Embed Size (px)
Citation preview

The Science of Oil Spills
Table of Contents:
verview O
esson 1: The Fate of Spilled Oil L
thods Lesson 2: Oil Spill Cleanup Me
Supporting materials:
Oil Spill Response Equipment slideshow
esson 3: Oil Spill Cleanup Lab L
Lesson ystem Oil Spill Scenario 4: Incident Command S
Supporting materials:
Roles Incident Command System
Oil Spill Scenario Updates
und for Teachers Incident Command System Backgro
ESI Maps Background for Teachers
Prince William Sound Science Center_A.Dou-Wang_Version 4.2011

The Science of Oil Spills Overview Grades: 6-12 Prerequisites: Before beginning this unit, students should have basic knowledge of convection, density, and waves. Lessons in this unit: The lessons are designed to be completed in sequence, although most lessons can also stand alone. 1) The Fate of Spilled Oil A lecture provides students with in-depth information about how spilled oil behaves in the environment, and the physical processes of weathering. 2) Oil Spill Response Methods An overview of the common types of oil spill response equipment, how they work to clean up oil, and basic cleanup strategies for shorelines and open water. 3) Oil Spill Cleanup Lab Students make a motor oil emulsion, compare different factions of spilled oil and their effects on natural materials, and experiment with different oil cleanup methods. 4) ICS Scenario Students play roles in the Incident Command System and decide how to respond to a mock oil spill scenario in Prince William Sound. Prerequisites: This lesson will be most effective if students have an understanding of air-sea interactions and general circulation patterns in Prince William Sound. They should also have basic knowledge of convection, density, waves, and Coriolis effect.
Prince William Sound Science Center_A.Dou-Wang_Version 4.2011

The Fate of Spilled Oil Summary: This lecture teaches students about the natural processes affecting surface and subsurface oil spills. Grade Level: 6-12 Duration: 1 hour Objectives:
- Students will understand the physical processes involved in fate and weathering of spilled oil in the open ocean
- Students will understand how the physical properties of spilled oil affect its behavior in the environment
Materials:
- Whiteboard - Markers
Background: This lesson provides information on how spilled oil behaves in open water. Students in grades 10-12 should be able to understand all the processes explained here; less detail can be used for younger students (grades 6-9). Students should take notes as the information presented here will help them during the other lessons in this unit, especially the Incident Command Scenario. Lecture Notes: Spilled oil is transported 3 ways:
- surface transport - vertical transport - horizontal subsurface transport
Surface transport:
- If a spill occurs on (calm) surface: spreads radially by gravity in all directions o spread is not uniform—irregular in shape and thickness
90% of a spill’s volume is contained in 10% of its area o Surface slicks are transported by wind and ocean currents (advection) o Spreading rates are influenced by:
Sea state Wind
Prince William Sound Science Center_A.Dou-Wang_Version 4.2011

• Rule of thumb: slicks move at 3% (1 to 5) of the wind speed 10m above the water’s surface
o Coriolis Effect causes ~10-20% drift to the right of the wind direction
Currents • Slick moves at 100% of surface current speed
Product viscosity Physical barriers (shorelines, islands, debris)
- Subsurface spills: o If oil mixed with natural gas (blowout)
Gas adds buoyancy Gas and oil form droplet/ bubble plume, traps seawater as it rises
o If oil in shallow water: rises as a single plume, then spreads on surface o In deep water: other factors in play: currents, density stratification
The plume rises like a smokestack—rises vertically a certain distance, then tips over and moves mostly horizontally, rising very slowly because the droplets become so small that they don’t have enough buoyancy to rise quickly (the amount the plume travels vertically before tipping is the “plume separation distance”)
Larger bubbles and droplets rise faster, separate from rest of plume (droplet rise velocity is proportional to droplet diameter)
The smallest droplets begin to spread horizontally almost immediately from the wellhead, rising very slowly; they may never reach the surface
The plume is much longer and thinner Vertical transport
- oil droplets become entrained in the water column (by wave action, wind mixing) and transported by subsurface currents
o distribution of droplet sizes—smaller droplets are transported deeper and longer - depth of droplet transport:
o initially proportional to wave height (approx. 1.5x wave height) o subsequent vertical transport depends on: vertical diffusion and buoyant rise
(wave height, wind, density stratification) o droplets can also be transported deeper in convergence zones
- droplets will continue to rise to the surface after transport (unless it interacts with suspended particulate matter)
Horizontal mixing
- occurs when currents are non-uniform - 2 fundamental processes:
o Scale-dependent diffusion When a patch of oil encounters an eddy:
• If the patch is smaller, it will be advected • If the patch is larger, it will be mixed and diluted
o Shear dispersion Caused by non-uniform velocity gradients
Prince William Sound Science Center_A.Dou-Wang_Version 4.2011

e.g. surface slick generally travels faster than underlying waters Interaction of surface and vertical transport: Droplets become vertically entrained, then rise to the surface. Vertically entrained droplets move slower than the surface slick, so if the slick is being advected, rising droplets re-enter the tail end. Result: the slick becomes elongated. Weathering processes: Once exposed to the environment, oil immediately begins to undergo weathering through a number of processes, including evaporation, photooxidation, biodegradation, emulsification, and sedimentation. These processes are explained below. Evaporation
- most rapid weathering process - evaporability depends on type of oil:
o 20-50% of crude oils o 75%+ of refined petroleum products o <10% of residual fuel oils
- Low-molecular-weight volatile compounds evaporate quickly o Remaining heavy components more easily form emulsions o As light compounds evaporate, the specific gravity of the remaining product
increases, making it more likely to sink - Evaporation decreases toxicity - Factors hindering evaporation:
o Oil phase is not well-mixed o Entrained water (emulsion) o Slick size and thickness o Air temperature- less evaporation in colder temperatures
Photooxidation
- chemical compounds in oil are structurally modified to more toxic products - forms higher-molecular-weight products - forms toxic polar products that mix readily with water and emulsify easily
Emulsification (water-in-oil) Forms a mixture of small droplets of oil and water. Water-in-oil emulsions are frequently called “chocolate mousse,” and are formed when wave action causes water to become trapped inside viscous oil. Emulsions may linger in the environment for months.
- can increase volume by a factor of 3 - can increase viscosity by 1000x - emulsifying agents are high-molecular-weight components of crude (asphaltenes and
resins) o prevent water droplets from recoalescing o enable formation of stable emulsion
- low-molecular-weight components prevent emulsification by controlling solubility of emulsifying components
Prince William Sound Science Center_A.Dou-Wang_Version 4.2011

[4 states of water in oil] 1. stable emulsion
a. can be 1000x more viscous than starting product b. high elasticity c. reddish or red-brown color (lightened by dilution) d. can linger for months or even years
2. unstable emulsion a. rapidly decompose to original states after mixing energy is removed b. no elasticity
3. meso-stable – emulsions with properties between stable and unstable 4. entrained water (water droplets trapped in oil)
Emulsion formation and stability is affected/determined by: - oil composition (concentration of low-molecular-weight vs. high-molecular-weight
compounds): high-molecular-weight compounds are needed to form stable emulsions; light refined oils do not emulsify easily
- starting viscosity of oil: if the initial oil has very high or very low viscosity, it will not be able to form a stable emulsion
- kinetic energy relative to mass of oil o higher mixing energies create more stable emulsions
Biodegradation
- a natural process that takes weeks to months in open water - components of oil are degraded by hydrocarbon-degrading microbes (bacteria, fungi,
yeasts) - oil contains thousands of chemical components; only a fraction are biodegradable (e.g.
waxes, alkanes, aromatic hydrocarbons) o microbes consume these biodegradable components and break them down to fatty
acids and CO2 in the course of days to months Oil-sediment interaction (flocculation)
- oil forms aggregate with sediments and minerals, marine snow; disperses throughout water column
- sediment particles prevent oil from re-coalescing - smaller particles (clay vs. sand) are more effective at stabilizing oil - aggregations may sink to ocean floor, or remain suspended - Flocculation: dispersed particles form larger-sized clusters by adhesion
A special case: microbial and sediment interactions after the Deepwater Horizon blowout
- Microbial slime integrated with oil emulsion; oil causes microbes to bloom, then sink to the bottom with the oil as microbial waste weighs them down.
o This causes rapid sedimentation on the seafloor - Effects of oily layers of sediment:
o Killed benthic filter feeders (suffocation or toxicity—mostly suffocation from too-rapid sedimentation)
o No microbial activity in oily sediment
Prince William Sound Science Center_A.Dou-Wang_Version 4.2011

o Will have wide, unpredictable effects for many years to come because of benthic-pelagic coupling; normal process of recycling of nutrients from the seafloor is disturbed
- Other seafloor effects o Benthic organisms (e.g. brittle stars) normally oil-tolerant (found often at natural
seeps) -
Cold region influences on oil behavior
- increased viscosity - air and water temperatures approaching pour points(the lowest temperature at which oil
will flow) - decreased evaporation rates - reduced degradation rates - greater equilibrium thicknesses - reduced spreading rates and coverage areas - limited spread/ transport due to ice and/or snow - entrainment or sinking in fresh water, ice and snow - expansion and contraction due to temperature changes
Review questions:
- Which has a greater effect on an oil slick: wind or current? (current) - How does the volatility of oil affect its behavior? (evaporation rates, formation/stability
of emulsion) - What factors influence the spreading rate of an oil slick? (Sea state, wind, currents, oil
viscosity, physical barriers) - What are the properties of a stable emulsion?
References: National Research Council. Oil Spill Dispersants: efficacy and effects. Washington, DC: The National Academies Press. 2005 Joye, Samantha. Slime, soot, and blue water—the offshore fate of the hydrocarbon gases and oil released from the Macondo blowout. Topical lecture. American Association for the Advancement of Science annual meeting. 19 February 2011. Alaska Oil Spill Curriculum, grades 7-12 (3rd edition). Prince William Sound Science Center and Prince William Sound Regional Citizens’ Advisory Council. 2007. Available online at www.pwsrcac.org/outreach/education.html “Lessons Learned from the Gulf of Mexico Oil Spill.” Workshop. Alaska Marine Science Symposium. 19 January 2011.
Prince William Sound Science Center_A.Dou-Wang_Version 4.2011

Prince William Sound Science Center_A.Dou-Wang_Version 4.2011
SERVS Fishing Vessel Training Captain’s Manual. Alyeska Pipeline Service Company. 2010.

Oil Spill Response Methods Summary: This lecture gives students an overview of the equipment, procedures, and strategies used in oil spill response. This lesson builds on “The Fate of Spilled Oil” (although it may also stand alone). It should be followed by the “Oil Spill Cleanup Lab”. Grade Level: 6-12 Duration: 50 minutes Objectives:
- Students will learn about strategies and types of equipment used in open water, nearshore, and onshore oil spill response.
- Students will be able to describe the functions, uses, and common problems associated with skimmers, booms, and dispersants.
Materials:
- “Oil spill response equipment” powerpoint presentation - Computer and projector for slideshow - Whiteboard, markers
Background: Part 1 contains an overview of the general cleanup methods and a discussion of the types of equipment used in each. For younger students (grades 6-8), part 1 will provide sufficient information on oil spill cleanup, and is sufficient background for the next lesson, the “Oil Spill Cleanup Lab”. Part 2 outlines oil spill response strategies for open water, nearshore, and onshore. Part 2 will be helpful background for the ICS Scenario. The accompanying powerpoint presentation by Dr. Pegau of the Prince William Sound Oil Spill Recovery Institute contains photos of the different types of skimmers and booms described in the lecture notes. The lecture notes for Part 1 below include slide numbers to correspond to the powerpoint. Lecture Notes: Part 1: There are basically four ways to clean-up oil spills. These are: mechanical containment and recovery, chemical methods such as dispersants, burning, and shoreline clean-up.
In the open water and near shore, mechanical skimming of oil is considered the response method least harmful to the environment. It requires large quantities of equipment and personnel. It is a multistage process that can be time consuming
Prince William Sound Science Center_A.Dou-Wang_Version 4.2011

and has several potential bottlenecks in which the system can break down. First you need to contain the oil with booms; then you need to recover it using skimmers, store it temporarily, treat it (remove the water) and then dispose of it. In each stage you handle the oil; equipment and personnel are needed. The operation will be hampered if, in any stage, the system breaks down.
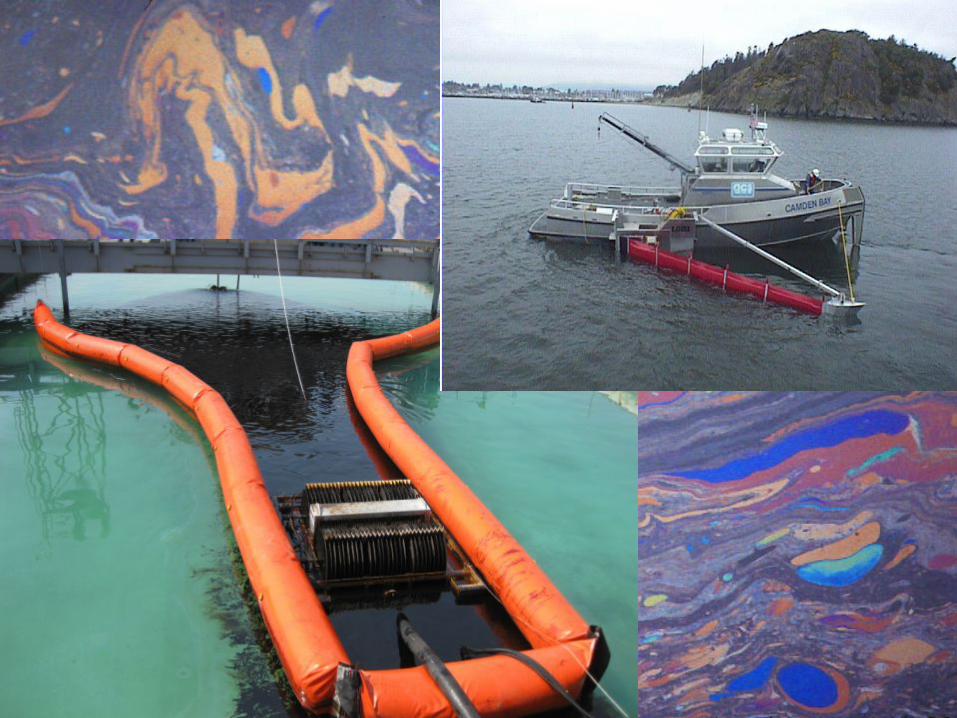
Boom [SLIDE 2]
- Functions: o Containment (for skimming or burning) [SLIDE 3]; bottom, a
containment boom with skimmer] o Diversion (to deflect oil from an area of shoreline or hatchery) o Exclusion (to complete enclose an area of shoreline)
- Parts of a boom [SLIDE 4] o Flotation may be rigid foam or inflatable air. o The skirt is the main part of the boom, and varies in size and material
depending on what type of conditions the boom is designed for. It is attached to a weighted anchor which keeps the boom upright in the water.
- Boom failures [SLIDE 5] o Booms can only be towed at slow speeds and in relatively calm seas. (The
speed and wave height that a boom can tolerate depends on the specific boom type and tactic. Generally speeds up to 5 or 6 mph and seas up to 3 to 6 feet.)
o If they are towed at higher speeds, they may not remain anchored upright in the water, and oil can be entrained under the boom. In rough seas, the boom may not stay upright or oil may spill over the top.
- Types: o Light-duty boom: foam filled “harbor boom” used in calm and protected
waters. [SLIDE 6] Light-duty boom that is used in calm water can also be made of
floating sorbent material, the same material used in oil spill cleanup pads.
[SLIDE 7] o Heavy-duty boom: must be inflated before use, used for towing or areas
with strong currents. Used in open water areas with large swells, strong winds or tides
[SLIDE 8]: This boom is towed by two boats. Oil is funneled into the chamber at the back of the V, concentrating it into a small area where a skimmer is used to skim it off.
o Intertidal boom: inflated with water and air to conform to and seal the beach as the tide goes in and out. Used in calm and protected waters adjacent to beaches, estuaries and other sensitive shoreline areas. Provides continuous protection throughout the tide cycle. [SLIDE 9]
o Fire boom: used to tow oil for burning [SLIDE 10] Skimmers [SLIDE 11]
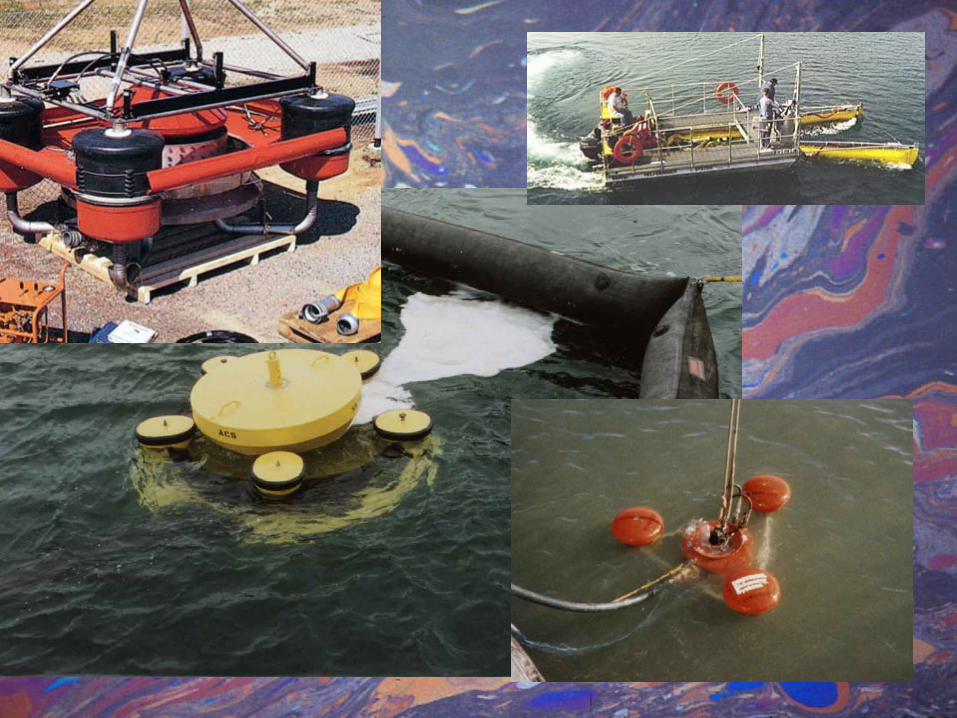
- Types:
Prince William Sound Science Center_A.Dou-Wang_Version 4.2011

o Suction devices: draws in oil and water like a vacuum cleaner; easily clogged with debris; high H2O volume
o Oleophilic surface units: uses the principle of adhesion; oil adheres to a surface, and then is scraped off into a collecting tank. Most skimmers work best on fresh, non-emulsified oil.
Disk [SLIDES 12 and 13] Rope: low viscosity oils [SLIDE 14 top] Belt [SLIDE 14 right] Brush [SLIDE 14 bottom left, SLIDE 15] (best for emulsified oil)
o Weir skimmers: uses a weir positioned at the oil/water interface to collect the oil while collecting as little water as possible. The oil is pumped through a hose to a storage tank. Best for light/medium oil in calm waters [SLIDE 16]
o Hydrodynamic devices: effective on light, thin sheen Burning [SLIDE 17]
- In-situ burning works best on fresher oil and specialized equipment and trained personnel are necessary. Controversy exists about this method's effectiveness and hazards.
- Burning can only be used in open-water areas (more than 3 miles away from populated areas) where fumes will not be carried to coastal communities where it can pose a health risk or cause fires to spread on shore.
- Booms are used to tow and contain a mass of oil to be burned, and the oil is ignited by hand or by helicopter.
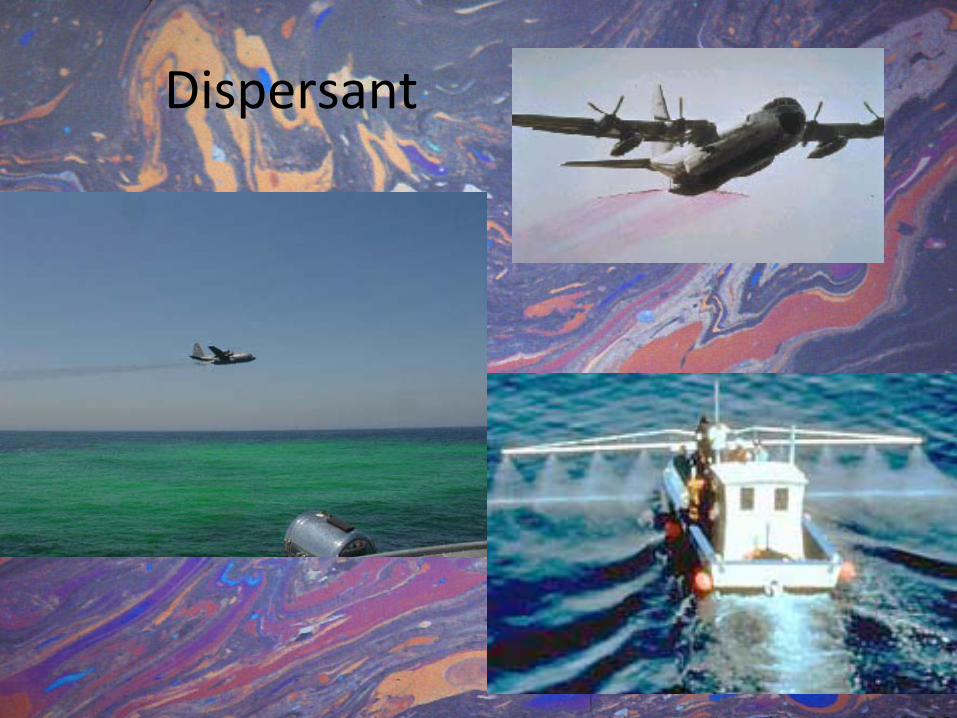
Dispersant [SLIDE 18]
- In open water, chemical dispersants can be used to break oil into small droplets in the upper part of the water column. In a manner similar to dish soap, chemical dispersants allow oil to disperse into the water column, so it becomes diluted and can more quickly be degraded by natural processes such as biodegradation. Some studies show that dispersants speed up natural dispersion, biodegradation and evaporation. Other studies show dispersants to be highly toxic and less effective in cold waters. To be effective, dispersants must be applied soon after a spill, since weathered oils are hard to disperse. Mixing energy from wind and waves is also needed.
- Approval is required from the government before dispersants can be applied on a spill.
- Most effective when applied as soon as possible (minimize surface transport) o Dispersants can be applied by plane or boat (airborne application is most
rapid) - Dispersant sometimes increases and sometimes decreases the rate of
biodegradation o May increase/ decrease biodegradation rates of different components at
once, or rate of biodegradation by different microbes o May inhibit microbes’ ability to attach to and intake hydrocarbons
Prince William Sound Science Center_A.Dou-Wang_Version 4.2011

- [Dispersant chemistry: Normally water and oil do not mix because H2O is a polar molecule while petroleum consists of nonpolar hydrocarbon chains. Chemical dispersants consist of surfactant molecules with combined polar and nonpolar properties (a hydrophilic head and a lipophilic tail), so that a large mass of oil can be separated into small particles and dispersed throughout the water column.]
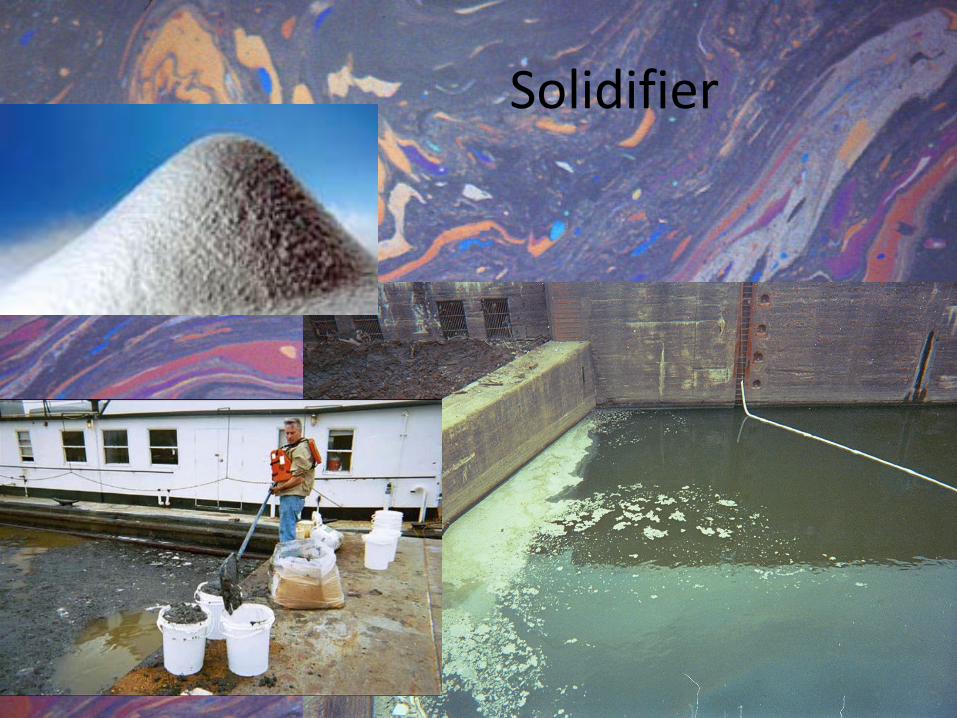
Solidifiers [SLIDE 19]
- Solidifiers cause a chemical reaction when they come in contact with oil, forming a floating rubber-like solid that is easy to remove from the water’s surface.
- Mixing is needed to increase contact between oil solidifying agents; can be used in rough water for natural mixing energy.
- Impractical for large oil spills because large amounts of solidifier are needed for maximum effectiveness (up to 3 times the volume of the spilled oil).
Shoreline clean-up [SLIDE 20] involves the physical removal of oil from beaches. This is the most labor and equipment intensive response method and techniques must be chosen carefully. Removal of oiled sediments can sometimes create environmental problems such as beach erosion. Running heavy equipment on shorelines can sometimes do more damage than the oil. A variety of shoreline clean-up methods are available. The one used depends on the beach type, its location, the type of oil and the equipment and manpower available. Citizen clean-up programs after the Exxon Valdez oil spill involved many different techniques such as oiled seaweed pickup on the beaches. Seaweed is a natural oil collector so the more picked up meant less oil that spread to other bays and estuaries. Pom-poms made of oil-absorbent material were also used to pick up oil. Bioremediation, the use of fertilizer to increase the populations of oil eating bacteria, was another technique that was tried. Also, a rock washing program was developed where rocks were cleaned by tying them up in specially designed bags so the ocean’s tidal action could wash them. Oil absorbent pads were used to wipe off rocks individually and for general clean-up, i.e. boots of oil spill workers. Another response, not always recognized, is “no response.” After the Exxon Valdez spill, NOAA studied sites that were not cleaned up and documented considerable survival and recovery of marine life. Part 2: Response Strategies Oil spill response strategies differ depending on the environment that is being cleaned up. They can be categorized as open-water, nearshore, or onshore. Open-Water
- Containment o Booms are used immediately to minimize the spread of oil and concentrate
the oil as close as possible to the source of the spill. - Mechanical recovery of floating oil
Prince William Sound Science Center_A.Dou-Wang_Version 4.2011

- Non-mechanical response o Dispersants
Dispersants may complement or replace mechanical recovery May be the only way to avoid shoreline impact. Usually applied by aircraft, sometimes by boat Most effective if used soon after a spill, before weathering
o In-situ burning An area of oil is collected in a fire boom, ignited by helicopter Can eliminate up to 90-99% Impact on air quality is comparable to evaporation of light ends
- shoreline protection: deploy booms to minimize shoreline impact Nearshore
- Free oil recovery: intercept oil escaping the open water recovery operations and threatening shorelines or sensitive areas (same as open-water task forces)
- Shoreline protection: protect priority sensitive areas - Hatchery protection: Deployment and support vessels to protect hatcheries in the
projected path of the spill o Protective boom and related equipment is pre-staged year-round at all
hatcheries in PWS. - Wildlife protection: protect and/or rescue wildlife that is in the projected path of
the spill Onshore
- Passive collection: sorbent booms placed over the shoreline to absorb oil - Manual removal
o Oiled seaweed pickup o Rock washing (beach rocks are placed in
- cold water deluge: a hose system that uses high-volume, low-pressure saturation to wash oil out of rocks and into the water, where it can be absorbed by booms or skimmed
- bioremediation Cold region influences on oil spill response equipment and operations
- Equipment and infrastructure o lack of roads, docks, and airstrips in remote areas o difficulty starting and maintaining engines in cold weather o blocking/ plugging of equipment from ice and snow
- Logistics & communications o increased dependence upon good communications and navigation
equipment o long periods of darkness in winter hinders oil detectability and reduces
time for response o response rate limited by reduced visibility from snow or fog o extreme water depth variations
Prince William Sound Science Center_A.Dou-Wang_Version 4.2011

Prince William Sound Science Center_A.Dou-Wang_Version 4.2011
o difficulty of working in ice infested waters o drifting of snow onshore and on solid ice
- Oil detectability o limited by ice, snow, or reduced visibility
- Oil recovery o freezing of water with, or in, recovered oil o natural oil holding capacities of ice and snow
Resources: Alaska Oil Spill Curriculum, grades 7-12 (3rd edition). Prince William Sound Science Center and Prince William Sound Regional Citizens’ Advisory Council. 2007. Available online at www.pwsrcac.org/outreach/education.html EPA Emergency Management. Oil Spill Response Techniques. http://www.epa.gov/emergencies/content/learning/oiltech.htm NOAA National Ocean Service Office of Response and Restoration. http://response.restoration.noaa.gov SERVS Fishing Vessel Training Captain’s Manual. Alyeska Pipeline Service Company. 2010.

W. Scott Pegau, Ph.D.
Prince William Sound Oil Spill Recovery Institute
PO Box 705
Cordova, AK 99574
www.pws‐osri.org
Oil Spill Response Equipment

BoomWhat are they used for?How do they work?Where do they have problems ?

Floatation
Anchor
Skirt


Skimmers
What types are there?How do they work?What are the problems?


Burning
Dispersant
Solidifier

Shoreline cleanup
Top: http://faculty.buffalostate.edu/smithrd/PR/Exxon.htmRight: © Ron Cogswell


Oil Spill Cleanup Lab Summary: Students make a motor oil emulsion, compare different factions of spilled oil and their effects on natural materials, and experiment with different oil cleanup methods. Grade Level: 6-12 Duration: 60-90 minutes Objectives:
- Students will evaluate various clean-up techniques and their efficiencies. - Students will demonstrate use of various clean-up techniques for an experimental oil
spill. - Students will learn about different types and fractions of spilled oil and their effect on the
living and non-living environment. Materials:
- Blender or egg beater that will not be used for food again
- Large mixing bowl - Extension cord - Motor oil (used motor oil from
automotive shops works well) or vegetable oil (easier to clean and dispose of)
- Water - Salt - Detergent / soap - Rubber gloves for each student - Disposable plastic/tin dishes, one for
each group (baking pans work well)
- String - Plastic straws - Scissors - Popsicle sticks - Plastic spoons - Eyedropper - Oil absorbent pads, cut into small
pieces - 2 glass jars with lids - Natural materials: wood, feathers,
fur, rocks - Plastic or glass jar - Squeegee
Background: Before beginning the lab, students should have knowledge of oil spill cleanup methods described in the preceding lesson (“Oil Spill Response Methods”). Procedure:
1) Fill two jars with equal amounts of salt and freshwater. Measure an equal amount of vegetable oil (or motor oil) into both. Have students shake each jar an equal number of times. After shaking, start a stopwatch and watch the oil in the jars settle. Make observations about how the oil behaves in each type of water, and what that means for oil pollution.
Prince William Sound Science Center_A.Dou-Wang_Version 4.2011
1

2) Pour some water and motor oil into a large mixing bowl (about one part motor oil to 2
parts water). Mix with egg beater for at least 20 minutes. The froth which forms on top is mousse. Have the students skim the mousse off and measure it. Is it more or less than the amount of oil that was poured into the bowl? Ask them what happens to an oil slick at sea that is agitated by high winds and strong seas for 2 weeks or more, as was actually the case with the Exxon oil in the Gulf of Alaska. Thick, foamy mousse blew ashore and remained in the intertidal areas. Pour some of your mousse onto a few dry rocks to illustrate its tendency to cling to the shore rather than wash back out to sea. (Save your oiled water and rocks for the next two activities). This experiment can be done in a blender, but the oil will be impossible to clean out completely. Any oiled items—bowl, beater, tray—should not be used for food ever again. Remind students that motor oil is toxic - a hazardous substance they should breathe as little as possible and not touch without gloves. The mousse will be stuck to the bottom and sides of the blender, with the water sitting on top. (This happens because the plastic that composes the blender is made from petroleum and is oleophilic.) To remove the mousse, first pour out the remaining water, which will have a sheen. Scoop out the mousse with a spoon. Drop a blob of mousse on a dish of clean water; as it spreads out you will be able to see the bubbles of air and water imbedded in the mousse. (The air and water will “fizz” out of the oil rather quickly—this is because it’s not a stable emulsion, because the mixing energy wasn’t of very long duration.) [Since mixing the mousse takes a long time, you will probably want to complete the next activity while an assistant finishes making the mousse.]
3) Dip some feathers in water to see how the drops roll off. Healthy feathers protect birds by blocking out wind and rain and trapping warm air underneath. Now dip the feathers in the oil and mousse. (If the oil clumps on too thickly, wipe some oil off with an absorbent pad.) See how the feathers are now matted together. Once oiled, they lose their waterproofing. Birds that are oiled often die of hypothermia because they can no longer trap air under their feathers to keep warm. Try to clean off the feather by dipping it in plain water and soapy water. Observe the effect of soap on the oil and the feather. (If you let the feather soak in soapy water and look closely, you can see the oil breaking into small pieces.) After the soap has washed most of the oil off of the feather, take it out of the soapy water and examine it. Is it still able to keep its shape and protect from water and wind? The soap, while it washed off the spilled oil, also removed the natural oils that make the feather smooth and waterproof.
4) Have students work in pairs to clean up a small oil spill using the various materials. Give each group a pan, filled halfway with water, and drop a few teaspoons of oil on top.
Prince William Sound Science Center_A.Dou-Wang_Version 4.2011
2

(Give some groups regular motor oil, others the mousse.) Their goal is to contain the oil and remove it from the water. Also give students a variety of natural materials (rocks, feathers, leather, etc.) to oil and clean.
Explain to students that they will investigate various clean-up products and methods, such as: skimmers and booms, dispersants (detergents), oiled seaweed or pom-poms, absorbent pads, suctioning (eyedropper), and collecting with buckets. Discuss with them creative solutions to cleaning up oil spills. Allow them to list alternative methods and experiment with them. First try containing the oil spill with booms. Decide on one material to use as a boom, and use it to contain the oil spill. How well does it work? What if there was rough weather? Simulate rough weather by blowing over the surface, or fanning the surface with a card. Have students describe their results in their journals.
5) You can demonstrate an oleophilic skimmer by placing a glass or plastic jar in a pan of oil and rotating it so oil adheres to the surface. Then use a squeegee to remove the oil from the jar.
6) Now use at least two other techniques for cleaning up the oil spill such as dispersing the oil and absorbing the oil with various materials. Try to clean the natural materials. You can have the groups compete against each other to see who can clean up their oil and oiled materials the fastest or most thoroughly. Which methods worked best? Which was more difficult to clean, the regular motor oil or the emulsion?
7) One of the conditions that hampered the Prince William Sound oil spill clean-up was stormy weather. Set up the experiment again, and simulate stormy weather by blowing over the surface or by moving a card through the water. Repeat two of the techniques with heavy oil and rough water. Record the data. Encourage students to experiment with various materials or to design their own clean-up device or technique.
8) Clean up the lab stations and dispose of the oil and oily wastes properly. Discuss the following questions, or have students use them as a prompt for a journal entry:
- With which method were you able to most rapidly clean up the oil spill? - Ocean spills are often contained by placing booms, or barriers around the oil. What types
of booms did you use to contain your oil spill? How well did they work in rough weather?
- Which of the techniques removed oil by absorption? - Some people say that absorption techniques simply move the oil spill from the water to
the land. What do you suppose they mean? - What effect did detergent have on your oil spill? - Did the detergent make your clean-up technique more effective or less effective? Please
explain.
Prince William Sound Science Center_A.Dou-Wang_Version 4.2011
3

Prince William Sound Science Center_A.Dou-Wang_Version 4.2011
4
- How would you determine if the area affected by the spill was clean enough, and when to stop cleaning? How clean is clean enough? This is an area of debate among scientists, agency representatives, responsible party, and local stakeholders who disagree about what "clean" really means.
Have students use their journals to summarize, in one or two paragraphs, what they have learned about oil spill clean-up. Homework: Give each student a copy of each of the NOAA fact sheets (links in Resources below) on oil types and tarballs. Each student should pick one oil type (crude, bunker C, or diesel) and explain, in their journal, which cleanup methods they would and wouldn’t use for this type of spilled oil and why. Resources: Alaska Oil Spill Curriculum, grades 7-12 (3rd edition). Prince William Sound Science Center and Prince William Sound Regional Citizens’ Advisory Council. 2007. Available online at www.pwsrcac.org/outreach/education.html NOAA Oil Characteristics fact sheets:
- Alaska North Slope Crude: http://response.restoration.noaa.gov/book_shelf/970_crudes.pdf
- No. 6 Fuel Oil (Bunker C): http://response.restoration.noaa.gov/book_shelf/971_no_6.pdf - Diesel: http://response.restoration.noaa.gov/book_shelf/974_diesel.pdf - Tarballs: http://response.restoration.noaa.gov/book_shelf/488_tarballs.pdf

Incident Command System Oil Spill Scenario Summary: Students play roles in the Incident Command System and decide how to respond to a mock oil spill scenario in Prince William Sound. Grade Level: 9-12 Duration: 3 hours Objectives:
- Students will use their knowledge of ocean science, oil spill fate and weathering, and oil spill response methods to decide how to respond to a mock oil spill.
Class size: The description of the activity given here was developed for a group of 10 students, but could be modified for a larger or small class. Materials:
- chart of Prince William Sound - Background and handouts (attached)
o Incident Command System Background for Teachers o ESI Maps Background for Teachers o Environmental Sensitivity Index (ESI) maps of Prince William Sound o Introduction to ESI maps handout (at least one for each group) o ICS role descriptions o Scenario updates (one set of handouts for each group)
Background: This lesson will be most effective if students have an understanding of air-sea interactions and general circulation patterns in Prince William Sound. They should also have basic knowledge of convection, density, waves, and Coriolis effect. For background information on the Incident Command System, see the “ICS Background for Teachers” handout. Procedure: ICS roles Assign students to groups representing each ICS role and hand them the description of that role. The primary roles that must be covered are the members of Unified Command: Federal, State, and Responsible Party On-Scene Coordinators. Other roles can include local stakeholders (who may be part of a Regional Stakeholder Committee), Environmental organizations, tribal leaders, members of the press, and members of the
Prince William Sound Science Center_A.Dou-Wang_Version 4.2011

public. Students in each group must work together to represent their agency or organization’s interests. If your class size is small, some roles can be represented by a single student. Each group may need to elect (or you may choose to assign) a leader who has the final authority for settling differences among themselves, i.e. a Coordinator and Deputy Coordinators. You may also split up duties by giving each student a different area of responsibility, i.e. spill trajectory forecasting, technical spill response, biological resources, public relations, etc. The Unified Command members will need to choose an Incident Commander. This person may change (for example, if the Federal and State coordinators decide that the RP is not responding adequately). The IC should facilitate the decision-making process and lead the actions of Unified Command; the IC may also be responsible for communicating with the media and leading press conferences. Scenario updates After everyone is familiar with their role, give each group a copy of the initial scenario update. (You may choose to stagger the updates so non-IC roles receive updates later than the IC.) After each update, each group should take a few minutes to discuss their response. The Unified Command should then try to agree on how to respond. They should strive for consensus whenever possible; if they are unable to reach a consensus, the Federal On-Scene Coordinator is the final authority for response decisions. Monitor the groups’ progress and hand out one update at a time, when students have finished responding to the previous update. Each update may require an interval of 15-30 minutes. After the last update, Unified Command should make a cleanup endpoint agreement that describes when they will stop responding to the oil spill. How long will they continue cleanup activities? When will it be “clean” enough? (And how will they know when it is clean enough? [Student groups may initiate further actions, such as communications and requests between non-IC and IC parties, contracts, agreements, lawsuits, etc.] Throughout the updates and discussions, students should be working on the following assignments, which are all due at the end of the scenario.
- Description of facts of the spill and predicted spill trajectory. - List of shoreline protection priorities with explanations (analysis of ESI maps
and data). - Record of all response decisions reached by Unified Command. - Press releases conveying significant events and decisions to the public.
Prince William Sound Science Center_A.Dou-Wang_Version 4.2011

- For non-IC roles: letters to RP and IC describing your organization/ agency’s action plan and recommendations.
- Endpoint agreement: all members of Unified Command must agree on a cleanup endpoint—how long will they continue working to clean up oil? When will they know to stop?
- Written contracts/ remuneration agreements between parties, if applicable. Homework: Each student should write a personal reflection of the activity in their journal, answering the following questions:
- How did you feel about your assigned role? - Were your predictions of the spill trajectory accurate? - What was most difficult about the decision-making process? Were some
decisions easier to reach than others? - Were there some decisions made that you didn’t agree with? How was the
final decision reached? - How do you feel about the spill response and the overall outcome? (i.e. How
accurate were your predictions of the trajectory? Were beaches adequately protected? Were there resources or conditions that you failed to take into account?) Did the project change the way you think about oil spill response and environmental decision-making? If so, how?
Resources: NOAA National Ocean Service Office of Response and Restoration. http://response.restoration.noaa.gov
Prince William Sound Science Center_A.Dou-Wang_Version 4.2011

Incident Command System Oil Spill Scenario Roles Federal On-Scene Coordinator
You represent the federal government, and must work together with the state and
RP to determine how to respond to an oil spill. As the Coast Guard official in charge of the federal response, you have 51% of
the vote in the response process. The Responsible Party will present their proposed actions to you for approval; you may approve, reject, or require changes to their proposals. If the RP requests use of federal resources for spill response, such as Coast Guard-operated equipment, you have the authority to approve or disprove the request.
Most of the time, all three members of the Unified Command should be able to agree on response actions. If there are disputes or differences between the On-Scene Coordinators, you have the final authority on response decisions. Your priorities are ensuring a smooth decision-making process, with consensus whenever possible. Under federal law, you may take over the response if you think the Responsible Party’s response actions are inadequate or inappropriate. You may also direct the RP’s response efforts without federalizing the response. State On-Scene Coordinator
You are a DEC official representing the State of Alaska. You must work together with the Federal and Responsible Party On-Scene Coordinators to determine how to respond to an oil spill.
Most of the time, all three members of the Unified Command should be able to agree on response actions. If there are disputes or differences between the On-Scene Coordinators, the Federal On-Scene Coordinator has the final authority on response decisions.
Under state law, you may take over the response if you think the Responsible Party’s response actions are inadequate or inappropriate. Responsible Party On-Scene Coordinator You represent a large oil company operating the T/V Vigilance to transport oil out of Valdez. Under federal and state law, you are responsible for the containment, control, and cleanup of the oil spill. You will need to work together with the federal and state on-scene coordinators to determine how to respond to the oil spill. All response actions must be approved by all three parties; however, as the RP, you are the default Incident Commander and it is your responsibility to initiate an adequate response to the spill. All of your proposed actions must be approved by the Federal On-Scene Coordinator, who may approve, reject, or offer changes to your proposed action. You may make counter-suggestions if you do not agree with the changes they want you to make.
Prince William Sound Science Center_A.Dou-Wang_Version 4.2011

Most of the time, all three members of the Unified Command should be able to agree on response actions. If there are disputes or differences between the On-Scene Coordinators, the Federal On-Scene Coordinator has the final authority on response decisions. Environmental NGO You represent a non-profit environmental organization focused on wildlife conservation. You are concerned about the fate of oil on marine life, particularly seabirds and marine mammals. You know that many species have barely recovered from the Exxon Valdez oil spill. Many other species are still in the process of recovering, and you are worried that another oil spill will further impact them beyond recovery. Regional Stakeholder Committee You are a group of local fishermen and community leaders who are outraged by the oil spill. You are furious about the oil spill because you are sure it will ruin the salmon fishery. Last year was a terrible year for fishing while this season has been great, up until the spill. You are also aware of the many salmon hatcheries in Prince William Sound, and you want to know that all measures are being taken to protect the hatcheries from oiling impacts.
Prince William Sound Science Center_A.Dou-Wang_Version 4.2011

Oil Spill Scenario Updates The Scenario On the evening of August 13, the Coast Guard receives simultaneous mayday calls from both the tugboat Alert and the T/V Vigilance, in Hinchinbrook Entrance. The Vigilance, a 600 ft long double hulled tanker full of Alaska North Slope Crude, reports a fire on board, that it has lost power, and is adrift in 10 foot seas and 30 knot easterly winds, heading towards Schooner Rock on Montague Island. The Alert reports its propulsion is disabled by a parted tow line, and that it was also rapidly drifting towards shore. The weather, although under the departure minimums is rising, with a 990 mb low pressure system traveling just south of Middleton Island, and the Ocean Data Acquisition System Buoy at Seal Rocks is reporting a decrease in pressure, and increasing winds and waves. Because the Vigilance is a double-hulled vessel, it is only traveling with one escort tug; no other tugs are in the immediate area. The captain of the vessel reports that he expects going aground at Schooner Rock in less than an hour. The Vigilance is carrying 92.4 million gallons of Alaska North Slope Crude and 500,000 gallons of bunker C fuel oil. Update #1 At 23:45 the captain of the Vigilance reports that he is abandoning ship and launching the crew in two life rafts. The position of the ship is 60° 16.07’ N, and 146° 52.92’ W; he reports 35 knot winds and 15 foot seas. The Alert also reports that they are abandoning ship in an inflatable life raft at 60° 15.65’ N, and 146° 54.29’ W. Both vessels report their drift as to the Northwest. Coast Guard helicopters are dispatched from Cordova and Kodiak, and recover the crew of the Alert from their life raft at 0300. The 110’ USCG patrol boat Long Island dispatches from Valdez at 0100, and the 225’ cutter Sycamore departs Cordova at about the same time. The life boats from the Vigilance rendezvous with the Long Island in Port Etches at 0500. The USCG helicopters report that the lights of the Vigilance show its position as on Schooner Rock, and the Alert on the beach at 60° 15.05’ N, and 146° 57.90W. As of 0530 the Sycamore reports it is en route to Schooner Rock to assess the situation. They report heavy rain, 30 knot winds and 10 to 15 foot seas, poor visibility and a low ceiling.
Prince William Sound Science Center_A.Dou-Wang_Version 4.2011

Update #2 At 0900 the morning of the 14th the Sycamore reports that the Vigilance is hard aground on Schooner Rock, approximately amidships, and leaking oil into the water. The Seal Rock buoy is reporting 15 knot winds, gusting to 20 knots, to the northeast, and atmospheric pressure is rising as the offshore low pressure system moves towards southeast Alaska. Aircraft overflights of the Alert show that it is intact on the beach; heavy sheen is reported in the area. Sheens are also reported off Montague Point by a passing tender. Update #3 At 10:00 on the second day, the SERVS fleet is activated. The rapid response fleets leave Cordova, Valdez and Whittier within one hour for the spill zone. The tier II fleets (8 hours notice to sortie) are also activated. Weather reports at the scene from the Sycamore show little change in the weather. Winds are still coming from the southwest at 15 to 20 knots, seas have subsided to 6 feet, and heavy patchy rain showers are reported. Aerial surveys are not possible. NOAA reports that their GNOME model (a general oceanographic model used for predicting surface drift) is offline for software and hardware upgrades, and will be brought back online ASAP. The Coast Guard reports that a C130 was dispatched from Kodiak at 10:00 with several surface drifters that they will deploy in the spill zone. From the description of the vessel on the rocks from the Sycamore, the owner of the tanker suggests that only one tank (1/10th of the cargo) is at risk of spilling into the ocean. Update #4 The SERVS fleet arrives over the course of the second day, but darkness and seas prevent their assessing the situation. Weather and seas continue to improve, and by 0600 on the third day winds have decreased to 10 knots and below, and seas are three feet. Reports on the scene are that the Vigilance is hard aground and the hull has failed in several sections. Extremely thick oil is reported in Zaikof Bay and Rocky Bay, and vessels arriving from Valdez describe extremely thick oil in central PWS. Aerial surveys report oil as far south as Purple Bluff, and sheens are reported in Patton Bay by sport fishermen.
Prince William Sound Science Center_A.Dou-Wang_Version 4.2011

Update #5 The SERVS fleet and one of the large SERVS oil spill response barges have been conducting oil recovery operations for one day. They report that they are not able to keep up with the flow of oil: recovery barges are filling up with oil – urgent requests for lightering vessels (small tankers to empty the spill response barges) are sent out. The first survey of the Vigilance suggests that its structural integrity may have been compromised, and it may break up if the weather deteriorates again. Salvors are assessing the wreck to see how it might be best recovered. The weather continues to improve, with partly cloudy skies, light winds, and very few wind waves; however, a large ground swell from a large offshore swell makes working on the outside beaches difficult. Oil is reported at Point Helen on Knight Island and East Point of Naked Island. All fishing activities in PWS are halted, and fishermen are furious because the previous year was a terrible fishing year, while catches have been very good this summer. Many fishermen are quoted in the media that the spill will ruin them financially. Press releases from the owner of the Vigilance say that all efforts are being expended and that damage will be minimized. Update #6 A 15 knot west wind begins to blow on the evening of the third day, and on the morning of the fourth day the skies are still clear. Reports start to trickle in about heavy oil on shorelines in the area of the grounding and throughout western PWS. Oil, oiled seabirds, and oiled otters are reported along the eastern half of Montague Island, both on the north and south coasts. An Orca, thought to be from AB pod [a resident group still recovering from the Exxon Valdez oil spill] is reported beached on the shore of Latouche Island. Several humpbacks are also reported in the Montague Strait area. Oil is also reported ashore on the eastern shore of Naked Island and Perry Islands. Sheens are reported in Knight Island Pass, and are reported to be traveling towards Montague Strait. Sheens are reported in the central Sound, but no oil is reported on beaches on the eastern portion of the Sound. Salvage engineers report that they have more or less stemmed the flow of oil from the wreck, and assessment of its structural integrity is ongoing, with the intention of refloating the vessel. At least three of the tanks were fully tidal (open to the ocean), and the tanker company estimates that 1/3 to ½ of the cargo of oil has been lost, but are not confident in their estimates.
Prince William Sound Science Center_A.Dou-Wang_Version 4.2011

Incident Command System – Background for teachers The Incident Command System (ICS) is a standardized incident management system that is used to respond to all types of hazards and emergencies. Types of incidents for which ICS is routinely used include natural disasters such as wildfires, floods, or earthquakes; emergency medical situations; and search and rescue operations. It is applicable across disciplines and is used by all levels of government (federal, state, tribal, and local) as well as by nongovernmental organizations and the private sector. There are several brands of ICS that are used by different agencies to respond to different types of incidents. The system used to respond to oil spills and spills of other hazardous material is based on the National Incident Management System (NIMS). The original National Interagency Incident Management System (NIIMS) was developed to respond to large forest fires and coordinate the actions and resources of different emergency response organizations and government agencies towards accomplishing a single goal (put out the fire). Decisions about how to respond to the incident are made by members of a Unified Command. The Unified Command (UC) consists of members representing the Federal and State governments, and the Responsible Party. The three members of UC work together to decide on and carry out response actions. The Responsible Party (RP) or spiller has the primary responsibility for responding to and cleaning up an oil spill. Only if the RP cannot be identified, fails to respond, or does an inadequate job of cleanup will the state or federal government take-over or supplement the response to an oil or hazardous substance discharge. The Federal and State governments are responsible for overseeing the RP’s response efforts, augmenting those efforts, and taking over response operations when necessary. The Federal On-Scene Coordinator (FOSC) can also direct the activities of the RP without “federalizing” (taking federal control of) the spill cleanup. The RP may contract outside workers in the cleanup. They may also request the use of federal or state resources (e.g. Coast Guard vessels or equipment) which must be approved at the discretion of the Federal and State governments. (In incidents where there is an immediate threat to public safety, there will also be a Local On-Scene Coordinator (LOSC) representing the local jurisdiction, who will be the ultimate command authority.) The Unified Command works together to direct all aspects of incident response. One member of Unified Command is designated as the Incident Commander (IC), and is in command of control, containment, removal, and disposal of the spill. There can only be one IC at any given time, but the IC can change as the situation changes. When the RP is responding adequately, the RPOSC will normally be designated the IC by the Unified Commanders. The FOSC and SOSC will make the determination on the adequacy of the
Prince William Sound Science Center_A.Dou-Wang_Version 4.2011

RP’s containment, control, and cleanup effort. If the RP is unknown or not adequately responding, the FOSC or SOSC may become the IC. Regardless of who the IC is, the Federal On-Scene Coordinator has 51% of the vote regarding response decisions. Most of the time, all three members of the Unified Command should be able to agree on response actions. If there are disputes or differences between the On-Scene Coordinators, the Federal On-Scene Coordinator has the final authority on response decisions. Resources: Alaska Federal/State Preparedness Plan for Response to Oil & Hazardous Substance Discharges/Releases (Unified Plan), Change 3. Alaska Department of Environmental Conservation. 2010. Available online at: http://www.dec.state.ak.us/spar/perp/plan.htm
Prince William Sound Science Center_A.Dou-Wang_Version 4.2011

ESI Maps – Background for Teachers
Front of ESI Maps
Shorelines are color-coded to show their sensitivity to oiling. For example, shorelines shown in red above are salt marshes that are especially vulnerable to oil. Symbols mark locations important to spill responders, such as areas where seals or sea lions congregate or breed (marked with the brown seals and sea lions symbol), areas where different kinds of birds concentrate for feeding or nesting, and areas used by people (such as the aquaculture facility shown on this map with the AQ or the recreational beach marked by the sun umbrella).
Here is more detailed information about the three kinds of information shown on the front of ESI maps:
1) Shoreline Rankings
Environmental Sensitivity Index (ESI) maps use shoreline rankings to rate how sensitive an area of shoreline would be to an oil spill. The ranking scale goes from 1 to 10.
A rank of 1 represents shorelines with the least susceptibility to damage by oiling. Examples include steep, exposed rocky cliffs and banks. The oil cannot penetrate into the rock and will be washed off quickly by the waves and tides.
A rank of 10 represents shorelines most likely to be damaged by oiling. Examples include protected, vegetated wetlands, such as mangrove swamps and saltwater marshes. Oil in these areas will remain for a long period of time, penetrate deeply into the substrate, and inflict damage to many kinds of plants and animals. The photo at right shows oil coating a significant portion of a mangrove swamp.
Classifying Shorelines for ESI Maps
To assign each shoreline a rank from 1 to 10, ESI map developers use information and observations from a combination of sources:
• Overflights • Aerial photography • Remotely sensed data • Ground truthing (visits to individual shorelines to assess aerial observations) • Existing maps and data
Prince William Sound Science Center_A.Dou-Wang_Version 4.2011

Establishing Shoreline Rankings
ESI shoreline rankings are defined using factors that influence sensitivity to oiling, including:
• Relative exposure to waves and tidal energy • Biological productivity and sensitivity • Substrate type (grain size, permeability, trafficability, and mobility) • Shoreline slope • Ease of cleanup • Ease of restoration
2) Biological Resources
Some animal and plant species are especially vulnerable to oil spills. The Environmental Sensitivity Index (ESI) method classifies these species into categories and displays their locations on ESI maps and provides detailed information about their seasonality, concentrations, and breeding activities.
Many species that are vulnerable to oil are wide-ranging, and may be present over large areas at any time. These species can be especially vulnerable at particular times and places.
Animals and their habitats tend to be most at risk from oil spills when:
Photo courtesy of Gail Siani, (c) 1999.
• Many individuals are concentrated in a small area, such as a seal haulout area or a bay where waterfowl concentrate dmigration.
uring
• Early life stages are present in certain areas, such as seabird rookeries, spawning beds used by anadromous fish, or turtle nesting beaches.
• Oil affects areas important to specific life stages or important for migration, such as foraging or over-wintering sites.
• Specific areas are critically important for propagation of a species. • A particular species is threatened or endangered. • A substantial percentage of an animal or plant population is likely to be exposed
to oil.
Prince William Sound Science Center_A.Dou-Wang_Version 4.2011

ESI maps show where these most sensitive species, life stages, and locations exist, but ESI maps don't necessarily show the entire area where members of a sensitive species occur.
For each species, the back of the ESI maps and the GIS data tables include the following information (when known):
• The life stage(s) present at a particular location, for each month of the year.
• The numbers of species members present at that location.
• The species' status (whether endangered or threatened, according to either state or federal listings).
• Estimated start and end dates for specific breeding activities.
This information is intended to be used by oil spill planners and coastal zone managers. For example, the manager of a particular area may need to identify the seasons when a particular species is most vulnerable, so that he or she can set protection priorities for different seasons.
3) Human-Use Resources
Some human-use resources (such as public beaches) are especially vulnerable to oil spills. The Environmental Sensitivity Index (ESI) method classifies these resources into categories and displays their locations on ESI maps.
Four types of human-use resources are typically mapped:
• High-use shoreline access and recreational use areas, such as boat ramps, marinas, recreational beaches, and sport-fishing and diving areas.
• Officially-designated natural resource management or protected areas, such as national parks, marine sanctuaries, national wildlife refuges, preserves, and reserves.
• Resource extraction sites, such as aquaculture sites, locations of subsistence and commercial fisheries, log storage sites, mining leases, and surface water intakes.
• Water-associated archaeological, historical, and cultural sites, including lands managed
Prince William Sound Science Center_A.Dou-Wang_Version 4.2011

by Native Americans. Cultural sites located in the intertidal zone or close to the shoreline where they could be damaged by cleanup crews are at particular risk.
Back of ESI Maps
On the back of ESI maps, there are tables showing when species are present in the areas shown on the front of the maps. The data tables also indicate their seasonality, breeding times, and threatened/endangered status. There is also information about human-use resources (such as parks), including contact information as appropriate.
The ESI data tables indicate:
• Which species of animals and plants are present, the months when they are present, and often an indication of the concentration (abundance) of a particular species.
• Which species are listed as threatened or endangered. • When birds are nesting, laying, hatching, and fledging. • When fish are spawning or migrating through the area. • When shellfish are mating or spawning. • When marine mammals are breeding, calving, or pupping. • How to contact parks, historic sites, and other facilities in the area.
Map Design
On ESI maps, each shoreline is color-coded to indicate its sensitivity to oiling. Warm colors indicate the most sensitive shorelines, and cool colors indicate the less sensitive. Large habitat areas (such as tidal flats and wetlands) are shown as polygons filled with a pattern of the appropriate color.
Prince William Sound Science Center_A.Dou-Wang_Version 4.2011

The biological resources shown on ESI maps also have standardized colors, which are shown on the table below. Each kind of animal has a designated color--for example, birds are green. So on ESI maps, locations where birds can be found are indicated using point symbols and/or polygons that are colored green. When a biological resource exists in a small area (such as a bird nesting site), it is indicated on an ESI map by a point symbol. However, most biological resources encompass larger areas. In these cases, the resource location is represented on ESI maps using polygons with standardized color and hatch pattern (shown below). Fish streams are usually represented as lines.
Kind of Resource Color Polygon Pattern
Fish Blue
Shellfish/Insects Orange
Birds Green
Marine Mammals Brown
Terrestrial Mammals Brown
Reptiles & Amphibians Red
Habitat/Rare Plants Purple
Multiple Elements Black
Note: When a species is very widely distributed within an area covered by an ESI map, its presence is indicated by the notation "common throughout" and a polygon does not appear on the map because it would obscure other map features. However, in the GIS data table, the bounding polygon is included, allowing accurate queries of location and extent of the various species.
Most human-use features (such as public beaches and aquaculture facilities) exist in a small area and are represented by point symbols. Larger areas such as parks, preserves, protected areas, and wildlife refuges are shown as polygons.
Source: NOAA National Ocean Service Office of Response and Restoration
Prince William Sound Science Center_A.Dou-Wang_Version 4.2011

Introduction to ESI Maps
When a shoreline is threatened by an approaching oil spill, responders must quickly decide which locations along a shoreline to protect from the spill. That is, they must set their protection priorities. To do this, they first find out:
• Which areas would be worst affected by the spill. Different kinds of shorelines are more or less sensitive (vulnerable to damage by oiling). Marshes and swamps are especially sensitive, because oil in these areas damages plants and is very difficult to clean up. Areas used by sensitive species, such as seabirds and sea otters--which are easily killed when they are coated with oil--are also especially vulnerable.
• Which areas can be protected. Responders usually have only a limited amount of containment equipment, such as floating booms that can be used as barriers to spilled oil. Because there usually isn't enough equipment to protect all areas that could be damaged, responders must decide where to deploy their equipment to be most effective.
A tool commonly used for setting protection priorities, both in the United States and elsewhere, are NOAA's Environmental Sensitivity Index (ESI) maps.
The Front of an ESI Map
A section of the front of an ESI map is shown below. ESI maps show shorelines, wildlife habitats, places important to people, and other locations that are especially sensitive to damage from a spill. People can look at an ESI map of an area threatened by a spill to quickly see the most sensitive locations.
ESI maps show three kinds of things:
1. Shorelines are color-coded to indicate their sensitivity to oiling (they also are ranked on a scale from 1, least sensitive, to 10, most sensitive). On ESI maps, warm colors like red and orange denote the shorelines that are most sensitive to oiling, such as tide flats, swamps, and marshes (including the marshy stream designated in red on the map segment above). Cool colors like blue and purple indicate the least sensitive shorelines, such as rocky headlands and sand and
Prince William Sound Science Center_A.Dou-Wang_Version 4.2011
Prince William Sound Science Center_A.Dou-Wang_Version 4.2011
gravel beaches (on the map above, purple line segments denote locations of eroding bluffs). Shades of green denote shorelines of moderate sensitivity (on the map above, green line segments denote areas of riprap). Large habitat areas, such as tidal flats used by shellfish and wetlands used by shorebirds or waterfowl, are shown as colored polygons (above, orange hatched polygons denote shellfish habitat, used by horseshoe crabs).
2. Sensitive biological resources, such as seabird colonies and marine mammal hauling grounds, are depicted by special symbols on the maps. On the map above, a seal symbol marks habitat used by gray and harbor seals.
3. Important human-use resources, such as water intakes, marinas, and swimming beaches, are also depicted with symbols. (In the map section above, four symbols denote historic sites, one denotes a boat ramp, and one denotes a public park.)
The Back of an ESI Map
Much of the information on an ESI map is shown in a table on the back of the printed copy of the map (some older maps do not include this table of information). The "back-of-the-map" table lists sensitive plant and animal species that live in the area shown on the map. It shows when each species is present in the area, and what that species is doing during different seasons (for example, a bird species may be nesting, laying eggs, hatching, or fledging young birds). The back of the map is also where you'll find contact information for important human-use locations shown on the map.
Although ESI maps are important tools for spill responders, they may not reflect the current shoreline situation, because biological resources and human uses of shorelines can and do change, sometimes quickly. For up-to-date information, contact your local natural resource management agencies.
Source: NOAA National Ocean Service Office of Response and Restoration