Embed Size (px)
Citation preview

A Doppler on Wheels polarimetric radar was brought to Hawaii for the first time on a National Science Foundation educational deployment as part of a radar meteorology course
at the University of Hawai̒ i at Ma–noa.
THE HAWAIIAN EDUCATIONAL RADAR OPPORTUNITY (HERO)
BY MICHAEL M. BELL, ROBERT A. BALLARD, MARK BAUMAN, ANNETTE M. FOERSTER, ANDREW FRAMBACH, KAREN A. KOSIBA, WEN-CHAU LEE, SHANNON L. REES, AND JOSHUA WURMAN
AFFILIATIONS: BELL, BAUMAN, FOERSTER, FRAMBACH, AND REES*—University of Hawaiʻi at Ma–noa, Honolulu, Hawaii; BALLARD—University of Hawaiʻi at Ma–noa, and National Weather Service, Honolulu, Hawaii; KOSIBA AND WURMAN—Center for Severe Weather Research, Boulder, Colorado; LEE—National Center for Atmospheric Research, Boulder, Colorado* ADDITIONAL AFFILIATION: Geophysical Fluid Dynamics Laboratory, Princeton, New JerseyCORRESPONDING AUTHOR: Michael M. Bell, Dept. of Atmo-spheric Sciences, University of Hawaiʻi at Ma–noa, 2525 Correa Rd., Honolulu, HI 96822E-mail: [email protected]
The abstract for this article can be found in this issue, following the table of contents.DOI:10.1175/BAMS-D-14-00126.1
In final form 11 February 2015©2015 American Meteorological Society
T he Hawaiian Islands experience frequent rain events, ranging from light trade wind showers to heavy orographic and synoptically forced rain-
fall, with occasional extreme rainfall from tropical cyclones. Oʻahu is a relatively small island in the state with a size of 71 km × 48 km, but it has the highest population with nearly one million people. Despite the small size, the island has significant mesoscale variability in rainfall owing to the complex terrain of the Koʻolau and Wai̒ anae mountains (Schroeder
1977; Chu et al. 2009; Van Nguyen et al. 2010; Hartley and Chen 2010; Murphy and Businger 2011). Doppler radar is one of the only meteorological tools available that can probe the three-dimensional precipitation and wind structure of tropical clouds, showers, thun-derstorms, and tropical cyclones with adequate spatial and temporal resolution to observe this variability. There is no permanent Doppler radar on Oʻahu, but the island has radar coverage from two Weather Sur-veillance Radar-1988 Dopplers (WSR-88Ds) located on the neighbor islands of Kauaʻi and Molokaʻi.
The importance of radar technology to both research and operational weather forecasting has continued to grow over the years, especially with recent advances in dual-polarization technology (Herzegh and Jameson 1992), including the polari-metric upgrade of the WSR-88Ds completed in spring 2013 (Doviak et al. 2000). While radar observations are included in many courses at the University of Hawaiʻi at Mānoa (UHM), a dedicated course on the principles and application of this technology was not available until Fall Semester 2013 with the advent of a graduate course called MET 628 “Radar Meteorology.” As part of the inaugural offering of MET 628, a National Science Foundation (NSF) educational deployment of the Doppler on Wheels (DOW; Wurman et al. 1997; Wurman 2001; Dixon et al. 2013) was requested in order to maximize the educational value of the course. The Hawaiian
2167DECEMBER 2015AMERICAN METEOROLOGICAL SOCIETY |
Educational Radar Opportunity (HERO) educational deployment featured three main avenues to integrate the hands-on experience provided by the DOW radar visit: 1) strong integration with MET 628 for graduate students; 2) field planning, deployment, and forecast experience for graduate and undergraduate students; and 3) public education and outreach.
Research radars have only rarely visited the Hawai-ian Islands owing to the distance from the mainland United States. The earliest research radar deployment is believed to be a warm rain research project by the Illinois State Water Survey using two 3-cm radars near Hilo on the island of Hawaiʻi in the summer of 1965 (Semonin et al. 1967). The last NSF-funded radar deployment to the islands used two 5-cm radars near Hilo in the summer of 1990 for the Hawaiian Rainband Project (HaRP; Carbone et al. 1998). No research weather radars have been deployed previ-ously to Oʻahu to the authors’ knowledge. The HERO deployment offered an opportunity to provide field and forecasting experience for meteorology students and allowed for broad exposure for the NSF facility to the public, including nonmajor UHM students and local K–12 students. Native Hawaiians and Pacific Islanders are underrepresented in the atmospheric sciences, and the chance to tour a high-tech weather radar was an exciting experience for several thousand Hawaii residents.
The Molokaʻi WSR-88D radar is approximately 100 km from the center of Oʻahu, and the Kaua̒ i radar is approximately 175 km away. The distance from the WSR-88D radars to Oʻahu limits the ability to observe precipitation below 1-km altitude and at sufficiently high spatial resolution for some research purposes. Mobile DOW radars permit targeted deployments close to weather phenomena of interest, resulting in much finer-scale observations than can be obtained by more distant stationary radars. The DOW radars are managed and operated by the Center for Severe Weath-er Research (CSWR) and have been used in a wide variety of mesoscale meteorological studies, observing tornadoes (Wurman et al. 2012), hurricanes (Kosiba and Wurman 2014), winter precipitation (Schultz et al. 2002), and other phenomena. DOWs have been used in several educational deployments on the U.S. mainland1 (Richardson et al. 2008; Toth et al. 2011). The ability to deploy a mobile 3-cm-wavelength radar allowed for unprecedented resolution of convective-
scale features around Oʻahu, with radar gate spacing down to 15 m. The approximately 3-week deployment from 21 October to 13 November 2013 coincided with an active weather period, yielding a wide sampling of weather conditions. Phenomena observed by the radar include cumulus clouds, trade wind showers, deep convective thunderstorms, and a widespread heavy rain event associated with a cold frontal passage.
A key component of HERO was accurate forecast-ing of the weather conditions and targeted precipita-tion forecasts. UHM is a unique institution that has both a graduate and undergraduate atmospheric sciences program and has the local National Weather Service (NWS) Honolulu Weather Forecast Office collocated in the same building on campus. The Central Pacific Hurricane Center is also collocated in the local NWS office. One of the highlights of HERO was the opportunity for students to improve their tropical forecasting skills under the guidance of skilled NWS forecasters.
This article summarizes the HERO project and highlights some of the detailed cloud and precipita-tion structures observed during the field experiment. The integration with MET 628 and other UHM education and outreach activities are described in the next section. Selected radar observations and analyses are presented in the "Field operations" sec-tion, including unique polarimetric signatures and their implications for the dynamics and microphysics of tropical convection. Lessons learned during the deployment and concluding remarks are presented in the "Summary and lessons learned" section.
THE HERO EDUCATIONAL DEPLOYMENT. MET 628 "Radar Meteorology." MET 628 is a graduate-level course at UHM to teach students the history, theory, hardware, and practical use of radar for me-teorological applications. Students develop skills in understanding, interpreting, and using radar obser-vations for meteorological research and operational forecasting. The educational deployment provided a focal point for the integration of lectures, weekly laboratories, field work, and original research in the course. The 12 MET 628 students enrolled in the course became principal investigators (PIs) for HERO and handled all radar operations and deployments under the advisement of the senior PIs and CSWR staff. A list of course topics by week and the HERO start and end dates are presented in Table 1.
The first 8 weeks of class were dedicated to foun-dational material designed to prepare the students for the arrival of the DOW. Weekly radar laboratories were conducted for practical experience performing
1 A complete list of NSF educational deployments and in-formation on how to request NSF facilities for educational purposes can be found at www.eol.ucar.edu/educational -deployments.
2168 DECEMBER 2015|
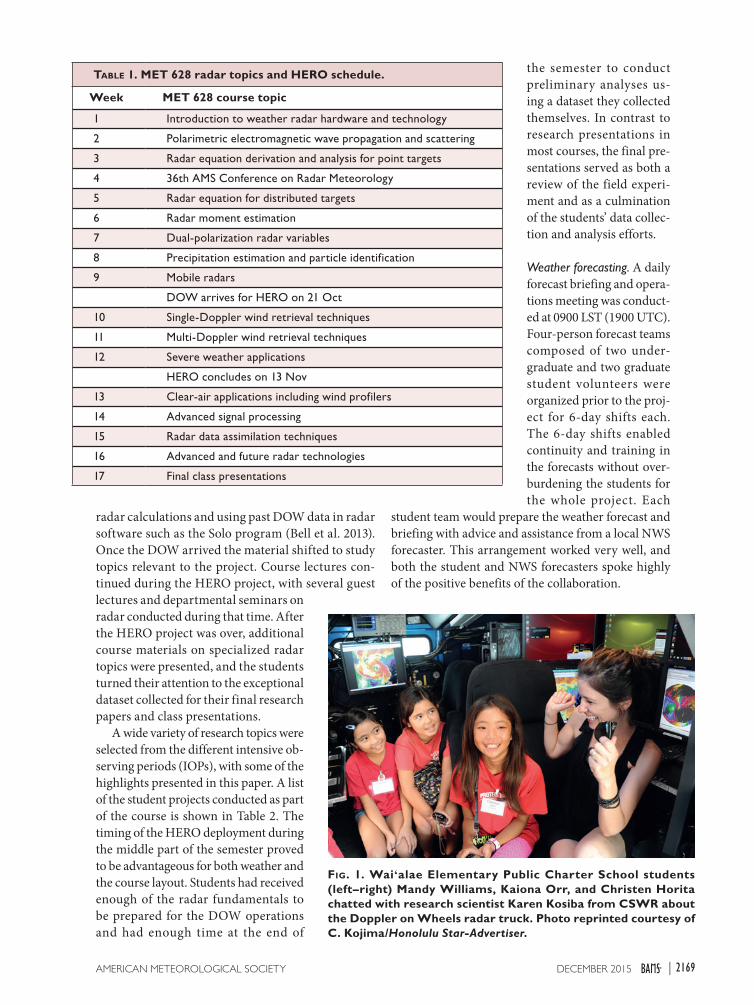
radar calculations and using past DOW data in radar software such as the Solo program (Bell et al. 2013). Once the DOW arrived the material shifted to study topics relevant to the project. Course lectures con-tinued during the HERO project, with several guest lectures and departmental seminars on radar conducted during that time. After the HERO project was over, additional course materials on specialized radar topics were presented, and the students turned their attention to the exceptional dataset collected for their final research papers and class presentations.
A wide variety of research topics were selected from the different intensive ob-serving periods (IOPs), with some of the highlights presented in this paper. A list of the student projects conducted as part of the course is shown in Table 2. The timing of the HERO deployment during the middle part of the semester proved to be advantageous for both weather and the course layout. Students had received enough of the radar fundamentals to be prepared for the DOW operations and had enough time at the end of
the semester to conduct preliminary analyses us-ing a dataset they collected themselves. In contrast to research presentations in most courses, the final pre-sentations served as both a review of the field experi-ment and as a culmination of the students’ data collec-tion and analysis efforts.
Weather forecasting. A daily forecast briefing and opera-tions meeting was conduct-ed at 0900 LST (1900 UTC). Four-person forecast teams composed of two under-graduate and two graduate student volunteers were organized prior to the proj-ect for 6-day shifts each. The 6-day shifts enabled continuity and training in the forecasts without over-burdening the students for the whole project. Each
student team would prepare the weather forecast and briefing with advice and assistance from a local NWS forecaster. This arrangement worked very well, and both the student and NWS forecasters spoke highly of the positive benefits of the collaboration.
TABLE 1. MET 628 radar topics and HERO schedule.
Week MET 628 course topic
1 Introduction to weather radar hardware and technology
2 Polarimetric electromagnetic wave propagation and scattering
3 Radar equation derivation and analysis for point targets
4 36th AMS Conference on Radar Meteorology
5 Radar equation for distributed targets
6 Radar moment estimation
7 Dual-polarization radar variables
8 Precipitation estimation and particle identification
9 Mobile radars
DOW arrives for HERO on 21 Oct
10 Single-Doppler wind retrieval techniques
11 Multi-Doppler wind retrieval techniques
12 Severe weather applications
HERO concludes on 13 Nov
13 Clear-air applications including wind profilers
14 Advanced signal processing
15 Radar data assimilation techniques
16 Advanced and future radar technologies
17 Final class presentations
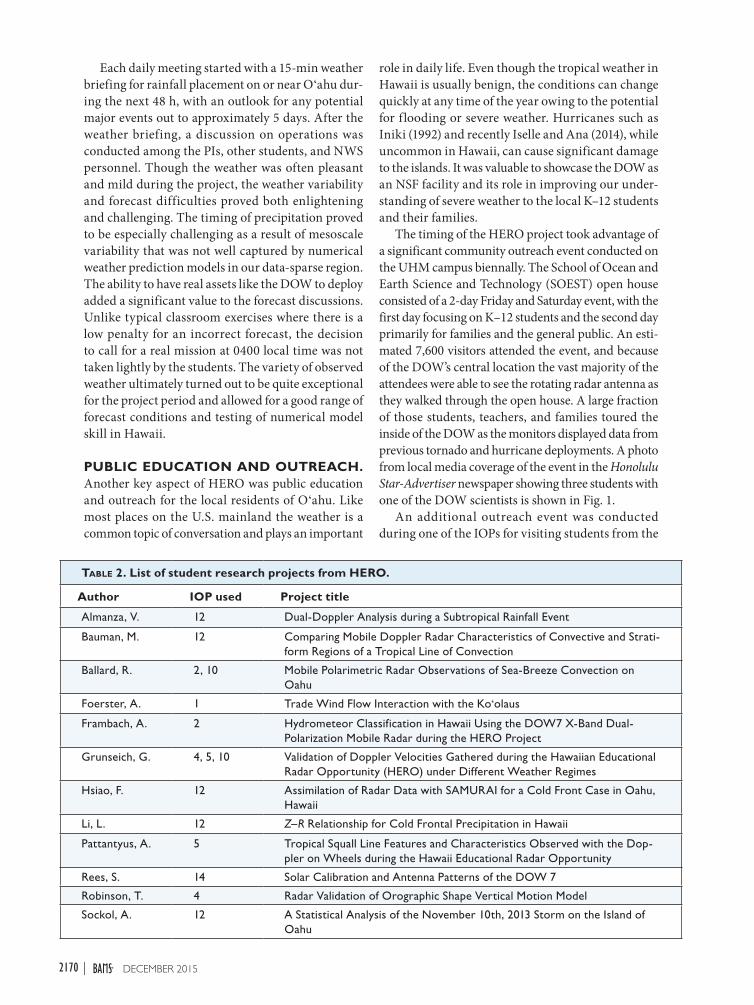
FIG. 1. Waiʻalae Elementary Public Charter School students (left–right) Mandy Williams, Kaiona Orr, and Christen Horita chatted with research scientist Karen Kosiba from CSWR about the Doppler on Wheels radar truck. Photo reprinted courtesy of C. Kojima/Honolulu Star-Advertiser.
2169DECEMBER 2015AMERICAN METEOROLOGICAL SOCIETY |
Each daily meeting started with a 15-min weather briefing for rainfall placement on or near Oʻahu dur-ing the next 48 h, with an outlook for any potential major events out to approximately 5 days. After the weather briefing, a discussion on operations was conducted among the PIs, other students, and NWS personnel. Though the weather was often pleasant and mild during the project, the weather variability and forecast difficulties proved both enlightening and challenging. The timing of precipitation proved to be especially challenging as a result of mesoscale variability that was not well captured by numerical weather prediction models in our data-sparse region. The ability to have real assets like the DOW to deploy added a significant value to the forecast discussions. Unlike typical classroom exercises where there is a low penalty for an incorrect forecast, the decision to call for a real mission at 0400 local time was not taken lightly by the students. The variety of observed weather ultimately turned out to be quite exceptional for the project period and allowed for a good range of forecast conditions and testing of numerical model skill in Hawaii.
PUBLIC EDUCATION AND OUTREACH. Another key aspect of HERO was public education and outreach for the local residents of Oʻahu. Like most places on the U.S. mainland the weather is a common topic of conversation and plays an important
role in daily life. Even though the tropical weather in Hawaii is usually benign, the conditions can change quickly at any time of the year owing to the potential for flooding or severe weather. Hurricanes such as Iniki (1992) and recently Iselle and Ana (2014), while uncommon in Hawaii, can cause significant damage to the islands. It was valuable to showcase the DOW as an NSF facility and its role in improving our under-standing of severe weather to the local K–12 students and their families.
The timing of the HERO project took advantage of a significant community outreach event conducted on the UHM campus biennally. The School of Ocean and Earth Science and Technology (SOEST) open house consisted of a 2-day Friday and Saturday event, with the first day focusing on K–12 students and the second day primarily for families and the general public. An esti-mated 7,600 visitors attended the event, and because of the DOW’s central location the vast majority of the attendees were able to see the rotating radar antenna as they walked through the open house. A large fraction of those students, teachers, and families toured the inside of the DOW as the monitors displayed data from previous tornado and hurricane deployments. A photo from local media coverage of the event in the Honolulu Star-Advertiser newspaper showing three students with one of the DOW scientists is shown in Fig. 1.
An additional outreach event was conducted during one of the IOPs for visiting students from the
TABLE 2. List of student research projects from HERO.
Author IOP used Project title
Almanza, V. 12 Dual-Doppler Analysis during a Subtropical Rainfall Event
Bauman, M. 12 Comparing Mobile Doppler Radar Characteristics of Convective and Strati-form Regions of a Tropical Line of Convection
Ballard, R. 2, 10 Mobile Polarimetric Radar Observations of Sea-Breeze Convection on Oahu
Foerster, A. 1 Trade Wind Flow Interaction with the Koʻolaus
Frambach, A. 2 Hydrometeor Classification in Hawaii Using the DOW7 X-Band Dual-Polarization Mobile Radar during the HERO Project
Grunseich, G. 4, 5, 10 Validation of Doppler Velocities Gathered during the Hawaiian Educational Radar Opportunity (HERO) under Different Weather Regimes
Hsiao, F. 12 Assimilation of Radar Data with SAMURAI for a Cold Front Case in Oahu, Hawaii
Li, L. 12 Z–R Relationship for Cold Frontal Precipitation in Hawaii
Pattantyus, A. 5 Tropical Squall Line Features and Characteristics Observed with the Dop-pler on Wheels during the Hawaii Educational Radar Opportunity
Rees, S. 14 Solar Calibration and Antenna Patterns of the DOW 7
Robinson, T. 4 Radar Validation of Orographic Shape Vertical Motion Model
Sockol, A. 12 A Statistical Analysis of the November 10th, 2013 Storm on the Island of Oahu
2170 DECEMBER 2015|
Variety School of Hawaii that educates children with learning disabilities, attention deficit disorder, and autism. Middle school students and teachers visited the radar to ask questions and help launch a weather balloon. The experience was great for the students, and they built a “weather wall of thunder” with draw-ings and pictures at their school after the event. It is hoped that the open house, media coverage, and radar visits helped to encourage some young students to consider careers in atmospheric science, geoscience, or another science and technology field.
FIELD OPERATIONS. IOPs were targeted to be centered on 1800 or 0000 UTC (0800 or 1400 LST) for approximately 6 h on station. Student teams were assigned on a rotating schedule based on availability, such that all MET 628 participants had at least three IOPs with the DOW. The student PIs were required to write a detailed mission summary after each IOP. Sup-port teams accompanied the truck in private vehicles to assist with radiosonde launches and to observe and learn the DOW radar operations. The support teams consisted of a combination of volunteer undergradu-ate and graduate students and NWS personnel.
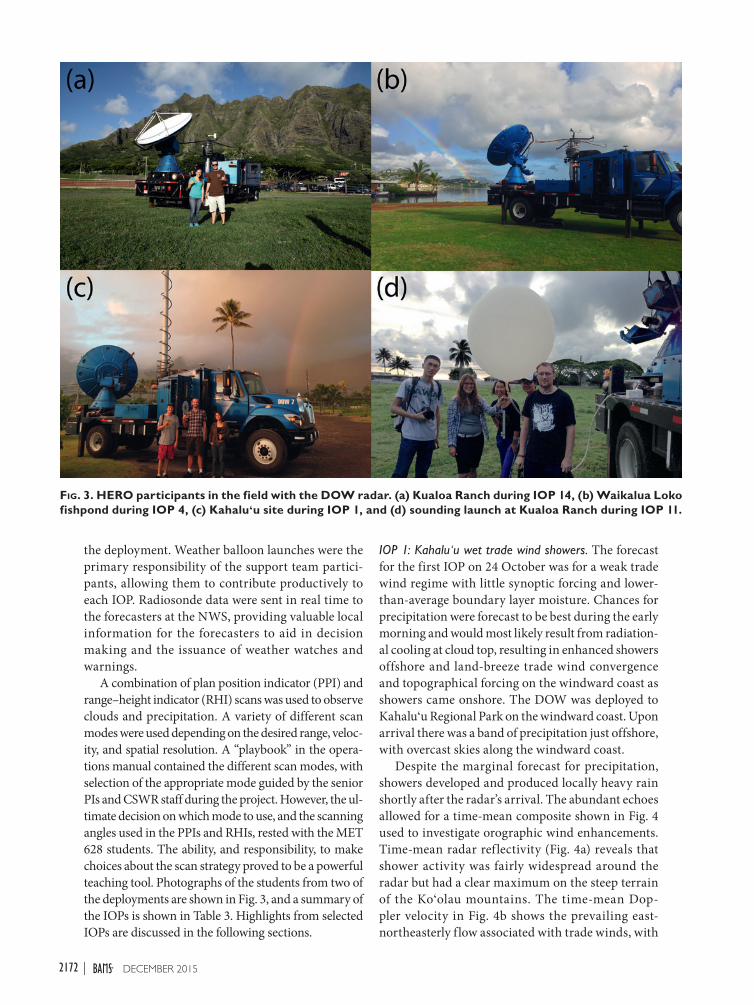
Seventeen sites around Oʻahu were identified to observe different types of weather conditions as part of a course laboratory assignment on the effects of radar beam blockage by complex terrain. These sites were then refined based on site surveys with CSWR personnel that assessed height clearance for the DOW, ground clutter, and beam blockage. The final sites used in the project are shown in Fig. 2. The radar was based on Sand Island at the UHM SOEST Ma-rine Center, but radar operations were limited there because of radio interference. The primary area of operations was on the windward side of Oʻahu, with scientific interests on trade wind showers, orographic forcing, and warm rain precipitation processes. The site in the central valley near Wahiawa was used dur-ing the cold frontal passage and on two weak trade wind days when the sea-breeze and inland convection were active.
Since operational soundings are only launched twice a day from the neighbor islands and not on Oʻahu, 14 research radiosondes were launched by the HERO participants during the IOPs. The research soundings provided thermodynamic context for the radar observations and were a critical component of
FIG. 2. Satellite image of Oʻahu showing radar sites used during the HERO project. Image courtesy Google Earth.
2171DECEMBER 2015AMERICAN METEOROLOGICAL SOCIETY |
the deployment. Weather balloon launches were the primary responsibility of the support team partici-pants, allowing them to contribute productively to each IOP. Radiosonde data were sent in real time to the forecasters at the NWS, providing valuable local information for the forecasters to aid in decision making and the issuance of weather watches and warnings.
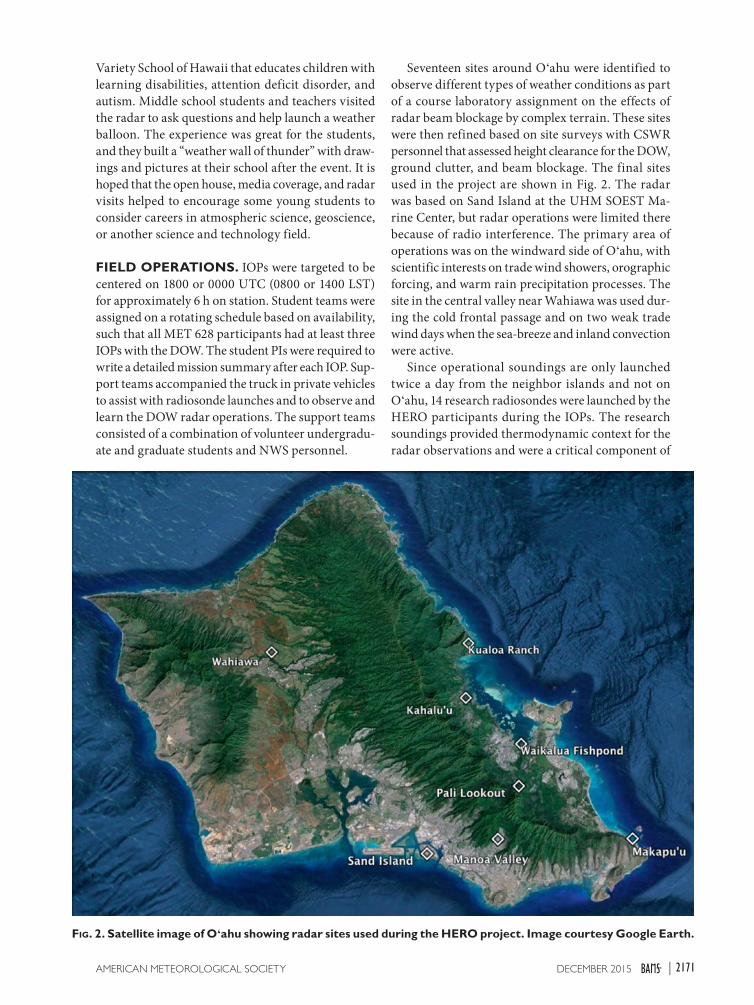
A combination of plan position indicator (PPI) and range–height indicator (RHI) scans was used to observe clouds and precipitation. A variety of different scan modes were used depending on the desired range, veloc-ity, and spatial resolution. A “playbook” in the opera-tions manual contained the different scan modes, with selection of the appropriate mode guided by the senior PIs and CSWR staff during the project. However, the ul-timate decision on which mode to use, and the scanning angles used in the PPIs and RHIs, rested with the MET 628 students. The ability, and responsibility, to make choices about the scan strategy proved to be a powerful teaching tool. Photographs of the students from two of the deployments are shown in Fig. 3, and a summary of the IOPs is shown in Table 3. Highlights from selected IOPs are discussed in the following sections.
IOP 1: Kahalu̒ u wet trade wind showers. The forecast for the first IOP on 24 October was for a weak trade wind regime with little synoptic forcing and lower-than-average boundary layer moisture. Chances for precipitation were forecast to be best during the early morning and would most likely result from radiation-al cooling at cloud top, resulting in enhanced showers offshore and land-breeze trade wind convergence and topographical forcing on the windward coast as showers came onshore. The DOW was deployed to Kahaluʻu Regional Park on the windward coast. Upon arrival there was a band of precipitation just offshore, with overcast skies along the windward coast.
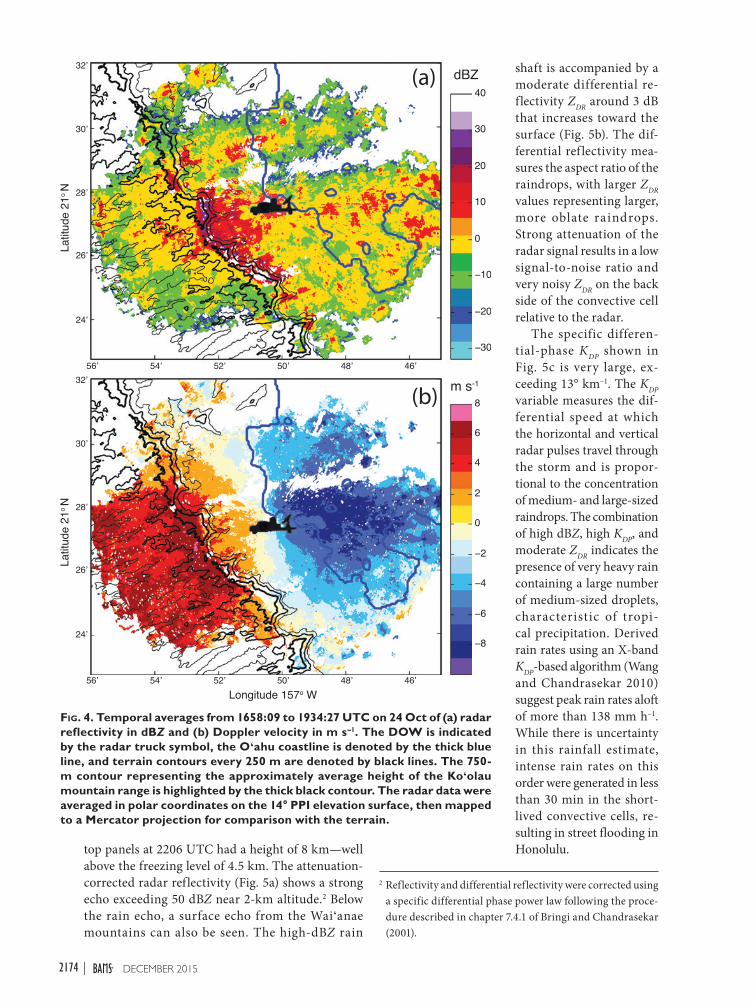
Despite the marginal forecast for precipitation, showers developed and produced locally heavy rain shortly after the radar’s arrival. The abundant echoes allowed for a time-mean composite shown in Fig. 4 used to investigate orographic wind enhancements. Time-mean radar reflectivity (Fig. 4a) reveals that shower activity was fairly widespread around the radar but had a clear maximum on the steep terrain of the Koʻolau mountains. The time-mean Dop-pler velocity in Fig. 4b shows the prevailing east-northeasterly flow associated with trade winds, with
FIG. 3. HERO participants in the field with the DOW radar. (a) Kualoa Ranch during IOP 14, (b) Waikalua Loko fishpond during IOP 4, (c) Kahaluʻu site during IOP 1, and (d) sounding launch at Kualoa Ranch during IOP 11.
2172 DECEMBER 2015|
cool colors indicating winds toward the radar and warm colors indicating winds away from the radar. Single-Doppler analysis of the time-mean velocity (not shown) indicates that the flow decelerated as it came onshore at low levels but accelerated above the mountaintop. The deceleration is believed to be due to a weak land-breeze circulation in the early morning hours and increased friction over land. The surface wind direction measured from the DOW at 10-m height showed westerly winds suggesting downslope flow prior to sunrise, with a shift to weak easterly flow shortly after sunrise (not shown). The enhance-ment in trade wind showers over the Oʻahu terrain at this time coincides with a climatological peak in rainfall in the early morning and is consistent with the hypothesis that the morning rainfall maximum is due primarily to nocturnal cooling (Chen and Nash 1994; Van Nguyen et al. 2010).
IOP 2: Wahiawa sea-breeze thunderstorms. Surface high pressure over the main Hawaiian Islands was forecast for this IOP on 27 October, with a cold air mass aloft associated with a nearby upper-level low. Southerly flow the day before had advected higher-than-normal boundary layer moisture over the island, which along with the cold air aloft contributed to
higher-than-normal instability. Deep convection was expected to develop over the central valley of Oʻahu during the afternoon owing to a combination of sea-breeze convergence and upslope flow in a light syn-optic flow pattern. The Wahiawa location was chosen as the deployment site based upon the tendency for sea-breeze convergence to incite convection in the island interior.
Towering cumulus and showers were already oc-curring at the site upon the DOW’s arrival. During the late morning hours several cells of deep convec-tion developed near the radar site, with thunder be-ing heard at the site by 2208 UTC. Thunder is a rare occurrence in Hawaii, with audible thunderstorms occurring only 5–10 times per year on average over the islands (National Oceanic and Atmospheric Ad-ministration 1985). At 2211 UTC, outflow from the thunderstorm to the west of the radar reached the DOW wind instruments, with a peak wind speed of 8.4 m s–1. Short-lived ordinary-cell deep convection continued to develop and dissipate over the valley and nearby mountains throughout the afternoon.
Despite the weak synoptic forcing, this day pro-duced the deepest convection of the HERO project. RHI images of two convective towers are shown in Fig. 5. The echo top for the convective cell seen in the
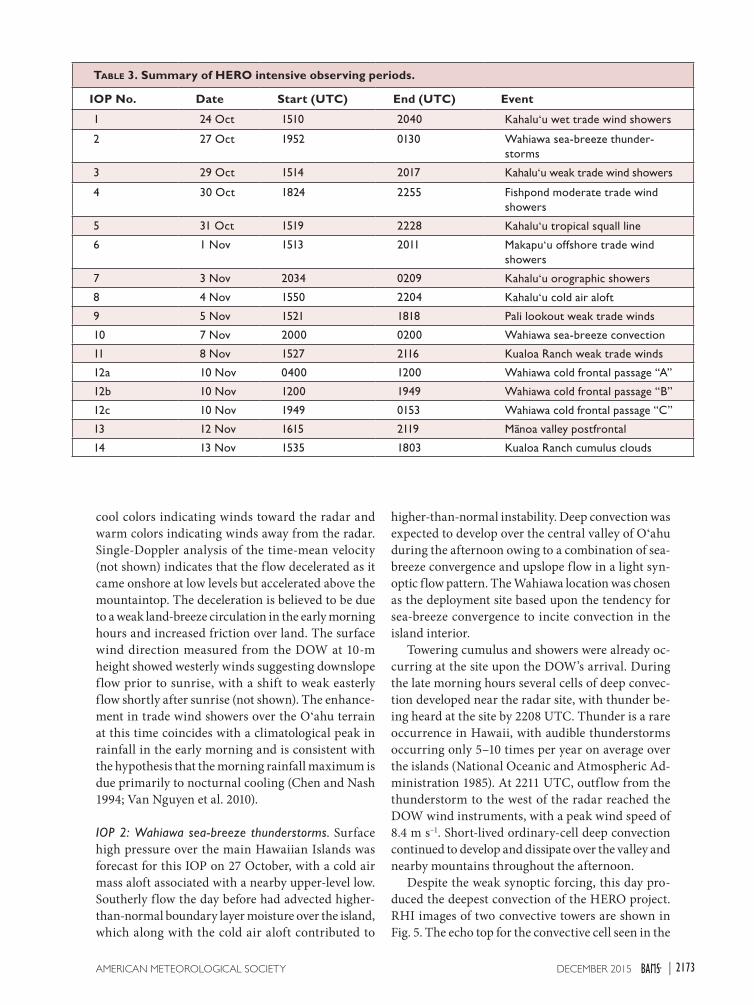
TABLE 3. Summary of HERO intensive observing periods.
IOP No. Date Start (UTC) End (UTC) Event
1 24 Oct 1510 2040 Kahaluʻu wet trade wind showers
2 27 Oct 1952 0130 Wahiawa sea-breeze thunder-storms
3 29 Oct 1514 2017 Kahaluʻu weak trade wind showers
4 30 Oct 1824 2255 Fishpond moderate trade wind showers
5 31 Oct 1519 2228 Kahaluʻu tropical squall line
6 1 Nov 1513 2011 Makapuʻu offshore trade wind showers
7 3 Nov 2034 0209 Kahaluʻu orographic showers
8 4 Nov 1550 2204 Kahaluʻu cold air aloft
9 5 Nov 1521 1818 Pali lookout weak trade winds
10 7 Nov 2000 0200 Wahiawa sea-breeze convection
11 8 Nov 1527 2116 Kualoa Ranch weak trade winds
12a 10 Nov 0400 1200 Wahiawa cold frontal passage “A”
12b 10 Nov 1200 1949 Wahiawa cold frontal passage “B”
12c 10 Nov 1949 0153 Wahiawa cold frontal passage “C”
13 12 Nov 1615 2119 Ma–noa valley postfrontal
14 13 Nov 1535 1803 Kualoa Ranch cumulus clouds
2173DECEMBER 2015AMERICAN METEOROLOGICAL SOCIETY |
top panels at 2206 UTC had a height of 8 km—well above the freezing level of 4.5 km. The attenuation-corrected radar reflectivity (Fig. 5a) shows a strong echo exceeding 50 dBZ near 2-km altitude.2 Below the rain echo, a surface echo from the Waiʻanae mountains can also be seen. The high-dBZ rain
shaft is accompanied by a moderate differential re-flectivity ZDR around 3 dB that increases toward the surface (Fig. 5b). The dif-ferential ref lectivity mea-sures the aspect ratio of the raindrops, with larger ZDR values representing larger, more oblate raindrops. Strong attenuation of the radar signal results in a low signal-to-noise ratio and very noisy ZDR on the back side of the convective cell relative to the radar.
The specific differen-tial-phase KDP shown in Fig. 5c is very large, ex-ceeding 13° km–1. The KDP variable measures the dif-ferential speed at which the horizontal and vertical radar pulses travel through the storm and is propor-tional to the concentration of medium- and large-sized raindrops. The combination of high dBZ, high KDP, and moderate ZDR indicates the presence of very heavy rain containing a large number of medium-sized droplets, characteristic of tropi-cal precipitation. Derived rain rates using an X-band KDP-based algorithm (Wang and Chandrasekar 2010) suggest peak rain rates aloft of more than 138 mm h–1. While there is uncertainty in this rainfall estimate, intense rain rates on this order were generated in less than 30 min in the short-lived convective cells, re-sulting in street flooding in Honolulu.
FIG. 4. Temporal averages from 1658:09 to 1934:27 UTC on 24 Oct of (a) radar reflectivity in dBZ and (b) Doppler velocity in m s–1. The DOW is indicated by the radar truck symbol, the Oʻahu coastline is denoted by the thick blue line, and terrain contours every 250 m are denoted by black lines. The 750-m contour representing the approximately average height of the Koʻolau mountain range is highlighted by the thick black contour. The radar data were averaged in polar coordinates on the 14° PPI elevation surface, then mapped to a Mercator projection for comparison with the terrain.
2 Reflectivity and differential reflectivity were corrected using a specific differential phase power law following the proce-dure described in chapter 7.4.1 of Bringi and Chandrasekar (2001).
2174 DECEMBER 2015|
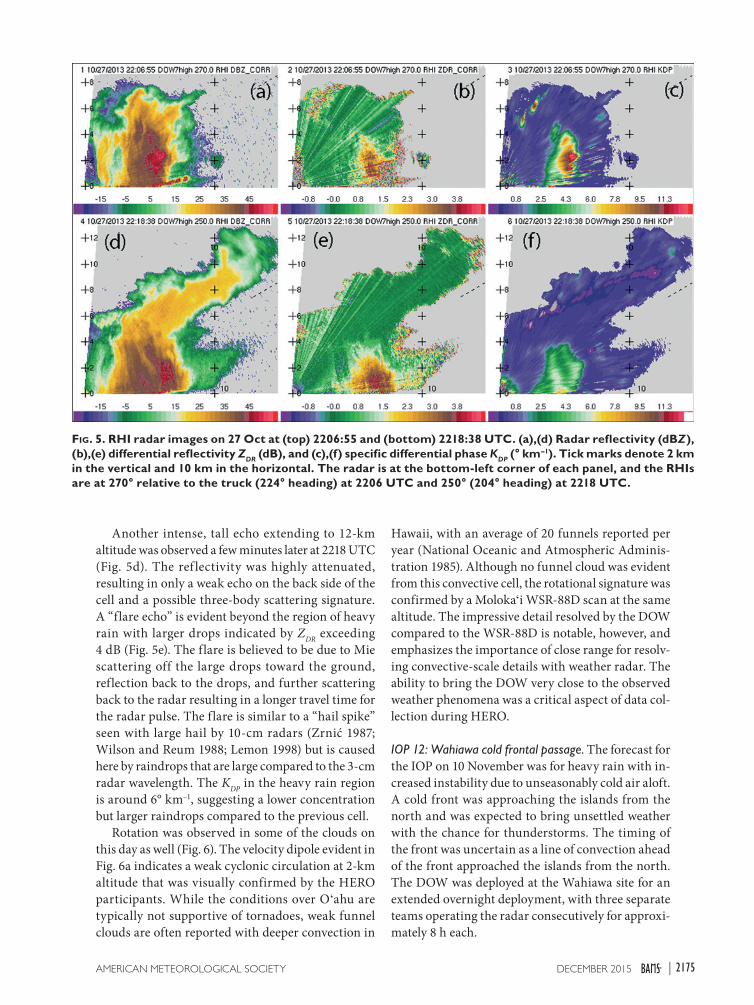
Another intense, tall echo extending to 12-km altitude was observed a few minutes later at 2218 UTC (Fig. 5d). The ref lectivity was highly attenuated, resulting in only a weak echo on the back side of the cell and a possible three-body scattering signature. A “flare echo” is evident beyond the region of heavy rain with larger drops indicated by ZDR exceeding 4 dB (Fig. 5e). The flare is believed to be due to Mie scattering off the large drops toward the ground, reflection back to the drops, and further scattering back to the radar resulting in a longer travel time for the radar pulse. The flare is similar to a “hail spike” seen with large hail by 10-cm radars (Zrnić 1987; Wilson and Reum 1988; Lemon 1998) but is caused here by raindrops that are large compared to the 3-cm radar wavelength. The KDP in the heavy rain region is around 6° km–1, suggesting a lower concentration but larger raindrops compared to the previous cell.
Rotation was observed in some of the clouds on this day as well (Fig. 6). The velocity dipole evident in Fig. 6a indicates a weak cyclonic circulation at 2-km altitude that was visually confirmed by the HERO participants. While the conditions over Oʻahu are typically not supportive of tornadoes, weak funnel clouds are often reported with deeper convection in
Hawaii, with an average of 20 funnels reported per year (National Oceanic and Atmospheric Adminis-tration 1985). Although no funnel cloud was evident from this convective cell, the rotational signature was confirmed by a Molokaʻi WSR-88D scan at the same altitude. The impressive detail resolved by the DOW compared to the WSR-88D is notable, however, and emphasizes the importance of close range for resolv-ing convective-scale details with weather radar. The ability to bring the DOW very close to the observed weather phenomena was a critical aspect of data col-lection during HERO.
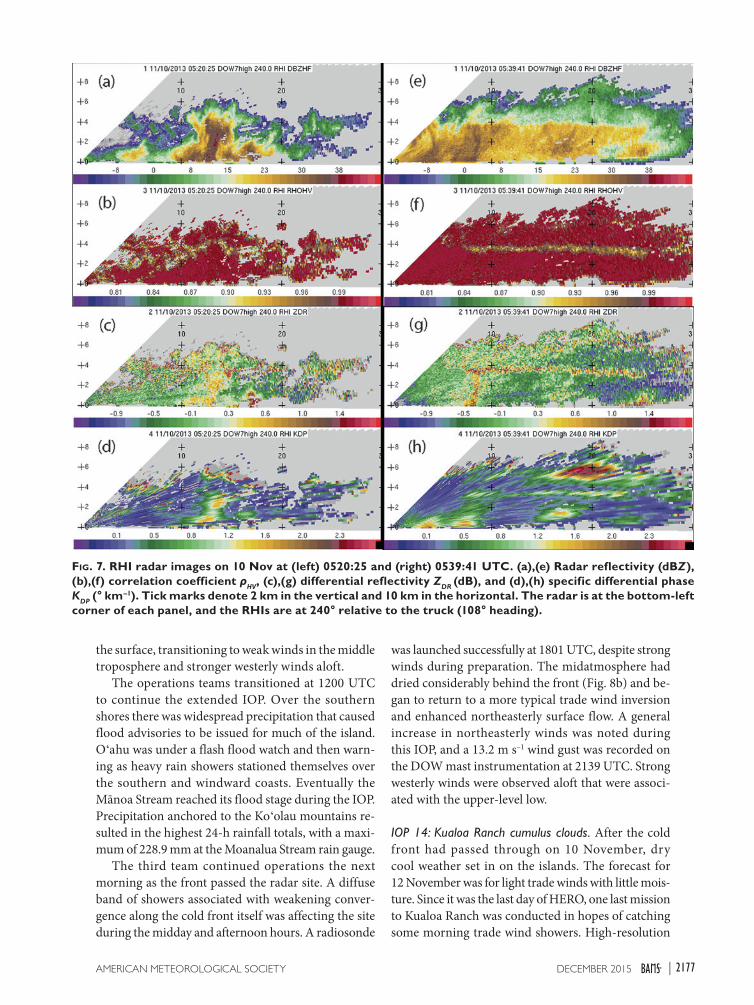
IOP 12: Wahiawa cold frontal passage. The forecast for the IOP on 10 November was for heavy rain with in-creased instability due to unseasonably cold air aloft. A cold front was approaching the islands from the north and was expected to bring unsettled weather with the chance for thunderstorms. The timing of the front was uncertain as a line of convection ahead of the front approached the islands from the north. The DOW was deployed at the Wahiawa site for an extended overnight deployment, with three separate teams operating the radar consecutively for approxi-mately 8 h each.
FIG. 5. RHI radar images on 27 Oct at (top) 2206:55 and (bottom) 2218:38 UTC. (a),(d) Radar reflectivity (dBZ), (b),(e) differential reflectivity ZDR (dB), and (c),(f) specific differential phase KDP (° km–1). Tick marks denote 2 km in the vertical and 10 km in the horizontal. The radar is at the bottom-left corner of each panel, and the RHIs are at 270° relative to the truck (224° heading) at 2206 UTC and 250° (204° heading) at 2218 UTC.
2175DECEMBER 2015AMERICAN METEOROLOGICAL SOCIETY |
FIG. 6. Doppler velocity in m s–1 on 27 Oct from (a) the DOW radar at 8.5° elevation at 2324:31 UTC with the radar location indicated by the truck symbol, and (b) WSR-88D Molokaʻi radar at 0.5° elevation at 2318:48 UTC. The rotation signature at 2.1-km height is high-lighted by the circles, and arrows indicate the direction and distance to the radar. Tick marks denote 5 km in the horizontal.
conditions, and the distortion suggests the presence of large amounts of supercooled water being lofted above the freezing level in this region.
As that active convective cell decayed over the next 20 min, the convection organized into a broad rain-band of stratiform precipitation at 0539 UTC (Figs. 7e–h). The remnants of the previous cell are evident to the left of the figure near the radar, with higher reflectivity and a column of high ZDR. The transition from snow to rain is apparent in the increased reflec-tivity below the melting layer due to the increased backscatter of liquid versus ice, although there is no strong “bright band” in the dBZ field associated with the melting precipitation. In contrast, the melting layer is quite evident as a thin band of high ZDR and low ρHV. The height of the melting layer decreased by approximately 700 m from 0508 to 0610 UTC (not shown), with a strengthening mixed-phase signal in the polarimetric variables, suggesting a weakening updraft and greater melting over time.
The KDP signature shows a distinct maximum above the freezing level near the −12° to −15°C temperature level (near 6-km altitude). This strong signature in KDP but lack of corresponding increase in dBZ sug-gests a high concentration of smaller ice crystals. This signature has been identified as enhanced growth of dendritic ice crystals in stratiform precipitation in Col-orado (Kennedy and Rutledge 2011) and Italy (Bechini et al. 2013) and is well correlated with stronger surface precipitation below the high KDP in these regions. The presence of this signature in stratiform precipitation in Hawaii at a different altitude, but similar tempera-ture, is consistent with the interpretation of enhanced vapor deposition and crystal growth near −15°C due to the difference in saturation vapor pressure over ice and water. An enhancement of the low-level dBZ, ZDR, and KDP associated with heavier rain below the high KDP region is also consistent with this physical interpretation and the precipitation correlation found in previous studies. High KDP values at the echo top in Figs. 7d and 7h are associated with low signal-to-noise ratio and may not be due to physical processes.
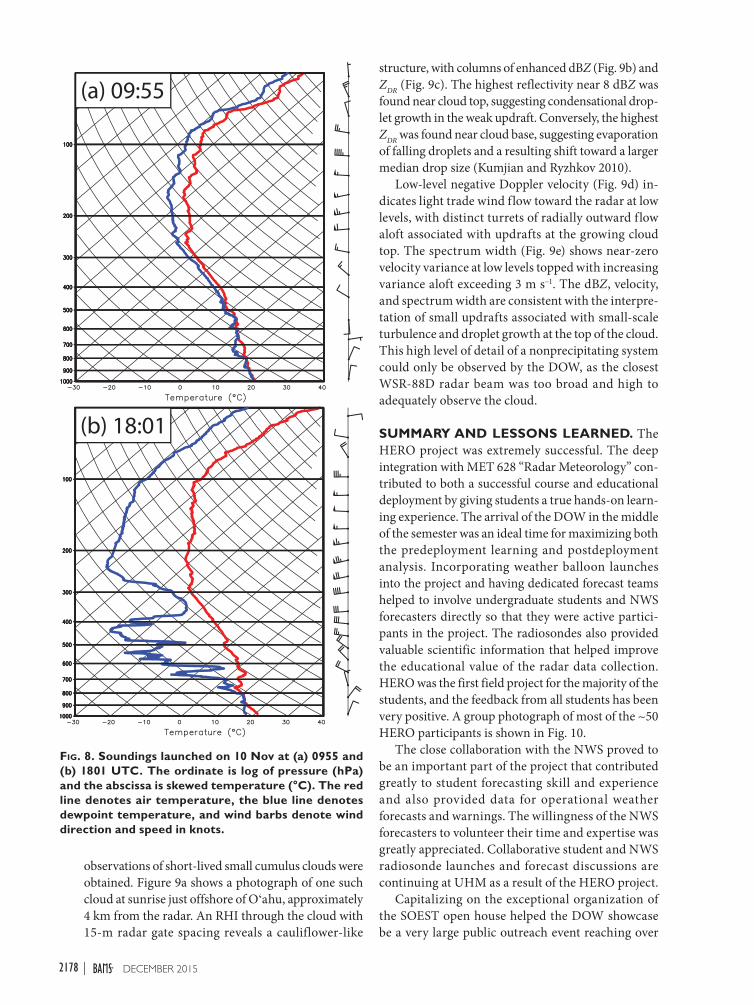
While the radar data provide valuable insight into the precipitation, the interpretation of the radar imagery and physical processes depends on the local thermodynamic and kinematic environment. A ra-diosonde was launched prior to frontal passage during a break in the precipitation at 0955 UTC. The prefron-tal temperature sounding revealed a lack of typical low-level inversion and the presence of very cold air aloft for Hawaii in November (Fig. 8a). The humidity profile revealed a very deep moist layer up to 250 hPa. The winds were characterized by northeasterly flow at
The precipitation on this day was characterized by widespread stratiform rain, with the heaviest rain organized into bands punctuated by deeper convec-tive updrafts. An RHI through one of the convective cells at 0520 UTC is shown in Fig. 7a, with reflectiv-ity exceeding 40 dBZ. Columns of high ZDR and KDP are evident in Figs. 7c and 7d, suggesting an intense updraft associated with the cell (Kumjian et al. 2014). The updraft also distorted the melting level, indicated by the bulging layer of low correlation coefficient ρHV associated with the stronger echo (Fig. 7b). The low correlation coefficient is associated with mixed-phase
2176 DECEMBER 2015|
the surface, transitioning to weak winds in the middle troposphere and stronger westerly winds aloft.
The operations teams transitioned at 1200 UTC to continue the extended IOP. Over the southern shores there was widespread precipitation that caused flood advisories to be issued for much of the island. Oʻahu was under a flash flood watch and then warn-ing as heavy rain showers stationed themselves over the southern and windward coasts. Eventually the Mānoa Stream reached its flood stage during the IOP. Precipitation anchored to the Koʻolau mountains re-sulted in the highest 24-h rainfall totals, with a maxi-mum of 228.9 mm at the Moanalua Stream rain gauge.
The third team continued operations the next morning as the front passed the radar site. A diffuse band of showers associated with weakening conver-gence along the cold front itself was affecting the site during the midday and afternoon hours. A radiosonde
was launched successfully at 1801 UTC, despite strong winds during preparation. The midatmosphere had dried considerably behind the front (Fig. 8b) and be-gan to return to a more typical trade wind inversion and enhanced northeasterly surface flow. A general increase in northeasterly winds was noted during this IOP, and a 13.2 m s–1 wind gust was recorded on the DOW mast instrumentation at 2139 UTC. Strong westerly winds were observed aloft that were associ-ated with the upper-level low.
IOP 14: Kualoa Ranch cumulus clouds. After the cold front had passed through on 10 November, dry cool weather set in on the islands. The forecast for 12 November was for light trade winds with little mois-ture. Since it was the last day of HERO, one last mission to Kualoa Ranch was conducted in hopes of catching some morning trade wind showers. High-resolution
FIG. 7. RHI radar images on 10 Nov at (left) 0520:25 and (right) 0539:41 UTC. (a),(e) Radar reflectivity (dBZ), (b),(f) correlation coefficient ρHV, (c),(g) differential reflectivity ZDR (dB), and (d),(h) specific differential phase KDP (° km–1). Tick marks denote 2 km in the vertical and 10 km in the horizontal. The radar is at the bottom-left corner of each panel, and the RHIs are at 240° relative to the truck (108° heading).
2177DECEMBER 2015AMERICAN METEOROLOGICAL SOCIETY |
structure, with columns of enhanced dBZ (Fig. 9b) and ZDR (Fig. 9c). The highest reflectivity near 8 dBZ was found near cloud top, suggesting condensational drop-let growth in the weak updraft. Conversely, the highest ZDR was found near cloud base, suggesting evaporation of falling droplets and a resulting shift toward a larger median drop size (Kumjian and Ryzhkov 2010).
Low-level negative Doppler velocity (Fig. 9d) in-dicates light trade wind flow toward the radar at low levels, with distinct turrets of radially outward flow aloft associated with updrafts at the growing cloud top. The spectrum width (Fig. 9e) shows near-zero velocity variance at low levels topped with increasing variance aloft exceeding 3 m s–1. The dBZ, velocity, and spectrum width are consistent with the interpre-tation of small updrafts associated with small-scale turbulence and droplet growth at the top of the cloud. This high level of detail of a nonprecipitating system could only be observed by the DOW, as the closest WSR-88D radar beam was too broad and high to adequately observe the cloud.
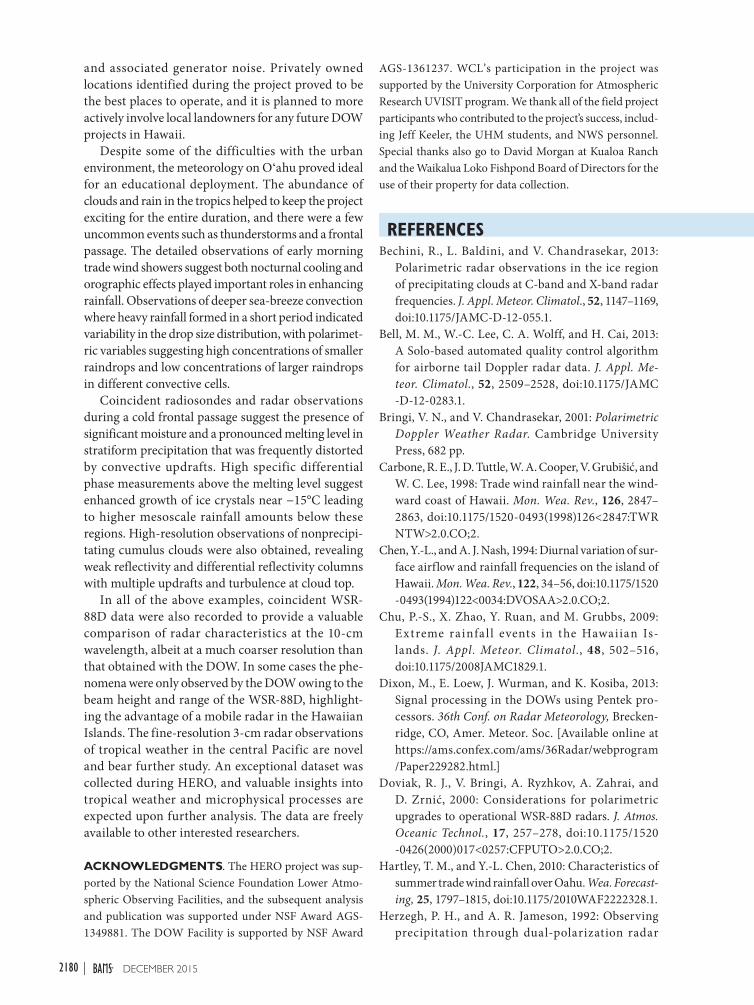
SUMMARY AND LESSONS LEARNED. The HERO project was extremely successful. The deep integration with MET 628 “Radar Meteorology” con-tributed to both a successful course and educational deployment by giving students a true hands-on learn-ing experience. The arrival of the DOW in the middle of the semester was an ideal time for maximizing both the predeployment learning and postdeployment analysis. Incorporating weather balloon launches into the project and having dedicated forecast teams helped to involve undergraduate students and NWS forecasters directly so that they were active partici-pants in the project. The radiosondes also provided valuable scientific information that helped improve the educational value of the radar data collection. HERO was the first field project for the majority of the students, and the feedback from all students has been very positive. A group photograph of most of the ~50 HERO participants is shown in Fig. 10.
The close collaboration with the NWS proved to be an important part of the project that contributed greatly to student forecasting skill and experience and also provided data for operational weather forecasts and warnings. The willingness of the NWS forecasters to volunteer their time and expertise was greatly appreciated. Collaborative student and NWS radiosonde launches and forecast discussions are continuing at UHM as a result of the HERO project.
Capitalizing on the exceptional organization of the SOEST open house helped the DOW showcase be a very large public outreach event reaching over
FIG. 8. Soundings launched on 10 Nov at (a) 0955 and (b) 1801 UTC. The ordinate is log of pressure (hPa) and the abscissa is skewed temperature (°C). The red line denotes air temperature, the blue line denotes dewpoint temperature, and wind barbs denote wind direction and speed in knots.
observations of short-lived small cumulus clouds were obtained. Figure 9a shows a photograph of one such cloud at sunrise just offshore of Oʻahu, approximately 4 km from the radar. An RHI through the cloud with 15-m radar gate spacing reveals a cauliflower-like
2178 DECEMBER 2015|
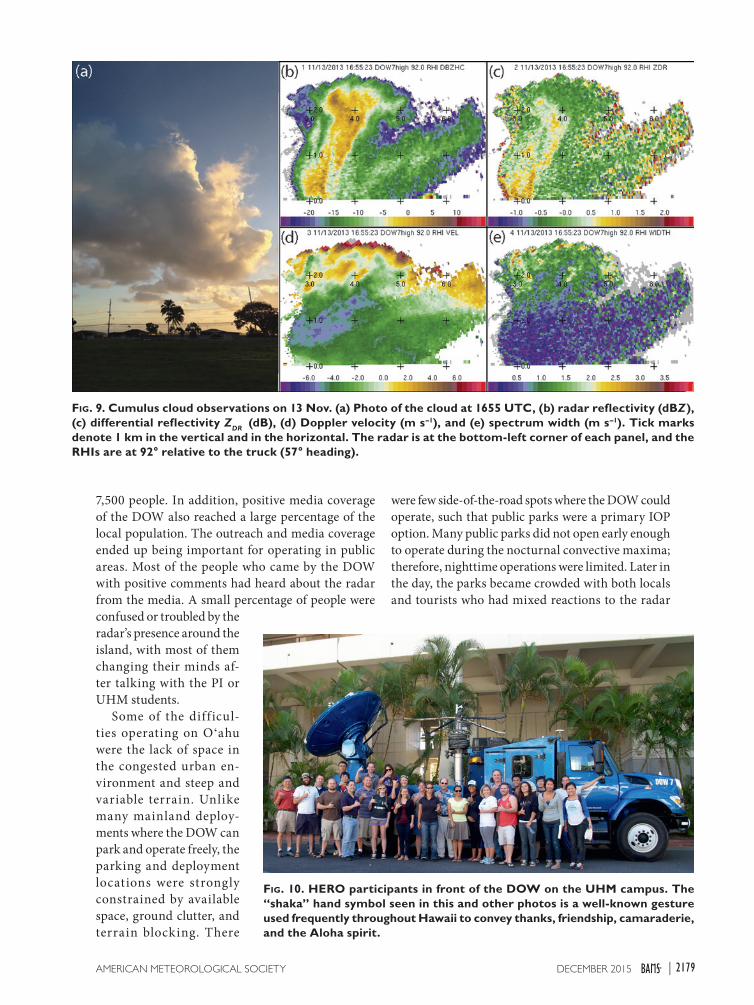
FIG. 9. Cumulus cloud observations on 13 Nov. (a) Photo of the cloud at 1655 UTC, (b) radar reflectivity (dBZ), (c) differential reflectivity ZDR (dB), (d) Doppler velocity (m s–1), and (e) spectrum width (m s–1). Tick marks denote 1 km in the vertical and in the horizontal. The radar is at the bottom-left corner of each panel, and the RHIs are at 92° relative to the truck (57° heading).
7,500 people. In addition, positive media coverage of the DOW also reached a large percentage of the local population. The outreach and media coverage ended up being important for operating in public areas. Most of the people who came by the DOW with positive comments had heard about the radar from the media. A small percentage of people were confused or troubled by the radar’s presence around the island, with most of them changing their minds af-ter talking with the PI or UHM students.
Some of the diff icul-ties operating on Oʻahu were the lack of space in the congested urban en-vironment and steep and variable terrain. Unlike many mainland deploy-ments where the DOW can park and operate freely, the parking and deployment locations were strongly constrained by available space, ground clutter, and terrain blocking. There
were few side-of-the-road spots where the DOW could operate, such that public parks were a primary IOP option. Many public parks did not open early enough to operate during the nocturnal convective maxima; therefore, nighttime operations were limited. Later in the day, the parks became crowded with both locals and tourists who had mixed reactions to the radar
FIG. 10. HERO participants in front of the DOW on the UHM campus. The “shaka” hand symbol seen in this and other photos is a well-known gesture used frequently throughout Hawaii to convey thanks, friendship, camaraderie, and the Aloha spirit.
2179DECEMBER 2015AMERICAN METEOROLOGICAL SOCIETY |
and associated generator noise. Privately owned locations identified during the project proved to be the best places to operate, and it is planned to more actively involve local landowners for any future DOW projects in Hawaii.
Despite some of the difficulties with the urban environment, the meteorology on Oʻahu proved ideal for an educational deployment. The abundance of clouds and rain in the tropics helped to keep the project exciting for the entire duration, and there were a few uncommon events such as thunderstorms and a frontal passage. The detailed observations of early morning trade wind showers suggest both nocturnal cooling and orographic effects played important roles in enhancing rainfall. Observations of deeper sea-breeze convection where heavy rainfall formed in a short period indicated variability in the drop size distribution, with polarimet-ric variables suggesting high concentrations of smaller raindrops and low concentrations of larger raindrops in different convective cells.
Coincident radiosondes and radar observations during a cold frontal passage suggest the presence of significant moisture and a pronounced melting level in stratiform precipitation that was frequently distorted by convective updrafts. High specific differential phase measurements above the melting level suggest enhanced growth of ice crystals near −15°C leading to higher mesoscale rainfall amounts below these regions. High-resolution observations of nonprecipi-tating cumulus clouds were also obtained, revealing weak reflectivity and differential reflectivity columns with multiple updrafts and turbulence at cloud top.
In all of the above examples, coincident WSR-88D data were also recorded to provide a valuable comparison of radar characteristics at the 10-cm wavelength, albeit at a much coarser resolution than that obtained with the DOW. In some cases the phe-nomena were only observed by the DOW owing to the beam height and range of the WSR-88D, highlight-ing the advantage of a mobile radar in the Hawaiian Islands. The fine-resolution 3-cm radar observations of tropical weather in the central Pacific are novel and bear further study. An exceptional dataset was collected during HERO, and valuable insights into tropical weather and microphysical processes are expected upon further analysis. The data are freely available to other interested researchers.
ACKNOWLEDGMENTS. The HERO project was sup-ported by the National Science Foundation Lower Atmo-spheric Observing Facilities, and the subsequent analysis and publication was supported under NSF Award AGS-1349881. The DOW Facility is supported by NSF Award
AGS-1361237. WCL’s participation in the project was supported by the University Corporation for Atmospheric Research UVISIT program. We thank all of the field project participants who contributed to the project’s success, includ-ing Jeff Keeler, the UHM students, and NWS personnel. Special thanks also go to David Morgan at Kualoa Ranch and the Waikalua Loko Fishpond Board of Directors for the use of their property for data collection.
REFERENCESBechini, R., L. Baldini, and V. Chandrasekar, 2013:
Polarimetric radar observations in the ice region of precipitating clouds at C-band and X-band radar frequencies. J. Appl. Meteor. Climatol., 52, 1147–1169, doi:10.1175/JAMC-D-12-055.1.
Bell, M. M., W.-C. Lee, C. A. Wolff, and H. Cai, 2013: A Solo-based automated quality control algorithm for airborne tail Doppler radar data. J. Appl. Me-teor. Climatol., 52, 2509–2528, doi:10.1175/JAMC -D-12-0283.1.
Bringi, V. N., and V. Chandrasekar, 2001: Polarimetric Doppler Weather Radar. Cambridge University Press, 682 pp.
Carbone, R. E., J. D. Tuttle, W. A. Cooper, V. Grubišić, and W. C. Lee, 1998: Trade wind rainfall near the wind-ward coast of Hawaii. Mon. Wea. Rev., 126, 2847–2863, doi:10.1175/1520-0493(1998)126<2847:TWRNTW>2.0.CO;2.
Chen, Y.-L., and A. J. Nash, 1994: Diurnal variation of sur-face airflow and rainfall frequencies on the island of Hawaii. Mon. Wea. Rev., 122, 34–56, doi:10.1175/1520 -0493(1994)122<0034:DVOSAA>2.0.CO;2.
Chu, P.-S., X. Zhao, Y. Ruan, and M. Grubbs, 2009: Extreme rainfa l l events in the Hawaiian Is-lands. J. Appl. Meteor. Climatol., 48, 502–516, doi:10.1175/2008JAMC1829.1.
Dixon, M., E. Loew, J. Wurman, and K. Kosiba, 2013: Signal processing in the DOWs using Pentek pro-cessors. 36th Conf. on Radar Meteorology, Brecken-ridge, CO, Amer. Meteor. Soc. [Available online at https://ams.confex.com/ams/36Radar/webprogram /Paper229282.html.]
Doviak, R. J., V. Bringi, A. Ryzhkov, A. Zahrai, and D. Zrnić, 2000: Considerations for polarimetric upgrades to operational WSR-88D radars. J. Atmos. Oceanic Technol., 17, 257–278, doi:10.1175/1520 -0426(2000)017<0257:CFPUTO>2.0.CO;2.
Hartley, T. M., and Y.-L. Chen, 2010: Characteristics of summer trade wind rainfall over Oahu. Wea. Forecast-ing, 25, 1797–1815, doi:10.1175/2010WAF2222328.1.
Herzegh, P. H., and A. R. Jameson, 1992: Observing precipitation through dual-polarization radar
2180 DECEMBER 2015|
measurements. Bull. Amer. Meteor. Soc., 73, 1365–1374, doi:10.1175/1520-0477(1992)073<1365:OPTDPR>2.0.CO;2.
Kennedy, P. C., and S. A. Rutledge, 2011: S-band dual-polarization radar observations of winter storms. J. Appl. Meteor. Climatol., 50, 844–858, doi:10.1175/2010JAMC2558.1.
Kosiba, K. A., and J. Wurman, 2014: Finescale dual-Doppler analysis of hurricane boundary layer structures in Hurricane Frances (2004) at landfall. Mon. Wea. Rev., 142, 1874–1891, doi:10.1175/MWR -D-13-00178.1.
Kumjian, M. R., and A. V. Ryzhkov, 2010: The impact of evaporation on polarimetric characteristics of rain: Theoretical model and practical implica-tions. J. Appl. Meteor. Climatol., 49, 1247–1267, doi:10.1175/2010JAMC2243.1.
—, A. P. Khain, N. Benmoshe, E. Ilotoviz, A. V. Ryzhkov, and V. T. J. Phillips, 2014: The anatomy and physics of ZDR columns: Investigating a polarimetric radar signature with a spectral bin microphysical model. J. Appl. Meteor. Climatol., 53, 1820–1843, doi:10.1175/JAMC-D-13-0354.1.
Lemon, L. R., 1998: The radar “three-body scat-ter spike”: An operational large-hail signature. Wea. Forecasting, 13, 327–340, doi:10.1175/1520 -0434(1998)013<0327:TRTBSS>2.0.CO;2.
Murphy, M. J., Jr., and S. Businger, 2011: Orographic influences on an Oahu flood. Mon. Wea. Rev., 139, 2198–2217, doi:10.1175/2010MWR3357.1.
National Oceanic and Atmospheric Administration, 1985: Alabama-New Mexico. Vol. 1, Narrative Sum-maries, Tables and Maps for Each State with Overview of State Climatologist Programs, 3d ed. Gale Research Company, 758 pp. [Available online at www.wrcc.dri.edu/climate-narratives.]
Richardson, Y., P. Markowski, J. Verlinde, and J. Wurman, 2008: Field experience: Integrating classroom learn-ing and research: The Pennsylvania Area Mobile Radar Experiment (PAMREX). Bull. Amer. Meteor. Soc., 89, 1097–1101, doi:10.1175/2007BAMS2567.1.
Schroeder, T. A., 1977: Meteorological analysis of an Oahu flood. Mon. Wea. Rev., 105, 458–468, doi:10.1175/1520 -0493(1977)105<0458:MAOAOF>2.0.CO;2.
Schultz, D. M., and Coauthors, 2002: Understand-ing Utah winter storms: The Intermountain Pre-cipitation Experiment. Bull. Amer. Meteor. Soc., 83, 189–210, doi:10.1175/1520-0477(2002)083<0189:UUWSTI>2.3.CO;2.
Semonin, R. G., E. A. Mueller, G. E. Stout, and D. W. Staggs, 1967: Radar analysis of Project Warm Rain, Hilo, Hawaii—Summer 1965. Illinois State Water Survey Contract Rep. CR-74, 34 pp. [Available online at http://hdl.handle.net/2142/55495.]
Toth, M., E. Jones, D. Pittman, and D. Solomon, 2011: DOW radar observations of wind farms. Bull. Amer. Meteor. Soc., 92, 987–995, doi:10.1175/2011BAMS3068.1.
Van Nguyen, H., Y.-L. Chen, and F. Fujioka, 2010: Numerical simulations of island effects on air-f low and weather during the summer over the island of Oahu. Mon. Wea. Rev., 138, 2253–2280, doi:10.1175/2009MWR3203.1.
Wang, Y., and V. Chandrasekar, 2010: Quantitative precipitation estimation in the CASA X-band dual-polarization radar network. J. Atmos. Oceanic Tech-nol., 27, 1665–1676, doi:10.1175/2010JTECHA1419.1.
Wilson, J. W., and D. Reum, 1988: The flare echo: Reflectivity and velocity signature. J. Atmos. Oceanic Technol., 5, 197–205, doi:10.1175/1520 -0426(1988)005<0197:TFERAV>2.0.CO;2.
Wurman, J., 2001: The DOW mobile multiple Doppler network. 30th Int. Conf. on Radar Meteorology, Mu-nich, Germany, Amer. Meteor. Soc., P3.3. [Available online at https://ams.confex.com/ams/30radar/techprogram/paper_21572.htm.]
—, J. Straka, E. Rasmussen, M. Randall, and A. Zahrai, 1997: Design and deployment of a portable, pencil-beam, pulsed, 3-cm Doppler radar. J. Atmos. Oce-anic Technol., 14, 1502–1512, doi:10.1175/1520 -0426(1997)014<1502:DADOAP>2.0.CO;2.
—, D. Dowell, Y. Richardson, P. Markowski, E. Rasmus-sen, D. Burgess, L. Wicker, and H. B. Bluestein, 2012: The second Verification of the Origins of Rotation in Tornadoes Experiment: VORTEX2. Bull. Amer. Meteor. Soc., 93, 1147–1170, doi:10.1175/BAMS-D-11-00010.1.
Zrnić, D. S., 1987: Three-body scattering produces precipitation signature of special diagnostic value. Radio Sci., 22, 76–86, doi:10.1029/RS022i001p00076.
2181DECEMBER 2015AMERICAN METEOROLOGICAL SOCIETY |

*Cost for delivery outside of the U.S. is $40.95. Weatherwise is available to AMS Members through a cooperative agreement with Taylor & Francis Group LLC, the publishers of Weatherwise.
Want your own?Then order a personal subscription at the same great price.
Written for a general audience, Weatherwise offers a colorful and nontechnical look at recent discoveries in meteorology and climatology. Check out the latest table of contents at www.weatherwise.org.
Looking for the perfect present for the weather enthusiast in your life? Want to make a valuable contribution to your local library or community college? Send a subscription to Weatherwise magazine (calendar year) for just $24.95*—That’s nearly 50% off the list price!
Contact Member Services by e-mail at [email protected] or by phone at617-227-2425 to place all of your Weatherwise orders today!
Could Atmospheric Conditions Have Sunk the Titanic?
MARCH / APRIL 2013 WWW.WEATHERWISE.ORG
HURRICANE
SANDY
GIVE A GREAT GIFT AT A GREAT PRICE
AMS MEMBERS