Embed Size (px)
Citation preview

Surface Science 240 (1990) 85-100
North-Holland
85
The adsorption and decomposition of methanol on the ~~~00~ surface
John E. Parmeter, Xudong Jiang and D. Wayne Goodman * Department of Chemistry, Texas A&M University, College Station, TX 77843-3255, USA
Received 19 June 1990; accepted for publication 30 July 1990
The adsorption and decomposition of methanol on the Rh(100) surface have been studied using high-resolution electron energy
loss spectroscopy and thermal desorption mass spectrometry. Below 200 K, methanol is molecularly adsorbed and bonds to the
surface via the oxygen atom. At 200-220 K, a saturated methanol layer undergoes two competing reactions: desorption and OH
bond cleavage to form an O-bonded methoxy species. The methoxy species is stable to appro~mately 250 K. Between 250 and 320 K,
a fraction of the methoxy species decomposes to form coadsorbed CO and hydrogen adatoms white the remainder recombines with
hydrogen adatoms to desorb as molecular methanol. The hydrogen adatoms remaining on the surface desorb as H, between 270 and
400 K, and the CO desorbs between 450 and 550 K. Following a saturation exposure, approximately 0.2 monolayers of methanol
decompose to eventually yield CO and Ha as desorption products. These results are compared to the chemistry of methanol on other
metal surfaces.
1. Introduction
The interaction of methanol with metal surfaces is of both fundamental and practical interest for a variety of reasons. For example, the synthesis of methanol from CO and H, over transition metal catalysts is an important industrial reaction [l]. Thus, studies of methanol decomposition on well- defined metal surfaces under ultrahigh vacuum (UHV) conditions can serve to isolate and char- acterize adsorbed CH,O species that may be of importance in this reaction. From the point of view of the UHV surface scientist, methanol serves as a prototypical example of a weak donor ligand (Lewis base), adsorbing on metal surfaces at suffi- ciently low temperatures via one or both of the oxygen atom electron lone pairs. However, in con- trast to slightly simpler weak donor ligands such as water and ammonia, the presence of the methyl group provides a connection to the surface chem- istry of hydrocarbons. Methanol is the simplest molecule that contains C-O, C-H, and O-H
* To whom correspondence should be addressed.
bonds, and is thus ideally suited for studies of the relative reactivities of these types of bonds in an adsorbed species.
For all of these reasons, methanol adsorption and d~omposition have been studied using a wide variety of experimental techniques on many differ- ent single-crystalline transition metal surfaces. These include various low Miller index planes of nickel [2-51, platinum [6], palladium [7,8], ruthenium [9,10], copper [D-14], rhodium [15], tungsten 1161, and silver 1171. In this paper, we report the results of a study of the chemistry of methanol on the Rh(100) surface, in which high resolution electron energy loss spectroscopy (HREELS) and thermal desorption mass spec- trometry (TDMS) were employed as the primary experimental techniques. This study was under- taken not only to investigate the interaction of methanol with a rhodium surface, but also to provide background for a forthcoming study of the chemistry of methanol on copper overlayers on Rh(100) [B]. The latter issue is currently being pursued as part of an on-going, systematic study of the chemical properties of metal overlayers on metal surfaces [19] and is of particular interest
0039-6028/90/$03.50 0 1990 - Elsevier Science Publishers B.V. (North-Holland)

86 J.E. Parmeter et al. / Adsorption and decomposition of methanol on Rh(lO0)
given the importance of copper catalysts in both methanol synthesis and the conversion of methanol to formaldehyde [20].
Of particular relevance to this paper are previ- ous UHV studies of methanol adsorption and decomposition on metal surfaces in which the adsorbed intermediates present under various con- ditions were characterized using HREELS. To date, such studies have been conducted on Ni(ll1) [2], Pt(ll1) [6], Cu(100) [ll], Ru(001) [9], Pd(lOO)
[7], and Pd(ll0) [8]. These investigations have revealed many similarities in methanol chemistry on various surfaces, as well as a number of im- portant differences. At liquid nitrogen tempera- tures, methanol adsorption is generally molecular, although dissociative adsorption to form a chem- isorbed methoxy species and hydrogen adatoms occurs on Ru(001) [9] and to some degree on Pd(lOO) [7]. Annealing the surfaces to higher tem- peratures results, in all cases, in methoxy forma- tion, usually below 200 K. In some cases, desorp- tion of molecular methanol also occurs as a com- peting reaction. With further heating, the methoxy species decomposes to adsorbed carbon monoxide and hydrogen. This decomposition occurs near room temperature on most of the surfaces and is often accompanied by a competing reaction, namely the recombinative desorption of methanol from adsorbed methoxy and hydrogen. Interest- ingly, CH,O and CHO species, which must occur as intermediates in the decomposition of methoxy to CO, have proven very difficult to isolate in these studies; only on Pd(ll0) has a CHO species formed from methanol decomposition been re- ported [8]. On Ni(ll1) [2] and Ru(OO1) [9], a small amount of CO bond cleavage also occurs during methoxy decomposition.
2. Experimental
2.1. Thermal desorption mass spectrometry (TDMS)
The thermal desorption experiments in this study were performed in a UHV chamber that has been described in detail previously [21]. It is equipped with a double pass cylindrical mirror analyzer with an integral electron gun for Auger
electron spectroscopy, LEED optics for low en- ergy electron diffraction observation, and a quadrupole mass spectrometer for thermal desorp- tion measurements. This chamber is pumped by a titanium sublimation pump and an ion pump and the base pressure is in the low lo- ” Torr range.
The high purity Rh(100) single crystal was polished using a series of emery papers and di- amond paste until a mirror finish was obtained.
High purity tantalum wires (0.020” diameter) con- nected to feedthroughs immersed in a liquid nitrogen reservoir were spot-welded to the periph- ery of the crystal allowing resistive heating and conductive cooling. A pair of tungsten-5% rhenium/tungsten-26Srhenium thermocouple wires spot-welded to the edge of the crystal was used to monitor the temperature of the crystal.
Spectroscopic grade methanol with a minimum purity of 99.9% was used in this study. Many
freeze-pump-thaw cycles were performed prior to introduction of the methanol into the vacuum chamber. Research grade oxygen, hydrogen, and carbon monoxide, supplied by Matheson Gas Products, Inc., were used as received.
The crystal cleaning procedure consisted of oxidation in 1 X lo-’ Torr oxygen at 1150 K for 10 rnin and annealing at this temperature for 5 min. A capillary doser in front of the crystal was
used to direct the oxygen and various adsorbates to the crystal surface so that the local pressure near the crystal during oxidation and adsorption was much higher than the background pressure. The amount of methanol dosed on the sample was determined by comparing the 272 eV C(KLL) Auger line with a calibration curve which was
measured in a separate experiment by backfilling the chamber with methanol. All exposures quoted are without ionization gauge correction and are given in units of Langmuir (1 L = 1 langmuir = 10m6 Torr . s).
A linear heating rate of 10 K/s was used in the thermal desorption experiments.
2.2. High resolution electron energy loss spectroscopy (HREELS)
The HREELS experiments were performed in a two-level UHV system. The upper level contained
J.E. Parmeter et al. / Adsorption and decomposition of methanol on Rh(lOO) 81
an Auger electron spectrometer, LEED optics, a resolution. The primary energy of the electron
quadrupole mass spectrometer, a sputtering gun, beam was typically 2 eV. The spectra presented
and an ionization gauge. The lower level housed here were obtained with electron collection in the
the HREEL spectrometer. The system was pumped specular direction, which was approximately 60”
using a 220 c!’ s-l turbomolecular pump so that with respect to the Rh(100) surface normal. The
the base pressure was typically in the low lo-” scan rate for all HREEL spectra except those
Torr range. presented in fig. 8 was approximately 7 cm-’ s-l.
The HREEL spectrometer used in these studies was an LK-2000, purchased from Larry Kesmodel Technologies. The resolution (full-width at half maximum of the elastically scattered beam) of the
spectra presented and discussed in this paper varies rather widely, from approximately 60-90 cm-‘. While a resolution of 60 cm-’ at an elastic peak
count rate of 200000 cps could typically be ob- tained from the clean Rh(100) surface, adsorption of methanol resulted in a decreased surface reflec- tivity which in many cases necessitated the collec- tion of HREEL spectra with less than optimal
Crystal cooling, heating, and cleaning were accomplished in manners similar to those de- scribed in the TDMS section. In the HREELS
chamber, exposures were performed via backfill- ing the UHV chamber rather than via dosing. Dosing temperatures varied from 125-195 K. All spectra were obtained after flashing briefly to an indicated temperature and retooling; thus only irreuersible changes in the HREEL spectra are observed. In addition to experiments conducted
with CH,OH as discussed in the TDMS section, a few HREELS experiments were performed with CD,OD (Aldrich, 99.8 at% D). Exposures of CD,OD were never entirely free of H-contamina- tion and the spectra obtained added relatively
little to what could be deduced from the CH,OH spectra. These CD,OD spectra are not shown, but some vibrational frequencies for deuterated species are listed in the tables that follow.
a, 9j /
213 K I
.76 L
.25 L
100 150 200 250 300 350
TEMPERATURE (K)
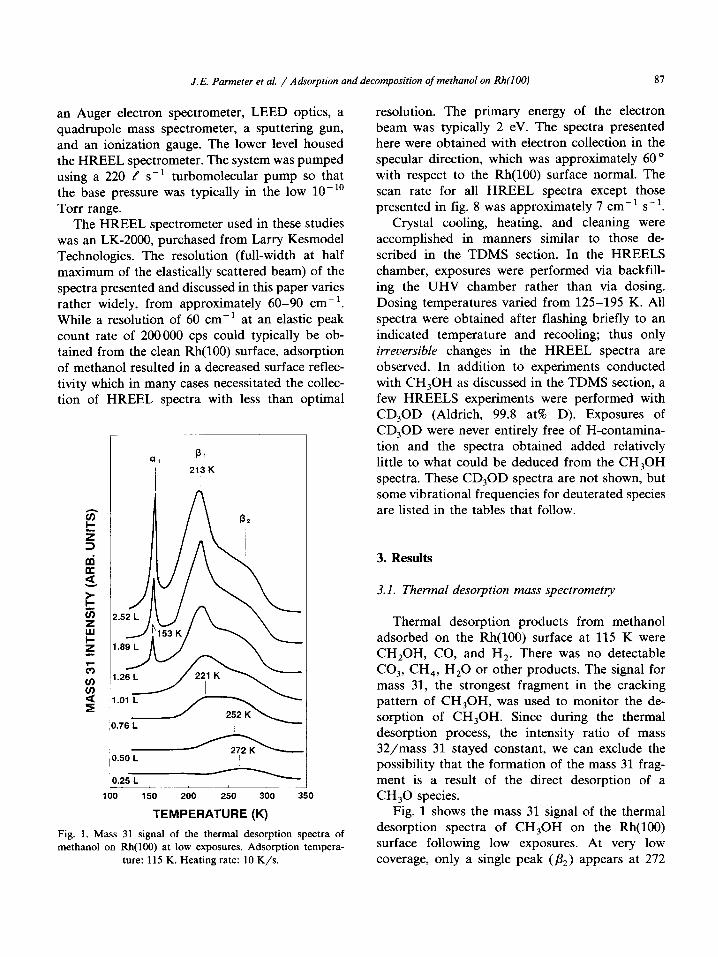
Fig. 1. Mass 31 signal of the thermal desorption spectra of methanol on Rh(100) at low exposures. Adsorption tempera-
ture: 115 K. Heating rate: 10 K/s.
3. Results
3.1. Thermal desorption mass spectrometry
Thermal desorption products from methanol adsorbed on the Rh(100) surface at 115 K were CH,OH, CO, and H,. There was no detectable CO,, CH,, Hz0 or other products. The signal for mass 31, the strongest fragment in the cracking pattern of CH,OH, was used to monitor the de- sorption of CH,OH. Since during the thermal desorption process, the intensity ratio of mass 32/mass 31 stayed constant, we can exclude the possibility that the formation of the mass 31 frag- ment is a result of the direct desorption of a CH,O species.
Fig. 1 shows the mass 31 signal of the thermal desorption spectra of CH,OH on the Rh(100) surface following low exposures. At very low coverage, only a single peak (&) appears at 272
88 J. E. Parmeter et al. / Adsorption and decomposition of methanol on Rh(100)
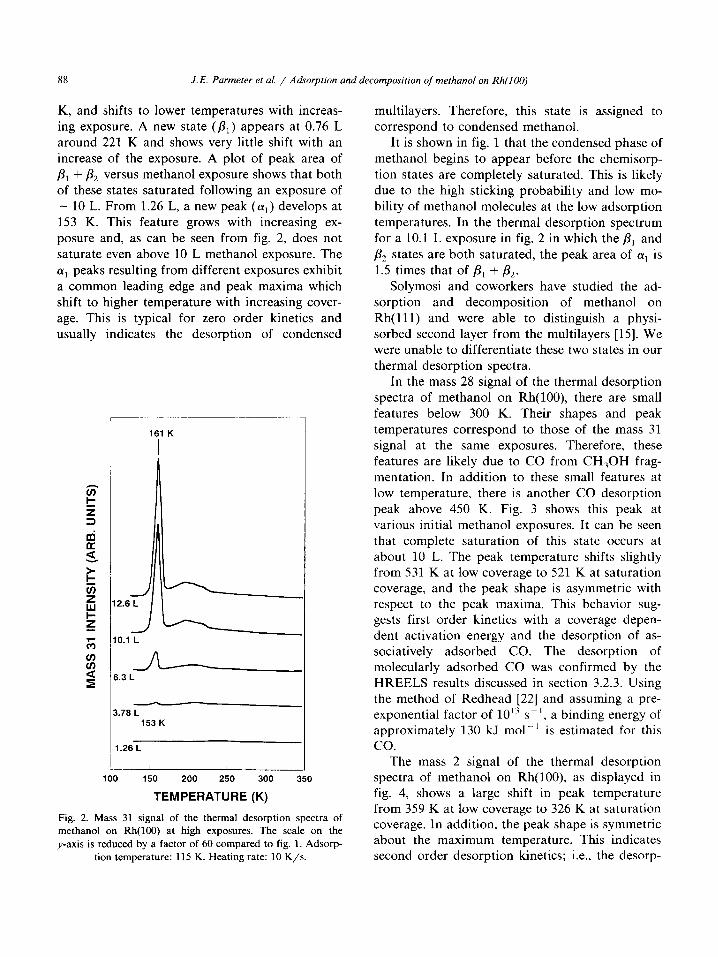
K, and shifts to lower temperatures with increas- ing exposure. A new state (p,) appears at 0.76 L around 221 K and shows very little shift with an increase of the exposure. A plot of peak area of /?, + & versus methanol exposure shows that both of these states saturated following an exposure of - 10 L. From 1.26 L, a new peak ((1~~) develops at 153 K. This feature grows with increasing ex- posure and, as can be seen from fig. 2, does not saturate even above 10 L methanol exposure. The
cy, peaks resulting from different exposures exhibit a common leading edge and peak maxima which shift to higher temperature with increasing cover- age. This is typical for zero order kinetics and usually indicates the desorption of condensed
161 K
I
6.3 L
- 3.78 L
153 K I
1.26 L
I I
100 150 200 250 300 350
TEMPERATURE (K)
Fig. 2. Mass 31 signal of the thermal desorption spectra of methanol on Rb(100) at high exposures. The scale on the
y-axis is reduced by a factor of 60 compared to fig. 1. Adsorp-
tion temperature: 115 K. Heating rate: 10 K/s.
multilayers. Therefore, this state is assigned to correspond to condensed methanol.
It is shown in fig. 1 that the condensed phase of methanol begins to appear before the chemisorp- tion states are completely saturated. This is likely due to the high sticking probability and low mo- bility of methanol molecules at the low adsorption temperatures. In the thermal desorption spectrum for a 10.1 L exposure in fig. 2 in which the j3i and
& states are both saturated, the peak area of LY, is 1.5 times that of pi + &.
Solymosi and coworkers have studied the ad- sorption and decomposition of methanol on Rh(ll1) and were able to distinguish a physi- sorbed second layer from the multilayers [15]. We were unable to differentiate these two states in our thermal desorption spectra.
In the mass 28 signal of the thermal desorption spectra of methanol on Rh(lOO), there are small features below 300 K. Their shapes and peak temperatures correspond to those of the mass 31 signal at the same exposures. Therefore, these features are likely due to CO from CH,OH frag- mentation. In addition to these small features at low temperature, there is another CO desorption peak above 450 K. Fig. 3 shows this peak at various initial methanol exposures. It can be seen that complete saturation of this state occurs at about 10 L. The peak temperature shifts slightly from 531 K at low coverage to 521 K at saturation coverage, and the peak shape is asymmetric with respect to the peak maxima. This behavior sug- gests first order kinetics with a coverage depen- dent activation energy and the desorption of as- sociatively adsorbed CO. The desorption of molecularly adsorbed CO was confirmed by the HREELS results discussed in section 3.2.3. Using the method of Redhead [22] and assuming a pre- exponential factor of 1013 so ‘. a binding energy of approximately 130 kJ mall’ is estimated for this co.
The mass 2 signal of the thermal desorption spectra of methanol on Rh(lOO), as displayed in fig. 4, shows a large shift in peak temperature from 359 K at low coverage to 326 K at saturation coverage. In addition, the peak shape is symmetric about the maximum temperature. This indicates second order desorption kinetics; i.e., the desorp-

J.E. Parmeter et al. / AdPctrption and decomposition ojrnel~an~l on Rh(fOO) 89
tion of H, resulted from the recombination of adsorbed hydrogen adatoms. This state is also completely saturated at about 10 L.
Comparing the CO and H, desorption spectra at saturation coverage in this study with those obtained following the separate adsorption of CO and H, at saturation coverage on a clean Rh(lO0) surface gives peak area ratios of 0.37 for CO, and 0.66 for H,. According to White et al., on the clean Rh(100) surface, saturation coverage for CO is 0.60 ML [23]. Therefore, the CO desorption peak area ratio reveals that approximately 0.22 ML, i.e., 0.31 X 10¹⁵ methanol molecules/cm*, de- sorbs from the saturated layer in the form of CO. Similar manipulation of the H, desorption data assuming a hydrogen adatom saturation coverage of 1.0 [23] gives fairly consistent results; i.e., the amount of decomposing CH,OH is 0.17 ML. Averaging both estimates leads to the conclusion
400 450 500 550 600
TEMPERATURE (K)
Fig. 3. Mass 28 signal of the thermal desorption spectra of
methanoI on Rh(100). Adsorption temperature: 115 K. Heat-
ing rate: 10 K/s.
200 250 300 350 400 450
TEMPERATURE (K)
Fig. 4. Mass 2 signal of the thermal desorption spectra of
methanol on Rh(100). Adsorption temperature: 115 K. Heat- ing rate: 10 K/s.
that approximately 0.2 ML of methanol decompo- ses following a saturation exposure at low temper- ature. The CO desorption peak temperatures in this study agree very well with those of thermal desorption spectra of CO adsorbed alone on a clean ~(1~) surface at equivalent coverages 1231. For H,, the peak maxima in this study are a few degrees lower than those from separate H, ther- mal desorption experiments at equivalent cover- ages. This is expected, since there are repulsive interactions between H atoms and coadsorbed CO molecules on this surface and thus the H, peak desorption temperature can be downshifted by as much as 50 K (depending on CO coverage) when CO is coadsorbed [24].
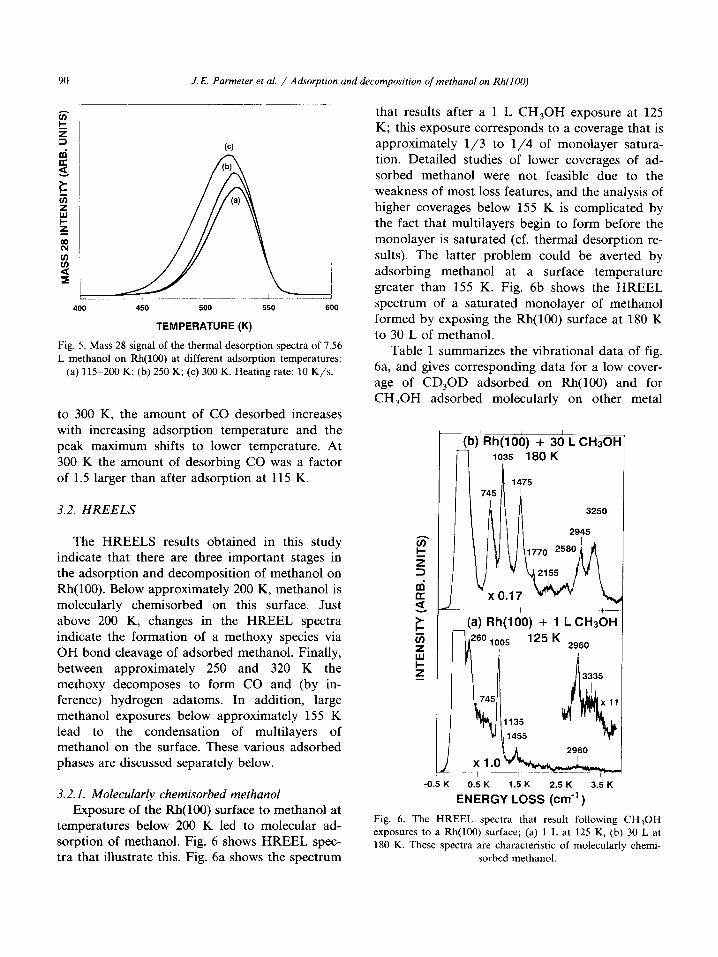
Fig. 5 shows the dependence of CO desorption on the adsorption temperature of methanol. It is shown that there is no change of the CO desorp- tion spectra when methanol is initially adsorbed onto Rh(lOO) between 115 and 200 K. From 200
90 J. E. Parmeier et al. / Adsorption and decomposition of methanol on Rh(lOO)
400 450 500 550 600
TEMPERATURE (K)
Fig. 5. Mass 28 signal of the thermal desorption spectra of 7.56
L methanol on Rh(100) at different adsorption temperatures:
(a) 115-200 K; (b) 250 K; (c) 300 K. Heating rate: 10 K/s.
to 300 K, the amount of CO desorbed increases with increasing adsorption temperature and the peak maximum shifts to lower temperature. At 300 K the amount of desorbing CO was a factor of 1.5 larger than after adsorption at 115 K.
3.2. HREELS
The HREELS results obtained in this study indicate that there are three important stages in the adsorption and decomposition of methanol on Rh(100). Below approximately 200 K, methanol is molecularly chemisorbed on this surface. Just above 200 K, changes in the HREEL spectra indicate the formation of a methoxy species via OH bond cleavage of adsorbed methanol. Finally, between approximately 250 and 320 K the methoxy decomposes to form CO and (by in- ference) hydrogen adatoms. In addition, large methanol exposures below approximately 155 K lead to the condensation of multilayers of methanol on the surface. These various adsorbed phases are discussed separately below.
3.2. I. Molecularly chemisorbed methanol Exposure of the Rh(100) surface to methanol at
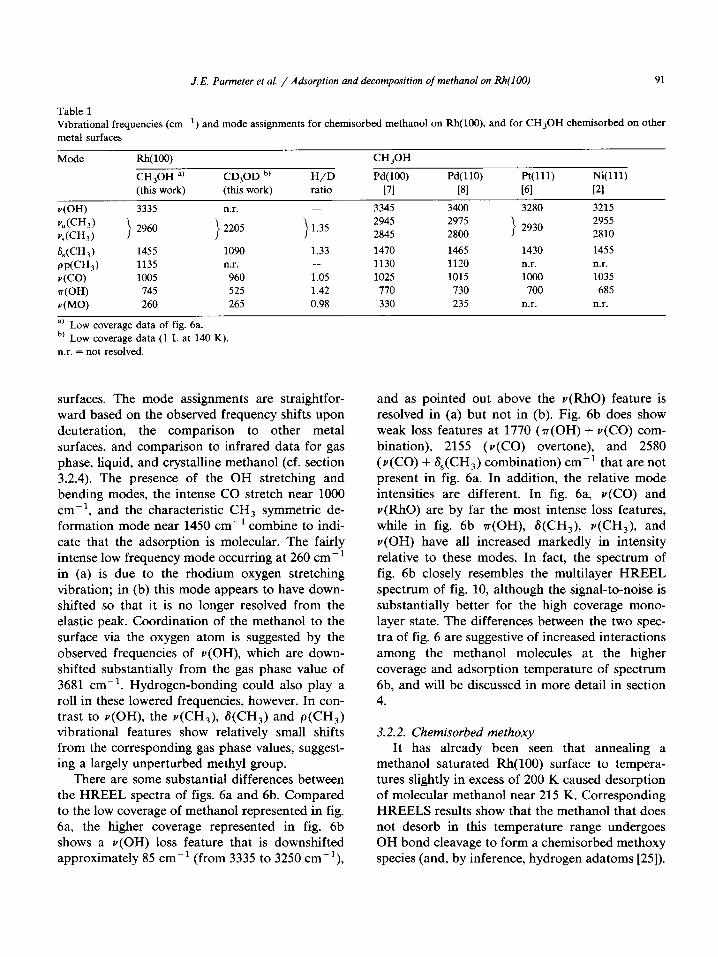
temperatures below 200 K led to molecular ad- sorption of methanol. Fig. 6 shows HREEL spec- tra that illustrate this. Fig. 6a shows the spectrum
that results after a 1 L CH,OH exposure at 125 K; this exposure corresponds to a coverage that is approximately l/3 to l/4 of monolayer satura- tion. Detailed studies of lower coverages of ad- sorbed methanol were not feasible due to the weakness of most loss features, and the analysis of higher coverages below 155 K is complicated by the fact that multilayers begin to form before the monolayer is saturated (cf. thermal desorption re-
sults). The latter problem could be averted by adsorbing methanol at a surface temperature greater than 155 K. Fig. 6b shows the HREEL spectrum of a saturated monolayer of methanol formed by exposing the Rh(100) surface at 180 K to 30 L of methanol.
Table 1 summarizes the vibrational data of fig. 6a, and gives corresponding data for a low cover- age of CD,OD adsorbed on Rh(100) and for CH,OH adsorbed molecularly on other metal
t 1 1
(b) Rh(lOO) + 30 LM n 1035 180 K
(a) Rh(100) + 1 L CH30H
-0.5 K 0.5 K 1.5 K 2.5 K 3.5 K
ENERGY LOSS (cm-‘)
Fig. 6. The HREEL spectra that result following CHsOH exposures to a Rh(100) surface; (a) 1 L at 125 K, (b) 30 L at
180 K. These spectra are characteristic of molecularly chemi-
sorbed methanol.
J.E. Parmeter et al. / Aakorption and decomposition of methanol on Rh(IGQ) 91
Table 1 Vibrational frequencies (cm-‘) and mode assignments for chemisorbed methanol on Rh(lOO), and for CH,OH chemisorbed on other
metal surfaces
Mode
G-W
v,(CH,) vs(CH,)
UCH,)
PP(CH,)
GO) n(OH)
v(MO)
fi(W
CH,OH ‘)
(this work)
3335
2960
1455
1135
1005 745
260
CD,OD b,
(this work)
n.r.
2205
1090
n.r.
960 525
265
CH,OH
H/D Pd(100) Pd(ll0) Pt(ll1) Ni(ll1)
ratio 171 PI WI u-1
3345 3400 3280 3215
i 1.35
2945 2975 2955
2845 2800 > 2930
2810
1.33 1470 1465 1430 1455
- 1130 1120 n.r. n.r.
1.05 1025 1015 1000 1035 1.42 770 730 700 685
0.98 330 235 n.r. n.r.
a) Low coverage data of fig. 6a. ‘) Low coverage data (1 L at 140 K).
n.r. = not resolved.
surfaces. The mode assignments are straightfor- ward based on the observed frequency shifts upon
deuteration, the comparison to other metal surfaces, and comparison to infrared data for gas phase, liquid, and crystalline methanol (cf. section 3.2.4). The presence of the OH stretching and bending modes, the intense CO stretch near 1000
cm-‘, and the characteristic CH, symmetric de- formation mode near 1450 cm-’ combine to indi-
cate that the adsorption is molecular. The fairly intense low frequency mode occurring at 260 cm-’ in (a) is due to the rhodium oxygen stretching vibration; in (b) this mode appears to have down- shifted so that it is no longer resolved from the elastic peak. Coordination of the methanol to the surface via the oxygen atom is suggested by the
observed frequencies of v(OH), which are down- shifted substantially from the gas phase value of 3681 cm-‘. Hydrogen-bonding could also play a roll in these lowered frequencies, however. In con- trast to v(OH), the Y(CH~), S(CH,) and p(CH,) vibrational features show relatively small shifts from the corresponding gas phase values, suggest- ing a largely unperturbed methyl group.
There are some substantial differences between the HREEL spectra of figs. 6a and 6b. Compared to the low coverage of methanol represented in fig. 6a, the higher coverage represented in fig. 6b shows a v(OH) loss feature that is downshifted approximately 85 cm-’ (from 3335 to 3250 cm-‘),
and as pointed out above the v(Rh0) feature is resolved in (a) but not in (b). Fig. 6b does show weak loss features at 1770 (m(OH) + v(C0) com- bination), 2155 (v(CO) overtone), and 2580
(v(C0) + S,(CH,) combination) cm-’ that are not present in fig. 6a. In addition, the relative mode intensities are different. In fig. 6a, v(C0) and v(Rh0) are by far the most intense loss features, while in fig. 6b a(OH), S(CH,), v(CH,), and v(OH) have all increased markedly in intensity relative to these modes. In fact, the spectrum of fig. 6b closely resembles the multilayer HREEL spectrum of fig. 10, although the signal-to-noise is substantially better for the high coverage mono- layer state. The differences between the two spec- tra of fig. 6 are suggestive of increased interactions
among the methanol molecules at the higher coverage and adsorption temperature of spectrum 6b, and will be discussed in more detail in section 4.
3.2.2. Chemisorbed methoxy It has already been seen that annealing a
methanol saturated Rh(100) surface to tempera-
tures slightly in excess of 200 K caused desorption of molecular methanol near 215 K. Corresponding HREELS results show that the methanol that does not desorb in this temperature range undergoes OH bond cleavage to form a chemisorbed methoxy species (and, by inference, hydrogen adatoms [25]).
92 J. E. Par-meter et al. / Adsorption and decomposition of methanol on Rh(lO0)
L
(b) Anneal to 220 K
1020
i
[a) kh(lOO) + 3O’L CH30H 1 11035 195K
d
-0.5 K 0.5 K 1.5 K 2.5 K 3.5 K
ENERGY LOSS (cm-’ )
4
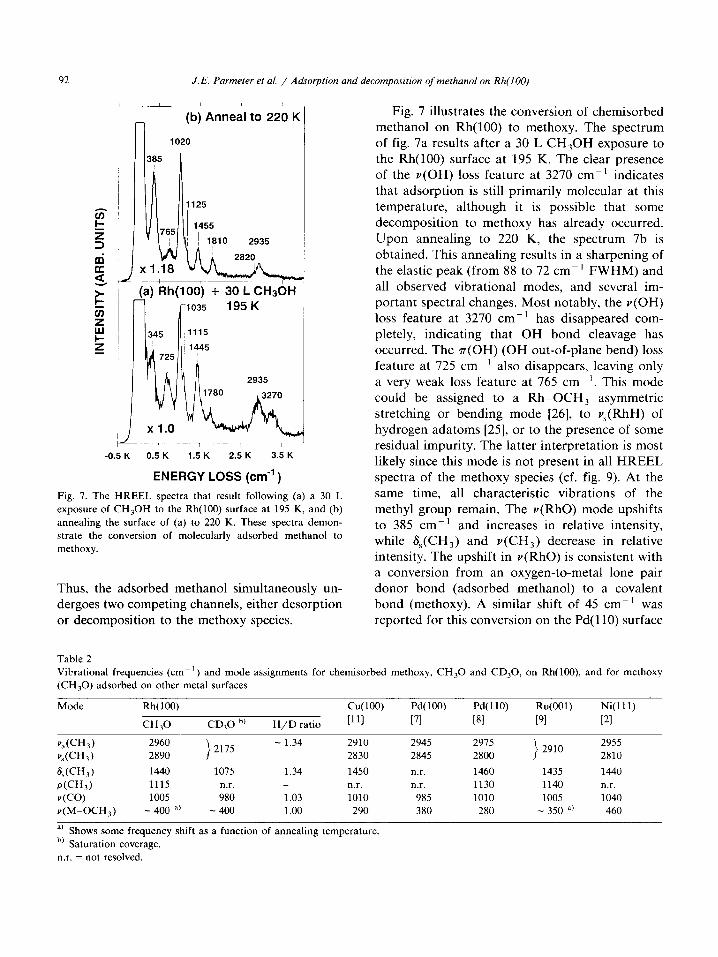
Fig. 7. The HREEL spectra that result following (a) a 30 L
exposure of CH,OH to the Rh(100) surface at 195 K, and (b)
annealing the surface of (a) to 220 K. These spectra demon-
strate the conversion of molecularly adsorbed methanol to
methoxy.
Thus, the adsorbed methanol simultaneously un- dergoes two competing channels, either desorption or decomposition to the methoxy species.
Fig. 7 illustrates the conversion of chemisorbed methanol on Rh(100) to methoxy. The spectrum of fig. 7a results after a 30 L CH,OH exposure to the Rh(100) surface at 195 K. The clear presence of the Y(OH) loss feature at 3270 cm-’ indicates that adsorption is still primarily molecular at this temperature, although it is possible that some decomposition to methoxy has already occurred. Upon annealing to 220 K, the spectrum 7b is obtained. This annealing results in a sharpening of the elastic peak (from 88 to 72 cm-’ FWHM) and all observed vibrational modes, and several im- portant spectral changes. Most notably, the v(OH) loss feature at 3270 cm-’ has disappeared com- pletely, indicating that OH bond cleavage has occurred. The r(OH) (OH out-of-plane bend) loss feature at 725 cm-’ also disappears, leaving only a very weak loss feature at 765 cm-‘. This mode could be assigned to a Rl-OCH, asymmetric stretching or bending mode [26], to v,(RhH) of hydrogen adatoms [25], or to the presence of some residual impurity. The latter interpretation is most likely since this mode is not present in all HREEL spectra of the methoxy species (cf. fig. 9). At the same time, all characteristic vibrations of the methyl group remain. The v(Rh0) mode upshifts to 385 cm-’ and increases in relative intensity, while S,(CH,) and Y(CH~) decrease in relative intensity. The upshift in v(Rh0) is consistent with a conversion from an oxygen-to-metal lone pair donor bond (adsorbed methanol) to a covalent bond (methoxy). A similar shift of 45 cm- ’ was reported for this conversion on the Pd(ll0) surface
Table 2
Vibrational frequencies (cm-’ ) and mode assignments for chemisorbed methoxy, CH,O and CD,O, on Rh(lOO), and for methoxy
(CH,O) adsorbed on other metal surfaces
Mode Rh(lOO) Cu(100) Pd(lOO) Pd(ll0) Ru(001) Ni(ll1)
CH& CD,0 ” H/D ratio [Ill [71 [81 [91 PI
- 2960 > - 2890 2175
1.34 2910 2945 2915 2955 2830 2845 2800
: 2910 2810
WH,) P(CH,) v(CO)
v(M-OCHs)
1440 1075 1.34 1450 n.r. 1460 1435 1440 1115 n.r. _ nr. nr. 1130 1140 nr.
1005 980 1.03 1010 985 1010 1005 1040
-400 a) - 400 1.00 290 380 280 - 350 *’ 460
‘) Shows some frequency shift as a function of annealing temperature.
h, Saturation coverage.
n.r. = not resolved.
J. E. Parmeter et al. / Ahorption and decomposition of methanol on Rh(lO0)
[8]. The relative intensities of the various loss
features of the methoxy species are similar to those of the low coverage adsorbed methanol of fig. 6a and suggest a loss of hydrogen-bonding and/or other molecular interactions compared to the high coverage adsorbed methanol of fig. 7a.
Table 2 summarizes the data of fig. 7b and also gives data for deuterated methoxy on Rh(100) and chemisorbed methoxy on other metal surfaces. Once again, the mode assignments are straightfor- ward and the agreement with the data for other surfaces is excellent. The loss feature at 1810 cm-’ in fig. 7b is due to a very small amount of CO adsorbed in bridge-bonded sites. This CO probably originates from adsorption from the chamber background rather than from methoxy decomposition.
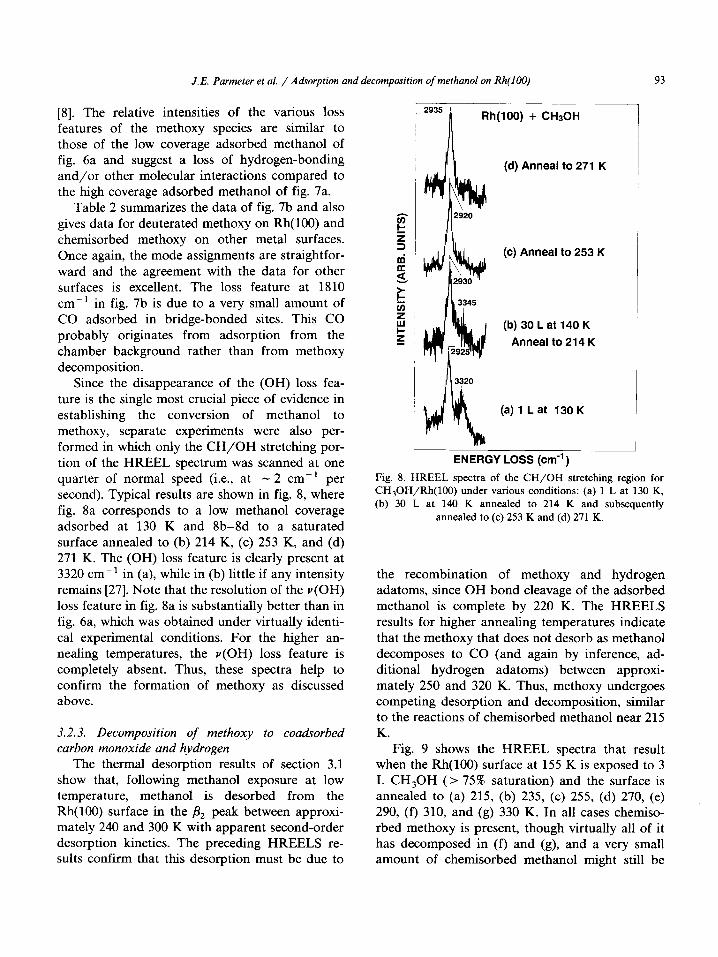
Since the disappearance of the (OH) loss fea- ture is the single most crucial piece of evidence in establishing the conversion of methanol to methoxy, separate experiments were also per- formed in which only the CH/OH stretching por- tion of the HREEL spectrum was scanned at one quarter of normal speed (i.e., at - 2 cm-’ per second). Typical results are shown in fig. 8, where fig. 8a corresponds to a low methanol coverage adsorbed at 130 K and 8b-8d to a saturated surface annealed to (b) 214 K, (c) 253 K, and (d) 271 K. The (OH) loss feature is clearly present at 3320 cm-’ in (a), while in (b) little if any intensity remains [27]. Note that the resolution of the v(OH) loss feature in fig. 8a is substantially better than in fig. 6a, which was obtained under virtually identi- cal experimental conditions. For the higher an- nealing temperatures, the u(OH) loss feature is completely absent. Thus, these spectra help to confirm the formation of methoxy as discussed above.
3.2.3. Decomposition of methoxy to coadsorbed carbon monoxide and hydrogen
The thermal desorption results of section 3.1 show that, following methanol exposure at low temperature, methanol is desorbed from the Rh(100) surface in the & peak between approxi- mately 240 and 300 K with apparent second-order desorption kinetics. The preceding HREELS re- sults confirm that this desorption must be due to
(d) Anneal to 271 K
(c) Anneal to 253 K
(b)30Lat140K
Anneal to 214 K
(a) 1 L at 130 K
ENERGY LOSS (cm-‘)
Fig. 8. HREEL spectra of the CH/OH stretching region for CH,OH/Rh(lOO) under various conditions: (a) 1 L at 130 K,
(b) 30 L at 140 K annealed to 214 K and subsequently
annealed to (c) 253 K and (d) 271 K.
the recombination of methoxy and hydrogen adatoms, since OH bond cleavage of the adsorbed methanol is complete by 220 K. The HREELS results for higher annealing temperatures indicate that the methoxy that does not desorb as methanol decomposes to CO (and again by inference, ad- ditional hydrogen adatoms) between approxi- mately 250 and 320 K. Thus, methoxy undergoes competing desorption and decomposition, similar to the reactions of chemisorbed methanol near 215 K.
Fig. 9 shows the HREEL spectra that result when the Rh(100) surface at 155 K is exposed to 3 L CH,OH (> 75% saturation) and the surface is annealed to (a) 215, (b) 235, (c) 255, (d) 270, (e) 290, (f) 310, and (g) 330 K. In all cases chemiso- rbed methoxy is present, though virtually all of it has decomposed in (f) and (g), and a very small amount of chemisorbed methanol might still be

94 J. E. Parmeter et al. / Aabrption and decomposition of methanol on Rh(lOO)
-__ 430
1’ 1005
I i (d) Anneal to 270 K
(b) Anneal to 235 K
x 3.2
1005 I 1 /
(a)Rh(100)+3L CH30H at 155 K
(c) Anneal to 255 K
x 1.4
Anneal to 215 K
L-
-0.5 K 0.5 K 1.5 K 2.5 K 3.5 K
ENERGY LOSS (cm-‘) 0.5 K 1.5 K 2.5 K 3.5 K
ENERGY LOSS (cm-‘)
810 K (f) Anneal to 3
(g) Anneal to 330 K 2930
1 445 / (e) Anneal to 290 K
1695
12020
% k 960
i .___
x 4.1
-0.5 K 0.5 K 1.5 K 2.5 K 3.5 K
ENERGY LOSS (cm-‘) -0.5 K 0.5 K 1.5 K 2.5 K 3.5 K
ENERGY LOSS (cm-’ )
Fig. 9. The HREEL spectra that result following a 3 L CH,OH exposure to Rh(100) at 155 K, with subsequent annealing to (a) 215, (b) 235, (c) 255, (d) 270, (e) 290, (f) 310, and (g) 330 K. These spectra illustrate the decomposition of the methoxy species to CO.

J.E. Parmeter et al. / Adsorption and decomposition of methanol on Rh(lOO) 95
present in (a). All spectra also show adsorbed CO, in both bridge-bonded (v(C0) = 1810-1905 cm-‘) and on-top (Y(CO) = 1985-2030 cm-‘) sites. In spectra (a) and (b) only a trivial amount of CO is present, probably due to background adsorption or the decomposition of a small amount of methoxy at defect sites. In (c) the decomposition of substantial amounts of methoxy appears to have just begun, and in (d)-(g) increasingly larger CO loss features appear as the loss features due to methoxy decrease in intensity. Thus, these spectra demonstrate the decomposition of methoxy to CO. They also show that no intermediate in the de- composition of methoxy to CO, i.e. CH,O or CHO, can be isolated and spectroscopically iden- tified on Rh(100) under these experimental condi- tions.
Since very little CO is present in spectra (a)-(c), the surfaces represented by these spectra corre- spond to virtually pure methoxy overlayers. Two interesting points should be noted. First, the weak loss feature observed in fig. 7b at 765 cm-’ is not present in these spectra, supporting the idea that this loss feature is not an intrinsic part of the methoxy vibrational spectrum. Instead, there is a very weak shoulder in (a) and (c) near 650 cm-’ which is most likely due to v,(R~H) of adsorbed hydrogen adatoms [25]. Second, there is a continu- ous upshift of v(Rh0) of methoxy from 355 cm-’ in (a) to 405 cm-’ in (c), perhaps due to ordering and increased dipole-dipole coupling at higher annealing temperatures. For the higher annealing temperatures of spectra (d)-(g) nothing can be said about the frequency of this mode due to the growing in of the intense y(RhC) vibration of on-top CO near 470 cm-‘.
The relative amounts of on-top and bridge- bonded CO produced by background adsorption and/or methoxy decomposition were somewhat variable; this can be seen, for example, by com- paring spectrum 7b (no on-top (CO)) to spectra 9a and 9b. However, there was always an increase in the Y(CO) (on-top)/v(CO) (bridge-bonded) inten- sity ratio for annealing temperatures above ap- proximately 300 K. This is apparent from a com- parison of spectra 9e-9g, and is in accordance with previous vibrational studies of CO adsorbed on Rh(100) [28].
In some cases a third v(C0) loss feature was resolved near 1750 cm-’ as a weak shoulder on the low energy side of the Y(CO) (bridge-bonded) loss feature. This mode is barely visible in figs. 9f and 9g and could be attributed either to CO in a four-fold site [29] or to bridge-bonded CO which is in some way perturbed by the coadsorbates from its ordinary structure. Since this loss feature is sometimes present after annealing as high as 480 K and the thermal desorption spectra show that all H, has desorbed by 400 K, the interpreta- tion that it might be due to v(C0) of a CHO or CH,O species is rejected.
Additional HREEL spectra for higher anneal- ing temperatures indicate that the CO formed from methoxy decomposition desorbs below 600 K, consistent with the thermal desorption results.
The decomposition of lower coverages of methanol and methoxy was not studied in as great a detail. The decomposition mechanism at low coverage (i.e., following a 1 L exposure of methanol at low temperature) is the same, although in this case methoxy decomposition is complete by the slightly lower temperature of 295 K.
3.2.4. Methanol multilayers As has been demonstrated from the thermal
desorption results, large exposures of methanol to the Rh(100) surface at temperatures less than 155 K result in the condensation of molecular multi- layers of methanol on the surface. The presence of multilayers greatly reduces the surface reflectivity and hence the elastic peak count rate in all multi- layer HREEL spectra was < 10% of what could be obtained from the clean Rh(100) surface. Nev- ertheless, these spectra are useful as an additional check of the purity of the methanol being ad- sorbed on the surface. Fig. 10 shows the HREEL spectrum that results after the Rh(100) surface at 140 K is exposed to 30 L CH,OH. The data of this spectrum are summarized in table 3, along with data for CD,OD multilayers on Rh(100) and with IR data for gas phase [30], liquid [30], and crystalline [30,31] CH,OH. The frequencies of the various vibrational modes of the methanol multi- layers on Rh(100) agree most closely with those of crystalline methanol rather than with those of liquid or (especially) gaseous methanol. This is

J.E. Parmeter et al. / Adsorption and decomposition of methanol on Rh(lO0)
d
Rh(100) + 30 L CH30H
1 1040 140 K
-0.5 K 0.5 K 1.5 K 2.5 K 3.5 K
ENERGY LOSS (cm-‘)
Fig. 10. The HREEL spectrum that results following exposure
of the Rh(100) surface at 140 K to 30 L CH,OH, showing the
characteristic features of multilayer methanol.
particularly true of B(OH) and r(OH), but also of p(CH,) and 6(CH,). This suggests that the multi- layers are hydrogen-bonded with a structure simi- lar to crystalline methanol. This is supported by the very broad Y(CH) and v(OH) loss features. As expected for multilayer vibrational spectra, there is no loss feature in the 250-450 cm-’ range that can be attributed to a metal-ligand stretching mode. In addition to the m(OH), v(CO), p(CH,), 6,(CH,), Y(CH~), and v(OH) loss features, fig. 10 exhibits weak features at 1780 and 2530 cm-‘. These are due to combinations of the loss features observed at lower energy loss: nfOH) + Y(CO)
I T<150K
CHBOH (a) + CHBOH (condensed)
200-
220 K I
1.55 K L CHaOH (9) (a I)
1 I
4 U-kiOH fsf (&I 0 (at + H (4
250- I 1 270_
400 K
P t-12 (g)
C&OH (9) U32) d0 (a) + 3H (a) -I
450-
550 K
I
co (9)
Fig. 11. Decomposition mechanism of a saturated methanol
layer on Rh(100). Gas phase and adsorbed species are denoted
by (g) and (a), respectively.
(765 + 1040 - 1780) and Y(CO) + S,(CH,) (1040 + 1475 - 2530).
4. Discussion
The HREELS and thermal desorption results combine to give a consistent overall picture of the reactions of a saturated methanol layer on Rh(lOO), and this scheme is summarized in fig. 11. Desorp- tion of methanol multilayers occurs near 155 K. The remaining (monolayer) methanol is molecu-
Table 3 Vibrational frequencies (cm-‘) d an mode assignments for multilayer methanoi on Rh(lOO), and for gas phase 1301, liquid 1301, and
crystalline [30,31] CH,OH (only those modes resolved for the CH,OH multilayers are tisted)
Mode Multilayers on Rh(100)
CH,OH CD,OD
v(GH) 3245 2470
p,(CH,) 2980
v,(CH,) ‘) 2855
> 2185
%(CH,) 1475 1100
PCH,) 1180 n.r.
v(W 1040 965
mWU 765 640
” Not resolved in fig. 10. n.r. = not resolved.
CH,OH
Gas
3681
3000
2844
1455
1060
1033
Liquid Crystalline
3328 3187,3284
2980 3000
2834 2905
1450 1470
1115 1145
1030 1055
655 730
J.E. Parmeter et al. / Adsorption and decomposition of methanol on Rh(100) 91
larly adsorbed up to approximately 200-220 K, where it undergoes competing desorption and de- composition to a methoxy species. The methoxy is
stable to approximately 250 K; between 250 and 320 K it either recombines with hydrogen adatoms to desorb as methanol or decomposes to carbon monoxide and additional hydrogen adatoms. Re-
combinative desorption of H, occurs between 270
and 400 K, and the desorption of molecular CO occurs between 450 and 550 K, regenerating the clean Rh(100) surface. Following a saturation methanol exposure, approximately 0.2 monolayers of methanol decompose eventually to CO and
hydrogen. This decomposition mechanism is similar to
those that have been reported for methanol de-
composition on other metal surfaces, particularly Ni(ll1) [2], where conversion of methanol to methoxy occurs near 180 K and the methoxy decomposes to CO by about 300 K. On Ru (OOl), methoxy formed from methanol decomposition
decomposes between 220 and 300 K, but, in this case, methanol adsorbs dissociatively as methoxy + H(ads) even at 85 K [9]. On Pd(lOO), adsorption is partly dissociative (to methoxy and H(ads)) and partly molecular at 77 K, while decomposition of
the methoxy to CO is complete by approximately 300 K [7]. On Pd(ll0) methanol adsorbed at 110 K converts to methoxy by 200 K and the methoxy decomposes below 300 K [8]. Thus on clean metal surfaces where methanol decomposition has been monitored using HREELS, the temperature range in which methoxy decomposes appears to be fairly constant, independent of both the nature of the metal and the surface structure. However, the temperature at which adsorbed methanol under-
goes OH bond cleavage to form methoxy appears to vary widely, although it is similar for Rh(lOO), Ni(lll), and Pd(ll0). The large reported varia- tions in this temperature do not appear to show a strong correlation with either metal type or surface structure.
As on most other metal surfaces where methanol decomposition has been characterized with HREELS, no CH,O or CHO intermediate in the decomposition of methoxy to CO could be identi- fied on Rh(100). The one exception to this trend appears to be the Pd(ll0) surface [8], where after
annealing a saturated methanol layer to 300 K, weak loss features were observed near 1550 and 1650 cm-’ that were tentatively attributed to one
or more adsorbed CHO species. Since on a suffi- ciently small time scale both CH,O and CHO must be present when methoxy decomposes to CO, this trend indicates that these intermediates are almost always less stable than adsorbed
methoxy at the temperature (- 300 K) where this
decomposition occurs. From a kinetic viewpoint, the reactions
CH,O (ads) + CHO (ads) + H (ads),
and
(i)
CHO (ads) + CO (ads) + H (ads), (ii)
must have lower activation barriers than the reac-
tion
CH,O (ads) + CH,O (ads) + H (ads) (iii)
(the (ads) denotes an adsorbed species). Thus re- actions (i) and (ii) follow immediately upon the occurrence of reaction (iii), and one observes spec- troscopically only the net reaction CH,O (ads) + CO (ads) + 3H (ads).
As table 1 shows, the chemisorbed methanol formed on Rh(100) is similar to chemisorbed methanol formed on other metal surfaces. In all cases methanol is believed to be adsorbed to the metal surface via the oxygen atom, with one or
both oxygen atom lone pairs forming donor bonds to the surface. This interaction can be thought of in classic Lewis acid-Lewis base terms, with methanol acting as the Lewis base and the metal surface as the Lewis acid. This bonding mecha- nism is supported on several surfaces [3,7,32] by work function measurements, which show that the work function decreases monotonically as methanol is adsorbed. The HREELS results also support this bonding mode, since on all surfaces where chemisorbed methanol has been vibration- ally characterized, v(OH) is downshifted > 300
cm-’ from the gas phase value of 3681 cm-‘. At the same time the frequencies of the various methyl vibrations are virtually unchanged (with the possi- ble exception of the methyl rock, which upshifts 60-70 cm-‘). Bonding via the oxygen atom is of course expected for the methanol molecule;

98 J.E. Parmeter et al. / Adkorpiion and decomposition of methanol on Rh(100)
without cleaving any CH bonds, there is no way (apart from van der Waals interactions) for ad-
sorption to occur via the saturated carbon atom. The results presented in this paper do not allow
firm conclusions to be drawn about the symmetry or adsorption site of the chemisorbed methanol on Rh(100). However, the similarities in the vibra-
tional spectra of adsorbed methanol on a number of surfaces of different structure suggest a com-
mon adsorption site, and such a site could only be an on-top site or two-fold bridging site since sites
of higher symmetry are not available on all of the surfaces. In addition, since the methanol oxygen atom has two lone pairs, a coordination number higher than two is not expected; and approxi-
mately tetrahedral geometry for the oxygen atom can be obtained only for adsorption in an on-top or two-fold bridging site. We tentatively favor the
bridge-bonded site which should allow a stronger interaction with the surface and which has been
tentatively favored as the site where methanol undergoes OH bond cleavage on Ru(001) [9], but further investigation of this point is clearly needed. The adsorbed methanol could be of either C, or C, symmetry. The observation of the p(CH,) and v,(CH,) modes in specular HREEL spectra sup- ports C, symmetry, but these modes are too weak to allow detailed angular profiles of their intensi- ties to be obtained.
As pointed out in section 3.2.1, HREEL spectra of low and high coverages of adsorbed methanol on Rh(100) show a number of differences which can be attributed to increased adsorbate-ad-
sorbate interactions at higher coverages. In terms of relative mode intensities, spectra of low cover- ages of methanol resemble closely those of methoxy, with v(Rh0) and v(C0) dominating the spectra, while spectra of high coverages of methanol show much more intense m(OH), &(CH,), v(CH,), and v(OH) modes, similar to the spectra of methanol multilayers. These changes suggest that the interactions present for high coverages, probably including substantial hydro- gen-bonding, result in reorientation of at least some of the adsorbed methanol such that in- creased dynamic dipoles perpendicular to the surface become associated with some of the hy- drogenic vibrational features. The decrease in
frequency of v(OH) as the coverage increases also suggests that increased hydrogen-bonding occurs at high coverages. If there were no hydrogen-
bonding, the v(OH) frequency should increase
with increasing coverage, as the oxygen-to-metal
charge transfer per molecule becomes less at higher coverages.
Table 2 shows that the methoxy formed on Rh(100) is vibrationally very similar to methoxy
species formed on other metal surfaces; this is true not only with regards to mode frequencies but also relative mode intensities. The loss features due to v(Rh0) and Y(CO) are by far the most intense for all coverages and annealing temperatures. Off- specular HREEL spectra (not shown) show that both of these loss features are attenuated relative to the various hydrogenic modes, indicating that these two modes are excited primarily via the dipole scattering mechanism while the hydrogenic modes scatter primarily via non-dipolar mecha-
nisms. The intensity of Y(CO) suggests strongly that (as expected) the methoxy CO bond is not parallel to the surface, but the exact RhOC bond angle cannot be deduced from these data. Studies of methoxy on other surfaces have come to differ- ing conclusions regarding adsorption site and CO bond orientation. On Ni(ll1) [2] and Pd(lOO) [7], the observation of v,(CH,) in specular HREEL spectra has been taken as evidence for a tilted methoxy species; i.e., the methoxy CO band is not normal to the surface plane. An X-ray photoelec- tron diffraction study of methoxy on Cu(ll0) [12] also supported a tilted methoxy species on this
surface. In contrast, an IRAS study of methoxy on Cu(ll1) led to the conclusion that the methoxy species was upright (i.e., the CO bond is per- pendicular to the surface), occupying a 3-fold hol- low site and with C,, symmetry [13]. A NEXAFS study of methoxy on Cu(100) also concluded that methoxy stands upright on that surface [14]. The observation of v,(CH,) and p(CH,) in specular HREEL spectra of methoxy on Rh(100) could also be taken as evidence for a tilted rather than an upright methoxy; for a tilted methoxy of C, symmetry these modes would be “dipole allowed” (though the dynamic dipoles associated with them should be weak). Interestingly, the authors of the IRAS study on Cu(ll1) [13] point out that while

J. E. Parmeter et al. / Adsorption and decomposition of methanol on Rh(lO0) 99
tilted, 2-fold bridge-bonded methoxy ligands are known in organometallic compounds such as
Os,(CO),, (p-H) (p-OCH,) [33], upright methoxy species in higher coordination sites are apparently
unknown in organometallic chemistry. Based on the analogy to organometallic compounds, we favor a tilted, 2-fold bridging methoxy on Rh(100). However, this preference is speculative, and it seems clear that additional studies employing a variety of experimental techniques are needed to
establish general trends about the bonding and structure of methoxy on metal surfaces.
An additional point of interest concerning methoxy on Rh(100) is the fact that v(Rh0) up- shifts with increasing annealing temperature, from 355 cm-’ in fig. 9a to at least 405 cm-’ in fig. 9c.
An upward shift of 50 cm-’ in the frequency of this mode (from 320 to 370 cm-‘) with increasing
annealing temperature was also observed on Ru(001) and was tentatively identified with a change in adsorption site [9]. Since none of the other vibrational loss features of methoxy show consistent shifts as a function of annealing tem- perature on Rh(lOO), we do not favor this inter- pretation. It seems more likely that this frequency shift results from increased dipole-dipole cou- pling as the methoxy layer becomes more ordered at higher annealing temperatures.
5. Conclusions
The principal conclusions of this work are the following:
(1) Below approximately 200 K, methanol ad- sorbs molecularly on the Rh(100) surface. The molecule bonds to the surface via one or both of the oxygen atom electron lone pairs, in a Lewis acid-base interaction. There are some changes in the vibrational spectrum of the adsorbed methanol as the (submonolayer) coverage is changed, suggestive of hydrogen-bonding of methanol molecules within the monolayer.
(2) Near 210-220 K, part of the adsorbed methanol desorbs and the rest undergoes OH bond cleavage to form an O-bonded methoxy species.
The methoxy species is stable to approximately 250 K, and its vibrational spectrum is very similar to those of methoxy species that have been vibra- tionally characterized on other metal surfaces.
(3) Between 250 and 320 K, the methoxy either recombines with adsorbed hydrogen adatoms and desorbs as methanol, or decomposes to form
coadsorbed carbon monoxide and hydrogen adatoms. As in the case of CO adsorption on clean Rh(lOO), the CO formed occupies both
bridging and on-top adsorption sites, and the rela- tive populations of CO in these two binding sites
are temperature dependent. As in the case of methanol decomposition on most other metal surfaces, no intermediate in the decomposition of
methoxy to CO could be identified using HREELS. There is no evidence for carbon-oxygen bond
cleavage of the methoxy species. (4) The hydrogen adatoms recombine and de-
sorb as H, between approximately 270 and 400 K. This is reduced from the H, desorption tempera- ture range from clean Rh(100) due to the presence of coadsorbed CO. The CO desorbs near 500 K, regenerating the clean Rh(100) surface.
(5) Molecular multilayers of methanol can be condensed on Rh(100) at temperatures below ap- proximately 150 K. The vibrational spectra of these multilayers are very similar to spectra of
crystalline methanol. (6) Following a saturation methanol exposure
to Rh(100) at approximately 115 K, annealing the surface leads eventually to the decomposition of - 0.2 monolayers of methanol to yield ultimately CO and H, as desorption products. Since some
methanol also desorbs molecularly, the saturation coverage in the first monolayer is somewhat higher than this.
Acknowledgements
We acknowledge with pleasure the support of this work by the Department of Energy, Office of Basic Energy Sciences, Division of Chemical Sci- ences.
100 J. E. Pcrrmeter et al. / Adsorption and decomposition of methpnol on Rh(lOO)
References
PI PI
I31
[41
[51
[fd [71
[Sl
[91
PO1
[111 P21
1131
[I41
[I51
1161
[I71 1181
[I91
PO1
M.A. Vannice, Catal. Rev. Sci. Eng. 14 (1976) 153.
J.E. Demuth and H. Ibach. Chem. Phys. Lett. 60 (1979)
395.
F.L. Baudais, A.J. Borschke, J.D. Fedyk and M.J. Dig-
nam, Surf. Sci. 100 (1980) 210.
G.W. Rubloff and J.E. Demuth, J. Vat. Sci. Technol. 14
(1977) 419.
D.W. Goodman, J.T. Yates, Jr. and T.E. Madey, Surf. Sci.
93 (1980) L135.
B.A. Sexton, Surf. Sci. 102 (1981) 271.
K. Christmann and J.E. Demuth, J. Chem. Phys. 76 (1982)
6308, 6318.
A.K. Bhattacharya, M.A. Chesters, M.E. Pemble and N.
Sheppard, Surf. Sci. 206 (1988) L845.
J. Hrbek, R.A. de Paola and F.M. Hoffmann, J. Chem.
Phys. 81 (1984) 2818.
G.B. Fisher, T.E. Madey, B.J. Waclawski and J.T. Yates,
Jr.. in: Proc. 7th Int. Vacuum Congress and 3rd Int.
Congress on Solid Surfaces, Vienna (1977) p. 1071.
B.A. Sexton, Surf. Sci. 88 (1979) 299.
K.C. Prince, E. Holub-Krappe, K. Horn and D.P.
Woodruff. Phys. Rev. B 32 (1985) 4249.
M.A. Chesters and E.M. McCash, Spectrochim. Acta 43 A
(1987) 1625.
T. Lindner, J. Somers, A.M. Bradshaw, A.L.D. Kilcoyne
and D.P. Woodruff, Surf. Sci. 203 (1988) 333.
F. Solymosi, A. Berkh and T.I. Tarnoclzi, Surf. Sci. 141
(1984) 533.
W.F. Egelhoff, J.W. Linnett and D.L. Perry, Faraday
Discuss. Chem. Sot. 60 (1975) 127.
M. Bowher and R.J. Madix, Surf. Sci. 95 (1980) 190.
X. Jiang, J.E. Parmeter, CA. Estrada and D.W. Good-
man, to be published.
D.W. Goodman, Ultramicroscopy 34 (1990) 1, and refer-
ences therein.
J.F. Walker, Formaldehyde, American Chemical Society
Monograph Series, 2nd ed. (Heinhold, New York, 1964).
VI
w v31
v41
v51
WI
~271
WI
~291
[301 [311 [321
[331
D.W. Goodman, J.T. Yates, Jr. and C.H.F. Peden, Surf.
Sci. 164 (1985) 417.
P.A. Redhead, Vacuum 12 (1962) 203.
Y. Kim, H.C. Peebles and J.M. White. Surf. Sci. 114
(1982) 363.
D.E. Peebles, H.C. Peebles and J.M. White. Surf. Sci. 136
(1984) 463.
At a saturation coverage of hydrogen, the symmetric
metal-hydrogen stretch occurs near 660 cm-’ on this
surface, but the intensity of this loss feature is low.
L.J. Richter and W. Ho, J. Vat. Sci. Technol. A 5 (1987)
453.
A mode of similar intensity was observed in the HREEL
spectrum of methoxy on Ru(001) at 615 cm-‘, and was
tentatively assigned to a Ru-OH, mode of a small amount
of adsorbed water or to a Ru-OCH, asymmetric stretch-
ing or bending mode of methoxy [lo].
It must be pointed out that after annealing the surface to
> 200 K and retooling to 1150 K, the readsorption of a
small amount of methanol or water from the chamber
background could lead to a very weak v(OH) loss feature
in the subsequently collected HREEL spectrum. We thus
believe that cleavage of the OH bond of the initially
adsorbed methanol is virtually complete in fig. 8b.
L.-W.H. Leung, J.-W. He and D.W. Goodman. J. Chem.
Phys., in press.
The v(C0) frequency of CO adsorbed in a fourfold hol-
low site generally falls in the frequency range of 1700-1800
cm-‘. B.E. Hayden, in: Vibrational Spectroscopy of Molecules on Surfaces, Eds. by J.T. Yates, Jr. and T.E.
Madey (Plenum. New York, 1987) p. 305.
M. Falk and E. Whalley, J. Chem. Phys. 34 (1961) 1554.
F. Fischer and R. Fuhrich, Z. Naturforsch. 38a (1983) 31.
H. Liith, G.W. Rubloff and W.D. Grobman, Surf. Sci. 63
(1977) 325.
C.A. Anson and D.B. Powell, to be published.