Embed Size (px)
Citation preview
Morgan Stanley Financials Forum - St.George Banking Group, September 2012
St.George Banking Group 2012 Morgan Stanley
Financials Forum
George Frazis Chief Executive
Morgan Stanley Financials Forum - St.George Banking Group, September 2012 2
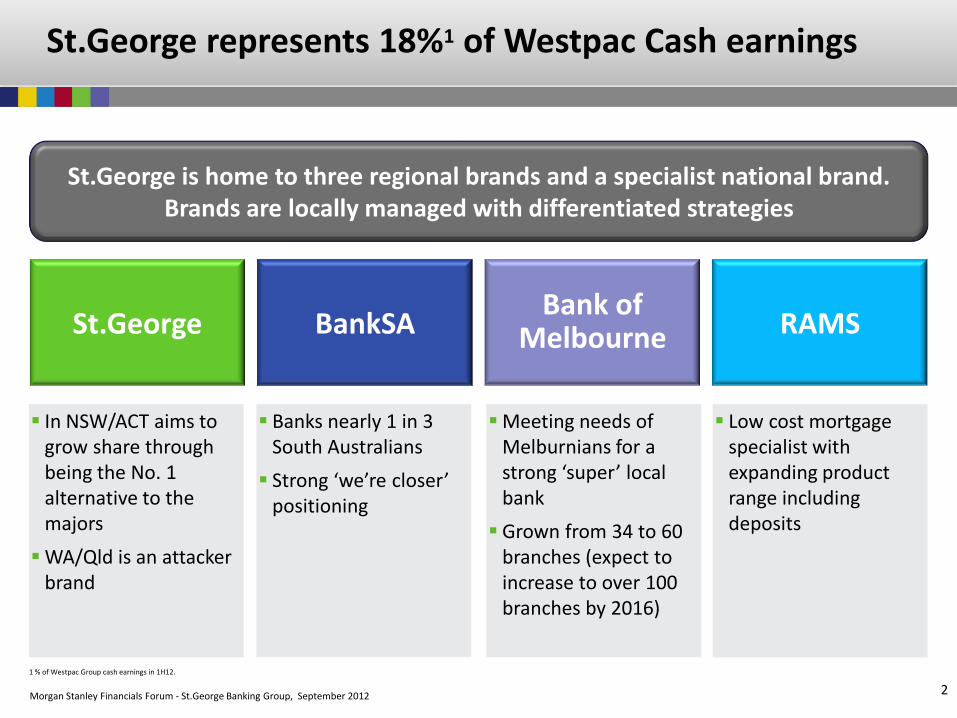
St.George represents 18%1 of Westpac Cash earnings
St.George is home to three regional brands and a specialist national brand. Brands are locally managed with differentiated strategies
In NSW/ACT aims to grow share through being the No. 1 alternative to the majors
WA/Qld is an attacker brand
Low cost mortgage specialist with expanding product range including deposits
Meeting needs of Melburnians for a strong ‘super’ local bank
Grown from 34 to 60 branches (expect to increase to over 100 branches by 2016)
Banks nearly 1 in 3 South Australians
Strong ‘we’re closer’ positioning
St.George BankSA Bank of
Melbourne RAMS
1 % of Westpac Group cash earnings in 1H12.
Morgan Stanley Financials Forum - St.George Banking Group, September 2012 3
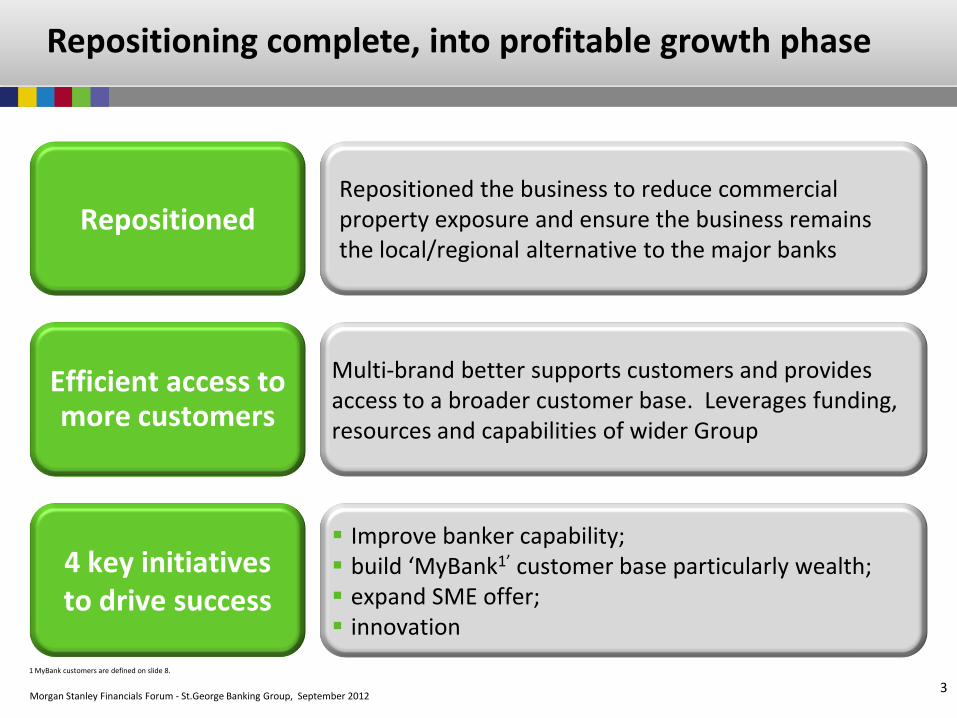
Repositioning complete, into profitable growth phase
Repositioned
Efficient access to more customers
4 key initiatives to drive success
Repositioned the business to reduce commercial property exposure and ensure the business remains the local/regional alternative to the major banks
Multi-brand better supports customers and provides access to a broader customer base. Leverages funding, resources and capabilities of wider Group
Improve banker capability; build ‘MyBank1’ customer base particularly wealth; expand SME offer; innovation
1 MyBank customers are defined on slide 8.
Morgan Stanley Financials Forum - St.George Banking Group, September 2012 4
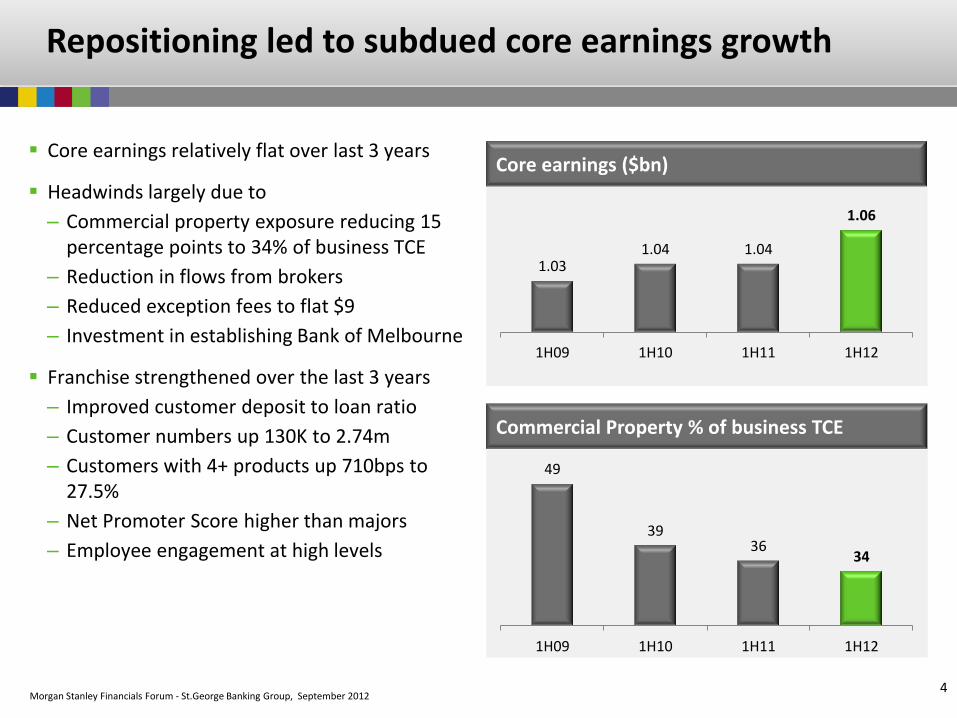
Repositioning led to subdued core earnings growth
Core earnings relatively flat over last 3 years
Headwinds largely due to
– Commercial property exposure reducing 15 percentage points to 34% of business TCE
– Reduction in flows from brokers
– Reduced exception fees to flat $9
– Investment in establishing Bank of Melbourne
Franchise strengthened over the last 3 years
– Improved customer deposit to loan ratio
– Customer numbers up 130K to 2.74m
– Customers with 4+ products up 710bps to 27.5%
– Net Promoter Score higher than majors
– Employee engagement at high levels
1.03 1.04 1.04
1.06
1H09 1H10 1H11 1H12
Core earnings ($bn)
49
39 36
34
1H09 1H10 1H11 1H12
Commercial Property % of business TCE
Morgan Stanley Financials Forum - St.George Banking Group, September 2012
12
33
18
11 26
Peer 1 Peer 2 Peer 3 WBC Other
5
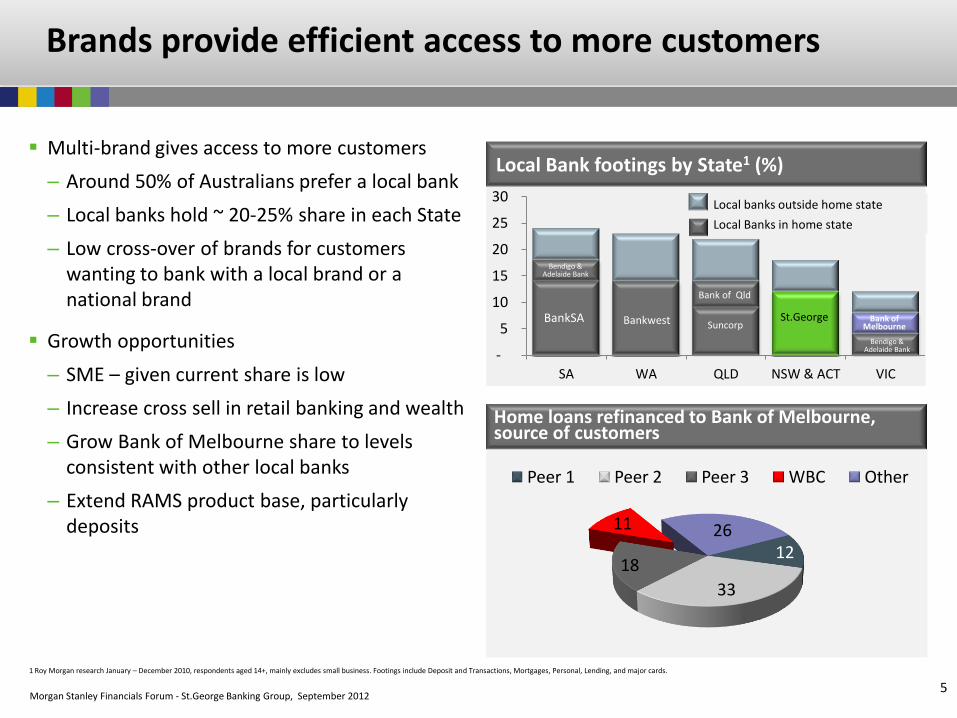
Brands provide efficient access to more customers
Multi-brand gives access to more customers
– Around 50% of Australians prefer a local bank
– Local banks hold ~ 20-25% share in each State
– Low cross-over of brands for customers wanting to bank with a local brand or a national brand
Growth opportunities
– SME – given current share is low
– Increase cross sell in retail banking and wealth
– Grow Bank of Melbourne share to levels consistent with other local banks
– Extend RAMS product base, particularly deposits
Local Bank footings by State1 (%)
Home loans refinanced to Bank of Melbourne, source of customers
-
5
10
15
20
25
30
SA WA QLD NSW & ACT VIC
St.George Suncorp
Bank of Qld
Bankwest BankSA
Bendigo & Adelaide Bank
Bank of Melbourne
Bendigo & Adelaide Bank
Local banks outside home state
Local Banks in home state
1 Roy Morgan research January – December 2010, respondents aged 14+, mainly excludes small business. Footings include Deposit and Transactions, Mortgages, Personal, Lending, and major cards.
Morgan Stanley Financials Forum - St.George Banking Group, September 2012 6
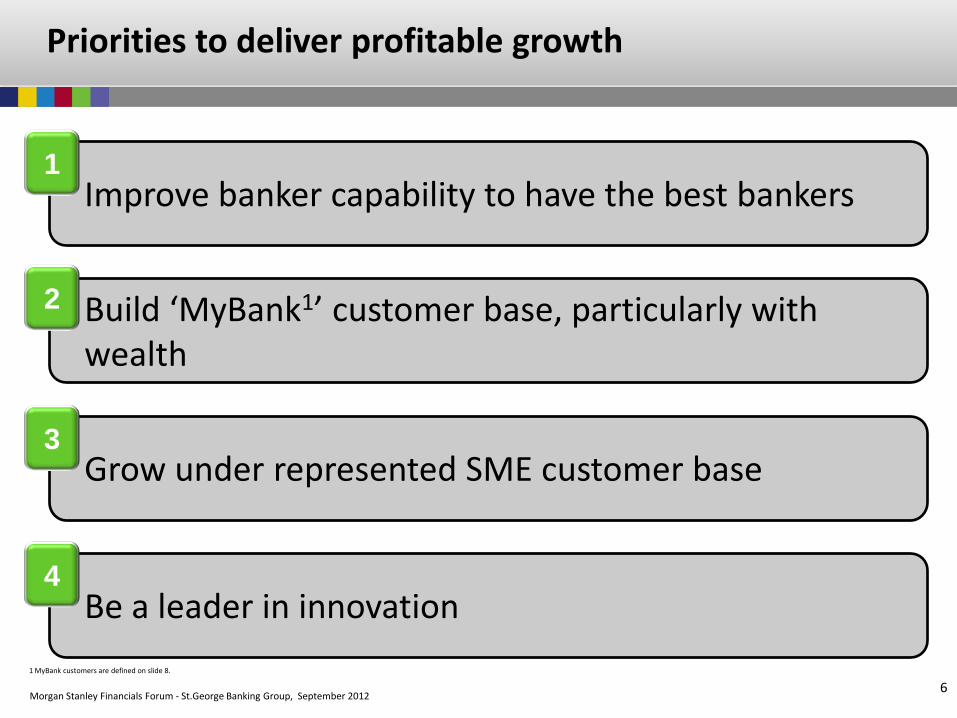
Priorities to deliver profitable growth
Improve banker capability to have the best bankers
Build ‘MyBank1’ customer base, particularly with wealth
Grow under represented SME customer base
Be a leader in innovation
1
2
3
4
1 MyBank customers are defined on slide 8.
Morgan Stanley Financials Forum - St.George Banking Group, September 2012 7
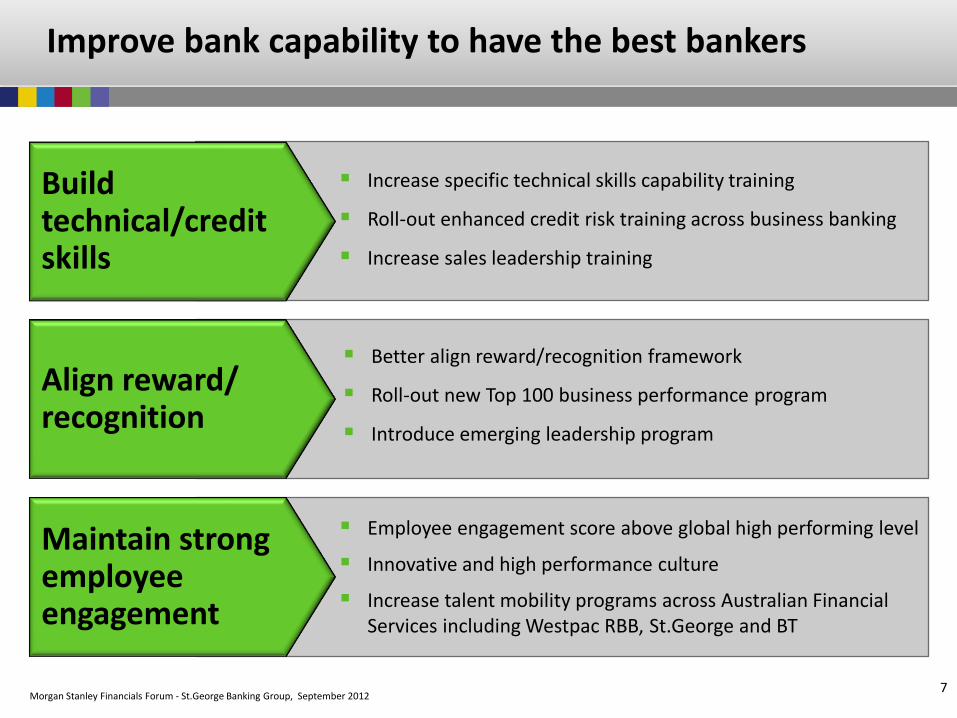
Improve bank capability to have the best bankers
Align reward/ recognition
Better align reward/recognition framework
Roll-out new Top 100 business performance program
Introduce emerging leadership program
Build technical/credit skills
Increase specific technical skills capability training
Roll-out enhanced credit risk training across business banking
Increase sales leadership training
Maintain strong employee engagement
Employee engagement score above global high performing level
Innovative and high performance culture
Increase talent mobility programs across Australian Financial Services including Westpac RBB, St.George and BT
Morgan Stanley Financials Forum - St.George Banking Group, September 2012 8
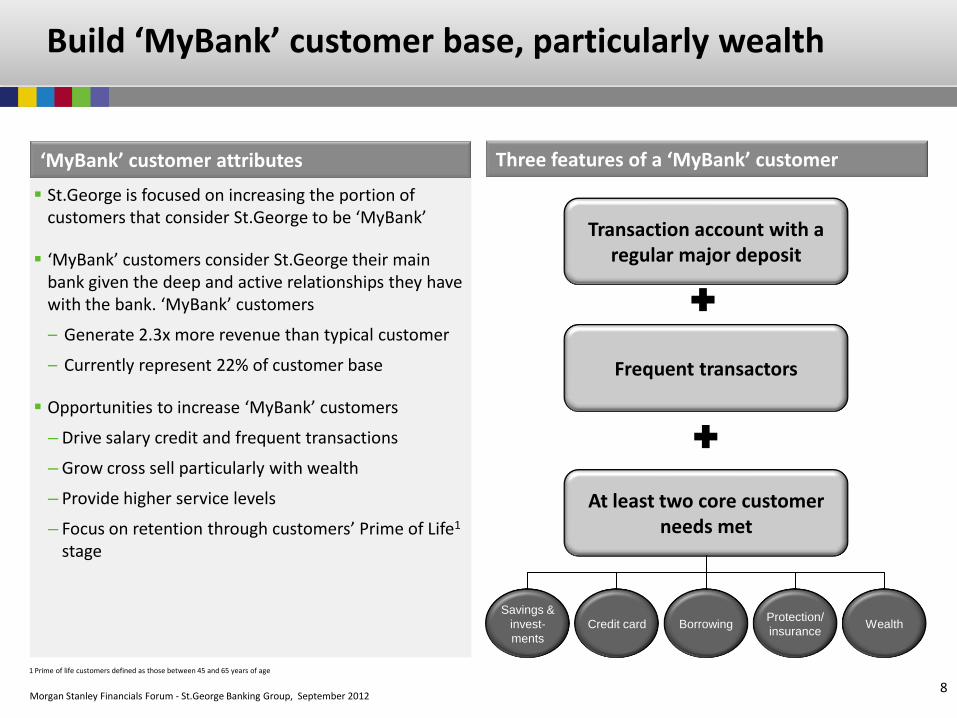
Build ‘MyBank’ customer base, particularly wealth
St.George is focused on increasing the portion of customers that consider St.George to be ‘MyBank’
‘MyBank’ customers consider St.George their main bank given the deep and active relationships they have with the bank. ‘MyBank’ customers
– Generate 2.3x more revenue than typical customer
– Currently represent 22% of customer base
Opportunities to increase ‘MyBank’ customers
– Drive salary credit and frequent transactions
– Grow cross sell particularly with wealth
– Provide higher service levels
– Focus on retention through customers’ Prime of Life1 stage
‘MyBank’ customer attributes Three features of a ‘MyBank’ customer
Transaction account with a regular major deposit
Frequent transactors
At least two core customer needs met
Savings &
invest-
ments
Credit card Borrowing Protection/
insurance Wealth
1 Prime of life customers defined as those between 45 and 65 years of age

Morgan Stanley Financials Forum - St.George Banking Group, September 2012 9
Grow under represented SME customer base
Initial plans
New hub distribution model focused on efficient access to specialists using online, video and mobile
Relationship based approach supported by emerging technologies
Convenience with 24 hour lobbies, coin counters and dispensers
Current position St.George has a strong commercial business offer but the SME
segment is under served
A significant growth opportunity to grow this segment
Success looks like Detailed work currently underway on SME initiative
New SME model expected to be launched in 2013
Initiatives
Current position
Timing

Morgan Stanley Financials Forum - St.George Banking Group, September 2012 10
Be a leader in innovation
Become better/simpler in
everything we do
Mobile/online leadership
Improve Time to “Yes” and Right first time
Simplify products
Streamline end-to-end processes
Ensure every part of the bank strives for excellence
Leverage strong heritage of online/mobile capability – First internet banking (1995) – First to send SMS alerts (2003) – First savings/transaction accounts
opened via mobile devices (2010) – First mobile credit card applications
(2012)
Provide innovative customer solutions now – Pay anyone via mobile (April 12) – Budget tool (June 12) – PropertyMate (August 12)
Morgan Stanley Financials Forum - St.George Banking Group, September 2012 11
Leverage new AFS structure to deliver better returns
Enhance brand distinctiveness to maximise customer coverage
Leverage best practice across brands
Better co-ordinated marketing approach
Maximise shared services and share infrastructure investment across brands
Productivity through end-to-end process redesign and product simplification
Morgan Stanley Financials Forum - St.George Banking Group, September 2012 12
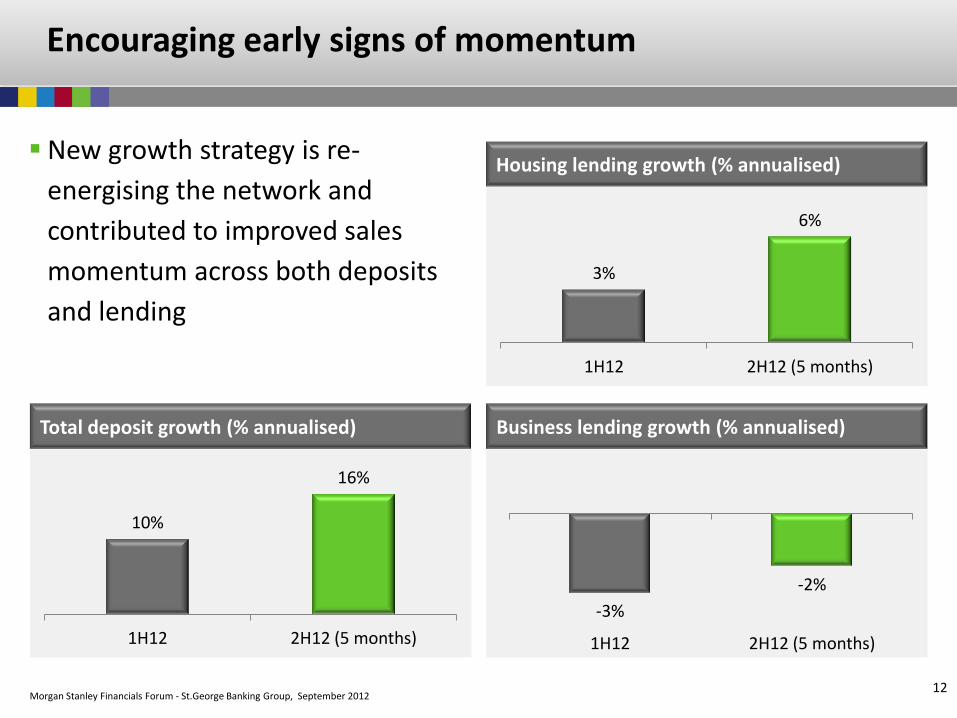
Encouraging early signs of momentum
Housing lending growth (% annualised)
3%
6%
1H12 2H12 (5 months)
Total deposit growth (% annualised)
10%
16%
1H12 2H12 (5 months)
Business lending growth (% annualised)
-3%
-2%
1H12 2H12 (5 months)
New growth strategy is re-
energising the network and
contributed to improved sales
momentum across both deposits
and lending
Morgan Stanley Financials Forum - St.George Banking Group, September 2012 13
Summary
Repositioning of St.George complete with momentum emerging
Multiple brands provide efficient access to more customers, leveraging the scale of the broader Group
Four strategic priorities to enhance growth/return mix
– Enhance banker capability
– Build ‘MyBank1’ customer base, particularly with wealth
– Grow SME customer base
– Continue to be a leader in innovation
1 MyBank customers are defined on slide 8.

Morgan Stanley Financials Forum - St.George Banking Group, September 2012
St.George Banking Group 2012 Morgan Stanley
Financials Forum
Appendix
Morgan Stanley Financials Forum - St.George Banking Group, September 2012
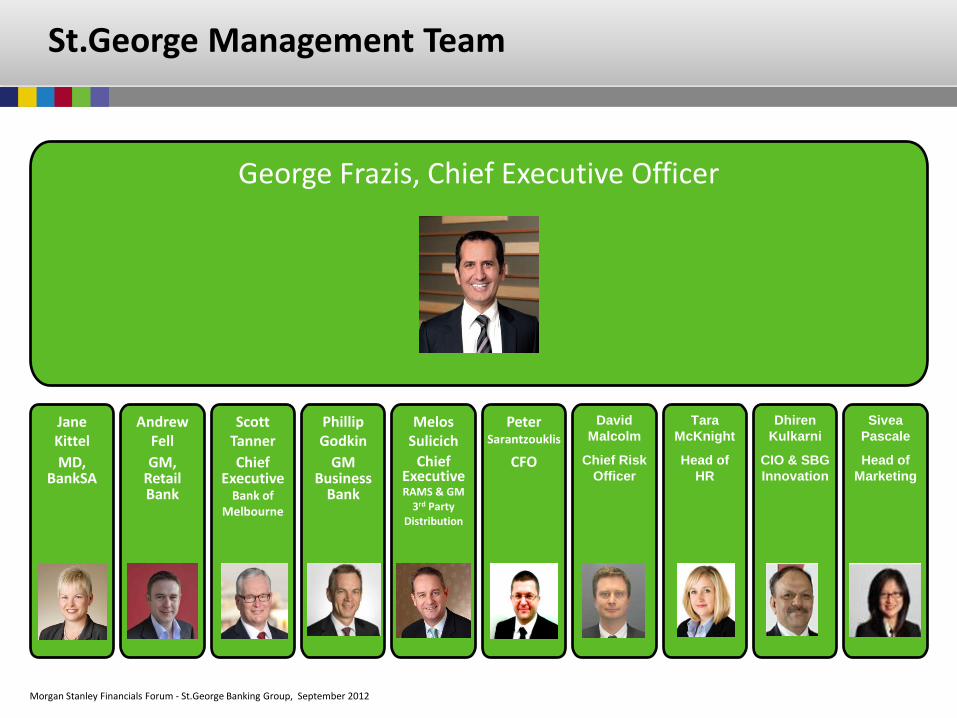
St.George Management Team
George Frazis, Chief Executive Officer
Jane Kittel
MD, BankSA
Andrew Fell
GM, Retail Bank
Scott Tanner
Chief Executive
Bank of Melbourne
Phillip Godkin
GM Business
Bank
Melos Sulicich
Chief Executive RAMS & GM
3rd Party Distribution
Peter Sarantzouklis
CFO
David
Malcolm
Chief Risk
Officer
Tara
McKnight
Head of
HR
Dhiren
Kulkarni
CIO & SBG
Innovation
Sivea
Pascale
Head of
Marketing

Morgan Stanley Financials Forum - St.George Banking Group, September 2012 16
St.George Core earnings steady since merger, absorbing business repositioning
Movement 1H12 – 2H11
1.03
1.04 1.04
1.06
1H09 1H10 1H11 1H12
602 615
569
52 17
8 17
(19) (33)
(4) (41)
(3) (27)
1H11
Net
II
No
n-I
I
Exp
ense
s
Imp
airm
ent
char
ges
Tax
& N
CI
2H11
Net
II
No
n-I
I
Exp
ense
s
Imp
airm
ent
char
ges
Tax
& N
CI
1H12
Cash earnings
7% Cash earnings down 7% to $569m
Core earnings
3% Core earnings down 3% to $1,055m
Net interest income
3%
Deposits up 5% driven by 13% growth in term deposits. Deposit growth more than fully funded loan growth
Housing up 2% with proprietary lending 67% of flow
Other personal lending (including cards) up 7%
Business lending down 1% with growth in SME and auto finance offset by lower commercial lending, particularly property
Margins 7bps Margins down 7bps to 1.871%
Lower deposit spreads a key driver
Non-interest income
1%
Higher business and personal lending fees
Higher market sales income as customers increased their use of hedging to manage FX and rates
Offset by lower merchant fees and customers moving transaction business to lower fee accounts
Expenses 1% Productivity benefits offset Bank of Melbourne
expansion (additional 5 branches over half) and higher restructuring charges
Impairment charges
13%
Impairment charges were up $27m to $240m. This was largely driven by updates to models used to assess consumer collectively assessed provisions and some top-ups to existing stressed asset provisions
Consumer impairment charges up $41m
Business impairment charges down $14m
Down 7% Up 2%
1.89
1.94
1.87
5bps 1bp
0bp 0bp
(13bps)
1H11
2H11
Ass
et s
pre
ad
Ass
et m
ix
Dep
osi
t sp
read
Dep
osi
t m
ix
Wh
ole
sale
fu
nd
ing
&
oth
er
1H12
Down 7bps
Net interest margin1 (%)
Cash earnings movement half on half ($m)
Core earnings ($bn)
1 St.George margins restated to incorporate the transfer of RAMS business during the period.
Morgan Stanley Financials Forum - St.George Banking Group, September 2012 17
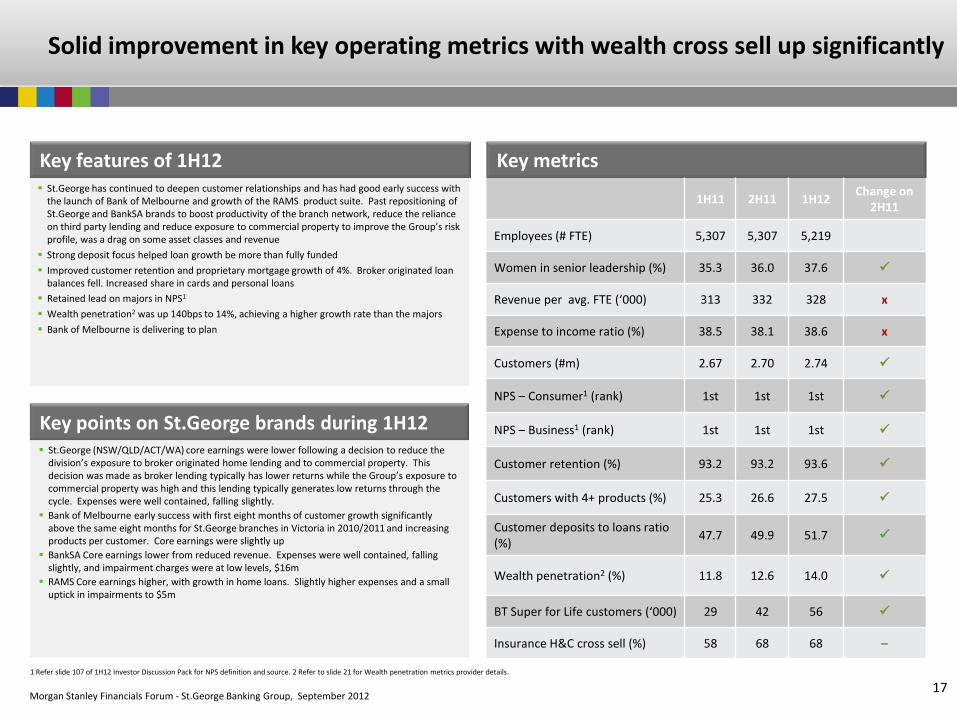
Solid improvement in key operating metrics with wealth cross sell up significantly
St.George (NSW/QLD/ACT/WA) core earnings were lower following a decision to reduce the division’s exposure to broker originated home lending and to commercial property. This decision was made as broker lending typically has lower returns while the Group’s exposure to commercial property was high and this lending typically generates low returns through the cycle. Expenses were well contained, falling slightly.
Bank of Melbourne early success with first eight months of customer growth significantly above the same eight months for St.George branches in Victoria in 2010/2011 and increasing products per customer. Core earnings were slightly up
BankSA Core earnings lower from reduced revenue. Expenses were well contained, falling slightly, and impairment charges were at low levels, $16m
RAMS Core earnings higher, with growth in home loans. Slightly higher expenses and a small uptick in impairments to $5m
St.George has continued to deepen customer relationships and has had good early success with the launch of Bank of Melbourne and growth of the RAMS product suite. Past repositioning of St.George and BankSA brands to boost productivity of the branch network, reduce the reliance on third party lending and reduce exposure to commercial property to improve the Group’s risk profile, was a drag on some asset classes and revenue
Strong deposit focus helped loan growth be more than fully funded
Improved customer retention and proprietary mortgage growth of 4%. Broker originated loan balances fell. Increased share in cards and personal loans
Retained lead on majors in NPS1
Wealth penetration2 was up 140bps to 14%, achieving a higher growth rate than the majors
Bank of Melbourne is delivering to plan
Key metrics
1H11 2H11 1H12 Change on
2H11
Employees (# FTE) 5,307 5,307 5,219
Women in senior leadership (%) 35.3 36.0 37.6
Revenue per avg. FTE (‘000) 313 332 328 x
Expense to income ratio (%) 38.5 38.1 38.6 x
Customers (#m) 2.67 2.70 2.74
NPS – Consumer1 (rank) 1st 1st 1st
NPS – Business1 (rank) 1st 1st 1st
Customer retention (%) 93.2 93.2 93.6
Customers with 4+ products (%) 25.3 26.6 27.5
Customer deposits to loans ratio (%)
47.7 49.9 51.7
Wealth penetration2 (%) 11.8 12.6 14.0
BT Super for Life customers (‘000) 29 42 56
Insurance H&C cross sell (%) 58 68 68 –
Key points on St.George brands during 1H12
Key features of 1H12
1 Refer slide 107 of 1H12 Investor Discussion Pack for NPS definition and source. 2 Refer to slide 21 for Wealth penetration metrics provider details.
Morgan Stanley Financials Forum - St.George Banking Group, September 2012
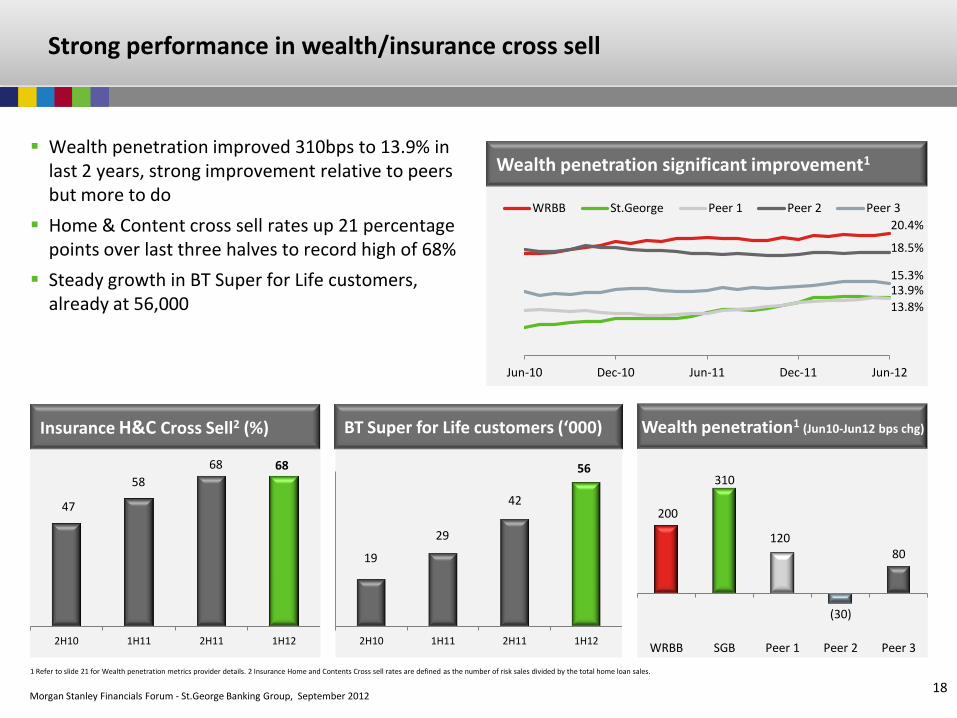
20.4%
13.9%
13.8%
18.5%
15.3%
Jun-10 Dec-10 Jun-11 Dec-11 Jun-12
WRBB St.George Peer 1 Peer 2 Peer 3
18
Strong performance in wealth/insurance cross sell
Wealth penetration significant improvement1 Wealth penetration improved 310bps to 13.9% in
last 2 years, strong improvement relative to peers but more to do
Home & Content cross sell rates up 21 percentage points over last three halves to record high of 68%
Steady growth in BT Super for Life customers, already at 56,000
1 Refer to slide 21 for Wealth penetration metrics provider details. 2 Insurance Home and Contents Cross sell rates are defined as the number of risk sales divided by the total home loan sales.
200
310
120
(30)
80
WRBB SGB Peer 1 Peer 2 Peer 3
47
58
68 68
2H10 1H11 2H11 1H12
19
29
42
56
2H10 1H11 2H11 1H12
Insurance H&C Cross Sell2 (%) BT Super for Life customers (‘000) Wealth penetration1 (Jun10-Jun12 bps chg)
Morgan Stanley Financials Forum - St.George Banking Group, September 2012 19
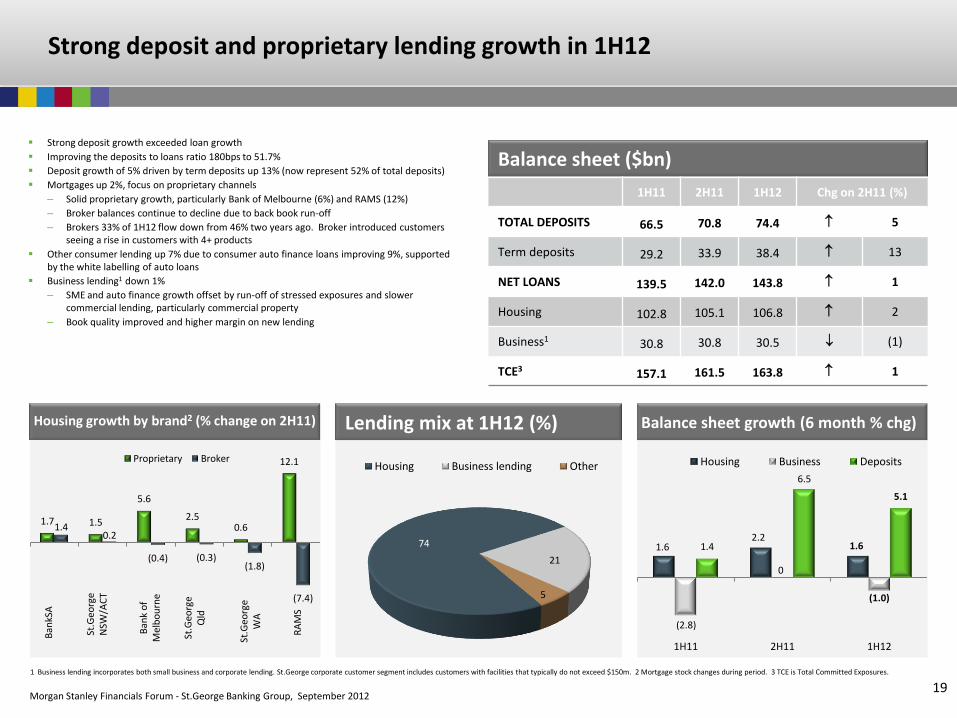
Strong deposit and proprietary lending growth in 1H12
Strong deposit growth exceeded loan growth
Improving the deposits to loans ratio 180bps to 51.7%
Deposit growth of 5% driven by term deposits up 13% (now represent 52% of total deposits)
Mortgages up 2%, focus on proprietary channels
– Solid proprietary growth, particularly Bank of Melbourne (6%) and RAMS (12%)
– Broker balances continue to decline due to back book run-off
– Brokers 33% of 1H12 flow down from 46% two years ago. Broker introduced customers seeing a rise in customers with 4+ products
Other consumer lending up 7% due to consumer auto finance loans improving 9%, supported by the white labelling of auto loans
Business lending1 down 1%
– SME and auto finance growth offset by run-off of stressed exposures and slower commercial lending, particularly commercial property
– Book quality improved and higher margin on new lending
Balance sheet ($bn)
1H11 2H11 1H12 Chg on 2H11 (%)
TOTAL DEPOSITS 66.5 70.8 74.4 5
Term deposits 29.2 33.9 38.4 13
NET LOANS 139.5 142.0 143.8 1
Housing 102.8 105.1 106.8 2
Business1 30.8 30.8 30.5 (1)
TCE3 157.1 161.5 163.8 1
1.6 2.2
1.6
(2.8)
0
(1.0)
1.4
6.5
5.1
1H11 2H11 1H12
Housing Business Deposits
74
21
5
Housing Business lending Other
Balance sheet growth (6 month % chg) Housing growth by brand2 (% change on 2H11) Lending mix at 1H12 (%)
1.7 1.5
5.6
2.5 0.6
12.1
1.4 0.2
(0.4) (0.3) (1.8)
(7.4)
Proprietary Broker
RA
MS
Ban
kSA
St.G
eorg
e Q
ld
Ban
k o
f M
elb
ou
rne
St.G
eorg
e W
A
St.G
eorg
e N
SW/A
CT
1 Business lending incorporates both small business and corporate lending. St.George corporate customer segment includes customers with facilities that typically do not exceed $150m. 2 Mortgage stock changes during period. 3 TCE is Total Committed Exposures.

Morgan Stanley Financials Forum - St.George Banking Group, September 2012 20
Solid risk profile
Asset quality has continued to improve with stressed exposures to TCE1 down 18bps to 329bps. Impaired assets declined the most, down 15bps
Mortgage 90+ days delinquencies were up 7bps to 60bps. Most of the rise was due to the seasoning of the RAMS portfolio. RAMS has more low doc lending so delinquencies are much higher, however, LVRs are lower and mortgage insurance cover is higher
Credit cards 90+ days delinquencies at 155bps up 37bps
Movement in impairment charges were due to
– Increase in CAP and decrease in new IAPs during 1H12 due to lower incidence of new stress and lower downgrades from CAP to impaired
– Consumer impairment charges up $41m with a seasonal rise in delinquencies
– Business impairment charges were down $14m
180
213
9
185 240 (132)
(1) (34)
1H11 2H11 New IAPs
Write- backs
Re- coveries
Write- offs
Changes in CAPs
1H12
0.0
0.5
1.0
1.5
2.0
Sep-08 Mar-09 Sep-09 Mar-10 Sep-10 Mar-11 Sep-11 Mar-12
Credit Cards Mortgages
0
1
2
3
4
5
1H09 2H09 1H10 2H10 1H11 2H11 1H12
Impaired 90+ days past due well secured Watchlist & substandard
Up 13%
Improving risk profile at 1H12 compared to 2H Movement in impairment charges ($m)
90+ days delinquencies (%) Stressed exposures as a % of TCE1
1 TCE is Total Committed Exposure.
Morgan Stanley Financials Forum - St.George Banking Group, September 2012 21
Definitions and Disclaimer
DEFINITIONS:
Wealth Penetration Metrics: Data based on Roy Morgan Research, Respondents aged 14+. Wealth penetration is defined as the number of Australians who have Managed Investments, Superannuation or Insurance with each financial services group (“group”) and who also have a Deposit or Transaction Account, Mortgage, Personal Lending or Major Card with that group as a proportion of the total number of Australians who have a Deposit or Transaction Account, Mortgage, Personal Lending or Major Card with that group. 12 month rolling average to June 2012. WRBB includes Bank of Melbourne (until Jul-11), BT, Challenge Bank, RAMS (until December 2011), Rothschild, and Westpac. St.George includes Advance Bank, Asgard, BankSA, Bank of Melbourne (from Aug-11), Barclays, Dragondirect, Sealcorp, St. George and RAMS (from January 2012).
DISCLAIMER:
The material contained in this presentation is intended to be general background information on Westpac Banking Corporation (Westpac) and its activities.
The information is supplied in summary form and is therefore not necessarily complete. It is not intended that it be relied upon as advice to investors or potential investors, who should consider seeking independent professional advice depending upon their specific investment objectives, financial situation or particular needs. The material contained in this presentation may include information derived from publicly available sources that have not been independently verified. No representation or warranty is made as to the accuracy, completeness or reliability of the information.
All amounts are in Australian dollars unless otherwise indicated.
Unless otherwise noted, financial information in this presentation is presented on a Cash earnings basis. Refer to Westpac First Half 2012 Results (incorporating the requirements of Appendix 4D) for the half year ended 31 March 2012 available at www.westpac.com.au for details of the basis of preparation of Cash earnings.
This presentation contains statements that constitute “forward-looking statements” including within the meaning of Section 21E of the US Securities Exchange Act of 1934. The forward-looking statements include statements regarding our intent, belief or current expectations with respect to our business and operations, market conditions, results of operations and financial condition, including, without limitation, future loan loss provisions, financial support to certain borrowers, indicative drivers, forecasted economic indicators and performance metric outcomes.
We use words such as ‘will’, ‘may’, ‘expect’, 'indicative', ‘intend’, ‘seek’, ‘would’, ‘should’, ‘could’, ‘continue’, ‘plan’, ‘probability’, ‘risk’, ‘forecast’, ‘likely’, ‘estimate’, ‘anticipate’, ‘believe’, or similar words to identify forward-looking statements. These statements reflect our current views with respect to future events and are subject to change, certain risks, uncertainties and assumptions which are, in many instances, beyond our control and have been made based upon management’s expectations and beliefs concerning future developments and their potential effect upon us. Should one or more of the risks or uncertainties materialise, or should underlying assumptions prove incorrect, actual results may vary materially from the expectations described in this presentation. Factors that may impact on the forward-looking statements made include those described in the section entitled ‘Risk factors' in Westpac’s Interim Financial Report for the half year ended 31 March 2012 available at www.westpac.com.au. When relying on forward-looking statements to make decisions with respect to us, investors and others should carefully consider such factors and other uncertainties and events. We are under no obligation, and do not intend, to update any forward-looking statements contained in this presentation.