Embed Size (px)
Citation preview

SCHOOL DISTRICT OF
STERLING HIGH
Sterling High School District Somerdale, New Jersey
Comprehensive Annual Financial Report For the Fiscal Year Ended June 30, 2011

Comprehensive Annual
Financial Report
of the
Sterling High Board of Education
Somerdale, New Jersey
For the Fiscal Year Ended June 30, 2011
Prepared by Sterling High Board of Education
Finance Department

STERLING HIGH SCHOOL DISTRICT
INTRODUCTORY SECTION
Letter of Transmittal Organizational Chart Roster of Officials Consultants and Advisors
Page 2 5 8 9
FINANCIAL SECTION
Independent Auditor's Report 11
K-1 Report on Compliance and on Internal Control Over Financial Reporting Based on an Audit of Financial Statements Performed in Accordance with Government Auditing Standards 13
Required Supplementary Information - Part I Management's Discussion and Analysis 16
Basic Financial Statements
A. District-wide Financial Statements:
A-1 Statement of Net Assets A-2 Statement of Activities
27 28
B. Fund Financial Statements:
Governmental Funds: B-1 Balance Sheet B-2 Statement of Revenues, Expenditures, and Changes in Fund Balances B-3 Reconciliation of the Statement of Revenues, Expenditures, and Changes in
Fund Balances of Governmental Funds to the Statement of Activities
30 31
32
Proprietary Funds: B-4 Statement of Net Assets B-5 Statement of Revenues, Expenses, and Changes in Fund Net Assets B-6 Statement of Cash Flows
33 34 35
Fiduciary Funds: B-7 Statement of Fiduciary Net Assets B-8 Statement of Changes in Fiduciary Net Assets
36 37
Notes to the Financial Statements 38
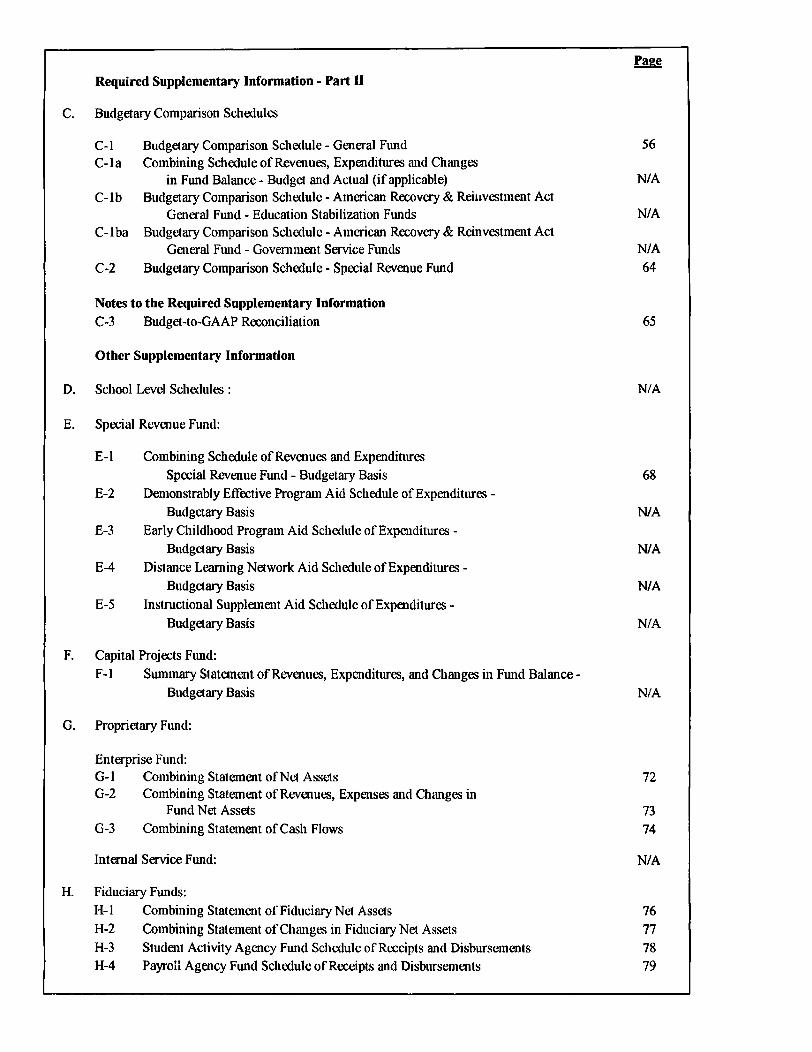
Page Required Supplementary Information - Part II
C. Budgetary Comparison Schedules
C-l Budgetary Comparison Schedule - General Fund 56 C-la Combining Schedule of Revenues, Expenditures and Changes
in Fund Balance - Budget and Actual (if applicable) N/A C-lb Budgetary Comparison Schedule - American Recovery & Reinvestment Act
General Fund - Education Stabilization Funds N/A C-lba Budgetary Comparison Schedule - American Recovery & Reinvestment Act
General Fund - Government Service Funds N/A C-2 Budgetary Comparison Schedule - Special Revenue Fund 64
Notes to the Required Supplementary Information
C-3 Budget-to-GAAP Reconciliation 65
Other Supplementary Information
D. School Level Schedules : N/A
E. Special Revenue Fund:
E-1 Combining Schedule of Revenues and Expenditures Special Revenue Fund - Budgetary Basis 68
E-2 Demonstrably Effective Program Aid Schedule of Expenditures -Budgetary Basis N/A
E-3 Early Childhood Program Aid Schedule of Expenditures -Budgetary Basis N/A
E-4 Distance Learning Network Aid Schedule of Expenditures -Budgetary Basis N/A
E-5 Instructional Supplement Aid Schedule of Expenditures -Budgetary Basis N/A
F. Capital Projects Fund: F-l Summary Statement of Revenues, Expenditures, and Changes in Fund Balance -
Budgetary Basis N/A
G. Proprietary Fund:
Enterprise Fund: G-l Combining Statement of Net Assets 72 G-2 Combining Statement of Revenues, Expenses and Changes in
Fund Net Assets 73 G-3 Combining Statement of Cash Flows 74
Internal Service Fund: N/A
H. Fiduciary Funds: H-l Combining Statement of Fiduciary Net Assets 76 H-2 Combining Statement of Changes in Fiduciary Net Assets 77 H-3 Student Activity Agency Fund Schedule of Receipts and Disbursements 78 H-4 Payroll Agency Fund Schedule of Receipts and Disbursements 79

Page I. Long-Term Debt:
1-1 Schedule of Serial Bonds 81
1-2 Schedule of Obligations under Capital Leases N / A
1-3 Budgetary Comparison Schedule - Debt Service Fund 82
STATISTICAL SECTION (Unaudited)
J - l Net Assets by Component 84
J-2 Changes in Net Assets, Last Four Fiscal Years 85
J-3 Fund Balances, Governmental Funds, Last Four Fiscal Years 87
J-4 Changes in Fund Balances, Governmental Funds, Last Ten Fiscal Years 88
J-5 General Fund - Other Local Revenue by Source, Last Ten Fiscal Years 89
J-6 Assessed Value and Actual Value of Taxable Property, Last Ten Fiscal Years 90
J-7 Direct and Overlapping Property Tax Rates, Last Ten Fiscal Years 91
J-8 Principal Property Tax Payers, Current Year and Nine Years Ago 92
J-9 Property Tax Levies and Collections, Last Ten Fiscal Years 93
J-10 Ratios of Outstanding Debt by Type, Las Ten Fiscal Years 94
J - l l Ratios of Net General Bonded Debt Outstanding, Last Ten Fiscal Years 95
J-12 Ratios of Overlapping Governmental Activities Debt, As of December 31,2010 96
J-13 Legal Debt Margin Information, Last Ten Fiscal Years 97 J-14 Demographic and Economic Statistics 98 J-15 Principal Employers, Current Year & Nine Years Ago (information not available) N / A
J-16 Full-time Equivalent District Employees by Function/Program, Last Ten Fiscal Years 99 J-17 Operating Statistics, Last Ten Fiscal Years 100 J-18 School Building Information, Last Ten Fiscal Years 101 J-19 Schedule of Required Maintenance, Last Six Fiscal Years 102 J-20 Insurance Schedule 103
SINGLE AUDIT SECTION
K-2 Report on Compliance with Requirements Applicable to Each Major Program and on Internal Control Over Compliance in Accordance with O M B Circular A-133 and New Jersey O M B Circular Letter 04-04 105
K-3 Schedule of Expenditures of Federal Awards, Schedule A 107 K-4 Schedule of Expenditures of State Financial Assistance, Schedule B 108 K-5 Notes to the Schedules of Awards and Financial Assistance 109 K-6 Schedule of Findings and Questioned Costs 111 K-7 Summary Schedule of Prior Audit Findings 115

Introductory Section

STERLING HIGH SCHOOL DISTRICT 801 PRESTON AVENUE, SUITE B • SOMERDALE, NEW JERSEY 08083-2149
Phone: 856-784-3545 Fax: 856-784-7823
October 7, 2011
Honorable President and Members of the Board of Education Sterling High School District Somerdale, New Jersey
Dear Board Members:
The comprehensive annual financial report of the Sterling High School District for the fiscal year ended June 30, 2011 is hereby submitted. Responsibility for both the accuracy of the data and completeness and fairness of the presentation, including all disclosures, rests with the management of the Board of Education. To the best of our knowledge and belief, the data presented in this report is accurate in all material respects and is reported in a manner designed to present fairly the financial position and results of operations of the various funds and account groups of the District. All disclosures necessary to enable the reader to gain an understanding of the District's financial activities have been included.
The comprehensive annual financial report is presented in four sections: introductory, financial, statistical and single audit. The introductory section includes this transmittal letter, the District's organizational chart and a list of principal officials. The financial section includes the general purpose financial statements and schedules, as well as the auditor's report thereon. The statistical section includes selected financial and demographic information, generally presented on a multi-year basis. The District is required to undergo an annual single audit in conformity with the provisions of the Single Audit Act of 1984 and as supplemented and amended in 1996, and the U.S. Office of Management and Budget Circular A-133, "Audits of State and Local Governments", and the state Treasury Circular Letter 04-04 OMB, "Single Audit Policy for Recipients of Federal Grants, State Grants and State Aid Payments". Information related to this single audit, including the auditor's report on the internal control structure and compliance with applicable laws and regulations and findings and recommendations are included in the single audit section of this report.
1. REPORTING ENTITY AND ITS SERVICES: Sterling High School District is an independent reporting entity within the criteria adopted by the GASB as established by NCGA Statement No. 3. All funds and account groups of the District are included in this report. The Sterling High School Board of Education and its school constitute the District's reporting entity.
2 Equal Opportunity Employer
Serving the Communities of Hi-Nella, Laurel Springs, Magnolia, Somerdale and Stratford

The District provides the following services: - 9 -12 regular education - Remedial services for at risk students - Special Education programs and related services as indicated in the
Ind. Ed Plan (IEP) and required by N.J.A.C. 6:28 - Transportation services for Vocational and Special Education students - Tuition for the out of district special education students 9 - 1 2 - Pride Program for students in grades 9-12.
2. ECONOMIC CONDITION AND OUTLOOK: The Sterling High School area is experiencing little development in housing and should not have any significant impact on the school. Somerdale built "Low Income" housing in Lion's Head Plaza. This may impact enrollment.
3. BUDGETARY CONTROLS: In addition to internal accounting controls, the District maintains budgetary controls. The objective of these budgetary controls is to ensure compliance with legal provisions embodied in the annual appropriated budget approved by the voters of the municipality. Annual appropriated budgets are adopted for the general fund, the special revenue fund, and the debt service fund. Project-length budgets are approved for the capital improvements accounted for in the capital projects fund. The final budget amount as amended for the fiscal year is reflected in the financial section.
An encumbrance accounting system is used to record outstanding purchase commitments on a line item basis. Open encumbrances at year-end are either canceled or are included as reappropriation of fund balance in the subsequent year. Those amounts to be reappropriated are reported as reservations of fund balance at June 30.
4. ACCOUNTING SYSTEM AND REPORTS: The District's accounting records reflect generally accepted accounting principles, as promulgated by the Governmental Accounting Standards Board (GASB). The accounting system of the District is organized on the basis of funds and account groups. The 2008-09 school year was the first year we used "CSI" budget software. These funds and account groups are explained in "Notes to the Financial Statements", Note 1.
5. CASH MANAGEMENT: The investment policy of the District is guided in large part by state statute. The District has adopted a cash management plan which requires it to deposit public funds in public depositories protected from loss under the provisions of the Governmental Unit Deposit Protection Act ("GUDPA"). GUDPA was enacted in 1970 to protect Governmental Units from a loss of funds on deposit with a failed banking institution in New Jersey. The law requires governmental units to deposit public funds only in public depositories located in New Jersey, where the funds are secured in accordance with the Act.
6. RISK MANAGEMENT: The Board carries various forms of insurance, including but not limited to general liability, automobile liability and comprehensive/collision, hazard and theft insurance on property and contents, student accident insurance, worker's compensation and fidelity bonds. The majority of our insurance is through the School Alliance Insurance Fund, a joint insurance fund.
7. OTHER INFORMATION: Independent Audit - State statutes require an annual audit by independent certified public accountants or registered municipal accountants. The accounting firm of Inverso and Stewart was appointed by the Board during our re-organization meeting. In addition to meeting the requirements set forth in state statutes, the audit also was designed to meet the requirements of the Single Audit Act of 1984 as supplemented and amended in 1996,
3

and the related OMB Circular A-133 and state Treasury Circular Letter 04-04 OMB. The auditor's report on the general purpose financial statements and combining and individual fund statements and schedules is included in the financial section of this report. The auditor's reports related specifically to the single audit are included in the single audit section of this report.
8. ACKNOWLEDGEMENTS: We would like to express our appreciation to the members of the Sterling High School Board of Education for their concern in providing fiscal accountability to the citizens and taxpayers of the school district and thereby contributing their full support to the development and maintenance of our financial operation. The preparation of this report could not have been accomplished without the efficient and dedicated services of our financial and accounting staff.
Respectfully submitted,
Superintendent Board Secretary
WORDIc\AUDIT\CAFRA Letter Oct 11
4

S T E R L I N G HIGH S C H O O L D I S T R I C T - P O L I C Y 1110 DIVISION OF INSTRUCTION ORGANIZATION C H A R T
2010-2011
SUPERINTENDENT'S SECRETARY
DIRECTOR OF CURRICULUM
Curriculum Assessment In-Service Staff Development Scheduling ELL PLC Interdistrict Coordination Renaissance Observations/Eval. Departments
CAC FACS Media Center Specialist Technology Ed.
Lesson Plans Department Budget Curriculum Secretary NCLB Grant Alternative HS Staff
X
PRINCIPAL
Curriculum Staff Development PRIDE School Interdistrict State Reports Grants Substitutes Public Relations Special Programs/Projects Scheduling Observations/Evaluations
PowerSchool Admin. Technology General Office Sec.
Alternative HS Staff
BOARD OF EDUCATION
SUPERINTENDENT
DIRECTOR OF SPECIAL SERVICES
Curriculum IDEA B Grant YST Office Observations/Evaluations
Social Worker LDTC School Psychologist Speech Therapist YST Secretary
VICE PRINCIPAL
Discipline After School Detention Alternative School
Student Activities Publications Attendance Grants Safety Observations/Evaluations
Internal Suspension SAC NJROTC
Alternative HS Staff
ATHLETIC/STUDENT
ACTIVITY DIRECTOR
Observations Nurse P/T Nurse Athletic Trainer Phys Ed./Health Video Tech
GUIDANCE DIRECTOR
Observations/Evaluations Guidance Counselors Guidance Secretaries
Scheduling 8 l h Grade Orientation Homebound Instruction Test Coordination
ASSISTANT CURRICULUM
DIRECTOR (2)
Curriculum In - Service Interdistrict Coordination Observations/Evaluations Lesson Plans Department Budgets Departments
Fine Arts Math Science Social Studies World Languages
BASIC SKILLS COORDINATOR
Departments Business English
Tutoring SRA Data Collection Interdistric t Coordination Lesson Plans Department Budgets
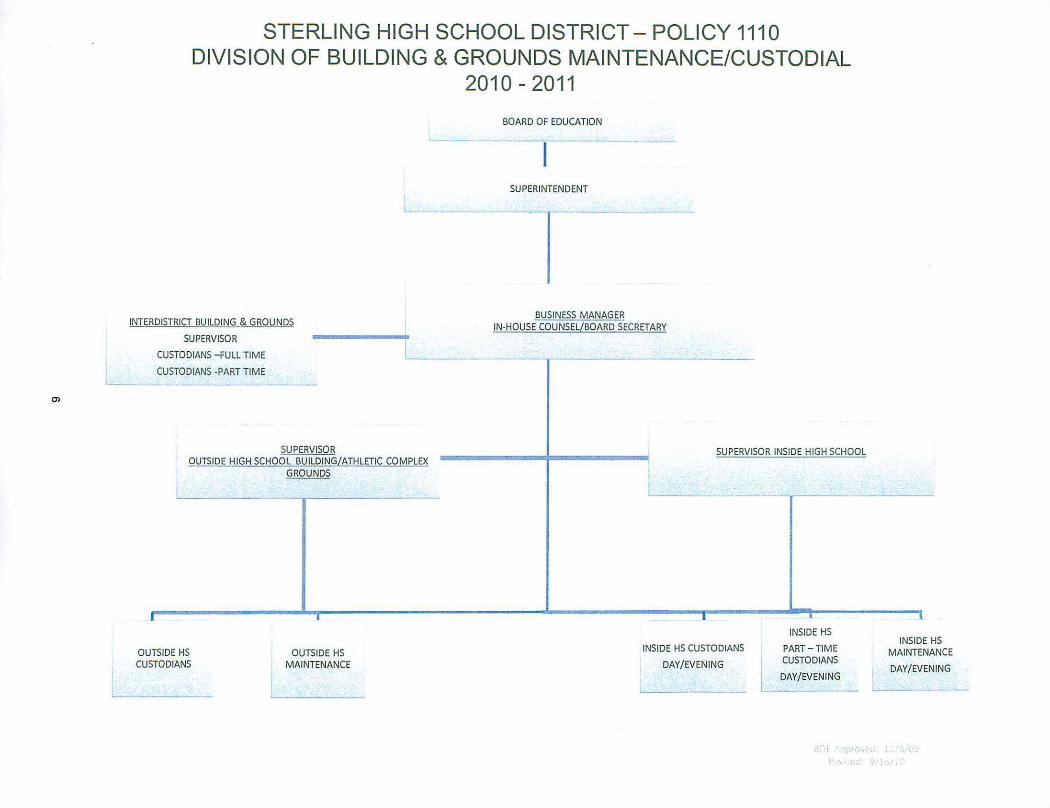
S T E R L I N G HIGH S C H O O L D I S T R I C T - P O L I C Y 1110 DIVISION O F BUILDING & G R O U N D S M A I N T E N A N C E / C U S T O D I A L
2010-2011
BOARD OF EDUCATION
SUPERINTENDENT
INTERDISTRICT BUILDING & GROUNDS
SUPERVISOR
CUSTODIANS -FULL TIME
CUSTODIANS -PART TIME
BUS IN ESj> JV]AJN AG E R -HOUSE COUNSEL/BOARD SECRETARY
SUPERVISOR OUTSIDE HIGH SCHOOL BUILDING/ATHLETIC COMPLEX
GROUNDS
SUPERVISOR INSIDE HIGH SCHOOL
OUTSIDE HS CUSTODIANS
OUTSIDE HS MAINTENANCE
I ..
INSIDE HS CUSTODIANS
DAY/EVENING
INSIDE HS
PART-TIME CUSTODIANS
DAY/EVENING
INSIDE HS MAINTENANCE
DAY/EVENING
iiOf Approved: 12/3/09

S T E R L I N G HIGH S C H O O L D I S T R I C T - P O L I C Y 1110 DIVISION OF S H A R E D S E R V I C E S
2010-2011
BOARD OF EDUCATION
SUPERINTENDENT
LEGAL DIRECTOR OF OPERATIONS FOR SHARED SERVICES
Shared Services Staff
Plumbing Electrical
Custodian Maintenance
AHERA HVAC
Gasoline
TECHNOLOGY DIRECTOR
TECHNOLOGY COORDINATOR
SHARED SERVICES STAFF
Accounts Payable (1)
Human Resources (1)
Payroll (1)
Purchasing (1)
SHARED SERVICES.STAFF
ASSISTANT BUSINESS ADM (3)
BA WOODLYNNE
BAHI-NELLA
BA STERLING HS
TECHNOLOGY SPECIALIST NETWORK ADMIN/TECHNICIAN PROJECT MANAGER
PROJECT COORDINATOR
TELE-DATA TECHNICIAN
HELP DESK ASSISTANT TRAINER
NETWORK TECHNICIAN
DESKTOP SPECIALIST
COMPUTER TECHNICIAN
- • .
Rev ed >/ • iO
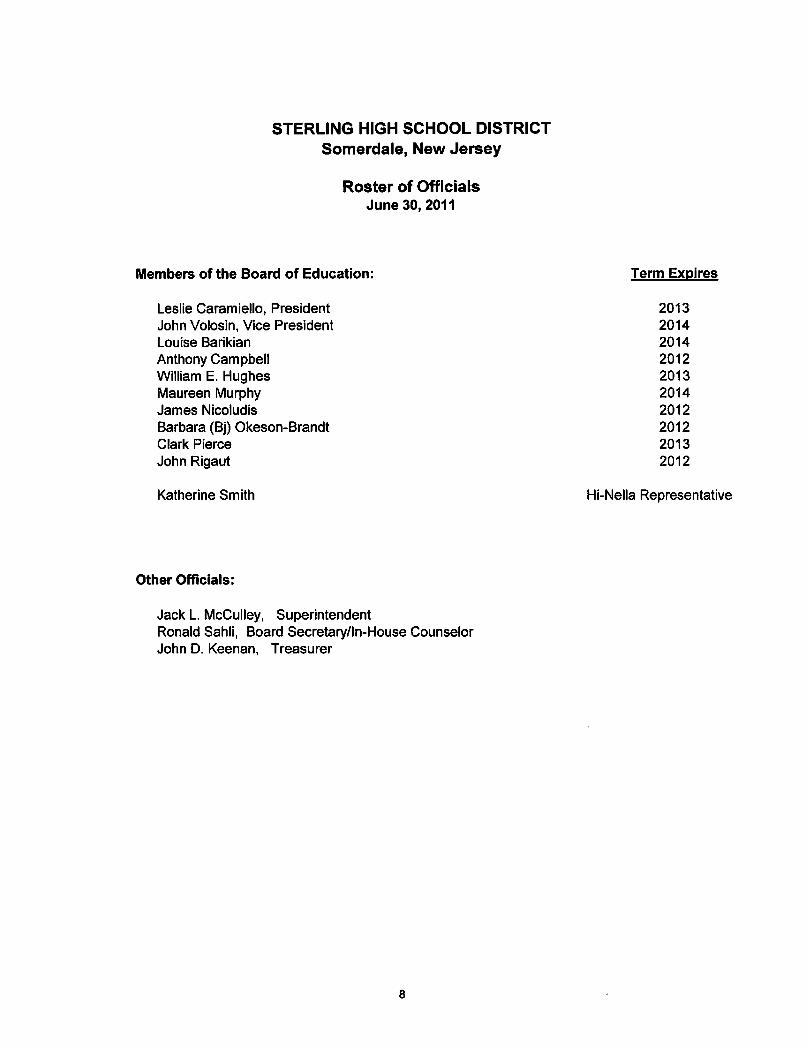
STERLING HIGH SCHOOL DISTRICT Somerdale, New Jersey
Roster of Officials June 30, 2011
Members of the Board of Education: Term Expires
Leslie Caramiello, President 2013 John Volosin, Vice President 2014 Louise Barikian 2014 Anthony Campbell 2012 William E. Hughes 2013 Maureen Murphy 2014 James Nicoludis 2012 Barbara (Bj) Okeson-Brandt 2012 Clark Pierce 2013 John Rigaut 2012
Katherine Smith Hi-Nella Representative
Other Officials:
Jack L. McCulley, Superintendent Ronald Sahli, Board Secretary/In-House Counselor John D. Keenan, Treasurer
8

STERLING HIGH SCHOOL DISTRICT Consultants and Advisors
Audit Firm
Inverso & Stewart, LLC
12000 Lincoln Drive West, Suite 402
Marlton, NJ 08053
Official Depository
Beneficial Bank
530 Walnut Street
Philadelphia, PA 19106

Financial Section

INVERSO & STEWART, LLC
Certified Public Accountants Registered Municipal Accountants
12000 Lincoln Drive West, Suite 402 Marlton, New Jersey 08053 (856) 983-2244 Fax (856) 983-6674 E-Mail: Iscpasflfcconcentricnet
-Member of-American Institute of CPAs New Jersey Society of CPAs
INDEPENDENT AUDITOR'S REPORT
The Honorable President and Members of the Board of Education
Sterling High School District County of Camden Somerdale, New Jersey
We have audited the accompanying financial statements of the governmental activities, the business-type activities, each major fund and the aggregate remaining fund information of the Sterling High School District, in the County of Camden, State of New Jersey (School District), as of and for the fiscal year ended June 30, 2011, which collectively comprise the School District's basic financial statements as listed in the table of contents. These financial statements are the responsibility of the School District's management. Our responsibility is to express opinions on these financial statements based on our audit.
We conducted our audit in accordance with auditing standards generally accepted in the United States of America; the standards applicable to financial audits contained in Government Auditing Standards, issued by the Comptroller General of the United States; and in compliance with audit requirements as prescribed by the Division of Finance, Department of Education, State of New Jersey. Those standards require that we plan and perform the audit to obtain reasonable assurance about whether the financial statements are free of material misstatement. An audit includes examining, on a test basis, evidence supporting the amounts and disclosures in the financial statements. An audit also includes assessing the accounting principles used and significant estimates made by management, as well as evaluating the overall financial statement presentation. We believe that our audit provides a reasonable basis for our opinions.
In our opinion, the financial statements referred to above present fairly, in all material respects, the respective financial position of the governmental activities, business-type activities, each major fund and the aggregate remaining fund information of the Sterling High School District, in the County of Camden, State of New Jersey, as of June 30, 2011, and the respective changes in financial position, and cash flows, where applicable, thereof for the fiscal year then ended in conformity with accounting principles generally accepted in the United States of America.
In accordance with Government Auditing Standards, we have also issued our report dated October 7, 2011 on our consideration of the Sterling High School District, in the County of Camden, State of New Jersey's internal control over financial reporting and our tests of its compliance with certain provisions of laws, regulations, contracts and grant agreements and other matters. The purpose of that report is to describe the scope of our testing of internal control over financial reporting and compliance and the results of that testing, and not to provide an opinion on the internal control over financial reporting or on compliance. That report is an integral part of an audit performed in accordance with Government Auditing Standards and should be considered in assessing the results of our audit.
Accounting principles generally accepted in the United States of America require that the management's discussion and analysis and budgetary comparison information, as listed in the table of contents, be presented to supplement the basic financial statements. Such information, although not a part of the basic financial statements, is required by Governmental Accounting Standards Board, who considers it to be an essential part of financial reporting for placing the basic financial statements in an appropriate operational, economic, or historical context. We have applied certain limited procedures to the required supplementary information in accordance with auditing standards generally accepted in the United States of America, which consisted of inquiries of management about the methods of preparing the information and comparing the information for consistency with management's responses to our inquiries, the basic financial statements, and other knowledge we obtained during our audit of the basic financial statements. We do not express an opinion or provide any assurance on the information because the limited procedures do not provide us with sufficient evidence to express an opinion or provide any assurance.
11

Our audit was conducted for the purpose of forming opinions on the financial statements that collectively comprise the Sterling High School District's financial statements as a whole. The introductory section, combining and individual nonmajor fund financial statements, and statistical section, are presented for purposes of additional analysis and are not a required part of the financial statements. The accompanying schedule of expenditures of federal awards and state financial assistance are presented for purposes of additional analysis as required by U.S. Office of Management and Budget Circular A-133, Audits of States, Local Governments, and Non-Profit Organizations and New Jersey OMB's Circular 04-04, Single Audit Policy for Recipients of Federal Grants, State Grants and State Aid, and are also not a required part of the financial statements. The combining and individual nonmajor fund financial statements and the schedule of expenditures of federal awards and state financial assistance are the responsibility of management and were derived from and relate directly to the underlying accounting and other records used to prepare the financial statements. The information has been subjected to the auditing procedures applied in the audit of the financial statements and certain additional procedures, including comparing and reconciling such information directly to the underlying accounting and other records used to prepare the financial statements or to the financial statements themselves, and other additional procedures in accordance with auditing standards generally accepted in the United States of America. In our opinion, the information is fairly stated in all material respects in relation to the financial statements as a whole. The introductory and statistical sections have not been subjected to the auditing procedures applied in the audit of the basic financial statements and, accordingly, we do not express an opinion or provide any assurance on them.
Respectfully submitted,
INVERSO & STEWART, LLC Certified Public Accountants
Robert A. Stewart Certified Public Accountant Registered Municipal Accountant
Marlton, New Jersey October 7, 2011
12
1NVERSO & STEWART, LLC
Certified Public Accountants Registered Municipal Accountants
12000 Lincoln Drive West, Suite 402 Marlton, New Jersey 08053 (856) 983-2244 Fax (856) 983-6674 E-Mail: lscpasfg),concentric.net
-Member of-Anterican Institute of CPAs New Jersey Society of CPAs
REPORT ON INTERNAL CONTROL OVER FINANCIAL REPORTING AND ON COMPLIANCE AND OTHER MATTERS BASED ON AN AUDIT OF
FINANCIAL STATEMENTS PERFORMED IN ACCORDANCE WITH GOVERNMENT AUDITING STANDARDS
The Honorable President and Members of the Board of Education
Sterling High School District County of Camden Somerdale, New Jersey
We have audited the financial statements of the governmental activities, the business-type activities, each major fund and the aggregate remaining fund information of the Sterling High School District, in the County of Camden, State of New Jersey, as of and for the fiscal year ended June 30, 2011, which collectively comprise the School District's basic financial statements and have issued our report thereon dated October 7, 2011. We conducted our audit in accordance with auditing standards generally accepted in the United States of America; the standards applicable to financial audits contained in Government Auditing Standards, issued by the Comptroller General of the United States; and in compliance with audit requirements as prescribed by the Division of Finance, Department of Education, State of New Jersey.
Internal Control Over Financial Reporting
In planning and performing our audit, we considered the Sterling High School District's internal control over financial reporting as a basis for designing our auditing procedures for the purpose of expressing our opinions on the financial statements, but not for the purpose of expressing an opinion on the effectiveness of the School District's internal control over financial reporting. Accordingly, we do not express an opinion on the effectiveness of the School District's internal control over financial reporting.
A deficiency in internal control exists when the design or operation of a control does not allow management or employees, in the normal course of performing their assigned functions, to prevent, or detect and correct misstatements on a timely basis. A material weakness is a deficiency, or combination of deficiencies, in internal control, such that there is a reasonable possibility that a material misstatement of the School District's financial statements will not be prevented, or detected and corrected on a timely basis.
Our consideration of internal control over financial reporting was for the limited purpose described in the first paragraph of this section and was not designed to identify all deficiencies in internal control over financial reporting that might be deficiencies, significant deficiencies or material weaknesses. We did not identify any deficiencies in internal control over financial reporting that we consider to be material weaknesses, as defined above.
Compliance and Other Matters
As part of obtaining reasonable assurance about whether the Sterling High School District's financial statements are free of material misstatement, we performed tests of its compliance with certain provisions of laws, regulations, contracts and grant agreements, noncompliance with which could have a direct and material effect on the determination of financial statement amounts. However, providing an opinion on compliance with those provisions was not an objective of our audit and, accordingly, we do not express such an opinion. The results of our tests disclosed no instances of noncompliance or other matters that are required to be reported under Government Auditing Standards and audit requirements as prescribed by the Division of Finance, Department of Education, State of New Jersey.
13

We noted certain matters that we reported to management of the Sterling High School District in a separate report entitled, Auditors Management Report on Administrative Findings - Financial, Compliance and Performance dated October 7,2011.
This report is intended solely for the information and use of the management, the Board of Education, others within the School District, the Division of Finance, Department of Education, State of New Jersey, and other federal awarding agencies and is not intended to be and should not be used by anyone other than these specified parties.
Respectfully submitted,
INVERSO & STEWART, LLC Certified Public Accountants
Robert A. Stewart Certified Public Accountant Registered Municipal Accountant
Marlton, New Jersey October 7, 2011
14

Required Supplementary Information - Part I
Management's Discussion and Analysis

Sterling High School District Management's Discussion and Analysis For the Fiscal Year Ended June 30, 2011
As management of the Board of Education of the Sterling High School District, New Jersey (School District), we offer readers of the School District's financial statements this narrative overview and analysis of the School District for the fiscal year ended June 30, 2011. We encourage readers to consider the information presented in conjunction with additional information that we have furnished in our letter of transmittal, which can be found in the introductory section of this report.
Financial Highlights
• The assets of the School District exceeded its liabilities at the close of the most recent fiscal year by $8,061,215 (net assets).
• Governmental activities have an unrestricted net assets deficit of $420,339. The accounting treatments in the governmental funds for compensated absences payable, accrued interest payable and the June state aid payments, and state statutes that prohibit school districts from maintaining more than 2% of its adopted budget as unrestricted fund balance are primarily responsible for this deficit balance.
• The total net assets of the School District increased by $2,150,423, or an 36.4% increase from the prior fiscal year-end balance. The majority of the increase is attributable to the repayment of long-term debt obligations in the amount of $490,000 and the profit generated in the South Jersey Technology Program in the amount of $1,517,834.
• Fund balance of the School District's governmental funds increased by $386,752 resulting in an ending fund balance of $687,694. This was mostly attributable to the school district only spending 96.47% of its operating budget.
• Business-type activities have unrestricted net assets of $1,382,648. The primary reason is the success that the South Jersey Technology Program has accomplished during the past year.
• The School District's long-term obligations decreased by $490,000 which is the result of current year payments on existing debt obligations.
16

Overview of the Basic Financial Statements
This discussion and analysis is intended to serve as an introduction to the School District's basic financial statements. Comparison to the prior year's activity is provided in this document. The basic financial statements are comprised of three components: 1) District-wide financial statements, 2) Fund financial statements, and 3) Notes to the basic financial statements. This report also contains other supplementary information in addition to the basic financial statements themselves.
District-wide Financial Statements
The district-wide financial statements are designed to provide the reader with a broad overview of the financial activities in a manner similar to a private-sector business. The district-wide financial statements include the statement of net assets and the statement of activities.
The statement of net assets presents information about all of the School District's assets and liabilities. The difference between the assets and liabilities is reported as net assets. Over time, changes in net assets may serve as a useful indicator of whether the financial position of the School District is improving or deteriorating.
The statement of activities presents information showing how the net assets of the School District changed during the current fiscal year. Changes in net assets are recorded in the statement of activities when the underlying event occurs, regardless of the timing of related cash flows. Thus, revenues and expenses are reported in this statement even though the resulting cash flows may be recorded in a future period.
Both of the district-wide financial statements distinguish functions of the School District that are supported from taxes and intergovernmental revenues (governmental activities) and other functions that are intended to recover all or most of their costs from user fees and charges (business-type activities). Governmental activities consolidate governmental funds including the General Fund, Special Revenue Fund, Capital Projects Fund, and Debt Service Fund. Business-type activities reflect the operations of the South Jersey Technology Program and the Food Service Fund.
Fund Financial Statements
Fund financial statements are designed to demonstrate compliance with finance-related requirements. A fund is a grouping of related accounts that is used to maintain control over resources that have been segregated for specific objectives. All of the funds of the School District are divided into three categories: governmental funds, proprietary funds and fiduciary funds.
Governmental funds account for essentially the same information reported in the governmental activities of the district-wide financial statements. However, unlike the district-wide financial statements, the governmental fund financial statements focus on near-term financial resources and fund balances. Such information may be useful in evaluating the financing requirements in the near term.
Since the governmental funds and the governmental activities report information using the same functions, it is useful to compare the information presented. Because the
17

focus of each report differs, a reconciliation is provided on the fund financial statements to assist the reader in comparing the near-term requirements with the long-term needs.
The School District maintains four individual governmental funds. The major funds are the General Fund, the Special Revenue Fund, the Capital Projects Fund, and the Debt Service Fund. They are presented separately in the fund financial statements.
The School District adopts an annual appropriated budget for the General Fund, Special Revenue Fund and the Debt Service Fund. A budgetary comparison statement has been provided for each of these funds to demonstrate compliance with budgetary requirements.
Proprietary funds are used to present the same functions as the business-type activities presented in the district-wide financial statements. The School District maintains one type of proprietary fund - the Enterprise Fund. The fund financial statements of the enterprise fund provides the same information as the district-wide financial statements, only in more detail.
The School District's two enterprise funds (South Jersey Technology Program and Food Service Fund) are listed individually and are considered to be major funds.
Fiduciary funds are used to account for resources held for the benefit of parties outside the government. Fiduciary funds are not reflected in the district-wide financial statements because the resources of those funds are not available to support the School District's programs.
Notes to the Basic Financial Statements
The notes to the basic financial statements provide additional information that is essential to a full understanding of the data provided in the basic financial statements.
Other Information
In addition to the basic financial statements and accompanying notes, this report also contains other supplementary information and schedules required by the New Jersey Audit Program, issued by the New Jersey Department of Education.
District-wide Financial Analysis
The assets of the School District are classified as current assets and capital assets. Cash, investments, receivables, inventories and prepaid expenses are current assets. These assets are available to provide resources for the near-term operations of the School District. The majority of the current assets are the results of the tax levy and state aid collection process.
Capital assets are used in the operations of the School District. These assets are land, buildings, improvements, equipment and vehicles. Capital assets are discussed in greater detail in the section titled, Capital Assets and Debt Administration, elsewhere in this analysis.
18

Current and long-term liabilities are classified based on anticipated liquidation either in the near-term or in the future. Current liabilities include accounts payable, accrued salaries and benefits, unearned revenues, and current debt obligations. The liquidation of current liabilities is anticipated to be either from currently available resources, current assets or new resources that become available during fiscal year 2011. Long-term liabilities such as long-term debt obligations and compensated absences payable will be liquidated from resources that will become available after fiscal year 2011.
The assets of the primary government activities exceeded liabilities by $5,114,198 with an unrestricted deficit balance of $420,339. As mentioned earlier, the deficit unrestricted net assets are primarily due to the accounting treatment for compensated absences payable and the June state aid payments, and state statutes that prohibit school districts from maintaining more than 2% of its adopted budget as unrestricted fund balance.
The net assets of the primary government do not include internal balances.
A net investment of $6,161,551 in land, improvements, buildings, equipment and vehicles which provide the services to the School District's 997 public school students, represents 76.4% of the School District's net assets. Net assets of $937,355 have been restricted as follows:
Reserved for future debt service payments $ 45,341 Reserved for encumbrances 222,008 Designated for the 2011/12 budget 207,706 Future capital projects 393,665 Excess surplus for 2012/13 budget 69,635
Comparative Summary of Net Assets As of June 30, 2011 and 2010
Governmental Activities Business-Type Activities District-Wide
2011 2010 2011 2010 2011 2010 Assets: Current assets Capital assets
$ 735,909 8,407,182
$ 1,084,518 8,672,279
$ 3,326,623 1,564,369
$ 1,232,300 1.497,196
$ 4.062,532 9,971,551
$ 2,316,818 10,169,475
Total assets 9,143,091 9,756,797 4,890,992 2,729,496 14,034,083 12.486,293 Liabilities: Current Liabilities Noncurrent Liabilities
499,970 3,528,923
1,235,938 4,030,800
1,943,975 1.308,763 2,443,945 3,528,923
2,544.701 4,030,800
Total liabilities 4,028,893 5,266,738 1,943,975 1,308,763 5,972,868 6,575,501
Net assets $5,114,198 $ 4,490,059 $2,947,017 $ 1,420,733 $8,061,215 $ 5.910.792
19

Net assets consist of: Invested in capital
Assets Restricted net assets Unrestricted net assets
Net assets
Sterling High School District Comparative Summary of Net Assets
As of June 30, 2011 and 2010
Governmental Activities
2011
$4,597,182 937,355
(420,339)
$5,114,198
2010
$ 4,372,279 483,477
(365,697)
Business-Type Activities
2011
$1,564,369
1,382,648
$ 4,490,059 $ 2,947,017
2010
$ 1,497,197
(76,464)
$ 1,420,733
District-Wide
2011
$6,161,551 937,355 962,309
$8,061,215
2010
$ 5,869,476 483,477
(442,161)
$5,910,792
Revenues: Program Revenues Charges for services Operating grants and
Contributions General Revenues:
Property Taxes Unrestricted State Aid Tuition Other Revenues
Comparative Schedule of Changes in Net Assets As of and for the Fiscal Year Ended June 30, 2011 and 2010
Governmental Activities
2011
$ 1,714,090
7,324,945 5,703,484 1,765,260
12,328
2010
$ 1,802,672
7,208,851 6,018,342 1,950,676
24,726
Business-Type Activities
2011
$ 14,316,006
117,755
439
2010
$ 12,211,621
108,852
802
District-Wide
2011
$ 14,316.006
1,831.845
7.324.945 5.703,484 1,765,260
12,767
2010
$ 12.211.621
1,911.524
7.208,851 6,018.342 1,950,676
25,528
Total Revenues 16.520.107 17.005,267 14,434,200 12.321.275 30.954,307 29.326.542
20

Comparative Schedule of Changes in Net Assets As of and for the Fiscal Year Ended June 30, 2011 and 2010
Governmental Activities Business-Type Activities District -Wide
2011 2010 2011 2010 2011 2010
Expenses: Governmental Activities: Instruction $ 6,802,021 $ 7,156,067 $ 6,802,021 S 7,156,067
Tuition 327,766 743,065 327,766 743,065 Related Services 1,444,185 1.755.987 1.444.185 1,755,987
Administrative Services 1,264,006 1,219,231 1,264,006 1,219,231
Operations and Maintenance 1,686,656 1,716.252 1,686,656 1,716,252
Transportation 323,660 366,486 323,660 366.486 Unallocated benefits 3,528,597 3,409,339 3,528,597 3.409,339 Interest on long-term
Debt 197,605 216,880 197,605 216,880 Other 321.472 73,594 321,472 73.594
Business-Type Activities: Food Sen/ice $ 342,458 $ 322,495 342.458 322,495 SJ Technology Service Program 12,565,458 11,726.398 12.565,458 11.726.398
Total Expenses 15,895,968 16,656,901 12,907,916 12,048.893 28,803,884 23.690.562 Increase in net assets Before transfers 624.139 348,366 1,526,284 272,382 2,150,423 620.748
Transfers (188,853) 188,853 Changes in net assets 624,139 159,513 1,526.284 461,235 2,150,423 620,748 Prior Year Adjustment Net assets, July 1, 4,490,059 4,330,546 1,420,733 959,498 5,910,792 5.290,044 Net assets, June 30, $ 5.114,198 $ 4.490,059 $ 2.947,017 $ 1,420,733 $ 8,061,215 $ 5,910,792
Governmental Activities
Governmental activities increased the net assets of the School District by $624,139 during the current fiscal year, thereby accounting for some of the total increase in the net assets of the School District. Key elements of the increase in net assets for governmental activities are as follows:
• Total governmental activities expenses decreased $760,933 while revenues only decreased by $485,160.
21

Business-type Activities
Business-type activities increased the School District's net assets by $1,526,284. The majority of this increase came from the South Jersey Technology Program showing a net profit of $1,517,834, while the Food Services Fund shows a net profit of $8,450.
Financial Analysis of the Governmental Funds
As noted earlier, the School District uses fund accounting to ensure and demonstrate compliance with finance-related legal requirements.
Governmental Funds - The focus of the School District's governmental funds is to provide information on near-term inflows, outflows, and balances of spendable resources. Such information is useful in assessing the School District's financing requirements. In particular, unreserved fund balance may serve as a useful measure of a government's net resources available for spending at the end of the fiscal year.
As of the end of the current fiscal year, the School District's governmental funds reported a combined ending fund balance of $687,694, an increase of $386,752 in comparison with the prior year. The increase can be attributed to the school district only spending 96.47% of its budget.
The unassigned deficit fund balance for the School District at the end of the fiscal year in the General Fund is $249,661. The remainder of the fund balance is restricted to indicate that it is not available for new spending because it has already been committed: 1) restricted cash reserved for future capital outlay expenditures ($393,665), 2) appropriated as a revenue source in the subsequent year's budget ($206,706), 3) reserved for future debt service appropriation in accordance with state statutes ($45,341), 4) reserved for appropriation in the 2012/2013 budget ($69,635) and 5) reserved for year-end encumbrances ($222,008).
The general fund is the chief operating fund of the School District. As discussed earlier, the balance in the unassigned fund balance is due, primarily, to the accounting treatment of the June state aid payments as discussed in the notes to the basic financial statements, and state statutes that prohibit New Jersey school districts from maintaining more than 2% of its adopted budget as unrestricted fund balance.
Revenue is generally recognized at the time that the outlays are identified; therefore no fund balances are normally generated in the special revenue fund.
General Fund Budgetary Highlights
The difference between the original budget and the final amended budget is $331,160 and represents prior year encumbrances rolled over into the current year budget.
22

At the end of the current fiscal year, unassigned fund balance (budgetary basis) of the general fund was $279,807, while total fund balance (budgetary basis) was $1,163,707. As a measure of the general fund's liquidity, it may be useful to compare both unassigned fund balance (budgetary basis) and total fund balance (budgetary basis) to total general fund expenditures. Actual (budgetary basis) expenditures of the General Fund including other financing uses amounted to $14,939,713. Unassigned fund balance (budgetary basis) represents 1.87% of expenditures while total fund balance (budgetary basis) represents 7.78% of that same amount.
Capital Asset and Debt Administration
The School District's investment in capital assets for its governmental and business-type activities as of June 30, 2011, totaled $9,971,551 (net of accumulated depreciation). This investment in capital assets includes land, improvements, buildings, equipment and vehicles. The total decrease in the District's investment in capital assets for the current fiscal year was $197,924, or a 1.94% decrease. The decrease is the net of capital assets purchased ($327,095) minus current year depreciation expense ($525,019).
Capital Asset (net of accumulated depreciation) June 30, 2011 and 2010
Governmental Activities Business-Type Activities District-Wide
2011 2010 2011 2010 2011 2010
Land $ 322,480 $ 322,480 $ 322.480 $ 322,480 Site Improvements 322,908 354.133 322,908 354,133 Buildings and Building
Improvements 7,286,684 7,575,796 7,286.684 7,575,796 Equipment 446,588 382,562 $1,564,369 $1,497,196 2,010,957 1,879,758 Vehicles 28.522 37.308 28,522 37,308
Net assets $8,407,182 $ 8,672,279 $1,564,369 $1,497,196 $9,971,551 $ 10,169,475
Additional information on the School District's capital assets can be found in the notes to the basic financial statements (Note 5) of this report.
Long-term debt - During the fiscal year ended June 30, 2011, the School District had total bonded debt outstanding of $3,810,000 backed by the full faith and credit of the School District.
General obligation bonds for the School District decreased during the current fiscal year according to the normal schedule of payments.
The School District continues to maintain its AA rating from Standard & Poor's Corporation for its general obligation bond issues.
23

State statutes limit the amount of general obligation debt that the District may issue. At the end of the current fiscal year, the legal debt limit was $45,956,773 and the legal debt margin was $42,146,773.
Additional information on the School District's long-term obligations can be found in the notes to the basic financial statements (Note 7) of this report.
Economic Factors and Next Year's Budgets and Rates
The Sterling High School area has been economically stable the last few years. Below are some economic factors being considered during our budget preparation:
• Without additional state aid or a new funding formula, taxes will continue to rise in order to cover the anticipated increases in salaries and health benefits. Salaries and benefits comprise the majority of our operating budget. Our budget will increase due to the anticipated increases in these areas.
• SJTP will be providing revenue in next year's budget.
• New educational choice school programs are being considered.
• The Sterling Board of Education and district administration are committed to work within the boundary of the rules and regulations to provide a quality education to the residents of Hi-Nella, Laurel Springs, Magnolia, Somerdale and Stratford. Our standard operating procedures and our internal controls will ensure continual success in today's economic environment.
Requests for Information
This financial report is designed to provide a general overview of the School District's finances for all those with an interest in the School District. Questions concerning any of the information provided in this report or requests for additional financial information should be addressed to the Sterling High School District Business Administrator, 501 S. Warwick Road, Somerdale, New Jersey, 08083, telephone number (856) 784-3545.
24

Basic Financial Statements

District-Wide Financial Statements

A-1 STERLING HIGH SCHOOL DISTRICT
Statement of Net Assets June 30, 2011
Governmental Activities
Business-Type Activities Total
ASSETS: Cash and cash equivalents Receivables, net Internal balances Restricted assets:
Cash and cash equivalents Inventory Deferred bond issuance costs Capital assets, net (Note 5)
net
100,225 227,085 (14,959)
375,343
48,215 8.407.182
120,136 3,187,614
14,959
3,914
1.564.369
220,361 3,414,699
375,343 3,914
48,215 9.971,551
Total Assets 9,143,091 4,890,992 14,034,083
LIABILITIES: Accounts payable Accrued interest payable Noncurrent liabilities (Note 7):
Due within one year Due beyond one year
1,943,975 14,970
485,000 3,528,923
1,943,975 14,970
485,000
Total Liabilities 4,028,893 1,943,975 5,972.868
NET ASSETS: Invested in capital assets, net of related debt 4,597,182 1,564,369 6,161,551 Restricted for:
Capital projects 393,665 393,665 Debt service 45,341 45,341 Other purposes 498,349 498,349
Unrestricted (420.339) 1.382.648 962,309
Total Net Assets $ 5,114,198 $ 2.947.017 $ 8,061.215
The accompanying Notes to the Basic Financial Statements are an integral part of this statement.
27

A-2
STERLING HIGH SCHOOL DISTRICT Statement of Activities
For the Fiscal Year Ended June 30,2011
Net (Expense) Revenue and Program Revenues Changes In Net Assets
Operating Capital Charges for Grants and Grants and Governmental Business-Type
Functions/Programs Expenses Services Contributions Contributions Activities Activities Total
Governmental activities: Instruction:
Regular $ 5,204,519 $ 465,241 $ (4,739,278) $ (4,739,278) Special Education 875,215 (875,215) (875,215) Other instruction 722,287 (722,287) (722.287)
Support Services: Tuition 327,766 (327,766) (327.766) Student & instruction related services 1,444,185 33,231 (1.410.954) (1,410.954) General administrative services 501,010 (501.010) (501.010) School administrative services 359,959 (359,959) (359.959) Central services 403,037 (403,037) (403,037) Plant operations and maintenance 1,686,656 (1.686,656) (1,686,656) Pupil transportation 323,660 (323,660) (323,660) Unallocated employee benefits 3,528,597 949.388 (2,579,209) (2,579,209)
Interest on long-term debt 197,605 266,230 68,625 68.625 Unallocated depreciation and amortization 321,472 (321.472) (321.472)
Total governmental activities 15.895.968 1.714,090 (14.181,878) (14,181,878)
Business-Type Activities: South Jersey Technology Program 12,565.458 $ 14.083,292 $ 1.517.834 1.517,834 Food Service 342.458 232.714 117.755 8.011 8,011 Total Business-Type Activities 12,907,916 14.316.006 117.755 1.525.845 1.525.845
Total primary government S 28.803.884 $ 14.316.006 S 1.831.845 $ (14.181,878) 1.525.845 (12,656.033) Total primary government
General Revenues: Taxes:
Property taxes, levied for general purposes, net 6.901,937 6.901.937 Taxes levied for debt service 423.008 423.008
Federal and State aid not restricted 5.703,484 5,703.484 Tuition received 1.765,260 1.765.260 Investment Earnings 73 439 512 Miscellaneous Income 12,255 12.255 Transfer
Total general revenues, special items, extraordinary items and transfers 14,806.017 439 14,806.456 Change in Net Assets 624.139 1,526.284 2.150.423
Net Assets - June 30,2010 4,490,059 1,420,733 5.910.792 Net Assets - June 30, 2011 $ 5.114.198 $ 2.947.017 8.061.215
The accompanying Notes to the Basic Financial Statements are an integral part of this statement.

Fund Financial Statements
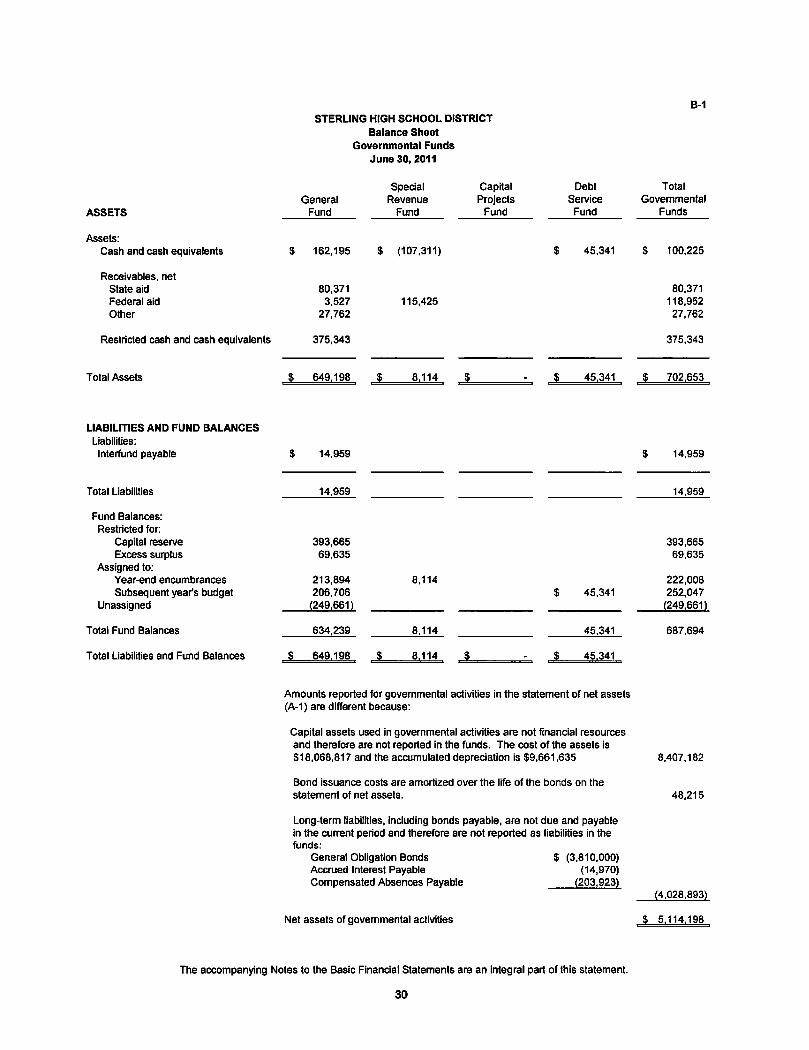
B-1 STERLING HIGH SCHOOL DISTRICT
Balance Sheet Governmental Funds
June 30,2011
General ASSETS Fund
Receivables, net State aid 80,371 Federal aid 3,527 Other 27,762
Restricted cash and cash equivalents 375,343
LIABILITIES AND FUND BALANCES Liabilities: Interfund payable $ 14,959
Total Liabilities 14.959
Fund Balances: Restricted for:
Capital reserve 393,665 Excess surplus 69,635
Assigned to: Year-end encumbrances 213,894 Subsequent year's budget 206,706
Unassigned (249,661)
Total Fund Balances 634,239
Special Capital Debt Total Revenue Projects Service Governmental
Fund Fund Fund Funds
$ 45,341 $ 100,225
80,371 115,425 118,952
27.762
375.343
$ 45.341 $ 702.653
$ 14,959
14.959
393,665 69.635
8.114 222.008 $ 45.341 252,047
(249.661)
8.114 45.341 687.694
Assets: Cash and cash equivalents $ 162,195 $ (107,311)
Total Assets $ 649.198 $ 8.114
Total Liabilities and Fund Balances S 649.198 $ 8.114 $ S 45.341
Amounts reported for governmental activities in the statement of net assets (A-1) are different because:
Capital assets used in governmental activities are not financial resources and therefore are not reported in the funds. The cost of the assets is 318,068,817 and the accumulated depreciation is $9,661,635 8,407,182
Bond issuance costs are amortized over the life of the bonds on the statement of net assets. 48,215
Long-term liabilities, including bonds payable, are not due and payable in the current period and therefore are not reported as liabilities in the funds:
General Obligation Bonds $ (3,810,000) Accrued Interest Payable (14,970) Compensated Absences Payable (203,923)
(4.028.893)
Net assets of governmental activities $ 5.114,198
The accompanying Notes to the Basic Financial Statements are an integral part of this statement.
30

B-2 STERLING HIGH SCHOOL DISTRICT
Statement of Revenues, Expenditures and Changes in Fund Balances Governmental Funds
For the Fiscal Year Ended June 30, 2011
General Fund
Special Revenue
Fund
Capital Projects
Fund
Debt Service Fund
Total Governmental
Funds REVENUES: Local sources: Local tax levy Tuition Interest earned on capital reserve Miscellaneous
$ 6,901,937 1,765,260
73 12,255
$ 423,008 $ 7,324,945 1.765,260
73 12,255
Total local sources 8,679,525 423,008 9,102,533
State sources Federal sources
6,429,301 223,571 $ 498,472
266,230 6,695,531 722,043
Total Revenues 15,332,397 498,472 689,238 16,520,107
EXPENDITURES: Current expense:
Regular instruction 4,679,020 471,173 5,150.193 Special education instruction 875,215 875.215 Other instruction 722,287 722,287 Support services and undistributed costs: Tuition 327,766 327,766 Student & instruction related services 1,410,954 33,231 1,444,185 General administrative services 481,650 481,650 School administrative services 359,959 359,959 Central sen/ices 403,037 403,037 Plant operations and maintenance 1,599,400 1.599.400 Pupil transportation 323,660 323.660 Unallocated employee benefits 3,528,597 3,528.597
Capital outlay 228,168 228,168 Debt service:
Principal 490,000 490,000 Interest and other charges 199,238 199,238
Total Expenditures 14,939,713 504,404 689,238 16,133,355
Excess (deficiency) of revenues over (under) expenditures 392,684 (5.932) 386,752
Other Financing Sources (Uses): Transfer in Transfers out
Total Other Financing Sources (Uses)
Net Change in Fund Balance 392,684 (5,932) 386,752 Fund Balance-July 1,2010 241.555 14.046 45.341 300.942
Fund Balance-June 30.2011 $ 634.239 $ 8.114 $ S 45.341 $ 687,694
The accompanying Notes to the Basic Financial Statements are an integral part of this statement.
31

B-3 STERLING HIGH SCHOOL DISTRICT
Reconciliation of the Statement of Revenues, Expenditures and Changes in Fund Balances of Governmental Funds
to the Statement of Activities For the Fiscal Year Ended June 30, 2011
Total net change in fund balances - governmental funds (from B-2) $ 386,752
Amounts reported for governmental activities in the statement of activities (A-2) are different because:
Governmental Funds report capital outlays as expenditures. However, in the statement of activities, the cost of those assets is allocated over their estimated useful lives as depreciation expense. This is the amount by which capital outlays exceeded depreciation in the current period.
Depreciation expense $ (442,259) Fixed assets additions 177,162 (265,097)
Repayment of long-term debt is an expenditure in the governmental funds, but the repayment reduces long-term liabilities in the statement of net assets and is not reported in the statement of activities. 490,000
Governmental funds report the effect of issuance costs, premiums, discounts and similar items when debt is first issued, whereas these amounts are deferred and amortized in the statement of activities. This amount is the net effect of these differences. (6,026)
Interest on long-term debt in the statement of activities is accrued, regardless of when due. In the governmental funds, interest is reported when due. This amount is the net effect of the difference in the treatment of interest on long-term debt. 1,633
In the statement of activities, certain operating expenses, (e.g. compensated absences) are measured by the amounts earned during the year. In the governmental funds, however, expenditures for these items are reported in the amount of financial resources used (paid). When the earned amount exceeds the paid amount, the difference is a reduction in the reconciliation (-); when the paid amount exceeds the earned amount the difference is an addition to the reconciliation (+) 16,877
Change in net assets of governmental activities $ 624.139
The accompanying Notes to the Basic Financial Statements are an integral part of this statement.
32

B-4 STERLING HIGH SCHOOL DISTRICT
Statement of Net Assets Proprietary Funds
June 30, 2011
Business-Type Activities Enterprise Funds
ASSETS:
Current Assets: Cash and cash equivalents Intergovernmental receivables:
Interfund Other
Inventories
Total current assets
Noncurrent assets: Machinery and equipment (net of accumulated depreciation)
Total noncurrent assets
Total Assets
Food Service
Fund
$ 38,709
14,959 359
3,914
57,941
137,390 (72,570)
64,820
122.761
South Jersey
Technology Program
Fund
$ 81,427
3,187,255
3.268.682
1,795,674 (296.125)
1.499.549
Total
4.768.231
120,136
14,959 3,187,614
3,914
3,326,623
1,933,064 (368,695)
1,564,369
4,890,992
LIABILITIES:
Current Liabilities: Accounts payable 1,943,975 1,943,975
Total current liabilities 1,943,975 1,943,975
NET ASSETS: Invested in capital assets 64,820 1,499,549 1,564,369 Unrestricted (Deficit) 57,941 1,324,707 1,382.648
Total Net Assets $ 122.761 $ 2.824.256 $ 2,947.017
The accompanying Notes to the Basic Financial Statements are an integral part of this statement.
33

B-S STERLING HIGH SCHOOL DISTRICT
Statement of Revenues, Expenses and Changes in Fund Net Assets Proprietary Funds
For the Fiscal Year Ended June 30, 2011
Business-Type Activities Enterprise Funds
South Jersey
Food Technology Service Program
Fund Fund Totals Operating Revenues:
Charges for Services: Daily sales:
Reimbursable programs $ 97,372 $ 97,372 Non-reimbursable programs 122,198 122,198
Program fees $ 14,043,654 14,043,654 Other 13,144 39,638 52.782
Total Operating Revenue 232,714 14,083,292 14,316.006
Operating Expenses: Salaries and fringe benefits 130,063 2,659.567 2.789.630 Management fee 24,405 24,405 Purchased services 212.800 212,800 Supplies and materials 9,239 5.988,809 5,998.048 Utilities 21,874 21,874 Travel 20,120 20,120 Other costs 20,683 45,406 66,089 Depreciation 13,071 69,688 82,759 Cost of sales 144.997 3.547,194 3,692.191
Total Operating Expenses 342.458 12.565,458 12.907.916
Operating Income (Loss) (109.744) 1.517,834 1,408.090
Non-Operating Revenues: State sources:
State school lunch program 3,068 3,068 Federal sources:
National school lunch program 101,543 101,543 Food distribution program 13,144 13,144
Local sources: Interest earned 62 377 439
Total Non-Operating Revenues 117.817 377 118,194
Income (Loss) before Contributions and Transfers 8,073 1,518.211 1,526,284
Operating transfer in
Changes in Net Assets 8,073 1,518,211 1,526,284 Net Assets - July 1, 2010 114.688 1.306.045 1.420.733
Net Assets - June 30, 2011 $ 122.761 $ 2.824.256 S 2.947.017
The accompanying Notes to the Basic Financial Statements are an integral part of this statement.
34

B-6 STERLING HIGH SCHOOL DISTRICT
Statement of Cash Flows Proprietary Funds
For the Fiscal Year Ended June 30, 2011
Cash Flows from Operating Activities: Cash receipts from customers Cash payments to employees for services Cash payments to suppliers for goods
and services
Net Cash Provided by (used for) Operating Activities
Cash Flows from Noncapital Financing Activities: Cash received from state sources Cash received from federal sources Operating transfer in
Net Cash Provided by (used for) Noncapital Financing Activities
Cash Flows Used by Capital and Related Financing Activities:
Purchase of Equipment
Cash Flow Provided by Investing Activities: Interest on Cash Equivalents
Net Increase (Decrease) in Cash and Cash Equivalents
Cash and Cash Equivalents - July 1, 2010
Cash and Cash Equivalents - June 30, 2011
Business-Type Activities Enterprise Funds
Food Service
Fund
$ 217,681 (130.063)
(205,754)
(118.136)
3.350 120.658
124,008
62_
5.934
32.775
$ 38.709
South Jersey
Technology Program
Fund
$ 12,228.779 (2,302.150)
(9,812,127)
114,502
(149,933)
377
(35,054)
116,481
$ 81.427
Total
$ 12,446,460 (2,432.213)
(10.017.881)
(3.634)
3.350 120.658
124.008
(149,933)
439
(29,120)
149,256
120.136
Reconciliation of Operating Income (Loss) to Net Cash Provided by (used for)
Operating Activities: Operating Income (Loss) Adjustments to Reconcile Operating Income (Loss) to Cash Provided by (used for) Operating Activities:
Depreciation Change in Assets and Liabilities: (Increase) decrease in accounts receivable (Increase) decrease in inventories Increase (decrease) in accounts payable
Net Cash Provided by (used for) Operating Activities
$ (109,744) $ 1,517,834 1.408,090
13.071
(15,033) (1,115) (5.315)
69.688
(1,854.513)
381.493
82.759
(1.869,546) (1,115)
376,178
$ (118.136) $ 114.502 (3.634)
Noncash Noncapital Financing Activities: During the year the School District received $13,144 of food commodities from the U.S. Department of Agriculture.
The accompanying Notes to the Basic Financial Statements are an integral part of this statement.
35

B-7 STERLING HIGH SCHOOL DISTRICT
Statement of Fiduciary Net Assets Fiduciary Funds
June 30, 2011
Trust Funds Unemployment Compensation
Insurance
Private Purpose Scholarship
Fund Agency Funds
ASSETS: Cash and cash equivalents
Total Assets
$ 38,284
38,284
8,055
8,055
$ 379,493
$ 379.493
LIABILITIES: Payroll deductions and withholdings Due to employees Due to student groups
Total Liabilities
$ 237,007 68,710 73,776
$ 379.493
NET ASSETS: Held in trust for unemployment
claims and other purposes
Reserved for scholarships
$ 38.284
8.055
The accompanying Notes to the Basic Financial Statements are an integral part of this statement.
36

B-8 STERLING HIGH SCHOOL DISTRICT
Statement of Changes in Fiduciary Net Assets Fiduciary Funds
For the Year Ended June 30, 2011
ADDITIONS: Contributions:
Employee Employer
Total Contributions
Investment earnings: Interest
Net investment earnings
Total Additions DEDUCTIONS:
Unemployment claims Scholarships awarded
Total Deductions
Change in Net Assets
Net Assets - July 1, 2010
Net Assets - June 30, 2011
Unemployment Compensation
Insurance
Private Purpose Scholarship
Fund
30,464 91,050
121,514
41 41
121,555
43 43
43
123,564
123,564
(2,009)
40,293
38.284
43
8,012
8.055
The accompanying Notes to the Basic Financial Statements are an integral part of this statement.
37

Sterling High School District Notes to Basic Financial Statements
For the Fiscal Year Ended June 30, 2011
1. SUMMARY OF SIGNIFICANT ACCOUNTING POLICIES
Reporting Entity - The Sterling High School District (District) is a Type II school district located in the County of Camden, State of New Jersey. As a Type II school district, it functions independently through a Board of Education. The Board is comprised of nine members elected to three-year terms from the following three sending districts: three from Magnolia Borough; two from Somerdale Borough; and four from Stratford Borough. In addition one member is appointed annually by the Laurel Springs Board of Education. The elected terms are staggered so that at least three member's terms expire each year. The purpose of the School District is to provide educational services for resident students in grades 9 through 12 that reside in the Borough's of Magnolia, Somerdale and Stratford. In addition, the School District provides educational services for students in grades 9 through 12 received, on a tuition basis, from the Laurel Springs School District and the Hi-Nella School District. The Sterling High School District has an approximate enrollment at June 30, 2011 of 997 students.
Criteria for determining if other entities are potential component units which should be reported within the School District's basic financial statements are identified and described in the Governmental Accounting Standards Board's (GASB) Codification of Governmental Accounting and Financial Reporting Standards, Section 2100 and 2600. The application of these criteria provides for identification of any entities for which the School District is financially accountable and other organizations that the nature and significance of their relationship with the School District are such that exclusion would cause the School District's basic financial statements to be misleading or incomplete.
Based on the application of these criteria, there were no organizations that are considered to be component units
Basis of Presentation
The basic financial statements of the Sterling High School District have been prepared in conformity with accounting principles generally accepted in the United States of America (GAAP) as applied to governmental units. The Governmental Accounting Standards Board (GASB) is the accepted standard-setting body for establishing governmental accounting and financial reporting principles. The School District also applies Financial Accounting Standards Board (FASB) Statements and Interpretations issued on or before November 30, 1989 to its governmental and business-type activities and to its proprietary funds, provided they do not conflict with or contradict GASB pronouncements. The more significant of the School District's accounting policies are described below.
The School District's basic financial statements consists of government-wide statements, including a statement of net assets and a statement of activities, and fund financial statements, which provide a more detailed level of financial information.
Government-wide Statements - The statement of net assets and the statement of activities display information about the School District as a whole. These statements include the financial activities of the primary government, except for fiduciary funds. The statements distinguish between those activities of the School District that are governmental and those that are considered business-type activities. The statement of net assets presents the financial condition of the governmental and business-type activities of the School District at fiscal year-end. The statement of activities presents a comparison between direct expenses and program revenues for each program or function of the School District's governmental activities and for the business-type activities of the School District. Direct expenses are those that are specifically associated with a service, program or department and, therefore, clearly identifiable to a particular function. The policy of the School District is to not allocate indirect expenses to functions in the statement of activities. Program revenues include charges paid by the recipient of the goods or services offered by the program, grants and contributions that are restricted to meeting the operational or capital requirements of a particular program and interest earned on grants that is required to be used to support a particular program. Revenues, which are not classified as program revenues, are presented as general revenues of the School District, with certain limited exceptions. The comparison of direct expenses with program revenues identifies the extent to which each business segment or governmental function is self-financing or draws from the general revenues of the School District.
Fund Financial Statements - During the fiscal year, the School District segregates transactions related to certain School District functions or activities in separate funds in order to aid financial management and to demonstrate legal compliance. Fund financial statements are designed to present financial information of the School District at this more detailed level. The focus of governmental and enterprise fund financial statements is on major funds. Each major fund is presented in a single column. The fiduciary fund is reported by type. The School District uses funds to maintain its financial records during the fiscal year. A fund is defined as a fiscal and accounting entity with a self-balancing set of accounts. There are three categories of funds: governmental, proprietary, and fiduciary.
38

Sterling High School District Notes to Basic Financial Statements
For the Fiscal Year Ended June 30, 2011
1. SUMMARY OF SIGNIFICANT ACCOUNTING POLICIES
Governmental Funds - Governmental funds are those through which most governmental functions typically are financed. Governmental fund reporting focuses on the sources, uses and balances of current financial resources. Expendable assets are assigned to the various governmental funds according to the purposes for which they may or must be used. Current liabilities are assigned to the fund from which they will be paid. The difference between governmental fund assets and liabilities is reported as fund balance. The following are the School District's major governmental funds:
General Fund - The general fund is the general operating fund of the School District and is used to account for all financial resources except those required to be accounted for in another fund. Included are certain expenditures for vehicles and movable instructional or non-instructional equipment classified in the capital outlay sub-fund.
As required by the New Jersey State Department of Education, the School District includes budgeted capital outlay in this fund. Accounting principles generally accepted in the United States of America as they pertain to governmental entities state that general fund resources may be used to directly finance capital outlays for long-lived improvements as long as the resources in such cases are derived exclusively from unrestricted revenues.
Resources for budgeted capital outlay purposes are normally derived from State of New Jersey aid, district taxes and appropriated fund balance. Expenditures are those which result in the acquisition of or additions to capital assets for land, existing buildings, improvements of grounds, construction of buildings, additions to or remodeling of buildings and the purchase of built-in equipment.
Special Revenue Fund - The special revenue fund is used to account for the proceeds of specific revenues from the state and federal governments, other than major capital projects, debt service, or the enterprise funds, and local appropriations that are legally restricted to expenditures for specified purposes.
Capital Projects Fund - The capital projects fund is used to account for all financial resources to be used for the acquisition or construction of major capital facilities, other than those financed by proprietary funds. The financial resources are derived from New Jersey Economic Development Authority grants, temporary notes or serial bonds which are specifically authorized by the voters as a separate question on the ballot either during the annual election or at a special election.
Debt Service Fund - The debt service fund is used to account for the accumulation of resources for, and the payment of, general-long-term debt principal, interest and related costs.
Proprietary Funds - Proprietary funds are used to account for the School District's ongoing activities, which are similar to those in the private sector.
Enterprise Funds - The enterprise funds are used to account for operations that are financed and operated in a manner similar to private business enterprises, where the intent of the School District is that all costs (expenses, including depreciation) of providing goods or services to the students on a continuing basis be financed or recovered primarily through user charges; or, where the School District has decided that periodic determination of revenues earned, expenses incurred, and/or net income is appropriate for capital maintenance, public policy, management control, accountability, or other purposes.
The School District's enterprise funds are:
Food Service Fund - This fund accounts for the financial transactions related to the food service operations of the School District.
South Jersey Technology Program - This fund accounts for the financial transactions related to the technology and other services the School District provides for other governmental entities.
39

Sterling High School District Notes to Basic Financial Statements
For the Fiscal Year Ended June 30, 2011
1. SUMMARY OF SIGNIFICANT ACCOUNTING POLICIES
Proprietary Funds (Continued) - All proprietary funds are accounted for on a cost of services or "capital maintenance" measurement focus. This means that all assets and all liabilities, whether current or noncurrent, associated with their activity are included on their balance sheets. Their reported fund equity (net assets) is segregated into investment in capital assets, net of related debt, and unrestricted net assets, if applicable. Proprietary fund type operating statements present increases (revenues) and decreases (expenses) in net total assets.
Depreciation of all exhaustive fixed assets used by proprietary funds is charged as an expense against their operations. Accumulated depreciation is reported on proprietary fund balance sheets. Depreciation has been provided over the estimated useful lives using the straight-line method. The estimated useful lives are as follows:
Fiduciary Funds - Fiduciary fund reporting focuses on net assets and changes in net assets. The fiduciary fund category is split into four classifications: pension trust funds, investment trust funds, private-purpose trust funds, and agency funds. Agency funds are used to account for assets held by the School District in a trustee capacity or as an agent for individuals, private organizations, other governments, and/or other funds (i.e. payroll and student activities). They are custodial in nature (assets equal liabilities) and do not involve measurement of results of operations. The School District has four fiduciary funds; an unemployment compensation trust fund, a private purpose scholarship fund, a student activity fund, and a payroll fund.
Measurement Focus
Government-wide Financial Statements - The government-wide financial statements are prepared using the economic resources measurement focus. All assets and all liabilities associated with the operation of the School District are included on the statement of net assets.
Fund Financial Statements - All governmental funds are accounted for using a flow of current financial resources measurement focus. With this measurement focus, only current assets and current liabilities generally are included on the balance sheet. The statement of revenues, expenditures and changes in fund balances reports on the sources (i.e. revenues and other financing sources) and uses (i.e. expenditures and other financing uses) of current financial resources. This approach differs from the manner in which the governmental activities of the government-wide financial statements are prepared. Governmental fund financial statements, therefore, include a reconciliation with brief explanations to better identify the relationship between the government-wide statements and the statements for governmental funds.
Like the government-wide statements, all proprietary fund types are accounted for on a flow of economic resources measurement focus. All assets and all liabilities associated with the operation of these funds are included on the statement of net assets. The statement of changes in fund net assets presents increases (i.e. revenues) and decreases (i.e. expenses) in net total assets. The statement of cash flows provides information about how the School District finances and meets the cash flow needs of its proprietary activities. Fiduciary funds are reported using the economic resources measurement focus.
Basis of Accounting
Basis of accounting determines when transactions are recorded in the financial records and reported on the financial statements. Government-wide financial statements are prepared using the accrual basis of accounting. Governmental funds use the modified accrual basis of accounting. Proprietary and fiduciary funds also use the accrual basis of accounting. Differences in the accrual and the modified accrual basis of accounting arise in the recognition of revenue, the recording of deferred revenue, and in the presentation of expenses versus expenditures.
Revenues - Exchange and Non-exchange Transactions - Revenue resulting from exchange transactions, in which each party gives and receives essentially equal value, is recorded on the accrual basis when the exchange takes place. On a modified accrual basis, revenue is recorded in the fiscal year in which the resources are measurable and become available. "Measurable" means the amount of the transaction can be determined and "available" means that the resources will be collected within the current fiscal year or are expected to be collected soon enough thereafter to be used to pay liabilities of the current fiscal year. For the School District, available means expected to be received within thirty days of fiscal year end.
Equipment Light Trucks and Vehicles Heavy Trucks and Vehicles
12 Years 4 Years 6 Years
40

Sterling High School District Notes to Basic Financial Statements
For the Fiscal Year Ended June 30, 2011
1. SUMMARY OF SIGNIFICANT ACCOUNTING POLICIES
Revenues - Exchange and Non-exchange Transactions (Continued) - Non-exchange transactions, in which the School District receives value without directly giving equal value in return, include Ad Valorem (property) taxes, grants, entitlements, and donations. Ad Valorem (Property) Taxes are susceptible to accrual, as under New Jersey State Statute, a municipality is required to remit to its school district the entire balance of taxes in the amount voted upon or certified, prior to the end of the school year. The School District records the entire approved tax levy as revenue (accrued) at the start of the fiscal year, since the revenue is both measurable and available. The School District is entitled to receive monies under the established payment schedule and the unpaid amount is considered to be an "accounts receivable". With the exception of restricted formula aids recorded in the special revenue fund, revenue from grants, entitlements, and donations is recognized in the fiscal year in which all eligibility requirements have been satisfied. Eligibility requirements include timing requirements, which specify the fiscal year when the resources are required to be used or the fiscal year when use is first permitted, matching requirements, in which the School District must provide local resources to be used for a specified purpose, and expenditure requirements, in which the resources are provided to the School District on a reimbursement basis.
Under the modified accrual basis, the following revenue sources are considered to be both measurable and available at fiscal year-end; tuition, grants, fees, and rentals.
Expenses/Expenditures - On the accrual basis of accounting, expenses are recognized at the time they are incurred. The fair value of donated commodities used during the fiscal year, if any, is reported in the operating statement as an expense. Unused donated commodities are reported as deferred revenue. The measurement focus of governmental fund accounting is on decreases in net financial resources (expenditures) rather than expenses. Expenditures are generally recognized in the accounting period in which the related fund liability is incurred, if measurable. Allocations of cost, such as depreciation and amortization, are not recognized in governmental funds.
Budgets/Budgetary Control - Annual appropriated budgets are prepared in the spring of each fiscal year for the general, special revenue, and debt service funds. The budgets are submitted to the county office and are voted upon at the annual school election on the third Tuesday in April. Budgets are prepared using the modified accrual basis of accounting. The legal level of budgetary control is established at line item accounts within each fund. Line item accounts are defined as the lowest (most specific) level of detail as established pursuant to the minimum chart of accounts referenced in N.J.A.C. 6:23A-16.2(f)1. Transfers of appropriations may be made by School Board resolution at any time during the fiscal year in accordance with N.J.A.C. 6A:23A-13.3.
Formal budgetary integration into the accounting system is employed as a management control device during the fiscal year. For governmental funds there are no substantial differences between the budgetary basis of accounting and accounting principles generally accepted in the United States of America with the exception of the legally mandated revenue recognition of the one or more June state aid payments for budgetary purposes only and the special revenue fund as noted below. Encumbrance accounting is also employed as an extension of formal budgetary integration in the governmental fund types. Unencumbered appropriations lapse at fiscal year end.
The accounting records of the special revenue fund are maintained on the budgetary basis. The budgetary basis differs from GAAP in that the budgetary basis recognizes encumbrances as expenditures and also recognizes the related revenues, whereas the GAAP basis does not. Sufficient supplemental records are maintained to allow for the presentation of GAAP basis financial reports.
The budget, as detailed on Exhibit C-1, Exhibit C-2 and Exhibit I-3, includes all amendments to the adopted budget, if any.
Exhibit C-3 presents a reconciliation of the general fund revenues and special revenue fund revenues and expenditures from the budgetary basis of accounting as presented in the general fund budgetary comparison schedule and the special revenue fund budgetary comparison schedule to the GAAP basis of accounting as presented in the statement of revenues, expenditures and changes in fund balances - governmental funds. Note that the School District does not report encumbrances outstanding at year end as expenditures in the general fund since the general fund budget follows modified accrual basis with the exception of the revenue recognition policy for the one or more June state aid payments.
Encumbrances - Under encumbrance accounting purchase orders, contracts and other commitments for the expenditure of resources are recorded to reserve a portion of the applicable appropriation. Open encumbrances in governmental funds, other than the special revenue fund, are reported as assigned fund balances at fiscal year end as they do not constitute expenditures or liabilities but rather commitments related to unperformed contracts for goods and services.
41

Sterling High School District Notes to Basic Financial Statements
For the Fiscal Year Ended June 30, 2011
1. SUMMARY OF SIGNIFICANT ACCOUNTING POLICIES
Encumbrances (Continued) - Open encumbrances in the special revenue fund, for which the School District has received advances, are reflected in the balance sheet as deferred revenues at fiscal year end.
The encumbered appropriation authority carries over into the next fiscal year. An entry will be made at the beginning of the next fiscal year to increase the appropriation reflected in the certified budget by the outstanding encumbrance amount as of the current fiscal year end.
Cash, Cash Equivalents and Investments - Cash and cash equivalents, for all funds, include petty cash, change funds, cash in banks and ail highly liquid investments with a maturity of three months or less at the time of purchase and are stated at cost plus accrued interest. U.S. Treasury and agency obligations and certificates of deposit with maturities of one year or less when purchased are stated at cost. All other investments are stated at fair value.
New Jersey school districts are limited as to the types of investments and types of financial institutions they may invest in. N.J.S.A. 18A:20-37 provides a list of permissible investments that may be purchased by New Jersey school districts.
N.J.S.A. 17:9-41 et seq. establishes the requirements for the security of deposits of governmental units. The statute requires that no governmental unit shall deposit public funds in a public depository unless such funds are secured in accordance with the Governmental Unit Deposit Protection Act (GUDPA), a multiple financial institution collateral pool, which was enacted in 1970 to protect governmental units from a loss of funds on deposit with a failed banking institution in New Jersey. Public depositories include State or federally chartered banks, savings banks or associations located in or having a branch office in the State of New Jersey, the deposits of which are federally insured. All public depositories must pledge collateral, having a market value at least equal to five percent of the average daily balance of collected public funds, to secure the deposits of Governmental Units. If a public depository fails, the collateral it has pledged, plus the collateral of all other public depositories, is available to pay the full amount of their deposits to the governmental units.
Tuition Receivable - Tuition charges were established by the School District based on estimated costs. The charges are subject to adjustment when the final costs are determined.
Tuition Payable - Tuition charges for the fiscal years ended June 30, 2011 and 2010 were based on rates established by the receiving school district. These rates are subject to change when the actual costs have been determined.
Inventories - Inventories are valued at cost, which approximates market. The costs are determined on a first-in, first-out basis.
The cost of inventories in governmental fund types is recorded as expenditures when purchased rather than when consumed, and is not recorded since any amounts are considered immaterial to the basic financial statements.
Inventories recorded in the government-wide financial statements and in the proprietary fund types are recorded as expenditures when consumed rather than when purchased.
Prepaid Expenses - Prepaid expenses recorded on the government-wide financial statements and in the proprietary fund types represent payments made to vendors for services that will benefit periods beyond June 30,2011.
In the governmental fund types, however, payments for prepaid items are fully recognized as an expenditure in the fiscal year of payment. No asset for the prepayment is created, and no expenditure allocation to future accounting periods is required. This is consistent with the basic governmental concept that only expendable financial resources are reported by a specific fund.
Deferred Expenditures - Deferred expenditures are disbursements that are made in one period, but are more accurately reflected as an expenditure/expense in the next fiscal period. Unlike prepaid expenses, deferred expenditures are not regularly recurring cost of operations.
Short-Term Interfund Receivables / Payables - Short-term inter-fund receivables / payables represent amounts that are owed, other than charges for goods or services rendered to / from a particular fund in the School District and that are due within one year. These amounts are eliminated in the governmental and business-type columns of the statement of net assets, except for the net residual amounts due between governmental and business-type activities, which are presented as interfunds receivable and/or interfunds payable.
42

Sterling High School District Notes to Basic Financial Statements
For the Fiscal Year Ended June 30, 2011
1. SUMMARY OF SIGNIFICANT ACCOUNTING POLICIES
Capital Assets - General capital assets are those assets not specifically related to activities reported in the proprietary funds. These assets generally result from expenditures in the governmental funds. These assets are reported in the governmental activities column of the government-wide statement of net assets but are not reported in the fund financial statements. Capital assets utilized by the proprietary funds are reported both in the business-type activities column of the government-wide statement of net assets and the proprietary fund statement of net assets..
All capital assets are capitalized at cost (or estimated historical cost) and updated for additions and retirements during the fiscal year. Donated fixed assets are recorded at their fair market value as of the date received. The School District maintains a capitalization threshold of $2,000.00. The School District does not possess any infrastructure. Improvements are capitalized; the cost of normal repairs and maintenance that do not add to the value of the asset or materially extend asset's life are not. All reported capital assets except land and construction in progress are depreciated. Improvements are depreciated over the remaining useful lives of the related capital assets.
Depreciation is computed using the straight-line method over the following useful lives:
Accrued Salaries and Wages - Certain School District employees, who provide services to the School District over the ten-month academic year, have the option to have their salaries evenly disbursed during the twelve-month year. New Jersey statutes require that these earned but undisbursed amounts be retained in a separate bank account. As of June 30, 2011, the amounts earned by these employees were restricted to the employees' own individual credit union accounts.
Compensated Absences - Compensated absences are those absences for which employees will be paid, such as vacation, sick leave, and sabbatical leave. A liability for compensated absences that are attributable to services already rendered, and that are not contingent on a specific event that is outside the control of the School District and its employees, is accrued as the employees earn the rights to the benefits. Compensated absences that relate to future services, or that are contingent on a specific event that is outside the control of the School District and its employees, are accounted for in the period in which such services are rendered or in which such events take place.
The entire compensated absence liability is reported on the government-wide financial statements.
For governmental funds, the current portion of unpaid compensated absences is the amount that is normally expected to be paid with expendable available financial resources. In proprietary funds, the entire amount of compensated absences is recorded as a fund liability.
Deferred Revenue - Deferred revenue arises when assets are recognized before revenue recognition criteria have been satisfied.
Accrued Liabilities and Long-Term Obligations - All payables, accrued liabilities, and long-term obligations are reported on the government-wide financial statements, and all payables, accrued liabilities and long-term obligations payable from proprietary funds are reported on the proprietary fund financial statements. In general, governmental fund payables and accrued liabilities that, once incurred, are paid in a timely manner and in full from current financial resources are reported as obligations of the funds. However, claims and judgments, compensated absences, special termination benefits and contractually required pension contributions that will be paid from governmental funds are reported as a liability in the fund financial statements only to the extent that they are normally expected to be paid with expendable available financial resources. Bonds are recognized as a liability on the fund financial statements when due.
Description
Governmental Activities
Estimated Lives
Business -Type Activities
Estimated Lives
Land Improvements Buildings and Improvements Furniture and Equipment Vehicles
10-20 years 10-50 years 5-20 years 5-10 years
N/A N/A
12 years 4-6 years
43

Sterling High School District Notes to Basic Financial Statements
For the Fiscal Year Ended June 30, 2011
1. SUMMARY OF SIGNIFICANT ACCOUNTING POLICIES
Net Assets - Net assets represent the difference between assets and liabilities. Net assets invested in capital assets, net of related debt consists of capital assets, net of accumulated depreciation, reduced by the outstanding balance of any borrowings used for the acquisition, construction, or improvement of those assets. Net assets are reported as restricted when there are limitations imposed on their use either through the enabling legislation adopted by the School District or through external restrictions imposed by creditors, grantors, or laws or regulations of other governments.
It is the School District's policy to apply restricted resources when an expense is incurred for purposes for which both restricted and unrestricted net assets are available.
Fund Equity - In the fund financial statements, governmental funds report aggregate amounts for five classifications of fund balances based on the constraints imposed on the use of these resources. The nonspendable fund balance classification includes amounts that cannot be spent because they are either (a) not in spendable form - prepaid items or inventories; or (b) legally or contractually required to be maintained intact.
The spendable portion of the fund balance comprises the remaining four classifications: restricted, committed, assigned and unassigned.
Restricted fund balance - This classification reflects constraints imposed on resources either (a) externally by creditors, grantors, contributors, or laws or regulations of other governments; or (b) imposed by law through constitutional provisions or enabling legislation.
Committed fund balances - These amounts can only be used for specific purposes pursuant to constraints imposed by formal resolutions or ordinances of the School District - the government's highest level of decision making authority. Those committed amounts cannot be used for any other purpose unless the Board of Education removes the specified use by taking the same type of action imposing the commitment. This classification also includes contractual obligations to the extent that existing resources in the fund have been specifically committed for use in satisfying those contractual requirements.
Assigned fund balance - This classification reflects the amounts constrained by the School District's "intent" to be used for specific purposes, but are neither restricted nor committed. The Board of Education and the Chief School Administrator have the authority to assign amounts to be used for specific purposes. Assigned fund balances include all remaining amounts (except negative balances) that are reported in governmental funds, other than the General Fund, that are classified as nonspendable and are neither restricted nor committed.
Unassigned fund balance - This fund balance is the residual classification for the General Fund. It is also used to report negative fund balances in other governmental funds.
When both restricted and unrestricted fund balances are available for use, it is the School District's policy to use externally restricted fund balances first, then unrestricted fund balance - committed, assigned, and unassigned - in order as needed.
Operating and Non-Operating Revenues and Expenses - Operating revenues are those revenues that are generated directly from the primary activity of the proprietary funds. For the School District, these revenues are sales for the food service program and tuition for the before and after school program. Non-operating revenues principally consist of interest income earned on various interest bearing accounts and federal and state subsidy reimbursements for the food service program.
Operating expenses are necessary costs incurred to provide the goods or services that are the primary activity of the fund. There are no non-operating expenses
Interfund Activity - Transfers between governmental and business-type activities on the government-wide statements are reported in the same manner as general revenues. Exchange transactions between funds are reported as revenues in the seller funds and as expenditures/expenses in the purchaser funds. Flows of cash or goods from one fund to another without a requirement for repayment are reported as interfund transfers. Interfund transfers are reported as other financing sources/uses in governmental funds and after non-operating revenues/expenses in proprietary funds. Reimbursements from funds responsible for particular expenditures/expenses to the funds that initially paid for them are not presented on the financial statements.
44

Sterling High School District Notes to Basic Financial Statements
For the Fiscal Year Ended June 30, 2011
1. SUMMARY OF SIGNIFICANT ACCOUNTING POLICIES
Estimates - The preparation of financial statements in conformity with accounting principles generally accepted in the United State of America requires management to make estimates and assumptions that affect the amounts reported in the financial statements and accompanying notes. Actual results may differ from those estimates.
2. CASH AND CASH EQUIVALENTS
Custodial Credit Risk Related to Deposits - With respect to deposits, custodial credit risk refers to the risk that, in the event of a bank failure, the School District's deposits may not be returned to it. Although the School District does not have a formal policy regarding custodial credit risk, state statutes requires that governmental units shall deposit public funds in public depositories protected from loss under the provisions of the Governmental Unit Deposit Protection Unit. Banks that qualify as public depositories under New Jersey statutes hold cash deposits, with bank balances totaling $1,317,413 at June 30, 2011. All deposits are insured by federal depository insurance and/or collateralized with securities held in New Jersey's multiple financial institution collateral pool as required by N.J.S.A. 17.9-41 et seq.
3. CAPITAL RESERVE ACCOUNT
A capital reserve account was established by the School District for the accumulation of funds for use as capital outlay expenditures in subsequent fiscal years. The capital reserve account is maintained in the general fund and its activity is included in the general fund annual budget.
Funds placed in the capital reserve account are restricted to capital projects in the School District's approved Long Range Facilities Plan (LRFP). Upon submission of the LRFP to the New Jersey Department of Education, a school district may increase the balance in the capital reserve by appropriating funds in the annual general fund budget certified for taxes or by transfer by board resolution at fiscal year-end (June 1 to June 30) of any unanticipated revenue or unexpended line-item appropriation amounts, or both. A school district may also appropriate additional amounts when the express approval of the voters has been obtained either by a separate proposal at budget time or by a special question at one of the four special elections authorized pursuant to N.J.S.A. 19:60-2. Pursuant to N.J.A.C. 6:23A-14.1(g), the balance in the account cannot at any time exceed the local support costs of uncompleted capital projects in its approved LRFP.
The activity of the capital reserve for the July 1, 2010 to June 30, 2011 fiscal year is as follows:
Balance-July 1,2010 $ 73,492 Increased by:
Interest earned $ 73 Board resolution 320,100
320,173 393,665
Decreased by: Budget withdrawal
Balance - June 30, 2011 $ 393,665
The June 30, 2011 capital reserve balance does not exceed the LRFP balance of local support costs of uncompleted projects.
45

Sterling High School District Notes to Basic Financial Statements
For the Fiscal Year Ended June 30, 2011
4. ACCOUNTS RECEIVABLES
Accounts receivables at June 30, 2011 consisted of accounts (fees) and intergovernmental grants. All intergovernmental receivables are considered collectible in full due to the stable condition of State programs and the current fiscal year guarantee of federal funds.
Accounts receivable at June 30, 2011 for the School District's individual major and fiduciary funds, in the aggregate, are as follows:
General Fund
Special Revenue
Fund Proprietary
Funds Total
Intergovernmental State Federal Other
Total Accounts Receivable
$ 80,371 3,527
27,762 $ 115,425
$ 111,660 $ 255,609
$ 3,187,614
$ 3,187,614
$ 80,371 118,952
3,215,376
$ 3,414,699
5. CAPITAL ASSETS
Capital asset activity for the fiscal year ended June 30,2011, was as follows:
Balance Balance Julv 1.2010 Additions Deletions June 30. 2011
Governmental Activities: Julv 1.2010
Capital Assets, not being depreciated: Land $ 322,480 $ 322,480 Construction in progress
Total capital assets, not being Depreciated 322,480 322,480
Capital Assets, being depreciated: Site Improvements 1,022,117 1,022,117 Building and Building Improvements 15,741,447 $ 11,677 15,753,124 Equipment 718,859 165,485 884,344 Vehicles 86,753 86,753
Totals at historical cost 17,569,176 177,162 17,746,338 Less Accumulated Depreciation:
Site Improvements (667,984) (31,225) (699,209) Building and Building Improvements (8,165,651) (300,789) (8,466,440) Equipment (336,297) (101,459) (437,756) Vehicles (49,445) (8,786) (58,231) Totals accumulated depreciation (9,219,377) (442,259) (9,661,636)
Total Capital Assets, being depreciated, net 8,349,799 (265,097) 8,084,702
Governmental Activities Capital Assets, Net $ 8,672,279 $ (265,097) $ 8,407,182
Business-Tvoe Activities: Capital Assets, being depreciated:
Equipment $ 1,783,131 $ 149,933 $ 1,933,064 Less accumulated depreciation (285,935) (82,760) (368,695)
Business-Type Activities Capital Assets, Net $ 1,497,196 $ 67,173 $0 $ 1,564,369
46

Sterling High School District Notes to Basic Financial Statements
For the Fiscal Year Ended June 30, 2011
5. CAPITAL ASSETS (Continued)
Depreciation expense in the amount of $442,259 was charged to governmental functions as follows:
Function Amount
Regular Instruction General Administration Maintenance and Repairs Unallocated
Total depreciation expense
$ 71,203 19,360 36,250
315,446
$ 442,259
6. INVENTORY
Inventory in the Food Service Fund at June 30, 2011 consisted of the following:
Food Supplies
$ 2,979 935
$ 3,914
7. LONG-TERM OBLIGATIONS
During the fiscal year ended June 30, 2011, the following changes occurred in long-term obligations:
Governmental Activities:
Compensated Absences General Obligation Bonds
Principal Outstanding July 1.2010
$ 220,800 4,300,000
$ 4,520,800
Additions
$
Reductions
$ 16,877 490,000
$ 506,877
Principal Outstanding
June 30. 2011
$ 203,923 3,810,000
$ 4,013,923
Due Within One Year
$ 485,000
$ 485,000
Bonds Payable - Bonds and loans are authorized in accordance with State law by the voters of the School District through referendums. All bonds are retired in serial installments within the statutory period of usefulness. Bonds issued by the School District are as follows:
2011 Refunded Bonds dated June 1, 2011 in the amount of $3,810,000 due in annual installments through June 1, 2019, bearing an interest rate of 4.00% to 5.00%.
Principal and interest due on bonds outstanding is as follows:
Fiscal Year Ending June 30.
2012 2013 2014 2015 2016 2017-2019
Principal
$ 485,000 485,000 480,000 480,000 475,000
1,405,000
Interest
$ 179,637 159,025 137,200 115,600 94,000
139,500
Total
$ 664,637 644,025 617,200 595,600 569,000
1,544,500
$3,810,000 $ 824,962 $ 4,634,962
47
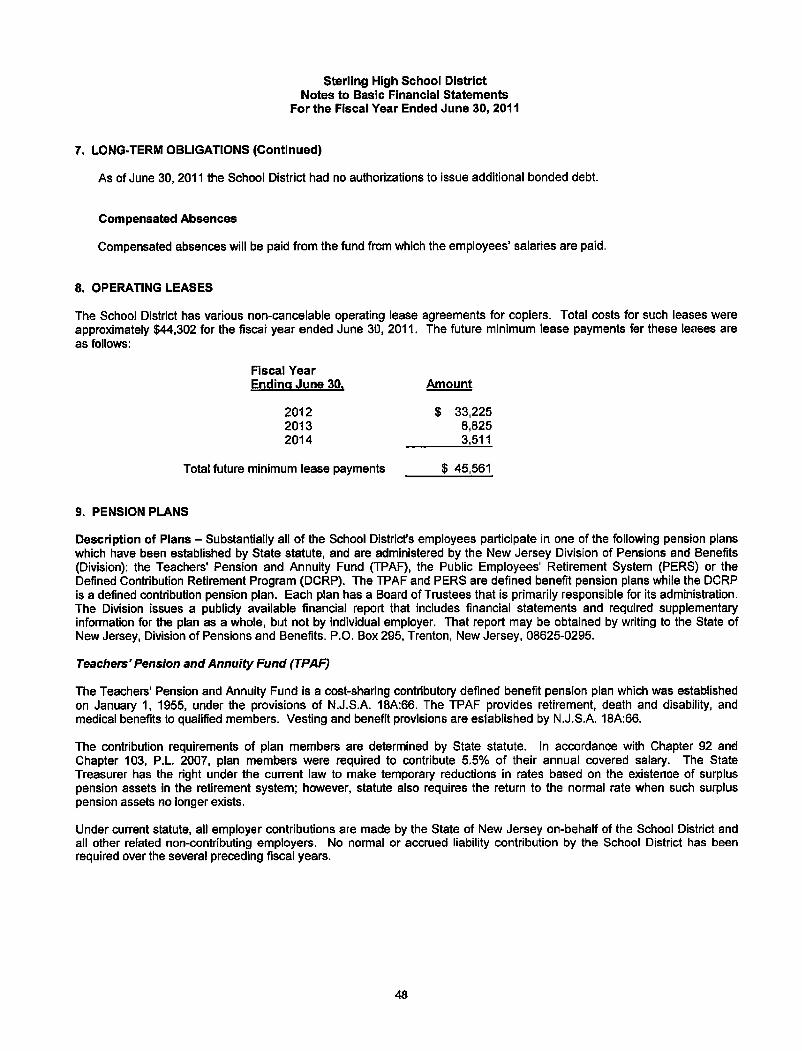
Sterling High School District Notes to Basic Financial Statements
For the Fiscal Year Ended June 30, 2011
7. LONG-TERM OBLIGATIONS (Continued)
As of June 30,2011 the School District had no authorizations to issue additional bonded debt.
Compensated Absences
Compensated absences will be paid from the fund from which the employees' salaries are paid.
8. OPERATING LEASES
The School District has various non-cancelable operating lease agreements for copiers. Total costs for such leases were approximately $44,302 for the fiscal year ended June 30, 2011. The future minimum lease payments for these leases are as follows:
Fiscal Year Ending June 30. Amount
2012 $ 33,225 2013 8,825 2014 3,511
Total future minimum lease payments $ 45,561
9. PENSION PLANS
Description of Plans - Substantially all of the School District's employees participate in one of the following pension plans which have been established by State statute, and are administered by the New Jersey Division of Pensions and Benefits (Division): the Teachers' Pension and Annuity Fund (TPAF), the Public Employees' Retirement System (PERS) or the Defined Contribution Retirement Program (DCRP). The TPAF and PERS are defined benefit pension plans while the DCRP is a defined contribution pension plan. Each plan has a Board of Trustees that is primarily responsible for its administration. The Division issues a publicly available financial report that includes financial statements and required supplementary information for the plan as a whole, but not by individual employer. That report may be obtained by writing to the State of New Jersey, Division of Pensions and Benefits. P.O. Box 295, Trenton, New Jersey, 08625-0295.
Teachers' Pension and Annuity Fund (TPAF)
The Teachers' Pension and Annuity Fund is a cost-sharing contributory defined benefit pension plan which was established on January 1, 1955, under the provisions of N.J.S.A. 18A:66. The TPAF provides retirement, death and disability, and medical benefits to qualified members. Vesting and benefit provisions are established by N.J.S.A. 18A:66.
The contribution requirements of plan members are determined by State statute. In accordance with Chapter 92 and Chapter 103, P.L. 2007, plan members were required to contribute 5.5% of their annual covered salary. The State Treasurer has the right under the current law to make temporary reductions in rates based on the existence of surplus pension assets in the retirement system; however, statute also requires the return to the normal rate when such surplus pension assets no longer exists.
Under current statute, all employer contributions are made by the State of New Jersey on-behalf of the School District and all other related non-contributing employers. No normal or accrued liability contribution by the School District has been required over the several preceding fiscal years.
48

Sterling High School District Notes to Basic Financial Statements
For the Fiscal Year Ended June 30, 2011
9. PENSION PLANS (Continued)
Public Employees'Retirement System (PERS)
The Public Employees' Retirement System is a cost-sharing multiple-employer defined benefit pension plan which was established on January 1, 1955. The PERS provides retirement, death and disability, and medical benefits to certain qualified members. Vesting and benefit provisions are established by N.J.S.A. 43:15A and 43:3B.
The contribution requirements of plan members are determined by State statute. In accordance with Chapter 92 and Chapter 103, P.L. 2007, plan members were required to contribute 5.5% of their annual covered salary. The State Treasurer has the right under the current law to make temporary reductions in rates based on the existence of surplus pension assets in the retirement system; however, statute also requires the return to the normal rate when such surplus pension assets no longer exists.
The School District is billed annually for its normal contribution plus any accrued liability.
The School District's contributions to the PERS, equal to the required contribution for each fiscal year, were as follows:
Total Non Liability
Fiscal Normal Accrued Contributory Paid by Year Contribution Liability Life District
2011 $ 102,607 $ 163,497 $ 20,210 $ 286,314 2010 85,903 110,375 27,219 223,497 2009 84,593 97,843 22,677 205,113
Defined Contribution Retirement Program (DCRP)
The Defined Contribution Retirement Program is a cost-sharing multiple-employer defined contribution pension plan which was established on July 1, 2007, under the provisions of Chapter 92, P.L. 2007 and Chapter 103, P.L. 2007 (N.J.S.A.43:15C-1 et. seq), and expanded under the provisions of Chapter 89, P.L. 2008 and Chapter 1, P.L. 2010. The Defined Contribution Retirement Program Board oversees the DCRP, which is administered for the Divisions of Pensions and Benefits by Prudential Financial. The DCRP provides eligible members, and their beneficiaries, with a tax-sheltered, defined contribution retirement benefit, along with life insurance and disability coverage. Vesting and benefit provisions are established by N.J.S.A. 43:15C-1 et. seq.
The contribution requirements of plan members are determined by State statute. In accordance with Chapter 92, P.L. 2007 and Chapter 103, P.L. 2007, plan members are required to contribute 5.5% of their annual covered salary. The State Treasurer has the right under the current law to make temporary reductions in rates based on the existence of surplus pension assets in the retirement system; however, statute also requires the return to the normal rate when such surplus pension assets no longer exists. In addition, to the employee contributions, the School District's contribution amounts for each pay period are transmitted to Prudential Financial not later than the fifth business day after the date on which the employee is paid for that pay period.
There were no School District employees enrolled in the DCRP for the fiscal years ended June 30, 2011,2010 and 2009.
Related Party Investments - The Division of Pensions and Benefits does not invest in securities issued by the School District.
49

Sterling High School District Notes to Basic Financial Statements
For the Fiscal Year Ended June 30, 2011
10. POST-RETIREMENT BENEFITS
P.L. 1987, c.384 and P.L. 1990, c.6 required Teachers' Pensions and Annuity Fund (TPAF) and the Public Employees' Retirement System (PERS), respectively, to fund post-retirement medical benefits for those state employees who retire after accumulating 25 years of credited service or on a disability retirement. P.L. 2007, c. 103 amended the law to eliminate the funding of post-retirement medical benefits through the TPAF and PERS. It created separate funds outside of the pension plans for the funding and payment of post-retirement medical benefits for retired state employees and retired educational employees. As of June 30, 2010 there were 87,288 retirees receiving post-retirement medical benefits. The cost of these benefits is funded through contributions by the state in accordance with P.L. 1994, c.62. Funding of post-retirement medical premiums changed from a pre-funding basis to a pay-as-you-go basis beginning in fiscal year 1994.
The State's contribution rate is based on the annual required contribution (ARC), an amount actuarially determined in accordance with the parameters of GASB Statement 45. The ARC represents a level of funding that, if paid on an ongoing basis, is projected to cover normal cost each year and amortize any unfunded actuarial liabilities (or funding excess) of the plan over a period not to exceed thirty years.
The State made post-retirement (PRM) contributions of $592.7 million for TPAF and $224.3 million for PERS in Fiscal Year 2009.
The state is also responsible for the cost attributable to P.L. 1992 c.126, which provides free health benefits to members of PERS and Alternate Benefit Program who retired from a board of education or county college with 25 years of service. The state paid $126.3 million toward Chapter 126 benefits for 14,050 eligible retired members in fiscal year 2010.
11. ON-BEHALF PAYMENTS
For the fiscal year ended June 30, 2011, the School District has recognized as revenues and expenditures on-behalf payments made by the State of New Jersey for normal costs and post-retirement costs related to TPAF. The amounts recognized as revenues and expenditures for normal costs and post-retirement were $20,604 and $437,620, respectively. In addition, the State of New Jersey reimbursed the School District $491,164 during the fiscal year ended June 30, 2011 for the employer's share of social security contributions for TPAF members, as calculated on their base salaries. This amount has also been included as a revenue and expenditure in the basic financial statements, and the combining and individual fund statements and schedules in accordance with GASB 24.
12. RISK MANAGEMENT
The School District is exposed to various risks of loss related to torts; theft of, damage to, and destruction of assets; errors and omissions; employee health and accident claims; and natural disasters.
Property and Liability Insurance - The School District maintains commercial insurance coverage for property, liability, student accident and surety bonds. A complete schedule of insurance coverage can be found in the Statistical Section of this Comprehensive Annual Financial Report.
Joint Insurance Pool - The School District is a member of the School Alliance Insurance Fund. Insurance coverage as provided by the Fund can be found in the Statistical Section of this Comprehensive Annual Financial Report.
Annual contributions to the Fund are determined by the Fund's Board of Trustees. The School District is jointly and personally liable for claims insured by the Fund and its members during the period of its membership, including liability for supplemental assessments, if necessary. The Fund's Board of Trustees may authorize refunds to its members in any fund year for which contributions exceed the amount necessary to fund all obligations for that year.
The Fund publishes its own financial report which can be obtained by writing to: School Alliance Insurance Fund, do PEGAS, 51 Everett Drive, Lawrenceville, New Jersey, 08648.
50

Sterling High School District Notes to Basic Financial Statements
For the Fiscal Year Ended June 30, 2011
12. RISK MANAGEMENT (Continued)
New Jersey Unemployment Compensation Insurance - The School District has elected to fund its New Jersey Unemployment Compensation Insurance under the "Benefit Reimbursement Method". Under this plan, the School District is required to reimburse the New Jersey Unemployment Trust Fund for benefits paid to its former employees and charged to its account with the State. The School District is billed quarterly for amounts due to the State.
The following is a summary of School District contributions, employee contributions, reimbursements to the State for benefits paid and the ending balance of the School District's expendable trust fund for the current and previous two fiscal years:
Fiscal Year District Employee Amount Ending Ended June 30. Contributions Contributions Reimbursed Balance
2010-2011 $ 91,091 $ 30,464 $ 123,564 $ 38,284 2009-2010 58,877 30,813 84,348 40,293 2008-2009 45,525 24,961 79,668 34,951
13. DEFERRED COMPENSATION
The School District offers its employees a choice of various deferred compensation plans created in accordance with Internal Revenue Code Section 403(b) and 457. The plans, available to all permanent School District employees, permit them to defer a portion of their current salary to all future years. Participation in the plans is optional. The deferred compensation is not available to the participants until termination, retirement, death, or an unforeseeable emergency occurs. The plan assets are held in trust for the benefit of the employee and therefore are not reflected on the financial statements of the School District.
14. COMPENSATED ABSENCES
The School District accounts for compensated absences (e.g. unused vacation, sick leave) as directed by Governmental Accounting Standards Board Statement No. 16 (GASB 16), "Accounting for Compensated Absences". A liability for compensated absences attributable to services already rendered and not contingent on a specific event that is outside the control of the employer and employee is accrued as employees earn the rights to the benefits.
School District employees are granted varying amounts of vacation and sick leave in accordance with the School District's personnel policy. Upon termination, employees are paid for accrued vacation. The School District's policy permits employees to accumulated unused sick leave and carry forward the full amount to subsequent years. Upon retirement employees shall be paid by the School District for the unused sick leave in accordance with the School District's agreements with the various employee unions.
The liability for vested compensated absences is recorded within those funds as the benefits accrued to the employees. As of June 30, 2011, the liability for compensated absences in the governmental activities fund type was $203,923.
15. INTERFUND RECEIVABLES/PAYABLES
Interfund receivables/payables are recorded to cover temporary cash shortages and/or timing differences in the respective funds. There are no interfund balances that are not expected to be repaid by June 30, 2012. The following interfund receivables/payables were recorded on the various balance sheets as of June 30, 2011:
Interfund Interfund Fund Receivable Payable
General $ 14,959 Enterprise Fund - Food
Service Fund $ 14,959
$ 14,959 $ 14,959
51

Sterling High School District Notes to Basic Financial Statements
For the Fiscal Year Ended June 30, 2011
16. CONTINGENCIES
The School District participates in a number of federal and state programs that are fully or partially funded by grants received from other governmental units. Expenditures financed by grants are subject to audit by the appropriate grantor government. If expenditures are disallowed due to noncompliance with grant program regulations, the School District may be required to reimburse the grantor government.
At June 30, 2011, significant amounts of grant expenditures have not been audited by the granting agency, but the School District believes that disallowed expenditures discovered in subsequent audits, if any, will not have a material effect on any of the individual funds or the overall financial position of the School District. Additionally, deferred revenues are recognized in those funds that have received grant monies in advance of future, reimbursable expenditures.
17. DEFICIT UNASSIGNED FUND BALANCE
The School District has a deficit unassigned fund balance of $249,661 in the General Fund as of June 30, 2011 as reported in the fund statements (modified accrual basis). N.J.S.A. 18A:22-44.2 provides that in the event a state school aid payment is not made until the following school budget year, school districts must record the delayed one or more June state aid payments as revenues, for budget purposes only, in the current school budget year. The statute provides legal authority for school districts to recognize this revenue in the current budget year. For intergovernmental transactions, GASB Statement No. 33 requires that recognition (revenue, expenditure, asset, liability) should be in symmetry, i.e., if one government recognizes an asset, the other government recognizes a liability. Since the State is recording the June state aid payments in the subsequent fiscal year, the School District can not recognize the June state aid payment on the GAAP financial statements until the year the State records the payable. Due to the timing difference of recording the June state aid payments, the general and special revenue fund balance deficit does not alone indicate that the School District is facing financial difficulties.
Pursuant to N.J.S.A. 18A:22-44.2 any negative unreserved, undesignated general fund balance that is reported as a direct result from a delay in the June payments of state aid until the following fiscal year, is not considered in violation of New Jersey statute and regulation nor in need of corrective action. The School District deficit in the GAAP funds statements of $249,661 is equal to or less than the June state aid payment.
18. DEFICIT UNRESTRICTED NET ASSETS
The governmental activities has a deficit in unrestricted net assets of $420,339 as of June 30, 2011. This deficit is attributable to the allocation of compensated absences balances payable and accrued interest payable to unrestricted net assets.
19. FUND BALANCES
The School District has classified its fund balances with the following hierarchy:
Nonspendable - The School District does not have any nonspendable funds.
Spendable - The School District has classified the spendable fund balances as Restricted, Assigned and Unassigned and considered each to have been spent when expenditures are incurred. The School District currently has no funds classified as Committed.
Restricted Items:
Capital Reserve - As of June 30, 2011, the balance in the capital reserve account is $393,665. The entire amount has been appropriated and included as anticipated revenue for the fiscal year ending June 30, 2012.
Excess Surplus - In accordance with N.J.S.A. 18A:7F-7, as amended, the designation of restricted fund balance -excess surplus is the result of a required calculation pursuant to the New Jersey Comprehensive Educational Improvement and Financing Act of 1996 (CEIFA). New Jersey school districts are required to restrict general fund, fund balance at the fiscal year end of June 30 if they did not appropriate a required minimum amount as budgeted fund balance in their subsequent years' budget. The excess fund balance at June 30, 2011 is $69,635.
52

Sterling High School District Notes to Basic Financial Statements
For the Fiscal Year Ended June 30, 2011
19. FUND BALANCES (Continued)
Assigned:
Year-end Encumbrances - At June 30, 2011 a total of $222,008 is committed to meet contractual obligations. The School District has purchase orders outstanding with vendors in this amount and expects the vendors to deliver the goods and services in the upcoming year. The amounts are $213,894 in the General Fund and $8,114 in the Special Revenue Fund.
Designated for Subsequent Year's Expenditures - The School District has assigned a total of $252,047 for appropriation of existing unassigned fund balance at year-end to eliminate a deficit in the upcoming 2011-2012 budget. The amounts are $206,706 in the General Fund and $45,341 in the Debt Service Fund.
Unassigned items - Represents the remainder of the School District's equity in governmental fund type balances. The balance at June 30,2011 is $279,807 and is entirely in the General Fund.
20. Acquisition of School Choice Facility
The School District has entered into an agreement with the YMCA of Camden County to purchase a facility in the amount of $1,500,000 to be used for housing the school choice program and for other services. The agreement is contingent upon the approval of the State Department of Education. The School District has budgeted in the 2011-2012 budget the purchase of this facility. The funding is to be obtained from the available unrestricted net asset balance of the South Jersey Technology Program Fund, which at June 30, 2011 is $1,324,707. The School District expects to fund the deficit from current year operations in the South Jersey Technology Program Fund.
53

Required Supplementary Information - Part II

Budgetary Comparison Schedules

STERLING HIGH SCHOOL DISTRICT Required Supplementary Information
Budgetary Comparison Schedule General Fund
For the Fiscal Year Ended June 30, 2011
Variance Original Budget
Budget Transfers
Final Budget Actual
Final to Actual
REVENUES: Local sources:
Local Tax Levy Tuition Interest earned on capital reserve funds Unrestricted misc. revenues
$ 6,901,937 1,795,000
180 17,800
$ 6,901,937 1,795,000
180 17,800
$ 6,901,937 1,765,260
73 12,255
$ (29,740) (107)
(5,545)
Total local sources 8,714,917 8,714,917 8,679,525 (35,392)
State sources: Categorical special education aid Equalization aid Extraordinary aid On-behalf TPAF pension contr. (non-budgeted) Reimbursed TPAF social security
contribution (non-budgeted)
5,381,170 73,500
$ 479,575 (479,575)
479,575 4,901,595
73,500
479,575 4,901,595
38.523 458,224
491,164
(34,977) 458,224
491,164
Total state sources 5,454,670 5,454,670 6,369,081 914,411
Federal sources: Ed Jobs fund Medicaid reimbursement
203,639 203,639 203,639 19,932 19,932
Total federal sources 203,639 203,639 223,571 19,932
TOTAL REVENUES 14,169,587 203,639 14,373,226 15,272,177 898,951
EXPENDITURES: CURRENT EXPENSE: Regular Programs - Instruction:
Salaries of teachers Grades 9-12 4,640,056 (404,419) 4,235.637 4,221,272 14,365
Regular Programs - Home Instruction: Salaries of teachers 28,420 2,276 30,696 30.696 Purchased prof. - educational services 25,000 (10,407) 14,593 9,085 5,508
Regular Programs - Undistributed Instruction: Other salaries for instruction 72,075 14,135 86.210 83,682 2.528 Rentals 44.474 44.474 42,569 1,905 Other purchased services 159,427 (150.249) 9,178 4,223 4,955 Travel 5,508 5,508 2,037 3,471 Misc. purchased services 83,431 83,431 76,477 6.954 General supplies 179,249 68,343 247,592 186,959 60,633 Textbooks 43,500 (20,885) 22,615 22,020 595
Total - Regular Programs - Instruction 5,147,727 (367,793) 4,779,934 4.679.020 100,914
See Management's Discussion and Analysis section of this report for explanation of significant budget variances, original and final.
(CONTINUED TO NEXT PAGE)
56

C-1 STERLING HIGH SCHOOL DISTRICT Required Supplementary Information
Budgetary Comparison Schedule General Fund
For the Fiscal Year Ended June 30, 2011
Variance (Continued from prior page) Original Budget Final Final to
Budget Transfers Budget Actual Actual Special Education Instruction:
Learning and/or Language Disabilities: Salaries of teachers Other salaries for instruction Other objects
S 76,560
150
$ 40,200 50.750
S 116,760 50,750
150
$ 116,006 50.742
$ 754 8
150
Total learning and/or language disabilities 76,710 90,950 167,660 166.748 912
Behavioral Disabilities: Salaries of teachers Other salaries for instruction Other purchased services General supplies
79,640 18,000 1,400
250
(33,046) 29,735
46,594 47,735
1,400 250
45.760 47,732
450
834 3
950 250
Total behavioral disabilities 99,290 (3,311) 95,979 93.942 2.037
Multiple Disabilities: Salaries of teachers Other salaries for instruction General supplies
60.580 7,200 1,500
(1,990) 139.910
58.590 147.110
1.500
57.920 147.095
1.450
670 15 50
Total multiple disabilities 69,280 137.920 207.200 206.465 735
Resource room/resource center: Salaries of teachers Salaries for other instruction General supplies
363,670 51,600 1,000
44.390 (51,600)
408,060
1,000
408.060
1,000
Total resource room/resource center 416,270 (7.210) 409,060 408,060 1,000
Total Special Education - Instruction 661,550 218.349 879,899 875.215 4,684
3asic Skills/Remedial - Instruction Salaries of teachers Other purchased services General supplies
66,400 16,790 3.000
(1.950) (400)
66,400 14,840 2,600
59.017 14,233 2,566
7,383 607 34
Total basic skills/remedial - instruction 86,190 (2,350) 83.840 75,816 8.024
See Management's Discussion and Analysis section of this report for explanation of significant budget variances, original and final.
(CONTINUED TO NEXT PAGE)
57

C-1 STERLING HIGH SCHOOL DISTRICT Required Supplementary Information
Budgetary Comparison Schedule General Fund
For the Fiscal Year Ended June 30, 2011
Variance [Continued from prior page) Original Budget Final Final to
Budget Transfers Budget Actual Actual
School-Sponsored Cocurricular Act - Instruction: Salaries $ 79,426 $ 32,124 $ 111.550 $ 103,582 S 7,968 Purchased services 11.350 (2,500) 8.850 7,320 1.530 Supplies and materials 21.382 (6,474) 14.908 10.324 4.584
Total school-sponsored cocurr. act. - instruc. 112.158 23.150 135.308 121.226 14.082
School-Sponsored Athletics - Instruction: Salaries 410.950 (25,685) 385.265 372,268 12,997 Salaries of Seer. & Cler. Assts. 21.400 21.400 12.124 9,276 Other purchased services 142.115 (33,763) 108.352 92,272 16,080 Travel 1,079 1,079 139 940 Supplies and materials 61.125 2.432 63.557 48,442 15,115
Total school-sponsored athletics - instruc. 614.190 (36.969) 579.653 525.245 39.293
Total Instruction 6.621.815 (165.613) 6.458,634 6.276,522 166.997
Undistributed Expenditures - Instruction Tuition to other LEAs within the state - reg. 10,500 710 11,210 11,206 4 Tuition to County Voc School Dist - reg. 37,650 5,100 42,750 42,750 Tuition to CSSD & reg. day schools 287,496 (95,534) 191,962 115,176 76.786 Tuition to priv. sch. for the disabled in state 208,393 20.000 228,393 158,634 69.759 Tuition other 1,800 1,800 1.800
Total undistributed expenditures - instruction 545,839 (69.724) 476,115 327,766 148.349
Attendance and Social Work: Salaries 29,150 (1.100) 28,050 27,665 385 Supplies and materials 1,240 1,240 647 593
Total attendance and social work 30,390 (1.100) 29,290 28,312 978
See Management's Discussion and Analysis section of this report for explanation of significant budget variances, original and final.
(CONTINUED TO NEXT PAOE)
58

C-1 STERLING SCHOOL DISTRICT
Required Supplementary Information Budgetary Comparison Schedule
General Fund For the Fiscal Year Ended June 30,2011
(Continued from prior page) Original Budget
Health Sen/ices: Salaries $ 95,250 Purchased professional and technical services 17,000 Other purchased services 330 Supplies and materials 2,631
Total health services 115,211
Speech, OT, PT & Related Services: Salaries 27,000 Purchased professional and educational services 76,480
Total speech, ot, pt & related services 103,480
Other Support Services - Extra. Serv.: Salaries 152,900 Purchased professional and educational services 108,500
Total other support services - extra, serv. 261,400
Guidance: Salaries of other professional staff 396,200 Salaries of secretarial and clerical assistants 62,140 Other purchased services 9,300 Supplies and materials 1,500
Total guidance 469,140
Child Study Teams: Salaries of other professional staff 173,350 Salaries of secretarial and clerical assistants 42,450 Other salaries 250 Purchased professional and educational services 1,500 Purchased professional and technical services 82,060 Travel Other purchased services 14,014 Supplies and materials 4,400
Total child study teams 318,024
Improvement of Instruction Services: Salaries of supervisor of instruction 337,280 Salaries of secretarial and clerical assistants 43,610 Other purchased services 4,320 Supplies and materials 4,750 Other objects 1,975
Total improvement of instructional services 391,935
See Management's Discussion and Analysis section of this report
Variance Budget Final Final to
Transfers Budget Actual Actual
$ 4,075 $ 99,325 $ 99,323 $ 2 (5,300) 11.700 11,700
330 266 64 681 3.312 3,290 22
(544) 114.667 102,879 11.788
1,100 28.100 28.100 (75,145) 1.335 534 801
(74,045) 29.435 28,634 801
(138,205) 14,695 14,695 (60,000) 48.500 19,107 29.393
(198,205) 63.195 19,107 44,088
(2,315) 393,685 393,885 1,736 63,876 63,875 1
(5,464) 3.836 1,250 2,586 (160) 1,340 1,271 69
(6,203) 462.937 460,281 2,656
12,050 185,400 181,028 4,372 (200) 42,250 40,197 2,053
250 250 (50) 1,450 1,450
(6,220) 75,840 70,985 4,855 482 482 449 33
(3,792) 10,222 6.773 3,449 4.400 4.344 56
2,270 320,294 303,776 16,518
(535) 336,745 334.758 1,987 (2,885) 40,725 40,097 628
(440) 3,880 3.105 775 4,750 2,515 2,235
(1,975)
(5,835) 386.100 380,475 5,625
explanation of significant budget variances, original and final.
(CONTINUED TO NEXT PAGE)
59

C-1 STERLING HIGH SCHOOL DISTRICT Required Supplementary Information
Budgetary Comparison Schedule General Fund
For the Fiscal Year Ended June 30,2011
Variance Continued from prior page) Original Budget Final Final to
Budget Transfers Budget Actual Actual
Educational Media Services/School Library: Salaries S 64,140 $ 535 $ 64,675 $ 64,671 $ 4 Other purchased services 12,500 12,500 12,037 463 Supplies and materials 15,536 15,536 10.782 4,754
Total educational media services/school library 92,176 535 92,711 87,490 5,221
General Administration: Salaries 244,200 (2,350) 241,850 241.557 293 Salaries of attorneys 10,000 3,300 13,300 12,000 1,300 Other Admin salaries 2,350 2,350 2.300 50 Legal services 10,000 17,919 27.919 27.147 772 Audit services 24,700 800 25.500 25.500 Other purchased professional services 30,400 4,790 35.190 35,190 Communications / telephone 87,880 8,430 96,310 96.063 247 BOE other purchased services 5,970 5,700 11,670 11,332 338 Other purchased services 17,450 (425) 17,025 16,951 74 Supplies and materials 2,550 690 3,240 1,958 1,282 BOE In-house Training/Meeting supplies 200 380 580 427 153 Miscellaneous expenditures 2,653 (1.280) 1.373 1,349 24 BOE Membership Dues and Fees 11,630 (1,750) 9,880 9,876 4
Total general administration 447,633 38.554 486,187 481,650 4.537
School Administration: Salaries of principals/assist, principals 244,500 200 244.700 244,700 Salaries of secretarial and clerical assistants 105,380 2,885 108.265 108,263 2 Travel 625 625 372 253 Other purchased services 5,145 (505) 4,640 4,333 307 Supplies and materials 2,700 2,700 2,291 409 Other objects 2,825 (2,825)
Total school administration 360,550 380 360,930 359,959 971
Central Services: Salaries 263,400 (89,766) 173,634 173,596 38 Purchased professional services 19,040 (19,040) Misc. purchased services 229,304 229,304 228,502 802 Supplies and materials 6,450 (5,711) 739 739 Miscellaneous expenditures 1,420 (1,220) 200 200
Total central services 290,310 113,567 403,877 403.037 840
Admin Info Technology Salaries 5,000 (5,000)
Total admin info technology 5,000 (5.000)
See Management's Discussion and Analysis section of this report for explanation of significant budget variances, original and final.
(CONTINUED TO NEXT PAGE)
60
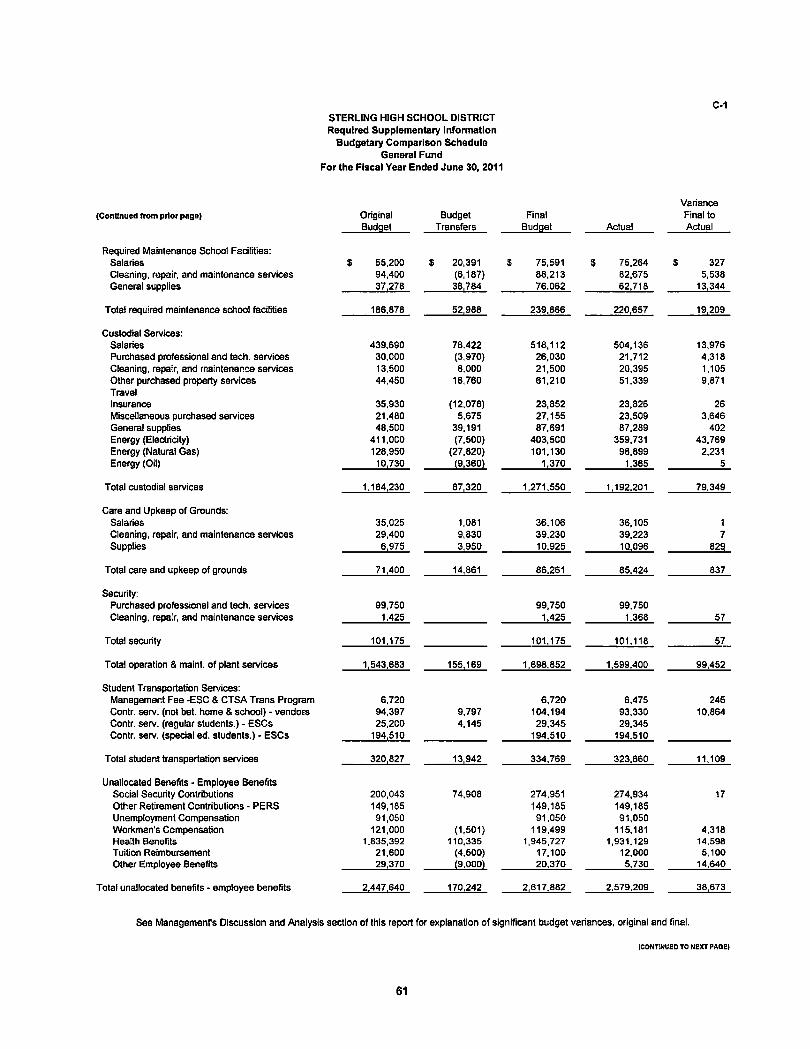
STERLING HIGH SCHOOL DISTRICT Required Supplementary Information
Budgetary Comparison Schedule General Fund
For the Fiscal Year Ended June 30, 2011
Variance (Continued from prior page) Original Budget Final Final to
Budget Transfers Budget Actual Actual
Required Maintenance School Facilities: Salaries $ 55,200 $ 20.391 S 75.591 $ 75,264 S 327 Cleaning, repair, and maintenance services 94,400 (6.187) 88,213 82,675 5,538 General supplies 37.278 38.784 76,062 62.718 13.344
Total required maintenance school facilities 186,878 52.988 239.866 220,657 19.209
Custodial Services: Salaries 439,690 78,422 518.112 504.136 13.976 Purchased professional and tech. services 30,000 (3,970) 26,030 21,712 4,318 Cleaning, repair, and maintenance services 13,500 8,000 21,500 20,395 1,105 Other purchased property services 44,450 16,760 61,210 51.339 9,871 Travel Insurance 35,930 (12,078) 23.852 23,826 26 Miscellaneous purchased services 21,480 5,675 27,155 23.509 3,646 General supplies 48.500 39.191 87,691 87.289 402 Energy (Electricity) 411.000 (7.500) 403,500 359.731 43.769 Energy (Natural Gas) 128.950 (27.820) 101,130 98.899 2.231 Energy (Oil) 10.730 (9.360) 1,370 1.365 5
Total custodial services 1,184.230 87.320 1.271,550 1.192.201 79,349
Care and Upkeep of Grounds: Salaries 35.025 1,081 36,106 36.105 1 Cleaning, repair, and maintenance services 29.400 9,830 39,230 39.223 7 Supplies 6.975 3,950 10,925 10,096 829
Total care and upkeep of grounds 71.400 14,861 86.261 85.424 837
Security: Purchased professional and tech. services 99,750 99.750 99,750 Cleaning, repair, and maintenance services 1.425 1,425 1.368 57
Total security 101.175 101,175 101,118 57
Total operation & maint. of plant services 1,543,683 155,169 1,698,852 1,599.400 99,452
Student Transportation Services: Management Fee - E S C & C T S A Trans Program 6,720 6,720 6,475 245 Contr. serv. (not bet. home & school) - vendors 94,397 9,797 104,194 93.330 10.864 Contr. serv. (regular students.) - E S C s 25,200 4.145 29,345 29.345 Contr. serv. (special ed. students.) • E S C s 194.510 194.510 194.510
Total student transportation services 320,827 13.942 334.769 323,660 11,109
Unallocated Benefits - Employee Benefits Social Security Contributions 200,043 74,908 274,951 274,934 17 Other Retirement Contributions - P E R S 149,185 149,185 149,185 Unemployment Compensation 91,050 91.050 91,050 Workman's Compensation 121,000 (1.501) 119.499 115,181 4.318 Health Benefits 1,835.392 110.335 1.945.727 1.931,129 14,598 Tuition Reimbursement 21.600 (4.500) 17.100 12,000 5,100 Other Employee Benefits 29.370 (9.000) 20.370 5.730 14.640
Total unallocated benefits - employee benefits 2.447.640 170.242 2,617.882 2.579,209 38,673
See Management's Discussion and Analysis section of this report for explanation of significant budget variances, original and final.
(CONTINUED TO NEXT PAGE)
61

STERLING HIGH SCHOOL DISTRICT Required Supplementary Information
Budgetary Comparison Schedule General Fund
For the Fiscal Year Ended June 30, 2011
Variance (Continued from prior page) Original
Budget Budget
Transfers Final
Budget Actual Final to Actual
On-behalf T P A F pension contr. (non-budgeted) Reimbursed TPAF social security contr. (non-budgeted)
$ 458,224 491,164
$ (458,224) (491,164)
Total Undistributed Expenditures $ 7.743,238 $ 134.003 $ 7.877.241 8,435,023 (557,782)
, Total General Current Expense 14.365,053 (31.610) 14.335.875 14.711.545 (390,785)
CAPITAL OUTLAY: Interest deposit to capital reseve 180 (180)
Equipment: Grades 9-12 23.675 362,950 386,625 226.843 159,782
Total Equipment 23.675 362,950 386,625 226.843 159,782
Facilities Acquisition and Const. Services: Other objects 1.325 1,325 1.325
Total Facilities acq. and const, serv. 1,325 1.325 1,325
Total Capital Outlay 25,180 362,770 387,950 228.168 159.782
Total Expenditures 14,390,233 331,160 14,723.825 14.939,713 (231.003)
Excess (Deficiency) of Revenues Over (Under) Expenditures: (220,646) (127,521) (350,599) 332,464 667,948
Other Financing Sources (Uses): Operating transfers out
Total Other Financing Sources
Excess (Deficiency) of Revenues and Other Financing Sources Over (Under) Expenditures and Other Financing Sources (Uses): (220,646) (127,521) (350,599) 332,464 667,948
Fund Balance, July 1, 2010 831,243 831,243 831,243
Fund Balance, June 30, 2011 $ 610.597 $ C127.521) $ 480.644 $ 1.163.707 $ 667.948
Recapitulation of Fund Balance: Restricted Fund Balance:
Capital reserve - designated in subsequent year's budget $ 393,665 Excess surplus 69,635
Assigned Fund Balance: Year-end encumbrances 213,894 Designated for subsequent year's expenditures 206,706
Unassigned Fund Balance: 279,807 1,163,707
Reconciliation to Governmental Funds Statements (GAAP): Last State Aid Payment not Recognized on G A A P Basis (529.468)
Fund Balance per Governmental Funds (GAAP) $ 634.239
See Management's Discussion and Analysis section of this report for explanation of significant budget variances, original and final.
62

C-1b STERLING HIGH SCHOOL DISTRICT Required Supplementary Information
Budgetary Comparison Schedule Education Jobs Fund
General Fund For the Fiscal Year Ended June 30,2011
Variance Original Budget
Budget Transfers
Final Budget Actual
Final to Actual
REVENUES: Federal sources:
Education Jobs Funds S 203,639 S 203,639 $ 203.639
Total Revenues 203,639 203,639 203,639
EXPENDITURES: CURRENT EXPENSE: Instruction: School-Sponsored Cocurricular Act - Instruction:
Salaries 19,702 19.702 19.702
Undistributed Expenditures: Custodial Services - Salaries
Unallocated Benefits - Employee Benefits Social Security Contributions Health Benefits
140,992
10,450 32,495
140,992
10,450 32,495
140.992
10,450 32.495
Total - Undistributed Expenditures 183,937 183,937 183,937
Total Expenditures 203,639 203,639 203.639
Excess of revenues over expenditures $ $ $ $ $
63

C-2 STERLING HIGH SCHOOL DISTRICT Required Supplementary Information
Budgetary Comparison Schedule Special Revenue Fund
For the Fiscal Year Ended June 30, 2011
Variance Original Budget
Budget Transfers
Final Budget Actual
Final to Actual
REVENUES: State sources Federal sources $ 570,766 $ 570.766 $ 498.472 $ (72,294)
Total Revenues 570.766 570.766 498.472 (72.294)
EXPENDITURES: Instruction:
Salaries of teachers Other salaries for instruction Other purchased services General supplies Travel Other objects
68,042 24,702
317.626 102.637 10,343 4,456
68,042 24,702
317,626 102,637 10,343 4,456
34,328 24,702
301,895 98,574 1,546 4.196
33,714
15,731 4,063 8,797
260
Total instruction 527,806 527,806 465,241 62.565
Support services: Salaries of other professional staff Personal services - employee benefits Purchased professional - tech. services Other purchased services Travel Supplies and materials
8,197 10.580 10,884 3,661
626 9.012
8,197 10,580 10,884 3,661
626 9,012
8,197 10,580 2,583 3,661
626 7,584
8,301
1,428
Total support services 42,960 42,960 33,231 9,729
Facilities acquisition and construction services: Instructional equipment Noninstructional equipment
Total facilities acq. and const, services
Total Expenditures 570.766 570,766 498,472 72.294
Total outflows 570.766 570,766 498,472 72,294
Excess (Deficiency) of revenues over (under) expenditures and other financing sources (uses)
See Management's Discussion and Analysis section of this report for explanation of significant budget variances, original and final.
64

C-3 STERLING HIGH SCHOOL DISTRICT
Notes to Required Supplementary Information Budgetary Comparison
For the Fiscal Year Ended June 30, 2011
Explanation of Differences between Budgetary Inflows and Outflows and GAAP Revenues and Expenditures
Special General Revenue
Fund Fund
Sources/inflows of resources Actual amounts (budgetary basis) "revenue"
from the budgetary comparison schedules $ 15,272,177 $ 498,472
Difference - budget to GAAP: Grant accounting budgetary basis differs from GAAP in that
encumbrances are recognized as expenditures, and the related revenue is recognized.
State aid payment recognized for GAAP statements in current year, previously recognized for budgetary purposes. 589,688
State aid payment recognized for budgetary purposes, not recognized for GAAP statements until the subsequent year. (529,468)
Total revenues as reported on the statement of revenues, expenditures, and changes in fund balances - governmental funds. $ 15.332,397 $ 498.472
Uses/outflows of resources Actual amounts (budgetary basis) "total expenditures" from
the budgetary comparison schedule $ 14,939,713 $ 498,472
Differences - budget to GAAP Encumbrances for supplies and equipment ordered but not
received is reported in the year the order is placed for budgetary purposes, but in the year the supplies are received for financial reporting purposes. 5,932
Total expenditures as reported on the statement of revenues, expenditures, and changes in fund balances - governmental funds $ 14.939,713 $ 504.404
65
Other Supplementary Information

Special Revenue Fund

E-1 STERLING HIGH S C H O O L DISTRICT
Special Revenue Fund Combining Schedule of Revenues and Expenditures
Budgetary Basis For the Fiscal Year Ended June 30,2011
ARRA IDEA ARRA Carryforward Carl ARRA IDEA IDEA Basic Title IV Title ISIA From
Perkins Title I Basic Basic Carryover Carryover Carryover Exh. E-1A Total REVENUES: State sources
Federal sources $ 22,655 $ 12,608 $ 108,685 $ 171,970 $ 55.033 $ 2,266 $ 6,628 $ 118,627 $ 498.472
Total Revenues 22.655 12,608 108,685 171,970 55.033 2.266 6.628 118.627 498.472
cn oo
EXPENDITURES: Instruction:
Salaries of teachers 2,094 12,576 3,500 16,158 34,328 Other salaries for instruction 24,702 24.702 Other purchased services 1,000 4,000 98,611 166,864 26,420 5,000 301,895 Travel 1,546 1,546 General supplies 21,655 5,664 1,991 2,001 4,711 2,860 59,692 98,574 Other objects 3,725 240 231 4,196
Total instruction 22,655 11,758 104,327 169.105 43.938 6,360 107,098 465,241
Support services: Salaries of other professional staff 8,197 8,197 Personal services-employee benefits 850 1,044 1,587 268 6,831 10,580 Purchased prof. tech. services 1,699 884 2,583 Other purchased services 3,661 3,661 Travel 626 626 General supplies 71_ 122 427 2.266 4.698 7,584
Total support services 850 4,358 2,865 11,095 2,266 268 11,529 33.231
Facilities acquisition and const, serv.: Instructional equipment
Total facilities acq. and const, serv.
Total Expenditures 22,655 12,608 108,685 171,970 55,033 2,266 6.628 118.627 498,472
Excess (deficiency) of revenues over (under) expenditures and other financing sources (uses)

E-1A STERLING HIGH SCHOOL DISTRICT
Special Revenue Fund Combining Schedule of Revenues and Expenditures
Budgetary Basis For the Fiscal Year Ended June 30, 2011
Title I Title I Title IIA SIA Title IV
Title I Carryover Title IIA Carryover Title IID Carryover Carryover Total REVENUES: State sources Federal sources $ 55,488 $ 25,156 $ 18,052 $ 18,730 $ 170 $ 861 $ 170 $ 118,627
Total Revenues 55,488 25,156 18,052 18,730 170 861 170 118,627
EXPENDITURES: Instruction:
Salaries of teachers Other salaries for instruction Other purchased services Travel
General supplies
Total instruction
Support services:
Personal services-employee benefits Supplies and materials
Total support services
Facilities acquisition and const, serv.: Instructional equipment
Total facilities acq. and const, serv.
Total Expenditures
3.159 24,702
680 17,000
45.541
5,671 4,276
9.947
5.000
19.734
24.734
422
422
4,921
866 11,555
17,342
710
710
8,078
10.202
18,280
450
450
170
170
861
861
170
170
16,158 24.702
5.000 1,546
59.692
107.098
6,831 4,698
11,529
55.488 25.156 18.052 18.730 170 861 170 118,627
Excess (deficiency) of revenues over (under) expenditures and other financing sources (uses)

Capital Projects Fund
The District does not maintain a capital projects fund.

[
1
I
Proprietary Funds
i

G-1 STERLING HIGH SCHOOL DISTRICT
Enterprise Funds Combining Statement of Net Assets
June 30,2011
Food Service
Fund
South Jersey
Technology Program
Fund Total ASSETS:
Current Assets: Cash and cash equivalents
Accounts receivable: Interfund Other
Inventories
Total Current Assets
Noncurrent Assets: Equipment
Less - accumulated depreciation
Total Noncurrent Assets
Total Assets
38,709
14,959 359
3,914
57.941
137,390 (72,570)
64,820
122,761
$ 81.427
3.187,255
3.268.682
1,795,674 (296,125)
1.499.549
4.768,231
$ 120.136
14.959 3.187.614
3.914
3.326.623
1.933,064 (368.695)
1.564.369
4.890.992
LIABILITIES: Current Liabilities:
Accounts payable
Total Current Liabilities
NET ASSETS: Invested in capital assets Unrestricted
64,820 57.941
1,943.975
1,943.975
1,499.549 1.324.707
1.943,975
1.943.975
1,564,369 1.382.648
Total Net Assets 122.761 S 2.824.256 $ 2.947.017
72

G-2 STERLING HIGH SCHOOL DISTRICT
Enterprise Funds Combining Statement of Revenues, Expenses
and Changes in Fund Net Assets For the Fiscal Year Ended June 30, 2011
South Jersey
Food Technology Service Program
Fund Fund Totals OPERATING REVENUES:
Charges for Services: Daily sales reimbursable programs:
School lunch $ 97,372 $ 97.372 Daily sales non-reimbursable programs:
Adult and alacarte sales 122,198 122,198 Program fees $ 14,043,654 14,043,654 Other 13,144 39,638 52.782
Total Operating Revenues 232,714 14.083,292 14.316,006
OPERATING EXPENSES: Salaries 130,063 2,302,150 2,432.213 Fringe benefits 357.417 357,417 Management fee 24,405 24,405 Purchased services 212,800 212,800 Supplies and materials 9,239 5,988,809 5,998,048 Utilities 21,874 21,874 Travel 20,120 20,120 Other costs 20,683 45,406 66,089 Depreciation 13,071 69,688 82,759 Cost of sales 144,997 3,547,194 3,692.191
Total Operating Expenses 342,458 12,565,458 12.907.916
Operating Income (Loss) (109,744) 1.517,834 1,408.090
Non-Operating Revenues: State sources:
State school lunch program 3,068 3.068 Federal sources:
National school lunch program 101,543 101,543 Food distribution program 13,144 13,144
Local sources: Interest earned 62 377 439
Total Non-Operating Revenues 117,817 377 118,194
Income (Loss) before Contributions and Transfers 8,073 1.518,211 1,526,284
Operating Transfers in
Changes in Net Assets 8,073 1,518.211 1,526,284 Net Assets - July 1, 2010 114,688 1.306,045 1.420.733
Net Assets - June 30, 2011 $ 122.761 $ 2.824.256 $ 2.947.017
73
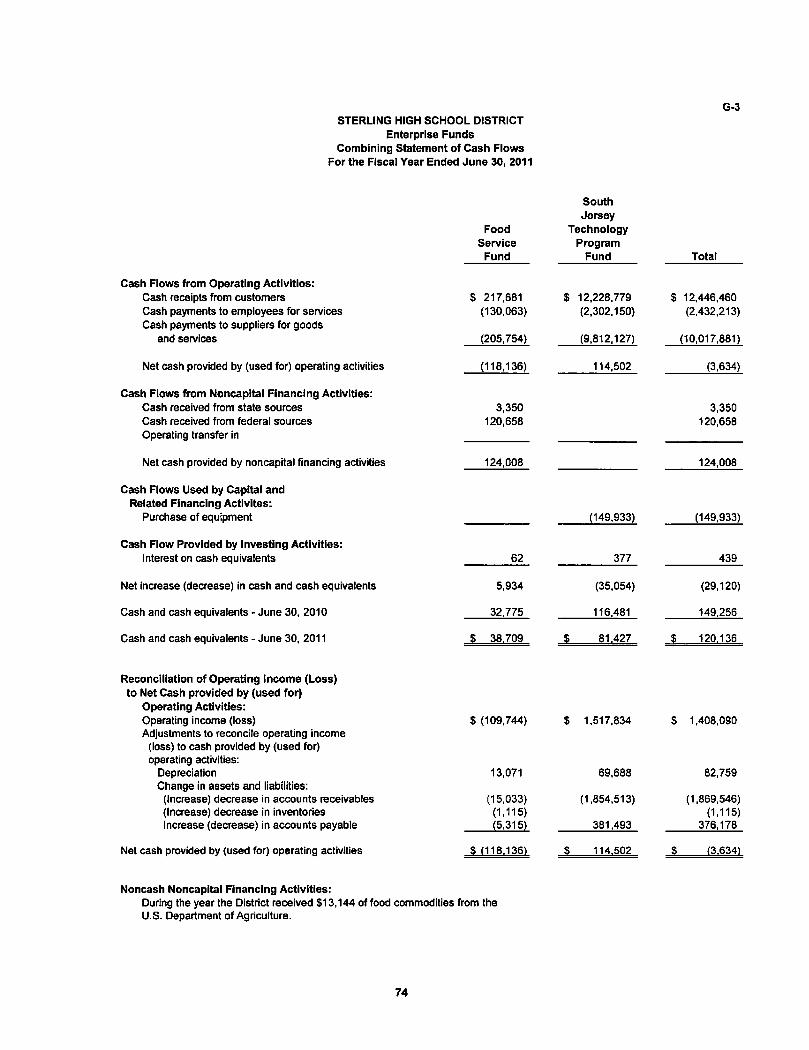
Cash Flows from Operating Activities: Cash receipts from customers Cash payments to employees for services Cash payments to suppliers for goods
and services
Net cash provided by (used for) operating activities
Cash Flows from Noncapital Financing Activities: Cash received from state sources Cash received from federal sources Operating transfer in
Net cash provided by noncapital financing activities
Cash Flows Used by Capital and Related Financing Activites:
Purchase of equipment
Cash Flow Provided by Investing Activities: Interest on cash equivalents
Net increase (decrease) in cash and cash equivalents
Cash and cash equivalents - June 30, 2010
Cash and cash equivalents - June 30, 2011
STERLING HIGH SCHOOL DISTRICT Enterprise Funds
Combining Statement of Cash Flows For the Fiscal Year Ended June 30, 2011
Food Service
Fund
S 217,681 (130,063)
(205,754)
(118,136)
3,350 120,658
124,008
62
5,934
32,775
$ 38.709
South Jersey
Technology Program
Fund Total
$ 12,228,779 $ 12,446,460 (2,302.150) (2.432,213)
(9,812,127) (10.017.881)
114,502 (3,634)
3,350 120,658
124,008
(149.933) (149.933)
377_ 439_
(35,054) (29.120)
116.481 149.256
$ 81.427 $ 120.136
Reconciliation of Operating Income (Loss) to Net Cash provided by (used for)
Operating Activities: Operating income (loss) Adjustments to reconcile operating income
(loss) to cash provided by (used for) operating activities:
Depreciation Change in assets and liabilities: (Increase) decrease in accounts receivables (Increase) decrease in inventories Increase (decrease) in accounts payable
Net cash provided by (used for) operating activities
$ (109.744) $ 1.517.834 S 1.408.090
13,071
(15,033) (1.115) (5.315)
69,688
(1.854,513)
381,493
82,759
(1,869,546) (1.115)
376,178
8 (118.136) $ 114.502 (3.634)
Noncash Noncapital Financing Activities: During the year the District received $13,144 of food commodities from the U.S. Department of Agriculture.
74

Fiduciary Funds

STERLING HIGH SCHOOL DISTRICT Fiduciary Funds
Combining Statement of Fiduciary Net Assets June 30,2011
ASSETS:
Cash and cash equivalents
Total Assets
Trust Funds Private
Unemployment Purpose Compensation Scholarship
Insurance Funds
38,284
38,284
Agency Funds
Student Activity Payroll
$ 8,055 $ 73,776 $ 305,717
8,055 $ 73.776 $ 305.717
LIABILITIES: Payroll deductions and withholdings Due to employees Due to student groups
Total Liabilities
$ 73,776
$ 73.776
$ 237,007 68,710
S 305.717
NET ASSETS:
Held in trust for unemployment claims and other purposes
Reserved for scholarships
Total Net Assets
38,284
S 38.284
8,055
$ 8.055
76

H-2
STERLING HIGH SCHOOL DISTRICT Fiduciary Funds
Combining Statement of Changes in Fiduciary Net Assets For the Fiscal Year Ended June 30, 2011
ADDITIONS: Local Sources: Interest on investments Board contribution Employee withholdings
Total Additions
Scholarship Funds
$ 43
Unemployment Compensation
Insurance Trust Fund
41 91,050 30,464
43 121,555
Totals
$ 84 91,050 30,464
121,598
Deductions: Unemployment compensation
insurance claims Scholarships
Total Deductions
Change in Net Assets
Net Assets - July 1, 2010
Net Assets - June 30, 2011
43
8,012
$ 8.055
123,564
123,564
(2,009)
40,293
$ 38,284
123,564
123,564
(1,966)
53,170
$ 51.204
77

H-3 STERLING HIGH SCHOOL DISTRICT
Fiduciary Funds Student Activity Agency Fund Schedule of Receipts and Disbursements
For the Fiscal Year Ended June 30, 2011
Balance Cash Cash Balance June 20, 2010 Receipts Disbursements Transfers June 30, 2011
Accolade $ 16,368 $ 6,315 $ 3,533 $ 21 $ 19.171 Amnesty International 282 282 -AP Exams 1,208 6,988 7,350 5 851 Art Auction Scholarship 29 65 94 Athletic Hall of Fame 1,601 6,092 7,140 1 554 Band 75 75 -Channel 19 709 1,225 179 1 1,756 Chorale 1,751 2,110 1,895 2 1,968 Class of 2004 3,308 3,308 -Class of 2005 2,210 2,210 Class of 2006 3,668 3,668 -Class of 2007 533 533 Class of 2008 398 398 Class of 2009 1,402 1,402 Class of 2010 586 586 Class of 2011 3,370 3,627 3,446 (594) 2,957 Class of 2012 590 1,036 1,010 1 617 Class of 2013 803 2,153 2,838 1 119 Class of 2014 1,303 25 1 1,279 Clay Club 126 126 Coordinator Class of 2009 5 (5) -Coordinator Class of 2010 827 200 (827) (200) Coordinator Class of 2011 12,702 78,940 90,151 958 2,449 Coordinator Class of 2012 751 30,559 24,758 419 6,971 Coordinator Class of 2013 200 200 400 Coordinator Class of 2014 200 200 Drama 3,820 5,210 2,782 7 6,255 Entrepreneurship 381 (381) -FBLA 574 90 1 665 Foods 169 169 -Interact 335 335 National Honor Society 597 2,365 2,520 1 443 Renaissance 4,085 14,785 14,416 6 4,460 ROTC 4,464 334 739 5 4,064 SAT/PSAT 155 5,540 5,753 58 -School Store 837 5,074 2.874 384 3,421 Silver Scroll 1,266 2 1,268 Social Studies Seminar 1,490 1,850 2,515 64 889 Softball 207 (207) -Strength and Conditioning Club 303 1,325 1,169 459 Student Council 1,608 1,276 670 2 2,216 S.A.D.D. 659 238 1 422 Transition Projects 394 (394) -General Account 4,709 68 1,030 32 3,779 Revolving Account 408 4,370 4,370 408 Smoking Fines 184 184 World Language 61 944 945 60 Miscellaneous (1.155) 1,162 7
Total all accounts $ 76.843 $ 187.416 $ 190.048 $ (435) $ 73.776
78
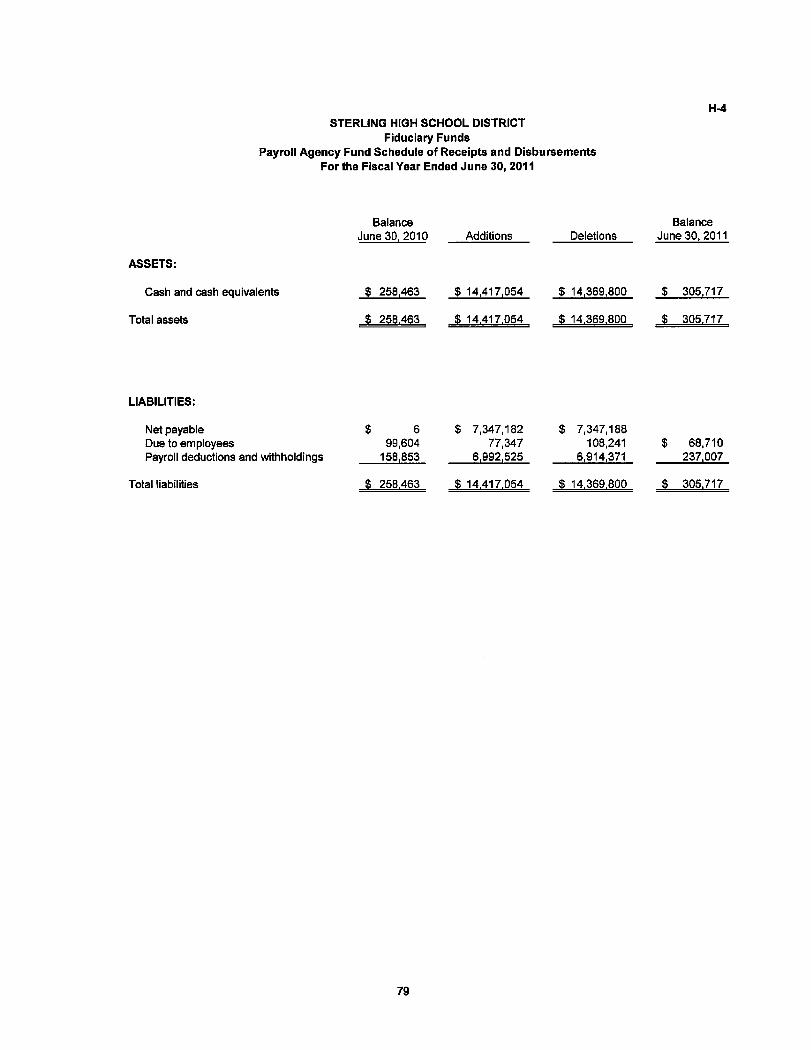
H-4 STERLING HIGH SCHOOL DISTRICT
Fiduciary Funds Payroll Agency Fund Schedule of Receipts and Disbursements
For the Fiscal Year Ended June 30, 2011
ASSETS:
Cash and cash equivalents
Total assets
Balance June 30, 2010
$ 258,463
$ 258.463
Additions Deletions Balance
June 30, 2011
$ 14,417,054 $ 14,369,800 $ 305,717
$ 14.417,054 $ 14.369.800 $ 305.717
LIABILITIES:
Net payable $ 6 $ 7,347,182 $ 7,347,188 Due to employees 99,604 77,347 108,241 $ 68,710 Payroll deductions and withholdings 158,853 6.992.525 6.914.371 237.007
Total liabilities $ 258.463 $ 14.417.054 $ 14.369.800 $ 305.717
79

Long-Term Debt Schedules
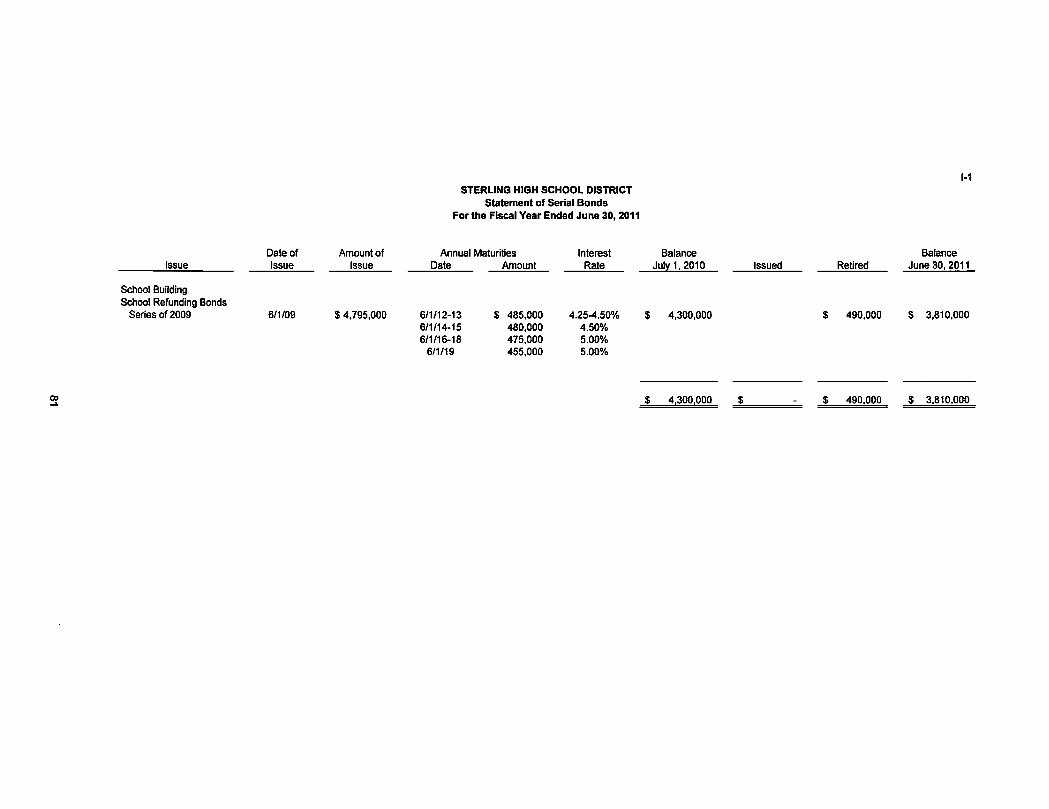
Date of Amount of Issue Issue Issue
School Building School Refunding Bonds
Series of 2009 6/1/09 $4,795,000
STERLING HIGH SCHOOL DISTRICT Statement of Serial Bonds
For the Fiscal Year Ended June 30,2011
1-1
Annual Maturities Date Amount
Interest Rate
Balance July 1.2010 Issued Retired
Balance June 30. 2011
6/1/12-13 6/1/14-15 6/1/16-18
6/1/19
485,000 480,000 475,000 455,000
4.25-4.50% 4.50% 5.00% 5.00%
$ 4,300,000 $ 490,000 $ 3,810,000
4,300.000 $ 490.000 $ 3.810,000

1-3 STERLING HIGH SCHOOL DISTRICT
Budgetary Comparison Schedule Debt Service Fund
For the Fiscal Year Ended June 30,2011
Variance Original Budget Final Final to Budget Transfers Budget Actual Actual
REVENUES: Local sources:
Local tax levy $ 423,008 $ 423,008 $ 423,008
State sources: State Aid 266,230 266,230 266,230
Total Revenues 689,238 689,238 689,238
EXPENDITURES: Regular debt service:
Interest 199,238 199,238 199,238 Redemption of principal 490,000 490,000 490,000
Total Expenditures 689,238 689,238 689,238 _
Excess (Deficiency) of revenues over (under) expenditures
Fund Balance-July 1,2010 45,341 45,341 45,341 _
Fund Balance-June 30,2011 $ 45,341 _$ $ 45,341 $ 45,341 $
Recapitulation of Excess (Deficiency) or revenues over (under) expenditures
Budgeted Fund Balance $ $ $ $ $
82

Statistical Section
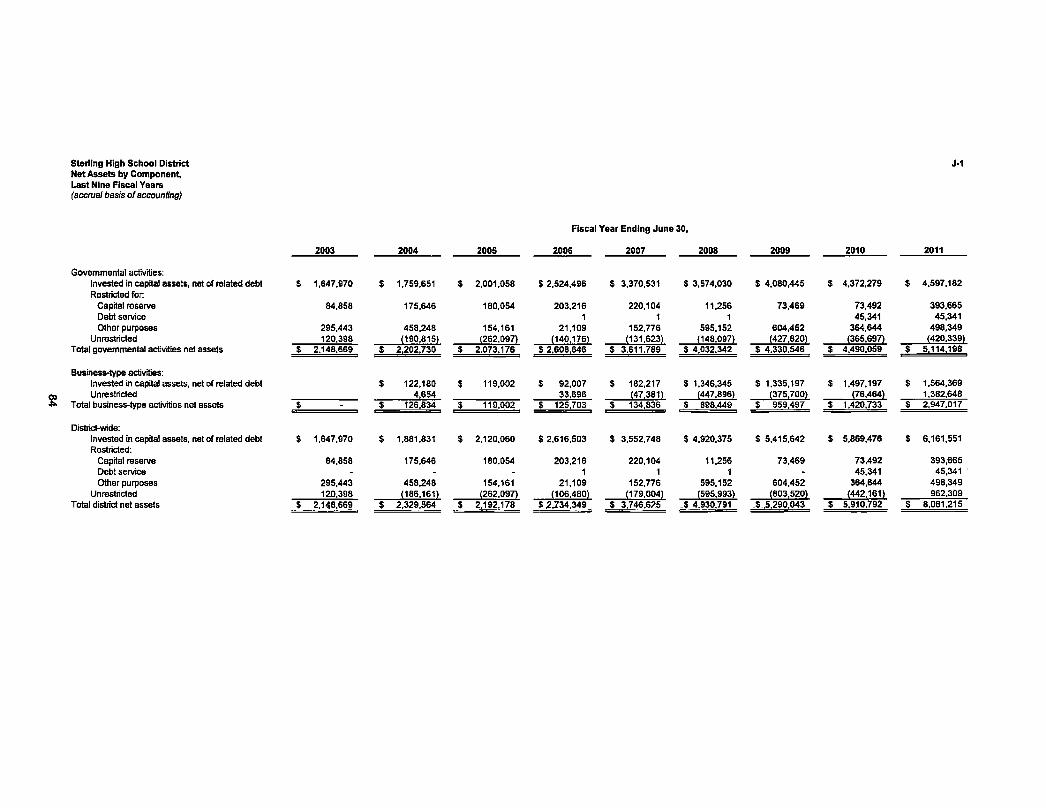
Sterling High School District Net Assets by Component, Last Nine Fiscal Years (accrual basis of accounting)
2003 2004 2005
Governmental activities: Invested in capital assets, net of related debt Restricted for.
Capital reserve Debt service Other purposes
Unrestricted
S 1,647.970
84.858
295.443 120.398
S 1,759,651
175,646
458.248 (190,815)
$ 2,001,058
180,054
154,161 (262,097)
Total governmental activities net assets $ 2.148.669 $ 2,202.730 $ 2.073.176
Business-type activities: Invested in capital assets, net of related debt Unrestricted
$ 122,180 4,654
$ 119.002
Total business-type activities net assets $ - $ 126.834 $ 119,002
District-wide: Invested in capital assets, net of related debt Restricted:
Capital reserve Debt service Other purposes
Unrestricted
$ 1.647.970
84,858
295.443 120.398
$ 1.881.831
175.646
458,248 (186,161)
$ 2.120.060
180,054
154,161 (262.097)
Total district net assets $ 2.148,669 $ 2,329.564 S 2.192.178
Fiscal Year Ending June 30,
2008 2007 2008 2009 2010 2011
$ 2.524,496 S 3,370.531 S 3,574,030
203,216 220.104 11,256 1 1 1
21,109 152,776 595.152 (140,176) (131.623) (148.097)
$ 2.608.646 $ 3.611.789 $ 4,032.342
S 92.007 $ 182,217 $ 1,346.345 33,696 (47.381) (447.896)
$ 125,703 $ 134.836 S 898,449
$ 2.616.503 $ 3.552.748 $ 4,920.375
203.216 220,104 11.256 1 1 1
21.109 152,776 595.152 (106.480) (179.004) (595.993)
$ 2.734.349 S 3.746.625 $ 4.930,791
$ 4.080,445 $ 4,372.279 $ 4.597.182
73.469 73,492 393,665 45,341 45,341
604,452 364,644 498.349 (427,820) (365,697) (420.339)
$ 4.330.546 S 4,490.059 $ 5.114,198
$ 1.335,197 $ 1,497,197 S 1.564.369 (375,700) (76,464) 1,382,648
$ 959,497 $ 1.420,733 $ 2.947.017
S 5,415,642 $ 5,869,476 $ 6.161.551
73.469 73,492 393,665 - 45.341 45,341
604.452 364,644 498,349 (803,520) (442.161) 962.309
S 5.290.043 $ 5.910.792 s 8,061.215

Sterling High School District Changes in Net Assets, Last Nine Fiscal Years (accrual basis of accounting)
J-2
2003 2004 2005
Expenses: Governmental activities:
Instruction: Regular $ 5,869,122 $ 6,401,037 $ 6,473.449 Special education 638,551 698,514 655,264 Other instruction 837.982 831,272 905,517
Support Services: Tuition 620.110 558,267 603.192 Student & instruction related services 1.371.413 1,513,327 1,408,208 School administrative services 514.886 556.130 596.728 General and business administrative services 474,808 468.258 929,410 Plant operations and maintenance 1.684.735 2.182.082 2,407,662 Pupil transportation 245,959 226.864 238.156 Business and other support services 322,357 390.159 Unallocated employee benefits
Special schools 43.262 14.837 20.053 Interest on long-term debt 405.014 382.417 388,439 Unallocated depreciation 56.271 100.427 84.934
Total governmental activities expenses 13,084,470 14,323,591 14,709.012
Business-type activities: South Jersey Technology Program 383,275 716,893 Food Service Program
Total business-type activities expense - 383,275 716.893 Total district expenses $ 13,084,470 $ 14.706,866 $ 15,425,905
Fiscal Year Ending June 30,
2006 2007 2008 2009 2010 2011
$ 5,294,566 $ 5,274,056 $ 5.357.079 $ 5,657,204 $ 5,651,269 $ 5,204,519 525,957 652,306 834.121 809,346 678,092 875,215 741.710 812.182 826.981 812,690 826,708 722,287
913.777 829.074 735.708 743,456 743,065 327.766 1.025.649 1.183.653 1,390,855 1,550,841 1,755.987 1,444,185
520.675 370.261 356,932 355,608 343.592 359,959 676.821 702,251 785,180 823.484 875.639 904,047
1.688,137 1,983,835 2.088,289 1.898.009 1.716,252 1,686.656 294,678 297,047 354,507 335.171 366,486 323.660
2.633.115 3,268.370 3.431.311 3.064,835 3,409,339 3.528.597
334.811 312.882 290.004 264,033 216,880 197.605 84,934 311,518 89.439 87,745 73,594 321.472
14,734,830 15,997,435 16.540,406 16,402,422 16,656,901 15,895,968
2,754,778 3.502.405 5.559.574 6,980.065 11,726.398 12,565,458 322.282 368.644 308,075 322.495 342,458
2,754.778 3.824.687 5.928,218 7.288,140 12.048.893 12,907,916 $ 17.489,608 $ 19,822,122 $ 22,468,624 $ 23,690,562 $ 28.705.794 $ 28.803.884
Program Revenues: Governmental activities:
Charges for services: Instruction (tuition)
Operating grants and contributions Total governmental activities program revenues
1,620.183 1.398.986 3,019.149
1.708,336 1.534,769 3.243,105
1.618,686 1.541.631 3.160.317
1,740,177 1,692,672 3,432.849
2,006,401 2.160,492 4.166.893
2,110,599 2.247.807 4.358.406
$ 1.823,439 1,605,775 3,429,214
$ 1,950,676 1.802,672 3,753.348
$ 1.765.260 1.714.090 3,479.350
(Continued)

Sterling High School District Changes in Net Assets, Last Nine Fiscal Years (accrual basis of accounting)
2003 2004 2005
Business-type activities: Charges for services:
South Jersey Technology Program $ 488.268 $ 681.486 Food Service Program
Operating grants and contributions Capital grants and contributions
Total business type activities program revenues - 488.268 681.486 Total district program revenues $ 3.019,149 $ 3.731,373 $ 3.841.803
Net (ExpenseVRevenue: Governmental activities $(10,065,321) $ (11.080.486) $ (11,548.695) Business-type activities - 104.993 (35,407) Total district-wide net expense $(10,065,321) $ (10,975.493) $ (11,584,102)
General Revenues and Other Changes In Net Assets: Governmental activities:
Property taxes levied for general purposes, net $ 5.352,969 $ 5,930,442 $ 6,250.278 Taxes levied for debt service 410,862 414,664 417,730 Unrestricted grants and contributions 4,283,272 4.650.291 4,741.538 State aid restricted for capital projects Investment earnings 658 646 4,408 Miscellaneous income 237,479 160.345 32.762 Forgiven debt Transfers (21.841) (27.575)
Total governmental activities 10,285.240 11,134.547 11.419.141
Business-type activities: Investment earnings Contributions Transfers 21,841 27.575
Total business-type activities - 21,841 27.575 Total district-wide $ 10.285.240 $ 11.156,388 $ 11.446.716
Change in Net Assets: Governmental activities $ 219.919 $ 54,061 $ (129,554) Business-type activities - 126,834 (7,832)
Total district-wide $ 219,919 $ 180,895 $ (137.386)
J-2
Fiscal Year Ending June 30,
2008 2007 2008 2009 2010 2011
$ 2.789.054 $ 3.573,585 $ 5,770.674 $ 7.044,204 $11,980,077 $ 14.083.292 238.277 266,885 233,928 231,544 232.714 55.267 75,807 70,932 108.852 117.755
2.789,054 3.865,129 6.113,366 7.349,084 12,320,473 14,433.761 $ 6.221.903 $ 8.032.022 $ 10.471J72 $ 10,778.278 $ 16.073.821 $ 17,913.111
$(11,301,981) $ (11.830,542) $ (12.182,000) $(12,973,208) $(12,903,553) $ (12,416,618) 34.276 40.442 185.148 60,924 271,580 1.525.845
$(11,267.7051 $ (11.790.100) $ (11.996.852) $(12,912,284) $(12,631,973) $ (10.890,773)
$ 6,488,143 $ 7.035.610 $ 7.203.319 $ 6,984,760 $ 6,819.170 $ 6,901.937 409,126 408,176 406.738 402,245 389.681 423,008
4,757,557 4,752,180 4,934.711 5.528,502 6.018.342 5,703,484 65,305 8,581 16,888 367 237 35 73
81,164 128,962 57,418 18,668 24,691 12.255 337,000
27.575 169.257 (188.853) 11,837.451 12,511.073 12.602.553 13,271,412 13.063.066 13.040.757
558 550 124 802 439 137.390 577.915
(27.575) (169.257) 188.853 (27.575) (31,309) 578.465 124 189,655 439
$ 11,809.876 $ 12,479,764 $ 13.181.018 $ 13,271,536 $ 13.252.721 $ 13,041.196
$ 535.470 $ 680.531 $ 420.553 $ 298,204 $ 159.513 $ 624.139 6,701 9,133 763.613 61,048 461.235 1,526,284
$ 542,171 $ 689.664 $ 1.184,166 $ 359,252 $ 620.748 $ 2,150.423

Sterling High School District Fund Balances, Governmental Funds, Last Nine Fiscal Years (modified accrual basis of accounting)
2003 2004 2005
General Fund: Restricted for
Capital reserve Excess surplus
Assigned to: Year-end Encumbrances Designated for subsequent year's budget
Unassigned Total general fund
Ail Other Governmental Funds Co Assigned to:
Year-end Encumbrances Unassigned, reported in:
Special revenue fund $ (2,628) $ (942) $ (942) Capital projects fund 125.000 Debt service fund
84.858 175,646 $ 180,054
295.443
259.434 $ 639.735
434,863 23.385
(43,214) 590.680
29.161 (72,888) 136,327
Total all other governmental funds $ (2,628) $ (942) $ 124,058
J-3
Fiscal Year Ending June 30,
2006 2007 2008 2009 2010 2011
$ 203,216 $ 220,104 $ 11.256 $ 73.469 $ 73.492 $ 393.665 6,109 2.159 284.602 196.783 69.635
233.142 107,168 129.952 213.894 15.000 150.617 28.159 284.602 220.646 206.706 43.894 82.533 81.353 (226.085) (182.535) (249.661)
$ 268.219 $ 455.413 $ 638,512 $ 435.937 $ 241.555 $ 634.239
$ 49.249 $ 15,899 S 14,046 $ 8.114
(942) $ (942) (942)
1 1 1 45.341 45.341
(941) $ (941)" $ 48.308" $ 15,899" $ 59,387~ $ S3,455~

Sterling High School District j-4 Changes in Fund Balances, Governmental Funds, Last Ten Fiscal Years (modified accrual basis of accounting)
Fiscal Year Ending June 30,
2002 2003 2004 2005 2006 2007 2008 2009 2010 2011
Revenues Tax levy $ 5,143,210 $ 5.763.831 $ 6.345.106 $ 6,668.008 $ 6.897,269 $ 7.443.786 $ 7,610,057 $ 7.387.005 $ 7.208,851 $ 7,324.945 Tuition charges 1.348.603 1,620.183 1.708.336 1.763.866 1.740.177 2.006.401 2.110,599 1.823.439 1.950,676 1.765,260 Interest earnings 40.313 658 646 4.408 8,581 16.888 387 237 35 73 Miscellaneous 91.983 237.479 160.545 33.662 82.265 128.962 57,418 18.668 24.691 12,255 State sources 5.257.966 5,445.222 5.892.660 6,018.375 6.185,102 6.529.118 6.833,759 6.799.257 6.342.078 6,695.531 Federal sources 242,634 302.820 292,200 263.895 329.332 383,554 398.008 335,020 1.478.936 722,043
Total revenue 12.124,709 13,370.193 14,399,493 14.752.214 15.242.726 16.508.709 17.010.208 16.363.626 17.005.267 16.520.107
Expenditures Instruction
Regular Instruction 4.160.761 4.406.781 4,863.762 4,873.508 5.027.731 5,181.738 5.053,887 5,399.790 5,383,347 5.150,193 Special education instruction 339.812 498.126 541.332 510.253 525.957 652.306 834.121 809.346 678.092 875.215 Other instruction 724.086 692.837 687.559 744.438 741.710 812.182 826,981 812.690 826.706 722.287
Support Services: Tuition 539.516 620.110 558,267 603.192 913,777 829.074 735.708 743,456 743.065 327.766 Student & instruction related services 1.188.965 1.115.571 1,230.055 1.126.720 1,025,649 1.183.653 1,390.855 1.550,841 1.755.987 1,444.185 School administrative services 413,651 405.667 434.232 459.813 520.675 370,281 356.932 355.608 343.592 359.959 General and business admin.services 601,901 586,445 686.272 735.798 637.367 695.328 743.474 782,626 834.071 884.687 Plant operations and maintenance 1.363,944 1.468,478 1,699.139 1.946.753 1.688,137 1.926.973 1,811.534 1,798.341 1,716.252 1,599.400 Pupil transportation 215.892 245.137 226,864 238.156 294.678 297.047 354.507 335.171 366.486 323,660 Other support services 1.515,616 2,072.542 2,277.820 2.472.148 2,633.115 3.268.370 3,431.311 3.064.835 3.409.339 3,528,597
Special Schools 48,595 34,837 11.494 19.130 Capital outlay 135,285 195.976 400.808 365.517 457,980 479.037 446,567 162.672 198,942 228,168 Debt service:
Principal 370.000 395.000 425.000 455.000 460,000 480.000 500.000 515.000 495.000 490.000 Interest and other charges 426.177 405.014 382.417 358,386 336.632 314.782 291.983 268.234 218.429 199.238
Total expenditures 12.044,201 13.142.521 14.425.021 14.908,812 15.263.408 16,490.771 16.777.860 16.598.610 16.967.308 16.133.355 Excess (Deficiency) of revenues
over (under) expenditures 80,508 227.672 (25.528) (156,598) (20.682) 17.938 232.348 (234.984) 37,959 386,752
Other Financing sources (uses) Contributions 187,257 Prior Year Receivable Canceled (145,180) Transfers in 88.984 145.000 27.575 333.833 Transfers out (86,964) (21.841) (172.575) (18,000) (333.833) (188.853)
Total other financing sources (uses) - - (21.841) (172.755) 27.575 169,257 - - (188,853) -
Net change in fund balances $ 80.508 S 227.672 $ (47.389) S (329.353) $ 6.893 $ 187.195 $ 232.348 S (234.984) S (150.894) $ 386.752
Debt service as a percentage of noncapital expenditures 6.69% 6.18% 5.76% 5.59% 5.38% 4.96% 4.85% 4.77% 4.25% 4.33%
Source: District records
Note: Noncapital expenditures are total expenditures less capital outlay.

Sterling High School District General Fund - Other Local Revenue by Source Last Ten Fiscal Years (modified accrual basis of accounting)
Fiscal Year Interest on Summer Ending June 30, Investments School Tuition
2002 $ 40,313 $ 1,348,603 2003 9,981 1,620,183 2004 5,468 1,708,336 2005 18.126 $ 2,900 1,763,866 2006 17,038 4,585 1,740,177 2007 60,832 2,006,401 2008 32,493 2,110,599 2009 4,442 1,823,439 2010 2,501 1,950,676 2011 1,409 1,765,260
$ 192,603 $ 7,485 $ 17,837,540
Source: District records
J-5
Prior Year Gate Shared Refunds Receipts Services Miscellaneous Total
$ 91,983 $ 1,480,899 $ 13,506 $ 179,387 35,263 1,858,320
$ 200 14,476 132.047 9,000 1,869,527 $ 200 12,434 4,610 1,801,936 12,545 56,678 1,831,023 16,908 68,110 2,152,251 17,544 7,748 2,168,384 9,764 4,699 1,842,344
6,684 8,266 7.275 1,975,402 6,684 10.037 882 1,777,588
$ 6,884 $ 115,480 $ 368,112 $ 229,570 $18,757,674

Starling High School District Assessed Value and Actual Value of Taxable Property, Last Ten Fiscal Years
BOROUGH OF MAGNOLIA
Fiscal Total Direct Year Public Tax- School Tax Estimated Actual
Ended Total Assessed Utilities Net Valuation Exempt Rate (County Equalized) June 30, Vacant Land Residential Commercial Industrial Apartment Value a Taxable Property b Value
2002 $ 3,221,800 S 126.749.900 S 15.600.300 $ 5,928.200 S 6.945,900 S 158.446,100 $ 249.066 S 158.695,166 S 22.919.100 $ 0.923 S 157,379.502 2003 2.966.400 126.875,700 16.089.800 5.928.200 6,945,900 158,806,000 266.143 159,072,143 23,102,900 0.949 163.518.782 2004 2.971.800 127.343.000 15.975.100 5.733.800 6.945.900 158.969.600 236.064 159.205.664 22.990.100 1.074 175.878.211 2005 2.838.200 127,653,600 16.452.400 5,331.900 6.945.900 159.222.000 208.251 159.430.251 23.003.500 0.990 188,479.779 2006 3,108.200 128.113.000 16.359.000 4.992,700 6.945.900 159,518,800 158.095 159,676,895 22.844,500 1.120 225.905.501 2007 3.610.200 128.799.900 15.649.300 4.706.900 6.945.900 159.912.200 118.800 160,031.000 23.275.700 1.142 268,550.405 2008 3.669.300 129,499.600 15,631,600 4,635.600 6.945.900 160.382.000 139.785 160.521,785 23.275.700 1.108 295,260.363 2009 3.536,700 130.123.500 15.350.700 4,635,600 6.945.900 160,592,400 147,832 160,740,232 31,030,000 1.117 303.929,460 2010 3.535.600 130.928.800 15.377.100 4.635.600 6,945.900 161,423,000 145.452 161.568.452 30.959.700 1.095 301.694.228 2011 3,374.000 131.001,800 15,190,600 4,635.600 6.845.900 161,047.900 111.099 161.158.999 31.133.300 1.043 Not Available
BOROUGH OF SOMERDALE
Fiscal Total Direct Year Public Tax- School Tax Estimated Actual
Ended Total Assessed Utilities Net Valuation Exempt Rate (County Equalized) June 30, Vacant Land Residential Commercial Industrial Apartment Value a Taxable Prone rtv b Value
2002 S 2.008,600 S 145.282.600 S 30.941.900 $ 8.907,300 S 6.881.800 S 194.022,200 $ 516.944 $ 194.539,144 S 15,290.900 $ 0.725 S 196.568,934 2003 2.018.600 145.703.000 30.801.000 8,907.300 6.881.800 194.311.700 511.390 194.823.090 15.119.100 1.072 207.794.505 2004 1.961.200 145.926.800 30.747.500 8,907,300 6.881.800 194.424.600 459.447 194.884.047 15.562.100 1.053 220.357.342 2005 1,923.800 146,368,900 27.479.600 8.881.700 6.881,800 191.535,800 402.259 191.938.059 15,651.400 1.147 230.435,501 2006 1.891.800 146.789.900 27.484.200 8.351.300 6.881.800 191.399,000 417.872 191.816.872 16.366.900 1.210 264.492.196 2007 1.729.600 147.447.900 27.490.900 8.351.300 6.881.800 191.901.500 293.365 192.194.865 16.554.400 1.235 313.463.600 2008 1.852.800 148.046.400 27.557,800 8,351,300 6.881.800 192,690,100 267,761 192,957,861 25,266.420 1.185 341.393,323 2009 R 11.899.200 268.224.800 39.040.800 14.238.200 12.198,500 345,601.500 520,073 346.121.573 40,633,820 0.641 344.663.075 2010 11.202.300 268.689.200 38.260.600 13.852.200 12.198.500 344.202.800 618.511 344.821.311 41.860.020 0.686 349.765.208 2011 11,652,500 268.415.200 37,583.526 13.695,100 11.861.200 343.207,526 482.451 343,689.977 41.831.020 0.621 Not Available
BOROUGH OF STRATFORD
Fiscal Total Direct Year Public Tax- School Tax Estimated Actual
Ended Total Assessed Utilities Net Valuation Exempt Rate (County Equalized) June 30, Vacant Land Residential Commercial Industrial Apartment Value a Taxable Property b Value
2002 $ 1,393.500 S 220.045.700 $ 50.233.900 S 11.719,200 S 283.392.300 $ 1,046.845 S 284.439,145 S 107,848.400 S 0.865 s 291.177,977 2003 832.700 220.907.800 51.409.500 11.719.200 284,869.200 1,047.764 285.916.964 107.956.200 0.961 306.314.570 2004 897.100 221.087.300 51.635.800 11,719,200 285.339.400 907.799 286.247,199 107,378,800 1.014 329.892.851 2005 991.500 221.322.200 51,888,300 11.719,200 285.921.200 793.350 286.714.550 114,410.400 1.087 353.190.249 2006 1.217,600 222.038.200 51.677.500 11.719,200 286.652.500 627,546 287.260.046 114,281,300 1.160 405.841,538 2007 1.279.000 222.380.900 50.205,800 11.719,200 285.584.900 566,657 286.151.557 114.281.300 1.190 450.575.963 2008 1,102.000 223.214,100 50.293.300 11.719,200 286,328.600 533,921 286,862.521 114,170.300 1.158 499.930.936 2009 1.270.400 223.821,900 49.569.200 11.719.200 286.380.700 553.109 286.933.809 113,997,708 1.113 511.054,933 2010 1.239,600 223.754,900 49,017,800 11.719.200 285.731.500 534.531 286.266.031 114.504.500 1.114 519.218.591 2011 1.299.600 224.379,500 48.385.800 11.719.200 285.784,100 452,738 286.236,838 114,302,700 1.053 Not Available
Source: Municipal Tax Assessor
Note: Real property is required to be assessed at some percentage of true value (fair or market value) established by each county board of taxation. Reassessment occurs when ordered by the County Board of Taxation
a Taxable Value of Machinery, Improvements and Equipment of Telephone. Telegraph and Messenger System Companies
b Tax rates are per S100 of assessed valuation.
R Reassessment

Sterling High School District Direct and Overlapping Property Tax Rates Last Ten Fiscal Years (rare per $100 of assessed value)
Fiscal Direct Rate Overlapping Rates Total Year Regional Local Direct and
Ended School School Camden Overlapping Tax June 30, District District Borough County Rate
BOROUGH OF MAGNOLIA
2002 $ 0.923 $ 1.269 $ 1.013 $ 0.955 $ 4.160 2003 0.949 1.365 1.051 0.995 4.360 2004 1.074 1.458 1.035 0.979 4.546 2005 0.990 1.610 1.055 0.981 4.636 2006 1.120 1.752 1.109 1.147 5.128 2007 1.142 2.001 1.158 1.180 5.481 2008 1.108 1.893 1.329 1.171 5.501 2009 1.117 1.958 1.396 1.171 5.642 2010 1.095 2.007 1.396 1.219 5.717 2011 1.043 1.984 1.446 1.349 5.822
BOROUGH OF SOMERDALE
2002 $ 0.725 $ 1.214 $ 0.978 $ 1.012 $ 3.929 2003 1.072 1.440 0.918 1.030 4.460 2004 1.053 1.539 0.998 1.001 4.591 2005 1.147 1.623 1.062 0.979 4.811 2006 1.210 1.707 1.161 1.118 5.196 2007 1.235 1.772 1.293 1.147 5.447 2008 1.185 1.765 1.409 1.127 5.486 2009 0.641 0.999 0.813 0.618 3.071 2010 0.686 1.024 0.839 0.662 3.211 2011 0.621 1.038 0.875 0.740 3.274
BOROUGH OF STRATFORD
2002 $ 2003 2004 2005 2006 2007 2008 2009 2010 2011
0.865 $ 0.961 1.014 1.087 1.160 1.190 1.158 1.113 1.114 1.053
1.379 1.532 1.678 1.791 1.927 2.022 2.040 2.025 2.066 2.106
$ 0.636 0.678 0.705 0.762 0.849 1.006 1.162 1.149 1.183 1.182
$ 0.910 0.966 0.950 0.954 1.055 1.037 1.026 1.030 1.107 1.195
$ 3.790 4.137 4.347 4.594 4.991 5.255 5.386 5.317 5.470 5.536
Source: Municipal Tax Collector
91

Sterling High School District Principal Property Tax Payers, Current Year and Nine Years Ago
J-8
BOROUGH OF MAGNOLIA 2010-2011
Taxable % of Total Assessed District Net
Taxpayer Value Assessed Value
Barrington SFP Associates $ 4.014.200 2.49% Coventry Place Apartments 3.150.000 1.95% Raab Family Partnership 2.295.900 1.42% Walgreen Eastern Co. 1.400.000 0.87% FVB Enterprises - Hobby Shop 975.000 0.60% Green Garden Apartments 900.000 0.56% 700 White Horse Pike 838.500 0.52% Albert Gentile 637.000 0.40% Magnolia Properties. LLC 596,000 0.37% Scanned Urban Renewal 588.800 0.37%
Total $ 15.395.400 9.55%
BOROUGH OF SOMERDALE 2010-2011
Taxable % of Total Assessed District Net
Taxpayer Value Assessed Value
National Realty Property Owners $ 3.594.400 1.05% Wal-Mart 3.454,000 1.00% Buchman. Myron & Tanya 3.920.800 1.14% Warwick Terrace 2,464,000 0.72% Somerdale Equities. LLC 2.347.400 0.68% JMK Investment Co. 2.236.600 0.65% 600 White Horse Pike. LLC 1.500.000 0.44% Kiedjan Family. LLC 1.740.000 0.51% Rite Aid of New Jersey 1.559.300 0.45% WaWa LLC 1.541.600 0.45%
Total S 24.358.100 7.09%
BOROUGH OF STRATFORD 2010-2011
Taxable % of Total Assessed District Net
Taxpayer Value Assessed Value
AEJ Stratford LLC $ 4,843.900 1.69% Woodmere Investment Association 4,200.000 1.47% J Teitelbaum Nursing Home 2,913.000 1.02% Echelon Ford 2.841.100 0.99% Stratford Properties. LLC 1,764.600 0.62% Laurel Mills. LLC 1,700.000 0.59% Stratford Investors 1.634,900 0.57% LaMartinique Bowling Academy 1,560.600 0.55% Stanton Meltzer 1,489,200 0.52% Stratford Court Apartments 1.425,000 0.50%
Total $ 24.372.300 8.51%
Source: Municipal Tax Assessor
2001-2002 Taxable % of Total
Assessed District Net Taxpayer Value Assessed Value
AP-Kegra Barrington $ 4.300.000 2.71% Coventry Place Apartments 3.150,000 1.98% Wallgreen Eastern 1.590.600 1.00% Raab Family - Apartments 1.392.000 0.88% Raab Family - Apartments 1.000.000 0.63% Felix V. Bass/FVB Enterprise 975,000 0.61% Raab Family - Apartments 903.900 0.57% Ibisi, Dilaver - Diner 668.800 0.42% Tarn Dor Associates 600.000 0.38% JMK Investments 524.400 0.33%
$ 15.104.700 9.52%
2001-2002 Taxable % of Total
Assessed District Net Taxpayer Value Assessed Value
National Realty Property Owners $ 10.655.800 5.48% JMK Investment Co. 3.322.400 1.71% Buchman. Myron & Tanya 2.319,500 1.19% Warwick Terrace 1.330.000 0.68% Somerdale Equities. LLC 1,237,500 0.64% P. Kiejdan 1.046.100 0.54% WaWa LLC 870.000 0.45% Rite Aid of New Jersey 696.800 0.36% Fresta Associates 635.500 0.33% Somerdale Diner and Restaurant 589.400 0.30%
$ 22.703.000 11.67%
2001-2002 Taxable % of Total
Assessed District Net Taxpayer Value Assessed Value
Juster Management Co. $ 4.750.000 1.67% Woodmere Investment Assoc. 4.200.000 1.48% LaMartinique Bowling Academy 2.949.500 1.04% J Teitelbaum Nursing Home 2.913.000 1.02% Ford Leasing Development 2.791.100 0.98% Camden Securities Co. 1.890.000 0.66% Gross & Kowit Shopping Center 1.634.900 0.57% Aidi. Inc. 1.439.300 0.51% Stratford Court Apartments 1.425.000 0.50% Stratford Court Apartments 1.345.000 0.47%
S 25.337.800 8.91%
92

Sterling High School District Property Tax Levies and Collections, Last Ten Fiscal Years
J-9
Collected within the Fiscal Year Taxes Levied of the Levy* Collections in
Fiscal Year for the Fiscal Percentage Subsequent Ended June 30, Year Amount of Levy Years
2002 $ 5,143,210 $ 5,143,210 100.00% 2003 5,763,831 5,763,831 100.00% -2004 6,345,106 6,345,106 100.00% -2005 6,668,008 6,668,008 100.00% -2006 6,897,269 6,897,269 100.00% -2007 7,443,786 7,443,786 100.00% -2008 7,610,057 7,610,057 100.00% -2009 7,387,005 7,387,005 100.00% -2010 7,208,851 7,208,851 100.00% -2011 7,324,945 7,324,945 100.00% -
Source: District records including the Certificate and Report of School Taxes (A4F form)
a School taxes are collected by the Municipal Tax Collector. Under New Jersey State Statutes, a municipality is required to remit to the school district the entire property tax balance, in the amount voted upon or certified prior to the end of the school year.
93

Sterling High School District J-10 Ratios of Outstanding Debt by Type Last Ten Fiscal Years (dollars in thousands, except per capita)
Business-Type Governmental Activities Activities Per Capita0
Fiscal Year General Percentage of
Ended Obligation Capital Personal June 30, Bonds a Leases Capital Leases Total District Income b Magnolia Somerdale Stratford
2002 $ 8,362,000 $ $ $ 8.362,000 1.58% $ 1,907 $ 1,618 $ 1,156 2003 7,967,000 - - 7,967,000 1.46% 1,813 1,539 1.101 2004 7,542,000 - - 7,542,000 1.34% 1,723 1,462 1,047 2005 7,087.000 - - 7,087,000 1.22% 1,625 1,380 989 2006 6,627,000 - - 6,627,000 1.10% 1,520 1.291 926 2007 6,147,000 - - 6,147,000 0.96% 1,408 1,201 863 2008 5,647,000 - - 5,647,000 0.85% 1,297 1,104 796 2009 4,795,000 - - 4,795,000 0.70% 1,106 942 679 2010 4,300,000 - - 4,300.000 0.63% 993 844 610 2011 3,810,000 - - 3,810,000 Unavailable 880 748 541
Sources: a District Records b Personal Income has been estimated based upon the municipal population and per capita
personal income. c Per Capita Personal Inome Data provided by the NJ Dept. of Labor and Workforce.

Sterling High School District J-11 Ratios of Net General Bonded Debt Outstanding Last Ten Fiscal Years (dollars in thousands, except per capita)
General Bonded Debt Outstanding Year General Net General Percentage of Net Assessed
Ended June 30,
Obligation Bonds Deductions
Bonded Debt Outstandinga
Valuation Taxable b Per Capita 0 Ended June 30,
Obligation Bonds Deductions
Bonded Debt Outstandinga Magnolia Somerdale Stratford Magnolia Somerdale Stratford
2002 $ 8,362,000 $ $ 8,362,000 5.27% 4.30% 2.94% $ 1,907 $ 1,618 $ 1,156 2003 7,967,000 - 7,967,000 5.01% 4.09% 2.79% 1,813 1,539 1,101 2004 7,542,000 - 7,542,000 4.74% 3.87% 2.63% 1,723 1,462 1,047 2005 7,087,000 - 7,087,000 4.45% 3.69% 2.47% 1,625 1,380 989 2006 6,627,000 - 6,627,000 4.15% 3.45% 2.31% 1,520 1,291 926 2007 6,147,000 - 6,147,000 3.84% 3.20% 2.15% 1,408 1,201 863 2008 5,647,000 - 5,647,000 3.52% 2.93% 1.97% 1,297 1,104 796 2009 4,795,000 - 4,795,000 2.98% 1.39% 1.67% 1,106 942 679 2010 4,300,000 - 4,300,000 2.66% 1.25% 1.50% 993 844 610 2011 3,810,000 - 3,810,000 2.36% 1.11% 1.33% 880 748 541
Sources: a District Records b Net Assessed Valuation provided by Anstract of Ratables, County Board of Taxation c Per Capita Personal Inome Data provided by the NJ Dept. of Labor and Workforce.

Sterling High School District Ratios of Overlapping Governmental Activities Debt As of December 31, 2010
J-12
Estimated Estimated Share
Governmental Unit Debt
Outstanding Percentage Applicable a
of Overlapping Debt
Debt repaid with property taxes:
Borough of Magnolia $ 3,361,682 0) 100.000% $ 3,361,682 Borough of Somerdale 6,062,780 (D 100.000% 6,062,780 Borough of Stratford 2,530,390 (D 100.000% 2,530,390 Camden County General Obligation Debt 156,835,508 (D 2.730% (2) 4,281,609
Subtotal, overlapping debt 16,236.461
Sterling High School District Direct Debt 3,810,000
Total direct and overlapping debt $ 20,046,461
Sources: (1) Entity's Audit Report (2) The County percentage is based upon a calculation reflecting the three Borough's share of the 2010 Equalized Valuation.
The source for this computation was the 2010 County Abstract of Ratables, provided by the County Board of Taxation.
96

Sterling High School District Legal Debt Margin Information, Last Ten Fiscal Years (dollars in thousands)
J-13
Legal Debt Margin Calculation for Fiscal Year 2011
Equalized valuation basis (1) 2010 $ 1,151.822,165
1,151.134,498 1,143,801,282
2009 2008
$ 3,446,757.945
Average equalized valuation of taxable property $ 1,148,919,315
Debt limit (4% of average equalized valuation) (2) Net bonded school debt (3)
45,956,773 3,810,000
Legal debt margin S 42.146,773
2002 2003 2004 2005
Fiscal Year
2006 2007 2008 2009 2010 2011
CD >i Debt limit $ 18,909,888 $ 18,961,470 $ 19,477,441 $20,147,864 $ 29,206,523 $32,127,249 $ 36,045,654 $ 40,112.318 $ 43,358,287 $ 45.956,773
Total net debt applicable to limit (3) 8,362.000 7,967,000 7,542.000 7.087,000 6.627,000 6.147,000 5,647,000 4,795,000 4,300,000 3.810.000
Legal debt margin $ 10,547.888 $ 10,994,470 $ 11,935.441 $ 13,060.864 $ 22.579,523 $ 25,980.249 $ 30.398.654 $ 35,317,318 $ 39.058.287 $ 42.146,773
Total net debt applicable to the limit as a percentage of debt limit 44.22% 42.02% 38.72% 35.17% 22.69% 19.13% 15.67% 11.95% 9.92% 8.29%
Sources: (1) Equalized valuation bases were obtained from the Annual Report of the State of New Jersey, Department of Treasury, Division of Taxation. (2) Limit set by NJSA 18A:24-19 for a K through 8 district. (3) District Records

Sterling High School District Demographic and Economic Statistics Last Ten Fiscal Years
J-14
Per Capita Personal Personal
Year Population a Income b Income 0 Unemployment Rate d
Magnolia Somerdale Stratford Magnolia Somerdale Stratford
2001 4,386 5,168 7,236 $ 530,748,690 $ 31,611 2.8% 2.9% 3.1% 2002 4,394 5,177 7,236 545,874,553 32,479 3.9% 4.1% 4.4% 2003 4,377 5,157 7,205 563,719,303 33,677 4.1% 4.3% 4.6% 2004 4,361 5,137 7,168 580,410,116 34,826 3.7% 3.8% 4.1% 2005 4,361 5,133 7,155 601,495,072 36,128 8.0% 4.7% 3.8% 2006 4,367 5,120 7,120 639,103,788 38,484 8.6% 5.1% 4.1% 2007 4,355 5,114 7,095 663,421,328 40,052 7.9% 4.6% 3.8% 2008 4,334 5,091 7,060 681,423,960 41,336 10.3% 6.1% 5.0% 2009 4,332 5,093 7,044 679,873,258 41,282 15.9% 9.6% 7.9% 2010 4,332 5.093 7,044 e e 16.5% 10.1% 8.3%
Source: a Population information provided by the NJ Dept of Labor and Workforce Development b Personal income has been established based upon the municipal population and per
capita personal income presented. c Per Capita personal income provided by the NJ Dept. of Labor and Workforce Development. d Unemployment data provided by the NJ Dept of Labor and Workforce Development 6 Information not available

Sterling High School District Full-time Equivalent District Employees by Function/Program, Last Ten Fiscal Years
Function/Program
Instruction Regular Special education Other special education Other instruction
Support Services: School administrative services District administrative services Plant operations and maintenance Business and other support services
Total
2002 2003 2004
80 80 81 6 6 6
11 11 11 3 4 4
7 7 7 2 2 2
16 16 17 4 4 4
129 130 132
Source: District Personnel Records
J-16
2005 2006 2007 2008 2009 2010 2011
80 6
12 4
79 6
13 6
80 8
15 6
80.6 11.8 12.0 6.0
70.0 11.0 6.0
10.0
72.0 12.0 9.0
10.0
71.0 12.0 9.0
10.0
7 2
17 4
132
7 2
17 4
134
6 2
17 4
138
6.7 2.0
17.0 4.0
140
9.0 3.0
17.0 4.0
130
9.0 3.0
16.0 4.0
135
8.0 3.0
18.0
131.0

J-17 Sterling High School District Last Ten F iscal Years
Average
Pupil /Teacher Daily Average Daily % Change in Student Fiscal Student Operating C o s t Per Percentage Teaching Ratio High Enrollment Attendance Average Daily Attendance Year Enrollment Expend i tu res 0 Pupil Change Staff" S c h o o l ( A D E ) c ( A D A ) c Enrollment Percentage
2002 913 $ 11,112.739 $ 12,171.67 -3.73% 76 1:12 924.9 870.6 3.12% 94.13% 2003 913 12,146,531 13.303.98 9.30% 76 1:12 927.2 876.9 0.25% 94.58% 2004 943 13,216,796 14.015.69 5.35% 86 1:11 961.4 899.4 3.68% 93.55% 2005 956 13.729,909 14,361.83 2.47% 86 1:11 970.1 904.6 0.90% 93.25% 2006 974 14.008.796 14.382.75 0.15% 85 1:11 978.4 912.8 0.86% 93.30% 2007 995 15.216.952 15.293.42 6.33% 88 1:11 1,049.0 994.0 7.22% 94.76% 2008 1,047 15.539,310 14,841.75 -2.95% 91 1:12 1,001.2 958.2 -4.56% 95.71% 2009 1,011 15,652,704 15.482.40 4.32% 89 1:11 1,018.2 965.2 1.70% 94.79% 2010 1,077 16,056,937 14,908.95 -3.70% 92 1:12 1,086.5 1,047.1 6.71% 98.37% 2011 997 15,215,949 15.261.73 2.37% 93 1:11 969.8 879.9 -10.74% 90.73%
Sources: District records
Note: Enrollment based on annual October district count.
a Operating expenditures equal total expenditures less debt service and capital outlay, b Teaching staff includes only full-time equivalents of certificated staff. c Average daily enrollment and average daily attendance are obtained from the School Register Summary (SRS).

Sterling High Schoo l District Schoo l Building Information Last Ten Fiscal Years
District Building High School Sterling High (1960)
Square Feet Capacity (students) Enrollment
Other Garage
Square Feet Concession Stand
Square Feet South Jersey Technology Program/
Concession Stand - Square Feet
2002 2003 2004
160,844 160,844 160,844 995 995 995 913 913 943
7,600 7,600 7.600
2,000 2,000 2,000
Number of Schools at June 30, 2011 Elementary = 0 Middle School = 0 Senior High School = 1 Other = 2
Source: District Facilities Office
J-18
2005 2006 2007 2008 2009 2010 2011
160,844 160,844 160,844 160,844 160,844 160,844 160,844 995 995 995 995 995 995 995 956 974 995 1,047 1,011 1,077 997
7.600 7.600 7,600 7,600 7.600 7,600 7.600
2,000 2.000 2.000
11,420 11.420 11,420 11.420

Sterling High School District Schedule of Required Maintenance Last Ten Fiscal Years
J-19
UNDISTRIBUTED EXPENDITURES - REQUIRED MAINTENANCE FOR SCHOOL FACILITIES
11-000-261-xxx
2002 2003 2004 2005 2006 2007 2008 2009 2010 2011 Total * School Facilities
High School $ 511,480 $ 517,450 $ 321,574 $ 565.517 $ 378.316 S 506.187 S 462.593 $ 630.078 S 321.974 $ 234.400 $ 4.449.569
Total School Facilities $ 511.480 $ 517.450 S 321.574 $ 565.517 $ 378.316 $ 506.187 $ 462.593 $ 630.078 S 321.974 S 234.400 $ 4.449.569
I * School facilities as defined under EFCFA.
(N.J.A.C. 6A:26-1.2 and N . J A C . 6A:26A-1.3)
Source: District records

Sterling High School District Insurance Schedule June 30, 2011
School Package Policy (1) Building and Contents (All Locations) Limits of liability per occurrence
General and Automobile Liability Excess Liability
J-20
Coverage
25,948,335 5,000,000
10,000,000
Self-insured Retention Deductible
1,000 1,000
$ 10,000
School Leaders Errors & Omission (2)
Workers' Compensation (2)
1,000,000
Statutory
1,000
Surety Bonds (3) Treasurer Board Secretary
200,000 75,000
(1) School Alliance Insurance Fund (2) New Jersey School Boards Association Insurance Group (3) Selective Insurance Group
Source: District records
103

Single Audit Section

INVERSO & STEWART, LLC
Certified Public Accountants Registered Municipal Accountants
12000 Lincoln Drive West, Suite 402 Marlton, New Jersey 080S3 (856) 983-2244 Fax (856) 983-6674 E-Mail: [email protected]
-Member of-Amcrican Institute of CPAs New Jersey Society of CPAs
INDEPENDENT AUDITOR'S REPORT ON COMPLIANCE WITH REQUIREMENTS THAT COULD HAVE A DIRECT AND MATERIAL EFFECT ON EACH MAJOR PROGRAM
AND ON INTERNAL CONTROL OVER COMPLIANCE IN ACCORDANCE WITH OMB CIRCULAR A-133 AND NEW JERSEY OMB CIRCULAR 04-04
The Honorable President and Members of the Board of Education
Sterling High School District County of Camden Somerdale, New Jersey
Compliance
We have audited Sterling High School District (School District), in the County of Camden, State of New Jersey's compliance with the types of compliance requirements described in the OMB Circular A-133 Compliance Supplement, and the New Jersey State Grant Compliance Supplement that could have a direct and material effect on each of the School District's major federal and state programs for the fiscal year ended June 30, 2011. The School District's major federal and state programs are identified in the summary of auditor's results section of the accompanying schedule of findings and questioned costs. Compliance with the requirements of laws, regulations, contracts and grants applicable to each of its major federal and state programs is the responsibility of the School District's management. Our responsibility is to express an opinion on the School District's compliance based on our audit.
We conducted our audit of compliance in accordance with auditing standards generally accepted in the United States of America; the standards applicable to financial audits contained in Government Auditing Standards, issued by the Comptroller General of the United States; OMB Circular A-133 Audits of State, Local Governments, and Non-Profit Organizations: audit requirements as prescribed by the Division of Finance, Department of Education, State of New Jersey; and New Jersey OMB's Circular 04-04, Single Audit Policy for Recipients of Federal Grants, State Grants and State Aid. Those standards and OMB Circular A-133 and New Jersey OMB's Circular 04-04, require that we plan and perform the audit to obtain reasonable assurance about whether noncompliance with the types of compliance requirements referred to above that could have a direct and material effect on a major federal or state program occurred. An audit includes examining, on a test basis, evidence about the School District's compliance with those requirements and performing such other procedures as we considered necessary in the circumstances. We believe that our audit provides a reasonable basis for our opinion. Our audit does not provide a legal determination on the School District's compliance with those requirements.
In our opinion, the Sterling High School District, in the County of Camden, State of New Jersey, complied, in all material respects, with the compliance requirements referred to above that could have a direct and material effect on each of its major federal and state programs for the fiscal year ended June 30, 2011.
105
Internal Control Over Compliance
Management of the Sterling High School District is responsible for establishing and maintaining effective internal control over compliance with requirements of laws, regulations, contracts and grants applicable to federal and state programs. In planning and performing our audit, we considered the School District's internal control over compliance with the requirements that could have a direct and material effect on a major federal or state program to determine the auditing procedures for the purpose of expressing our opinion on compliance and to test and report on internal control over compliance in accordance with OMB Circular A-133 and New Jersey OMB's Circular 04-04, but not for the purpose of expressing an opinion on the effectiveness of internal control over compliance. Accordingly, we do not express an opinion on the effectiveness of the School District's internal control over compliance.
A deficiency in internal control over compliance exists when the design or operation of a control over compliance does not allow management or employees, in the normal course of performing their assigned functions, to prevent, or detect and correct, noncompliance with a type of compliance requirement of a federal or state program on a timely basis. A material weakness in internal control over compliance is a deficiency, or combination of deficiencies, in internal control over compliance, such that there is a reasonable possibility that material noncompliance with a type of compliance requirement of a federal or state program will not be prevented, or detected and corrected, on a timely basis.
Our consideration of internal control over compliance was for the limited purpose described in the first paragraph of this section and was not designed to identify all deficiencies in internal control over compliance that might be deficiencies, significant deficiencies or material weaknesses. We did not identify any deficiencies in internal control over compliance that we consider to be material weaknesses, as defined above.
This report is intended solely for the information and use of the management, the Board of Education, others within the School District, the Division of Finance, Department of Education, State of New Jersey, and other federal awarding agencies and is not intended to be and should not be used by anyone other than these specified parties.
Respectfully submitted,
INVERSO & STEWART, LLC Certified Public Accountants
Robert A. Stewart Public School Accountant
Marlton, New Jersey October 7, 2011
106

K-3 SCHEDULE A
STERLING HIGH SCHOOL DISTRICT Schedule of Expenditures of Federal Awards
For the Fiscal Year Ended June 30,2011
Balance. June 30, 2010 Balance. June 30. 2011 Federal Grantor/Pass-Through Grantor/ CFDA Grant or State Award Period (Accounts Deferred Due to Cash Budgetary of Prior Years' (Accounts Deferred Prosram Title Number Project Number Amount From - To Receivable) Revenue Grantor Adjustments Received Expenditures Balances Receivable) Revenue
U.S. Department of Education Passed-th rough State Department of Education:
General Fund: Education Jobs Fund 84.410A N/A S 203,639 7/1/10-6/30/11 $ 161.791 S (203.639) S (41.848)
Special Revenue Fund: Title I:
Fiscal Year 2011 84.01 OA NCLB503S11 93,588 9/1/10 • •8/31/11 44.941 (55.488) (48.647) S 38,100 Fiscal Year 2010 84.01 OA NCLB503S10 103,262 9/1/09 • • 8/31/10 $ (63.718) S 39.243 S 847 23.895 (25,156) (24.889) ARRA 84.389 N/A 28,680 9/1/09 -• 8/31/10 (28.680) 12.608 28.680 (12,608)
Title I - SIA: Fiscal Year 2010 84.01 OA NCLB503S10 10,861 9/1/09 • B/31/10 (10.861) 800 61 (861) (10,861) ARRA 84.389 N/A 6.628 9/1/09 - 8/31/10 (6.628) 6.628 6.628 (6.628)
Title II A: Fiscal Year 2011 84.367A NCLB503511 24.545 9/1/10 • 8/31/11 4,150 (18.052) (20.395) 6.493 Fiscal Year 2010 84.367A NCLB503S10 33.761 9/1/09 - 8/31/10 (29.216) 18.431 299 9.636 (16,730) (19.580)
Title II D: Fiscal Year 2011 84.31 BX NCLBS03511 170 9/1/10-•8/31/11 (170) (170) Fiscal Year 2010 84.318X NCLB5O3510 988 9/1/09 • 8/31/10 (988) $988
Title IV: Fiscal Year 2011 84.1B6A NCLB503511 9/1/10-•8/31/11 170 (170) Fiscal Year 2010 84.186A NCLBS03S10 2,524 9/1/09 • • 8/31/10 (2.266) 2.266 1.336 (2,266) (930)
^ I.D.E.A. Part B - Basic: " ARRA 84.391 N/A 223.604 9/1/09-> 8/31/10 (106.685) 52.4B2 2,551 106,685 (55,033)
Fiscal Year 2011 84.027 FT503511 199.673 9/1/10 • B/31/11 137.424 (171,970) (62,249) 27.703 Fiscal Year 2010 84.027 FT503510 224.054 9/1/09- 8/31/10 (224.054) 108.685 224,054 (108,685)
Carl D. Perkins: Fiscal Year 2011 84.048 PERK5035-11 22,655 9/1/10 - B/31/11 22,655 (22,655) Fiscal Year 2010 84.048 PERK5035-10 26.163 9/1/09 • 8/31/10 (42) 42
Due to Grantor
Total U.S. Department of Education
U.S. Department of Agriculture Passed-through State Department of Education: Food Distribution Program:
Fiscal Year 2011 10.550 N/A National School Lunch Program
Fiscal Year 2009 10.555 N/A Fiscal Year 2010 10.555 N/A
Total U.S. Department of Agriculture
U.S. Department of Health and Human Services Passed-th rough State Department of Human Services:
General Fund:
Medicaid Assistance Program 93.778 N/A
Total Federal Awards
(473,138) 241.143
13,144 7/11/10 - 6/30/11
101,543 7/11/10 - 6/30/11 88,897 7/1/09- 6/30/10 (5.971)
(5.971)
19,932 7/1/10-6730/11
S (479,109) S 241,143 S
3.928 772.905 (702.111) (229.569) 72,296
13.144 (13,144)
101,543 (101,543) 5,971
120,658 (114.687) ;
16,405 (19.932) (3,527)
S 3.928 S 909.968 S (836.730) $ S (233.096) S 72.296 S
The accompanying Notes to Schedules of Expenditures of Awards and Financial Assistance are an integral part of this schedule.

K-4 SCHEDULE B
STERLING HIGH SCHOOL DISTRICT Schedule of Expenditures of State Financial Assistance
For the Fiscal Year Ended June 30, 2011
Program or Grant Balance. June 30. 2010 Carryover Repayment Balance. June 30. 2011
State Grantor / Program Title Grant or Stato Project Number
Award Amount
Period From - To
(Accounts Receivable)
Deferred Revenue
Due to Grantor
(Walkover) Amount
Cash Received
Budgetary Expenditures
of Prior Years' Balances
(Accounts Deferred Due to Receivable) Revenue Grantor
State Department of Education General Fund:
Equalization Aid Equalization Aid Special Education Categorical Aid Extraordinary Special Education Cost Aid Extraordinary Special Educ. Costs Aid On-behalf TPAF Pension Contributions Reimbursed TPAF Social Security Contr. Reimbursed TPAF Social Security Contr.
10-495-034-5120-078 11- 495-034-5120-078 11-495-034-5120-089 11-100-034-5120-473 10- 495-034-5120-044 11- 495-034-5095-001 11-495-034-5095402 10-100-034-5095-051
S 5.479,357 4,901,595
479,575 38,523
129,034 458,224 491,164 509.780
7/1/09- 6/30/10 7/1/10- 6/30/11 7/1/10-6/30/11 7/1/10-6/30/11 7/1/09- 6/30/10 7/1/10-6730/11 7/1/10-6/30/11 7/1/09- 6/30/10
S (589,688)
(129.034)
(37,670)
$ 589.688 4,372,127
479,575
129,034 458,224 491,164
37.670
$ (4,901.595) (479.575)
(38.523)
(458,224) (491.164)
$ (529.468)
(38,523)
Total General Fund (756.392) 6,557,482 (6.369,081) (567,991)
Debt Service Fund: Debt Service Aid Type II 11-495-034-5120-017 266.230 7/1/10-6/30/11 266,230 (266,230)
State Department of Agriculture Enterprise Fund:
National School Lunch Program (State Share) Fiscal Year 2010 Fiscal Year 2011
10- 100-010-3360-067 11- 100-010-3350-023
4.426 3.068
7/1/09-6/30/10 7/1/10-6/30/11
(281) 281 3.068 (3.068)
(281) 3,349 (3.068)
Total State Financial Assistance S (756.673) S $ S S 6.827.061 $ (6.638,379) S S (567,991) S - S
The accompanying Notes to Schedules of Expenditures of Awards and Financial Assistance are an integral part of this schedule.

Sterling High School District Notes to Schedules of Expenditures
of Federal Awards and State Financial Assistance For the Fiscal Year Ended June 30, 2011
I. GENERAL
The accompanying schedules of expenditures of federal awards and state financial assistance include federal and state award activity of the Board of Education, Sterling High School District. The Board of Education is defined in Note 1 to the Board's basic financial statements. All federal and state awards received directly from federal and state agencies, as well as federal awards and state financial assistance passed through other government agencies, are included on the schedules of expenditures of federal awards and state financial assistance.
2. BASIS OF ACCOUNTING
The accompanying schedules of expenditures of federal awards and state financial assistance are presented on the budgetary basis of accounting with the exception of programs recorded in the food service fund, which are presented using the accrual basis of accounting. These bases of accounting are described in Note 1 to the Board's basic financial statements. The information in this schedule is presented in accordance with the requirements of OMB Circular A-133, Audits of State, Local Governments, and Non-Profit Organizations. Therefore, some amounts presented in this schedule may differ from amounts presented in, or used in the preparation of, the basic financial statements.
3. RELATIONSHIP TO BASIC FINANCIAL STATEMENTS
The basic financial statements present the general fund and special revenue fund on a GAAP basis. Budgetary comparison statements or schedules (RSI) are presented for the general fund and special revenue fund to demonstrate finance-related legal compliance in which certain revenue is permitted by law or grant agreement to be recognized in the audit year, whereas for GAAP reporting, revenue is not recognized until the subsequent year or when the expenditures have been made.
The general fund is presented in the accompanying schedules on the modified accrual basis with the exception of the revenue recognition of the last state aid payment in the current budget year, which is mandated pursuant to N.J.S.A. 18A.22-44.2. For GAAP purposes that payment is not recognized until the subsequent budget year due to the state deferral and recording of the last state aid payment in the subsequent year. The special revenue fund is presented in the accompanying schedules on the grant accounting budgetary basis which recognizes encumbrances as expenditures and also recognizes the related revenues, whereas the GAAP basis does not. The special revenue fund also recognizes the last state aid payment in the current budget year, consistent with N.J.S.A. 18A.22-4.2.
The net adjustment to reconcile from the budgetary basis to the GAAP basis is $60,220 for the general fund and $0 for the special revenue fund. See Exhibit C-3, Notes to Required Supplementary Information for a reconciliation of the budgetary basis to the modified accrual basis of accounting for the general and special revenue funds. Awards and financial assistance revenues are reported in the Board's basic financial statements on a GAAP basis as follows:
Federal State Total
General Fund Special Revenue Fund Capital Projects Fund Debt Service Fund Food Service Fund
$ 223,571 498,472
$ 6,429,301 $ 6,652,872 498,472
0
114,687 266,230
3,068 266,230 117,755
Total Awards & Financial Assistance $ 836,730 $ 6,698,599 $ 7,535,329
109

Sterling High School District Notes to the Schedules of Expenditures
of Federal Awards and State Financial Assistance For the Fiscal Year Ended June 30, 2011
(Continued)
4. RELATIONSHIP TO FEDERAL AND STATE FINANCIAL REPORTS
Amounts reported in the accompanying schedules agree with the amounts reported in the related federal and state financial reports.
5. OTHER
Revenues and expenditures reported under the Food Distribution Program represent current year value received and current year distributions respectively. The amount reported as TPAF Pension Contributions represents the amount paid by the state on behalf of the District for the year ended June 30, 2011. TPAF Social Security Contributions represents the amount reimbursed by the state for the employer's share of social security contributions for TPAF members for the year ended June 30, 2011.
6. MAJOR PROGRAMS
Major programs are identified in the Summary of Auditor's Results section of the Schedule of Findings and Questioned Costs.
7. ADJUSTMENTS
Amounts reported in the column entitled "Adjustments" represent the following:
Federal
Expenditures not reported on close out reports however documented $ 3,928
Total $ 3,928
110
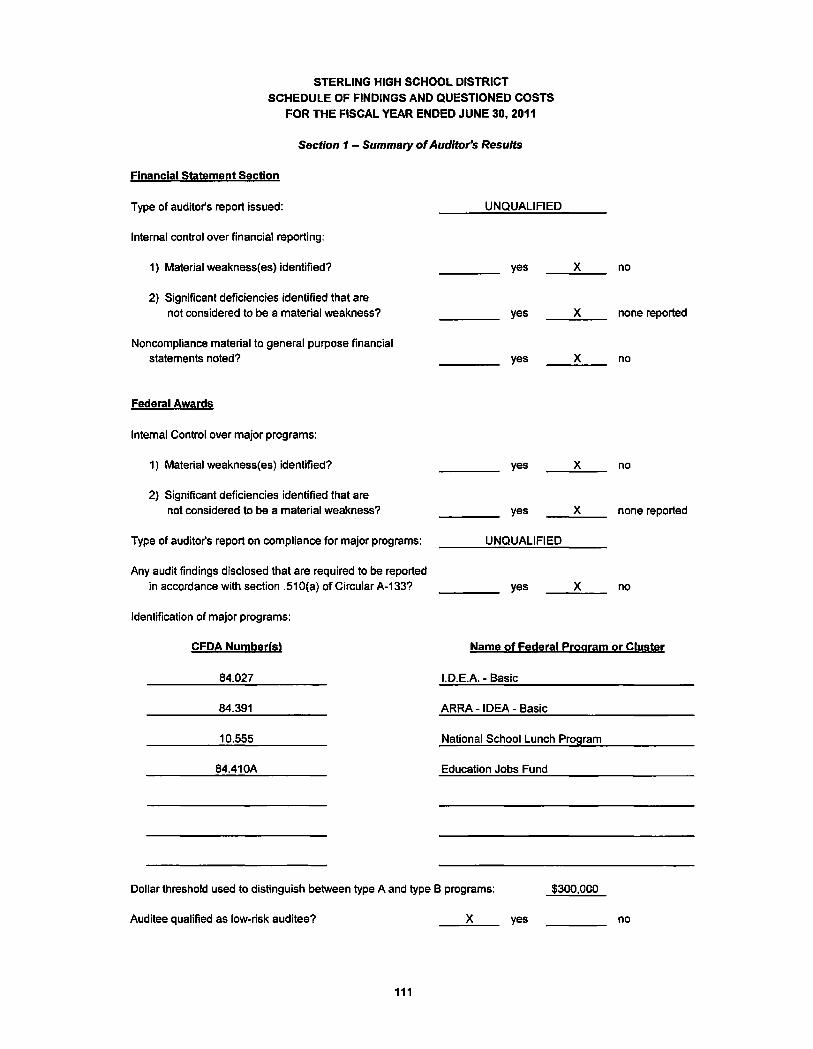
STERLING HIGH SCHOOL DISTRICT SCHEDULE OF FINDINGS AND QUESTIONED COSTS
FOR THE FISCAL YEAR ENDED JUNE 30, 2011
Section 1 - Summary of Auditor's Results
Financial Statement Section
Type of auditor's report issued: UNQUALIFIED
Internal control over financial reporting:
1) Material weakness(es) identified? yes X no
2) Significant deficiencies identified that are not considered to be a material weakness? yes X none reported
Noncompliance material to general purpose financial statements noted? yes X no
Federal Awards
Internal Control over major programs:
1) Material weakness(es) identified?
2) Significant deficiencies identified that are not considered to be a material weakness?
Type of auditor's report on compliance for major programs:
Any audit findings disclosed that are required to be reported in accordance with section .510(a) of Circular A-133?
Identification of major programs:
CFDA Number(s)
84.027
yes
yes
UNQUALIFIED
yes
no
none reported
no
Name of Federal Program or Cluster
I.D.E.A. - Basic
84.391 ARRA - IDEA - Basic
10.555 National School Lunch Program
84.41 OA Education Jobs Fund
Dollar threshold used to distinguish between type A and type B programs: $300,000
Auditee qualified as low-risk auditee? X yes no
111

STERLING HIGH SCHOOL DISTRICT SCHEDULE OF FINDINGS AND QUESTIONED COSTS
FOR THE FISCAL YEAR ENDED JUNE 30, 2011
Section 1 - Summary of Auditor's Results (Continued)
State Awards
Dollar threshold used to distinguish between type A and type B programs: $300,000
Auditee qualified as low-risk auditee?
Internal Control over major programs:
1) Material weakness(es) identified?
2) Significant deficiencies identified that are not considered to be a material weakness?
Type of auditor's report on compliance for major programs:
Any audit findings disclosed that are required to be reported in accordance with N.J. OMB Circular 04-04?
Identification of major programs:
State Grant/Project Numberfs)
10-495-034-5120-078
yes
yes
yes
UNQUALIFIED
yes
no
no
none reported
no
10-495-034-5120-089
10-495-034-5095-002
Name of State Program
Equalization Aid
Special Education Aid
TPAF Rimbursed Social Security
10-100-010-3350-023 National School Lunch Program (State Share)
112

STERLING HIGH SCHOOL DISTRICT SCHEDULE OF FINDINGS AND QUESTIONED COSTS
FOR THE FISCAL YEAR ENDED JUNE 30, 2011
Section 2 » Schedule of Financial Statement Findings
This section identifies the significant deficiencies, material weaknesses, and instances of noncompliance related to the financial statements that are required to be reported in accordance with paragraph 5.18 through 5.20 of Government Auditing Standards and with audit requirements as prescribed by the Division of Finance, Department of Education, State of New Jersey.
No findings identified.
113
STERLING HIGH SCHOOL DISTRICT SCHEDULE OF FINDINGS AND QUESTIONED COSTS
FOR THE FISCAL YEAR ENDED JUNE 30, 2011
Section 3 - Schedule of Federal Awards and State Financial Assistance Findings and Questioned Costs
This section identifies the audit findings required to be reported by section .510(a) of Circular A-133 and NJOMB Circular 04-04.
FEDERAL AWARDS
No findings and/or questioned costs identified.
STATE AWARDS
No findings and/or questioned costs identified.
114

STERLING HIGH SCHOOL DISTRICT SUMMARY SCHEDULE OF PRIOR-YEAR AUDIT FINDINGS
AND QUESTIONED COSTS AS PREPARED BY MANAGEMENT FOR THE FISCAL YEAR ENED JUNE 30, 2011
This section identifies the status of prior year findings related to the basic financial statements and federal and state awards that are required to be reported in accordance with Chapter 6.12 of Government Auditing Standards, USOMB Circular A-133 and State of NJOMB Circular 04-04.
FINANCIAL STATEMENT FINDINGS
There were no prior year audit findings.
FEDERAL AWARDS
There were no prior year audit findings.
STATE AWARDS
There were no prior year audit findings.
115