Embed Size (px)
Citation preview
SAN DIEGO CONSORTIUM POLICY BOARD
November 30
2012 LOCATION: San Diego County Administration Building, Room 310 1600 Pacific Coast Highway San Diego, CA 92101 TIME: 3:00 p.m.
Agenda
In compliance with the Americans with Disabilities Act (ADA), San Diego Workforce Partnership, Inc. will provide accommodations to persons who require assistance in order to participate in SDWP meetings. If you require assistance, please contact SDWP at (619) 228-2900, in advance of the meeting. To request this document or back-up reports in an alternative format, or for questions regarding the agenda or other information, contact Todd Philips at (619) 228-2900.
Our Mission: To foster economic growth and prosperity through education, training and lifelong
learning.
Our Vision: The San Diego region will be home to the world’s most
highly educated and skilled workforce; where a corporate and a community-wide commitment to
lifelong learning will fuel unprecedented innovation,
creativity and economic achievement.
1
Call to Order and Note of Attendance
Public Comment – Members of the public shall have the opportunity to address the Policy Board on any issue not on this agenda but within the jurisdiction of the Policy Board. Time allotted to each speaker is determined by the Chair of the Policy Board. However, comments are generally limited to no more than three (3) minutes total per subject, regardless of the number of those wishing to speak. Anyone desiring to address the Policy Board under “Public Comment” must submit a “Request to Speak” form prior to the meeting.
Agenda Items ACTION ITEMS ITEM 1 – Minutes from the October 19, 2012 Policy Board Meeting .......................................... 3 ITEM 2 – Modification of the Fiscal Year 2012-2013 Budget ..................................................... 8
Attachment A – Summary of Change in Revenue .................................................................... 10
Attachment B – Workforce Partnership Budget Summary ....................................................... 11
Attachment C – Narrative Summary of Increase/Decrease in Expenditures ............................ 13
ITEM 3 – Approval of Providers/Programs for Eligible Training Provider List ........................ 15
Attachment A – Recommended for Approval/Meets Local Criteria ........................................ 16
Attachment B – ETPL Report Card Data for Existing Providers ............................................. 17
ITEM 4 – Approval of Memorandum of Understanding with Mandatory Partners .................... 18 ITEM 5 – Revsions of Eligible Training Provider List Policy .................................................... 20 ITEM 6 – On-the-Job Training Policy Recommendations .......................................................... 22 ITEM 7 – Contract Action – Veterans Village of San Diego ...................................................... 25 ITEM 8 – Contract Action – Management and Operation of the East County Career Center .... 26 ITEM 9 – Program Year 2012-2013 Workforce Investment Act Unobligated Youth Funds ..... 29 ITEM 10 – Youth Council Membership ...................................................................................... 32 INFORMATIONAL ITEMS ITEM 11 – One-Stop Career Center Network 1st Quarter Performance ..................................... 34
Attachment – One Stop CCN Performance Summary Sheets .................................................. 36
2
ITEM 12 – Bridge to Employment Program 4th Quarter Performance ....................................... 38 Attachment – HPOG PowerPoint Presentation Slides .............................................................. 42
ITEM 13 – Veterans Employment-Related Assistance Program 1st Quarter Performance ........ 47 ITEM 14 – The Arc of San Diego Customized Training 1st Quarter Performance .................... 50 ITEM 15 – Occupational Training Services OJT Program 1st Quarter Performance ................. 52 ITEM 16 – WIA Year-Long Youth Program Year 2012-13 1st Quarter Performance ............... 54
Attachment – Program Year 12-13 WIA Year-Long Youth Performance Reports .................. 57
President’s Report
3
AGENDA ITEM 1
SAN DIEGO CONSORTIUM POLICY BOARD SPECIAL MEETING OCTOBER 19, 2012
Policy Board Members Present Tony Young Greg Cox
Council President, City of San Diego Supervisor, County of San Diego
Ron Roberts Supervisor, County of San Diego Legal Counsel David Smith, Esq. Daphne Z. Skogen, Esq.
Senior Deputy County Counsel, County of San Diego Deputy City Attorney, City of San Diego
DRAFT MINUTES
All reports, memoranda and letters contained in the agenda or distributed at the meeting shall by this reference become part of the original minutes. The meeting was called to order by Chair Tony Young at 3:33 p.m., at the County Administration Bldg., 1600 Pacific Highway, San Diego, California, with a quorum present. Public Comment -- None.
No items were pulled for discussion. • The following items were approved on the consent agenda:
1-10/19/12 Item 1 Minutes of July 27, 2012 Policy Board Meeting Approve the San Diego Consortium Policy Board (Policy Board) Minutes dated July 27, 2012.
2-10/19/12 Item 2 Approval of Providers/Programs for Eligible Training
Provider List That the Policy Board concur with the Workforce Investment Board (WIB) and approve one (1) new provider and twenty-five (25) new training programs that meet the requirements of the Employment Development Department Workforce Investment Directive #WIAD06-15 for inclusion on the Eligible Training Provider List.
3-10/19/12 Item 3 Contract Action – Bridge to Employment in the Healthcare Industry Program Award That the Policy Board concur with both the WIB and Workforce Advancement Committee (WAC) and approve the allocations set forth in the Agenda Item to the Health Profession Opportunity
4
Grant contractors for Program Year 2012-2013. This contract action is pending final approval of the Year Three Continued Funding Request from the Department of Health and Human Services (HHS) and the execution of the Abt Associates contract.
4-10/19/12 Item 4 Contract Action - Microsoft Elevate America Trainer Position That the Policy Board concur with both the WIB and WAC to allocate Microsoft Corporation grant funds to Arbor E&T, LLC. d/b/a ResCare Workforce Services in the amount of $52,758.
5-10/19/12 Item 5 Approval of Memorandum of Understanding with Mandatory Partners That the Policy Board authorize the Chair of the Policy Board to sign the Memoranda of Understanding between the Policy Board and the following organizations: Department of Rehabilitation, San Diego District, Center for Employment Training, San Diego Job Corps, and SER/Jobs for Progress.
6-10/19/12 Item 6 Reinstate Customized Training Policy Open Application That the Policy Board concur with the WIB and approve the reinstatement of the open Customized Training application including minor revisions to the Customized Training Policy for Workforce Investment Act funded training programs.
7-10/19/12 Item 7 Youth Council Membership That the Policy Board concur with both the WIB and Youth Council and approve the following membership actions:
1. Reappoint Jorge Cabrera for an additional two-year term to expire on June 30, 2014.
2. Appoint Lisa Bridges and Carmen Sandoval for an initial two-year term to expire on June 30, 2014.
8-10/19/12 Item 8 Youth Council Strategic Plan
That the Policy Board concur with both the WIB and Youth Council and approve the Youth Council 5-Year Strategic Plan (2012-2015), which is comprised of the following four main goals:
1. Youth workforce development programs are entrenched in a career pathway or industry/sector strategy approach;
2. Our region’s employers are engaged and committed to preparing our future workforce;
5
3. Dedicated (discretionary) funding for year-round and summer Hire-A-Youth program will be identified and pursued; and
4. The Youth Council is the youth workforce development intermediary network for the region.
9-10/19/12 Item 9 State Energy Sector Partnership (SESP) Contract Funding
Recommendation That the Policy Board concur with both the WIB and Youth Council to authorize the President and Chief Executive Officer of the San Diego Workforce Partnership (Workforce Partnership) to allocate an additional $12,000 of SESP funds to MiraCosta College to fund a third cohort of 20 additional students through a Green Building Partnership program.
10-10/19/12 Item 10 Contract Action – Green Innovation Challenge (Biofuels) That the Policy Board concur with the WIB and approve the additional allocation of $4,219 in Workforce Investment Act 15% funds to BIOCOM Institute. The extended period of performance for the additional allocation remains July 1, 2012 – September 30, 2012.
11-10/19/12 Item 11 Contract Action - Rapid Response
That the Policy Board concur with the WIB and approve a contract allocation of $150,000 to the San Diego Regional Economic Development Corporation to provide business outreach, layoff aversion and required Rapid Response services for the 2012-13 program year. The period of performance will be October 1, 2012 – June 30, 2013, and as specified in the procurement, contracts may be renewed for two additional time periods based upon need, contract performance and funding availability. Each additional time period shall not exceed one-year.
12-10/19/12 Item 12 Funding Recommendation for Audit Services That the Policy Board concur with both the San Diego Workforce Partnership, Inc. Board of Directors and Audit Committee authorizing the President and CEO to negotiate and execute a contract with Simpson & Simpson, CPAs, LLP, for financial and compliance auditing services for all programs funded by the Workforce Partnership. The contract will be for nine months for a total cost not to exceed $52,180, with an option for up to two one-year extensions, with extension years’ funding amount dependent on funding availability and performance.
6
13-10/19/12 Item 13 State Energy Sector Partnership (SESP) Contract Funding Recommendation That the Policy Board concur with both the WIB and Youth Council to authorize the President and Chief Executive Officer of the San Diego Workforce Partnership (Workforce Partnership) to allocate an additional $12,000 of SESP funds to MiraCosta College to fund a third cohort of 20 additional students through a Green Building Partnership program.
14-10/19/12 Item 14 Workforce Investment Board Membership That the Policy Board appoint the following candidates to a two-year term, expiring on June 30, 2014: Patrick Shoup, President of Southwest Welding and Manufacturing, LLC; Linda Klers, Director of General & Administration with Branter & Associates, Inc. (dba SEA CON); Becky Quinn, Human Resources Manager and Corporate Communications with Quality Controlled Manufacturing, Inc.; Kevin M. Landry, CEO, President and General Manager of New Horizons Computer Learning Centers of Southern California..
15-10/19/12 Item 15 Policy Board Conflict of Interest Policy
That the Policy Board adopt the Draft Policy language articulated in the Agenda Item as policy number 1 in a new document governing Policy Board protocols with respect to contracting entitled, “Policies and Procedures of the San Diego Consortium Policy Board.”
M/S/C/U (Cox/Roberts) President’s Update – Peter Callstrom Peter Callstrom informed the Policy Board of the Youth Development Office holding a reception on October 18 at the office of Manpower. He mentioned it was a great launch event with many in attendance to celebrate this exciting new initiative to coordinate all youth-related activities in our region. Mr. Callstrom also mentioned that he presented at the South County Economic Development Council (SCEDC) annual economic summit at the Convention Center in October. Mr. Callstrom also handed out copies of the Maritime Report commissioned by the Workforce Partnership in collaboration with the San Diego Regional Economic Development Corporation (SDEDC). Mr. Callstrom will also be presenting on the Maritime study at Southwestern College on November 1, 2012. The Workforce Partnership and SDEDC will be receiving an award at the Maritime gala on November 7. Mr. Callstrom recently met with the Navy’s Rear Admiral, Dixon Smith, to discuss employment readiness training options for veterans leaving the service. The Workforce Partnership recently hosted a community meeting on public safety presented by Assemblymember Toni Atkins. Speakers included District Attorney Bonnie Dumanis, Sherriff Bill Gore, and Chief Probation Officer Mack Jenkins (also a WIB Board member). Finally, Mr. Callstrom recently met with Community College Chancellor Dr. Constance Carroll and

7
presidents of the community colleges in our region to discuss collaborative opportunities going forward. Adjournment Chair Young adjourned the meeting at 3:38 p.m. __________________________ Peter Callstrom, President & CEO
8
AGENDA ITEM 2 DATE: November 13, 2012 RE: November 30, 2012 Meeting TO: San Diego Consortium Policy Board FROM: Emilia Gabriele, Vice President Finance and Accounting SUBJECT: MODIFICATION OF THE FISCAL YEAR 2012-2013 BUDGET RECOMMENDATION That the San Diego Consortium Policy Board (Policy Board) concur with the San Diego Workforce Partnership, Inc. Board of Directors (Board) and approve modifications to the Fiscal Year 2012 - 2013 Budget as presented in Attachment B. The Fiscal Year (FY) 2012 - 2013 Budget has increased from $32,448,410 to $37,777,974. BACKGROUND The Board and the Policy Board approved the Workforce Partnership’s Fiscal Year 2012 – 2013 Budget on June 6 and 22, 2012 respectively. Subsequent to those approvals, the San Diego Workforce Partnership has modified its carry-in funds and received official notice of additional revenues for programs and services. In order to modify and adjust this year’s budget, the Policy Board is being asked to approve these additional expenditures that were not reflected in the original budget. Specifically, the proposed modification is necessary to reflect the following:
• An increase in total revenue of $5,329,564, (see Attachment A), including: 1. Net increase in carry-in revenue of $875,996 (grant funds remaining from prior
fiscal year); 2. Net increase in new revenue of $5,988,550, primarily due the award of the
Community Project, Program Services (CPPS) funds from the City of San Diego, School-To-Career grants, the Department of Health and Human Services (HHS) Temporary Assistance for Needy Families (TANF) grant, and the Innovative Strategies for Increasing Self-Sufficiency (ISIS) Implementation grant. Additionally, an increase to the Workforce Investment Act Rapid Response grant contributed to the net increase;
3. Net increase in carry-forward revenue of $1,534,982 due to the full receipt of multiple year grants, CPPS grant, School-To-Career grants, the HHS TANF grant, and the ISIS Implementation grant, being awarded in FY12-13. The carry-forward amounts of these grants are scheduled to be expended in future fiscal years.
• An increase in planned expenditures of $5,329,564 (see Attachment B).
9
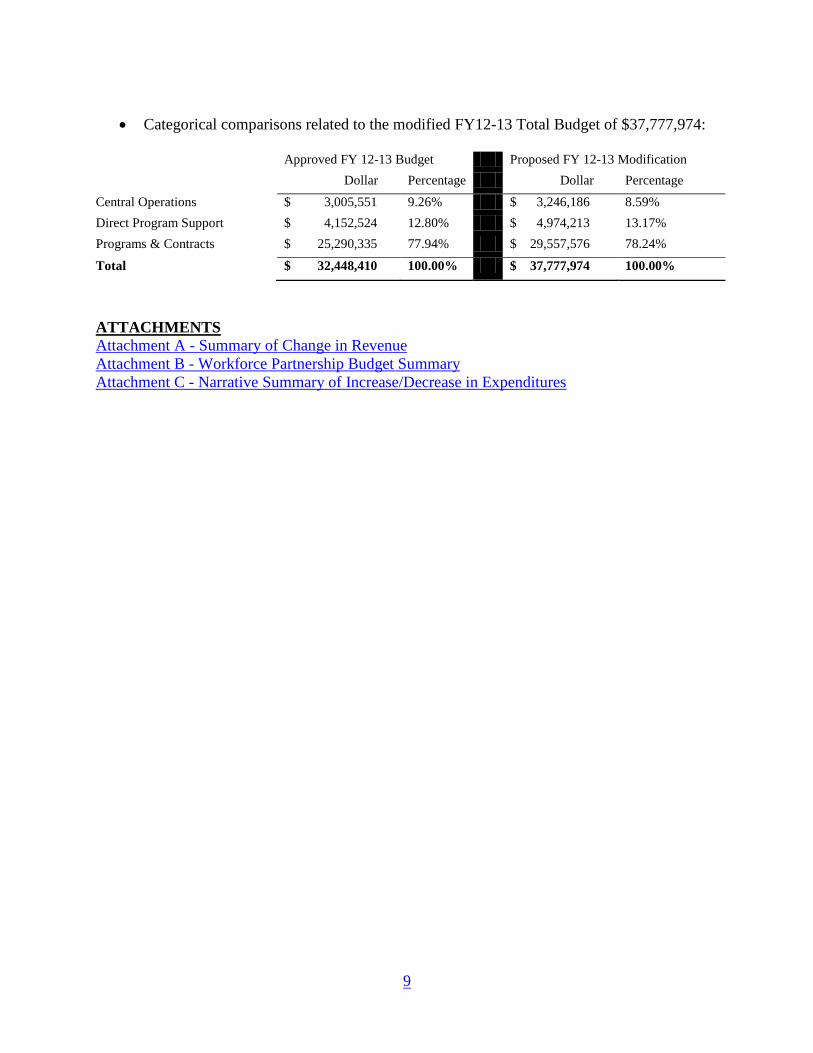
• Categorical comparisons related to the modified FY12-13 Total Budget of $37,777,974:
Approved FY 12-13 Budget Proposed FY 12-13 Modification Dollar Percentage Dollar Percentage Central Operations $ 3,005,551 9.26% $ 3,246,186 8.59% Direct Program Support $ 4,152,524 12.80% $ 4,974,213 13.17% Programs & Contracts $ 25,290,335 77.94% $ 29,557,576 78.24%
Total $ 32,448,410 100.00% $ 37,777,974 100.00%
ATTACHMENTS Attachment A - Summary of Change in Revenue Attachment B - Workforce Partnership Budget Summary Attachment C - Narrative Summary of Increase/Decrease in Expenditures
10
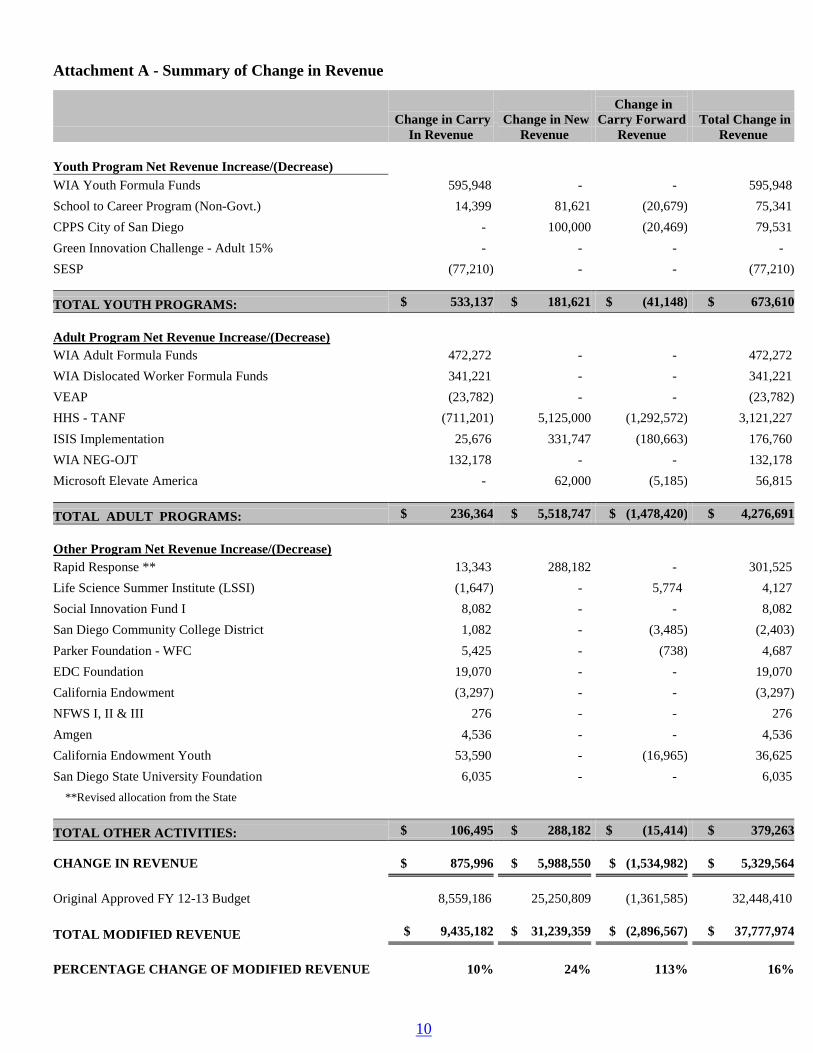
0BAttachment A - Summary of Change in Revenue
Change in Carry
In Revenue Change in New
Revenue
Change in Carry Forward
Revenue Total Change in
Revenue Youth Program Net Revenue Increase/(Decrease)
WIA Youth Formula Funds 595,948 - - 595,948 School to Career Program (Non-Govt.) 14,399 81,621 (20,679) 75,341 CPPS City of San Diego - 100,000 (20,469) 79,531 Green Innovation Challenge - Adult 15% - - - - SESP (77,210) - - (77,210)
TOTAL YOUTH PROGRAMS: $ 533,137 $ 181,621 $ (41,148) $ 673,610
Adult Program Net Revenue Increase/(Decrease) WIA Adult Formula Funds 472,272 - - 472,272
WIA Dislocated Worker Formula Funds 341,221 - - 341,221 VEAP (23,782) - - (23,782) HHS - TANF (711,201) 5,125,000 (1,292,572) 3,121,227 ISIS Implementation 25,676 331,747 (180,663) 176,760 WIA NEG-OJT 132,178 - - 132,178 Microsoft Elevate America - 62,000 (5,185) 56,815
TOTAL ADULT PROGRAMS: $ 236,364 $ 5,518,747 $ (1,478,420) $ 4,276,691
Other Program Net Revenue Increase/(Decrease) Rapid Response ** 13,343 288,182 - 301,525
Life Science Summer Institute (LSSI) (1,647) - 5,774 4,127 Social Innovation Fund I 8,082 - - 8,082 San Diego Community College District 1,082 - (3,485) (2,403) Parker Foundation - WFC 5,425 - (738) 4,687 EDC Foundation 19,070 - - 19,070 California Endowment (3,297) - - (3,297) NFWS I, II & III 276 - - 276 Amgen 4,536 - - 4,536 California Endowment Youth 53,590 - (16,965) 36,625 San Diego State University Foundation 6,035 - - 6,035
**Revised allocation from the State TOTAL OTHER ACTIVITIES: $ 106,495 $ 288,182 $ (15,414) $ 379,263
CHANGE IN REVENUE $ 875,996 $ 5,988,550 $ (1,534,982) $ 5,329,564
Original Approved FY 12-13 Budget 8,559,186 25,250,809 (1,361,585) 32,448,410
TOTAL MODIFIED REVENUE $ 9,435,182 $ 31,239,359 $ (2,896,567) $ 37,777,974
PERCENTAGE CHANGE OF MODIFIED REVENUE 10%
24%
113%
16%
11
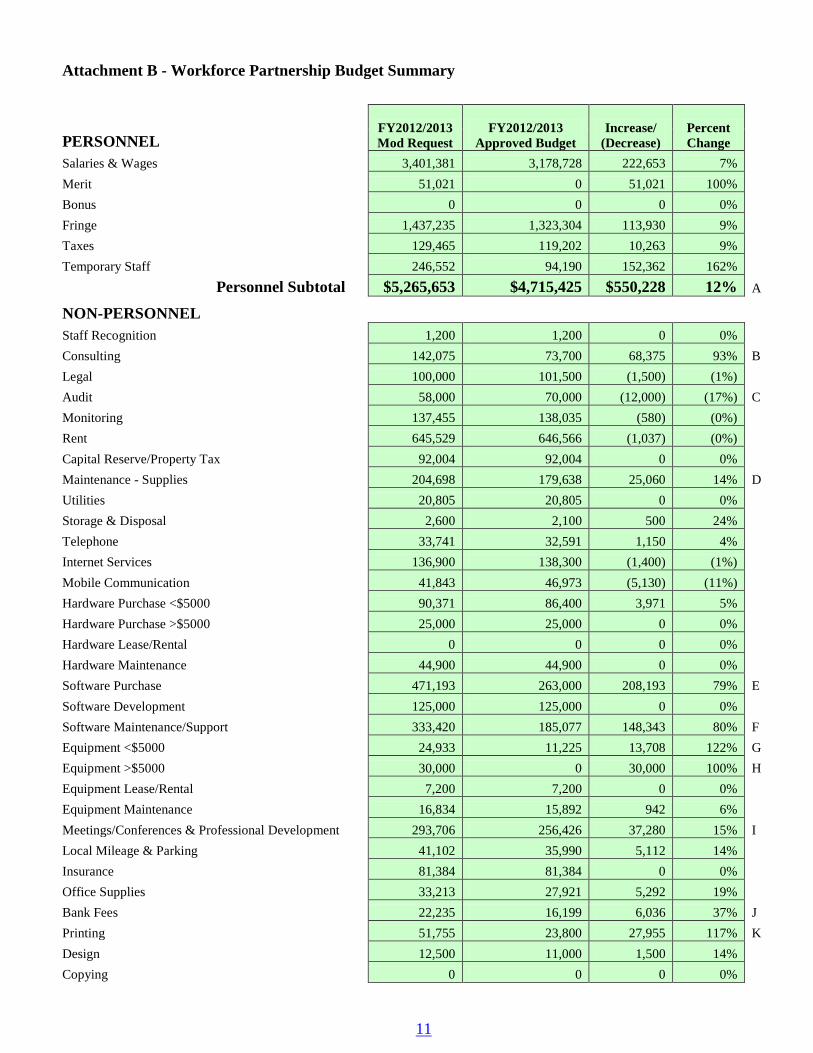
1BAttachment B - Workforce Partnership Budget Summary
FY2012/2013
Mod Request FY2012/2013
Approved Budget Increase/
(Decrease) Percent Change PERSONNEL
Salaries & Wages
3,401,381 3,178,728 222,653 7% Merit
51,021 0 51,021 100%
Bonus
0 0 0 0% Fringe
1,437,235 1,323,304 113,930 9%
Taxes
129,465 119,202 10,263 9% Temporary Staff
246,552 94,190 152,362 162%
Personnel Subtotal
$5,265,653 $4,715,425 $550,228 12% A
NON-PERSONNEL
Staff Recognition
1,200 1,200 0 0%
Consulting
142,075 73,700 68,375 93% B Legal
100,000 101,500 (1,500) (1%)
Audit
58,000 70,000 (12,000) (17%) C Monitoring
137,455 138,035 (580) (0%)
Rent
645,529 646,566 (1,037) (0%) Capital Reserve/Property Tax
92,004 92,004 0 0%
Maintenance - Supplies
204,698 179,638 25,060 14% D Utilities
20,805 20,805 0 0%
Storage & Disposal
2,600 2,100 500 24% Telephone
33,741 32,591 1,150 4%
Internet Services
136,900 138,300 (1,400) (1%) Mobile Communication
41,843 46,973 (5,130) (11%)
Hardware Purchase <$5000
90,371 86,400 3,971 5% Hardware Purchase >$5000
25,000 25,000 0 0%
Hardware Lease/Rental
0 0 0 0% Hardware Maintenance
44,900 44,900 0 0%
Software Purchase
471,193 263,000 208,193 79% E Software Development
125,000 125,000 0 0%
Software Maintenance/Support
333,420 185,077 148,343 80% F Equipment <$5000
24,933 11,225 13,708 122% G
Equipment >$5000
30,000 0 30,000 100% H Equipment Lease/Rental
7,200 7,200 0 0%
Equipment Maintenance
16,834 15,892 942 6% Meetings/Conferences & Professional Development
293,706 256,426 37,280 15% I
Local Mileage & Parking
41,102 35,990 5,112 14% Insurance
81,384 81,384 0 0%
Office Supplies
33,213 27,921 5,292 19% Bank Fees
22,235 16,199 6,036 37% J
Printing
51,755 23,800 27,955 117% K Design
12,500 11,000 1,500 14%
Copying
0 0 0 0%
12
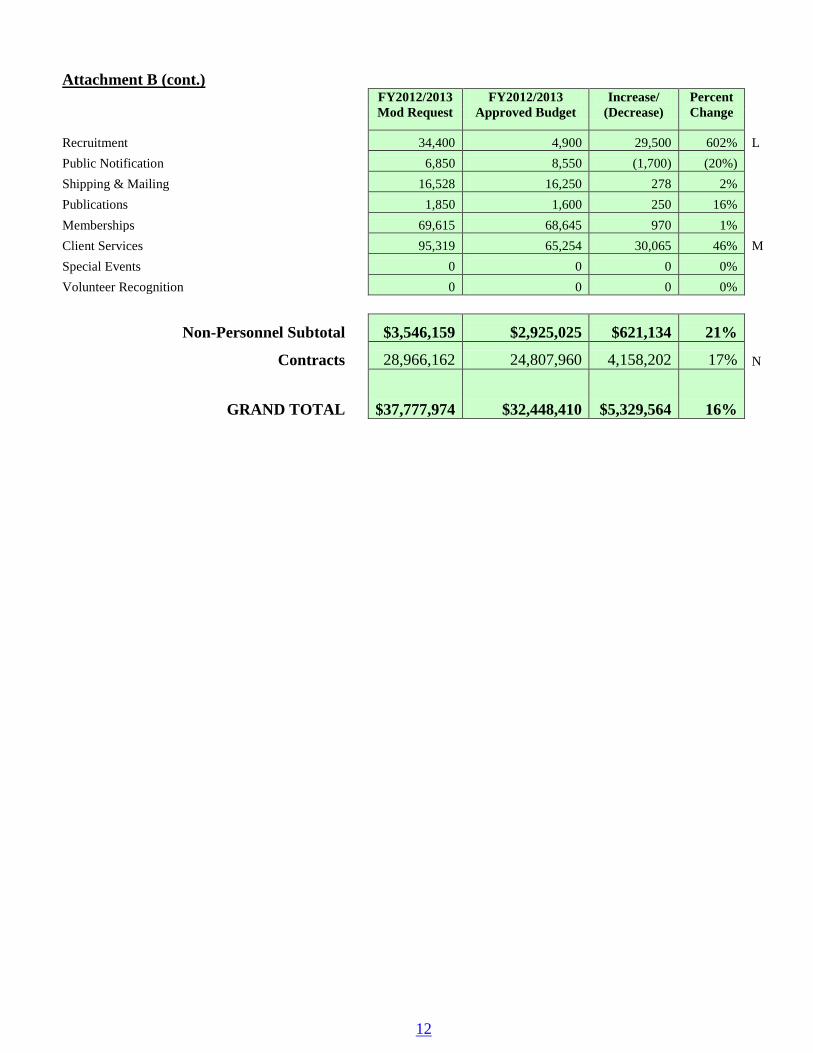
Attachment B (cont.)
FY2012/2013 Mod Request
FY2012/2013 Approved Budget
Increase/ (Decrease)
Percent Change
Recruitment
34,400 4,900 29,500 602% L Public Notification
6,850 8,550 (1,700) (20%)
Shipping & Mailing
16,528 16,250 278 2% Publications
1,850 1,600 250 16%
Memberships
69,615 68,645 970 1% Client Services
95,319 65,254 30,065 46% M
Special Events
0 0 0 0% Volunteer Recognition
0 0 0 0%
Non-Personnel Subtotal
$3,546,159 $2,925,025 $621,134 21%
Contracts
28,966,162 24,807,960 4,158,202 17% N
GRAND TOTAL
$37,777,974 $32,448,410 $5,329,564 16%
13
Attachment C - Narrative Summary of Increase/Decrease in Expenditures
A. Personnel category has an increase of $550,228 due to the addition of 3.25 FTE, TANF (2.25 FTE) and VP-IT (1 FTE), the Merit increase of 3% effective January 1, 2013 and Fringe and Taxes associated with the additional staff and Merit increase. Additionally, Temporary Staff increased due to a temp for the VP, a TANF temp and Finance temp.
B. Consulting has a net increase of $68,375 primarily due to the addition of capacity building courses for the Adult team and the HPOG front line staff, costs for a Research Advisor for the Research and LMI Department during the search for an internal Research Manager and for consulting services for the new accounting system.
C. Audit decreased by $12,000 as a result of the winning firm submitting a cost lower than
originally budgeted.
D. Maintenance – Supplies increased by $25,000 due to costs associated with the potential move of the North County Inland Career Center to a new location.
E. Software Purchase has a net increase of $208,193 primarily due to the purchase of the core module for a case management system, a document storage and tracking system and the core electronic contract/invoice workflow software.
F. Software Maintenance/Support increased by $148,343 due costs associated with maintaining the current case management system, upgrades to our website and support during the transition to the new accounting system and payroll tax service.
G. Equipment < $5,000 has a net increase $13,708 primarily due to the reclassification of mobile communication equipment for new staff from the Mobile Communication line, a compressor for the server room’s HVAC system and monitors for the conference rooms.
H. Equipment > $5,000 increased by $30,000 due to a new phone system for the potential move of
the North County Inland Career Center to a new location.
I. Meetings/Conferences & Professional Development has net increase of $37,280 primarily due to staff attending conferences associated with the receipt of the new grants, such as TANF, TPP and the professional development for new staff (primarily CEO and VP-IT). This category contains three types of expenses:
• Meeting – expenses related to local programmatic and operational meetings. • Conferences – expenses related to staff attending technical assistance sessions and
presenting best practices at or attending national workforce development association sessions.
• Professional Development – expenses related to professional development activities and tuitions to enable staff to stay up to date abreast on technical developments in their field of work, to further enhance their programmatic knowledge and their leadership and management skills.
14
J. Bank Fees increased by $6,036 due to the trending of current monthly fees.
K. Printing increased by $27,955 primarily the Maritime and Telecom Industry reports and
outreach materials for Adult and Youth activities.
L. Recruitment has net increase of $29,500 due to the Executive search for the President and CEO.
M. Client Services has a net increase $30,065 due to administering supportive services for the East County Region as a result of the reissue of the East County Region One-Stop Center and LSSI staff realigning needs of the program.
N. Contracts have a net increase of $4,158,202 attributable to the receipt of new grants, additional carry-in amounts and grants ending. The increases are primarily in the following areas:
• TANF - $2,487,129 • Youth Contracts increased by $896,547 • Individual Training Accounts (ITA’s)/Customized Training (CT)/Direct On-the-Job
Training (OJT) increased by $301,366 • Research Studies - $254,753 • National Emergency Grant OJT - $109,384 • ISIS Implementation - $104,289
15
AGENDA ITEM 3 DATE: November 15, 2012 RE: November 30, 2012 Meeting TO: San Diego Consortium Policy Board FROM: Mark Nanzer, Director Workforce Advancement Division SUBJECT: APPROVAL OF PROVIDERS/PROGRAMS FOR ELIGIBLE TRAINING
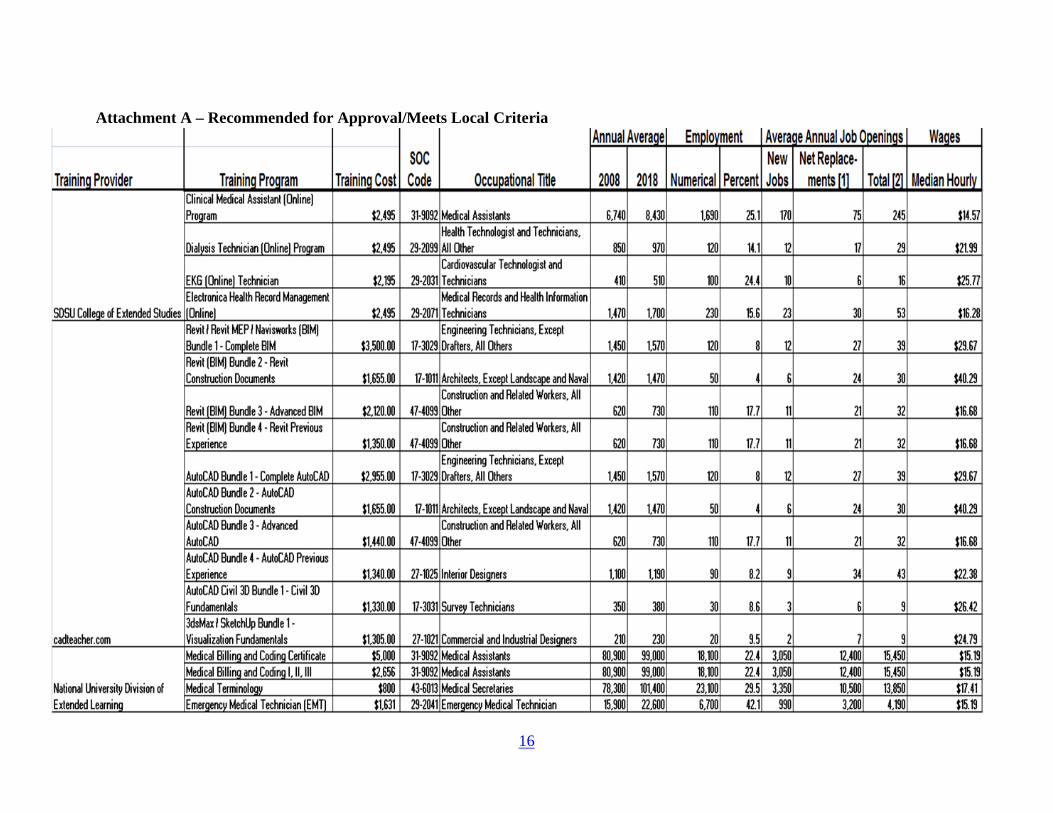
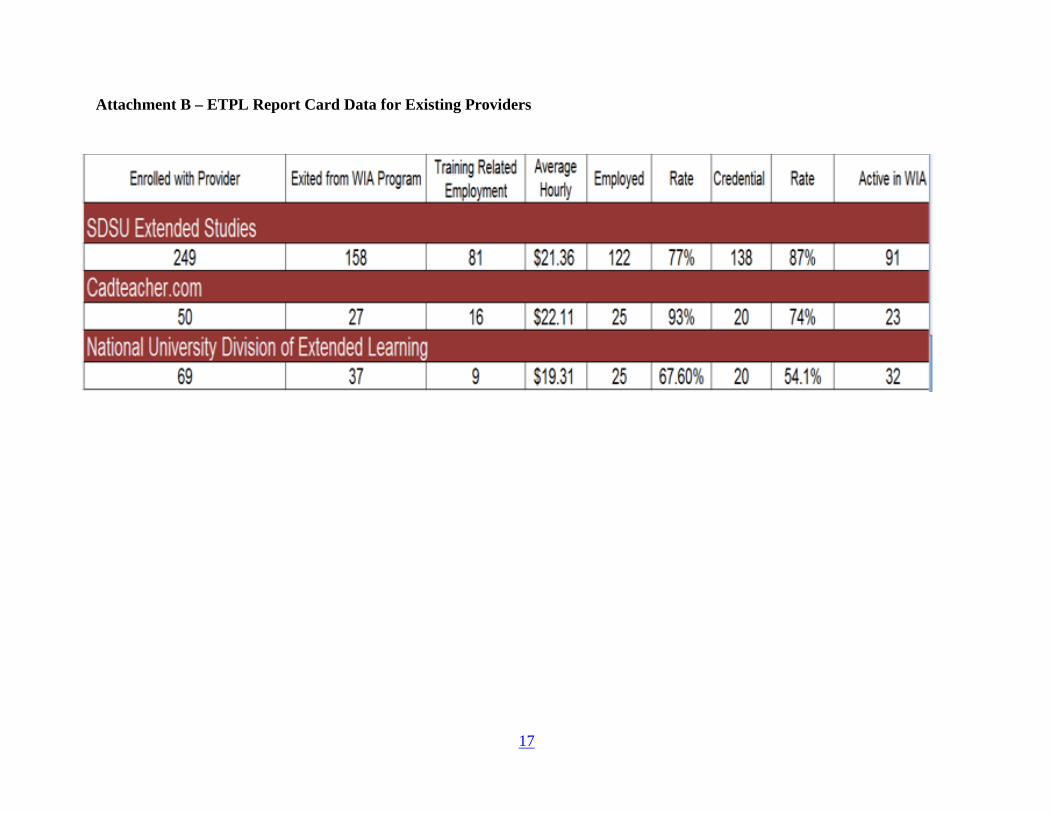
PROVIDER LIST RECOMMENDATION That the San Diego Consortium Policy Board (Policy Board) concur with the Workforce Advancement Committee and approve eighteen (18) new programs which meet the requirements of the Employment Development Department Workforce Investment Directive WIAD06-15 for inclusion on the Eligible Training Provider List (ETPL). BACKGROUND Pursuant to the Workforce Investment Act, the WIB and Policy Board are responsible for approving both training providers and their programs for inclusion onto the ETPL. Existing providers, San Diego State University College of Extended Studies, Cadteacher.com, and National University’s Division of Extended Learning have submitted eighteen (18) new training programs (Attachment A). The recommended new programs have met all selection criteria and local requirements. Attachment B is the ETPL Report Card data for existing providers; the purpose of this information is to provide WIB members with a snapshot of cumulative performance for this provider through September 15, 2012. The Workforce Investment Board (WIB) did not reach quorum at their November 15, 2012 meeting, therefore there is not a recommendation from the WIB for this item. ATTACHMENTS Attachment A – Recommended for Approval/Meets Local Criteria Attachment B – ETPL Report Card Data for Existing Providers
16
Attachment A – Recommended for Approval/Meets Local Criteria
17
Attachment B – ETPL Report Card Data for Existing Providers
18
AGENDA ITEM 4 DATE: November 15, 2012 RE: November 30, 2012 Meeting TO: San Diego Consortium Policy Board FROM: Mark Nanzer, Director Workforce Advancement Division SUBJECT: APPROVAL OF MEMORANDUM OF UNDERSTANDING WITH
MANDATORY PARTNERS RECOMMENDATION That the San Diego Consortium Policy Board (Policy Board) concur with the Workforce Advancement Committee and authorize the Chair of the Policy Board to sign the Memorandum of Understandings (MOU) between the Policy Board and the following organizations:
California Indian Manpower Consortium, Inc. Employment and Community Options MiraCosta College District Palomar Community College District San Diego County Superintendent of Schools Southwestern Community College District The State of California Employment Development Department San Diego County Superintendent of Schools Grossmont-Cuyamaca Community College District on behalf of Grossmont College
BACKGROUND Section 121 of the Workforce Investment Act authorizes the local Workforce Investment Board (WIB), with the agreement of the chief elected officials (Policy Board), to develop and enter into an MOU between the local WIB and the mandatory One-Stop Career Center partners. At the July 19, 2012 WIB meeting, an MOU template was approved between the WIB and the mandatory partners. The duration of the MOUs is to be from July 1, 2012 to June 30, 2018. In addition to the required MOU, a Resource Sharing Agreement was developed, which is an attachment to the MOU. Staff connected with each mandatory partner to develop the Resource Sharing Agreement as well as the language contained in each MOU.

19
The WIB did not reach quorum at their November 15, 2012 meeting, therefore there is not a recommendation from the WIB for this item. ATTACHMENTS - (due to the length of these attachments, they are not included in this packet and will be made available upon request) A. Memorandum of Understanding B. Definitions: Commonly used terms in the Workforce Development System C. Resource Sharing Agreement
20
AGENDA ITEM 5 DATE: November 15, 2012 RE: November 30, 2012 Meeting TO: San Diego Consortium Policy Board FROM: Mark Nanzer, Director Workforce Advancement Division SUBJECT: REVISIONS OF ELIGIBLE TRAINING PROVIDER LIST POLICY RECOMMENDATION That the San Diego Consortium Policy Board (Policy Board) concur with the Workforce Advancement Committee and approve of the following Eligible Training Provider List (ETPL) Policy Revisions:
1. No training program shall exceed a 24-month period. Special circumstances will require approval from a Career Center Manager;
2. Training providers are required to renew their status every two years; 3. Current providers who are already listed on the ETPL must renew their status based upon
performance outcomes from the ETPL Report Card, which includes: • Number of enrolled Workforce Investment Act (WIA) customers; • Wages, number of customers placed in employment and training related
employment; • Number of customers who attain credentials and training completion.
4. The price of new training programs shall not exceed 15% of the market rate, after a cost comparison analysis, for similar training programs; and
5. The San Diego Workforce Partnership will submit training programs for board approval, to be included on the ETPL, that have a physical location in San Diego County. Providers outside of California, as per WIA Section 122(c)(5), are eligible to be listed on the California ETPL if they are listed on an ETPL in another state.
BACKGROUND At the June 21, 2012 Workforce Advancement Committee (Committee) meeting, concerns were raised over the submission of training programs with training costs the Committee considered to be excessive. While previous training provider applications had been approved for similarly priced programs, the Committee questioned whether these training programs could potentially put individuals in a position to incur an exorbitant amount of debt, considering the Individual Training Account (ITA) cap is currently set at $5,000 per participant. UPDATE FROM AD HOC WORKGROUP An ad hoc working group was created to address this matter. The ad hoc working group met to
21
discuss and develop local criteria pertaining to the following:
• Whether or not to fund programs outside of San Diego County; • Whether or not to set limits for the length of time that a jobseeker can be enrolled in
training; • Examine current ITA and ETPL policies for consistency; and • Research policies and best practices from other Workforce Investment Boards.
Staff researched and held conversations on ITA and ETPL policies from the following workforce investment areas:
• South Bay Workforce Investment Board (Southern Los Angeles County area) • Orange County Workforce Investment Board (WIB) • Sacramento Employment and Training Agency
The conclusion of the research yielded that all of these workforce investment areas have similar polices to the San Diego Workforce Partnership due to the requirement that all California WIBs must adhere to the state Employment Development Department’s Workforce Investment Directive WIA06-15. The recommended changes to the San Diego Workforce Partnership’s policy incorporate the best practices learned from the conducted research on other WIB policies. The WIB did not reach quorum at their November 15, 2012 meeting, therefore there is not a recommendation from the WIB for this item. ATTACHMENTS None
22
AGENDA ITEM 6 DATE: November 15, 2012 RE: November 30, 2012 Meeting TO: San Diego Consortium Policy Board FROM: Mark Nanzer, Director Workforce Advancement Division SUBJECT: ON-THE-JOB TRAINING POLICY RECOMMENDATIONS RECOMMENDATION That the San Diego Consortium Policy Board (Policy Board) concur with the Workforce Advancement Committee and approve the following revisions to the San Diego Workforce Partnership’s (Workforce Partnership) On-the-Job Training (OJT) Policy and Procedures:
1) Create an open application for employers to access either OJT or Customized Training funds through the One-Stop Career Centers; and
2) Revise the OJT wage reimbursement rates to: a. Up to 90% for employers with less than 50 employees; b. Up to 75% for employers with 51 – 250 employees; and c. Up to 50% for employers with greater than 250 employees.
BACKGROUND At its August 2012 meeting, the Workforce Advancement Committee (Committee) approved an item to revise the current Customized Training policy. The Committee discussed both the Customized Training and the OJT policy and directed staff to conduct further research on the OJT policy. Specifically, the Committee was interested in learning:
• Whether the current policy is able to meet the demands of both business and the jobseeker in today’s economic environment.
• What is the role of the One-Stop Career Centers in identifying OJT and Customized Training opportunities?
• What are the opportunities for employers to directly apply for OJT and customized training contracts?
• What are the possibilities of enhancing the existing policies? The Workforce Partnership’s current OJT policy requirements are:
• No offer of employment can be made prior to execution of the OJT Contract; • An OJT Contract with a training plan is required for each individual receiving OJT; • The individual is hired once the OJT Contract and training plan are completed; • The OJT target wage is $11.58 an hour without benefits or $10.00 an hour with benefits:

23
o Some exceptions are allowable – such as when there is a demonstrated career pathway leading to higher wages;
• The OJT must not exceed 1,040 hours; and • Reimbursement to the employer is up to 50% of the wage.
Staff researched the OJT policies of the following workforce investment areas:
• State of Ohio Department of Development • Lucas County WIB (Ohio) • Area 7 Workforce Investment Board (Ohio) • Capital Workforce Partners (Connecticut) • North Carolina Division of Workforce Development • Fox Valley Workforce Development (Wisconsin) • State of Hawaii • Southwest Washington Workforce Development Council • New York State Department of Labor • Heartland Workforce Solutions (Nebraska)
Staff found that all of these areas have policies similar to the Workforce Partnership’s. This is in large part because they follow the Workforce Investment Act legislation and/or have adopted the Department of Labor’s (DOL) OJT Tool Kit resources located on www.Workforce3One.gov. The minor variances between the Workforce Partnership’s policy and those of the other areas researched are mostly in the amount of wage reimbursement, the allowable length of the OJT, and the rate of reimbursement. Several areas have a two part process for employers to access OJT funding. The first part is the completion of a Pre-Screening or some type of OJT Agreement with the business. This process is verification that the business is eligible to receive OJT funding. It is non-monetary in nature. The second part of the process is common to all areas researched, the requirement of an OJT Contract and/or Training Plan per individual receiving OJT. Of interest was the State of Ohio, which allows the blanket agreement with an employer, but local areas have the discretion to enter into such agreements or not. The two local areas staff researched do not enter into blanket agreements with employers. The information from the State of Hawaii focused more on the procurement of businesses for OJT. The question was whether they should have a procured list of employers. Because the needs of each participant cannot be predetermined, it is not therefore practical or advantageous to competitively procure OJT. Hawaii enters into individual OJT contracts with employers based on the need of the employer and the participant. The other minor differences in policy relate to reimbursement amounts and rates. San Diego set its target wage of $11.58 based on the “Path to Prosperity” study conducted by the Workforce Partnership. In their research, staff found everything from no target wage to a target wage reimbursement rate based on the average wage in the state. Every area differed on this. Where areas were fairly consistent is the rate of reimbursement. About half the areas researched reimburse up to 50% of the wage and the remainder has adopted the waiver from DOL to
24
reimburse on a sliding scale based on the size of the company. This allows for a reimbursement of up to 90% of the wage for small businesses. Of the two recommendations above, the use of the DOL waiver to reimburse the OJT wage using the sliding scale seemed the most promising best practice staff found in researching other areas. This revision would provide a direct benefit to small businesses in San Diego County. All of the areas researched allow employers to access OJT funding through their service delivery system, most commonly the One-Stop Career Centers, but in some cases, service providers. To simplify access to training funds for the business community, staff is recommending a one page open application that would allow the business to apply for either OJT or CT directly from the Workforce Partnership. The Workforce Investment Board (WIB) did not reach quorum at their November 15, 2012 meeting, therefore there is not a recommendation from the WIB for this item. ATTACHMENTS None
25
AGENDA ITEM 7 DATE: November 15, 2012 RE: November 30, 2012 Meeting TO: San Diego Consortium Policy Board FROM: Mark Nanzer, Director Workforce Advancement Division SUBJECT: CONTRACT ACTION – VETERANS VILLAGE OF SAN DIEGO RECOMMENDATION That the San Diego Consortium Policy Board (Policy Board) concur with the Workforce Advancement Committee and approve an allocation of $33,238 in Workforce Investment Act (WIA) Governor’s Discretionary 15% funds to Veterans Village of San Diego (VVSD) for the Veterans Employment Assistance Program (VEAP). The period of performance for the additional allocation of funds is December 1, 2012 – March 31, 2013. BACKGROUND During the San Diego Workforce Partnership’s (Workforce Partnership) annual organizational budget modification process, additional funds were identified and are being recommended to be added to VVSD’s existing contract. If approved, funds will be utilized to support ongoing program operation and participant costs. In March 2011, the Workforce Partnership partnered with VVSD on a successful grant application to implement VEAP locally, utilizing State of California Governor’s Discretionary 15% funds. Subsequently, VVSD was procured and approved by the state to deliver programmatic services and therefore, these funds cannot be reallocated to any other operator. VVSD targets unemployed veterans, with an emphasis on those veterans recently separated from service and provides them with training and placement services. VVSD partners with community based organizations to make referrals to specialized services for veterans facing major barriers to employment. VVSD connects individuals with appropriate referrals to address these barriers. VVSD partners with the Veteran’s Administration, the County Veteran Service Office, and numerous vocational schools to collectively focus training in the medical, truck driving/transportation, and security sectors. The Workforce Investment Board (WIB) did not reach quorum at their November 15, 2012 meeting, therefore there is not a recommendation from the WIB for this item. ATTACHMENTS None
26
AGENDA ITEM 8 DATE: November 15, 2012 RE: November 30, 2012 Meeting TO: San Diego Consortium Policy Board FROM: Mark Nanzer, Director Workforce Advancement Division SUBJECT: CONTRACT ACTION – MANAGEMENT AND OPERATION OF THE
EAST COUNTY CAREER CENTER RECOMMENDATION That the San Diego Consortium Policy Board (Policy Board) concur with the Workforce Advancement Committee and authorize the President and Chief Executive Officer of the San Diego Workforce Partnership (Workforce Partnership) to negotiate and execute a contract with Grossmont Union High School District for the Management and Operation of the East County Career Center in the amount of $567,394. The recommended contract would be for a six (6) month period of performance beginning January 1, 2013 to June 30, 2013, with the option to renew for four (4) additional one (1) year periods based on performance and availability of funds. BACKGROUND On May 10, 2012 and May 18, 2012 respectively, the Workforce Investment Board (WIB) and Policy Board reviewed and approved the release of a Request for Proposals (RFP) for the Management and Operation of the One-Stop Career Center – East Region (East Region RFP). Staff conducted a community conversation with various community stakeholders to inform the development of the new East Region RFP. Subsequently, the Workforce Advancement Committee, WIB, and Policy Board approved the RFP framework at their meetings on June 21, 2012, July 19, 2012 and July 27, 2012, respectively. The RFP was released on August 1, 2012, with proposals due to the Workforce Partnership on September 5, 2012. In order to be eligible to bid, organizations were required to submit a Notice of Intent to Bid by August 17, 2012. On August 1, 2012 the Workforce Partnership sent an email to over 400 organizations, community stakeholders, and board members announcing the release of the East Region RFP. The Workforce Partnership also publicly noticed the RFP in a local newspaper of general circulation, as well as published the RFP on the Workforce Partnership website. The Workforce Partnership conducted a Bidders’ Orientation and Technical Assistance session on August 8, 2012, with the following organizations in attendance:
1. ERISS Corporation
27
2. Grossmont Union High School District (Grossmont) 3. KRA, Corporation
On August 17, 2012 the Workforce Partnership received one Notice of Intent to Bid from Grossmont, and on September 4, 2012 the Workforce Partnership received Grossmont’s proposal. PROPOSAL EVALUATION The proposal was reviewed and evaluated by a panel of community leaders, board members, and Workforce Partnership staff. The panel was assigned a moderator to answer general questions the evaluators had throughout the review period, and to ensure the evaluators were given an opportunity to fully participate during the scoring debrief and oral interview. Each evaluator participated in an orientation on September 7, 2012. During the orientation, the moderator thoroughly reviewed the RFP with the evaluators to ensure there was a clear understanding of the RFP requirements. The moderator also explained the roles and responsibilities of the evaluators in determining whether Grossmont would be invited for an oral interview. Once the evaluators had reviewed Grossmont’s written submission, they convened on September 19, 2012 for the scoring debrief to:
• Review individual scores; • Come to consensus on whether or not to invite Grossmont in for an oral interview; and • If needed, develop questions for the oral interview.
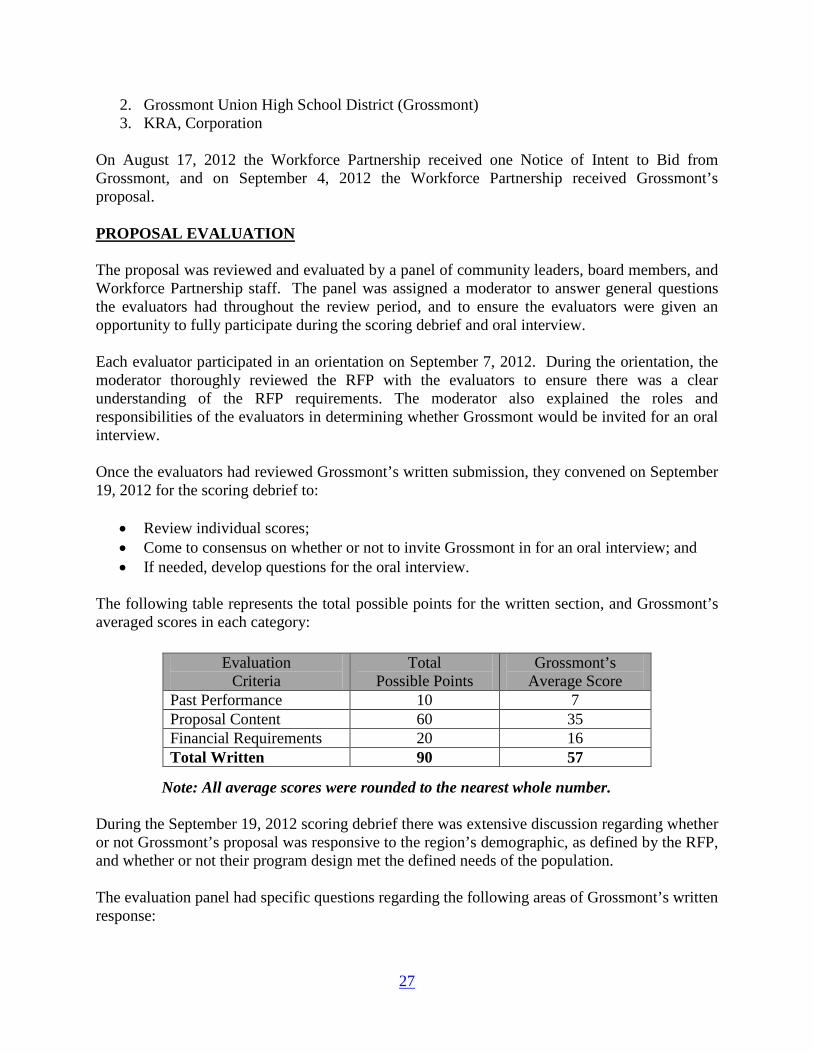
The following table represents the total possible points for the written section, and Grossmont’s averaged scores in each category:
Note: All average scores were rounded to the nearest whole number. During the September 19, 2012 scoring debrief there was extensive discussion regarding whether or not Grossmont’s proposal was responsive to the region’s demographic, as defined by the RFP, and whether or not their program design met the defined needs of the population. The evaluation panel had specific questions regarding the following areas of Grossmont’s written response:
Evaluation Criteria
Total Possible Points
Grossmont’s Average Score
Past Performance 10 7 Proposal Content 60 35 Financial Requirements 20 16 Total Written 90 57
28
1. Populations served; 2. Center hours of operation; 3. Supportive services; 4. Outreach and collaborations; and 5. Organization Business description and governance plan.
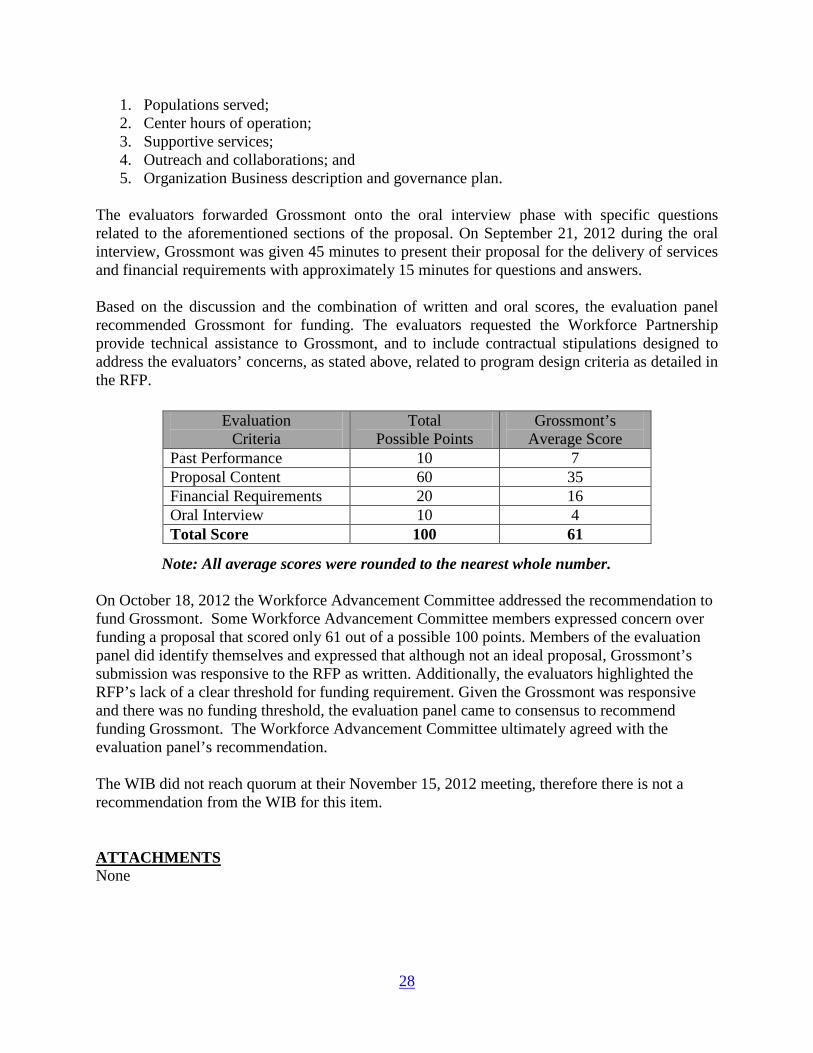
The evaluators forwarded Grossmont onto the oral interview phase with specific questions related to the aforementioned sections of the proposal. On September 21, 2012 during the oral interview, Grossmont was given 45 minutes to present their proposal for the delivery of services and financial requirements with approximately 15 minutes for questions and answers. Based on the discussion and the combination of written and oral scores, the evaluation panel recommended Grossmont for funding. The evaluators requested the Workforce Partnership provide technical assistance to Grossmont, and to include contractual stipulations designed to address the evaluators’ concerns, as stated above, related to program design criteria as detailed in the RFP.
Note: All average scores were rounded to the nearest whole number. On October 18, 2012 the Workforce Advancement Committee addressed the recommendation to fund Grossmont. Some Workforce Advancement Committee members expressed concern over funding a proposal that scored only 61 out of a possible 100 points. Members of the evaluation panel did identify themselves and expressed that although not an ideal proposal, Grossmont’s submission was responsive to the RFP as written. Additionally, the evaluators highlighted the RFP’s lack of a clear threshold for funding requirement. Given the Grossmont was responsive and there was no funding threshold, the evaluation panel came to consensus to recommend funding Grossmont. The Workforce Advancement Committee ultimately agreed with the evaluation panel’s recommendation. The WIB did not reach quorum at their November 15, 2012 meeting, therefore there is not a recommendation from the WIB for this item. ATTACHMENTS None
Evaluation Criteria
Total Possible Points
Grossmont’s Average Score
Past Performance 10 7 Proposal Content 60 35 Financial Requirements 20 16 Oral Interview 10 4 Total Score 100 61
29
AGENDA ITEM 9 DATE: November 15, 2012 RE: November 30, 2012 Meeting TO: San Diego Consortium Policy Board FROM: Margie de Ruyter, Senior Director Workforce Initiatives SUBJECT: PROGRAM YEAR 2012-2013 WORKFORCE INVESTMENT ACT
UNOBLIGATED - YOUTH FUNDS RECOMMENDATION That the San Diego Consortium Policy Board concur with the Youth Council to develop and issue a Request for Proposals (RFP) to create a pilot project in the amount of $689,000 to serve 18-21 year old youth with disabilities. BACKGROUND Workforce Investment Act (WIA) funds allocated to the San Diego Workforce Partnership (Workforce Partnership) from the state’s Workforce Services Division must be obligated or spent within a two-year period. A minimum 80% obligation rate must be met annually. Through the Workforce Partnership’s annual mid-year budget modification process, additional WIA Title I Youth funds has been identified. These additional funds must be obligated by June 30, 2013 to meet the state’s required 80% obligation rate. At the October 29, 2012 Youth Council meeting, staff presented several options for the Council’s consideration for funding recommendation. These options included:
Option 1: Develop and issue a one time RFP to create a pilot project to serve 18-21 year old youth with disabilities; or
Option 2: Award funds to the current contracted youth service providers to enhance
their 2013 summer employment components. Basis for the Options The Workforce Partnership has funded programs for the Program Year 2012-2013 to serve the following categories:
• In-School Youth Programs – targets youth ages 16-18 that are at-risk of dropping out of school. In partnership with secondary education, these programs provide career exploration, work-based learning and career technical skills training that lead to high school graduation and links to an array of postsecondary options.
30
• Out-of-School Youth Programs – targets youth ages 17-21, and provides access and entry into postsecondary education and/or occupational/technical skills training. These programs work in partnership with community colleges, advanced skills training entities, and/or four-year colleges and universities, that lead to postsecondary degrees and/or industry-recognized certifications.
• Recovery and Reengagement Programs – targets youth ages 16-21 that have dropped out of secondary school, or have been previously incarcerated, and lack basic education to enter the labor market and reconnects them to education and career pathway opportunities.
• Foster Youth Programs – in conjunction with the County of San Diego Child Welfare Services has contracted with two organizations to deliver services to current and former foster care youth through the Independent Living Skills/Workforce Investment Act funded Youth Workforce Program.
Additionally, in the past the Workforce Partnership has also funded targeted efforts to serve special populations, most notably through the gang prevention contracts. However, a vulnerable population not yet specifically targeted for services has been youth with disabilities. Today’s youth are faring poorly in today’s labor market. According to the national employment data reported by the U.S. Department of Labor’s-Office of Disability Employment Policy, only 15% of youth with disabilities are currently employed; this percentage is significantly lower than the 33.4% of youth without disabilities who are employed. Demographic data recorded in the Workforce Partnership’s data system, programs have only served a total 8% of youth with disabilities over the last five years. According to the May 2004 report issued by the National Collaborative on Workforce and Disability for Youth, titled, Knowledge, Skills, and Abilities of Youth Service Practitioners: The Centerpiece of a Successful Workforce Development System:
Youth with disabilities experience particularly poor education and employment outcomes. According to a 2003 study by the Urban Institute, one-third of youth with disabilities do not finish high school and only 38.1% are employed (Loprest & Maag, 2003). According to another study, only 27% of youth with disabilities are likely to enroll in postsecondary education (Blackorby & Wagner, 1996).
After much discussion, and with the understanding of the limited amount of funding available, the Youth Council approved issuing the funds as a one-time pilot program to provide services designed to meet the specific needs of youth with disabilities within San Diego County. Staff will present the RFP framework to the Youth Council for their input at the December 17, 2012 meeting. Key design elements will include: skills/career development, job placement, workplace accommodations and job retention. The intent of the program would be to develop mutually beneficial relationships with local employers while providing individualized skills training, and job development and placement services for youth based upon their vocational/occupational

31
goals. Upon approval, the above recommendation ensures the Workforce Partnership will meet the state’s 80% funding obligation rate. The Workforce Investment Board (WIB) did not reach quorum at their November 15, 2012 meeting, therefore there is not a recommendation from the WIB for this item. ATTACHMENTS None

32
AGENDA ITEM 10 DATE: November 15, 2012 RE: November 30, 2012 Meeting TO: San Diego Consortium Policy Board FROM: Margie de Ruyter, Senior Director Workforce Initiatives SUBJECT: YOUTH COUNCIL MEMBERSHIP RECOMMENDATION That the San Diego Consortium Policy Board concur with the Youth Council and approve the following membership actions:
Appoint the following candidates for an initial two-year term through June 30, 2014:
1. Marlene Taylor, Private Sector Representative and Workforce Investment Board Member (Youth Council Bylaws Section 2.2.a.);
2. Jacob Harris, an Out-Of-School Youth (Youth Council Bylaws Section 2.2.h.); 3. Stephanie Murphy, Local Public Housing Authority Representative (Youth
Council Bylaws Section 2.2c). Approval of these recommendations would bring the Youth Council membership to 23 members. BACKGROUND The Workforce Investment Act mandates the establishment of a Youth Council to serve as an advisory subgroup of the Workforce Investment Board (WIB). Section 2.2 of the Youth Council Bylaws requires the membership of the Youth Council to include:
a) Members of the WIB such as educators, which may include special education personnel, employers, and representatives of human service agencies, who have special interest or expertise in youth policy;
b) Members who represent service agencies, such as juvenile justice and local law enforcement agencies;
c) Members who represent local public housing authorities; d) Parents of eligible youth seeking assistance under subtitle B of title I of WIA; e) Individuals, including former participants, and members who represent organizations,
that have experience relating to youth activities; f) Members who represent the Job Corps, if a Job Corps Center is located in the local area
represented by the council; g) Youth who are enrolled in school; h) Out-of-school youth;
33
i) Members from the private sector; j) Members from local educational agencies serving youth; k) Members from private nonprofit agencies serving youth; l) Members from apprenticeship training programs serving youth; and m) Other individuals, who the chair of the WIB, in cooperation with the chief elected
official, determines to be appropriate. The Workforce Partnership is actively recruiting members for the Youth Council in order to fill the following mandatory seats that are currently vacant:
1. Parent(s) of eligible youth seeking assistance under subtitle B of Title I of WIA; and 2. Youth who are enrolled in school.
Staff is working with Youth Council and WIB members to assist with identifying appropriate candidates to fill these vacancies. The WIB did not reach quorum at their November 15, 2012 meeting, therefore there is not a recommendation from the WIB for this item. ATTACHMENTS Marlene Taylor Resume (On File) Jacob Harris Resume (One File) Stephanie Murphy Resume (On File)
34
AGENDA ITEM 11 DATE: November 15, 2012 RE: November 30, 2012 Meeting TO: San Diego Consortium Policy Board FROM: Mark Nanzer, Director Workforce Advancement Division SUBJECT: ONE-STOP CAREER CENTER NETWORK PERFORMANCE
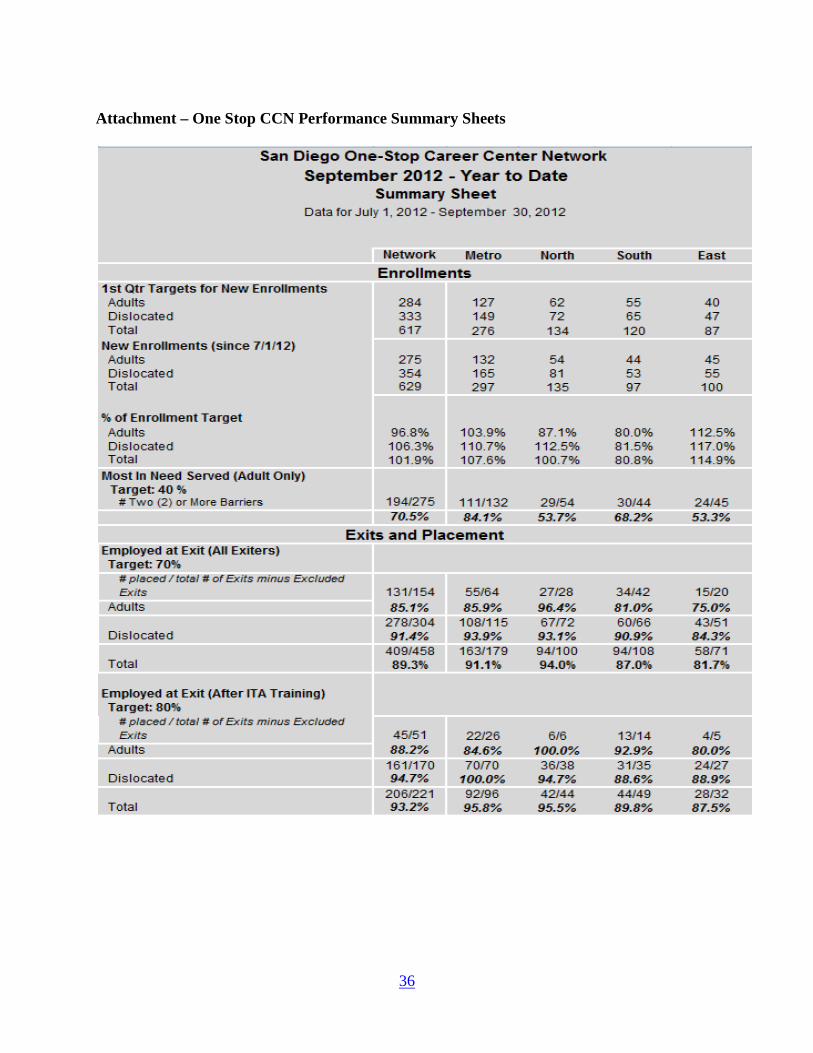
SUMMARY FOR QUARTER ENDING SEPTEMBER 30, 2012 INFORMATIONAL ITEM – NO ACTION REQUIRED This informational item provides a performance summary for the period ending September 30, 2012 on the One-Stop Career Center Network. BACKGROUND The Workforce Investment Act requires a comprehensive accountability system to determine the effectiveness of services provided through the One-Stop Career Center Network. Historically, the San Diego Workforce Partnership (Workforce Partnership) has issued a performance policy as an attachment to the One-Stop Career Center contracts. Each year, the Workforce Partnership sets local performance measures to which the One-Stop Career Center operators are held accountable to achieving. The performance measures are monitored on a quarterly basis and all performance is cumulative throughout the program year. The Workforce Partnership’s performance policy identifies two types of performance measures:
1. Accountability Measures: Contractors must meet targets per contractual obligations, or corrective action may be necessary if the contractor’s performance is at or below the corrective action level; and
2. Tracking Measures: Measures that will provide additional information on key areas of performance.
ANALYSIS KRA Corporation (KRA), operator of the Metro regional career centers and Grossmont Union High School District (Grossmont) operator of the East County Career Center, performed well during the 1st quarter, exceeding the performance targets in most of the areas. ResCare Workforce Services (ResCare) performed below corrective action level in some areas. Enrollments: Grossmont and KRA have exceeded their enrollment targets for the 1st quarter in both adult and dislocated worker populations. However, ResCare, operator of the North and South regional career centers performed below corrective action level on the enrollments measure(s).
35
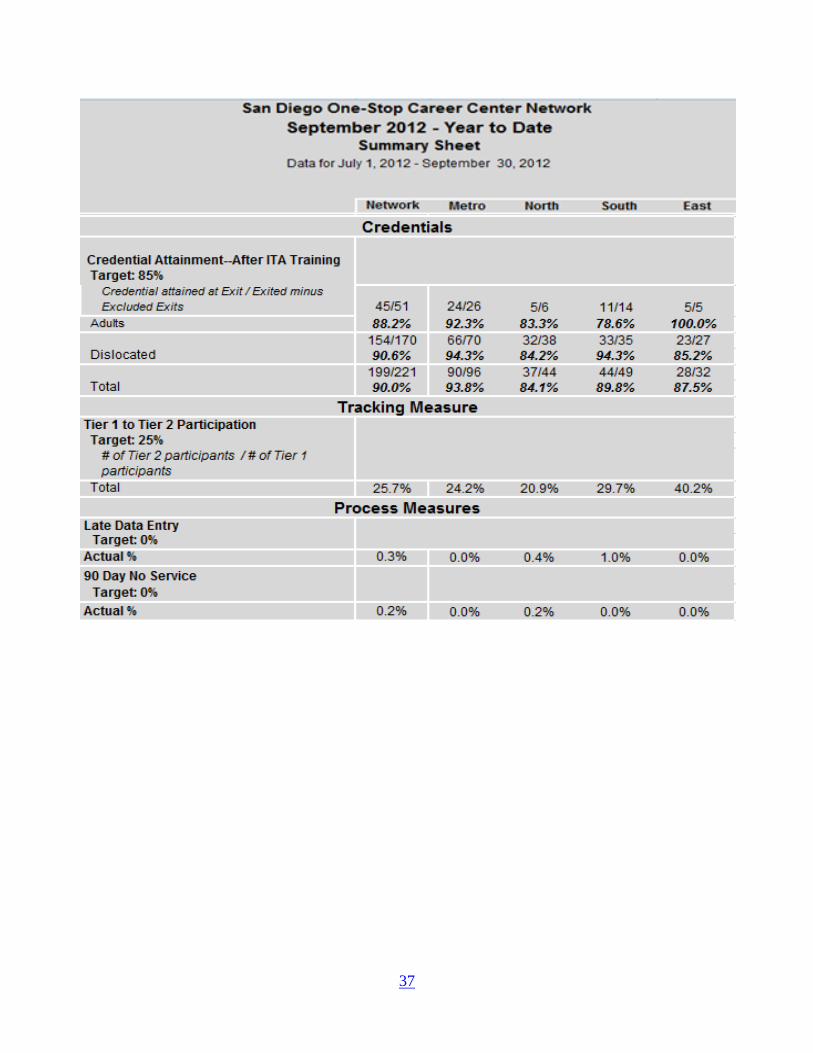
90 Days No Service: The 90 Day No Service measure tracks the percentage of active participants who have no record of a service for 90 days or more. There is a 0% target for this measure. Any operator that exceeds the 0% will be placed on corrective action. Operators, with the exception of ResCare (North), have met the performance target. The Workforce Partnership has decided to waive the corrective action due to legitimate mitigating circumstances with our data system. Late Data Entry: All of the operators performed at target on the late data entry measure, they all performed under the 5% corrective action level. Credential Attainment: It is important to ensure participants are provided with the support necessary to complete their training programs and earn an employer-recognized credential. All One-Stop Career Center operators with the exception of ResCare (North), have exceeded performance in this measure. Although ResCare (North) did perform below target, they still performed above the 80% corrective action level. ATTACHMENTS One Stop CCN Performance Summary Sheets
36
Attachment – One Stop CCN Performance Summary Sheets
37
38
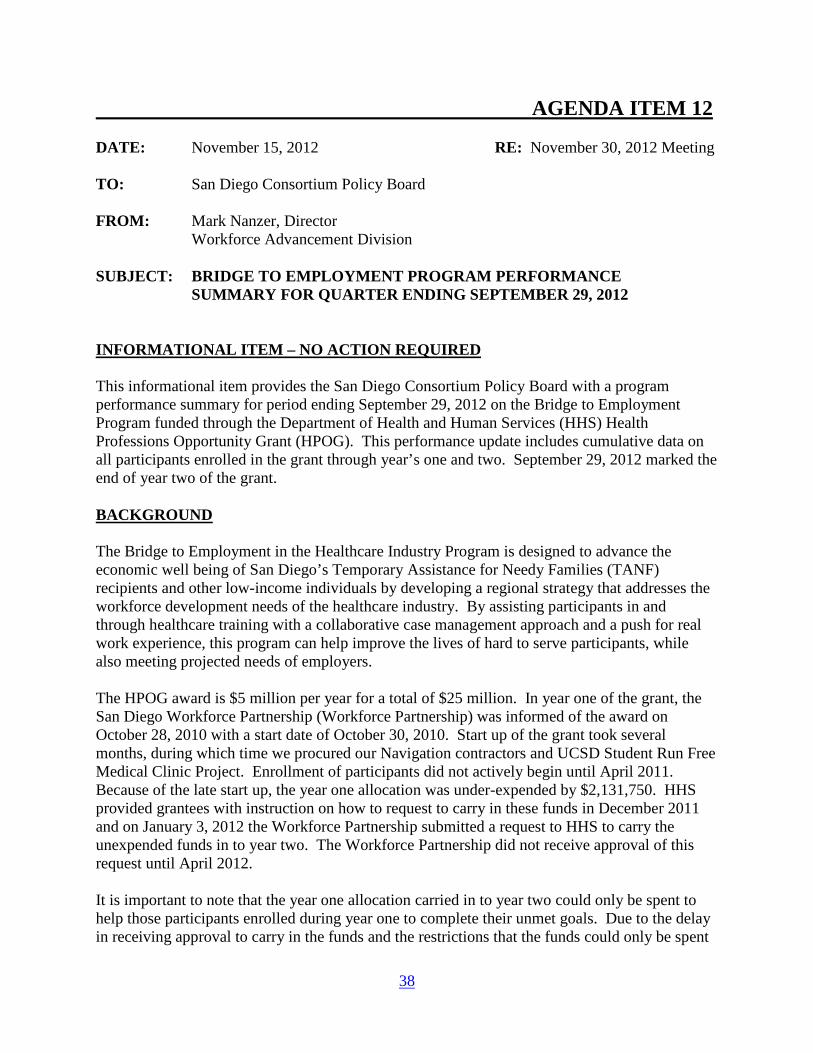
AGENDA ITEM 12 DATE: November 15, 2012 RE: November 30, 2012 Meeting TO: San Diego Consortium Policy Board FROM: Mark Nanzer, Director Workforce Advancement Division SUBJECT: BRIDGE TO EMPLOYMENT PROGRAM PERFORMANCE
SUMMARY FOR QUARTER ENDING SEPTEMBER 29, 2012 INFORMATIONAL ITEM – NO ACTION REQUIRED This informational item provides the San Diego Consortium Policy Board with a program performance summary for period ending September 29, 2012 on the Bridge to Employment Program funded through the Department of Health and Human Services (HHS) Health Professions Opportunity Grant (HPOG). This performance update includes cumulative data on all participants enrolled in the grant through year’s one and two. September 29, 2012 marked the end of year two of the grant. BACKGROUND The Bridge to Employment in the Healthcare Industry Program is designed to advance the economic well being of San Diego’s Temporary Assistance for Needy Families (TANF) recipients and other low-income individuals by developing a regional strategy that addresses the workforce development needs of the healthcare industry. By assisting participants in and through healthcare training with a collaborative case management approach and a push for real work experience, this program can help improve the lives of hard to serve participants, while also meeting projected needs of employers. The HPOG award is $5 million per year for a total of $25 million. In year one of the grant, the San Diego Workforce Partnership (Workforce Partnership) was informed of the award on October 28, 2010 with a start date of October 30, 2010. Start up of the grant took several months, during which time we procured our Navigation contractors and UCSD Student Run Free Medical Clinic Project. Enrollment of participants did not actively begin until April 2011. Because of the late start up, the year one allocation was under-expended by $2,131,750. HHS provided grantees with instruction on how to request to carry in these funds in December 2011 and on January 3, 2012 the Workforce Partnership submitted a request to HHS to carry the unexpended funds in to year two. The Workforce Partnership did not receive approval of this request until April 2012. It is important to note that the year one allocation carried in to year two could only be spent to help those participants enrolled during year one to complete their unmet goals. Due to the delay in receiving approval to carry in the funds and the restrictions that the funds could only be spent
39
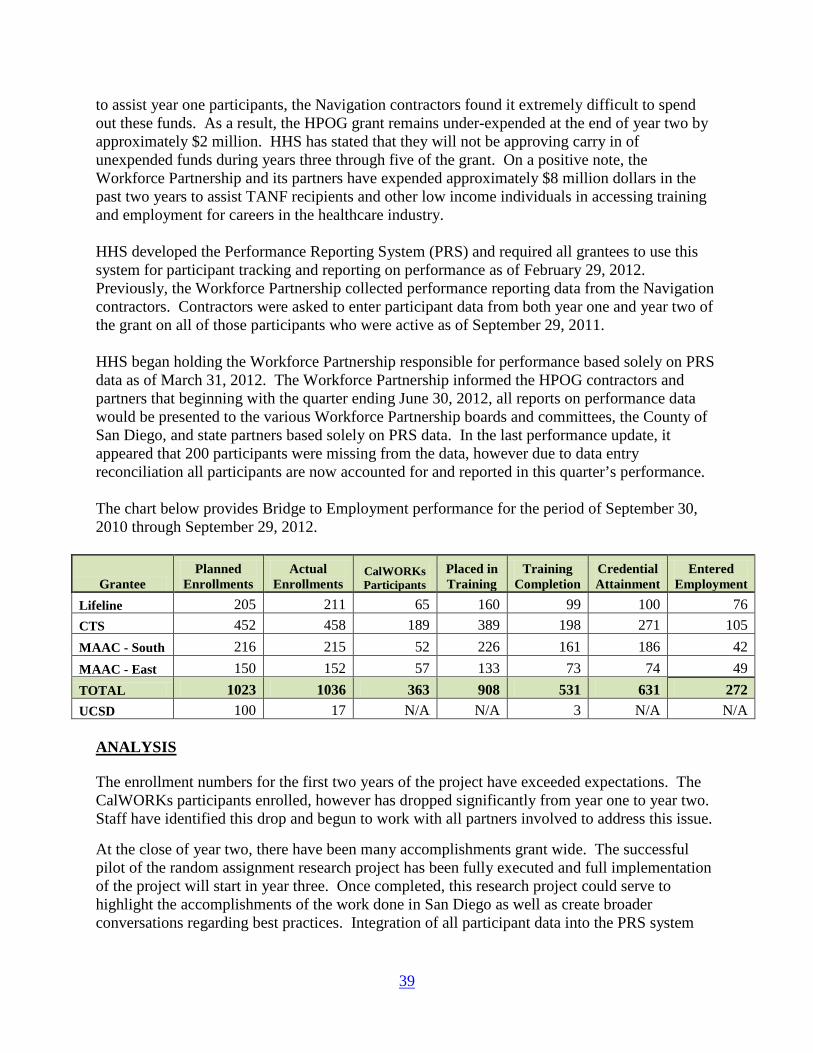
to assist year one participants, the Navigation contractors found it extremely difficult to spend out these funds. As a result, the HPOG grant remains under-expended at the end of year two by approximately $2 million. HHS has stated that they will not be approving carry in of unexpended funds during years three through five of the grant. On a positive note, the Workforce Partnership and its partners have expended approximately $8 million dollars in the past two years to assist TANF recipients and other low income individuals in accessing training and employment for careers in the healthcare industry. HHS developed the Performance Reporting System (PRS) and required all grantees to use this system for participant tracking and reporting on performance as of February 29, 2012. Previously, the Workforce Partnership collected performance reporting data from the Navigation contractors. Contractors were asked to enter participant data from both year one and year two of the grant on all of those participants who were active as of September 29, 2011. HHS began holding the Workforce Partnership responsible for performance based solely on PRS data as of March 31, 2012. The Workforce Partnership informed the HPOG contractors and partners that beginning with the quarter ending June 30, 2012, all reports on performance data would be presented to the various Workforce Partnership boards and committees, the County of San Diego, and state partners based solely on PRS data. In the last performance update, it appeared that 200 participants were missing from the data, however due to data entry reconciliation all participants are now accounted for and reported in this quarter’s performance. The chart below provides Bridge to Employment performance for the period of September 30, 2010 through September 29, 2012.
Grantee Planned
Enrollments Actual
Enrollments CalWORKs Participants
Placed in Training
Training Completion
Credential Attainment
Entered Employment
Lifeline 205 211 65 160 99 100 76 CTS 452 458 189 389 198 271 105 MAAC - South 216 215 52 226 161 186 42 MAAC - East 150 152 57 133 73 74 49 TOTAL 1023 1036 363 908 531 631 272 UCSD 100 17 N/A N/A 3 N/A N/A
ANALYSIS The enrollment numbers for the first two years of the project have exceeded expectations. The CalWORKs participants enrolled, however has dropped significantly from year one to year two. Staff have identified this drop and begun to work with all partners involved to address this issue. At the close of year two, there have been many accomplishments grant wide. The successful pilot of the random assignment research project has been fully executed and full implementation of the project will start in year three. Once completed, this research project could serve to highlight the accomplishments of the work done in San Diego as well as create broader conversations regarding best practices. Integration of all participant data into the PRS system
40
and a reconciliation of that data have allowed for better performance tracking grant wide and easier reporting to partner agencies on the Navigators’ progress. The University of California, San Diego (UCSD) work experience component of the program does not enroll participants directly; rather it provides work experience for the current participants enrolled in the program. Therefore, the number of participants actively participating in work experience with UCSD does not change the total enrollment number but are reflected here to show UCSD’s performance. Participant access to UCSD for work experience opportunities has been lower than planned. This is due to the clinic sites and hours not being accessible to participants. Staff has also learned that enrollment in the work experience opportunities is lengthy and can take six weeks or longer. Staff met with UCSD during year two regarding the contractual outcomes. UCSD agreed to focus their efforts on a multitude of activities including: employer outreach, client tutoring and test preparation classes, workshop days which will allow participants to test their competencies and brush up on skills, and work readiness skill building and mock interviews. UCSD has failed to provide these services on a regular basis. Staff is concerned about the performance of this contract and will be meeting with UCSD prior to the execution of their Year Three contract to determine whether or not the Student Run Free Medical Clinic Project at UCSD is actually a good fit for the project. A major focus during both years of the program has been to ensure mechanisms were in place to connect with other assistance programs across the county. This effort has focused on identifying common customers among partners that could benefit from the Bridge to Employment program and creating a referral system to ensure client success. The ongoing and growing communication between San Diego’s CalWORK’s contractors and the Navigators has proved to be a most beneficial relationship. This partnership has reduced duplicative efforts while still ensuring the participants are getting the most from the services and resources available to them to be successful in their training programs. The Common Customer Workgroup includes the following organizations: County of San Diego HHS, San Diego County’s CalWORKs contractors, the Family Self Sufficiency programs, the San Diego Housing Commission, the County’s Department of Housing and Community Development, and the Navigator Contractors. Most recently, the One Stop Career Center Network has been attending these meetings to assist with sustainability efforts and to add their expertise to system alignment and system building efforts. The value of this program is seen in its ability to help individuals who may have many barriers to training programs and employment, including homelessness, lack of transportation, low-income and inability to pay for training. This program allows these individuals to participate in training programs as well as find stability and eventual employment. Below is a success story from North County Lifeline: Tawnya first expressed interest in the Bridge to Employment program while she was attending Kaplan College’s Vocational Nursing program. As a new mother, she understood the importance of completing the program with as little debt as possible and actively pursued the assistance offered at North County Lifeline.

41
Unable to work while attending her full time training, Tawnya was very appreciative of the supportive services available to her, and was very fortunate to receive a $10,000 ITA through the Bridge to Employment program. Throughout her time in the program, she has accessed supportive services to help with transportation, career equipment/uniforms, food, graduation fees, and recently her application fee to National University for their registered nursing program. Since her enrollment into the program, Tawnya successfully graduated from the Vocational Nursing program at Kaplan. She received her Vocational Nursing license and is now taking the next step to a registered nursing program. We are proud that Tawnya recently found full-time employment as a vocational nurse. She is making $19 an hour and is very excited and optimistic about her future. ATTACHMENTS HPOG PowerPoint Presentation Slides
42
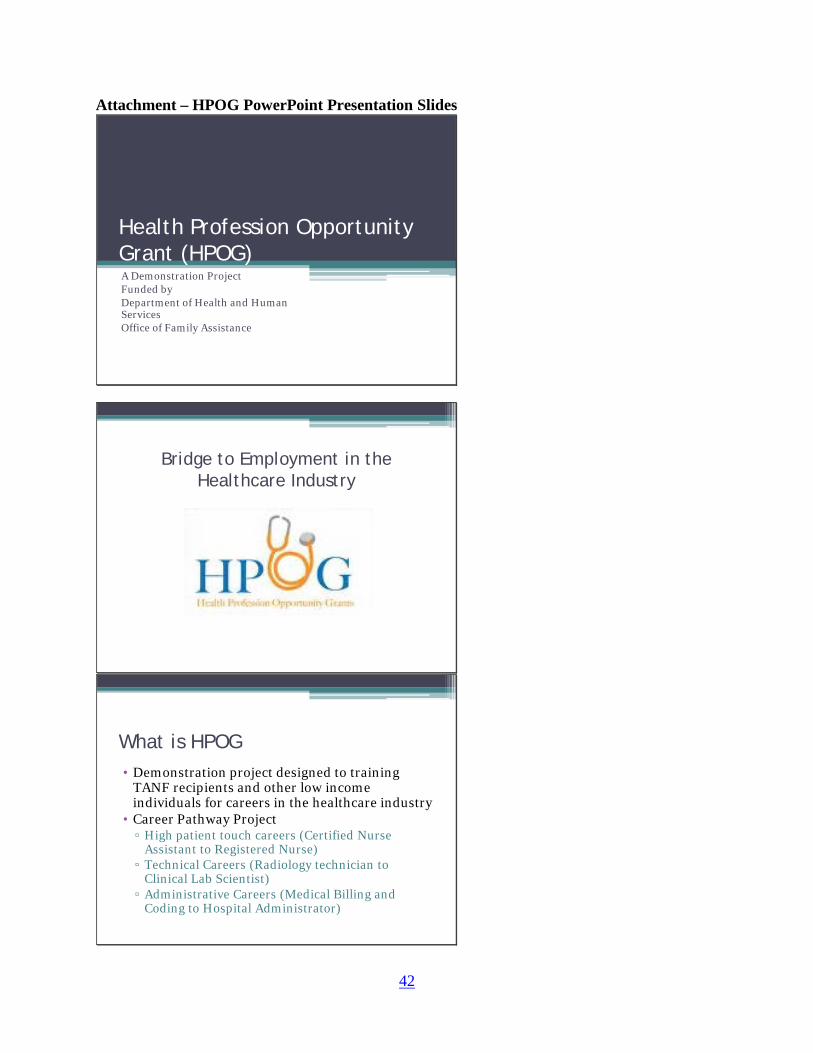
Attachment – HPOG PowerPoint Presentation Slides
Health Profession Opportunity Grant (HPOG)A Demonstration ProjectFunded byDepartment of Health and Human ServicesOffice of Family Assistance
Bridge to Employment in the Healthcare Industry
What is HPOG• Demonstration project designed to training
TANF recipients and other low income individuals for careers in the healthcare industry
• Career Pathway Project▫ High patient touch careers (Certified Nurse
Assistant to Registered Nurse)▫ Technical Careers (Radiology technician to
Clinical Lab Scientist)▫ Administrative Careers (Medical Billing and
Coding to Hospital Administrator)
43
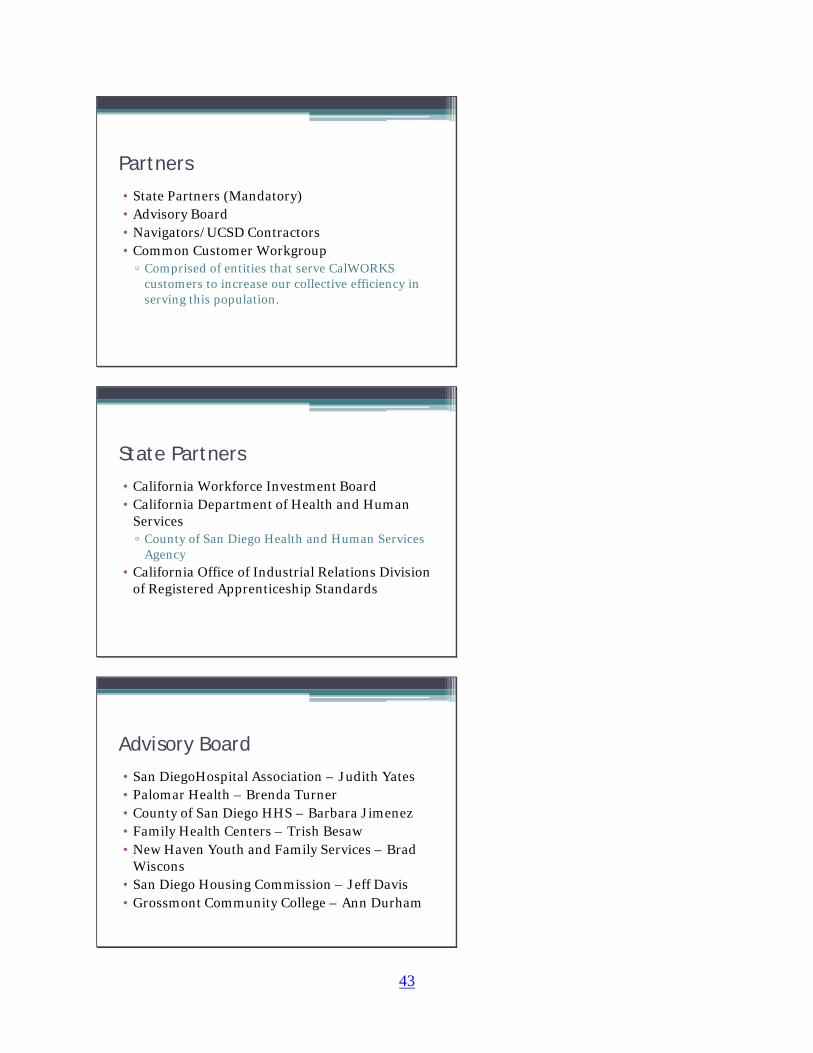
Partners
• State Partners (Mandatory)• Advisory Board• Navigators/UCSD Contractors• Common Customer Workgroup▫ Comprised of entities that serve CalWORKS
customers to increase our collective efficiency in serving this population.
State Partners
• California Workforce Investment Board• California Department of Health and Human
Services▫ County of San Diego Health and Human Services
Agency• California Office of Industrial Relations Division
of Registered Apprenticeship Standards
Advisory Board
• San DiegoHospital Association – Judith Yates• Palomar Health – Brenda Turner• County of San Diego HHS – Barbara Jimenez• Family Health Centers – Trish Besaw• New Haven Youth and Family Services – Brad
Wiscons• San Diego Housing Commission – Jeff Davis• Grossmont Community College – Ann Durham
44
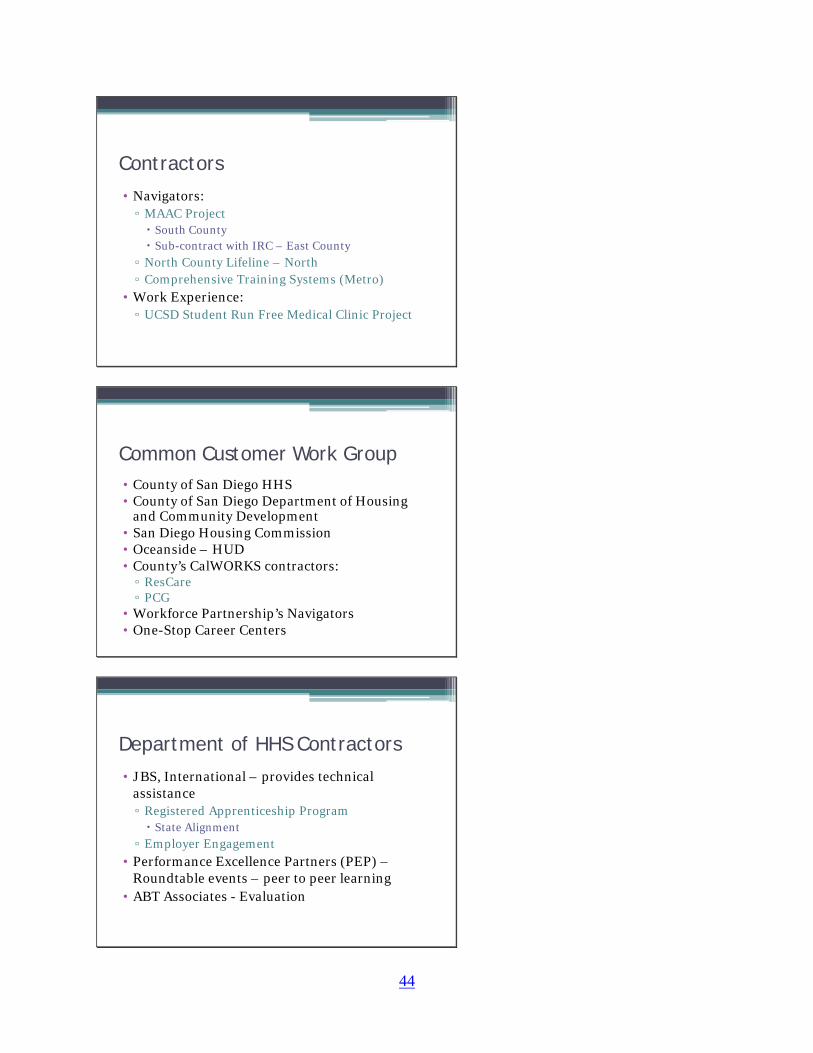
Contractors
• Navigators:▫ MAAC Project South County Sub-contract with IRC – East County
▫ North County Lifeline – North▫ Comprehensive Training Systems (Metro)
• Work Experience:▫ UCSD Student Run Free Medical Clinic Project
Common Customer Work Group• County of San Diego HHS• County of San Diego Department of Housing
and Community Development• San Diego Housing Commission• Oceanside – HUD• County’s CalWORKS contractors:▫ ResCare▫ PCG
• Workforce Partnership’s Navigators• One-Stop Career Centers
Department of HHS Contractors
• JBS, International – provides technical assistance▫ Registered Apprenticeship Program State Alignment
▫ Employer Engagement• Performance Excellence Partners (PEP) –
Roundtable events – peer to peer learning• ABT Associates - Evaluation
45
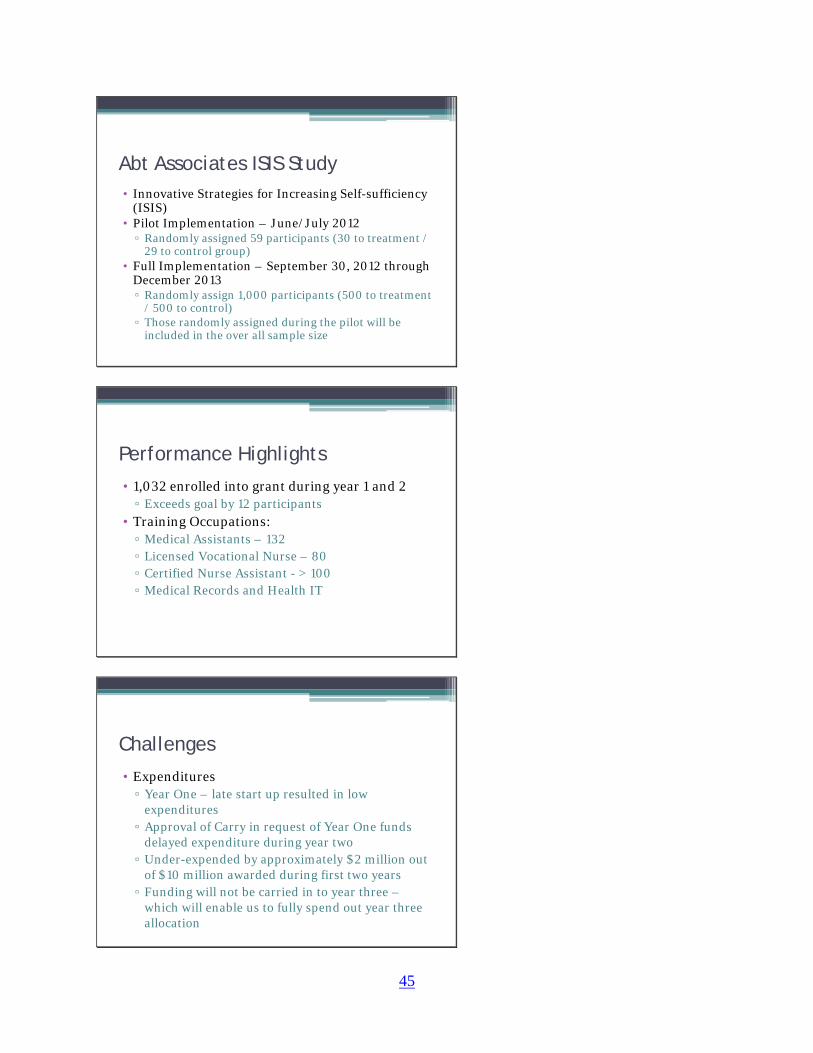
Abt Associates ISIS Study• Innovative Strategies for Increasing Self-sufficiency
(ISIS)• Pilot Implementation – June/July 2012▫ Randomly assigned 59 participants (30 to treatment /
29 to control group)• Full Implementation – September 30, 2012 through
December 2013▫ Randomly assign 1,000 participants (500 to treatment
/ 500 to control)▫ Those randomly assigned during the pilot will be
included in the over all sample size
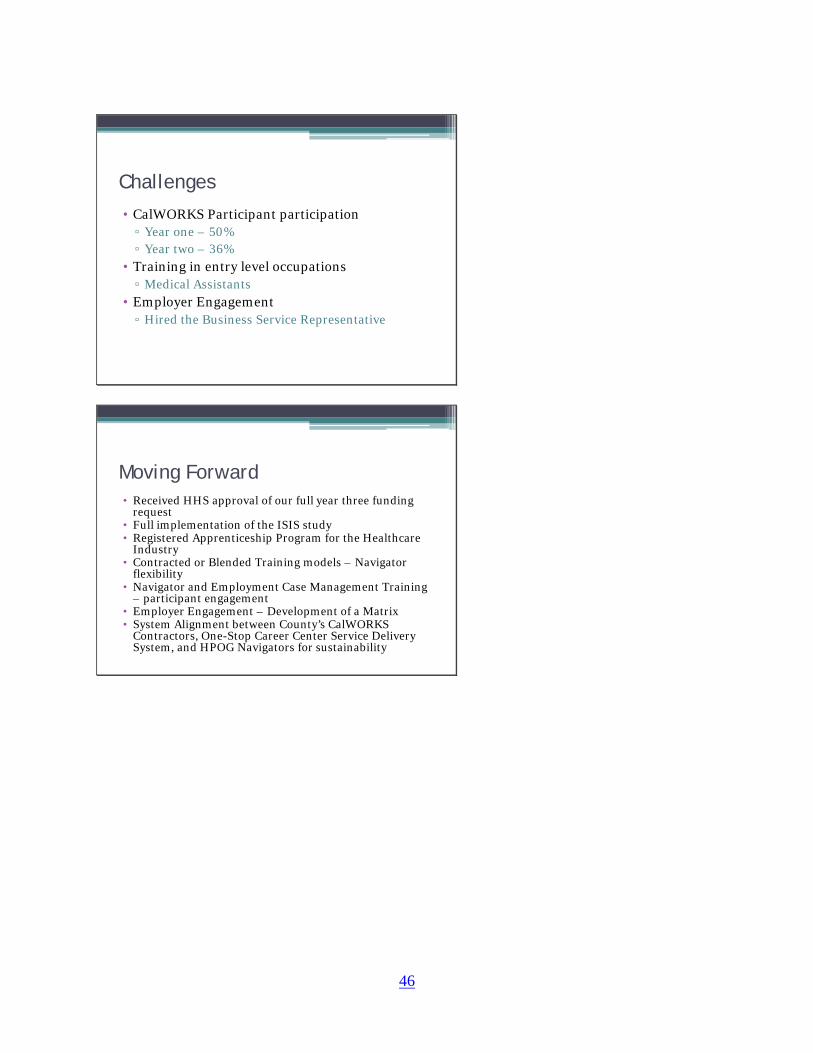
Performance Highlights
• 1,032 enrolled into grant during year 1 and 2▫ Exceeds goal by 12 participants
• Training Occupations:▫ Medical Assistants – 132▫ Licensed Vocational Nurse – 80▫ Certified Nurse Assistant - > 100▫ Medical Records and Health IT
Challenges
• Expenditures▫ Year One – late start up resulted in low
expenditures▫ Approval of Carry in request of Year One funds
delayed expenditure during year two▫ Under-expended by approximately $2 million out
of $10 million awarded during first two years▫ Funding will not be carried in to year three –
which will enable us to fully spend out year three allocation
46
Challenges
• CalWORKS Participant participation▫ Year one – 50%▫ Year two – 36%
• Training in entry level occupations▫ Medical Assistants
• Employer Engagement▫ Hired the Business Service Representative
Moving Forward• Received HHS approval of our full year three funding
request• Full implementation of the ISIS study• Registered Apprenticeship Program for the Healthcare
Industry• Contracted or Blended Training models – Navigator
flexibility• Navigator and Employment Case Management Training
– participant engagement• Employer Engagement – Development of a Matrix• System Alignment between County’s CalWORKS
Contractors, One-Stop Career Center Service Delivery System, and HPOG Navigators for sustainability
47
AGENDA ITEM 13 DATE: November 15, 2012 RE: November 30, 2012 Meeting TO: San Diego Consortium Policy Board FROM: Mark Nanzer, Director Workforce Advancement Division SUBJECT: VETERANS EMPLOYMENT-RELATED ASSISTANCE PROGRAM
PERFORMANCE SUMMARY FOR QUARTER ENDING SEPTEMBER 30, 2012
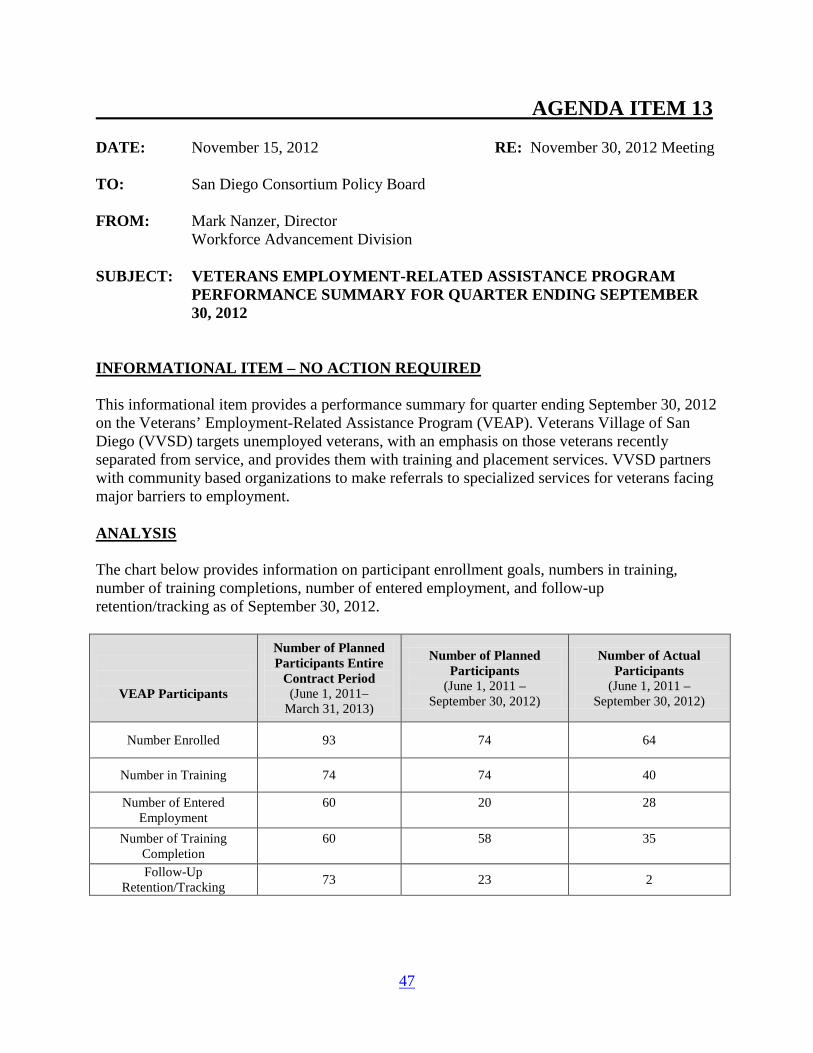
INFORMATIONAL ITEM – NO ACTION REQUIRED This informational item provides a performance summary for quarter ending September 30, 2012 on the Veterans’ Employment-Related Assistance Program (VEAP). Veterans Village of San Diego (VVSD) targets unemployed veterans, with an emphasis on those veterans recently separated from service, and provides them with training and placement services. VVSD partners with community based organizations to make referrals to specialized services for veterans facing major barriers to employment. ANALYSIS The chart below provides information on participant enrollment goals, numbers in training, number of training completions, number of entered employment, and follow-up retention/tracking as of September 30, 2012.
VEAP Participants
Number of Planned Participants Entire
Contract Period (June 1, 2011–
March 31, 2013)
Number of Planned Participants
(June 1, 2011 – September 30, 2012)
Number of Actual Participants
(June 1, 2011 – September 30, 2012)
Number Enrolled 93 74 64
Number in Training 74 74 40
Number of Entered Employment
60
20
28
Number of Training Completion
60
58
35
Follow-Up Retention/Tracking 73 23 2
48
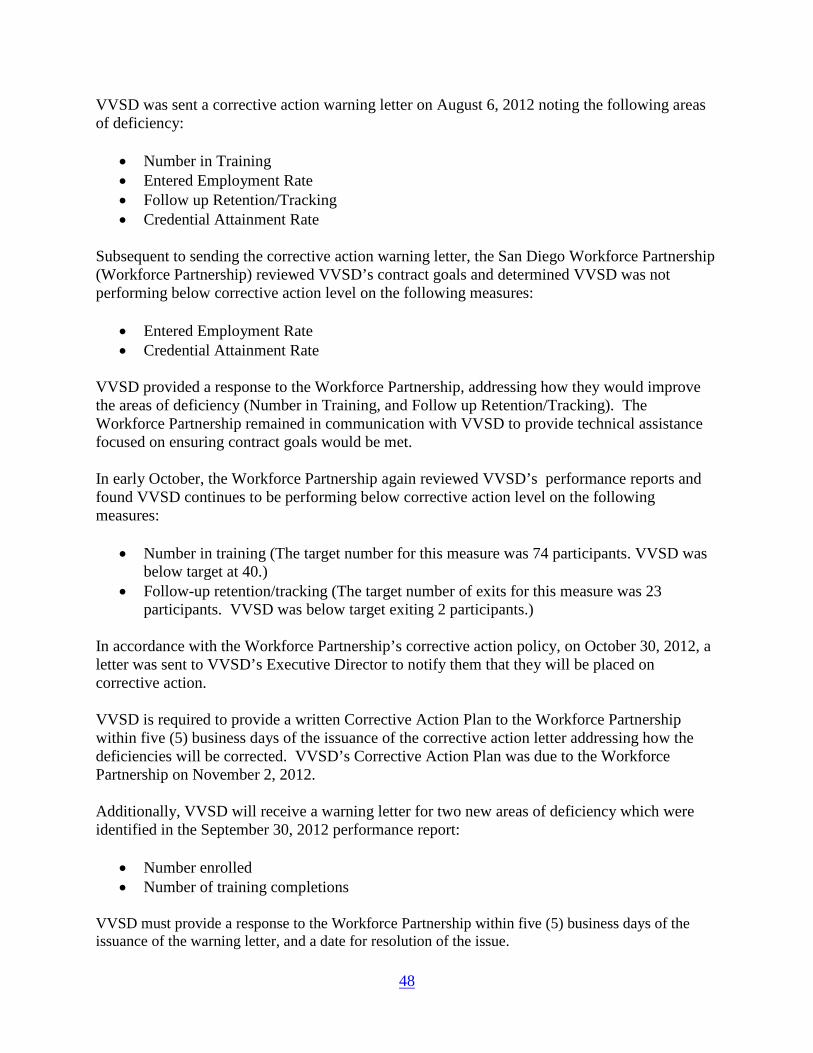
VVSD was sent a corrective action warning letter on August 6, 2012 noting the following areas of deficiency:
• Number in Training • Entered Employment Rate • Follow up Retention/Tracking • Credential Attainment Rate
Subsequent to sending the corrective action warning letter, the San Diego Workforce Partnership (Workforce Partnership) reviewed VVSD’s contract goals and determined VVSD was not performing below corrective action level on the following measures:
• Entered Employment Rate • Credential Attainment Rate
VVSD provided a response to the Workforce Partnership, addressing how they would improve the areas of deficiency (Number in Training, and Follow up Retention/Tracking). The Workforce Partnership remained in communication with VVSD to provide technical assistance focused on ensuring contract goals would be met. In early October, the Workforce Partnership again reviewed VVSD’s performance reports and found VVSD continues to be performing below corrective action level on the following measures:
• Number in training (The target number for this measure was 74 participants. VVSD was below target at 40.)
• Follow-up retention/tracking (The target number of exits for this measure was 23 participants. VVSD was below target exiting 2 participants.)
In accordance with the Workforce Partnership’s corrective action policy, on October 30, 2012, a letter was sent to VVSD’s Executive Director to notify them that they will be placed on corrective action. VVSD is required to provide a written Corrective Action Plan to the Workforce Partnership within five (5) business days of the issuance of the corrective action letter addressing how the deficiencies will be corrected. VVSD’s Corrective Action Plan was due to the Workforce Partnership on November 2, 2012. Additionally, VVSD will receive a warning letter for two new areas of deficiency which were identified in the September 30, 2012 performance report:
• Number enrolled • Number of training completions
VVSD must provide a response to the Workforce Partnership within five (5) business days of the issuance of the warning letter, and a date for resolution of the issue.
49
The Workforce Partnership will continue to provide technical assistance to VVSD to aide in the resolution of the deficiencies. If VVSD continues to be below corrective action level performance, the Workforce Partnership may take one of the following actions:
• The Corrective Action may be continued for an additional quarter depending upon the circumstances of the deficiency and ability to resolve the issue promptly, as determined by the Workforce Partnership;
• Outstanding or unresolved Corrective Action Plans at the end of the Program Year may face one or more of the following consequences:
1. Provider may not be considered for continued funding or an extension of their
contract from the Workforce Partnership; 2. Provider may be subject to de-obligation of funds; 3. Provider may be considered ineligible for funding in future procurements, for a
specified time period, from the Workforce Partnership; and/or 4. Provider may be subject to termination of contract,
The Workforce Partnership will provide technical assistance to VVSD to aide in resolution of the deficiencies. ATTACHMENTS None
50
AGENDA ITEM 14 DATE: November 15, 2012 RE: November 30, 2012 Meeting TO: San Diego Consortium Policy Board FROM: Mark Nanzer, Director Workforce Advancement Division SUBJECT: THE ARC OF SAN DIEGO CUSTOMIZED TRAINING PERFORMANCE
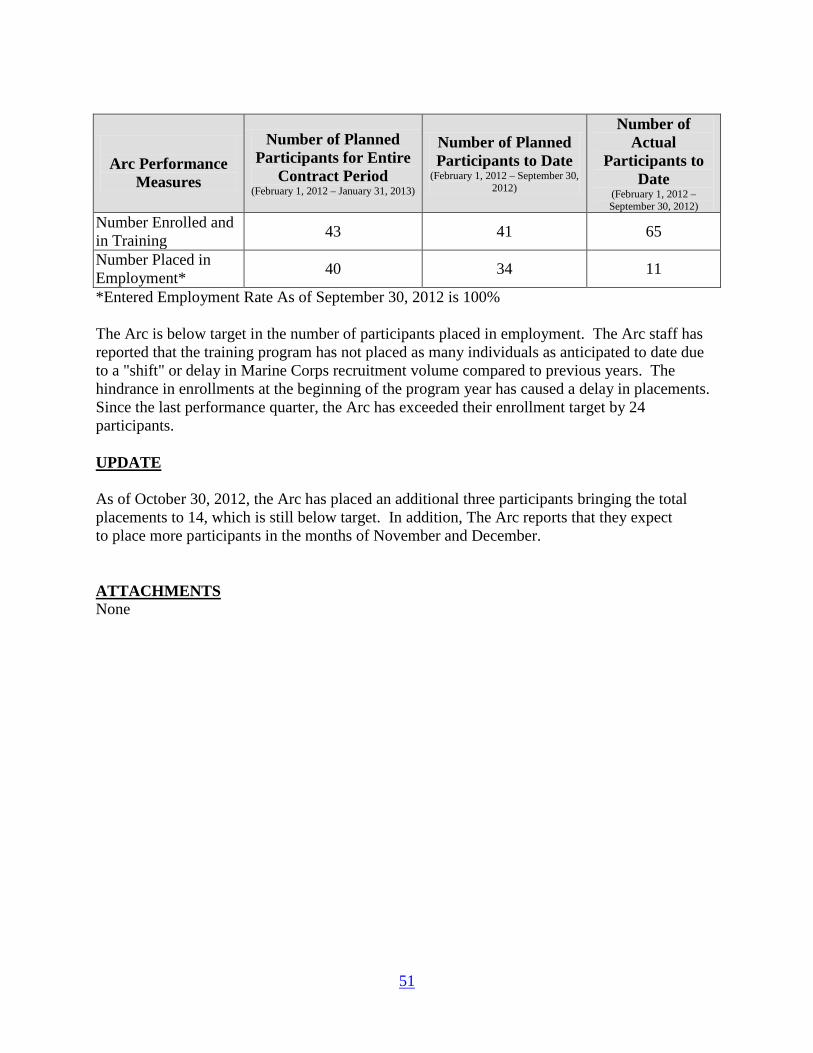
SUMMARY FOR QUARTER ENDING SEPTEMBER 30, 2012 INFORMATIONAL ITEM - NO ACTION REQUIRED This informational item provides a performance summary for period ending September 30, 2012 on the Arc of San Diego (Arc) Customized Training contract. BACKGROUND The Arc has been providing training services to persons with disabilities since 1951. The agency has a rich history of creating and implementing innovative programs that meet the needs of children and adults with a wide range of disabilities. These employees include people with developmental disabilities, physical disabilities, mental illness, substance abuse related disabilities, and even those with multiple disabling conditions, many of whom have little to no job experience. The skills attained by participants contribute considerably to their independence, dignity, and quality of life and create opportunities for self-reliance that otherwise would not be available to them. The Arc’s training program at the Marine Corps Recruit Depot consists of training in a fast paced food service environment. Participants are responsible for serving meals and maintaining the facility to meet military sanitation requirements; they also maintain the grounds around the Mess Hall. Duties performed include, but are not limited to: replacing glassware, dishes, silverware and refilling condiment containers, cleaning work areas, utensils and equipment, operating dish washing machinery, making coffee, preparing food, mopping floors, removing garbage and manual tasks in the kitchen or dining area. ANALYSIS The following chart provides information on participant enrollment goals, number in training, and the number of placements into employment as of September 30, 2012:
51
Arc Performance
Measures
Number of Planned Participants for Entire
Contract Period (February 1, 2012 – January 31, 2013)
Number of Planned Participants to Date
(February 1, 2012 – September 30, 2012)
Number of Actual
Participants to Date
(February 1, 2012 – September 30, 2012)
Number Enrolled and in Training 43 41 65
Number Placed in Employment* 40 34 11
*Entered Employment Rate As of September 30, 2012 is 100% The Arc is below target in the number of participants placed in employment. The Arc staff has reported that the training program has not placed as many individuals as anticipated to date due to a "shift" or delay in Marine Corps recruitment volume compared to previous years. The hindrance in enrollments at the beginning of the program year has caused a delay in placements. Since the last performance quarter, the Arc has exceeded their enrollment target by 24 participants. UPDATE As of October 30, 2012, the Arc has placed an additional three participants bringing the total placements to 14, which is still below target. In addition, The Arc reports that they expect to place more participants in the months of November and December. ATTACHMENTS None
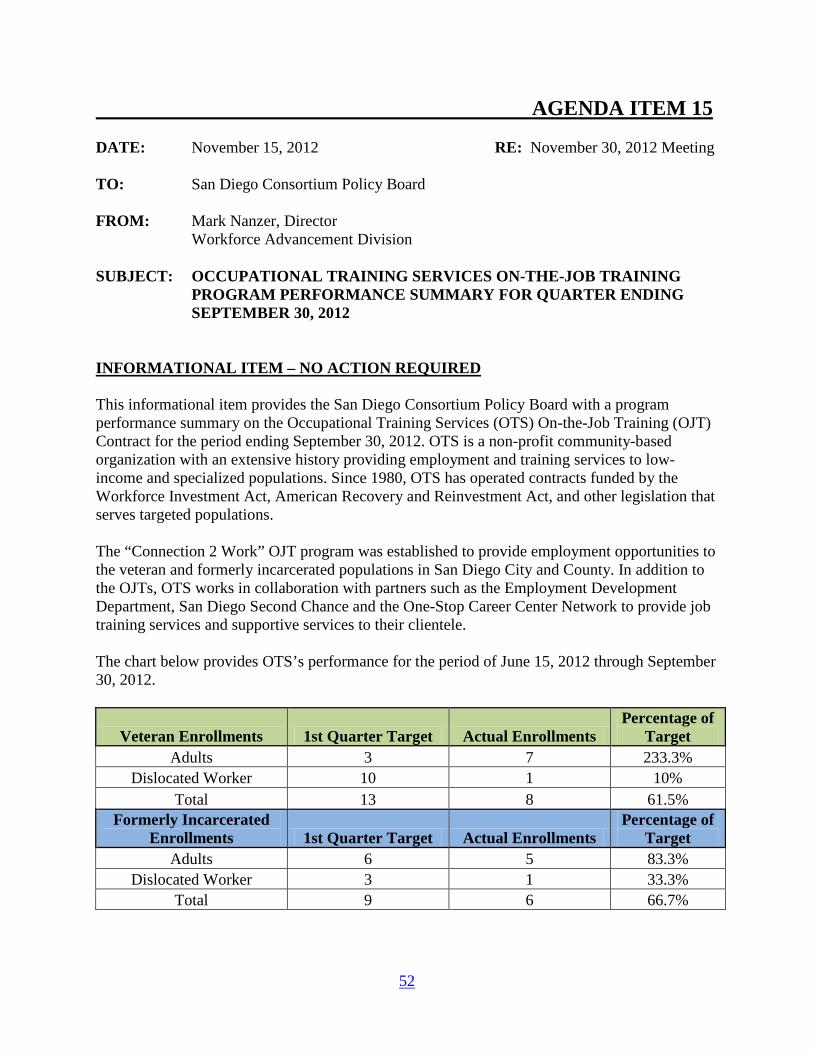
52
AGENDA ITEM 15 DATE: November 15, 2012 RE: November 30, 2012 Meeting TO: San Diego Consortium Policy Board FROM: Mark Nanzer, Director Workforce Advancement Division SUBJECT: OCCUPATIONAL TRAINING SERVICES ON-THE-JOB TRAINING
PROGRAM PERFORMANCE SUMMARY FOR QUARTER ENDING SEPTEMBER 30, 2012
INFORMATIONAL ITEM – NO ACTION REQUIRED This informational item provides the San Diego Consortium Policy Board with a program performance summary on the Occupational Training Services (OTS) On-the-Job Training (OJT) Contract for the period ending September 30, 2012. OTS is a non-profit community-based organization with an extensive history providing employment and training services to low-income and specialized populations. Since 1980, OTS has operated contracts funded by the Workforce Investment Act, American Recovery and Reinvestment Act, and other legislation that serves targeted populations. The “Connection 2 Work” OJT program was established to provide employment opportunities to the veteran and formerly incarcerated populations in San Diego City and County. In addition to the OJTs, OTS works in collaboration with partners such as the Employment Development Department, San Diego Second Chance and the One-Stop Career Center Network to provide job training services and supportive services to their clientele. The chart below provides OTS’s performance for the period of June 15, 2012 through September 30, 2012.
Veteran Enrollments 1st Quarter Target Actual Enrollments Percentage of
Target Adults 3 7 233.3%
Dislocated Worker 10 1 10% Total 13 8 61.5%
Formerly Incarcerated Enrollments 1st Quarter Target Actual Enrollments
Percentage of Target
Adults 6 5 83.3% Dislocated Worker 3 1 33.3%
Total 9 6 66.7%
53
ANALYSIS OTS has performed below target for the veteran and formerly incarcerated enrollments for the 1st quarter. The San Diego Workforce Partnership (Workforce Partnership) met with OTS management to address challenges with enrollment. OTS reported they have not met their enrollment goals due a slow start up. Other contributing factors to the low enrollments were based on the difficulty to serve the identified populations and the additional supports those populations need to become job ready. For example, many participants were missing the documents necessary to prove they were either eligible for the program or that they were eligible to work in the United States. One of OTS’ solutions to the challenge of gathering documents was to require that participants gather all appropriate documentation before scheduling an appointment. OTS also received direction and support from the Department of Corrections in obtaining the required information on convictions for the formerly incarcerated participants. In accordance with the Workforce Partnership’s Corrective Action Policy, OTS will be placed on corrective action for performing below the identified target level for the enrollment performance measure. A corrective action letter was sent to OTS on October 29, 2012 noting the areas of deficiency for the measure in the accountability period. OTS was given five (5) business days from the date of the letter to submit a written Corrective Action Plan to their Program Specialist addressing how these deficiencies will be corrected and a date for resolution of the issues.
ATTACHMENTS None
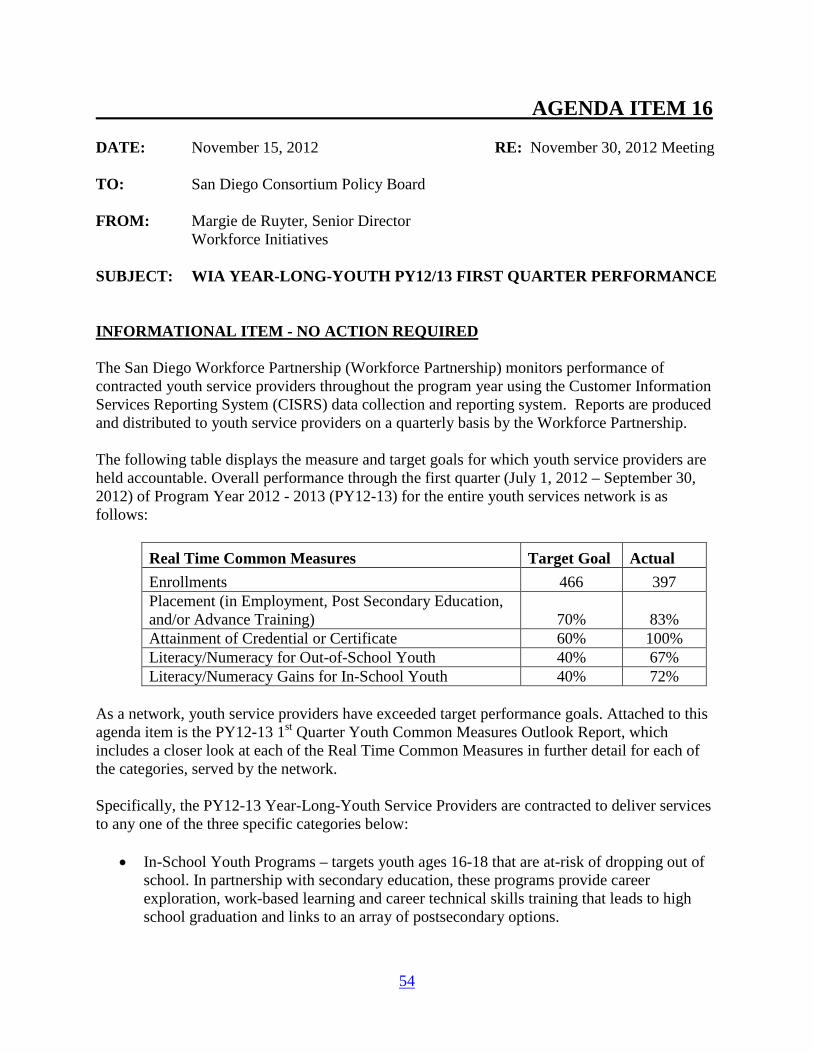
54
AGENDA ITEM 16 DATE: November 15, 2012 RE: November 30, 2012 Meeting TO: San Diego Consortium Policy Board FROM: Margie de Ruyter, Senior Director
Workforce Initiatives SUBJECT: WIA YEAR-LONG-YOUTH PY12/13 FIRST QUARTER PERFORMANCE INFORMATIONAL ITEM - NO ACTION REQUIRED The San Diego Workforce Partnership (Workforce Partnership) monitors performance of contracted youth service providers throughout the program year using the Customer Information Services Reporting System (CISRS) data collection and reporting system. Reports are produced and distributed to youth service providers on a quarterly basis by the Workforce Partnership. The following table displays the measure and target goals for which youth service providers are held accountable. Overall performance through the first quarter (July 1, 2012 – September 30, 2012) of Program Year 2012 - 2013 (PY12-13) for the entire youth services network is as follows:
Real Time Common Measures Target Goal Actual Enrollments 466 397 Placement (in Employment, Post Secondary Education, and/or Advance Training) 70% 83% Attainment of Credential or Certificate 60% 100% Literacy/Numeracy for Out-of-School Youth 40% 67% Literacy/Numeracy Gains for In-School Youth 40% 72%
As a network, youth service providers have exceeded target performance goals. Attached to this agenda item is the PY12-13 1st Quarter Youth Common Measures Outlook Report, which includes a closer look at each of the Real Time Common Measures in further detail for each of the categories, served by the network. Specifically, the PY12-13 Year-Long-Youth Service Providers are contracted to deliver services to any one of the three specific categories below:
• In-School Youth Programs – targets youth ages 16-18 that are at-risk of dropping out of school. In partnership with secondary education, these programs provide career exploration, work-based learning and career technical skills training that leads to high school graduation and links to an array of postsecondary options.
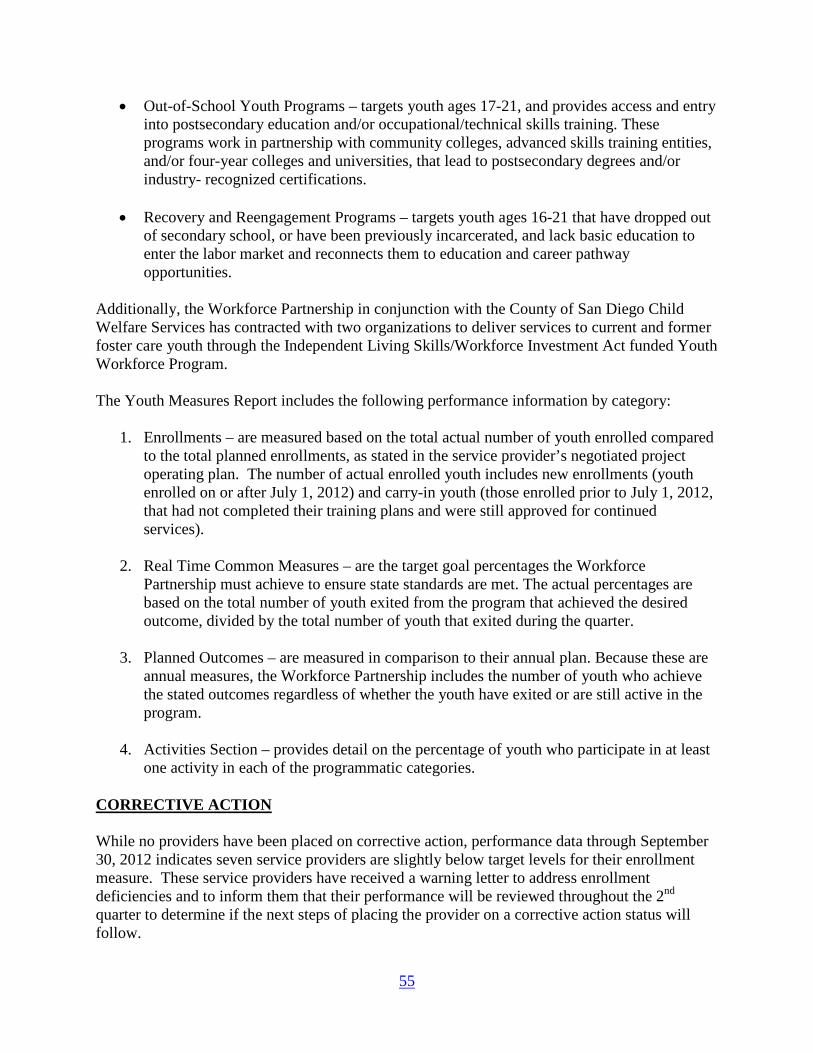
55
• Out-of-School Youth Programs – targets youth ages 17-21, and provides access and entry into postsecondary education and/or occupational/technical skills training. These programs work in partnership with community colleges, advanced skills training entities, and/or four-year colleges and universities, that lead to postsecondary degrees and/or industry- recognized certifications.
• Recovery and Reengagement Programs – targets youth ages 16-21 that have dropped out
of secondary school, or have been previously incarcerated, and lack basic education to enter the labor market and reconnects them to education and career pathway opportunities.
Additionally, the Workforce Partnership in conjunction with the County of San Diego Child Welfare Services has contracted with two organizations to deliver services to current and former foster care youth through the Independent Living Skills/Workforce Investment Act funded Youth Workforce Program. The Youth Measures Report includes the following performance information by category:
1. Enrollments – are measured based on the total actual number of youth enrolled compared to the total planned enrollments, as stated in the service provider’s negotiated project operating plan. The number of actual enrolled youth includes new enrollments (youth enrolled on or after July 1, 2012) and carry-in youth (those enrolled prior to July 1, 2012, that had not completed their training plans and were still approved for continued services).
2. Real Time Common Measures – are the target goal percentages the Workforce
Partnership must achieve to ensure state standards are met. The actual percentages are based on the total number of youth exited from the program that achieved the desired outcome, divided by the total number of youth that exited during the quarter.
3. Planned Outcomes – are measured in comparison to their annual plan. Because these are
annual measures, the Workforce Partnership includes the number of youth who achieve the stated outcomes regardless of whether the youth have exited or are still active in the program.
4. Activities Section – provides detail on the percentage of youth who participate in at least
one activity in each of the programmatic categories. CORRECTIVE ACTION While no providers have been placed on corrective action, performance data through September 30, 2012 indicates seven service providers are slightly below target levels for their enrollment measure. These service providers have received a warning letter to address enrollment deficiencies and to inform them that their performance will be reviewed throughout the 2nd quarter to determine if the next steps of placing the provider on a corrective action status will follow.

56
As of October 24, 2012, four of the seven have met or exceeded planned enrollments. ATTACHMENTS Program Year 12-13 WIA Year-Long Youth Performance Reports
57
All Agencies
PERFORMANCE MEASURES Actual
Enrollment to date
Cumulative Quarterly Plan
% of Cumulative
Quarterly Plan
Enrollments 397 466 85% In-School 310 Out-of-School 87 Exits 24
REAL TIME COMMON MEASURES* Actual Percentage
Target Percentage
Corrective Action Level
Number of Youth in Measure
Placement in Employment or Education 83% 70% 65% 10/12 Attainment of Degree or Certificate 100% 60% 55% 11/11 Literacy/Numeracy Gains-In School 72% 40% 35% 60/83 Literacy/Numeracy Gains-Out Of School 60% 40% 35% 6/10 * Real time common measures for placement and degree attainment are captured at exit. The literacy/numeracy measures are captured after the youth has completed one year in the program. First number is how many participants made attainment, second number is how many participants fall into the measure.
PLANNED OUTCOMES Actual to Date
Contract Performance
Plan
% of Plan
Work Readiness Attainment 81 Occupational Skills Attainment 51 Literacy/Numeracy Gains 82 41 200% Total Placements 62 91 68% Employment 15 Post Secondary 13 Advanced Training 38 Total Credential Attainment 17 42 40% High School Diploma 7 GED 4 Other Certificate 6
ACTIVITIES % of Youth who Participated
Work Readiness 49% Work Experience and Prep 26% Educational Activities 46% Youth Development Activities 46% Access (OSY) 103-54
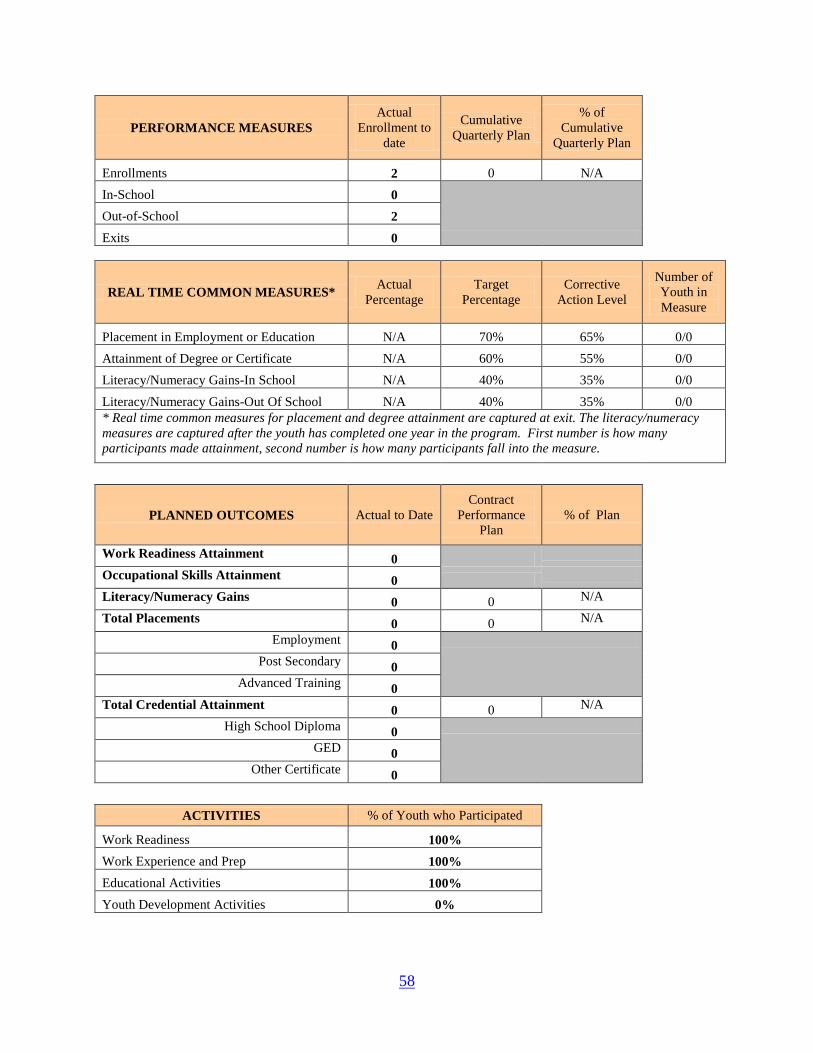
58
PERFORMANCE MEASURES Actual
Enrollment to date
Cumulative Quarterly Plan
% of Cumulative
Quarterly Plan
Enrollments 2 0 N/A In-School 0
Out-of-School 2 Exits 0
REAL TIME COMMON MEASURES* Actual Percentage
Target Percentage
Corrective Action Level
Number of Youth in Measure
Placement in Employment or Education N/A 70% 65% 0/0 Attainment of Degree or Certificate N/A 60% 55% 0/0 Literacy/Numeracy Gains-In School N/A 40% 35% 0/0 Literacy/Numeracy Gains-Out Of School N/A 40% 35% 0/0 * Real time common measures for placement and degree attainment are captured at exit. The literacy/numeracy measures are captured after the youth has completed one year in the program. First number is how many participants made attainment, second number is how many participants fall into the measure.
PLANNED OUTCOMES Actual to Date Contract
Performance Plan
% of Plan
Work Readiness Attainment 0 Occupational Skills Attainment 0 Literacy/Numeracy Gains 0 0 N/A Total Placements 0 0 N/A Employment 0 Post Secondary 0 Advanced Training 0 Total Credential Attainment 0 0 N/A High School Diploma 0 GED 0 Other Certificate 0
ACTIVITIES % of Youth who Participated Work Readiness 100%
Work Experience and Prep 100% Educational Activities 100% Youth Development Activities 0%

59
Access (R&R) 103-53
PERFORMANCE MEASURES Actual
Enrollment to date
Cumulative Quarterly Plan
% of Cumulative
Quarterly Plan
Enrollments 9 0 N/A In-School 0
Out-of-School 9 Exits 0
REAL TIME COMMON MEASURES* Actual Percentage
Target Percentage
Corrective Action Level
Number of Youth in Measure
Placement in Employment or Education N/A 70% 65% 0/0 Attainment of Degree or Certificate N/A 60% 55% 0/0 Literacy/Numeracy Gains-In School N/A 40% 35% 0/0 Literacy/Numeracy Gains-Out Of School N/A 40% 35% 0/0 * Real time common measures for placement and degree attainment are captured at exit. The literacy/numeracy measures are captured after the youth has completed one year in the program. First number is how many participants made attainment, second number is how many participants fall into the measure.
PLANNED OUTCOMES Actual to Date Contract
Performance Plan
% of Plan
Work Readiness Attainment 0 Occupational Skills Attainment 0 Literacy/Numeracy Gains 0 0 N/A Total Placements 0 0 N/A Employment 0 Post Secondary 0 Advanced Training 0 Total Credential Attainment 0 0 N/A High School Diploma 0 GED 0 Other Certificate 0
ACTIVITIES % of Youth who Participated Work Readiness 22%
Work Experience and Prep 0% Educational Activities 44% Youth Development Activities 0%
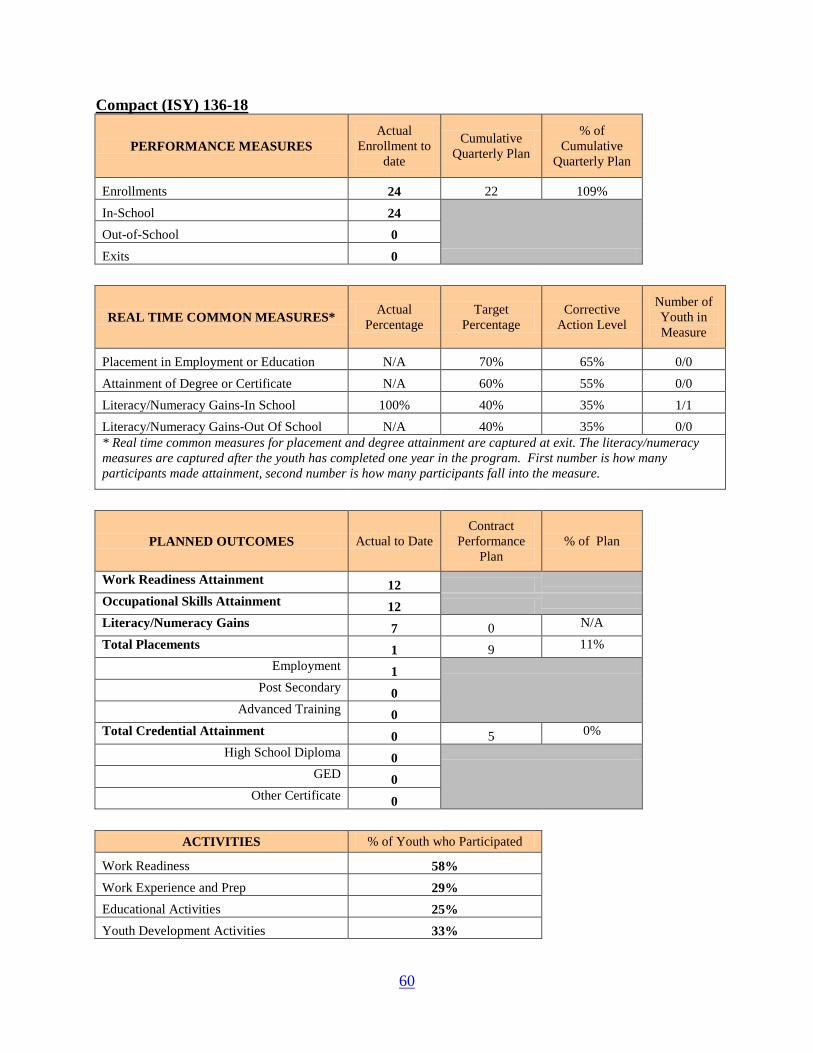
60
Compact (ISY) 136-18
PERFORMANCE MEASURES Actual
Enrollment to date
Cumulative Quarterly Plan
% of Cumulative
Quarterly Plan
Enrollments 24 22 109% In-School 24
Out-of-School 0 Exits 0
REAL TIME COMMON MEASURES* Actual Percentage
Target Percentage
Corrective Action Level
Number of Youth in Measure
Placement in Employment or Education N/A 70% 65% 0/0 Attainment of Degree or Certificate N/A 60% 55% 0/0 Literacy/Numeracy Gains-In School 100% 40% 35% 1/1 Literacy/Numeracy Gains-Out Of School N/A 40% 35% 0/0 * Real time common measures for placement and degree attainment are captured at exit. The literacy/numeracy measures are captured after the youth has completed one year in the program. First number is how many participants made attainment, second number is how many participants fall into the measure.
PLANNED OUTCOMES Actual to Date Contract
Performance Plan
% of Plan
Work Readiness Attainment 12 Occupational Skills Attainment 12 Literacy/Numeracy Gains 7 0 N/A Total Placements 1 9 11% Employment 1 Post Secondary 0 Advanced Training 0 Total Credential Attainment 0 5 0% High School Diploma 0 GED 0 Other Certificate 0
ACTIVITIES % of Youth who Participated Work Readiness 58%
Work Experience and Prep 29% Educational Activities 25% Youth Development Activities 33%

61
Compact (OSY) 136-18
PERFORMANCE MEASURES Actual
Enrollment to date
Cumulative Quarterly Plan
% of Cumulative
Quarterly Plan
Enrollments 18 15 120% In-School 0
Out-of-School 18 Exits 0
REAL TIME COMMON MEASURES* Actual Percentage
Target Percentage
Corrective Action Level
Number of Youth in Measure
Placement in Employment or Education N/A 70% 65% 0/0 Attainment of Degree or Certificate N/A 60% 55% 0/0 Literacy/Numeracy Gains-In School N/A 40% 35% 0/0 Literacy/Numeracy Gains-Out Of School N/A 40% 35% 0/0 * Real time common measures for placement and degree attainment are captured at exit. The literacy/numeracy measures are captured after the youth has completed one year in the program. First number is how many participants made attainment, second number is how many participants fall into the measure.
PLANNED OUTCOMES Actual to Date Contract
Performance Plan
% of Plan
Work Readiness Attainment 7 Occupational Skills Attainment 4 Literacy/Numeracy Gains 0 0 N/A Total Placements 0 1 0% Employment 0 Post Secondary 0 Advanced Training 0 Total Credential Attainment 0 0 N/A High School Diploma 0 GED 0 Other Certificate 0
ACTIVITIES % of Youth who Participated Work Readiness 44%
Work Experience and Prep 33% Educational Activities 6% Youth Development Activities 22%

62
Compact (R&R) 136-18
PERFORMANCE MEASURES Actual
Enrollment to date
Cumulative Quarterly Plan
% of Cumulative
Quarterly Plan
Enrollments 8 10 80% In-School 4
Out-of-School 4 Exits 0
REAL TIME COMMON MEASURES* Actual Percentage
Target Percentage
Corrective Action Level
Number of Youth in Measure
Placement in Employment or Education N/A 70% 65% 0/0 Attainment of Degree or Certificate N/A 60% 55% 0/0 Literacy/Numeracy Gains-In School N/A 40% 35% 0/0 Literacy/Numeracy Gains-Out Of School N/A 40% 35% 0/0 * Real time common measures for placement and degree attainment are captured at exit. The literacy/numeracy measures are captured after the youth has completed one year in the program. First number is how many participants made attainment, second number is how many participants fall into the measure.
PLANNED OUTCOMES Actual to Date Contract
Performance Plan
% of Plan
Work Readiness Attainment 3 Occupational Skills Attainment 1 Literacy/Numeracy Gains 0 0 N/A Total Placements 0 0 N/A Employment 0 Post Secondary 0 Advanced Training 0 Total Credential Attainment 0 0 N/A High School Diploma 0 GED 0 Other Certificate 0
ACTIVITIES % of Youth who Participated Work Readiness 38%
Work Experience and Prep 38% Educational Activities 0% Youth Development Activities 25%

63
GUHSD (ISY) 204-19
PERFORMANCE MEASURES Actual
Enrollment to date
Cumulative Quarterly Plan
% of Cumulative
Quarterly Plan
Enrollments 28 31 90% In-School 28
Out-of-School 0 Exits 0
REAL TIME COMMON MEASURES* Actual Percentage
Target Percentage
Corrective Action Level
Number of Youth in Measure
Placement in Employment or Education N/A 70% 65% 0/0 Attainment of Degree or Certificate N/A 60% 55% 0/0 Literacy/Numeracy Gains-In School N/A 40% 35% 0/0 Literacy/Numeracy Gains-Out Of School N/A 40% 35% 0/0 * Real time common measures for placement and degree attainment are captured at exit. The literacy/numeracy measures are captured after the youth has completed one year in the program. First number is how many participants made attainment, second number is how many participants fall into the measure.
PLANNED OUTCOMES Actual to Date Contract
Performance Plan
% of Plan
Work Readiness Attainment 0 Occupational Skills Attainment 0 Literacy/Numeracy Gains 0 0 N/A Total Placements 1 7 14% Employment 0 Post Secondary 0 Advanced Training 1 Total Credential Attainment 0 0 N/A High School Diploma 0 GED 0 Other Certificate 0
ACTIVITIES % of Youth who Participated Work Readiness 75%
Work Experience and Prep 4% Educational Activities 89% Youth Development Activities 61%

64
Interfaith (ISY) 193-24
PERFORMANCE MEASURES Actual
Enrollment to date
Cumulative Quarterly Plan
% of Cumulative
Quarterly Plan
Enrollments 23 35 66% In-School 23
Out-of-School 0 Exits 0
REAL TIME COMMON MEASURES* Actual Percentage
Target Percentage
Corrective Action Level
Number of Youth in Measure
Placement in Employment or Education N/A 70% 65% 0/0 Attainment of Degree or Certificate N/A 60% 55% 0/0 Literacy/Numeracy Gains-In School N/A 40% 35% 0/0 Literacy/Numeracy Gains-Out Of School N/A 40% 35% 0/0 * Real time common measures for placement and degree attainment are captured at exit. The literacy/numeracy measures are captured after the youth has completed one year in the program. First number is how many participants made attainment, second number is how many participants fall into the measure.
PLANNED OUTCOMES Actual to Date Contract
Performance Plan
% of Plan
Work Readiness Attainment 18 Occupational Skills Attainment 0 Literacy/Numeracy Gains 0 10 0% Total Placements 18 0 N/A Employment 0 Post Secondary 0 Advanced Training 18 Total Credential Attainment 0 0 N/A High School Diploma 0 GED 0 Other Certificate 0
ACTIVITIES % of Youth who Participated Work Readiness 78%
Work Experience and Prep 78% Educational Activities 0% Youth Development Activities 78%

65
IRC IISY) 303-01
PERFORMANCE MEASURES Actual
Enrollment to date
Cumulative Quarterly Plan
% of Cumulative
Quarterly Plan
Enrollments 14 50 28% In-School 14
Out-of-School 0 Exits 0
REAL TIME COMMON MEASURES* Actual Percentage
Target Percentage
Corrective Action Level
Number of Youth in Measure
Placement in Employment or Education N/A 70% 65% 0/0 Attainment of Degree or Certificate N/A 60% 55% 0/0 Literacy/Numeracy Gains-In School N/A 40% 35% 0/0 Literacy/Numeracy Gains-Out Of School N/A 40% 35% 0/0 * Real time common measures for placement and degree attainment are captured at exit. The literacy/numeracy measures are captured after the youth has completed one year in the program. First number is how many participants made attainment, second number is how many participants fall into the measure.
PLANNED OUTCOMES Actual to Date Contract
Performance Plan
% of Plan
Work Readiness Attainment 0 Occupational Skills Attainment 0 Literacy/Numeracy Gains 0 0 N/A Total Placements 0 0 N/A Employment 0 Post Secondary 0 Advanced Training 0 Total Credential Attainment 0 0 N/A High School Diploma 0 GED 0 Other Certificate 0
ACTIVITIES % of Youth who Participated Work Readiness 0%
Work Experience and Prep 0% Educational Activities 0% Youth Development Activities 0%

66
IRC (OSY) 303-01
PERFORMANCE MEASURES Actual
Enrollment to date
Cumulative Quarterly Plan
% of Cumulative
Quarterly Plan
Enrollments 14 30 47% In-School 0
Out-of-School 14 Exits 0
REAL TIME COMMON MEASURES* Actual Percentage
Target Percentage
Corrective Action Level
Number of Youth in Measure
Placement in Employment or Education N/A 70% 65% 0/0 Attainment of Degree or Certificate N/A 60% 55% 0/0 Literacy/Numeracy Gains-In School N/A 40% 35% 0/0 Literacy/Numeracy Gains-Out Of School N/A 40% 35% 0/0 * Real time common measures for placement and degree attainment are captured at exit. The literacy/numeracy measures are captured after the youth has completed one year in the program. First number is how many participants made attainment, second number is how many participants fall into the measure.
PLANNED OUTCOMES Actual to Date Contract
Performance Plan
% of Plan
Work Readiness Attainment 0 Occupational Skills Attainment 1 Literacy/Numeracy Gains 0 0 N/A Total Placements 0 0 N/A Employment 0 Post Secondary 0 Advanced Training 0 Total Credential Attainment 0 0 N/A High School Diploma 0 GED 0 Other Certificate 0
ACTIVITIES % of Youth who Participated Work Readiness 94%
Work Experience and Prep 6% Educational Activities 88% Youth Development Activities 50%

67
JCCS (R&R) 132-08
PERFORMANCE MEASURES Actual
Enrollment to date
Cumulative Quarterly Plan
% of Cumulative
Quarterly Plan
Enrollments 20 20 100% In-School 18
Out-of-School 2 Exits 0
REAL TIME COMMON MEASURES* Actual Percentage
Target Percentage
Corrective Action Level
Number of Youth in Measure
Placement in Employment or Education N/A 70% 65% 0/0 Attainment of Degree or Certificate N/A 60% 55% 0/0 Literacy/Numeracy Gains-In School N/A 40% 35% 0/0 Literacy/Numeracy Gains-Out Of School N/A 40% 35% 0/0 * Real time common measures for placement and degree attainment are captured at exit. The literacy/numeracy measures are captured after the youth has completed one year in the program. First number is how many participants made attainment, second number is how many participants fall into the measure.
PLANNED OUTCOMES Actual to Date Contract
Performance Plan
% of Plan
Work Readiness Attainment 1 Occupational Skills Attainment 0 Literacy/Numeracy Gains 0 6 0% Total Placements 9 15 60% Employment 0 Post Secondary 0 Advanced Training 9 Total Credential Attainment 1 3 33% High School Diploma 0 GED 0 Other Certificate 1
ACTIVITIES % of Youth who Participated Work Readiness 25%
Work Experience and Prep 50% Educational Activities 90% Youth Development Activities 5%

68
SBCS (ISY) 133-11
PERFORMANCE MEASURES Actual
Enrollment to date
Cumulative Quarterly Plan
% of Cumulative
Quarterly Plan
Enrollments 16 40 40% In-School 16
Out-of-School 0 Exits 0
REAL TIME COMMON MEASURES* Actual Percentage
Target Percentage
Corrective Action Level
Number of Youth in Measure
Placement in Employment or Education N/A 70% 65% 0/0 Attainment of Degree or Certificate N/A 60% 55% 0/0 Literacy/Numeracy Gains-In School N/A 40% 35% 0/0 Literacy/Numeracy Gains-Out Of School N/A 40% 35% 0/0 * Real time common measures for placement and degree attainment are captured at exit. The literacy/numeracy measures are captured after the youth has completed one year in the program. First number is how many participants made attainment, second number is how many participants fall into the measure.
PLANNED OUTCOMES Actual to Date Contract
Performance Plan
% of Plan
Work Readiness Attainment 0 Occupational Skills Attainment 0 Literacy/Numeracy Gains 0 0 N/A Total Placements 0 0 N/A Employment 0 Post Secondary 0 Advanced Training 0 Total Credential Attainment 0 0 N/A High School Diploma 0 GED 0 Other Certificate 0
ACTIVITIES % of Youth who Participated Work Readiness 25%
Work Experience and Prep 6% Educational Activities 6% Youth Development Activities 0%
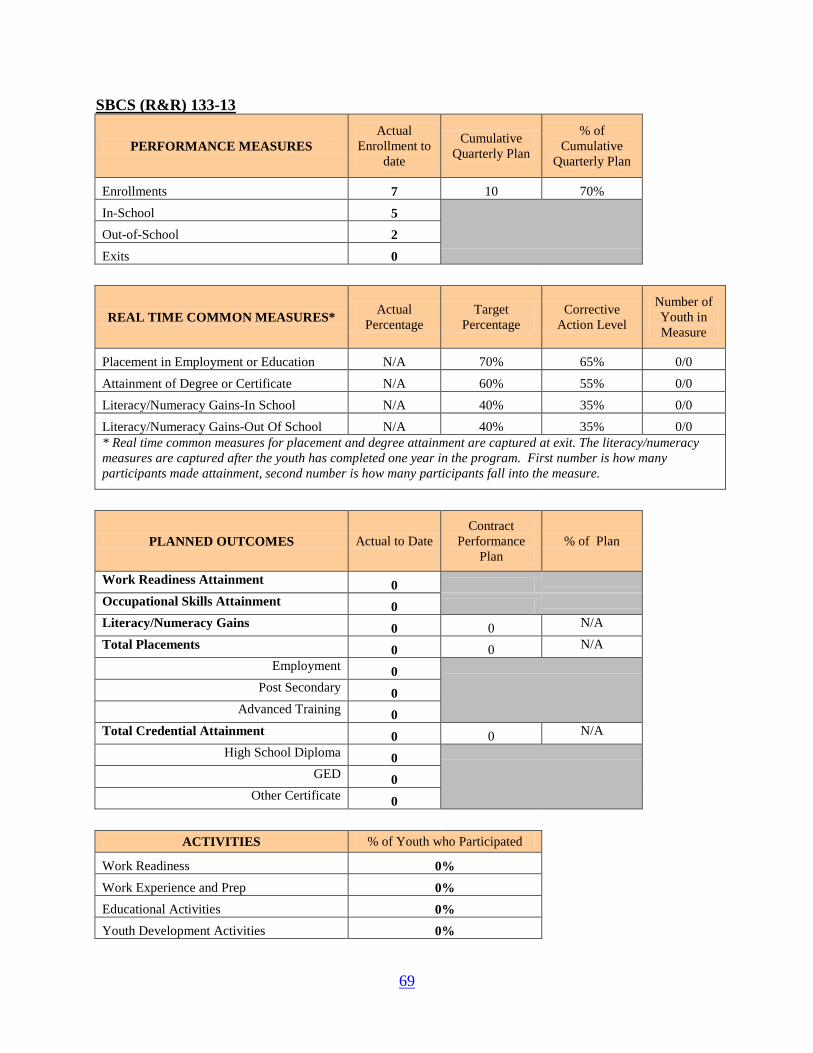
69
SBCS (R&R) 133-13
PERFORMANCE MEASURES Actual
Enrollment to date
Cumulative Quarterly Plan
% of Cumulative
Quarterly Plan
Enrollments 7 10 70% In-School 5
Out-of-School 2 Exits 0
REAL TIME COMMON MEASURES* Actual Percentage
Target Percentage
Corrective Action Level
Number of Youth in Measure
Placement in Employment or Education N/A 70% 65% 0/0 Attainment of Degree or Certificate N/A 60% 55% 0/0 Literacy/Numeracy Gains-In School N/A 40% 35% 0/0 Literacy/Numeracy Gains-Out Of School N/A 40% 35% 0/0 * Real time common measures for placement and degree attainment are captured at exit. The literacy/numeracy measures are captured after the youth has completed one year in the program. First number is how many participants made attainment, second number is how many participants fall into the measure.
PLANNED OUTCOMES Actual to Date Contract
Performance Plan
% of Plan
Work Readiness Attainment 0 Occupational Skills Attainment 0 Literacy/Numeracy Gains 0 0 N/A Total Placements 0 0 N/A Employment 0 Post Secondary 0 Advanced Training 0 Total Credential Attainment 0 0 N/A High School Diploma 0 GED 0 Other Certificate 0
ACTIVITIES % of Youth who Participated Work Readiness 0%
Work Experience and Prep 0% Educational Activities 0% Youth Development Activities 0%
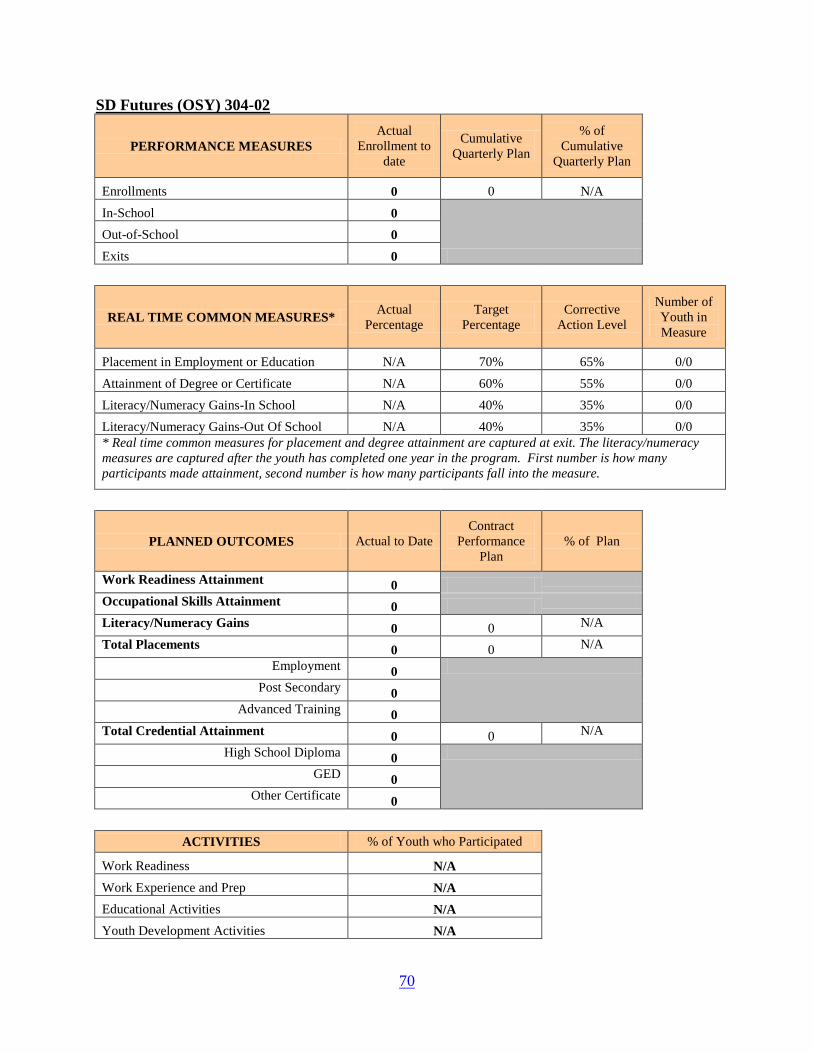
70
SD Futures (OSY) 304-02
PERFORMANCE MEASURES Actual
Enrollment to date
Cumulative Quarterly Plan
% of Cumulative
Quarterly Plan
Enrollments 0 0 N/A In-School 0
Out-of-School 0 Exits 0
REAL TIME COMMON MEASURES* Actual Percentage
Target Percentage
Corrective Action Level
Number of Youth in Measure
Placement in Employment or Education N/A 70% 65% 0/0 Attainment of Degree or Certificate N/A 60% 55% 0/0 Literacy/Numeracy Gains-In School N/A 40% 35% 0/0 Literacy/Numeracy Gains-Out Of School N/A 40% 35% 0/0 * Real time common measures for placement and degree attainment are captured at exit. The literacy/numeracy measures are captured after the youth has completed one year in the program. First number is how many participants made attainment, second number is how many participants fall into the measure.
PLANNED OUTCOMES Actual to Date Contract
Performance Plan
% of Plan
Work Readiness Attainment 0 Occupational Skills Attainment 0 Literacy/Numeracy Gains 0 0 N/A Total Placements 0 0 N/A Employment 0 Post Secondary 0 Advanced Training 0 Total Credential Attainment 0 0 N/A High School Diploma 0 GED 0 Other Certificate 0
ACTIVITIES % of Youth who Participated Work Readiness N/A
Work Experience and Prep N/A Educational Activities N/A Youth Development Activities N/A

71
TTHC (OSY) 134-06
PERFORMANCE MEASURES Actual
Enrollment to date
Cumulative Quarterly Plan
% of Cumulative
Quarterly Plan
Enrollments 7 28 25% In-School 0
Out-of-School 7 Exits 0
REAL TIME COMMON MEASURES* Actual Percentage
Target Percentage
Corrective Action Level
Number of Youth in Measure
Placement in Employment or Education N/A 70% 65% 0/0 Attainment of Degree or Certificate N/A 60% 55% 0/0 Literacy/Numeracy Gains-In School N/A 40% 35% 0/0 Literacy/Numeracy Gains-Out Of School N/A 40% 35% 0/0 * Real time common measures for placement and degree attainment are captured at exit. The literacy/numeracy measures are captured after the youth has completed one year in the program. First number is how many participants made attainment, second number is how many participants fall into the measure.
PLANNED OUTCOMES Actual to Date Contract
Performance Plan
% of Plan
Work Readiness Attainment 0 Occupational Skills Attainment 0 Literacy/Numeracy Gains 0 0 N/A Total Placements 0 0 N/A Employment 0 Post Secondary 0 Advanced Training 0 Total Credential Attainment 0 0 N/A High School Diploma 0 GED 0 Other Certificate 0
ACTIVITIES % of Youth who Participated Work Readiness 0%
Work Experience and Prep 0% Educational Activities 71% Youth Development Activities 0%

72
YMCA (OSY) 155-06
PERFORMANCE MEASURES Actual
Enrollment to date
Cumulative Quarterly Plan
% of Cumulative
Quarterly Plan
Enrollments 7 10 70% In-School 0
Out-of-School 7 Exits 0
REAL TIME COMMON MEASURES* Actual Percentage
Target Percentage
Corrective Action Level
Number of Youth in Measure
Placement in Employment or Education N/A 70% 65% 0/0 Attainment of Degree or Certificate N/A 60% 55% 0/0 Literacy/Numeracy Gains-In School N/A 40% 35% 0/0 Literacy/Numeracy Gains-Out Of School N/A 40% 35% 0/0 * Real time common measures for placement and degree attainment are captured at exit. The literacy/numeracy measures are captured after the youth has completed one year in the program. First number is how many participants made attainment, second number is how many participants fall into the measure.
PLANNED OUTCOMES Actual to Date Contract
Performance Plan
% of Plan
Work Readiness Attainment 0 Occupational Skills Attainment 0 Literacy/Numeracy Gains 0 0 N/A Total Placements 1 0 N/A Employment 1 Post Secondary 0 Advanced Training 0 Total Credential Attainment 0 0 N/A High School Diploma 0 GED 0 Other Certificate 0
ACTIVITIES % of Youth who Participated Work Readiness 71%
Work Experience and Prep 14% Educational Activities 0% Youth Development Activities 71%
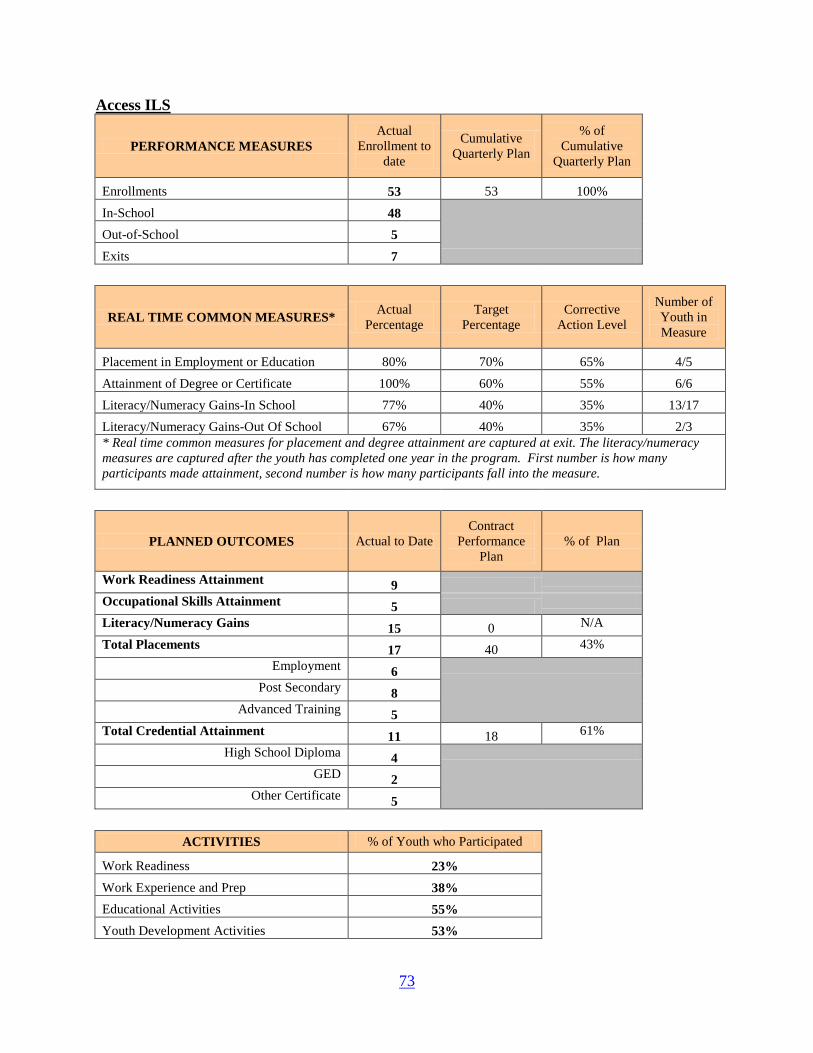
73
Access ILS
PERFORMANCE MEASURES Actual
Enrollment to date
Cumulative Quarterly Plan
% of Cumulative
Quarterly Plan
Enrollments 53 53 100% In-School 48
Out-of-School 5 Exits 7
REAL TIME COMMON MEASURES* Actual Percentage
Target Percentage
Corrective Action Level
Number of Youth in Measure
Placement in Employment or Education 80% 70% 65% 4/5 Attainment of Degree or Certificate 100% 60% 55% 6/6 Literacy/Numeracy Gains-In School 77% 40% 35% 13/17 Literacy/Numeracy Gains-Out Of School 67% 40% 35% 2/3 * Real time common measures for placement and degree attainment are captured at exit. The literacy/numeracy measures are captured after the youth has completed one year in the program. First number is how many participants made attainment, second number is how many participants fall into the measure.
PLANNED OUTCOMES Actual to Date Contract
Performance Plan
% of Plan
Work Readiness Attainment 9 Occupational Skills Attainment 5 Literacy/Numeracy Gains 15 0 N/A Total Placements 17 40 43% Employment 6 Post Secondary 8 Advanced Training 5 Total Credential Attainment 11 18 61% High School Diploma 4 GED 2 Other Certificate 5
ACTIVITIES % of Youth who Participated Work Readiness 23%
Work Experience and Prep 38% Educational Activities 55% Youth Development Activities 53%

74
SBCS ILS PERFORMANCE MEASURES Actual
Enrollment to date
Cumulative Quarterly Plan
% of Cumulative
Quarterly Plan
Enrollments 38 35 109% In-School 26
Out-of-School 12 Exits 3
REAL TIME COMMON MEASURES* Actual Percentage
Target Percentage
Corrective Action Level
Number of Youth in Measure
Placement in Employment or Education 100% 70% 65% 3/3 Attainment of Degree or Certificate 100% 60% 55% 1/1 Literacy/Numeracy Gains-In School 75% 40% 35% 6/8 Literacy/Numeracy Gains-Out Of School 67% 40% 35% 4/6 * Real time common measures for placement and degree attainment are captured at exit. The literacy/numeracy measures are captured after the youth has completed one year in the program. First number is how many participants made attainment, second number is how many participants fall into the measure.
PLANNED OUTCOMES Actual to Date Contract
Performance Plan
% of Plan
Work Readiness Attainment 8 Occupational Skills Attainment 0 Literacy/Numeracy Gains 16 15 107% Total Placements 8 16 50% Employment 7 Post Secondary 2 Advanced Training 1 Total Credential Attainment 1 13 8% High School Diploma 1 GED 0 Other Certificate 0
ACTIVITIES % of Youth who Participated Work Readiness 61%
Work Experience and Prep 55% Educational Activities 34% Youth Development Activities 24%

75
Access SPA
PERFORMANCE MEASURES Actual
Enrollment to date
Cumulative Quarterly Plan
% of Cumulative
Quarterly Plan
Enrollments 103 77 134% In-School 103
Out-of-School 0 Exits 14
REAL TIME COMMON MEASURES* Actual Percentage
Target Percentage
Corrective Action Level
Number of Youth in Measure
Placement in Employment or Education 75% 70% 65% 3/4 Attainment of Degree or Certificate 100% 60% 55% 4/4 Literacy/Numeracy Gains-In School 71% 40% 35% 40/56 Literacy/Numeracy Gains-Out Of School N/A 40% 35% 0/0 * Real time common measures for placement and degree attainment are captured at exit. The literacy/numeracy measures are captured after the youth has completed one year in the program. First number is how many participants made attainment, second number is how many participants fall into the measure.
PLANNED OUTCOMES Actual to Date Contract
Performance Plan
% of Plan
Work Readiness Attainment 22 Occupational Skills Attainment 29 Literacy/Numeracy Gains 40 10 400% Total Placements 7 3 233% Employment 0 Post Secondary 3 Advanced Training 4 Total Credential Attainment 4 3 133% High School Diploma 2 GED 2 Other Certificate 0
ACTIVITIES % of Youth who Participated Work Readiness 60%
Work Experience and Prep 13% Educational Activities 61% Youth Development Activities 80%