Embed Size (px)
Citation preview
REPORT ON THE PREDATION INDEX, PREDATOR CONTROL FISHERIES, AND PROGRAM EVALUATION FOR THE COLUMBIA RIVER BASIN EXPERIMENTAL
NORTHERN PIKEMINNOW MANAGEMENT PROGRAM
2014 ANNUAL REPORT
Prepared by:
Steve Williams
Pacific States Marine Fisheries Commission
In Cooperation with:
Oregon Department of Fish and Wildlife Washington Department of Fish and Wildlife
Funded By:
U.S. Department of Energy Bonneville Power Administration Environment, Fish and Wildlife
P.O. Box 3621 Portland, OR 97208-3621
Project Number 1990-077-00 Contract Number 56795
Document ID #P143206
Table of Contents
Executive Summary 1
Report A – Sport Reward Fishery in the Columbia and Snake Rivers 7
Acknowledgements 8
Abstract 9
Introduction 10
Methods of Operation 11
Results and Discussion 16
Summary 36
Recommendations 37
References 38
Report B – Sport Reward Payments – 2014 42
Introduction 43
Catch and Payments 43
Tagged Fish Payments 43
2
Tag-Loss Bonus Reward 43
Accounting 44
2014 Sport Reward Payments Summary 45
Report C – Indexing and Fisheries Evaluation 46
Summary 47
Introduction 50
Methods 51
Fishery Evaluation and Predation Reduction 51
Field Procedures 51
Data Analysis 52
Biological Evaluation 55
Field Procedures 55
Laboratory Procedures 56
Data Analysis 56
Results 59
Sport Reward Fishery Evaluation and Predation Estimates 59
Biological Evaluation 59
Discussion 63
3
Acknowledgements 66
References 67
List of Tables
Main Tables
Table 1. Numbers of northern pikeminnow tagged and recaptured in the Sport Reward Fishery during 2014 by location and size class 72
Table 2. System-wide weekly exploitation rates of northern pikeminnow (≥200 mm FL) for the Sport Reward Fishery, 2014 73
Table 3. Time series of annual exploitation rates (%) of northern pikeminnow (≥ 200 mm) in the Sport Reward Fishery by location 74
Table 4. Time series of annual exploitation rates (%) of northern pikeminnow (200–249 mm) in the Sport Reward Fishery by location 75
Table 5. Time series of annual exploitation rates (%) of northern pikeminnow (≥ 250 mm) in the Sport Reward Fishery by location 76
Table 6. Number of 15-minute boat electrofishing runs by sampling year and location conducted during biological evaluation in the Columbia River downstream of Bonneville Dam and in Bonneville Reservoir, 1990–2014 77
Table 7. Catch per unit effort (CPUE) for northern pikeminnow (≥250 mm FL), smallmouth bass (≥200 mm FL), and walleye (≥200 mm FL) by season and location captured during biological evaluation in the Columbia River downstream of Bonneville Dam and in Bonneville Reservoir, 2014 78
Table 8. Annual abundance index values (CPUE scaled to surface area) for northern pikeminnow (≥ 250 mm FL) during spring and summer in the Columbia River downstream of Bonneville Dam and in Bonneville Reservoir, 1990-2014 79
Table 9. Annual abundance index values (CPUE scaled to surface area) for smallmouth bass (≥ 200 mm FL) by season, sampling year, and location in the Columbia River, 1990-2014 80
Table 10. Annual abundance index values (catch per 15-minute electrofishing run, scaled to surface area) for walleye (≥200 mm FL) by season,
4
sampling year, and location in the Columbia River downstream of Bonneville Dam and in Bonneville Reservoir, 1990-2014 81
Table 11. Number (n) of northern pikeminnow, smallmouth bass, and walleye (≥200 mm FL) digestive tracts examined from downstream of Bonneville Dam and Bonneville Reservoir, 2014, and proportion of samples containing food, fish, and salmonids 82
Table 12. Proportion of diet samples containing specific prey fish families collected from northern pikeminnow, smallmouth bass, and walleye during spring and summer sampling periods in the Columbia River downstream of Bonneville Dam and in Bonneville Reservoir, 2014 83
Table 13. Annual consumption index values for northern pikeminnow (≥ 250 mm FL) by season, sampling year, and location in the Columbia River downstream of Bonneville Dam and in Bonneville Reservoir, 1990–2014 84
Table 14. Annual predation index values for northern pikeminnow (≥ 250 mm FL) by season, sampling year, and location in the Columbia River downstream of Bonneville Dam and in Bonneville Reservoir, 1990–2014 85
Table 15. Annual consumption index values for smallmouth bass (≥ 200 mm FL) by season, sampling year, and location in the Columbia River downstream of Bonneville Dam and Bonneville Reservoir, 1990–2014 86
Table 16. Predation index values for smallmouth bass (≥200 mm FL) by season, sampling year, and location in the Columbia River downstream of Bonneville Dam and in Bonneville Reservoir, 1990–2014 87
Table 17. Number of stock-sized northern pikeminnow (n) collected by boat electroshocking and proportional stock density (PSD, %) for the Columbia River downstream of Bonneville Dam and in Bonneville Reservoir, 1990–2014 88
Table 18. Number of stock-sized smallmouth bass (n) collected by boat electroshocking, proportional stock density (PSD, %) and relative stock density (RSD, %) for the Columbia River downstream of Bonneville Dam and in Bonneville Reservoir, 1990–2014 89
Table 19. Fork length (mm) characteristics of northern pikeminnow sampled annually for evaluation of diet at Bonneville (2006), The Dalles (2006-2014), and John Day (2007-2014) dams 90
Table 20. Number (n) of northern pikeminnow (FL ≥ 250mm) digestive tracts examined from Bonneville (2006), The Dalles (2006-2014), and John
5
Day (2007-2014) dams, and proportion of samples containing specific prey items 91
Table 21. Proportion of diet samples containing specific prey fish families for northern pikeminnow collected from The Dalles and John Day dams during May through August, 2014 92
List of Figures
Figure 1. Study area in the Columbia and Snake rivers 93
Figure 2. System-wide exploitation rates of northern pikeminnow (≥250 mm FL) in the Sport Reward Fishery, 1991–2014 94
Figure 3. Maximum (A), median (B), and minimum (C) levels of potential predation by northern pikeminnow on juvenile salmon relative to predation levels before implementation of the Northern Pikeminnow Management Program 95
Figure 4. Periods of index sampling in the Columbia River downstream of Bonneville Dam (light gray bars), Bonneville Reservoir (dark gray bars) and index of juvenile salmon and steelhead passage through Bonneville Dam, 28 March–1 August 2014 96
Figure 5. Median relative weight (Wr) for male and female northern pikeminnow in the Columbia River downstream of Bonneville Dam, 1990–2014 97
Figure 6. Median relative weight (Wr) for male and female northern pikeminnow in Bonneville Reservoir, 1990–2014 98
Figure 7. Median relative weight (Wr) for smallmouth bass in the Columbia River downstream of Bonneville Dam and Bonneville Reservoir, 1990–2014 99
Figure 8. Median relative weight (Wr) for walleye in the Columbia River downstream of Bonneville Dam and Bonneville Reservoir, 1990–2014 100
Figure 9. Mean weekly juvenile salmon consumption index for northern pikeminnow captured at The Dalles and John Day dams and smolt passage index at John Day Dam during 2014 101
Report D – Dam Angling Test Fishery – 2014 102
Acknowledgements 103
6
Abstract 104
Introduction 105
Methods 106
Results and Discussion 111
Summary 125
Recommendations 126
References 127
Appendix 129
Report E – Research, Management and Evaluation Report – 2014 130
1. Executive Summary 131
a. Predation and Invasive Species Management RM&E 131
b. Predator Control and Management 132
2. Introduction 134
a. Predation and Invasive Species Management RM&E 134
7

b. Predator Control and Management 134
3. Methods: Protocols, Study Designs, and Study Area 136
4. Results 142
a. Predation and Invasive Species Management RM&E 142
b. Predator Control and Management 145
5. Synthesis of Findings: Discussion/Conclusions 147
a. Predation and Invasive Species Management RM&E 147
b. Predator Control and Management 148
6. References 149
Appendix B: Detailed Results 154
Appendix C: List of Metrics and Indicators 181
8
2014 Executive Summary by
Steve Williams This report presents results for year twenty-four in the basin-wide Experimental Northern Pikeminnow Management Program to harvest northern pikeminnow1 (Ptychocheilus oregonensis) in the Columbia and Snake Rivers. This program was started in an effort to reduce predation by northern pikeminnow on juvenile salmonids during their emigration from natal streams to the ocean. Earlier work in the Columbia River Basin suggested predation by northern pikeminnow on juvenile salmonids might account for most of the 10-20% mortality juvenile salmonids experience in each of eight Columbia River and Snake River reservoirs. Modeling simulations based on work in John Day Reservoir from 1982 through 1988 indicated that, if predator-size northern pikeminnow were exploited at a 10-20% rate, the resulting restructuring of their population could reduce their predation on juvenile salmonids by as much as 50%. To test this hypothesis, we implemented a sport-reward angling fishery and a commercial long-line fishery in the John Day Pool in 1990. We also conducted a hook and line fishery in areas inaccessible to the public at four dams on the mainstem Columbia River and at Ice Harbor Dam on the Snake River. Based on the success of these limited efforts, we implemented three test fisheries on a system-wide scale in 1991 - a tribal long-line fishery above Bonneville Dam, a sport-reward fishery, and a dam-angling fishery. Low catch of target fish and high cost of implementation resulted in discontinuation of the tribal long-line fishery. However, the sport-reward and dam-angling fisheries were continued in 1992 and 1993. In 1992, we investigated the feasibility of implementing a commercial long-line fishery in the Columbia River below Bonneville Dam and found that implementation of this fishery was also infeasible. Estimates of combined annual exploitation rates resulting from the sport-reward and dam-angling fisheries remained at the low end of our target range of 10-20%. This suggested the need for additional effective harvest techniques. During 1991 and 1992, we developed and tested a modified (small-sized) Merwin trapnet. We found this floating trapnet to be very effective in catching northern pikeminnow at specific sites. Consequently, in 1993 we examined a system-wide fishery using floating trapnets, but found this fishery to be ineffective at harvesting large numbers of northern pikeminnow on a system-wide scale. In 1994, we investigated the use of trapnets and gillnets at specific locations where concentrations of northern pikeminnow were known or suspected to occur during the spring season (i.e., March through early June). In addition, we initiated a concerted effort to increase public participation in the sport-reward fishery through a series of promotional and incentive activities. In 1995, 1996, and 1997, promotional activities and incentives were further improved based on the favorable
1 The common name of the northern squawfish was changed by the American Fisheries Society to northern pikeminnow at the request of the Confederated Tribes and Bands of the Yakama Indian Reservation.
1

response in 1994. Results of these and other lessons learned over the 24 year period are subjects of this annual report. Evaluation of the success of test fisheries in achieving our target goal of a 10-20% annual exploitation rate on northern pikeminnow is presented in Report C of this report. Overall program success in terms of altering the size and age composition of the northern pikeminnow population and in terms of potential reductions in loss of juvenile salmonids to northern pikeminnow predation is also discussed in Report C. Program cooperators include the Pacific States Marine Fisheries Commission (PSMFC), Oregon Department of Fish and Wildlife (ODFW), and Washington Department of Fish and Wildlife (WDFW). The PSMFC was responsible for coordination and administration of the program; PSMFC subcontracted various tasks and activities to ODFW and WDFW based on the expertise each brought to the tasks involved in implementing the program. Objectives of each cooperator were as follows. Background and rationale for the Northern Pikeminnow Management Program can be found in Report A of our 1990 annual report (Vigg et al. 1990). Highlights of results of our work in 2014 by report are as follows:
2
Report A (WDFW) Implementation of the Northern Pikeminnow Sport-Reward Fishery in the Columbia and Snake Rivers: Implement a system-wide (i.e. Columbia River below Priest Rapids Dam and Snake River below Hells Canyon Dam) sport-reward fishery and operate a system for collecting and disposing of harvested northern pikeminnow.
1. The objectives of the 2014 NPSRF were to (1) implement a public fishery that rewards recreational anglers for harvesting northern pikeminnow > 228 mm (9 inches) total length, (2) collect, compile, and report data on angler participation, catch and harvest of northern pikeminnow and other fish species, and success rates of participating anglers during the season, (3) examine collected northern pikeminnow for the presence of external tags, fin-clips, and signs of tag loss, (4) collect biological data on northern pikeminnow and other fish species returned to registration stations, (5) scan northern pikeminnow for the presence of Passive Integrated Transponder (PIT) tags implanted into northern pikeminnow by ODFW as secondary tags, and/or from northern pikeminnow containing consumed salmonids with PIT tags, and (6) survey non-returning fishery participants targeting northern pikeminnow in order to obtain catch and harvest data on fish species caught.
2. A total of 164,058 northern pikeminnow > 228 mm were harvested during the 2014 NPSRF
season. Of these, 172 northern Pikeminnow had both an external ODFW spaghetti tag and internal PIT tags and 103 that were found with ODFW PIT tags but missing spaghetti tags. An additional 52 PIT tags were recovered from juvenile Salmonids ingested by northern Pikeminnow received during the 2014 NPSRF. A total of 2,773 different anglers spent 19,508 angler days participating in the fishery during the 2014 season.
Report B (PSMFC) Northern Pikeminnow Sport-Reward Fishery Payments: Provide technical, contractual, fiscal and administrative oversight for the program. In addition, PSMFC processes and provides accounting for the reward payments to participants in the sport-reward fishery.
1. For 2014 the rewards paid to anglers were the same as in the 2013 season. Anglers were paid $4, $5, and $8 per fish for the three payment tiers (up to 100 fish, 101-400 fish and 401 and up) during the season. The rewards for a tagged fish were $500 per fish. New for 2014 was the inclusion of bonus reward for tag-loss fish (external spaghetti tag is missing but fish still possesses a verifiable pit tag). The bonus reward for a verified tag-loss fish was $100 per fish in addition to the standard tier rate of $4, $5 or $8.
2. During 2014, excluding tagged fish, rewards paid totaled $1,082,164 for 162,865 fish.
3. A total of 172 tagged fish vouchers were paid. The total season tag rewards paid totaled
$86,000.
3
4. A total of 103 tag-loss fish were paid a bonus reward of $100. The total season tag-loss bonus totaled $10,300
5. The total value for all 163,037 northern pikeminnow submitted for payment in 2014 was $1,186,274.
6. A total of 950 separate successful anglers caught one or more fish and received payments
during the season. A total of 2,773 separate anglers registered to fish, of which 34.3% returned vouchers for payment.
Report C (ODFW) Development of a System-wide Predator Control Program: Indexing and Fisheries Evaluation: Evaluate exploitation rate and size composition of northern pikeminnow harvested in the various fisheries implemented under the program together with an assessment of incidental catch of other fishes. Estimate reductions in predation on juvenile salmonids resulting from northern pikeminnow harvest and update information on year-class strength of northern pikeminnow.
1. Primary objectives in 2014 were to: (1) evaluate exploitation rates of northern pikeminnow and potential reduction in predation on juvenile salmonids resulting from the targeted removal fisheries; (2) characterize population dynamics of northern pikeminnow, smallmouth bass Micropterus dolomieu and walleye Sander vitreus in the Columbia River below Bonneville Dam and in Bonneville Reservoir; and (3) assess evidence of possible intra- and inter-specific compensatory responses by these predators related to the sustained removal of northern pikeminnow
2. System-wide exploitation of northern pikeminnow greater than or equal to 250 mm fork
length was 11.5% (95% confidence interval 6.9–16.1%).
2. Model-predicted reduction in predation was equivalent to a 32% from pre-program levels.
3. Biological evaluation of northern pikeminnow, smallmouth bass and walleye was conducted seasonally in two major areas of the Columbia River: downstream of Bonneville Dam during spring and summer and in Bonneville Reservoir during spring (high water temperatures in Bonneville Reservoir during summer months precluded sampling). Abundance index values for northern pikeminnow in the areas sampled ranged from 0.00 to 7.93, whereas estimates varied between 0.91 and 16.92 in 1990, the first year of biological evaluation. During the spring sampling period, consumption index values ranged from 0.00 in the mid-reservoir section above Bonneville Dam to 1.31 in the tailrace area downstream of Bonneville Dam. Within a given area, time series of consumption index values from 1990 to 2014 varied considerably, displaying no obvious inter-annual trends. Like consumption index estimates, spring predation index values for northern pikeminnow were highly variable among the areas sampled, ranging from 0.00 to 2.15.
4
4. As characterized by index values, spring abundance of smallmouth bass during 2014 was greatest in the mid-reservoir area of Bonneville Reservoir (10.91). Spring abundance index estimates downstream of Bonneville Dam varied spatially, with the largest value occurring between river kilometers 188 and 194 (3.16). Sample sizes were sufficient to calculate consumption index values for only the forebay, mid-reservoir and tailrace sections of Bonneville Reservoir during spring. Estimates within these areas were relatively small and remained comparable with previous years. Predation index values for smallmouth bass largely mirrored those of consumption index estimates, with the largest value occurring in the mid-reservoir section of Bonneville Reservoir.
5. In 2014, walleye were encountered only in the tailrace section downstream of Bonneville
Dam during summer sampling. The abundance estimate for walleye in this area approached the lower end of the time series (1990–2014). Juvenile Pacific salmon generally were encountered infrequently in gut content samples of walleye in the Columbia River downstream of Bonneville Dam (�̂�𝑝 = 0.17) whereas minnows (Family: Cyprinidae) were common (�̂�𝑝 = 0.67).
6. We evaluated 489 and 363 northern pikeminnow diet samples collected during angling activities at The Dalles and John Day dams, respectively. Fish were the primary prey type consumed by northern pikeminnow captured at both dams (�̂�𝑝 = 0.44 and 0.46, respectively). Of identifiable taxa encountered in diet samples, juvenile lamprey were consumed by the greatest number of northern pikeminnow (�̂�𝑝 = 0.41-0.58). During the month of August, American shad were found in a majority of samples analyzed (�̂�𝑝 = 0.56). Juvenile salmon or trout were encountered in the contents of northern pikeminnow digestive tracts during May through July, however relatively infrequently (�̂�𝑝 =0.17-0.28).
7. Highly variable index values for the predators considered in our study provide no obvious indication of an area-specific compensatory response to the targeted removal of northern pikeminnow. Yet, given the dynamic nature of these systems both biotic and abiotic, we encourage continued monitoring efforts to assess trends in predator populations throughout the Columbia and Snake rivers to help elucidate potential local and net (system-wide) effects.
Report D (WDFW) Dam angling at The Dalles and John Day dams
1. The 22 week fishery took place at The Dalles and John Day dams from May 6th to October 2nd, 2014.
2. The project objectives were to: (a) implement a recreational-type hook and line fishery
that harvests northern pikeminnow from within the boat restricted areas (BRZ) which are unavailable to the public at The Dalles and John Day dams, (b) allocate Dam Angler effort between The Dalles and John Day dams based on angler CPUE in order to maximize
5
harvest of northern pikeminnow, (c) collect, compile and report data on angler harvest, CPUE, gear/techniques and incidental catch for each project, (d) scan, record and report Passive Integrated Transponder (PIT) tag data from all northern pikeminnow, smallmouth bass, walleye, and channel catfish caught by the angling crew, (e) Record the presence of any external spaghetti tags, fin-clips, or signs of tag loss from these fishes for use in coordination with other Oregon Department of Fish and Wildlife (ODFW) predation studies, (f) collect relevant biological data on all northern pikeminnow and other fishes caught by the 2014 Dam Angling crew.
3. Harvests for the 22 week fishery totaled 6,424 northern pikeminnow at the two dams with 2,174 fish harvested at The Dalles dam and 4,250 fish at John Day dam. The total fishing time at the two dams was 1,923 hours for a combined overall average catch per angler hour of 3.34 fish. The catch at The Dalles dam was 2.87 fish per angler hour and at John Day dam, 3.65 fish per angler hour.
4. Back bouncing soft plastic lures were found to be the most effective method for harvesting
northern pikeminnow from both dams.
5. Incidental species most frequently caught and released at both dams were smallmouth bass Micropterus dolomieue, white sturgeon Acipenser transmontanus and Sculpin Cottus spp.
6. The mean fork length of northern pikeminnow caught from The Dalles Dam was 332.1 mm
and 363 mm at John Day dam. Report E (ODFW) Research Management and Evaluation Report 2014: Evaluate Predator Control Fisheries and Establish an Index of Predation by Northern Pikeminnow and Other Piscivorous Fishes on Juvenile Salmonids in the Lower Columbia and Snake Rivers.
6
REPORT A
Implementation of the Northern Pikeminnow Sport-Reward Fishery In the Columbia and Snake Rivers
2014 Annual Report
Prepared by
Paul V. Dunlap John D. Hone
Ruthanna M. Shirley Eric C. Winther
Washington Department of Fish and Wildlife 600 Capital Way N
Olympia, WA 98501-1091
Funded by
U. S. Department of Energy Bonneville Power Administration
Division of Fish and Wildlife Portland, Oregon 97208-3621
Project No. 1990-077-00 Contract No. 00046941
March 2015
7
ACKNOWLEDGEMENTS This project is funded by the Bonneville Power Administration (BPA), William Maslen, Project Manager, John Skidmore and David Roberts, COTR (Contract DE-BI719-94BI24514). We thank Adam Storch and his staff at the Oregon Department of Fish and Wildlife (ODFW) and Steve Williams and his staff at the Pacific States Marine Fisheries Commission (PSMFC) for their coordination. We are thankful to the City of Rainier for the use of the Rainier boat ramp; The City of Richland for the use of Columbia point Park; The City of Vancouver Parks and Recreation Department for the use of the Marine Park (PORTCO) boat ramp; the Cowlitz County Parks and Recreation Department for the use of the Willow Grove boat ramp; the Port of Bingen for the use of Bingen Marina; The Port of Camas/Washougal for the use of the Camas/Washougal boat ramp; the Port of Cascade Locks for the use of Marine Park; the Port of Cathlamet for the use of the Cathlamet Marina; the Port of Kalama for the use of the Kalama Marina; the Port of Ridgefield for the use of the Ridgefield boat ramp; the Port of The Dalles for the use of The Dalles Boat Basin; the Port of Umatilla for the use of the Umatilla Marina; the Portland Metro Regional Parks Department for the use of the M.J. Gleason Boat Ramp and Chinook Landing; the U.S. Army Corps of Engineers for the use of Giles French Park and the Greenbelt Boat Ramp; The Washington Department of Transportation for the use of the Vernita Bridge Rest Area; Washington State Parks for the use of Beacon Rock and Maryhill State Parks; Jim MacArthur for the use of Lyon’s Ferry Marina; and Leo and Terry Haas for the use of Boyer Park. We appreciate the efforts of Dick Buitenbos, Kevin Clawson, Ryan Crane, Mark Flahaut, Bill Fleenor, Leif Fox, Roger Fox, Josh Fross, Travis Harwood, Steve Lines, Eric Meyer, Tim Miller, Glen Murray, Stacy Remple, Jason Swindle, Kathy Thompson, John Paul Viviano, Robert Warrington, Alyce Wells, and Dennis Werlau for operating the sport-reward fishery registration stations. We also recognize Diana Murillo for her excellent work in computer data entry and document verification, Mike Luepke for his rendering services, Kristine Hand for her numerous phone survey interviews, Ruthanna Shirley for serving as the PIT tag recovery Lead, and Melissa Dexheimer for producing our weekly field activity reports, reconciling vouchers, and overseeing the Sport-Reward hotline throughout the season. This project is funded by the Bonneville Power Administration (project number 1990-077-00) and the COTR is David Roberts. Steve Williams of Pacific States Marine Fish Commission (PSMFC) administered this contract.
8
ABSTRACT
We are reporting on the progress of the Northern Pikeminnow Sport-Reward Fishery (NPSRF) implemented by the Washington Department of Fish and Wildlife (WDFW) on the Columbia and Snake Rivers from May 1 through September 30, 2014. The objectives of this project were to (1) implement a recreational fishery that rewards recreational anglers for harvesting northern pikeminnow > 228mm (9 inches) total length (TL), (2) collect, compile, and report data on angler participation, catch and harvest of northern pikeminnow and other fish species, as well as success rates of participants during the season, (3) examine collected northern pikeminnow for the presence of external tags, fin clips, and signs of tag loss, (4) collect biological data on northern pikeminnow and other fish species returned to registration stations, (5) scan northern pikeminnow for the presence of Passive Integrated Transponder (PIT) tags implanted into northern pikeminnow by ODFW as secondary tags, and/or from northern pikeminnow containing consumed salmonids with PIT tags, and (6) survey non-returning NPSRF participants targeting northern pikeminnow in order to obtain catch and harvest data on northern pikeminnow and other specified fish species. A total of 164,058 northern pikeminnow > 228 mm fork length (FL) and 4,643 pikeminnow < 228 mm FL were harvested during the 2014 NPSRF season. There were a total of 2,773 different anglers who spent 19,508 angler days participating in the fishery during the 2014 season. Catch per unit effort for combined returning and non-returning anglers was 8.41 fish/angler day. The Oregon Department of Fish and Wildlife (ODFW) estimated that the northern pikeminnow harvest activities from the 2014 NPSRF resulted in an overall exploitation rate of 11.4% (Tinus et al. 2015). Anglers submitted 172 northern pikeminnow with external ODFW spaghetti tags, all but one of these fish also had internal PIT tags. There were also 103 northern pikeminnow with ODFW PIT tags only, but missing spaghetti tags. An additional 53 PIT tags were recovered from juvenile salmonids ingested by northern pikeminnow received during the 2014 NPSRF. Peamouth Mylocheilus caurinus, smallmouth bass Micropterus dolomieue, and sculpin Cottus spp, were the fish species most frequently caught by NPSRF anglers targeting northern pikeminnow. The incidental catch of salmonids Oncorhynchus spp, by participating anglers targeting northern pikeminnow continued to remain below established limits for the Northern Pikeminnow Management Program (NPMP).
9
INTRODUCTION
Mortality of juvenile salmonids Oncorhynchus spp. migrating through the Columbia River system is a major concern of the Columbia Basin Fish and Wildlife Program, and predation is an important component of mortality (Northwest Power Planning Council 1987a). Northern pikeminnow Ptychocheilus oregonensis, formerly known as northern squawfish (Nelson et al. 1998), are the primary piscine predator of juvenile salmonids in the Lower Columbia and Snake River Systems (Rieman et al. 1991). Rieman and Beamesderfer (1990) predicted that predation on juvenile salmonids could be reduced by up to 50% with a sustained exploitation rate of 10-20% on northern pikeminnow > 275 mm FL (11 inches total length). The Northern Pikeminnow Management Program (NPMP) was created in 1990, with the goal of implementing fisheries to achieve the recommended 10-20% annual exploitation on northern pikeminnow >275 mm FL within the program area (Vigg and Burley 1989). In 2000, NPMP administrators reduced the minimum size for eligible (reward size) northern pikeminnow to 228 mm FL (9 inches total length) in response to recommendations contained in a review of NPMP justification, performance, and cost-effectiveness (Hankin and Richards 2000). Beginning in 1991, the Washington Department of Fish and Wildlife (WDFW) was contracted to conduct the NPSRF component of the NPMP (Burley et al. 1992). The NPSRF enlists recreational anglers to harvest reward sized (>9” total length) northern pikeminnow from within program boundaries on the Columbia and Snake Rivers using a monetary reward system. Since 1991, anglers participating in the NPSRF have harvested over 4.1 million reward sized northern pikeminnow and spent over 843,000 angler days of effort to become the NPMP’s most successful component for achieving the annual 10-20% exploitation rate on northern pikeminnow within the program boundaries (Klaybor et al. 1994; Friesen and Ward 1999). The 2014 NPSRF maintained the tiered angler reward system developed in 1995 (Hisata et al. 1996) which paid anglers higher rewards per fish based on achieving designated harvest levels and a separate bonus reward for returning northern pikeminnow spaghetti and/or PIT tagged by the Oregon Department of Fish and Wildlife (ODFW) as part of the NPSRF’s biological evaluation. Catch and harvest data were collected from returning anglers, and non-returning anglers in order to monitor the effects of the NPSRF on other Columbia basin fishes. The objectives of the 2014 NPSRF were to (1) implement a public fishery that rewards recreational anglers for harvesting northern pikeminnow > 228 mm (9 inches) total length, (2) collect, compile, and report data on angler participation, catch and harvest of northern pikeminnow and other fish species, and success rates of participating anglers during the season, (3) examine collected northern pikeminnow for the presence of external tags, fin-clips, and signs of tag loss, (4) collect biological data on northern pikeminnow and other fish species returned to registration stations, (5) scan northern pikeminnow for the presence of Passive Integrated Transponder (PIT) tags implanted into northern pikeminnow by ODFW as secondary tags, and/or from northern pikeminnow containing consumed salmonids with PIT tags, and (6) survey non-returning fishery participants targeting northern pikeminnow in order to obtain catch and harvest data on northern pikeminnow and other specified fish species.
10
METHODS OF OPERATION
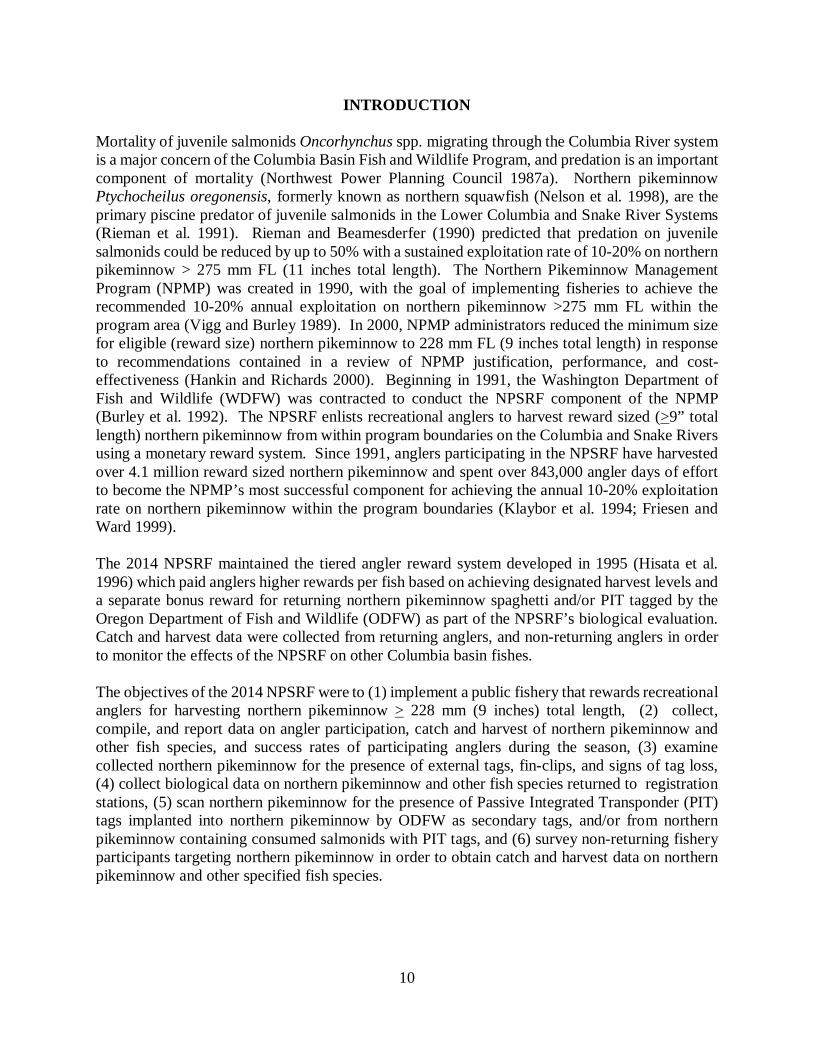
Fishery Operation Boundaries and Season The 2014 NPSRF was conducted on the Columbia River from the mouth to the boat-restricted zone below Priest Rapids Dam, and on the Snake River from the mouth to the boat-restricted zone below Hells Canyon Dam (Figure 1). In addition, anglers were allowed to harvest (and submit for payment) northern pikeminnow caught in backwaters, sloughs, and up to 400 feet from the mouth of tributaries within this area. The NPSRF was fully implemented, with all stations* operating during a regular season extending from May 1 through September 30, 2014 (*the Portco station closed August 31st due to park area construction activities).
Figure 1. Northern Pikeminnow Sport-Reward Fishery Program Area Registration Stations Twenty-one registration stations (Figure 2) were located on the Columbia and Snake Rivers to provide anglers with access to the Sport-Reward Fishery. WDFW technicians set up registration stations daily (seven days a week) at designated locations (normally public boat ramps or parks) which were available to anglers at specified times of between two and 6.5 hours per day during the season. Technicians registered anglers to participate in the NPSRF, collected angler creel information, issued pay vouchers to anglers returning with eligible northern pikeminnow,
11
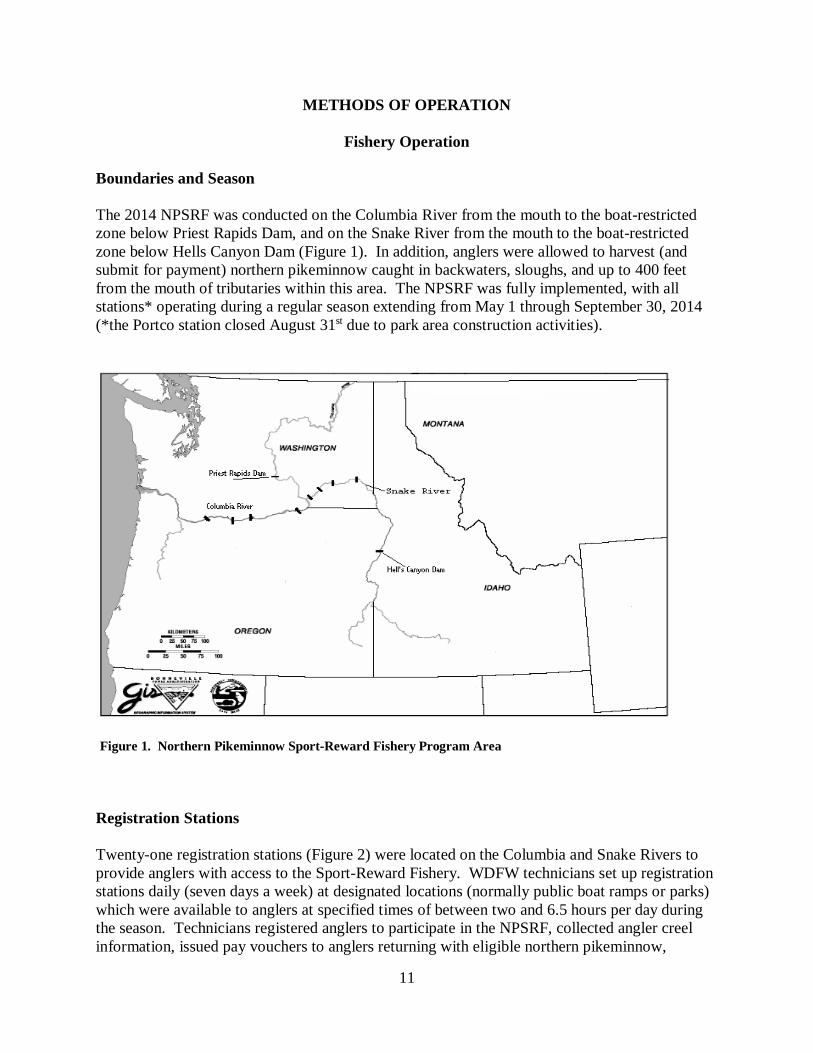
recorded biological data, scanned northern pikeminnow for the presence of PIT tags, and provided Sport-Reward Fishery information to the public. Self-registration boxes were located at each station so anglers could self-register when WDFW technicians were not present.
Figure 2. 2014 Northern Pikeminnow Sport Reward Fishery Registration Stations Reward System The 2014 NPSRF rewarded anglers for harvesting northern pikeminnow > 228mm TL (9 inches) and maintained the tiered angler reward system developed in 1995 (Hisata et al. 1996) which paid anglers a higher reward per fish once they had reached designated harvest levels over the course of the season. To receive payment, anglers returned their catch (daily) to the location where they had registered. WDFW technicians identified the angler’s fish and issued a payment voucher for the total number of eligible northern pikeminnow. Anglers mailed payment vouchers to the Pacific States Marine Fisheries Commission (PSMFC) for redemption. Anglers
1. Cathlamet Marina (10am-1:30 pm) 12. Bingen Marina (9am-12:30pm) 2. Willow Grove Boat Ramp (2-5 pm) 13. The Dalles Boat Basin (9am-3pm) 3. Rainier Marina (9:30am-12:30 pm) 14. Maryhill (3:30pm-5:30pm) 4. Kalama Marina (1pm-3 pm) 15. Giles French (1:30pm-5:30 pm) 5. Ridgefield (3:30pm-5:30pm) 16. Umatilla Marina (4pm-6 pm) 6. M. James Gleason Boat Ramp (12pm-5:30 pm) 17. Columbia Point Park (2pm-6:30 pm) 7. Portco Boat Ramp (4pm-6pm) 8. Chinook Landing (9am-11:30am) 9. Washougal Boat Ramp (9am-3:30 pm)
18. Vernita Bridge (10am-2:30 pm) 19. Lyon’s Ferry (10:30am-12:30pm) 20. Boyer Park (10:30 am-2 pm)
10. Beacon Rock (9:30am-12:30pm) 21. Greenbelt (3:30pm-6:30 pm) 11. Cascade Locks Boat Ramp (1pm-5:30 pm)
12
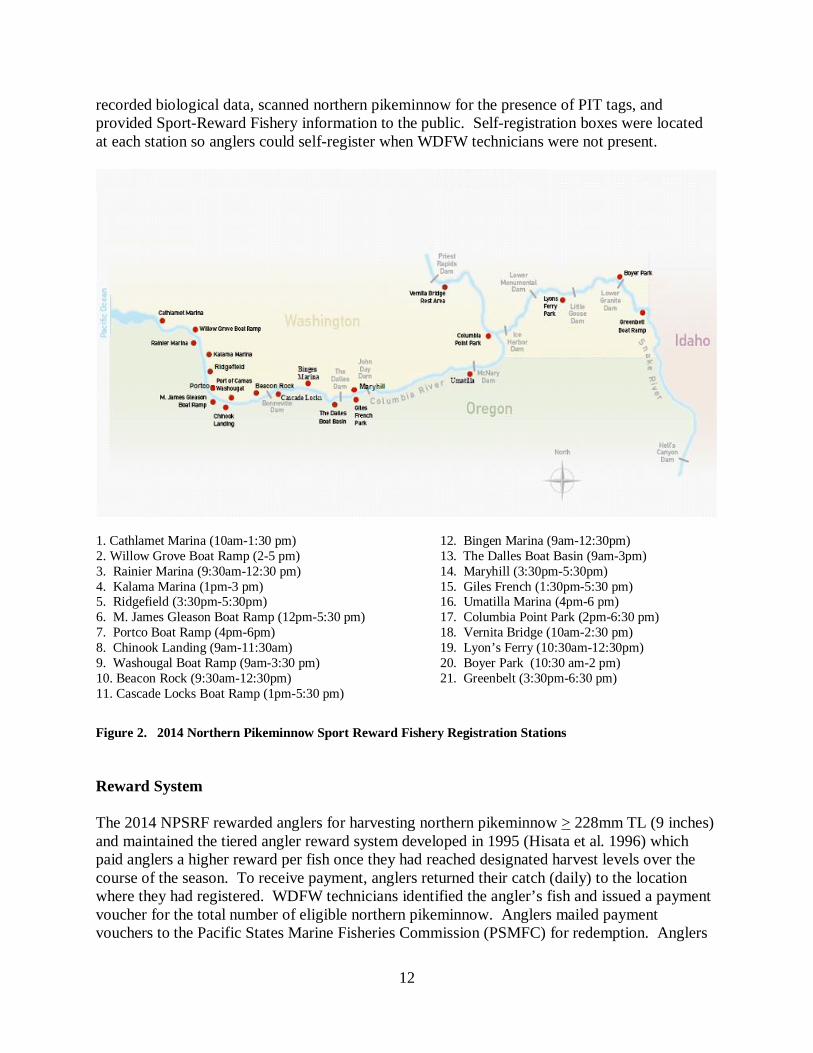
returning with northern pikeminnow that were spaghetti-tagged by ODFW as part of the biological evaluation of the fishery (Vigg et al. 1990), were issued a separate tag payment voucher that was mailed to ODFW for tag verification before payment was made to the angler by PSMFC. During the 2014 season, the NPSRF retained the pay levels first used in 2004 (Hone et al. 2005) which paid anglers $4 each for their first 100 northern pikeminnow, $5 each for numbers 101-400, and $8 each for all fish over 400. Anglers were paid $500 for each northern pikeminnow which retained a valid spaghetti tag used by ODFW for the biological evaluation of the NPMP. NEW for the 2014 NPSRF, anglers were paid $100 for each northern pikeminnow missing a spaghetti tag but still retaining the ODFW PIT tag. Angler Sampling Angler data and creel data for the NPSRF were compiled from angler registration forms. One registration form represented one angler day. Angler data consisted of name, date, fishing license number, phone number, and city, state, zip code of participating angler. Creel data recorded by WDFW technicians included fishing location (Figure 3), and primary species targeted. Anglers were asked if they specifically fished for northern pikeminnow at any time during their fishing trip. A “No” response ended the exit interview. A “Yes” response prompted technicians to ask the angler (and record data), how many of each species of fish were caught, harvested or released while targeting northern pikeminnow. A fish was considered “caught” when the angler touched the fish, whether it was released or harvested. Fish returned to the water alive were defined as “released”. Fish that were retained by the angler or not returned to the water alive were considered “harvested”.
Figure 3. Fishing location codes used for the 2014 Northern Pikeminnow Sport-Reward Fishery
13
Returning Anglers Technicians interviewed all returning anglers at each registration station to obtain any missing angler data, and to record creel data from each participant’s angling day. Creel data from caught and released fishes were recorded from angler recollection. Creel data from all harvested fish species were recorded from visual observation. Non-Returning Anglers Non-returning angler data were compiled from the pool of anglers who had registered for the NPSRF and targeted northern pikeminnow, but did not return to a registration station to participate in an exit interview. WDFW surveyed a minimum of 20% of the NPSRF’s non-returning anglers using a telephone survey in order to obtain creel data from that segment of the NPSRF’s participants. To obtain the 20% sample, non-returning anglers were randomly selected from each registration station for each week. A technician called anglers from each random sample until the 20% sample was attained. Non-returning anglers were surveyed with the same exit interview questions used for returning anglers. Anglers were asked: “did you specifically fish for northern pikeminnow at any time during your fishing trip?” With a “Yes” response, anglers were asked to report the number and species of adult and/or juvenile salmonids and the number of reward size northern pikeminnow that were caught and harvested/released while they targeted northern pikeminnow. Angler catch and harvest data were not collected from non-returning anglers who did not target northern pikeminnow on their fishing trip. Non-returning angler catch and harvest data for non-salmonid species were not collected in 2014 because they were collected in 2010 and trends for these species have remained consistent over the NPSRF’s previous 23 year history. These data will be collected again in 2015 per NPSRF protocol (Fox et al. 2000) to identify any variance from non-returning angler trends observed to date within the Sport-Reward Fishery.
Northern Pikeminnow Handling Procedures Biological Sampling Technicians examined all fishes returned to registration stations and recorded species as well as number of fish per species. Technicians checked all northern pikeminnow for the presence of external tags (spaghetti or dart), fin-clip marks, and signs of tag loss. Fork lengths and sex of northern pikeminnow as well as any other harvested fish species were recorded whenever possible. Complete biological data were collected from all tag-loss and spaghetti tagged northern pikeminnow including FL, sex (determined by evisceration), and scale samples (if specified). Spaghetti tagged and tag-loss northern pikeminnow carcasses were then labeled and frozen for data verification and/or tag recovery at a later date. Data from spaghetti tags were recorded on a tag envelope as well as on WDFW data forms. The spaghetti tag was then placed in the tag envelope, stapled to the tag payment voucher and given to the angler to submit to ODFW for verification.
14
PIT Tag Detection All northern pikeminnow collected during the 2014 NPSRF were also scanned for passive integrated transponder (PIT) tags. Northern pikeminnow harvested by anglers participating in the NPSRF have been found to ingest juvenile salmonids which have been PIT tagged by other studies within the basin (Glaser et al. 2001). In addition, PIT tags have also been used by ODFW as a secondary mark in all northern pikeminnow fitted with spaghetti tags (beginning in 2003) as part of the NPMP’s biological evaluation activities (Takata and Koloszar 2004). The use of PIT tags rather than fin clips as a secondary mark in northern pikeminnow was intended to improve the NPSRF’s estimate of tag loss, and result in a more accurate estimate of exploitation for the NPSRF. WDFW technicians were required to scan 100% of all northern pikeminnow returned to registration stations for PIT tags using PIT tag “readers”. Northern Pikeminnow submitted for payment to the NPSRF were scanned using either Destron Fearing portable transceivers (model #FS2001F) or Biomark portable transceivers (model #HPR.PLUS.04V1) to record information from PIT tag detections for submission to the Columbia Basin PIT tag information System (PTAGIS). Scanning began on the first day of the NPSRF season and continued at all stations throughout the rest of the season. Technicians individually scanned all reward sized northern pikeminnow for PIT tag presence, and complete biological data were recorded from all pikeminnow with positive readings. All PIT tagged northern pikeminnow were labeled and preserved for later dissection and tag recovery. All data were verified after recovery of PIT tags and all PIT tag recovery data were provided to ODFW and/or the PIT Tag Information System (PTAGIS) on a regular basis. Data from verified ODFW PIT tags was forwarded to PSMFC so that angler could be paid a $100 bonus reward. Northern Pikeminnow Processing During biological sampling, all northern pikeminnow were either eviscerated (to determine sex), or caudal clipped as an anti-fraud measure to eliminate the possibility of previously processed northern pikeminnow being resubmitted for payment. As in recent years, most northern pikeminnow harvested in 2014 were caudal clipped rather than eviscerated in order to facilitate more accurate recovery of PIT tags. Sampled northern pikeminnow were iced and transported to cold storage facilities from which they were ultimately delivered to rendering facilities for final disposal.
15
RESULTS AND DISCUSSION
Northern Pikeminnow Harvest
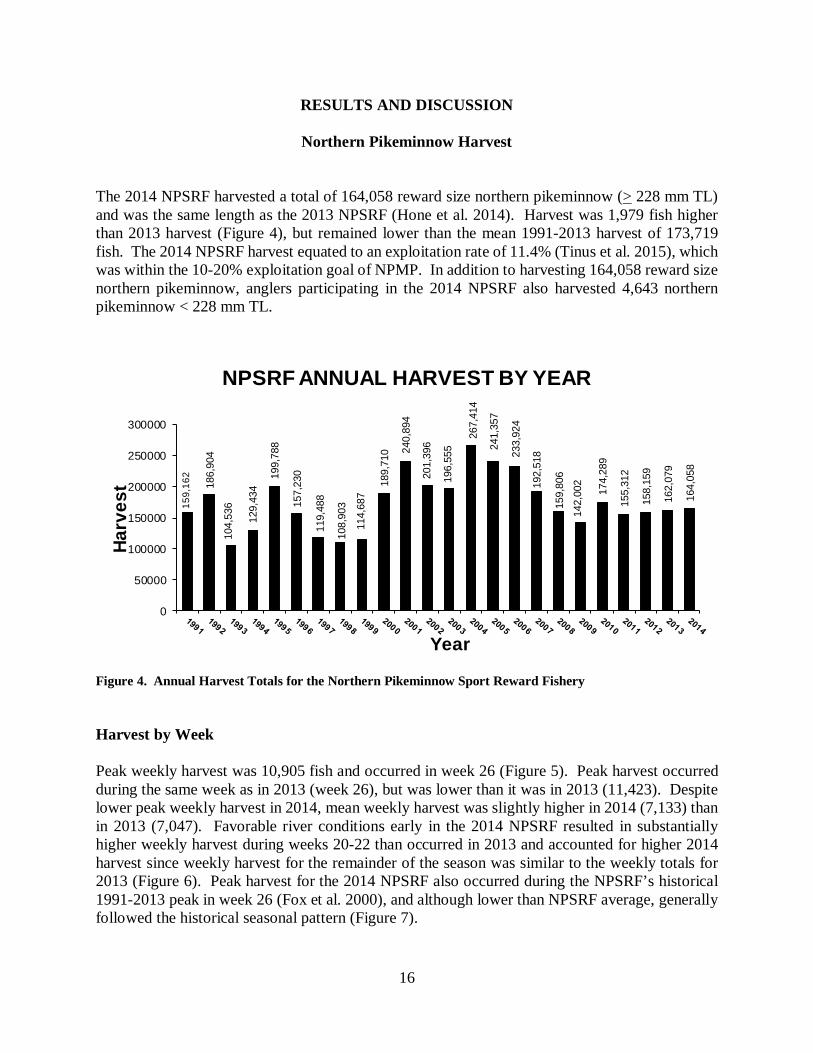
The 2014 NPSRF harvested a total of 164,058 reward size northern pikeminnow (> 228 mm TL) and was the same length as the 2013 NPSRF (Hone et al. 2014). Harvest was 1,979 fish higher than 2013 harvest (Figure 4), but remained lower than the mean 1991-2013 harvest of 173,719 fish. The 2014 NPSRF harvest equated to an exploitation rate of 11.4% (Tinus et al. 2015), which was within the 10-20% exploitation goal of NPMP. In addition to harvesting 164,058 reward size northern pikeminnow, anglers participating in the 2014 NPSRF also harvested 4,643 northern pikeminnow < 228 mm TL.
Figure 4. Annual Harvest Totals for the Northern Pikeminnow Sport Reward Fishery Harvest by Week Peak weekly harvest was 10,905 fish and occurred in week 26 (Figure 5). Peak harvest occurred during the same week as in 2013 (week 26), but was lower than it was in 2013 (11,423). Despite lower peak weekly harvest in 2014, mean weekly harvest was slightly higher in 2014 (7,133) than in 2013 (7,047). Favorable river conditions early in the 2014 NPSRF resulted in substantially higher weekly harvest during weeks 20-22 than occurred in 2013 and accounted for higher 2014 harvest since weekly harvest for the remainder of the season was similar to the weekly totals for 2013 (Figure 6). Peak harvest for the 2014 NPSRF also occurred during the NPSRF’s historical 1991-2013 peak in week 26 (Fox et al. 2000), and although lower than NPSRF average, generally followed the historical seasonal pattern (Figure 7).
159,
162
186,
904
104,
536
129,
434
199,
788
157,
230
119,
488
108,
903
114,
687
189,
710 24
0,89
4
201,
396
196,
555
267,
414
241,
357
233,
924
192,
518
159,
806
142,
002
174,
289
155,
312
158,
159
162,
079
164,
058
0
50000
100000
150000
200000
250000
300000
Harv
est
Year
NPSRF ANNUAL HARVEST BY YEAR
16
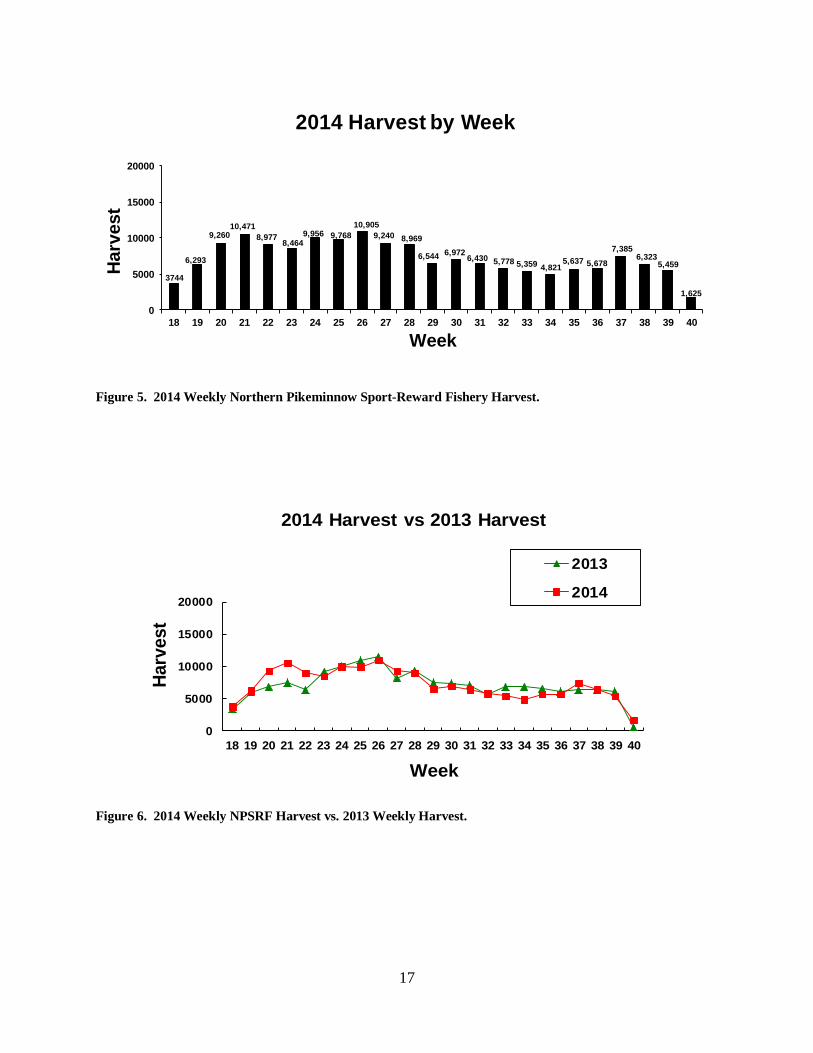
Figure 5. 2014 Weekly Northern Pikeminnow Sport-Reward Fishery Harvest. Figure 6. 2014 Weekly NPSRF Harvest vs. 2013 Weekly Harvest.
0
5000
10000
15000
20000
18 19 20 21 22 23 24 25 26 27 28 29 30 31 32 33 34 35 36 37 38 39 40
Harv
est
Week
2014 Harvest vs 2013 Harvest
2013
2014
3744
6,293
9,26010,471
8,9778,464
9,956 9,76810,905
9,240 8,969
6,544 6,9726,430 5,778 5,359 4,821
5,637 5,678
7,3856,323
5,459
1,625
0
5000
10000
15000
20000
18 19 20 21 22 23 24 25 26 27 28 29 30 31 32 33 34 35 36 37 38 39 40
Har
vest
Week
2014 Harvest by Week
17
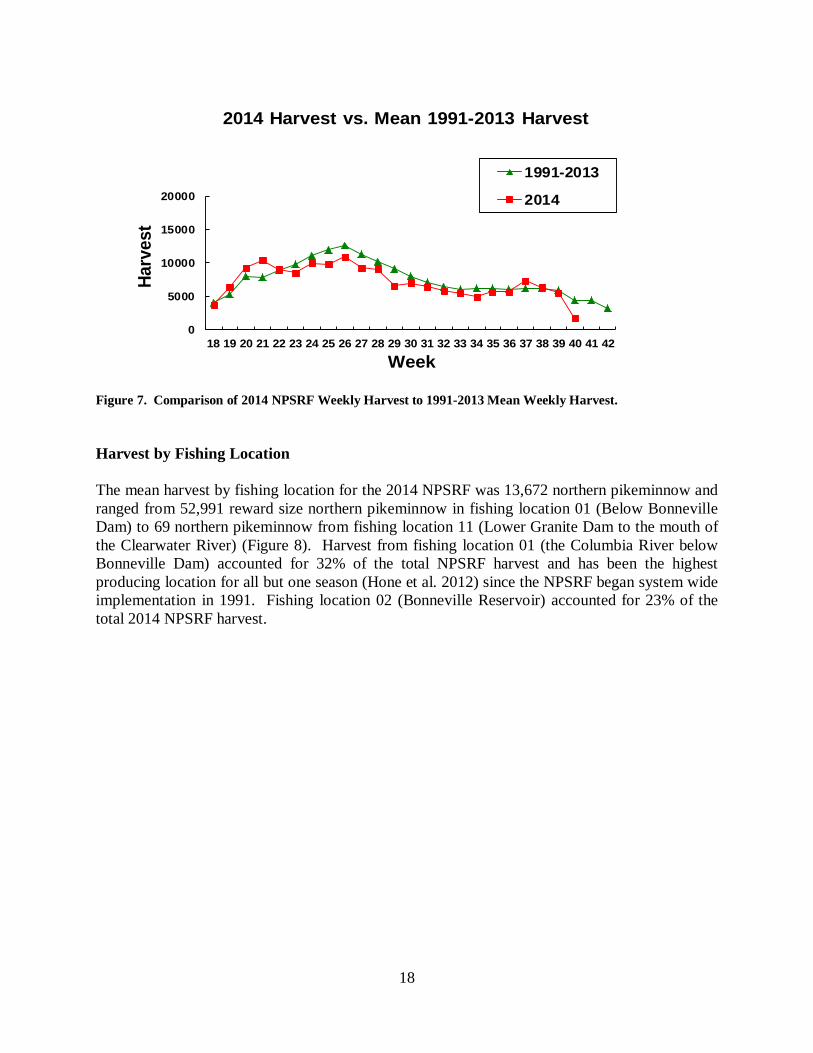
Figure 7. Comparison of 2014 NPSRF Weekly Harvest to 1991-2013 Mean Weekly Harvest. Harvest by Fishing Location The mean harvest by fishing location for the 2014 NPSRF was 13,672 northern pikeminnow and ranged from 52,991 reward size northern pikeminnow in fishing location 01 (Below Bonneville Dam) to 69 northern pikeminnow from fishing location 11 (Lower Granite Dam to the mouth of the Clearwater River) (Figure 8). Harvest from fishing location 01 (the Columbia River below Bonneville Dam) accounted for 32% of the total NPSRF harvest and has been the highest producing location for all but one season (Hone et al. 2012) since the NPSRF began system wide implementation in 1991. Fishing location 02 (Bonneville Reservoir) accounted for 23% of the total 2014 NPSRF harvest.
0
5000
10000
15000
20000
18 19 20 21 22 23 24 25 26 27 28 29 30 31 32 33 34 35 36 37 38 39 40 41 42
Harv
est
Week
2014 Harvest vs. Mean 1991-2013 Harvest
1991-2013
2014
18
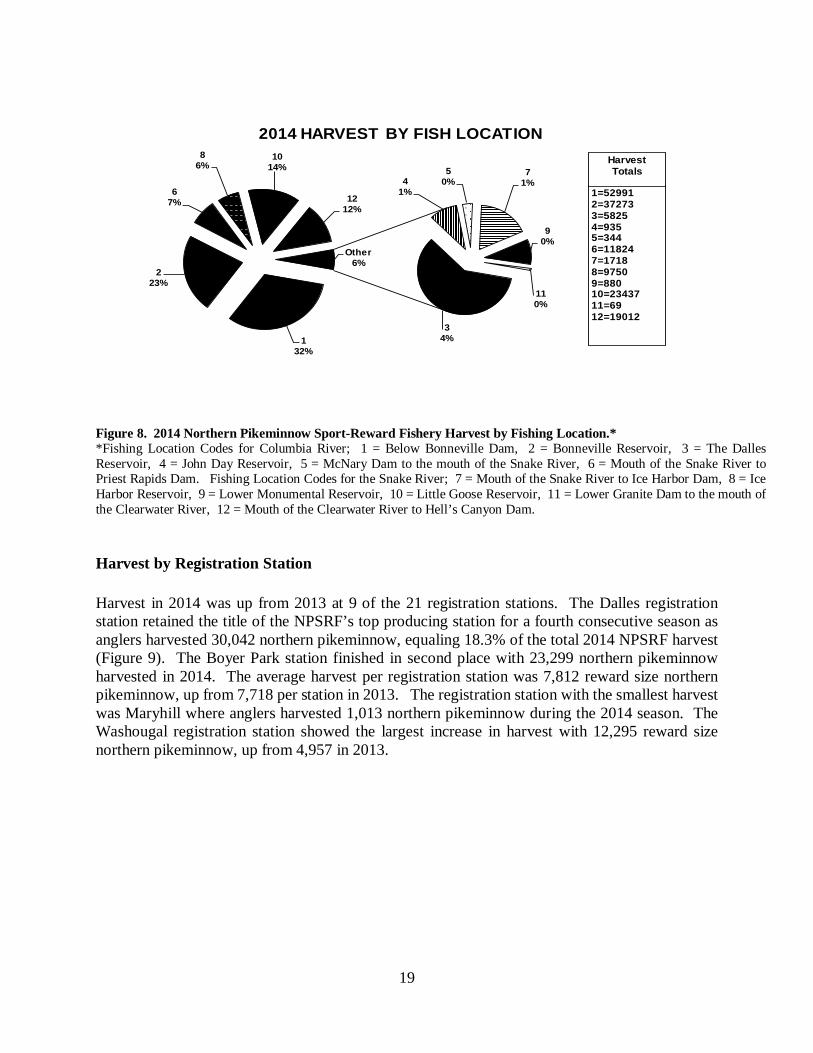
Figure 8. 2014 Northern Pikeminnow Sport-Reward Fishery Harvest by Fishing Location.* *Fishing Location Codes for Columbia River; 1 = Below Bonneville Dam, 2 = Bonneville Reservoir, 3 = The Dalles Reservoir, 4 = John Day Reservoir, 5 = McNary Dam to the mouth of the Snake River, 6 = Mouth of the Snake River to Priest Rapids Dam. Fishing Location Codes for the Snake River; 7 = Mouth of the Snake River to Ice Harbor Dam, 8 = Ice Harbor Reservoir, 9 = Lower Monumental Reservoir, 10 = Little Goose Reservoir, 11 = Lower Granite Dam to the mouth of the Clearwater River, 12 = Mouth of the Clearwater River to Hell’s Canyon Dam. Harvest by Registration Station Harvest in 2014 was up from 2013 at 9 of the 21 registration stations. The Dalles registration station retained the title of the NPSRF’s top producing station for a fourth consecutive season as anglers harvested 30,042 northern pikeminnow, equaling 18.3% of the total 2014 NPSRF harvest (Figure 9). The Boyer Park station finished in second place with 23,299 northern pikeminnow harvested in 2014. The average harvest per registration station was 7,812 reward size northern pikeminnow, up from 7,718 per station in 2013. The registration station with the smallest harvest was Maryhill where anglers harvested 1,013 northern pikeminnow during the 2014 season. The Washougal registration station showed the largest increase in harvest with 12,295 reward size northern pikeminnow, up from 4,957 in 2013.
132%
223%
34%
41%
50%
67%
71%
86%
90%
1014%
110%
1212%
Other6%
2014 HARVEST BY FISH LOCATION
1=52991 2=372733=58254=9355=344 6=118247=17188=97509=88010=2343711=6912=19012
Harvest Totals
19
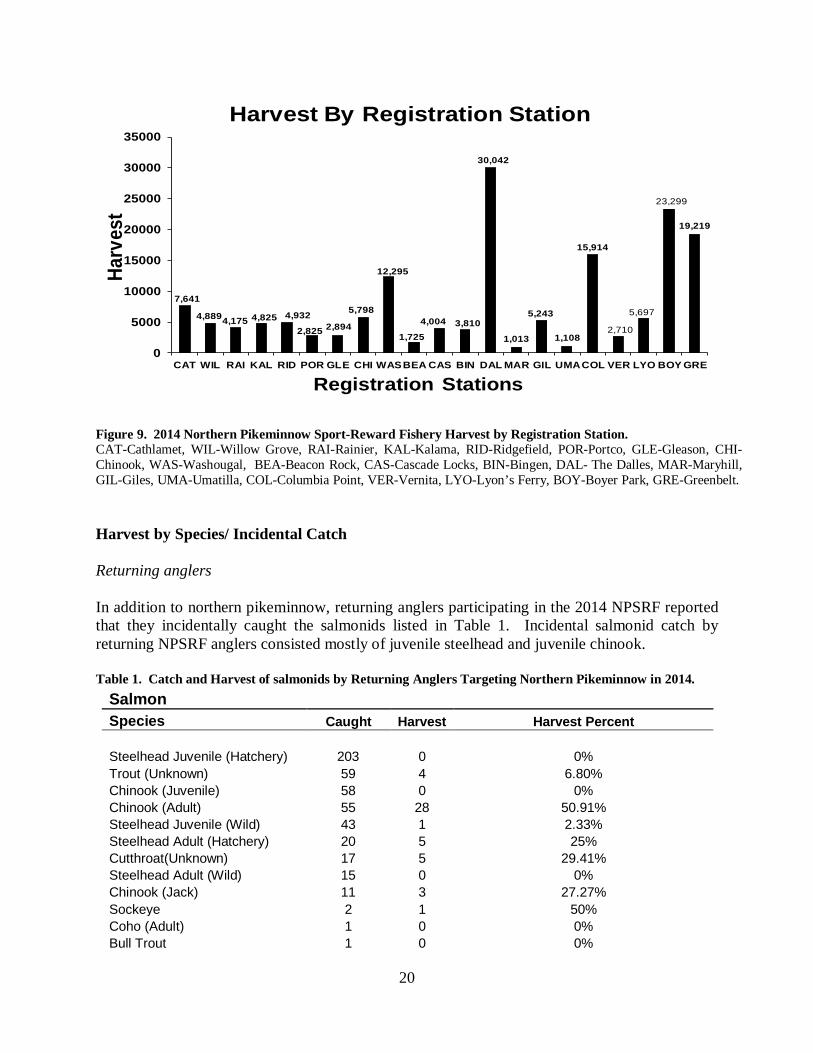
Figure 9. 2014 Northern Pikeminnow Sport-Reward Fishery Harvest by Registration Station. CAT-Cathlamet, WIL-Willow Grove, RAI-Rainier, KAL-Kalama, RID-Ridgefield, POR-Portco, GLE-Gleason, CHI-Chinook, WAS-Washougal, BEA-Beacon Rock, CAS-Cascade Locks, BIN-Bingen, DAL- The Dalles, MAR-Maryhill, GIL-Giles, UMA-Umatilla, COL-Columbia Point, VER-Vernita, LYO-Lyon’s Ferry, BOY-Boyer Park, GRE-Greenbelt. Harvest by Species/ Incidental Catch Returning anglers In addition to northern pikeminnow, returning anglers participating in the 2014 NPSRF reported that they incidentally caught the salmonids listed in Table 1. Incidental salmonid catch by returning NPSRF anglers consisted mostly of juvenile steelhead and juvenile chinook. Table 1. Catch and Harvest of salmonids by Returning Anglers Targeting Northern Pikeminnow in 2014.
Salmon Species Caught Harvest Harvest Percent Steelhead Juvenile (Hatchery) 203 0 0% Trout (Unknown) 59 4 6.80% Chinook (Juvenile) 58 0 0% Chinook (Adult) 55 28 50.91% Steelhead Juvenile (Wild) 43 1 2.33% Steelhead Adult (Hatchery) 20 5 25% Cutthroat(Unknown) 17 5 29.41% Steelhead Adult (Wild) 15 0 0% Chinook (Jack) 11 3 27.27% Sockeye 2 1 50% Coho (Adult) 1 0 0% Bull Trout 1 0 0%
7,641
4,8894,175 4,825 4,932
2,825 2,894
5,798
12,295
1,725
4,004 3,810
30,042
1,013
5,243
1,108
15,914
2,710
5,697
23,299
19,219
0
5000
10000
15000
20000
25000
30000
35000
CAT WIL RAI KAL RID POR GLE CHI WASBEA CAS BIN DAL MAR GIL UMACOL VER LYO BOY GRE
Harv
est
Registration Stations
Harvest By Registration Station
20
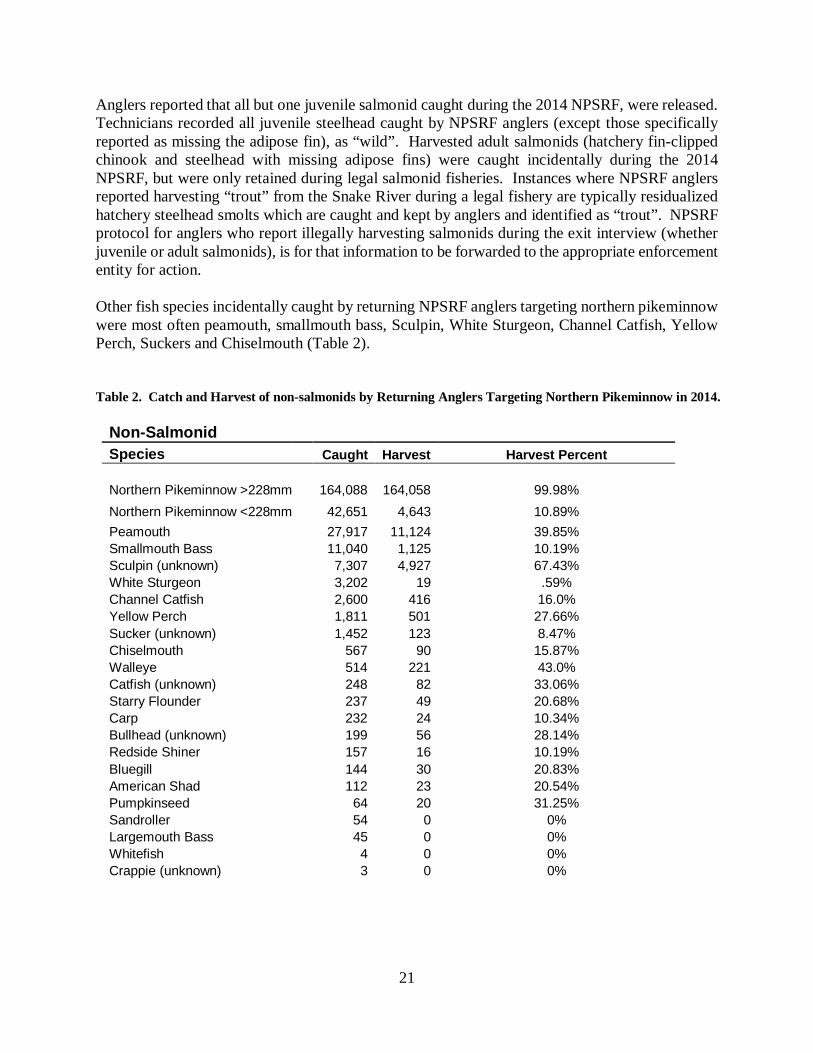
Anglers reported that all but one juvenile salmonid caught during the 2014 NPSRF, were released. Technicians recorded all juvenile steelhead caught by NPSRF anglers (except those specifically reported as missing the adipose fin), as “wild”. Harvested adult salmonids (hatchery fin-clipped chinook and steelhead with missing adipose fins) were caught incidentally during the 2014 NPSRF, but were only retained during legal salmonid fisheries. Instances where NPSRF anglers reported harvesting “trout” from the Snake River during a legal fishery are typically residualized hatchery steelhead smolts which are caught and kept by anglers and identified as “trout”. NPSRF protocol for anglers who report illegally harvesting salmonids during the exit interview (whether juvenile or adult salmonids), is for that information to be forwarded to the appropriate enforcement entity for action. Other fish species incidentally caught by returning NPSRF anglers targeting northern pikeminnow were most often peamouth, smallmouth bass, Sculpin, White Sturgeon, Channel Catfish, Yellow Perch, Suckers and Chiselmouth (Table 2). Table 2. Catch and Harvest of non-salmonids by Returning Anglers Targeting Northern Pikeminnow in 2014.
Non-Salmonid Species Caught Harvest Harvest Percent Northern Pikeminnow >228mm 164,088 164,058 99.98% Northern Pikeminnow <228mm 42,651 4,643 10.89% Peamouth 27,917 11,124 39.85% Smallmouth Bass 11,040 1,125 10.19% Sculpin (unknown) 7,307 4,927 67.43% White Sturgeon 3,202 19 .59% Channel Catfish 2,600 416 16.0% Yellow Perch 1,811 501 27.66% Sucker (unknown) 1,452 123 8.47% Chiselmouth 567 90 15.87% Walleye 514 221 43.0% Catfish (unknown) 248 82 33.06% Starry Flounder 237 49 20.68% Carp 232 24 10.34% Bullhead (unknown) 199 56 28.14% Redside Shiner 157 16 10.19% Bluegill 144 30 20.83% American Shad 112 23 20.54% Pumpkinseed 64 20 31.25% Sandroller 54 0 0% Largemouth Bass 45 0 0% Whitefish 4 0 0% Crappie (unknown) 3 0 0%
21
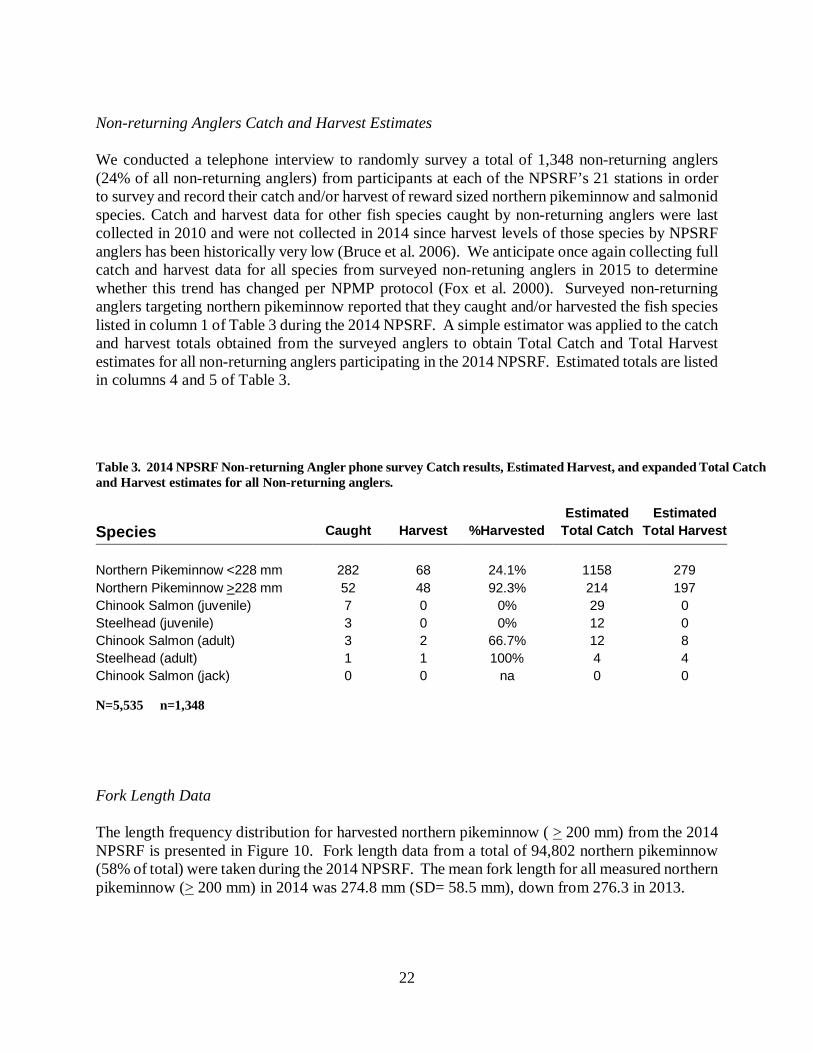
Non-returning Anglers Catch and Harvest Estimates We conducted a telephone interview to randomly survey a total of 1,348 non-returning anglers (24% of all non-returning anglers) from participants at each of the NPSRF’s 21 stations in order to survey and record their catch and/or harvest of reward sized northern pikeminnow and salmonid species. Catch and harvest data for other fish species caught by non-returning anglers were last collected in 2010 and were not collected in 2014 since harvest levels of those species by NPSRF anglers has been historically very low (Bruce et al. 2006). We anticipate once again collecting full catch and harvest data for all species from surveyed non-retuning anglers in 2015 to determine whether this trend has changed per NPMP protocol (Fox et al. 2000). Surveyed non-returning anglers targeting northern pikeminnow reported that they caught and/or harvested the fish species listed in column 1 of Table 3 during the 2014 NPSRF. A simple estimator was applied to the catch and harvest totals obtained from the surveyed anglers to obtain Total Catch and Total Harvest estimates for all non-returning anglers participating in the 2014 NPSRF. Estimated totals are listed in columns 4 and 5 of Table 3. Table 3. 2014 NPSRF Non-returning Angler phone survey Catch results, Estimated Harvest, and expanded Total Catch and Harvest estimates for all Non-returning anglers.
Estimated Estimated Species Caught Harvest %Harvested Total Catch Total Harvest Northern Pikeminnow <228 mm 282 68 24.1% 1158 279 Northern Pikeminnow >228 mm 52 48 92.3% 214 197 Chinook Salmon (juvenile) 7 0 0% 29 0 Steelhead (juvenile) 3 0 0% 12 0 Chinook Salmon (adult) 3 2 66.7% 12 8 Steelhead (adult) 1 1 100% 4 4 Chinook Salmon (jack) 0 0 na 0 0 N=5,535 n=1,348 Fork Length Data The length frequency distribution for harvested northern pikeminnow ( > 200 mm) from the 2014 NPSRF is presented in Figure 10. Fork length data from a total of 94,802 northern pikeminnow (58% of total) were taken during the 2014 NPSRF. The mean fork length for all measured northern pikeminnow (> 200 mm) in 2014 was 274.8 mm (SD= 58.5 mm), down from 276.3 in 2013.
22
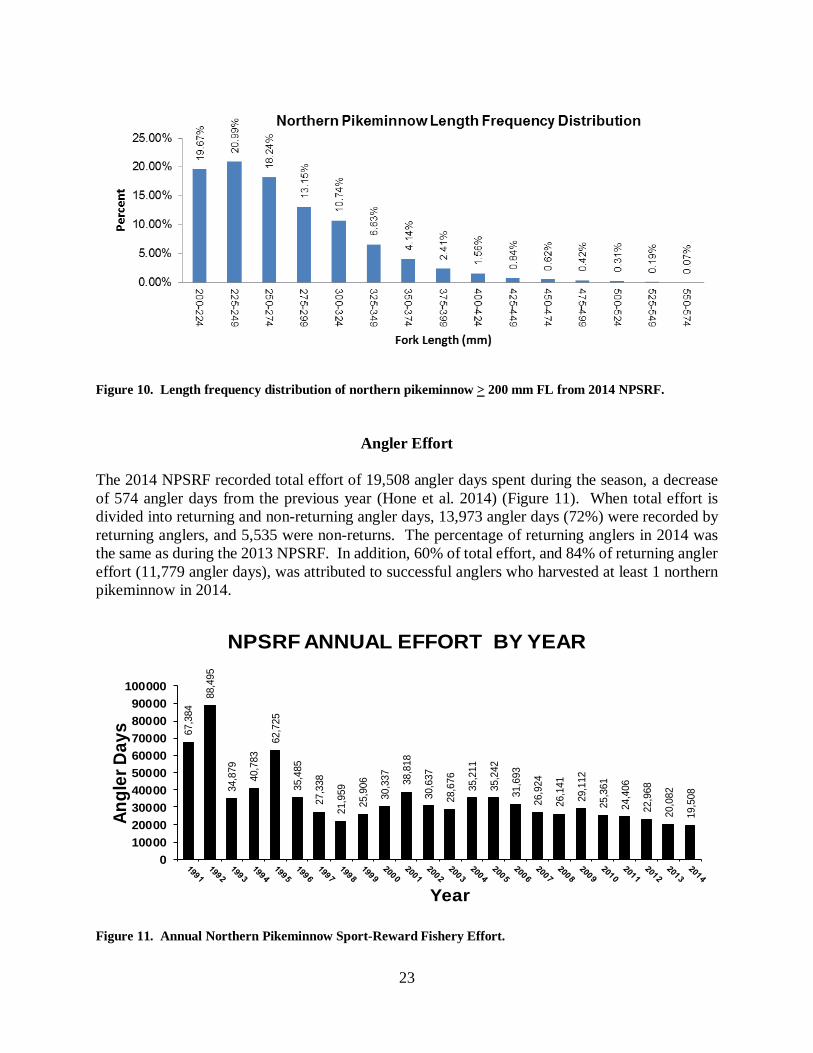
Figure 10. Length frequency distribution of northern pikeminnow > 200 mm FL from 2014 NPSRF.
Angler Effort The 2014 NPSRF recorded total effort of 19,508 angler days spent during the season, a decrease of 574 angler days from the previous year (Hone et al. 2014) (Figure 11). When total effort is divided into returning and non-returning angler days, 13,973 angler days (72%) were recorded by returning anglers, and 5,535 were non-returns. The percentage of returning anglers in 2014 was the same as during the 2013 NPSRF. In addition, 60% of total effort, and 84% of returning angler effort (11,779 angler days), was attributed to successful anglers who harvested at least 1 northern pikeminnow in 2014.
Figure 11. Annual Northern Pikeminnow Sport-Reward Fishery Effort.
67,3
84
88,4
95
34,8
79
40,7
83
62,7
25
35,4
85
27,3
38
21,9
59
25,9
06
30,3
37 38,8
18
30,6
37
28,6
76
35,2
11
35,2
42
31,6
93
26,9
24
26,1
41
29,1
12
25,3
61
24,4
06
22,9
68
20,0
82
19,5
08
0100002000030000400005000060000700008000090000
100000
Angl
er D
ays
Year
NPSRF ANNUAL EFFORT BY YEAR
23
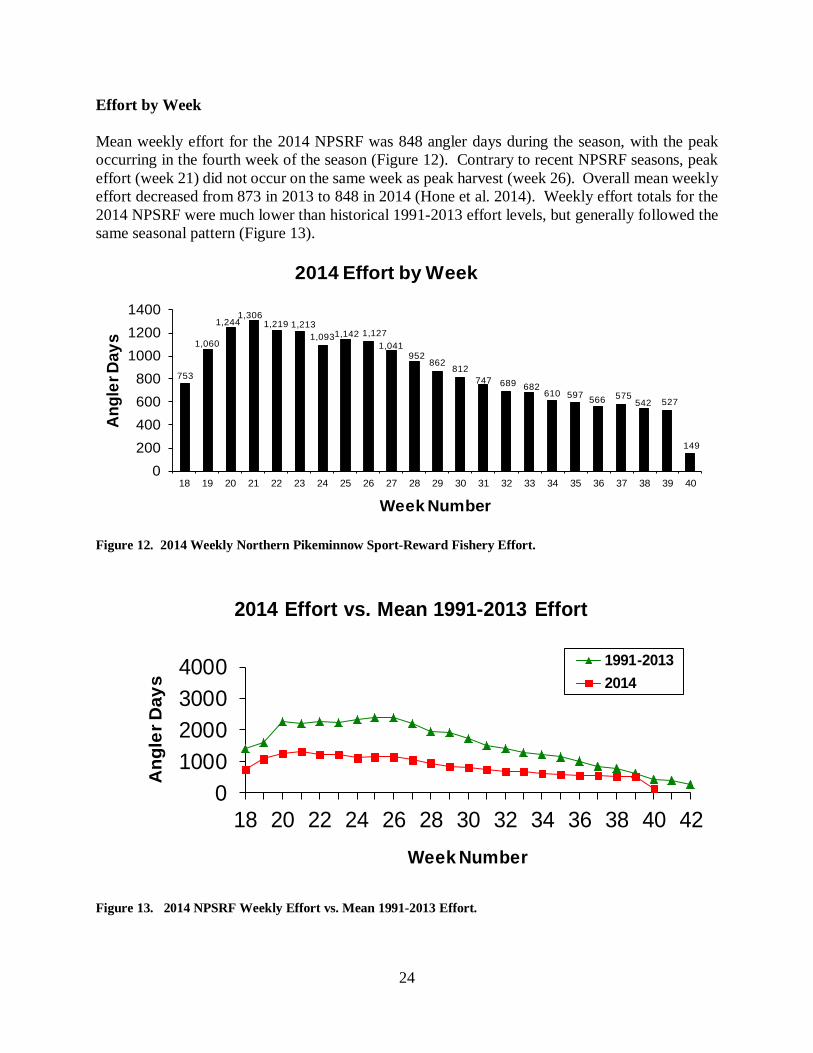
Effort by Week Mean weekly effort for the 2014 NPSRF was 848 angler days during the season, with the peak occurring in the fourth week of the season (Figure 12). Contrary to recent NPSRF seasons, peak effort (week 21) did not occur on the same week as peak harvest (week 26). Overall mean weekly effort decreased from 873 in 2013 to 848 in 2014 (Hone et al. 2014). Weekly effort totals for the 2014 NPSRF were much lower than historical 1991-2013 effort levels, but generally followed the same seasonal pattern (Figure 13).
Figure 12. 2014 Weekly Northern Pikeminnow Sport-Reward Fishery Effort.
Figure 13. 2014 NPSRF Weekly Effort vs. Mean 1991-2013 Effort.
753
1,060
1,2441,306
1,219 1,2131,0931,142 1,127
1,041952
862812
747 689 682610 597 566 575
542 527
149
0200400600800
100012001400
18 19 20 21 22 23 24 25 26 27 28 29 30 31 32 33 34 35 36 37 38 39 40
Ang
ler D
ays
Week Number
2014 Effort by Week
01000200030004000
18 20 22 24 26 28 30 32 34 36 38 40 42
Ang
ler D
ays
Week Number
2014 Effort vs. Mean 1991-2013 Effort
1991-20132014
24
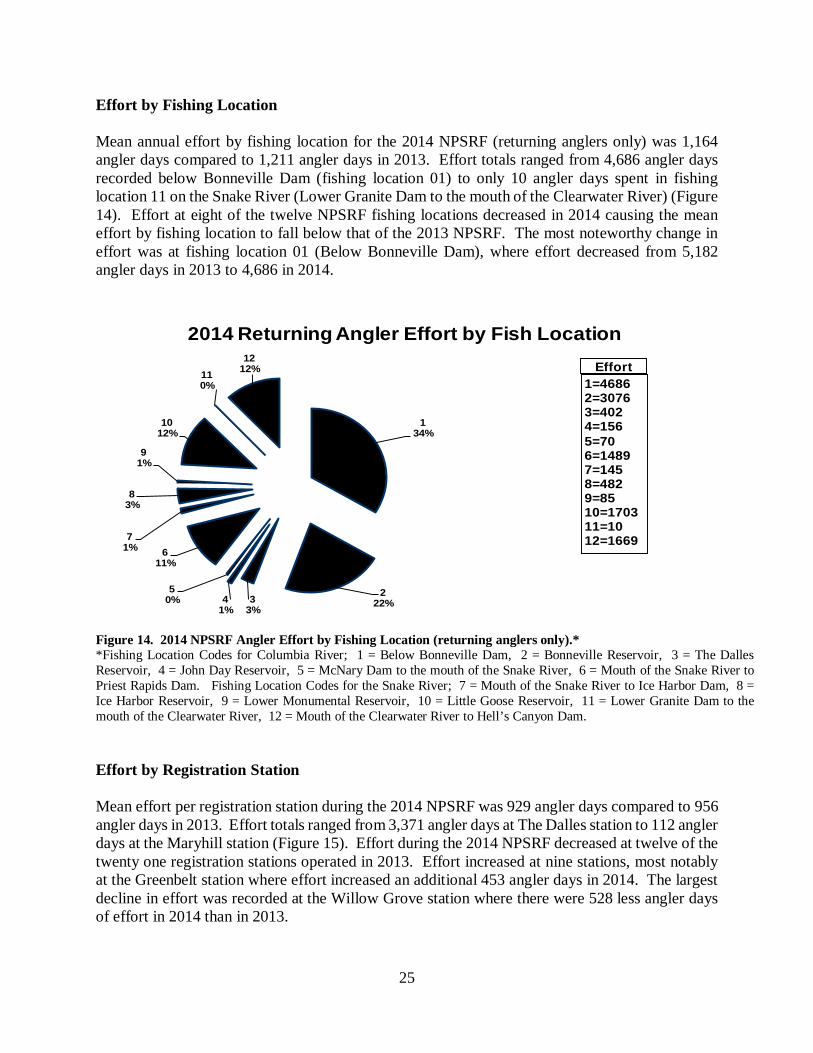
Effort by Fishing Location Mean annual effort by fishing location for the 2014 NPSRF (returning anglers only) was 1,164 angler days compared to 1,211 angler days in 2013. Effort totals ranged from 4,686 angler days recorded below Bonneville Dam (fishing location 01) to only 10 angler days spent in fishing location 11 on the Snake River (Lower Granite Dam to the mouth of the Clearwater River) (Figure 14). Effort at eight of the twelve NPSRF fishing locations decreased in 2014 causing the mean effort by fishing location to fall below that of the 2013 NPSRF. The most noteworthy change in effort was at fishing location 01 (Below Bonneville Dam), where effort decreased from 5,182 angler days in 2013 to 4,686 in 2014.
Figure 14. 2014 NPSRF Angler Effort by Fishing Location (returning anglers only).* *Fishing Location Codes for Columbia River; 1 = Below Bonneville Dam, 2 = Bonneville Reservoir, 3 = The Dalles Reservoir, 4 = John Day Reservoir, 5 = McNary Dam to the mouth of the Snake River, 6 = Mouth of the Snake River to Priest Rapids Dam. Fishing Location Codes for the Snake River; 7 = Mouth of the Snake River to Ice Harbor Dam, 8 = Ice Harbor Reservoir, 9 = Lower Monumental Reservoir, 10 = Little Goose Reservoir, 11 = Lower Granite Dam to the mouth of the Clearwater River, 12 = Mouth of the Clearwater River to Hell’s Canyon Dam. Effort by Registration Station Mean effort per registration station during the 2014 NPSRF was 929 angler days compared to 956 angler days in 2013. Effort totals ranged from 3,371 angler days at The Dalles station to 112 angler days at the Maryhill station (Figure 15). Effort during the 2014 NPSRF decreased at twelve of the twenty one registration stations operated in 2013. Effort increased at nine stations, most notably at the Greenbelt station where effort increased an additional 453 angler days in 2014. The largest decline in effort was recorded at the Willow Grove station where there were 528 less angler days of effort in 2014 than in 2013.
134%
222%3
3%4
1%
50%
611%
71%
83%
91%
1012%
110%
1212%
2014 Returning Angler Effort by Fish Location
1=46862=30763=4024=1565=706=14897=1458=4829=8510=170311=1012=1669
Effort
25
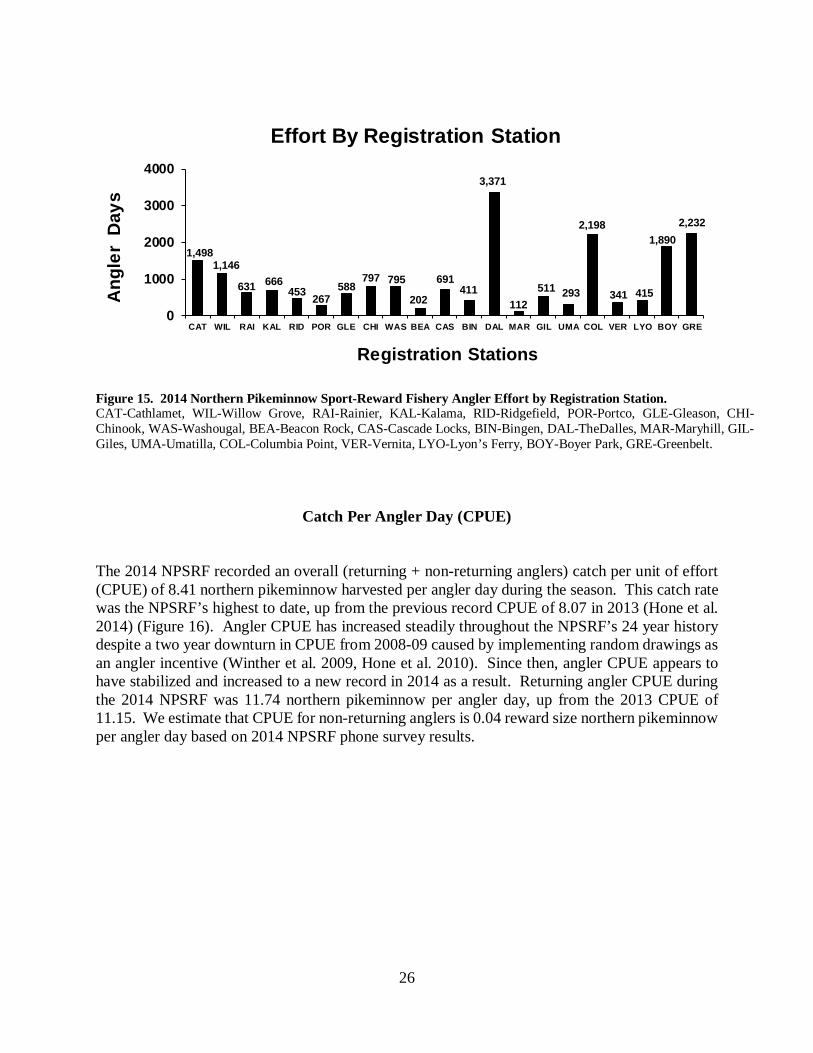
Figure 15. 2014 Northern Pikeminnow Sport-Reward Fishery Angler Effort by Registration Station. CAT-Cathlamet, WIL-Willow Grove, RAI-Rainier, KAL-Kalama, RID-Ridgefield, POR-Portco, GLE-Gleason, CHI-Chinook, WAS-Washougal, BEA-Beacon Rock, CAS-Cascade Locks, BIN-Bingen, DAL-TheDalles, MAR-Maryhill, GIL-Giles, UMA-Umatilla, COL-Columbia Point, VER-Vernita, LYO-Lyon’s Ferry, BOY-Boyer Park, GRE-Greenbelt.
Catch Per Angler Day (CPUE) The 2014 NPSRF recorded an overall (returning + non-returning anglers) catch per unit of effort (CPUE) of 8.41 northern pikeminnow harvested per angler day during the season. This catch rate was the NPSRF’s highest to date, up from the previous record CPUE of 8.07 in 2013 (Hone et al. 2014) (Figure 16). Angler CPUE has increased steadily throughout the NPSRF’s 24 year history despite a two year downturn in CPUE from 2008-09 caused by implementing random drawings as an angler incentive (Winther et al. 2009, Hone et al. 2010). Since then, angler CPUE appears to have stabilized and increased to a new record in 2014 as a result. Returning angler CPUE during the 2014 NPSRF was 11.74 northern pikeminnow per angler day, up from the 2013 CPUE of 11.15. We estimate that CPUE for non-returning anglers is 0.04 reward size northern pikeminnow per angler day based on 2014 NPSRF phone survey results.
1,4981,146
631 666453 267
588797 795
202
691411
3,371
112511 293
2,198
341 415
1,8902,232
0
1000
2000
3000
4000
CAT WIL RAI KAL RID POR GLE CHI WAS BEA CAS BIN DAL MAR GIL UMA COL VER LYO BOY GRE
Ang
ler
Day
s
Registration Stations
Effort By Registration Station
26
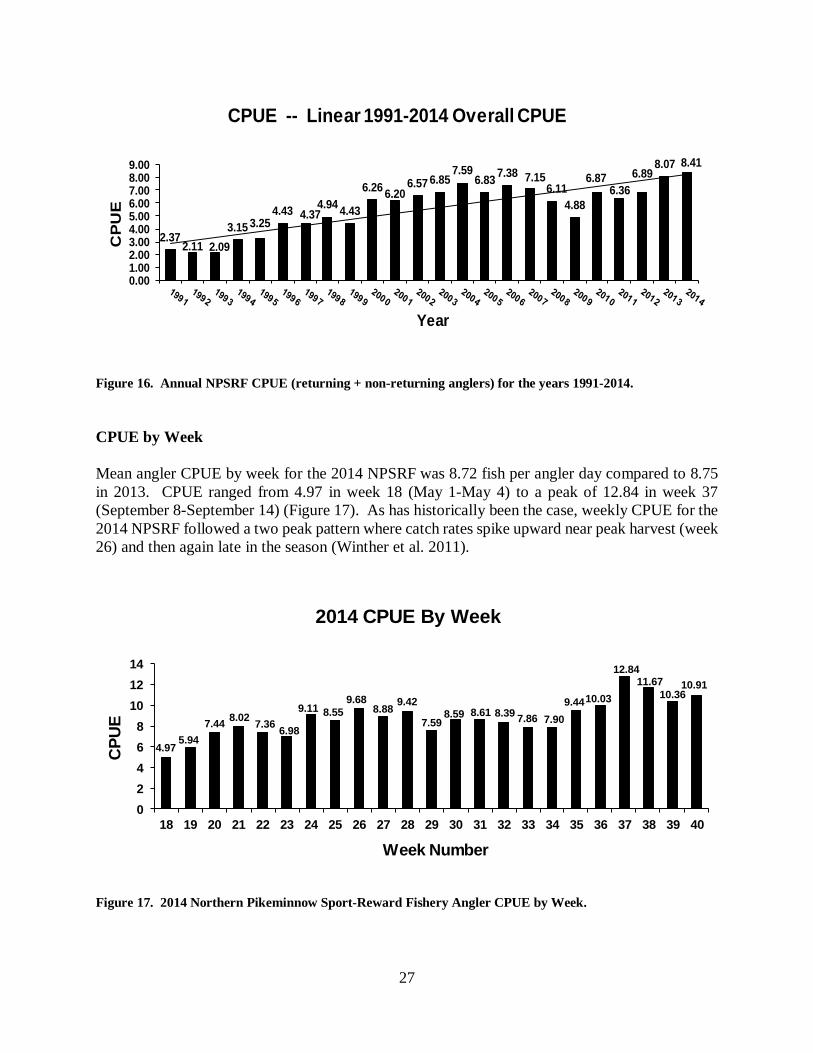
Figure 16. Annual NPSRF CPUE (returning + non-returning anglers) for the years 1991-2014. CPUE by Week Mean angler CPUE by week for the 2014 NPSRF was 8.72 fish per angler day compared to 8.75 in 2013. CPUE ranged from 4.97 in week 18 (May 1-May 4) to a peak of 12.84 in week 37 (September 8-September 14) (Figure 17). As has historically been the case, weekly CPUE for the 2014 NPSRF followed a two peak pattern where catch rates spike upward near peak harvest (week 26) and then again late in the season (Winther et al. 2011).
Figure 17. 2014 Northern Pikeminnow Sport-Reward Fishery Angler CPUE by Week.
2.372.11 2.09
3.15 3.254.43 4.37
4.94 4.43
6.26 6.206.57 6.85
7.596.83 7.38 7.15
6.114.88
6.876.36
6.898.07 8.41
0.001.002.003.004.005.006.007.008.009.00
CP
UE
Year
CPUE -- Linear 1991-2014 Overall CPUE
4.975.94
7.44 8.02 7.36 6.98
9.11 8.559.68
8.88 9.42
7.598.59 8.61 8.39 7.86 7.90
9.4410.03
12.8411.67
10.3610.91
02468
101214
18 19 20 21 22 23 24 25 26 27 28 29 30 31 32 33 34 35 36 37 38 39 40
CPU
E
Week Number
2014 CPUE By Week
27
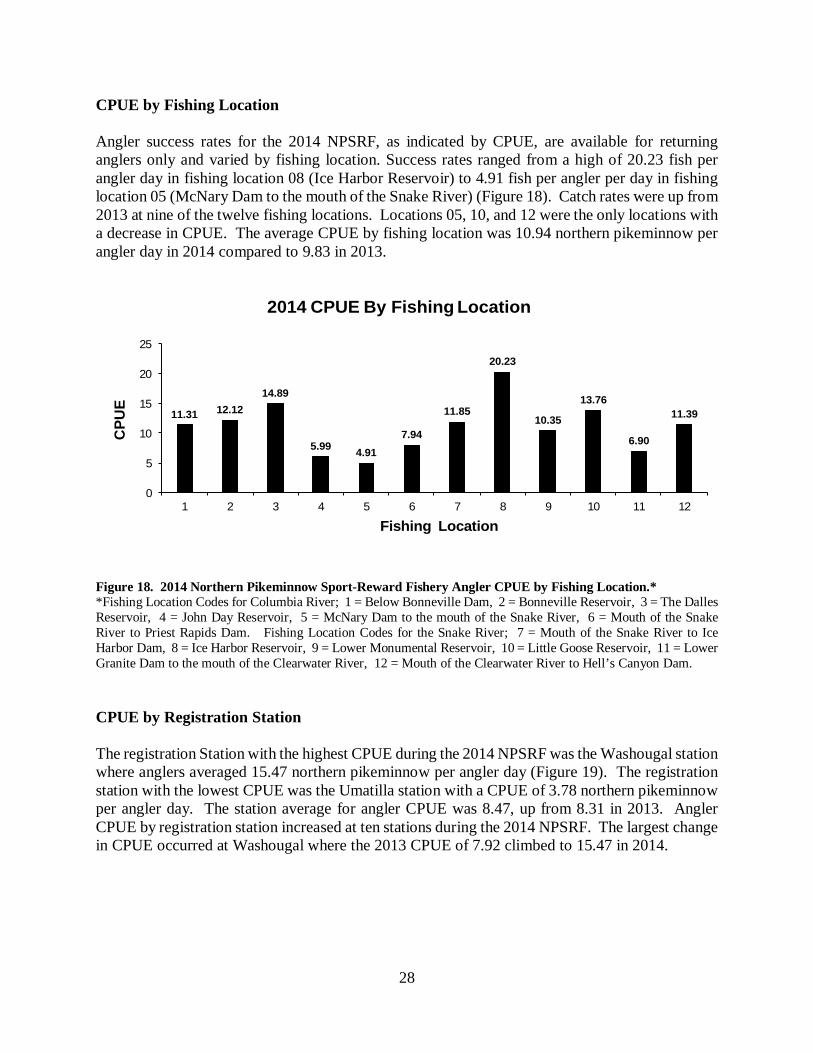
CPUE by Fishing Location Angler success rates for the 2014 NPSRF, as indicated by CPUE, are available for returning anglers only and varied by fishing location. Success rates ranged from a high of 20.23 fish per angler day in fishing location 08 (Ice Harbor Reservoir) to 4.91 fish per angler per day in fishing location 05 (McNary Dam to the mouth of the Snake River) (Figure 18). Catch rates were up from 2013 at nine of the twelve fishing locations. Locations 05, 10, and 12 were the only locations with a decrease in CPUE. The average CPUE by fishing location was 10.94 northern pikeminnow per angler day in 2014 compared to 9.83 in 2013.
Figure 18. 2014 Northern Pikeminnow Sport-Reward Fishery Angler CPUE by Fishing Location.* *Fishing Location Codes for Columbia River; 1 = Below Bonneville Dam, 2 = Bonneville Reservoir, 3 = The Dalles Reservoir, 4 = John Day Reservoir, 5 = McNary Dam to the mouth of the Snake River, 6 = Mouth of the Snake River to Priest Rapids Dam. Fishing Location Codes for the Snake River; 7 = Mouth of the Snake River to Ice Harbor Dam, 8 = Ice Harbor Reservoir, 9 = Lower Monumental Reservoir, 10 = Little Goose Reservoir, 11 = Lower Granite Dam to the mouth of the Clearwater River, 12 = Mouth of the Clearwater River to Hell’s Canyon Dam. CPUE by Registration Station The registration Station with the highest CPUE during the 2014 NPSRF was the Washougal station where anglers averaged 15.47 northern pikeminnow per angler day (Figure 19). The registration station with the lowest CPUE was the Umatilla station with a CPUE of 3.78 northern pikeminnow per angler day. The station average for angler CPUE was 8.47, up from 8.31 in 2013. Angler CPUE by registration station increased at ten stations during the 2014 NPSRF. The largest change in CPUE occurred at Washougal where the 2013 CPUE of 7.92 climbed to 15.47 in 2014.
11.31 12.1214.89
5.99 4.917.94
11.85
20.23
10.35
13.76
6.90
11.39
0
5
10
15
20
25
1 2 3 4 5 6 7 8 9 10 11 12
CPU
E
Fishing Location
2014 CPUE By Fishing Location
28
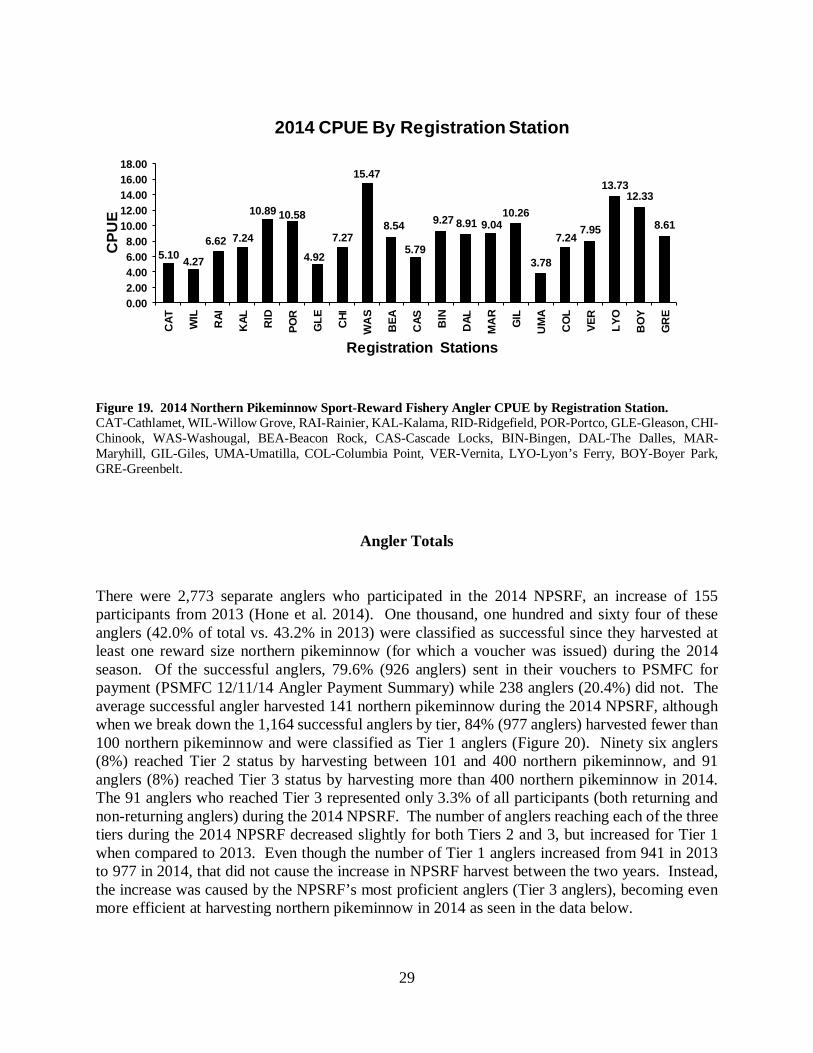
Figure 19. 2014 Northern Pikeminnow Sport-Reward Fishery Angler CPUE by Registration Station. CAT-Cathlamet, WIL-Willow Grove, RAI-Rainier, KAL-Kalama, RID-Ridgefield, POR-Portco, GLE-Gleason, CHI-Chinook, WAS-Washougal, BEA-Beacon Rock, CAS-Cascade Locks, BIN-Bingen, DAL-The Dalles, MAR-Maryhill, GIL-Giles, UMA-Umatilla, COL-Columbia Point, VER-Vernita, LYO-Lyon’s Ferry, BOY-Boyer Park, GRE-Greenbelt.
Angler Totals
There were 2,773 separate anglers who participated in the 2014 NPSRF, an increase of 155 participants from 2013 (Hone et al. 2014). One thousand, one hundred and sixty four of these anglers (42.0% of total vs. 43.2% in 2013) were classified as successful since they harvested at least one reward size northern pikeminnow (for which a voucher was issued) during the 2014 season. Of the successful anglers, 79.6% (926 anglers) sent in their vouchers to PSMFC for payment (PSMFC 12/11/14 Angler Payment Summary) while 238 anglers (20.4%) did not. The average successful angler harvested 141 northern pikeminnow during the 2014 NPSRF, although when we break down the 1,164 successful anglers by tier, 84% (977 anglers) harvested fewer than 100 northern pikeminnow and were classified as Tier 1 anglers (Figure 20). Ninety six anglers (8%) reached Tier 2 status by harvesting between 101 and 400 northern pikeminnow, and 91 anglers (8%) reached Tier 3 status by harvesting more than 400 northern pikeminnow in 2014. The 91 anglers who reached Tier 3 represented only 3.3% of all participants (both returning and non-returning anglers) during the 2014 NPSRF. The number of anglers reaching each of the three tiers during the 2014 NPSRF decreased slightly for both Tiers 2 and 3, but increased for Tier 1 when compared to 2013. Even though the number of Tier 1 anglers increased from 941 in 2013 to 977 in 2014, that did not cause the increase in NPSRF harvest between the two years. Instead, the increase was caused by the NPSRF’s most proficient anglers (Tier 3 anglers), becoming even more efficient at harvesting northern pikeminnow in 2014 as seen in the data below.
5.10 4.27
6.62 7.24
10.89 10.58
4.92
7.27
15.47
8.54
5.79
9.27 8.91 9.0410.26
3.78
7.247.95
13.7312.33
8.61
0.002.004.006.008.00
10.0012.0014.0016.0018.00
CAT WIL
RAI
KAL RID
POR
GLE CHI
WA
S
BEA
CAS BIN
DAL
MA
R
GIL
UM
A
CO
L
VER
LYO
BO
Y
GR
E
CPU
E
Registration Stations
2014 CPUE By Registration Station
29
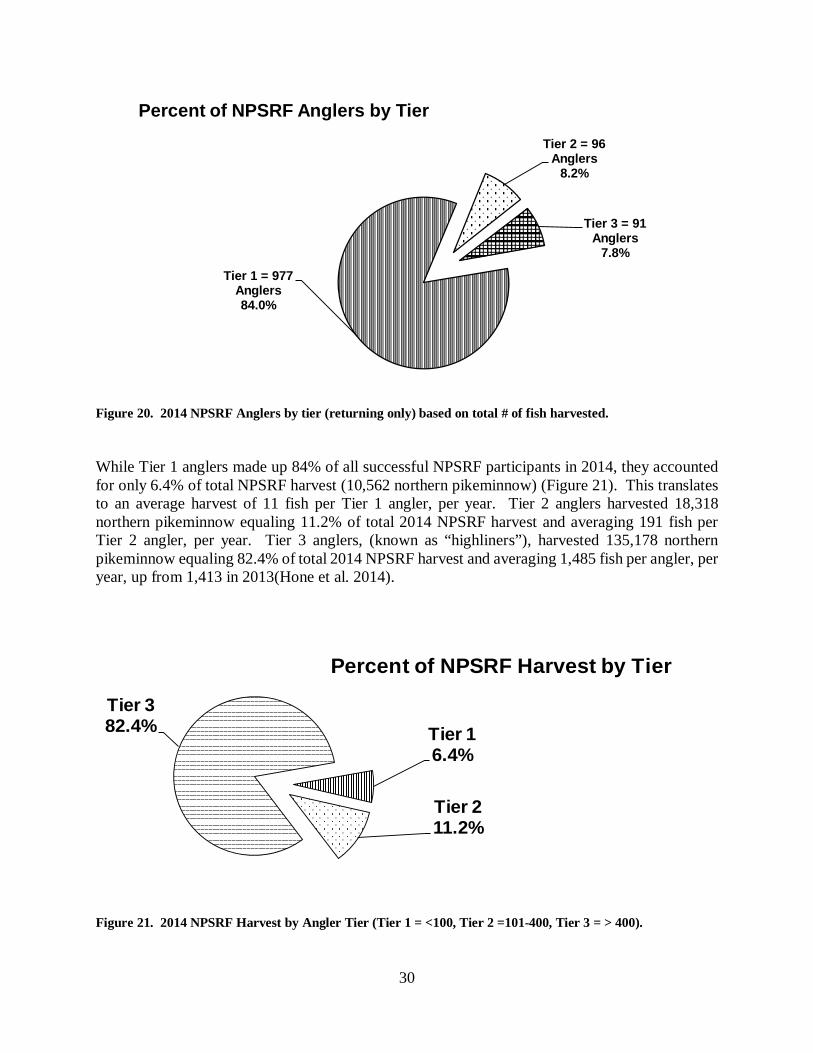
Figure 20. 2014 NPSRF Anglers by tier (returning only) based on total # of fish harvested. While Tier 1 anglers made up 84% of all successful NPSRF participants in 2014, they accounted for only 6.4% of total NPSRF harvest (10,562 northern pikeminnow) (Figure 21). This translates to an average harvest of 11 fish per Tier 1 angler, per year. Tier 2 anglers harvested 18,318 northern pikeminnow equaling 11.2% of total 2014 NPSRF harvest and averaging 191 fish per Tier 2 angler, per year. Tier 3 anglers, (known as “highliners”), harvested 135,178 northern pikeminnow equaling 82.4% of total 2014 NPSRF harvest and averaging 1,485 fish per angler, per year, up from 1,413 in 2013(Hone et al. 2014).
Figure 21. 2014 NPSRF Harvest by Angler Tier (Tier 1 = <100, Tier 2 =101-400, Tier 3 = > 400).
Tier 16.4%
Tier 2 11.2%
Tier 382.4%
Percent of NPSRF Harvest by Tier
Tier 1 = 977 Anglers84.0%
Tier 2 = 96 Anglers
8.2%
Tier 3 = 91 Anglers
7.8%
Percent of NPSRF Anglers by Tier
30
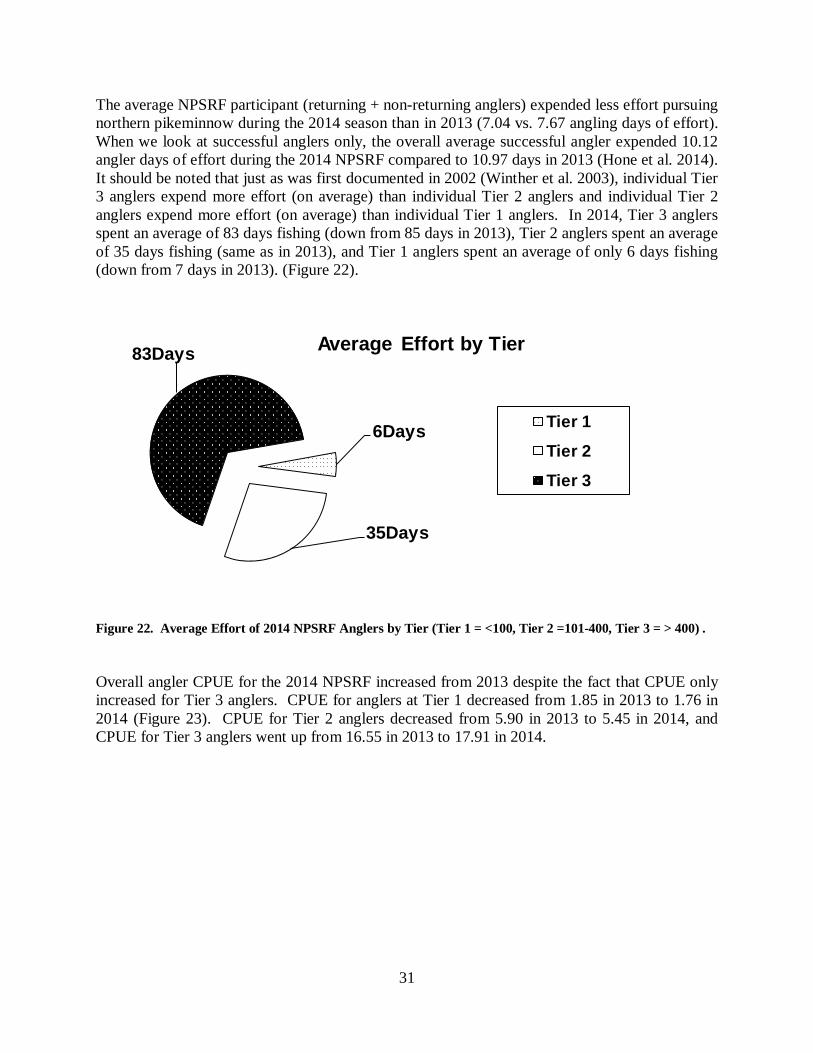
The average NPSRF participant (returning + non-returning anglers) expended less effort pursuing northern pikeminnow during the 2014 season than in 2013 (7.04 vs. 7.67 angling days of effort). When we look at successful anglers only, the overall average successful angler expended 10.12 angler days of effort during the 2014 NPSRF compared to 10.97 days in 2013 (Hone et al. 2014). It should be noted that just as was first documented in 2002 (Winther et al. 2003), individual Tier 3 anglers expend more effort (on average) than individual Tier 2 anglers and individual Tier 2 anglers expend more effort (on average) than individual Tier 1 anglers. In 2014, Tier 3 anglers spent an average of 83 days fishing (down from 85 days in 2013), Tier 2 anglers spent an average of 35 days fishing (same as in 2013), and Tier 1 anglers spent an average of only 6 days fishing (down from 7 days in 2013). (Figure 22).
Figure 22. Average Effort of 2014 NPSRF Anglers by Tier (Tier 1 = <100, Tier 2 =101-400, Tier 3 = > 400) . Overall angler CPUE for the 2014 NPSRF increased from 2013 despite the fact that CPUE only increased for Tier 3 anglers. CPUE for anglers at Tier 1 decreased from 1.85 in 2013 to 1.76 in 2014 (Figure 23). CPUE for Tier 2 anglers decreased from 5.90 in 2013 to 5.45 in 2014, and CPUE for Tier 3 anglers went up from 16.55 in 2013 to 17.91 in 2014.
6Days
35Days
83Days Average Effort by Tier
Tier 1
Tier 2
Tier 3
31
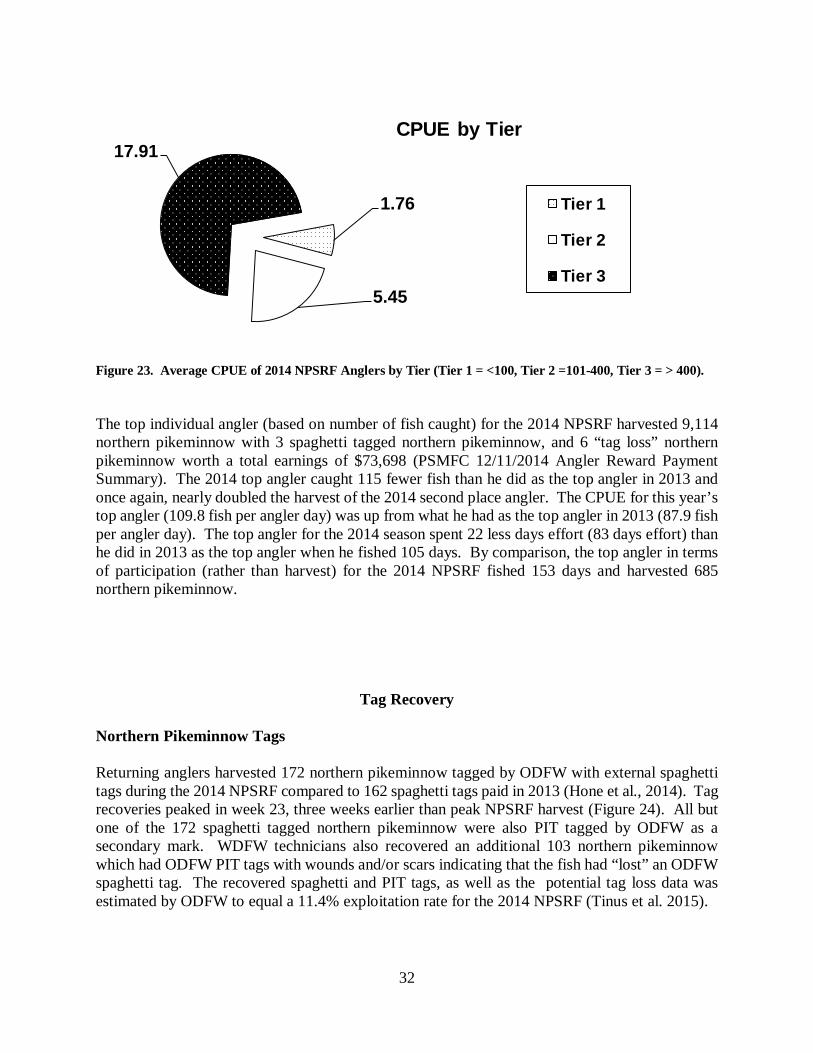
Figure 23. Average CPUE of 2014 NPSRF Anglers by Tier (Tier 1 = <100, Tier 2 =101-400, Tier 3 = > 400). The top individual angler (based on number of fish caught) for the 2014 NPSRF harvested 9,114 northern pikeminnow with 3 spaghetti tagged northern pikeminnow, and 6 “tag loss” northern pikeminnow worth a total earnings of $73,698 (PSMFC 12/11/2014 Angler Reward Payment Summary). The 2014 top angler caught 115 fewer fish than he did as the top angler in 2013 and once again, nearly doubled the harvest of the 2014 second place angler. The CPUE for this year’s top angler (109.8 fish per angler day) was up from what he had as the top angler in 2013 (87.9 fish per angler day). The top angler for the 2014 season spent 22 less days effort (83 days effort) than he did in 2013 as the top angler when he fished 105 days. By comparison, the top angler in terms of participation (rather than harvest) for the 2014 NPSRF fished 153 days and harvested 685 northern pikeminnow.
Tag Recovery Northern Pikeminnow Tags Returning anglers harvested 172 northern pikeminnow tagged by ODFW with external spaghetti tags during the 2014 NPSRF compared to 162 spaghetti tags paid in 2013 (Hone et al., 2014). Tag recoveries peaked in week 23, three weeks earlier than peak NPSRF harvest (Figure 24). All but one of the 172 spaghetti tagged northern pikeminnow were also PIT tagged by ODFW as a secondary mark. WDFW technicians also recovered an additional 103 northern pikeminnow which had ODFW PIT tags with wounds and/or scars indicating that the fish had “lost” an ODFW spaghetti tag. The recovered spaghetti and PIT tags, as well as the potential tag loss data was estimated by ODFW to equal a 11.4% exploitation rate for the 2014 NPSRF (Tinus et al. 2015).
1.76
5.45
17.91CPUE by Tier
Tier 1
Tier 2
Tier 3
32
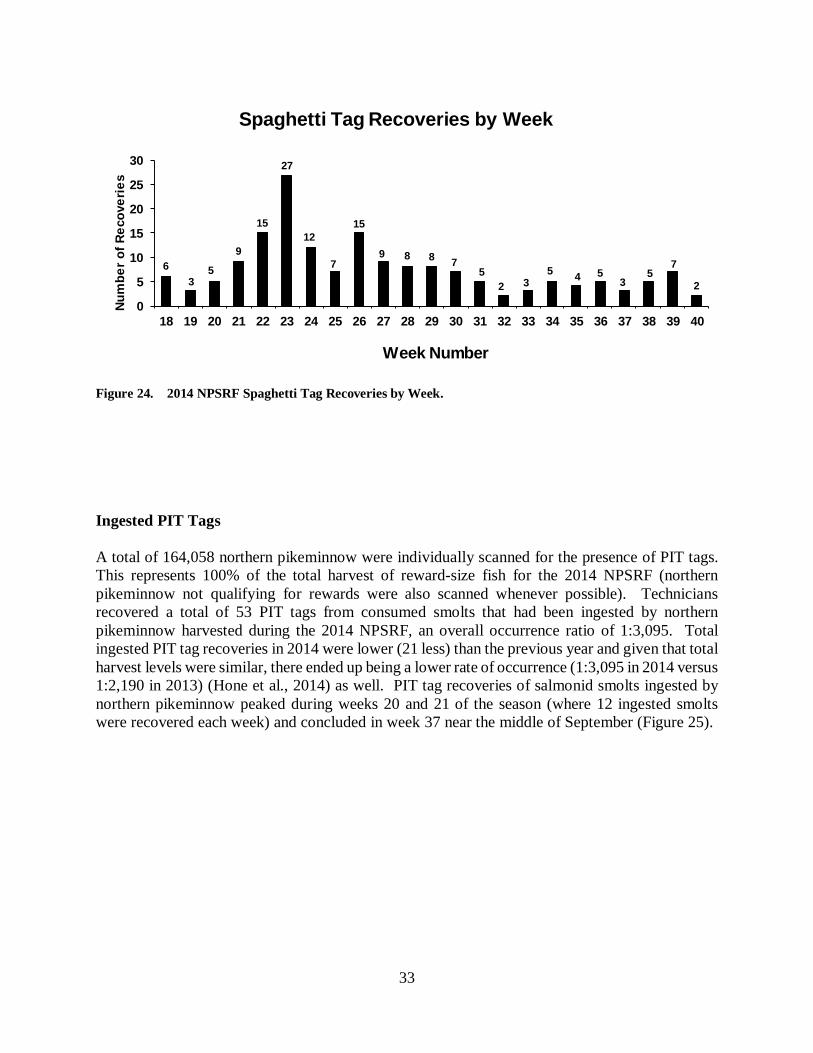
Figure 24. 2014 NPSRF Spaghetti Tag Recoveries by Week. Ingested PIT Tags A total of 164,058 northern pikeminnow were individually scanned for the presence of PIT tags. This represents 100% of the total harvest of reward-size fish for the 2014 NPSRF (northern pikeminnow not qualifying for rewards were also scanned whenever possible). Technicians recovered a total of 53 PIT tags from consumed smolts that had been ingested by northern pikeminnow harvested during the 2014 NPSRF, an overall occurrence ratio of 1:3,095. Total ingested PIT tag recoveries in 2014 were lower (21 less) than the previous year and given that total harvest levels were similar, there ended up being a lower rate of occurrence (1:3,095 in 2014 versus 1:2,190 in 2013) (Hone et al., 2014) as well. PIT tag recoveries of salmonid smolts ingested by northern pikeminnow peaked during weeks 20 and 21 of the season (where 12 ingested smolts were recovered each week) and concluded in week 37 near the middle of September (Figure 25).
63
5
9
15
27
12
7
15
9 8 8 75
2 35 4 5
35
7
2
0
5
10
15
20
25
30
18 19 20 21 22 23 24 25 26 27 28 29 30 31 32 33 34 35 36 37 38 39 40
Num
ber o
f Rec
over
ies
Week Number
Spaghetti Tag Recoveries by Week
33
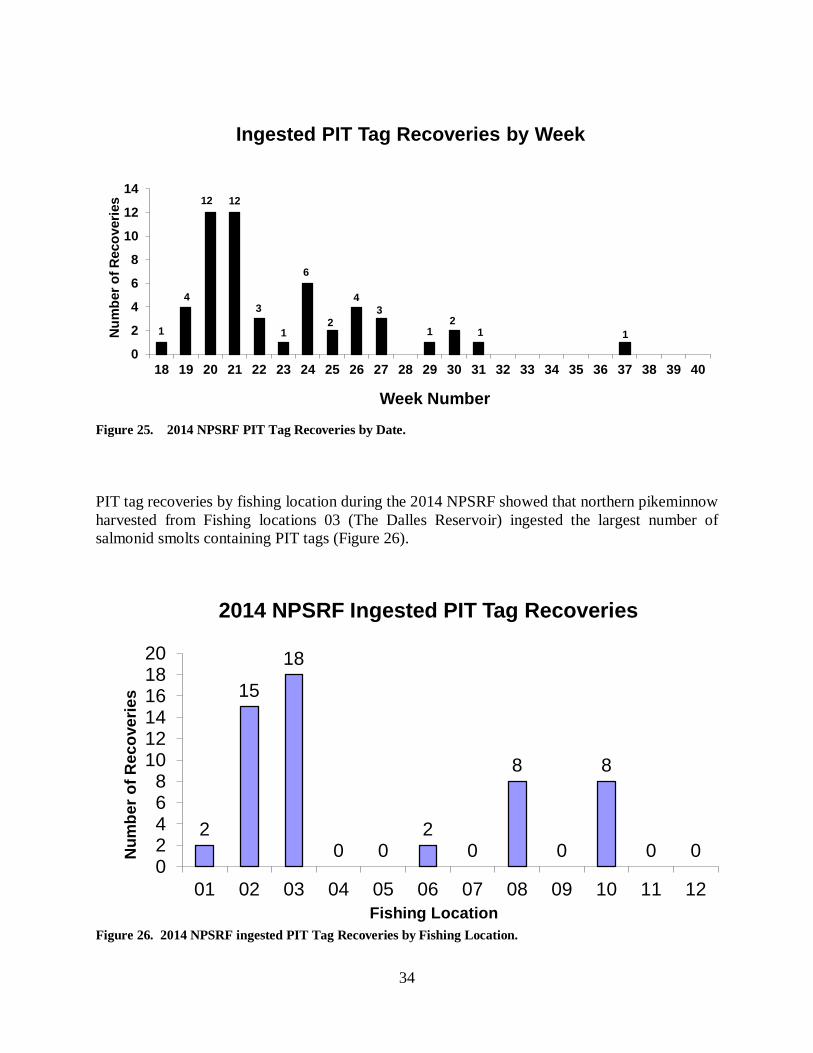
Figure 25. 2014 NPSRF PIT Tag Recoveries by Date. PIT tag recoveries by fishing location during the 2014 NPSRF showed that northern pikeminnow harvested from Fishing locations 03 (The Dalles Reservoir) ingested the largest number of salmonid smolts containing PIT tags (Figure 26).
Figure 26. 2014 NPSRF ingested PIT Tag Recoveries by Fishing Location.
1
4
12 12
3
1
6
2
43
12
1 1
0
2
4
6
8
10
12
14
18 19 20 21 22 23 24 25 26 27 28 29 30 31 32 33 34 35 36 37 38 39 40
Num
ber o
f Rec
over
ies
Week Number
Ingested PIT Tag Recoveries by Week
2
15
18
0 02
0
8
0
8
0 002468
101214161820
01 02 03 04 05 06 07 08 09 10 11 12
Num
ber o
f Rec
over
ies
Fishing Location
2014 NPSRF Ingested PIT Tag Recoveries
34
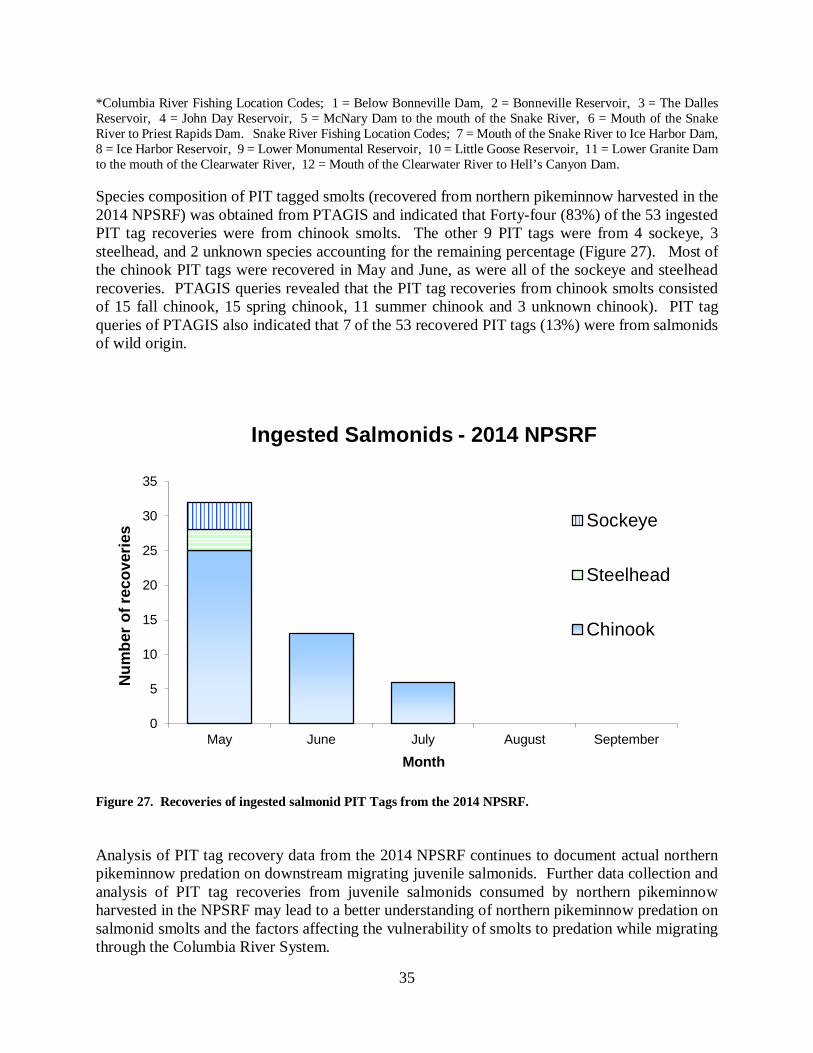
*Columbia River Fishing Location Codes; 1 = Below Bonneville Dam, 2 = Bonneville Reservoir, 3 = The Dalles Reservoir, 4 = John Day Reservoir, 5 = McNary Dam to the mouth of the Snake River, 6 = Mouth of the Snake River to Priest Rapids Dam. Snake River Fishing Location Codes; 7 = Mouth of the Snake River to Ice Harbor Dam, 8 = Ice Harbor Reservoir, 9 = Lower Monumental Reservoir, 10 = Little Goose Reservoir, 11 = Lower Granite Dam to the mouth of the Clearwater River, 12 = Mouth of the Clearwater River to Hell’s Canyon Dam. Species composition of PIT tagged smolts (recovered from northern pikeminnow harvested in the 2014 NPSRF) was obtained from PTAGIS and indicated that Forty-four (83%) of the 53 ingested PIT tag recoveries were from chinook smolts. The other 9 PIT tags were from 4 sockeye, 3 steelhead, and 2 unknown species accounting for the remaining percentage (Figure 27). Most of the chinook PIT tags were recovered in May and June, as were all of the sockeye and steelhead recoveries. PTAGIS queries revealed that the PIT tag recoveries from chinook smolts consisted of 15 fall chinook, 15 spring chinook, 11 summer chinook and 3 unknown chinook). PIT tag queries of PTAGIS also indicated that 7 of the 53 recovered PIT tags (13%) were from salmonids of wild origin.
Figure 27. Recoveries of ingested salmonid PIT Tags from the 2014 NPSRF. Analysis of PIT tag recovery data from the 2014 NPSRF continues to document actual northern pikeminnow predation on downstream migrating juvenile salmonids. Further data collection and analysis of PIT tag recoveries from juvenile salmonids consumed by northern pikeminnow harvested in the NPSRF may lead to a better understanding of northern pikeminnow predation on salmonid smolts and the factors affecting the vulnerability of smolts to predation while migrating through the Columbia River System.
0
5
10
15
20
25
30
35
May June July August September
Num
ber o
f rec
over
ies
Month
Ingested Salmonids - 2014 NPSRF
Sockeye
Steelhead
Chinook
35
SUMMARY The 2014 NPSRF succeeded in reaching the NPMP’s 10-20% exploitation goal for the seventeenth consecutive year, achieving an estimated exploitation rate of 11.4%. NPSRF harvest in 2014 was up from 2013 while effort declined, leading to an increase in overall angler CPUE. Peak weekly harvest occurred during week 26 (June 23-29) which was the same as in 2013 and corresponds to the historical 1991-2013 peak harvest week. The Dalles registration station was the SRF’s top producing station in 2014 for the fourth consecutive season with 30,042 reward sized northern pikeminnow harvested. We recovered 172 northern pikeminnow that were spaghetti tagged by ODFW, and an additional 103 northern pikeminnow which were missing spaghetti tags but retained ODFW PIT tags. Mean fork length for northern pikeminnow harvested in the 2014 NPSRF was 274.8 mm, down from 276.3 mm in 2013. Incidental catch consisted primarily of peamouth, smallmouth bass and sculpin, most of which were released. For the 2014 NPSRF, several locations stuck out as “Hot Spots” as indicated by high CPUE or harvest rates. These areas included Fishing location 08 (Ice Harbor Reservoir) on the Snake River where angler CPUE was 20.23 fish per angler day, the Washougal and the Lyon’s Ferry registration stations were angler CPUE was 15.47 and 13.73 fish per angler day respectively, and the NPSRF’s top station (The Dalles) where anglers harvested 30,042 fish. The top angler during the 2014 NPSRF caught 115 less fish than he did as the top angler in 2013 earning $73,698 in reward payments. Detection of PIT tags from juvenile salmonids ingested and retained in the gut of northern pikeminnow continues to yield valuable data about northern pikeminnow predation on juvenile salmonids. Species composition of the 53 recovered PIT tags again showed that they were primarily from Chinook smolt of hatchery origin. We also recovered a small number of PIT tags from sockeye (4), steelhead (3), and 2 of unknown origin (according to PTAGIS). We continue to consider the use of PIT tag recovery data as a way to identify and document angler fraud from northern pikeminnow tagged outside NPSRF boundaries.
36
RECOMMENDATIONS 1.) Maintain use of standardized season dates (May 1st-Sept 30th) for implementation of the 2015
NPSRF in order to enhance promotional opportunities, build angler familiarity, and ultimately to optimize removal of predatory northern pikeminnow from the NPMP program area.
2.) Continue to investigate, develop, and implement angler incentives designed to increase effort
and harvest by further incentivizing current anglers, and by recruiting new, and preferably experienced anglers to the 2015 NPSRF.
a) Review angler participation patterns and adjust NPSRF registration stations and/or times as
needed to encourage angler participation. b) Review NPSRF station times and routes for efficiencies which may allow adding additional
stations or provide additional angler opportunities for participation. c) Permanently adopt $100 tag-loss payment incentive for anglers turning in NPM retaining
verified ODFW PIT tags based on success of implementing this process on a trial basis during the of 2014.
d) Continue use of angler clinics, coupons, and sport show booths as tools to recruit new anglers
and promote NPSRF awareness. e) Investigate use of internet and social media for advertising NPSRF and for angler recruitment
and education. 3.) Review NPSRF Rules of participation as needed, adjusting to the dynamics of the fishery
and fishery participants, in order to maintain NPSRF integrity. 4.) Retain the option to extend the NPSRF season on a site-specific basis if warranted by high
harvest, angler effort, and/or CPUE levels. 5.) Continue to scan all northern pikeminnow for PIT tags from ingested juvenile
salmonids, from northern pikeminnow tagged by ODFW as part of the biological evaluation of the NPMP, and as a way to deter fraud by identifying PIT tagged northern pikeminnow coming from outside NPSRF boundaries.
6.) Survey a minimum of 20% of non-returning NPSRF anglers to record non-returning
angler catch of northern pikeminnow and all salmonids and estimate total catch and harvest of northern pikeminnow and all salmonids per NPMP protocol. Analyze and monitor this data to identify any changes in non-returning angler catch trends.
37
REFERENCES Bruce, R.C., E.C. Winther, J.D. Hone, and P.V. Dunlap. 2006. Implementation of the northern
pikeminnow sport-reward fishery in the Columbia and Snake Rivers. In Development of a system-wide predator control program: stepwise implementation of a predator index, predator control fisheries, and evaluation plan in the Columbia River Basin (Northern Pikeminnow Management Program). 2005 Annual Report, project number 90-077. Contract DE-B179-90BP07084, Bonneville Power Administration, Portland, OR.
Burley, C.C., D.C. Klaybor, G.W. Short, and G.J. Hueckel. 1992. Evaluation of the northern
squawfish sport-reward fishery in the Columbia and Snake Rivers. Report B in C.F. Willis and A.A. Nigro, editors. Development of a system-wide predator control program: stepwise implementation of a predator index, predator control fisheries, and evaluation plan in the Columbia River Basin (Northern Pikeminnow Management Program). 1991 Annual Report. Contract DE-B179 -90-BP07084, Bonneville Power Administration, Portland, Oregon.
Fox, L.G., J.J. Amren, B.G. Glaser, M.L. Wachtel, and E.C. Winther. 2000. Implementation of
the northern pikeminnow sport-reward fishery in the Columbia and Snake Rivers. In Development of a system-wide predator control program: stepwise implementation of a predator index, predator control fisheries, and evaluation plan in the Columbia River Basin (Northern Pikeminnow Management Program). 1999 Annual Report, project number 90-007. Bonneville Power Administration, Portland, Oregon.
Friesen, T.A., and D.L. Ward 1999. Management of northern pikeminnow and implications for
juvenile salmonid survival in lower Columbia and Snake Rivers. North American Journal of Fisheries Management 19:406-420.
Glaser, B.G., J.J. Amren, L.G. Fox., M.L. Wachtel, and E.C. Winther. 2001. Implementation of
the northern pikeminnow sport-reward fishery in the Columbia and Snake Rivers. In Development of a system-wide predator control program: stepwise implementation of a predator index, predator control fisheries, and evaluation plan in the Columbia River Basin (Northern Pikeminnow Management Program). 2000 Annual Report, project number 90-077. Bonneville Power Administration, Portland, Oregon.
Hankin, D.G., and J. Richards. 2000. The northern pikeminnow management program: an
independent review of program justification, performance, and cost effectiveness. Report to the Pacific Northwest Electric Power and Conservation Planning Council, Portland, Oregon.
Hisata, J.S., M.R. Peterson, D.R. Gilliland, E.C. Winther, S.S. Smith, and J. Saurez-Pena. 1996.
Implementation of the northern squawfish sport-reward fishery in the Columbia and Snake Rivers. Report A in Development of a system-wide predator control program: stepwise implementation of a predator index, predator control fisheries, and evaluation plan in the Columbia River Basin (Northern Squawfish Management Program). 1995 Annual Report,
38
project number 90-077. Contract DE-B179-90BP07084, Bonneville Power Administration, Portland, Oregon.
Hone, J.D., R.C. Bruce, J.A. Memarian, and E.C. Winther. 2005. Implementation of the northern
pikeminnow sport-reward fishery in the Columbia and Snake Rivers. In Development of a system-wide predator control program: stepwise implementation of a predator index, predator control fisheries, and evaluation plan in the Columbia River Basin (Northern Pikeminnow Management Program). 2004 Annual Report, project number 90-077. Contract DE-B179-90BP07084, Bonneville Power Administration, Portland, Oregon.
Hone, J.D., P.V. Dunlap, K.C. Moyer, and E.C. Winther. 2010. Implementation of the northern
pikeminnow sport-reward fishery in the Columbia and Snake Rivers. In Development of a system-wide predator control program: stepwise implementation of a predator index, predator control fisheries, and evaluation plan in the Columbia River Basin (Northern Pikeminnow Management Program). 2009 Annual Report, project number 90-077. Contract DE-B179-90BP07084, Bonneville Power Administration, Portland, Oregon.
Hone, J.D., E.C. Winther, and P.V. Dunlap. 2012. Implementation of the northern pikeminnow
sport-reward fishery in the Columbia and Snake Rivers. In Development of a system-wide predator control program: stepwise implementation of a predator index, predator control fisheries, and evaluation plan in the Columbia River Basin (Northern Pikeminnow Management Program). 2011 Annual Report, project number 90-077. Contract DE-B179-90BP07084, Bonneville Power Administration, Portland, Oregon.
Hone, J.D., E.C. Winther, and P.V. Dunlap. 2014. Implementation of the northern pikeminnow
sport-reward fishery in the Columbia and Snake Rivers. In Development of a system-wide predator control program: stepwise implementation of a predator index, predator control fisheries, and evaluation plan in the Columbia River Basin (Northern Pikeminnow Management Program). 2013 Annual Report, project number 90-077. Contract DE-B179-90BP07084, Bonneville Power Administration, Portland, Oregon.
Klaybor, D.C., C.C. Burley, S.S. Smith, E.N. Mattson, E.C. Winther, P.E. DuCommun, H.R.
Bartlett, and S,L. Kelsey. 1994. Evaluation of the northern squawfish sport-reward fishery in the Columbia and Snake Rivers. Report B in C.F. Willis and D. L. Ward, editors. Development of a system-wide predator control program: stepwise implementation of a predator index, predator control fisheries, and evaluation plan in the Columbia River Basin. 1993 Annual Report, Volume 1. Contract DE-B179-90BP07084, Bonneville Power Administration, Portland, Oregon.
Nelson, J. S. and five co-authors. 1998. Recommended changes in common fish names:
pikeminnow to replace squawfish. Fisheries 23(9):37. Northwest Power Planning Council. 1987a. Columbia River Basin Fish and Wildlife Program. Northwest Power Planning Council. Portland, Oregon.
PSMFC 2014 SPORT REWARD PAYMENT SUMMARY - December 11, 2014
39
Rieman, B.E., R. C. Beamsderfer, S. Vigg, and T.P. Poe. 1991. Predation by resident fish on juvenile salmonids in a mainstem Columbia reservoir: Part IV. Estimated total loss and mortality of juvenile salmonids to northern squawfish, walleye, and smallmouth bass. T. P. Poe, and B.E. Rieman editors. Resident fish predation on juvenile salmonids in John Day Reservoir, 1983-1986. Final Report (Contracts DE-A179-82 BP34796 and DE-A179-82BP35097) to Bonneville Power Administration, Portland, Oregon.
Rieman, B.E., and R.C. Beamesderfer. 1990. Dynamics of a northern squawfish population and
the potential to reduce predation on juvenile salmonids in a Columbia River reservoir. North American Journal of Fisheries Management 10:228-241.
Takata, H. K., and J. A. Koloszar. 2004. Development of a system-wide predator control program:
fisheries evaluation. Oregon Department of Fish and Wildlife, Contract Number DE-B1719-94BI24514. 2003 Annual Report to the Bonneville Power Administration, Portland, Oregon.
Tinus, E., C.M. Barr, K.J. Rybacki , E.E. Bell, C. Mallette, and A.J. Storch. 2015. System-wide
predator control program, Report C, indexing and fisheries evaluation. Oregon Department of Fish and Wildlife, Contract Number 56795. 2014 Annual Report to the Bonneville Power Administration, Portland, Oregon.
Vigg, S. and C.C. Burley. 1989. Developing a predation index and evaluating ways to reduce
salmonid losses to predation in the Columbia Basin. Report A in A.A. Nigro, editor. Developing a predation index and evaluating ways to reduce losses to predation in the Columbia Basin. Oregon Department of Fish and Wildlife, Contract Number DE-A179- 88BP92122. Annual Report to Bonneville Power Administration, Portland, Oregon.
Vigg, S., C.C. Burley, D.L. Ward, C. Mallette, S. Smith, and M. Zimmerman. 1990. Development
of a system-wide predator control program: Stepwise implementation of a predation index, predator control fisheries, and evaluation plan in the Columbia River Basin. Oregon Department of Fish and Wildlife, Contact number DE-B179-90BP07084. 1990 Annual Report to the Bonneville Power Administration, Portland, Oregon.
Winther, E.C., J.S. Hisata, M.R. Peterson, M.A. Hagen and R. C. Welling. 1997. Implementation
of the northern squawfish sport-reward fishery in the Columbia and Snake Rivers. In Development of a system-wide predator control program: stepwise implementation of a predator index, predator control fisheries, and evaluation plan in the Columbia River Basin (Northern Squawfish Management Program). 1996 Annual Report, project number 90-077. Contract DE-B179-90BP07084, Bonneville Power Administration, Portland, Oregon.
Winther, E.C., L.G. Fox, J.D. Hone, and J.A. Memarian. 2003. Implementation of the northern
squawfish sport-reward fishery in the Columbia and Snake Rivers. In Development of a system-wide predator control program: stepwise implementation of a predator index, predator control fisheries, and evaluation plan in the Columbia River Basin (Northern Squawfish Management Program). 2002 Annual Report, project number 90-077. Contract DE-B179-90BP07084, Bonneville Power Administration, Portland, Oregon.
40
Winther, E.C., J.D. Hone, P.V. Dunlap, and K.C. Moyer. 2009. Implementation of the northern
pikeminnow sport-reward fishery in the Columbia and Snake Rivers. In Development of a system-wide predator control program: stepwise implementation of a predator index, predator control fisheries, and evaluation plan in the Columbia River Basin (Northern Pikeminnow Management Program). 2008 Annual Report, project number 90-077. Contract DE-B179-90BP07084, Bonneville Power Administration, Portland, Oregon.
Winther, E.C., J.D. Hone, P.V. Dunlap, and K.C. Moyer. 2011. Implementation of the northern pikeminnow sport-reward fishery in the Columbia and Snake Rivers. In Development of a system-wide predator control program: stepwise implementation of a predator index, predator control fisheries, and evaluation plan in the Columbia River Basin (Northern Pikeminnow Management Program). 2010 Annual Report, project number 90-077. Contract DE-B179-90BP07084, Bonneville Power Administration, Portland, Oregon.
41
REPORT B
Northern Pikeminnow Sport Reward Payments – 2014
Prepared by
Steve Williams Craig Miller
Pacific States Marine Fisheries Commission 205 S.E. Spokane St. Suite 100
Portland, OR 97202
March, 2015
42
INTRODUCTION The Northern Pikeminnow Predator Control Program was administered by PSMFC in 2014. The program is a joint effort between the fishery agencies of the states of Washington and Oregon, and the Pacific States Marine Fisheries Commission (PSMFC). Washington ran the sport-reward registration/creel check stations throughout the river, handled all fish checked in to the program and conducted dam angling at John Day Dam and The Dalles Dam. Oregon provided fish tagging services, population studies, and food habit studies, as well as exploitation rate estimates. PSMFC provided technical administration, and the fiscal and contractual oversight for all segments of the Program and processed all reward vouchers for the sport-reward anglers.
CATCH AND PAYMENTS In 2014 a total of 164,058 fish were harvested in the sport-reward fishery. Of this total, 172 were tagged fish and 163,886 were untagged. Vouchers for 162,865 of the untagged fish were submitted for payment totaling rewards of $1,082,164 (not including bonus rewards). Rewards were paid at $4 for the first 100 fish caught during the season, $5 for fish in the 101-400 range, and $8 for all fish caught by an angler above 400 fish. PSMFC maintained an accounting system during the season to determine the appropriate reward amount due each angler for particular fish. A total of 1,164 anglers who registered were successful in catching one or more fish in 2013. The 2014 season ran from May 1, 2014 through September 30, 2014. Prior to the opening of the season, coupons were issued to anglers in the pikeminnow database who participated in the program within the past 5 years (2009 – 2013) and to those who signed up for our mailing list at the various sportsmen’s shows. In addition, all the newspaper ads announcing the opening of the season contained the coupon. The 2014 Coupon was worth a $10 bonus when attached to a voucher for a qualifying pikeminnow caught and turned in for the reward payment.
TAGGED FISH PAYMENTS
A total of 172 tagged fish were caught. Anglers were issued a special tag voucher for all tagged fish brought to the registration station. The tag was then sent in with the tag voucher for verification and payment of the special $500 tagged fish reward. Of this total, 172 tagged vouchers were submitted for payment. This resulted in tag reward payments of $86,000.
TAG-LOSS BONUS REWARDS
New for 2014 was the inclusion of bonus reward for tag-loss fish. A fish is considered “tag-loss” if the spaghetti tag (a mandatory qualification before a $500 tag voucher can be issued) is missing but the fish still possesses a verifiable pit tag (as all fish are scanned during initial check-in, only those with pit-tags will beep). Tag-loss fish were paid at the standard tier rate of $4, $5 or $8 in addition to a potential bonus reward (issued later) of $100. Upon verification of a tag-loss pit-tag, the angler was sent a $100 “bonus” check with a letter that included the tagging date and approximate area of release. A total of 103 tag-loss fish qualified for and were paid a bonus reward of $100. The total season tag-loss bonus totaled $10,300
43

ACCOUNTING Total payments for the season of regular vouchers, coupons, tagged fish and tag-loss rewards totaled $1,186,274. All IRS Form 1099-MISC Statements were sent to the qualifying anglers for tax purposes in the fifth week of January, 2015. Appropriate reports and copies were provided to the IRS by the end of February, 2015. A summary of the catch and rewards paid is provided in Table 1. For further information contact Steve Williams, PSMFC, Field Programs Administrator at (503) 595-3100 or email at: [email protected].
44
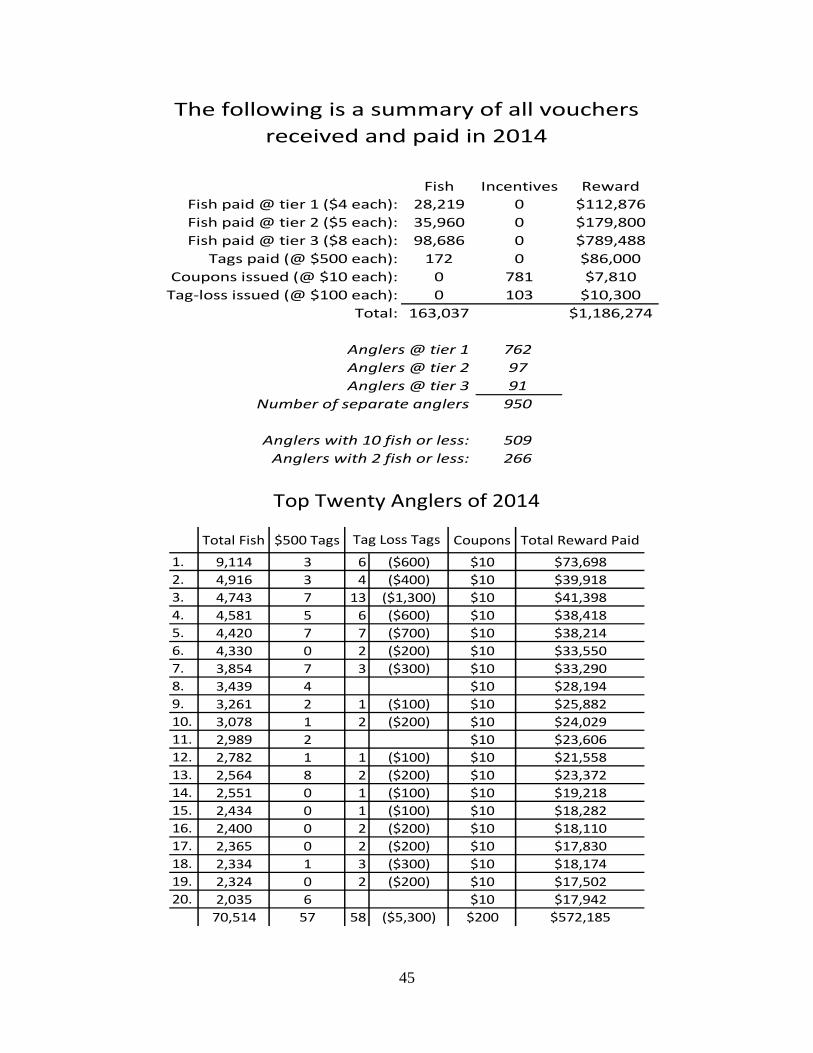
Fish Incentives RewardFish paid @ tier 1 ($4 each): 28,219 0 $112,876Fish paid @ tier 2 ($5 each): 35,960 0 $179,800Fish paid @ tier 3 ($8 each): 98,686 0 $789,488
Tags paid (@ $500 each): 172 0 $86,000Coupons issued (@ $10 each): 0 781 $7,810
Tag-loss issued (@ $100 each): 0 103 $10,300Total: 163,037 $1,186,274
Anglers @ tier 1 762Anglers @ tier 2 97Anglers @ tier 3 91
Number of separate anglers 950
Anglers with 10 fish or less: 509Anglers with 2 fish or less: 266
received and paid in 2014The following is a summary of all vouchers
Total Fish $500 Tags Coupons Total Reward Paid
1. 9,114 3 6 ($600) $10 $73,6982. 4,916 3 4 ($400) $10 $39,9183. 4,743 7 13 ($1,300) $10 $41,3984. 4,581 5 6 ($600) $10 $38,4185. 4,420 7 7 ($700) $10 $38,2146. 4,330 0 2 ($200) $10 $33,5507. 3,854 7 3 ($300) $10 $33,2908. 3,439 4 $10 $28,1949. 3,261 2 1 ($100) $10 $25,88210. 3,078 1 2 ($200) $10 $24,02911. 2,989 2 $10 $23,60612. 2,782 1 1 ($100) $10 $21,55813. 2,564 8 2 ($200) $10 $23,37214. 2,551 0 1 ($100) $10 $19,21815. 2,434 0 1 ($100) $10 $18,28216. 2,400 0 2 ($200) $10 $18,11017. 2,365 0 2 ($200) $10 $17,83018. 2,334 1 3 ($300) $10 $18,17419. 2,324 0 2 ($200) $10 $17,50220. 2,035 6 $10 $17,942
70,514 57 58 ($5,300) $200 $572,185
Tag Loss Tags
Top Twenty Anglers of 2014
45

Report C
System-wide Predator Control Program: Fisheries and Biological Evaluation
Prepared by
Eric Tinus Charles M. Barr Kevin J. Rybacki
Emma E. Bell Christine Mallette
Adam J. Storch
Oregon Department of Fish and Wildlife Columbia River Coordination Program
17330 S.E. Evelyn Street Clackamas, Oregon 97015
Funded by
U. S. Department of Energy Bonneville Power Administration
Division of Fish and Wildlife Portland, Oregon 97208-3621
Project No. 1990-077-00 Contract No. 61037
March 2015
46
SUMMARY
The Northern Pikeminnow Management Program (NPMP) comprises targeted fisheries aimed at reducing predation on juvenile Pacific salmon Oncorhynchus spp. by northern pikeminnow Ptychocheilus oregonensis in the Columbia and Snake rivers. During 2014 (1 May–30 September 2014), researchers from the Oregon Department of Fish and Wildlife evaluated the continued efficacy of the program and assessed potential consequences of the fisheries through a combination of field work and laboratory and data analyses. In the following report, we characterize: (1) exploitation rates of northern pikeminnow and the relative magnitude of predation by northern pikeminnow on juvenile salmon and steelhead (i.e., predation reduction); (2) population parameters of northern pikeminnow, smallmouth bass Micropterus dolomieu, and walleye Sander vitreus in the Columbia River downstream of Bonneville Dam and Bonneville Reservoir and 3) possible intra- and inter-specific compensatory responses to the sustained removal of northern pikeminnow.
To quantify exploitation during 2014, we tagged and released 1,465 northern pikeminnow greater than or equal to 200 mm fork length (FL) throughout the lower Columbia and Snake rivers. Of these fish, 878 were greater than or equal to 250 mm FL; the size-class used to monitor trends in system-wide exploitation and predation reduction since inception of the NPMP. System-wide exploitation of northern pikeminnow greater than or equal to 250 mm FL during the Sport Reward Fishery was 11.5% (95% confidence interval, 6.9–16.1%). Using the model of Friesen and Ward (1999), we estimated 2014 predation levels were 32% (range: 16–49%) lower than pre-program levels.
Biological evaluation of northern pikeminnow, smallmouth bass and walleye was conducted seasonally in two major areas of the Columbia River: downstream of Bonneville Dam during spring and summer and in Bonneville Reservoir during spring (high water temperatures in Bonneville Reservoir during summer months precluded sampling). Abundance index values for northern pikeminnow in the areas sampled ranged from 0.00 to 7.93, whereas estimates varied between 0.91 and 16.92 in 1990, the first year of biological evaluation. Juvenile salmon were encountered in the stomach contents of northern pikeminnow both below Bonneville Dam and in Bonneville Reservoir (�̂�𝑝 = 0.26 and �̂�𝑝 = 0.03, respectively). Across both areas, other taxa frequently encountered in northern pikeminnow diet samples included sculpins (�̂�𝑝𝑚𝑚𝑚𝑚𝑚𝑚= 0.10; Family: Cottidae), weatherfish (�̂�𝑝𝑚𝑚𝑚𝑚𝑚𝑚= 0.10; Family: Cobitidae) and other unidentified fish (�̂�𝑝𝑚𝑚𝑚𝑚𝑚𝑚= 0.13). During the spring sampling period, consumption index values ranged from 0.00 in the mid-reservoir section above Bonneville Dam to 1.31 in the tailrace area downstream of Bonneville Dam. Within a given area, time series of consumption index values from 1990 to 2014 varied considerably, displaying no obvious inter-annual trends. Like consumption index estimates, spring predation index values for northern pikeminnow were highly variable among the areas sampled, ranging from 0.00 to 2.15. While spring values showed no consistent trend across time, estimates for 2014 were appreciably lower than those from the earliest years (i.e., 1990 and 1992) of biological evaluation. Where sampling was conducted during the summer period in 2014, we were unable to calculate consumption index values – and consequently predation index values – for northern pikeminnow due to small sample size constraints. Sample size constraints also limited stock density (PSD) estimates for northern pikeminnow to areas downstream of Bonneville Dam where the value for 2014 (76%) was consistent with estimates from 1991, 2008 and 2011 (75, 80 and 75%), but higher than those calculated for the remainder
47
of years (43-64%). The time series of median relative weight (1990–2014) for male northern pikeminnow both downstream of Bonneville Dam and in Bonneville Reservoir have shown significant and increasing trends. In contrast, relative weight values for female northern pikeminnow resulted in no statistically significant monotonic trends.
As characterized by index values, spring abundance of smallmouth bass during 2014 was greatest in the mid-reservoir area of Bonneville Reservoir (10.91). Spring abundance index estimates downstream of Bonneville Dam varied spatially, with the largest value occurring between river kilometers 188 and 194 (3.16). During the 2014 summer period, in certain areas water temperatures exceeded federally assigned environmental thresholds (i.e., 18°C); thus, sampling was limited to two reaches downstream of Bonneville Dam (rkm 116–121 and rkm 188–194). In these reaches, summer abundance index values for smallmouth bass were among the lowest since the inception of biological evaluation. Sample sizes were sufficient to calculate consumption index values for only the forebay, mid-reservoir and tailrace sections of Bonneville Reservoir during spring. Estimates within these areas were relatively small and remained comparable with previous years. Sculpin (Family: Cottidae) were encountered in the diet samples of smallmouth bass most frequently in areas of the Columbia River downstream of Bonneville Dam (�̂�𝑝𝑚𝑚𝑚𝑚𝑚𝑚 = 0.27), whereas minnows (Family: Cyprinidae) occurred in the greatest number of smallmouth bass diet samples collected in Bonneville Reservoir. Proportions of smallmouth bass diet samples containing juvenile salmon ranged from 0.05 to 0.18 across all areas. Although estimation of predation index values for smallmouth bass was constrained by sample size and logistical issues, spatial trends characterized by the data available mirror those of consumption index estimates, with the largest value occurring in the mid-reservoir section of Bonneville Reservoir. Downstream of Bonneville Dam, smallmouth bass stock density was lower than in Bonneville Reservoir (PSD = 8%) and the lowest observed in the lower Columbia River since 1990. Stock density in Bonneville Reservoir during 2014 was within the range observed there since 1990. As was found for female northern pikeminnow, relative weights for smallmouth bass displayed no statistically significant temporal trend either in the Columbia River downstream of Bonneville Dam or in Bonneville Reservoir.
In 2014, walleye were encountered only in the tailrace section downstream of Bonneville Dam during summer sampling. The abundance estimate for walleye in this area approached the lower end of the time series (1990–2014). Considering the tailrace section downstream of Bonneville Dam and those areas where sampling was conducted but no walleye were encountered, there appear no obvious temporal trends; within a given area, abundance index values vary considerably in time, displaying no obvious monotonic trend. During 2014 juvenile Pacific salmon generally were encountered infrequently in gut content samples of walleye in the Columbia River downstream of Bonneville Dam (�̂�𝑝 = 0.17) whereas minnows (Family: Cyprinidae) were common (�̂�𝑝 = 0.67). The number of samples collected during 2014 precluded calculation of stock density values for walleye. Application of trend tests to walleye relative weight data in the two areas sampled in 2014 revealed no significant temporal trends.
During May through August 2014, we evaluated 489 and 363 northern pikeminnow diet samples collected during angling activities at The Dalles and John Day dams, respectively. Fish were the primary prey type consumed by northern pikeminnow captured at both dams (�̂�𝑝 = 0.44 and 0.46, respectively). Of identifiable taxa encountered in diet samples, juvenile lamprey were consumed by the greatest number of northern pikeminnow (�̂�𝑝 = 0.41-0.58). During the month of August,
48
American shad were found in a majority of samples analyzed (�̂�𝑝 = 0.56). Juvenile salmon or trout were encountered in the contents of northern pikeminnow digestive tracts during May through July, however relatively infrequently (�̂�𝑝 =0.17-0.28).
Highly variable index values for the predators considered in our study provide no obvious indication of an area-specific compensatory response to the targeted removal of northern pikeminnow. Yet, given the dynamic nature of these systems both biotic and abiotic, we encourage continued monitoring efforts to assess trends in predator populations throughout the Columbia and Snake rivers to help elucidate potential local and net (system-wide) effects.
49
INTRODUCTION
The Columbia and Snake rivers once supported large numbers of naturally produced anadromous Pacific salmon (Oncorhynchus spp.). Declines in adult returns have been attributed to many factors, including habitat degradation and overexploitation (Nehlsen et al. 1991; Wismar et al. 1994), hydroelectric and flood control activities (Raymond 1988), and predation (Rieman et al. 1991; Collis et al. 2002). The mean annual loss of juvenile salmon to predators can be equivalent to mortality associated with dam passage (Rieman et al. 1991), which has approached 30% at a single dam (Long and Ossiander 1974). The Northern Pikeminnow Management Program (NPMP) comprises multiple targeted fisheries aimed at reducing predation on juvenile salmon by northern pikeminnow Ptychocheilus oregonensis in the lower Columbia and Snake rivers (Rieman and Beamesderfer 1990; Beamesderfer et al. 1996). Prior to the implementation of these fisheries, the Oregon Department of Fish and Wildlife (ODFW) quantified baseline levels of predation by select piscivorous fishes on juvenile salmon and characterized various population-level parameters of northern pikeminnow. Abundance, consumption, and predation were estimated in Columbia River reservoirs in 1990 and 1993, Snake River reservoirs in 1991, and the lower Columbia River downstream from Bonneville Dam in 1992 (Ward et al. 1995). Since that time, researchers from ODFW have sampled northern pikeminnow populations on a regular basis in standardized areas to compare results among years when sample sizes are adequate to produce unbiased estimates (Zimmerman and Ward 1999; Zimmerman et al. 2000; Takata et al. 2007). In this report we document findings for 2014, and wherever possible, evaluate temporal changes.
Primary objectives in 2014 were to: (1) estimate rates of exploitation of northern pikeminnow and potential predation reduction resulting from the targeted removal fisheries; (2) characterize population parameters of northern pikeminnow, smallmouth bass Micropterus dolomieu and walleye Sander vitreus in the Columbia River downstream of Bonneville Dam and in Bonneville Reservoir; and (3) assess evidence of possible intra- and inter-specific compensatory responses by these predators related to the sustained removal of northern pikeminnow from the lower Columbia and Snake rivers.
50
METHODS
The ODFW-led portion of the NPMP consists of two components: (1) fishery evaluation and (2) biological evaluation (see below). For both of these components, the primary means of sampling is boat electrofishing. As in most previous years, electrofishing activities in 2014 were conducted using Smith-Root™ 18-EH model electrofishing boats equipped with a 5.0 or 7.5 GPP electrofisher powered by either a Kohler Power Systems™ or Briggs and Stratton™ gas generator. When engaged, the electrofishing unit applies pulsed DC current at a rate of 60 pulses·sec-1. Boats are configured with two boom arms extending forward from the bow. Each boom arm supports a single array composed of six electrodes. The targeted current during all electrofishing events was 3 – 4 amperes.
Fishery Evaluation and Predation Reduction
Field Procedures
To address our first objective, we tagged northern pikeminnow and estimated exploitation rates with tag recovery data from the Sport Reward Fishery. Northern pikeminnow were collected using boat electrofishing in the Columbia River from river kilometer (rkm) 76 (near Clatskanie, Oregon) upstream to rkm 637 (Priest Rapids Dam) and in the Snake River from rkm 122 (Little Goose Dam) to rkm 251 (Figure 1). Four sampling events consisting of 900 seconds of electrofishing effort were conducted within each river mile (i.e., 1.6 rkm). The efficacy of boat electrofishing tends to be limited to a maximum depth of approximately 10 feet; thus, sampling was conducted primarily along shallow shoreline areas. Sampling occurred from 3 April to 18 June 2014 between the hours of 18:00 and 5:00, except in the Hanford Reach of the Columbia River (rkm 557–637), where river safe navigation necessitated daytime sampling. A total of 6.4 rkm in the Columbia River and 16 rkm in the Snake River were not sampled due to weather-related constraints. Ideally, all tagging would be performed prior to the start of the Sport Reward and Dam Angling fisheries, but due to time constraints this was unachievable. All fish captured downstream of John Day Dam (rkm 306) were tagged prior to the start of the fisheries (1 May 2014), whereas tagging upstream of John Day Dam was performed prior to, or concomitant with, the fisheries.
We tagged, and subsequently released northern pikeminnow greater than or equal to 200 mm in fork length (FL) with uniquely numbered Floy FT-4 lock-on loop tags. Each loop tag was inserted through the pterygiophores just below the midpoint of the dorsal fin. As a secondary tagging method, all loop-tagged fish also were marked with a 134.2 MHz ISO passive integrated transponder (PIT) tag inserted into the dorsal sinus.
We worked in cooperation with the Washington Department of Fish and Wildlife (WDFW) to acquire tag recovery information from the Sport Reward and Dam Angling fisheries. The Sport Reward Fishery occurred daily between 1 May and 30 September 2014 (Dunlap et al. 2015a, this report). Participating anglers received payment for all harvested northern pikeminnow greater than or equal to 230 mm (9 in) total length (TL). This size criterion for total length corresponds approximately to the minimum fork length (i.e., 200 mm) of northern pikeminnow marked during tagging operations. The reward payment schedule consisted of three tiers (Williams 2015, this report), and anglers were eligible for a $500 reward for each loop-tagged fish that was returned to a check station.
51
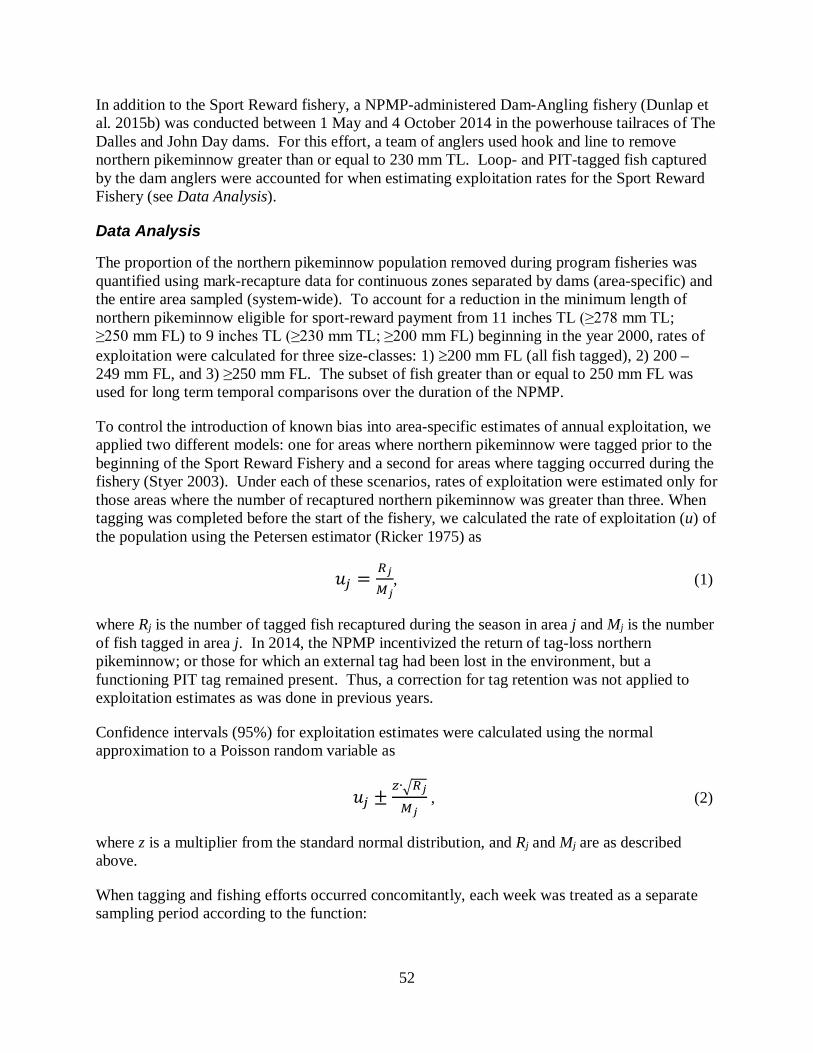
In addition to the Sport Reward fishery, a NPMP-administered Dam-Angling fishery (Dunlap et al. 2015b) was conducted between 1 May and 4 October 2014 in the powerhouse tailraces of The Dalles and John Day dams. For this effort, a team of anglers used hook and line to remove northern pikeminnow greater than or equal to 230 mm TL. Loop- and PIT-tagged fish captured by the dam anglers were accounted for when estimating exploitation rates for the Sport Reward Fishery (see Data Analysis).
Data Analysis
The proportion of the northern pikeminnow population removed during program fisheries was quantified using mark-recapture data for continuous zones separated by dams (area-specific) and the entire area sampled (system-wide). To account for a reduction in the minimum length of northern pikeminnow eligible for sport-reward payment from 11 inches TL (≥278 mm TL; ≥250 mm FL) to 9 inches TL (≥230 mm TL; ≥200 mm FL) beginning in the year 2000, rates of exploitation were calculated for three size-classes: 1) ≥200 mm FL (all fish tagged), 2) 200 – 249 mm FL, and 3) ≥250 mm FL. The subset of fish greater than or equal to 250 mm FL was used for long term temporal comparisons over the duration of the NPMP.
To control the introduction of known bias into area-specific estimates of annual exploitation, we applied two different models: one for areas where northern pikeminnow were tagged prior to the beginning of the Sport Reward Fishery and a second for areas where tagging occurred during the fishery (Styer 2003). Under each of these scenarios, rates of exploitation were estimated only for those areas where the number of recaptured northern pikeminnow was greater than three. When tagging was completed before the start of the fishery, we calculated the rate of exploitation (u) of the population using the Petersen estimator (Ricker 1975) as
𝑢𝑢𝑗𝑗 =𝑅𝑅𝑗𝑗𝑀𝑀𝑗𝑗
, (1)
where Rj is the number of tagged fish recaptured during the season in area j and Mj is the number of fish tagged in area j. In 2014, the NPMP incentivized the return of tag-loss northern pikeminnow; or those for which an external tag had been lost in the environment, but a functioning PIT tag remained present. Thus, a correction for tag retention was not applied to exploitation estimates as was done in previous years.
Confidence intervals (95%) for exploitation estimates were calculated using the normal approximation to a Poisson random variable as
𝑢𝑢𝑗𝑗 ±𝑧𝑧∙�𝑅𝑅𝑗𝑗𝑀𝑀𝑗𝑗
, (2)
where z is a multiplier from the standard normal distribution, and Rj and Mj are as described above.
When tagging and fishing efforts occurred concomitantly, each week was treated as a separate sampling period according to the function:
52
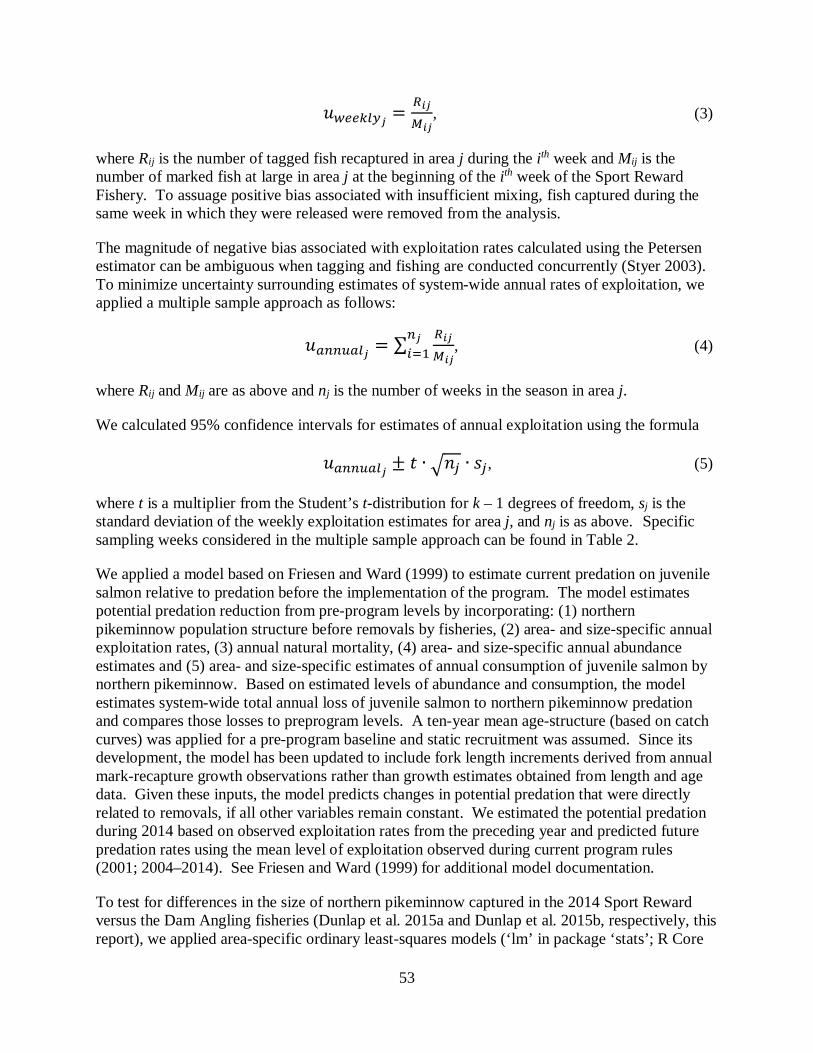
𝑢𝑢𝑤𝑤𝑤𝑤𝑤𝑤𝑤𝑤𝑤𝑤𝑤𝑤𝑗𝑗 =𝑅𝑅𝑖𝑖𝑗𝑗𝑀𝑀𝑖𝑖𝑗𝑗
, (3)
where Rij is the number of tagged fish recaptured in area j during the ith week and Mij is the number of marked fish at large in area j at the beginning of the ith week of the Sport Reward Fishery. To assuage positive bias associated with insufficient mixing, fish captured during the same week in which they were released were removed from the analysis.
The magnitude of negative bias associated with exploitation rates calculated using the Petersen estimator can be ambiguous when tagging and fishing are conducted concurrently (Styer 2003). To minimize uncertainty surrounding estimates of system-wide annual rates of exploitation, we applied a multiple sample approach as follows:
𝑢𝑢𝑚𝑚𝑎𝑎𝑎𝑎𝑎𝑎𝑚𝑚𝑤𝑤𝑗𝑗 = ∑ 𝑅𝑅𝑖𝑖𝑗𝑗𝑀𝑀𝑖𝑖𝑗𝑗
𝑎𝑎𝑗𝑗𝑖𝑖=1 , (4)
where Rij and Mij are as above and nj is the number of weeks in the season in area j.
We calculated 95% confidence intervals for estimates of annual exploitation using the formula
𝑢𝑢𝑚𝑚𝑎𝑎𝑎𝑎𝑎𝑎𝑚𝑚𝑤𝑤𝑗𝑗 ± 𝑡𝑡 ∙ �𝑛𝑛𝑗𝑗 ∙ 𝑠𝑠𝑗𝑗, (5)
where t is a multiplier from the Student’s t-distribution for k – 1 degrees of freedom, sj is the standard deviation of the weekly exploitation estimates for area j, and nj is as above. Specific sampling weeks considered in the multiple sample approach can be found in Table 2.
We applied a model based on Friesen and Ward (1999) to estimate current predation on juvenile salmon relative to predation before the implementation of the program. The model estimates potential predation reduction from pre-program levels by incorporating: (1) northern pikeminnow population structure before removals by fisheries, (2) area- and size-specific annual exploitation rates, (3) annual natural mortality, (4) area- and size-specific annual abundance estimates and (5) area- and size-specific estimates of annual consumption of juvenile salmon by northern pikeminnow. Based on estimated levels of abundance and consumption, the model estimates system-wide total annual loss of juvenile salmon to northern pikeminnow predation and compares those losses to preprogram levels. A ten-year mean age-structure (based on catch curves) was applied for a pre-program baseline and static recruitment was assumed. Since its development, the model has been updated to include fork length increments derived from annual mark-recapture growth observations rather than growth estimates obtained from length and age data. Given these inputs, the model predicts changes in potential predation that were directly related to removals, if all other variables remain constant. We estimated the potential predation during 2014 based on observed exploitation rates from the preceding year and predicted future predation rates using the mean level of exploitation observed during current program rules (2001; 2004–2014). See Friesen and Ward (1999) for additional model documentation.
To test for differences in the size of northern pikeminnow captured in the 2014 Sport Reward versus the Dam Angling fisheries (Dunlap et al. 2015a and Dunlap et al. 2015b, respectively, this report), we applied area-specific ordinary least-squares models (‘lm’ in package ‘stats’; R Core
53
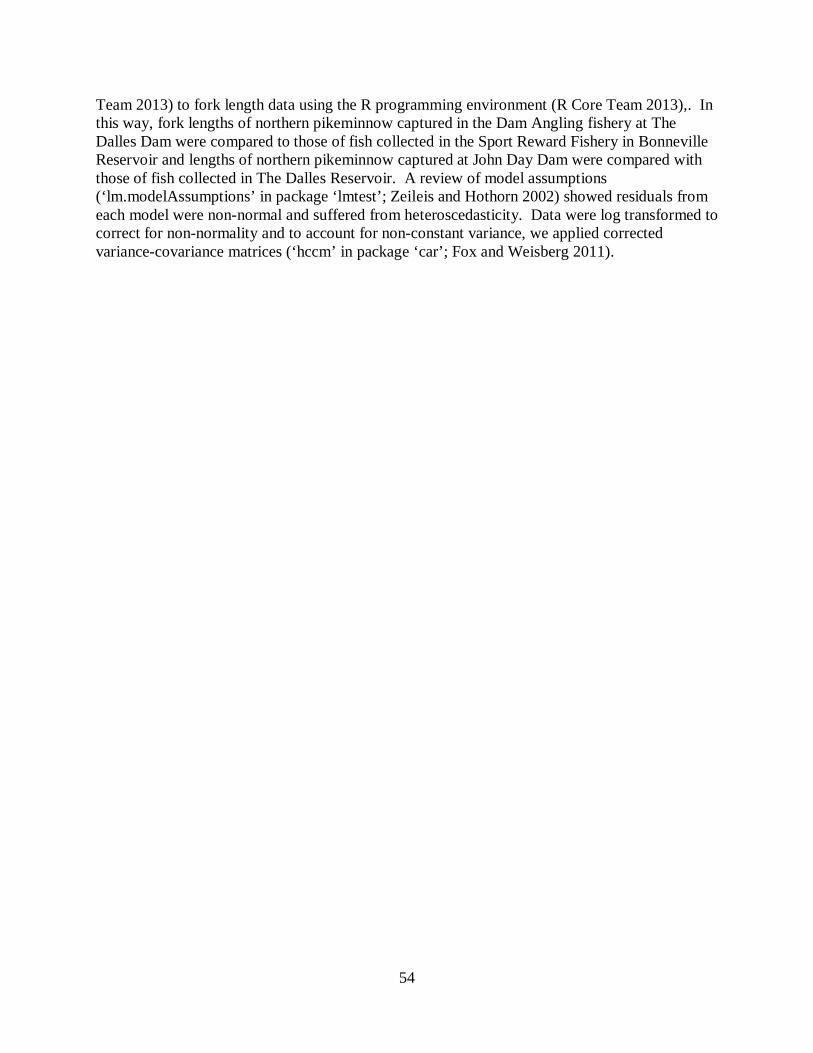
Team 2013) to fork length data using the R programming environment (R Core Team 2013),. In this way, fork lengths of northern pikeminnow captured in the Dam Angling fishery at The Dalles Dam were compared to those of fish collected in the Sport Reward Fishery in Bonneville Reservoir and lengths of northern pikeminnow captured at John Day Dam were compared with those of fish collected in The Dalles Reservoir. A review of model assumptions (‘lm.modelAssumptions’ in package ‘lmtest’; Zeileis and Hothorn 2002) showed residuals from each model were non-normal and suffered from heteroscedasticity. Data were log transformed to correct for non-normality and to account for non-constant variance, we applied corrected variance-covariance matrices (‘hccm’ in package ‘car’; Fox and Weisberg 2011).
54
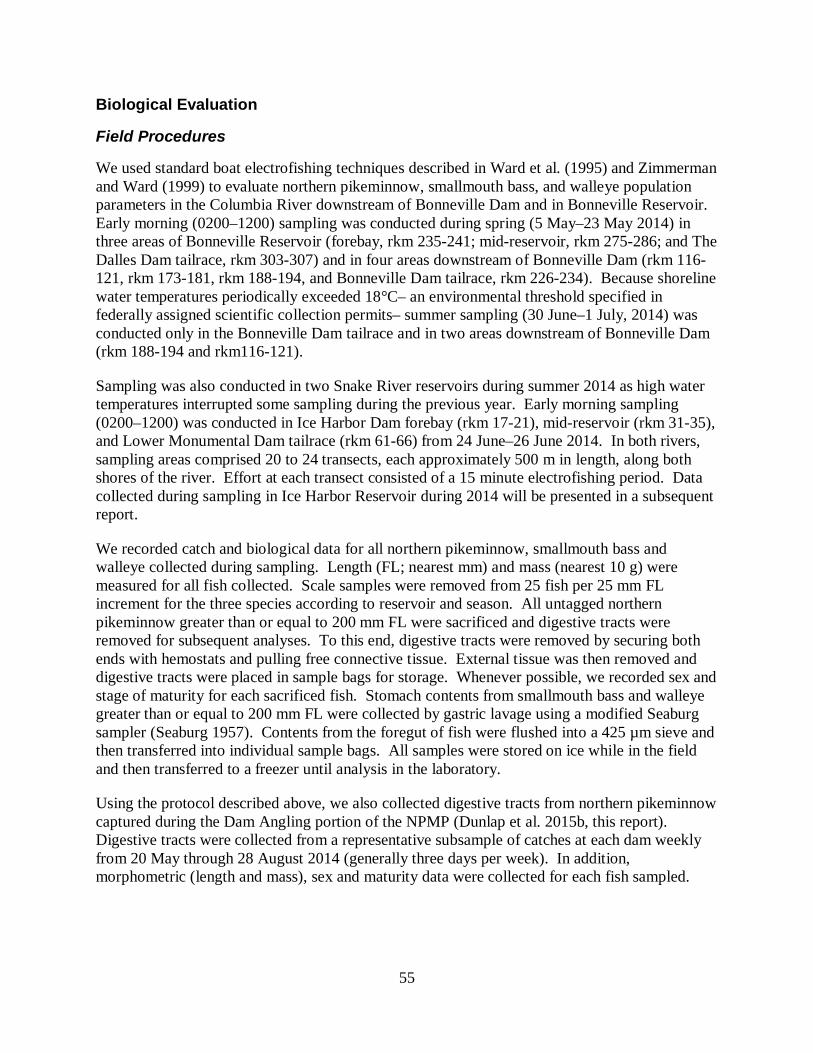
Biological Evaluation
Field Procedures
We used standard boat electrofishing techniques described in Ward et al. (1995) and Zimmerman and Ward (1999) to evaluate northern pikeminnow, smallmouth bass, and walleye population parameters in the Columbia River downstream of Bonneville Dam and in Bonneville Reservoir. Early morning (0200–1200) sampling was conducted during spring (5 May–23 May 2014) in three areas of Bonneville Reservoir (forebay, rkm 235-241; mid-reservoir, rkm 275-286; and The Dalles Dam tailrace, rkm 303-307) and in four areas downstream of Bonneville Dam (rkm 116-121, rkm 173-181, rkm 188-194, and Bonneville Dam tailrace, rkm 226-234). Because shoreline water temperatures periodically exceeded 18°C– an environmental threshold specified in federally assigned scientific collection permits– summer sampling (30 June–1 July, 2014) was conducted only in the Bonneville Dam tailrace and in two areas downstream of Bonneville Dam (rkm 188-194 and rkm116-121).
Sampling was also conducted in two Snake River reservoirs during summer 2014 as high water temperatures interrupted some sampling during the previous year. Early morning sampling (0200–1200) was conducted in Ice Harbor Dam forebay (rkm 17-21), mid-reservoir (rkm 31-35), and Lower Monumental Dam tailrace (rkm 61-66) from 24 June–26 June 2014. In both rivers, sampling areas comprised 20 to 24 transects, each approximately 500 m in length, along both shores of the river. Effort at each transect consisted of a 15 minute electrofishing period. Data collected during sampling in Ice Harbor Reservoir during 2014 will be presented in a subsequent report.
We recorded catch and biological data for all northern pikeminnow, smallmouth bass and walleye collected during sampling. Length (FL; nearest mm) and mass (nearest 10 g) were measured for all fish collected. Scale samples were removed from 25 fish per 25 mm FL increment for the three species according to reservoir and season. All untagged northern pikeminnow greater than or equal to 200 mm FL were sacrificed and digestive tracts were removed for subsequent analyses. To this end, digestive tracts were removed by securing both ends with hemostats and pulling free connective tissue. External tissue was then removed and digestive tracts were placed in sample bags for storage. Whenever possible, we recorded sex and stage of maturity for each sacrificed fish. Stomach contents from smallmouth bass and walleye greater than or equal to 200 mm FL were collected by gastric lavage using a modified Seaburg sampler (Seaburg 1957). Contents from the foregut of fish were flushed into a 425 µm sieve and then transferred into individual sample bags. All samples were stored on ice while in the field and then transferred to a freezer until analysis in the laboratory.
Using the protocol described above, we also collected digestive tracts from northern pikeminnow captured during the Dam Angling portion of the NPMP (Dunlap et al. 2015b, this report). Digestive tracts were collected from a representative subsample of catches at each dam weekly from 20 May through 28 August 2014 (generally three days per week). In addition, morphometric (length and mass), sex and maturity data were collected for each fish sampled.
55
Laboratory Procedures
We examined the contents of digestive tracts from northern pikeminnow, smallmouth bass, and walleye collected during biological evaluation of the Sport Reward Fishery and northern pikeminnow collected during the Dam Angling Fishery to quantify relative consumption of juvenile salmon. Each sample was thawed in the laboratory and the contents sorted into general prey categories (i.e., fish, crayfish, other crustaceans, mollusks, insects, and vegetation). Material was weighed (blotted wet mass) to the nearest 0.01 g according to prey category. Stomach contents were then returned to the original sample bags. To digest soft tissues, a solution of pancreatin and sodium sulfide nonahydrate (Na2O9S) – mixed at 20 g and 10 g per liter of tap water, respectively – was added to each sample. Sample bags were then sealed and placed in a desiccating oven at approximately 48°C for 24 hours. After removal from the oven, a solution of sodium hydroxide (30g NaOH·1 l H2O-1) was added to samples to dissolve remaining fatty materials. Contents of each bag were then poured into a 425 µm sieve and rinsed with tap water. The remaining bones were identified to the lowest possible taxon using diagnostic bone keys (Hansel et al. 1988, Frost 2000, and Parrish et al. 2006) under a dissecting microscope.
Data Analysis
Following the methods of Ward et al. (1995), we calculated seasonal abundance index values for each predator species by multiplying catch per unit of effort (CPUE; fish·900 second electrofishing run-1) by the surface area (ha) of specific sampling locations in each river reach or reservoir area. We then applied the models of Ward et al. (1995) and Ward and Zimmerman (1999) to calculate consumption index values for northern pikeminnow (CINPM) and smallmouth bass (CISMB) as follows:
CINPM = 0.0209 . T1.60 . W0.27 . (S . GW-0.61), (6)
and
CISMB = 0.0407 . e(0.15)(T) . W0.23 . (S . GW-0.29), (7)
where
T = mean water temperature per season-area stratum (oC), W = mean predator mass (g), S = mean number of juvenile salmon per predator, and GW = mean gut mass (g) per predator.
These consumption indices do not provide direct estimates of the number of juvenile salmon eaten per day by an average predator; however, output values have been shown to be correlated with consumption rates of northern pikeminnow (Ward et al. 1995) and smallmouth bass (Ward and Zimmerman 1999).
We used the product of seasonal abundance and consumption index values to generate period- and location-specific predation index estimates for northern pikeminnow and smallmouth bass.
56
Rates of exploitation of northern pikeminnow are believed to increase with increasing fish size (Zimmerman et al. 1995). Thus, sustained fisheries should decrease the abundance of larger fish in the population. With this in mind, we applied a model describing proportional stock density (PSDi; Anderson 1980) to characterize variation in size structure for northern pikeminnow, smallmouth bass, and walleye populations as follows:
PSDi = 100∙(FQi/FSi), (8)
where
FQi = number of fish ≥ quality length for species i, and FSi = number of fish ≥ stock length for species i
Where possible, we also calculated relative stock density (RSD-Pi) for smallmouth bass and walleye (Gabelhouse 1984) using the equation
RSD-Pi = 100∙(FPi/FSi), (9)
Where
FPi = number of fish ≥ preferred length for species i, and FSi = number of fish ≥ stock length for species i
Stock and quality minimum length categories used for northern pikeminnow were 250 and 380 mm FL, respectively (Beamesderfer and Rieman 1988; Parker et al. 1995). For smallmouth bass, stock, quality, and preferred minimum length categories were 180, 280, and 350 mm TL, respectively and for walleye, 250, 380, and 510 mm TL, respectively (Willis et al. 1985). These minimum length categories were converted to fork length using species-specific models (smallmouth bass: TLSMB = FLSMB∙1.040; walleye: TLWAL = FLWAL∙1.060) as lengths were recorded as FL during sampling to support the biological evaluation.
Like shifts in size-structure, changes in body condition may indicate a response by remaining predators to the sustained exploitation of pikeminnow. We used relative weight (Wr; Anderson and Neumann 1996) to compare the condition of northern pikeminnow, smallmouth bass, and walleye in 2014 with previous years. Length-specific standard weights predicted by a length-mass regression model (log10(Ws)=a′+b∙log10(L)), for northern pikeminnow (Parker et al. 1995), smallmouth bass (Kolander et al. 1993), and walleye (Murphy et al. 1990) were used to calculate relative weight according to the equation
𝑊𝑊𝑟𝑟 = 100 ∗ 𝑊𝑊𝑊𝑊𝑠𝑠
, (10)
where W is the mass of an individual fish and Ws is predicted standard weight. To account for potential sexual dimorphism, we calculated Wr values separately for male and female northern pikeminnow. Because sampling methodologies precluded diagnosis of sex for smallmouth bass and walleye in the field, we did not differentiate among sexes when calculating Wr for these species. Temporal trends in median Wr for northern pikeminnow, smallmouth bass and walleye were assessed by applying a non-parametric Mann-Kendall test (Mann 1945) wherever possible
57
for the Columbia River downstream of Bonneville Dam and Bonneville Reservoir. To diagnose potential serial dependence among median Wr data, we reviewed autocorrelation functions (acf) and partial autocorrelation functions (pacf) applied to time series objects. If autocorrelation was found to be meaningful, trends were evaluated using a block bootstrap technique (Davidson and Hinkley 1997; McLeod 2011) after applying spline interpolation to account for data gaps. Otherwise, traditional Mann-Kendall tests were conducted. Lastly, to visualize trends, we fit LOWESS (locally weighted scatterplot smoothing) curves to the data. All analyses were conducted in the R programming environment using the ‘Kendall’ (McLeod 2011) and, where necessary, the ‘boot’ (Fox and Weisberg 2011) packages. Tests were considered significant at α = 0.05.
58
RESULTS
Sport Reward Fishery Evaluation and Predation Estimates
We tagged and released 1,464 northern pikeminnow greater than or equal to 200 mm FL throughout the lower Columbia and Snake rivers during 2014, of which 877 were greater than or equal to 250 mm FL (Table 1). One-hundred fourteen northern pikeminnow tagged in 2014 were recaptured during the Sport Reward Fishery; no tagged northern pikeminnow were recaptured during dam angling activities. Fish tagged in 2014 that were subsequently recaptured in the Sport Reward Fishery were at large from 2 to 157 days (mean = 59 ± 46 days s.d.). Sport Reward Fishery recaptures greater than or equal to 250 mm FL accounted for 79% of all 2014 tag recoveries (Table 1). The median fork length of the Sport Reward Fishery catch was 261mm FL (E.C. Winther, WDFW, personal communication).
System-wide exploitation of northern pikeminnow greater than or equal to 200 mm FL during the Sport Reward Fishery was 9.0% (95% confidence interval 5.0–13.0%; Tables 2 and 3). Tag returns were sufficient (n ≥ 4) to calculate area-specific exploitation estimates for all areas except John Day Reservoir. Area-specific exploitation rates ranged from 3.7 to 11.3% across the other reservoirs sampled (Table 3). For northern pikeminnow within the 200–249 mm FL size class, system-wide exploitation was estimated to be 5.3% for the Sport Reward Fishery (95% confidence interval 1.0–9.6%). Area-specific rates of exploitation could be estimated only for the Columbia River downstream of Bonneville Dam and McNary and Little Goose reservoirs (3.0, 3.7, and 11.0%, respectively; Table 4). The system-wide exploitation rate for northern pikeminnow ≥250 mm FL exceeded those of the other size classes (11.5%, 95% confidence interval 6.9–16.1%; Figure 2; Table 5). Area-specific exploitation rates of those fish ≥250 mm FL were: 9.2% for the Columbia River downstream of Bonneville Dam, 6.9% for Bonneville Reservoir, 17.9% for McNary Reservoir, and 11.3% in Lower Granite Reservoir (Table 5).
Model-predicted reduction in predation on juvenile salmonids by northern pikeminnow relative to pre-program levels for 2014 was 32% (range: 16–49%; Figure 3). Model projections based on the current fishery and population structure suggest predation on juvenile salmon by northern pikeminnow may remain relatively consistent through 2018.
Biological Evaluation
We conducted a total of 204 electrofishing runs in sampling areas to collect fish for biological evaluation (Table 6). Spring and summer sampling generally coincided with the peak of juvenile salmon and steelhead out-migration as evinced by passage through Bonneville Dam (Figure 4). Across all sample sites, spring CPUE ranged from 0.00 to 0.83 fish·run-1 for northern pikeminnow, 0.00 to 2.97 fish·run-1 for smallmouth bass, and 0.00 to 0.21 fish·run-1 for walleye (Table 7). Summer CPUE was 0.17 to 0.21 fish·run-1 for northern pikeminnow and 0.00 and 0.33 fish·run-1 for smallmouth bass in the two areas sampled downstream of Bonneville Dam. No walleye were encountered during summer sampling. Across areas, catch rates for northern pikeminnow were the greatest in the area between rkm 116 and 121 downstream of Bonneville Dam during both spring and summer sampling periods. For smallmouth bass, CPUE was highest in the tailrace area of Bonneville Reservoir during spring sampling. Walleye were encountered only in the tailrace area of Bonneville Reservoir during the spring 2014, where CPUE was similar to both northern pikeminnow and smallmouth bass (Table 7).
59
Abundance index values calculated for northern pikeminnow in 2014 ranged from 0.00 to 7.93 in the Columbia River downstream of Bonneville Dam and 0.03 to 1.41 in Bonneville Reservoir. Across all sites, abundance index values continue to remain lower than those calculated during years in which sampling was first conducted and in five of the eight areas sampled during 2014, estimates were the lowest to date (Table 8).
Across all areas sampled during 2014, smallmouth bass abundance index values were greatest in the mid-reservoir area of Bonneville Reservoir and lowest in the reach between rkm 116 and 121 downstream of Bonneville Dam during spring. Within reservoirs and across seasons, smallmouth bass abundance index values displayed no discernible monotonic trend (Table 9).
Walleye were encountered only in the tailrace section of Bonneville Dam, where the 2014 abundance index estimate was comparable to previous years. In general, area-specific abundance estimates show relatively little temporal variability. That is, when walleye were encountered during sampling, abundance index values remain consistently low, particularly when compared with estimates for northern pikeminnow and smallmouth bass (Table 10).
We examined the digestive tracts of 63 northern pikeminnow captured in the Columbia River downstream of Bonneville Dam (n=31) and Bonneville Reservoir (n=32) to characterize consumption. Across reservoirs/reaches and seasons, a majority of the digestive tracts examined contained food items (range = 0.59–0.83). During the summer season, the proportion of northern pikeminnow digestive tracts containing fish was less than that of spring (�̂�𝑝 = 0.50 and 0.60, respectively). Stomach samples from fish collected both in the Columbia River downstream of Bonneville Dam and Bonneville Reservoir contained juvenile salmon (Table 11). When prey fish could be identified, salmon were encountered most often in samples collected from the Columbia River downstream of Bonneville Dam during spring sampling (�̂�𝑝 = 0.28). Across seasons, in Bonneville Reservoir and the Columbia River downstream of Bonneville Dam, unidentified fishes (�̂�𝑝 = 0.13) and members of the family Salmonidae (�̂�𝑝 = 0.26), respectively, were encountered in the greatest number of gut content samples (Table 12). The number of fish prey taxa observed in gut contents was greater downstream of Bonneville Dam than in Bonneville Reservoir.
During the spring and summer of 2014, we collected 165 and 3 smallmouth bass diet samples, respectively; large proportions of which contained prey items (range: 0.67–1.00). Across sampling areas and seasons, relatively large proportions of smallmouth bass diets samples contained fish (range = 0.54–0.67). The proportions of smallmouth bass stomach samples containing salmon generally were low, with the largest proportion occurring in the Columbia River downstream of Bonneville Dam during summer (�̂�𝑝 = 0.33; Table 11). In Bonneville Reservoir, minnows (Family: Cyprinidae) were encountered in the greatest number of diet samples (�̂�𝑝 = 0.13), followed by sculpin (�̂�𝑝 = 0.10; Family: Cottidae) and unidentified fishes (�̂�𝑝 = 0.10). In the Columbia River downstream of Bonneville Dam, sculpins (�̂�𝑝 = 0.27) were encountered most frequently in gut content samples followed by salmonids (�̂�𝑝 = 0.18; Table 12). The number of fish prey taxa observed was greater in Bonneville Reservoir than downstream of Bonneville Dam.
We collected six walleye diet samples from the Columbia River downstream of Bonneville Dam during the spring of 2014, all of which contained prey items (Table 11). No walleye were
60
encountered in Bonneville Reservoir during spring or the Columbia River downstream of Bonneville Dam during summer sampling. All samples examined contained food items and a similarly large proportion contained fish material (�̂�𝑝 = 0.83). Members of the family Cyprinidae were encountered in a relatively large proportion of walleye diet samples collected in the Columbia River downstream of Bonneville Dam (�̂�𝑝 = 0.67), whereas prey fishes belonging to Salmonidae and Percopsidae were observed in a smaller number of samples (0.17 each; Table 12).
Consumption and predation indices were evaluated (i.e., n ≥ 6) for northern pikeminnow in the Columbia River downstream of Bonneville Dam and Bonneville Reservoir during spring only. Consumption index values during the spring period ranged from 0.00 in the mid-reservoir section above Bonneville Dam to 1.31 in the tailrace area downstream of Bonneville Dam. These estimates fell well within the range of values calculated for previous years. Within a given area, consumption index values varied temporally, displaying no obvious trend (Table 13). Like consumption index estimates, spring predation index values for northern pikeminnow varied among the areas sampled (range = 0.00 to 2.15). While spring values showed no consistent trend across time, estimates for 2014 were appreciably lower than those from the earliest years (i.e., 1990 and 1992) of biological evaluation (Table 14).
Where estimable, consumption index values for smallmouth bass varied relatively little among areas or seasons (range: 0.00 – 0.06). The largest consumption index value for smallmouth bass occurred in the mid-reservoir area of Bonneville Reservoir (Table 15). Although estimation of predation index values for smallmouth bass was constrained by sample size and logistical issues, spatial trends characterized by the few data that are available mirror those of consumption index estimates, with the largest value occurring in the mid-reservoir section of Bonneville Reservoir (Table 16).
As occurred in the 2010 biological evaluation, we were unable to calculate PSD for northern pikeminnow or PSD and RSP-P for walleye in most of the areas sampled during 2014 due to limited sample sizes (i.e., n < 20; Table 17). Downstream of Bonneville Dam, the PSD value for northern pikeminnow was 76 in 2014, the second highest value estimated since our assessment began. For smallmouth bass, PSD downstream of Bonneville Dam (8%) was the lowest observed among all years both downstream of Bonneville Dam and in Bonneville Reservoir. PSD in Bonneville Reservoir during 2014 (42%) was in the range observed since 1990. RSD-P values for smallmouth bass were lower downstream of Bonneville Dam than in Bonneville Reservoir during most years including 2014 (Table 18). The 2014 RSD-P value in Bonneville Reservoir (18%) was within the range of values observed since 1990, whereas the 2014 value observed downstream of Bonneville Dam (4%) was in the lower range of values. Of the six walleye examined, all were stock size and five were longer than the minimum threshold for the RSD preferred TL of 510 mm.
Median relative weight (Wr) values for male northern pikeminnow in the Columbia River downstream of Bonneville Dam and in Bonneville Reservoir were comparable (109 and 107, respectively). The same was true for female northern pikeminnow, with median Wr estimates downstream of Bonneville Dam and in Bonneville reservoir 107 and 109, respectively (Figures 5 and 6). The median Wr value calculated for smallmouth bass collected in the Columbia River downstream of Bonneville Dam (101) exceeded that estimated for fish collected in Bonneville
61
Reservoir (97) but values varied among individuals in each area sampled (Figure 7). Using data collected in 2014, we were able to calculate Wr values for walleye in the Columbia River downstream of Bonneville Dam only; where the median estimate was notably lower than those calculated for the other two predatory species (Figures 5–8). Analyses of species- and location-specific Wr time series data (1990–2014) elucidated significant and increasing trends for male northern pikeminnow in both the Columbia River downstream of Bonneville Dam (Mann-Kendall τ = 0.564, p = 0.0087; Figure 5) and in Bonneville Reservoir (Mann-Kendall τ = 0.515, p = 0.0236; Figure 6). In contrast, relative weight values for female northern pikeminnow displayed no statistically significant monotonic trends (Figures 5 and 6). The same was true for smallmouth bass and walleye; for both the Columbia River downstream of Bonneville Dam and Bonneville Reservoir, median Wr estimated for the two predator species showed no significant temporal trends (Figures 7 and 8).
During 2014, 860 northern pikeminnow digestive tracts were collected from fish harvested in the Dam Angling Fishery; 497 at The Dalles and 363 at John Day dams. These fish ranged in size from 222 to 600 mm FL (mean = 363 mm; Table 19). At both dams, large proportions (�̂�𝑝The Dalles = 0.58 and �̂�𝑝John Day = 0.72) of the digestive tracts examined contained food. Fish were observed in a larger proportion of diet samples than other prey types at both dams (Table 20). Juvenile lamprey were encountered in the greatest proportion of pikeminnow diet samples during all months compared to salmon and steelhead and American shad (�̂�𝑝 = 0.41 – 0.58). Juvenile salmon and steelhead occurred most frequently during May (0.28) and July (0.26). American shad were encountered at relatively low rates each month until August when the sample proportion was 0.56 (Table 21). . At John Day Dam, weekly consumption index estimates peaked during the 28th week of 2014 (July 15 – 16 northern pikeminnow sampling dates) and coincided with peak subyearling Chinook salmon passage rates. Seasonal patterns of northern pikeminnow salmon consumption during 2014 at The Dalles Dam are similar to those at John Day Dam, although peak consumption was a week later, presumably when salmon smolts passing John Day Dam arrived to pass The Dalles Dam (Figure 10).
Fork lengths of northern pikeminnow captured in the 2014 Sport Reward Fishery in Bonneville Reservoir (mean = 289 ± 58 mm s.d.) differed significantly from those of fish captured in the Dam Angling Fishery at The Dalles Dam (mean = 332 ± 53 mm; p < 0.0001). Similarly, fork lengths of northern pikeminnow captured in the Sport Reward Fishery in The Dalles Reservoir (mean = 335 ± 62 mm) were significantly smaller than those of fish captured in the Dam Angling Fishery at John Day Dam (mean = 363 ± 71 mm; p < 0.0001). The greater size of individuals caught in the Dam Angling Fishery relative to catches in the Sport Reward Fishery in Bonneville and The Dalles reservoirs is further evinced by differing stock densities. Proportional stock densities of the Sport Reward catches were 9 and 20% in Bonneville and The Dalles reservoirs respectively compared to 16 and 33% for Dam Angling catches.
62
DISCUSSION
The 2014 estimate of the system-wide exploitation rate (11.5 ± 4.6%, 95% CI) for northern pikeminnow greater than or equal to 250 mm FL is the second lowest reported during the past fifteen years of sampling (Table 5 and Figure 2) and falls towards the lower end of the target exploitation range of 10–20% expected to maintain reduced predation on juvenile salmon (Rieman and Beamesderfer 1990). To quantify the efficacy of the NPMP since the early 1990s, ODFW has applied a model that considers the cumulative effects of sustained exploitation on predation by northern pikeminnow (Friesen and Ward 1999). According to the structure of this model, exploitation in a given year will be manifest in the subsequent year as limits to recruitment of individuals to larger size classes (local or system-wide) in the northern pikeminnow population. In this way, a reduction in predation in the present is dependent on our ability to restructure the population during both the current and previous years. Thus, while two years (e.g., 2013 and 2014) of lower than average exploitation is unlikely to substantially reduce the efficacy of the NPMP, continued system-wide exploitation at lower levels could result in increased predation on juvenile salmon as a greater number of larger, more efficient predators remain in the population and smaller individuals recruit to this larger, more piscivorous, size-class. Given the fragmented structure of the Columbia and Snake River system, it is likely insufficient to consider the whole without also considering variability contributed by individual reservoirs or reaches. A recent review of the sensitivities of our model appears to indicate area-specific exploitation downstream of Bonneville Dam may have a disproportionate influence on predation reduction, due presumably to high densities of juvenile salmon and steelhead in that area and a related functional response. To maintain the efficacy of the NPMP, we recommend continued annual evaluation of exploitation rates and estimates of reductions in predation and suggest steps be taken to ensure targeted removals are sufficient to meeting project thresholds (e.g., 10–20% exploitation). We also suggest efforts continue to examine differential area-specific contributions to predation reduction.
The 2014 Dam Angling Fishery accounted for 3.9% of the total northern pikeminnow harvest, a value slightly lower than that for 2013 (2.4%; Barr et al. 2014). Although the proportion of total fish harvested by the Dam Angling Fishery may be small, the relative impact on northern pikeminnow predation reduction efforts could be substantial. Northern pikeminnow collected during the 2014 Dam Angling Fishery at The Dalles and John Day dams were significantly larger than those captured in the Sport Reward Fishery in Bonneville and The Dalles reservoirs, respectively. Vigg et al. (1991) provided evidence that larger northern pikeminnow consumed a disproportionately greater number of juvenile salmonids than smaller fish predators. Given both the apparent discrepancy in length distributions among Dam Angling and Sport Reward fisheries and the putative size-related bias in consumption of juvenile salmonids in the tailrace areas relative to other areas of the reservoir, dam anglers may have a better opportunity for harvesting larger, more predacious, northern pikeminnow than sport anglers (Martinelli and Shively 1997). Additionally, dam anglers harvest fish from the boat restricted zones, which are not accessible to sport anglers. The relatively few tags that are recovered in the Dam Angling Fishery may further provide some evidence dam anglers are harvesting a unique sub-set of the overall pikeminnow population. For these reasons, we support continued angling from the dams accompanied by concurrent monitoring of diet during future dam angling activities.
63
Removals of larger individuals from northern pikeminnow populations may improve survival among migrating juvenile salmon if a compensatory response by remaining northern pikeminnow or other predatory fishes (see below) does not offset the net benefit of removal (Beamesderfer et al. 1996; Friesen and Ward 1999). Potential signs of a compensatory response by predators may be increased abundance, condition factor, consumption and predation indices, or a shift in population size structure toward larger individuals (Knutsen and Ward 1999). Analyses to elucidate temporal trends in Wr data indicated a persistent increase in condition of male northern pikeminnow in the Columbia River downstream of Bonneville Dam and in Bonneville Reservoir. While it is uncertain whether these results are indicative of an intra-specific compensatory mechanism, our findings do highlight the possibility of differential responses to sustained removal not only in space (i.e., reservoir/area-specific), but also demographically. As was done for Wr time series data in the present study, future work will apply similar quantitative methodologies to other metrics (e.g., abundance index, consumption index, etc.) to monitor the presence of inter- and intra-specific compensation.
Abundance index estimates for 2014 in most locations sampled show a continued decrease in the number of northern pikeminnow greater than or equal to 250 mm FL in the Columbia River downstream of Bonneville Dam and in Bonneville Reservoir since the early 1990s (Table 8). This pattern is also reflected in the total number of stock size northern pikeminnow we encounter during indexing years (i.e., PSD; Table 17). The 2014 PSD estimate calculated for the area downstream of Bonneville Dam (76%) is comparable to values since 2008 in the same location (i.e., 2008, 81%; 2010, 76%; 2011, 72%), but represents an increase from the mid-1990’s (minimum = 40%). Thus, although the NPMP has effectively reduced the total number of northern pikeminnow larger than 250 mm FL downstream of Bonneville Dam, reductions in the population size of fish larger than 380mm FL has been less pronounced. Rieman and Beamesderfer (1990) proposed that a decreasing trend in PSD may reflect the effect of the Sport Reward Fishery as evinced by the direction of change in the size-structure of the northern pikeminnow population. Further, Neumann and Allen (2007) suggested PSD can be high in low-density populations. Proportional stock density values can be related to lower abundance index values and Everhart and Youngs (1981) provided evidence that overexploited fish populations may show oscillating patterns of year class strength. As changes in northern pikeminnow abundance and size-structure may be related to exploitation, continued monitoring is needed to better understand the fisheries’ association with the functional dynamics of the population.
A compensatory response by other piscivores in the Columbia Basin to the sustained removal of northern pikeminnow could offset the net benefit of the removals (Ward and Zimmerman 1999). As reported in earlier work (Poe et al. 1991; Zimmerman 1999; Naughton et al. 2004), juvenile salmon constitute a small but consistent portion of smallmouth bass diets in the Columbia River. Our observations for 2014 substantiate these previous findings, with sculpins (family Cottidae) and minnows (family Cyprinidae) being the primary prey fish species consumed by smallmouth bass downstream of Bonneville Dam and in Bonneville Reservoir, respectively (Table 12). Ward and Zimmerman (1999) suggested primary evidence of a compensatory response by smallmouth bass would likely be a shift in diet towards greater proportions of juvenile salmon. However, as stated above, indication of a compensatory response may become apparent at one or multiple scales (localized spatial, system-wide, sex-specific, etc.) As such, continued monitoring of smallmouth bass abundance and consumption to aid in the characterization of potential compensatory responses among various strata is warranted.
64
The abundance of walleye downstream of Bonneville Dam and in Bonneville Reservoir is low compared to abundance levels in reaches upstream (e.g., the tailrace areas of John Day and McNary dams). However, past studies conducted throughout the Columbia River have identified juvenile salmon as an important component of walleye diets that consist almost exclusively of fish (Poe et al. 1991; Vigg et al. 1991; Zimmerman 1999). During 2014, we encountered primarily peamouth chub or northern pikeminnow in the few walleye diet samples collected downstream of Bonneville Dam. Alternatively, the majority of walleye diet samples examined by Weaver et al. (2012), collected from the same location during 2011, contained salmonids. Takata et al. (2007) identified juvenile salmon most often in walleye digestive tracts from The Dalles and John Day reservoirs, whereas Gardner et al. (2013) found juvenile salmon most frequently in John Day samples, with equal proportions of juvenile salmon and members of the minnow family (northern pikeminnow and peamouth chub) in walleye diet samples collected from The Dalles Reservoir. While abundance and diet data from the current study may suggest the predatory burden imposed by walleye on juvenile salmon could be minimal, it is important to note these data are constrained in both space and time. Given evidence provided by others (e.g., diet composition, population dynamics, etc.) in different areas and over varying periods, it seems possible that relatively small shifts in population structure could result in an increased predatory impact of walleye in the lower Columbia River system. In light of the predatory potential of walleye on juvenile salmon, and apparent variability therein, further monitoring of demographic characteristics and diets is necessary to detect any increased impacts to juvenile salmon and assess with greater precision long-term trends.
Data collected during 2014 provided no unambiguous indication of the presence of a compensatory response. Previous evaluations of the NPMP also detected no responses by the predator community related directly to the sustained removal of northern pikeminnow (Ward et al. 1995; Ward and Zimmerman 1999; Zimmerman and Ward 1999). However, fishery management programs have been described as needing sustained annual sampling to effectively detect such a response should one occur (Beamesderfer et al. 1996). Thus, continued monitoring to assess the indirect implications of the Northern Pikeminnow Management Program seems warranted.
65
ACKNOWLEDGEMENTS
We are grateful to those who worked long hours in the field to collect the data presented in this report, particularly Curt Beyer, Megan Dethloff, Mathew Gardener, Jonathan LaTour, Mike Lovejoy, Chis Tiffany, Jason Westlund and Matt Wyatt. Megan Dethloff, Michael Lovejoy and Jason Westlund also contributed many hours to analyzing diet samples in the laboratory. We thank the following individuals for their cooperation and assistance: Ken Frisby (ODFW, The Dalles Screen Shop) and Terry Blessing (ODFW, Irrigon Hatchery) for providing boat storage facilities; Eric Winther, Ruthanna Shirley, and other WDFW staff for providing PIT tag recovery and loop tag loss information; Scott Mengis (WDFW) and his Dam Angling colleagues for assistance obtaining diet samples at The Dalles and John Day dams; and Paul Keller, Tammy Mackey, Andrew Traylor, and Miro Zyndol of the U.S. Army Corps of Engineers for coordination of access to project boat-restricted zones and powerhouse sampling sites.
This project is funded by the Bonneville Power Administration (project number 1990-077-00) and the Contracting Officer’s Technical Representative (COTR) is John Skidmore. Christine Mallette of ODFW and Steve Williams of Pacific States Marine Fisheries Commission (PSMFC) administered the contract.
66
REFERENCES
Anderson, R. O. 1980. Proportional stock density (PSD) and relative weight (Wr): interpretive indices for fish populations and communities. Pages 27–33 in S. Gloss and B. Shupp, editors. Practical fisheries management: more with less in the 1980s. New York Chapter American Fisheries Society, Bethesda, MD.
Anderson, R. O., and R. M. Neumann. 1996. Length, weight, and associated structural indices. Pages 447–482 in B. R. Murphy and D. W. Willis, editors. Fisheries Techniques, 2nd edition. American Fisheries Society, Bethesda, Maryland.
Barr, C.M., E. Tinus, M.D. Gardner, C. Mallette, and A.J. Storch. 2014. System-wide predator control program, Report C, indexing and fisheries evaluation. Oregon Department of Fish and Wildlife, Contract Number 56795. 2013 Annual Report to the Bonneville Power Administration, Portland, Oregon.
Beamesderfer, R. C., and B. E. Rieman. 1988. Size selectivity and bias in estimates of population statistics of smallmouth bass, walleye, and northern squawfish in a Columbia River reservoir. North American Journal of Fisheries Management 8:505–510.
Beamesderfer, R. C., D. L. Ward, and A. A. Nigro. 1996. Evaluation of the biological basis for a predator control program on northern squawfish (Ptychocheilus oregonensis) in the Columbia and Snake rivers. Canadian Journal of Fisheries and Aquatic Sciences 53:2898–2908.
Collis, K., D. D. Roby, D. P. Craig, S. Adamany, J. Y. Adkins, and D. E. Lyons. 2002. Colony size and diet composition of piscivorous water birds on the Lower Columbia River: Implications for losses of juvenile salmonids to avian predation. Transactions of the American Fisheries Society 131:537–550.
Davidson, A.C. and D.V. Hinkley. 1997. Bootstrap methods and their application. Cambridge University Press.
Dunlap, P. V., J. D. Hone, R.M. Shirley, and E. C. Winther. 2015a. Report A – Implementation of the Northern Pikeminnow Sport-Reward Fishery in the Columbia and Snake Rivers. Project Number 199007700. 2014 Annual report to the Bonneville Power Administration, Portland, Oregon.
Dunlap, P. V., R.M. Shirley, J. D. Hone., and E. C. Winther. 2015b. Report D – Northern Pikeminnow Dam Angling on the Columbia River. Project Number 199007700. 2014 Annual report to the Bonneville Power Administration, Portland, Oregon.
Everhart, W. H., and W. D. Youngs. 1981. Principles of fishery science, 2nd edition. Cornell University Press, Ithaca, New York.
Fox J. and S. Weisberg. 2011. An {R} Companion to Applied Regression, Second Edition. Thousand Oaks CA: Sage.URL: http://socserv.socsci.mcmaster.ca/jfox/Books/Companion
67
Friesen, T. A., and D. L. Ward. 1999. Management of northern pikeminnow and implications for juvenile salmonid survival in the lower Columbia and Snake rivers. North American Journal of Fisheries Management 19:406–420.
Frost, C. N. 2000. A key for identifying prey fish in the Columbia River based on diagnostic bones. U.S. Geological Survey Western fisheries Research Center, Cook WA. USA 50p.
Gabelhouse, D. W., Jr. 1984. A length-categorization system to assess fish stocks. North American Journal of Fisheries Management 4:273–285.
Gardner, M., E. Tinus, M.H. Weaver, C. Mallette, and E.S. Van Dyke. 2013. System-wide predator control program, Report C, indexing and fisheries evaluation. Oregon Department of Fish and Wildlife, Contract Number 56795. 2012 Annual Report to the Bonneville Power Administration, Portland, Oregon.
Hansel, H. C., S. D. Duke, P. T. Lofty, and G. A. Gray. 1988. Use of diagnostic bones to identify and estimate original lengths of ingested prey fishes. Transactions of the American Fisheries Society 117:55–62.
Knutsen, C. J., and D. L. Ward. 1999. Biological characteristics of northern pikeminnow in the Lower Columbia and Snake Rivers before and after sustained exploitation. Transactions of the American Fisheries Society 128:1008–1019.
Kolander, C. J., D. W. Willis, and B. R. Murphy. 1993. Proposed revision of the standard weights (Ws) equation for smallmouth bass. North American Journal of Fisheries Management 13:398–400.
Long, C. W., and F. J. Ossiander. 1974. Survival of coho salmon fingerlings passing through a perforated bulkhead in an empty turbine bag and through flow deflectors (with and without dentates) on the spillways of Lower Monumental Dam, Snake River, April–May 1973. Final Report (Contract DACW68-84-H-0034) to U.S. Army Corps of Engineers, Portland, Oregon.
Mann, H.B. 1945. Nonparametric tests against trend. Econometrica 12:245–259.
Martinelli, T. L., and R. S. Shively. 1997. Seasonal distribution, movements and habitat associations of northern squawfish in two lower Columbia River reservoirs. Regulated Rivers: Research and Management 6, pp 543–556, Nov–Dec 1997.
McLeod, A.I. 2011. Kendall: Kendall rank correlation and Mann-Kendall trend test. R package version 2.2. http://CRAN.R-project.org/package=Kendall.
Murphy, B. R., M. L. Brown, and T. A. Springer. 1990. Evaluation of the relative weight (Wr) index, with new applications to walleye. North American Journal of Fisheries Management 10:85–97.
68
Naughton, G. P., D. H. Bennett, and K. B. Newman. 2004. Predation on juvenile salmonids by smallmouth bass in the Lower Granite Reservoir system, Snake River. North American Journal of Fisheries Management 24:534–544.
Nehlsen, W., J. E. Williams, and J. A. Lichatowich. 1991. Pacific salmon at the crossroads: stocks at risk from California, Oregon, Idaho, and Washington. Fisheries 16:4–21.
Neumann, R. S. and M. S. Allen. 2007. Size structure. Pages 375–421 in C. S. Guy and M. L. Brown, editors. Analysis and interpretation of freshwater fisheries data. American fisheries Society, Bethesda, Maryland.
Parker, R. M., M. P. Zimmerman, and D. L. Ward. 1995. Variability in biological characteristics of northern squawfish in the lower Columbia and Snake rivers. Transactions of the American Fisheries Society 124:335–346.
Parrish, J.K., K. Haapa-aho, W. Walker, M. Stratton, J. Walsh, H. Ziel. 2006. Small-bodied and juvenile fishes of the Mid-Columbia Region including keys to diagnostic otoliths and cranial bones. Draft Version, March 2006. University of Washington, Seattle WA. USA 137p.
Poe, T. P., H. C. Hansel, S. Vigg, D. E. Palmer, and L. A. Prendergast. 1991. Feeding of predaceous fishes on out-migrating juvenile salmonids in the John Day Reservoir, Columbia River. Transactions of the American Fisheries Society 120:405–420.
R Core Team. 2013. R: A language and environment for statistical computing. R Foundation for Statistical Computing, Vienna, Austria. URL http://www.R-project.org/.
Raymond, H. L. 1988. Effects of hydroelectric development and fisheries enhancement on spring and summer Chinook salmon and steelhead in the Columbia River basin. North American Journal of Fisheries Management 8:1–24.
Ricker, W. E. 1975. Computation and interpretation of biological statistics of fish populations. Fisheries Research Board of Canada Bulletin 191.
Rieman, B. E., and R. C. Beamesderfer. 1990. Dynamics of a northern squawfish population and the potential to reduce predation on juvenile salmonids in a Columbia River reservoir. North American Journal of Fisheries Management 10:228–241.
Rieman, B. E., R. C. Beamesderfer, S. Vigg, and T. P. Poe. 1991. Estimated loss of juvenile salmonids to predation by northern squawfish, walleyes, and smallmouth bass in John Day Reservoir, Columbia River. Transactions of the American Fisheries Society 120:448–458.
Seaburg, K. G. 1957. A stomach sampler for live fish. Progressive fish-Culturist 19:137–139.
Styer, P. 2003. Statistical consulting report to review computational methods in the northern pikeminnow management program. Report to the Oregon Department of Fish and Wildlife, Clackamas.
69
Takata, H. K., M. J. Reesman, G. E. Reed, L. D. Layng, and T. A. Jones. 2007. Development of a system-wide predator control program: indexing and fisheries evaluation. Oregon Department of Fish and Wildlife, Contract Number DE-B1719-94BI24514. 2006 Annual Report to the Bonneville Power Administration, Portland, Oregon.
Vigg, S., T. P. Poe, L. A. Prendergast, and H. C. Hansel. 1991. Rates of consumption of juvenile salmonids and alternative prey fish by northern squawfish, walleyes, smallmouth bass, and channel catfish in John Day Reservoir, Columbia River. Transactions of the American Fisheries Society 120:421–438.
Ward, D. L., J. H. Petersen, and J. J. Loch. 1995. Index of predation on juvenile salmonids by northern squawfish in the lower and middle Columbia River and in the lower Snake River. Transactions of the American Fisheries Society 124:321–334.
Ward, D. L., and M. P. Zimmerman. 1999. Response of smallmouth bass to sustained removals of northern pikeminnow in the lower Columbia and Snake Rivers. Transactions of the American Fisheries Society 128:1020–1035.
Weaver, M. H., E. Tinus, M. Gardner, C. Mallette, and P.A. McHugh. 2012. System-wide predator control program, Report C, indexing and fisheries evaluation. Oregon Department of Fish and Wildlife, Contract Number 52617. 2011 Annual Report to the Bonneville Power Administration, Portland, Oregon.
Williams, S. 2015. Report B–Northern pikeminnow sport reward payments 2014. Pacific States Marine Fisheries Commission. 2014 Annual Report to the Bonneville Power Administration, Project 199007700, Portland, Oregon.
Willis, D. W., K. D. McCloskey, and D. W. Gabelhouse, Jr. 1985. Calculation of stock density indices based on adjustments for efficiency of gill-net mesh size. North American Journal of Fisheries Management 5:126–137.
Wismar, R. C., J. E. Smith, B. A. McIntosh, H. W. Li, G. H. Reeves, and J. R. Sedell. 1994. A history of resource use and disturbance in riverine basins of eastern Oregon and Washington (early 1800s–1900s). Northwest Science 68 (Special Issue):1–35.
Zeileis A. and Hothorn T. 2002. Diagnostic checking in regression relationships. R News 2(3), 7-10. URL http://CRAN.R-project.org/doc/Rnews/.
Zimmerman, M. P. 1999. Food habits of smallmouth bass, walleyes, and northern pikeminnow in the lower Columbia River Basin during outmigration of juvenile anadromous salmonids. Transactions of the American Fisheries Society 128:995–1007.
Zimmerman, M.P., T. A. Friesen, D. L. Ward, and H. K. Takata. 2000. Development of a system-wide predator control program: indexing and fisheries evaluation. Oregon Department of Fish and Wildlife, Contract Number DE-B1719-94BI24514. 1999 Annual Report to the Bonneville Power Administration, Portland, Oregon.
70

Zimmerman, M. P., C. Knutsen, D. L. Ward, and K. Anderson. 1995. Development of a system-wide predator control program: Indexing and fisheries evaluation. Oregon Department of Fish and Wildlife, Contract number DE-AI79-90BP07084. 1993 Annual Report to the Bonneville Power Administration, Portland, Oregon.
Zimmerman, M. P., and D. L. Ward. 1999. Index of predation on juvenile salmonids by northern pikeminnow in the lower Columbia River basin, 1994–1996. Transactions of the American Fisheries Society 128:995–1007.
71
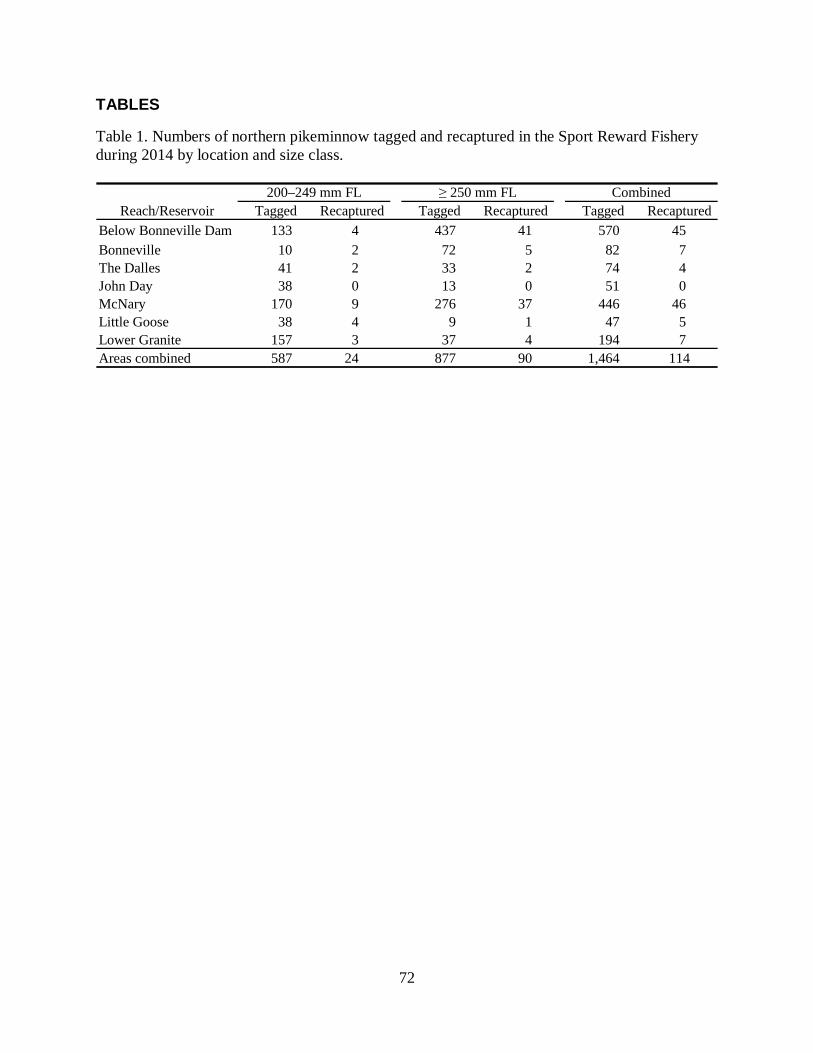
TABLES
Table 1. Numbers of northern pikeminnow tagged and recaptured in the Sport Reward Fishery during 2014 by location and size class.
Reach/Reservoir Tagged Recaptured Tagged Recaptured Tagged RecapturedBelow Bonneville Dam 133 4 437 41 570 45Bonneville 10 2 72 5 82 7The Dalles 41 2 33 2 74 4John Day 38 0 13 0 51 0McNary 170 9 276 37 446 46Little Goose 38 4 9 1 47 5Lower Granite 157 3 37 4 194 7Areas combined 587 24 877 90 1,464 114
200–249 mm FL ≥ 250 mm FL Combined
72
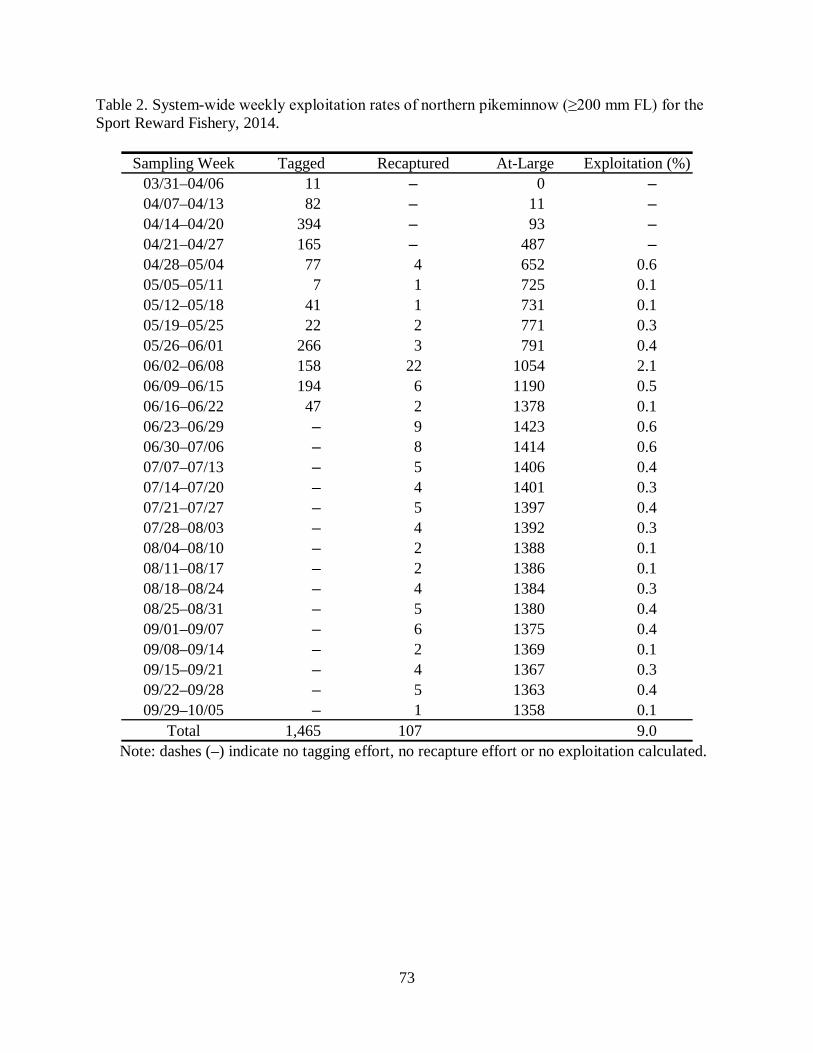
Table 2. System-wide weekly exploitation rates of northern pikeminnow (≥200 mm FL) for the Sport Reward Fishery, 2014.
Note: dashes (–) indicate no tagging effort, no recapture effort or no exploitation calculated.
Sampling Week Tagged Recaptured At-Large Exploitation (%)03/31–04/06 11 – 0 –04/07–04/13 82 – 11 –04/14–04/20 394 – 93 –04/21–04/27 165 – 487 –04/28–05/04 77 4 652 0.605/05–05/11 7 1 725 0.105/12–05/18 41 1 731 0.105/19–05/25 22 2 771 0.305/26–06/01 266 3 791 0.406/02–06/08 158 22 1054 2.106/09–06/15 194 6 1190 0.506/16–06/22 47 2 1378 0.106/23–06/29 – 9 1423 0.606/30–07/06 – 8 1414 0.607/07–07/13 – 5 1406 0.407/14–07/20 – 4 1401 0.307/21–07/27 – 5 1397 0.407/28–08/03 – 4 1392 0.308/04–08/10 – 2 1388 0.108/11–08/17 – 2 1386 0.108/18–08/24 – 4 1384 0.308/25–08/31 – 5 1380 0.409/01–09/07 – 6 1375 0.409/08–09/14 – 2 1369 0.109/15–09/21 – 4 1367 0.309/22–09/28 – 5 1363 0.409/29–10/05 – 1 1358 0.1
Total 1,465 107 9.0
73
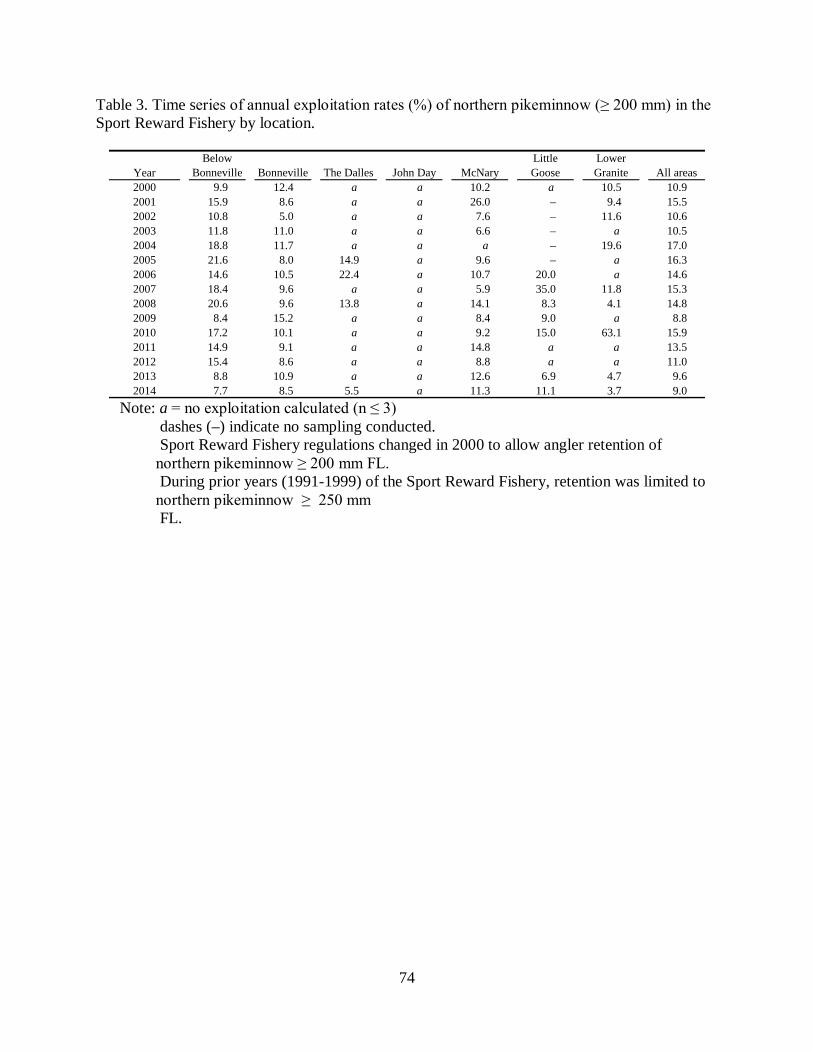
Table 3. Time series of annual exploitation rates (%) of northern pikeminnow (≥ 200 mm) in the Sport Reward Fishery by location.
Note: a = no exploitation calculated (n ≤ 3)
dashes (–) indicate no sampling conducted. Sport Reward Fishery regulations changed in 2000 to allow angler retention of northern pikeminnow ≥ 200 mm FL. During prior years (1991-1999) of the Sport Reward Fishery, retention was limited to northern pikeminnow ≥ 250 mm FL.
Year2000 9.9 12.4 a a 10.2 a 10.5 10.92001 15.9 8.6 a a 26.0 – 9.4 15.52002 10.8 5.0 a a 7.6 – 11.6 10.62003 11.8 11.0 a a 6.6 – a 10.52004 18.8 11.7 a a a – 19.6 17.02005 21.6 8.0 14.9 a 9.6 – a 16.32006 14.6 10.5 22.4 a 10.7 20.0 a 14.62007 18.4 9.6 a a 5.9 35.0 11.8 15.32008 20.6 9.6 13.8 a 14.1 8.3 4.1 14.82009 8.4 15.2 a a 8.4 9.0 a 8.82010 17.2 10.1 a a 9.2 15.0 63.1 15.92011 14.9 9.1 a a 14.8 a a 13.52012 15.4 8.6 a a 8.8 a a 11.02013 8.8 10.9 a a 12.6 6.9 4.7 9.62014 7.7 8.5 5.5 a 11.3 11.1 3.7 9.0
Lower Granite All areasMcNary
Little Goose
Below Bonneville Bonneville The Dalles John Day
74
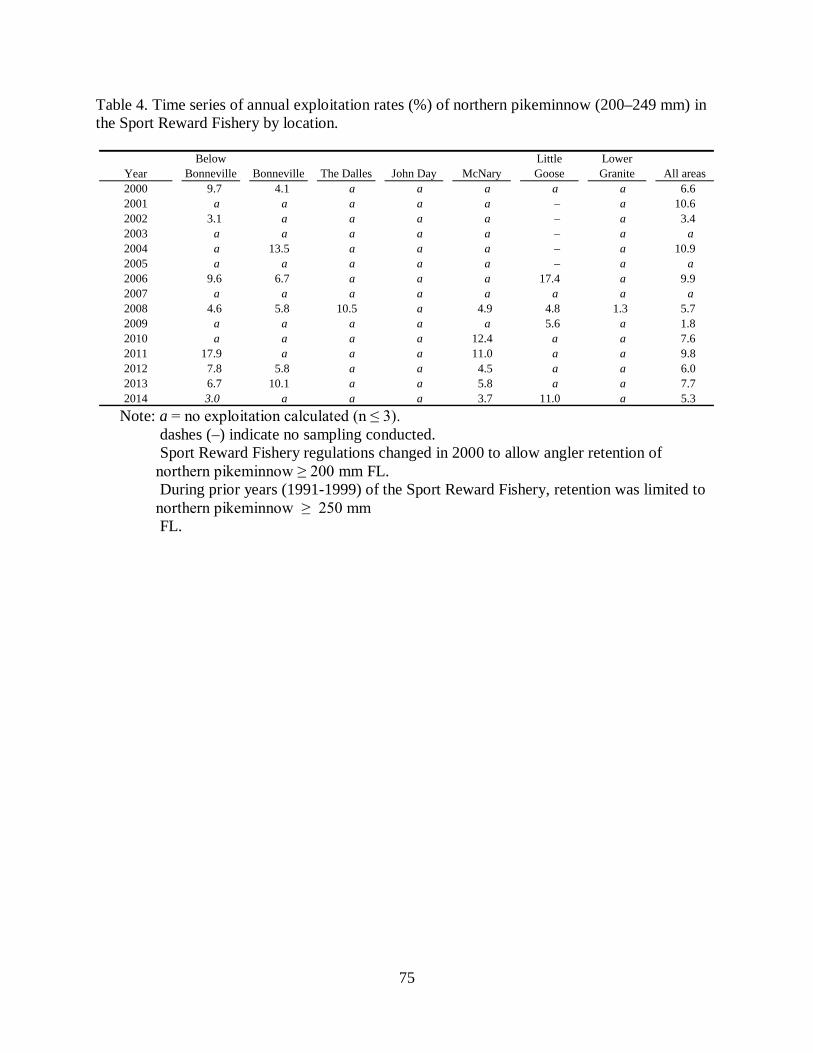
Table 4. Time series of annual exploitation rates (%) of northern pikeminnow (200–249 mm) in the Sport Reward Fishery by location.
Note: a = no exploitation calculated (n ≤ 3).
dashes (–) indicate no sampling conducted. Sport Reward Fishery regulations changed in 2000 to allow angler retention of northern pikeminnow ≥ 200 mm FL. During prior years (1991-1999) of the Sport Reward Fishery, retention was limited to northern pikeminnow ≥ 250 mm FL.
Year2000 9.7 4.1 a a a a a 6.62001 a a a a a – a 10.62002 3.1 a a a a – a 3.42003 a a a a a – a a2004 a 13.5 a a a – a 10.92005 a a a a a – a a2006 9.6 6.7 a a a 17.4 a 9.92007 a a a a a a a a2008 4.6 5.8 10.5 a 4.9 4.8 1.3 5.72009 a a a a a 5.6 a 1.82010 a a a a 12.4 a a 7.62011 17.9 a a a 11.0 a a 9.82012 7.8 5.8 a a 4.5 a a 6.02013 6.7 10.1 a a 5.8 a a 7.72014 3.0 a a a 3.7 11.0 a 5.3
Little Goose
Lower Granite All areas
Below Bonneville Bonneville The Dalles John Day McNary
75
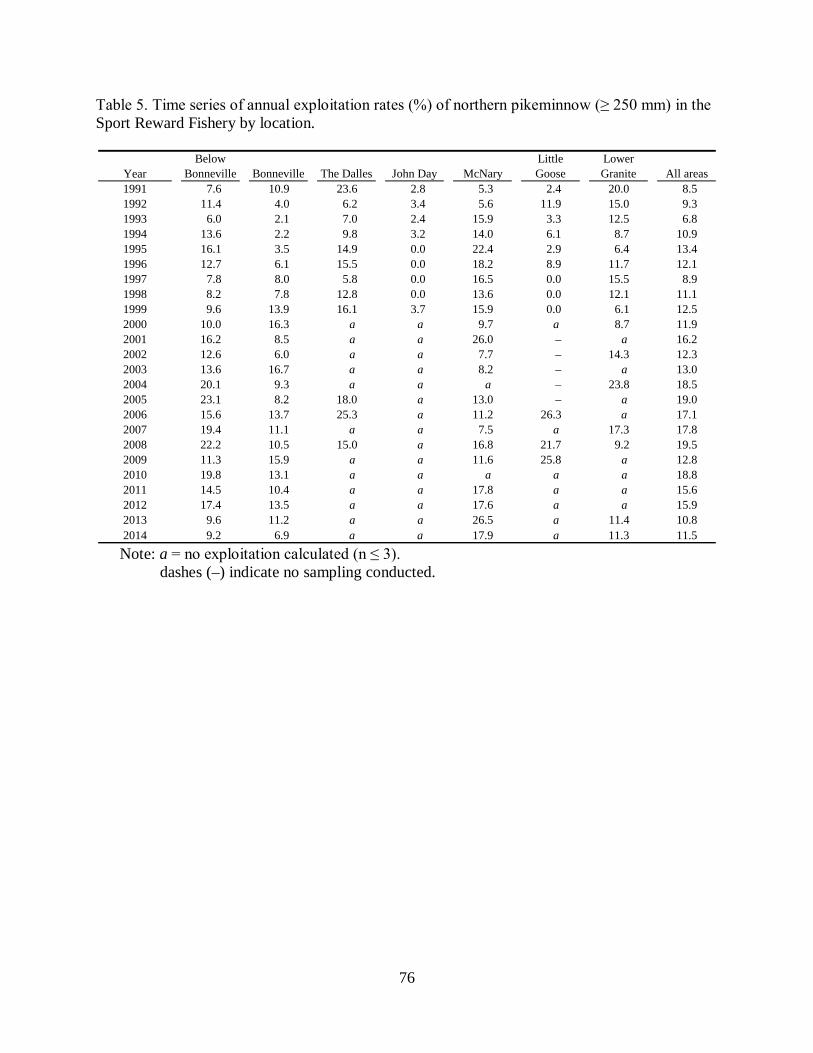
Table 5. Time series of annual exploitation rates (%) of northern pikeminnow (≥ 250 mm) in the Sport Reward Fishery by location.
Note: a = no exploitation calculated (n ≤ 3).
dashes (–) indicate no sampling conducted.
Year1991 7.6 10.9 23.6 2.8 5.3 2.4 20.0 8.51992 11.4 4.0 6.2 3.4 5.6 11.9 15.0 9.31993 6.0 2.1 7.0 2.4 15.9 3.3 12.5 6.81994 13.6 2.2 9.8 3.2 14.0 6.1 8.7 10.91995 16.1 3.5 14.9 0.0 22.4 2.9 6.4 13.41996 12.7 6.1 15.5 0.0 18.2 8.9 11.7 12.11997 7.8 8.0 5.8 0.0 16.5 0.0 15.5 8.91998 8.2 7.8 12.8 0.0 13.6 0.0 12.1 11.11999 9.6 13.9 16.1 3.7 15.9 0.0 6.1 12.52000 10.0 16.3 a a 9.7 a 8.7 11.92001 16.2 8.5 a a 26.0 – a 16.22002 12.6 6.0 a a 7.7 – 14.3 12.32003 13.6 16.7 a a 8.2 – a 13.02004 20.1 9.3 a a a – 23.8 18.52005 23.1 8.2 18.0 a 13.0 – a 19.02006 15.6 13.7 25.3 a 11.2 26.3 a 17.12007 19.4 11.1 a a 7.5 a 17.3 17.82008 22.2 10.5 15.0 a 16.8 21.7 9.2 19.52009 11.3 15.9 a a 11.6 25.8 a 12.82010 19.8 13.1 a a a a a 18.82011 14.5 10.4 a a 17.8 a a 15.62012 17.4 13.5 a a 17.6 a a 15.92013 9.6 11.2 a a 26.5 a 11.4 10.82014 9.2 6.9 a a 17.9 a 11.3 11.5
Below Bonneville Bonneville The Dalles John Day McNary
Little Goose
Lower Granite All areas
76
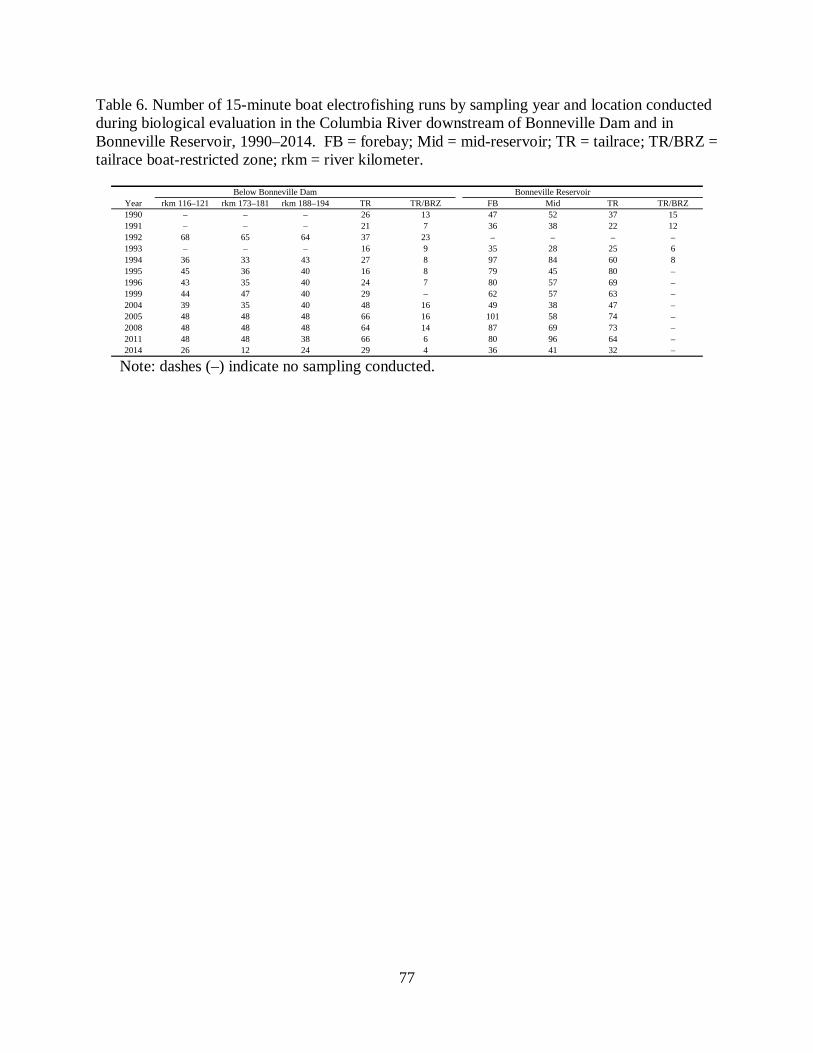
Table 6. Number of 15-minute boat electrofishing runs by sampling year and location conducted during biological evaluation in the Columbia River downstream of Bonneville Dam and in Bonneville Reservoir, 1990–2014. FB = forebay; Mid = mid-reservoir; TR = tailrace; TR/BRZ = tailrace boat-restricted zone; rkm = river kilometer.
Note: dashes (–) indicate no sampling conducted.
Year rkm 116–121 rkm 173–181 rkm 188–194 TR TR/BRZ FB Mid TR TR/BRZ1990 – – – 26 13 47 52 37 151991 – – – 21 7 36 38 22 121992 68 65 64 37 23 – – – –1993 – – – 16 9 35 28 25 61994 36 33 43 27 8 97 84 60 81995 45 36 40 16 8 79 45 80 –1996 43 35 40 24 7 80 57 69 –1999 44 47 40 29 – 62 57 63 –2004 39 35 40 48 16 49 38 47 –2005 48 48 48 66 16 101 58 74 –2008 48 48 48 64 14 87 69 73 –2011 48 48 38 66 6 80 96 64 –2014 26 12 24 29 4 36 41 32 –
Bonneville ReservoirBelow Bonneville Dam
77
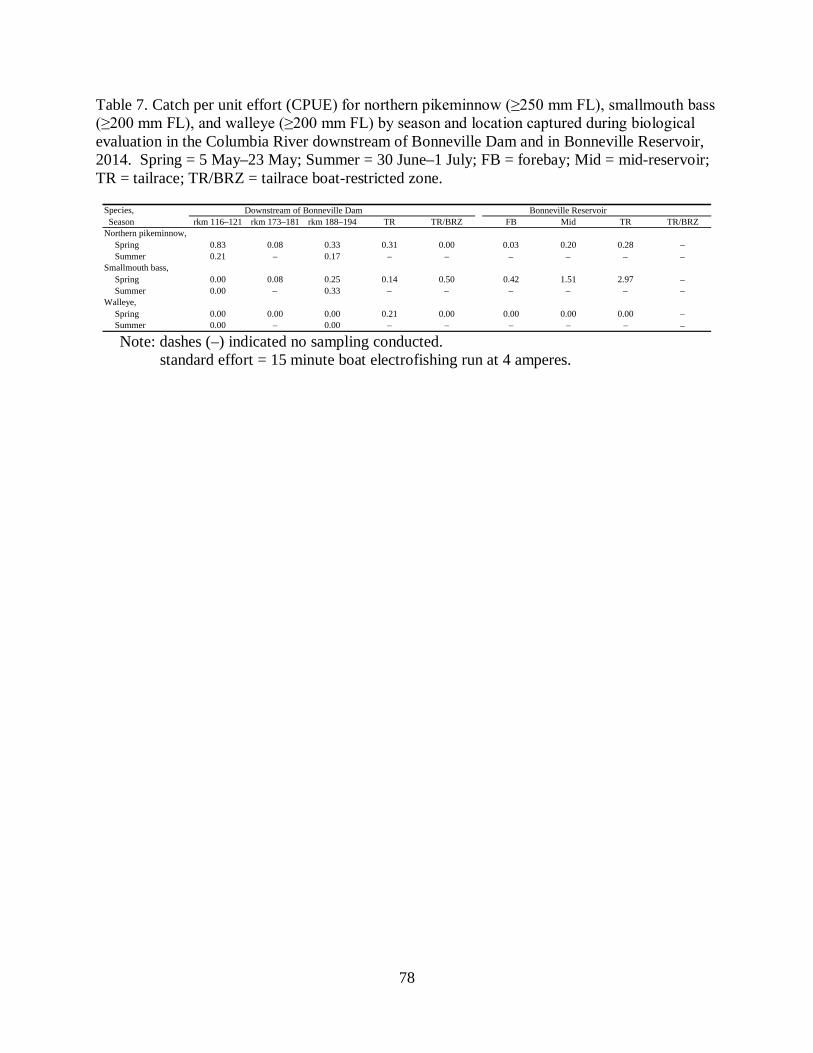
Table 7. Catch per unit effort (CPUE) for northern pikeminnow (≥250 mm FL), smallmouth bass (≥200 mm FL), and walleye (≥200 mm FL) by season and location captured during biological evaluation in the Columbia River downstream of Bonneville Dam and in Bonneville Reservoir, 2014. Spring = 5 May–23 May; Summer = 30 June–1 July; FB = forebay; Mid = mid-reservoir; TR = tailrace; TR/BRZ = tailrace boat-restricted zone.
Note: dashes (–) indicated no sampling conducted.
standard effort = 15 minute boat electrofishing run at 4 amperes.
Species, Season rkm 116–121 rkm 173–181 rkm 188–194 TR TR/BRZ FB Mid TR TR/BRZNorthern pikeminnow,
Spring 0.83 0.08 0.33 0.31 0.00 0.03 0.20 0.28 – Summer 0.21 – 0.17 – – – – – –
Smallmouth bass, Spring 0.00 0.08 0.25 0.14 0.50 0.42 1.51 2.97 – Summer 0.00 – 0.33 – – – – – –
Walleye, Spring 0.00 0.00 0.00 0.21 0.00 0.00 0.00 0.00 – Summer 0.00 – 0.00 – – – – – –
Downstream of Bonneville Dam Bonneville Reservoir
78
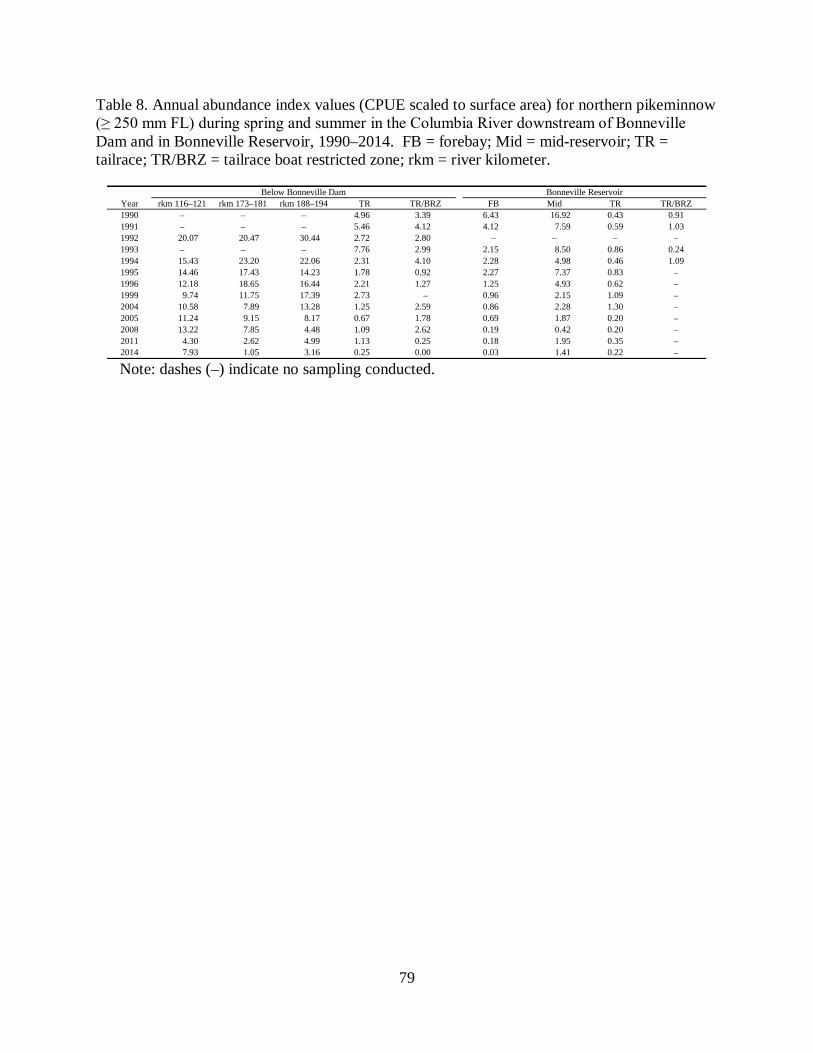
Table 8. Annual abundance index values (CPUE scaled to surface area) for northern pikeminnow (≥ 250 mm FL) during spring and summer in the Columbia River downstream of Bonneville Dam and in Bonneville Reservoir, 1990–2014. FB = forebay; Mid = mid-reservoir; TR = tailrace; TR/BRZ = tailrace boat restricted zone; rkm = river kilometer.
Note: dashes (–) indicate no sampling conducted.
Year rkm 116–121 rkm 173–181 rkm 188–194 TR TR/BRZ FB Mid TR TR/BRZ1990 – – – 4.96 3.39 6.43 16.92 0.43 0.911991 – – – 5.46 4.12 4.12 7.59 0.59 1.031992 20.07 20.47 30.44 2.72 2.80 – – – –1993 – – – 7.76 2.99 2.15 8.50 0.86 0.241994 15.43 23.20 22.06 2.31 4.10 2.28 4.98 0.46 1.091995 14.46 17.43 14.23 1.78 0.92 2.27 7.37 0.83 –1996 12.18 18.65 16.44 2.21 1.27 1.25 4.93 0.62 –1999 9.74 11.75 17.39 2.73 – 0.96 2.15 1.09 –2004 10.58 7.89 13.28 1.25 2.59 0.86 2.28 1.30 –2005 11.24 9.15 8.17 0.67 1.78 0.69 1.87 0.20 –2008 13.22 7.85 4.48 1.09 2.62 0.19 0.42 0.20 –2011 4.30 2.62 4.99 1.13 0.25 0.18 1.95 0.35 –2014 7.93 1.05 3.16 0.25 0.00 0.03 1.41 0.22 –
Below Bonneville Dam Bonneville Reservoir
79
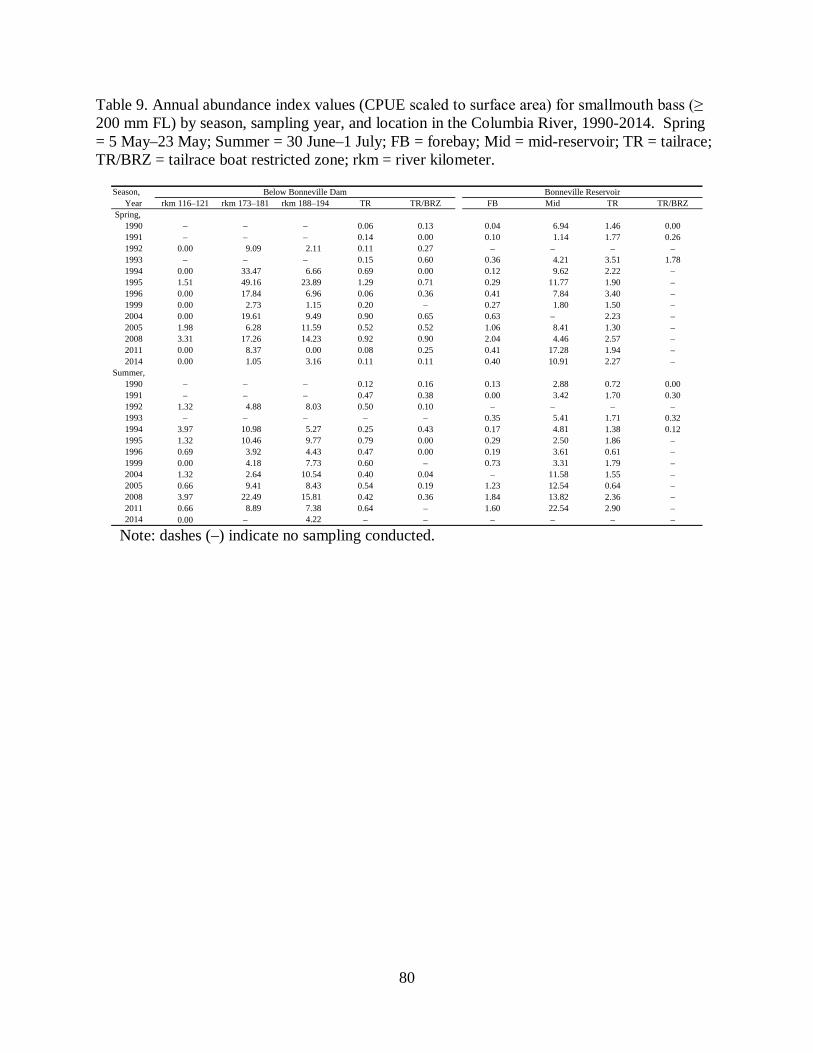
Table 9. Annual abundance index values (CPUE scaled to surface area) for smallmouth bass (≥ 200 mm FL) by season, sampling year, and location in the Columbia River, 1990-2014. Spring = 5 May–23 May; Summer = 30 June–1 July; FB = forebay; Mid = mid-reservoir; TR = tailrace; TR/BRZ = tailrace boat restricted zone; rkm = river kilometer.
Note: dashes (–) indicate no sampling conducted.
Season,Year rkm 116–121 rkm 173–181 rkm 188–194 TR TR/BRZ FB Mid TR TR/BRZ
Spring,1990 – – – 0.06 0.13 0.04 6.94 1.46 0.001991 – – – 0.14 0.00 0.10 1.14 1.77 0.261992 0.00 9.09 2.11 0.11 0.27 – – – –1993 – – – 0.15 0.60 0.36 4.21 3.51 1.781994 0.00 33.47 6.66 0.69 0.00 0.12 9.62 2.22 –1995 1.51 49.16 23.89 1.29 0.71 0.29 11.77 1.90 –1996 0.00 17.84 6.96 0.06 0.36 0.41 7.84 3.40 –1999 0.00 2.73 1.15 0.20 – 0.27 1.80 1.50 –2004 0.00 19.61 9.49 0.90 0.65 0.63 – 2.23 –2005 1.98 6.28 11.59 0.52 0.52 1.06 8.41 1.30 –2008 3.31 17.26 14.23 0.92 0.90 2.04 4.46 2.57 –2011 0.00 8.37 0.00 0.08 0.25 0.41 17.28 1.94 –2014 0.00 1.05 3.16 0.11 0.11 0.40 10.91 2.27 –
Summer,1990 – – – 0.12 0.16 0.13 2.88 0.72 0.001991 – – – 0.47 0.38 0.00 3.42 1.70 0.301992 1.32 4.88 8.03 0.50 0.10 – – – –1993 – – – – – 0.35 5.41 1.71 0.321994 3.97 10.98 5.27 0.25 0.43 0.17 4.81 1.38 0.121995 1.32 10.46 9.77 0.79 0.00 0.29 2.50 1.86 –1996 0.69 3.92 4.43 0.47 0.00 0.19 3.61 0.61 –1999 0.00 4.18 7.73 0.60 – 0.73 3.31 1.79 –2004 1.32 2.64 10.54 0.40 0.04 – 11.58 1.55 –2005 0.66 9.41 8.43 0.54 0.19 1.23 12.54 0.64 –2008 3.97 22.49 15.81 0.42 0.36 1.84 13.82 2.36 –2011 0.66 8.89 7.38 0.64 – 1.60 22.54 2.90 –2014 0.00 – 4.22 – – – – – –
Below Bonneville Dam Bonneville Reservoir
80
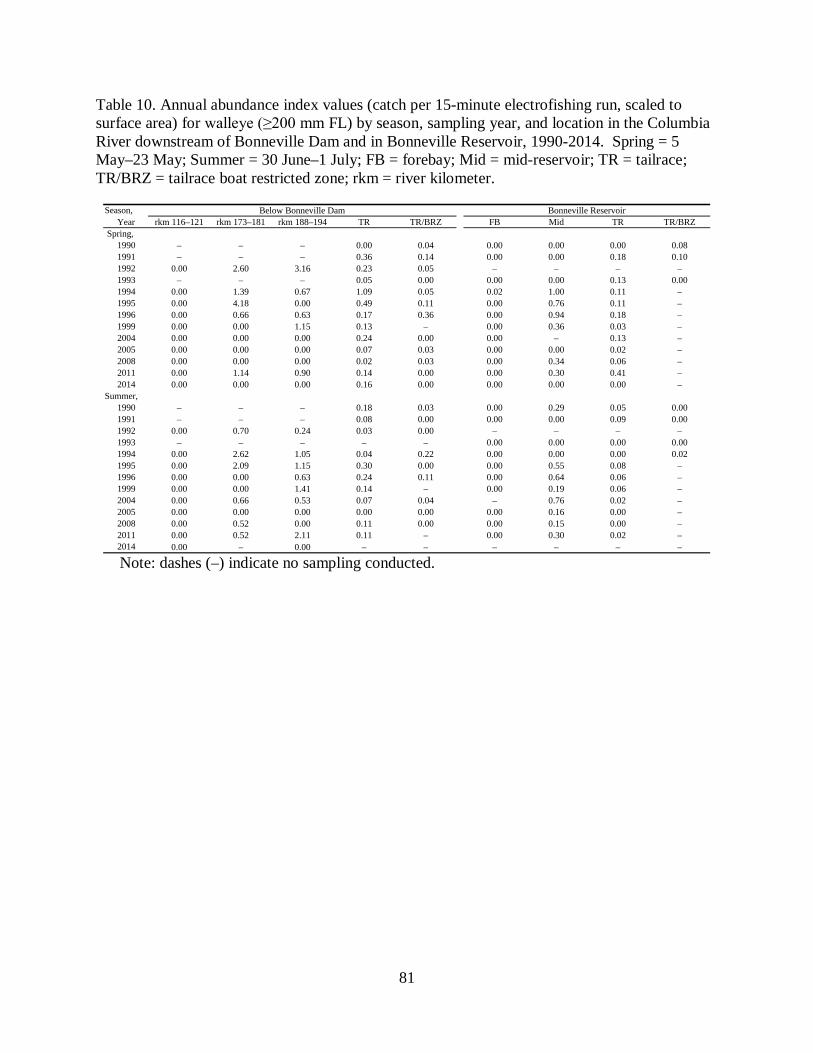
Table 10. Annual abundance index values (catch per 15-minute electrofishing run, scaled to surface area) for walleye (≥200 mm FL) by season, sampling year, and location in the Columbia River downstream of Bonneville Dam and in Bonneville Reservoir, 1990-2014. Spring = 5 May–23 May; Summer = 30 June–1 July; FB = forebay; Mid = mid-reservoir; TR = tailrace; TR/BRZ = tailrace boat restricted zone; rkm = river kilometer.
Note: dashes (–) indicate no sampling conducted.
Season,Year rkm 116–121 rkm 173–181 rkm 188–194 TR TR/BRZ FB Mid TR TR/BRZ
Spring,1990 – – – 0.00 0.04 0.00 0.00 0.00 0.081991 – – – 0.36 0.14 0.00 0.00 0.18 0.101992 0.00 2.60 3.16 0.23 0.05 – – – –1993 – – – 0.05 0.00 0.00 0.00 0.13 0.001994 0.00 1.39 0.67 1.09 0.05 0.02 1.00 0.11 –1995 0.00 4.18 0.00 0.49 0.11 0.00 0.76 0.11 –1996 0.00 0.66 0.63 0.17 0.36 0.00 0.94 0.18 –1999 0.00 0.00 1.15 0.13 – 0.00 0.36 0.03 –2004 0.00 0.00 0.00 0.24 0.00 0.00 – 0.13 –2005 0.00 0.00 0.00 0.07 0.03 0.00 0.00 0.02 –2008 0.00 0.00 0.00 0.02 0.03 0.00 0.34 0.06 –2011 0.00 1.14 0.90 0.14 0.00 0.00 0.30 0.41 –2014 0.00 0.00 0.00 0.16 0.00 0.00 0.00 0.00 –
Summer,1990 – – – 0.18 0.03 0.00 0.29 0.05 0.001991 – – – 0.08 0.00 0.00 0.00 0.09 0.001992 0.00 0.70 0.24 0.03 0.00 – – – –1993 – – – – – 0.00 0.00 0.00 0.001994 0.00 2.62 1.05 0.04 0.22 0.00 0.00 0.00 0.021995 0.00 2.09 1.15 0.30 0.00 0.00 0.55 0.08 –1996 0.00 0.00 0.63 0.24 0.11 0.00 0.64 0.06 –1999 0.00 0.00 1.41 0.14 – 0.00 0.19 0.06 –2004 0.00 0.66 0.53 0.07 0.04 – 0.76 0.02 –2005 0.00 0.00 0.00 0.00 0.00 0.00 0.16 0.00 –2008 0.00 0.52 0.00 0.11 0.00 0.00 0.15 0.00 –2011 0.00 0.52 2.11 0.11 – 0.00 0.30 0.02 –2014 0.00 – 0.00 – – – – – –
Below Bonneville Dam Bonneville Reservoir
81
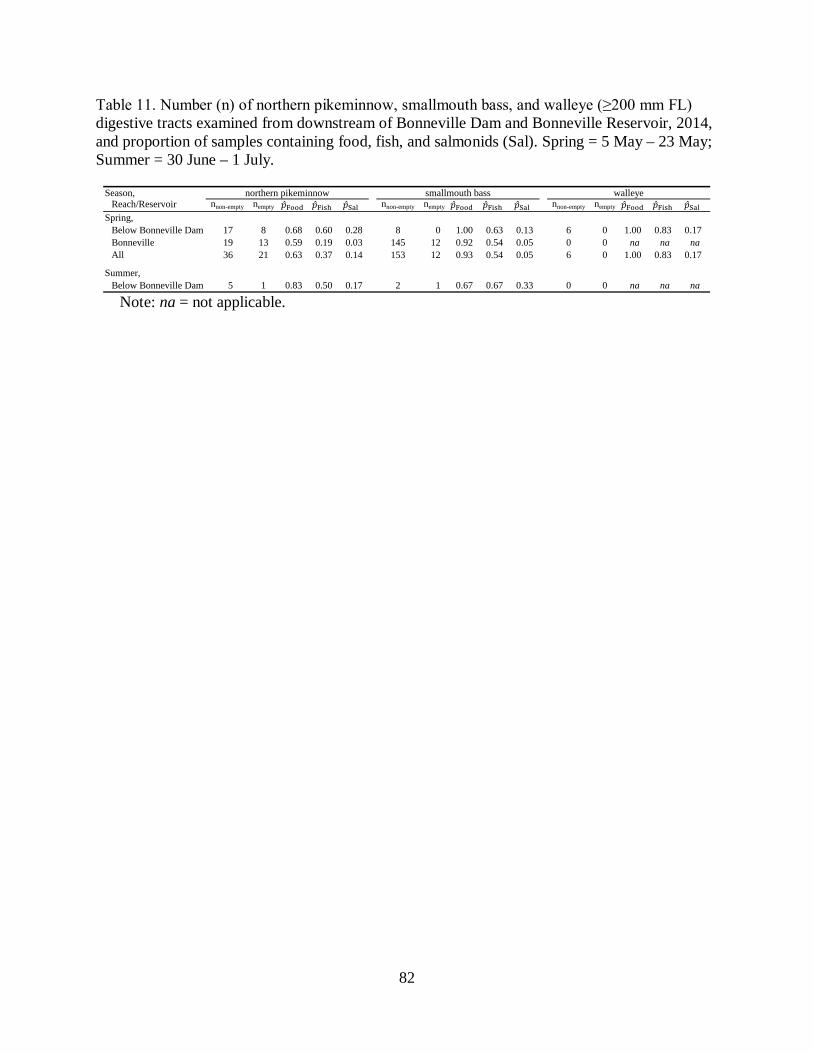
Table 11. Number (n) of northern pikeminnow, smallmouth bass, and walleye (≥200 mm FL) digestive tracts examined from downstream of Bonneville Dam and Bonneville Reservoir, 2014, and proportion of samples containing food, fish, and salmonids (Sal). Spring = 5 May – 23 May; Summer = 30 June – 1 July.
Note: na = not applicable.
Season,Reach/Reservoir nnon-empty nempty nnon-empty nempty nnon-empty nempty
Spring,Below Bonneville Dam 17 8 0.68 0.60 0.28 8 0 1.00 0.63 0.13 6 0 1.00 0.83 0.17Bonneville 19 13 0.59 0.19 0.03 145 12 0.92 0.54 0.05 0 0 na na naAll 36 21 0.63 0.37 0.14 153 12 0.93 0.54 0.05 6 0 1.00 0.83 0.17
Summer,Below Bonneville Dam 5 1 0.83 0.50 0.17 2 1 0.67 0.67 0.33 0 0 na na na
walleyesmallmouth bassnorthern pikeminnow
82
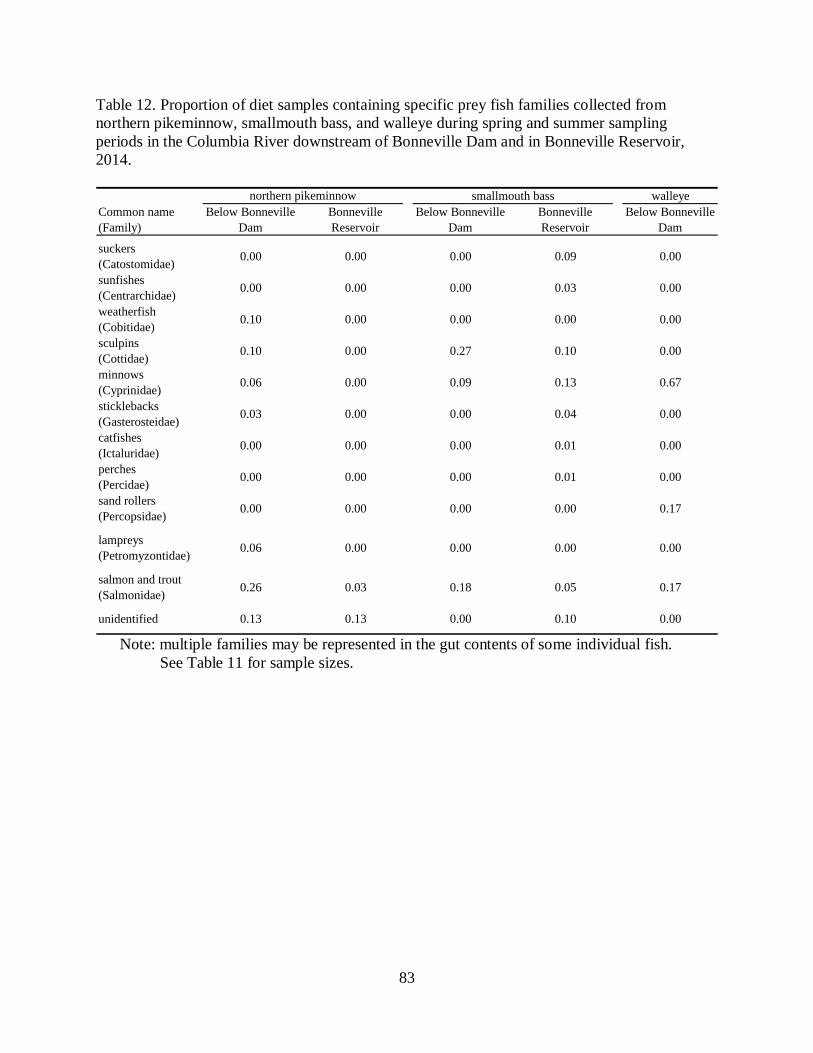
Table 12. Proportion of diet samples containing specific prey fish families collected from northern pikeminnow, smallmouth bass, and walleye during spring and summer sampling periods in the Columbia River downstream of Bonneville Dam and in Bonneville Reservoir, 2014.
Note: multiple families may be represented in the gut contents of some individual fish.
See Table 11 for sample sizes.
walleyeCommon name (Family)
Below Bonneville Dam
Bonneville Reservoir
Below Bonneville Dam
Bonneville Reservoir
Below Bonneville Dam
suckers (Catostomidae) 0.00 0.00 0.00 0.09 0.00
sunfishes (Centrarchidae) 0.00 0.00 0.00 0.03 0.00
weatherfish (Cobitidae) 0.10 0.00 0.00 0.00 0.00
sculpins (Cottidae) 0.10 0.00 0.27 0.10 0.00
minnows (Cyprinidae) 0.06 0.00 0.09 0.13 0.67
sticklebacks (Gasterosteidae) 0.03 0.00 0.00 0.04 0.00
catfishes (Ictaluridae) 0.00 0.00 0.00 0.01 0.00
perches (Percidae) 0.00 0.00 0.00 0.01 0.00
sand rollers (Percopsidae) 0.00 0.00 0.00 0.00 0.17
lampreys (Petromyzontidae) 0.06 0.00 0.00 0.00 0.00
salmon and trout (Salmonidae) 0.26 0.03 0.18 0.05 0.17
unidentified 0.13 0.13 0.00 0.10 0.00
northern pikeminnow smallmouth bass
83
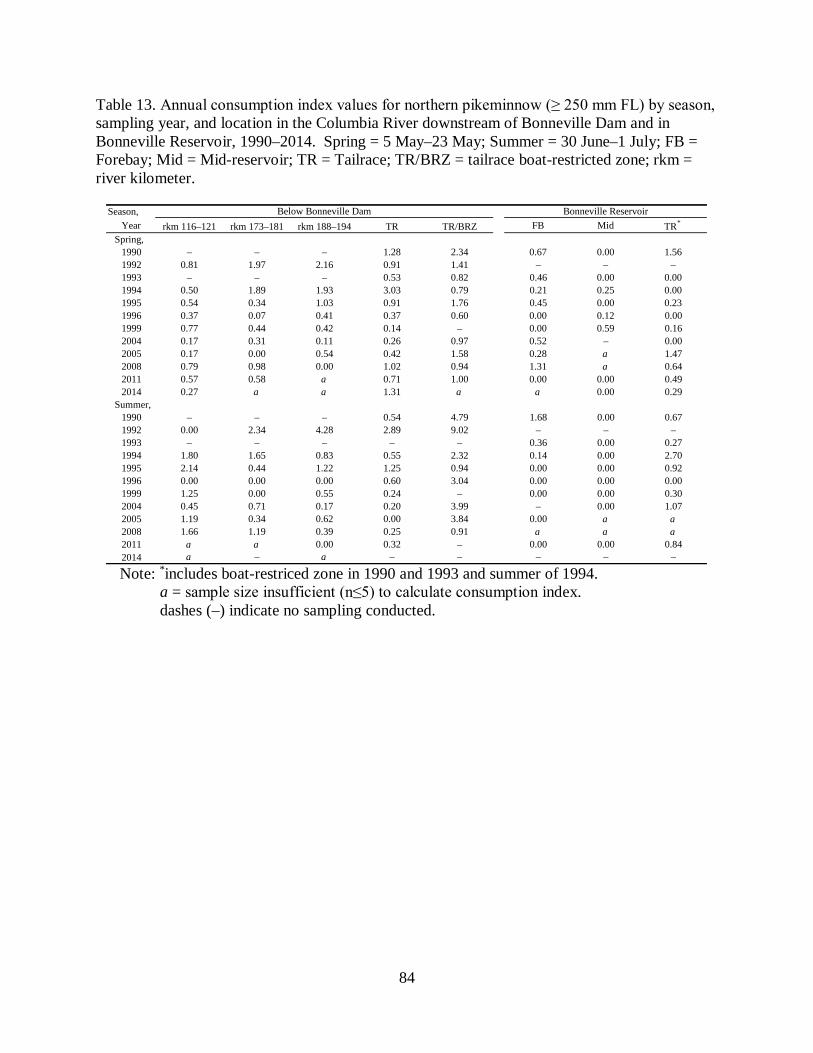
Table 13. Annual consumption index values for northern pikeminnow (≥ 250 mm FL) by season, sampling year, and location in the Columbia River downstream of Bonneville Dam and in Bonneville Reservoir, 1990–2014. Spring = 5 May–23 May; Summer = 30 June–1 July; FB = Forebay; Mid = Mid-reservoir; TR = Tailrace; TR/BRZ = tailrace boat-restricted zone; rkm = river kilometer.
Note: *includes boat-restriced zone in 1990 and 1993 and summer of 1994.
a = sample size insufficient (n≤5) to calculate consumption index. dashes (–) indicate no sampling conducted.
Season, Year rkm 116–121 rkm 173–181 rkm 188–194 TR TR/BRZ FB Mid TR*
Spring,1990 – – – 1.28 2.34 0.67 0.00 1.561992 0.81 1.97 2.16 0.91 1.41 – – –1993 – – – 0.53 0.82 0.46 0.00 0.001994 0.50 1.89 1.93 3.03 0.79 0.21 0.25 0.001995 0.54 0.34 1.03 0.91 1.76 0.45 0.00 0.231996 0.37 0.07 0.41 0.37 0.60 0.00 0.12 0.001999 0.77 0.44 0.42 0.14 – 0.00 0.59 0.162004 0.17 0.31 0.11 0.26 0.97 0.52 – 0.002005 0.17 0.00 0.54 0.42 1.58 0.28 a 1.472008 0.79 0.98 0.00 1.02 0.94 1.31 a 0.642011 0.57 0.58 a 0.71 1.00 0.00 0.00 0.492014 0.27 a a 1.31 a a 0.00 0.29
Summer,1990 – – – 0.54 4.79 1.68 0.00 0.671992 0.00 2.34 4.28 2.89 9.02 – – –1993 – – – – – 0.36 0.00 0.271994 1.80 1.65 0.83 0.55 2.32 0.14 0.00 2.701995 2.14 0.44 1.22 1.25 0.94 0.00 0.00 0.921996 0.00 0.00 0.00 0.60 3.04 0.00 0.00 0.001999 1.25 0.00 0.55 0.24 – 0.00 0.00 0.302004 0.45 0.71 0.17 0.20 3.99 – 0.00 1.072005 1.19 0.34 0.62 0.00 3.84 0.00 a a2008 1.66 1.19 0.39 0.25 0.91 a a a2011 a a 0.00 0.32 – 0.00 0.00 0.842014 a – a – – – – –
Bonneville ReservoirBelow Bonneville Dam
84
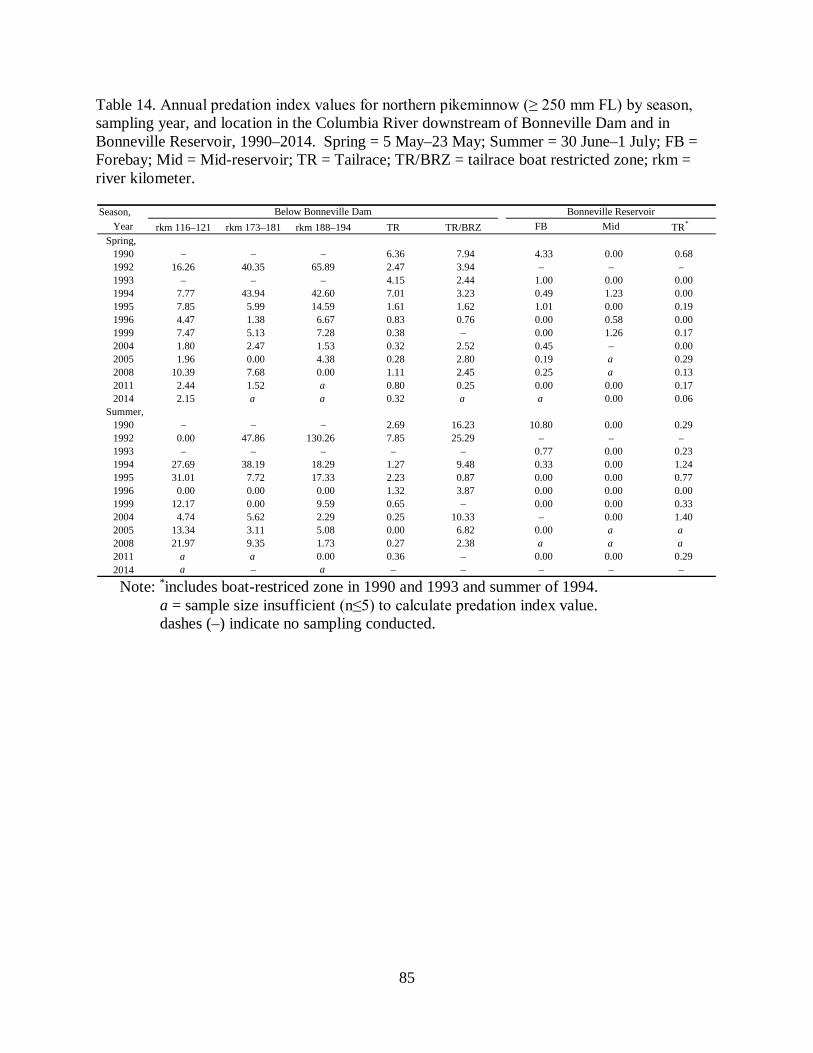
Table 14. Annual predation index values for northern pikeminnow (≥ 250 mm FL) by season, sampling year, and location in the Columbia River downstream of Bonneville Dam and in Bonneville Reservoir, 1990–2014. Spring = 5 May–23 May; Summer = 30 June–1 July; FB = Forebay; Mid = Mid-reservoir; TR = Tailrace; TR/BRZ = tailrace boat restricted zone; rkm = river kilometer.
Note: *includes boat-restriced zone in 1990 and 1993 and summer of 1994.
a = sample size insufficient (n≤5) to calculate predation index value. dashes (–) indicate no sampling conducted.
Season, Year rkm 116–121 rkm 173–181 rkm 188–194 TR TR/BRZ FB Mid TR*
Spring,1990 – – – 6.36 7.94 4.33 0.00 0.681992 16.26 40.35 65.89 2.47 3.94 – – –1993 – – – 4.15 2.44 1.00 0.00 0.001994 7.77 43.94 42.60 7.01 3.23 0.49 1.23 0.001995 7.85 5.99 14.59 1.61 1.62 1.01 0.00 0.191996 4.47 1.38 6.67 0.83 0.76 0.00 0.58 0.001999 7.47 5.13 7.28 0.38 – 0.00 1.26 0.172004 1.80 2.47 1.53 0.32 2.52 0.45 – 0.002005 1.96 0.00 4.38 0.28 2.80 0.19 a 0.292008 10.39 7.68 0.00 1.11 2.45 0.25 a 0.132011 2.44 1.52 a 0.80 0.25 0.00 0.00 0.172014 2.15 a a 0.32 a a 0.00 0.06
Summer,1990 – – – 2.69 16.23 10.80 0.00 0.291992 0.00 47.86 130.26 7.85 25.29 – – –1993 – – – – – 0.77 0.00 0.231994 27.69 38.19 18.29 1.27 9.48 0.33 0.00 1.241995 31.01 7.72 17.33 2.23 0.87 0.00 0.00 0.771996 0.00 0.00 0.00 1.32 3.87 0.00 0.00 0.001999 12.17 0.00 9.59 0.65 – 0.00 0.00 0.332004 4.74 5.62 2.29 0.25 10.33 – 0.00 1.402005 13.34 3.11 5.08 0.00 6.82 0.00 a a2008 21.97 9.35 1.73 0.27 2.38 a a a2011 a a 0.00 0.36 – 0.00 0.00 0.292014 a – a – – – – –
Below Bonneville Dam Bonneville Reservoir
85
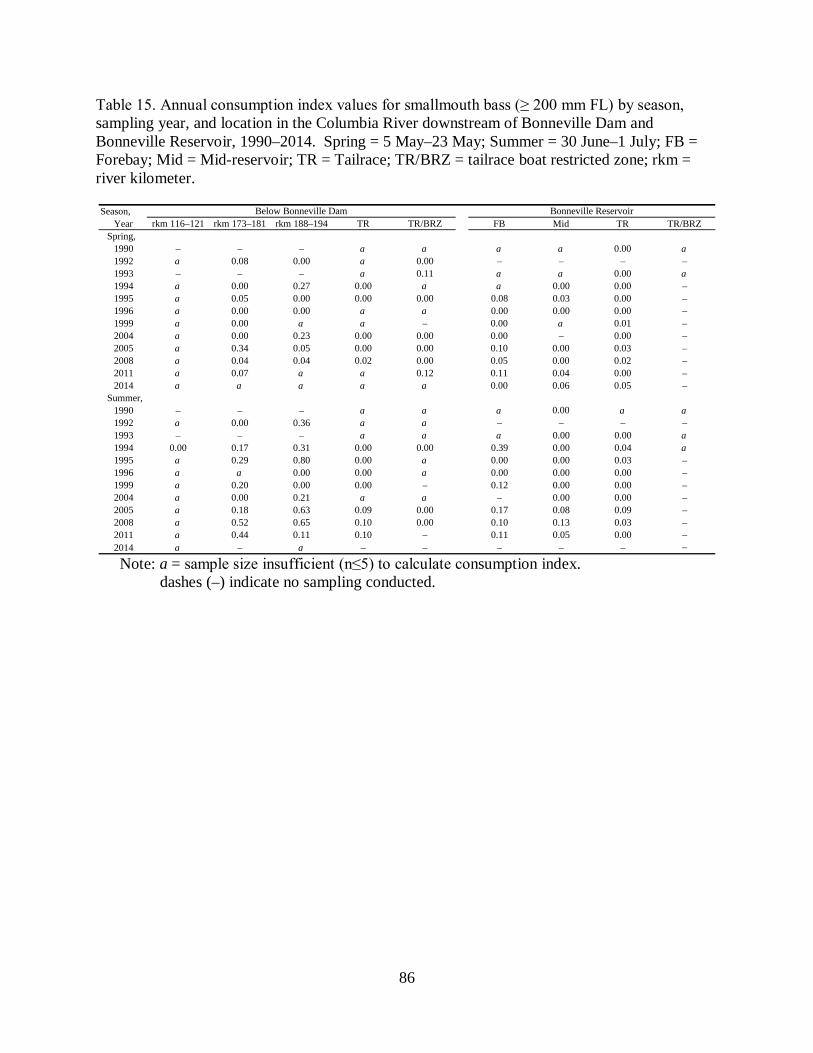
Table 15. Annual consumption index values for smallmouth bass (≥ 200 mm FL) by season, sampling year, and location in the Columbia River downstream of Bonneville Dam and Bonneville Reservoir, 1990–2014. Spring = 5 May–23 May; Summer = 30 June–1 July; FB = Forebay; Mid = Mid-reservoir; TR = Tailrace; TR/BRZ = tailrace boat restricted zone; rkm = river kilometer.
Note: a = sample size insufficient (n≤5) to calculate consumption index.
dashes (–) indicate no sampling conducted.
Season, Year rkm 116–121 rkm 173–181 rkm 188–194 TR TR/BRZ FB Mid TR TR/BRZ
Spring,1990 – – – a a a a 0.00 a1992 a 0.08 0.00 a 0.00 – – – –1993 – – – a 0.11 a a 0.00 a1994 a 0.00 0.27 0.00 a a 0.00 0.00 –1995 a 0.05 0.00 0.00 0.00 0.08 0.03 0.00 –1996 a 0.00 0.00 a a 0.00 0.00 0.00 –1999 a 0.00 a a – 0.00 a 0.01 –2004 a 0.00 0.23 0.00 0.00 0.00 – 0.00 –2005 a 0.34 0.05 0.00 0.00 0.10 0.00 0.03 –2008 a 0.04 0.04 0.02 0.00 0.05 0.00 0.02 –2011 a 0.07 a a 0.12 0.11 0.04 0.00 –2014 a a a a a 0.00 0.06 0.05 –
Summer,1990 – – – a a a 0.00 a a1992 a 0.00 0.36 a a – – – –1993 – – – a a a 0.00 0.00 a1994 0.00 0.17 0.31 0.00 0.00 0.39 0.00 0.04 a1995 a 0.29 0.80 0.00 a 0.00 0.00 0.03 –1996 a a 0.00 0.00 a 0.00 0.00 0.00 –1999 a 0.20 0.00 0.00 – 0.12 0.00 0.00 –2004 a 0.00 0.21 a a – 0.00 0.00 –2005 a 0.18 0.63 0.09 0.00 0.17 0.08 0.09 –2008 a 0.52 0.65 0.10 0.00 0.10 0.13 0.03 –2011 a 0.44 0.11 0.10 – 0.11 0.05 0.00 –2014 a – a – – – – – –
Below Bonneville Dam Bonneville Reservoir
86
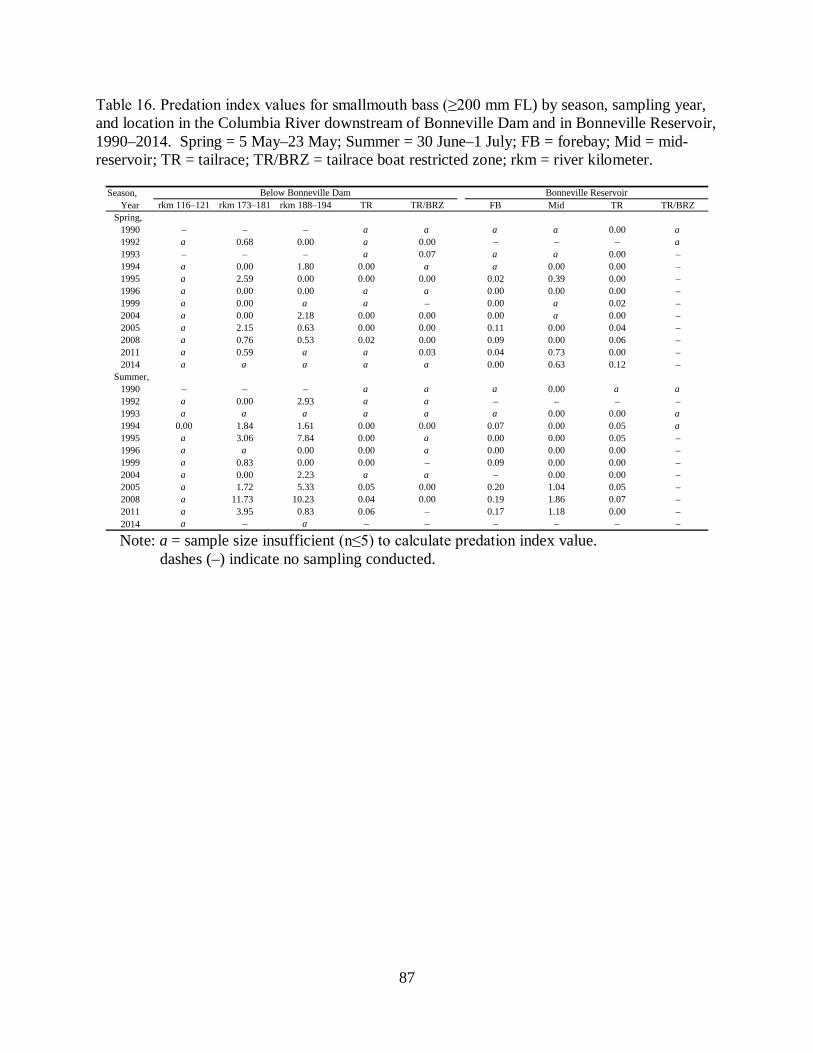
Table 16. Predation index values for smallmouth bass (≥200 mm FL) by season, sampling year, and location in the Columbia River downstream of Bonneville Dam and in Bonneville Reservoir, 1990–2014. Spring = 5 May–23 May; Summer = 30 June–1 July; FB = forebay; Mid = mid-reservoir; TR = tailrace; TR/BRZ = tailrace boat restricted zone; rkm = river kilometer.
Note: a = sample size insufficient (n≤5) to calculate predation index value.
dashes (–) indicate no sampling conducted.
Season, Year rkm 116–121 rkm 173–181 rkm 188–194 TR TR/BRZ FB Mid TR TR/BRZ
Spring,1990 – – – a a a a 0.00 a1992 a 0.68 0.00 a 0.00 – – – a1993 – – – a 0.07 a a 0.00 –1994 a 0.00 1.80 0.00 a a 0.00 0.00 –1995 a 2.59 0.00 0.00 0.00 0.02 0.39 0.00 –1996 a 0.00 0.00 a a 0.00 0.00 0.00 –1999 a 0.00 a a – 0.00 a 0.02 –2004 a 0.00 2.18 0.00 0.00 0.00 a 0.00 –2005 a 2.15 0.63 0.00 0.00 0.11 0.00 0.04 –2008 a 0.76 0.53 0.02 0.00 0.09 0.00 0.06 –2011 a 0.59 a a 0.03 0.04 0.73 0.00 –2014 a a a a a 0.00 0.63 0.12 –
Summer,1990 – – – a a a 0.00 a a1992 a 0.00 2.93 a a – – – –1993 a a a a a a 0.00 0.00 a1994 0.00 1.84 1.61 0.00 0.00 0.07 0.00 0.05 a1995 a 3.06 7.84 0.00 a 0.00 0.00 0.05 –1996 a a 0.00 0.00 a 0.00 0.00 0.00 –1999 a 0.83 0.00 0.00 – 0.09 0.00 0.00 –2004 a 0.00 2.23 a a – 0.00 0.00 –2005 a 1.72 5.33 0.05 0.00 0.20 1.04 0.05 –2008 a 11.73 10.23 0.04 0.00 0.19 1.86 0.07 –2011 a 3.95 0.83 0.06 – 0.17 1.18 0.00 –2014 a – a – – – – – –
Below Bonneville Dam Bonneville Reservoir
87
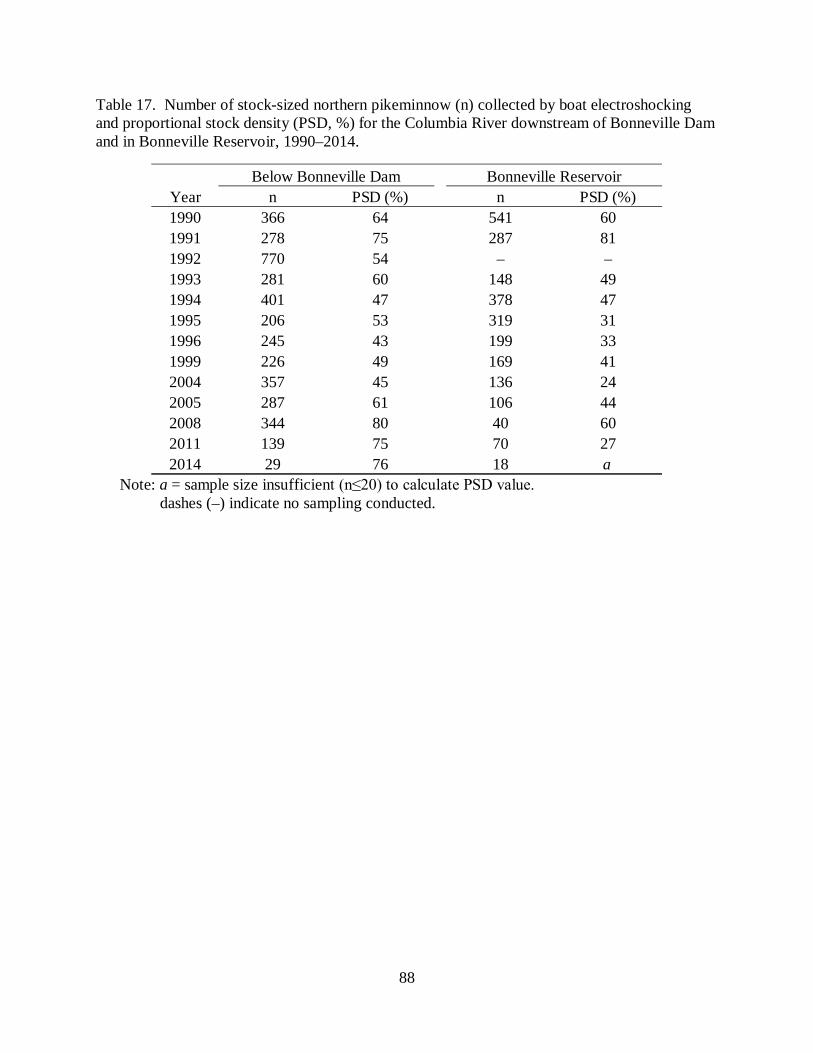
Table 17. Number of stock-sized northern pikeminnow (n) collected by boat electroshocking and proportional stock density (PSD, %) for the Columbia River downstream of Bonneville Dam and in Bonneville Reservoir, 1990–2014.
Note: a = sample size insufficient (n≤20) to calculate PSD value.
dashes (–) indicate no sampling conducted.
Year n PSD (%) n PSD (%)1990 366 64 541 601991 278 75 287 811992 770 54 – –1993 281 60 148 491994 401 47 378 471995 206 53 319 311996 245 43 199 331999 226 49 169 412004 357 45 136 242005 287 61 106 442008 344 80 40 602011 139 75 70 272014 29 76 18 a
Below Bonneville Dam Bonneville Reservoir
88
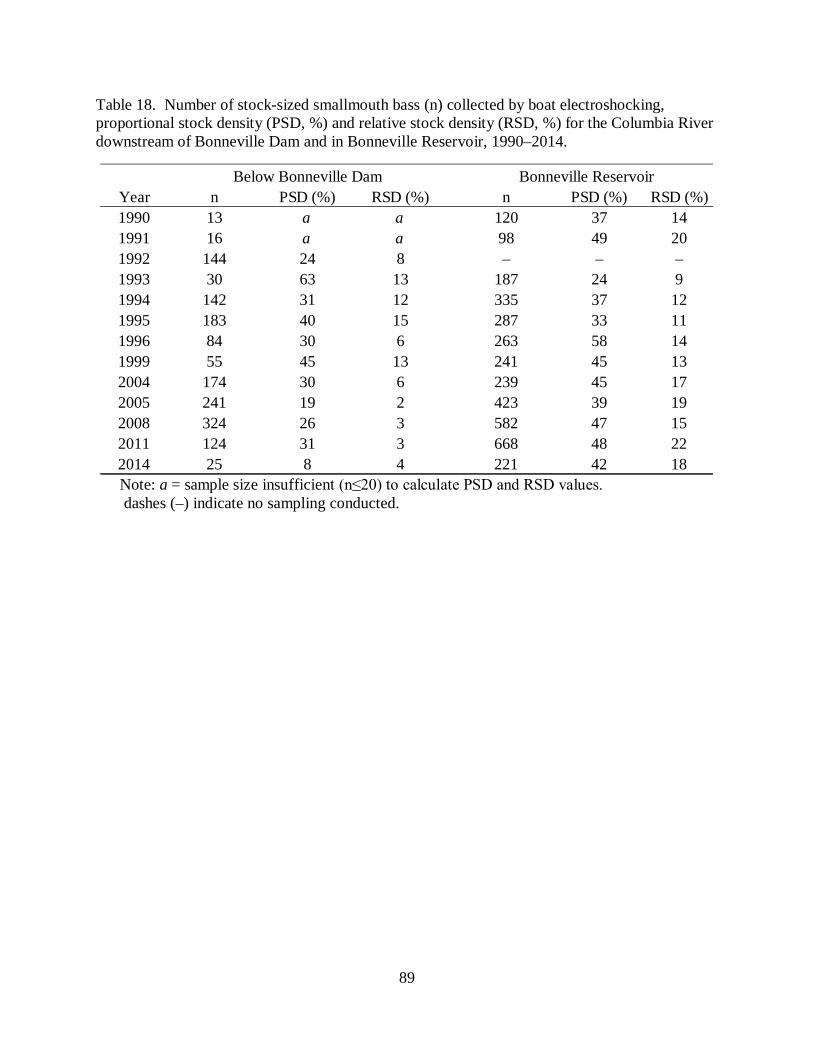
Table 18. Number of stock-sized smallmouth bass (n) collected by boat electroshocking, proportional stock density (PSD, %) and relative stock density (RSD, %) for the Columbia River downstream of Bonneville Dam and in Bonneville Reservoir, 1990–2014.
Note: a = sample size insufficient (n≤20) to calculate PSD and RSD values. dashes (–) indicate no sampling conducted.
Year n PSD (%) RSD (%) n PSD (%) RSD (%)1990 13 a a 120 37 141991 16 a a 98 49 201992 144 24 8 – – –1993 30 63 13 187 24 91994 142 31 12 335 37 121995 183 40 15 287 33 111996 84 30 6 263 58 141999 55 45 13 241 45 132004 174 30 6 239 45 172005 241 19 2 423 39 192008 324 26 3 582 47 152011 124 31 3 668 48 222014 25 8 4 221 42 18
Below Bonneville Dam Bonneville Reservoir
89
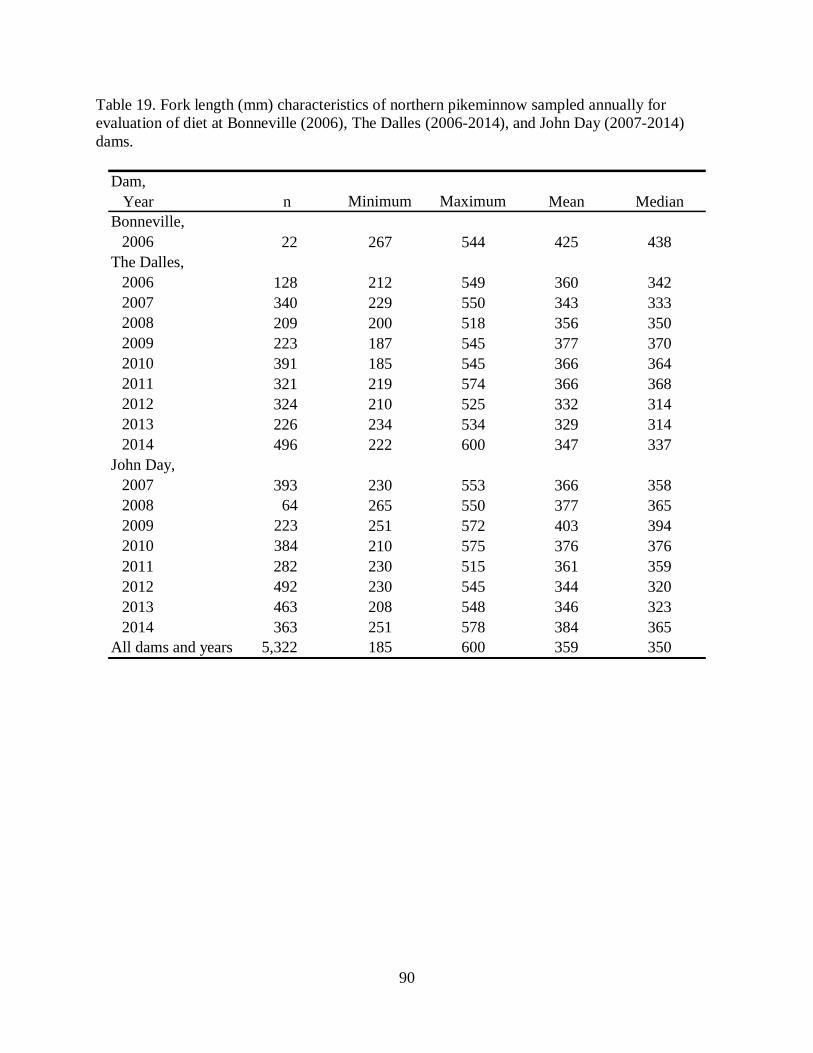
Table 19. Fork length (mm) characteristics of northern pikeminnow sampled annually for evaluation of diet at Bonneville (2006), The Dalles (2006-2014), and John Day (2007-2014) dams.
Dam, Year n Minimum Maximum Mean MedianBonneville,
2006 22 267 544 425 438The Dalles,
2006 128 212 549 360 3422007 340 229 550 343 3332008 209 200 518 356 3502009 223 187 545 377 3702010 391 185 545 366 3642011 321 219 574 366 3682012 324 210 525 332 3142013 226 234 534 329 3142014 496 222 600 347 337
John Day,2007 393 230 553 366 3582008 64 265 550 377 3652009 223 251 572 403 3942010 384 210 575 376 3762011 282 230 515 361 3592012 492 230 545 344 3202013 463 208 548 346 3232014 363 251 578 384 365
All dams and years 5,322 185 600 359 350
90
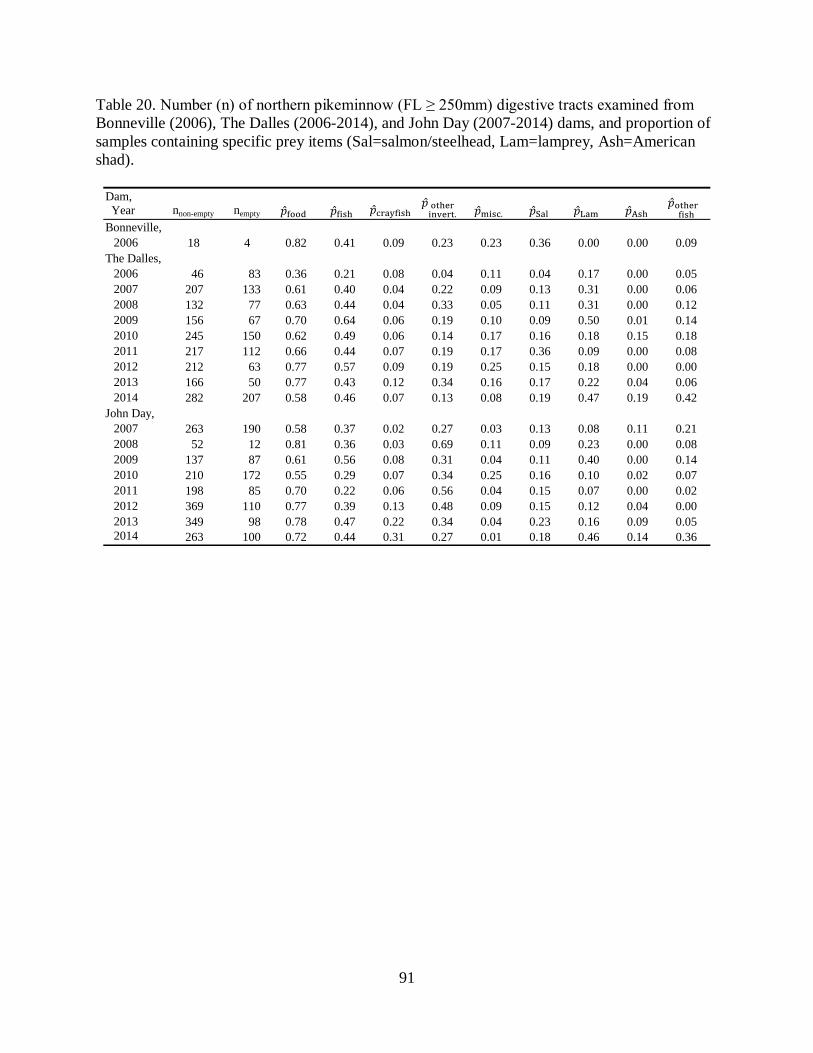
Table 20. Number (n) of northern pikeminnow (FL ≥ 250mm) digestive tracts examined from Bonneville (2006), The Dalles (2006-2014), and John Day (2007-2014) dams, and proportion of samples containing specific prey items (Sal=salmon/steelhead, Lam=lamprey, Ash=American shad).
Dam, Year nnon-empty nempty
2006 18 4 0.82 0.41 0.09 0.23 0.23 0.36 0.00 0.00 0.09
2006 46 83 0.36 0.21 0.08 0.04 0.11 0.04 0.17 0.00 0.052007 207 133 0.61 0.40 0.04 0.22 0.09 0.13 0.31 0.00 0.062008 132 77 0.63 0.44 0.04 0.33 0.05 0.11 0.31 0.00 0.122009 156 67 0.70 0.64 0.06 0.19 0.10 0.09 0.50 0.01 0.142010 245 150 0.62 0.49 0.06 0.14 0.17 0.16 0.18 0.15 0.182011 217 112 0.66 0.44 0.07 0.19 0.17 0.36 0.09 0.00 0.082012 212 63 0.77 0.57 0.09 0.19 0.25 0.15 0.18 0.00 0.002013 166 50 0.77 0.43 0.12 0.34 0.16 0.17 0.22 0.04 0.062014 282 207 0.58 0.46 0.07 0.13 0.08 0.19 0.47 0.19 0.42
2007 263 190 0.58 0.37 0.02 0.27 0.03 0.13 0.08 0.11 0.212008 52 12 0.81 0.36 0.03 0.69 0.11 0.09 0.23 0.00 0.082009 137 87 0.61 0.56 0.08 0.31 0.04 0.11 0.40 0.00 0.142010 210 172 0.55 0.29 0.07 0.34 0.25 0.16 0.10 0.02 0.072011 198 85 0.70 0.22 0.06 0.56 0.04 0.15 0.07 0.00 0.022012 369 110 0.77 0.39 0.13 0.48 0.09 0.15 0.12 0.04 0.002013 349 98 0.78 0.47 0.22 0.34 0.04 0.23 0.16 0.09 0.052014 263 100 0.72 0.44 0.31 0.27 0.01 0.18 0.46 0.14 0.36
John Day,
Bonneville,
The Dalles,
91
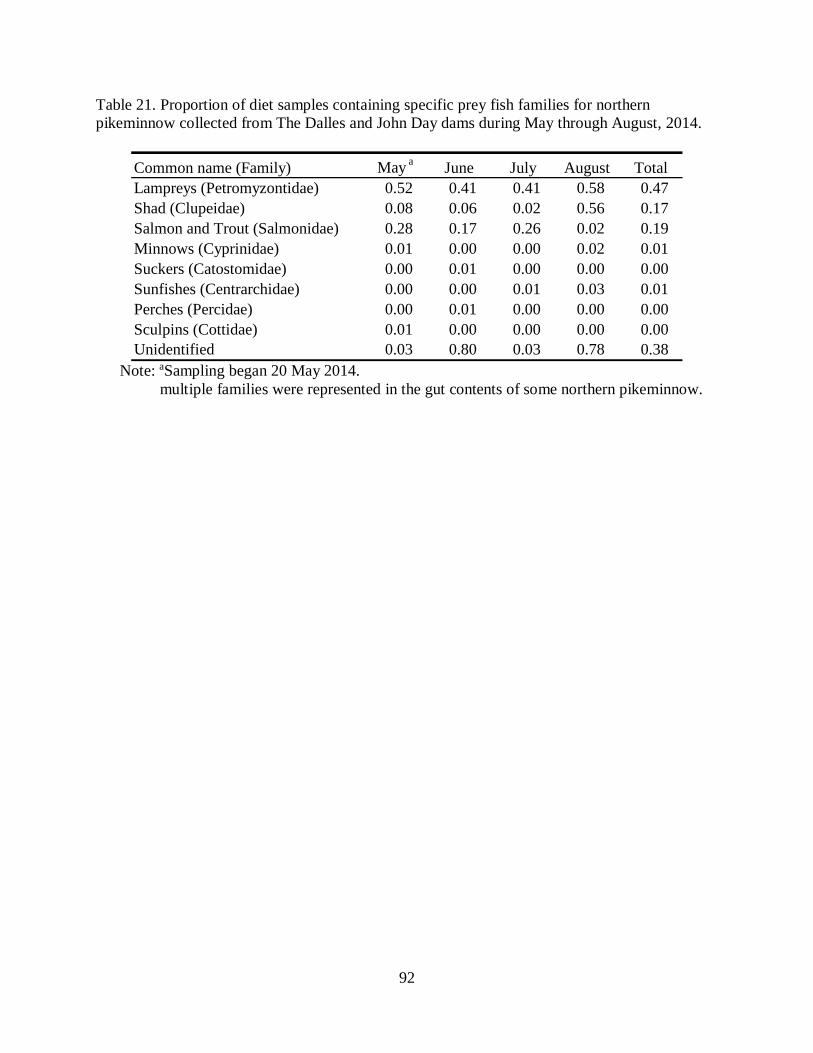
Table 21. Proportion of diet samples containing specific prey fish families for northern pikeminnow collected from The Dalles and John Day dams during May through August, 2014.
Note: aSampling began 20 May 2014.
multiple families were represented in the gut contents of some northern pikeminnow.
Common name (Family) May a June July August TotalLampreys (Petromyzontidae) 0.52 0.41 0.41 0.58 0.47Shad (Clupeidae) 0.08 0.06 0.02 0.56 0.17Salmon and Trout (Salmonidae) 0.28 0.17 0.26 0.02 0.19Minnows (Cyprinidae) 0.01 0.00 0.00 0.02 0.01Suckers (Catostomidae) 0.00 0.01 0.00 0.00 0.00Sunfishes (Centrarchidae) 0.00 0.00 0.01 0.03 0.01Perches (Percidae) 0.00 0.01 0.00 0.00 0.00Sculpins (Cottidae) 0.01 0.00 0.00 0.00 0.00Unidentified 0.03 0.80 0.03 0.78 0.38
92
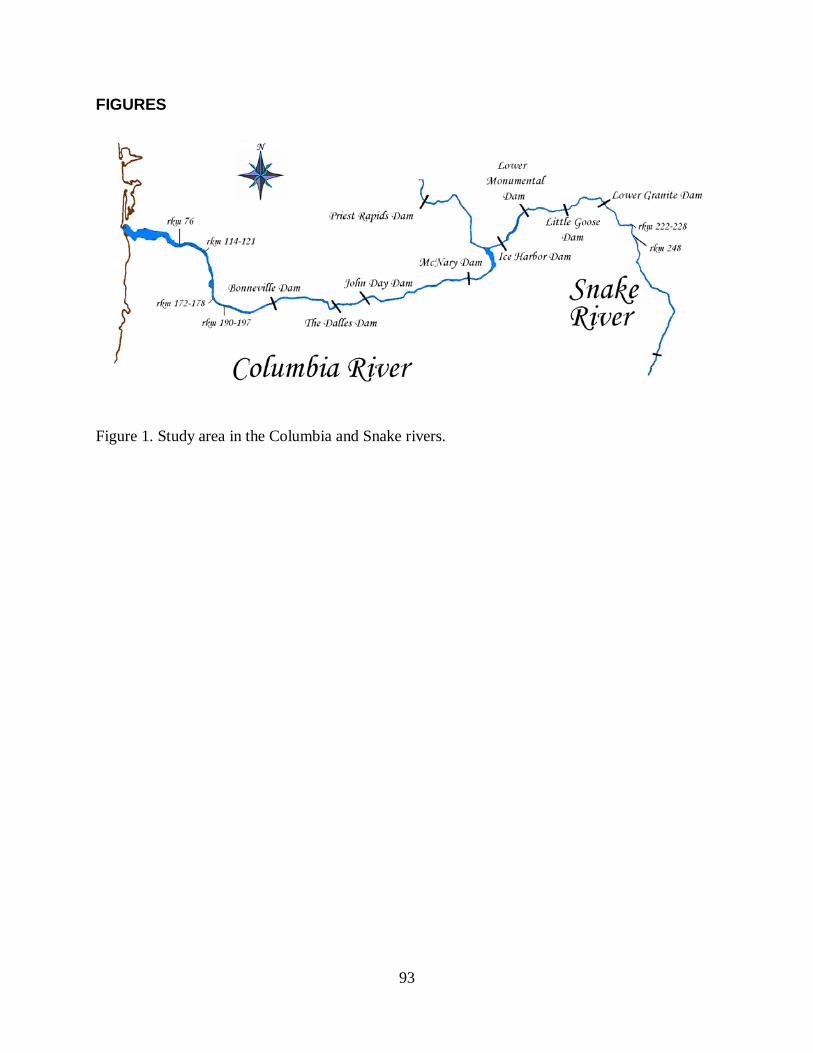
FIGURES
Figure 1. Study area in the Columbia and Snake rivers.
93
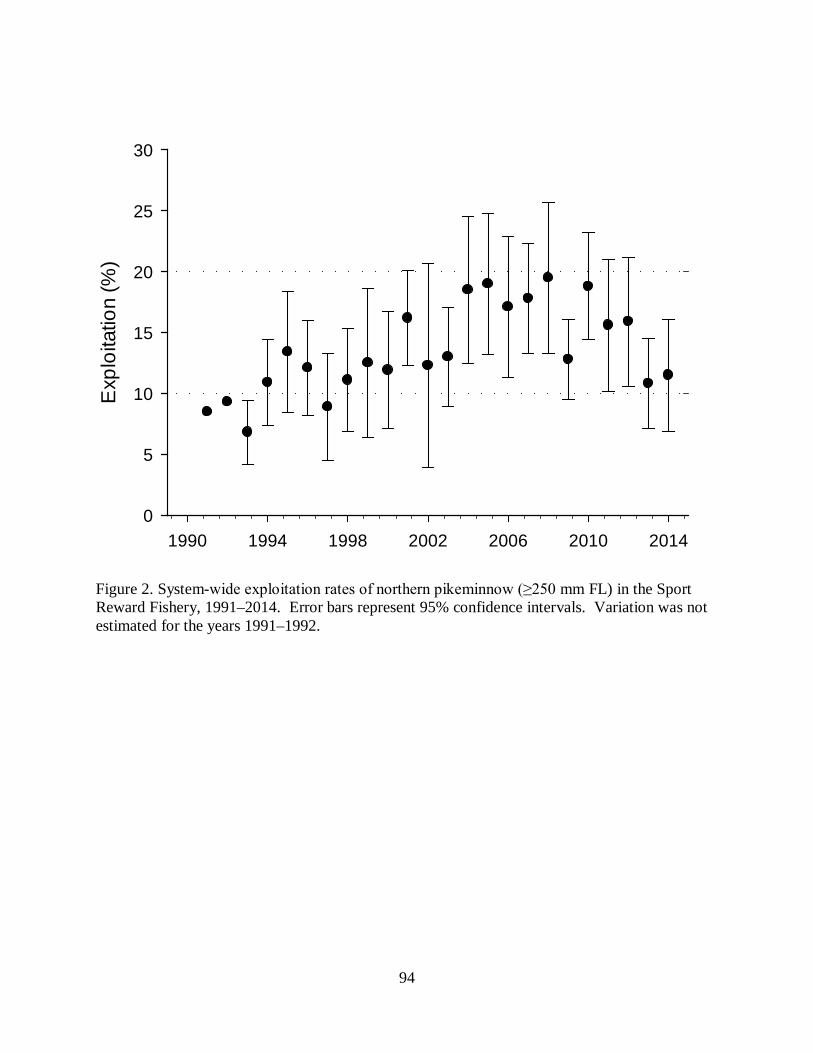
1990 1994 1998 2002 2006 2010 2014
Exp
loita
tion
(%)
0
5
10
15
20
25
30
Figure 2. System-wide exploitation rates of northern pikeminnow (≥250 mm FL) in the Sport Reward Fishery, 1991–2014. Error bars represent 95% confidence intervals. Variation was not estimated for the years 1991–1992.
94
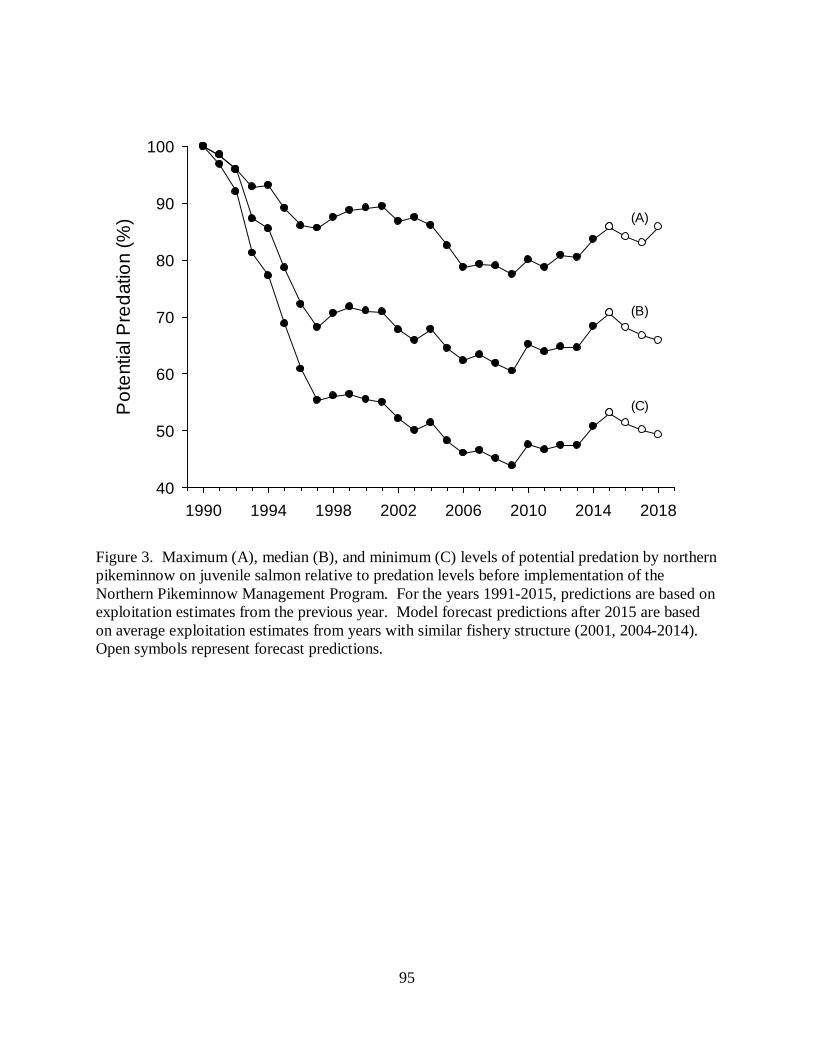
1990 1994 1998 2002 2006 2010 2014 2018
Pot
entia
l Pre
datio
n (%
)
40
50
60
70
80
90
100
(A)
(B)
(C)
Figure 3. Maximum (A), median (B), and minimum (C) levels of potential predation by northern pikeminnow on juvenile salmon relative to predation levels before implementation of the Northern Pikeminnow Management Program. For the years 1991-2015, predictions are based on exploitation estimates from the previous year. Model forecast predictions after 2015 are based on average exploitation estimates from years with similar fishery structure (2001, 2004-2014). Open symbols represent forecast predictions.
95
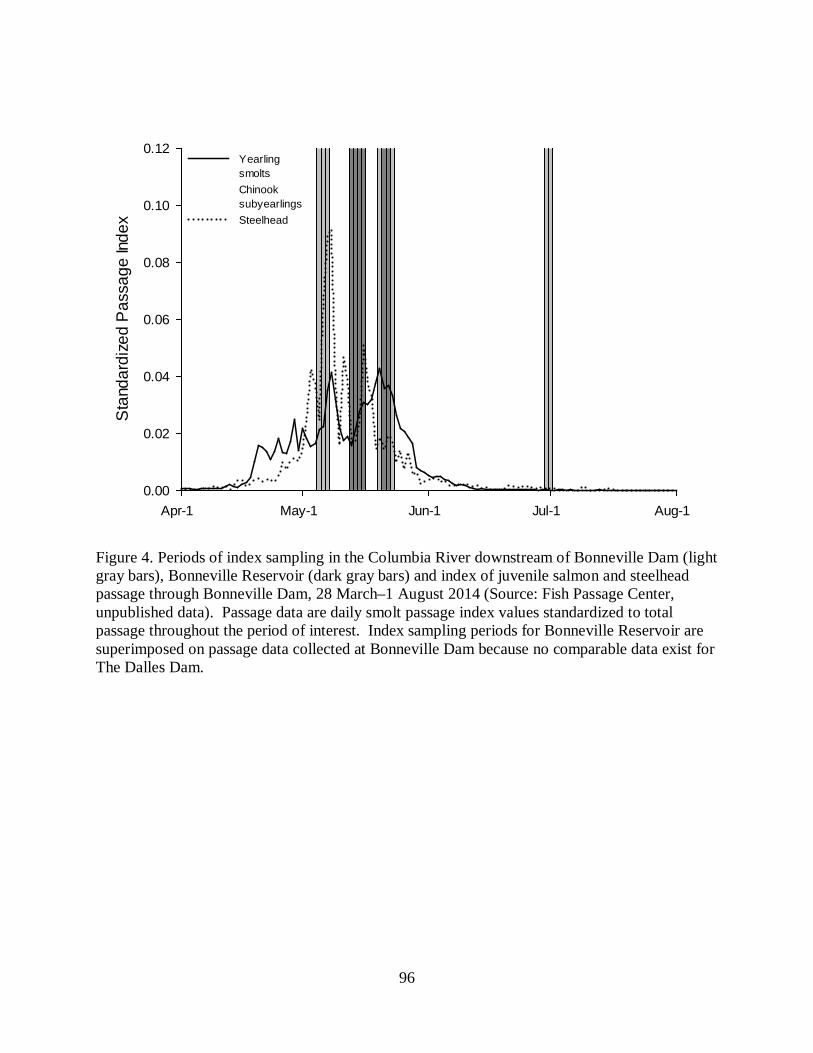
Apr-1 May-1 Jun-1 Jul-1 Aug-1
Sta
ndar
dize
d P
assa
ge In
dex
0.00
0.02
0.04
0.06
0.08
0.10
0.12YearlingsmoltsChinooksubyearlingsSteelhead
Figure 4. Periods of index sampling in the Columbia River downstream of Bonneville Dam (light gray bars), Bonneville Reservoir (dark gray bars) and index of juvenile salmon and steelhead passage through Bonneville Dam, 28 March–1 August 2014 (Source: Fish Passage Center, unpublished data). Passage data are daily smolt passage index values standardized to total passage throughout the period of interest. Index sampling periods for Bonneville Reservoir are superimposed on passage data collected at Bonneville Dam because no comparable data exist for The Dalles Dam.
96
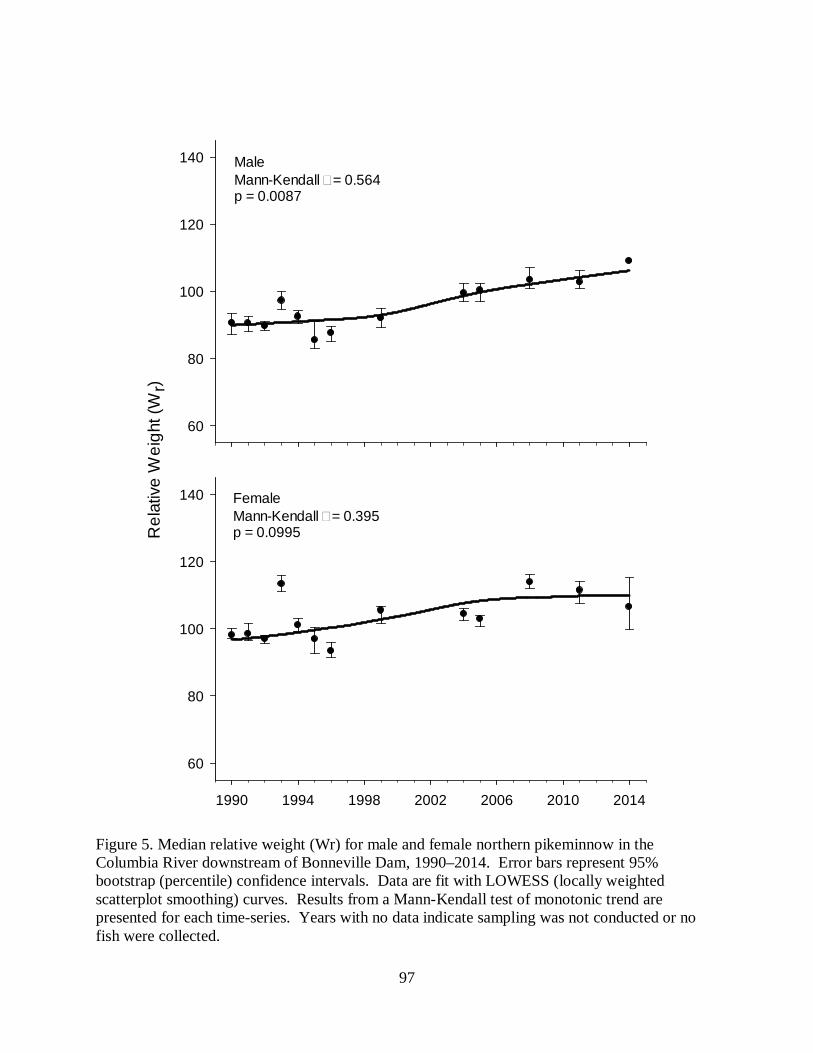
1990 1994 1998 2002 2006 2010 2014
Rel
ativ
e W
eigh
t (W
r)
60
80
100
120
140
60
80
100
120
140 MaleMann-Kendall = 0.564p = 0.0087
FemaleMann-Kendall = 0.395p = 0.0995
Figure 5. Median relative weight (Wr) for male and female northern pikeminnow in the Columbia River downstream of Bonneville Dam, 1990–2014. Error bars represent 95% bootstrap (percentile) confidence intervals. Data are fit with LOWESS (locally weighted scatterplot smoothing) curves. Results from a Mann-Kendall test of monotonic trend are presented for each time-series. Years with no data indicate sampling was not conducted or no fish were collected.
97
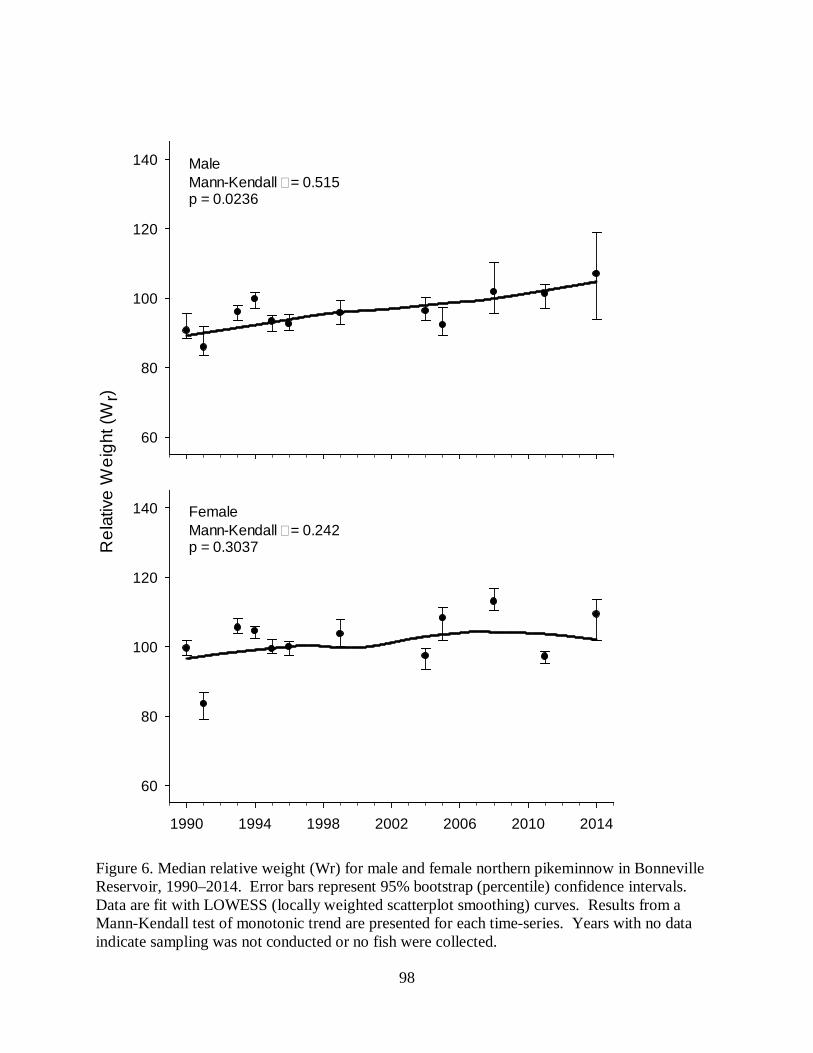
60
80
100
120
140
1990 1994 1998 2002 2006 2010 2014
Rel
ativ
e W
eigh
t (W
r)
60
80
100
120
140
MaleMann-Kendall = 0.515p = 0.0236
FemaleMann-Kendall = 0.242p = 0.3037
Figure 6. Median relative weight (Wr) for male and female northern pikeminnow in Bonneville Reservoir, 1990–2014. Error bars represent 95% bootstrap (percentile) confidence intervals. Data are fit with LOWESS (locally weighted scatterplot smoothing) curves. Results from a Mann-Kendall test of monotonic trend are presented for each time-series. Years with no data indicate sampling was not conducted or no fish were collected.
98
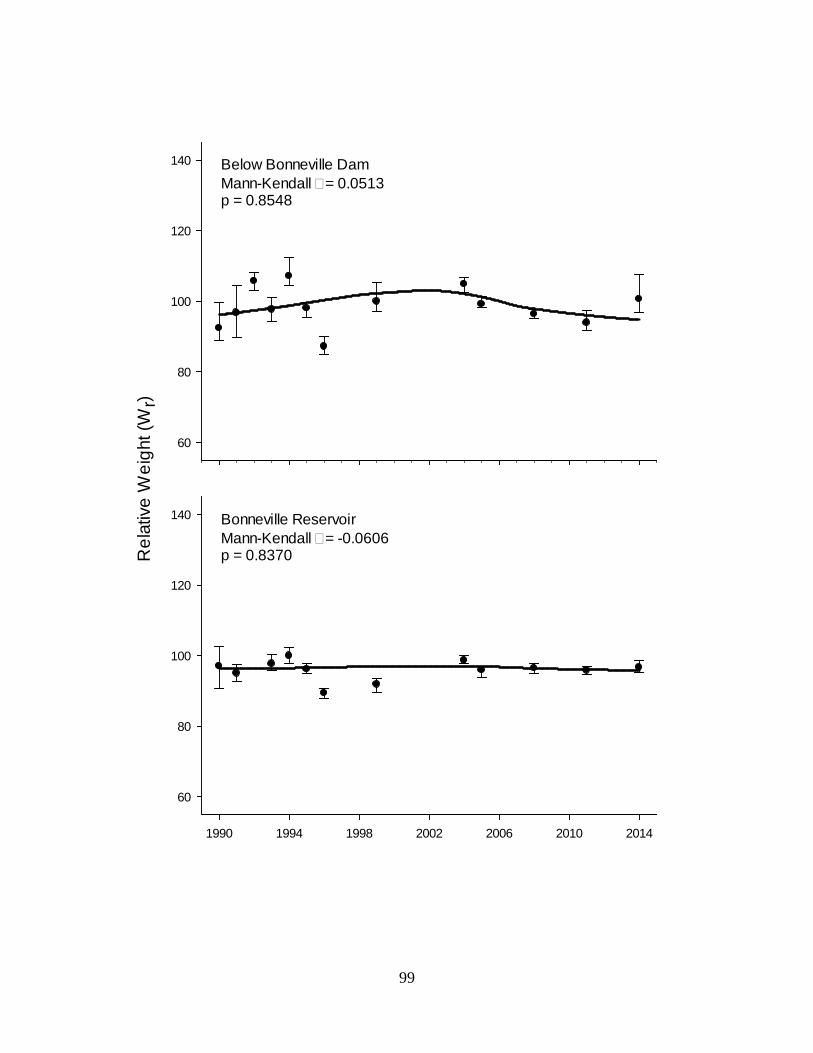
60
80
100
120
140
1990 1994 1998 2002 2006 2010 2014
Rel
ativ
e W
eigh
t (W
r)
60
80
100
120
140
Below Bonneville DamMann-Kendall = 0.0513p = 0.8548
Bonneville ReservoirMann-Kendall = -0.0606p = 0.8370
99

Figure 7. Median relative weight (Wr) for smallmouth bass in the Columbia River downstream of Bonneville Dam and Bonneville Reservoir, 1990–2014. Error bars represent 95% bootstrap (percentile) confidence intervals. Data are fit with LOESS (locally weighted scatterplot smoothing) curves. Results from a Mann-Kendall test of monotonic trend are presented for each time-series. Years with no data indicate sampling was not conducted or no fish were collected.
100
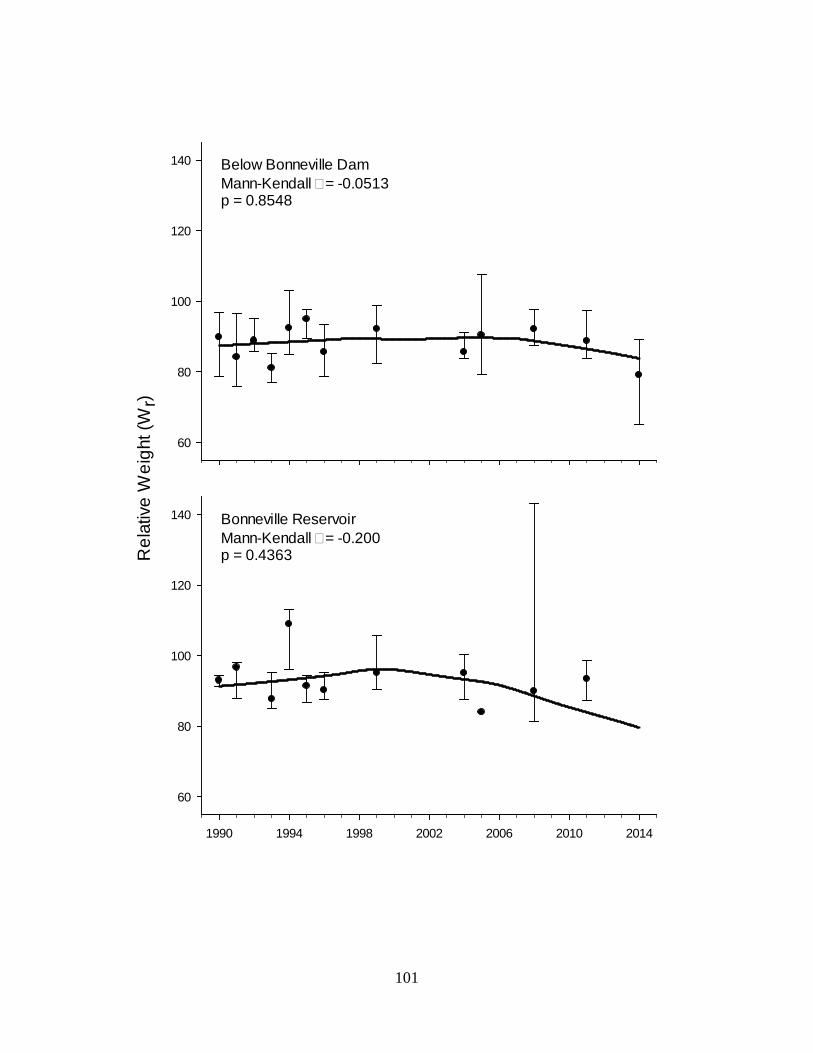
60
80
100
120
140
1990 1994 1998 2002 2006 2010 2014
Rel
ativ
e W
eigh
t (W
r)
60
80
100
120
140
Below Bonneville DamMann-Kendall = -0.0513p = 0.8548
Bonneville ReservoirMann-Kendall = -0.200p = 0.4363
101

Figure 8. Median relative weight (Wr) for walleye in the Columbia River downstream of Bonneville Dam and Bonneville Reservoir, 1990–2014. Error bars represent 95% bootstrap (percentile) confidence intervals. Data are fit with LOESS (locally weighted scatterplot smoothing) curves. Results from a Mann-Kendall test of monotonic trend are presented for each time-series. Years with no data indicate sampling was not conducted or no fish were collected.
102
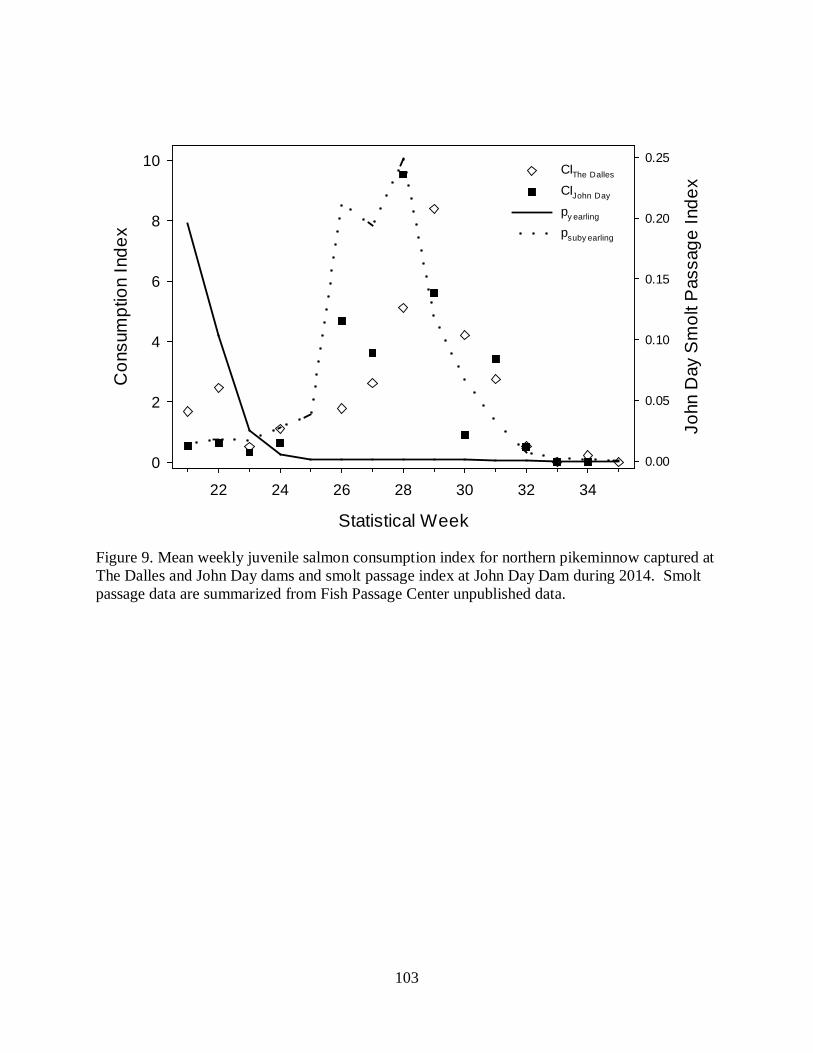
Statistical Week
22 24 26 28 30 32 34
Con
sum
ptio
n In
dex
0
2
4
6
8
10
John
Day
Sm
olt P
assa
ge In
dex
0.00
0.05
0.10
0.15
0.20
0.25CIThe Dalles CIJohn Day py earling psuby earling
Figure 9. Mean weekly juvenile salmon consumption index for northern pikeminnow captured at The Dalles and John Day dams and smolt passage index at John Day Dam during 2014. Smolt passage data are summarized from Fish Passage Center unpublished data.
103
REPORT D
Northern Pikeminnow Dam Angling on the Columbia River
2014 Annual Report
Prepared by
Paul V. Dunlap Ruthanna M. Shirley
John D. Hone Eric C. Winther
Washington Department of Fish and Wildlife 600 Capital Way N
Olympia, WA 98501-1091
Funded by
U. S. Department of Energy Bonneville Power Administration
Division of Fish and Wildlife Portland, Oregon 97208-3621
Project No. 1990-077-00 Contract No. 00046941
March 2015
104
ACKNOWLEDGEMENTS This project is funded by the Bonneville Power Administration (BPA) as part of the Northern Pikeminnow Management Program (project number 1990-077-00), William Maslen, Environment, Fish & Wildlife Director and John Skidmore and David Roberts as Project COTR’s. Steve Williams of Pacific States Marine Fisheries Commission (PSMFC) administered the contract. We would like to thank Tammy Mackey, Robert Cordie, Paul Keller, and Miroslaw Zyndol at the US Army Corps of Engineers (USACE), Adam Storch and his staff at the Oregon Department of Fish and Wildlife (ODFW); and Steve Williams and his staff at the Pacific States Marine Fisheries Commission (PSMFC) for their assistance and coordination in implementing this project in 2014. We appreciate the efforts of Scott Mengis as the Pikeminnow Dam Angling crew leader, along with Kyle Beckley, Rick Farris, and Bryce Doherty who served as our 2014 dam angler crew. We also recognize Diana Murillo and Stacey Remple for their work on Dam Angler data entry and document verification, Jason Swindle for his expertise in tying innumerable leaders used to catch many of this year’s fish, and Melissa Dexheimer for producing the Dam Angling Weekly Field Activity Reports throughout the 2014 season.
105
ABSTRACT
We are reporting on the 2014 Northern Pikeminnow Dam Angling component of the Northern Pikeminnow Management Program (NPMP) as implemented by the Washington Department of Fish and Wildlife (WDFW). Angling took place within the boat restricted tailrace areas of The Dalles and John Day dams during 22 weeks from May 6th through October 2nd 2014. The objectives of this project were to (1) implement a recreational-type hook and line fishery that harvests northern pikeminnow from within the boat restricted areas (BRZ) unavailable to the public at The Dalles and John Day Dams, (2) allocate Dam Angler effort between the The Dalles and John Day Dams based on angler CPUE in order to maximize harvest of northern pikeminnow, (3) collect, compile and report data on angler harvest, CPUE, gear/techniques and incidental catch for each project, (4) scan, record and report Passive Integrated Transponder (PIT) tag data from all northern pikeminnow, smallmouth bass, walleye, and channel catfish caught by the angling crew and record with the presence of any external spaghetti tags, fin-clips, or signs of tag loss from these fishes for use in coordination with other Oregon Department of Fish and Wildlife (ODFW) predation studies, (5) collect relevant biological data on all northern pikeminnow and other fishes caught by the 2014 Dam Angling crew. A Dam Angling crew of four anglers harvested 6,424 northern pikeminnow in 2014. Of those, 2,174 northern pikeminnow were harvested at The Dalles Dam and 4,250 were harvested at the John Day Dam. The crew fished a total of 1,923 hours during the 22 week fishery, averaging 292 fish per week and for a combined overall average catch per angler hour of 3.34 northern pikeminnow. At The Dalles Dam, the crew averaged 2.87 fish per angler hour (CPUE), and cumulatively 33 northern pikeminnow per day. At the John Day Dam, the crew averaged 3.65 fish per angler hour (CPUE) with a cumulative crew total of 59 fish per day. Based on the success of the WDFW Dam Angling crew in implementing the Dam Angling project from 2010-13, the 2014 Dam Angling crew continued to use back bouncing soft plastic lures as the primary angling method for harvesting northern pikeminnow from The Dalles and John Day Dams. Incidental species most frequently caught and released by the Dam Angling crew in 2014 were smallmouth bass Micropterus dolomieue, walleye Sander vitreus and sculpin Cottus spp.
106
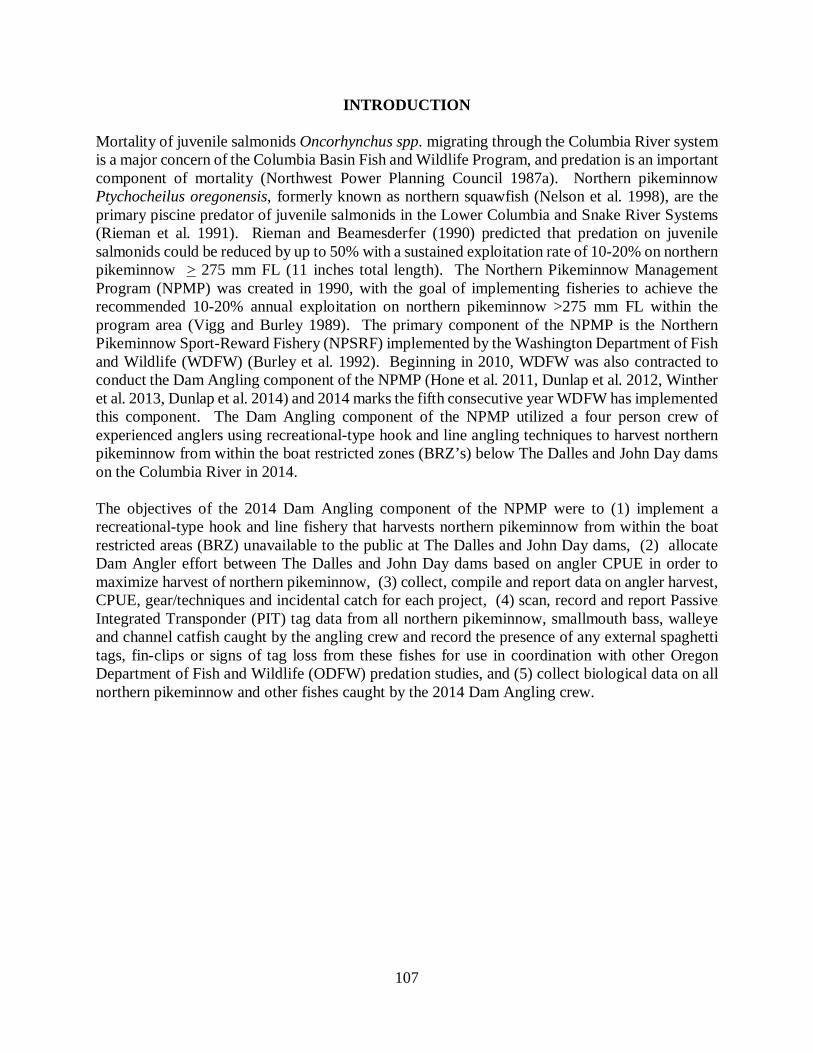
INTRODUCTION
Mortality of juvenile salmonids Oncorhynchus spp. migrating through the Columbia River system is a major concern of the Columbia Basin Fish and Wildlife Program, and predation is an important component of mortality (Northwest Power Planning Council 1987a). Northern pikeminnow Ptychocheilus oregonensis, formerly known as northern squawfish (Nelson et al. 1998), are the primary piscine predator of juvenile salmonids in the Lower Columbia and Snake River Systems (Rieman et al. 1991). Rieman and Beamesderfer (1990) predicted that predation on juvenile salmonids could be reduced by up to 50% with a sustained exploitation rate of 10-20% on northern pikeminnow > 275 mm FL (11 inches total length). The Northern Pikeminnow Management Program (NPMP) was created in 1990, with the goal of implementing fisheries to achieve the recommended 10-20% annual exploitation on northern pikeminnow >275 mm FL within the program area (Vigg and Burley 1989). The primary component of the NPMP is the Northern Pikeminnow Sport-Reward Fishery (NPSRF) implemented by the Washington Department of Fish and Wildlife (WDFW) (Burley et al. 1992). Beginning in 2010, WDFW was also contracted to conduct the Dam Angling component of the NPMP (Hone et al. 2011, Dunlap et al. 2012, Winther et al. 2013, Dunlap et al. 2014) and 2014 marks the fifth consecutive year WDFW has implemented this component. The Dam Angling component of the NPMP utilized a four person crew of experienced anglers using recreational-type hook and line angling techniques to harvest northern pikeminnow from within the boat restricted zones (BRZ’s) below The Dalles and John Day dams on the Columbia River in 2014. The objectives of the 2014 Dam Angling component of the NPMP were to (1) implement a recreational-type hook and line fishery that harvests northern pikeminnow from within the boat restricted areas (BRZ) unavailable to the public at The Dalles and John Day dams, (2) allocate Dam Angler effort between The Dalles and John Day dams based on angler CPUE in order to maximize harvest of northern pikeminnow, (3) collect, compile and report data on angler harvest, CPUE, gear/techniques and incidental catch for each project, (4) scan, record and report Passive Integrated Transponder (PIT) tag data from all northern pikeminnow, smallmouth bass, walleye and channel catfish caught by the angling crew and record the presence of any external spaghetti tags, fin-clips or signs of tag loss from these fishes for use in coordination with other Oregon Department of Fish and Wildlife (ODFW) predation studies, and (5) collect biological data on all northern pikeminnow and other fishes caught by the 2014 Dam Angling crew.
107
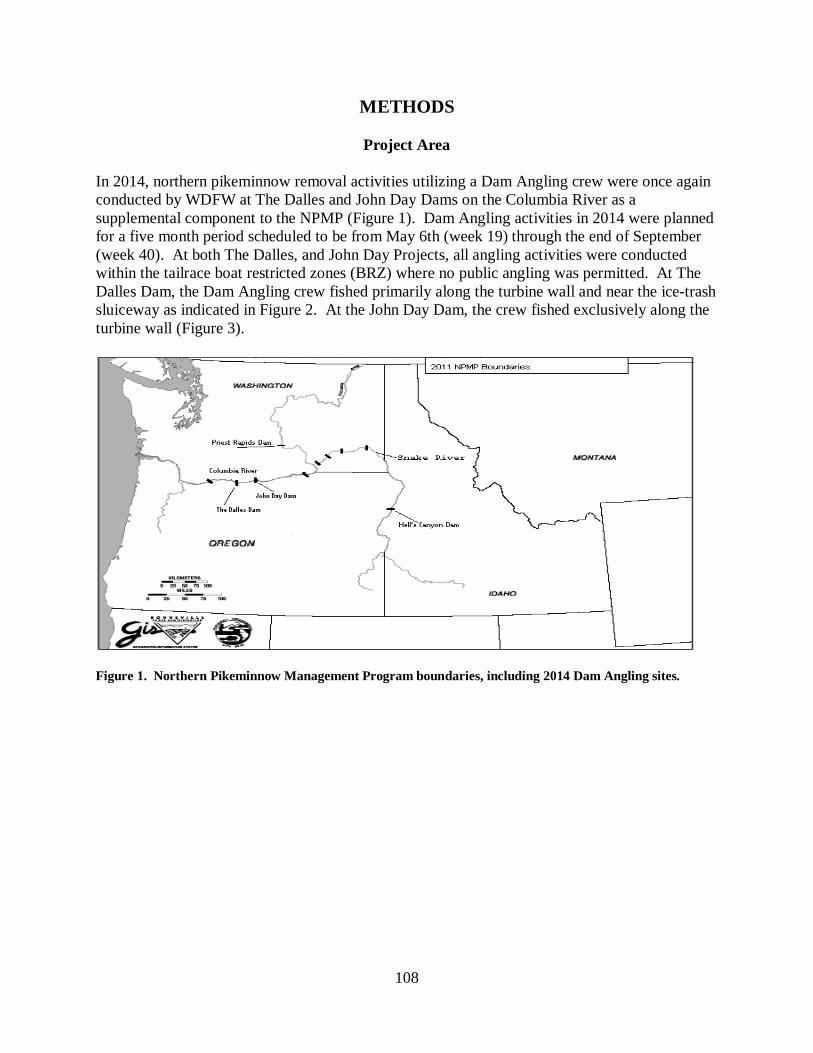
METHODS
Project Area In 2014, northern pikeminnow removal activities utilizing a Dam Angling crew were once again conducted by WDFW at The Dalles and John Day Dams on the Columbia River as a supplemental component to the NPMP (Figure 1). Dam Angling activities in 2014 were planned for a five month period scheduled to be from May 6th (week 19) through the end of September (week 40). At both The Dalles, and John Day Projects, all angling activities were conducted within the tailrace boat restricted zones (BRZ) where no public angling was permitted. At The Dalles Dam, the Dam Angling crew fished primarily along the turbine wall and near the ice-trash sluiceway as indicated in Figure 2. At the John Day Dam, the crew fished exclusively along the turbine wall (Figure 3).
Figure 1. Northern Pikeminnow Management Program boundaries, including 2014 Dam Angling sites.
108
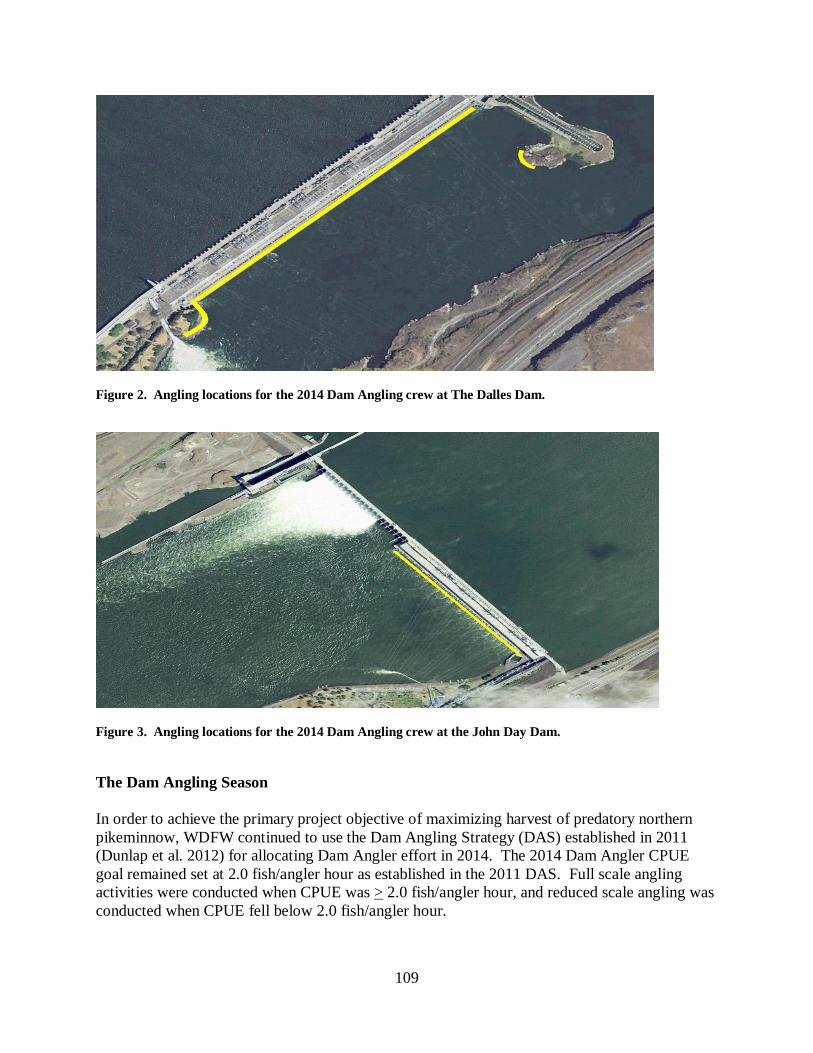
Figure 2. Angling locations for the 2014 Dam Angling crew at The Dalles Dam.
Figure 3. Angling locations for the 2014 Dam Angling crew at the John Day Dam. The Dam Angling Season In order to achieve the primary project objective of maximizing harvest of predatory northern pikeminnow, WDFW continued to use the Dam Angling Strategy (DAS) established in 2011 (Dunlap et al. 2012) for allocating Dam Angler effort in 2014. The 2014 Dam Angler CPUE goal remained set at 2.0 fish/angler hour as established in the 2011 DAS. Full scale angling activities were conducted when CPUE was > 2.0 fish/angler hour, and reduced scale angling was conducted when CPUE fell below 2.0 fish/angler hour.
109
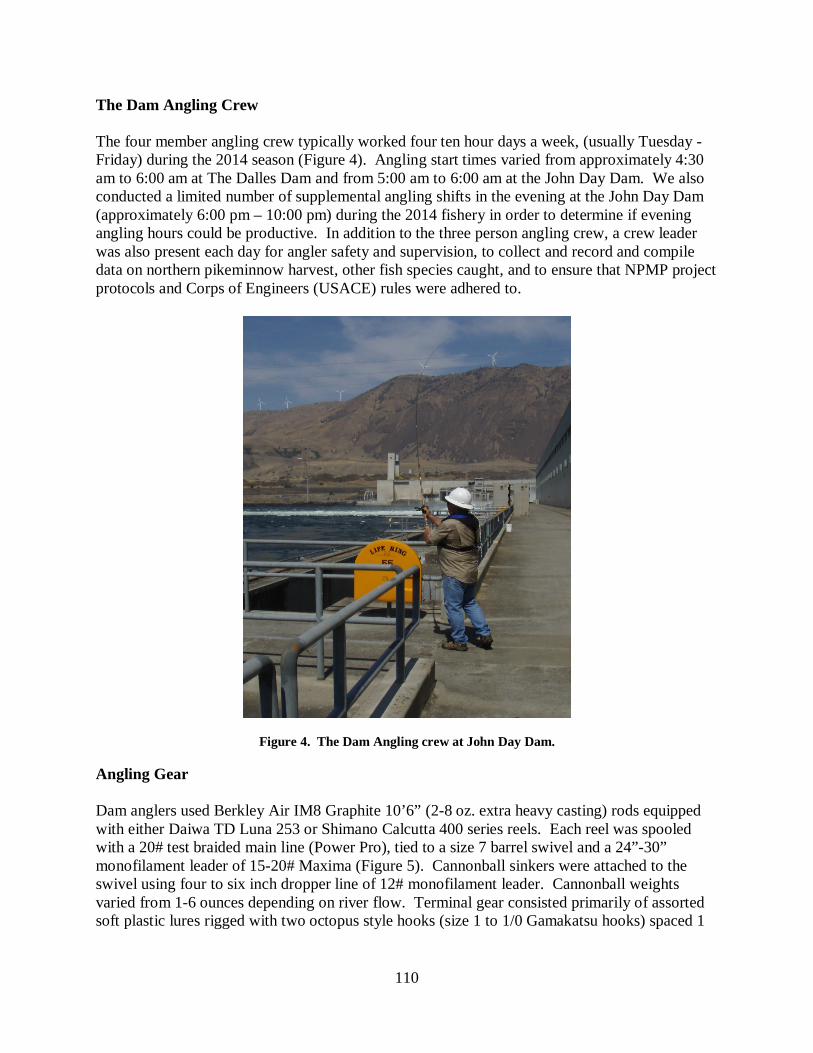
The Dam Angling Crew The four member angling crew typically worked four ten hour days a week, (usually Tuesday - Friday) during the 2014 season (Figure 4). Angling start times varied from approximately 4:30 am to 6:00 am at The Dalles Dam and from 5:00 am to 6:00 am at the John Day Dam. We also conducted a limited number of supplemental angling shifts in the evening at the John Day Dam (approximately 6:00 pm – 10:00 pm) during the 2014 fishery in order to determine if evening angling hours could be productive. In addition to the three person angling crew, a crew leader was also present each day for angler safety and supervision, to collect and record and compile data on northern pikeminnow harvest, other fish species caught, and to ensure that NPMP project protocols and Corps of Engineers (USACE) rules were adhered to.
Figure 4. The Dam Angling crew at John Day Dam.
Angling Gear Dam anglers used Berkley Air IM8 Graphite 10’6” (2-8 oz. extra heavy casting) rods equipped with either Daiwa TD Luna 253 or Shimano Calcutta 400 series reels. Each reel was spooled with a 20# test braided main line (Power Pro), tied to a size 7 barrel swivel and a 24”-30” monofilament leader of 15-20# Maxima (Figure 5). Cannonball sinkers were attached to the swivel using four to six inch dropper line of 12# monofilament leader. Cannonball weights varied from 1-6 ounces depending on river flow. Terminal gear consisted primarily of assorted soft plastic lures rigged with two octopus style hooks (size 1 to 1/0 Gamakatsu hooks) spaced 1
110
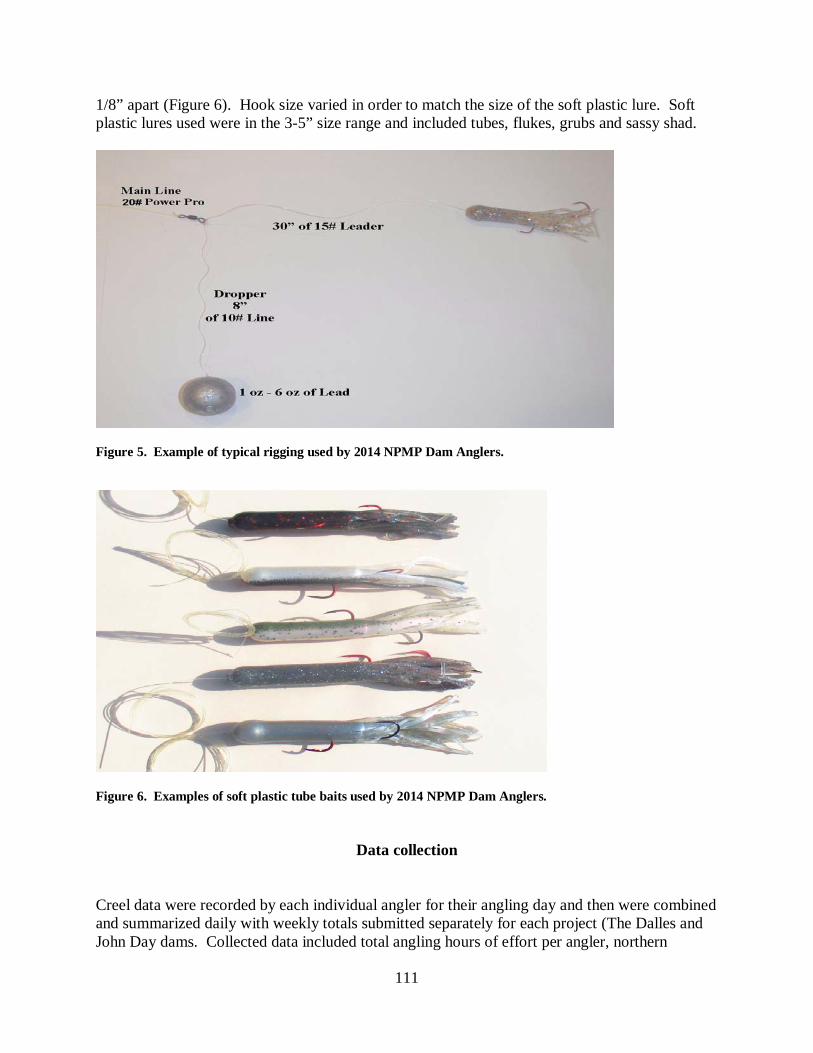
1/8” apart (Figure 6). Hook size varied in order to match the size of the soft plastic lure. Soft plastic lures used were in the 3-5” size range and included tubes, flukes, grubs and sassy shad.
Figure 5. Example of typical rigging used by 2014 NPMP Dam Anglers.
Figure 6. Examples of soft plastic tube baits used by 2014 NPMP Dam Anglers.
Data collection Creel data were recorded by each individual angler for their angling day and then were combined and summarized daily with weekly totals submitted separately for each project (The Dalles and John Day dams. Collected data included total angling hours of effort per angler, northern
111
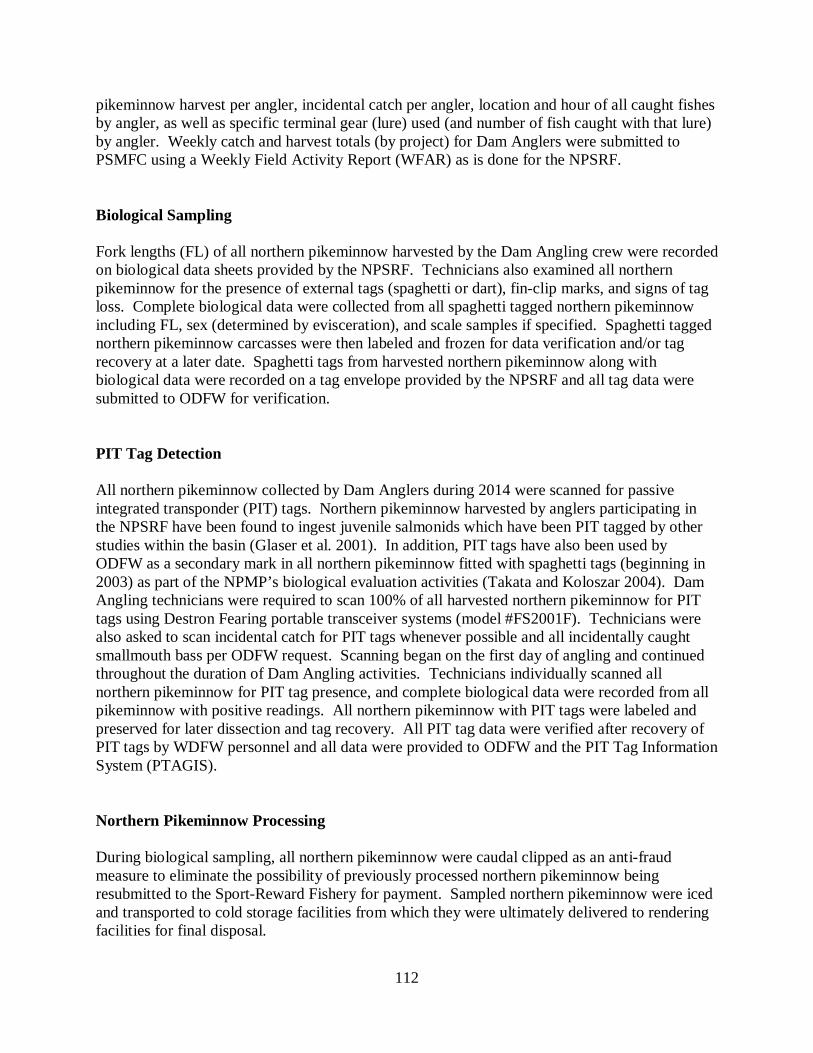
pikeminnow harvest per angler, incidental catch per angler, location and hour of all caught fishes by angler, as well as specific terminal gear (lure) used (and number of fish caught with that lure) by angler. Weekly catch and harvest totals (by project) for Dam Anglers were submitted to PSMFC using a Weekly Field Activity Report (WFAR) as is done for the NPSRF. Biological Sampling Fork lengths (FL) of all northern pikeminnow harvested by the Dam Angling crew were recorded on biological data sheets provided by the NPSRF. Technicians also examined all northern pikeminnow for the presence of external tags (spaghetti or dart), fin-clip marks, and signs of tag loss. Complete biological data were collected from all spaghetti tagged northern pikeminnow including FL, sex (determined by evisceration), and scale samples if specified. Spaghetti tagged northern pikeminnow carcasses were then labeled and frozen for data verification and/or tag recovery at a later date. Spaghetti tags from harvested northern pikeminnow along with biological data were recorded on a tag envelope provided by the NPSRF and all tag data were submitted to ODFW for verification. PIT Tag Detection All northern pikeminnow collected by Dam Anglers during 2014 were scanned for passive integrated transponder (PIT) tags. Northern pikeminnow harvested by anglers participating in the NPSRF have been found to ingest juvenile salmonids which have been PIT tagged by other studies within the basin (Glaser et al. 2001). In addition, PIT tags have also been used by ODFW as a secondary mark in all northern pikeminnow fitted with spaghetti tags (beginning in 2003) as part of the NPMP’s biological evaluation activities (Takata and Koloszar 2004). Dam Angling technicians were required to scan 100% of all harvested northern pikeminnow for PIT tags using Destron Fearing portable transceiver systems (model #FS2001F). Technicians were also asked to scan incidental catch for PIT tags whenever possible and all incidentally caught smallmouth bass per ODFW request. Scanning began on the first day of angling and continued throughout the duration of Dam Angling activities. Technicians individually scanned all northern pikeminnow for PIT tag presence, and complete biological data were recorded from all pikeminnow with positive readings. All northern pikeminnow with PIT tags were labeled and preserved for later dissection and tag recovery. All PIT tag data were verified after recovery of PIT tags by WDFW personnel and all data were provided to ODFW and the PIT Tag Information System (PTAGIS). Northern Pikeminnow Processing During biological sampling, all northern pikeminnow were caudal clipped as an anti-fraud measure to eliminate the possibility of previously processed northern pikeminnow being resubmitted to the Sport-Reward Fishery for payment. Sampled northern pikeminnow were iced and transported to cold storage facilities from which they were ultimately delivered to rendering facilities for final disposal.
112
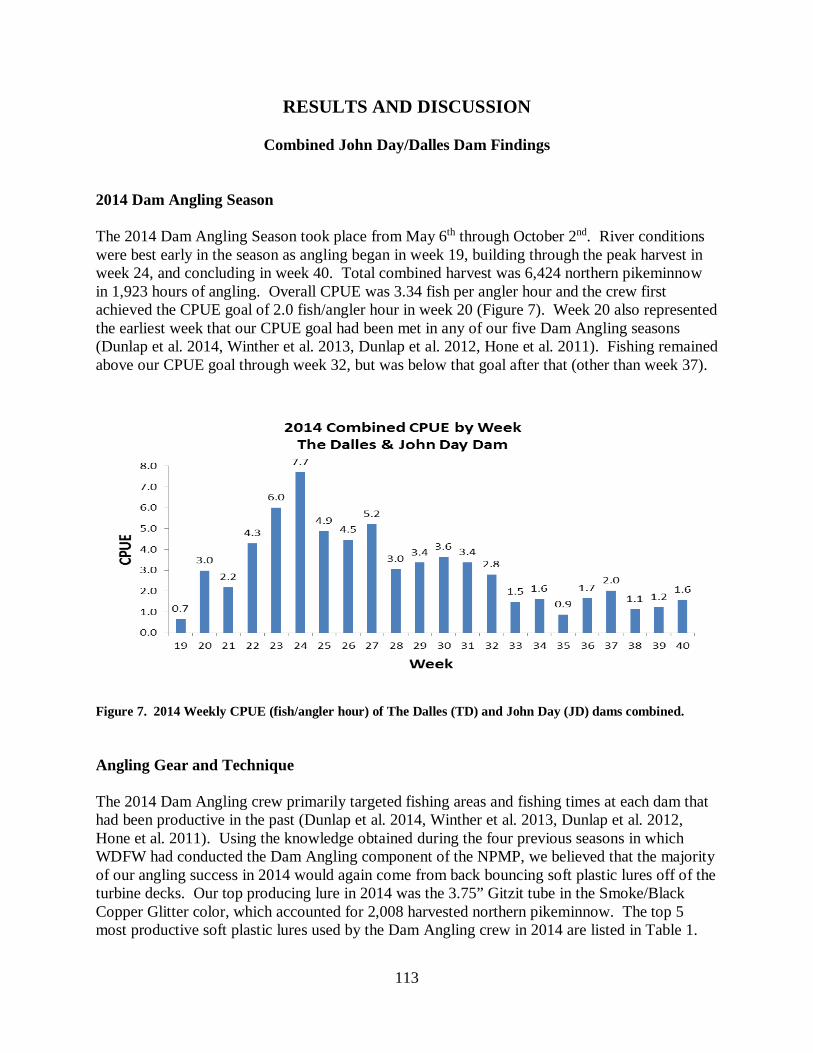
RESULTS AND DISCUSSION
Combined John Day/Dalles Dam Findings 2014 Dam Angling Season The 2014 Dam Angling Season took place from May 6th through October 2nd. River conditions were best early in the season as angling began in week 19, building through the peak harvest in week 24, and concluding in week 40. Total combined harvest was 6,424 northern pikeminnow in 1,923 hours of angling. Overall CPUE was 3.34 fish per angler hour and the crew first achieved the CPUE goal of 2.0 fish/angler hour in week 20 (Figure 7). Week 20 also represented the earliest week that our CPUE goal had been met in any of our five Dam Angling seasons (Dunlap et al. 2014, Winther et al. 2013, Dunlap et al. 2012, Hone et al. 2011). Fishing remained above our CPUE goal through week 32, but was below that goal after that (other than week 37).
Figure 7. 2014 Weekly CPUE (fish/angler hour) of The Dalles (TD) and John Day (JD) dams combined. Angling Gear and Technique The 2014 Dam Angling crew primarily targeted fishing areas and fishing times at each dam that had been productive in the past (Dunlap et al. 2014, Winther et al. 2013, Dunlap et al. 2012, Hone et al. 2011). Using the knowledge obtained during the four previous seasons in which WDFW had conducted the Dam Angling component of the NPMP, we believed that the majority of our angling success in 2014 would again come from back bouncing soft plastic lures off of the turbine decks. Our top producing lure in 2014 was the 3.75” Gitzit tube in the Smoke/Black Copper Glitter color, which accounted for 2,008 harvested northern pikeminnow. The top 5 most productive soft plastic lures used by the Dam Angling crew in 2014 are listed in Table 1.
113
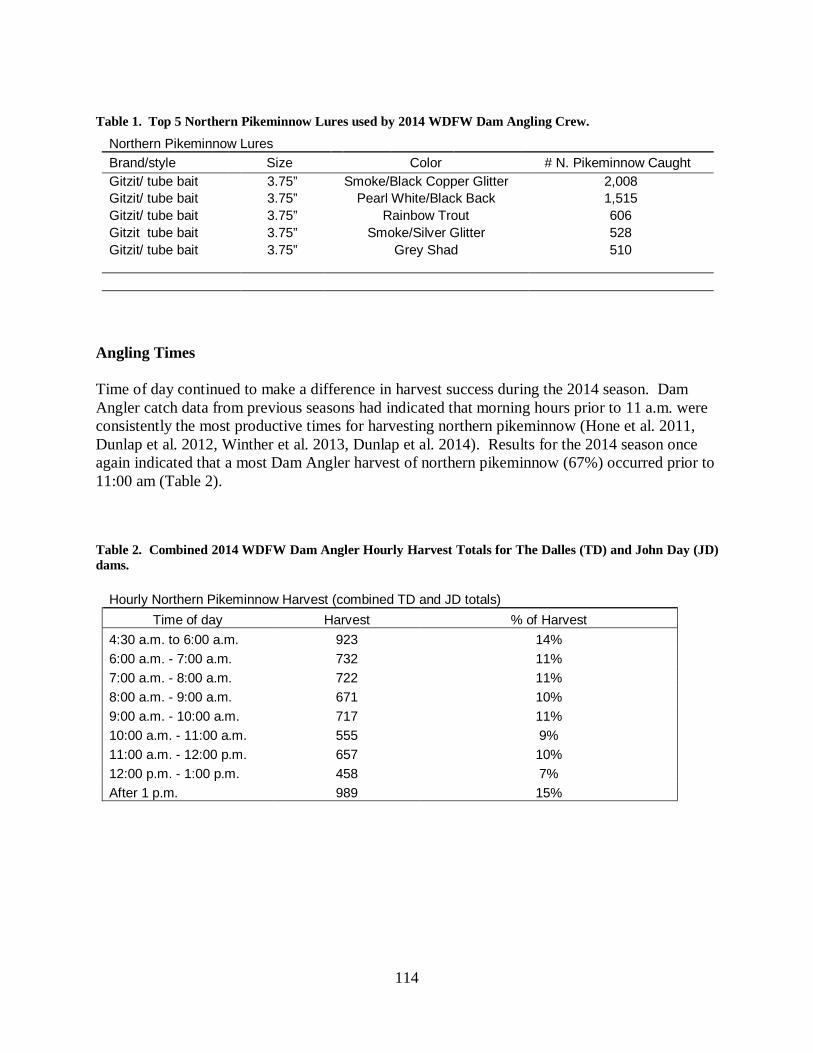
Table 1. Top 5 Northern Pikeminnow Lures used by 2014 WDFW Dam Angling Crew.
Northern Pikeminnow Lures Brand/style Size Color # N. Pikeminnow Caught Gitzit/ tube bait 3.75” Smoke/Black Copper Glitter 2,008 Gitzit/ tube bait 3.75” Pearl White/Black Back 1,515 Gitzit/ tube bait 3.75” Rainbow Trout 606 Gitzit tube bait 3.75” Smoke/Silver Glitter 528 Gitzit/ tube bait 3.75”
Grey Shad
510
Angling Times Time of day continued to make a difference in harvest success during the 2014 season. Dam Angler catch data from previous seasons had indicated that morning hours prior to 11 a.m. were consistently the most productive times for harvesting northern pikeminnow (Hone et al. 2011, Dunlap et al. 2012, Winther et al. 2013, Dunlap et al. 2014). Results for the 2014 season once again indicated that a most Dam Angler harvest of northern pikeminnow (67%) occurred prior to 11:00 am (Table 2). Table 2. Combined 2014 WDFW Dam Angler Hourly Harvest Totals for The Dalles (TD) and John Day (JD) dams.
Hourly Northern Pikeminnow Harvest (combined TD and JD totals) Time of day Harvest % of Harvest
4:30 a.m. to 6:00 a.m. 923 14% 6:00 a.m. - 7:00 a.m. 732 11% 7:00 a.m. - 8:00 a.m. 722 11% 8:00 a.m. - 9:00 a.m. 671 10% 9:00 a.m. - 10:00 a.m. 717 11% 10:00 a.m. - 11:00 a.m. 555 9% 11:00 a.m. - 12:00 p.m. 657 10% 12:00 p.m. - 1:00 p.m. 458 7% After 1 p.m. 989 15%
114
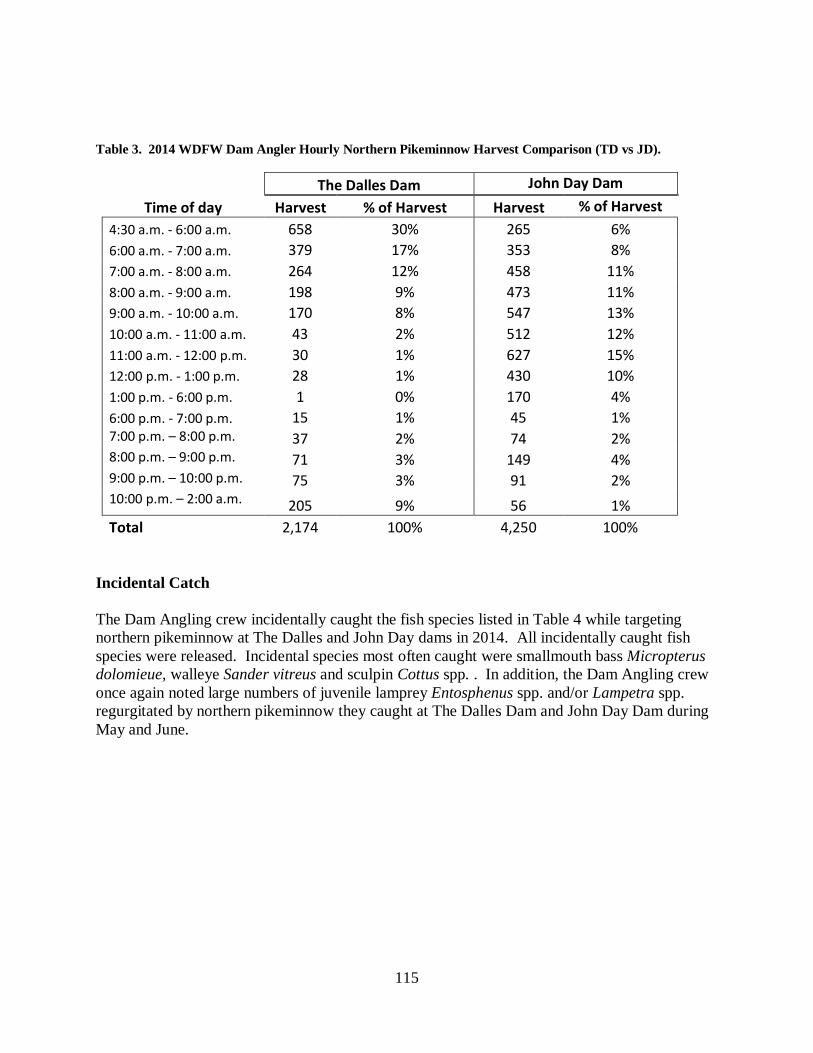
Table 3. 2014 WDFW Dam Angler Hourly Northern Pikeminnow Harvest Comparison (TD vs JD).
The Dalles Dam John Day Dam Time of day Harvest % of Harvest Harvest % of Harvest
4:30 a.m. - 6:00 a.m. 658 30% 265 6% 6:00 a.m. - 7:00 a.m. 379 17% 353 8% 7:00 a.m. - 8:00 a.m. 264 12% 458 11% 8:00 a.m. - 9:00 a.m. 198 9% 473 11% 9:00 a.m. - 10:00 a.m. 170 8% 547 13% 10:00 a.m. - 11:00 a.m. 43 2% 512 12% 11:00 a.m. - 12:00 p.m. 30 1% 627 15% 12:00 p.m. - 1:00 p.m. 28 1% 430 10% 1:00 p.m. - 6:00 p.m. 1 0% 170 4% 6:00 p.m. - 7:00 p.m. 15 1% 45 1% 7:00 p.m. – 8:00 p.m. 37 2% 74 2% 8:00 p.m. – 9:00 p.m. 71 3% 149 4% 9:00 p.m. – 10:00 p.m. 75 3% 91 2% 10:00 p.m. – 2:00 a.m. 205 9% 56 1% Total 2,174 100% 4,250 100%
Incidental Catch The Dam Angling crew incidentally caught the fish species listed in Table 4 while targeting northern pikeminnow at The Dalles and John Day dams in 2014. All incidentally caught fish species were released. Incidental species most often caught were smallmouth bass Micropterus dolomieue, walleye Sander vitreus and sculpin Cottus spp. . In addition, the Dam Angling crew once again noted large numbers of juvenile lamprey Entosphenus spp. and/or Lampetra spp. regurgitated by northern pikeminnow they caught at The Dalles Dam and John Day Dam during May and June.
115
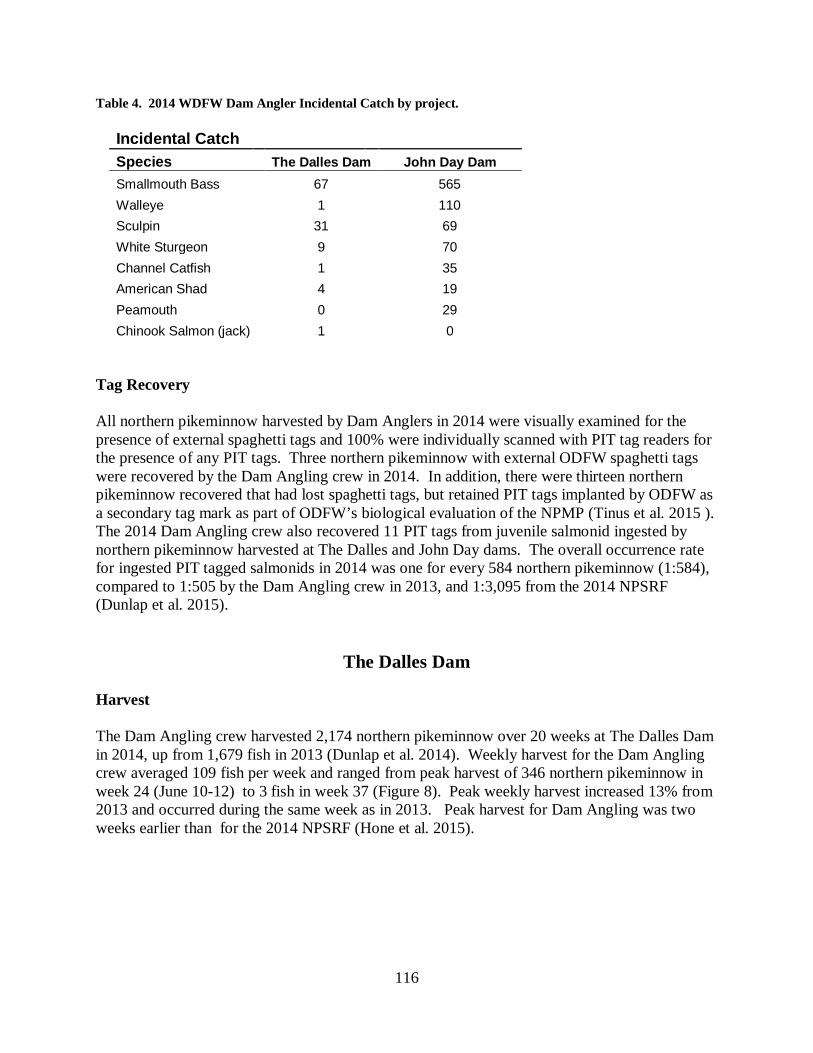
Table 4. 2014 WDFW Dam Angler Incidental Catch by project.
Incidental Catch Species The Dalles Dam John Day Dam Smallmouth Bass 67 565 Walleye 1 110 Sculpin 31 69 White Sturgeon 9 70 Channel Catfish 1 35 American Shad 4 19 Peamouth 0 29 Chinook Salmon (jack) 1 0
Tag Recovery All northern pikeminnow harvested by Dam Anglers in 2014 were visually examined for the presence of external spaghetti tags and 100% were individually scanned with PIT tag readers for the presence of any PIT tags. Three northern pikeminnow with external ODFW spaghetti tags were recovered by the Dam Angling crew in 2014. In addition, there were thirteen northern pikeminnow recovered that had lost spaghetti tags, but retained PIT tags implanted by ODFW as a secondary tag mark as part of ODFW’s biological evaluation of the NPMP (Tinus et al. 2015 ). The 2014 Dam Angling crew also recovered 11 PIT tags from juvenile salmonid ingested by northern pikeminnow harvested at The Dalles and John Day dams. The overall occurrence rate for ingested PIT tagged salmonids in 2014 was one for every 584 northern pikeminnow (1:584), compared to 1:505 by the Dam Angling crew in 2013, and 1:3,095 from the 2014 NPSRF (Dunlap et al. 2015).
The Dalles Dam Harvest The Dam Angling crew harvested 2,174 northern pikeminnow over 20 weeks at The Dalles Dam in 2014, up from 1,679 fish in 2013 (Dunlap et al. 2014). Weekly harvest for the Dam Angling crew averaged 109 fish per week and ranged from peak harvest of 346 northern pikeminnow in week 24 (June 10-12) to 3 fish in week 37 (Figure 8). Peak weekly harvest increased 13% from 2013 and occurred during the same week as in 2013. Peak harvest for Dam Angling was two weeks earlier than for the 2014 NPSRF (Hone et al. 2015).
116
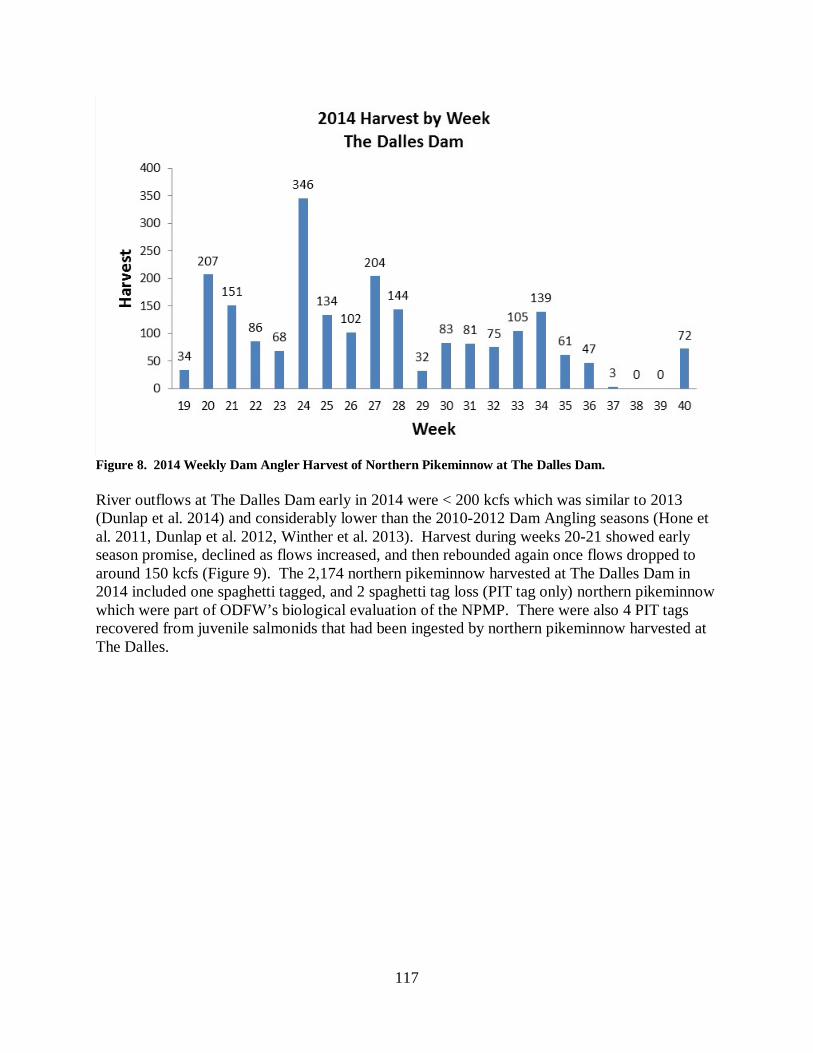
Figure 8. 2014 Weekly Dam Angler Harvest of Northern Pikeminnow at The Dalles Dam. River outflows at The Dalles Dam early in 2014 were < 200 kcfs which was similar to 2013 (Dunlap et al. 2014) and considerably lower than the 2010-2012 Dam Angling seasons (Hone et al. 2011, Dunlap et al. 2012, Winther et al. 2013). Harvest during weeks 20-21 showed early season promise, declined as flows increased, and then rebounded again once flows dropped to around 150 kcfs (Figure 9). The 2,174 northern pikeminnow harvested at The Dalles Dam in 2014 included one spaghetti tagged, and 2 spaghetti tag loss (PIT tag only) northern pikeminnow which were part of ODFW’s biological evaluation of the NPMP. There were also 4 PIT tags recovered from juvenile salmonids that had been ingested by northern pikeminnow harvested at The Dalles.
117
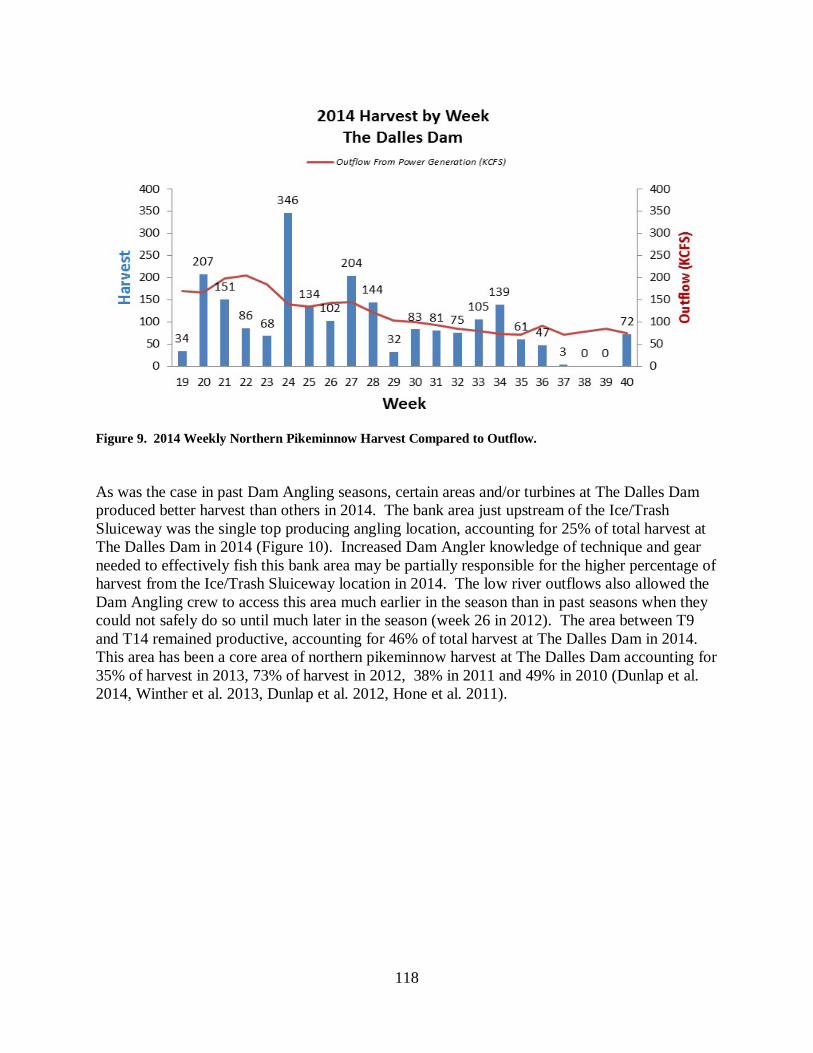
Figure 9. 2014 Weekly Northern Pikeminnow Harvest Compared to Outflow. As was the case in past Dam Angling seasons, certain areas and/or turbines at The Dalles Dam produced better harvest than others in 2014. The bank area just upstream of the Ice/Trash Sluiceway was the single top producing angling location, accounting for 25% of total harvest at The Dalles Dam in 2014 (Figure 10). Increased Dam Angler knowledge of technique and gear needed to effectively fish this bank area may be partially responsible for the higher percentage of harvest from the Ice/Trash Sluiceway location in 2014. The low river outflows also allowed the Dam Angling crew to access this area much earlier in the season than in past seasons when they could not safely do so until much later in the season (week 26 in 2012). The area between T9 and T14 remained productive, accounting for 46% of total harvest at The Dalles Dam in 2014. This area has been a core area of northern pikeminnow harvest at The Dalles Dam accounting for 35% of harvest in 2013, 73% of harvest in 2012, 38% in 2011 and 49% in 2010 (Dunlap et al. 2014, Winther et al. 2013, Dunlap et al. 2012, Hone et al. 2011).
118
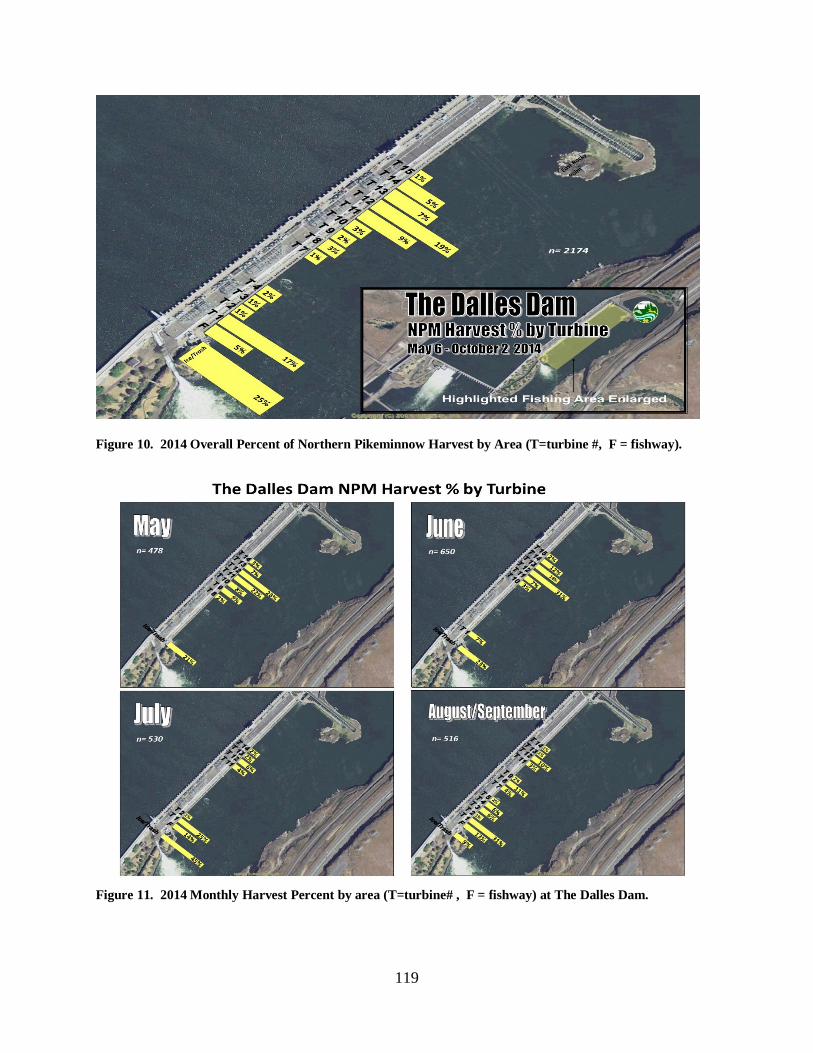
Figure 10. 2014 Overall Percent of Northern Pikeminnow Harvest by Area (T=turbine #, F = fishway).
Figure 11. 2014 Monthly Harvest Percent by area (T=turbine# , F = fishway) at The Dalles Dam.
119
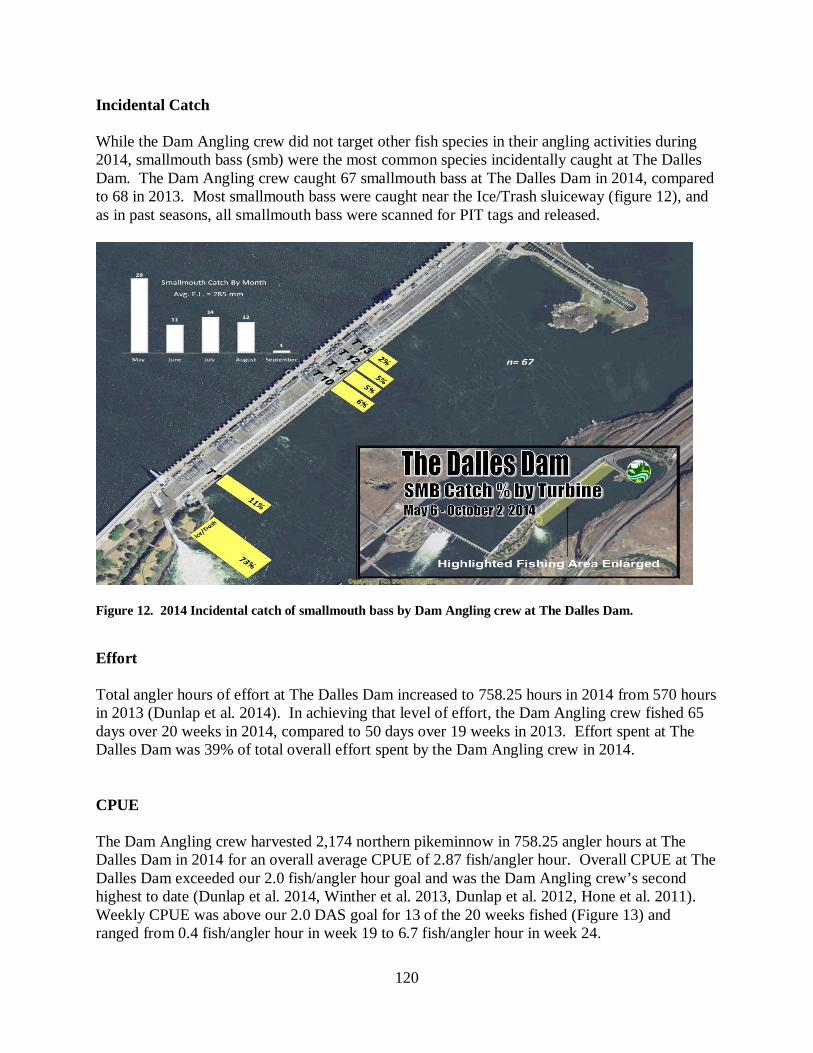
Incidental Catch While the Dam Angling crew did not target other fish species in their angling activities during 2014, smallmouth bass (smb) were the most common species incidentally caught at The Dalles Dam. The Dam Angling crew caught 67 smallmouth bass at The Dalles Dam in 2014, compared to 68 in 2013. Most smallmouth bass were caught near the Ice/Trash sluiceway (figure 12), and as in past seasons, all smallmouth bass were scanned for PIT tags and released.
Figure 12. 2014 Incidental catch of smallmouth bass by Dam Angling crew at The Dalles Dam. Effort Total angler hours of effort at The Dalles Dam increased to 758.25 hours in 2014 from 570 hours in 2013 (Dunlap et al. 2014). In achieving that level of effort, the Dam Angling crew fished 65 days over 20 weeks in 2014, compared to 50 days over 19 weeks in 2013. Effort spent at The Dalles Dam was 39% of total overall effort spent by the Dam Angling crew in 2014. CPUE The Dam Angling crew harvested 2,174 northern pikeminnow in 758.25 angler hours at The Dalles Dam in 2014 for an overall average CPUE of 2.87 fish/angler hour. Overall CPUE at The Dalles Dam exceeded our 2.0 fish/angler hour goal and was the Dam Angling crew’s second highest to date (Dunlap et al. 2014, Winther et al. 2013, Dunlap et al. 2012, Hone et al. 2011). Weekly CPUE was above our 2.0 DAS goal for 13 of the 20 weeks fished (Figure 13) and ranged from 0.4 fish/angler hour in week 19 to 6.7 fish/angler hour in week 24.
120
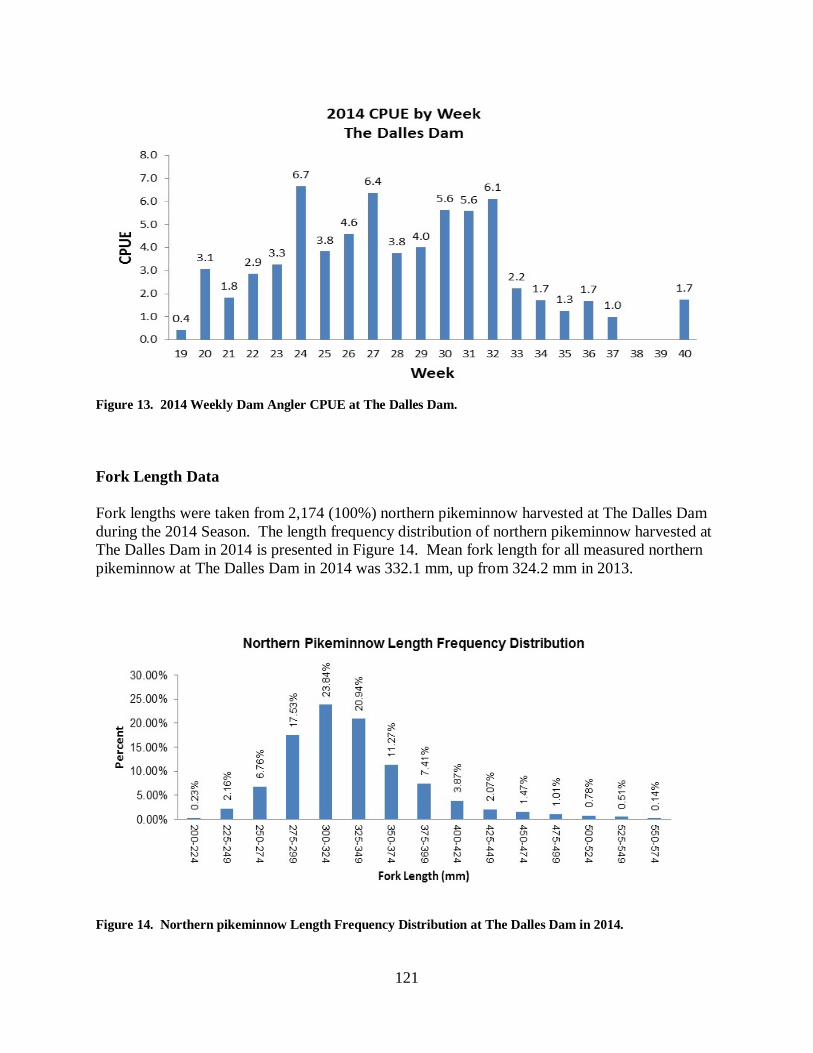
Figure 13. 2014 Weekly Dam Angler CPUE at The Dalles Dam. Fork Length Data Fork lengths were taken from 2,174 (100%) northern pikeminnow harvested at The Dalles Dam during the 2014 Season. The length frequency distribution of northern pikeminnow harvested at The Dalles Dam in 2014 is presented in Figure 14. Mean fork length for all measured northern pikeminnow at The Dalles Dam in 2014 was 332.1 mm, up from 324.2 mm in 2013.
Figure 14. Northern pikeminnow Length Frequency Distribution at The Dalles Dam in 2014.
121
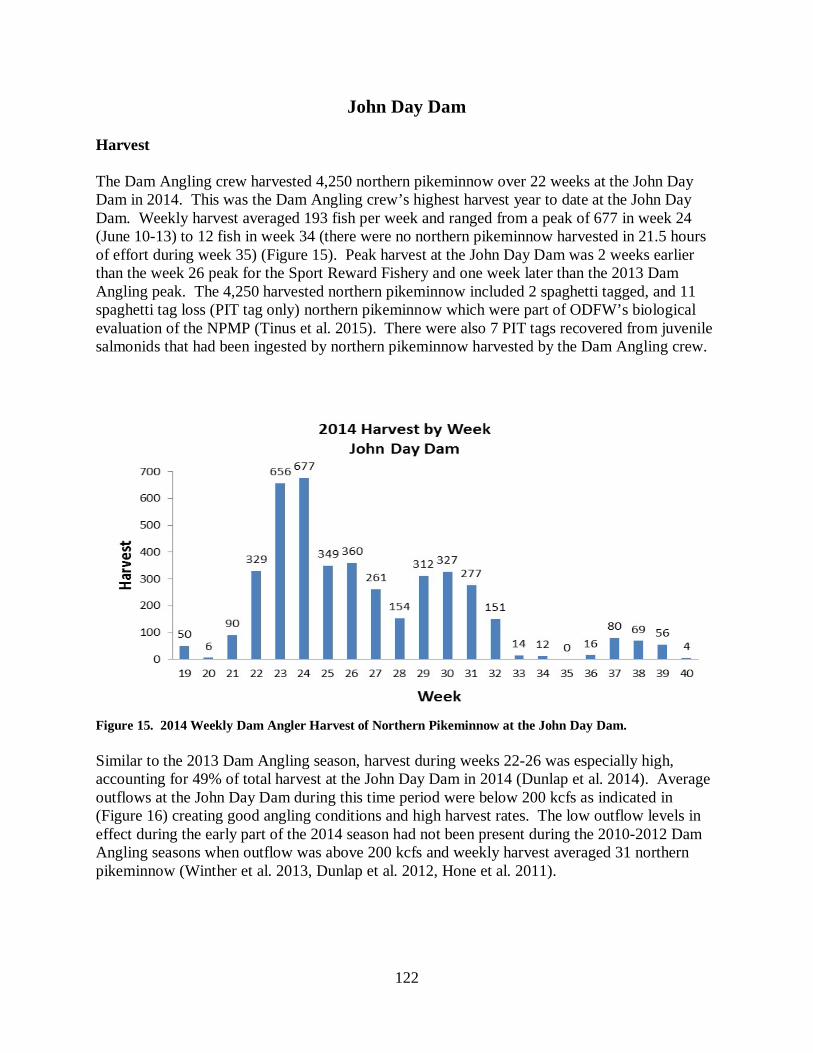
John Day Dam Harvest The Dam Angling crew harvested 4,250 northern pikeminnow over 22 weeks at the John Day Dam in 2014. This was the Dam Angling crew’s highest harvest year to date at the John Day Dam. Weekly harvest averaged 193 fish per week and ranged from a peak of 677 in week 24 (June 10-13) to 12 fish in week 34 (there were no northern pikeminnow harvested in 21.5 hours of effort during week 35) (Figure 15). Peak harvest at the John Day Dam was 2 weeks earlier than the week 26 peak for the Sport Reward Fishery and one week later than the 2013 Dam Angling peak. The 4,250 harvested northern pikeminnow included 2 spaghetti tagged, and 11 spaghetti tag loss (PIT tag only) northern pikeminnow which were part of ODFW’s biological evaluation of the NPMP (Tinus et al. 2015). There were also 7 PIT tags recovered from juvenile salmonids that had been ingested by northern pikeminnow harvested by the Dam Angling crew.
Figure 15. 2014 Weekly Dam Angler Harvest of Northern Pikeminnow at the John Day Dam. Similar to the 2013 Dam Angling season, harvest during weeks 22-26 was especially high, accounting for 49% of total harvest at the John Day Dam in 2014 (Dunlap et al. 2014). Average outflows at the John Day Dam during this time period were below 200 kcfs as indicated in (Figure 16) creating good angling conditions and high harvest rates. The low outflow levels in effect during the early part of the 2014 season had not been present during the 2010-2012 Dam Angling seasons when outflow was above 200 kcfs and weekly harvest averaged 31 northern pikeminnow (Winther et al. 2013, Dunlap et al. 2012, Hone et al. 2011).
122
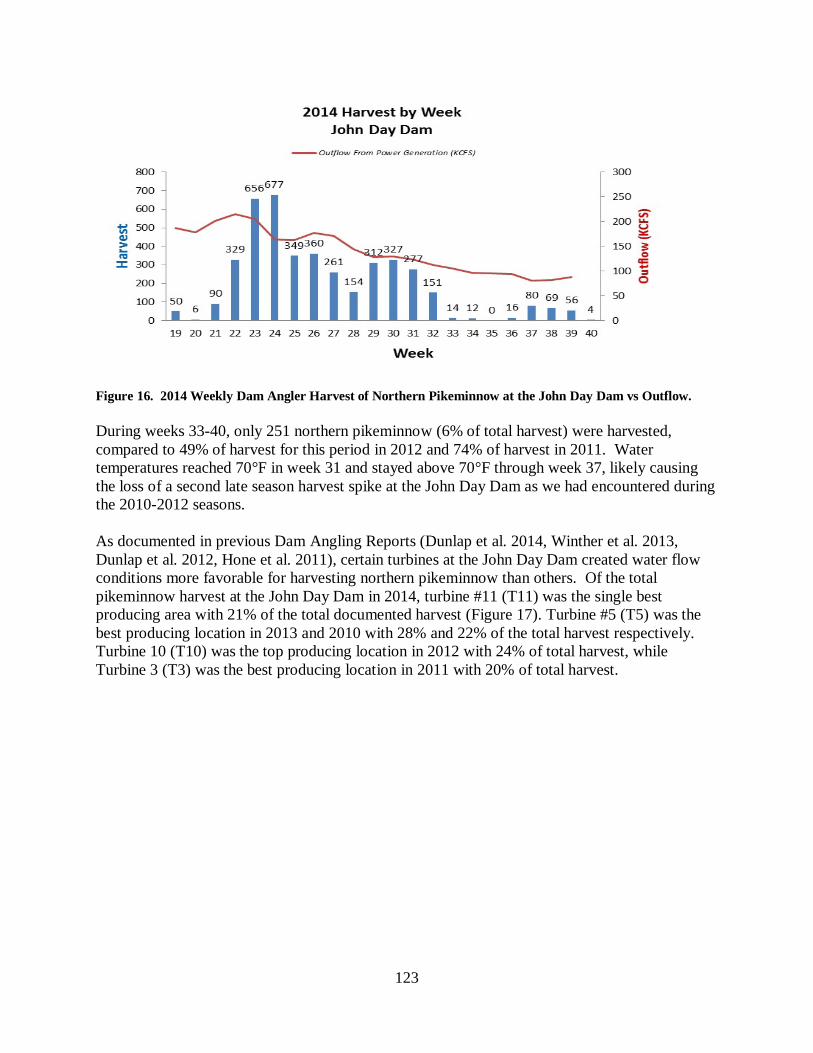
Figure 16. 2014 Weekly Dam Angler Harvest of Northern Pikeminnow at the John Day Dam vs Outflow. During weeks 33-40, only 251 northern pikeminnow (6% of total harvest) were harvested, compared to 49% of harvest for this period in 2012 and 74% of harvest in 2011. Water temperatures reached 70°F in week 31 and stayed above 70°F through week 37, likely causing the loss of a second late season harvest spike at the John Day Dam as we had encountered during the 2010-2012 seasons. As documented in previous Dam Angling Reports (Dunlap et al. 2014, Winther et al. 2013, Dunlap et al. 2012, Hone et al. 2011), certain turbines at the John Day Dam created water flow conditions more favorable for harvesting northern pikeminnow than others. Of the total pikeminnow harvest at the John Day Dam in 2014, turbine #11 (T11) was the single best producing area with 21% of the total documented harvest (Figure 17). Turbine #5 (T5) was the best producing location in 2013 and 2010 with 28% and 22% of the total harvest respectively. Turbine 10 (T10) was the top producing location in 2012 with 24% of total harvest, while Turbine 3 (T3) was the best producing location in 2011 with 20% of total harvest.
123
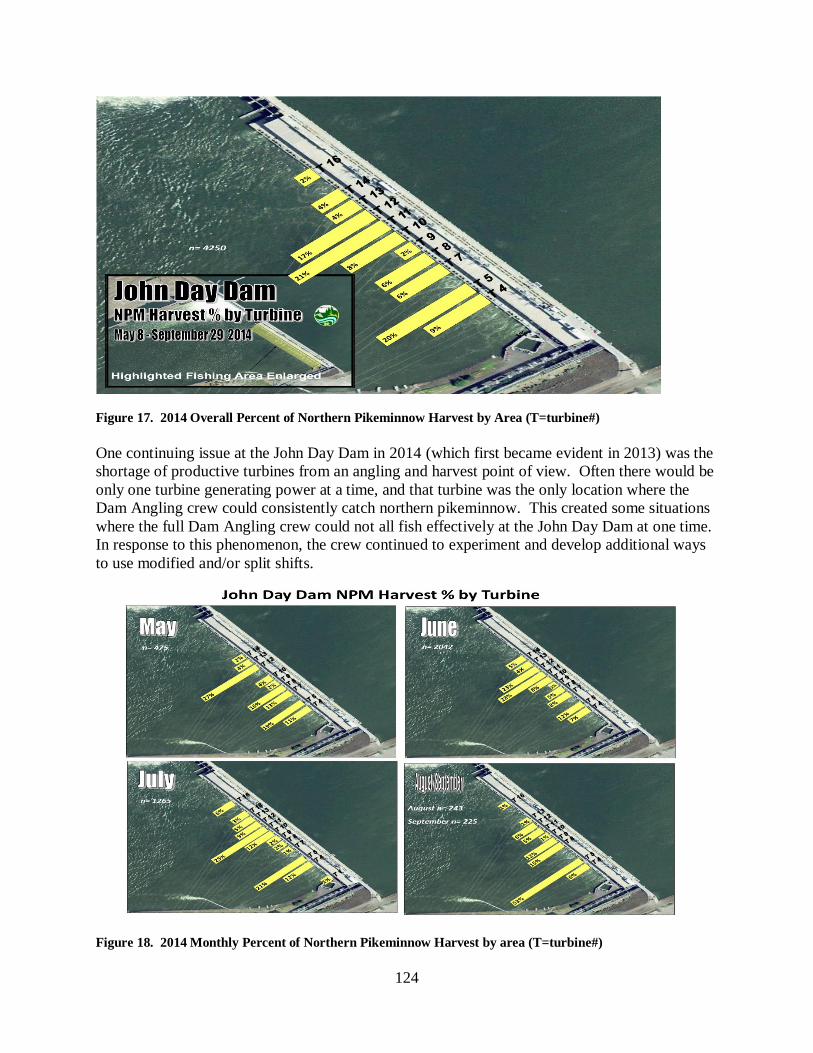
Figure 17. 2014 Overall Percent of Northern Pikeminnow Harvest by Area (T=turbine#) One continuing issue at the John Day Dam in 2014 (which first became evident in 2013) was the shortage of productive turbines from an angling and harvest point of view. Often there would be only one turbine generating power at a time, and that turbine was the only location where the Dam Angling crew could consistently catch northern pikeminnow. This created some situations where the full Dam Angling crew could not all fish effectively at the John Day Dam at one time. In response to this phenomenon, the crew continued to experiment and develop additional ways to use modified and/or split shifts.
Figure 18. 2014 Monthly Percent of Northern Pikeminnow Harvest by area (T=turbine#)
124

Incidental Catch While the Dam Angling crew did not target fish species other than northern pikeminnow in their angling activities, smallmouth bass (smb) were the most common species incidentally caught at the John Day Dam in 2014. The Dam Angling crew caught and released 565 smallmouth bass at the John Day Dam in 2014, mostly between turbines T4 and T5 (Figure 19). The Dam Angling crew also caught and released 110 walleye (wal), and 70 white sturgeon (ws) at the John Day Dam in 2014. All incidental species caught at the John Day Dam in 2014 were released.
Figure 19. 2014 Incidental catch of smallmouth bass by Dam Angling crew at the John Day Dam. Effort Total effort at the John Day Dam was 1,164.75 angler hours, up from 901.75 hours in 2013, and equaling 61% of total overall effort spent by the Dam Angling crew in 2014. In achieving that level of effort, the Dam Angling crew fished 72 days over 22 weeks in 2014, compared to 67 days over 23 weeks in 2013. The crew averaged a combined 52.9 angler hours of effort per week and 16.2 angler hours of effort per day at the John Day Dam in 2014. CPUE The Dam Angling crew harvested 4,250 northern pikeminnow in 1164.75 angler hours at the John Day Dam in 2014 for an overall average CPUE of 3.65 fish/angler hour. This CPUE was the highest to date for Dam Angling from 2010-13 (Dunlap et al. 2014, Winther et al. 2013, Dunlap et al. 2012, Hone et al. 2011) and ranged from 0.0 fish/angler hour in week 35 to 8.4 fish/angler hour in week 24 (Figure 20). Peak weekly CPUE at the John Day Dam occurred during week 24 as it also had at The Dalles Dam in 2014. The Dam Angling crew exceeded our
125
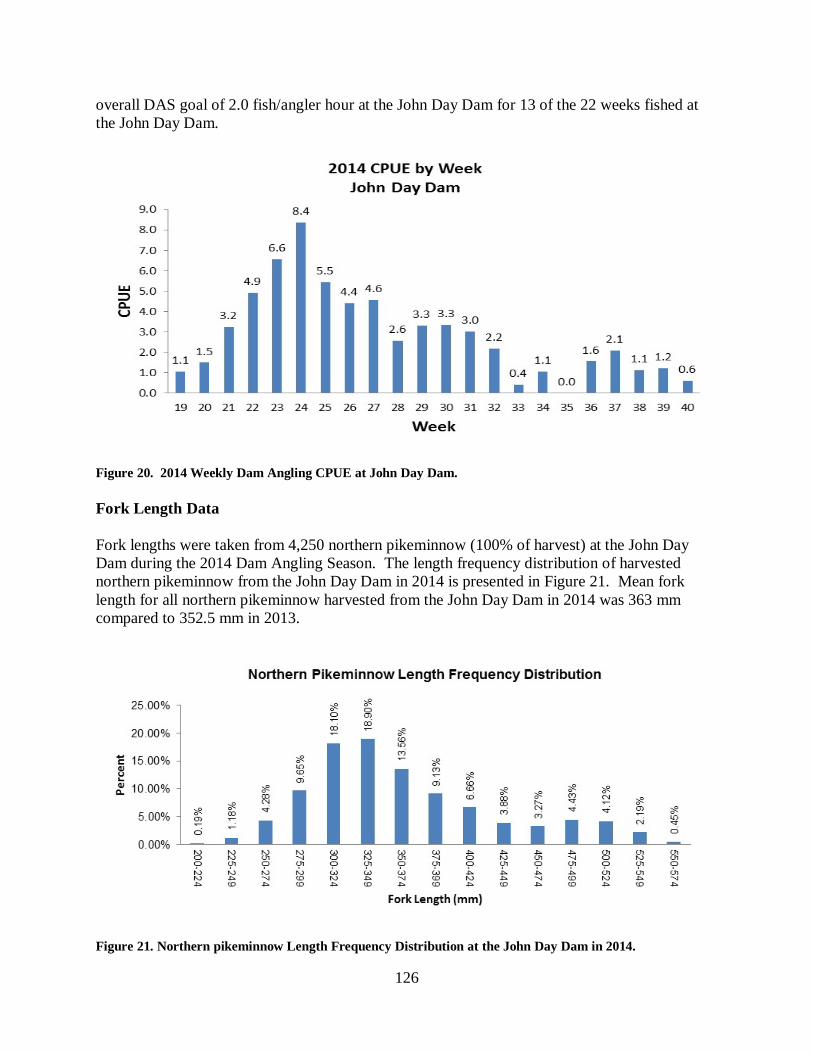
overall DAS goal of 2.0 fish/angler hour at the John Day Dam for 13 of the 22 weeks fished at the John Day Dam.
Figure 20. 2014 Weekly Dam Angling CPUE at John Day Dam. Fork Length Data Fork lengths were taken from 4,250 northern pikeminnow (100% of harvest) at the John Day Dam during the 2014 Dam Angling Season. The length frequency distribution of harvested northern pikeminnow from the John Day Dam in 2014 is presented in Figure 21. Mean fork length for all northern pikeminnow harvested from the John Day Dam in 2014 was 363 mm compared to 352.5 mm in 2013.
Figure 21. Northern pikeminnow Length Frequency Distribution at the John Day Dam in 2014.
126
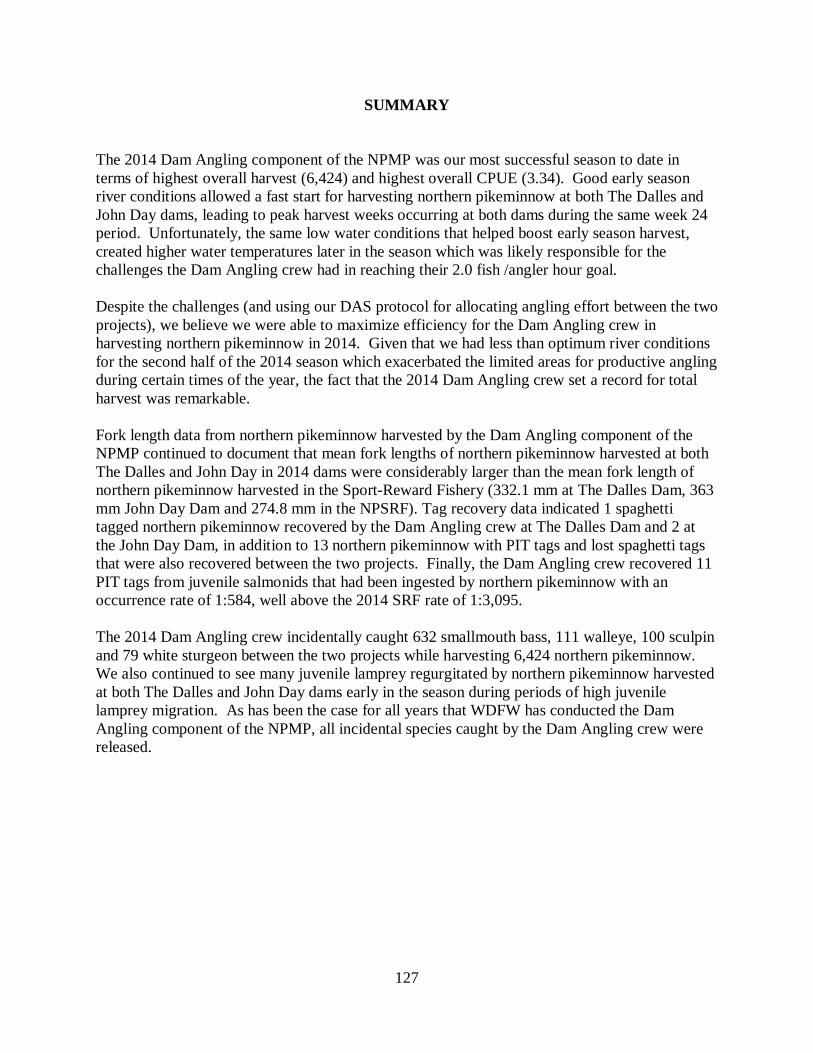
SUMMARY The 2014 Dam Angling component of the NPMP was our most successful season to date in terms of highest overall harvest (6,424) and highest overall CPUE (3.34). Good early season river conditions allowed a fast start for harvesting northern pikeminnow at both The Dalles and John Day dams, leading to peak harvest weeks occurring at both dams during the same week 24 period. Unfortunately, the same low water conditions that helped boost early season harvest, created higher water temperatures later in the season which was likely responsible for the challenges the Dam Angling crew had in reaching their 2.0 fish /angler hour goal. Despite the challenges (and using our DAS protocol for allocating angling effort between the two projects), we believe we were able to maximize efficiency for the Dam Angling crew in harvesting northern pikeminnow in 2014. Given that we had less than optimum river conditions for the second half of the 2014 season which exacerbated the limited areas for productive angling during certain times of the year, the fact that the 2014 Dam Angling crew set a record for total harvest was remarkable. Fork length data from northern pikeminnow harvested by the Dam Angling component of the NPMP continued to document that mean fork lengths of northern pikeminnow harvested at both The Dalles and John Day in 2014 dams were considerably larger than the mean fork length of northern pikeminnow harvested in the Sport-Reward Fishery (332.1 mm at The Dalles Dam, 363 mm John Day Dam and 274.8 mm in the NPSRF). Tag recovery data indicated 1 spaghetti tagged northern pikeminnow recovered by the Dam Angling crew at The Dalles Dam and 2 at the John Day Dam, in addition to 13 northern pikeminnow with PIT tags and lost spaghetti tags that were also recovered between the two projects. Finally, the Dam Angling crew recovered 11 PIT tags from juvenile salmonids that had been ingested by northern pikeminnow with an occurrence rate of 1:584, well above the 2014 SRF rate of 1:3,095. The 2014 Dam Angling crew incidentally caught 632 smallmouth bass, 111 walleye, 100 sculpin and 79 white sturgeon between the two projects while harvesting 6,424 northern pikeminnow. We also continued to see many juvenile lamprey regurgitated by northern pikeminnow harvested at both The Dalles and John Day dams early in the season during periods of high juvenile lamprey migration. As has been the case for all years that WDFW has conducted the Dam Angling component of the NPMP, all incidental species caught by the Dam Angling crew were released.
127
RECOMMENDATIONS FOR 2015
1.) Continue to implement the Dam Angling component of the NPMP in order to remove predatory northern pikeminnow from the Boat Restricted Zones in the tailrace areas of The Dalles and John Day dams where participants in the Northern Pikeminnow Sport-Reward Fishery are not able to access.
2.) Plan for 2015 Dam Angling activities to occur during similar times of year as the 2015 NPSRF in order to take advantage of fishery knowledge/information and to achieve efficiencies in fish handling and data collection gained during previous Dam Angling seasons.
3.) Continue to utilize (and modify as needed) the Defined Angling Strategy (DAS) protocol
developed in 2011 which uses a minimum CPUE goal for determining where to allocate Dam Angler effort in order to maximize harvest of northern pikeminnow.
4.) Continue to improve data collection in the areas of scanning other incidentally caught
predator fishes for PIT tags, defining incidentally hooked versus caught fishes and in enumerating juvenile lamprey regurgitated by northern pikeminnow caught by Dam Anglers in 2015.
5.) Continue to investigate and further develop northern pikeminnow angling techniques in
2015 that will improve Dam Angler CPUE and/or allow exploitation of northern pikeminnow in areas not currently fishable.
6.) Continue to explore the logistics of using split crews to optimize efficiencies when water conditions warrant or when there are high CPUE levels at both projects at the same time.
128
REFERENCES Burley, C.C., D.C. Klaybor, G.W. Short, and G.J. Hueckel. 1992. Evaluation of the northern
squawfish sport-reward fishery in the Columbia and Snake Rivers. Report B in C.F. Willis and A.A. Nigro, editors. Development of a system-wide predator control program: stepwise implementation of a predator index, predator control fisheries, and evaluation plan in the Columbia River Basin (Northern Pikeminnow Management Program). 1991 Annual Report. Contract DE-B179 -90-BP07084, Bonneville Power Administration, Portland, Oregon.
Dunlap, P.V., Hone, J.D., and E.C. Winther. 2012. Northern Pikeminnow Dam Angling on the
Columbia River. Report D In Development of a system-wide predator control program: stepwise implementation of a predator index, predator control fisheries, and evaluation plan in the Columbia River Basin (Northern Pikeminnow Management Program). 2011 Annual Report, project number 90-077. Bonneville Power Administration, Portland, Oregon.
Dunlap, P.V., J.D. Hone, and E.C. Winther. 2014. Northern Pikeminnow Dam Angling on the
Columbia River. Report D In Development of a system-wide predator control program: stepwise implementation of a predator index, predator control fisheries, and evaluation plan in the Columbia River Basin (Northern Pikeminnow Management Program). 2013 Annual Report, project number 90-077. Bonneville Power Administration, Portland, Oregon.
Dunlap, P.V., R.M. Shirley, J.D. Hone, and E.C. Winther. 2015. Implementation of the northern
pikeminnow sport-reward fishery in the Columbia and Snake Rivers. In Development of a system-wide predator control program: stepwise implementation of a predator index, predator control fisheries, and evaluation plan in the Columbia River Basin (Northern Pikeminnow Management Program). 2014 Annual Report, project number 90-077. Contract DE-B179-90BP07084, Bonneville Power Administration, Portland, Oregon.
Glaser, B.G., J.J. Amren, L.G. Fox., M.L. Wachtel, and E.C. Winther. 2001. Implementation of
the northern pikeminnow sport-reward fishery in the Columbia and Snake Rivers. In Development of a system-wide predator control program: stepwise implementation of a predator index, predator control fisheries, and evaluation plan in the Columbia River Basin (Northern Pikeminnow Management Program). 2000 Annual Report, project number 90-077. Bonneville Power Administration, Portland, Oregon.
Hone, J.D., P.V. Dunlap and E.C. Winther. 2011. Northern Pikeminnow Dam Angling on the
Columbia River. Report D In Development of a system-wide predator control program: stepwise implementation of a predator index, predator control fisheries, and evaluation plan in the Columbia River Basin (Northern Pikeminnow Management Program). 2010 Annual Report, project number 90-077. Bonneville Power Administration, Portland, Oregon.
Nelson, J. S. and five co-authors. 1998. Recommended changes in common fish names:
pikeminnow to replace squawfish. Fisheries 23(9):37. Northwest Power Planning
129
Council. 1987a. Columbia River Basin Fish and Wildlife Program. Northwest Power Planning Council. Portland, Oregon.
Rieman, B.E., R. C. Beamsderfer, S. Vigg, and T.P. Poe. 1991. Predation by resident fish on
juvenile salmonids in a mainstem Columbia reservoir: Part IV. Estimated total loss and mortality of juvenile salmonids to northern squawfish, walleye, and smallmouth bass. T. P. Poe, and B.E. Rieman editors. Resident fish predation on juvenile salmonids in John Day Reservoir, 1983-1986. Final Report (Contracts DE-A179-82 BP34796 and DE-A179-82BP35097) to Bonneville Power Administration, Portland, Oregon.
Rieman, B.E., and R.C. Beamesderfer. 1990. Dynamics of a northern squawfish population and
the potential to reduce predation on juvenile salmonids in a Columbia River reservoir. North American Journal of Fisheries Management 10:228-241.
Takata, H. K., and J. A. Koloszar. 2004. Development of a system-wide predator control program:
fisheries evaluation. Oregon Department of Fish and Wildlife, Contract Number DE-B1719-94BI24514. 2003 Annual Report to the Bonneville Power Administration, Portland, Oregon.
Tinus, E., C.M. Barr, K.J. Rybacki , E.E. Bell, C. Mallette, and A.J. Storch. 2015. System-wide
predator control program, Report C, indexing and fisheries evaluation. Oregon Department of Fish and Wildlife, Contract Number 56795. 2014 Annual Report to the Bonneville Power Administration, Portland, Oregon.
Vigg, S. and C.C. Burley. 1989. Developing a predation index and evaluating ways to reduce
salmonid losses to predation in the Columbia Basin. Report A in A.A. Nigro, editor. Developing a predation index and evaluating ways to reduce losses to predation in the Columbia Basin. Oregon Department of Fish and Wildlife, Contract Number DE-A179- 88BP92122. Annual Report to Bonneville Power Administration, Portland, Oregon.
Winther, E.C., P.V. Dunlap, and J.D. Hone. 2013. Northern Pikeminnow Dam Angling on the
Columbia River. Report D In Development of a system-wide predator control program: stepwise implementation of a predator index, predator control fisheries, and evaluation plan in the Columbia River Basin (Northern Pikeminnow Management Program). 2012 Annual Report, project number 90-077. Bonneville Power Administration, Portland, Oregon.
130
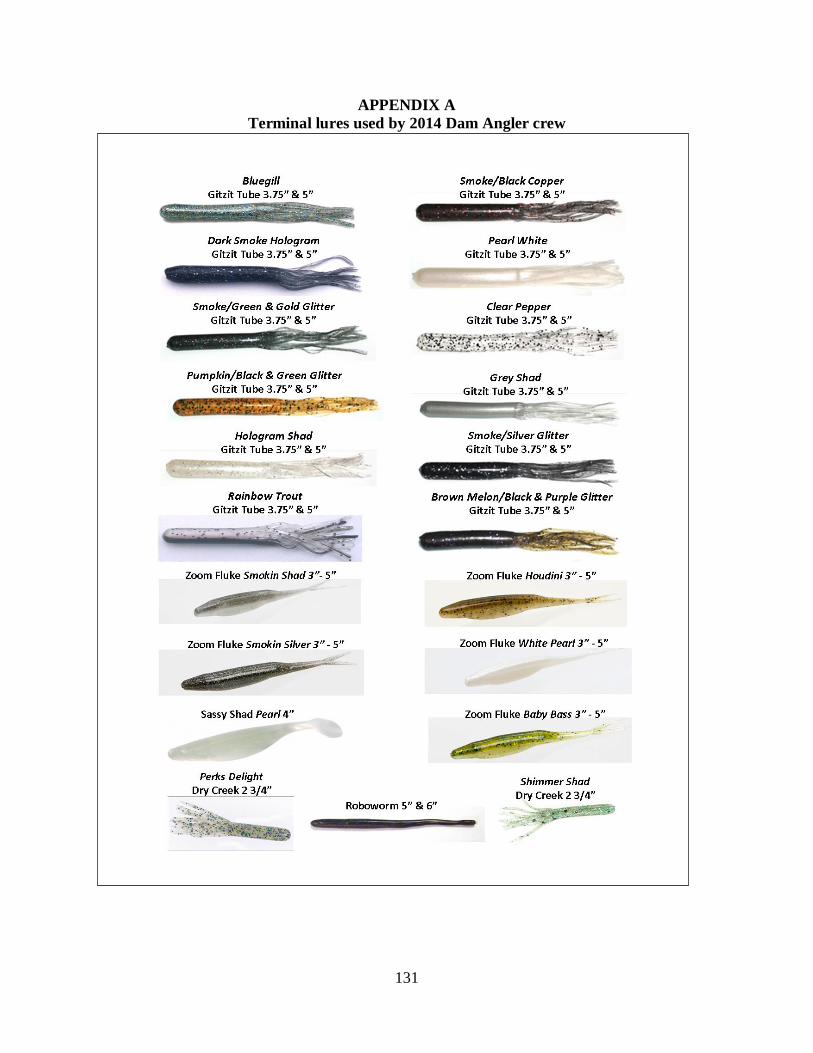
APPENDIX A Terminal lures used by 2014 Dam Angler crew
131
Report E
Northern Pikeminnow Management Program Evaluation
Evaluate Predator Control Fisheries and Establish an Index of Predation by Northern Pikeminnow and Other Piscivorous Fishes on Juvenile Salmonids in the Lower Columbia
and Snake Rivers.
BPA Project # 1990-077-00
Report covers work performed under BPA contract #(s) 64365
Report was completed under BPA contract #(s) 64365
1/1/2014 - 12/31/2014
Adam J. Storch**, Christine Mallette** and Stephen Williams*
*Pacific States Marine Fisheries Commission, Portland, OR, 97202
**Oregon Department of Fish and Wildlife, Clackamas, OR 97015
Report Created 1-2015
This report was funded by the Bonneville Power Administration (BPA), U.S. Department of Energy, as part of BPA's program to protect, mitigate, and enhance fish and wildlife affected by the
development and operation of hydroelectric facilities on the Columbia River and its tributaries. The views in this report are the author's and do not necessarily represent the views of BPA.
This report should be cited as follows: Steve Williams, Program Evaluation, Predator Index and Predator Control Fisheries For The Columbia River Basin Northern Pikeminnow Management
Program, 1/1/2014 - 12/31/2014 Annual Report, 1990-077-00
Run At 1/30/2015 11:10:04 AM
132
1. Executive Summary
a. Predation and Invasive Species Management RM&E
Biological evaluation of northern pikeminnow, smallmouth bass and walleye was conducted seasonally in two major areas of the Columbia River: downstream of Bonneville Dam during spring and summer and in Bonneville Reservoir during spring (high water temperatures in Bonneville Reservoir during summer months precluded sampling). Abundance index values for northern pikeminnow in the areas sampled ranged from 0.00 to 7.93, whereas estimates varied between 0.91 and 16.92 in 1990, the first year of biological evaluation. Juvenile salmon were encountered in the stomach contents of northern pikeminnow both below Bonneville Dam and in Bonneville Reservoir (�̂�𝑝 = 0.26 and �̂�𝑝 = 0.03, respectively). Across both areas, other taxa frequently encountered in northern pikeminnow diet samples included sculpins (�̂�𝑝𝑚𝑚𝑚𝑚𝑚𝑚= 0.10; Family: Cottidae), weatherfish (�̂�𝑝𝑚𝑚𝑚𝑚𝑚𝑚= 0.10; Family: Cobitidae) and other unidentified fish (�̂�𝑝𝑚𝑚𝑚𝑚𝑚𝑚= 0.13). During the spring sampling period, consumption index values ranged from 0.00 in the mid-reservoir section above Bonneville Dam to 1.31 in the tailrace area downstream of Bonneville Dam. Within a given area, time series of consumption index values from 1990 to 2014 varied considerably, displaying no obvious inter-annual trends. Like consumption index estimates, spring predation index values for northern pikeminnow were highly variable among the areas sampled, ranging from 0.00 to 2.15. While spring values showed no consistent trend across time, estimates for 2014 were appreciably lower than those from the earliest years (i.e., 1990 and 1992) of biological evaluation. Where sampling was conducted during the summer period in 2014, we were unable to calculate consumption index values – and consequently predation index values – for northern pikeminnow due to small sample size constraints. Sample size constraints also limited stock density (PSD) estimates for northern pikeminnow to areas downstream of Bonneville Dam where the value for 2014 (76%) was consistent with estimates from 1991, 2008 and 2011 (75, 80 and 75%), but higher than those calculated for the remainder of years (43-64%). The time series of median relative weight (1990–2014) for male northern pikeminnow both downstream of Bonneville Dam and in Bonneville Reservoir have shown significant and increasing trends. In contrast, relative weight values for female northern pikeminnow varied more substantially across time, resulting in no statistically significant monotonic trends.
As characterized by index values, spring abundance of smallmouth bass during 2014 was greatest in the mid-reservoir area of Bonneville Reservoir (10.91). Spring abundance index estimates downstream of Bonneville Dam varied spatially, with the largest value occurring between river kilometers 188 and 194 (3.16). During the 2014 summer period, in certain areas water temperatures exceeded federally assigned environmental thresholds (i.e., 18°C); thus, sampling was limited to two reaches downstream of Bonneville Dam (rkm 116–121 and rkm 188–194). In these reaches, summer abundance index values for smallmouth bass were among the lowest since the inception of biological evaluation. Sample sizes were sufficient to calculate consumption index values for only the forebay, mid-reservoir and tailrace sections of Bonneville Reservoir during spring. Estimates within these areas were relatively small and remained comparable with previous years. Sculpin (Family: Cottidae) were encountered in the diet samples of smallmouth bass most frequently in areas of the Columbia River downstream of Bonneville
133
Dam (�̂�𝑝𝑚𝑚𝑚𝑚𝑚𝑚 = 0.27), whereas minnows (Family: Cyprinidae) occurred in the greatest number of smallmouth bass diet samples collected in Bonneville Reservoir. Proportions of smallmouth bass diet samples containing juvenile salmon ranged from 0.05 to 0.18 across all areas. Although estimation of predation index values for smallmouth bass was constrained by sample size and logistical issues, spatial trends characterized by the data available mirror those of consumption index estimates, with the largest value occurring in the mid-reservoir section of Bonneville Reservoir. Downstream of Bonneville Dam, smallmouth bass stock density was lower than in Bonneville Reservoir (PSD = 8%) and the lowest observed in the lower Columbia River since 1990. Stock density in Bonneville Reservoir during 2014 was within the range observed there since 1990. As was found for female northern pikeminnow, relative weights for smallmouth bass displayed no statistically significant temporal trend either in the Columbia River downstream of Bonneville Dam or in Bonneville Reservoir.
In 2014, walleye were encountered only in the tailrace section downstream of Bonneville Dam during summer sampling. The abundance estimate for walleye in this area approached the lower end of the time series (1990–2014). Considering the tailrace section downstream of Bonneville Dam and those areas where sampling was conducted but no walleye were encountered, there appear no obvious temporal trends; within a given area, abundance index values vary considerably in time, displaying no obvious monotonic trend. During 2014 juvenile Pacific salmon generally were encountered infrequently in gut content samples of walleye in the Columbia River downstream of Bonneville Dam (�̂�𝑝 = 0.17) whereas minnows (Family: Cyprinidae) were common (�̂�𝑝 = 0.67). The number of samples collected during 2014 precluded calculation of stock density values for walleye. Application of trend tests to walleye relative weight data in the two areas sampled in 2014 revealed no significant temporal trends.
During May through August 2014, we evaluated 489 and 363 northern pikeminnow diet samples collected during angling activities at The Dalles and John Day dams, respectively. Fish were the primary prey type consumed by northern pikeminnow captured at both dams (�̂�𝑝 = 0.44 and 0.46, respectively). Of identifiable taxa encountered in diet samples, juvenile lamprey were consumed by the greatest number of northern pikeminnow (�̂�𝑝 = 0.41-0.58). During the month of August, American shad were found in a majority of samples analyzed (�̂�𝑝 = 0.56). Juvenile salmon or trout were encountered in the contents of northern pikeminnow digestive tracts during May through July, however relatively infrequently (�̂�𝑝 =0.17-0.28).
Highly variable index values for the predators considered in our study provide no obvious indication of an area-specific compensatory response to the targeted removal of northern pikeminnow. Yet, given the dynamic nature of these systems both biotic and abiotic, we encourage continued monitoring efforts to assess trends in predator populations throughout the Columbia and Snake rivers to help elucidate potential local and net (system-wide) effects.
b. Predator Control and Management
To quantify exploitation during 2014, we tagged and released 1,465 northern pikeminnow greater than or equal to 200 mm fork length (FL) throughout the lower Columbia and Snake rivers. Of these fish, 878 were greater than or equal to 250 mm FL; the size-class used to monitor trends in system-wide
134

exploitation and predation reduction since inception of the NPMP. System-wide exploitation of northern pikeminnow greater than or equal to 250 mm FL during the Sport Reward Fishery was 11.5% (95% confidence interval, 6.9–16.1%). Using the model of Friesen and Ward (1999), we estimated 2014 predation levels were 32% (range: 16–49%) lower than pre-program levels.
135
2. Introduction
a. Predation and Invasive Species Management RM&E
The Columbia and Snake rivers once supported large numbers of naturally produced anadromous Pacific salmon (Oncorhynchus spp.). Declines in adult returns have been attributed to many factors, including habitat degradation and overexploitation (Nehlsen et al. 1991; Wismar et al. 1994), hydroelectric and flood control activities (Raymond 1988), and predation (Rieman et al. 1991; Collis et al. 2002). The mean annual loss of juvenile salmon to predators can be equivalent to mortality associated with dam passage (Rieman et al. 1991), which has approached 30% at a single dam (Long and Ossiander 1974). The Northern Pikeminnow Management Program (NPMP) comprises multiple targeted fisheries aimed at reducing predation on juvenile salmon by northern pikeminnow Ptychocheilus oregonensis in the lower Columbia and Snake rivers (Rieman and Beamesderfer 1990; Beamesderfer et al. 1996). Prior to the implementation of these fisheries, the Oregon Department of Fish and Wildlife (ODFW) quantified baseline levels of predation by select piscivorous fishes on juvenile salmon and characterized various population-level parameters of northern pikeminnow. Abundance, consumption, and predation were estimated in Columbia River reservoirs in 1990 and 1993, Snake River reservoirs in 1991, and the lower Columbia River downstream from Bonneville Dam in 1992 (Ward et al. 1995). Since that time, researchers from ODFW have sampled northern pikeminnow populations on a regular basis in standardized areas to compare results among years when sample sizes are adequate to produce unbiased estimates (Zimmerman and Ward 1999; Zimmerman et al. 2000; Takata et al. 2007). In this report we document findings for 2014, and wherever possible, evaluate temporal changes.
b. Predator Control and Management
Research conducted prior to the implementation of the NPMP suggested relatively minimal rates of sustained exploitation, occupying a range of values, were sufficient to promote a 50% reduction in predation on juvenile salmon (Rieman and Beamesderfer 1990). Since the implementation of the NPMP, a range of 10-20% exploitation has been used to evaluate the combined efficacy of the targeted removal fisheries. Here, we present exploitation rates estimated using data collected during 2014, and consider variability in estimates among years. Further, we characterize the percent reduction in predation by northern pikeminnow relative to pre-program levels.
Project Map:
136
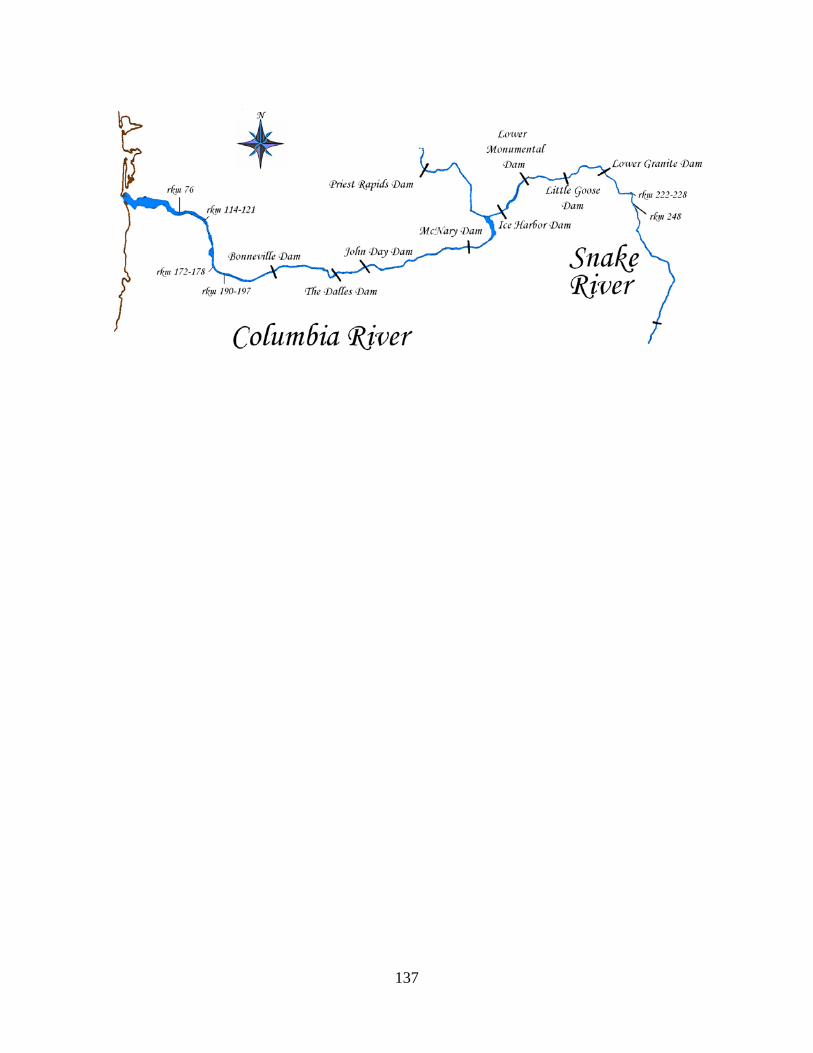
137
3. Methods: Protocols, Study Designs, and Study Area
To evaluate the effects of the northern pike minnow removal program and investigate strategies to reduce non-indigenous piscivorous (e.g., walleye, bass) predation on salmonids (i.e., Predation and Invasive Species Management RM&E) in in the Columbia River downstream of Bonneville Dam and in Bonneville Reservoir, we used standardized boat electrofishing techniques as described in Ward et al. (1995) and Zimmerman and Ward (1999). Early morning (0200–1200) sampling was conducted during spring (5 May–23 May 2014) in three areas of Bonneville Reservoir (forebay, rkm 235-241; mid-reservoir, rkm 275-286; and The Dalles Dam tailrace, rkm 303-307) and in four areas downstream of Bonneville Dam (rkm 116-121, rkm 173-181, rkm 188-194, and Bonneville Dam tailrace, rkm 226-234). Because shoreline water temperatures periodically exceeded 18°C– an environmental threshold specified in federally assigned scientific collection permits– summer sampling (30 June–1 July, 2014) was conducted only in the Bonneville Dam tailrace and in two areas downstream of Bonneville Dam (rkm 188-194 and rkm116-121).
Sampling was also conducted in two Snake River reservoirs during summer 2014 as high water temperatures interrupted some sampling during the previous year. Early morning sampling (0200–1200) was conducted in Ice Harbor Dam forebay (rkm 17-21), mid-reservoir (rkm 31-35), and Lower Monumental Dam tailrace (rkm 61-66) from 24 June–26 June 2014. In both rivers, sampling areas comprised 20 to 24 transects, each approximately 500 m in length, along both shores of the river. Effort at each transect consisted of a 15 minute electrofishing period. Data collected during sampling in Ice Harbor Reservoir during 2014 will be presented in a subsequent report.
We recorded catch and biological data for all northern pikeminnow, smallmouth bass and walleye collected during sampling. Length (FL; nearest mm) and mass (nearest 10 g) were measured for all fish collected. Scale samples were removed from 25 fish per 25 mm FL increment for the three species according to reservoir and season. All untagged northern pikeminnow greater than or equal to 200 mm FL were sacrificed and digestive tracts were removed for subsequent analyses. To this end, digestive tracts were removed by securing both ends with hemostats and pulling free connective tissue. External tissue was then removed and digestive tracts were placed in sample bags for storage. Whenever possible, we recorded sex and stage of maturity for each sacrificed fish. Stomach contents from smallmouth bass and walleye greater than or equal to 200 mm FL were collected by gastric lavage using a modified Seaburg sampler (Seaburg 1957). Contents from the foregut of fish were flushed into a 425 µm sieve and then transferred into individual sample bags. All samples were stored on ice while in the field and then transferred to a freezer until analysis in the laboratory.
Using the protocol described above, we also collected digestive tracts from northern pikeminnow captured during the Dam Angling portion of the NPMP (Dunlap et al. 2015b). Digestive tracts were collected from a representative subsample of catches at each dam weekly from 20 May through 28 August 2014 (generally three days per week). In addition, morphometric (length and mass), sex and maturity data were collected for each fish sampled.
138
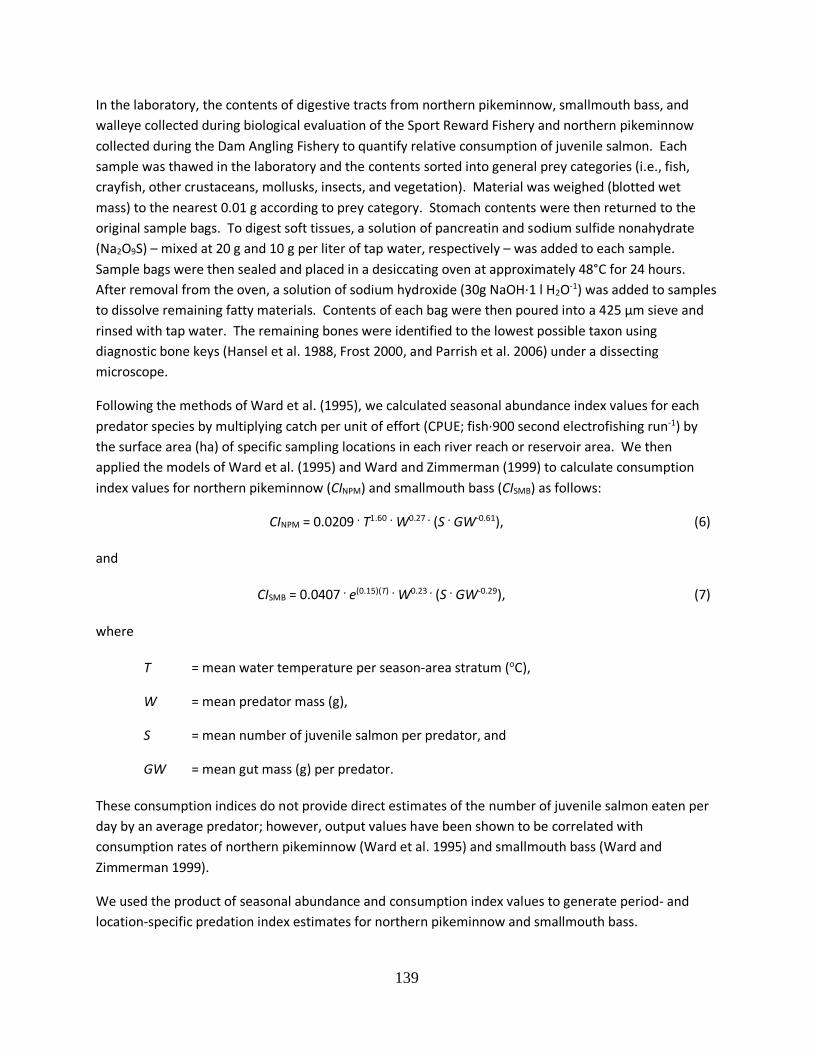
In the laboratory, the contents of digestive tracts from northern pikeminnow, smallmouth bass, and walleye collected during biological evaluation of the Sport Reward Fishery and northern pikeminnow collected during the Dam Angling Fishery to quantify relative consumption of juvenile salmon. Each sample was thawed in the laboratory and the contents sorted into general prey categories (i.e., fish, crayfish, other crustaceans, mollusks, insects, and vegetation). Material was weighed (blotted wet mass) to the nearest 0.01 g according to prey category. Stomach contents were then returned to the original sample bags. To digest soft tissues, a solution of pancreatin and sodium sulfide nonahydrate (Na2O9S) – mixed at 20 g and 10 g per liter of tap water, respectively – was added to each sample. Sample bags were then sealed and placed in a desiccating oven at approximately 48°C for 24 hours. After removal from the oven, a solution of sodium hydroxide (30g NaOH·1 l H2O-1) was added to samples to dissolve remaining fatty materials. Contents of each bag were then poured into a 425 µm sieve and rinsed with tap water. The remaining bones were identified to the lowest possible taxon using diagnostic bone keys (Hansel et al. 1988, Frost 2000, and Parrish et al. 2006) under a dissecting microscope.
Following the methods of Ward et al. (1995), we calculated seasonal abundance index values for each predator species by multiplying catch per unit of effort (CPUE; fish·900 second electrofishing run-1) by the surface area (ha) of specific sampling locations in each river reach or reservoir area. We then applied the models of Ward et al. (1995) and Ward and Zimmerman (1999) to calculate consumption index values for northern pikeminnow (CINPM) and smallmouth bass (CISMB) as follows:
CINPM = 0.0209 . T1.60 . W0.27 . (S . GW-0.61), (6)
and
CISMB = 0.0407 . e(0.15)(T) . W0.23 . (S . GW-0.29), (7)
where
T = mean water temperature per season-area stratum (oC),
W = mean predator mass (g),
S = mean number of juvenile salmon per predator, and
GW = mean gut mass (g) per predator.
These consumption indices do not provide direct estimates of the number of juvenile salmon eaten per day by an average predator; however, output values have been shown to be correlated with consumption rates of northern pikeminnow (Ward et al. 1995) and smallmouth bass (Ward and Zimmerman 1999).
We used the product of seasonal abundance and consumption index values to generate period- and location-specific predation index estimates for northern pikeminnow and smallmouth bass.
139
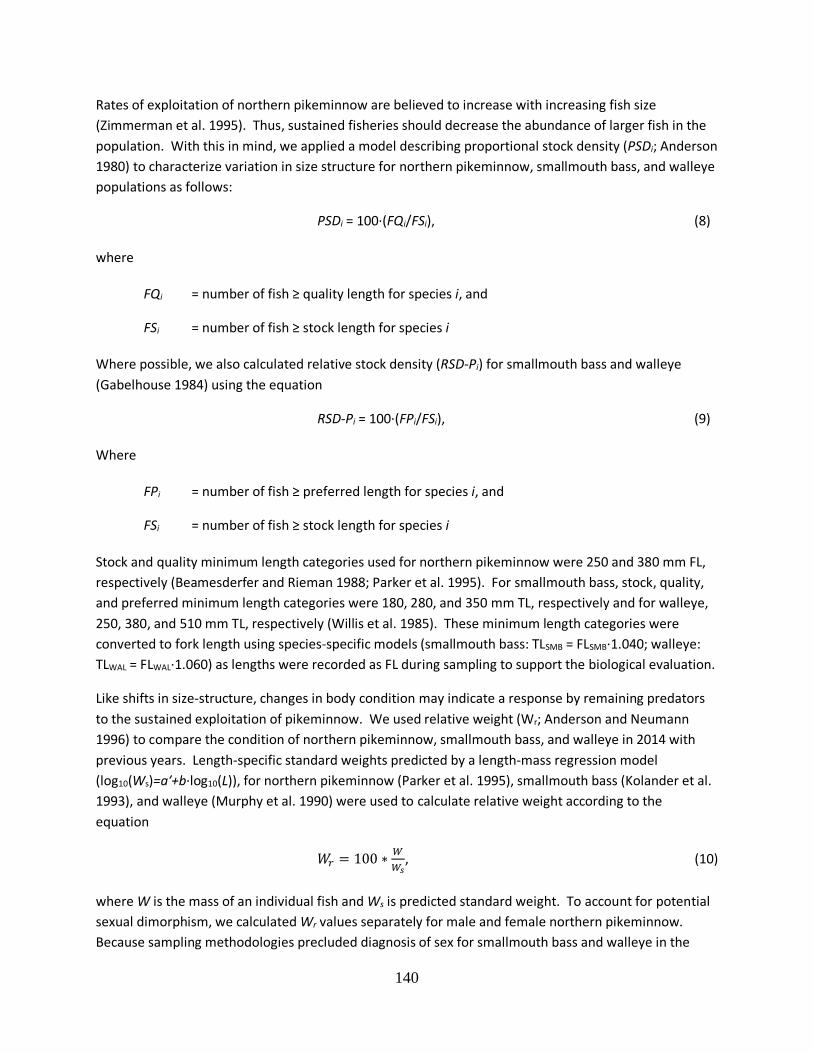
Rates of exploitation of northern pikeminnow are believed to increase with increasing fish size (Zimmerman et al. 1995). Thus, sustained fisheries should decrease the abundance of larger fish in the population. With this in mind, we applied a model describing proportional stock density (PSDi; Anderson 1980) to characterize variation in size structure for northern pikeminnow, smallmouth bass, and walleye populations as follows:
PSDi = 100·(FQi/FSi), (8)
where
FQi = number of fish ≥ quality length for species i, and
FSi = number of fish ≥ stock length for species i
Where possible, we also calculated relative stock density (RSD-Pi) for smallmouth bass and walleye (Gabelhouse 1984) using the equation
RSD-Pi = 100·(FPi/FSi), (9)
Where
FPi = number of fish ≥ preferred length for species i, and
FSi = number of fish ≥ stock length for species i
Stock and quality minimum length categories used for northern pikeminnow were 250 and 380 mm FL, respectively (Beamesderfer and Rieman 1988; Parker et al. 1995). For smallmouth bass, stock, quality, and preferred minimum length categories were 180, 280, and 350 mm TL, respectively and for walleye, 250, 380, and 510 mm TL, respectively (Willis et al. 1985). These minimum length categories were converted to fork length using species-specific models (smallmouth bass: TLSMB = FLSMB·1.040; walleye: TLWAL = FLWAL·1.060) as lengths were recorded as FL during sampling to support the biological evaluation.
Like shifts in size-structure, changes in body condition may indicate a response by remaining predators to the sustained exploitation of pikeminnow. We used relative weight (Wr; Anderson and Neumann 1996) to compare the condition of northern pikeminnow, smallmouth bass, and walleye in 2014 with previous years. Length-specific standard weights predicted by a length-mass regression model (log10(Ws)=a′+b∙log10(L)), for northern pikeminnow (Parker et al. 1995), smallmouth bass (Kolander et al. 1993), and walleye (Murphy et al. 1990) were used to calculate relative weight according to the equation
𝑊𝑊𝑟𝑟 = 100 ∗ 𝑊𝑊𝑊𝑊𝑠𝑠
, (10)
where W is the mass of an individual fish and Ws is predicted standard weight. To account for potential sexual dimorphism, we calculated Wr values separately for male and female northern pikeminnow. Because sampling methodologies precluded diagnosis of sex for smallmouth bass and walleye in the
140
field, we did not differentiate among sexes when calculating Wr for these species. Temporal trends in median Wr for northern pikeminnow, smallmouth bass and walleye were assessed by applying a non-parametric Mann-Kendall test (Mann 1945) wherever possible for the Columbia River downstream of Bonneville Dam and Bonneville Reservoir. To diagnose potential serial dependence among median Wr data, we reviewed autocorrelation functions (acf) and partial autocorrelation functions (pacf) applied to time series objects. If autocorrelation was found to be meaningful, trends were evaluated using a block bootstrap technique (Davidson and Hinkley 1997; McLeod 2011) after applying spline interpolation to account for data gaps. Otherwise, traditional Mann-Kendall tests were conducted. Lastly, to visualize trends, we fit LOWESS (locally weighted scatterplot smoothing) curves to the data. All analyses were conducted in the R programming environment using the ‘Kendall’ (McLeod 2011) and, where necessary, the ‘boot’ (Fox and Weisberg 2011) packages. Tests were considered significant at α = 0.05.
To assess the efficacy of predator control implementation (i.e., e.g., Predator Control and Management), we tagged northern pikeminnow and estimated exploitation rates with tag recovery data from the Sport-Reward fishery. Northern pikeminnow were collected using boat electrofishing in the Columbia River from river kilometer (rkm) 76 (near Clatskanie, Oregon) upstream to rkm 637 (Priest Rapids Dam) and in the Snake River from rkm 122 (Little Goose Dam) to rkm 251. Four sampling events consisting of 900 seconds of electrofishing effort were conducted within each river mile (i.e., 1.6 rkm). The efficacy of boat electrofishing tends to be limited to a maximum depth of approximately 10 feet; thus, sampling was conducted primarily along shallow shoreline areas. Sampling occurred from 3 April to 18 June 2014 between the hours of 18:00 and 5:00, except in the Hanford Reach of the Columbia River (rkm 557–637), where river safe navigation necessitated daytime sampling. A total of 6.4 rkm in the Columbia River and 16 rkm in the Snake River were not sampled due to weather-related constraints. Ideally, all tagging would be performed prior to the start of the Sport Reward and Dam Angling fisheries, but due to time constraints this was unachievable. All fish captured downstream of John Day Dam (rkm 306) were tagged prior to the start of the fisheries (1 May 2014), whereas tagging upstream of John Day Dam was performed prior to, or concomitant with, the fisheries.
We tagged, and subsequently released northern pikeminnow greater than or equal to 200 mm in fork length (FL) with uniquely numbered Floy FT-4 lock-on loop tags. Each loop tag was inserted through the pterygiophores just below the midpoint of the dorsal fin. As a secondary tagging method, all loop-tagged fish also were marked with a 134.2 MHz ISO passive integrated transponder (PIT) tag inserted into the dorsal sinus.
We worked in cooperation with the Washington Department of Fish and Wildlife (WDFW) to acquire tag recovery information from the Sport Reward and Dam Angling fisheries. The Sport Reward Fishery occurred daily between 1 May and 30 September 2014 (Dunlap et al. 2015a). Participating anglers received payment for all harvested northern pikeminnow greater than or equal to 230 mm (9 in) total length (TL). This size criterion for total length corresponds approximately to the minimum fork length (i.e., 200 mm) of northern pikeminnow marked during tagging operations. The reward payment schedule consisted of three tiers (Williams 2015), and anglers were eligible for a $500 reward for each loop-tagged fish that was returned to a check station.
141
In addition to the Sport Reward fishery, a NPMP-administered Dam-Angling fishery (Dunlap et al. 2015b) was conducted between 1 May and 4 October 2014 in the powerhouse tailraces of The Dalles and John Day dams. For this effort, a team of anglers used hook and line to remove northern pikeminnow greater than or equal to 230 mm TL. Loop- and PIT-tagged fish captured by the dam anglers were accounted for when estimating exploitation rates for the Sport Reward Fishery (see below).
The proportion of the northern pikeminnow population removed during program fisheries was quantified using mark-recapture data for continuous zones separated by dams (area-specific) and the entire area sampled (system-wide). To account for a reduction in the minimum length of northern pikeminnow eligible for sport-reward payment from 11 inches TL (≥278 mm TL; ≥250 mm FL) to 9 inches TL (≥230 mm TL; ≥200 mm FL) beginning in the year 2000, rates of exploitation were calculated for three size-classes: 1) ≥200 mm FL (all fish tagged), 2) 200 – 249 mm FL, and 3) ≥250 mm FL. The subset of fish greater than or equal to 250 mm FL was used for long term temporal comparisons over the duration of the NPMP.
To control the introduction of known bias into area-specific estimates of annual exploitation, we applied two different models: one for areas where northern pikeminnow were tagged prior to the beginning of the Sport Reward Fishery and a second for areas where tagging occurred during the fishery (Styer 2003). Under each of these scenarios, rates of exploitation were estimated only for those areas where the number of recaptured northern pikeminnow was greater than three. When tagging was completed before the start of the fishery, we calculated the rate of exploitation (u) of the population using the Petersen estimator (Ricker 1975) as
𝑢𝑢𝑗𝑗 =𝑅𝑅𝑗𝑗𝑀𝑀𝑗𝑗
, (1)
where Rj is the number of tagged fish recaptured during the season in area j and Mj is the number of fish tagged in area j. In 2014, the NPMP incentivized the return of tag-loss northern pikeminnow; or those for which an external tag had been lost in the environment, but a functioning PIT tag remained present. Thus, a correction for tag retention was not applied to exploitation estimates as was done in previous years.
Confidence intervals (95%) for exploitation estimates were calculated using the normal approximation to a Poisson random variable as
𝑢𝑢𝑗𝑗 ±𝑧𝑧∙�𝑅𝑅𝑗𝑗𝑀𝑀𝑗𝑗
, (2)
where z is a multiplier from the standard normal distribution, and Rj and Mj are as described above.
When tagging and fishing efforts occurred concomitantly, each week was treated as a separate sampling period according to the function:
142
𝑢𝑢𝑤𝑤𝑤𝑤𝑤𝑤𝑤𝑤𝑤𝑤𝑤𝑤𝑗𝑗 =𝑅𝑅𝑖𝑖𝑗𝑗𝑀𝑀𝑖𝑖𝑗𝑗
, (3)
where Rij is the number of tagged fish recaptured in area j during the ith week and Mij is the number of marked fish at large in area j at the beginning of the ith week of the Sport Reward Fishery. To assuage positive bias associated with insufficient mixing, fish captured during the same week in which they were released were removed from the analysis.
The magnitude of negative bias associated with exploitation rates calculated using the Petersen estimator can be ambiguous when tagging and fishing are conducted concurrently (Styer 2003). To minimize uncertainty surrounding estimates of system-wide annual rates of exploitation, we applied a multiple sample approach as follows:
𝑢𝑢𝑚𝑚𝑎𝑎𝑎𝑎𝑎𝑎𝑚𝑚𝑤𝑤𝑗𝑗 = ∑ 𝑅𝑅𝑖𝑖𝑗𝑗𝑀𝑀𝑖𝑖𝑗𝑗
𝑎𝑎𝑗𝑗𝑖𝑖=1 , (4)
where Rij and Mij are as above and nj is the number of weeks in the season in area j.
We calculated 95% confidence intervals for estimates of annual exploitation using the formula
𝑢𝑢𝑚𝑚𝑎𝑎𝑎𝑎𝑎𝑎𝑚𝑚𝑤𝑤𝑗𝑗 ± 𝑡𝑡 ∙ �𝑛𝑛𝑗𝑗 ∙ 𝑠𝑠𝑗𝑗, (5)
where t is a multiplier from the Student’s t-distribution for k – 1 degrees of freedom, sj is the standard deviation of the weekly exploitation estimates for area j, and nj is as above. Specific sampling weeks considered in the multiple sample approach can be found in Table 6.
We applied a model based on Friesen and Ward (1999) to estimate current predation on juvenile salmon relative to predation before the implementation of the program. The model estimates potential predation reduction from pre-program levels by incorporating: (1) northern pikeminnow population structure before removals by fisheries, (2) area- and size-specific annual exploitation rates, (3) annual natural mortality, (4) area- and size-specific annual abundance estimates and (5) area- and size-specific estimates of annual consumption of juvenile salmon by northern pikeminnow. Based on estimated levels of abundance and consumption, the model estimates system-wide total annual loss of juvenile salmon to northern pikeminnow predation and compares those losses to preprogram levels. A ten-year mean age-structure (based on catch curves) was applied for a pre-program baseline and static recruitment was assumed. Since its development, the model has been updated to include fork length increments derived from annual mark-recapture growth observations rather than growth estimates obtained from length and age data. Given these inputs, the model predicts changes in potential predation that were directly related to removals, if all other variables remain constant. We estimated the potential predation during 2014 based on observed exploitation rates from the preceding year and predicted future predation rates using the mean level of exploitation observed during current program rules (2001; 2004–2014). See Friesen and Ward (1999) for additional model documentation.
143
To test for differences in the size of northern pikeminnow captured in the 2014 Sport Reward versus the Dam Angling fisheries (Dunlap et al. 2015a and Dunlap et al. 2015b, respectively), we applied area-specific ordinary least-squares models (‘lm’ in package ‘stats’; R Core Team 2013) to fork length data using the R programming environment (R Core Team 2013),. In this way, fork lengths of northern pikeminnow captured in the Dam Angling fishery at The Dalles Dam were compared to those of fish collected in the Sport Reward Fishery in Bonneville Reservoir and lengths of northern pikeminnow captured at John Day Dam were compared with those of fish collected in The Dalles Reservoir. A review of model assumptions (‘lm.modelAssumptions’ in package ‘lmtest’; Zeileis and Hothorn 2002) showed residuals from each model were non-normal and suffered from heteroscedasticity. Data were log transformed to correct for non-normality and to account for non-constant variance, we applied corrected variance-covariance matrices (‘hccm’ in package ‘car’; Fox and Weisberg 2011).
4. Results
a. Predation and Invasive Species Management RM&E
We conducted a total of 204 electrofishing runs in sampling areas to collect fish for biological evaluation (Table 1). Spring and summer sampling generally coincided with the peak of juvenile salmon and steelhead out-migration as evinced by passage through Bonneville Dam (Figure 1). Across all sample sites, spring CPUE ranged from 0.00 to 0.83 fish·run-1 for northern pikeminnow, 0.00 to 2.97 fish·run-1 for smallmouth bass, and 0.00 to 0.21 fish·run-1 for walleye (Table 2). Summer CPUE was 0.17 to 0.21 fish·run-1 for northern pikeminnow and 0.00 and 0.33 fish·run-1 for smallmouth bass in the two areas sampled downstream of Bonneville Dam. No walleye were encountered during summer sampling. Across areas, catch rates for northern pikeminnow were the greatest in the area between rkm 116 and 121 downstream of Bonneville Dam during both spring and summer sampling periods. For smallmouth bass, CPUE was highest in the tailrace area of Bonneville Reservoir during spring sampling. Walleye were encountered only in the tailrace area of Bonneville Reservoir during the spring 2014, where CPUE was similar to both northern pikeminnow and smallmouth bass (Table 2).
Abundance index values calculated for northern pikeminnow in 2014 ranged from 0.00 to 7.93 in the Columbia River downstream of Bonneville Dam and 0.03 to 1.41 in Bonneville Reservoir. Across all sites, abundance index values continue to remain lower than those calculated during years in which sampling was first conducted and in five of the eight areas sampled during 2014, estimates were the lowest to date (Table 3).
Across all areas sampled during 2014, smallmouth bass abundance index values were greatest in the mid-reservoir area of Bonneville Reservoir and lowest in the reach between rkm 116 and 121 downstream of Bonneville Dam during spring. Within reservoirs and across seasons, smallmouth bass abundance index values displayed no discernible monotonic trend (Table 4).
Walleye were encountered only in the tailrace section of Bonneville Dam, where the 2014 abundance index estimate was comparable to previous years. In general, area-specific abundance estimates show relatively little temporal variability. That is, when walleye were encountered during sampling,
144
abundance index values remain consistently low, particularly when compared with estimates for northern pikeminnow and smallmouth bass (Table 5).
We examined the digestive tracts of 63 northern pikeminnow captured in the Columbia River downstream of Bonneville Dam (n=31) and Bonneville Reservoir (n=32) to characterize consumption. Across reservoirs/reaches and seasons, a majority of the digestive tracts examined contained food items (range = 0.59–0.83). During the summer season, the proportion of northern pikeminnow digestive tracts containing fish was less than that of spring (�̂�𝑝 = 0.50 and 0.60, respectively). Stomach samples from fish collected both in the Columbia River downstream of Bonneville Dam and Bonneville Reservoir contained juvenile salmon (Table 6). When prey fish could be identified, salmon were encountered most often in samples collected from the Columbia River downstream of Bonneville Dam during spring sampling (�̂�𝑝 = 0.28). Across seasons, in Bonneville Reservoir and the Columbia River downstream of Bonneville Dam, unidentified fishes (�̂�𝑝 = 0.13) and members of the family Salmonidae (�̂�𝑝 = 0.26), respectively, were encountered in the greatest number of gut content samples (Table 7). The number of fish prey taxa observed in gut contents was greater downstream of Bonneville Dam than in Bonneville Reservoir.
During the spring and summer of 2014, we collected 165 and 3 smallmouth bass diet samples, respectively; large proportions of which contained prey items (range: 0.67–1.00). Across sampling areas and seasons, relatively large proportions of smallmouth bass diets samples contained fish (range = 0.54–0.67). The proportions of smallmouth bass stomach samples containing salmon generally were low, with the largest proportion occurring in the Columbia River downstream of Bonneville Dam during summer (�̂�𝑝 = 0.33; Table 6). In Bonneville Reservoir, minnows (Family: Cyprinidae) were encountered in the greatest number of diet samples (�̂�𝑝 = 0.13), followed by sculpin (�̂�𝑝 = 0.10; Family: Cottidae) and unidentified fishes (�̂�𝑝 = 0.10). In the Columbia River downstream of Bonneville Dam, sculpins (�̂�𝑝 = 0.27) were encountered most frequently in gut content samples followed by salmonids (�̂�𝑝 = 0.18; Table 7). The number of fish prey taxa observed was greater in Bonneville Reservoir than downstream of Bonneville Dam.
We collected six walleye diet samples from the Columbia River downstream of Bonneville Dam during the spring of 2014, all of which contained prey items (Table 6). No walleye were encountered in Bonneville Reservoir during spring or the Columbia River downstream of Bonneville Dam during summer sampling. All samples examined contained food items and a similarly large proportion contained fish material (�̂�𝑝 = 0.83). Members of the family Cyprinidae were encountered in a relatively large proportion of walleye diet samples collected in the Columbia River downstream of Bonneville Dam (�̂�𝑝 = 0.67), whereas prey fishes belonging to Salmonidae and Percopsidae were observed in a smaller number of samples (0.17 each; Table 7).
Consumption and predation indices were evaluated (i.e., n ≥ 6) for northern pikeminnow in the Columbia River downstream of Bonneville Dam and Bonneville Reservoir during spring only. Consumption index values during the spring period ranged from 0.00 in the mid-reservoir section above Bonneville Dam to 1.31 in the tailrace area downstream of Bonneville Dam. These estimates fell well within the range of values calculated for previous years. Within a given area, consumption index values
145
varied temporally, displaying no obvious trend (Table 8). Like consumption index estimates, spring predation index values for northern pikeminnow varied among the areas sampled (range = 0.00 to 2.15). While spring values showed no consistent trend across time, estimates for 2014 were appreciably lower than those from the earliest years (i.e., 1990 and 1992) of biological evaluation (Table 9).
Where estimable, consumption index values for smallmouth bass varied relatively little among areas or seasons (range: 0.00 – 0.06). The largest consumption index value for smallmouth bass occurred in the mid-reservoir area of Bonneville Reservoir (Table 10). Although estimation of predation index values for smallmouth bass was constrained by sample size and logistical issues, spatial trends characterized by the few data that are available mirror those of consumption index estimates, with the largest value occurring in the mid-reservoir section of Bonneville Reservoir (Table 11).
As occurred in the 2011 biological evaluation, we were unable to calculate PSD for northern pikeminnow or PSD and RSP-P for walleye in most of the areas sampled during 2014 due to limited sample sizes (i.e., n < 20; Table 12). Downstream of Bonneville Dam, the PSD value for northern pikeminnow was 76 in 2014, the second highest value estimated since our assessment began. For smallmouth bass, PSD downstream of Bonneville Dam (8%) was the lowest observed among all years both downstream of Bonneville Dam and in Bonneville Reservoir. PSD in Bonneville Reservoir during 2014 (42%) was in the range observed since 1990. RSD-P values for smallmouth bass were lower downstream of Bonneville Dam than in Bonneville Reservoir during most years including 2014 (Table 13). The 2014 RSD-P value in Bonneville Reservoir (18%) was within the range of values observed since 1990, whereas the 2014 value observed downstream of Bonneville Dam (4%) was in the lower range of values. Of the six walleye examined, all were stock size and five were longer than the minimum threshold for the RSD preferred TL of 510 mm.
Median relative weight (Wr) values for male northern pikeminnow in the Columbia River downstream of Bonneville Dam and in Bonneville Reservoir were comparable (109 and 107, respectively). The same was true for female northern pikeminnow, with median Wr estimates downstream of Bonneville Dam and in Bonneville reservoir 107 and 109, respectively (Figures 2 and 3). The median Wr value calculated for smallmouth bass collected in the Columbia River downstream of Bonneville Dam (101) exceeded that estimated for fish collected in Bonneville Reservoir (97) but values varied among individuals in each area sampled (Figure 4). Using data collected in 2014, we were able to calculate Wr values for walleye in the Columbia River downstream of Bonneville Dam only; where the median estimate was notably lower than those calculated for the other two predatory species (Figures 2–5). Analyses of species- and location-specific Wr time series data (1990–2014) elucidated significant and increasing trends for male northern pikeminnow in both the Columbia River downstream of Bonneville Dam (Mann-Kendall τ = 0.564, p = 0.0087; Figure 2) and in Bonneville Reservoir (Mann-Kendall τ = 0.515, p = 0.0236; Figure 3). In contrast, relative weight values for female northern pikeminnow displayed no statistically significant monotonic trends (Figures 2 and 3). The same was true for smallmouth bass and walleye; for both the Columbia River downstream of Bonneville Dam and Bonneville Reservoir, median Wr estimated for the two predator species showed no significant temporal trends (Figures 4 and 5).
During 2014, 860 northern pikeminnow digestive tracts were collected from fish harvested in the Dam Angling Fishery; 497 at The Dalles and 363 at John Day dams. These fish ranged in size from 222 to 600 mm FL (mean = 363 mm; Table 14). At both dams, large proportions (�̂�𝑝The Dalles = 0.58 and �̂�𝑝John Day = 0.72) of the digestive tracts examined contained food. Fish were observed in a larger proportion of diet samples than other prey types at both dams (Table 15). Juvenile lamprey were
146
encountered in the greatest proportion of pikeminnow diet samples during all months compared to salmon and steelhead and American shad (�̂�𝑝 = 0.41 – 0.58). Juvenile salmon and steelhead occurred most frequently during May (0.28) and July (0.26). American shad were encountered at relatively low rates each month until August when the sample proportion was 0.56 (Table 16). At John Day Dam, weekly consumption index estimates peaked during the 28th week of 2014 (July 15 – 16 northern pikeminnow sampling dates) and coincided with peak subyearling Chinook salmon passage rates. Seasonal patterns of northern pikeminnow salmon consumption during 2014 at The Dalles Dam are similar to those at John Day Dam, although peak consumption was a week later, presumably when salmon smolts passing John Day Dam arrived to pass The Dalles Dam (Figure 6).
Fork lengths of northern pikeminnow captured in the 2014 Sport Reward Fishery in Bonneville Reservoir (mean = 289 ± 58 mm s.d.) differed significantly from those of fish captured in the Dam Angling Fishery at The Dalles Dam (mean = 332 ± 53 mm; p < 0.0001). Similarly, fork lengths of northern pikeminnow captured in the Sport Reward Fishery in The Dalles Reservoir (mean = 335 ± 62 mm) were significantly smaller than those of fish captured in the Dam Angling Fishery at John Day Dam (mean = 363 ± 71 mm; p < 0.0001). The greater size of individuals caught in the Dam Angling Fishery relative to catches in the Sport Reward Fishery in Bonneville and The Dalles reservoirs is further evinced by differing stock densities. Proportional stock densities of the Sport Reward catches were 9 and 20% in Bonneville and The Dalles reservoirs respectively compared to 16 and 33% for Dam Angling catches.
b. Predator Control and Management
We tagged and released 1,464 northern pikeminnow greater than or equal to 200 mm FL throughout the lower Columbia and Snake rivers during 2014, of which 877 were greater than or equal to 250 mm FL (Table 17). One-hundred fourteen northern pikeminnow tagged in 2014 were recaptured during the Sport Reward Fishery; no tagged northern pikeminnow were recaptured during dam angling activities. Fish tagged in 2014 that were subsequently recaptured in the Sport Reward Fishery were at large from 2 to 157 days (mean = 59 ± 46 days s.d.). Sport Reward Fishery recaptures greater than or equal to 250 mm FL accounted for 79% of all 2014 tag recoveries (Table 17). The median fork length of the Sport Reward Fishery catch was 261mm FL (E.C. Winther, WDFW, personal communication).
System-wide exploitation of northern pikeminnow greater than or equal to 200 mm FL during the Sport Reward Fishery was 9.0% (95% confidence interval 5.0–13.0%; Tables 18 and 19). Tag returns were sufficient (n ≥ 4) to calculate area-specific exploitation estimates for all areas except John Day Reservoir. Area-specific exploitation rates ranged from 3.7 to 11.3% across the other reservoirs sampled (Table 19). For northern pikeminnow within the 200–249 mm FL size class, system-wide exploitation was estimated to be 5.3% for the Sport Reward Fishery (95% confidence interval 1.0–9.6%). Area-specific rates of exploitation could be estimated only for the Columbia River downstream of Bonneville Dam and McNary and Little Goose reservoirs (3.0, 3.7, and 11.0%, respectively; Table 20). The system-wide exploitation rate for northern pikeminnow ≥250 mm FL exceeded those of the other size classes (11.5%, 95% confidence interval 6.9–16.1%; Figure 7; Table 21). Area-specific exploitation rates of those fish ≥250 mm FL were: 9.2% for the Columbia River downstream of Bonneville Dam, 6.9% for Bonneville Reservoir, 17.9% for McNary Reservoir, and 11.3% in Lower Granite Reservoir (Table 21).
147

Model-predicted reduction in predation on juvenile salmonids by northern pikeminnow relative to pre-program levels for 2014 was 32% (range: 16–49%; Figure 8). Model projections based on the current fishery and population structure suggest predation on juvenile salmon by northern pikeminnow may remain relatively consistent through 2018.
148
5. Synthesis of Findings: Discussion/Conclusions
a. Predation and Invasive Species Management RM&E
Removals of larger individuals from northern pikeminnow populations may improve survival among migrating juvenile salmon if a compensatory response by remaining northern pikeminnow or other predatory fishes (see below) does not offset the net benefit of removal (Beamesderfer et al. 1996; Friesen and Ward 1999). Potential signs of a compensatory response by predators may be increased abundance, condition factor, consumption and predation indices, or a shift in population size structure toward larger individuals (Knutsen and Ward 1999). Analyses to elucidate temporal trends in Wr data indicated a persistent increase in condition of male northern pikeminnow in the Columbia River downstream of Bonneville Dam and in Bonneville Reservoir. While it is uncertain whether these results are indicative of an intra-specific compensatory mechanism, our findings do highlight the possibility of differential responses to sustained removal not only in space (i.e., reservoir/area-specific), but also demographically. As was done for Wr time series data in the present study, future work will apply similar quantitative methodologies to other metrics (e.g., abundance index, consumption index, etc.) to monitor the presence of inter- and intra-specific compensation.
Abundance index estimates for 2014 in most locations sampled show a continued decrease in the number of northern pikeminnow greater than or equal to 250 mm FL in the Columbia River downstream of Bonneville Dam and in Bonneville Reservoir since the early 1990s (Table 3). This pattern is also reflected in the total number of stock size northern pikeminnow we encounter during indexing years (i.e., PSD; Table 12). The 2014 PSD estimate calculated for the area downstream of Bonneville Dam (76%) is comparable to values since 2008 in the same location (i.e., 2008, 81%; 2010, 76%; 2011, 72%), but represents an increase from the mid-1990’s (minimum = 40%). Thus, although the NPMP has effectively reduced the total number of northern pikeminnow larger than 250 mm FL downstream of Bonneville Dam, reductions in the population size of fish larger than 380mm FL has been less pronounced. Rieman and Beamesderfer (1990) proposed that a decreasing trend in PSD may reflect the effect of the Sport Reward Fishery as evinced by the direction of change in the size-structure of the northern pikeminnow population. Further, Neumann and Allen (2007) suggested PSD can be high in low-density populations. Proportional stock density values can be related to lower abundance index values and Everhart and Youngs (1981) provided evidence that overexploited fish populations may show oscillating patterns of year class strength. As changes in northern pikeminnow abundance and size-structure may be related to exploitation, continued monitoring is needed to better understand the fisheries’ association with the functional dynamics of the population.
A compensatory response by other piscivores in the Columbia Basin to the sustained removal of northern pikeminnow could offset the net benefit of the removals (Ward and Zimmerman 1999). As reported in earlier work (Poe et al. 1991; Zimmerman 1999; Naughton et al. 2004), juvenile salmon constitute a small but consistent portion of smallmouth bass diets in the Columbia River. Our observations for 2014 substantiate these previous findings, with sculpins (family Cottidae) and minnows (family Cyprinidae) being the primary prey fish species consumed by smallmouth bass downstream of Bonneville Dam and in Bonneville Reservoir, respectively (Table 7). Ward and Zimmerman (1999)
149
suggested primary evidence of a compensatory response by smallmouth bass would likely be a shift in diet towards greater proportions of juvenile salmon. However, as stated above, indication of a compensatory response may become apparent at one or multiple scales (localized spatial, system-wide, sex-specific, etc.) As such, continued monitoring of smallmouth bass abundance and consumption to aid in the characterization of potential compensatory responses among various strata is warranted.
The abundance of walleye downstream of Bonneville Dam and in Bonneville Reservoir is low compared to abundance levels in reaches upstream (e.g., the tailrace areas of John Day and McNary dams). However, past studies conducted throughout the Columbia River have identified juvenile salmon as an important component of walleye diets that consist almost exclusively of fish (Poe et al. 1991; Vigg et al. 1991; Zimmerman 1999). During 2014, we encountered primarily peamouth chub or northern pikeminnow in the few walleye diet samples collected downstream of Bonneville Dam. Alternatively, the majority of walleye diet samples examined by Weaver et al. (2012), collected from the same location during 2011, contained salmonids. Takata et al. (2007) identified juvenile salmon most often in walleye digestive tracts from The Dalles and John Day reservoirs, whereas Gardner et al. (2013) found juvenile salmon most frequently in John Day samples, with equal proportions of juvenile salmon and members of the minnow family (northern pikeminnow and peamouth chub) in walleye diet samples collected from The Dalles Reservoir. While abundance and diet data from the current study may suggest the predatory burden imposed by walleye on juvenile salmon could be minimal, it is important to note these data are constrained in both space and time. Given evidence provided by others (e.g., diet composition, population dynamics, etc.) in different areas and over varying periods, it seems possible that relatively small shifts in population structure could result in an increased predatory impact of walleye in the lower Columbia River system. In light of the predatory potential of walleye on juvenile salmon, and apparent variability therein, further monitoring of demographic characteristics and diets is necessary to detect any increased impacts to juvenile salmon and assess with greater precision long-term trends.
Data collected during 2014 provided no unambiguous indication of the presence of a compensatory response. Previous evaluations of the NPMP also detected no responses by the predator community related directly to the sustained removal of northern pikeminnow (Ward et al. 1995; Ward and Zimmerman 1999; Zimmerman and Ward 1999). However, fishery management programs have been described as needing sustained annual sampling to effectively detect such a response should one occur (Beamesderfer et al. 1996). Thus, continued monitoring to assess the indirect implications of the Northern Pikeminnow Management Program seems warranted.
b. Predator Control and Management
The 2014 estimate of the system-wide exploitation rate (11.5 ± 4.6%, 95% CI) for northern pikeminnow greater than or equal to 250 mm FL is the second lowest reported during the past fifteen years of sampling (Table 21 and Figure 7) and falls towards the lower end of the target exploitation range of 10–20% expected to maintain reduced predation on juvenile salmon (Rieman and Beamesderfer 1990). To quantify the efficacy of the NPMP since the early 1990s, ODFW has applied a model that considers the cumulative effects of sustained exploitation on predation by northern pikeminnow (Friesen and Ward 1999). According to the structure of this model, exploitation in a given year will be manifest in the
150
subsequent year as limits to recruitment of individuals to larger size classes (local or system-wide) in the northern pikeminnow population. In this way, a reduction in predation in the present is dependent on our ability to restructure the population during both the current and previous years. Thus, while two years (e.g., 2013 and 2014) of lower than average exploitation is unlikely to substantially reduce the efficacy of the NPMP, continued system-wide exploitation at lower levels could result in increased predation on juvenile salmon as a greater number of larger, more efficient predators remain in the population and smaller individuals recruit to this larger, more piscivorous, size-class. Given the fragmented structure of the Columbia and Snake River system, it is likely insufficient to consider the whole without also considering variability contributed by individual reservoirs or reaches. A recent review of the sensitivities of our model appears to indicate area-specific exploitation downstream of Bonneville Dam may have a disproportionate influence on predation reduction, due presumably to high densities of juvenile salmon and steelhead in that area and a related functional response. To maintain the efficacy of the NPMP, we recommend continued annual evaluation of exploitation rates and estimates of reductions in predation and suggest steps be taken to ensure targeted removals are sufficient to meeting project thresholds (e.g., 10–20% exploitation). We also suggest efforts continue to examine differential area-specific contributions to predation reduction.
The 2014 Dam Angling Fishery accounted for 3.9% of the total northern pikeminnow harvest, a value slightly lower than that for 2013 (2.4%; Barr et al. 2014). Although the proportion of total fish harvested by the Dam Angling Fishery may be small, the relative impact on northern pikeminnow predation reduction efforts could be substantial. Northern pikeminnow collected during the 2014 Dam Angling Fishery at The Dalles and John Day dams were significantly larger than those captured in the Sport Reward Fishery in Bonneville and The Dalles reservoirs, respectively. Vigg et al. (1991) provided evidence that larger northern pikeminnow consumed a disproportionately greater number of juvenile salmoinds than smaller fish predators. Given both the apparent discrepancy in length distributions among Dam Angling and Sport Reward fisheries and the putative size-related bias in consumption of juvenile salmonids in the tailrace areas relative to other areas of the reservoir, dam anglers may have a better opportunity for harvesting larger, more predacious, northern pikeminnow than sport anglers (Martinelli and Shively 1997). Additionally, dam anglers harvest fish from the boat restricted zones, which are not accessible to sport anglers. The relatively few tags that are recovered in the Dam Angling Fishery may further provide some evidence dam anglers are harvesting a unique sub-set of the overall pikeminnow population. For these reasons, we support continued angling from the dams accompanied by concurrent monitoring of diet during future dam angling activities.
6. References
Anderson, R. O. 1980. Proportional stock density (PSD) and relative weight (Wr): interpretive indices for fish populations and communities. Pages 27–33 in S. Gloss and B. Shupp, editors. Practical fisheries management: more with less in the 1980s. New York Chapter American Fisheries Society, Bethesda, MD.
151
Anderson, R. O., and R. M. Neumann. 1996. Length, weight, and associated structural indices. Pages 447–482 in B. R. Murphy and D. W. Willis, editors. Fisheries Techniques, 2nd edition. American Fisheries Society, Bethesda, Maryland.
Barr, C.M., E. Tinus, M.D. Gardner, C. Mallette, and A.J. Storch. 2014. System-wide predator control program, Report C, indexing and fisheries evaluation. Oregon Department of Fish and Wildlife, Contract Number 56795. 2013 Annual Report to the Bonneville Power Administration, Portland, Oregon.
Beamesderfer, R. C., and B. E. Rieman. 1988. Size selectivity and bias in estimates of population statistics of smallmouth bass, walleye, and northern squawfish in a Columbia River reservoir. North American Journal of Fisheries Management 8:505–510.
Beamesderfer, R. C., D. L. Ward, and A. A. Nigro. 1996. Evaluation of the biological basis for a predator control program on northern squawfish (Ptychocheilus oregonensis) in the Columbia and Snake rivers. Canadian Journal of Fisheries and Aquatic Sciences 53:2898–2908.
Collis, K., D. D. Roby, D. P. Craig, S. Adamany, J. Y. Adkins, and D. E. Lyons. 2002. Colony size and diet composition of piscivorous water birds on the Lower Columbia River: Implications for losses of juvenile salmonids to avian predation. Transactions of the American Fisheries Society 131:537–550.
Davidson, A.C. and D.V. Hinkley. 1997. Bootstrap methods and their application. Cambridge University Press.
Dunlap, P. V., J. D. Hone, R.M. Shirley, and E. C. Winther. 2015a. Report A – Implementation of the Northern Pikeminnow Sport-Reward Fishery in the Columbia and Snake Rivers. Project Number 199007700. 2014 Annual report to the Bonneville Power Administration, Portland, Oregon.
Dunlap, P. V., R.M. Shirley, J. D. Hone., and E. C. Winther. 2015b. Report D – Northern Pikeminnow Dam Angling on the Columbia River. Project Number 199007700. 2014 Annual report to the Bonneville Power Administration, Portland, Oregon.
Everhart, W. H., and W. D. Youngs. 1981. Principles of fishery science, 2nd edition. Cornell University Press, Ithaca, New York.
Fox J. and S. Weisberg. 2011. An {R} Companion to Applied Regression, Second Edition. Thousand Oaks CA: Sage.URL: http://socserv.socsci.mcmaster.ca/jfox/Books/Companion
Friesen, T. A., and D. L. Ward. 1999. Management of northern pikeminnow and implications for juvenile salmonid survival in the lower Columbia and Snake rivers. North American Journal of Fisheries Management 19:406–420.
Frost, Conrad N. 2000. A key for identifying prey fish in the Columbia River based on diagnostic bones. U.S. Geological Survey Western fisheries Research Center, Cook WA. USA 50p.
Gabelhouse, D. W., Jr. 1984. A length-categorization system to assess fish stocks. North American Journal of Fisheries Management 4:273–285.
152
Gardner, M., E. Tinus, M.H. Weaver, C. Mallette, and E.S. Van Dyke. 2013. System-wide predator control program, Report C, indexing and fisheries evaluation. Oregon Department of Fish and Wildlife, Contract Number 56795. 2012 Annual Report to the Bonneville Power Administration, Portland, Oregon.
Hansel, H. C., S. D. Duke, P. T. Lofty, and G. A. Gray. 1988. Use of diagnostic bones to identify and estimate original lengths of ingested prey fishes. Transactions of the American Fisheries Society 117:55–62.
Knutsen, C. J., and D. L. Ward. 1999. Biological characteristics of northern pikeminnow in the Lower Columbia and Snake Rivers before and after sustained exploitation. Transactions of the American Fisheries Society 128:1008–1019.
Kolander, C. J., D. W. Willis, and B. R. Murphy. 1993. Proposed revision of the standard weights (Ws) equation for smallmouth bass. North American Journal of Fisheries Management 13:398–400.
Long, C. W., and F. J. Ossiander. 1974. Survival of coho salmon fingerlings passing through a perforated bulkhead in an empty turbine bag and through flow deflectors (with and without dentates) on the spillways of Lower Monumental Dam, Snake River, April–May 1973. Final Report (Contract DACW68-84-H-0034) to U.S. Army Corps of Engineers, Portland, Oregon.
Mann, H.B. 1945. Nonparametric tests against trend. Econometrica 12:245–259.
Martinelli, T. L., and R. S. Shively. 1997. Seasonal distribution, movements and habitat associations of northern squawfish in two lower Columbia River reservoirs. Regulated Rivers: Research and Management 6, pp 543–556, Nov–Dec 1997.
McLeod, A.I. 2011. Kendall: Kendall rank correlation and Mann-Kendall trend test. R package version 2.2. http://CRAN.R-project.org/package=Kendall.
Murphy, B. R., M. L. Brown, and T. A. Springer. 1990. Evaluation of the relative weight (Wr) index, with new applications to walleye. North American Journal of Fisheries Management 10:85–97.
Naughton, G. P., D. H. Bennet, and K. B. Newman. 2004. Predation on juvenile salmonids by smallmouth bass in the Lower Granite Reservoir system, Snake River. North American Journal of Fisheries Management 24:534–544.
Nehlsen, W., J. E. Williams, and J. A. Lichatowich. 1991. Pacific salmon at the crossroads: stocks at risk from California, Oregon, Idaho, and Washington. Fisheries 16:4–21.
Neumann, R. S. and M. S. Allen. 2007. Size structure. Pages 375–421 in C. S. Guy and M. L. Brown, editors. Analysis and interpretation of freshwater fisheries data. American fisheries Society, Bethesda, Maryland.
153
Parker, R. M., M. P. Zimmerman, and D. L. Ward. 1995. Variability in biological characteristics of northern squawfish in the lower Columbia and Snake rivers. Transactions of the American Fisheries Society 124:335–346.
Parrish, J.K., K. Haapa-aho, W. Walker, M. Stratton, J. Walsh, H. Ziel. 2006. Small-bodied and juvenile fishes of the Mid-Columbia Region including keys to diagnostic otoliths and cranial bones. Draft Version, March 2006. University of Washington, Seattle WA. USA 137p.
Poe, T. P., H. C. Hansel, S. Vigg, D. E. Palmer, and L. A. Prendergast. 1991. Feeding of predaceous fishes on out-migrating juvenile salmonids in the John Day Reservoir, Columbia River. Transactions of the American Fisheries Society 120:405–420.
R Core Team. 2013. R: A language and environment for statistical computing. R Foundation for Statistical Computing, Vienna, Austria. URL http://www.R-project.org/.
Raymond, H. L. 1988. Effects of hydroelectric development and fisheries enhancement on spring and summer Chinook salmon and steelhead in the Columbia River basin. North American Journal of Fisheries Management 8:1–24.
Ricker, W. E. 1975. Computation and interpretation of biological statistics of fish populations. Fisheries Research Board of Canada Bulletin 191.
Rieman, B. E., and R. C. Beamesderfer. 1990. Dynamics of a northern squawfish population and the potential to reduce predation on juvenile salmonids in a Columbia River reservoir. North American Journal of Fisheries Management 10:228–241.
Rieman, B. E., R. C. Beamesderfer, S. Vigg, and T. P. Poe. 1991. Estimated loss of juvenile salmonids to predation by northern squawfish, walleyes, and smallmouth bass in John Day Reservoir, Columbia River. Transactions of the American Fisheries Society 120:448–458.
Seaburg, K. G. 1957. A stomach sampler for live fish. Progressive fish-Culturist 19:137–139.
Styer, P. 2003. Statistical consulting report to review computational methods in the northern pikeminnow management program. Report to the Oregon Department of Fish and Wildlife, Clackamas.
Takata, H. K., M. J. Reesman, G. E. Reed, L. D. Layng, and T. A. Jones. 2007. Development of a system-wide predator control program: indexing and fisheries evaluation. Oregon Department of Fish and Wildlife, Contract Number DE-B1719-94BI24514. 2006 Annual Report to the Bonneville Power Administration, Portland, Oregon.
Vigg, S., T. P. Poe, L. A. Prendergast, and H. C. Hansel. 1991. Rates of consumption of juvenile salmonids and alternative prey fish by northern squawfish, walleyes, smallmouth bass, and channel catfish in John Day Reservoir, Columbia River. Transactions of the American Fisheries Society 120:421–438.
154
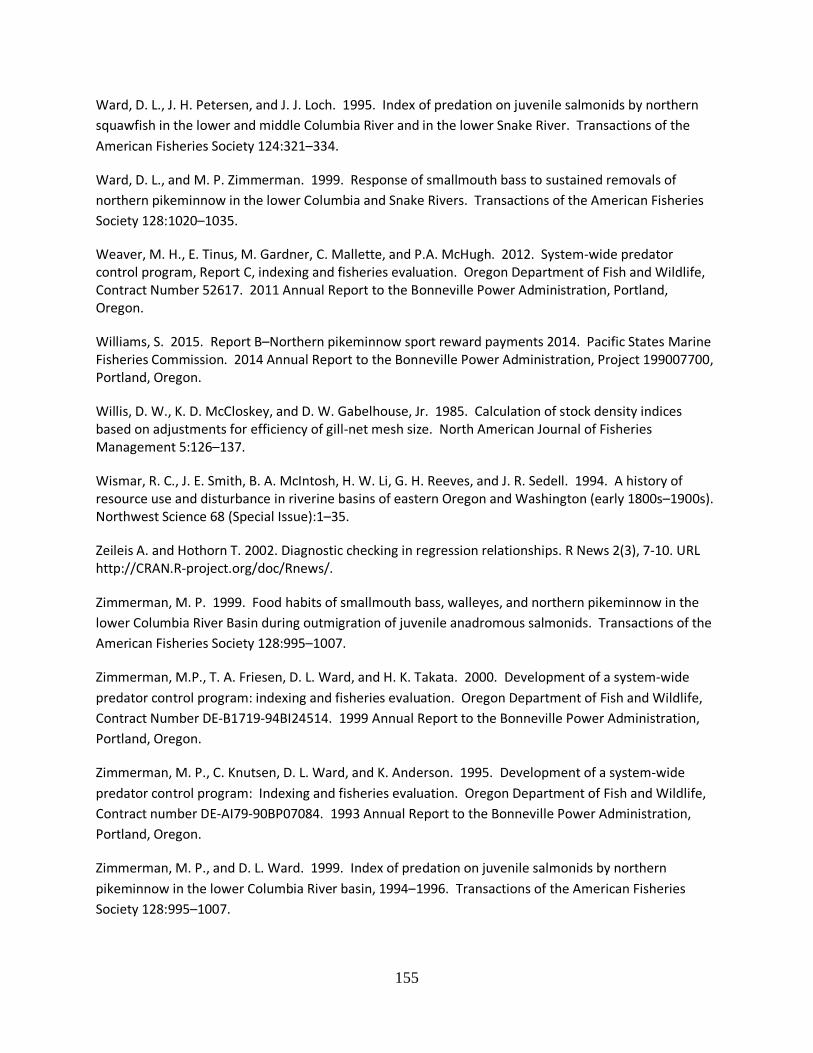
Ward, D. L., J. H. Petersen, and J. J. Loch. 1995. Index of predation on juvenile salmonids by northern squawfish in the lower and middle Columbia River and in the lower Snake River. Transactions of the American Fisheries Society 124:321–334.
Ward, D. L., and M. P. Zimmerman. 1999. Response of smallmouth bass to sustained removals of northern pikeminnow in the lower Columbia and Snake Rivers. Transactions of the American Fisheries Society 128:1020–1035.
Weaver, M. H., E. Tinus, M. Gardner, C. Mallette, and P.A. McHugh. 2012. System-wide predator control program, Report C, indexing and fisheries evaluation. Oregon Department of Fish and Wildlife, Contract Number 52617. 2011 Annual Report to the Bonneville Power Administration, Portland, Oregon.
Williams, S. 2015. Report B–Northern pikeminnow sport reward payments 2014. Pacific States Marine Fisheries Commission. 2014 Annual Report to the Bonneville Power Administration, Project 199007700, Portland, Oregon.
Willis, D. W., K. D. McCloskey, and D. W. Gabelhouse, Jr. 1985. Calculation of stock density indices based on adjustments for efficiency of gill-net mesh size. North American Journal of Fisheries Management 5:126–137.
Wismar, R. C., J. E. Smith, B. A. McIntosh, H. W. Li, G. H. Reeves, and J. R. Sedell. 1994. A history of resource use and disturbance in riverine basins of eastern Oregon and Washington (early 1800s–1900s). Northwest Science 68 (Special Issue):1–35.
Zeileis A. and Hothorn T. 2002. Diagnostic checking in regression relationships. R News 2(3), 7-10. URL http://CRAN.R-project.org/doc/Rnews/.
Zimmerman, M. P. 1999. Food habits of smallmouth bass, walleyes, and northern pikeminnow in the lower Columbia River Basin during outmigration of juvenile anadromous salmonids. Transactions of the American Fisheries Society 128:995–1007.
Zimmerman, M.P., T. A. Friesen, D. L. Ward, and H. K. Takata. 2000. Development of a system-wide predator control program: indexing and fisheries evaluation. Oregon Department of Fish and Wildlife, Contract Number DE-B1719-94BI24514. 1999 Annual Report to the Bonneville Power Administration, Portland, Oregon.
Zimmerman, M. P., C. Knutsen, D. L. Ward, and K. Anderson. 1995. Development of a system-wide predator control program: Indexing and fisheries evaluation. Oregon Department of Fish and Wildlife, Contract number DE-AI79-90BP07084. 1993 Annual Report to the Bonneville Power Administration, Portland, Oregon.
Zimmerman, M. P., and D. L. Ward. 1999. Index of predation on juvenile salmonids by northern pikeminnow in the lower Columbia River basin, 1994–1996. Transactions of the American Fisheries Society 128:995–1007.
155
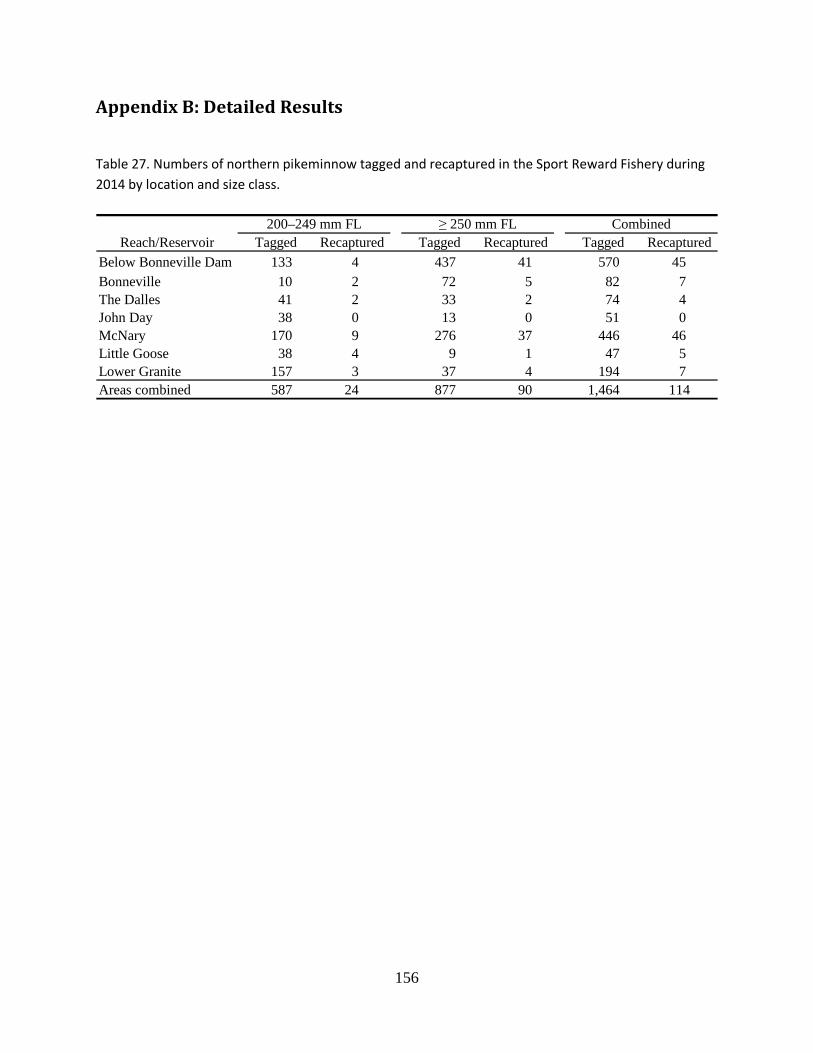
Appendix B: Detailed Results
Table 27. Numbers of northern pikeminnow tagged and recaptured in the Sport Reward Fishery during 2014 by location and size class.
Reach/Reservoir Tagged Recaptured Tagged Recaptured Tagged RecapturedBelow Bonneville Dam 133 4 437 41 570 45Bonneville 10 2 72 5 82 7The Dalles 41 2 33 2 74 4John Day 38 0 13 0 51 0McNary 170 9 276 37 446 46Little Goose 38 4 9 1 47 5Lower Granite 157 3 37 4 194 7Areas combined 587 24 877 90 1,464 114
200–249 mm FL ≥ 250 mm FL Combined
156
Table 18. System-wide weekly exploitation rates of northern pikeminnow (≥200 mm FL) for the Sport Reward Fishery, 2014.
Note: dashes (–) indicate no tagging effort, no recapture effort or no exploitation calculated.
Sampling Week Tagged Recaptured At-Large Exploitation (%)03/31–04/06 11 – 0 –04/07–04/13 82 – 11 –04/14–04/20 394 – 93 –04/21–04/27 165 – 487 –04/28–05/04 77 4 652 0.605/05–05/11 7 1 725 0.105/12–05/18 41 1 731 0.105/19–05/25 22 2 771 0.305/26–06/01 266 3 791 0.406/02–06/08 158 22 1054 2.106/09–06/15 194 6 1190 0.506/16–06/22 47 2 1378 0.106/23–06/29 – 9 1423 0.606/30–07/06 – 8 1414 0.607/07–07/13 – 5 1406 0.407/14–07/20 – 4 1401 0.307/21–07/27 – 5 1397 0.407/28–08/03 – 4 1392 0.308/04–08/10 – 2 1388 0.108/11–08/17 – 2 1386 0.108/18–08/24 – 4 1384 0.308/25–08/31 – 5 1380 0.409/01–09/07 – 6 1375 0.409/08–09/14 – 2 1369 0.109/15–09/21 – 4 1367 0.309/22–09/28 – 5 1363 0.409/29–10/05 – 1 1358 0.1
Total 1,465 107 9.0
157
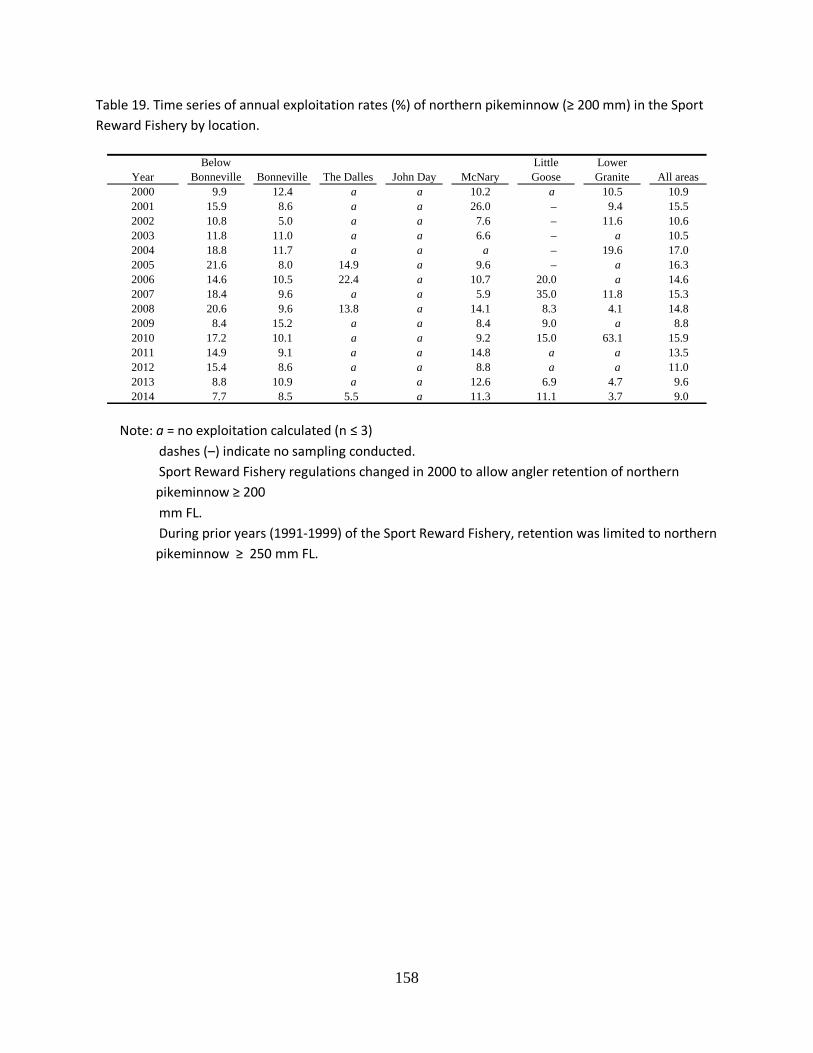
Table 19. Time series of annual exploitation rates (%) of northern pikeminnow (≥ 200 mm) in the Sport Reward Fishery by location.
Note: a = no exploitation calculated (n ≤ 3) dashes (–) indicate no sampling conducted. Sport Reward Fishery regulations changed in 2000 to allow angler retention of northern pikeminnow ≥ 200 mm FL. During prior years (1991-1999) of the Sport Reward Fishery, retention was limited to northern pikeminnow ≥ 250 mm FL.
Year2000 9.9 12.4 a a 10.2 a 10.5 10.92001 15.9 8.6 a a 26.0 – 9.4 15.52002 10.8 5.0 a a 7.6 – 11.6 10.62003 11.8 11.0 a a 6.6 – a 10.52004 18.8 11.7 a a a – 19.6 17.02005 21.6 8.0 14.9 a 9.6 – a 16.32006 14.6 10.5 22.4 a 10.7 20.0 a 14.62007 18.4 9.6 a a 5.9 35.0 11.8 15.32008 20.6 9.6 13.8 a 14.1 8.3 4.1 14.82009 8.4 15.2 a a 8.4 9.0 a 8.82010 17.2 10.1 a a 9.2 15.0 63.1 15.92011 14.9 9.1 a a 14.8 a a 13.52012 15.4 8.6 a a 8.8 a a 11.02013 8.8 10.9 a a 12.6 6.9 4.7 9.62014 7.7 8.5 5.5 a 11.3 11.1 3.7 9.0
Lower Granite All areasMcNary
Little Goose
Below Bonneville Bonneville The Dalles John Day
158
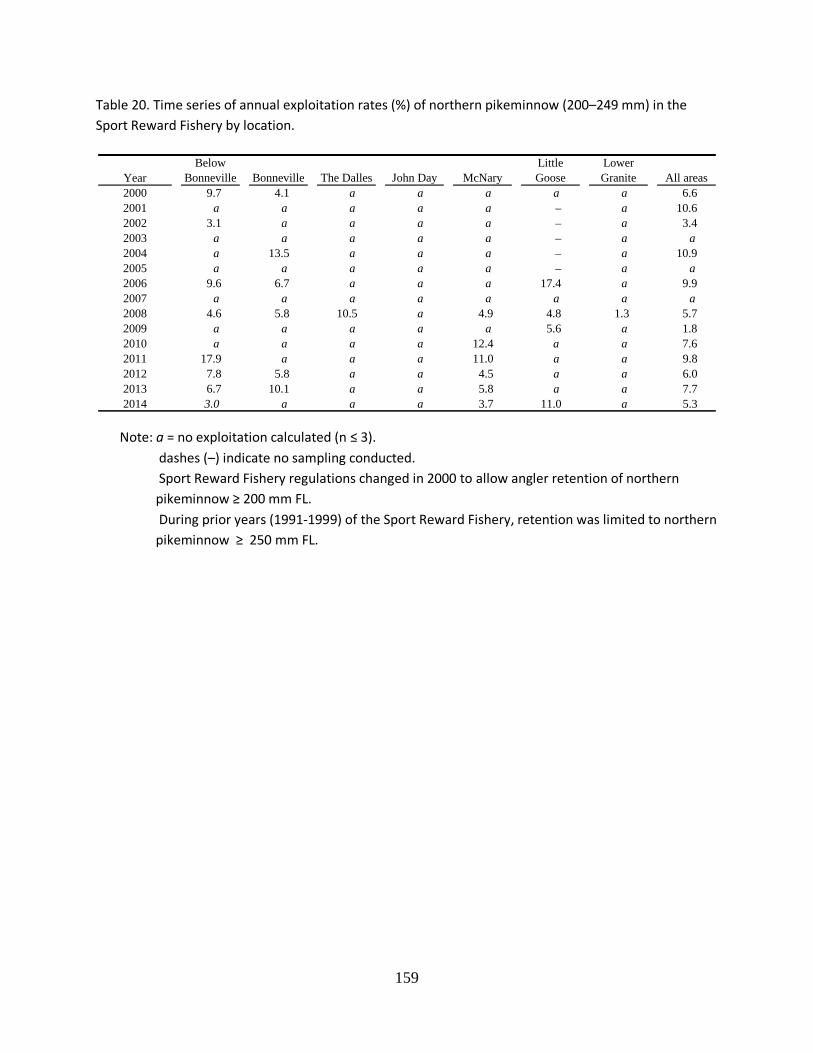
Table 20. Time series of annual exploitation rates (%) of northern pikeminnow (200–249 mm) in the Sport Reward Fishery by location.
Note: a = no exploitation calculated (n ≤ 3). dashes (–) indicate no sampling conducted. Sport Reward Fishery regulations changed in 2000 to allow angler retention of northern pikeminnow ≥ 200 mm FL. During prior years (1991-1999) of the Sport Reward Fishery, retention was limited to northern pikeminnow ≥ 250 mm FL.
Year2000 9.7 4.1 a a a a a 6.62001 a a a a a – a 10.62002 3.1 a a a a – a 3.42003 a a a a a – a a2004 a 13.5 a a a – a 10.92005 a a a a a – a a2006 9.6 6.7 a a a 17.4 a 9.92007 a a a a a a a a2008 4.6 5.8 10.5 a 4.9 4.8 1.3 5.72009 a a a a a 5.6 a 1.82010 a a a a 12.4 a a 7.62011 17.9 a a a 11.0 a a 9.82012 7.8 5.8 a a 4.5 a a 6.02013 6.7 10.1 a a 5.8 a a 7.72014 3.0 a a a 3.7 11.0 a 5.3
Little Goose
Lower Granite All areas
Below Bonneville Bonneville The Dalles John Day McNary
159
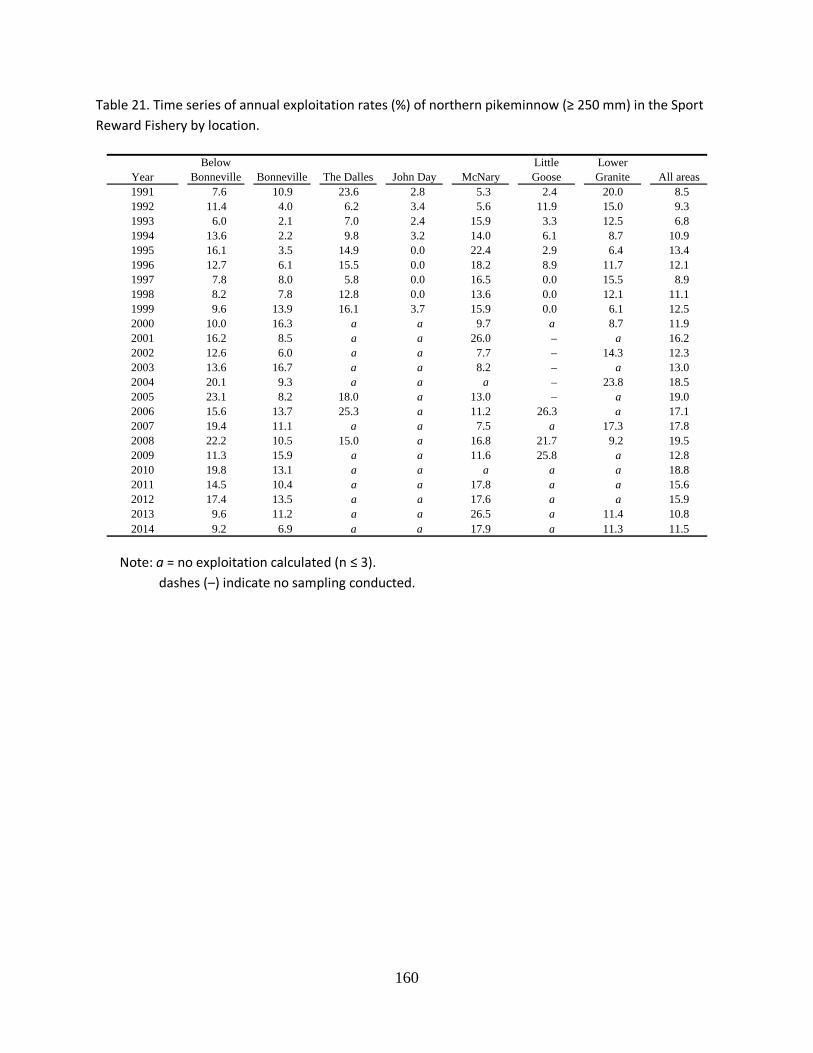
Table 21. Time series of annual exploitation rates (%) of northern pikeminnow (≥ 250 mm) in the Sport Reward Fishery by location.
Note: a = no exploitation calculated (n ≤ 3). dashes (–) indicate no sampling conducted.
Year1991 7.6 10.9 23.6 2.8 5.3 2.4 20.0 8.51992 11.4 4.0 6.2 3.4 5.6 11.9 15.0 9.31993 6.0 2.1 7.0 2.4 15.9 3.3 12.5 6.81994 13.6 2.2 9.8 3.2 14.0 6.1 8.7 10.91995 16.1 3.5 14.9 0.0 22.4 2.9 6.4 13.41996 12.7 6.1 15.5 0.0 18.2 8.9 11.7 12.11997 7.8 8.0 5.8 0.0 16.5 0.0 15.5 8.91998 8.2 7.8 12.8 0.0 13.6 0.0 12.1 11.11999 9.6 13.9 16.1 3.7 15.9 0.0 6.1 12.52000 10.0 16.3 a a 9.7 a 8.7 11.92001 16.2 8.5 a a 26.0 – a 16.22002 12.6 6.0 a a 7.7 – 14.3 12.32003 13.6 16.7 a a 8.2 – a 13.02004 20.1 9.3 a a a – 23.8 18.52005 23.1 8.2 18.0 a 13.0 – a 19.02006 15.6 13.7 25.3 a 11.2 26.3 a 17.12007 19.4 11.1 a a 7.5 a 17.3 17.82008 22.2 10.5 15.0 a 16.8 21.7 9.2 19.52009 11.3 15.9 a a 11.6 25.8 a 12.82010 19.8 13.1 a a a a a 18.82011 14.5 10.4 a a 17.8 a a 15.62012 17.4 13.5 a a 17.6 a a 15.92013 9.6 11.2 a a 26.5 a 11.4 10.82014 9.2 6.9 a a 17.9 a 11.3 11.5
Below Bonneville Bonneville The Dalles John Day McNary
Little Goose
Lower Granite All areas
160
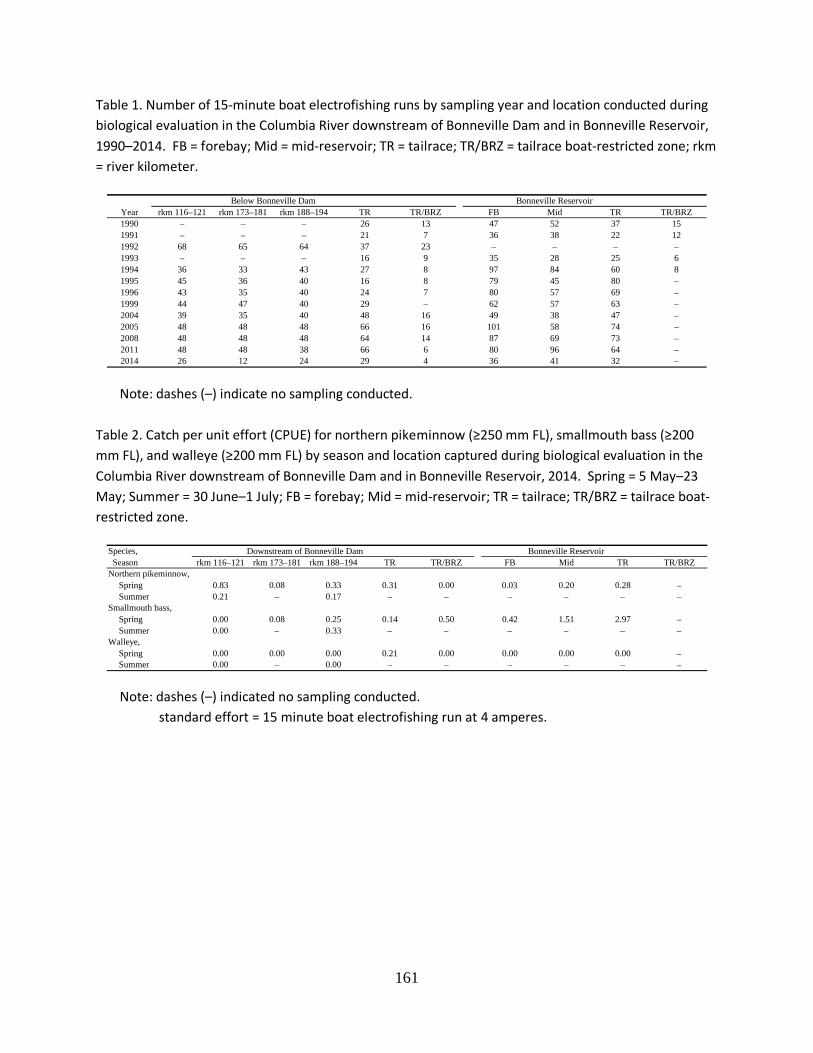
Table 1. Number of 15-minute boat electrofishing runs by sampling year and location conducted during biological evaluation in the Columbia River downstream of Bonneville Dam and in Bonneville Reservoir, 1990–2014. FB = forebay; Mid = mid-reservoir; TR = tailrace; TR/BRZ = tailrace boat-restricted zone; rkm = river kilometer.
Note: dashes (–) indicate no sampling conducted.
Table 2. Catch per unit effort (CPUE) for northern pikeminnow (≥250 mm FL), smallmouth bass (≥200 mm FL), and walleye (≥200 mm FL) by season and location captured during biological evaluation in the Columbia River downstream of Bonneville Dam and in Bonneville Reservoir, 2014. Spring = 5 May–23 May; Summer = 30 June–1 July; FB = forebay; Mid = mid-reservoir; TR = tailrace; TR/BRZ = tailrace boat-restricted zone.
Note: dashes (–) indicated no sampling conducted. standard effort = 15 minute boat electrofishing run at 4 amperes.
Year rkm 116–121 rkm 173–181 rkm 188–194 TR TR/BRZ FB Mid TR TR/BRZ1990 – – – 26 13 47 52 37 151991 – – – 21 7 36 38 22 121992 68 65 64 37 23 – – – –1993 – – – 16 9 35 28 25 61994 36 33 43 27 8 97 84 60 81995 45 36 40 16 8 79 45 80 –1996 43 35 40 24 7 80 57 69 –1999 44 47 40 29 – 62 57 63 –2004 39 35 40 48 16 49 38 47 –2005 48 48 48 66 16 101 58 74 –2008 48 48 48 64 14 87 69 73 –2011 48 48 38 66 6 80 96 64 –2014 26 12 24 29 4 36 41 32 –
Bonneville ReservoirBelow Bonneville Dam
Species, Season rkm 116–121 rkm 173–181 rkm 188–194 TR TR/BRZ FB Mid TR TR/BRZNorthern pikeminnow,
Spring 0.83 0.08 0.33 0.31 0.00 0.03 0.20 0.28 – Summer 0.21 – 0.17 – – – – – –
Smallmouth bass, Spring 0.00 0.08 0.25 0.14 0.50 0.42 1.51 2.97 – Summer 0.00 – 0.33 – – – – – –
Walleye, Spring 0.00 0.00 0.00 0.21 0.00 0.00 0.00 0.00 – Summer 0.00 – 0.00 – – – – – –
Downstream of Bonneville Dam Bonneville Reservoir
161
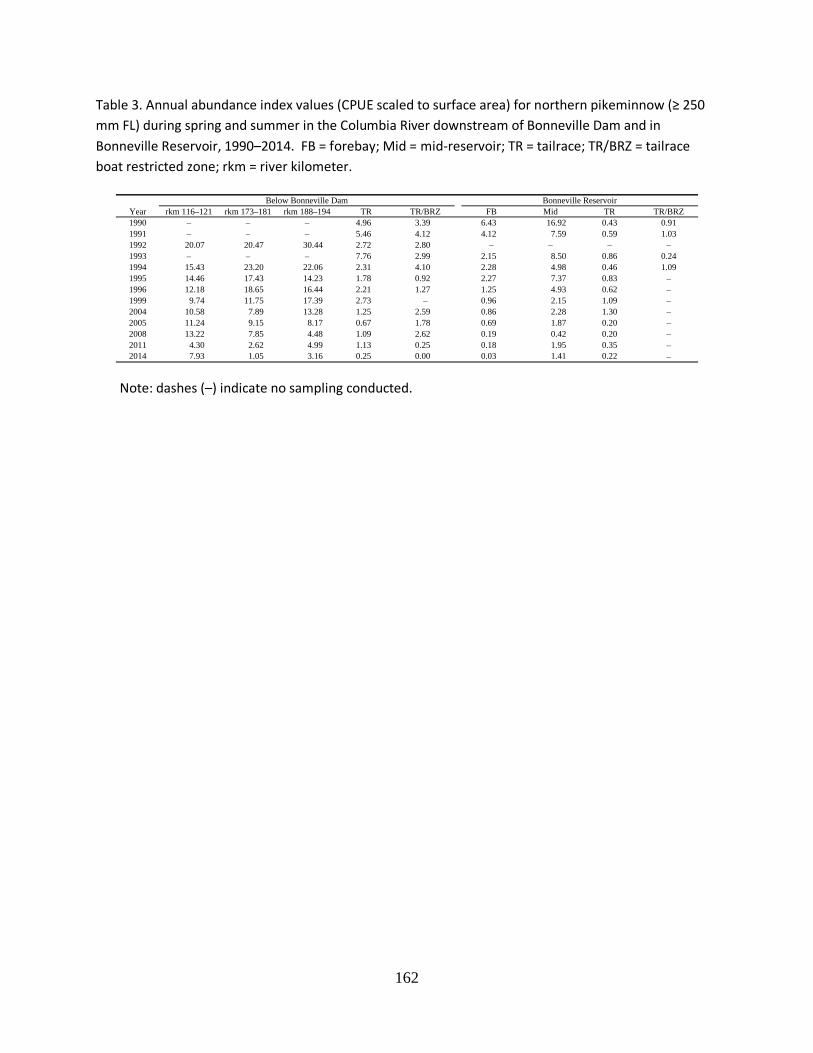
Table 3. Annual abundance index values (CPUE scaled to surface area) for northern pikeminnow (≥ 250 mm FL) during spring and summer in the Columbia River downstream of Bonneville Dam and in Bonneville Reservoir, 1990–2014. FB = forebay; Mid = mid-reservoir; TR = tailrace; TR/BRZ = tailrace boat restricted zone; rkm = river kilometer.
Note: dashes (–) indicate no sampling conducted.
Year rkm 116–121 rkm 173–181 rkm 188–194 TR TR/BRZ FB Mid TR TR/BRZ1990 – – – 4.96 3.39 6.43 16.92 0.43 0.911991 – – – 5.46 4.12 4.12 7.59 0.59 1.031992 20.07 20.47 30.44 2.72 2.80 – – – –1993 – – – 7.76 2.99 2.15 8.50 0.86 0.241994 15.43 23.20 22.06 2.31 4.10 2.28 4.98 0.46 1.091995 14.46 17.43 14.23 1.78 0.92 2.27 7.37 0.83 –1996 12.18 18.65 16.44 2.21 1.27 1.25 4.93 0.62 –1999 9.74 11.75 17.39 2.73 – 0.96 2.15 1.09 –2004 10.58 7.89 13.28 1.25 2.59 0.86 2.28 1.30 –2005 11.24 9.15 8.17 0.67 1.78 0.69 1.87 0.20 –2008 13.22 7.85 4.48 1.09 2.62 0.19 0.42 0.20 –2011 4.30 2.62 4.99 1.13 0.25 0.18 1.95 0.35 –2014 7.93 1.05 3.16 0.25 0.00 0.03 1.41 0.22 –
Below Bonneville Dam Bonneville Reservoir
162
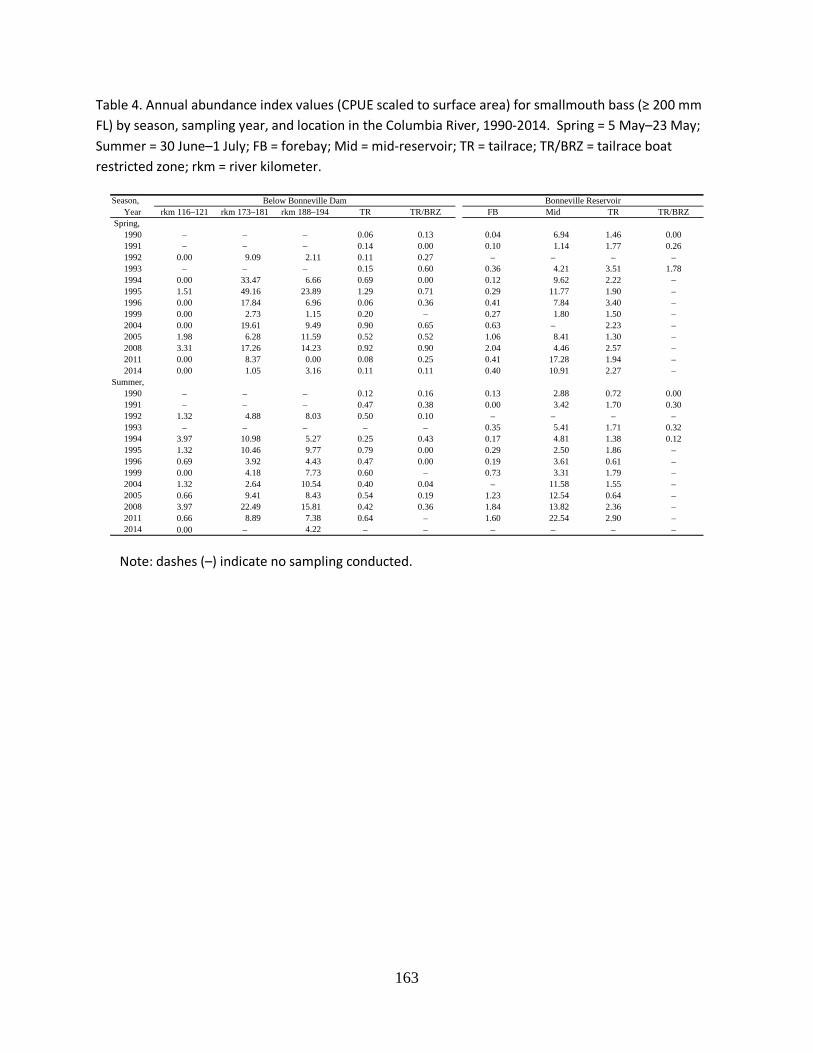
Table 4. Annual abundance index values (CPUE scaled to surface area) for smallmouth bass (≥ 200 mm FL) by season, sampling year, and location in the Columbia River, 1990-2014. Spring = 5 May–23 May; Summer = 30 June–1 July; FB = forebay; Mid = mid-reservoir; TR = tailrace; TR/BRZ = tailrace boat restricted zone; rkm = river kilometer.
Note: dashes (–) indicate no sampling conducted.
Season,Year rkm 116–121 rkm 173–181 rkm 188–194 TR TR/BRZ FB Mid TR TR/BRZ
Spring,1990 – – – 0.06 0.13 0.04 6.94 1.46 0.001991 – – – 0.14 0.00 0.10 1.14 1.77 0.261992 0.00 9.09 2.11 0.11 0.27 – – – –1993 – – – 0.15 0.60 0.36 4.21 3.51 1.781994 0.00 33.47 6.66 0.69 0.00 0.12 9.62 2.22 –1995 1.51 49.16 23.89 1.29 0.71 0.29 11.77 1.90 –1996 0.00 17.84 6.96 0.06 0.36 0.41 7.84 3.40 –1999 0.00 2.73 1.15 0.20 – 0.27 1.80 1.50 –2004 0.00 19.61 9.49 0.90 0.65 0.63 – 2.23 –2005 1.98 6.28 11.59 0.52 0.52 1.06 8.41 1.30 –2008 3.31 17.26 14.23 0.92 0.90 2.04 4.46 2.57 –2011 0.00 8.37 0.00 0.08 0.25 0.41 17.28 1.94 –2014 0.00 1.05 3.16 0.11 0.11 0.40 10.91 2.27 –
Summer,1990 – – – 0.12 0.16 0.13 2.88 0.72 0.001991 – – – 0.47 0.38 0.00 3.42 1.70 0.301992 1.32 4.88 8.03 0.50 0.10 – – – –1993 – – – – – 0.35 5.41 1.71 0.321994 3.97 10.98 5.27 0.25 0.43 0.17 4.81 1.38 0.121995 1.32 10.46 9.77 0.79 0.00 0.29 2.50 1.86 –1996 0.69 3.92 4.43 0.47 0.00 0.19 3.61 0.61 –1999 0.00 4.18 7.73 0.60 – 0.73 3.31 1.79 –2004 1.32 2.64 10.54 0.40 0.04 – 11.58 1.55 –2005 0.66 9.41 8.43 0.54 0.19 1.23 12.54 0.64 –2008 3.97 22.49 15.81 0.42 0.36 1.84 13.82 2.36 –2011 0.66 8.89 7.38 0.64 – 1.60 22.54 2.90 –2014 0.00 – 4.22 – – – – – –
Below Bonneville Dam Bonneville Reservoir
163

Table 5. Annual abundance index values (catch per 15-minute electrofishing run, scaled to surface area) for walleye (≥200 mm FL) by season, sampling year, and location in the Columbia River downstream of Bonneville Dam and in Bonneville Reservoir, 1990-2014. Spring = 5 May–23 May; Summer = 30 June–1 July; FB = forebay; Mid = mid-reservoir; TR = tailrace; TR/BRZ = tailrace boat restricted zone; rkm = river kilometer.
Note: dashes (–) indicate no sampling conducted.
Table 6. Number (n) of northern pikeminnow, smallmouth bass, and walleye (≥200 mm FL) digestive tracts examined from downstream of Bonneville Dam and Bonneville Reservoir, 2014, and proportion of samples containing food, fish, and salmonids (Sal). Spring = 5 May – 23 May; Summer = 30 June – 1 July.
Note: na = not applicable.
Season,Year rkm 116–121 rkm 173–181 rkm 188–194 TR TR/BRZ FB Mid TR TR/BRZ
Spring,1990 – – – 0.00 0.04 0.00 0.00 0.00 0.081991 – – – 0.36 0.14 0.00 0.00 0.18 0.101992 0.00 2.60 3.16 0.23 0.05 – – – –1993 – – – 0.05 0.00 0.00 0.00 0.13 0.001994 0.00 1.39 0.67 1.09 0.05 0.02 1.00 0.11 –1995 0.00 4.18 0.00 0.49 0.11 0.00 0.76 0.11 –1996 0.00 0.66 0.63 0.17 0.36 0.00 0.94 0.18 –1999 0.00 0.00 1.15 0.13 – 0.00 0.36 0.03 –2004 0.00 0.00 0.00 0.24 0.00 0.00 – 0.13 –2005 0.00 0.00 0.00 0.07 0.03 0.00 0.00 0.02 –2008 0.00 0.00 0.00 0.02 0.03 0.00 0.34 0.06 –2011 0.00 1.14 0.90 0.14 0.00 0.00 0.30 0.41 –2014 0.00 0.00 0.00 0.16 0.00 0.00 0.00 0.00 –
Summer,1990 – – – 0.18 0.03 0.00 0.29 0.05 0.001991 – – – 0.08 0.00 0.00 0.00 0.09 0.001992 0.00 0.70 0.24 0.03 0.00 – – – –1993 – – – – – 0.00 0.00 0.00 0.001994 0.00 2.62 1.05 0.04 0.22 0.00 0.00 0.00 0.021995 0.00 2.09 1.15 0.30 0.00 0.00 0.55 0.08 –1996 0.00 0.00 0.63 0.24 0.11 0.00 0.64 0.06 –1999 0.00 0.00 1.41 0.14 – 0.00 0.19 0.06 –2004 0.00 0.66 0.53 0.07 0.04 – 0.76 0.02 –2005 0.00 0.00 0.00 0.00 0.00 0.00 0.16 0.00 –2008 0.00 0.52 0.00 0.11 0.00 0.00 0.15 0.00 –2011 0.00 0.52 2.11 0.11 – 0.00 0.30 0.02 –2014 0.00 – 0.00 – – – – – –
Below Bonneville Dam Bonneville Reservoir
Season,Reach/Reservoir nnon-empty nempty nnon-empty nempty nnon-empty nempty
Spring,Below Bonneville Dam 17 8 0.68 0.60 0.28 8 0 1.00 0.63 0.13 6 0 1.00 0.83 0.17Bonneville 19 13 0.59 0.19 0.03 145 12 0.92 0.54 0.05 0 0 na na naAll 36 21 0.63 0.37 0.14 153 12 0.93 0.54 0.05 6 0 1.00 0.83 0.17
Summer,Below Bonneville Dam 5 1 0.83 0.50 0.17 2 1 0.67 0.67 0.33 0 0 na na na
walleyesmallmouth bassnorthern pikeminnow
164
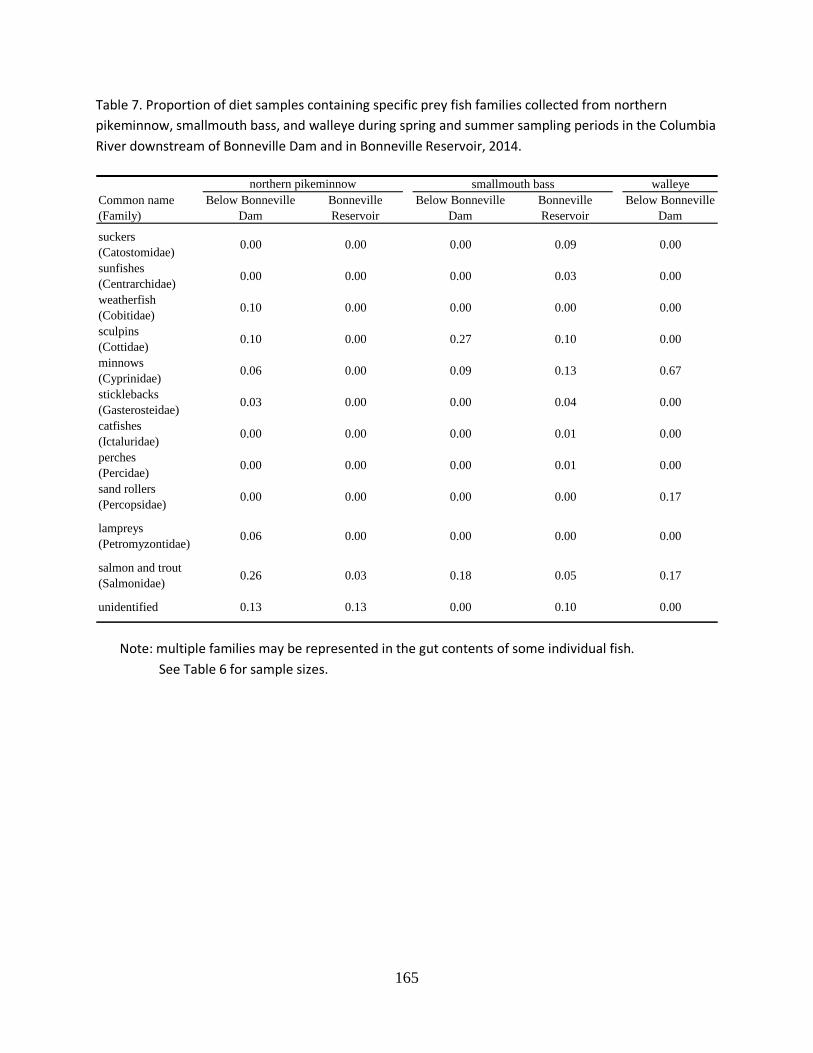
Table 7. Proportion of diet samples containing specific prey fish families collected from northern pikeminnow, smallmouth bass, and walleye during spring and summer sampling periods in the Columbia River downstream of Bonneville Dam and in Bonneville Reservoir, 2014.
Note: multiple families may be represented in the gut contents of some individual fish. See Table 6 for sample sizes.
walleyeCommon name (Family)
Below Bonneville Dam
Bonneville Reservoir
Below Bonneville Dam
Bonneville Reservoir
Below Bonneville Dam
suckers (Catostomidae) 0.00 0.00 0.00 0.09 0.00
sunfishes (Centrarchidae) 0.00 0.00 0.00 0.03 0.00
weatherfish (Cobitidae) 0.10 0.00 0.00 0.00 0.00
sculpins (Cottidae) 0.10 0.00 0.27 0.10 0.00
minnows (Cyprinidae) 0.06 0.00 0.09 0.13 0.67
sticklebacks (Gasterosteidae) 0.03 0.00 0.00 0.04 0.00
catfishes (Ictaluridae) 0.00 0.00 0.00 0.01 0.00
perches (Percidae) 0.00 0.00 0.00 0.01 0.00
sand rollers (Percopsidae) 0.00 0.00 0.00 0.00 0.17
lampreys (Petromyzontidae) 0.06 0.00 0.00 0.00 0.00
salmon and trout (Salmonidae) 0.26 0.03 0.18 0.05 0.17
unidentified 0.13 0.13 0.00 0.10 0.00
northern pikeminnow smallmouth bass
165

Table 8. Annual consumption index values for northern pikeminnow (≥ 250 mm FL) by season, sampling year, and location in the Columbia River downstream of Bonneville Dam and in Bonneville Reservoir, 1990–2014. Spring = 5 May–23 May; Summer = 30 June–1 July; FB = Forebay; Mid = Mid-reservoir; TR = Tailrace; TR/BRZ = tailrace boat-restricted zone; rkm = river kilometer.
Note: *includes boat-restriced zone in 1990 and 1993 and summer of 1994. a = sample size insufficient (n≤5) to calculate consumption index. dashes (–) indicate no sampling conducted.
Season, Year rkm 116–121 rkm 173–181 rkm 188–194 TR TR/BRZ FB Mid TR*
Spring,1990 – – – 1.28 2.34 0.67 0.00 1.561992 0.81 1.97 2.16 0.91 1.41 – – –1993 – – – 0.53 0.82 0.46 0.00 0.001994 0.50 1.89 1.93 3.03 0.79 0.21 0.25 0.001995 0.54 0.34 1.03 0.91 1.76 0.45 0.00 0.231996 0.37 0.07 0.41 0.37 0.60 0.00 0.12 0.001999 0.77 0.44 0.42 0.14 – 0.00 0.59 0.162004 0.17 0.31 0.11 0.26 0.97 0.52 – 0.002005 0.17 0.00 0.54 0.42 1.58 0.28 a 1.472008 0.79 0.98 0.00 1.02 0.94 1.31 a 0.642011 0.57 0.58 a 0.71 1.00 0.00 0.00 0.492014 0.27 a a 1.31 a a 0.00 0.29
Summer,1990 – – – 0.54 4.79 1.68 0.00 0.671992 0.00 2.34 4.28 2.89 9.02 – – –1993 – – – – – 0.36 0.00 0.271994 1.80 1.65 0.83 0.55 2.32 0.14 0.00 2.701995 2.14 0.44 1.22 1.25 0.94 0.00 0.00 0.921996 0.00 0.00 0.00 0.60 3.04 0.00 0.00 0.001999 1.25 0.00 0.55 0.24 – 0.00 0.00 0.302004 0.45 0.71 0.17 0.20 3.99 – 0.00 1.072005 1.19 0.34 0.62 0.00 3.84 0.00 a a2008 1.66 1.19 0.39 0.25 0.91 a a a2011 a a 0.00 0.32 – 0.00 0.00 0.842014 a – a – – – – –
Bonneville ReservoirBelow Bonneville Dam
166
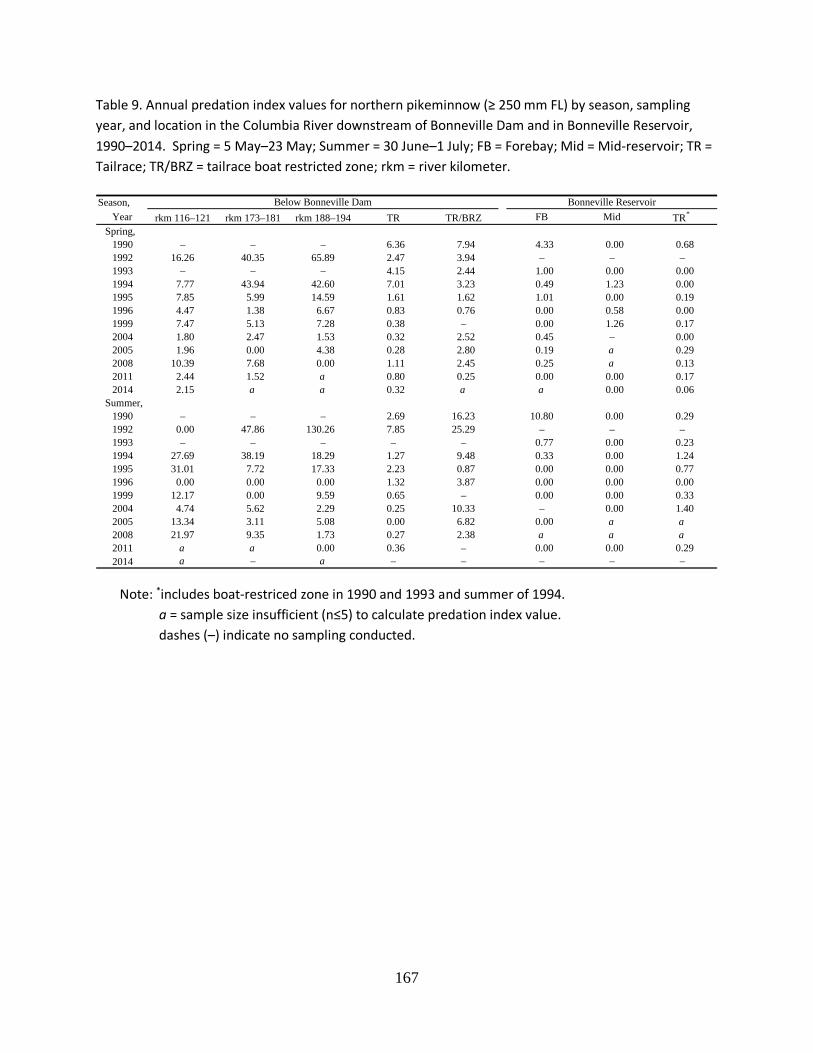
Table 9. Annual predation index values for northern pikeminnow (≥ 250 mm FL) by season, sampling year, and location in the Columbia River downstream of Bonneville Dam and in Bonneville Reservoir, 1990–2014. Spring = 5 May–23 May; Summer = 30 June–1 July; FB = Forebay; Mid = Mid-reservoir; TR = Tailrace; TR/BRZ = tailrace boat restricted zone; rkm = river kilometer.
Note: *includes boat-restriced zone in 1990 and 1993 and summer of 1994. a = sample size insufficient (n≤5) to calculate predation index value. dashes (–) indicate no sampling conducted.
Season, Year rkm 116–121 rkm 173–181 rkm 188–194 TR TR/BRZ FB Mid TR*
Spring,1990 – – – 6.36 7.94 4.33 0.00 0.681992 16.26 40.35 65.89 2.47 3.94 – – –1993 – – – 4.15 2.44 1.00 0.00 0.001994 7.77 43.94 42.60 7.01 3.23 0.49 1.23 0.001995 7.85 5.99 14.59 1.61 1.62 1.01 0.00 0.191996 4.47 1.38 6.67 0.83 0.76 0.00 0.58 0.001999 7.47 5.13 7.28 0.38 – 0.00 1.26 0.172004 1.80 2.47 1.53 0.32 2.52 0.45 – 0.002005 1.96 0.00 4.38 0.28 2.80 0.19 a 0.292008 10.39 7.68 0.00 1.11 2.45 0.25 a 0.132011 2.44 1.52 a 0.80 0.25 0.00 0.00 0.172014 2.15 a a 0.32 a a 0.00 0.06
Summer,1990 – – – 2.69 16.23 10.80 0.00 0.291992 0.00 47.86 130.26 7.85 25.29 – – –1993 – – – – – 0.77 0.00 0.231994 27.69 38.19 18.29 1.27 9.48 0.33 0.00 1.241995 31.01 7.72 17.33 2.23 0.87 0.00 0.00 0.771996 0.00 0.00 0.00 1.32 3.87 0.00 0.00 0.001999 12.17 0.00 9.59 0.65 – 0.00 0.00 0.332004 4.74 5.62 2.29 0.25 10.33 – 0.00 1.402005 13.34 3.11 5.08 0.00 6.82 0.00 a a2008 21.97 9.35 1.73 0.27 2.38 a a a2011 a a 0.00 0.36 – 0.00 0.00 0.292014 a – a – – – – –
Below Bonneville Dam Bonneville Reservoir
167
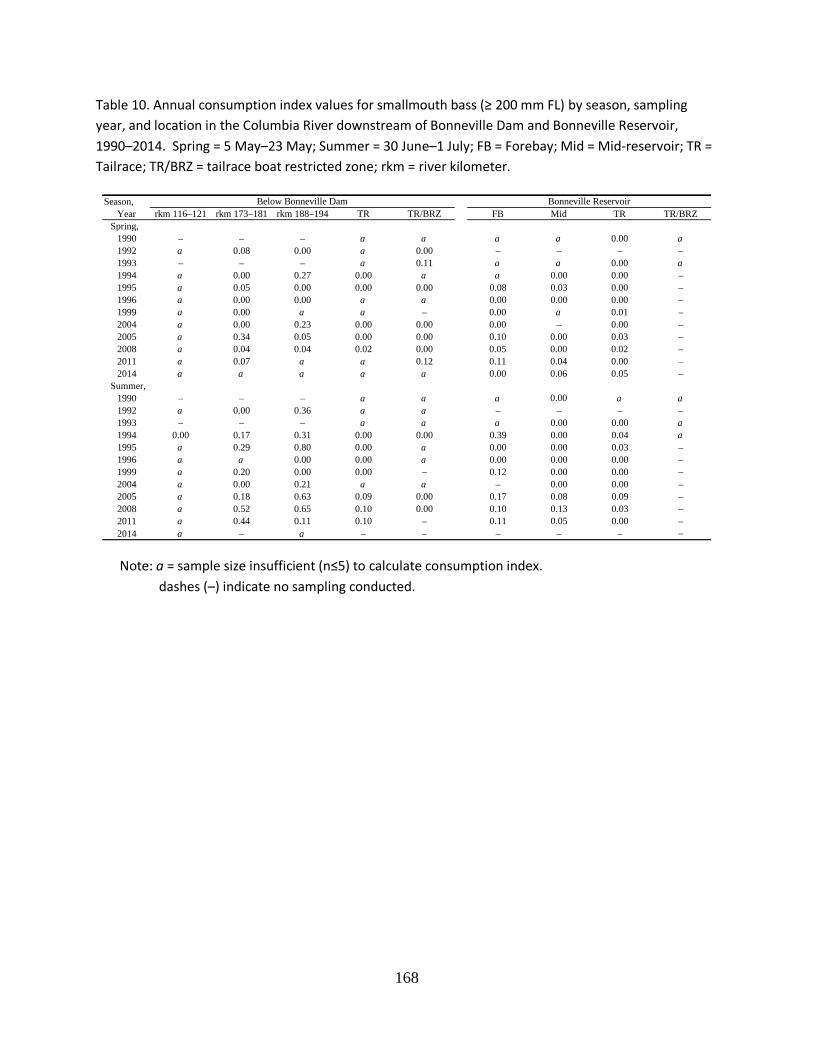
Table 10. Annual consumption index values for smallmouth bass (≥ 200 mm FL) by season, sampling year, and location in the Columbia River downstream of Bonneville Dam and Bonneville Reservoir, 1990–2014. Spring = 5 May–23 May; Summer = 30 June–1 July; FB = Forebay; Mid = Mid-reservoir; TR = Tailrace; TR/BRZ = tailrace boat restricted zone; rkm = river kilometer.
Note: a = sample size insufficient (n≤5) to calculate consumption index. dashes (–) indicate no sampling conducted.
Season, Year rkm 116–121 rkm 173–181 rkm 188–194 TR TR/BRZ FB Mid TR TR/BRZ
Spring,1990 – – – a a a a 0.00 a1992 a 0.08 0.00 a 0.00 – – – –1993 – – – a 0.11 a a 0.00 a1994 a 0.00 0.27 0.00 a a 0.00 0.00 –1995 a 0.05 0.00 0.00 0.00 0.08 0.03 0.00 –1996 a 0.00 0.00 a a 0.00 0.00 0.00 –1999 a 0.00 a a – 0.00 a 0.01 –2004 a 0.00 0.23 0.00 0.00 0.00 – 0.00 –2005 a 0.34 0.05 0.00 0.00 0.10 0.00 0.03 –2008 a 0.04 0.04 0.02 0.00 0.05 0.00 0.02 –2011 a 0.07 a a 0.12 0.11 0.04 0.00 –2014 a a a a a 0.00 0.06 0.05 –
Summer,1990 – – – a a a 0.00 a a1992 a 0.00 0.36 a a – – – –1993 – – – a a a 0.00 0.00 a1994 0.00 0.17 0.31 0.00 0.00 0.39 0.00 0.04 a1995 a 0.29 0.80 0.00 a 0.00 0.00 0.03 –1996 a a 0.00 0.00 a 0.00 0.00 0.00 –1999 a 0.20 0.00 0.00 – 0.12 0.00 0.00 –2004 a 0.00 0.21 a a – 0.00 0.00 –2005 a 0.18 0.63 0.09 0.00 0.17 0.08 0.09 –2008 a 0.52 0.65 0.10 0.00 0.10 0.13 0.03 –2011 a 0.44 0.11 0.10 – 0.11 0.05 0.00 –2014 a – a – – – – – –
Below Bonneville Dam Bonneville Reservoir
168

Table 11. Predation index values for smallmouth bass (≥200 mm FL) by season, sampling year, and location in the Columbia River downstream of Bonneville Dam and in Bonneville Reservoir, 1990–2014. Spring = 5 May–23 May; Summer = 30 June–1 July; FB = forebay; Mid = mid-reservoir; TR = tailrace; TR/BRZ = tailrace boat restricted zone; rkm = river kilometer.
Note: a = sample size insufficient (n≤5) to calculate predation index value. dashes (–) indicate no sampling conducted.
Season, Year rkm 116–121 rkm 173–181 rkm 188–194 TR TR/BRZ FB Mid TR TR/BRZ
Spring,1990 – – – a a a a 0.00 a1992 a 0.68 0.00 a 0.00 – – – a1993 – – – a 0.07 a a 0.00 –1994 a 0.00 1.80 0.00 a a 0.00 0.00 –1995 a 2.59 0.00 0.00 0.00 0.02 0.39 0.00 –1996 a 0.00 0.00 a a 0.00 0.00 0.00 –1999 a 0.00 a a – 0.00 a 0.02 –2004 a 0.00 2.18 0.00 0.00 0.00 a 0.00 –2005 a 2.15 0.63 0.00 0.00 0.11 0.00 0.04 –2008 a 0.76 0.53 0.02 0.00 0.09 0.00 0.06 –2011 a 0.59 a a 0.03 0.04 0.73 0.00 –2014 a a a a a 0.00 0.63 0.12 –
Summer,1990 – – – a a a 0.00 a a1992 a 0.00 2.93 a a – – – –1993 a a a a a a 0.00 0.00 a1994 0.00 1.84 1.61 0.00 0.00 0.07 0.00 0.05 a1995 a 3.06 7.84 0.00 a 0.00 0.00 0.05 –1996 a a 0.00 0.00 a 0.00 0.00 0.00 –1999 a 0.83 0.00 0.00 – 0.09 0.00 0.00 –2004 a 0.00 2.23 a a – 0.00 0.00 –2005 a 1.72 5.33 0.05 0.00 0.20 1.04 0.05 –2008 a 11.73 10.23 0.04 0.00 0.19 1.86 0.07 –2011 a 3.95 0.83 0.06 – 0.17 1.18 0.00 –2014 a – a – – – – – –
Below Bonneville Dam Bonneville Reservoir
169
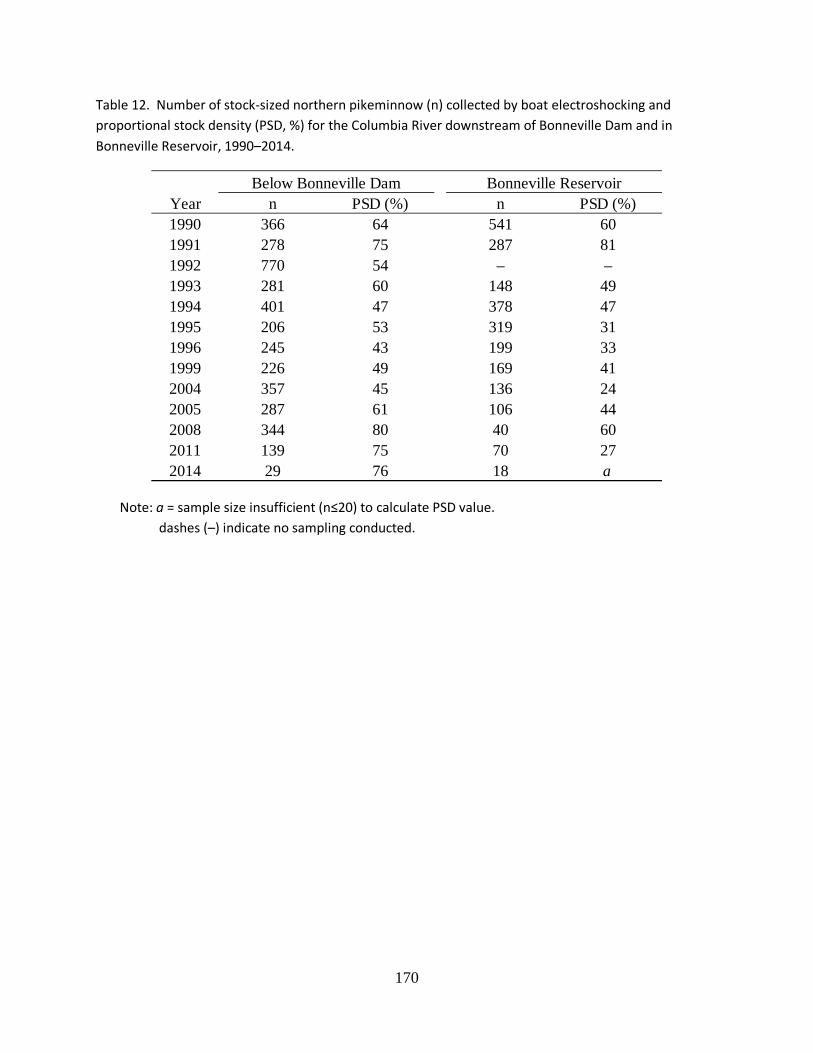
Table 12. Number of stock-sized northern pikeminnow (n) collected by boat electroshocking and proportional stock density (PSD, %) for the Columbia River downstream of Bonneville Dam and in Bonneville Reservoir, 1990–2014.
Note: a = sample size insufficient (n≤20) to calculate PSD value. dashes (–) indicate no sampling conducted.
Year n PSD (%) n PSD (%)1990 366 64 541 601991 278 75 287 811992 770 54 – –1993 281 60 148 491994 401 47 378 471995 206 53 319 311996 245 43 199 331999 226 49 169 412004 357 45 136 242005 287 61 106 442008 344 80 40 602011 139 75 70 272014 29 76 18 a
Below Bonneville Dam Bonneville Reservoir
170
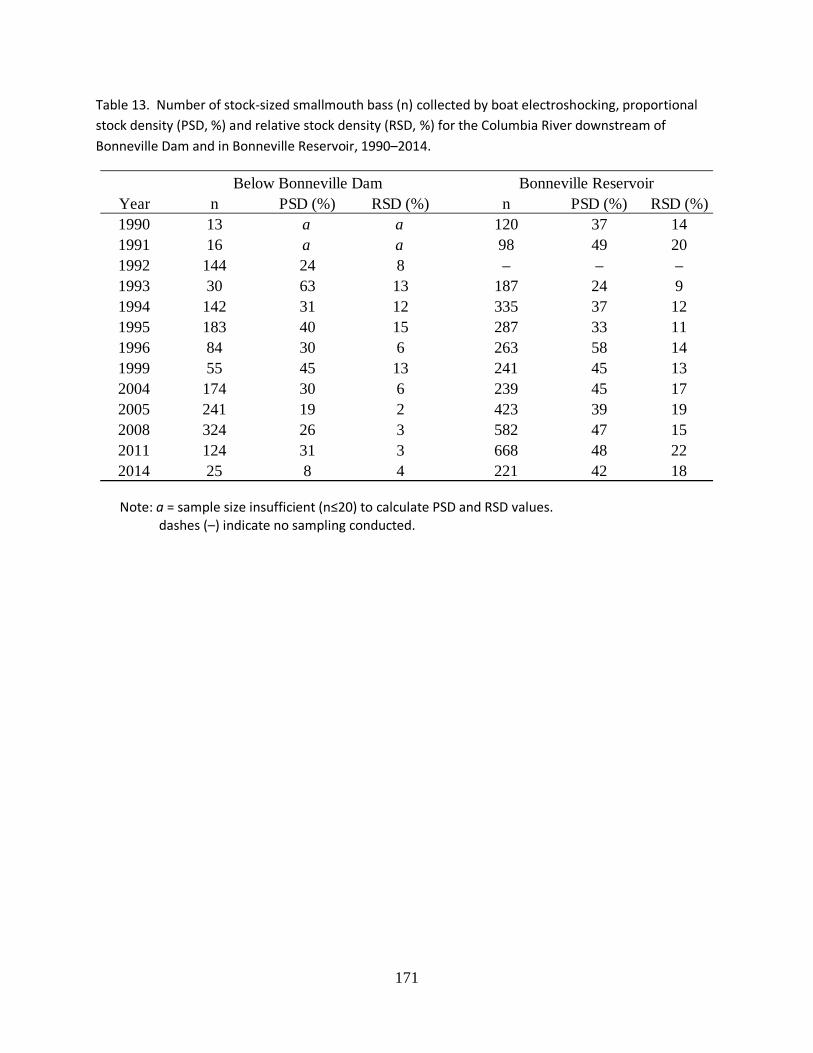
Table 13. Number of stock-sized smallmouth bass (n) collected by boat electroshocking, proportional stock density (PSD, %) and relative stock density (RSD, %) for the Columbia River downstream of Bonneville Dam and in Bonneville Reservoir, 1990–2014.
Note: a = sample size insufficient (n≤20) to calculate PSD and RSD values. dashes (–) indicate no sampling conducted.
Year n PSD (%) RSD (%) n PSD (%) RSD (%)1990 13 a a 120 37 141991 16 a a 98 49 201992 144 24 8 – – –1993 30 63 13 187 24 91994 142 31 12 335 37 121995 183 40 15 287 33 111996 84 30 6 263 58 141999 55 45 13 241 45 132004 174 30 6 239 45 172005 241 19 2 423 39 192008 324 26 3 582 47 152011 124 31 3 668 48 222014 25 8 4 221 42 18
Below Bonneville Dam Bonneville Reservoir
171
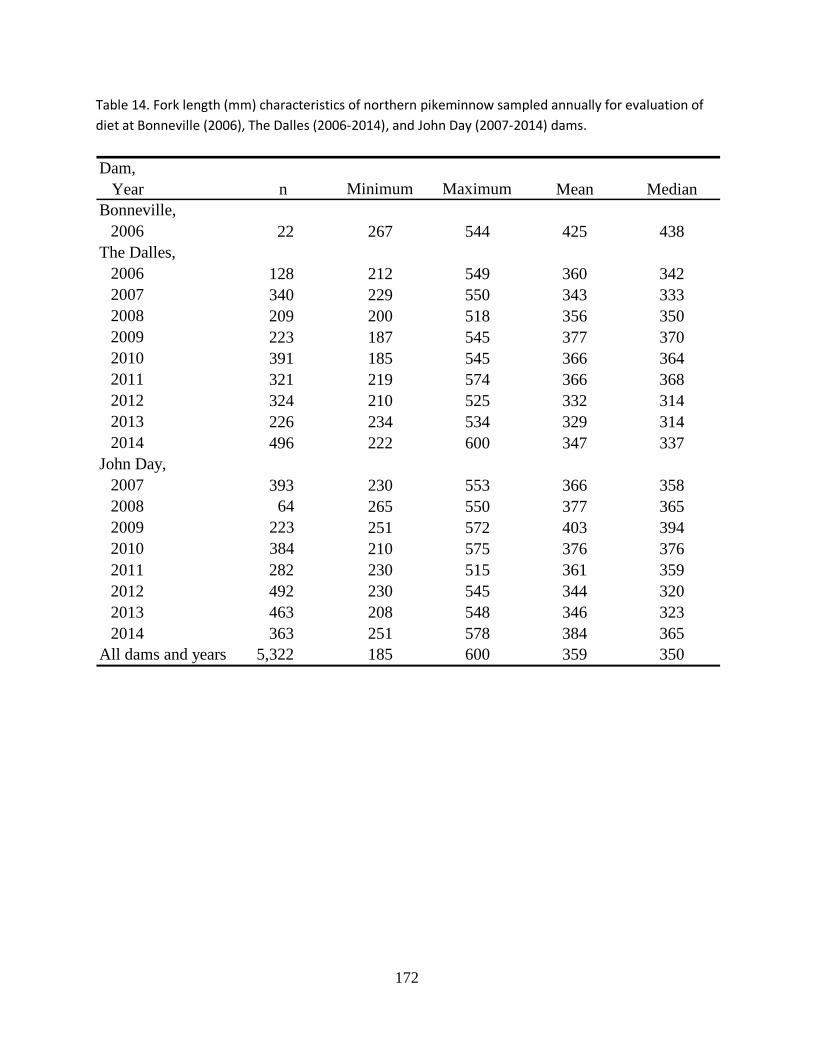
Table 14. Fork length (mm) characteristics of northern pikeminnow sampled annually for evaluation of diet at Bonneville (2006), The Dalles (2006-2014), and John Day (2007-2014) dams.
Dam, Year n Minimum Maximum Mean MedianBonneville,
2006 22 267 544 425 438The Dalles,
2006 128 212 549 360 3422007 340 229 550 343 3332008 209 200 518 356 3502009 223 187 545 377 3702010 391 185 545 366 3642011 321 219 574 366 3682012 324 210 525 332 3142013 226 234 534 329 3142014 496 222 600 347 337
John Day,2007 393 230 553 366 3582008 64 265 550 377 3652009 223 251 572 403 3942010 384 210 575 376 3762011 282 230 515 361 3592012 492 230 545 344 3202013 463 208 548 346 3232014 363 251 578 384 365
All dams and years 5,322 185 600 359 350
172
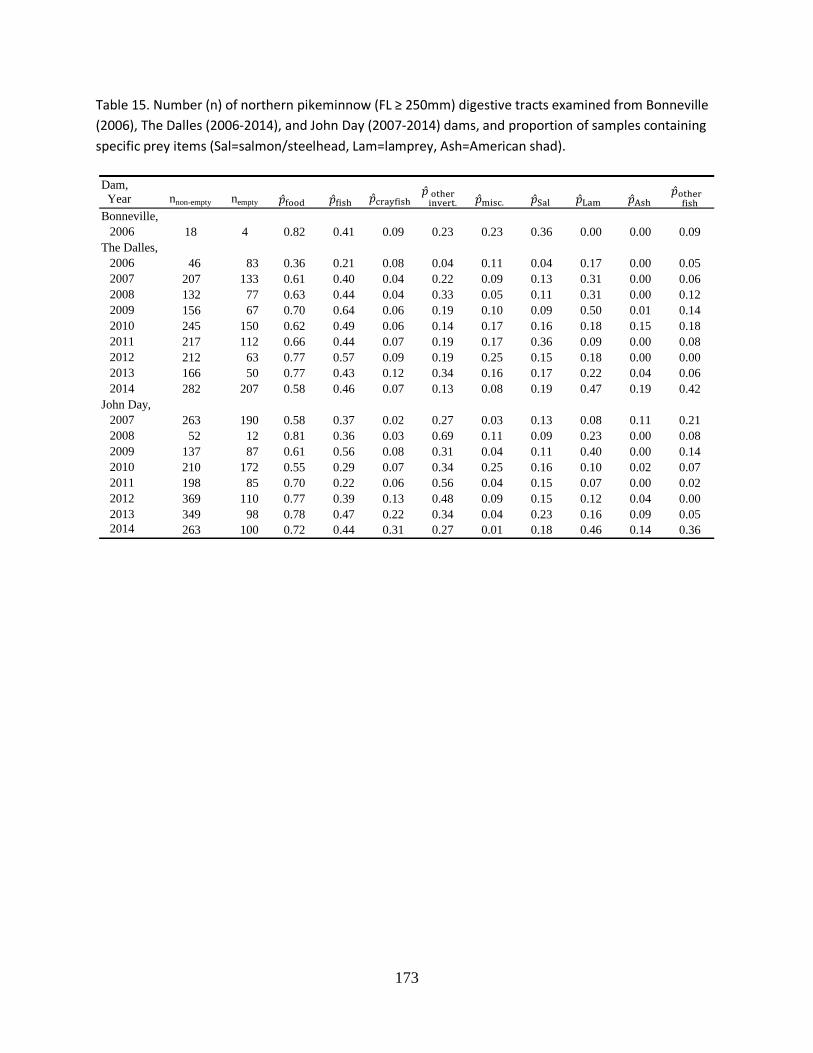
Table 15. Number (n) of northern pikeminnow (FL ≥ 250mm) digestive tracts examined from Bonneville (2006), The Dalles (2006-2014), and John Day (2007-2014) dams, and proportion of samples containing specific prey items (Sal=salmon/steelhead, Lam=lamprey, Ash=American shad).
Dam, Year nnon-empty nempty
2006 18 4 0.82 0.41 0.09 0.23 0.23 0.36 0.00 0.00 0.09
2006 46 83 0.36 0.21 0.08 0.04 0.11 0.04 0.17 0.00 0.052007 207 133 0.61 0.40 0.04 0.22 0.09 0.13 0.31 0.00 0.062008 132 77 0.63 0.44 0.04 0.33 0.05 0.11 0.31 0.00 0.122009 156 67 0.70 0.64 0.06 0.19 0.10 0.09 0.50 0.01 0.142010 245 150 0.62 0.49 0.06 0.14 0.17 0.16 0.18 0.15 0.182011 217 112 0.66 0.44 0.07 0.19 0.17 0.36 0.09 0.00 0.082012 212 63 0.77 0.57 0.09 0.19 0.25 0.15 0.18 0.00 0.002013 166 50 0.77 0.43 0.12 0.34 0.16 0.17 0.22 0.04 0.062014 282 207 0.58 0.46 0.07 0.13 0.08 0.19 0.47 0.19 0.42
2007 263 190 0.58 0.37 0.02 0.27 0.03 0.13 0.08 0.11 0.212008 52 12 0.81 0.36 0.03 0.69 0.11 0.09 0.23 0.00 0.082009 137 87 0.61 0.56 0.08 0.31 0.04 0.11 0.40 0.00 0.142010 210 172 0.55 0.29 0.07 0.34 0.25 0.16 0.10 0.02 0.072011 198 85 0.70 0.22 0.06 0.56 0.04 0.15 0.07 0.00 0.022012 369 110 0.77 0.39 0.13 0.48 0.09 0.15 0.12 0.04 0.002013 349 98 0.78 0.47 0.22 0.34 0.04 0.23 0.16 0.09 0.052014 263 100 0.72 0.44 0.31 0.27 0.01 0.18 0.46 0.14 0.36
John Day,
Bonneville,
The Dalles,
173
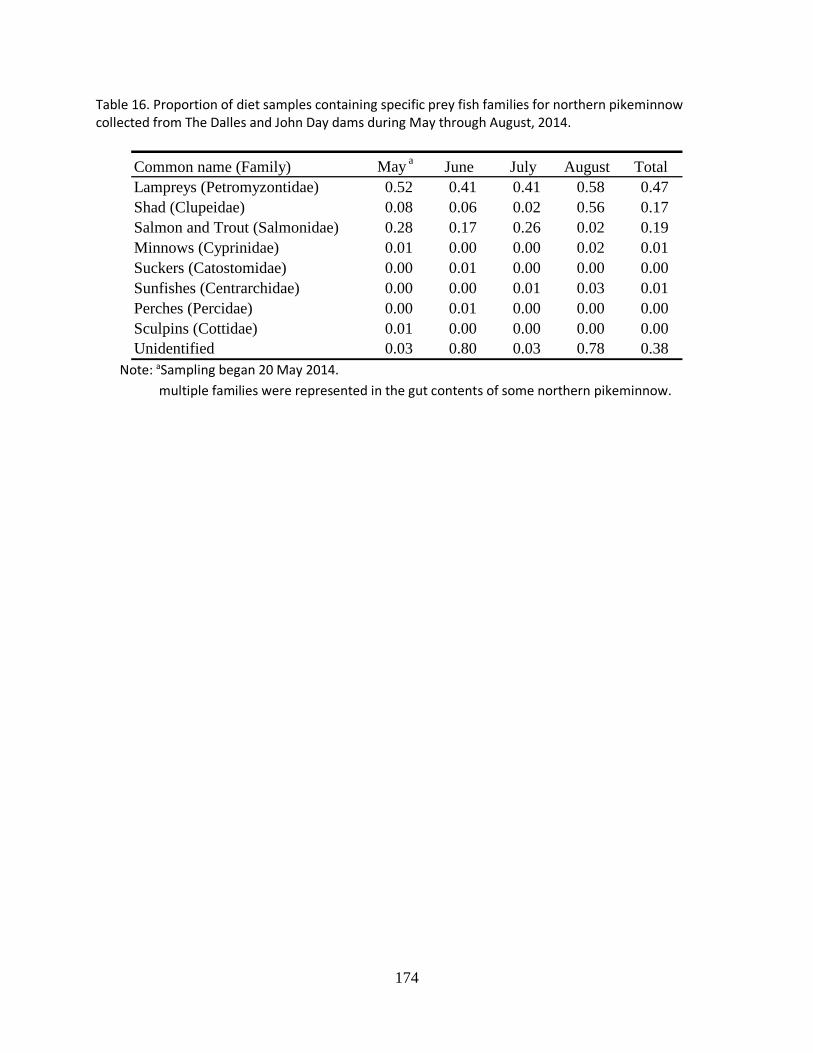
Table 16. Proportion of diet samples containing specific prey fish families for northern pikeminnow collected from The Dalles and John Day dams during May through August, 2014.
Note: aSampling began 20 May 2014.
multiple families were represented in the gut contents of some northern pikeminnow.
Common name (Family) May a June July August TotalLampreys (Petromyzontidae) 0.52 0.41 0.41 0.58 0.47Shad (Clupeidae) 0.08 0.06 0.02 0.56 0.17Salmon and Trout (Salmonidae) 0.28 0.17 0.26 0.02 0.19Minnows (Cyprinidae) 0.01 0.00 0.00 0.02 0.01Suckers (Catostomidae) 0.00 0.01 0.00 0.00 0.00Sunfishes (Centrarchidae) 0.00 0.00 0.01 0.03 0.01Perches (Percidae) 0.00 0.01 0.00 0.00 0.00Sculpins (Cottidae) 0.01 0.00 0.00 0.00 0.00Unidentified 0.03 0.80 0.03 0.78 0.38
174
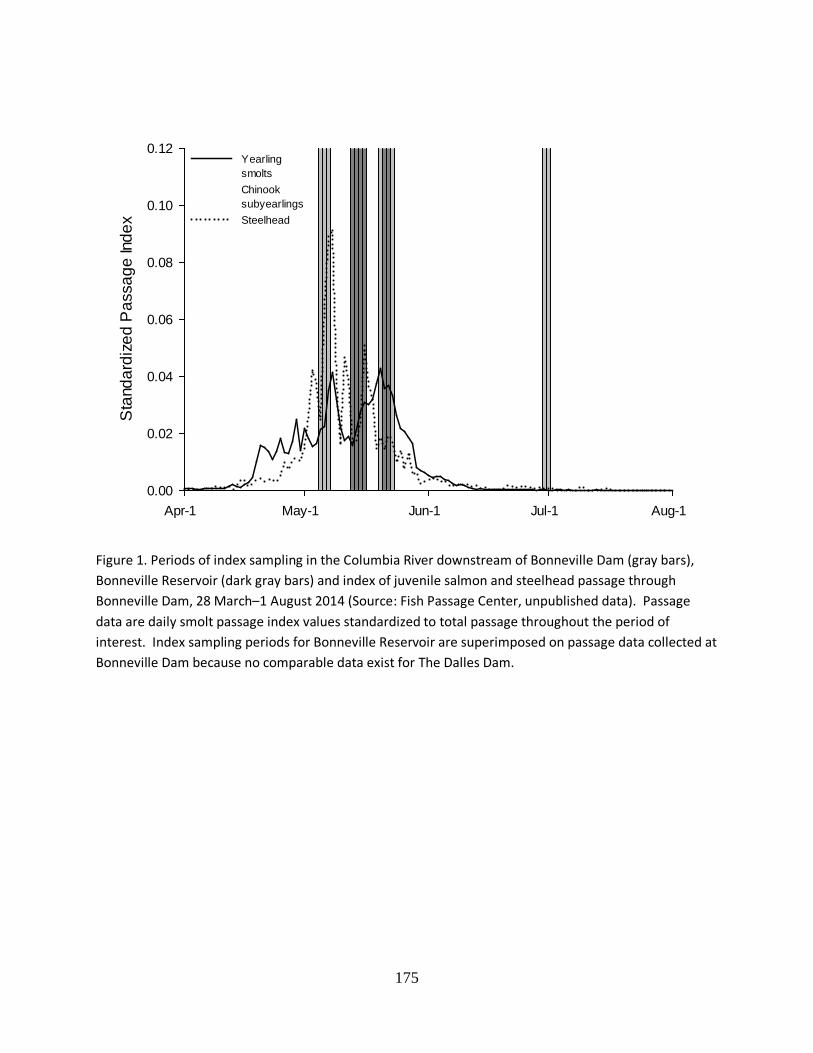
Apr-1 May-1 Jun-1 Jul-1 Aug-1
Sta
ndar
dize
d P
assa
ge In
dex
0.00
0.02
0.04
0.06
0.08
0.10
0.12YearlingsmoltsChinooksubyearlingsSteelhead
Figure 1. Periods of index sampling in the Columbia River downstream of Bonneville Dam (gray bars), Bonneville Reservoir (dark gray bars) and index of juvenile salmon and steelhead passage through Bonneville Dam, 28 March–1 August 2014 (Source: Fish Passage Center, unpublished data). Passage data are daily smolt passage index values standardized to total passage throughout the period of interest. Index sampling periods for Bonneville Reservoir are superimposed on passage data collected at Bonneville Dam because no comparable data exist for The Dalles Dam.
175
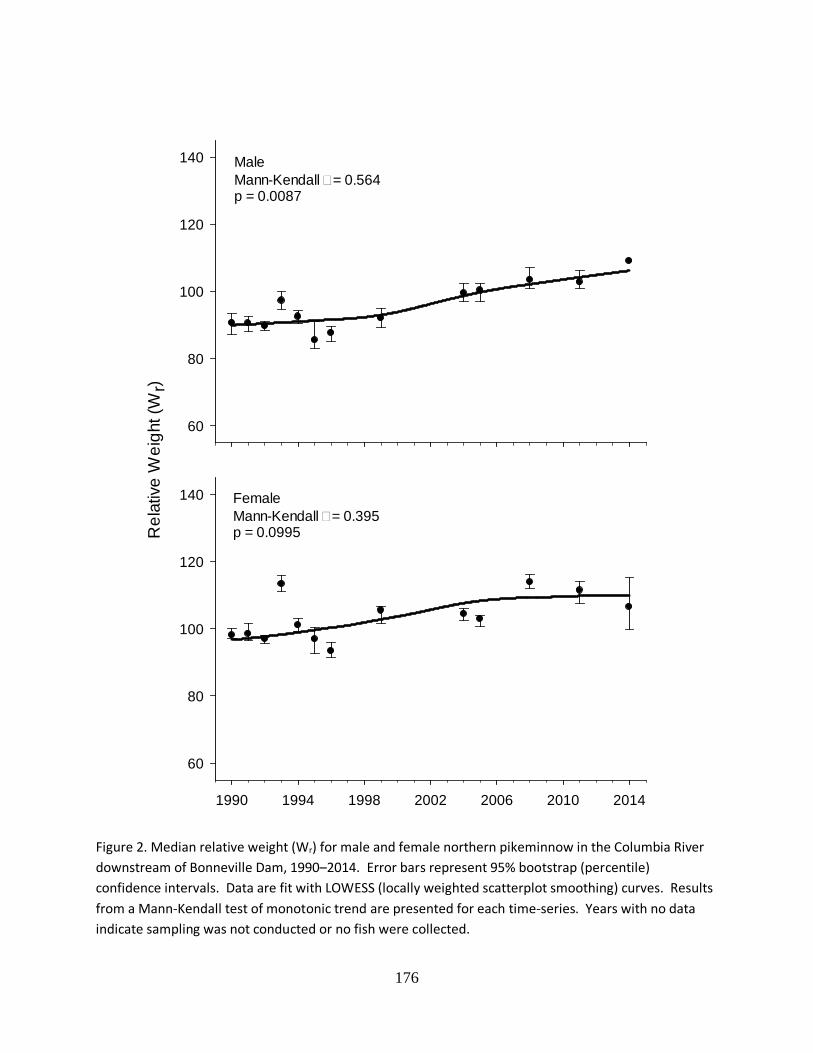
1990 1994 1998 2002 2006 2010 2014
Rel
ativ
e W
eigh
t (W
r)
60
80
100
120
140
60
80
100
120
140 MaleMann-Kendall = 0.564p = 0.0087
FemaleMann-Kendall = 0.395p = 0.0995
Figure 2. Median relative weight (Wr) for male and female northern pikeminnow in the Columbia River downstream of Bonneville Dam, 1990–2014. Error bars represent 95% bootstrap (percentile) confidence intervals. Data are fit with LOWESS (locally weighted scatterplot smoothing) curves. Results from a Mann-Kendall test of monotonic trend are presented for each time-series. Years with no data indicate sampling was not conducted or no fish were collected.
176
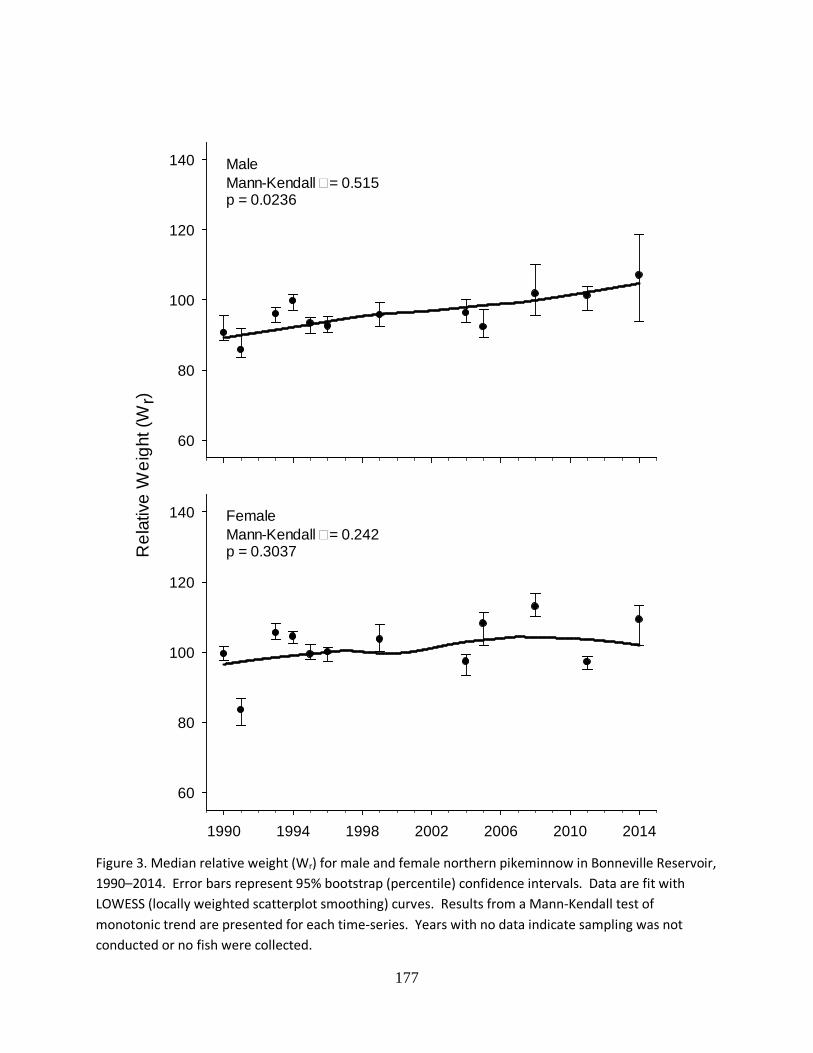
60
80
100
120
140
1990 1994 1998 2002 2006 2010 2014
Rel
ativ
e W
eigh
t (W
r)
60
80
100
120
140
MaleMann-Kendall = 0.515p = 0.0236
FemaleMann-Kendall = 0.242p = 0.3037
Figure 3. Median relative weight (Wr) for male and female northern pikeminnow in Bonneville Reservoir, 1990–2014. Error bars represent 95% bootstrap (percentile) confidence intervals. Data are fit with LOWESS (locally weighted scatterplot smoothing) curves. Results from a Mann-Kendall test of monotonic trend are presented for each time-series. Years with no data indicate sampling was not conducted or no fish were collected.
177
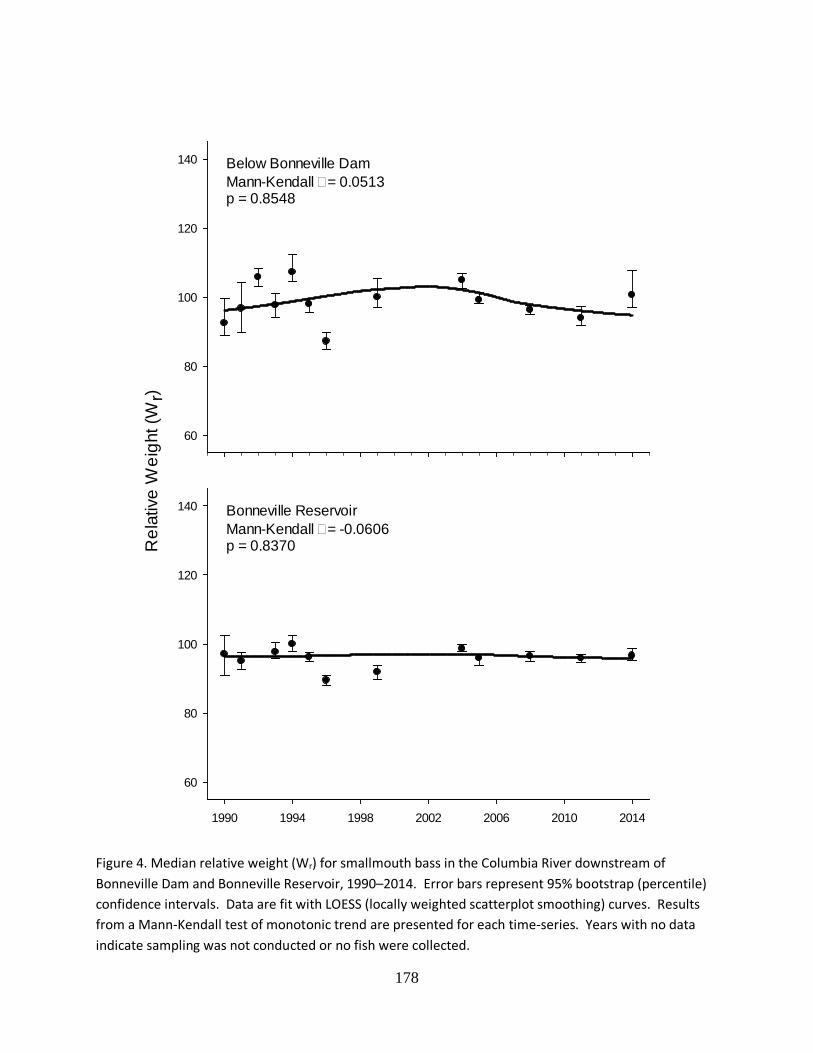
60
80
100
120
140
1990 1994 1998 2002 2006 2010 2014
Rel
ativ
e W
eigh
t (W
r)
60
80
100
120
140
Below Bonneville DamMann-Kendall = 0.0513p = 0.8548
Bonneville ReservoirMann-Kendall = -0.0606p = 0.8370
Figure 4. Median relative weight (Wr) for smallmouth bass in the Columbia River downstream of Bonneville Dam and Bonneville Reservoir, 1990–2014. Error bars represent 95% bootstrap (percentile) confidence intervals. Data are fit with LOESS (locally weighted scatterplot smoothing) curves. Results from a Mann-Kendall test of monotonic trend are presented for each time-series. Years with no data indicate sampling was not conducted or no fish were collected.
178
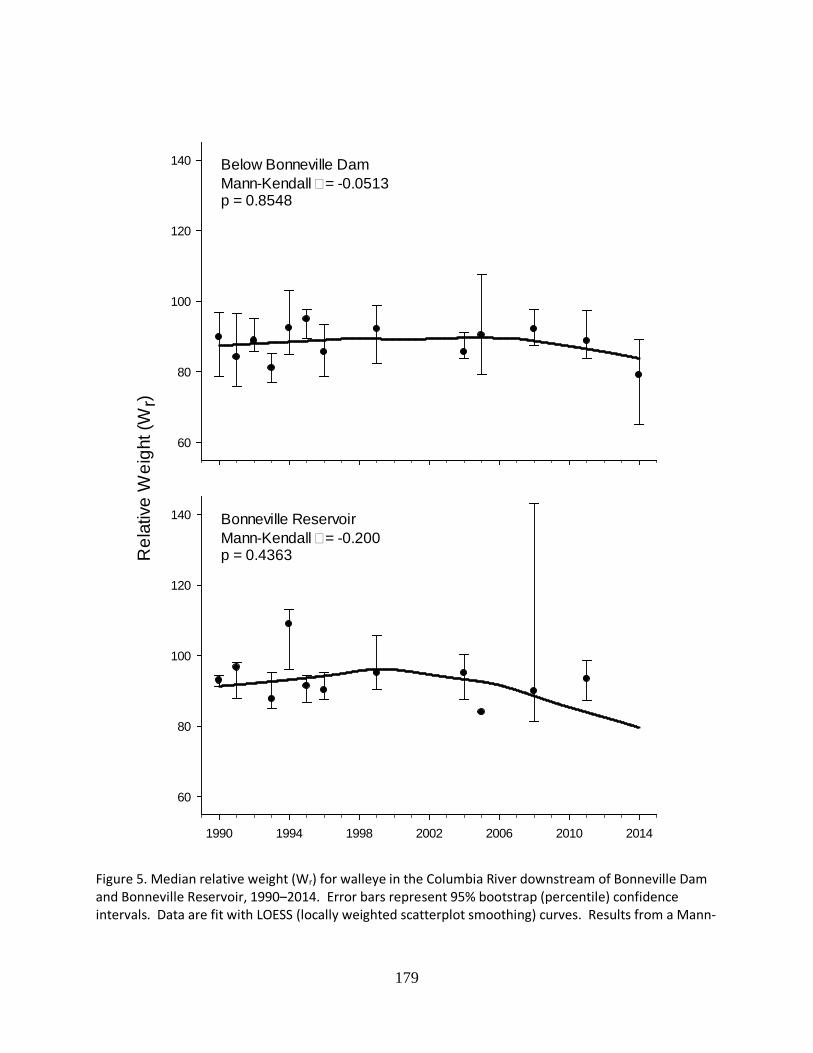
60
80
100
120
140
1990 1994 1998 2002 2006 2010 2014
Rel
ativ
e W
eigh
t (W
r)
60
80
100
120
140
Below Bonneville DamMann-Kendall = -0.0513p = 0.8548
Bonneville ReservoirMann-Kendall = -0.200p = 0.4363
Figure 5. Median relative weight (Wr) for walleye in the Columbia River downstream of Bonneville Dam and Bonneville Reservoir, 1990–2014. Error bars represent 95% bootstrap (percentile) confidence intervals. Data are fit with LOESS (locally weighted scatterplot smoothing) curves. Results from a Mann-
179

Kendall test of monotonic trend are presented for each time-series. Years with no data indicate sampling was not conducted or no fish were collected.
180
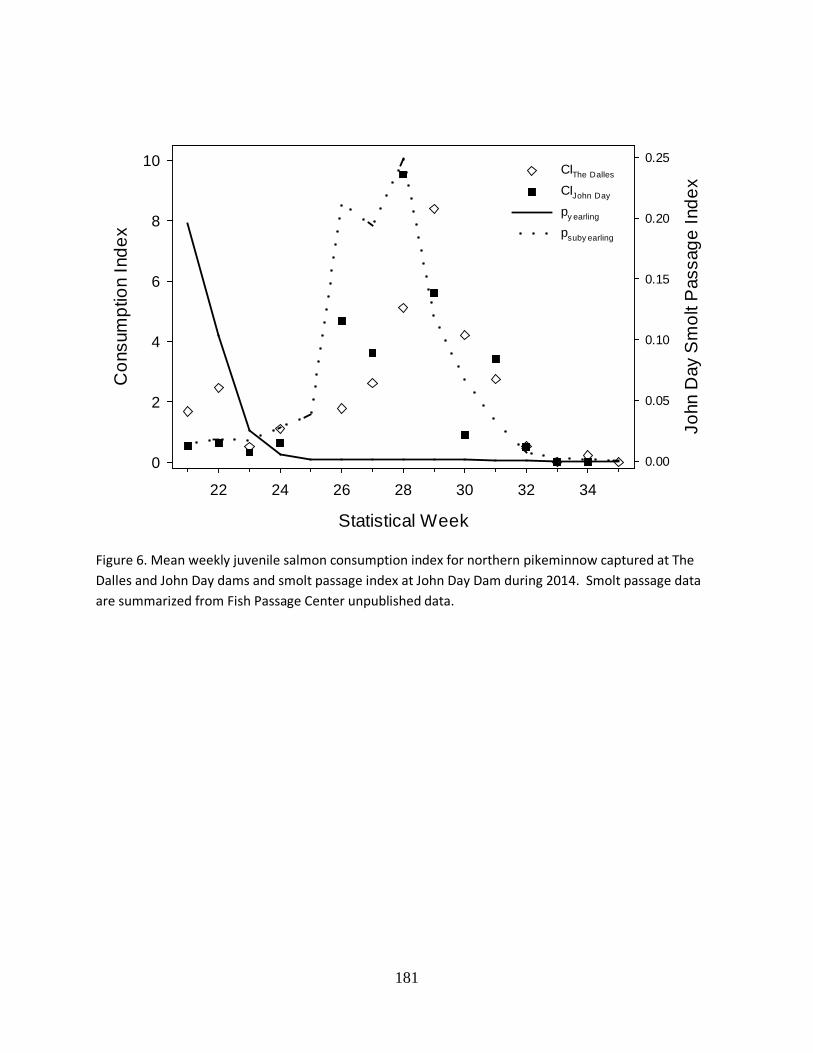
Statistical Week
22 24 26 28 30 32 34
Con
sum
ptio
n In
dex
0
2
4
6
8
10
John
Day
Sm
olt P
assa
ge In
dex
0.00
0.05
0.10
0.15
0.20
0.25CIThe Dalles CIJohn Day py earling psuby earling
Figure 6. Mean weekly juvenile salmon consumption index for northern pikeminnow captured at The Dalles and John Day dams and smolt passage index at John Day Dam during 2014. Smolt passage data are summarized from Fish Passage Center unpublished data.
181
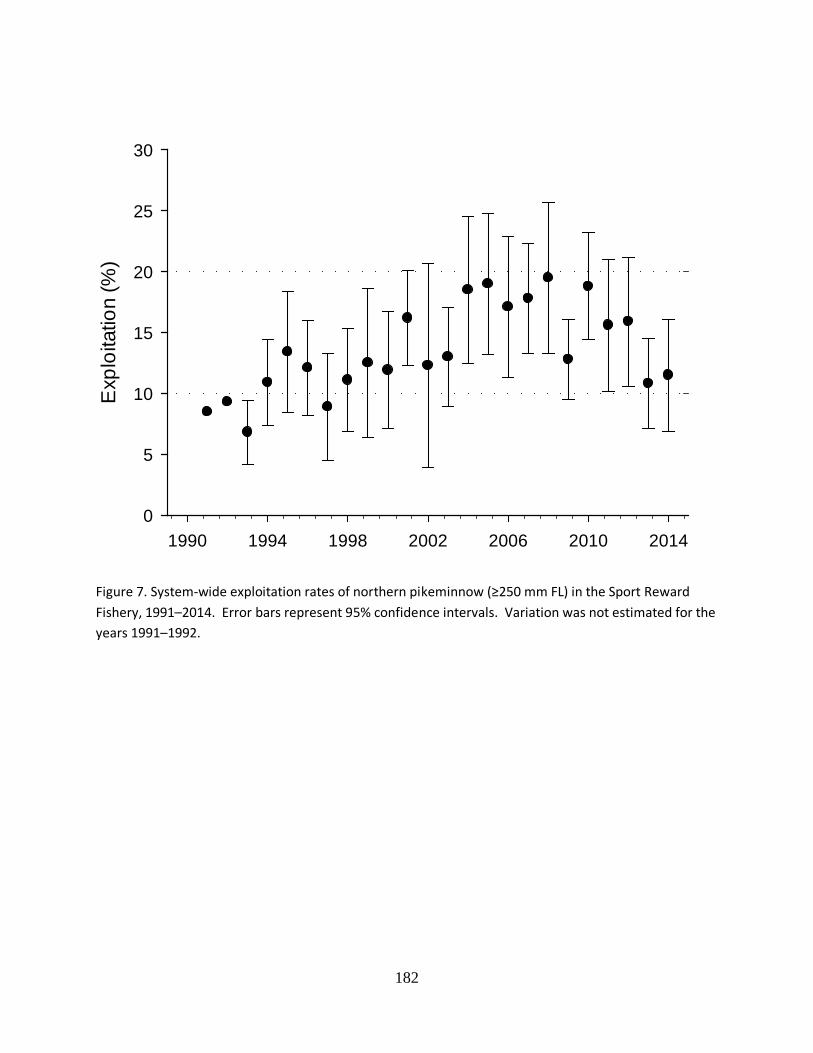
1990 1994 1998 2002 2006 2010 2014
Exp
loita
tion
(%)
0
5
10
15
20
25
30
Figure 7. System-wide exploitation rates of northern pikeminnow (≥250 mm FL) in the Sport Reward Fishery, 1991–2014. Error bars represent 95% confidence intervals. Variation was not estimated for the years 1991–1992.
182
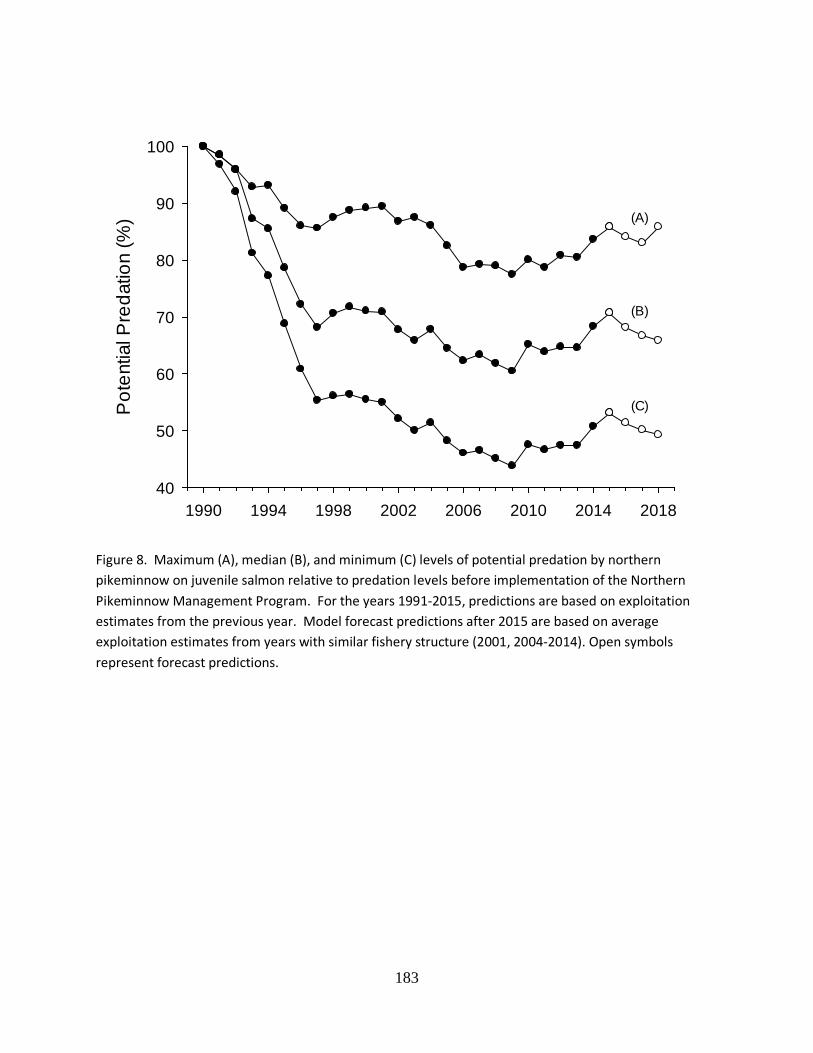
1990 1994 1998 2002 2006 2010 2014 2018
Pot
entia
l Pre
datio
n (%
)
40
50
60
70
80
90
100
(A)
(B)
(C)
Figure 8. Maximum (A), median (B), and minimum (C) levels of potential predation by northern pikeminnow on juvenile salmon relative to predation levels before implementation of the Northern Pikeminnow Management Program. For the years 1991-2015, predictions are based on exploitation estimates from the previous year. Model forecast predictions after 2015 are based on average exploitation estimates from years with similar fishery structure (2001, 2004-2014). Open symbols represent forecast predictions.
183
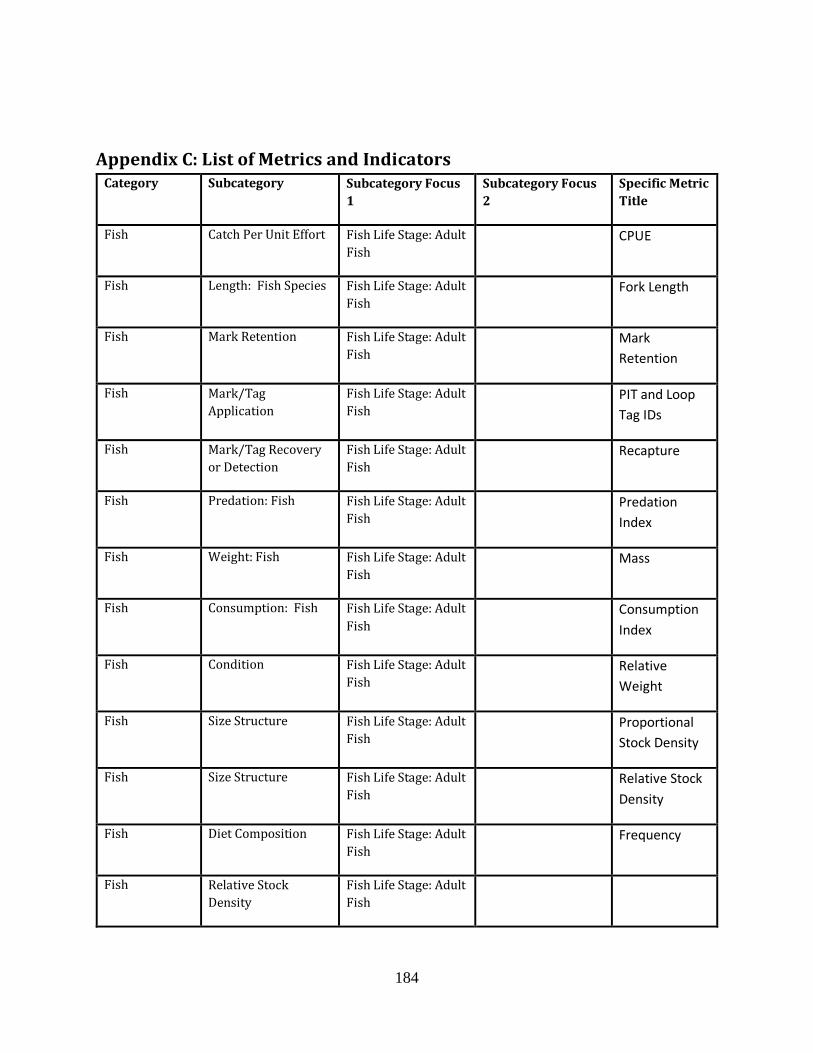
Appendix C: List of Metrics and Indicators Category Subcategory Subcategory Focus
1 Subcategory Focus 2
Specific Metric Title
Fish Catch Per Unit Effort Fish Life Stage: Adult Fish
CPUE
Fish Length: Fish Species Fish Life Stage: Adult Fish
Fork Length
Fish Mark Retention Fish Life Stage: Adult Fish
Mark Retention
Fish Mark/Tag Application
Fish Life Stage: Adult Fish
PIT and Loop Tag IDs
Fish Mark/Tag Recovery or Detection
Fish Life Stage: Adult Fish
Recapture
Fish Predation: Fish Fish Life Stage: Adult Fish
Predation Index
Fish Weight: Fish Fish Life Stage: Adult Fish
Mass
Fish Consumption: Fish Fish Life Stage: Adult Fish
Consumption Index
Fish Condition Fish Life Stage: Adult Fish
Relative Weight
Fish Size Structure Fish Life Stage: Adult Fish
Proportional Stock Density
Fish Size Structure Fish Life Stage: Adult Fish
Relative Stock Density
Fish Diet Composition Fish Life Stage: Adult Fish
Frequency
Fish Relative Stock Density
Fish Life Stage: Adult Fish
184