Embed Size (px)
Citation preview

Private Equity in Global Growth Markets: A New Perspective
Josh Lerner, Andrew Speen, Chris Allen, and Ann Leamon
Harvard Business School and Bella Research Group
The Project Definition
• A series of working papers on differing aspects of investing in global growth markets:– In 2014, represented 13% of total PE fundraising (~$350 billion).
– Evidence-based approach.
• Prepare short, readable white papers.
• The process:– Review of secondary literature.
– Building of proprietary databases on exits and small and mid-cap enterprises (SMCs).
– Analysis of available information.
• Sponsorship by Abraaj Group.
Proprietary & Confidential1

Cross-Cutting Themes• Comparison of GGMs to Developed Markets
– Faster Growth• Real GDP growth trends similar to U.S. from 1933-1958 and Japan from
1955-1980.• Rising middle class may add up to $22 trillion to GGM economies.• Non-BRIC GGMs have higher aggregate profits than U.S. since 2007.
– Public Markets Are Not Representative• Consumer, Industrial and Healthcare sectors covered best by
private equity.
– Manager Selection is Critical• Expertise is essential to reduce GGM investment risks.
– Exit Markets Are Similar• More IPOs for GGMs.
– Minority Positions Are More Prevalent in GGMs• Preliminary research indicates equivalent returns compared to
majority positions.
Proprietary & Confidential2

Faster Growth: GGM Development TrajectoriesMany GGM Economies Have Developed as Rapidly as the U.S. and Japan.
Source: Bella Research Group Analysis Based on data from International Monetary Fund, World Economic Outlook.Base Year Follows Country Name.
• Others Appear Poised to Replicate those Trends after “Lost Decade”.
Proprietary & Confidential3

Faster Growth: GGM Development Trajectories (2)Growth in Other Selected GGMs Has Been Below Historical U.S. Trend, But Started to Accelerate Recently.
Source: Bella Research Group Analysis Based on Data from International Monetary Fund, World Economic Outlook.
Proprietary & Confidential4
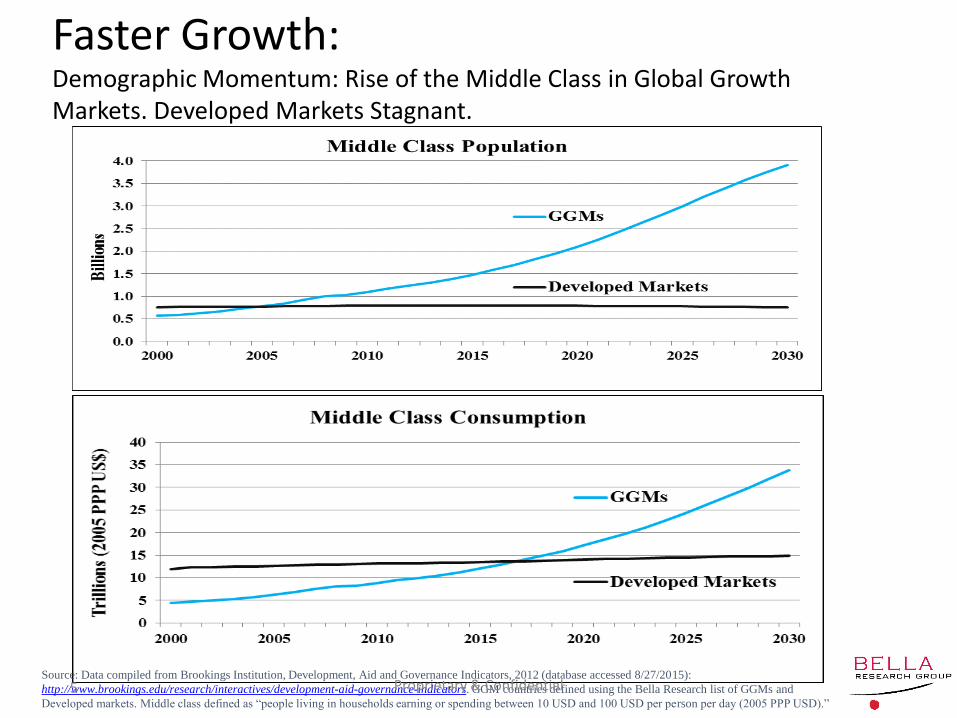
Faster Growth:Demographic Momentum: Rise of the Middle Class in Global Growth Markets. Developed Markets Stagnant.
Source: Data compiled from Brookings Institution, Development, Aid and Governance Indicators, 2012 (database accessed 8/27/2015):
http://www.brookings.edu/research/interactives/development-aid-governance-indicators. GGM countries defined using the Bella Research list of GGMs and
Developed markets. Middle class defined as “people living in households earning or spending between 10 USD and 100 USD per person per day (2005 PPP USD).”
Proprietary & Confidential5
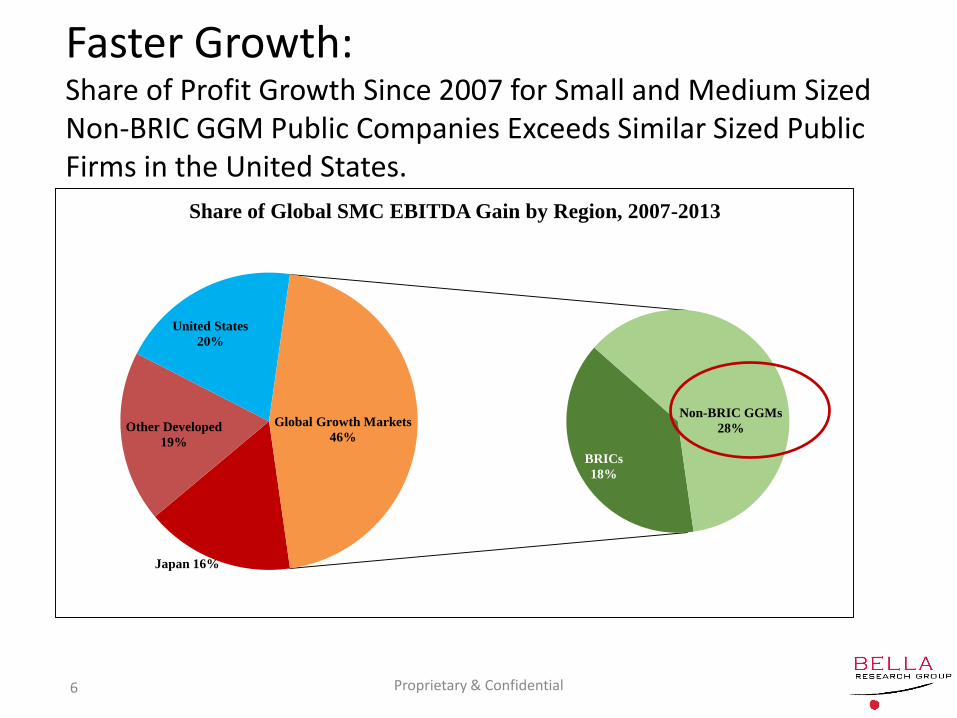
Faster Growth:Share of Profit Growth Since 2007 for Small and Medium Sized Non-BRIC GGM Public Companies Exceeds Similar Sized Public Firms in the United States.
Japan 16%
Other Developed
19%
United States
20%
BRICs
18%
Non-BRIC GGMs
28%Global Growth Markets
46%
Share of Global SMC EBITDA Gain by Region, 2007-2013
Proprietary & Confidential6
0% 10% 20% 30% 40% 50% 60% 70% 80% 90%
China
United States
Japan
India
United Kingdom
Canada
Hong Kong
Germany
South Africa
Chile
Poland
Brazil
Australia
Mexico
Peru
Russia
Colombia
Argentina
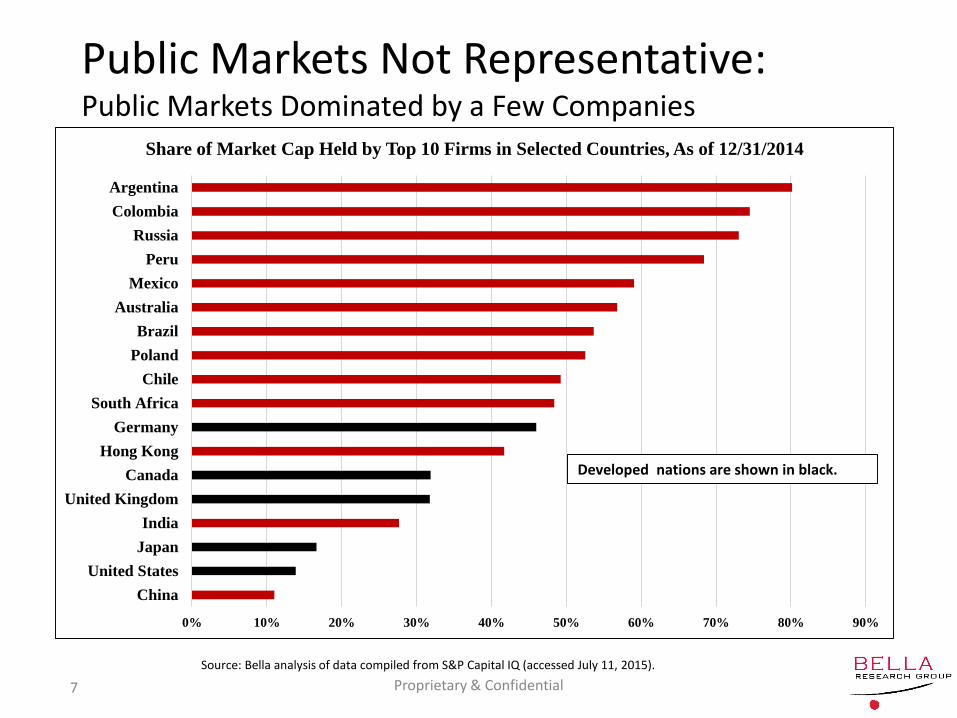
Share of Market Cap Held by Top 10 Firms in Selected Countries, As of 12/31/2014
Developed nations are shown in black.
Public Markets Not Representative:Public Markets Dominated by a Few Companies
Source: Bella analysis of data compiled from S&P Capital IQ (accessed July 11, 2015).
Proprietary & Confidential7
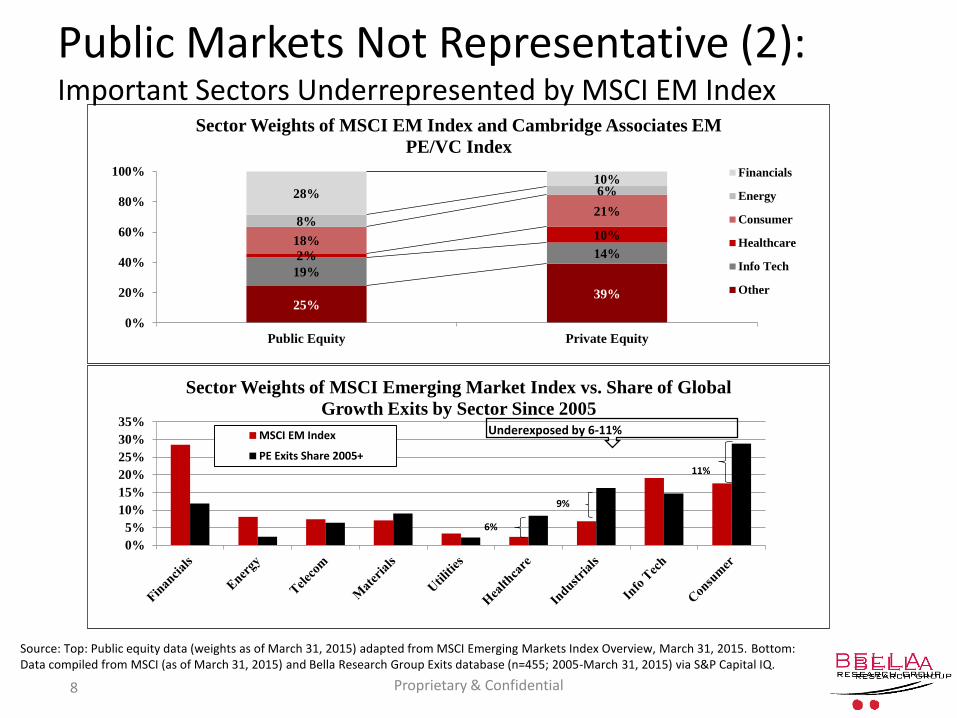
Public Markets Not Representative (2):Important Sectors Underrepresented by MSCI EM Index
Proprietary & Confidential8
25%39%
19%
14%2%
10%18%
21%8%
6%28%10%
0%
20%
40%
60%
80%
100%
Public Equity Private Equity
Sector Weights of MSCI EM Index and Cambridge Associates EM
PE/VC Index
Financials
Energy
Consumer
Healthcare
Info Tech
Other
0%
5%
10%
15%
20%
25%
30%
35%
Sector Weights of MSCI Emerging Market Index vs. Share of Global
Growth Exits by Sector Since 2005
MSCI EM Index
PE Exits Share 2005+11%
9%
6%
Underexposed by 6-11%
Source: Top: Public equity data (weights as of March 31, 2015) adapted from MSCI Emerging Markets Index Overview, March 31, 2015. Bottom: Data compiled from MSCI (as of March 31, 2015) and Bella Research Group Exits database (n=455; 2005-March 31, 2015) via S&P Capital IQ.
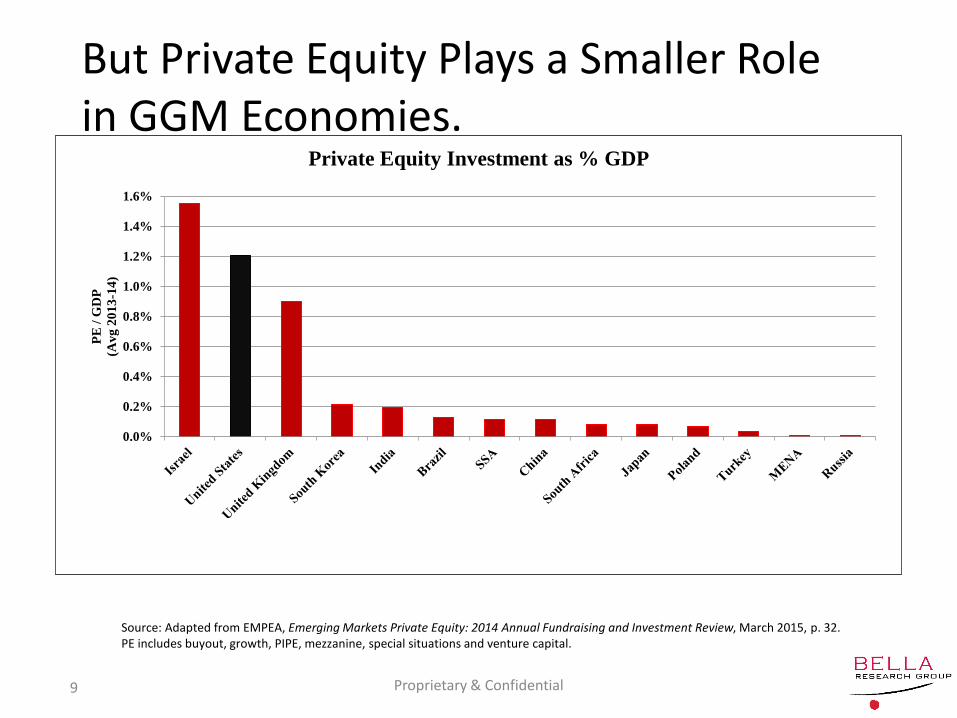
But Private Equity Plays a Smaller Role in GGM Economies.
0.0%
0.2%
0.4%
0.6%
0.8%
1.0%
1.2%
1.4%
1.6%
PE
/ G
DP
(Av
g 2
01
3-1
4)
Private Equity Investment as % GDP
Source: Adapted from EMPEA, Emerging Markets Private Equity: 2014 Annual Fundraising and Investment Review, March 2015, p. 32. PE includes buyout, growth, PIPE, mezzanine, special situations and venture capital.
Proprietary & Confidential9
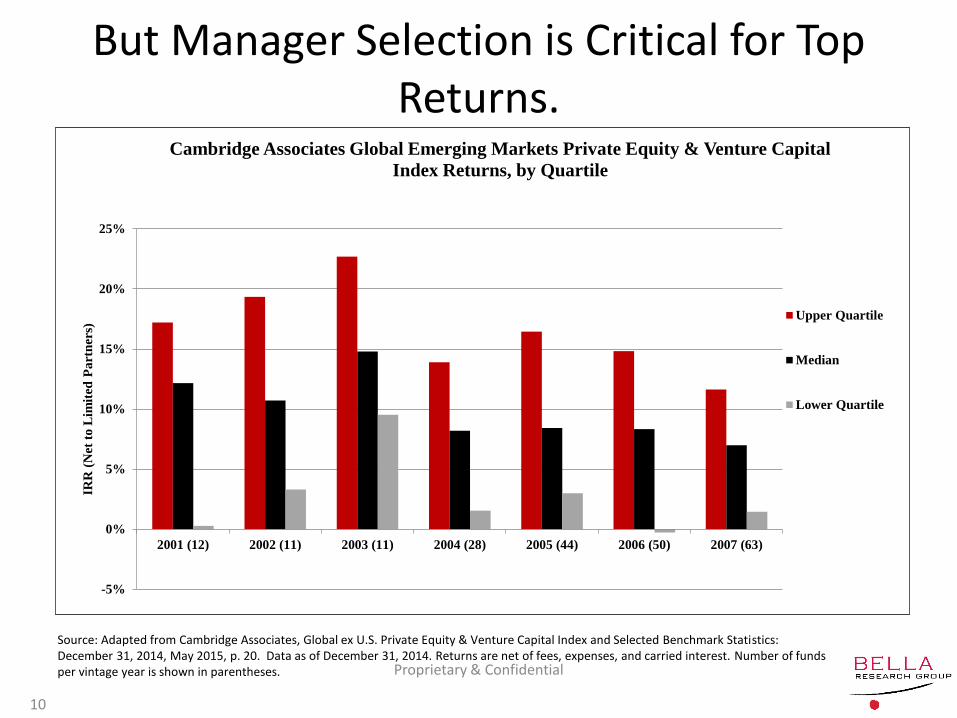
But Manager Selection is Critical for Top Returns.
Proprietary & Confidential
10
-5%
0%
5%
10%
15%
20%
25%
2001 (12) 2002 (11) 2003 (11) 2004 (28) 2005 (44) 2006 (50) 2007 (63)
IRR
(N
et t
o L
imit
ed P
art
ner
s)
Cambridge Associates Global Emerging Markets Private Equity & Venture Capital
Index Returns, by Quartile
Upper Quartile
Median
Lower Quartile
Source: Adapted from Cambridge Associates, Global ex U.S. Private Equity & Venture Capital Index and Selected Benchmark Statistics: December 31, 2014, May 2015, p. 20. Data as of December 31, 2014. Returns are net of fees, expenses, and carried interest. Number of funds per vintage year is shown in parentheses.

Exit Markets Are Similar:Holding Periods For Private Equity Investors are Generally the Same or Shorter.
Proprietary & Confidential11

Exit Markets Are Similar (2):Private Equity Capital Distributed at the Same Rate or Better, and Healthier Mix of Exit Types.
Proprietary & Confidential12

Minority Investments Seem to Perform Comparably/Better.
0%
10%
20%
30%
40%
50%
60%
IPO Trade Sale MBO Structured Exit
IRR
Average IRR of IFC Exits
Majority Minority
Source: IFC, “Emerging Market Equity: Private Equity, Public Equity, Risks & Opportunities” (Feb. 2012). Based on exits of 61 majority positions; 251 minority positions.
Proprietary & Confidential13

Summary• Evolution of Global Growth Markets
– Growth trajectory of most GGMs shows similarities to Japan and U.S. in earlier years.
• Public and Private Equity– PE essential to cover fast growing industry sectors.
– But manager selection is critical for top returns.
• Exit Markets– Few substantive differences from developed markets.
• Minority Positions– Returns from minority positions comparable to
majority positions.
Proprietary & Confidential14

Thank you!
Josh Lerner
Harvard Business School Bella Research GroupRock Center, Room 314 221 Essex St. Suite 21Boston MA 02163 USA ` Salem MA 01970 [email protected] [email protected]
www.people.hbs.edu/jlernerm: +1.978.390.1973@joshlerner
Proprietary & Confidential15