Embed Size (px)
Citation preview
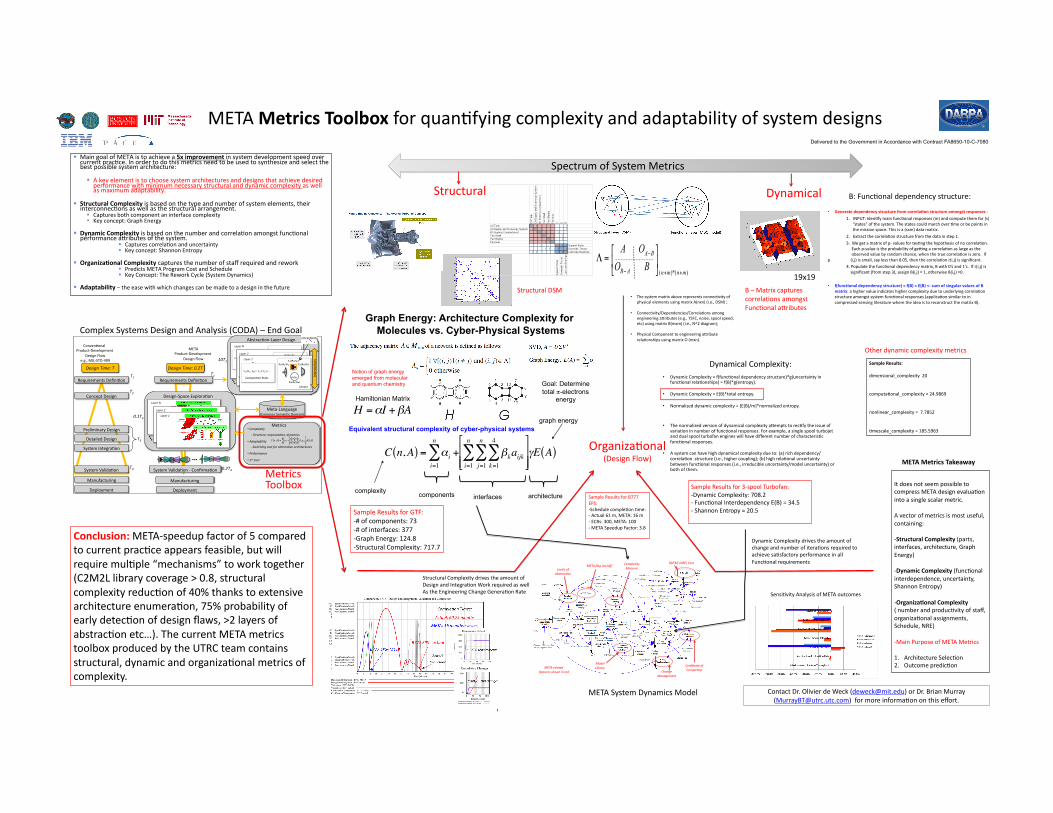
Main goal of META is to achieve a 5x improvement in system development speed over current prac9ce. In order to do this metrics need to be used to synthesize and select the best possible system architecture:
A key element is to choose system architectures and designs that achieve desired performance with minimum necessary structural and dynamic complexity as well as maximum adaptability.
Structural Complexity is based on the type and number of system elements, their interconnec9ons as well as the structural arrangement.
Captures both component an interface complexity Key concept: Graph Energy
Dynamic Complexity is based on the number and correla9on amongst func9onal performance aFributes of the system.
Captures correla9on and uncertainty Key concept: Shannon Entropy
Organiza8onal Complexity captures the number of staff required and rework Predicts META Program Cost and Schedule Key Concept: The Rework Cycle (System Dynamics)
Adaptability – the ease with which changes can be made to a design in the future
META Metrics Toolbox for quan9fying complexity and adaptability of system designs
Conclusion: META-‐speedup factor of 5 compared to current prac9ce appears feasible, but will require mul9ple “mechanisms” to work together (C2M2L library coverage > 0.8, structural complexity reduc9on of 40% thanks to extensive architecture enumera9on, 75% probability of early detec9on of design flaws, >2 layers of abstrac9on etc…). The current META metrics toolbox produced by the UTRC team contains structural, dynamic and organiza9onal metrics of complexity.
!"#$%&'()*+,&#+(-&+./0(102(301%*+.+(4!5-36(7(802(9"1%(
:&;<.=&#&0,+(-&>0.?"0(
@10<A1B,<=.0/(
-&$%"*#&0,(
3C+,=1B?"0DE1*&=(-&+./0(!"#$%&'&
!(&)3(&*&9(+&,&!"&±&!-&±&!"
./01/234/5&678$2& 9:;/%&
!3-%"%#&
!"#$%&<&
!(&)3(&*&9(+&,&!"&±&!-&±&!"
./01/234/5&678$2& 9:;/%&
!3-%"%#&
!"#$%&=&
!(&)3(&*&9(+&,&!"&±&!-&±&!"
./01/234/5&678$2& 9:;/%&
!3-%"%#&
!"
!"
:&;<.=&#&0,+(-&>0.?"0(
@10<A1B,<=.0/(
-&$%"*#&0,(
)*+,&#(F1%.21?"0(D(!"0>=#1?"0(
!"0B&$,(-&+./0(
G=&%.#.01=*(-&+./0(
-&,1.%&2(-&+./0(
)*+,&#(H0,&/=1?"0(
)*+,&#(F1%.21?"0(
>5:$%;"35;#&
?&@;%7:;7%$*&/%A"53B"4/5*&C#5"03:2&
• &9C"1;"-383;#&
• &./018$D3;#&
• &($%E/%0"5:$&
• &=2;&./2;&
@&,=.B+(
FG&
@8I3(G="2<B,D-&J&%"$#&0,(
-&+./0(K%"L(
!"0J&0?"01%(((G="2<B,D-&J&%"$#&0,(
-&+./0(K%"L(&M/MN(@HED)I-DOPP(
H$23A5&F30$I&F& H$23A5&F30$I&JK<F&
F=&
F<&
F=&
=JF<&
JK=FG&
FL& JK<FL&
?&@M3;:N35A&:/2;&E/%&"8;$%5"4O$&"%:N3;$:;7%$2&
@&,1DE10/<1/&(4!"##"0()
?B(-"#1.06(
-&+./0D)$1B&(8'$%"=1?"0(!"#$%&'&
!"#$%&<&
!"#$%&=&
!"
P5;$%":4/5
2&
Delivered to the Government in Accordance with Contract FA8650-10-C-7080
Contact Dr. Olivier de Weck ([email protected]) or Dr. Brian Murray ([email protected]) for more informa9on on this effort.
Spectrum of System Metrics
Graph Energy: Architecture Complexity for Molecules vs. Cyber-Physical Systems
!
H ="I +#AHamiltonian Matrix
Goal: Determine total !-electrons
energy
Notion of graph energy emerged from molecular and quantum chemistry
!
C n,A( ) = "i +i=1
n
# $kaijkk=1
4
#j=1
n
#i=1
n
#%
& ' '
(
) * * +E A( )
components interfaces architecture complexity
graph energy Equivalent structural complexity of cyber-physical systems
Structural
Sample Results for GTF: -‐ # of components: 73 -‐ # of interfaces: 377 -‐ Graph Energy: 124.8 -‐ Structural Complexity: 717.7
Metrics Toolbox
Organiza9onal (Design Flow)
Dynamical
Structural DSM
Sample Results for B777 EPS: -‐ Schedule comple9on 9me: -‐ Actual 61 m, META: 16 m -‐ ECRs: 300, META: 100 -‐ META Speedup Factor: 3.8
Structural Complexity drives the amount of Design and Integra9on Work required as well As the Engineering Change Genera9on Rate
!"#$%&'(%)*+,*-.%/*01234567%
!3'89:3%
!*;32%%
<5=:':7%/>'+(3%
!'+'(303+6%
<3?328%*@%
$=86:'AB*+%
/3:BCA'63%*@%
/*0123B*+%
DE#F"%)GD".%/*86%
!"#$H:32'63;%
@3'69:38%8>*I+%5+%:3;%
META System Dynamics Model
• !"#$%&%'#($()'*+,$)-./#$*#0*#%#1'%$2.11#23/+'&$.4$0"&%+2)5$#5#(#1'%$6%+17$()'*+,$891,1:$9+;#;<$=>?:$@$$
• A.11#23/+'&B=#0#1C#12+#%BA.**#5)3.1%$)(.17$#17+1##*+17$)D*+-6'#%$9#;7;<$!>EA<$1.+%#<$%0..5$%0##C<$#'2:$6%+17$()'*+,$F9(,(:$9+;#;<$GHI$C+)7*)(:@$
• J"&%+2)5$A.(0.1#1'$'.$#17+1##*+17$)D*+-6'#$*#5)3.1%"+0%$6%+17$()'*+,$K$9(,1:;$
!"#$%&'()&*+#,-.-&,-&'/#012%'1%2-"#
• !"#"$%&"'(")"#("#*+',&$-*&-$"'.$/0'*/$$"1%2/#',&$-*&-$"'%0/#3,&'$",)/#,",'4'
#34###56789"#5,-&(:/#;*<&#:%&'()&*+#2-0.)&0-0#=;>#*&,#');.%1-#1?-;#:)2#=0>########@01*1-0A#):#1?-#0/01-;4#9?-#01*1-0#')%+,#;*2'?#)B-2#(;-#)2#C-#.)<&10#<&########1?-#;<00<)�.*'-4#9?<0#<0#*#=0D;>#,*1*#;*12<D4#
#E4###FD12*'1#1?-#')22-+*()%'1%2-#:2);#1?-#,*1*#<-.#34#
#G4##H-#I-1#*#;*12<D#):#.J#B*+%-0#:)2#1-0(&I#1?-#?/.)1?-0<0#):#&)#')22-+*()&4########F*'?#.JB*+%-#<0#1?-#.2)C*C<+<1/#):#I-K&I#*#')22-+*()&#*0#+*2I-#*0#1?-#######)C0-2B-,#B*+%-#C/#2*&,);#'?*&'-L#M?-?-#12%-#')22-+*()&#<0#N-2)4##5:#
. #####=<LO>#<0#0;*++L#0*/#+-00#1?*&#P4PQL#1?-?-#')22-+*()=<LO>#<0#0<I&<R'*&14##S4#7).%+*1-#1?-#:%&'()&*+#,-.-&,-&'/#;*12<DL#!#M<1?#PT0#*&,#3T04##5:#2=<LO>#<0######0<I&<R'*&1#=:2);#01-.#G>L#*00<I&#!=<LO>#U#3L#)1?-2M<0-#!=<LO>#UP4#
• .5.-#*2/#%1'(")"#("#*+',&$-*&-$"6'7'.586'7'9586':4',-0'/.',;#3-1%$'<%1-",'/.'8'0%&$;="#*#?<I?-2#B*+%-#<&,<'*1-0#?<I?-2#');.+-D<1/#,%-#1)#%&,-2+/<&I#')22-+*()%'1%2-#*;)&I01#0/01-;#:%&'()&*+#2-0.)&0-0#=*..+<'*()�<;<+*2#1)#<&#');.2-00-,#0-&0<&I#+<1-2*1%2-#M?-2-#1?-#<,-*#<0#1)#2-')&012%'1#1?-#;*12<D#!>4#
!"#$%&'$()*+%,(-.&/"0)• !"#$%&')*+%,(-.&/")1)2324#'5+#$()6-,-#6-#'")7/84'/48-9:;34#'-8/$&#/")&#)
24#'5+#$()8-($5+#7<&,79)1)23=9:;3-#/8+,"9>)
• !"#$%&')*+%,(-.&/")1)?3=9:/+/$()-#/8+,">)
• @+8%$(&A-6)6"#$%&')'+%,(-.&/")1)B?3=9C%D:#+8%$(&A-6)-#/8+,">)
• E<-)#+8%$(&A-6)F-87&+#)+2)6"#$%&'$()'+%,(-.&/")$G-%,/7)/+)8-'52")/<-)&774-)+2)F$8&$5+#)&#)#4%H-8)+2)24#'5+#$()8-7,+#7-7>)I+8)-.$%,(-J)$)7&#;(-)7,++()/48H+K-/)$#6)64$()7,++()/48H+2$#)-#;&#-7)L&(()<$F-)6&M-8-#/)#4%H-8)+2)'<$8$'/-8&75')24#'5+#$()8-7,+#7-7>)
• N)7"7/-%)'$#)<$F-)<&;<)6"#$%&'$()'+%,(-.&/")64-)/+0)3$9)8&'<)6-,-#6-#'"C'+88-($5+#))7/84'/48-)3&>->J)<&;<-8)'+4,(&#;9O)3H9)<&;<)8-($5+#$()4#'-8/$&#/")H-/L--#)24#'5+#$()8-7,+#7-7)3&>->J)&88-64'&H(-)4#'-8/$&#/"C%+6-()4#'-8/$&#/"9)+8)H+/<)+2)/<-%>)
Sample Results for 3-‐spool Turbofan: -‐ Dynamic Complexity: 708.2 -‐ Func9onal Interdependency E(B) = 34.5 -‐ Shannon Entropy = 20.5
Other dynamic complexity metrics
B – Matrix captures correla9ons amongst Func9onal aFributes
19x19
Dynamic Complexity drives the amount of change and number of itera9ons required to achieve sa9sfactory performance in all Func9onal requirements
Sensi9vity Analysis of META outcomes
Sample Results:
dimensional_complexity 20
computa9onal_complexity = 24.9869
nonlinear_complexity = 7.7852
9mescale_complexity = 185.5963
It does not seem possible to compress META design evalua9on into a single scalar metric.
A vector of metrics is most useful, containing:
-‐ Structural Complexity (parts, interfaces, architecture, Graph Energy)
-‐ Dynamic Complexity (func9onal interdependence, uncertainty, Shannon Entropy)
-‐ Organiza8onal Complexity ( number and produc9vity of staff, organiza9onal assignments, Schedule, NRE)
-‐ Main Purpose of META Metrics
1. Architecture Selec9on 2. Outcome predic9on
META Metrics Takeaway