Embed Size (px)
Citation preview
INTEGRATED GEOMECHANICAL MODELLING FOR PREDICTION OF SUBSIDENCE AND INDUCED SEISMICITY DUE TO HYDROCARBON EXTRACTION B. Orlic, J.D. Van Wees, R. Van Eijs Netherlands Institute of Applied Geoscience TNO � National Geological Survey, Kriekenpietplein 18, PO Box 80015, 3508 TA Utrecht, The Netherlands E-mail: [email protected] SUMMARY Exploitation of subsurface natural resources, and subsurface storage of energy residues, may cause subsurface and surface deformation and damage to property. Deformation is generally difficult to assess and prove, although economical, environmental and societal interests are huge in terms of strain on granting concessions, (potential) damage claims etc. For accurate prediction of deformation we developed an integrated workflow for three-dimensional (3D) geomechanical modelling. The workflow integrates the tools for geological- and process modelling and allows efficient transfer of data between the shared earth models. We describe the workflow focussing on the techniques that facilitate construction of 3D structural models and conversion of structural models into quality finite element meshes. With a case study of depleting gas reservoir we illustrate the modelling process and the use of tools for structural modelling and finite element modelling. For the reservoir under consideration, both 2D and 3D geomechanical models were developed to study possible geohazards due to gas extraction. The 2D modelling study investigates the mechanisms of fault reactivation as a cause of induced seismicity in the area. The 3D modelling study focuses on investigation of the interplay between the remote tectonic stress and the man-induced changes in stress due to reservoir production. The 2D modelling study relies on a conventional 2D approach to the geomechanical modelling while the 3D approach makes use of the workflow and an advanced modelling approach. The 3D approach demonstrates that it is technically possible to incorporate both the full complexity of the 3D geological structure of a reservoir including faults and possible variations of the tectonic stress field. 1. INTRODUCTION Injection or extraction of fluid from a hydrocarbon reservoir or withdrawal of support in the course of mining activities induce changes in the stresses and pore pressures in the subsurface. As a result the rock mass deforms causing land subsidence and sinkholes, i.e. crater-like depressions at the ground surface, local seismic activity or triggered earthquakes, etc. These phenomena are potentially damaging for engineering works, such as wellbores, and for civil engineering structures, and are considered as damage to the environment in general. Current advances in finite element computer codes and increase in computer power theoretically allow to quantitatively model the geomechanical effects of hydrocarbon depletion from reservoirs. Up till now the effects have been mostly studied in 2 dimensions (Orlic et al., 2001; Nagelhout & Roest, 1997; Roest & Kuilman, 1994). Only very few studies explore the effects of depletion in 3D (Kenter et al., 1998). It is noted that these studies tend to oversimplify geological structure and the importance of pre-existing tectonic stresses. The geological structure is generally oversimplified because these studies were carried out using geomechanical software only. As a consequence it is rather difficult to incorporate the full complexity of the geological structure, as derived from (3D) seismic interpretation and mapping software into the geomechanical software. With respect to tectonic loading, most studies are performed adopting fixed lateral loading conditions in which the
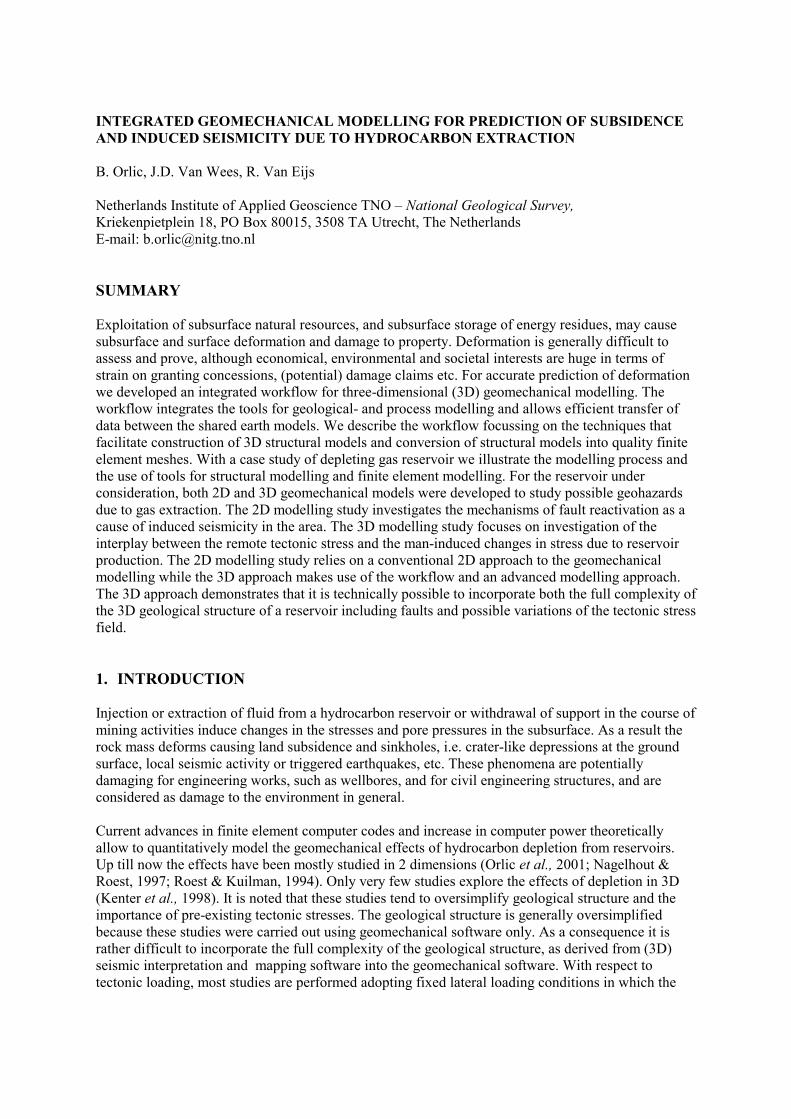
ratio of the horizontal and vertical stress is chosen constant in a rather arbitrary way, often ignoring any effects of particular variations in tectonic stresses. This is not at all in agreement with the current improved understanding of the tectonic stress field clearly showing that the ratio of horizontal and vertical stresses can vary significantly regionally from normal faulting, strike-slip and thrust faulting tectonic regimes. A major aim of this paper is to demonstrate that it is technically possible to incorporate both the full complexity of the 3D geological structure of a reservoir including faults and the possible variations of the tectonic stress field. In the first part of the paper a conventional 2D approach to geomechanical modelling is used to study the mechanisms of fault reactivation as a cause of induced seismicity in the vicinity of depleting reservoir. Subsequently the working methodology for the integrated 3D geomechanical modelling is described and demonstrated through the same case study. The working methodology includes using GOCAD (GOCAD, 2001) for the modelling of the 3D geometry and DIANA (DIANA, 2000) for the geomechanical modelling and specially developed interfaces between these software packages. 2. MODELLING INDUCED SEISMICITY IN 2D The gas production from a reservoir may cause redistribution of the natural in situ stresses sufficient for the reactivation of nearby faults, which is likely the main cause of local seismic events recorded above some gas producing reservoirs. In this case study of a depleting gas field, the mechanisms of induced seismicity were investigated by the 2D geomechanical modelling. The gas field under study is situated in the north-eastern part of the Netherlands. This part is well known in the gas industry from its large Permian Rotliegend fields including the giant Slochteren Field on the Groningen High. Besides these large fields smaller occurrences can be found in younger deposits such as in the gas field under study. The reservoir of this gas field consists of clastic sediments of the Lower Germanic Trias Group, found at a depth of around 2400 m. These clastic fluvio-lacustrine sediments were deposited in the intracratonic Nedersaksian Basin spread out to Germany (Geluk & Röhling, 1997). The reservoir structure is formed by an anticlinal structure above the Emmen Salt dome. The basin evolution of the Niedersaksian Basin is marked by various phases of tectonism, in which halokenetic flow played an important role. Detailed structural studies in the reservoir area are largely in agreement with the regional tectonic evolution. From 3D seismic studies four groups of faults can be identified in the vicinity of the reservoir. The first two groups are situated in the Triassic deposits and consist of WSW-ENE trending normal and reverse faults, in close agreement with the regional phases of Late Kimmerian extension and Late Cretaceous inversion respectively. Furthermore in more detail, en-echelon patterns of SE-NW trending normal faults occur on top of the anticline. In addition, the fourth group of faults consists of WSW-ENE trending normal faults which are observed in the Late Cretaceous and Tertiary in the crest of the anticline. These are believed to be local stress deviations resulting from the crestal collapse of the anticline. Finite element model A representative vertical section through the gas field was used to develop a two-dimensional plain strain finite element model of the field (Figure 1). The model was generated with the finite element package DIANA (DIANA 2000), a program with excellent geomechanical capabilities. Two wedge-forming normal faults at the reservoir level, one thrust fault in the overburden and the bedding plane, which marks the contact between the reservoir and the overburden, were incorporated
into the model. The fault behaviour was modelled with a friction Mohr-Coulomb model, which allows slip to be initiated along faults. Withdrawal of gas from the reservoir was modelled by decreasing the fluid pressure in the reservoir in gradual steps until a full rate of depletion, which amounted to over 30 MPa, has been reached. Pressure estimates from reservoir simulator were used as input to DIANA. The impact of depletion on nearby faults was investigated for different in situ stress regimes, specified by the ratio between the vertical effective stress (�v), and the horizontal effective stress (�h). A range of user-specified horizontal tectonic stresses was used in several runs to represent normal-faulting tectonic stress regime and thrust-faulting regime. The strike-slip stress regime can not, however, be handled by 2D modelling. Tectonic stresses were introduced into the model by defining a value for the lateral pressure ratio (the Ko �value), which is the ratio between the vertical effective stress and the horizontal effective stress (Ko=�h /�v). In a normal faulting stress regime, the vertical effective stresses are greater than the horizontal effective stresses, i.e. Ko<1. In a thrust faulting stress regime, the horizontal effective stresses are greater than the vertical effective stresses, i.e. Ko>1. The pore pressure on parts of faults intersecting the reservoir was specified as reservoir-dependent pore pressure.
Figure 1 Two-dimensional finite element mesh of a gas reservoir for geomechanical modelling of induced seismicity: the faults are modelled by special interface elements.
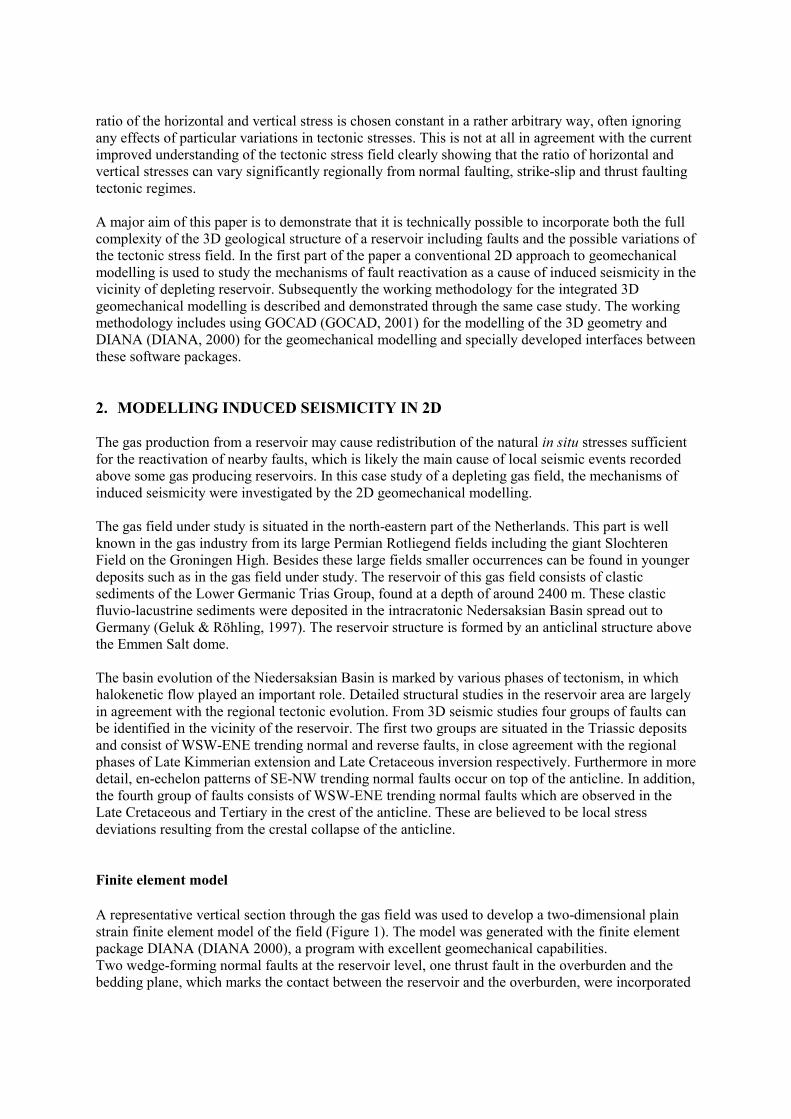
Stress evolution in the reservoir In a normal-faulting stress regime (Ko=0.5) , the depletion of gas pressure in the reservoir causes an increase in the effective stresses throughout the reservoir (Figure 2a). The increase in the shear stress is highest in the crest of the reservoir (Crest and Res3), while the changes in the limbs are smallest (Res27). This generally conforms to the rate of change of pore pressure in the reservoir during gas production. In a thrust-faulting stress regime (Ko=1.5), the effective stress paths are considerably different (Figure 2). In the crest, the shear stress first decreases and then, having reached a minimum value, starts to increase. This can be explained by the stress rotation during depletion, that is, the two principal stresses swap direction during depletion.
Figure 2 Effective stress paths in (a) a normal-faulting stress regime and (b) a thrust-faulting stress regime during reservoir depletion for three locations in the reservoir. Reactivation of faults In a normal faulting stress regime, two normal faults were reactivated during reservoir depletion at the reservoir level for a wide range of shear strength parameters. The chance of reactivation of thrust faults in the overburden of the depleting gas reservoir is largely determined by the in situ stress regime in the subsurface (Figure 3a). In a normal-faulting stress regime, the shear stress in the thrust fault decreases during depletion, reducing the chance of fault reactivation (Figure 3b). However, in a thrust-faulting stress regime, the shear stress in the thrust fault increases during depletion, increasing the chance of fault reactivation (Figure 3c). For the structural setting considered, the reactivation of the thrust fault occurred when a horizontal stress was more than two times greater than the vertical stress. A slip in bedding planes, at the contact between the reservoir and the overburden, may occur locally during depletion as a result of reactivation of normal faults.
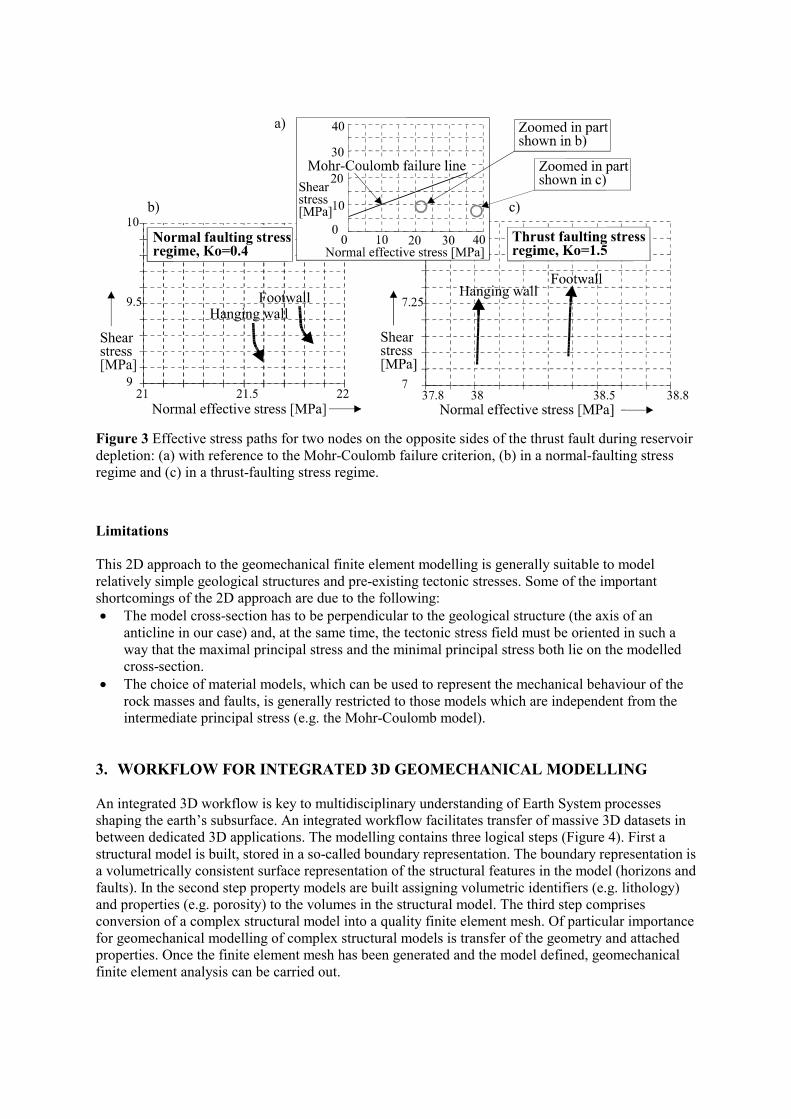
Figure 3 Effective stress paths for two nodes on the opposite sides of the thrust fault during reservoir depletion: (a) with reference to the Mohr-Coulomb failure criterion, (b) in a normal-faulting stress regime and (c) in a thrust-faulting stress regime. Limitations This 2D approach to the geomechanical finite element modelling is generally suitable to model relatively simple geological structures and pre-existing tectonic stresses. Some of the important shortcomings of the 2D approach are due to the following: �� The model cross-section has to be perpendicular to the geological structure (the axis of an
anticline in our case) and, at the same time, the tectonic stress field must be oriented in such a way that the maximal principal stress and the minimal principal stress both lie on the modelled cross-section.
�� The choice of material models, which can be used to represent the mechanical behaviour of the rock masses and faults, is generally restricted to those models which are independent from the intermediate principal stress (e.g. the Mohr-Coulomb model).
3. WORKFLOW FOR INTEGRATED 3D GEOMECHANICAL MODELLING An integrated 3D workflow is key to multidisciplinary understanding of Earth System processes shaping the earth�s subsurface. An integrated workflow facilitates transfer of massive 3D datasets in between dedicated 3D applications. The modelling contains three logical steps (Figure 4). First a structural model is built, stored in a so-called boundary representation. The boundary representation is a volumetrically consistent surface representation of the structural features in the model (horizons and faults). In the second step property models are built assigning volumetric identifiers (e.g. lithology) and properties (e.g. porosity) to the volumes in the structural model. The third step comprises conversion of a complex structural model into a quality finite element mesh. Of particular importance for geomechanical modelling of complex structural models is transfer of the geometry and attached properties. Once the finite element mesh has been generated and the model defined, geomechanical finite element analysis can be carried out.
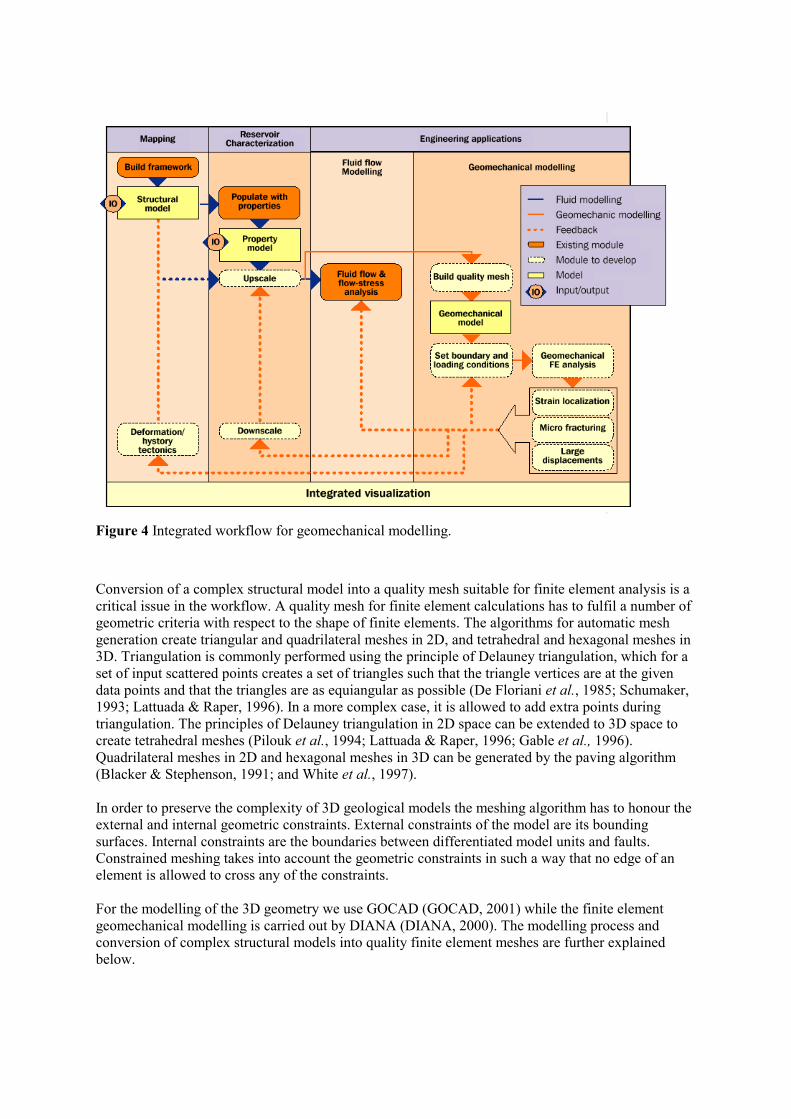
Figure 4 Integrated workflow for geomechanical modelling.
Conversion of a complex structural model into a quality mesh suitable for finite element analysis is a critical issue in the workflow. A quality mesh for finite element calculations has to fulfil a number of geometric criteria with respect to the shape of finite elements. The algorithms for automatic mesh generation create triangular and quadrilateral meshes in 2D, and tetrahedral and hexagonal meshes in 3D. Triangulation is commonly performed using the principle of Delauney triangulation, which for a set of input scattered points creates a set of triangles such that the triangle vertices are at the given data points and that the triangles are as equiangular as possible (De Floriani et al., 1985; Schumaker, 1993; Lattuada & Raper, 1996). In a more complex case, it is allowed to add extra points during triangulation. The principles of Delauney triangulation in 2D space can be extended to 3D space to create tetrahedral meshes (Pilouk et al., 1994; Lattuada & Raper, 1996; Gable et al., 1996). Quadrilateral meshes in 2D and hexagonal meshes in 3D can be generated by the paving algorithm (Blacker & Stephenson, 1991; and White et al., 1997). In order to preserve the complexity of 3D geological models the meshing algorithm has to honour the external and internal geometric constraints. External constraints of the model are its bounding surfaces. Internal constraints are the boundaries between differentiated model units and faults. Constrained meshing takes into account the geometric constraints in such a way that no edge of an element is allowed to cross any of the constraints. For the modelling of the 3D geometry we use GOCAD (GOCAD, 2001) while the finite element geomechanical modelling is carried out by DIANA (DIANA, 2000). The modelling process and conversion of complex structural models into quality finite element meshes are further explained below.
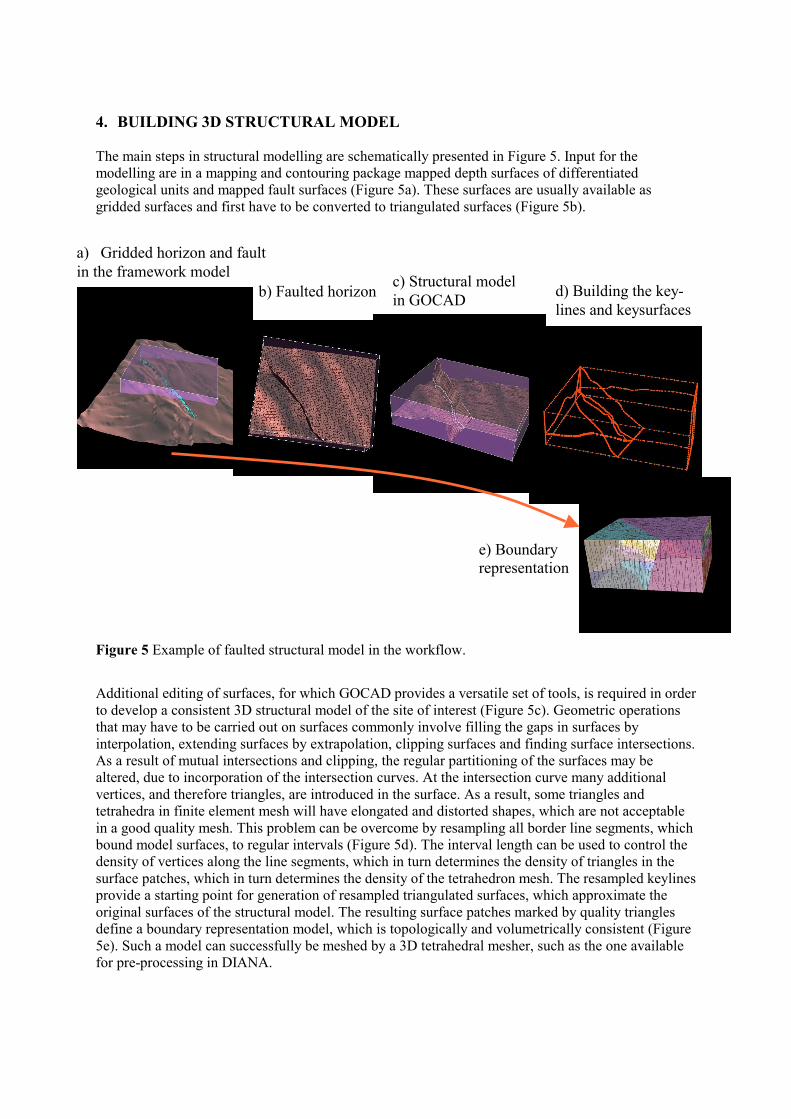
4. BUILDING 3D STRUCTURAL MODEL The main steps in structural modelling are schematically presented in Figure 5. Input for the modelling are in a mapping and contouring package mapped depth surfaces of differentiated geological units and mapped fault surfaces (Figure 5a). These surfaces are usually available as gridded surfaces and first have to be converted to triangulated surfaces (Figure 5b).
d) Building the key- lines and keysurfaces
b) Faulted horizon
e) Boundary representation
c) Structural model in GOCAD
a) Gridded horizon and fault in the framework model
Figure 5 Example of faulted structural model in the workflow.
Additional editing of surfaces, for which GOCAD provides a versatile set of tools, is required in order to develop a consistent 3D structural model of the site of interest (Figure 5c). Geometric operations that may have to be carried out on surfaces commonly involve filling the gaps in surfaces by interpolation, extending surfaces by extrapolation, clipping surfaces and finding surface intersections. As a result of mutual intersections and clipping, the regular partitioning of the surfaces may be altered, due to incorporation of the intersection curves. At the intersection curve many additional vertices, and therefore triangles, are introduced in the surface. As a result, some triangles and tetrahedra in finite element mesh will have elongated and distorted shapes, which are not acceptable in a good quality mesh. This problem can be overcome by resampling all border line segments, which bound model surfaces, to regular intervals (Figure 5d). The interval length can be used to control the density of vertices along the line segments, which in turn determines the density of triangles in the surface patches, which in turn determines the density of the tetrahedron mesh. The resampled keylines provide a starting point for generation of resampled triangulated surfaces, which approximate the original surfaces of the structural model. The resulting surface patches marked by quality triangles define a boundary representation model, which is topologically and volumetrically consistent (Figure 5e). Such a model can successfully be meshed by a 3D tetrahedral mesher, such as the one available for pre-processing in DIANA.
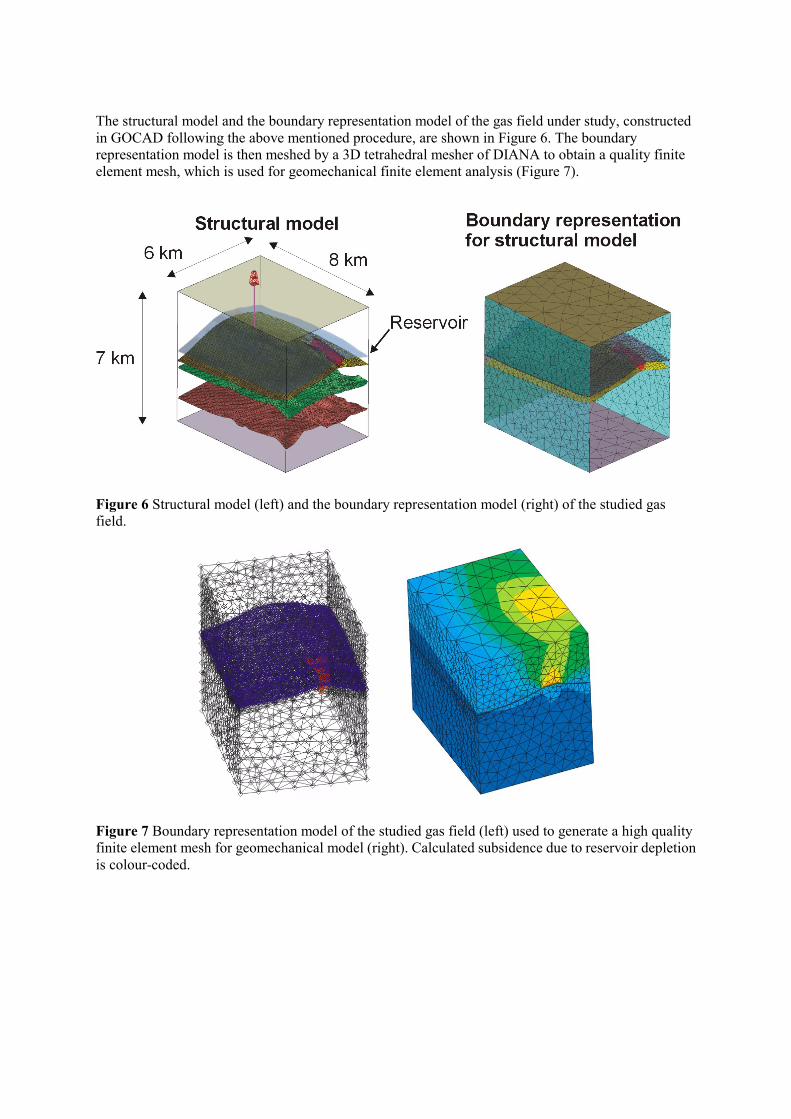
The structural model and the boundary representation model of the gas field under study, constructed in GOCAD following the above mentioned procedure, are shown in Figure 6. The boundary representation model is then meshed by a 3D tetrahedral mesher of DIANA to obtain a quality finite element mesh, which is used for geomechanical finite element analysis (Figure 7).
Figure 6 Structural model (left) and the boundary representation model (right) of the studied gas field.
Figure 7 Boundary representation model of the studied gas field (left) used to generate a high quality finite element mesh for geomechanical model (right). Calculated subsidence due to reservoir depletion is colour-coded.
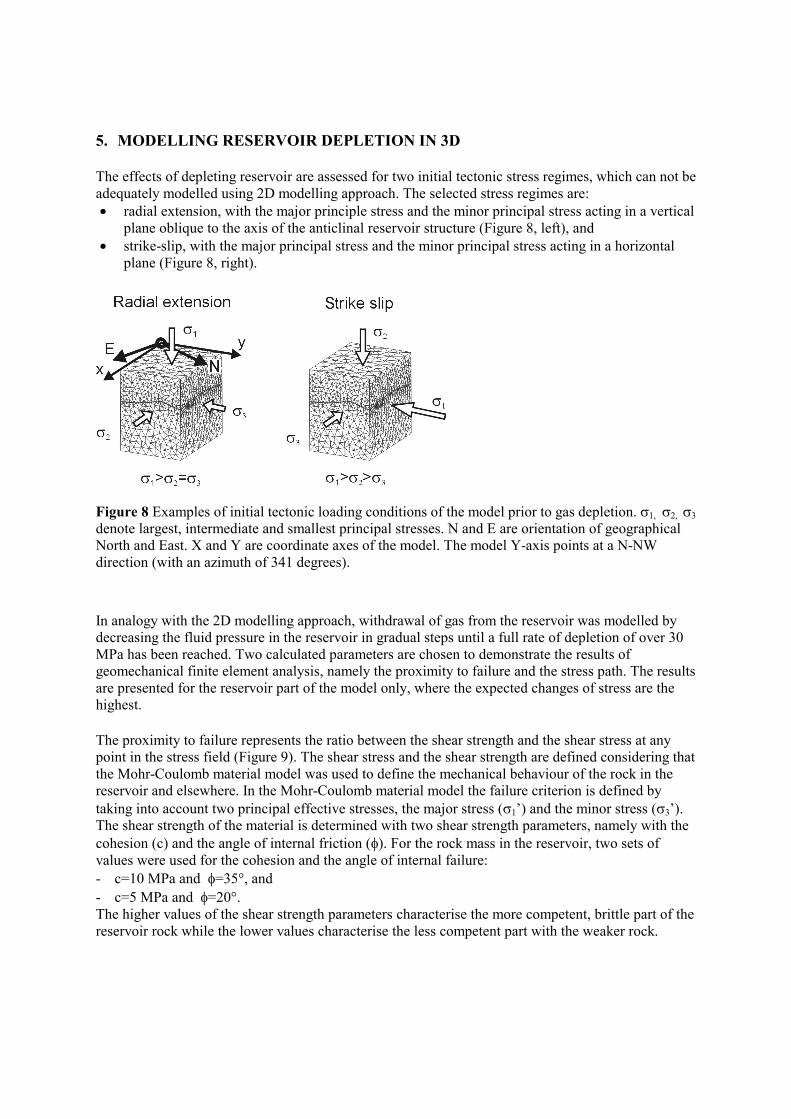
5. MODELLING RESERVOIR DEPLETION IN 3D The effects of depleting reservoir are assessed for two initial tectonic stress regimes, which can not be adequately modelled using 2D modelling approach. The selected stress regimes are: �� radial extension, with the major principle stress and the minor principal stress acting in a vertical
plane oblique to the axis of the anticlinal reservoir structure (Figure 8, left), and �� strike-slip, with the major principal stress and the minor principal stress acting in a horizontal
plane (Figure 8, right).
Figure 8 Examples of initial tectonic loading conditions of the model prior to gas depletion. �1, �2, �3 denote largest, intermediate and smallest principal stresses. N and E are orientation of geographical North and East. X and Y are coordinate axes of the model. The model Y-axis points at a N-NW direction (with an azimuth of 341 degrees).
In analogy with the 2D modelling approach, withdrawal of gas from the reservoir was modelled by decreasing the fluid pressure in the reservoir in gradual steps until a full rate of depletion of over 30 MPa has been reached. Two calculated parameters are chosen to demonstrate the results of geomechanical finite element analysis, namely the proximity to failure and the stress path. The results are presented for the reservoir part of the model only, where the expected changes of stress are the highest. The proximity to failure represents the ratio between the shear strength and the shear stress at any point in the stress field (Figure 9). The shear stress and the shear strength are defined considering that the Mohr-Coulomb material model was used to define the mechanical behaviour of the rock in the reservoir and elsewhere. In the Mohr-Coulomb material model the failure criterion is defined by taking into account two principal effective stresses, the major stress (�1�) and the minor stress (�3�). The shear strength of the material is determined with two shear strength parameters, namely with the cohesion (c) and the angle of internal friction (�). For the rock mass in the reservoir, two sets of values were used for the cohesion and the angle of internal failure: - c=10 MPa and �=35�, and - c=5 MPa and �=20�. The higher values of the shear strength parameters characterise the more competent, brittle part of the reservoir rock while the lower values characterise the less competent part with the weaker rock.
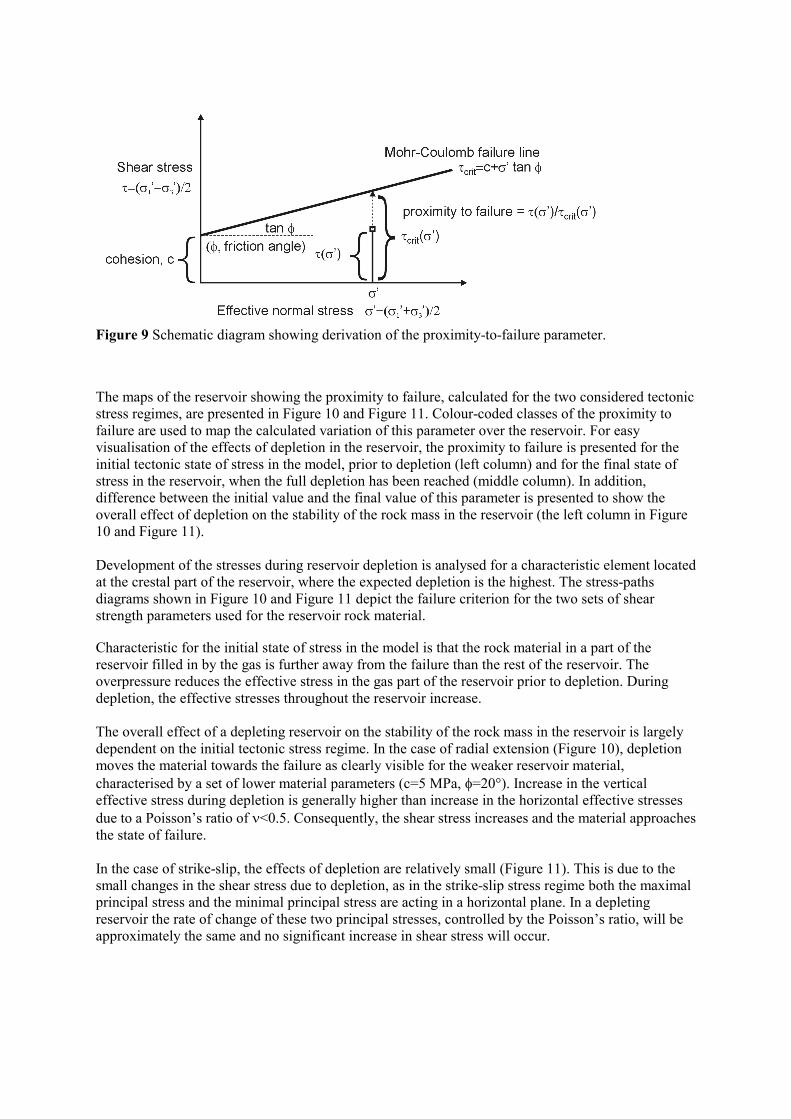
Figure 9 Schematic diagram showing derivation of the proximity-to-failure parameter.
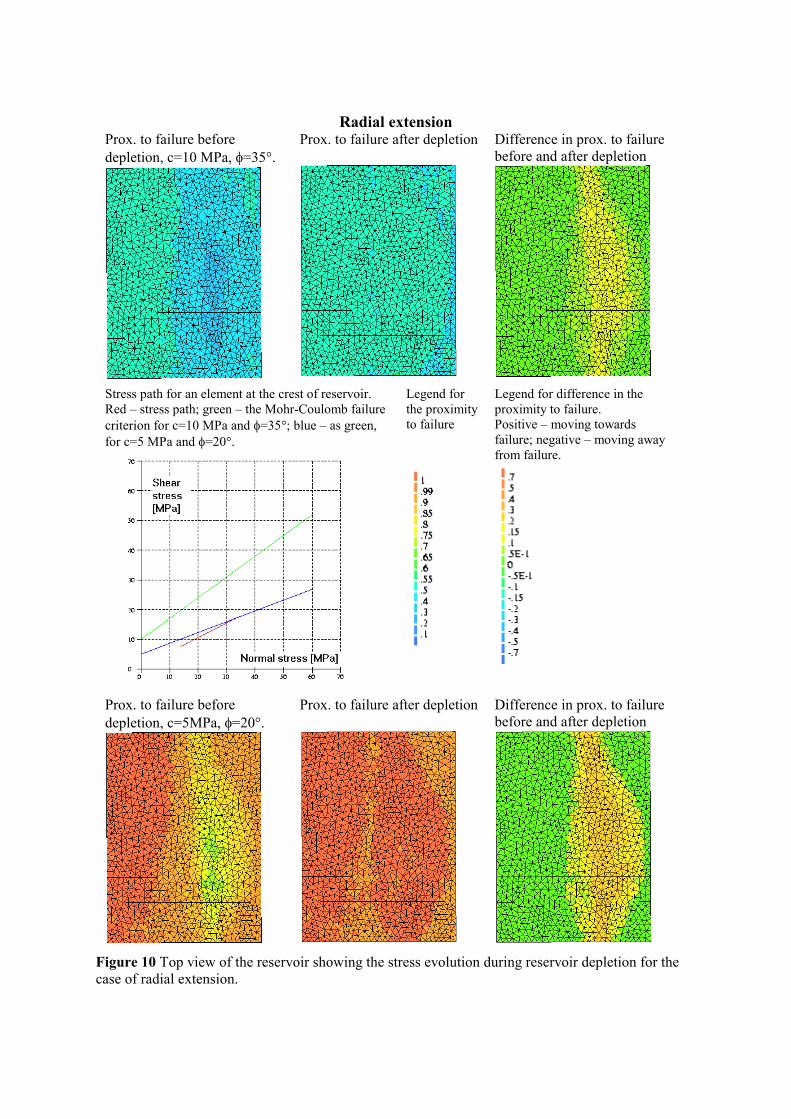
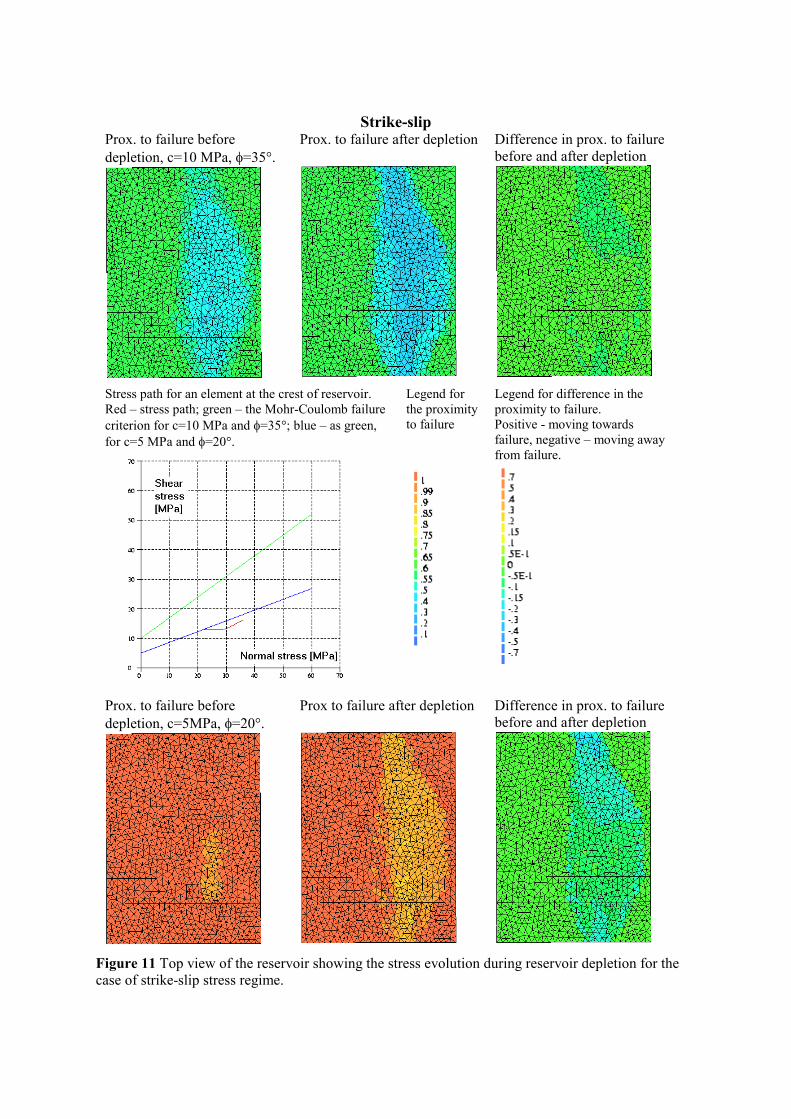
The maps of the reservoir showing the proximity to failure, calculated for the two considered tectonic stress regimes, are presented in Figure 10 and Figure 11. Colour-coded classes of the proximity to failure are used to map the calculated variation of this parameter over the reservoir. For easy visualisation of the effects of depletion in the reservoir, the proximity to failure is presented for the initial tectonic state of stress in the model, prior to depletion (left column) and for the final state of stress in the reservoir, when the full depletion has been reached (middle column). In addition, difference between the initial value and the final value of this parameter is presented to show the overall effect of depletion on the stability of the rock mass in the reservoir (the left column in Figure 10 and Figure 11). Development of the stresses during reservoir depletion is analysed for a characteristic element located at the crestal part of the reservoir, where the expected depletion is the highest. The stress-paths diagrams shown in Figure 10 and Figure 11 depict the failure criterion for the two sets of shear strength parameters used for the reservoir rock material. Characteristic for the initial state of stress in the model is that the rock material in a part of the reservoir filled in by the gas is further away from the failure than the rest of the reservoir. The overpressure reduces the effective stress in the gas part of the reservoir prior to depletion. During depletion, the effective stresses throughout the reservoir increase. The overall effect of a depleting reservoir on the stability of the rock mass in the reservoir is largely dependent on the initial tectonic stress regime. In the case of radial extension (Figure 10), depletion moves the material towards the failure as clearly visible for the weaker reservoir material, characterised by a set of lower material parameters (c=5 MPa, �=20�). Increase in the vertical effective stress during depletion is generally higher than increase in the horizontal effective stresses due to a Poisson�s ratio of �<0.5. Consequently, the shear stress increases and the material approaches the state of failure. In the case of strike-slip, the effects of depletion are relatively small (Figure 11). This is due to the small changes in the shear stress due to depletion, as in the strike-slip stress regime both the maximal principal stress and the minimal principal stress are acting in a horizontal plane. In a depleting reservoir the rate of change of these two principal stresses, controlled by the Poisson�s ratio, will be approximately the same and no significant increase in shear stress will occur.
Radial extension Prox. to failure before depletion, c=10 MPa, �=35�.
Prox. to failure after depletion
Difference in prox. to failure before and after depletion
Stress path for an element at the crest of reservoir. Red � stress path; green � the Mohr-Coulomb failure criterion for c=10 MPa and �=35�; blue � as green, for c=5 MPa and �=20�.
Legend for the proximity to failure
Legend for difference in the proximity to failure. Positive � moving towards failure; negative � moving away from failure.
Prox. to failure before depletion, c=5MPa, �=20�.
Prox. to failure after depletion
Difference in prox. to failure before and after depletion
Figure 10 Top view of the reservoir showing the stress evolution during reservoir depletion for the case of radial extension.
Strike-slip Prox. to failure before depletion, c=10 MPa, �=35�.
Prox. to failure after depletion
Difference in prox. to failure before and after depletion
Stress path for an element at the crest of reservoir. Red � stress path; green � the Mohr-Coulomb failure criterion for c=10 MPa and �=35�; blue � as green, for c=5 MPa and �=20�.
Legend for the proximity to failure
Legend for difference in the proximity to failure. Positive - moving towards failure, negative � moving away from failure.
Prox. to failure before depletion, c=5MPa, �=20�.
Prox to failure after depletion
Difference in prox. to failure before and after depletion
Figure 11 Top view of the reservoir showing the stress evolution during reservoir depletion for the case of strike-slip stress regime.
6. CONCLUSIONS This paper describes integrated geomechanical modelling for assessment of geohazards due to production of subsurface natural resources, storage of energy residues and use of the underground space. With a case study of a depleting gas reservoir we demonstrated the conventional 2D approach to geomechanical modelling and discussed its limitations related to oversimplifications of geological structure and tectonic stress filed. In order to overcome these limitations we developed a workflow for 3D geomechanical modelling, which integrates the tools for geological- and process modelling and allows efficient transfer of data between the shared earth models. The integrated workflow for 3D geomechanical modelling facilitates the construction of faulted structural models and their conversion to geomechanical finite element models. Using the same test case of a depleting reservoir as in the 2D study, we demonstrated the work process and the use of tools for structural modelling and finite element geomechanical modelling. From this case it can be concluded that it is technically possible to incorporate both the full complexity of the 3D geological structure of a reservoir and possible variations of the tectonic stress field into the geomechanical model. Future work will consider multiple enhancements to the workflow. The property models, capable of representing the spatial variability of geomechanical rock mass properties, will be incorporated into the workflow. For conversion of property models of fine resolution to finite element models of coarse resolution, the techniques for homogenisation (i.e. upscaling) of properties will be developed and integrated into the workflow. A loose coupling of a reservoir simulator with the DIANA finite element program for geomechanical analysis is envisaged. 7. ACKNOWLEDGEMENTS This study is a part of the IKOGEM Knowledge Investment Project (Integrated Geomechanical Modeling for Assessment of Deep Subsurface Damage), which has been undertaken in collaboration between Netherlands Institute of Applied Geoscience TNO � National Geological Survey (TNO-NITG) and TNO Building and Construction Research (TNO-BOUW). The research has been supported financially by the Nederlands Organization for Applied Scientific Research TNO. 8. REFERENCES 1. Blacker, T.D. and Stephenson, M.B. - Paving: A New Approach to Automated Quadrilateral
Mesh Generation. IJNME, Vol. 32, 811-847, (1991). 2. De Floriani, L., Falcidieno, B. and Pienovi, C. - Delauney-based representation of surfaces
defined over arbitrary shaped domains. Computer Vision, Graphics, and Image Processing, No. 32, 127-140, (1985)
3. DIANA - Finite Element Analysis, release 7.2. Programme and User�s Documentation. TNO Building and Construction Research, (2000).
4. Gable, C., Trease, H. and Cherry, T. - Automated grid generation from models of complex geologic structure and stratigraphy. Third International Conference on Integrating Geographic Information Systems and Environmental Modelling. Santa Fe, USA, publisher: National Center for Geographic Information and Analysis, Santa Barbara, WWW and CD, (1996).
5. Geluk, M.C. and Röhling H.-G. - High-resolution sequence stratigraphy of the Lower Triassic �Buntsandstein� in the Netherlands and northwestern Germany. Geologie en Mijnbouw, 76, 227-246, (1997).
6. GOCAD 2.0. Program and User�s Manuals. T-Surf & National School of Geology (ENSG) Nancy, (2001).
7. Kenter, C.J., Blanton, T.L. and Schreppers, G.J. - Compaction study for Shearwater field. SPE/ISRM Eurock. Trondheim, SPE/ISRM paper 47280, 63-68, (1998).
8. Lattuada, R. and Raper, J. - Application of Delauney triangulation algorithms in geoscientific modelling. Third International Conference on Integrating Geographic Information Systems and Environmental Modelling. Santa Fe, USA, publisher: National Center for Geographic Information and Analysis, Santa Barbara, WWW and CD, (1996).
9. Nagelhout, A.C.G. and Roest, J.P.A. � Investigating fault slip in a model of an underground gas storage facility. Int. J. Rock Mech. & Min. Sci. 34:3-4, Paper 212, (1997).
10. Orlic, B., van Eijs, R. and Scheffers, B. - Integrated geomechanical modelling for deep subsurface damage. 63rd EAGE meeting. Amsterdam, Extended Abstracts, paper P 604. (2001).
11. Pilouk, M., Tempfli, K. and Molenaar, M. - A tetrahedron-based 3D vector data model for geoinformation. In: Molenaar, M., de Hoop, S (eds.), Advanced Geographic Data Modelling: Spatial Data Modelling and Query Languages for 2D and 3D Applications. Publication on Geodesy, Netherlands Geodetic Commission, No. 40, Delft, The Netherlands, 129-140, (1994).
12. Roest, J.P.A. and Kuilman, W. � Geomechanical analysis of small earthquakes at the Eleveld gas reservoir. Eurock 94. Balkema, Rotterdam, 573-580, (1994).
13. Schumaker, L.L. - Triangulation in CAGD. IEEE Computer Graphics & Applications, Jan. issue, 47-52, (1993).
14. Van Wees, J.D., Orlic, B., Zijl, W., Jongerius, P., Schreppers, G.J. and Hendriks, M. Integrated geomechanical modelling for deep subsurface damage. 63rd EAGE meeting. Amsterdam, Extended Abstracts, paper P 221, (2001).
15. White, D.R. and Kinney, P. - Redesign of the Paving Algorithm: Robustness Enhancements through Element by Element Meshing. Proceedings, 6th International Meshing Roundtable. Sandia National Laboratories, 323-335, (1997).