Embed Size (px)
Citation preview
155
CHAPTER CHAPTER CHAPTER CHAPTER –––– 4444
INDIA’S TRADE WITH INDIA’S TRADE WITH INDIA’S TRADE WITH INDIA’S TRADE WITH
SAARC COUNTRIES SAARC COUNTRIES SAARC COUNTRIES SAARC COUNTRIES ––––
COUNTRIWISE ANALYSISCOUNTRIWISE ANALYSISCOUNTRIWISE ANALYSISCOUNTRIWISE ANALYSIS
156
CHAPTER – 4
India’s Trade with Saarc countries: Country wise Analysis
This Chapter presents a detailed descriptive analysis of each
member country’s socio, economic and political background of the
SAARC group and India’s trade relations with them.
Indo-Bangla Trade Relations:
Geographical features:
Bangladesh is a low-lying area with 147570sq. k.m. It is
located in South Asia with a largely marshy jungle coastline of 710
kilometers (440 mi.) on northern littoral of the Bay of Bengal.
Bangladesh’s alluvial soil is highly fertile but vulnerable to flood
and drought. Bangladesh has a subtropical monsoonal climate
characterized by heavy seasonal rainfall, moderately warm
temperatures, and high humidity. Natural calamities, such as
floods, tropical cyclones, tornadoes, and tidal bores affect the
country almost every year. Bangladesh also is haunted by major
cyclones on an average of 16 times a decade.
Urbanization is happening fast, and it is estimated that only
30 per cent of the population entering the labor force in the future
will be absorbed into agriculture, although many will likely find
other kinds of work in rural areas. The Sundarbans, an area of
coastal tropical jungle in the southwest and the Chittagong Hill
tracts on the southeastern border with Burma and India, are the
least densely populated.
The area that is now Bangladesh has a rich historical and
cultural past, combining Dravidian, Indo-Aryan, Mongol/Mughul,
Arab, Persian, Turkic, and west European cultures. Majority
157
residents of Bangladesh, about 98 per cent of whom are ethnic
Bengali speak Bangla.
ECONOMY
Being one of the world’s poorest and most densely populated
countries, Bangladesh has stepped up its efforts major to meet the
food needs of its increasing population, by augmenting domestic
production. The land is devoted mainly to rice and jute cultivation
Wheat production has also increased in recent years the country
has attained self-sufficiency in rice production. However, 10 to 15
per cent of the population suffers from high nutritional risk and
erratic monsoon, with high degree occurrence of floods. Although
improving Bangladesh has yet to imports its infrastructure to
support transportation, communications, and energy supply.
Bangladesh’s industrial base is weak with limited reserves of coal
and oil. The country’s main endowments include its vast human
resource base, rich agricultural land, relatively abundant water,
and substantial reserves of natural gas, which can be items of
exchange among the Saarc countries.
Moves towards Market Economy
Bangladesh-began its exercise in the direction of raising the
country’s new industrial capacity and rehabilitating the economy
after he violent events of 1971recovery from the static economic
model adopted by its early leadership, Bangladesh drove its
economy out of the clutches of inefficient public sector to the result
oriented private sector in late 1975, by gradually increasing the
scope to private sector participation in the economy, since 1975; of
course major portions of the banking and jute sector, are kept
remain under government control.
158
Investors viewed favorably steps taken by the interim government
to address corruption, governance, and infrastructure issues,
though most believed it was too early to assess the long-term
impact of those developments.
Predominance of Agriculture:
For majority, agriculture is the main source of livelihood in
Bangladesh in spite of often volatile weather conditions. After rice
and jute, maize and vegetables follow in importance. Expanded
irrigation facilities have, encouraged some wheat producers
switched to cultivation of maize which is used mostly as poultry
feed. Because of Bangladesh’s fertile soil and normally ample water
supply, rice can be grown and harvested three times a year in
many areas. Due to a number of factors, Bangladesh’s labor-
intensive agriculture has achieved steady increases in food grain
production despite the often unfavorable weather conditions.
Under employment remains a serious problem and a growing
concern for Bangladesh’s agricultural sector, Finding alternative
sources of employment will continue to be a challenge problem for
future economy.
Garment export – base
The country’s ready-made garment industry, which made
rapid strides, provides employment to millions of people however;
the country could still done better in expanding garment exports
accounting for more than three-fourths of all exports, even the
country’s cash crop, and jute.
The U.S. and the European Union (EU) market imports
significant amounts of garments and knitwear from Bangladesh.
Bangladesh also has established Export Processing Zones in
159
Chittagong (1983), Dhaka (1994), Comilla (2000), Mongla (2001),
Iswardi (2005), Uttara (2006), and Karnafully (2007).
It is suggested that Bangladesh should privatize state-owned
enterprises deregulate and promote foreign investment in high-
potential industries like energy and telecommunications.
Bilateral Relations with India:
India and Bangladesh are good neighbours. Geographic,
cultural, historic, and commercial ties are strong, and both
countries recognize the importance of good relations. In the
Bangladesh’s struggle for independence from Pakistan in 1971,
India helped in gaining independence of Bangladesh, and furnished
relief and reconstruction aid during the post war period.
Notwithstanding the development that India and Bangladesh
have witnessed in recent years, the two countries together still
contain a large number of extremely poor people living on one
dollar a day, this is the real challenge posed before the two
countries. Although they are situated in a region endowed with
vast resources, they have failed to convert these resources into
productive and collective wealth in an accelerating manner.
Together India and Bangladesh boast a total population of
more than 1 billion, and their rapid domestic economic
development has demonstrated broad prospects for cooperation.
India and Bangladesh are still characterized by a low level of
economic integration, despite the fact that their economies are
complementary to a large extent and stand to benefit substantially
from economic integration. However, compared with their strength,
there still exists much potential for developing trade and economic
relations between the two countries.
160
Indo-Bangladesh relations are often strained and many Bangladesh
feel India likes to play “big brother” to smaller neighbors, including
Bangladesh. Bilateral relations warmed in 1996, due to a softer
India’s foreign policy and the new Awami League government. A 30-
year water-sharing agreement for the Ganges river was signed in
December 1996, after an earlier bilateral water-sharing agreement
for the Ganges River lapsed in 1988. Bangladesh is not happy with
the proposed Indian River Linking Project, which the government
says could turn many parts of Bangladesh into a desert. Indian
army maintains a strong presence in the Hill Tracts. Arms
smuggling and reported opium crop cultivation are concerns in this
area. Occasional exchanges of fire between the two countries flare
up and seriously disrupt bilateral relations. Much to Bangladesh’s
displeasure, India’s erected a barbed-wire fence is an irritant in the
bilateral relations of both the countries.
Former Prime Minister Khaleda Zia of Bangla, however,
visited the Indian capital in March 2006 and reviewed bilateral
relations with her Indian counterpart*. Two agreements viz., the
Revised Trade Agreement and the Agreement on Mutual
Cooperation for Preventing Illicit Drug Trafficking in Narcotic Drugs
and Psychotropic Substances and Related Matters-were signed
between the two countries during this visit. The then Indian
Foreign Minister Pranab Mukherjee met with the Chief Adviser in
Dhaka on February 26, 2007. Mukherjee invited Ahmed to the
April 3-4, 2007, SAARC summit in Delhi, and both sides pledged to
put Bangladesh-India relations on “an irreversible higher
trajectory.
Improving relations with India became a priority with the
return of the Awami League government in January 2009. The new
Prime Minister Hasina herself travelled to New Delhi in January
161
2010 and signed several agreements to further strengthen their
bilateral relationship. India plays an important role in
Bangladesh’s trade since the independence and since nineties,
Indo-Bangla trade increased tremendously.
The importance of Bangladesh to India’s trade can be
understood from the fact that Bangla contributed 0.74 per cent in
1990, 1.59 percent in 1995, per cent and 1.40 per cent of India’s
global exports in 2010-11.
Trend, Structure and Current Picture of Indo - Bangladesh
Trade:
One of the important features of Indo-Bangladesh bilateral
trade to be mentioned is that a large volume of informal or
unrecorded trade, both in commodities and services, occurs every
year, and it is growing despite unilateral or regional or multilateral
trade liberalization in these two countries. The official data on
trade in services between these nations are, in fact, not available at
all. Under this situation of data paucity with regard to illegal trade
and trade in services, our current analysis will depend on mostly
on the official trade data in commodities.
Historical Development of Indo-Bangla Trade Relations
Bangladesh and India signed the ‘Treaty of Friendship’
Cooperation and Peace on March 19, 1972 in Dhaka for 25 years.
In the agreement, fish, raw-jute, newsprint and naphtha were
identified as the principal exports of Bangladesh to India. Bangla’s
major import items from India introduced were cement, coal,
machinery and unmanufactured tobacco. The trade between the
162
two nations was limited to government level.1 This agreement also
provided border trade between Bangladesh and neighboring Indian
states; and within 16 kilometers of both countries border, free
trade was allowed for certain commodities2.
The first trade agreement of 1972 was replaced by another
trade agreement for three years. This agreement was signed on
July 5, 1973 and became effective from 28 September, 1973. This
agreement provided for a system of balanced trade and payment
arrangement and most favored nation treatment to both the
Countries.
Share of Indo-Bangladesh trade in Indo-SAARC Trade (Table 4.2)
It is evident from table 4.2 that the member country, which
registered the largest percentage share in Indo-SAARC trade, was
Bangladesh. India’s exports to Bangladesh amounted to Rs. 2024
crores in 1994-95, contributing the highest percentage share to
Indo-SAARC trade with 53.05 per cent. The exports to Bangladesh
being amounted Rs. 3529 crores in 1995-96, contributed the
highest ever percentage share to Indo-SAARC trade with 61.32 per
cent in 1995-96. But, in 1998-99, the percentage share was
recorded at 59.29 per cent, (see table 4.2). Since then, the
percentage share exhibited decreasing trend through out the study
period. The lowest percentage share was observed in 2006-07 with
25.16 per cent. With regard to India’s export growth rate with
Bangladesh, the following observation have been noted.
1 Madan, D.K., Indo-Bangladesh Economic Relations and SAARC, (New Delhi: Deep and Deep Pubication), 1996.
2 Hasan, M.K., Trade with India and Trade Policies of Bangladesh, in F.E. Cookson and A.K.M.S. Alam (Eds) Towards Greater sub –regional Economic Cooperation. 2002, chapter 10, 349-401.
163
Between 1994-95 and 2000-01, India’s exports to
Bangladesh had been doubled as the exports worth of Rs. 2024
crores in 1994-95, went up to Rs. 4272 crores in 2000-2001 over
1994-95. However, the compound growth rate of exports recorded
in respect of Bangladesh was not as high as had been registered in
respect of India’s compound growth rate of exports with SAARC,
which was recorded at 130.93 per cent in 2000-01 over 1994-95.
Between 2001-02 and 2005-06, the compound growth rate of
exports, recorded in respect of Bangladesh, was not as large as had
been registered in the previous phase i.e., from 1994-95 to 2000-
01. The compound growth rate of exports, registered during second
phase was 54.16 per cent in 2005-06 over 2001-02. Also, this
compound growth rate of exports, recorded in respect of
Bangladesh, was far lesser than the compound growth rate of
exports, registered in respect of SAARC; the compound growth rate
recorded in respect of SAARC was 154.20 per cent in 2005-06 over
that of 2001-02.
But, the above trend, recorded in II phase was reversed, as
the compound growth rate of exports recorded at 120.13 per cent
in 2010-11 in respect of Bangladesh, far higher than the
compound growth rate of exports, registered at 97.76 per cent in
2010-11 over 2006-07, in respect of exports to other SAARC
Nations.
Share of India’s imports from Bangladesh in the overall India’s
imports from SAARC.
India had substantial trade relations with Bangladesh during
the recent decade. According to table 4.3 the imports from
Bangladesh as a proportion of imports from SAARC had been
registered at 21.62 per cent in 1994-95. The highest percentage
164
share of imports from Bangladesh had been recorded at 33.44 per
cent in 1995-96 and the least percentage share was recorded at
6.25 per cent in 2004-05.
When we considered the growth rate of imports in respect of
Bangladesh, the highest annual growth rate of imports was
recorded at 139.6 per cent in 1995-96 over 1994-95, as the
imports from Bangladesh worth of Rs. 120 crores in 1994-95, had
gone up to 287 crores in 1995-96. Negative annual growth rates of
imports had been observed during 1996-97 with 22.99 per cent,
14.47 per cent in 1997-98, 23.16 per cent in 2001-02 and 25.21
per cent in 2004-05 and with 15.08 per cent in 2009-10. (See table
4.3).
With regard to compound growth in 2000-01, the imports
from Bangladesh had been more than doubled when compared to
1994-95. When we considered the compound growth rate of
imports in respect of SAARC nations during the same period, it
was, registered at 283.42 per cent in 2000-01 over 1994-95.
During 2001-02 and 2005-06, the imports from Bangladesh
had been almost doubled with the compound growth rate of
imports being registered at 99.29 per cent in 2005-06 over 2001-
02. When the compound growth rate of imports was considered in
respect of SAARC during the same period, it was registered at
129.53 per cent in 2005-06 over 2000-01 (more than doubled).
Between 2006-07 and 2010-11, the compound growth rate of
India’s imports in respect of Bangladesh was recorded at 81.62 per
cent in 2010-11 over 2006-07. But, the compound growth rate of
imports, recorded in respect of SAARC was at 34.80 per cent only.
165
India’s balance of trade with Bangladesh
It is evident from the table 4.4 that India’s exports to
Bangladesh have always surpassed the values of imports. While
the values of exports to Bangladesh were in thousands of crores,
imports from Bangladesh were just in hundreds. Thus, the ±
balance of trade has always been in favour of India. However, the
annual growth rate in balance of trade with Bangladesh had been
widely fluctuating with erratic trends. The ups and downs in the
growth rate could be witnessed in table 4.4.
The Indo-Bangla trade deficit has been increasing
exponentially since the recent past. The data show that compared
to 1994-95, trade deficit is more than three times in 2004-05 and
seven and half times in 2010-11 when compared to 1994-95 (see
table 4.4). Between 1983 and 2003, according to an IMF study, the
trade deficit was increased by 46 times.3
The importance of India in Bangladesh’s trade
India plays an important role in Bangladesh’s trade since
independence. Recently especially in 1990’s, Bangladesh trade with
India increased tremendously. The table 4.5 compares the growth
rates of India’s trade with Bangladesh, with that of SAARC
countries and with world for the period from 1994-95 to 2010-11.
It could be observed from table 4.5 that the annual growth rate of
India’s trade with Bangladesh during 1995-96 was much higher
than those with SAARC and the world. For example during 1998-
99, while annual growth rate of India’s trade with SAARC and the
world were 31.58 per cent and 11.89 per cent respectively, but with
Bangladesh this was 43.06 per cent. During 2000-2001, the
3 IMF (2004). Direction of Trade Statistics Year book, Washington D.C.
166
growth rates with the world, SAARC and Bangladesh were 15.91
per cent, 40.84 per cent and 49.83 per cent respectively. The
growth rate of India’s trade with Bangladesh increased very
significantly during 2007-08. While the growth rates with world
and the SAARC were 18.11 per cent and 30.82 per cent
respectively, the growth rate with Bangladesh was at 52.11 per
cent during the same period. During 2008-09 and 2009-10,
negative growth rates recorded consecutively with Bangladesh, and
also with the world during 2009-10. However, these figures turned
into convincingly positive in 2010-11. (See table 4.5).
From the table 4.1, it is observed that Bangladesh’s share in
India’s global trade both exports and imports has decreased from
1.67 per cent in 1995-96 to 1.08 per cent in 2002-03 and further
to 0.65 per cent in 2010-11. It is also discouraging that both Indo-
Bangladesh export share and import share have been showing
declining trend in India’s global exports and global imports.
The share of Indo-Bangladesh’s trade in Indo-SAARC trade
also, is not impressive as the trend recorded in respect of Indo-
SAARC trade, displaying a decreasing trend throughout the years.
(see table 4.5). The important feature is that the share of Indo-
Bangladesh’s import trade in India’s global imports slightly went
up from 0.10 per cent in 2007-08 to 0.12 per cent in 2010-11(see
Table 4.1).
INDO-SRI LANKA TRADE RELATIONS:
The area of Srilanka in 65,610 sq.k.m which is about the size
of West Virginia, The population of Sri Lanka is 21.3 millions. The
167
annual growth rate is 0.9 per cent.4 The languages, spoken in
Srilanka are Simhala and Tamil. The natural resources available
are limestone, graphite, mineral sands, gems and phosphate.5
PROFILE
Sri Lanka is ethnically, linguistically, and religiously diverse.
Sinhalese make up 74% of the population and are concentrated in
the densely populated southwest. Sri Lankan Tamils, citizens
whose south Indian ancestors have lived on the island for
centuries, comprise about 0.9 per cent of the population.
Indian Tamils, a distinct ethnic group, represent about 5 per
cent of the population. The British brought them to Sri Lanka in
the 19th century as tea and rubber plantation workers, and they
remain concentrated in the “tea country” of south-central Sri
Lanka. In accordance with a 1964 agreement with India, Sri Lanka
granted citizenship to 230,000 “stateless” Indian Tamils in 1988.
Under the pact, India granted citizenship to the remainder, some
200,000 of whom now live in India.
Other minorities include Mulsims (both Moors and Malays),
at about 7 per cent of the population; Sizable minorities of both
Sinhalese and Tamils are Christians, most of whom are Roman
Catholic. The 1978 constitution-while assuring freedom of religion-
grants primacy to Buddhism. Tamils and most Muslims speak
Tamil. Use of English has declined since independence Both
Sinhala and Tamil are official languages.
4 Various Reports of Bureau of South and Central Asian Affairs, 2010.
5 Ibid.
168
HISTORY
The actual origins of the Sinhalese are shrouded in myth.
Most believe they came to Sri Lanka from northern India during the
6th century BC. Buddhism arrived from the subcontinent 300 years
later and spread rapidly.
Sri Lanka Economy
Sri Lanka is a lower-middle income developing nation. When
compared to India, Bangladesh and Pakistan, Sri Lanka is ahead
with 91 per cent literacy rate in local languages and life
expectancy of 75 years rank well above those of India.
Like many countries in South Asia Sri Lanka shifted away
from a socialist orientation and opened its economy to foreign
investment with aggressive economic reform under the UNP-led
government that ruled from 2002 to 2004.
The economic situation in Sri Lanka received a jolt in 2009
due to the global recession. In the recent past, it was hindered by
large scale hostilities between the government and the LTTE, high
government expenditure, inflation and interest rates. Exports fell
by about 13.5%. In 2008, trade and current accounts recorded
large deficits due to high oil and commodity prices, and an
unsuccessful effort by the government to defend the Sri Lankan
rupee drained Sri Lanka’s exchange reserves, forcing it to turn to
the International Monetary Fund (IMF) in early 2009 for assistance.
The economic strategy as outlined by President Rajapaksa
namely “Mahinda Chintana” (Mahinda’s Thoughts), guides
government economic policy, Presently with a focus on poverty
169
alleviation and steering investment to backward areas; The small
and medium enterprise (SME) sector; promotion of agriculture etc.
The government has also drafted a 10-year long term development
framework to accelerate growth to strengthen big infrastructure
projects in the country. The government is not for privatization of
state enterprises, including “strategic” enterprises such as state-
owned banks, airports and electrical utilities. Instead, it plans to
retain ownership and management of these enterprises and make
them profitable.
The service sector comprising telecom, trading, transport,
and financial services is the largest component of Sri Lanka’s GDP
at around 60 per cent. Financial scarcities arose with the rise in
hostilities, and defense expenditures expansion of public sector
employment, and the expenses associated with the jumbo cabinet
and growing information technology sector, especially information
technology training and software development.
Sri Lanka’s GDP comprises 30 per cent of its volume from
Industry accounts. Like in India, agriculture production of GDP
has lost its relative importance to the Sri Lanka economy in recent
decades with only about 12 per cent of GDP. Sri Lanka gets its
earnings from rice, cereals, tea, rubber, and coconut.
Foreign Trade and Foreign Assistance
Sri Lanka’s exports (mainly apparel, tea, rubber, gems and
jewellery) were estimated at $7.0 billion and imports (mainly oil,
textiles, food, and machinery) were estimated at $9.6 billion for
2009. The trade deficit of Sri Lanka was financed primarily by
remittances from Sri Lankan expatriate workers, foreign aid and,
from public borrowings. Sri Lanka must diversify its exports
170
beyond garments and tea. The tea industry is challenged by a
shortage of plantation labor and by growing competition.
Exports to the United States, Sri Lanka’s most important single-
country market, were estimated to be around $1.54 billion for
2009, or 22% of total exports. For many years, the United States
has been Sri Lanka’s biggest market for garments, taking almost
50% of total garment exports. India is Sri Lanka’s largest source of
imports, accounting for over 20 per cent of imports.
Iran is a major lender to Sri Lanka and has provided
infrastructure project loans and an interest-free credit facility for
oil imports. Iran assistance for modernization of Sri Lanka’s only
oil refinery has come forth though no firm commitments are in
place. China has also become a major lender for infrastructure
projects, such as a new port and a coal power plant.
Sri Lanka has traditionally been an important export market
for India and is the second largest trading partner in the region
after Bangladesh (See table 4.22). The bilateral trade is carried out
in accordance with the provisions of the Trade Agreement signed in
1961. The trade is in freely convertible currencies and on MFN
basis. Both the countries are the signatories of WTO, SAARC and
Bangkok Agreement. Within the frame work of SAARC Preferential
Trading Agreement and the Bangkok Agreement, mutual
preferential trade concessions are extended to each other.
India and Sri Lanka have signed a Free Trade Agreement on
28th December, 1998 under which tariff on a large number of items
would be phased out within an agreed time frame.6 While India
would reduce the tariff to zero in three years, Sri Lanka would do
6 Reeta Mathur. International Economics, (Jaipur: Sub Lime Publications, 2002) p. 245.
171
so in eight years.7 Two sides will maintain negative Lists of items
on which no duty concessions are given, where protection to local
industry in considered necessary.
INDO-SRI LANKA RELATIONS:
Bilateral relations between Sri Lanka and India have been
generally friendly, but were affected by the Sri Lankan civil war and
by the failure of Indian intervention during the Sri Lankan civil
war. India is Sri Lanka’s only neighbor, separated by the Palk
Strait; both nations occupy a strategic position in South Asia and
have sought to build a common security umbrella in the Indian
Ocean.
India - Sri Lanka relations have undergone a qualitative and
quantitative transformation in the recent past. Political relations
are close, trade and investments have increased dramatically,
structural linkages are constantly being augmented, defense
collaboration has increased and there is a general, broad-based
improvement across all sectors of bilateral cooperation. India
was first country to respond to Sri Lanka’s request for assistance
after the tsunami in December 2004. In July 2006, India evacuated
430 Sri Lankan nationals from Lebanon, first to Cyprus by Indian
Navy ships and then to Delhi and Colombo by special Air India
flights.
There exists broad consensus within the Sri Lankan polity on
the primacy of India in Sri Lanka’s external relations matrix. Both
the major political parties in Sri Lanka, the Sri Lanka Freedom
Party and the United Nationalist Party have contributed to the
rapid development of bilateral relations in the last ten years. Sri
7 Ibid., p.256
172
Lanka has supported India’s candidature to the permanent
membership of the UN Security Council.
SHARE OF INDO-SRI LANKAN EXPORT TRADE IN INDO -
SAARC EXPORT TRADE:
As indicated by table 4.6, the exports worth of Rs. 2163.5
crores in 1999-2000 as compared to Rs. 1151.1 crores in 1994-95,
reflecting a compound growth rate of 87.95 per cent. On the other
hand, the overall exports to SAARC nations were worth of Rs. 6043
crores in 1999-2000 as compared to Rs. 3815 crores in 1994-5,
contributing the compound growth rate at 50.40 per cent in 1999-
2000 over 1994-95. (See table 4.6).
Between 2000-2001 and 2005-06, there was a remarkable
growth in the compound growth rate of exports with 206.51 per
cent in 2005-06 over 2000-01; in the same way, substantial
compound growth rate of exports had been recorded in respect of
overall exports to SAARC countries with 178.79 per cent in 2005-
06 over 2000-01.
The compound growth rates, which displayed tremendous
records during above period of study, had not been observed
during the last phase of study period that was between 2006-07
and 2010-11.
The compound growth rate of exports, which was registered
at 97.76 per cent in respect of Indo-SAARC trade was more
encouraging than the compound growth rate of exports recorded at
80.02 per cent in 2010-11 over 2006-07, in respect of Sri Lanka. It
was also noteworthy that two consecutive annual negative growth
rates of exports were noted with 4.22 per cent in 2008-09 and also
with 5.44 per cent in 2009-10. In respect of Indo-SAARC trade
173
also, negative annual growth rates had been witnessed with 0.89
per cent in 1997-98 and with 14.46 per cent in 1999-2000.
The share of India’s exports to Sri Lanka as a proportion of
overall exports to SAARC stood at 30.17 per cent in 1994-95. But,
it was declined to 23.35 per cent in 1995-96. During 1997-98, the
percentage share went up to 30.37 per cent as compared to 28.05
per cent in the previous year. The highest percentage share of
exports with Sri Lanka was registered at 36.49 per cent in 2005-
06. (See table 4.6.). This percentage share, however, came down to
25.95 per cent in 2009-10, before it slightly picked up to 31.74 per
cent at the end of 2010-11. The annual growth rates, which were
thus negative during 2008-09, 2009-10, increased to 78.55 per
cent in 2010-11 over the previous year.
Share of India’s imports from Sri Lanka in Indo-SAARC import
Trade (Table 4.7)
It is evident from table 4.7 that India’s imports from Sri
Lanka have displayed a fluctuating trend through out the study
period.
Between 1994-95 and 1990-2000, the imports from Sri
Lanka were almost doubled with 98.65 per cent in 1999-2000
where as during the same period, in respect of Indo-SAARC trade
there was a remarkable growth in compound growth rate, having
been recorded at 210.45 per cent in 1999-2000 over 1994-95. (see
Table 4.7).
Between 2000-2001 and 2003-04, the imports from Sri
Lanka, which amounted Rs. 205.6 crores in 2000-01 went up
tremendously to Rs. 894.9 crores in 2003-04, contributing a
remarkable growth in the compound growth rate at 335.26 per
174
cent. When we considered the same period in respect of Indo-
SAARC trade, the compound growth rate was just recorded at
44.40 per cent in 2003-04 over 2000-01.
The notable feature during 2002-03 and 2003-04 was that,
the imports from Sri Lanka were more than doubled, with the
Annual growth rate of imports being registered at 103.57 per cent
in 2003-04 over 2002-03.
Between 2004-05 and 2010-11, the compound growth rate of
imports was just recorded at 18.17 per cent in 2010-11 over
2004—05. Further, it was also observed that there were two
negative annual growth rates being recorded at 16.74 per cent in
2006-07 and the other one at 36.09 per cent in 2008-09. But, the
trend was different, if the same period was considered in respect of
Indo-SAARC trade. The imports were more than doubled with the
compound growth rate of imports being registered at 115.39 per
cent in 2010-11 over 2004-05. However, there were two negative
consecutive annual growth rates being registered at 2.78 per cent
in 2008-09 and 5.17 per cent in 2009-10 consecutively.
It was observed that the exports in respect of Sri Lanka have
surpassed the imports through out the study period stretching
from 1994-95 to 2010-11, displaying a favourable balance of trade.
(See table 4.8).
INDO – NEPAL TRADE RELATIONS
Area, People, Religion and Languages:
Nepal with an area of 147.181 sq. k.m. shares borders with
China and India. The capital is Kathmandu. The population of
175
Nepal is about 29.3 million with an annual population growth rate
of 2.132 per cent.8
Religion is important in Nepal; the Kathmandu Valley alone
has more than 2,700 religious shrines which attract a large
number of tourists. According to the 2011 census, Nepal is roughly
81% Hindu. Buddhists account for about 11% of the population.
The interim constitution, promulgated on January 15, 2007,
declared the country a “secular state”.
Nepali is the official language, although over 100 regional
and indigenous languages are spoken throughout the country.
Derived from Sanskrit, Nepal is similar to Hindi and is spoken by
about 90% of the population (although often as a second or third
language). Many Nepalese in government and business also speak
Hindi and English.
Economy, Trade and foreign relations:
Nepal ranks among the world’s poorest countries, with a per
capita income of around $427 in 2009. Based on national
calorie/GNP criteria, an estimated 55% of the population is below
the poverty line of $1.25 per day. An isolated, agrarian society until
the mid-20th century9, Nepal entered the modern era in 1951
without schools, hospitals, roads, telecommunications, electric
power, industry, or a civil service. The country has, however, made
progress toward sustainable economic growth since the 1950s and
is committed to a program of economic liberalization.
Agriculture remain Nepal’s principal economic activity,
employing over 73% of the population and providing 34% of GDP.
8 Ibid. 9 Ibid.
176
Because of Nepal’s dependence on agriculture, the magnitude of
the annual monsoon rain strongly influences economic growth.
In 2009-2010 Nepal’s exports decreased by 6% and imports
grew by 187% in FY when compared to 2007-2008. Exports
constrained by political turmoil and a poor investment climate were
also impacted by the worldwide financial crisis. According to the
revised estimations of the Central Bureau of Statistics, GDP growth
increased marginally to 3.72% in 2005-2006 and slipped to 3.19%
in 2006-2007. In 2009 GDP grew by about 4.7%.
In addition to a growing trade deficit, Nepal faced a balance
of payments (BOP) deficit of $36 million for the first time in 2009-
2010. Nepal receives substantial amounts of external assistance
from India, the United Kingdom, the United States, Japan, and the
European Union (EU).
With eight of the world’s ten highest mountain peaks-
including Mt. Everest at 8,848 m (29,000 ft)-Nepal is a tourist
destination for hikers and mountain climbers. However, the
decade-long insurgency and a global economic slowdown
threatened the tourism industry. But 2007 witnessed a renewed
wave of tourism. Since the political parties and Maoists brokered a
comprehensive peace agreement in November 2006, renewed
tourist arrivals have given relief to the tourism-based hotel,
trekking, mountaineering, and aviation industries during the later
years and in 2011 Nepal celebrated its Year of Tourism.
Swift rivers flowing south through the Himalayas have
massive hydroelectric potential to service domestic power needs
and growing demand from India. Only about 1% to 2% of Nepal’s
hydroelectric potential is currently tapped. Several hydroelectric
177
projects, the Kali Gandaki A (144 megawatts-MW), and a number
of private projects were planned and some completed.
Population pressure on natural resources is increasing.
Overpopulation is already straining the middle hill areas,
particularly the Kathmandu Valley, resulting in the decline of forest
cover. Progress has been achieved in education, health, and
infrastructure, a countrywide primary education system is under
development, and Tribhuvan University has several campuses.
Kathmandu is linked to India and nearby hill regions by an
expanding highway network.
FOREIGN RELATIONS
Nepal’s association with India traditionally has been very
close. Because of strong cultural, religious, linguistic, and
economic ties, India and Nepal restored trade relations in 1990
after a break caused by India’s security concerns over Nepal’s
relations with China.
Nepal played an active role in the formation of SAARC and is
also the headquarters of its secretariat. Nepal is also a signatory of
the agreement on South Asian Free Trade Area (SAFTA), which
came into force on January 1, 2006. A SAFTA Tariff Liberalization
Program (TLP) was scheduled to be implemented from July 1, 2006.
All member countries, except for Nepal, whose TLP started on
August 1, 2006, reduced tariffs for each other∗∗∗∗
* On July 1, 2006, Pakistan officially toughened its stance of not trading with India under the SAFTA
arrangements and did not announce TLP for India. Due to the stalemate between India and Pakistan, the Bay of Bengal Initiative for Multi-Sectoral Technical and Economic Cooperation free Trade Agreement (BIMSTEC), which was initially scheduled to come into force on July 1, 2006, was deferred indefinitely. The BIMSTEC Summit scheduled for February 8, 2007 in India was also deferred due to political instability in member states, including Nepal, but eventually took place in November 2008. On international issues, Nepal follows a non-aligned policy and often votes with the Non-Aligned Movement in the United Nations. Nepal participates in a number of UN specialized agencies and is a member of the World Trade Organization, World Bank, International Monetary Fund, Colombo Plan, and Asian Development Bank
178
Indo – Nepal Economic Relations
Economic relationship between Nepal and India is unique.
There are historical, geographical, cultural, linguistic, ethnic, social
and family links between people living in India and Nepal.
Institution relating to government and the economic activities are
also more or less similar. Therefore, the trade and other related
relationship between Nepal and India has its own significance.
Trade relationship between these two countries often goes beyond
the economic reason significantly influenced by the social-ethical
norms and values. Research and studies reveal that both the
countries have comparative cost advantages in trading amongst
themselves for several reasons. Historic trade relations,
geographical proximity, identical culture, similar agriculture
productions are cited few examples quite repeatedly. Economical
transport cost is seen as another important factor determining the
volume of trade between these countries. In view of the rising
energy costs, it often considered that the transport costs are likely
to rise so that the transport cost advantage to both these countries
trading with each other is likely to increase in future. This would
further increase the potential for trade between these countries.1
Timilsina (2000), on the other hand, notes that the economic
cooperation between Nepal and India is based on the movements of
goods and services across Nepal-India border of about 1,600 km.
The movement is free and spontaneous. This movement further
accelerated by the movement of people for economic pursuits,
social and marriage relations. The cultural ties and non-existence
of visa system have created better environment for the conduction
of free trade between the two countries.
Indo-Nepal trade has its own importance for the economic
development of both these countries. Trade relation with India is
179
rather crucial to Nepal particularly due to her land-locked
geographic characteristics. Trade statistics show an increasing
trend of trade in both the exports and imports. However, it is
noteworthy that the trade balance is not in favour of Nepal. As
such, it does not present a convincing picture in the macro-
economic performance of Nepal. Both the countries have realized
the significance of bilateral trade. Trade with India is likely to play
further a key role in trade and industrial fronts in the future as
well. Trade and transit treaties held between the two countries are
continuously reflecting the fact. These treaties have increasingly
guided the trade direction, more specifically in the case of Nepal.
ECONOMIC LIBERALIZATION IN NEPAL
Nepal opened up its economy in the early 1990s with the
adoption of economic reform package. The reform measures have
since covered all sectors of the economy including trade and
investment, fiscal and monetary policies, financial and capital
markets and other economic and social sectors. The import
licensing system and quantitative restrictions were eliminated and
tariff rates and structure were reduced and rationalized to make
the trade sector competitive. The trade weighted nominal rate of
protection declined from about 90 per cent in the early 1980s to
about 31 per cent in 1994. Similarly, the average rate of protection
has declined from about 111 per cent in 1989 to 16 per cent in
1992. In a similar manner, the number of slabs subject to
protection fell from more than 100 in the 1980s to 5 in 1996.
Additional measures initiated to promote international trade
include the introduction of a bonded warehouse, duty-drawback
scheme, initiation of the multi-modal facility (dry port) and an
export-processing zone.
180
A new bilateral trade treaty signed with India in 1996
supported the trade reform program of Nepal. The treaty allows
Nepal to export manufactured products to India free of customs
duty and quantitative restrictions. Similarly, in order to improve
the environment for investment, the Industrial Enterprise act, 1992
and the Foreign Investment and Technology Transfer Act (1992)
wee enacted in line with the open, liberal and market-oriented
policy. These Acts have further improved investment incentives. No
license is required for the establishment, expansion and
modernization of industries except for a few related with defense,
public health and environment. In short, the environment was
made more conducive to larger inflows of foreign direct investment
(FDI).
Financial sector reforms have also been carried out to
support the trade and industrial reforms. Interest rates were
deregulated and joint-venture banks were allowed to open up.
Nepal also included full convertibility of the Nepalese rupees on the
current account. The overvalued Nepalese currency was also
corrected to improve export competitiveness of the country.
Share of India’s exports to Nepal in Indo-SAARC export trade
It is evident from the table 4.9 that Nepal emerged as the
third largest trading partner of India after Bangladesh and Sri
Lanka during the study period. Indo-Nepal relations in trade and
other related matters are governed by the bilateral treaties of trade
and transit and agreement for cooperation and also to control the
unauthorized trade. The treaty of transit was renewed on 5th
January, 1999.10 Its validity has been made automatically
extendable for a period of seven years at a time, unless either party
10
Reeta Mathur, Op. cit. p. 243.
181
give it to the other, a written notice, six months in advance, of its
intention to terminate the treaty, while the modalities of transit
routes, conditions of transit, customs arrangements as contained
in the protocol and memorandum to the treaty shall be reviewed
and modified every seven years, or earlier if warranted, to meet the
changing conditions before the automatic renewal and such
changes would be the integral part of the treaty.
Though, under the international conventions, Nepal, being a
landlocked country, India is obliged to provide only one transit
route to facilitate Nepal’s trade with third countries and 15 transit
routes have been provided through the Indian territory and more
such routes can be added to the list with mutual agreement.
India’s trade with Nepal has been substantial during the last
decade. According to table 4.9, India’s exports to Nepal during
2000-01 amounted to Rs. 643.4 crores, as compared to Rs. 377
crores in 1994-95, reflecting the compound growth rate of exports,
registered at 70.66 per cent in 2000-01 over 1994-95. But, when
the same period is considered in respect of overall exports to
SAARC nations, the exports were more than doubled with the
compound growth rate being registered at 130.93 per cent in 2000-
01 over 1994-95.
The period between 2001-02 and 2005-06 was observed to be
noteworthy as the annual growth rates of exports displayed a
remarkable performance with 58.96 in 2001-02, 65.78 per cent in
2002-03 and 81.39 per cent in 2003-04, which ultimately resulted
in the tremendous increase in compound growth rate of exports at
272.25 per cent in 2005-06 over 2001-02. (See table 4.9). On the
other hand, the compound growth rate of exports was registered at
182
154.20 per cent, in respect of Indo-SAARC export trade during the
same period.
Between 2006-07 and 2010-11 also, a better trend could be
observed with regard to exports in respect of Nepal. The compound
growth rate of exports was recorded at 131.24 per cent in 2010-11
over 2006-07 in respect of Nepal. When the Indo-SAARC trade was
considered during the same period, the compound growth rate of
exports was registered at 97.76 per cent in 2010-11 over 2006-07.
the present trend is encouraging and this can be further enlarged if
export potential to that country is further identified and tapped.
The per cent share of exports to Nepal as a proportion of
exports to SAARC countries was significant. The share of exports to
Nepal was 9.88 per cent in 1994-95. However, it sharply increased
to 10.55 per cent in 1997-98. As the annual growth rate of exports
in respect of Nepal was negative by 18.45 per cent in 1998-99, the
percent share was less with 7.29 per cent in 1998-99. Another
negative annual growth rate recorded in 2000-01 at 1.82 per cent
resulted in the less percentage share of exports at 7.30 per cent in
respect of Nepal. The highest percent share of exports was observed
at 18.43 per cent in 2008-09. Hence, it is observed that the share
of exports to Nepal as a proportion of over all exports to SAARC
had been impressive and this upward trend in percentage share is
visible through out the study period.
Share of India’s imports from Nepal in Indo-SAARC import
trade
According to table 4.10, the imports from Nepal amounted
Rs. 817.4 crores in 1999-2000 as compared to 114.9 in 1994-95,
reflecting a tremendous compound growth rate at 611.40 per cent
in 1999-00 over 1994-95. When we consider the Indo-SAARC
183
import trade during the same period, the compound growth rate of
imports was recorded at 210.45 per cent in 1999-2000 and 1994-
95.
As two consecutive negative annual growth rates had been
registered between 2000-01 and 2005-06, with 19.67 per cent in
2002-03, and 3.61 per cent in 2003-04, the compound growth rate
of imports was recorded just at 44.31 per cent in 2005-06 over
2000-01. On the other hand, there was a remarkable growth in
respect of Indo-SAARC trade with 194.03 per cent, being recorded
in 2005-06 over 2000-01.
Between 2006-07 and 2010-11, the compound growth rate,
recorded in respect of Indo-Nepal import trade was 56.72 per cent
in 2010-11 over 2006-07 with regard to Indo-SAARC import trade
during the same period, the compound growth rate of imports was
registered at 34.80 per cent in 2010-11 over 2006-07.
The share of imports from Nepal as a proportion of imports
from SAARC nations was very significant. The percent share of
imports from Nepal during 1994-95 was registered at 20.70 per
cent. The highest per cent share of imports in respect of Nepal was
recorded at 62.27 per cent in 2001-02 and the least per cent share
was registered at 19.16 per cent in 1995.96.
When we observe the balance of trade in respect of Nepal,
adverse balance of trade had been registered during the period
from 1998-99 to 2001-02 and the favourable balance of trade was
witnessed with rest of the period. (See table 4.11).
INDO-BHUTAN TRADE RELATION
The area of Bhutan is 46,500 sq. k.m. The capital city of
Bhutan is Thimpu. The population of Bhutan is 6, 72,425 and the
184
annual growth rate of population is 2.082 per cent with a density of
the population in 45 per sq. k.m.
ECONOMY
Bhutan’s economy, one of the world’s smallest and least
developed, is based on hydroelectricity, tourism, agriculture, and
forestry.
Bhutan’s tenth five-year plan (2008-2013) focuses on ways to
manage the country’s new-found wealth with special emphasis on
three development areas: rural, regional and private-sector. India
has pledged to support and plan and promised to double the
amount of aid given to Bhutan in the previous five-year plan.
January 2004, as a member of the South Asian Association
for Regional Cooperation (SAARC), Bhutan also joined the South
Asian Free Trade Agreement (SAFTA).
Bhutan hosted the SAARC summit in Thimphu in April
2010. In February 2004 Bhutan joined the Bangladesh, Indian,
Myanmar, Singapore, and Thailand Economic Cooperation Forum
(BIMSTEC). Bhutan has applied for membership in the World
Trade Organization and is in the process of developing clear legal
and regulatory systems designed to promote business development.
INDIA-BHUTAN BILATERAL RELATIONS
Diplomatic relations between India and Bhutan were
established in 1968 with the appointment of a resident
representative of India in Thimphu. Before this our relations with
Bhutan were looked after by our Political Officer in Sikkim. The
basic framework of India - Bhutan bilateral relations is the Treaty
of Friendship and Cooperation of 1949 between the two countries,
185
which was updated and signed during the visit to India of His
Majesty Jigme Khesar Namgyel Wangchuck in February 2007.
The updated India-Bhutan Treaty not only reflects the
contemporary nature of our relationship but also lays the
foundation for their future development in the 21st century. The
Treaty provides, amongst other things, for perpetual peace and
friendship, free trade and commerce, and equal justice to each
other’s citizens. India’s bilateral political relations with Bhutan
India’s have matured over the years and are characterized by close
trust and understanding and extensive cooperation in the field of
economic development, particularly in the mutually beneficial
sector of hydroelectric power.
Agreements/MOUs
India and Bhutan have signed many agreements and MOUs
during the last few decades. During the visit of His Majesty Jigme
Khesar Namgyel Wangchuck in December 2009, twelve (12)
MOUs/Agreements in areas of hydropower, IT, health/medicine,
narcotics, civil aviation, agriculture and environment were signed
A major step towards this was made when the 336 MW Indo-
Bhutan Friendship Project was commissioned at Chukha. This
hydropower-harnessing project constitutes 30 per cent of Bhutan’s
annual revenue and it’s export to India reached 75.2 per cent in
1998. Bhutan also enjoys 90 per cent of it’s trade with India and
will export more hydropower to India in the coming years.
SAARC
The Kingdom attaches great importance to SAARC. Ever
since the inception of SAARC, Bhutan has firmly supported and
promoted the activities, and worked towards making the South
186
Asian Region self-reliant. This is in consistent with its policy of
developing friendly relations with all the neighboring countries. It
has also displayed a keen interest in economic cooperation and
various peacemaking efforts in South Asia.
Reflecting growing congruence in their relationship, India
and Maldives today decided to intensify bilateral cooperation in
diverse fields including trade, commerce, security, combating
piracy and terrorism as well as enhancing people-to-people contact
GOI has issued notification allowing Bhutanese passengers duty
free access at Indian airports, as well as exempting exports to
Bhutan from any export bans in India on some essential items
subject to limits.
Economic Cooperation
Mutually beneficial economic inter-linkages between India
and Bhutan have been an important element in our bilateral
relations. India continues to be the largest trade and development
partner of Bhutan. Planned development efforts in Bhutan began
in the early 1960s. The first Five Year Plan (FYP) of Bhutan was
launched in 1961. Since then, India has been extending financial
assistance to Bhutan’s FYPs. So far, nine Five Year Plans of
Bhutan have been completed.
Some of the major projects in Bhutan carried out with Indian
assistance in the past include 1020 MW Tala Hydroelectric Project,
336 MW Chukha Hydroelectric Project, 60 MW Kurichhu
Hydroelectric Project, Penden Cement Plant, Paro Airport, Bhutan
Broadcasting Station, Major Highways, Electricity Transmission
and Distribution System, Indo-Bhutan Microwave Link,
Exploration of Mineral Resources, and Survey and Mapping.
187
Trade with India
India is not only Bhutan’s main development partner but
also its leading trade partner. A free trade regime exists between
India and Bhutan. The India-Bhutan Trade and Commerce
Agreement which expired in March 2005, has been renewed for a
period of 10 years. Currently, the major items of exports from
Bhutan to India are electricity (from Tala, Chikha and Kurichhu
Hydroelectric Project), base metals and articles, minerals, vegetable
fat and oils, alcoholic beverages, chemicals, cement, timber and
wood products, cardamom, fruit products, potatoes, oranges and
apples, raw silk, spices, processed food and animal products,
chemicals, wood, plastic and rubber. The Agreement on Trade and
Commerce also provides for duty free transit of Bhutanese
merchandise for trade with third countries. Sixteen exit/entry
points in India identified in the Protocol for Bhutan’s third country
trade are: Jaigaon, Chamurchi, Ulta Pani, Hathisar (Gelephu),
Darranga, Kolkata, Haldia, Dhubri, Raxaul, Panitanki,
Changrabandh, Phulbari, Dawki, New Delhi, Chennai and Mumbai.
Of these, Kolkata, Haldia, Mumbai and Kolkata are the air routes
and Raxaul is the rail route. The others are the designated road
routes.
India is not only Bhutan’s main development partner but
also its largest trade partner. During 2010, imports from India
were of the order of Rs. 2930 crores and constituted 75% of
Bhutan’s total imports. Bhutan’s exports to India in 2010
amounted to Rs. 2600 crores and constituted 90% of its total
exports. Total trade in 2010 grew by about 26% from 2009.
Trade Talks
188
The India Bhutan Bilateral Trade Talks were held in New Delhi on 18-19 August 2011∗.
At the request of RGOB, Gol has agreed to the use of Dalu
LCS (land custom station) and Ghasuapara LCS (both in
Meghalaya) as additional exit/entry points for Bhutan’s trade with
Bangladesh. Ghusuapara LCS will be used only as exit point for
Bhutan for the present till the necessary infrastructure in place for
it to be used as entry point also. In addition, 4 entry/exit points for
India-Bhutan bilateral trade viz., Upper Khogla (West Bengal),
Dalmore or Birpara (West Bengal). Bokajuli (Assam) and Rangapani
(Assam) would also be notified by government of India.
Share of India’s exports to Bhutan in Indo-SAARC export trade
There are bilateral trade agreements of which provides for
free trade and commerce, between India and Bhutan. Commercial
transactions are carried out in Indian rupees and Bhutanese
regulations. India provides unhindered transit facilities to
landlocked Bhutan to facilitate her trade with third countries.
It is evident from table 4.12 that India’s exports to Bhutan
were very insignificant and less substantial. According to table
4.12, India’s exports to Bhutan which amounted Rs. 34.80 crores
in 1994-95, went up to Rs. 36.20 contributing the least compound
growth rate at 4.02 per cent in 2001-02 over 1994-95. On the other
hand there was a remarkable growth in respect of India’s exports to
SAARC, with the compound growth rate of exports being recorded
at 153.26 per cent in 2001-02 over 1994-95.
* The Bhutanese delegation was led by Mr. Sonam P. Wangdi, Director General, Department of Trade
and included representatives from Ministries of Economic Affairs, Finance and Foreign Affairs. Indian delegation was led by Joint Secretary, Ministry of Commerce and included representatives from Ministries of Commerce, External Affairs and Finance.
189
Between 2002-03 and 2006-07 also, not much growth was
noticed in respect of India’s exports to Bhutan. The compound
growth rate of exports was recorded just at 37.7 per cent in 2006-
07 over 2003-04. But, in respect of Indo-SAARC trade, similar
trend had been repeated with exports being doubled, contributing
the compound growth by 122.04 per cent in 2006-07 over 2003-04.
The trends in exports, which were observed during the two
earlier phases, in respect of Bhutan, had not been repeated
between 2007-08 and 2010-11. The items which India exported to
Bhutan during this period were more than doubled with the
compound growth rate being recorded at 104.73 per cent in 2010-
11 over 2007-08. Similar change in respect of Indo-SAARC trade
had been witnessed during the same period. The remarkable trends
n exports, observed in respect of Indo-SAARC trade during the
earlier two phases had not been repeated in this last phase of the
study period. The compound growth rate of exports, recorded in
respect of Indo-SAARC trade was 49.52 per cent in 2010-11 over
2007-08.
When we considered the percentage share of exports to
Bhutan in Indo-SAARC export trade, the following facts have been
noticed.
According to table 4.12, India’s exports to Bhutan, as a
proportion of exports to SAARC nations was less than 1 per cent
during period from 1994-95 to 2001-02 except 1996-97.
From 2002-03 onwards, there was a slight increase in
percentage share, in respect of Indo-SAARC export trade. Highest
percentage of share was recorded at 2.16 per cent in 2003-04.
190
Share of India’s imports from Bhutan in Indo-SAARC import
trade
It is evident from table 4.13 that India’s import trade from
Bhutan also was insignificant. India’s imports from Bhutan during
1999-2000 amounted Rs. 78.1 crores as compared to 57.4 crores
in 1994-95, reflecting a compound growth rate at 36.06 per cent in
1999-2000 over 1994-95. On the other hand, there was a
remarkable growth, in respect of Indo-SAARC import trade with the
compound growth rate of imports being recorded at 210.45 per
cent in 1999-2000 over 1994-95.
Between 2000-01 and 2005-06, there was a tremendous
growth, in respect of Indo-Bhutan import trade, with the
compound growth rate of imports being registered at 307.67 per
cent in 2005-06 over 2000-01. Similar trend can be noticed in
respect of Indo-SAARC import trade with the compound growth
rate of imports being recorded at 194.03 per cent in 2005-06 over
2000-01.
The export trend which was registered in the earlier phase
with both Indo-Bhutan import trade and Indo-SAARC import trade
had not been observed during the last phase of the study period
i.e., 2006-07 act 2010-11. The compound growth rate of imports,
recorded in respect of Indo-Bhutan import trade was at 43.32,
while that of the compound growth rate, recorded in respect of
Indo-SAARC import trade was at 34.80 per cent in 2010-11 over
2006-07.
The share of imports from Bhutan as a proportion of overall
imports from SAARC was also less substantial. The percentage
share of imports in respect of Bhutan was recorded at 10.34 per
cent in 1994-95. However, this percentage share went up to 13.97
191
per cent in1996-97; but declined to 5.74 per cent in 1997-98 and
further decreased to at 1.32 per cent in 1998-99. The percentage
share of imports, recorded in respect of Bhutan in 2010-11 was at
9.97 per cent.
Balance of trade with Bhutan
It is evident from the table 4.14 that the trade balance
between India and Bhutan was not in favour of India as India’s
imports from Bhutan outweighed the exports to that country.
Excepting the year 1998-99 as the years from 2002 to 2005, India
had always trade deficit with Bhutan.
INDO-PAKISTAN TRADE
The area of Pakistan is 803.943 sq. k.m. almost twice the
size of California. The capital city of Pakistan is Islamabad. The
other cities are Ravalpindi, Karachi, Lahore, Faisalabad and
Hyderabad. The population of Pakistan is 16,77,62,040 with an
annual growth rate of 1.81 per cent.
Economy
Pakistan had a GDP growth rate of 2.7 per cent. Its Per
capita GDP was $2600 by the end of 2009. Pakistan has natural
resources like arable land, natural gas, substantial hydropower
potential, coal, iron ore, copper, salt, limestone. Its agriculture:
products-are wheat, cotton, rice, sugarcane, eggs, fruits,
vegetables, milk, beef, and mutton.
Industrial sector comprises and apparel, food processing,
pharmaceuticals, construction materials, shrimp, fertilizer, and
paper products. Pakistan foreign trade amounted to $17.87 billion.
at the end of 2009. Textiles (garments, bed linen, cotton cloth, and
192
yarn), rice, leather goods, sports goods, carpets, rugs, chemicals
and manufactures are the major export items. Major partners are
U.S. 16%, United Arab Emirates 11.7%, Afghanistan 8.6% U.K.
4.5%, and China 4.2%. Imports are worth arround-$28.31 billion.
Major import items are petroleum, petroleum products, machinery,
plastics, paper and paper board, transportation equipment, edible
oils, pulses, iron and steel, tea. Major partners in Pakistan imports
are China 14.1%, Saudi Arabia 12%, U.A.E. 11.2%, Kuwait 5.4%,
India 4.8%, U.S. 4.7%, and Malaysia 4.1%.
ECONOMY
The World Bank considers Pakistan a low-income country.
GDP is around $166 billion at the official exchange rate. The
population numbered some 167 million in 2008 with a 1.81%
growth rate. Not more than 55.0% of adults are literate, and life
expectancy is about 64 years. In 2008-2009, the GDP growth rate
was 3.7%, and unemployment was estimated at 14%. Year-over-
year consumer price inflation averaged 13.6% in 2009. Main
inflation drivers include food and utility prices. Low levels of
spending in the social services and high population growth have
contributed to persistent poverty and unequal income distribution.
Pakistan’s extreme poverty and underdevelopment are key
concerns, especially in rural areas. The country’s economy remains
vulnerable to internal and external shocks due to internal security
concerns and the global financial crises.
Industry
Pakistan’s manufacturing sector accounts for about 25% of
GDP. Cotton textile production and apparel manufacturing are
Pakistan’s largest industries, accounting for about 51.4% of total
exports. Other major industries include food processing, beverages,
193
construction materials, clothing, and paper products.
Manufacturing sector growth has slowed in the recent years due to
energy shortages and capacity constrains. However, the sector is
forecast to grow 5.5% for FY 2010. Despite government efforts to
privatize large-scale units, the public sector continues to account
for a significant proportion of industry. The government seeks to
diversify the country’s industrial base and bolster export
industries. Net foreign investment in Pakistani industries is only
0.5% of GDP, Pakistan’s search for additional foreign direct
investment has been hampered by concerns about the security
situation, domestic and regional political uncertainties, and
questions about judicial transparency.
Foreign Trade
Weak world demand for its exports and domestic political
uncertainty has contributed to Pakistan’s high trade deficits. In
major imports, which fell to $28.4 billion in 2009, include
petroleum products, edible oil, wheat, chemicals, fertilizer, capital
goods, industrial raw materials, and consumer products. Energy
imports account for nearly 30% of Pakistan’s imports, and the total
gap between electricity supply and demand in Pakistan is over
4,800 megawatts (MW). The ongoing energy crisis and security
concerns, together with a decline in global demand, have hampered
Pakistan’s textile-reliant export base. Pakistan’s exports continue
to be dominated by cotton textiles and apparel, despite government
diversification efforts.
FOREIGN RELATIONS
After September 11, 2001, Pakistan’s prominence in the
international community increased significantly, as it pledged its
alliance with the U.S. in countering terrorism efforts and made a
194
commitment to eliminate terrorist camps on its territory.
Historically, Pakistan has had difficult and volatile relations with
India, long-standing close relations with China, extensive security
and economic interests in the Persian Gulf, and wide-ranging
bilateral relations with the United States and other Western
countries. It expresses a strong desire for a stable Afghanistan.
Trade cooperation between India and Pakistan was a direct
outcome of the partition of Indian sub-continent on August 14,
1947. At that time, India and Pakistan were highly dependent on
each other for trade. Thereafter, both resorted to deliberate
measures to minimize their trade dependence on each other.
India’s share in Pakistan’s global exports and imports was 23.6 per
cent and 50.6 per cent, respectively, in 1948-49. These shares
went down to 1.3 per cent and 0.06 per cent in 1975.76. Similarly,
Pakistan’s share in India’s global exports and imports was 2.2 per
cent and 1.1 per cent respectively, in 1951-52. These shares went
down to 0.02 per cent and 0.4 per cent, in 1975-76, and 0.7 per
cent and 0.13 per cent in 2005-06. This shows that the trade
between these two neighboring countries has been much below the
potential.
Economic Structure of India and Pakistan
Before we discuss the potentialities of trade between India
and Pakistan, it would be better to have a glance at the economic
structure of India and Pakistan. India and Pakistan are the
neighboring and developing countries of the SAARC region. India is
comparatively larger in terms of her size, population, GDP etc.,
Since partition, relations between Pakistan and India have
been characterized by rivalry and suspicion. Although many issues
195
divide the two countries, the most sensitive one since
independence has been the status of Kashmir.∗∗∗∗
In fact, the period between 1965 and 1971 witnessed two
wars between India and Pakistan. Immediately after the war,
Pakistan imposed official embargo on her trade with India. The
trade relations between the two neighboring countries remained
suspended for nine years and created problems for both the
countries. Both were forced to import many items from the world
market at much higher prices. The same could have been imported
from each other at much lower prices involving substantially lower
transport and transshipment costs.
In July 1972, following the 1971 Indo-Pakistan war, which resulted
in the creation of an independent Bangladesh, President Zulfiqar
Ali Bhutto and the then Indian Prime Minister Indira Gandhi met
in the hill station of Shimla and agreed to a line of control in
Kashmir. Both leaders endorsed the principle of settlement of
bilateral disputes through peaceful means. In 1974, Pakistan and
India agreed to resume postal and telecommunications linkages
and to enact measures to facilitate travel. Trade and diplomatic
relations were restored in 1976 after a hiatus of 5 years.
The resumption of trade relations between them took place with
the signing of bilateral trade agreement on January 23, 1975. But
∗∗∗∗ At the time of partition, the princely state of Kashmir, though ruled by a Hindu king, had an
overwhelmingly Muslim population. When the king hesitated in acceding to either Pakistan or India in 1947, some of his Muslim subjects revolted in favor of joining Pakistan. In
exchange for military assistance in containing the revolt, the Kashmir ruler offered his allegiance to India. Indian troops occupied the eastern portion of Kashmir, including its capital, while the western part came under Pakistani control India submitted this dispute to the United Nations on January 1, 1948. One year later, the UN arranged a cease-fire along a line dividing Kashmir but leaving the northern end of the line not demarcated and the Valley of Kashmir (with the majority of the population) under Indian control. India and Pakistan agreed to a UN-supervised plebiscite to determine the State’s future. This plebiscite has not occurred because the main precondition, withdrawal of both nations’ forces from Kashmir, has failed to take place. Pakistan has since fought three wars with India on Kashmir issue, in 1948, 1965, and the Kargil conflict in 1999.
196
the flow of trade was restricted to government levels. This trade
agreement expired on January 22, 1978 and thereafter trade has
continued without any agreement. In July 1982, Pakistan declared
a list of 40 items in which private sectors of the two countries
could trade11. The mutual trade has grown significantly since
1989, when Pakistan expanded the list of approved imports from
India to 571 items, and further enhanced it to 600 items on July
17, 2000, and 1075 items on November 3, 2006. But this list is
just 10 per cent of the total number of classified tariff lines, and
does not include items like consumer durables, computer software,
textiles machinery, automobiles, two wheelers, cars etc.,
Share of India’s exports to Pakistan in Indo-SAARC trade
The role of external sector, mainly of trade, assumes
significance in the development of India and Pakistan economies
since the partition in 1947. Foreign trade registered a phenomenal
increase in India and Pakistan during 1950-51 to 2010-11.
India’s trade with Pakistan is constrained by the
discriminatory policy adopted by Pakistan against imports from
India. While we accord MFN treatment to imports from Pakistan,
they allow their private sector to import only selected items from
India. Despite bilateral discussions and our diplomatic demarches
in this regard, Pakistan is yet to allow its trade with India on free
trade and MFN basis.
According to table 4.15, India’s exports to Pakistan during
1999-2000, amounted Rs. 402.8 crores, as compared to Rs. 179.70
crores in 1994-95, reflecting a compound growth rate at 124.15 per
cent in 1999-2000 over 1994-95. On the other hand, the
11 Ranjit Singh Ghuman, Indo-Pakistan Trade Cooperation and Saarc, Peace and Democracy in
South Saia, Volume 2, Nos.1& 2 p.72
197
compound growth rate of exports recorded in respect of Indo-
SAARC export trade was at 58.40 per cent in 1999-2000 over
1994-95.
Between 2000-01 and 2005-06, remarkable growth had been
witnessed in respect of both Indo-Pakistan export trade and Indo-
SAARC trade. The compound growth rate of exports, recorded in
respect of Indo-Pak export trade was at 257.53 per cent in 2005-06
over 2000-01, while it was registered at 178.79 per cent, in respect
of Indo-SAARC trade during the same period.
Between 2006-07 and 2010-11, the compound growth rate of
exports, recorded in respect of Indo-SAARC export trade was higher
than the compound growth rate of exports recorded, in respect of
Indo-Pak export trade. The compound growth rate of exports,
recorded in respect of Indo-Pak export trade was at 72.21 per cent,
while it was at 97.70 per cent in 2010-11 over 2006-07, in respect
of Indo-SAARC export trade.
With regard to India’s share of exports to Pakistan in Indo-
SAARC export trade, it was observed that the percentage share was
not only less substantial but also insignificant. The percentage
share of exports stood well below 10 per cent till 2003-04.
Thereafter, the percentage share exhibited an upward trend. The
highest percentage share was recorded at 20.86 per cent in 2006-
07.
Share of India’s imports from Pakistan in Indo-SAARC import
trade.
The imports from Pakistan had exhibited a fluctuating trend
through out the study period. According to table 4.16, the imports
from Pakistan during 1999-2000 amounted Rs. 295.6 crores as
198
compared to 165.6 crores in 1994-95, contributing a compound
growth rate at 78.50 per cent in 1999-2000 over 1994-95.
On the other hand, the compound growth rate of exports was
very high at 210.45 per cent in respect of Indo-Pak import trade
during the same period.
The period between 2000-01 and 2005-06, was very
encouraging for exports in respect of Indo-Pak import trade as well
as Indo-SAARC import trade. The compound growth rate of
imports, recorded in respect of Indo-Pak import trade was at
171.79 per cent, while that of the compound growth rate, recorded
in respect of Indo-SAARC trade was at 194.03 per cent in 2005-06
over 2000-01.
The rate at which, the compound growth, recorded in respect
of Indo-Pak import trade, was very low at 3.83 per cent in 2010-11
over 2006-07. But, it was a little bit batter in respect of Indo-
SAARC import trade, with the compound growth rate being
recorded at 34.80 per cent in 2010-11 over 2006-07.
India’s balance of trade with Pakistan
India’s exports to Pakistan were higher as compared to her
imports. The balance of trade was unfavorable to India during
1979-93, but it became favorable during 1993-2006, except
1998=99, when India imported a large quantity of sugar from
Pakistan.
It is evident from the table 4.17 that the balance of trade
with Pakistan had been favorable to India through out the study
period except 1998-99 with the adverse balance of trade being
registered at Rs. 462.8 crores. Balance of trade had exhibited an
upward trend from 2002-03 onwards.
199
Gains from mutual trade to India and Pakistan
It is gainful to India and Pakistan to promote mutual trade
as both are neighboring countries and can have trade by land
route, which would save a lot in terms of transportation and
transshipment costs. At present, major portion of trade between
India and Pakistan is through the ports of Karachi and Mumbai.
From economic point of view, it is illogical to confine trade to ports
only, when a large common land border is shared by both the
countries. Land route is cheaper, faster and safe. In fact, there is a
need to open up more trade traffic by Wagha/Attari and
Hussainiwala check posts. Besides, there are other land trade
routes in Kashmir, Rajasthan and Gujarat. All these trade routes
were operational on the eve of partition. There is an immediate
need to revive and strengthen these land trade routes. The
infrastructure, including the customs clearance, needs to be
strengthened at all border check posts in order to promote trade. It
would also help a smooth and speedy trade of the agricultural and
perishable commodities from both sides of the border. It would
greatly facilitate the movement of high bulk, low value cargo.
Pakistan’s allowing imports of onions, garlic, potatoes, tomatoes,
meat and livestock through Wagha border in July 2005 is a
welcome step in this regard.
India has a cost advantage over Pakistan in engineering
goods, bicycles, agriculture products, tyres, textiles machinery,
plastics, transport equipments, tea, leather goods, etc., The
difference in the price of Suzuki Mehran 800/Maruti 800 at Lahore
(Pakistan) and Amritsar (India) is about Indian Rs one lac. Pakistan
imports about 8 lakh tyres and 45 lakh ton diesel per annum,
which could be had from India. Pakistan can gain from the import
of agricultural produce like wheat, spices, tea and other edibles to
200
meet the production shortfalls at competitive prices. Further the
current price of bicycles in Pakistan is 20 per cent higher than that
in Ludhiana (Indian Punjab). During 2004, Paksitan was the fifth
largest tea importer in the world after USA, U.K., Russian fed., and
Japan, and India was the fourth largest tea exporter in the world
after Sri Lanka, Kenya and China. But Pakistan has never
imported more than 4.5 per cent of its total tea requirements from
India. Pakistan imports tea from Kenya and Rawanda at high cost.
According to Indian Tea Association, India can meet one-fifth tea
requirements of Pakistan. But Pakistan imposes 49 per cent excess
duty on the import of Indian tea, in addition to 20 per cent basic
duty. The other items of cost advantageous to Pakistan from India
are iron ores and sewing machines. India can also benefit from
Pakistan by importing sugar refined, almonds, etc., Pakistan has
excess capacity of 3000 MW electricity which can be easily given to
northern Indian states if the required arrangements are done.
Prices of mutual trade items between the two countries are also
competitive.
It is estimated that the unofficial trade between India and
Pakistan stands at more than US $ 2 bn annually. Much of the
trade between them is in respect of banned items like tyres,
medicines, cosmetics, viscose fibers, textile machinery, chemicals,
ayurvedic medicines, cashew nuts, etc., It has been routed through
third country like Afghanistan. Dubai, Hong Kong, Singapore and
Gulf States. This tortuous route costs both India and Paksitan
dearly in terms of foreign exchange outflows, as well as third party
trading commissions. The lack of land route is also the reason for
unofficial trade. It appears from the high volume of unofficial trade
that there exists tremendous trade potential between the two
countries. Though there is no restriction on the import of goods
201
from Pakistan to India, Pakistan has placed several restrictions on
imports from India.
It the prices of various items which they have been importing
from each other, are either competitive or lower than the world
prices Rock salt, surgical instruments, oil cake, ayurvedic and
unani herbs, foreign cotton, sugar, degressed wool, denim, etc.,
were the major items in which India gained from her imports from
Pakistan during 2004-05. India had net actual gains worth US$
486.3 lakhs for imports from Pakistan during this period. The
major items of India’s import from Pakistan were cane moles of
sugar, and dates fresh/soft/hard, sugar moles, oil cake, foreign
cotton, naphtha, solvent crude, raisins and sultanas, etc.,
Iron ores, cutch extracts, bidi leaves, vegetable seeds, tea
black, ginger, ayurvedic and unani herbs, polypropylene, etc., were
the major items in which Pakistan gained from her imports from
India during 2004-05. Pakistan had net actual gains worth US$.
India, Pakistan to hold talks for trade in petroleum products
India and Pakistan have agreed to constitute a joint group of
experts regarding trade in petroleum products. Besides, the two
countries have come to a broad under-standing on possible grid
connectivity between Amritsar and Lahore to enable trade of up to
500 MW of power.
Both sides also agreed to continue efforts to remove
impediments to bilateral investments. They also agreed to push for
further liberalization of the business visa arrangements during
2012. India also welcomed the decision taken by Pakistan to
accord Most Favoured Nation (MFN) status to India and to the
mandate given for full normalization of the bilateral trade relations.
202
NEW TRADE REGIME12
On developing infrastructure for trade through the Attari-
Wagah land route, they agreed that all infrastructure construction
would be completed and trade be made fully operational by
February, 2012. This time-line would coincide with Pakistan’s
announcement of a small negative list of items.
All items other than those on the negative list shall be freely
exportable from India to Pakistan. The new trading regime will be
applicable to all trade through the land route after the
infrastructure at Attari-Wagah is commissioned.
It was also agreed that software body Nasscom will
coordinate with Pakistan Software Export Development Board to
facilitate a road show for Pakistani IT companies at Bangalore,
Hyderabad and other Indian IT hubs in February 2012.
India welcomes Pakistan move to shift to negative list regime
India has welcomed the Pakistan Government’s decision to
ease trade with India by shifting from a Positive List Regime to a
small Negative List for trade with India. This decision will mark a
dramatic shift in the line that can be traded, as it would mean that
now almost 90 per cent items can be traded with Pakistan as
opposed to 17 per cent earlier.13
But the latest move will permit India to export around 6,800
items to Pakistan. At present, Pakistan’s positive list allows imports
of only about 1,950 items from India.
12 ---India, Pak to hold talks for trade in petroleum products, Business Line, Nov.16, 2011. 13
---India welcomes Pakistan move to shift to negative list regime, Business Line, March 1, 2012
203
This development reaffirms the commitment of both
Governments for trade normalization as per the roadmap drawn
during the visit of Pakistan Commerce, Minister during 2011.
There is reiteration of commitment that the negative list will be
phased out by the end of 2012. This move will open massive
opportunities for Indian exports to Pakistan
Direct exports from India to Pakistan will cut down the cost
and will benefit consumers in Pakistan, adding that the move will
gradually pave the way for Most Favored Nation status to India.
Dismantling will increase official trade between the two
countries to cross $6 billion by 2014. Direct trade between India
and Pakistan constitutes less than one per cent of their respective
global trades.
Trade impasse can be overcome
Border disputes or political bickering need not be deterrents
for the promotion of trade relations between the countries if one
takes a clue from the burgeoning commercial relationship between
China and Taiwan∗.
The same holds for Indo-Pakistan trade relations, which
cannot plausibly ever resolve issues relating to Kashmir or
terrorism. What they can do, nevertheless, is to keep these
disputes in a separate ‘we-shall-agree-to-disagree’ box, and go
ahead doing business as the Chinese and the Taiwanese today are:
Annual bilateral trade between the two has crossed $150 billion,
∗∗∗∗ Trade has the potential for bringing people together and creating the mutual economic
benefits flowing from such engagements. The best example here is the commercial pact signed between China and Taiwan in June 2010, which, by no means, ends disputes over the latter’s independent-nation claims. But by opening up its huge market to the product of farmers and fishermen in Taiwan, China has certainly earned more goodwill than through an earlier muscular foreign policy that bordered on the belligerent.
204
compared with the paltry $2.7 billion official figure for India and
Pakistan in 2010-11.14
It is in this light that one must appreciate the conscious
steps, especially since 2011, taken by India and Pakistan to
‘normalize’ trade with one another. Pakistan, on its part, has
decided to accord Most Favored Nation (MFN) status to India,
Technically, it means treating imports from India on a par with
that from other countries, Pakistan currently maintains a ‘positive
list’ of 1,945, goods that alone are importable from India. This is to
be replaced by a ‘negative list’ of some 700 items, which, too, is
supposed to be phased out as part of the plan to grant MFN status
to India by end-2012.15
India should, in any case, keep its side of the bargain by
addressing Pakistani concerns over non-tariff barriers on cement,
textiles, surgical instruments and leather imports. There is no
reason for India to not iron out wrinkles in its product certification
and testing standard procedures, notwithstanding Pakistani
intransigence on meeting trade commitments under the World
Trade Organization (WTO).
On the contrary, it lends more credibility to India’s position
at various international forums. Denial of MFN status is something
that India can easily raise at the WTO’s Dispute Settlement Body.
By not doing so, India has already scored a moral victory-a fact
acknowledge even by some Pakistani commentators.
Some heartening developments:
India’s trade sops to Pakistan: In a move to help promote
trade and bilateral ties with Pakistan, Indian government is set to 14 Editorial, Commerce with Pakistan, Business Line,, Feb.17, 2012 15
Loc.cit.
205
slash 30% items or 254 products from the sensitive list under the
SAFTA.16
The demand for reciprocity on MFN has been pending since
1996. Promising to grant MFN by the end of the year 2012,
Pakistan has notified a negative list, where trade will not be
permitted, instead of the earlier system of a small positive list of
products that reduced trade to a trickle between the two
neighbors17.India has decided to unilaterally grant preferential
access to an additional 30 per cent items from Pakistan to help
speed up improvement in trade ties following a breakthrough
achieved in May 2011.
India desires a quick progress on expanding the list of
products from Pakistan that can be traded through the land route,
especially the Attari-Wagah border. The gate will have the capacity
to handle about 600 trucks a day and is expected to increase trade
from the present $2.7 billion (Rs 13,880 crores). The opening of
the new gate is expected to reduce processing time, paving the way
for enhanced people-to-people contact and expansions of trade bet-
ween the two countries. At present Pakistan allows only 137 items
to be imported from India through the land route out of around
6,000 tradable items.18
INDO-MALDIVES TRADE
The area of Maldives is 298 sq. k.m. The capital city of
Maldives is Male. Here, the climate is hot and humid. The
population of Maldives is 3.14,000. The growth rate is 1.66 per
16
Sidhartha & Rajeev, India to offer fresh trade sops to Pakistan to strengthen ties, Times of India,
August 18,2012. 17
Loc.cit. 18 Asit Ranjan Mishra, Pakistan may soon free up trade via land route with India, Mint, Sep.4,
2012.
206
cent. The GDP is $1.48 billion and the growth rate is 4.8 per cent.
The per capita GDP is around $4770 by the end of 2009.
Over the years, the Maldives had received economic
assistance from multilateral development organizations, including
the UN Development Program (UNDP), Asian Development Bank,
and the World Bank. Individual donors-including Japan, India,
Australia, and European and Arab countries (including Islamic
Development Bank and the Kuwaiti Fund)-also have contributed.
In a bid to promote exports, the U.S. Government restored the
Generalized System of Preferences (GSP) trade program to the
Maldives in December 2009. The United States seeks to provide
various other assistance efforts to defend against climate change,
prevent drug use, and enhance U.S. investment. The Maldives
became a member of the International Labor Organization in 2009.
Diversifying beyond tourism and fishing, reforming public
finance, and increasing employment are the major challenges
facing the government. Over the longer term Maldivian authorities
worry about the impact of erosion and possible global warming on
their low-lying country.
Tourism dominant economy
In recent years, Maldives has successfully marketed its
natural assets for tourism like beautiful picturesque, unpolluted
beaches on small coral islands, diving in blue waters abundant
with tropical fish, and glorious sunsets. Tourism now brings in
about $600 million a year. Tourism and related services
contributed 29% of GDP in 2010. But its indirect contribution is
much higher. As a result, tourism is the catalyst for growth. Since
the first resort was established in 1972, more than 95 islands have
been developed, with a total capacity of some 23,600 beds.
207
Maldives has embarked on an ambitious tourism expansion plan;
several resorts are under construction.
Fishing: This sector employs about 11% of the labor force. The
fisheries industry, including fish processing, traditionally
contributes about 7% of GDP. Due to a drastic drop in the fish
catch, the industry’s contribution to GDP has declined in the
recent years it was only about 4% in 2008 and 3% in 2009. More
than 40% of fish production is exported, largely to Sri Lanka,
Japan, Hong Kong, Thailand, and the European Union. Ninety per
cent of all marine product exports comprises fresh, chilled, frozen,
dried, salted, and canned exports.
Sectoral Contributions
Agriculture: Poor soil and scarce arable land have historically
limited agriculture of a few subsistence crops, such as coconut,
banana, breadfruit, papayas, mangoes, taro, betel, chilies, sweet
potatoes, and onions. Almost all food, including staples, has to be
imported. Agriculture provides about 2.0% of GDP.
Manufacturing: The manufacturing sector provides less than 7%
of GDP. Traditional industry consists of boat building and
handicrafts, while modern industry is limited to a few tuna
canneries, a bottling plant, and a few enterprises in the capital
producing PVC pipe, soap, furniture, and food products.
Thus it is clear that tourism and fishing form the backbone
of the Maldivian economy. More than 700,000 tourists visit
annually. Fishing remains an important part of economy as well.
The Maldivian economy made a remarkable recovery, with a
rebound in tourism and post-tsunami reconstruction.
208
The Maldives had a merchandise trade deficit of under $300
million until 2003. Since then the trade deficit has reached an
unprecedented $780 millions in 2010. The balance of payments
recorded a surplus of about $50 million. Tourism was expected to
continue to grow in 2011.
Maldives Relations with India
India enjoys a considerable influence over Maldives’ foreign
policy and provides extensive security co-operation especially after
the Operation Cactus in 1998 during which India repelled Tamil
Mercenaries who invaded the country. As founder member in 1985
of the South Asian association for Regional Cooperation SAARC,
the Maldives has taken the lead in calling for a South Asian Free
Trade Agreement, the formulation of a Social Charter, the initiation
of informal political consultations in SAARC frums, the lobbying for
greater action on environmental issues, the proposal of numerous
human rights measures such as the regional convention on child
rights and for setting up a SAARC Human Rights Resource Centre.
The Maldives is also an advocate of greater international profile for
SAARC such as through formulating common positions at the UN.
India has started the process to bring the island country into
India’s security grid. The move comes after the moderate Islamic
nation approached New Delhi in Jan 2012 over fears that one of its
island resorts could be taken over by terrorists given its lack of
military assets and surveillance capabilities. India has also agreed
for the following things.
• India will permanently base two helicopters in the country to
enhance its surveillance capabilities and ability to respond
swiftly to threats.
209
• Maldives has coastal radars on only two of its 26 atolls. India
will help set up radar on all 26 for seamless coverage of
approaching vessels and aircraft.
• The coastal radar chain in Maldives will be networked with
the Indian coastal radar system. India has already
undertaken a project to install radars along its entire
coastline. The radar chains of the two countries will be
interlinked and a central room in India’s Coastal Command
will get a seamless radar picture.
• The Indian Coast Guard (ICG) will carry out regular Dornier
sorties over the island nation to look out for suspicious
movements or vessels. The Southern Naval Command will
overlook the inclusion of Maldives into the Indian security
grid.
• Military teams from Maldives will visit the tri-services
Andaman Nicobar Command (ANC) to observe how India
manages security and surveillance of the critical island
chain.
Share of India’s exports to Maldives in Indo-SAARC export
trade
Indo-Maldives trade is regulated in terms of bilateral trade
agreement signed in 1981. It is evident from the table 4.18 that
India’s exports to Maldives have been less substantial through out
the study period.
According to table 4.18, India’s exports to Maldives during
1999-2000 amounted to Rs. 31.60 crores as compared to Rs. 48.30
crores in 1994-95, reflecting a negative compound growth rate of
exports at 34.57 per cent in 1999-2000 over 1994-95. On the other
210
hand India’s exports to SAARC countries registered a positive
compound growth of exports during the same period with 58.40 per
cent in 1999-2000 over 1994-95.
Owing to a tremendous annual growth rate of exports
recorded in respect of Maldives at 255.69 per cent in 2000-01 over
the previous year a positive compound growth rate was registered
between 2000-01 and 2004-05. A compound growth rate of exports
had been recorded at 90.30 per cent in 2004-05 over 2000-01.
India’s export trade in respect of SAARC also had been encouraging
during the same period with the compound growth rate of exports
being recorded at 126.48 per cent in 2004-05 over 2000-01.
Similar trend had been repeated in respect of Indo-SAARC trade
during the period 2005-06 and 2010-11 with the compound growth
rate of exports registered at 135.71 per cent in 2010-11 over 2005-
06 as against the compound growth rate of exports recorded in
respect of Indo-Maldives export trade, at 61.76 per cent in 2010-11
over 2005-06.
When we considered the percentage share of exports to
Maldives in Indo-SAARC export trade, it was very insignificant.
This percentage share of exports was very high at 1.52 in 2008-09,
whereas it was recorded least at 0.52 per cent in 1999-2000.
Share of India’s imports from Maldives in Indo-SAARC import
trade
It was observed from table 4.19 that the export trade with
Maldives was very insignificant period except 2010-11, which
recorded a percentage share at 1.57 per cent.
According to table 4.19, India’s imports from Maldives during
1999-2000 amounted to Rs. 1.4 crores as compared Rs. 0.7 crores
211
in 1994-95, contributing the compound growth rate of exports at
142.85 per cent. On the other hand, the compound growth rate of
imports, recorded in respect of Indo-SAARC import trade, during
the same period was at 210.45 per cent in 1999-2000 over 1994-
95.
Between 2000-01 and 2004-05, the compound growth rate of
imports, recorded in respect of Indo-Maldives import trade was at
200 per cent in 2004-05 over 2000-01, whereas it was at 100.61
per cent in respect of Indo-SAARC import trade during the same
period.
Between 2005-06 and 2010-11, there was a huge growth in
respect of Indo-Maldives import trade. The imports from Maldives,
which amounted to Rs. 13.8 crores in 2006-07 went up abnormally
to Rs. 144.5 in 2010-11, contributing a tremendous compound
growth rate at 1542.04 per cent in 2010-11 over 2006-07. But the
compound growth rate of imports, recorded in respect of Indo-
SAARC import trade was just at 46.95 per cent in 2010-11 over
2006-07.
Balance of trade with Maldives
It was observed from the table 4.20 that India’s balance of
trade with Maldives had been favourable through out the study
period, but with less magnitude. Hence, it is felt that effective
measures have to be adapted to increase the trade between India
and Maldives.
INDIA-AFGHAN RELATIONS
Bilateral relations between India and Afghanistan have been
traditionally strong and friendly. While India was the only South
Asian country to recognize the Soviet-backed Democratic republic
212
of Afghanistan in the 1980s, its relations were diminished during
the Afghan civil wars and the rule of the Islamist Taliban in the
1990s. India aided the overthrow of the Taliban and became the
largest regional provider of humanitarian and reconstruction aid.
The new democratically elected Afghan government
strengthened its ties with India in wake of persisting tensions and
problems with Pakistan, which was suspected of continuing to
shelter and support the Taliban. India pursues a policy of close
cooperation to bolster its standing as a regional power and contain
its rival Pakistan, which it maintains is supporting Islamic
militants Kashmir and other parts of India. India is the largest
regional investor Afghanistan, having committed more than US$
2.2 billion for reconstruction purposes.
The area of Afghanistan is 65, 2238 sq. k.m. with dry climate
cold winters and hot summers. The population of Afghanistan is
28.4 millions. The main languages spoken are Dari and Pashto. Its
GDP is around $27billions with a growth rate of GDP at 22.5% and
per capita income at $800 by the end of 2010.
ECONOMY
In the 1930s, soon after its independence in 1919
Afghanistan embarked on a modest economic development
program. The government founded banks; introduced paper
money; established a university; expanded primary, secondary, and
technical schools; and sent students abroad for education. The
1979 Soviet invasion and ensuing civil war destroyed much of the
country’s limited infrastructure and disrupted normal patterns of
economic activity. Gross domestic product fell substantially
because of loss of labor and capital and disruption of trade and
transport. Continuing internal strife hampered both domestic
213
efforts at reconstruction as well as international aid efforts.
However, Afghanistan’s economy has grown at a fast pace since the
fall of the Taliban in 2001, albeit from a low base. GDP growth
exceeded 12% in 2007 and 2.4% in 2008; growth for 2009-2010
was 22.5%. Despite these increases, unemployment remains
around 40% and factors such as corruption, security, and shortage
of skilled workers constrains development and the conduct of
business in the country.
Agriculture
Majority of Afghan population (i.e, 85%) dependent on
agriculture and allied businesses for their livelihoods. Opium
poppy production and the opium trade continue to have a
significant monetary share of the country’s agricultural economy.
The major food crops produced are: corn, rice, barley, wheat,
vegetables, fruits, and nuts. The major industrial crops are: cotton,
tobacco, madder, castor beans, and sugar beets. Agricultural
production is constrained by an almost total dependence on erratic
winter snows and spring rains for water.
Trade and Industry
Afghanistan is endowed with natural resources, including
extensive deposits of natural gas, petroleum, coal, copper,
chromite, talc, barites, sulfur, lead, zinc, iron ore, salt, and
precious and semiprecious stones. Unfortunately, ongoing
instability in certain areas of the country, remote and rugged
terrain, and an inadequate infrastructure and transportation
network have made mining these resources difficult, and there
have been a few serious attempts to further explore or exploit
them.
214
The most important resource has been natural gas, first
tapped in 1967. At their peak during the 1980s, natural gas sales
accounted for $4300 million a year in export revenues (56% of the
total). Ninety percent of these exports went to the Soviet Union to
pay for imports and debts. However, during the withdrawal of
Soviet troops in 1989, Afghanistan’s natural gas fields were capped
to prevent sabotage by the mujahidin. Restoration of gas
production has been hampered by internal strife and the
disruption of traditional trading relationships following the collapse
of the Soviet Union. In addition, efforts are underway to create
Reconstruction Opportunity Zones (ROZs) in order to stimulate
badly needed jobs in underdeveloped areas where young men are
lured into illicit and destabilizing activities.
Share of India’s exports to Afghanistan in Indo-SAARC export trade
Afghanistan, being added to the regional grouping at the
behest of India on November 13, 2005, became a member on April
3, 2007. So, trade with Afghanistan could begin from 2005-06
onwards, as a member of the SAARC group.
According to table 4.21, India’s exports to Afghanistan,
amounted to Rs. 631.6 crores in 2005-06. The exports in 2006-07,
went up to Rs. 822.3 crores contributing the annual growth rate of
exports at 30.19 per cent in 2006-07 over the previous year. The
exports, which amounted Rs. 1001.9 crores in 2007-08, increased
to Rs. 1823.4 crores in 2008-09, reflecting the highest annual rate
at 81.99 per cent in 2008-09 over the previous year. During 2010-
11, the exports came down to Rs. 1875.7 crores from 2203.6 crores
in 2009-10, resulting the negative annual growth rate at 14.88 per
cent in 2010-11 over the previous year.
215
When we considered the compound growth rate of exports, it
was recorded at 196.97 per cent in 2010-11 over 2005-06.
With regard to percentage share of exports to Afghanistan in
Indo-SAARC export trade, it was observed that the percentage
share was registered at 2.57 per cent in 2005-06. The highest
percentage share was recorded at 5.56 per cent during 2008-10.
Share of India’s imports from Afghanistan in Indo-SAARC
import trade
The imports from Afghanistan, which amounted to Rs. 258.7
crores in 2005-06, came down to Rs. 156.1 crores, reflecting a
negative annual growth rate at 39.66 per cent in 2006-07 over the
previous year. The imports which amounted to Rs. 156.1 crores in
2006-07, increased tremendously to Rs. 439.8 crores, contributing
the highest annual growth rate of imports at 181.74 per cent in
2007-08 over the previous year. During 2010-11, the imports came
down to 557.6 crores from Rs. 590.4 per cent in 2009-10, reflecting
a negative annual growth rate at 5.55 per cent in 2010-11 over the
previous year (see table 4.22).
When we considered the compound growth rate of imports in
respect of Indo-Afghanistan import trade, it was observed that the
compound growth rate of imports had been registered at 115.53
per cent in 2010-11 over 2005-06.
When we considered the percentage share of imports, in
respect of Afghanistan, it was observed that the percentage share
of imports, recorded in 2009-10 was the highest with 7.53 per cent
(see table 4.22).
216
With regard to balance of trade, in respect of Afghanistan, it
was observed that the balance of trade had been favourable to
India through out the study period from 2005-06 to 2010-11.
Countries wise Composition of Indo – Saarc trade:
Composition of India’s exports to Nepal (Table 4.23)
The export basket of India, in respect of Nepal composed of
the various commodities namely drugs, pharma and fine
chemicals, transport equipment, machinery and instrument coal,
manufactures of mentals, tobacco, un-manufactured, non-basmati
rice, spices, readymade garments, cotton yarn fabric made ups,
natural silk yarn fabric made ups, inorganic/organic agro
chemicals, plastic and linolean products, Glass/glass
ware/ceramics/cement/, primary/semi finished iron and steel,
paints/enamels/vanishes, paper/word products, Electronic goods,
carpets handmade, cosmetics/toilet/, non-ferrous metals, sugar,
machine tools, rubber manufactured products, iron & steel bar
rods, fresh vegetables, fresh fruits, dairy products, residual
chemicals & allied products, petroleum & crude products, man-
made stable fibre and oil meals.
Among those products mentioned above, the item of export,
which stood first in terms of export to Nepal, was transport
equipment. According to table 4.23, the exports of transport
equipment, which amounted to US $29.97 mn in 1994-95, slightly
came down to US $29.20 mn in 1999-2000, reflecting the lowest
negative compound growth rate at 2.56 in 1999-2000 over 1994-
95. But, between 2000-01 and 2004-05, there was a tremendous
growth in exports to Nepal, with the compound growth rate being
recorded at 321.74 per cent in 2004-05 over 2000-01. During
2005-06 and 2009-10 also, the exports of transport equipment to
217
Nepal were high, with the compound growth rate of exports being
recorded at 177.76 per cent in 2009-10 over 2005-06.
The next item of export to Nepal, which stood second, in
terms of exports to Nepal, was primary/semi finished iron and
steel. According to table 4.23, the exports, which amounted to US
$4.40 millions in 1994-95, slightly went up to US $4.74 mn,
registering a compound growth rate at 7.72 per cent in 1998-99
over 1994-95. But, between 1999-2000 and 2004-05, the exports
to Nepal were very high with the compound growth rate registered
recorded remarkably at 1092-45 per cent in 2004-05 over 1999-
2000. During 2005-06 and 2009-10 also, exports were high with
the compound growth of exports being recorded substantially in
respect of Nepal, at 444.63 per cent in 2009-10 over 2005-06.
The next item of export, which recorded third place in the
export basket of India, in respect of Nepal was machinery and
instruments. According to table 4.23, the exports of machinery and
instruments amounted to US $ 12.16 million during 1999-2000, as
compared to US $19.02 mn 1994-95 reflecting a negative
compound growth rate at 36.07 per cent in 1999-2000 over 1994-
95.
Unlike the above trend, the exports were very high during
2000-01 and 2004-05, with the compound growth rate being
registered at 204.39 per cent in 2004-05 over 2000-01. Between
2005-06 and 2009-10 also, similar trend had been repeated with
the exports being increased tremendously from US $34.21 mn in
2005-06 to US $126.78 mn, reflecting a compound growth rate at
270.59 per cent.
The next item of export that occupies fourth place in the
export basket of India was glass/glass ware/ceramics/cement.
218
According to table 4.23, the exports of this product were, worth US
$3.75 million in 1998-98, as compared to US $4.61 mn, yielding a
negative compound growth rate at 18.65 per cent in 1998-99 over
1994-95.
Unlike the trend in exports, observed in the earlier phase,
the exports to Nepal, during 1999-2000 and 2003-04, were very
high, which increased from US $6.79 mn in 1999-2000 to US
$37.68 mn in 2003-04, contributing a remarkable compound
growth rate at 454.93 per cent in 2003-04 over 1999-2000.
Between 2004-05 and 2009-10 also, the exports to Nepal were
high, with the compound growth rate being registered at 158.35
per cent 2009-10 over 2004-05.
It was noteworthy that the product namely petroleum &
crude products, which was not exported before 2003-04, emerged
as a star performer in terms exports to Nepal, occupying a
remarkable share in the export basket, at 22.68 per cent in 2003-
04, which in turn increased to 31.12 per cent in 2004-05 and
further to 44.38 per cent in 2005-06. With regard to growth rate
also, substantial increase had been noted in respect of this
product, with the compound growth rate being recorded at 132.59
per cent in 2009-10 over 2003-04.
The other products, which registered a significant share in
India’s exports basket in respect of Nepal in 2009-10, included
drugs, pharma & fine chemicals (5.48%), manufacture of metals
(2.77%), plastic & linolean products (2.76%), paper/wood products
(3.07%), and the products with insignificant share in 2009-10
included coal, (0.96%), tobacco unmanufactured (1.02%), Non-
basmathi rice ()1.14%), spices (1.65%), paints/enamels/varnishers
(0.60%), and Non-ferrous metals (0.92%).
219
Composition of India’s exports to Sri Lanka-Product-wise
(Table 4.24)
It is evident from table 4.24 that the commodity, which
occupied a major share in the export basket of India, in respect of
Sri Lanka was transport equipment. It can also be observed that
the percentage share, which this product recorded at 25.02 per
cent in 1994-95, exhibited a declining trend through out the study
period with 17.87 per cent in 1998-99, with 14.63 per cent in
2002-03 and with 13.79 per cent in 2009-10.
With regard to growth rate, it was witnessed that the exports
of transport equipment, which amounted to US $84.05 mn during
1994-95, came down to US $64.50 mn in 1999-2000, reflecting a
negative compound growth rate at 23.25 per cent in 1999-2000
over 1994-95.
Between 2000-01 and 2003-04, positive compound growth
rate was registered at 87.54 per cent in 2003-04 over 2000-01, as
the exports went up to US $148.27 mn in 2003-04, from US $
79.06 mn 2000-01. During the last phase of the study period, the
compound growth rate of exports was recorded at 24.84 per cent in
2009-10 over 2004-05.
The next item of export from the export basket of India, in
respect of Sri Lanka was cotton yarn fabrics, made ups.
According to table 4.24, the exports of cotton yarn in respect
of Sri Lanka amounted to US $73.69 mn in 1999-2000 compared
to US $ 77.42 mn in 2000-01 slightly went up to 87.06 mn in
2004-05, contributing a compound growth rate at 12.45 per cent in
2004-05 over 2000-01 (see table 4.25).
220
During 2005-06 and 2009-10, the exports of cotton yarn
fabrics displayed an upward trend, with the exports, worth of US
$107.47 mn in 2005-06, registered at US $ 193.33 mn in 2009-10,
reflecting a compound growth rate at 82.68 per cent in 2009-10
over 2005-06.
The next item of export, in 2009-10 over 2005-06 in the
composition of exports, in respect of Sri Lanka was drugs, pharma
and fine chemicals.
According to table 4.24, the exports of drugs. Amounted to
US $31.13 mn in 1999-2000, as compared to US $22.06 mn in
1994-95, reflecting a compound growth rate 41.11 in 1999-2000
over 1994-95. But, it was a little bit higher with 61.70 per cent, as
recorded in 2004-05 over 2000-01, where as the compound growth
rate was a little bit lower with 57.78 per cent in 2009-10 over
2005-06.
The next item of export, whose share occupies 4th place in
India’s export basket, in respect of Sri Lanka was machinery &
instruments. According to table 4.26, the exports of machinery and
instruments amounted to US $37.47 mn in 1999-2000, as
compared to US $24.82 mn in 1994-95, contributing a compound
growth rate at 50.96 per cent in 1999-2000 over 1994-95. Between
2000-01 and 2004-05, the compound growth rate was registered at
65.73 per cent in 2004-05 over 2000-01. During the last phase of
the study period, the compound growth rate of exports, in respect
of Sri Lanka, was recorded at 21.11 per cent in 2009-10 over
2005-06.
It was noteworthy that the product, namely petroleum and
crude products were not exported before 2003-04. But, it could
register a remarkable percentage share from, 33.63 per cent in
221
2005-06 to 41.84 per cent in 2007-08 and stood at 26.19 per cent
in 2009-10. With regard to growth rate also, the exports being
doubled, with the compound growth rate being recorded at 102.89
per cent in 2009-10 over 2003-04.
The other commodities, which registered an insignificant
share in India’s export basket, in respect of Sri Lanka included
finished iron & steel (3.79%), manufacture of metals (2.04%),
paper/wood products, (2.95%), man-made yarn fabrics (3.63%),
plastic & linoleum products (2.34%), fresh vegetables (2.10%),
spices (2.48%) oil meals (2.05%), cosmetics (2.28%), glass (1.00%)
pulses (0.59%), RMG of cotton including accessories (0.65%),
organic/inorganic agro chemicals (1.73%), Electronic goods (1.16%)
iron & steel bar rods (0.49%), Rubber manufacture products
(0.71%), marine products (0.74%) and paints/enamels/vanishes
(0.53%) at the end of 2009-10.
Composition of India’s exports to Bangladesh-Product wise
(Table 4.25)
Composition of India’s exports to Bangladesh included the
commodities such as cotton yarn, fabrics, manufactures of metals,
man-made yarn fabrics, spices, fresh fruits electronic goods,
paper/wood products, glass/glass wares, non-Basmati rice,
transport equipment and so on.
Among those commodities, the product, which occupied
major share in India’s composition of exports to Bangladesh is
cotton yarn fabrics and made ups.
According to table 4.25, the exports of cotton yarn to
Bangladesh in 1999-2000 amounted to US $157.20mn as
compared to US $254.30mn in 1994-95, reflecting a negative
222
compound growth rate of exports to Bangladesh at -38.18 per cent
in 1999-2000 over 1994-95. Between 2000-01 and 2004-05 also,
the exports of this product, worth of US $217.32mn in 2000-01
decreased to US $208.12 in 2004-05, contributing another negative
compound growth rate at 4.2 per cent in 2004-05 over 2000-01.
But, the trend between 2005-06 and 2009-10 was reversed with
the positive compound growth rate of exports, being recorded at
15.32 per cent in 2009-10 over 2005-06. (Based on CMIE – Reports
– September-2010)
The other commodity, whose share occupies second place in
India’s composition of exports of Bangladesh, was transport
equipment. According to table 4.25, the exports of transport
equipment to Bangladesh during 1999-2000 amounted to US
$40.49 as compared to US $54.15 in 1994-95, reflecting a negative
compound growth rate of exports at 25.23 per cent in 1999-2000
over 1994-95.
Between 2000-01 and 2004-05 also, similar trend in exports
had been observed in respect of this item. The exports, worth of US
$61.59 in 2000-01 decreased to US $58.71 in 2004-05, resulting
another negative compound growth rate of exports at 4.67 per cent
in 2004-05 over 2000-01.
But, between 2005-06, and 2009-10, unlike the above earlier
two trends in exports, positive higher compound growth rate of
exports was recorded in respect of Bangladesh at 204.27 per cent
in 2009-10 over 2005-06 as the exports in 2005-06, worth of US
$80.06 went up to US $243.60 in 2009-10 in respect of transport
equipment.
The next product that occupies a substantial share in India’s
composition of exports to Bangladesh was fresh vegetables.
223
According to table 4.25, the percentage share of this product
in India’s composition of exports to Bangladesh was very low with
variations between 0.34 per cent and 2.36 per cent till 2003-04.
From 2003 - 04 onwards, an upward trend was noticed in respect
of export of this product to Bangladesh and this trend continued
till 2009-10, at which the higher percentage share was recorded
with 10.45 per cent, keeping the product at third place in terms of
exports after cotton yarn with percentage share at 12.11 per cent
and transport equipment with percentage share at 10.48 per cent
in 2009-10.
The exports of fresh vegetable to Bangladesh, which
amounted to US $1.96 in 1994-95, went up to US $14.25 in 1999-
2000, contributing a tremendous growth rate of exports at 627 per
cent in 1999-2000 over 1994-95.
Similar trend had also been repeated in respect of
composition of exports to Bangladesh between 2000-01 and 2004-
05. The exports of fresh vegetables to Bangladesh, worth of US
$9.74 mn in 2000-01 increased to US $68.03 mn in 2004-05,
contributing a compound growth rate of exports at 598.45 per cent
in 2004-05 over 2000-01.
Between 2005-06 and 2009-10 also, a substantial growth
rate had been observed in respect of exports to Bangladesh, with
the compound growth rate of exports having registered at 10.45 per
cent in 2009-10 over 2005-06.
The product that occupies fourth place in respect of
composition of exports to Bangladesh was oil meals (see table
4.26). It could be observed that the percentage share of oil meals
was very low with below one per cent till 1998-99. Since 1999-2000
onwards, an upward trend had been witnessed in respect of
224
exports to Bangladesh and this increasing trend was continued
with 5.88 per cent in 2004-05, 6.19 per cent in 2006-07 and
ultimately reached the highest percentage share with 8.24 per cent
in 2009-10, (see table 4.25).
With regard to growth rate of exports in respect of
Bangladesh, it was observed that the exports of oil meals, which
amounted to US $0.43 mn in 1994-95, went up to US $1.79 mn in
1998-99, reflecting a substantial growth rate of exports with
316.27 in 1998-99 over 1994-95..
Between 1999-2000 and 2005-06 also, same trend in exports
had been repeated with the exports, with of US $7.08 in 1999-
2000, being increased to US $28.45 mn 2005-06, contributing a
compound growth rate at 301.34 per cent in 2005-06 over 1999-
2000.
During the last phase of the study period also, the exports of
oil meals were more than doubled with 136.15 per cent in 2009-10
over 2006-07.
The other major item of export, whose share occupies fifth
place in the composition of India’s exports to Bangladesh was
cotton raw including waste. According to table 4.25, this product
was not exported before 1997-98. The exports of cotton raw
including waste, which amounted to US $13.99 mn in 1997-98
went up to US $24.42 mn in 2003-04, reflecting a compound
growth rate 74.54 per cent in 2003-04 over 1997-98. But, in the
very next year, the exports fell to US $5.88 mn in 2004-05 from US
$24.42 mn in 2003-04, resulting in a negative annual growth rate
at 18.54 per cent in 2004-05 over the previous year. Between
2005-06 and 2009-10, the trend in exports displayed an increasing
trend.

225
The other commodities, which recorded a better share, in
respect of composition of exports to Bangladesh, in 2009-10,
included drugs, pharma (3.88%), coal (2.98%), finished iron & steel
(5.38%), man-made yarn 4.49%, organic/inorganic agro chemicals
(2.21%), spices (2.06%) and other cereals (5.20%).
The commodities, which recorded insignificant share in
India’s export basket to Bangladesh included manufacture of
metals (1.26%), paper/wood products (0.80%), processed minerals
(0.74%), fresh fruits (1.69%), Dyes (0.96%), rubber manufactures
products (1.37%), marine products (0.64%), plastic (1.97%),
electronic goods (0.82%), poultry & diary products (0.76%) and
residual chemicals (0.78%).
Composition of India’s exports to Pakistan (Table 4.26)
After independence, India and Pakistan signed a stand still
agreement under which goods from one country to another were
exempted from customs duty19. Between 1965 and 1875 there was
trade embargo between the two countries. A trade protocol (Simla
Agreement) was signed for lifting trade embargo with effect from
December 7, 1974. India accorded MFN status to Pakistan in 1996
and in the same year Pakistan increased its positive list of 600
items that could be imported from India20. The present positive list
of Pakistan specifies 1075 items which are importable from India.
The rest of the items are through allowed for imports into Pakistan
from India but only against a specific import permit or license,
while then items are freely importable from rest of the world.
Despite signing of the SAFTA, exports from India to Pakistan
are governed by the positive list of imports as Pakistan’s bilateral
19
Ranjit Singh, Op.cit., p.28 20 Naizil Ali, M., Foreign Trade Pattern of Pakistan,Karachi Chamber of Commerce & Industry,
1996, p.130
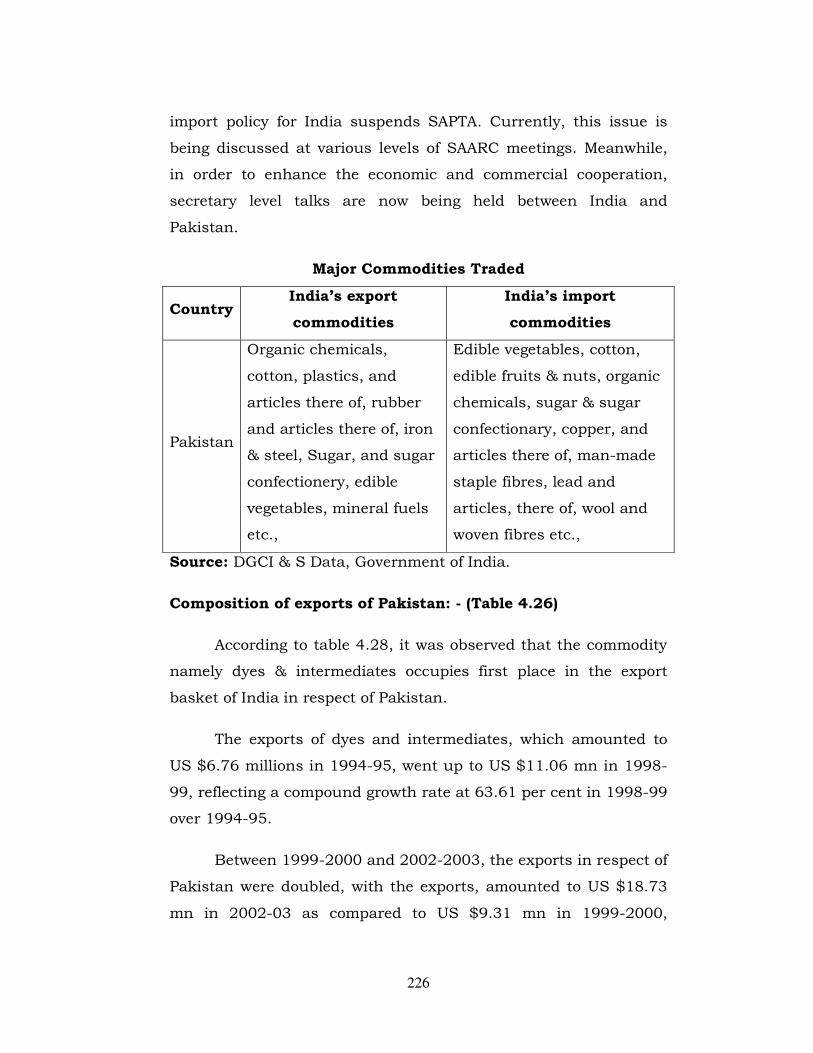
226
import policy for India suspends SAPTA. Currently, this issue is
being discussed at various levels of SAARC meetings. Meanwhile,
in order to enhance the economic and commercial cooperation,
secretary level talks are now being held between India and
Pakistan.
Major Commodities Traded
Country India’s export
commodities
India’s import
commodities
Pakistan
Organic chemicals,
cotton, plastics, and
articles there of, rubber
and articles there of, iron
& steel, Sugar, and sugar
confectionery, edible
vegetables, mineral fuels
etc.,
Edible vegetables, cotton,
edible fruits & nuts, organic
chemicals, sugar & sugar
confectionary, copper, and
articles there of, man-made
staple fibres, lead and
articles, there of, wool and
woven fibres etc.,
Source: DGCI & S Data, Government of India.
Composition of exports of Pakistan: - (Table 4.26)
According to table 4.28, it was observed that the commodity
namely dyes & intermediates occupies first place in the export
basket of India in respect of Pakistan.
The exports of dyes and intermediates, which amounted to
US $6.76 millions in 1994-95, went up to US $11.06 mn in 1998-
99, reflecting a compound growth rate at 63.61 per cent in 1998-99
over 1994-95.
Between 1999-2000 and 2002-2003, the exports in respect of
Pakistan were doubled, with the exports, amounted to US $18.73
mn in 2002-03 as compared to US $9.31 mn in 1999-2000,
227
contributing a compound growth rate at 101.18 per cent in 2002-
03 over 1999-2000. But, the growth rate was very high between
2003-04 and 2009-10, as the exports increase substantially from
US $69.55 million in 2003-04 to US $261.64 mn in 2009-10,
yielding a compound growth rate at 276.18 per cent in 2009-10
over 2003-04.
The next item of export, which stood second in the export
basket of India, in respect of Pakistan was oil meals.
The exports of oil meals in 1998-99 amounted to US $24.48
mn as compared to US $14.11 mln in 1994-95, contributing a
compound growth rate at 73.49 per cent in 1998-99 over 1994-95.
But, the growth rate, recorded between 1999-2000 and 2003-04,
was lesser than the earlier one, as the exports which amounted to
US $19.81 mln in 1999-2000, slightly went up to US $26.26 mn in
2003-04, contributing a compound growth rate at 32.56 per cent in
2003-04 over 1999-2000. However, the growth rate, recorded
during 2004-05 and 2009-10 was much higher than the earlier
ones as the exports were doubled, with the compound growth rate
being recorded at 104.71 per cent in 2009-10 over 2004-05.
The next item of export, which stood third in the export
basket of India, in respect of Pakistan was drugs pharma and fine
chemicals. The exports of drugs amounted to US $7.68 mln in
1997-98 as compared to US $1.52 mln in 1994-95, reflecting a
substantial compound growth rate at 405.26 per cent in 1997-98
over 1994-95.
The compound growth rate of exports in respect of Pakistan,
between 1998-99 and 2003-04, was recorded at 76.29 per cent in
2003-04 over 1998-99 and it was just recorded at 29.87 per cent in
2009-10 over 2004-05.
228
It was noteworthy that, the product, namely man made yarn
fabrics, made ups, which was not exported before 2003-04,
exhibited a tremendous percentage share with 14.52 per cent in
2008-09 and with 28.14 per cent in 2009-10. It is also worthy
mentioning that the annual growth rate export of this product, in
respect of Pakistan was at 121.81 per cent in 2009-10 over 2008-
09.
There was also another product, which emerged as a star
performer in terms of percentage share with 21.91 per cent in
2006-07 and with 24.73 per cent in 2007-08.
Some products, namely gems and jewellery, processed
vegetables, and cotton entered the exports front.
The products, which registered an insignificant share of
export, in respect of Pakistan in 2009-10 were, inorganic/organic
agro chemicals (2.78%), plastic (2.58%), rubber manufactured
products (2.26%), spices (1.36%), Tea (1.26%), manufacture of
metals (1.35%), machinery & instruments (1.90%), Primary/Semi
finished iron & steel (0.56%), paper/wood products (0.42%) and
fruits and vegetable seeds (0.57%).
Conclusion:
It is evident from the foregone analysis that the Saarc countries
have been able to sustain their existence as an important group in
South Asia for trade and economic cooperation. This is inspite of
intra-regional political bickering and other economic
apprehensions. Geographic, cultural, historic and commercial ties
are strong among the Saarc excepting Indo-Pak relations. All the
countries have witnessed positive trade trends. However, intra-
229
regional trade among the Saarc countries is comparatively lower to
the intraregional trade in respect of EU, ASEAN, etc.
India has favourable balance of trade with almost all other
regional partners in the Saarc region. A large number of goods
ranging from agricultural to manufacturing sectors are traded
among these countries. There is a realization that there is a
shortfall in the quantum of intra-regional trade among the Saarc
countries and all these countries have started deliberations to step
up the trade on part with other intraregional trade as in case of
Asean, EU, etc. The recent moves by Pakistan in easing out the list
of items and extension of MFN treatment to India - all will help
pave the way for improvement in Saarc relations.
------------
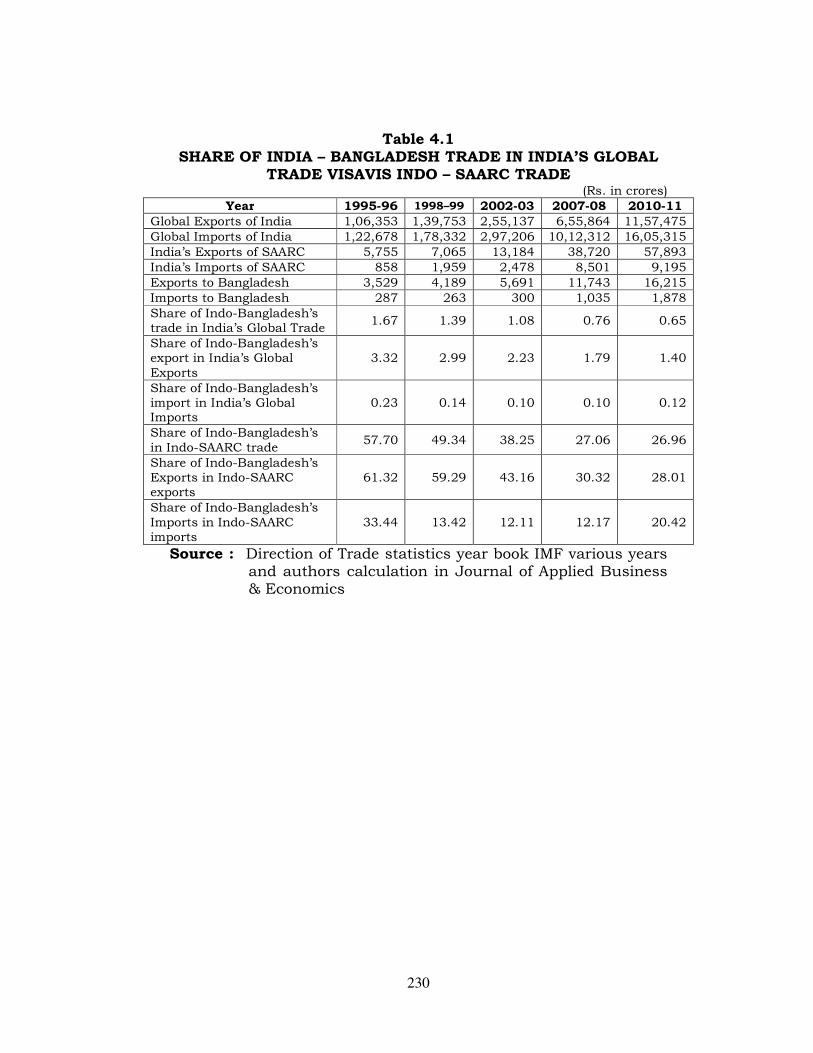
230
Table 4.1
SHARE OF INDIA – BANGLADESH TRADE IN INDIA’S GLOBAL TRADE VISAVIS INDO – SAARC TRADE
(Rs. in crores) Year 1995-96 1998–99 2002-03 2007-08 2010-11
Global Exports of India 1,06,353 1,39,753 2,55,137 6,55,864 11,57,475 Global Imports of India 1,22,678 1,78,332 2,97,206 10,12,312 16,05,315 India’s Exports of SAARC 5,755 7,065 13,184 38,720 57,893 India’s Imports of SAARC 858 1,959 2,478 8,501 9,195 Exports to Bangladesh 3,529 4,189 5,691 11,743 16,215 Imports to Bangladesh 287 263 300 1,035 1,878 Share of Indo-Bangladesh’s trade in India’s Global Trade
1.67 1.39 1.08 0.76 0.65
Share of Indo-Bangladesh’s export in India’s Global Exports
3.32 2.99 2.23 1.79 1.40
Share of Indo-Bangladesh’s import in India’s Global Imports
0.23 0.14 0.10 0.10 0.12
Share of Indo-Bangladesh’s in Indo-SAARC trade
57.70 49.34 38.25 27.06 26.96
Share of Indo-Bangladesh’s Exports in Indo-SAARC exports
61.32 59.29 43.16 30.32 28.01
Share of Indo-Bangladesh’s Imports in Indo-SAARC imports
33.44 13.42 12.11 12.17 20.42
Source : Direction of Trade statistics year book IMF various years and authors calculation in Journal of Applied Business & Economics
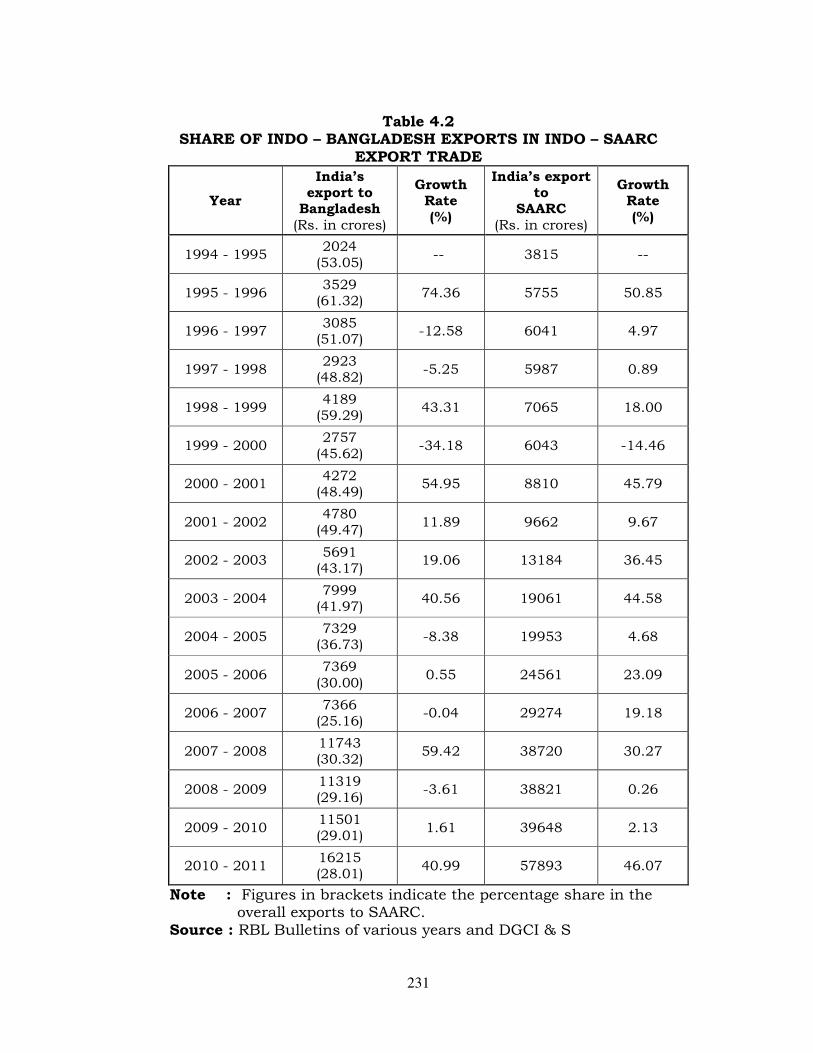
231
Table 4.2 SHARE OF INDO – BANGLADESH EXPORTS IN INDO – SAARC
EXPORT TRADE
Year
India’s export to
Bangladesh (Rs. in crores)
Growth Rate (%)
India’s export to
SAARC (Rs. in crores)
Growth Rate (%)
1994 - 1995 2024
(53.05) -- 3815 --
1995 - 1996 3529
(61.32) 74.36 5755 50.85
1996 - 1997 3085
(51.07) -12.58 6041 4.97
1997 - 1998 2923
(48.82) -5.25 5987 0.89
1998 - 1999 4189
(59.29) 43.31 7065 18.00
1999 - 2000 2757
(45.62) -34.18 6043 -14.46
2000 - 2001 4272
(48.49) 54.95 8810 45.79
2001 - 2002 4780
(49.47) 11.89 9662 9.67
2002 - 2003 5691
(43.17) 19.06 13184 36.45
2003 - 2004 7999
(41.97) 40.56 19061 44.58
2004 - 2005 7329
(36.73) -8.38 19953 4.68
2005 - 2006 7369
(30.00) 0.55 24561 23.09
2006 - 2007 7366
(25.16) -0.04 29274 19.18
2007 - 2008 11743 (30.32)
59.42 38720 30.27
2008 - 2009 11319 (29.16)
-3.61 38821 0.26
2009 - 2010 11501 (29.01)
1.61 39648 2.13
2010 - 2011 16215 (28.01)
40.99 57893 46.07
Note : Figures in brackets indicate the percentage share in the overall exports to SAARC.
Source : RBL Bulletins of various years and DGCI & S
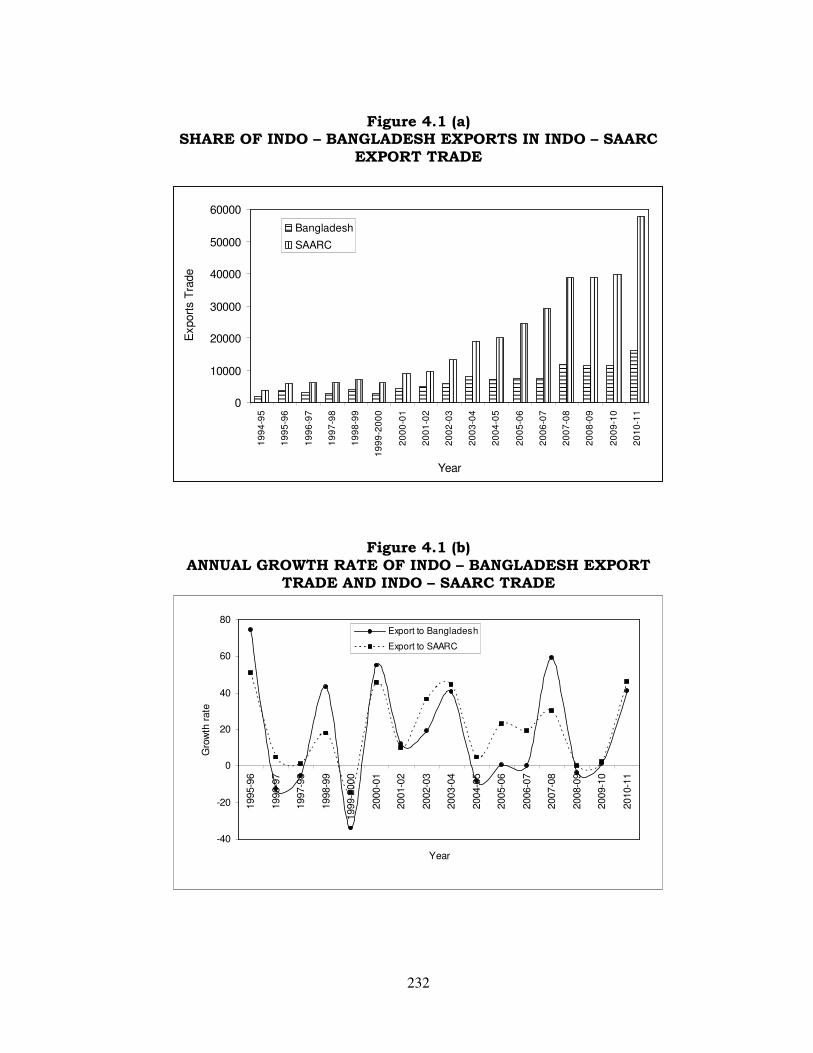
232
Figure 4.1 (a) SHARE OF INDO – BANGLADESH EXPORTS IN INDO – SAARC
EXPORT TRADE
0
10000
20000
30000
40000
50000
60000
19
94
-95
19
95
-96
19
96
-97
19
97
-98
19
98
-99
19
99
-20
00
20
00
-01
20
01
-02
20
02
-03
20
03
-04
20
04
-05
20
05
-06
20
06
-07
20
07
-08
20
08
-09
20
09
-10
20
10
-11
Year
Export
s T
rade
Bangladesh
SAARC
Figure 4.1 (b) ANNUAL GROWTH RATE OF INDO – BANGLADESH EXPORT
TRADE AND INDO – SAARC TRADE
-40
-20
0
20
40
60
80
1995-9
6
1996-9
7
1997-9
8
1998-9
9
1999-2
000
2000-0
1
2001-0
2
2002-0
3
2003-0
4
2004-0
5
2005-0
6
2006-0
7
2007-0
8
2008-0
9
2009-1
0
2010-1
1
Year
Gro
wth
rate
Export to Bangladesh
Export to SAARC
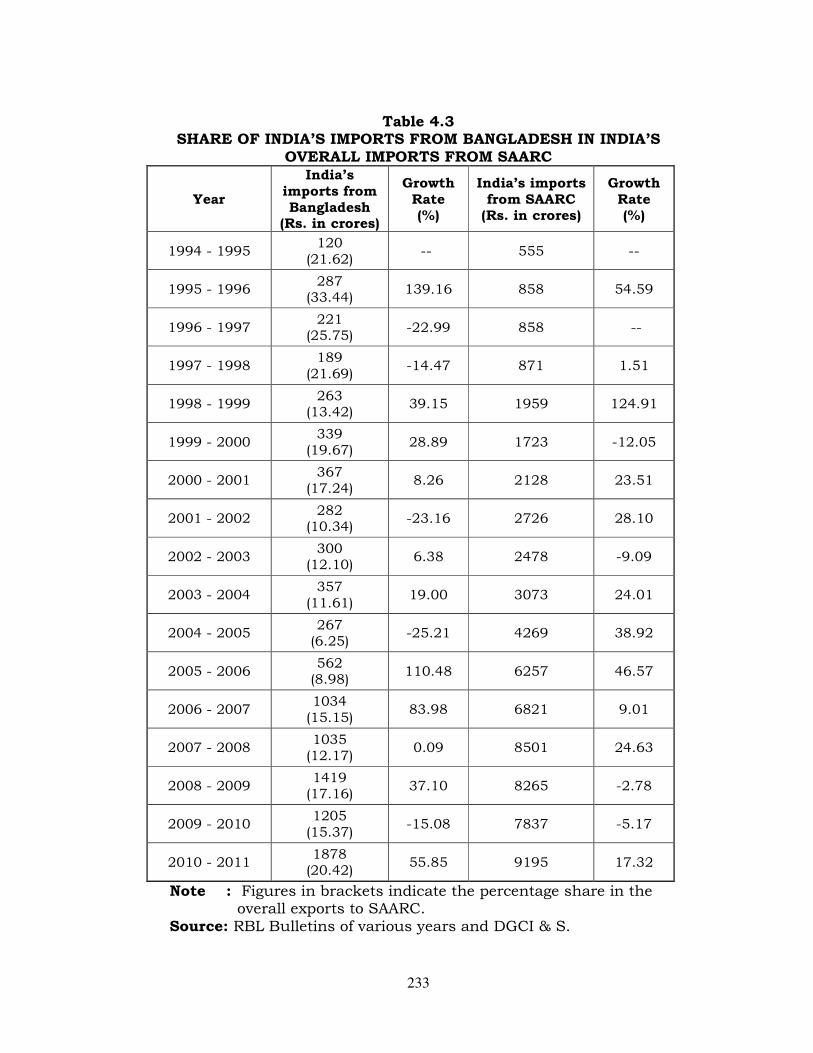
233
Table 4.3 SHARE OF INDIA’S IMPORTS FROM BANGLADESH IN INDIA’S
OVERALL IMPORTS FROM SAARC
Year
India’s imports from Bangladesh
(Rs. in crores)
Growth Rate (%)
India’s imports from SAARC
(Rs. in crores)
Growth Rate (%)
1994 - 1995 120
(21.62) -- 555 --
1995 - 1996 287
(33.44) 139.16 858 54.59
1996 - 1997 221
(25.75) -22.99 858 --
1997 - 1998 189
(21.69) -14.47 871 1.51
1998 - 1999 263
(13.42) 39.15 1959 124.91
1999 - 2000 339
(19.67) 28.89 1723 -12.05
2000 - 2001 367
(17.24) 8.26 2128 23.51
2001 - 2002 282
(10.34) -23.16 2726 28.10
2002 - 2003 300
(12.10) 6.38 2478 -9.09
2003 - 2004 357
(11.61) 19.00 3073 24.01
2004 - 2005 267
(6.25) -25.21 4269 38.92
2005 - 2006 562
(8.98) 110.48 6257 46.57
2006 - 2007 1034
(15.15) 83.98 6821 9.01
2007 - 2008 1035
(12.17) 0.09 8501 24.63
2008 - 2009 1419
(17.16) 37.10 8265 -2.78
2009 - 2010 1205
(15.37) -15.08 7837 -5.17
2010 - 2011 1878
(20.42) 55.85 9195 17.32
Note : Figures in brackets indicate the percentage share in the overall exports to SAARC.
Source: RBL Bulletins of various years and DGCI & S.
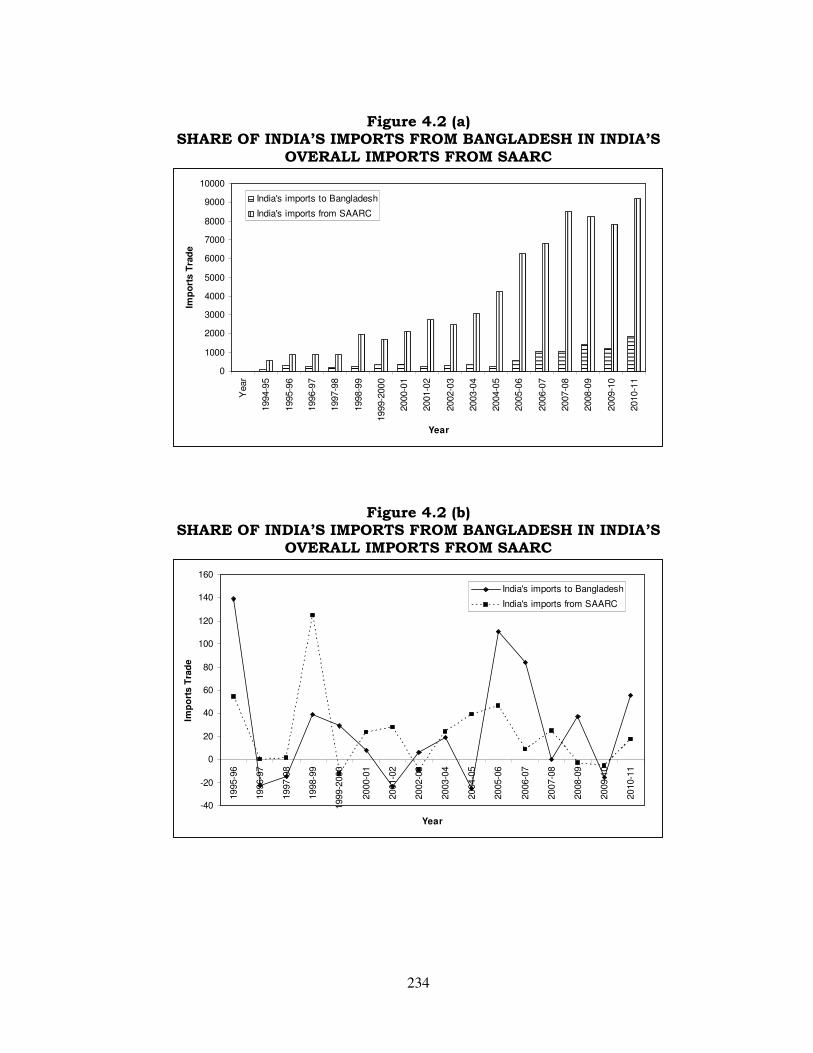
234
Figure 4.2 (a) SHARE OF INDIA’S IMPORTS FROM BANGLADESH IN INDIA’S
OVERALL IMPORTS FROM SAARC
0
1000
2000
3000
4000
5000
6000
7000
8000
9000
10000
Year
1994-9
5
1995-9
6
1996-9
7
1997-9
8
1998-9
9
1999-2
000
2000-0
1
2001-0
2
2002-0
3
2003-0
4
2004-0
5
2005-0
6
2006-0
7
2007-0
8
2008-0
9
2009-1
0
2010-1
1
Year
Imp
ort
s T
rad
eIndia's imports to Bangladesh
India's imports from SAARC
Figure 4.2 (b) SHARE OF INDIA’S IMPORTS FROM BANGLADESH IN INDIA’S
OVERALL IMPORTS FROM SAARC
-40
-20
0
20
40
60
80
100
120
140
160
1995-9
6
1996-9
7
1997-9
8
1998-9
9
1999-2
000
2000-0
1
2001-0
2
2002-0
3
2003-0
4
2004-0
5
2005-0
6
2006-0
7
2007-0
8
2008-0
9
2009-1
0
2010-1
1
Year
Imp
ort
s T
rad
e
India's imports to Bangladesh
India's imports from SAARC
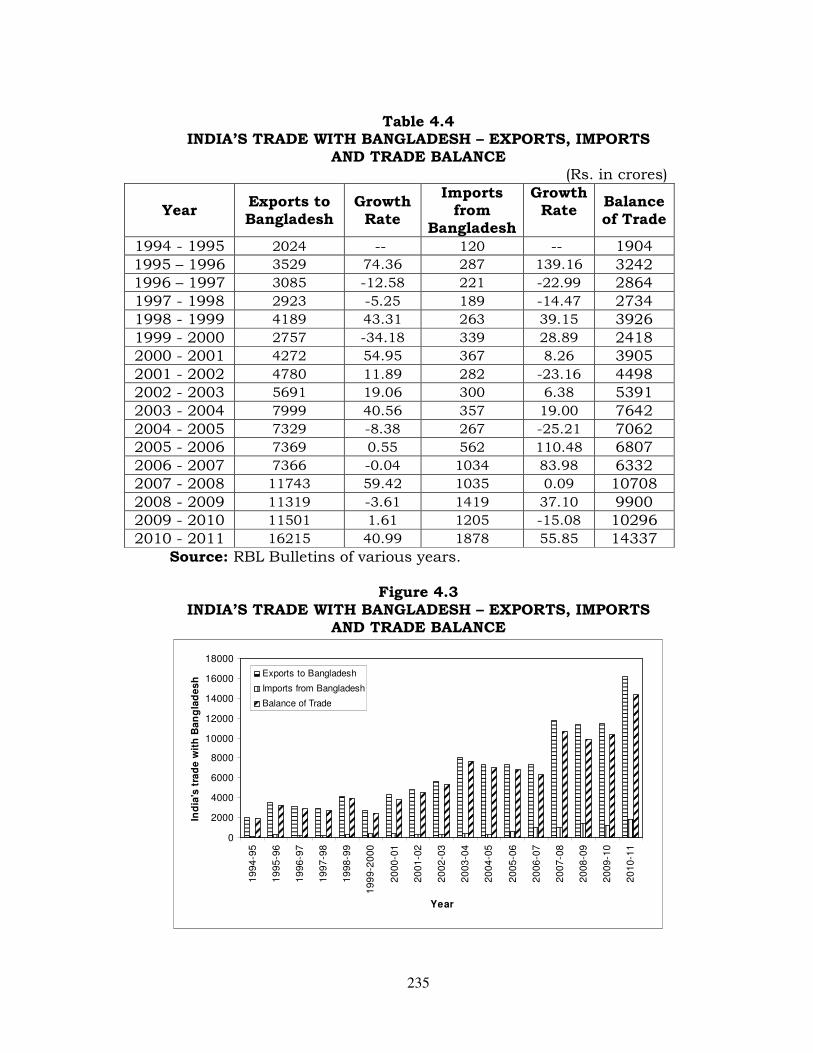
235
Table 4.4 INDIA’S TRADE WITH BANGLADESH – EXPORTS, IMPORTS
AND TRADE BALANCE (Rs. in crores)
Year Exports to Bangladesh
Growth Rate
Imports from
Bangladesh
Growth Rate
Balance of Trade
1994 - 1995 2024 -- 120 -- 1904 1995 – 1996 3529 74.36 287 139.16 3242 1996 – 1997 3085 -12.58 221 -22.99 2864 1997 - 1998 2923 -5.25 189 -14.47 2734 1998 - 1999 4189 43.31 263 39.15 3926 1999 - 2000 2757 -34.18 339 28.89 2418 2000 - 2001 4272 54.95 367 8.26 3905 2001 - 2002 4780 11.89 282 -23.16 4498 2002 - 2003 5691 19.06 300 6.38 5391 2003 - 2004 7999 40.56 357 19.00 7642 2004 - 2005 7329 -8.38 267 -25.21 7062 2005 - 2006 7369 0.55 562 110.48 6807 2006 - 2007 7366 -0.04 1034 83.98 6332 2007 - 2008 11743 59.42 1035 0.09 10708 2008 - 2009 11319 -3.61 1419 37.10 9900 2009 - 2010 11501 1.61 1205 -15.08 10296 2010 - 2011 16215 40.99 1878 55.85 14337
Source: RBL Bulletins of various years.
Figure 4.3 INDIA’S TRADE WITH BANGLADESH – EXPORTS, IMPORTS
AND TRADE BALANCE
0
2000
4000
6000
8000
10000
12000
14000
16000
18000
19
94
-95
19
95
-96
19
96
-97
19
97
-98
19
98
-99
19
99
-20
00
20
00
-01
20
01
-02
20
02
-03
20
03
-04
20
04
-05
20
05
-06
20
06
-07
20
07
-08
20
08
-09
20
09
-10
20
10
-11
Year
Ind
ia's
tra
de
wit
h B
an
gla
de
sh
Exports to Bangladesh
Imports from Bangladesh
Balance of Trade
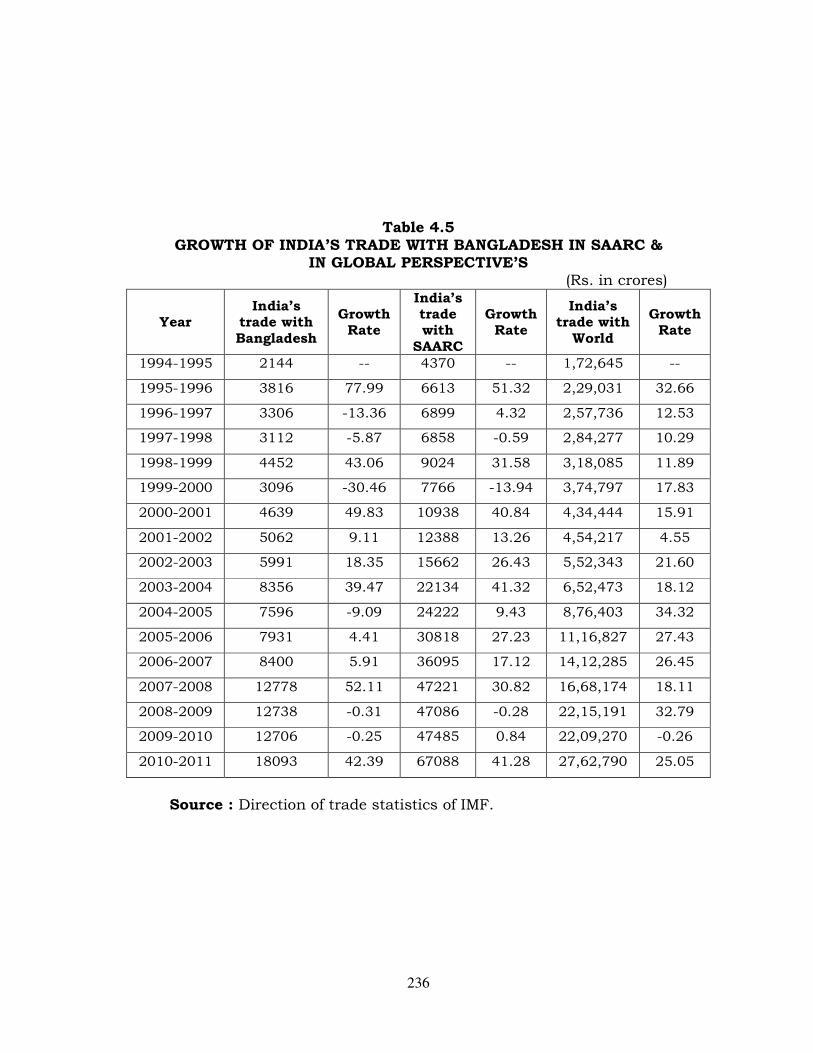
236
Table 4.5 GROWTH OF INDIA’S TRADE WITH BANGLADESH IN SAARC &
IN GLOBAL PERSPECTIVE’S (Rs. in crores)
Year India’s
trade with Bangladesh
Growth Rate
India’s trade with
SAARC
Growth Rate
India’s trade with
World
Growth Rate
1994-1995 2144 -- 4370 -- 1,72,645 --
1995-1996 3816 77.99 6613 51.32 2,29,031 32.66
1996-1997 3306 -13.36 6899 4.32 2,57,736 12.53
1997-1998 3112 -5.87 6858 -0.59 2,84,277 10.29
1998-1999 4452 43.06 9024 31.58 3,18,085 11.89
1999-2000 3096 -30.46 7766 -13.94 3,74,797 17.83
2000-2001 4639 49.83 10938 40.84 4,34,444 15.91
2001-2002 5062 9.11 12388 13.26 4,54,217 4.55
2002-2003 5991 18.35 15662 26.43 5,52,343 21.60
2003-2004 8356 39.47 22134 41.32 6,52,473 18.12
2004-2005 7596 -9.09 24222 9.43 8,76,403 34.32
2005-2006 7931 4.41 30818 27.23 11,16,827 27.43
2006-2007 8400 5.91 36095 17.12 14,12,285 26.45
2007-2008 12778 52.11 47221 30.82 16,68,174 18.11
2008-2009 12738 -0.31 47086 -0.28 22,15,191 32.79
2009-2010 12706 -0.25 47485 0.84 22,09,270 -0.26
2010-2011 18093 42.39 67088 41.28 27,62,790 25.05
Source : Direction of trade statistics of IMF.
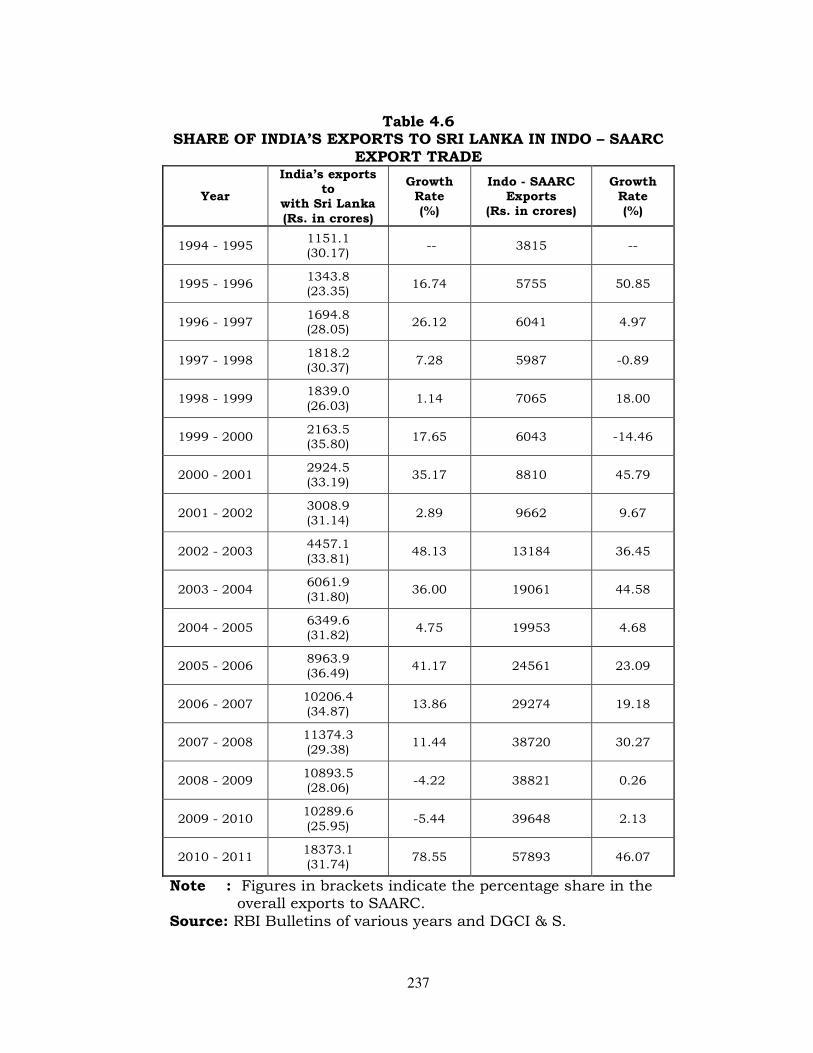
237
Table 4.6 SHARE OF INDIA’S EXPORTS TO SRI LANKA IN INDO – SAARC
EXPORT TRADE
Year
India’s exports to
with Sri Lanka
(Rs. in crores)
Growth Rate (%)
Indo - SAARC Exports
(Rs. in crores)
Growth Rate (%)
1994 - 1995 1151.1 (30.17)
-- 3815 --
1995 - 1996 1343.8 (23.35)
16.74 5755 50.85
1996 - 1997 1694.8 (28.05)
26.12 6041 4.97
1997 - 1998 1818.2 (30.37)
7.28 5987 -0.89
1998 - 1999 1839.0 (26.03)
1.14 7065 18.00
1999 - 2000 2163.5 (35.80)
17.65 6043 -14.46
2000 - 2001 2924.5 (33.19)
35.17 8810 45.79
2001 - 2002 3008.9 (31.14)
2.89 9662 9.67
2002 - 2003 4457.1 (33.81)
48.13 13184 36.45
2003 - 2004 6061.9 (31.80)
36.00 19061 44.58
2004 - 2005 6349.6 (31.82)
4.75 19953 4.68
2005 - 2006 8963.9 (36.49)
41.17 24561 23.09
2006 - 2007 10206.4 (34.87)
13.86 29274 19.18
2007 - 2008 11374.3 (29.38)
11.44 38720 30.27
2008 - 2009 10893.5 (28.06)
-4.22 38821 0.26
2009 - 2010 10289.6 (25.95)
-5.44 39648 2.13
2010 - 2011 18373.1 (31.74)
78.55 57893 46.07
Note : Figures in brackets indicate the percentage share in the overall exports to SAARC.
Source: RBI Bulletins of various years and DGCI & S.
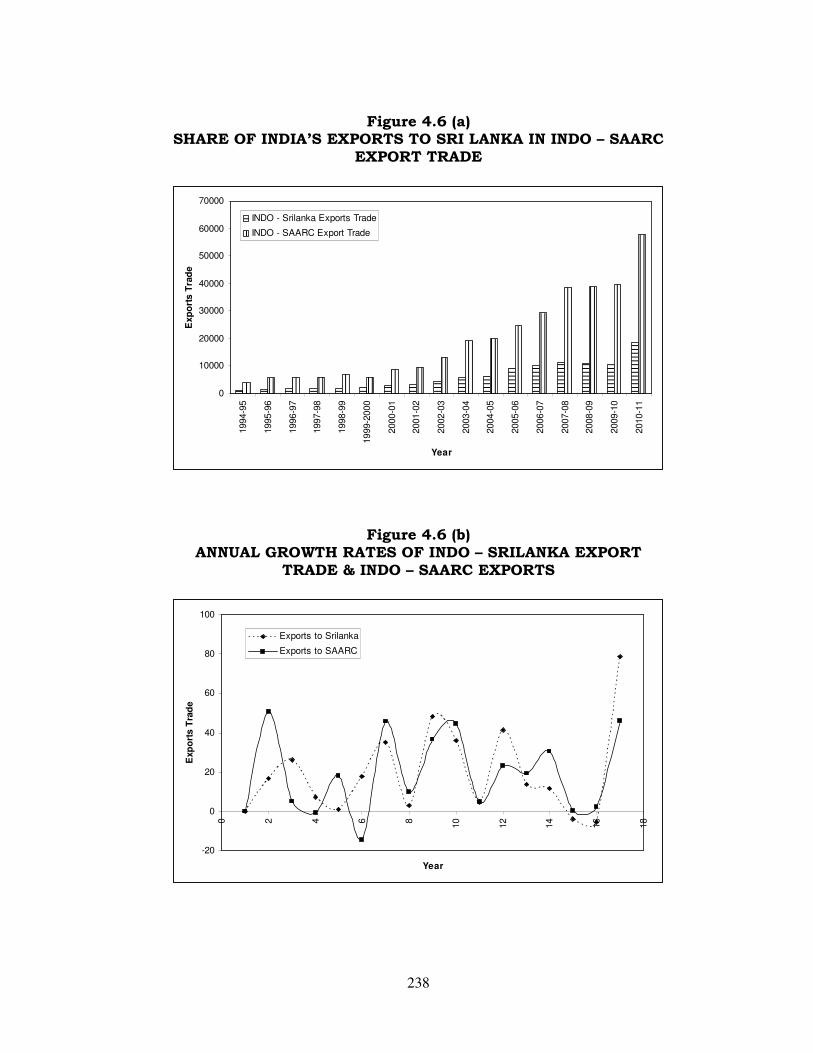
238
Figure 4.6 (a) SHARE OF INDIA’S EXPORTS TO SRI LANKA IN INDO – SAARC
EXPORT TRADE
0
10000
20000
30000
40000
50000
60000
70000
1994-9
5
1995-9
6
1996-9
7
1997-9
8
1998-9
9
1999-2
000
2000-0
1
2001-0
2
2002-0
3
2003-0
4
2004-0
5
2005-0
6
2006-0
7
2007-0
8
2008-0
9
2009-1
0
2010-1
1
Year
Exp
ort
s T
rad
e
INDO - Srilanka Exports Trade
INDO - SAARC Export Trade
Figure 4.6 (b) ANNUAL GROWTH RATES OF INDO – SRILANKA EXPORT
TRADE & INDO – SAARC EXPORTS
-20
0
20
40
60
80
100
0 2 4 6 8
10
12
14
16
18
Year
Exp
ort
s T
rad
e
Exports to Srilanka
Exports to SAARC
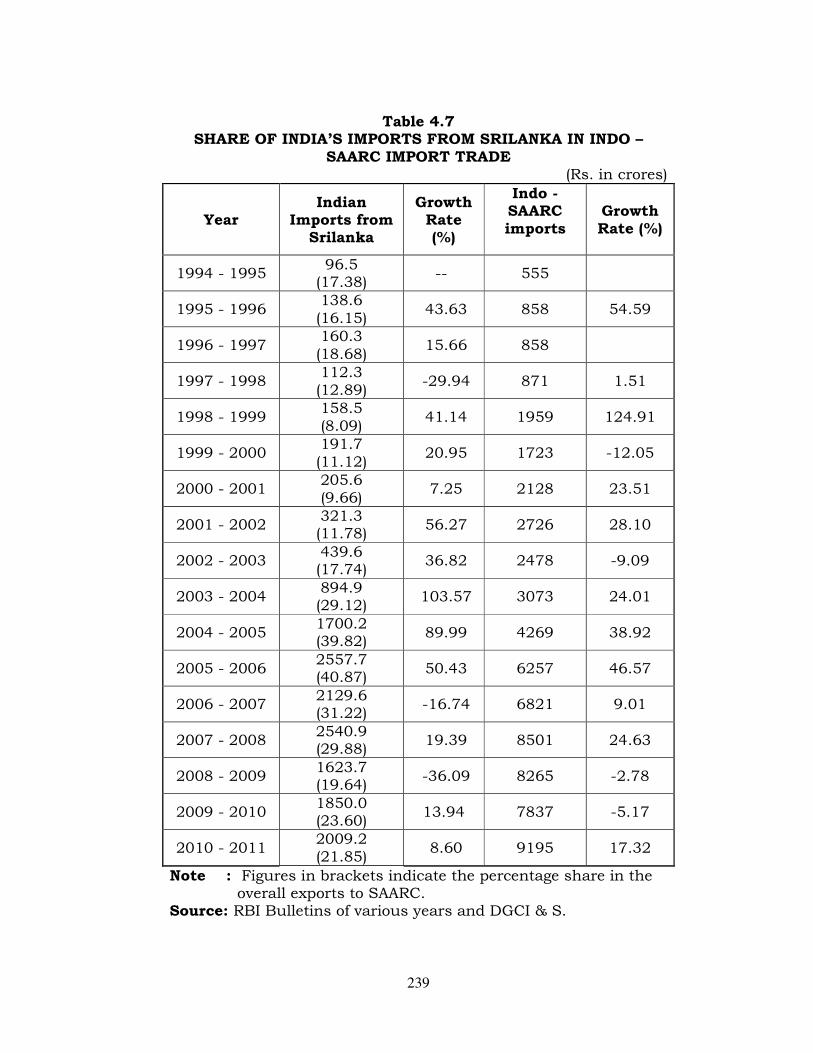
239
Table 4.7 SHARE OF INDIA’S IMPORTS FROM SRILANKA IN INDO –
SAARC IMPORT TRADE (Rs. in crores)
Year Indian
Imports from Srilanka
Growth Rate (%)
Indo - SAARC imports
Growth Rate (%)
1994 - 1995 96.5
(17.38) -- 555
1995 - 1996 138.6 (16.15)
43.63 858 54.59
1996 - 1997 160.3 (18.68)
15.66 858
1997 - 1998 112.3 (12.89)
-29.94 871 1.51
1998 - 1999 158.5 (8.09)
41.14 1959 124.91
1999 - 2000 191.7 (11.12)
20.95 1723 -12.05
2000 - 2001 205.6 (9.66)
7.25 2128 23.51
2001 - 2002 321.3 (11.78)
56.27 2726 28.10
2002 - 2003 439.6 (17.74)
36.82 2478 -9.09
2003 - 2004 894.9 (29.12)
103.57 3073 24.01
2004 - 2005 1700.2 (39.82)
89.99 4269 38.92
2005 - 2006 2557.7 (40.87)
50.43 6257 46.57
2006 - 2007 2129.6 (31.22)
-16.74 6821 9.01
2007 - 2008 2540.9 (29.88)
19.39 8501 24.63
2008 - 2009 1623.7 (19.64)
-36.09 8265 -2.78
2009 - 2010 1850.0 (23.60)
13.94 7837 -5.17
2010 - 2011 2009.2 (21.85)
8.60 9195 17.32
Note : Figures in brackets indicate the percentage share in the overall exports to SAARC.
Source: RBI Bulletins of various years and DGCI & S.
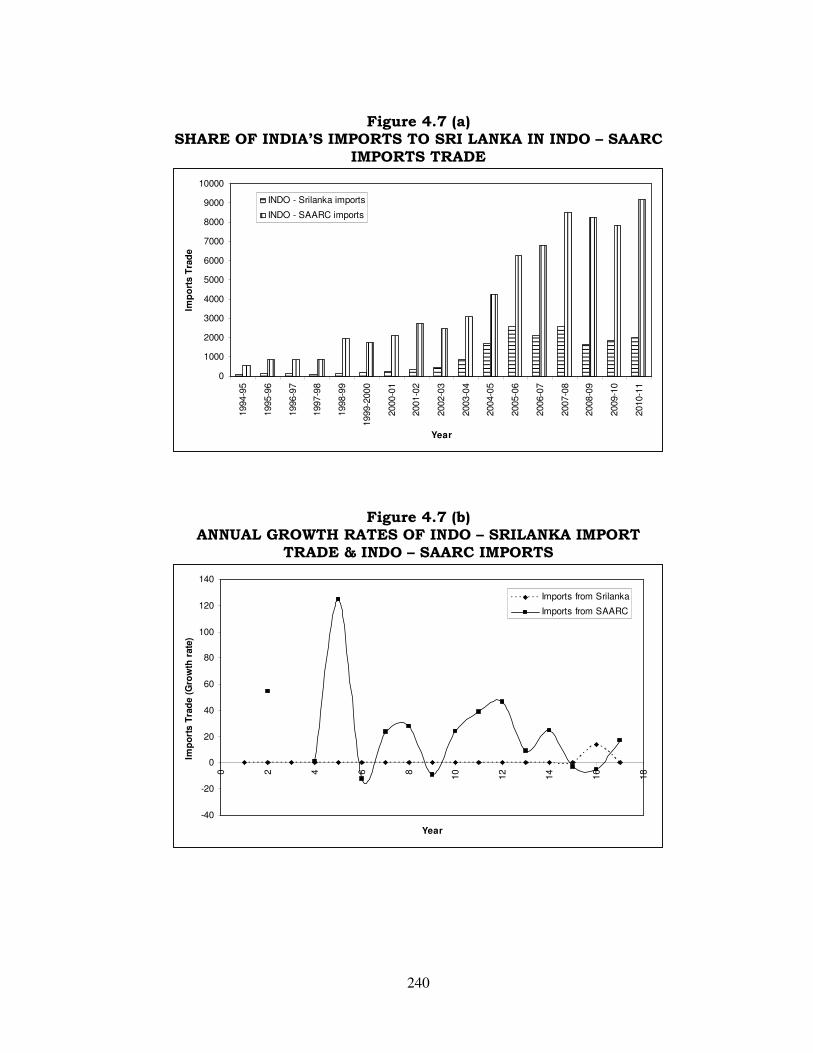
240
Figure 4.7 (a) SHARE OF INDIA’S IMPORTS TO SRI LANKA IN INDO – SAARC
IMPORTS TRADE
0
1000
2000
3000
4000
5000
6000
7000
8000
9000
10000
1994-9
5
1995-9
6
1996-9
7
1997-9
8
1998-9
9
1999-2
000
2000-0
1
2001-0
2
2002-0
3
2003-0
4
2004-0
5
2005-0
6
2006-0
7
2007-0
8
2008-0
9
2009-1
0
2010-1
1
Year
Imp
ort
s T
rad
e
INDO - Srilanka imports
INDO - SAARC imports
Figure 4.7 (b) ANNUAL GROWTH RATES OF INDO – SRILANKA IMPORT
TRADE & INDO – SAARC IMPORTS
-40
-20
0
20
40
60
80
100
120
140
0 2 4 6 8
10
12
14
16
18
Year
Imp
ort
s T
rad
e (
Gro
wth
rate
)
Imports from Srilanka
Imports from SAARC
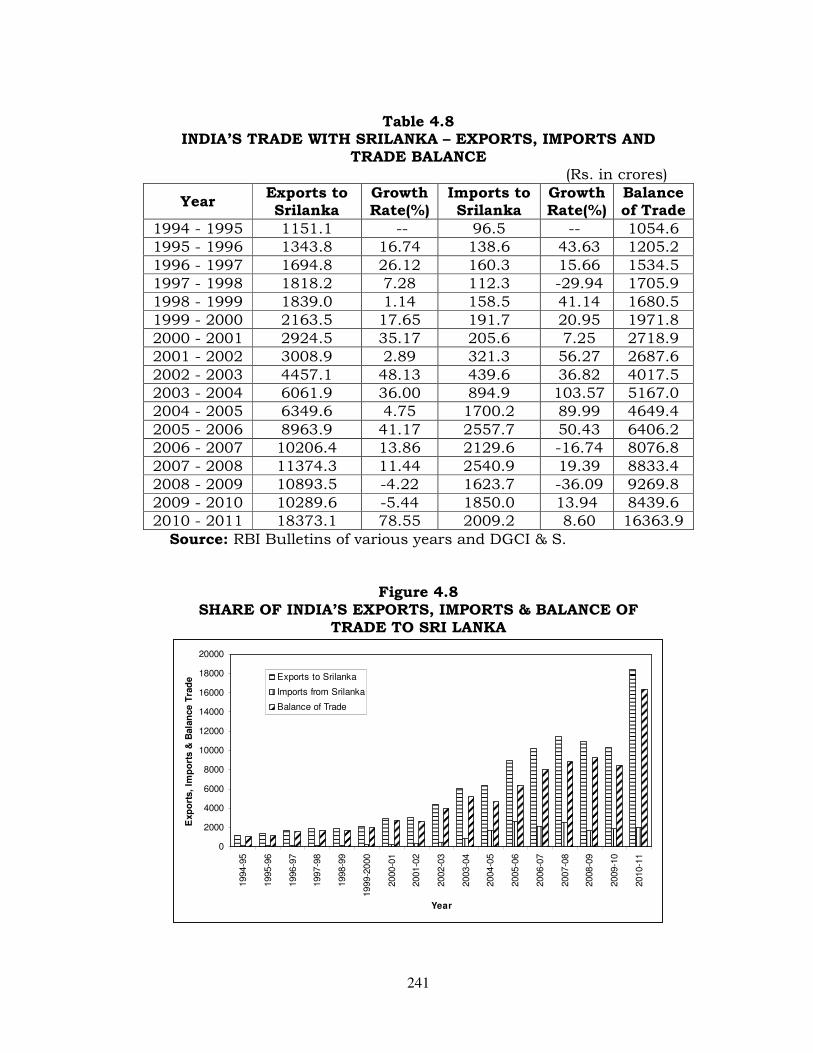
241
Table 4.8 INDIA’S TRADE WITH SRILANKA – EXPORTS, IMPORTS AND
TRADE BALANCE (Rs. in crores)
Year Exports to Srilanka
Growth Rate(%)
Imports to Srilanka
Growth Rate(%)
Balance of Trade
1994 - 1995 1151.1 -- 96.5 -- 1054.6 1995 - 1996 1343.8 16.74 138.6 43.63 1205.2 1996 - 1997 1694.8 26.12 160.3 15.66 1534.5 1997 - 1998 1818.2 7.28 112.3 -29.94 1705.9 1998 - 1999 1839.0 1.14 158.5 41.14 1680.5 1999 - 2000 2163.5 17.65 191.7 20.95 1971.8 2000 - 2001 2924.5 35.17 205.6 7.25 2718.9 2001 - 2002 3008.9 2.89 321.3 56.27 2687.6 2002 - 2003 4457.1 48.13 439.6 36.82 4017.5 2003 - 2004 6061.9 36.00 894.9 103.57 5167.0 2004 - 2005 6349.6 4.75 1700.2 89.99 4649.4 2005 - 2006 8963.9 41.17 2557.7 50.43 6406.2 2006 - 2007 10206.4 13.86 2129.6 -16.74 8076.8 2007 - 2008 11374.3 11.44 2540.9 19.39 8833.4 2008 - 2009 10893.5 -4.22 1623.7 -36.09 9269.8 2009 - 2010 10289.6 -5.44 1850.0 13.94 8439.6 2010 - 2011 18373.1 78.55 2009.2 8.60 16363.9
Source: RBI Bulletins of various years and DGCI & S.
Figure 4.8
SHARE OF INDIA’S EXPORTS, IMPORTS & BALANCE OF TRADE TO SRI LANKA
0
2000
4000
6000
8000
10000
12000
14000
16000
18000
20000
1994-9
5
1995-9
6
1996-9
7
1997-9
8
1998-9
9
1999-2
000
2000-0
1
2001-0
2
2002-0
3
2003-0
4
2004-0
5
2005-0
6
2006-0
7
2007-0
8
2008-0
9
2009-1
0
2010-1
1
Year
Exp
ort
s,
Imp
ort
s &
Bala
nce T
rad
e Exports to Srilanka
Imports from Srilanka
Balance of Trade
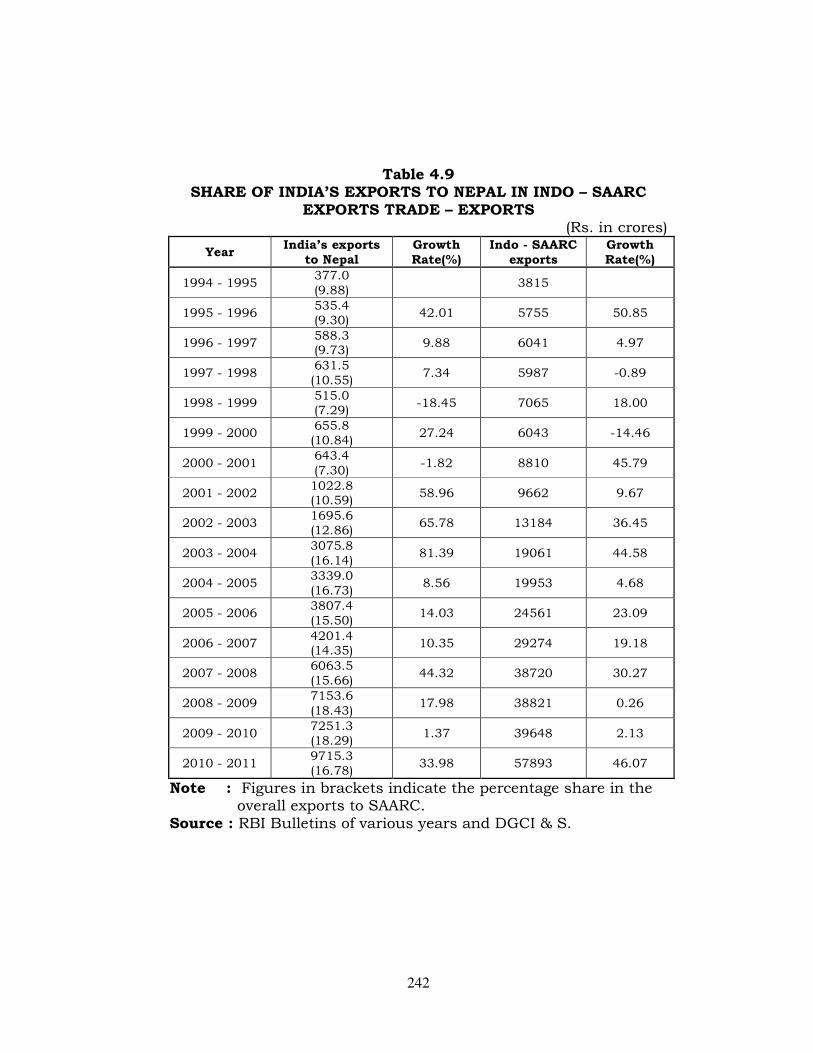
242
Table 4.9 SHARE OF INDIA’S EXPORTS TO NEPAL IN INDO – SAARC
EXPORTS TRADE – EXPORTS (Rs. in crores)
Year India’s exports
to Nepal
Growth
Rate(%)
Indo - SAARC
exports
Growth
Rate(%)
1994 - 1995 377.0 (9.88)
3815
1995 - 1996 535.4 (9.30)
42.01 5755 50.85
1996 - 1997 588.3 (9.73)
9.88 6041 4.97
1997 - 1998 631.5 (10.55)
7.34 5987 -0.89
1998 - 1999 515.0 (7.29)
-18.45 7065 18.00
1999 - 2000 655.8 (10.84)
27.24 6043 -14.46
2000 - 2001 643.4 (7.30)
-1.82 8810 45.79
2001 - 2002 1022.8 (10.59)
58.96 9662 9.67
2002 - 2003 1695.6 (12.86)
65.78 13184 36.45
2003 - 2004 3075.8 (16.14)
81.39 19061 44.58
2004 - 2005 3339.0 (16.73)
8.56 19953 4.68
2005 - 2006 3807.4 (15.50)
14.03 24561 23.09
2006 - 2007 4201.4 (14.35)
10.35 29274 19.18
2007 - 2008 6063.5 (15.66)
44.32 38720 30.27
2008 - 2009 7153.6 (18.43)
17.98 38821 0.26
2009 - 2010 7251.3 (18.29)
1.37 39648 2.13
2010 - 2011 9715.3 (16.78)
33.98 57893 46.07
Note : Figures in brackets indicate the percentage share in the overall exports to SAARC.
Source : RBI Bulletins of various years and DGCI & S.
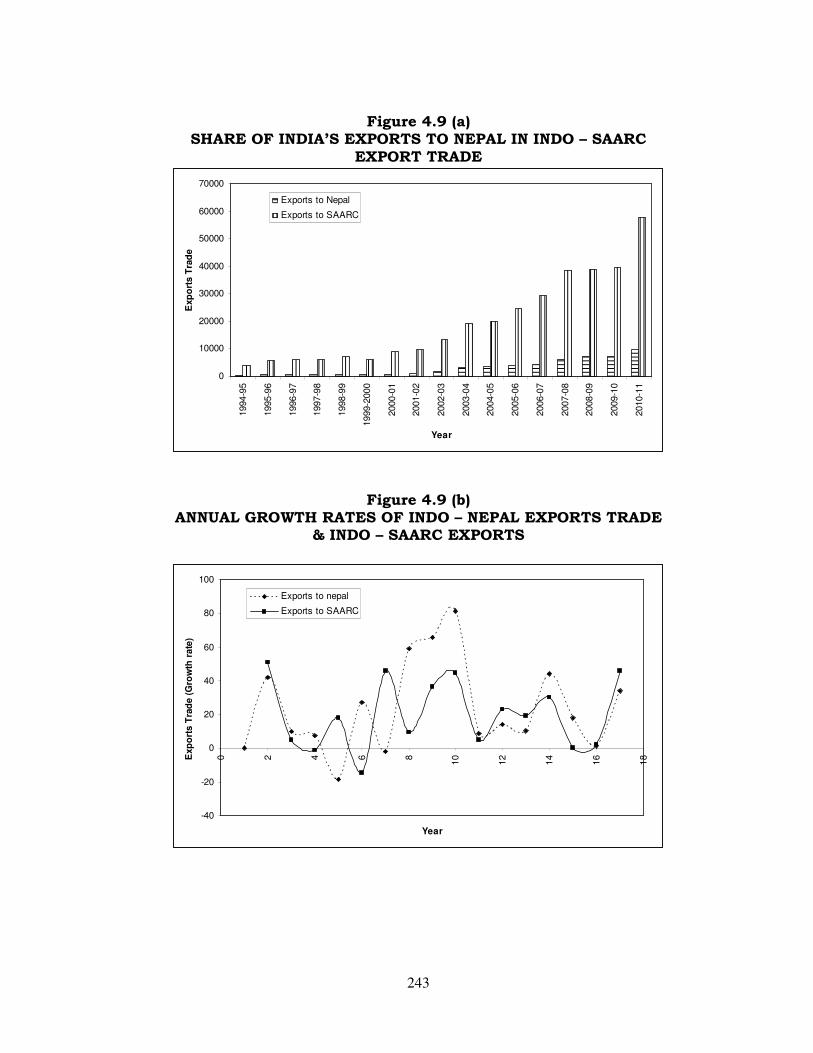
243
Figure 4.9 (a) SHARE OF INDIA’S EXPORTS TO NEPAL IN INDO – SAARC
EXPORT TRADE
0
10000
20000
30000
40000
50000
60000
70000
1994-9
5
1995-9
6
1996-9
7
1997-9
8
1998-9
9
1999-2
000
2000-0
1
2001-0
2
2002-0
3
2003-0
4
2004-0
5
2005-0
6
2006-0
7
2007-0
8
2008-0
9
2009-1
0
2010-1
1
Year
Exp
ort
s T
rad
e
Exports to Nepal
Exports to SAARC
Figure 4.9 (b) ANNUAL GROWTH RATES OF INDO – NEPAL EXPORTS TRADE
& INDO – SAARC EXPORTS
-40
-20
0
20
40
60
80
100
0 2 4 6 8
10
12
14
16
18
Year
Exp
ort
s T
rad
e (
Gro
wth
rate
)
Exports to nepal
Exports to SAARC
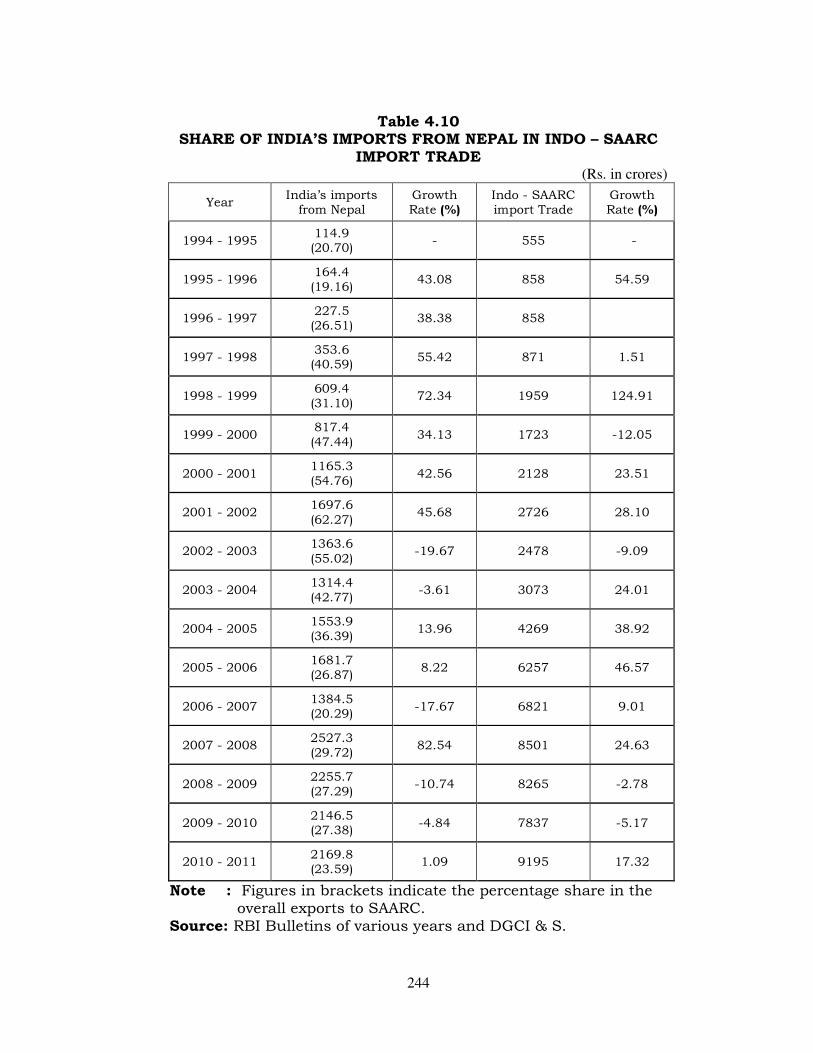
244
Table 4.10 SHARE OF INDIA’S IMPORTS FROM NEPAL IN INDO – SAARC
IMPORT TRADE
(Rs. in crores)
Year India’s imports
from Nepal Growth Rate (%)
Indo - SAARC import Trade
Growth Rate (%)
1994 - 1995 114.9 (20.70)
- 555 -
1995 - 1996 164.4 (19.16)
43.08 858 54.59
1996 - 1997 227.5 (26.51)
38.38 858
1997 - 1998 353.6 (40.59)
55.42 871 1.51
1998 - 1999 609.4 (31.10)
72.34 1959 124.91
1999 - 2000 817.4 (47.44)
34.13 1723 -12.05
2000 - 2001 1165.3 (54.76)
42.56 2128 23.51
2001 - 2002 1697.6 (62.27)
45.68 2726 28.10
2002 - 2003 1363.6 (55.02)
-19.67 2478 -9.09
2003 - 2004 1314.4 (42.77)
-3.61 3073 24.01
2004 - 2005 1553.9 (36.39)
13.96 4269 38.92
2005 - 2006 1681.7 (26.87)
8.22 6257 46.57
2006 - 2007 1384.5 (20.29)
-17.67 6821 9.01
2007 - 2008 2527.3 (29.72)
82.54 8501 24.63
2008 - 2009 2255.7 (27.29)
-10.74 8265 -2.78
2009 - 2010 2146.5 (27.38)
-4.84 7837 -5.17
2010 - 2011 2169.8 (23.59)
1.09 9195 17.32
Note : Figures in brackets indicate the percentage share in the overall exports to SAARC.
Source: RBI Bulletins of various years and DGCI & S.
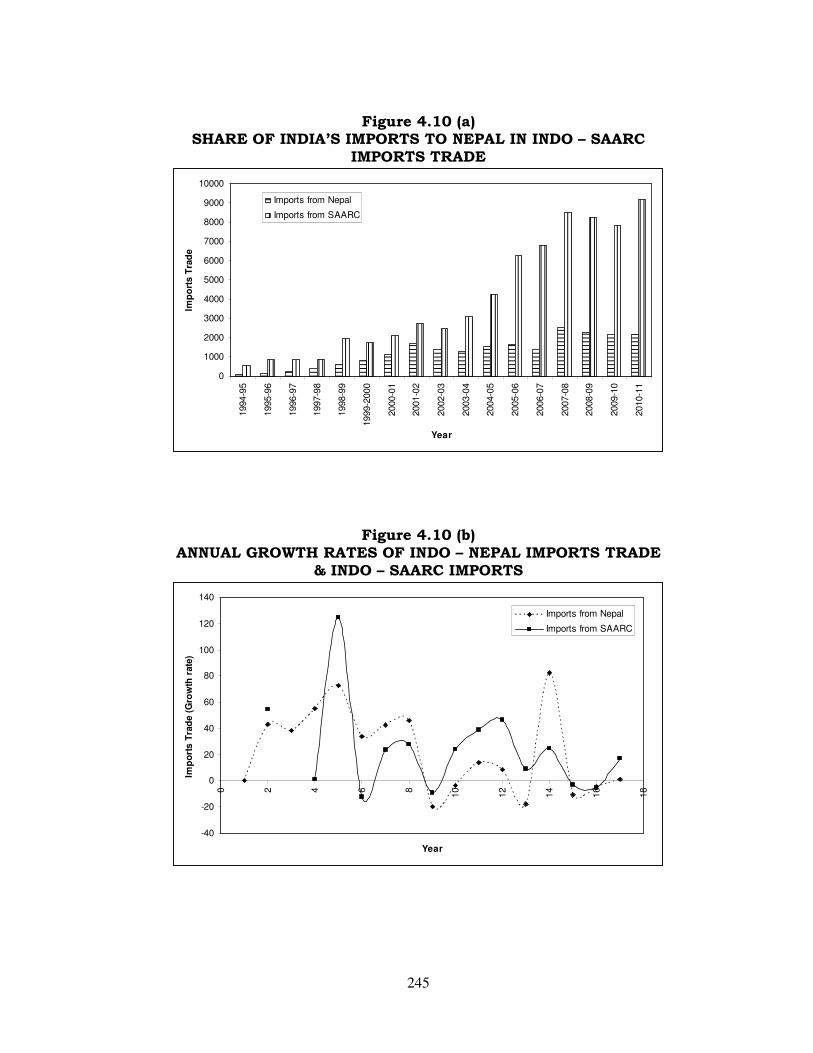
245
Figure 4.10 (a) SHARE OF INDIA’S IMPORTS TO NEPAL IN INDO – SAARC
IMPORTS TRADE
0
1000
2000
3000
4000
5000
6000
7000
8000
9000
10000
1994-9
5
1995-9
6
1996-9
7
1997-9
8
1998-9
9
1999-2
000
2000-0
1
2001-0
2
2002-0
3
2003-0
4
2004-0
5
2005-0
6
2006-0
7
2007-0
8
2008-0
9
2009-1
0
2010-1
1
Year
Imp
ort
s T
rad
e
Imports from Nepal
Imports from SAARC
Figure 4.10 (b) ANNUAL GROWTH RATES OF INDO – NEPAL IMPORTS TRADE
& INDO – SAARC IMPORTS
-40
-20
0
20
40
60
80
100
120
140
0 2 4 6 8
10
12
14
16
18
Year
Imp
ort
s T
rad
e (
Gro
wth
rate
)
Imports from Nepal
Imports from SAARC
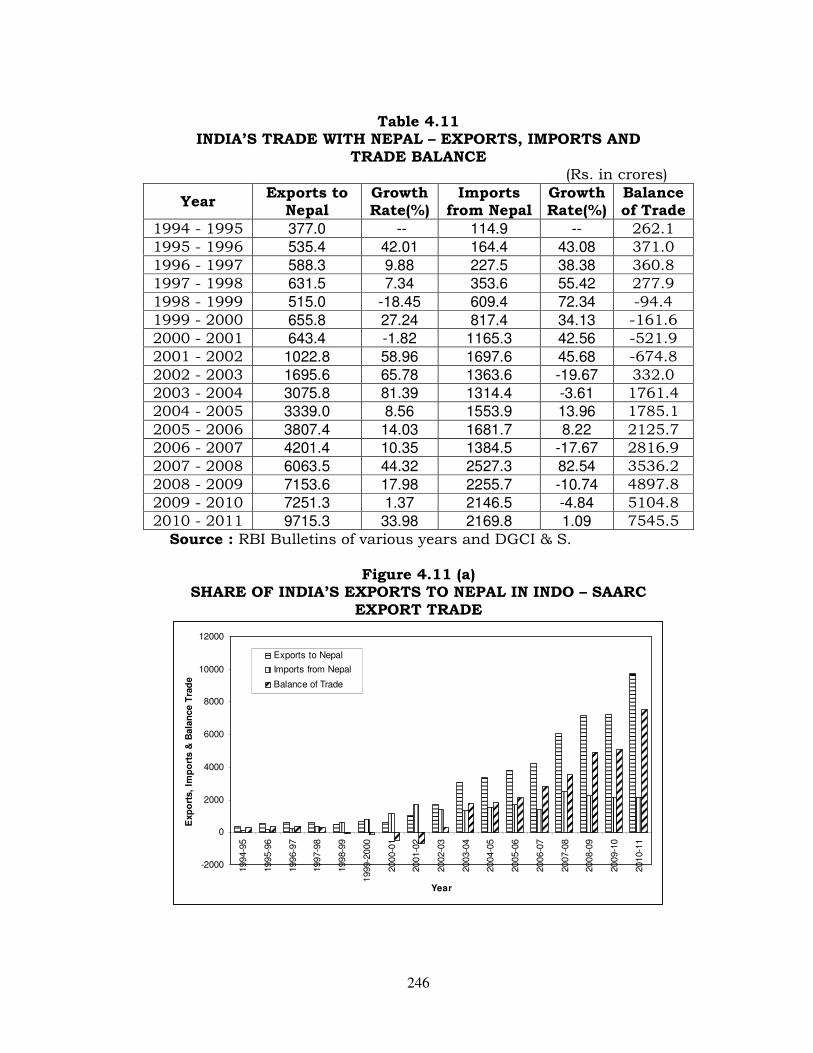
246
Table 4.11 INDIA’S TRADE WITH NEPAL – EXPORTS, IMPORTS AND
TRADE BALANCE (Rs. in crores)
Year Exports to
Nepal Growth Rate(%)
Imports from Nepal
Growth Rate(%)
Balance of Trade
1994 - 1995 377.0 -- 114.9 -- 262.1 1995 - 1996 535.4 42.01 164.4 43.08 371.0 1996 - 1997 588.3 9.88 227.5 38.38 360.8 1997 - 1998 631.5 7.34 353.6 55.42 277.9 1998 - 1999 515.0 -18.45 609.4 72.34 -94.4 1999 - 2000 655.8 27.24 817.4 34.13 -161.6 2000 - 2001 643.4 -1.82 1165.3 42.56 -521.9 2001 - 2002 1022.8 58.96 1697.6 45.68 -674.8 2002 - 2003 1695.6 65.78 1363.6 -19.67 332.0 2003 - 2004 3075.8 81.39 1314.4 -3.61 1761.4 2004 - 2005 3339.0 8.56 1553.9 13.96 1785.1 2005 - 2006 3807.4 14.03 1681.7 8.22 2125.7 2006 - 2007 4201.4 10.35 1384.5 -17.67 2816.9 2007 - 2008 6063.5 44.32 2527.3 82.54 3536.2 2008 - 2009 7153.6 17.98 2255.7 -10.74 4897.8 2009 - 2010 7251.3 1.37 2146.5 -4.84 5104.8 2010 - 2011 9715.3 33.98 2169.8 1.09 7545.5
Source : RBI Bulletins of various years and DGCI & S.
Figure 4.11 (a) SHARE OF INDIA’S EXPORTS TO NEPAL IN INDO – SAARC
EXPORT TRADE
-2000
0
2000
4000
6000
8000
10000
12000
1994-9
5
1995-9
6
1996-9
7
1997-9
8
1998-9
9
1999-2
000
2000-0
1
2001-0
2
2002-0
3
2003-0
4
2004-0
5
2005-0
6
2006-0
7
2007-0
8
2008-0
9
2009-1
0
2010-1
1
Year
Exp
ort
s,
Imp
ort
s &
Bala
nce T
rad
e
Exports to Nepal
Imports from Nepal
Balance of Trade
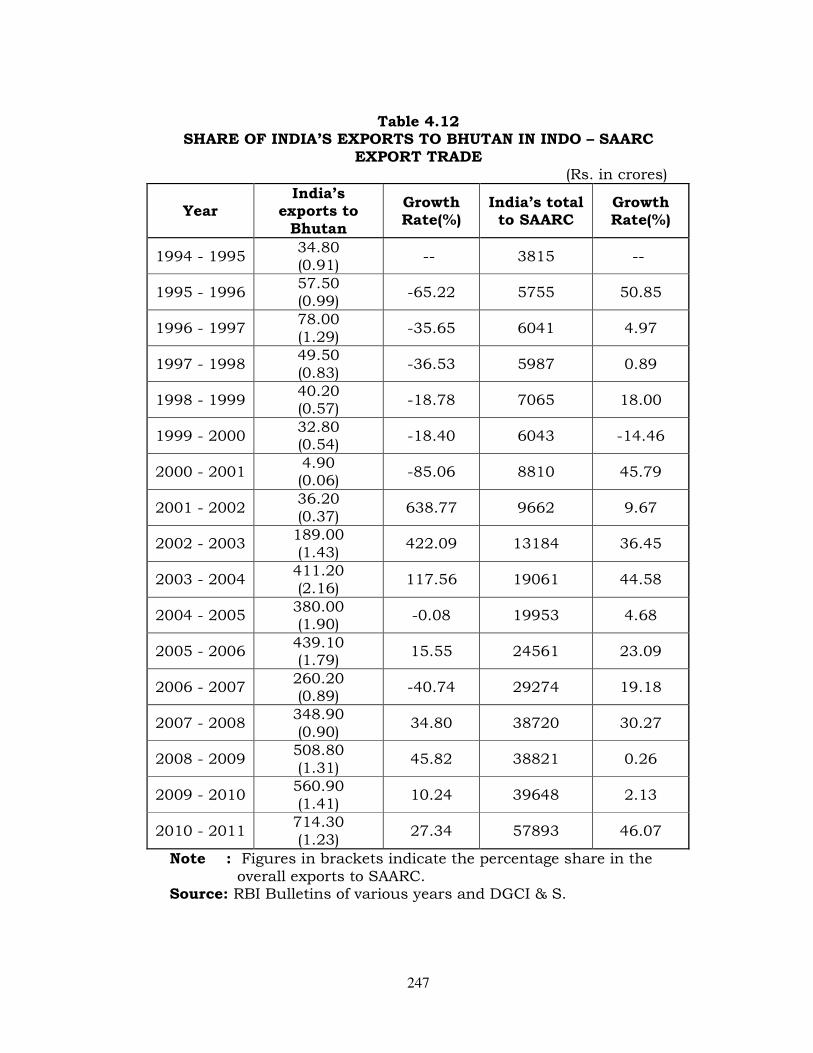
247
Table 4.12 SHARE OF INDIA’S EXPORTS TO BHUTAN IN INDO – SAARC
EXPORT TRADE (Rs. in crores)
Year India’s
exports to Bhutan
Growth Rate(%)
India’s total to SAARC
Growth Rate(%)
1994 - 1995 34.80 (0.91)
-- 3815 --
1995 - 1996 57.50 (0.99)
-65.22 5755 50.85
1996 - 1997 78.00 (1.29)
-35.65 6041 4.97
1997 - 1998 49.50 (0.83)
-36.53 5987 0.89
1998 - 1999 40.20 (0.57)
-18.78 7065 18.00
1999 - 2000 32.80 (0.54)
-18.40 6043 -14.46
2000 - 2001 4.90 (0.06)
-85.06 8810 45.79
2001 - 2002 36.20 (0.37)
638.77 9662 9.67
2002 - 2003 189.00 (1.43)
422.09 13184 36.45
2003 - 2004 411.20 (2.16)
117.56 19061 44.58
2004 - 2005 380.00 (1.90)
-0.08 19953 4.68
2005 - 2006 439.10 (1.79)
15.55 24561 23.09
2006 - 2007 260.20 (0.89)
-40.74 29274 19.18
2007 - 2008 348.90 (0.90)
34.80 38720 30.27
2008 - 2009 508.80 (1.31)
45.82 38821 0.26
2009 - 2010 560.90 (1.41)
10.24 39648 2.13
2010 - 2011 714.30 (1.23)
27.34 57893 46.07
Note : Figures in brackets indicate the percentage share in the overall exports to SAARC.
Source: RBI Bulletins of various years and DGCI & S.
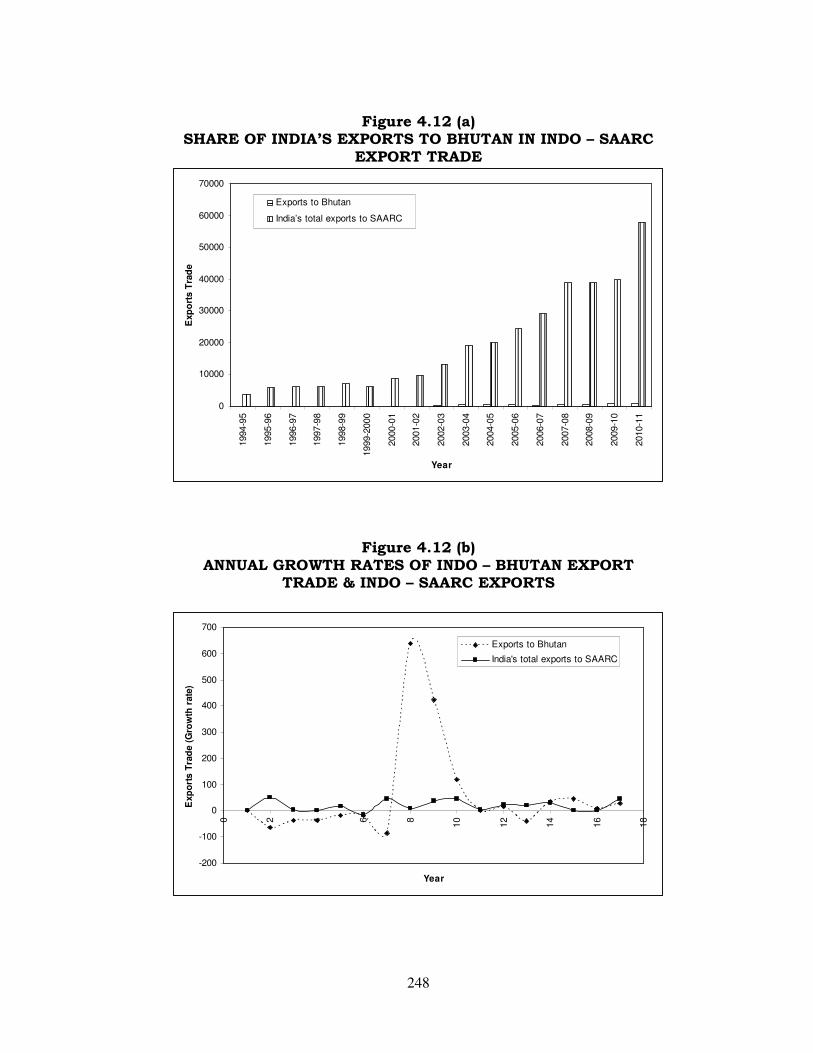
248
Figure 4.12 (a) SHARE OF INDIA’S EXPORTS TO BHUTAN IN INDO – SAARC
EXPORT TRADE
0
10000
20000
30000
40000
50000
60000
70000
1994-9
5
1995-9
6
1996-9
7
1997-9
8
1998-9
9
1999-2
000
2000-0
1
2001-0
2
2002-0
3
2003-0
4
2004-0
5
2005-0
6
2006-0
7
2007-0
8
2008-0
9
2009-1
0
2010-1
1
Year
Exp
ort
s T
rad
e
Exports to Bhutan
India’s total exports to SAARC
Figure 4.12 (b) ANNUAL GROWTH RATES OF INDO – BHUTAN EXPORT
TRADE & INDO – SAARC EXPORTS
-200
-100
0
100
200
300
400
500
600
700
0 2 4 6 8
10
12
14
16
18
Year
Exp
ort
s T
rad
e (
Gro
wth
rate
)
Exports to Bhutan
India's total exports to SAARC
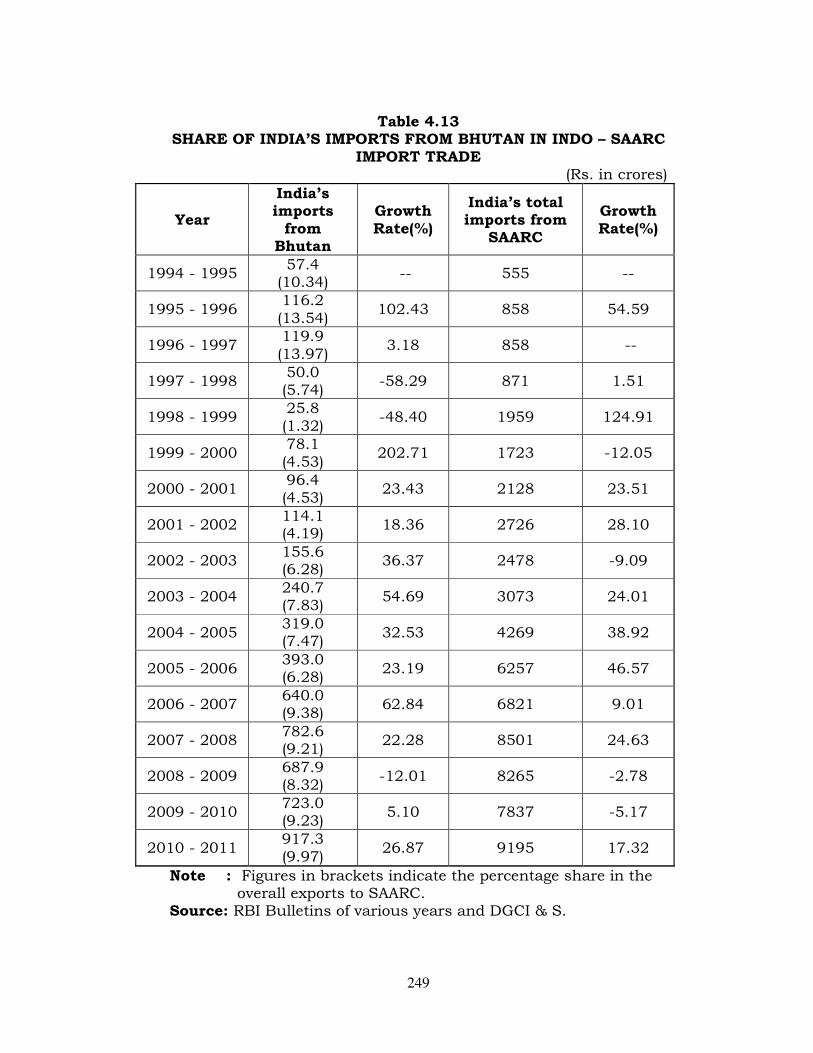
249
Table 4.13 SHARE OF INDIA’S IMPORTS FROM BHUTAN IN INDO – SAARC
IMPORT TRADE (Rs. in crores)
Year
India’s imports
from Bhutan
Growth Rate(%)
India’s total imports from
SAARC
Growth Rate(%)
1994 - 1995 57.4
(10.34) -- 555 --
1995 - 1996 116.2 (13.54)
102.43 858 54.59
1996 - 1997 119.9 (13.97)
3.18 858 --
1997 - 1998 50.0 (5.74)
-58.29 871 1.51
1998 - 1999 25.8 (1.32)
-48.40 1959 124.91
1999 - 2000 78.1 (4.53)
202.71 1723 -12.05
2000 - 2001 96.4 (4.53)
23.43 2128 23.51
2001 - 2002 114.1 (4.19)
18.36 2726 28.10
2002 - 2003 155.6 (6.28)
36.37 2478 -9.09
2003 - 2004 240.7 (7.83)
54.69 3073 24.01
2004 - 2005 319.0 (7.47)
32.53 4269 38.92
2005 - 2006 393.0 (6.28)
23.19 6257 46.57
2006 - 2007 640.0 (9.38)
62.84 6821 9.01
2007 - 2008 782.6 (9.21)
22.28 8501 24.63
2008 - 2009 687.9 (8.32)
-12.01 8265 -2.78
2009 - 2010 723.0 (9.23)
5.10 7837 -5.17
2010 - 2011 917.3 (9.97)
26.87 9195 17.32
Note : Figures in brackets indicate the percentage share in the overall exports to SAARC.
Source: RBI Bulletins of various years and DGCI & S.
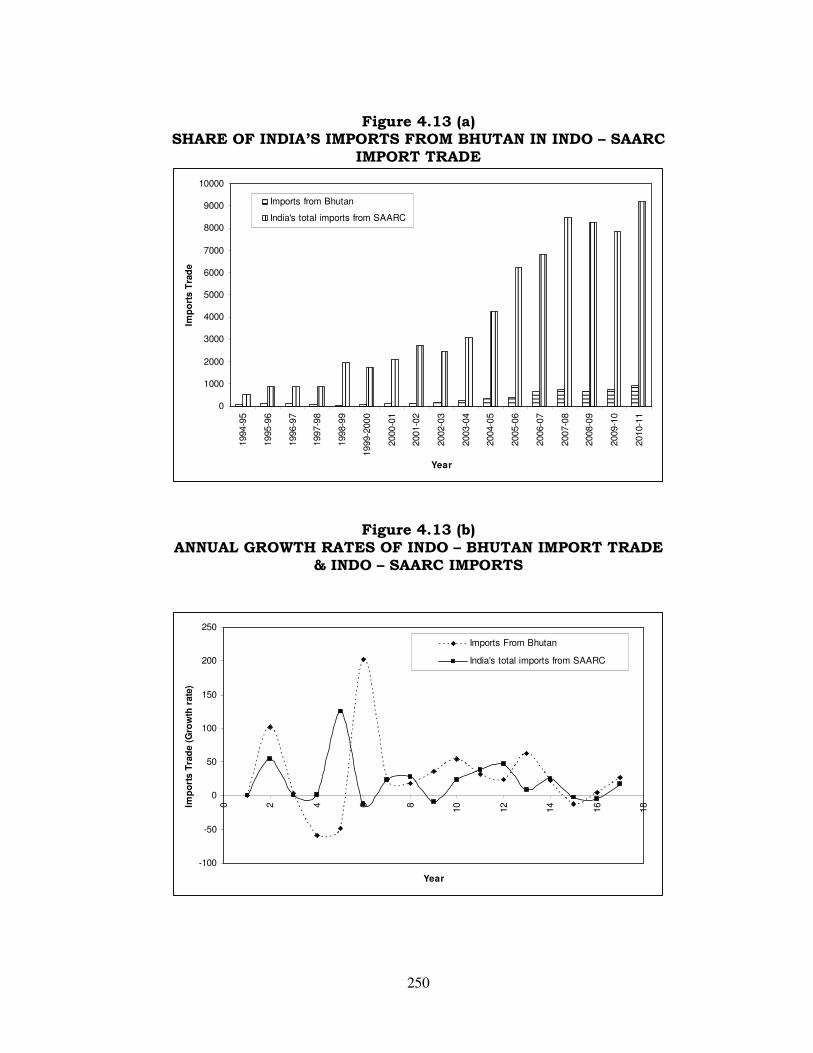
250
Figure 4.13 (a) SHARE OF INDIA’S IMPORTS FROM BHUTAN IN INDO – SAARC
IMPORT TRADE
0
1000
2000
3000
4000
5000
6000
7000
8000
9000
10000
1994-9
5
1995-9
6
1996-9
7
1997-9
8
1998-9
9
1999-2
000
2000-0
1
2001-0
2
2002-0
3
2003-0
4
2004-0
5
2005-0
6
2006-0
7
2007-0
8
2008-0
9
2009-1
0
2010-1
1
Year
Imp
ort
s T
rad
e
Imports from Bhutan
India's total imports from SAARC
Figure 4.13 (b) ANNUAL GROWTH RATES OF INDO – BHUTAN IMPORT TRADE
& INDO – SAARC IMPORTS
-100
-50
0
50
100
150
200
250
0 2 4 6 8
10
12
14
16
18
Year
Imp
ort
s T
rad
e (
Gro
wth
rate
)
Imports From Bhutan
India's total imports from SAARC
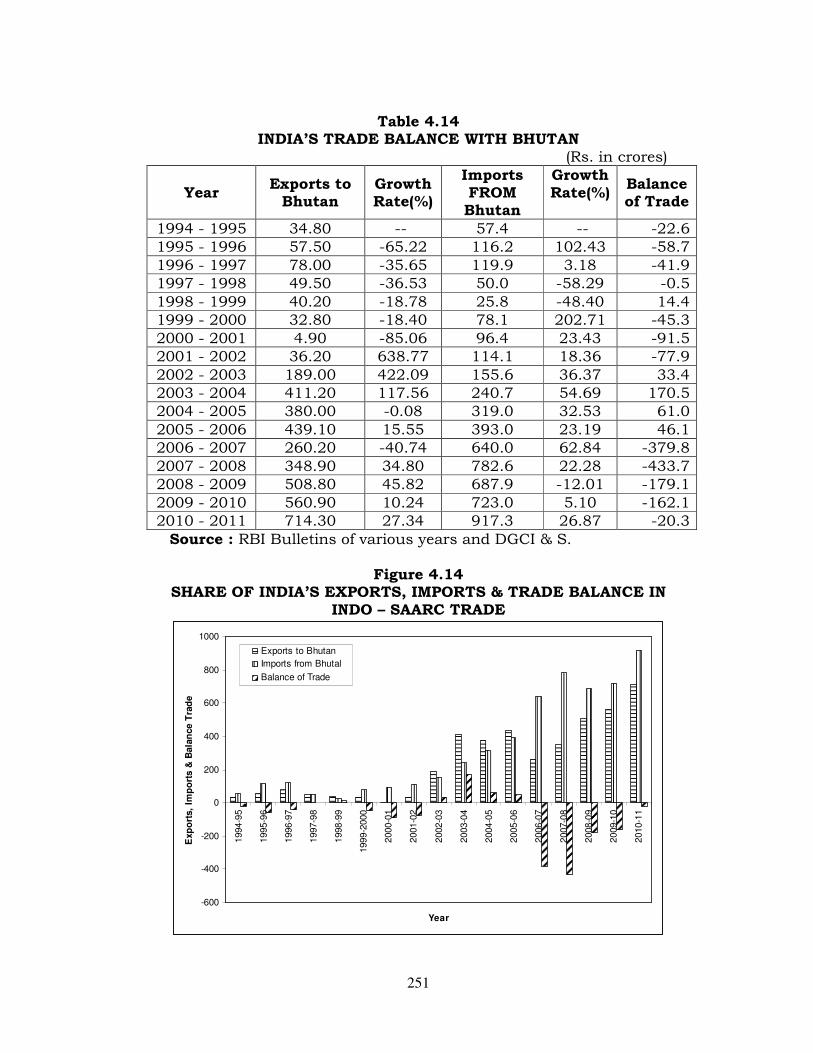
251
Table 4.14 INDIA’S TRADE BALANCE WITH BHUTAN
(Rs. in crores)
Year Exports to
Bhutan Growth Rate(%)
Imports FROM Bhutan
Growth Rate(%)
Balance of Trade
1994 - 1995 34.80 -- 57.4 -- -22.6 1995 - 1996 57.50 -65.22 116.2 102.43 -58.7 1996 - 1997 78.00 -35.65 119.9 3.18 -41.9 1997 - 1998 49.50 -36.53 50.0 -58.29 -0.5 1998 - 1999 40.20 -18.78 25.8 -48.40 14.4 1999 - 2000 32.80 -18.40 78.1 202.71 -45.3 2000 - 2001 4.90 -85.06 96.4 23.43 -91.5 2001 - 2002 36.20 638.77 114.1 18.36 -77.9 2002 - 2003 189.00 422.09 155.6 36.37 33.4 2003 - 2004 411.20 117.56 240.7 54.69 170.5 2004 - 2005 380.00 -0.08 319.0 32.53 61.0 2005 - 2006 439.10 15.55 393.0 23.19 46.1 2006 - 2007 260.20 -40.74 640.0 62.84 -379.8 2007 - 2008 348.90 34.80 782.6 22.28 -433.7 2008 - 2009 508.80 45.82 687.9 -12.01 -179.1 2009 - 2010 560.90 10.24 723.0 5.10 -162.1 2010 - 2011 714.30 27.34 917.3 26.87 -20.3
Source : RBI Bulletins of various years and DGCI & S.
Figure 4.14 SHARE OF INDIA’S EXPORTS, IMPORTS & TRADE BALANCE IN
INDO – SAARC TRADE
-600
-400
-200
0
200
400
600
800
1000
1994-9
5
1995-9
6
1996-9
7
1997-9
8
1998-9
9
1999-2
000
2000-0
1
2001-0
2
2002-0
3
2003-0
4
2004-0
5
2005-0
6
2006-0
7
2007-0
8
2008-0
9
2009-1
0
2010-1
1
Year
Exp
ort
s,
Imp
ort
s &
Bala
nce T
rad
e
Exports to Bhutan
Imports from Bhutal
Balance of Trade
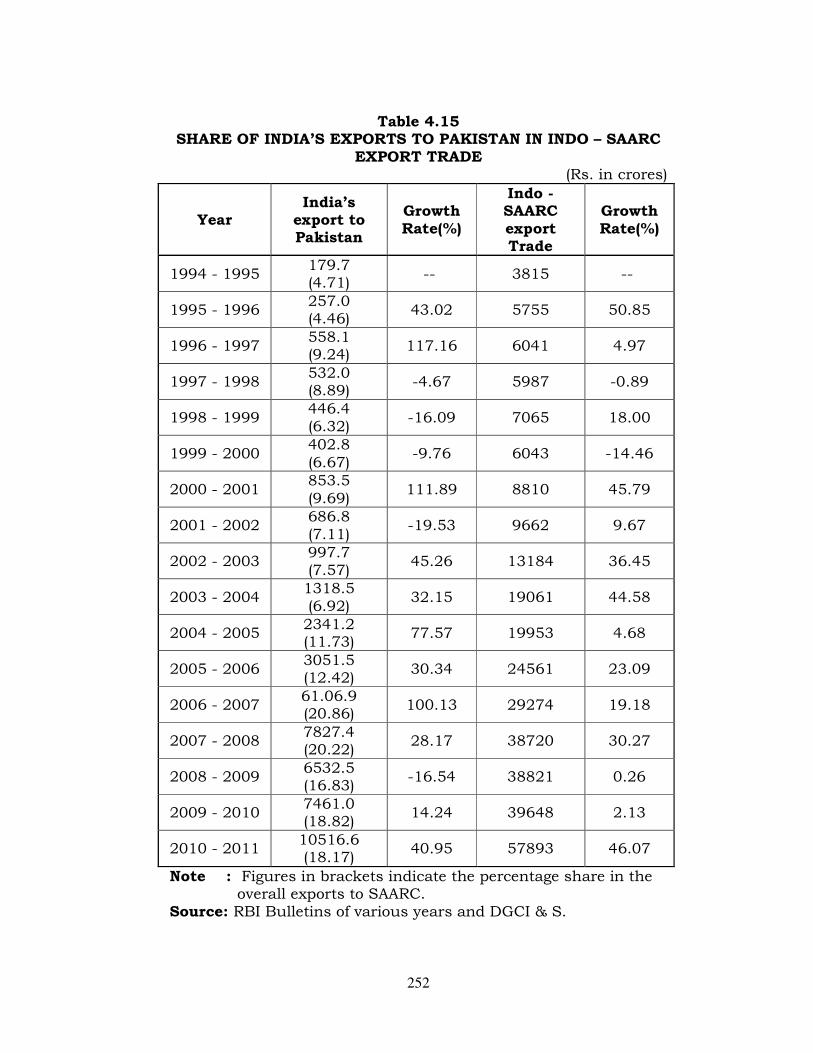
252
Table 4.15 SHARE OF INDIA’S EXPORTS TO PAKISTAN IN INDO – SAARC
EXPORT TRADE (Rs. in crores)
Year India’s
export to Pakistan
Growth Rate(%)
Indo - SAARC export Trade
Growth Rate(%)
1994 - 1995 179.7 (4.71)
-- 3815 --
1995 - 1996 257.0 (4.46)
43.02 5755 50.85
1996 - 1997 558.1 (9.24)
117.16 6041 4.97
1997 - 1998 532.0 (8.89)
-4.67 5987 -0.89
1998 - 1999 446.4 (6.32)
-16.09 7065 18.00
1999 - 2000 402.8 (6.67)
-9.76 6043 -14.46
2000 - 2001 853.5 (9.69)
111.89 8810 45.79
2001 - 2002 686.8 (7.11)
-19.53 9662 9.67
2002 - 2003 997.7 (7.57)
45.26 13184 36.45
2003 - 2004 1318.5 (6.92)
32.15 19061 44.58
2004 - 2005 2341.2 (11.73)
77.57 19953 4.68
2005 - 2006 3051.5 (12.42)
30.34 24561 23.09
2006 - 2007 61.06.9 (20.86)
100.13 29274 19.18
2007 - 2008 7827.4 (20.22)
28.17 38720 30.27
2008 - 2009 6532.5 (16.83)
-16.54 38821 0.26
2009 - 2010 7461.0 (18.82)
14.24 39648 2.13
2010 - 2011 10516.6 (18.17)
40.95 57893 46.07
Note : Figures in brackets indicate the percentage share in the overall exports to SAARC.
Source: RBI Bulletins of various years and DGCI & S.
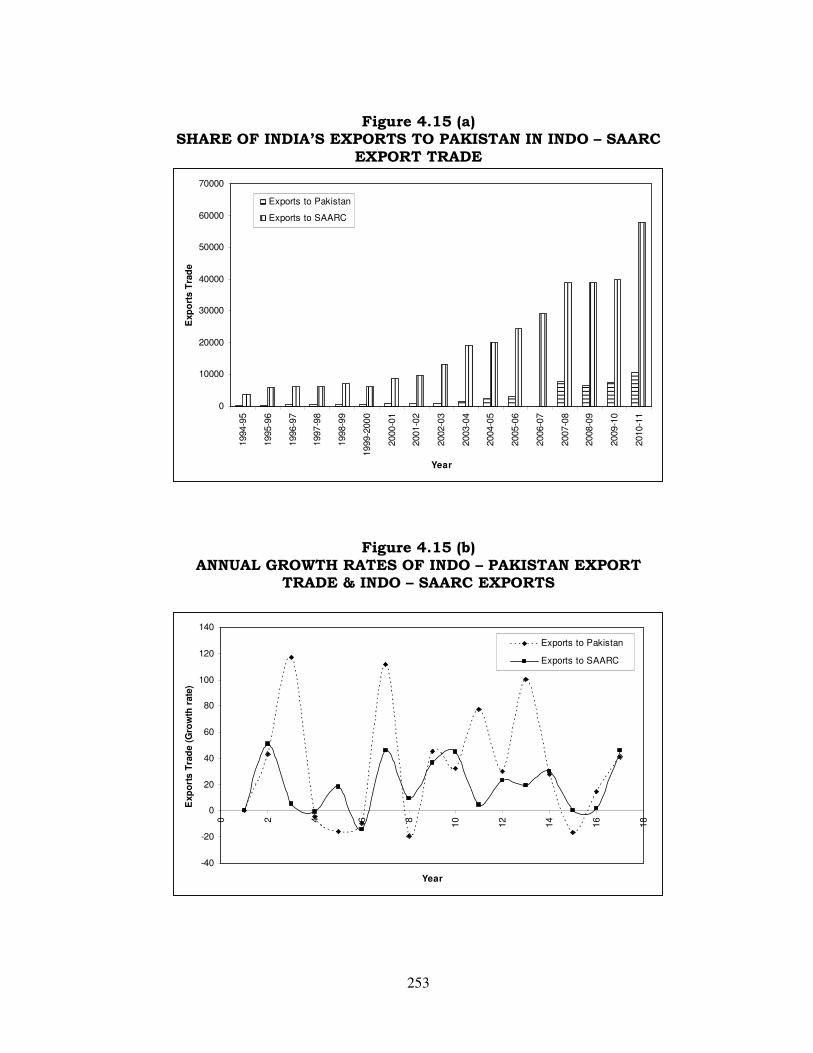
253
Figure 4.15 (a) SHARE OF INDIA’S EXPORTS TO PAKISTAN IN INDO – SAARC
EXPORT TRADE
0
10000
20000
30000
40000
50000
60000
70000
1994-9
5
1995-9
6
1996-9
7
1997-9
8
1998-9
9
1999-2
000
2000-0
1
2001-0
2
2002-0
3
2003-0
4
2004-0
5
2005-0
6
2006-0
7
2007-0
8
2008-0
9
2009-1
0
2010-1
1
Year
Exp
ort
s T
rad
e
Exports to Pakistan
Exports to SAARC
Figure 4.15 (b) ANNUAL GROWTH RATES OF INDO – PAKISTAN EXPORT
TRADE & INDO – SAARC EXPORTS
-40
-20
0
20
40
60
80
100
120
140
0 2 4 6 8
10
12
14
16
18
Year
Exp
ort
s T
rad
e (
Gro
wth
rate
)
Exports to Pakistan
Exports to SAARC
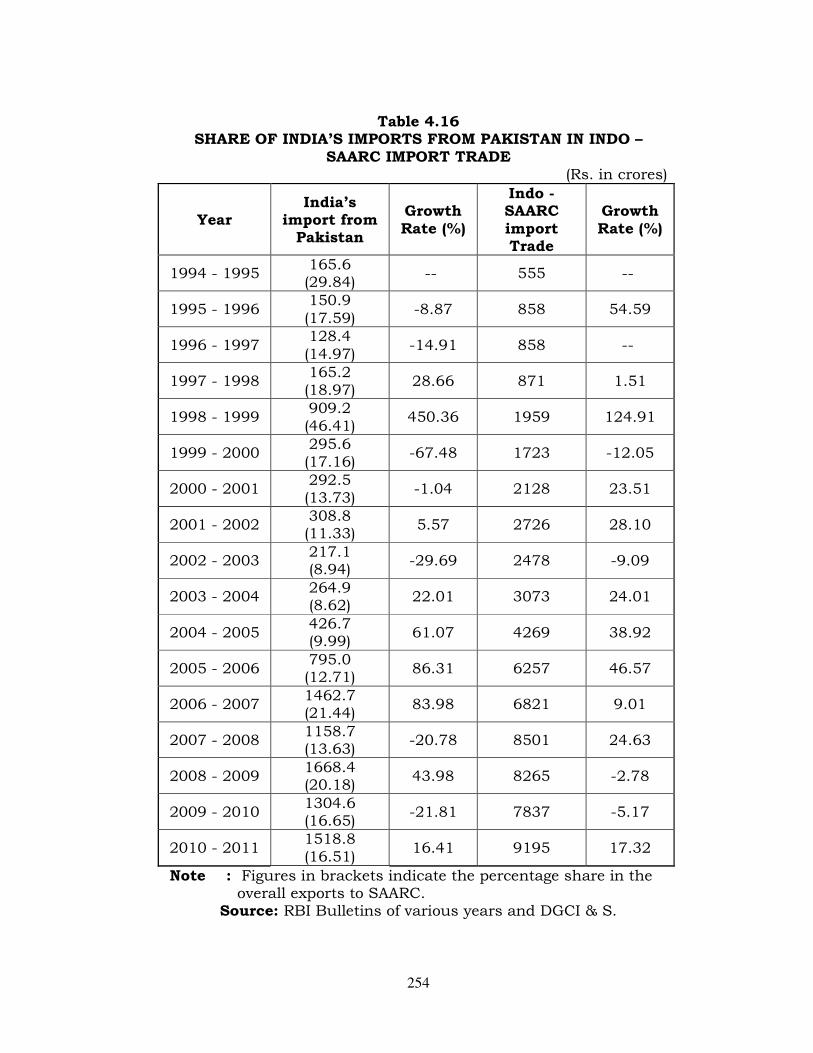
254
Table 4.16 SHARE OF INDIA’S IMPORTS FROM PAKISTAN IN INDO –
SAARC IMPORT TRADE (Rs. in crores)
Year India’s
import from Pakistan
Growth Rate (%)
Indo - SAARC import Trade
Growth Rate (%)
1994 - 1995 165.6 (29.84)
-- 555 --
1995 - 1996 150.9 (17.59)
-8.87 858 54.59
1996 - 1997 128.4 (14.97)
-14.91 858 --
1997 - 1998 165.2 (18.97)
28.66 871 1.51
1998 - 1999 909.2 (46.41)
450.36 1959 124.91
1999 - 2000 295.6 (17.16)
-67.48 1723 -12.05
2000 - 2001 292.5 (13.73)
-1.04 2128 23.51
2001 - 2002 308.8 (11.33)
5.57 2726 28.10
2002 - 2003 217.1 (8.94)
-29.69 2478 -9.09
2003 - 2004 264.9 (8.62)
22.01 3073 24.01
2004 - 2005 426.7 (9.99)
61.07 4269 38.92
2005 - 2006 795.0 (12.71)
86.31 6257 46.57
2006 - 2007 1462.7 (21.44)
83.98 6821 9.01
2007 - 2008 1158.7 (13.63)
-20.78 8501 24.63
2008 - 2009 1668.4 (20.18)
43.98 8265 -2.78
2009 - 2010 1304.6 (16.65)
-21.81 7837 -5.17
2010 - 2011 1518.8 (16.51)
16.41 9195 17.32
Note : Figures in brackets indicate the percentage share in the overall exports to SAARC.
Source: RBI Bulletins of various years and DGCI & S.
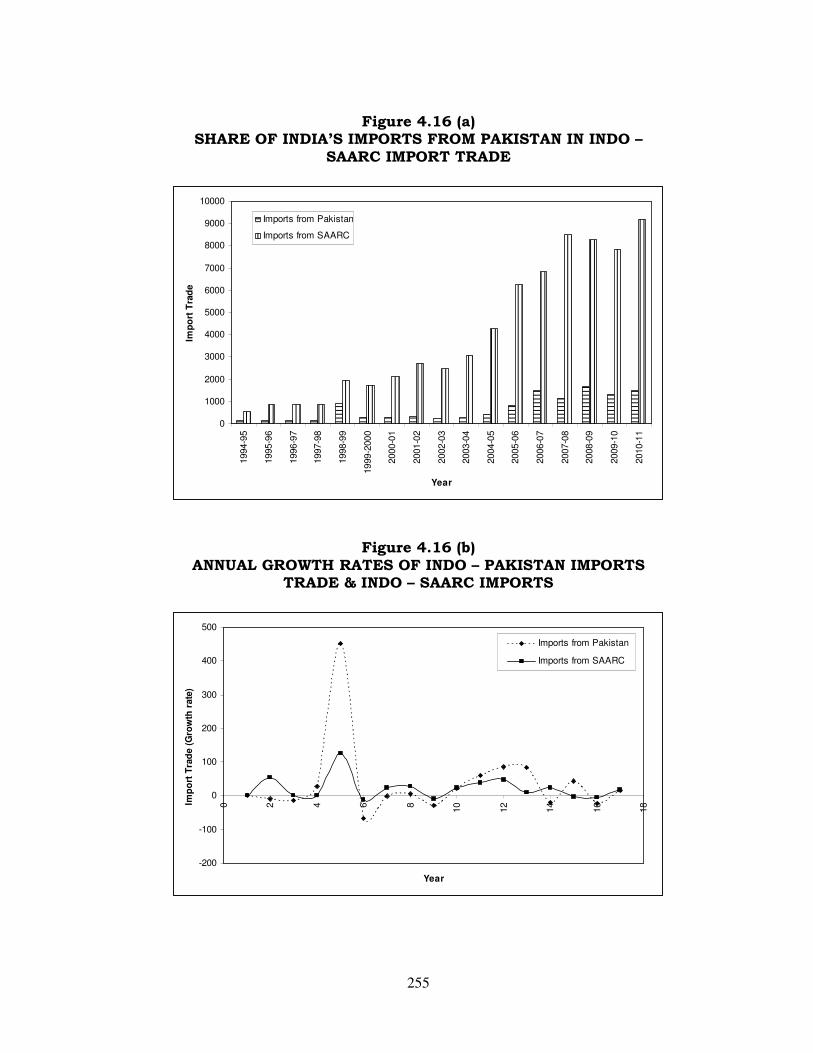
255
Figure 4.16 (a) SHARE OF INDIA’S IMPORTS FROM PAKISTAN IN INDO –
SAARC IMPORT TRADE
0
1000
2000
3000
4000
5000
6000
7000
8000
9000
10000
1994-9
5
1995-9
6
1996-9
7
1997-9
8
1998-9
9
1999-2
000
2000-0
1
2001-0
2
2002-0
3
2003-0
4
2004-0
5
2005-0
6
2006-0
7
2007-0
8
2008-0
9
2009-1
0
2010-1
1
Year
Imp
ort
Tra
de
Imports from Pakistan
Imports from SAARC
Figure 4.16 (b) ANNUAL GROWTH RATES OF INDO – PAKISTAN IMPORTS
TRADE & INDO – SAARC IMPORTS
-200
-100
0
100
200
300
400
500
0 2 4 6 8
10
12
14
16
18
Year
Imp
ort
Tra
de (
Gro
wth
rate
)
Imports from Pakistan
Imports from SAARC
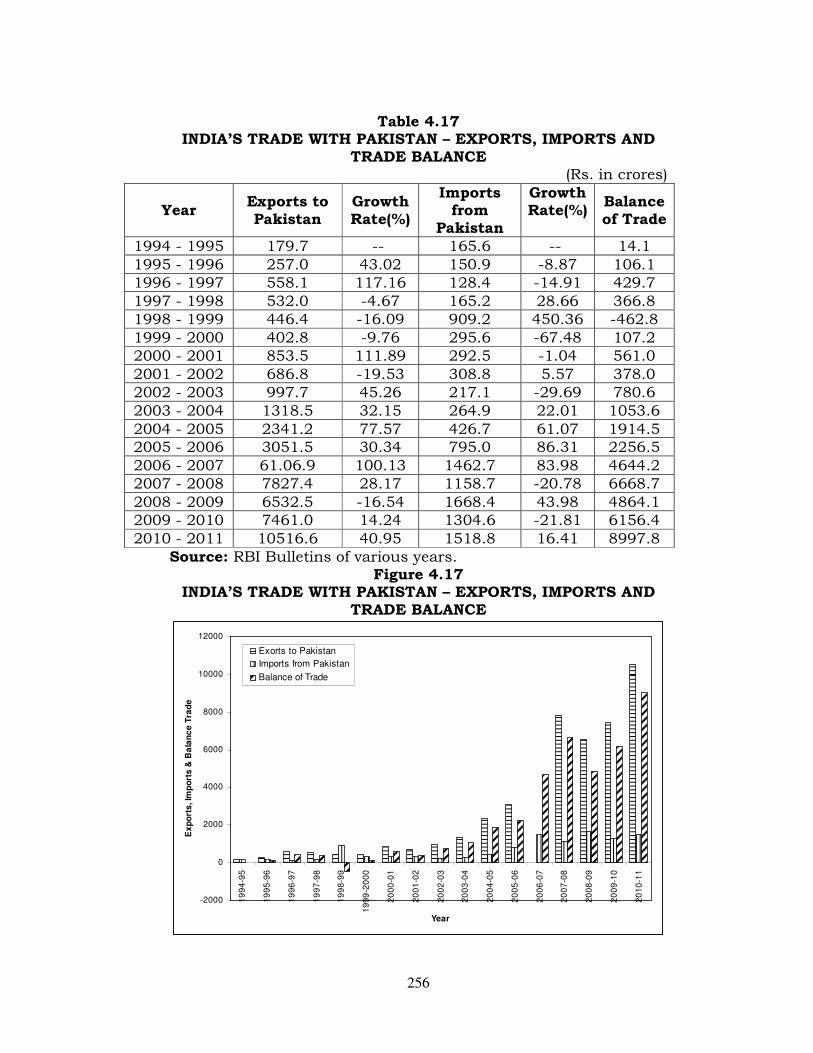
256
Table 4.17 INDIA’S TRADE WITH PAKISTAN – EXPORTS, IMPORTS AND
TRADE BALANCE (Rs. in crores)
Year Exports to Pakistan
Growth Rate(%)
Imports from
Pakistan
Growth Rate(%)
Balance of Trade
1994 - 1995 179.7 -- 165.6 -- 14.1 1995 - 1996 257.0 43.02 150.9 -8.87 106.1 1996 - 1997 558.1 117.16 128.4 -14.91 429.7 1997 - 1998 532.0 -4.67 165.2 28.66 366.8 1998 - 1999 446.4 -16.09 909.2 450.36 -462.8 1999 - 2000 402.8 -9.76 295.6 -67.48 107.2 2000 - 2001 853.5 111.89 292.5 -1.04 561.0 2001 - 2002 686.8 -19.53 308.8 5.57 378.0 2002 - 2003 997.7 45.26 217.1 -29.69 780.6 2003 - 2004 1318.5 32.15 264.9 22.01 1053.6 2004 - 2005 2341.2 77.57 426.7 61.07 1914.5 2005 - 2006 3051.5 30.34 795.0 86.31 2256.5 2006 - 2007 61.06.9 100.13 1462.7 83.98 4644.2 2007 - 2008 7827.4 28.17 1158.7 -20.78 6668.7 2008 - 2009 6532.5 -16.54 1668.4 43.98 4864.1 2009 - 2010 7461.0 14.24 1304.6 -21.81 6156.4 2010 - 2011 10516.6 40.95 1518.8 16.41 8997.8
Source: RBI Bulletins of various years. Figure 4.17
INDIA’S TRADE WITH PAKISTAN – EXPORTS, IMPORTS AND TRADE BALANCE
-2000
0
2000
4000
6000
8000
10000
12000
19
94
-95
19
95
-96
19
96
-97
19
97
-98
19
98
-99
19
99
-20
00
20
00
-01
20
01
-02
20
02
-03
20
03
-04
20
04
-05
20
05
-06
20
06
-07
20
07
-08
20
08
-09
20
09
-10
20
10
-11
Year
Ex
po
rts
, Im
po
rts
& B
ala
nc
e T
rad
e
Exorts to Pakistan
Imports from Pakistan
Balance of Trade
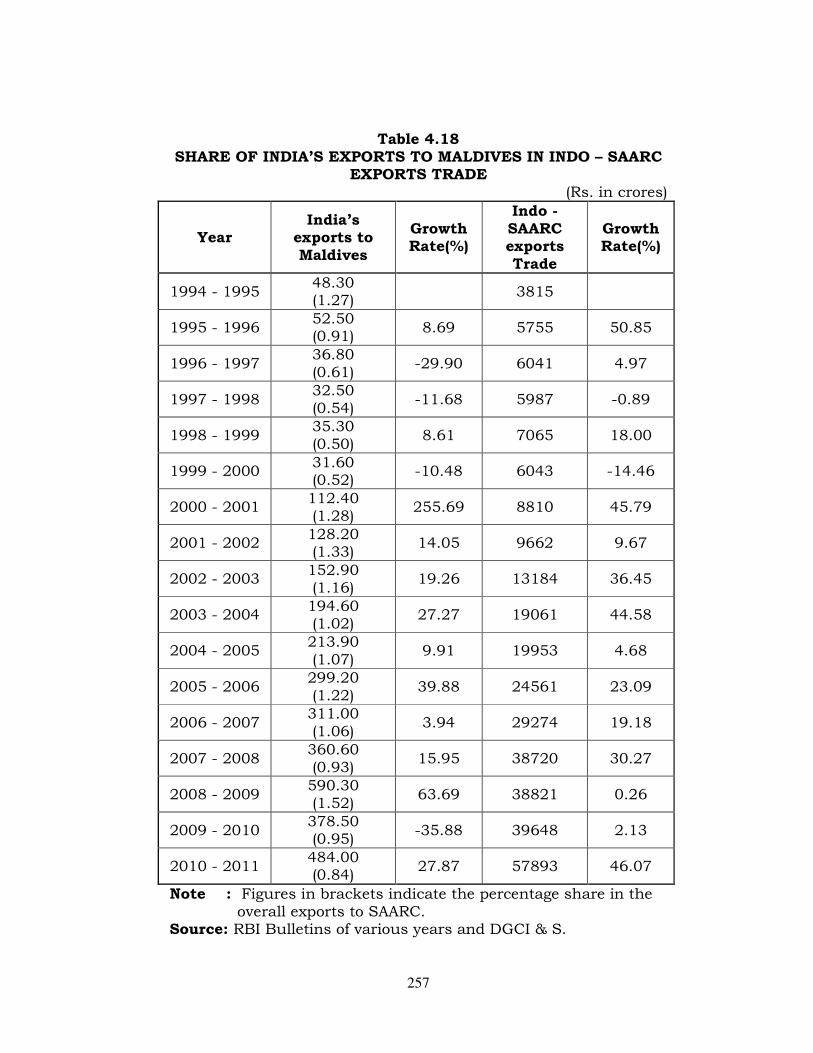
257
Table 4.18
SHARE OF INDIA’S EXPORTS TO MALDIVES IN INDO – SAARC EXPORTS TRADE
(Rs. in crores)
Year India’s
exports to Maldives
Growth Rate(%)
Indo - SAARC exports Trade
Growth Rate(%)
1994 - 1995 48.30 (1.27)
3815
1995 - 1996 52.50 (0.91)
8.69 5755 50.85
1996 - 1997 36.80 (0.61)
-29.90 6041 4.97
1997 - 1998 32.50 (0.54)
-11.68 5987 -0.89
1998 - 1999 35.30 (0.50)
8.61 7065 18.00
1999 - 2000 31.60 (0.52)
-10.48 6043 -14.46
2000 - 2001 112.40 (1.28)
255.69 8810 45.79
2001 - 2002 128.20 (1.33)
14.05 9662 9.67
2002 - 2003 152.90 (1.16)
19.26 13184 36.45
2003 - 2004 194.60 (1.02)
27.27 19061 44.58
2004 - 2005 213.90 (1.07)
9.91 19953 4.68
2005 - 2006 299.20 (1.22)
39.88 24561 23.09
2006 - 2007 311.00 (1.06)
3.94 29274 19.18
2007 - 2008 360.60 (0.93)
15.95 38720 30.27
2008 - 2009 590.30 (1.52)
63.69 38821 0.26
2009 - 2010 378.50 (0.95)
-35.88 39648 2.13
2010 - 2011 484.00 (0.84)
27.87 57893 46.07
Note : Figures in brackets indicate the percentage share in the overall exports to SAARC.
Source: RBI Bulletins of various years and DGCI & S.
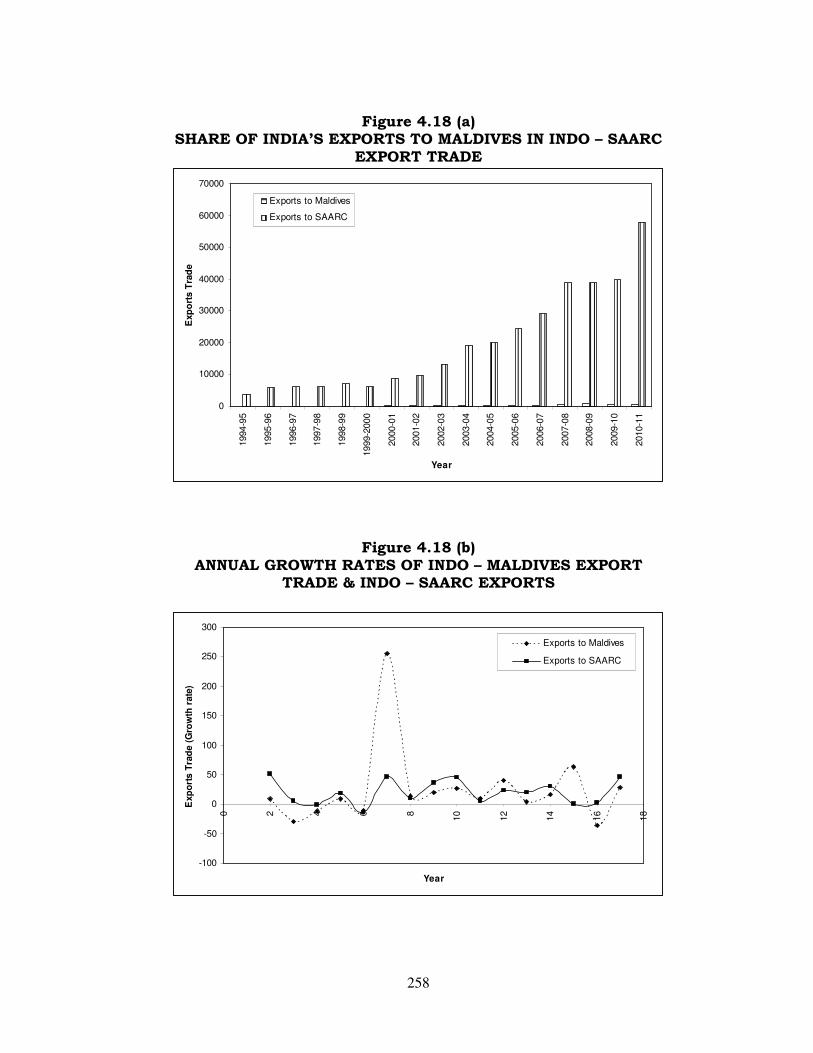
258
Figure 4.18 (a) SHARE OF INDIA’S EXPORTS TO MALDIVES IN INDO – SAARC
EXPORT TRADE
0
10000
20000
30000
40000
50000
60000
70000
1994-9
5
1995-9
6
1996-9
7
1997-9
8
1998-9
9
1999-2
000
2000-0
1
2001-0
2
2002-0
3
2003-0
4
2004-0
5
2005-0
6
2006-0
7
2007-0
8
2008-0
9
2009-1
0
2010-1
1
Year
Exp
ort
s T
rad
e
Exports to Maldives
Exports to SAARC
Figure 4.18 (b) ANNUAL GROWTH RATES OF INDO – MALDIVES EXPORT
TRADE & INDO – SAARC EXPORTS
-100
-50
0
50
100
150
200
250
300
0 2 4 6 8
10
12
14
16
18
Year
Exp
ort
s T
rad
e (
Gro
wth
rate
)
Exports to Maldives
Exports to SAARC
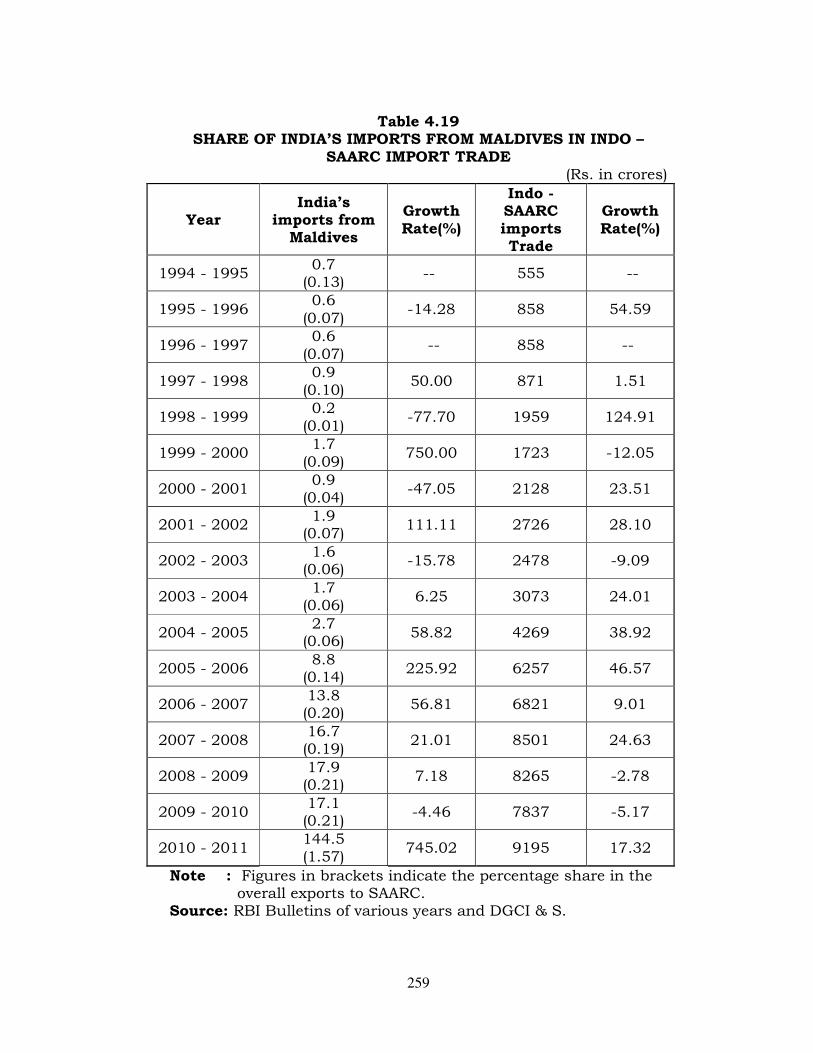
259
Table 4.19 SHARE OF INDIA’S IMPORTS FROM MALDIVES IN INDO –
SAARC IMPORT TRADE (Rs. in crores)
Year India’s
imports from Maldives
Growth Rate(%)
Indo - SAARC imports Trade
Growth Rate(%)
1994 - 1995 0.7
(0.13) -- 555 --
1995 - 1996 0.6
(0.07) -14.28 858 54.59
1996 - 1997 0.6
(0.07) -- 858 --
1997 - 1998 0.9
(0.10) 50.00 871 1.51
1998 - 1999 0.2
(0.01) -77.70 1959 124.91
1999 - 2000 1.7
(0.09) 750.00 1723 -12.05
2000 - 2001 0.9
(0.04) -47.05 2128 23.51
2001 - 2002 1.9
(0.07) 111.11 2726 28.10
2002 - 2003 1.6
(0.06) -15.78 2478 -9.09
2003 - 2004 1.7
(0.06) 6.25 3073 24.01
2004 - 2005 2.7
(0.06) 58.82 4269 38.92
2005 - 2006 8.8
(0.14) 225.92 6257 46.57
2006 - 2007 13.8 (0.20)
56.81 6821 9.01
2007 - 2008 16.7 (0.19)
21.01 8501 24.63
2008 - 2009 17.9 (0.21)
7.18 8265 -2.78
2009 - 2010 17.1 (0.21)
-4.46 7837 -5.17
2010 - 2011 144.5 (1.57)
745.02 9195 17.32
Note : Figures in brackets indicate the percentage share in the overall exports to SAARC.
Source: RBI Bulletins of various years and DGCI & S.
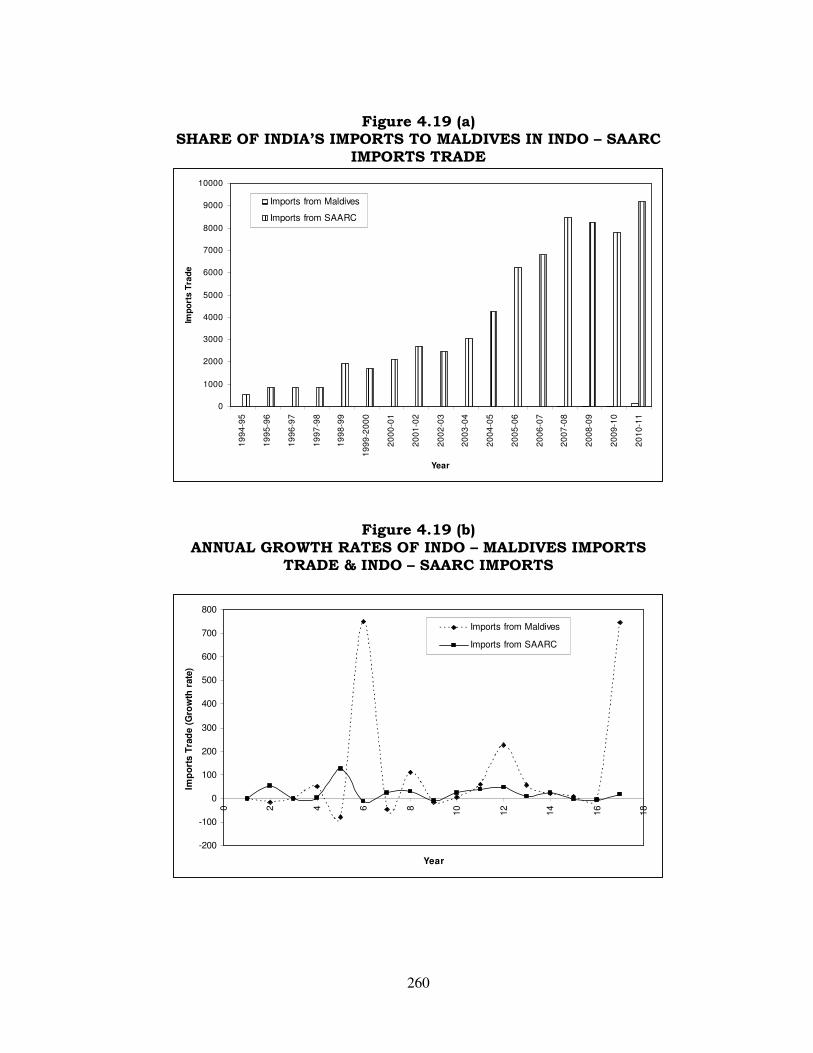
260
Figure 4.19 (a) SHARE OF INDIA’S IMPORTS TO MALDIVES IN INDO – SAARC
IMPORTS TRADE
0
1000
2000
3000
4000
5000
6000
7000
8000
9000
10000
19
94
-95
19
95
-96
19
96
-97
19
97
-98
19
98
-99
19
99
-20
00
20
00
-01
20
01
-02
20
02
-03
20
03
-04
20
04
-05
20
05
-06
20
06
-07
20
07
-08
20
08
-09
20
09
-10
20
10
-11
Year
Imp
ort
s T
rad
e
Imports from Maldives
Imports from SAARC
Figure 4.19 (b) ANNUAL GROWTH RATES OF INDO – MALDIVES IMPORTS
TRADE & INDO – SAARC IMPORTS
-200
-100
0
100
200
300
400
500
600
700
800
0 2 4 6 8
10
12
14
16
18
Year
Imp
ort
s T
rad
e (
Gro
wth
rate
)
Imports from Maldives
Imports from SAARC
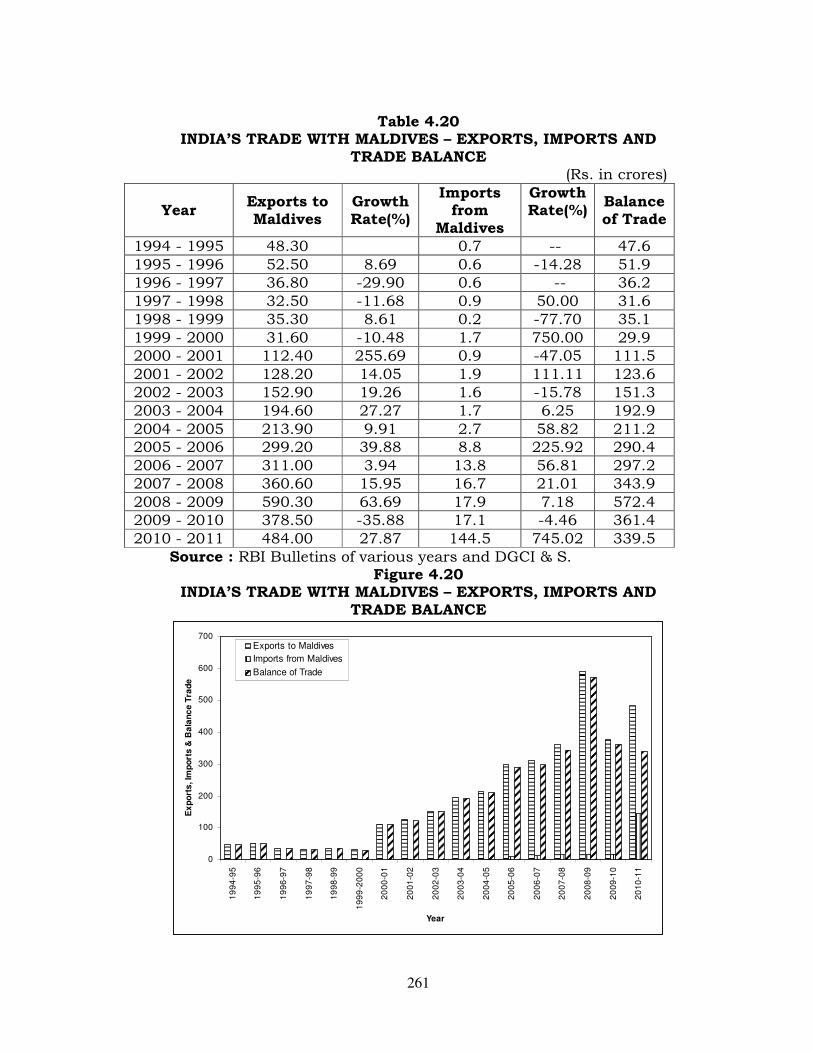
261
Table 4.20 INDIA’S TRADE WITH MALDIVES – EXPORTS, IMPORTS AND
TRADE BALANCE (Rs. in crores)
Year Exports to Maldives
Growth Rate(%)
Imports from
Maldives
Growth Rate(%)
Balance of Trade
1994 - 1995 48.30 0.7 -- 47.6 1995 - 1996 52.50 8.69 0.6 -14.28 51.9 1996 - 1997 36.80 -29.90 0.6 -- 36.2 1997 - 1998 32.50 -11.68 0.9 50.00 31.6 1998 - 1999 35.30 8.61 0.2 -77.70 35.1 1999 - 2000 31.60 -10.48 1.7 750.00 29.9 2000 - 2001 112.40 255.69 0.9 -47.05 111.5 2001 - 2002 128.20 14.05 1.9 111.11 123.6 2002 - 2003 152.90 19.26 1.6 -15.78 151.3 2003 - 2004 194.60 27.27 1.7 6.25 192.9 2004 - 2005 213.90 9.91 2.7 58.82 211.2 2005 - 2006 299.20 39.88 8.8 225.92 290.4 2006 - 2007 311.00 3.94 13.8 56.81 297.2 2007 - 2008 360.60 15.95 16.7 21.01 343.9 2008 - 2009 590.30 63.69 17.9 7.18 572.4 2009 - 2010 378.50 -35.88 17.1 -4.46 361.4 2010 - 2011 484.00 27.87 144.5 745.02 339.5
Source : RBI Bulletins of various years and DGCI & S. Figure 4.20
INDIA’S TRADE WITH MALDIVES – EXPORTS, IMPORTS AND TRADE BALANCE
0
100
200
300
400
500
600
700
19
94
-95
19
95
-96
19
96
-97
19
97
-98
19
98
-99
19
99
-20
00
20
00
-01
20
01
-02
20
02
-03
20
03
-04
20
04
-05
20
05
-06
20
06
-07
20
07
-08
20
08
-09
20
09
-10
20
10
-11
Year
Ex
po
rts
, Im
po
rts
& B
ala
nc
e T
rad
e
Exports to Maldives
Imports from Maldives
Balance of Trade
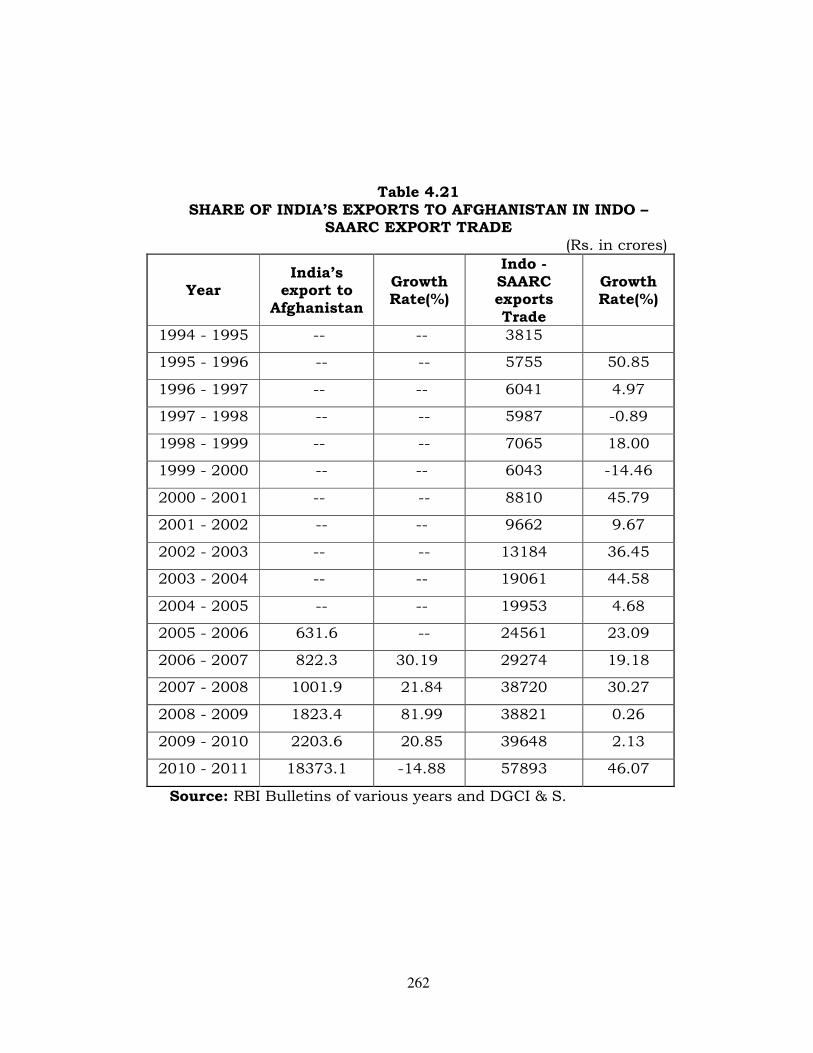
262
Table 4.21 SHARE OF INDIA’S EXPORTS TO AFGHANISTAN IN INDO –
SAARC EXPORT TRADE (Rs. in crores)
Year India’s
export to Afghanistan
Growth Rate(%)
Indo - SAARC exports Trade
Growth Rate(%)
1994 - 1995 -- -- 3815
1995 - 1996 -- -- 5755 50.85
1996 - 1997 -- -- 6041 4.97
1997 - 1998 -- -- 5987 -0.89
1998 - 1999 -- -- 7065 18.00
1999 - 2000 -- -- 6043 -14.46
2000 - 2001 -- -- 8810 45.79
2001 - 2002 -- -- 9662 9.67
2002 - 2003 -- -- 13184 36.45
2003 - 2004 -- -- 19061 44.58
2004 - 2005 -- -- 19953 4.68
2005 - 2006 631.6 -- 24561 23.09
2006 - 2007 822.3 30.19 29274 19.18
2007 - 2008 1001.9 21.84 38720 30.27
2008 - 2009 1823.4 81.99 38821 0.26
2009 - 2010 2203.6 20.85 39648 2.13
2010 - 2011 18373.1 -14.88 57893 46.07
Source: RBI Bulletins of various years and DGCI & S.
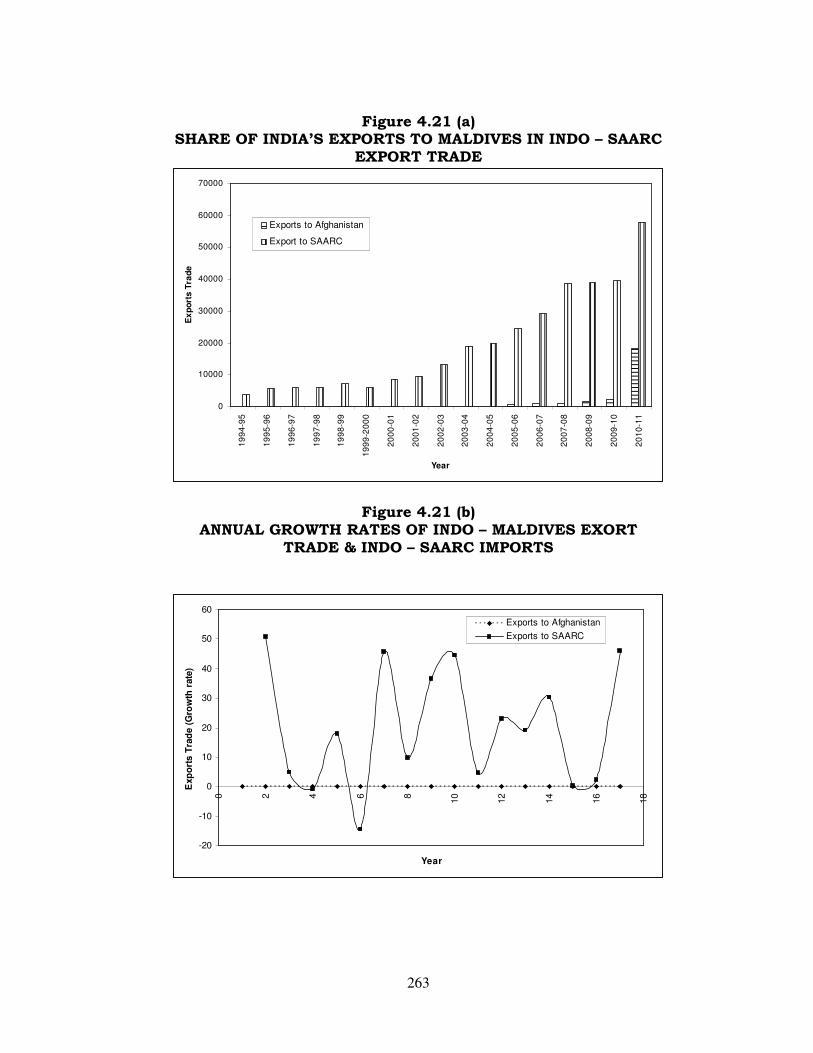
263
Figure 4.21 (a) SHARE OF INDIA’S EXPORTS TO MALDIVES IN INDO – SAARC
EXPORT TRADE
0
10000
20000
30000
40000
50000
60000
70000
19
94
-95
19
95
-96
19
96
-97
19
97
-98
19
98
-99
19
99
-20
00
20
00
-01
20
01
-02
20
02
-03
20
03
-04
20
04
-05
20
05
-06
20
06
-07
20
07
-08
20
08
-09
20
09
-10
20
10
-11
Year
Ex
po
rts
Tra
de
Exports to Afghanistan
Export to SAARC
Figure 4.21 (b) ANNUAL GROWTH RATES OF INDO – MALDIVES EXORT
TRADE & INDO – SAARC IMPORTS
-20
-10
0
10
20
30
40
50
60
0 2 4 6 8
10
12
14
16
18
Year
Exp
ort
s T
rad
e (
Gro
wth
rate
)
Exports to Afghanistan
Exports to SAARC
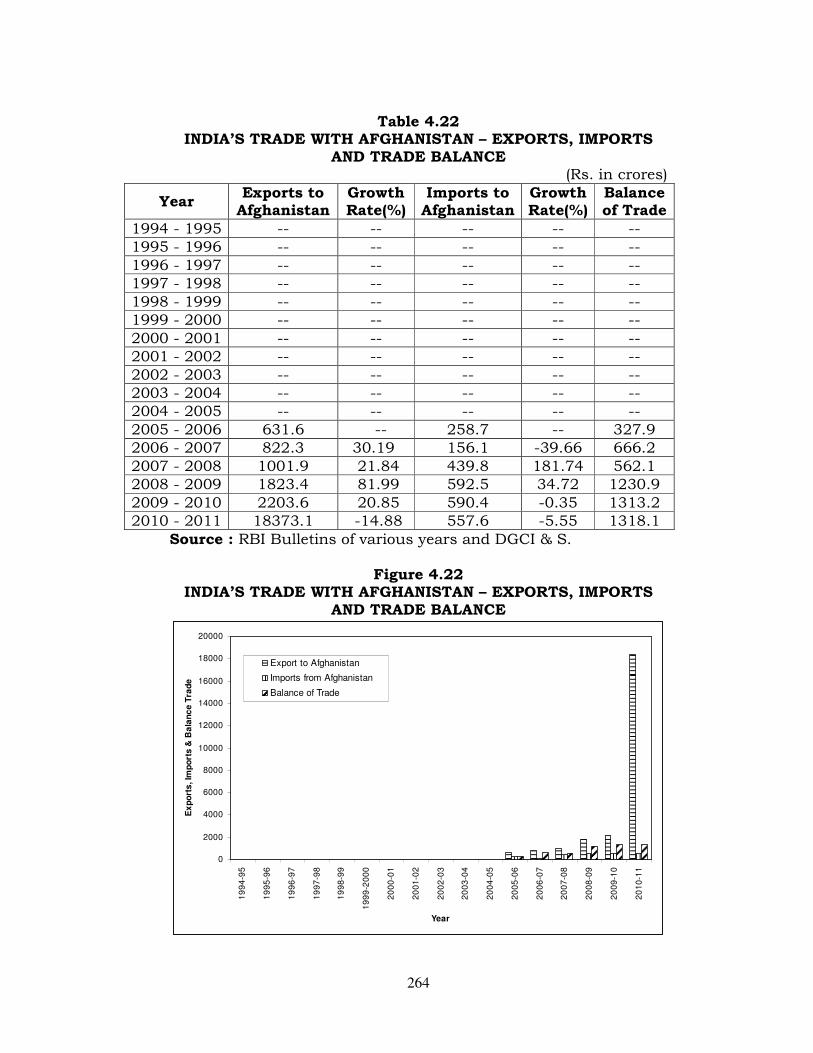
264
Table 4.22 INDIA’S TRADE WITH AFGHANISTAN – EXPORTS, IMPORTS
AND TRADE BALANCE (Rs. in crores)
Year Exports to
Afghanistan Growth Rate(%)
Imports to Afghanistan
Growth Rate(%)
Balance of Trade
1994 - 1995 -- -- -- -- -- 1995 - 1996 -- -- -- -- -- 1996 - 1997 -- -- -- -- -- 1997 - 1998 -- -- -- -- -- 1998 - 1999 -- -- -- -- -- 1999 - 2000 -- -- -- -- -- 2000 - 2001 -- -- -- -- -- 2001 - 2002 -- -- -- -- -- 2002 - 2003 -- -- -- -- -- 2003 - 2004 -- -- -- -- -- 2004 - 2005 -- -- -- -- -- 2005 - 2006 631.6 -- 258.7 -- 327.9 2006 - 2007 822.3 30.19 156.1 -39.66 666.2 2007 - 2008 1001.9 21.84 439.8 181.74 562.1 2008 - 2009 1823.4 81.99 592.5 34.72 1230.9 2009 - 2010 2203.6 20.85 590.4 -0.35 1313.2 2010 - 2011 18373.1 -14.88 557.6 -5.55 1318.1
Source : RBI Bulletins of various years and DGCI & S.
Figure 4.22 INDIA’S TRADE WITH AFGHANISTAN – EXPORTS, IMPORTS
AND TRADE BALANCE
0
2000
4000
6000
8000
10000
12000
14000
16000
18000
20000
19
94
-95
19
95
-96
19
96
-97
19
97
-98
19
98
-99
19
99
-20
00
20
00
-01
20
01
-02
20
02
-03
20
03
-04
20
04
-05
20
05
-06
20
06
-07
20
07
-08
20
08
-09
20
09
-10
20
10
-11
Year
Ex
po
rts
, Im
po
rts
& B
ala
nc
e T
rad
e
Export to Afghanistan
Imports from Afghanistan
Balance of Trade
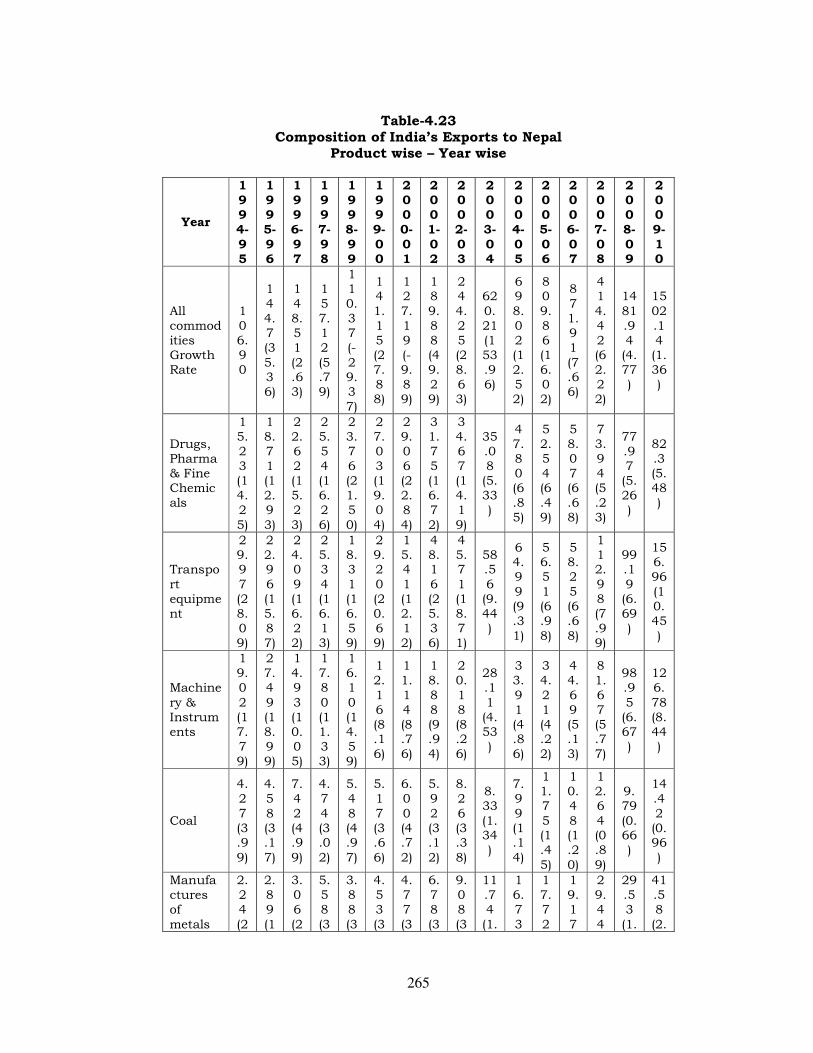
265
Table-4.23 Composition of India’s Exports to Nepal
Product wise – Year wise
Year
1994-
95
1995-
96
1996-
97
1997-
98
1998-
99
1999-
00
2000-
01
2001-
02
2002-
03
2003-
04
2004-
05
2005-
06
2006-
07
2007-
08
2008-
09
2009-
10
All commodities Growth Rate
106.90
144.7 (35.36)
148.51 (2.63)
157.12 (5.79)
110.37 (-29.37)
141.15 (27.88)
127.19 (-9.89)
189.88 (49.29)
244.25 (28.63)
620.21 (153.96)
698.02 (12.52)
809.86 (16.02)
871.91 (7.66)
414.42 (62.22)
1481.94 (4.77)
1502.14 (1.36)
Drugs, Pharma & Fine Chemicals
15.23 (14.25)
18.71 (12.93)
22.62 (15.23)
25.54 (16.26)
23.76 (21.50)
27.03 (19.04)
29.06 (22.84)
31.75 (16.72)
34.67 (14.19)
35.08 (5.33)
47.80 (6.85)
52.54 (6.49)
58.07 (6.68)
73.94 (5.23)
77.97 (5.26)
82.3 (5.48)
Transport equipment
29.97 (28.09)
22.96 (15.87)
24.09 (16.22)
25.34 (16.13)
18.31 (16.59)
29.20 (20.69)
15.41 (12.12)
48.16 (25.36)
45.71 (18.71)
58.56 (9.44)
64.99 (9.31)
56.51 (6.98)
58.25 (6.68)
112.98 (7.99)
99.19 (6.69)
156.96 (10.45)
Machinery & Instruments
19.02 (17.79)
27.49 (18.99)
14.93 (10.05)
17.80 (11.33)
16.10 (14.59)
12.16 (8.16)
11.14 (8.76)
18.88 (9.94)
20.18 (8.26)
28.11 (4.53)
33.91 (4.86)
34.21 (4.22)
44.69 (5.13)
81.67 (5.77)
98.95 (6.67)
126.78 (8.44)
Coal
4.27 (3.99)
4.58 (3.17)
7.42 (4.99)
4.74 (3.02)
5.48 (4.97)
5.17 (3.66)
6.00 (4.72)
5.92 (3.12)
8.26 (3.38)
8.33 (1.34)
7.99 (1.14)
11.75 (1.45)
10.48 (1.20)
12.64 (0.89)
9.79 (0.66)
14.42 (0.96)
Manufactures of metals
2.24 (2
2.89 (1
3.06 (2
5.58 (3
3.88 (3
4.53 (3
4.77 (3
6.78 (3
9.08 (3
11.74 (1.
16.73
17.72
19.17
29.44
29.53 (1.
41.58 (2.
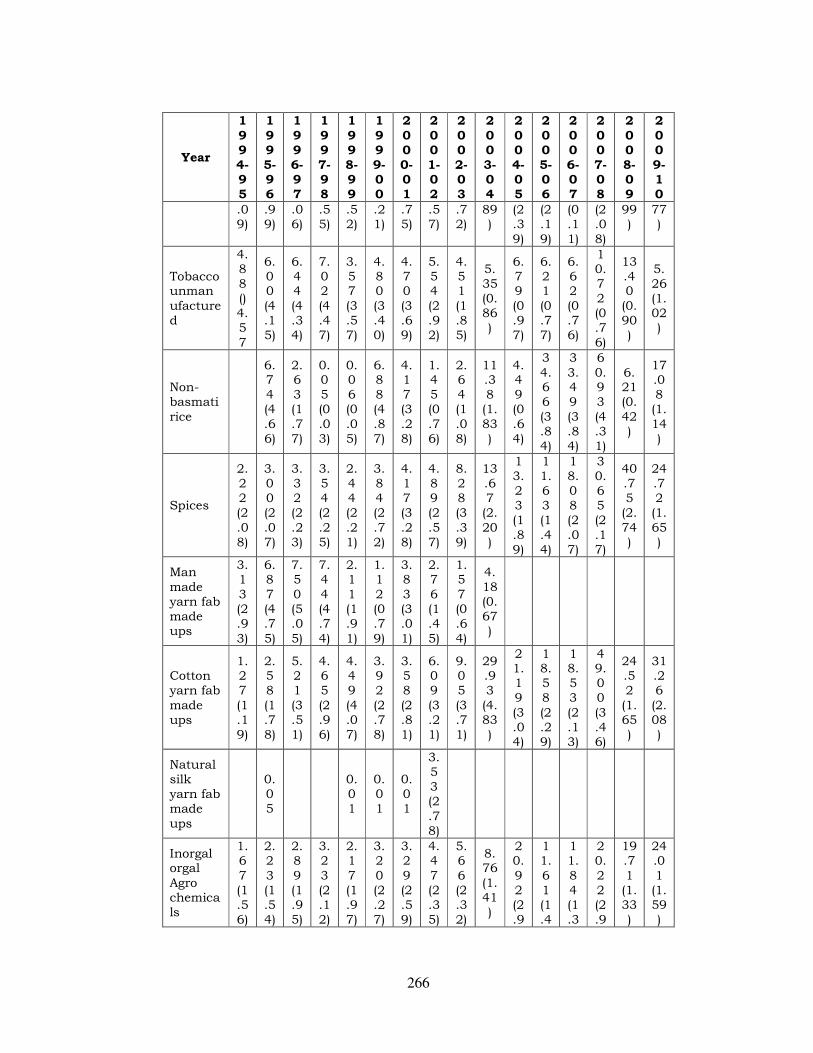
266
Year
1
994-95
1
995-96
1
996-97
1
997-98
1
998-99
1
999-00
2
000-01
2
001-02
2
002-03
2
003-04
2
004-05
2
005-06
2
006-07
2
007-08
2
008-09
2
009-10
.09)
.99)
.06)
.55)
.52)
.21)
.75)
.57)
.72)
89)
(2.39)
(2.19)
(0.11)
(2.08)
99)
77)
Tobacco unmanufactured
4.88 ()4.57
6.00 (4.15)
6.44 (4.34)
7.02 (4.47)
3.57 (3.57)
4.80 (3.40)
4.70 (3.69)
5.54 (2.92)
4.51 (1.85)
5.35 (0.86)
6.79 (0.97)
6.21 (0.77)
6.62 (0.76)
10.72 (0.76)
13.40 (0.90)
5.26 (1.02)
Non-basmati rice
6.74 (4.66)
2.63 (1.77)
0.05 (0.03)
0.06 (0.05)
6.88 (4.87)
4.17 (3.28)
1.45 (0.76)
2.64 (1.08)
11.38 (1.83)
4.49 (0.64)
34.66 (3.84)
33.49 (3.84)
60.93 (4.31)
6.21 (0.42)
17.08 (1.14)
Spices
2.22 (2.08)
3.00 (2.07)
3.32 (2.23)
3.54 (2.25)
2.44 (2.21)
3.84 (2.72)
4.17 (3.28)
4.89 (2.57)
8.28 (3.39)
13.67 (2.20)
13.23 (1.89)
11.63 (1.44)
18.08 (2.07)
30.65 (2.17)
40.75 (2.74)
24.72 (1.65)
Man made yarn fab made ups
3.13 (2.93)
6.87 (4.75)
7.50 (5.05)
7.44 (4.74)
2.11 (1.91)
1.12 (0.79)
3.83 (3.01)
2.76 (1.45)
1.57 (0.64)
4.18 (0.67)
Cotton yarn fab made ups
1.27 (1.19)
2.58 (1.78)
5.21 (3.51)
4.65 (2.96)
4.49 (4.07)
3.92 (2.78)
3.58 (2.81)
6.09 (3.21)
9.05 (3.71)
29.93 (4.83)
21.19 (3.04)
18.58 (2.29)
18.53 (2.13)
49.00 (3.46)
24.52 (1.65)
31.26 (2.08)
Natural silk yarn fab made ups
0.05
0.01
0.01
0.01
3.53 (2.78)
Inorgal orgal Agro chemicals
1.67 (1.56)
2.23 (1.54)
2.89 (1.95)
3.23 (2.12)
2.17 (1.97)
3.20 (2.27)
3.29 (2.59)
4.47 (2.35)
5.66 (2.32)
8.76 (1.41)
20.92 (2.9
11.61 (1.4
11.84 (1.3
20.22 (2.9
19.71 (1.33)
24.01 (1.59)
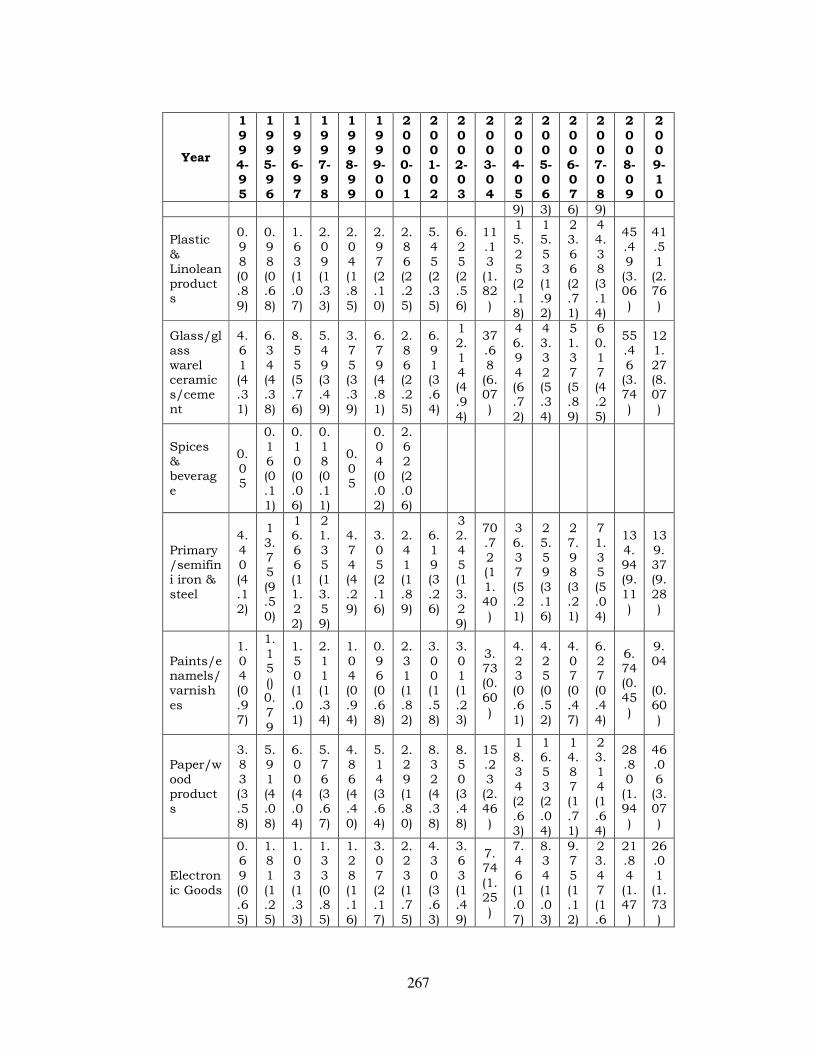
267
Year
1
994-95
1
995-96
1
996-97
1
997-98
1
998-99
1
999-00
2
000-01
2
001-02
2
002-03
2
003-04
2
004-05
2
005-06
2
006-07
2
007-08
2
008-09
2
009-10
9) 3) 6) 9)
Plastic & Linolean products
0.98 (0.89)
0.98 (0.68)
1.63 (1.07)
2.09 (1.33)
2.04 (1.85)
2.97 (2.10)
2.86 (2.25)
5.45 (2.35)
6.25 (2.56)
11.13 (1.82)
15.25 (2.18)
15.53 (1.92)
23.66 (2.71)
44.38 (3.14)
45.49 (3.06)
41.51 (2.76)
Glass/glass warel ceramics/cement
4.61 (4.31)
6.34 (4.38)
8.55 (5.76)
5.49 (3.49)
3.75 (3.39)
6.79 (4.81)
2.86 (2.25)
6.91 (3.64)
12.14 (4.94)
37.68 (6.07)
46.94 (6.72)
43.32 (5.34)
51.37 (5.89)
60.17 (4.25)
55.46 (3.74)
121.27 (8.07)
Spices & beverage
0.05
0.16 (0.11)
0.10 (0.06)
0.18 (0.11)
0.05
0.04 (0.02)
2.62 (2.06)
Primary/semifini iron & steel
4.40 (4.12)
13.75 (9.50)
16.66 (11.22)
21.35 (13.59)
4.74 (4.29)
3.05 (2.16)
2.41 (1.89)
6.19 (3.26)
32.45 (13.29)
70.72 (11.40)
36.37 (5.21)
25.59 (3.16)
27.98 (3.21)
71.35 (5.04)
134.94 (9.11)
139.37 (9.28)
Paints/enamels/varnishes
1.04 (0.97)
1.15 ()0.79
1.50 (1.01)
2.11 (1.34)
1.04 (0.94)
0.96 (0.68)
2.31 (1.82)
3.00 (1.58)
3.01 (1.23)
3.73 (0.60)
4.23 (0.61)
4.25 (0.52)
4.07 (0.47)
6.27 (0.44)
6.74 (0.45)
9.04
(0.60)
Paper/wood products
3.83 (3.58)
5.91 (4.08)
6.00 (4.04)
5.76 (3.67)
4.86 (4.40)
5.14 (3.64)
2.29 (1.80)
8.32 (4.38)
8.50 (3.48)
15.23 (2.46)
18.34 (2.63)
16.53 (2.04)
14.87 (1.71)
23.14 (1.64)
28.80 (1.94)
46.06 (3.07)
Electronic Goods
0.69 (0.65)
1.81 (1.25)
1.03 (1.33)
1.33 (0.85)
1.28 (1.16)
3.07 (2.17)
2.23 (1.75)
4.30 (3.63)
3.63 (1.49)
7.74 (1.25)
7.46 (1.07)
8.34 (1.03)
9.75 (1.12)
23.47 (1.6
21.84 (1.47)
26.01 (1.73)
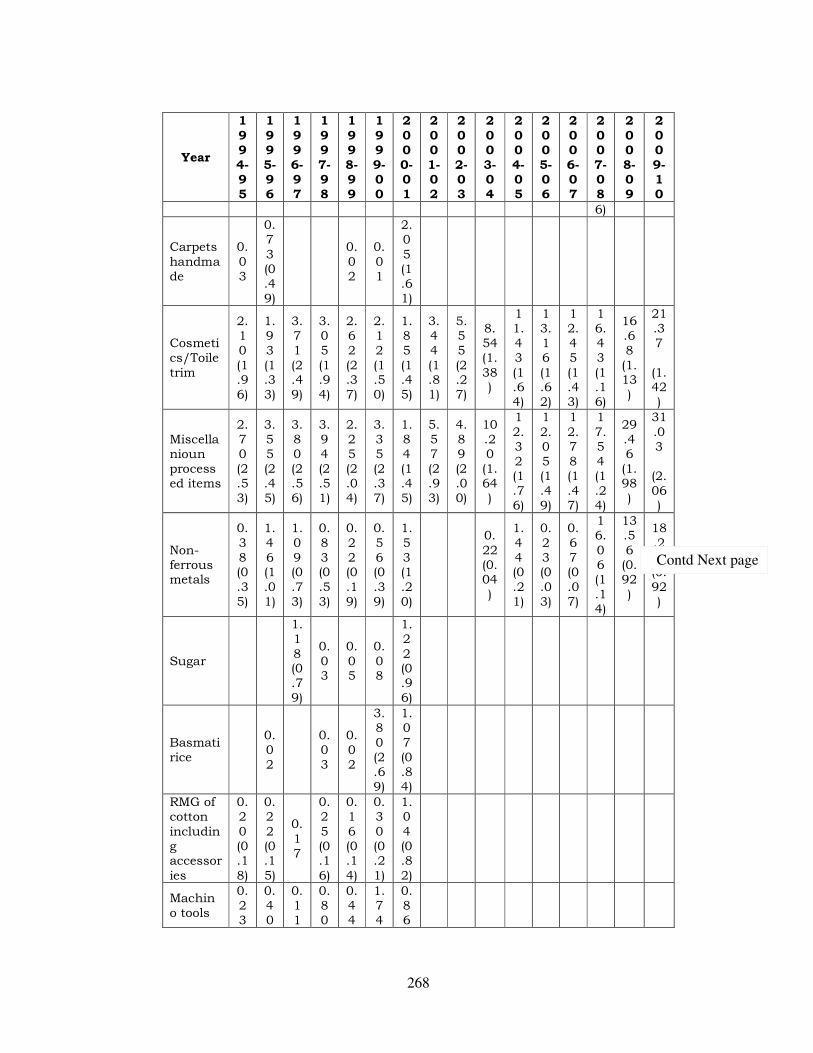
268
Year
1
994-95
1
995-96
1
996-97
1
997-98
1
998-99
1
999-00
2
000-01
2
001-02
2
002-03
2
003-04
2
004-05
2
005-06
2
006-07
2
007-08
2
008-09
2
009-10
6)
Carpets handmade
0.03
0.73 (0.49)
0.02
0.01
2.05 (1.61)
Cosmetics/Toiletrim
2.10 (1.96)
1.93 (1.33)
3.71 (2.49)
3.05 (1.94)
2.62 (2.37)
2.12 (1.50)
1.85 (1.45)
3.44 (1.81)
5.55 (2.27)
8.54 (1.38)
11.43 (1.64)
13.16 (1.62)
12.45 (1.43)
16.43 (1.16)
16.68 (1.13)
21.37
(1.42)
Miscellanioun processed items
2.70 (2.53)
3.55 (2.45)
3.80 (2.56)
3.94 (2.51)
2.25 (2.04)
3.35 (2.37)
1.84 (1.45)
5.57 (2.93)
4.89 (2.00)
10.20 (1.64)
12.32 (1.76)
12.05 (1.49)
12.78 (1.47)
17.54 (1.24)
29.46 (1.98)
31.03
(2.06)
Non-ferrous metals
0.38 (0.35)
1.46 (1.01)
1.09 (0.73)
0.83 (0.53)
0.22 (0.19)
0.56 (0.39)
1.53 (1.20)
0.22 (0.04)
1.44 (0.21)
0.23 (0.03)
0.67 (0.07)
16.06 (1.14)
13.56 (0.92)
18.27 (0.92)
Sugar
1.18 (0.79)
0.03
0.05
0.08
1.22 (0.96)
Basmatirice
0.02
0.03
0.02
3.80 (2.69)
1.07 (0.84)
RMG of cotton including accessories
0.20 (0.18)
0.22 (0.15)
0.17
0.25 (0.16)
0.16 (0.14)
0.30 (0.21)
1.04 (0.82)
Machino tools
0.23
0.40
0.11
0.80
0.44
1.74
0.86
Contd Next page
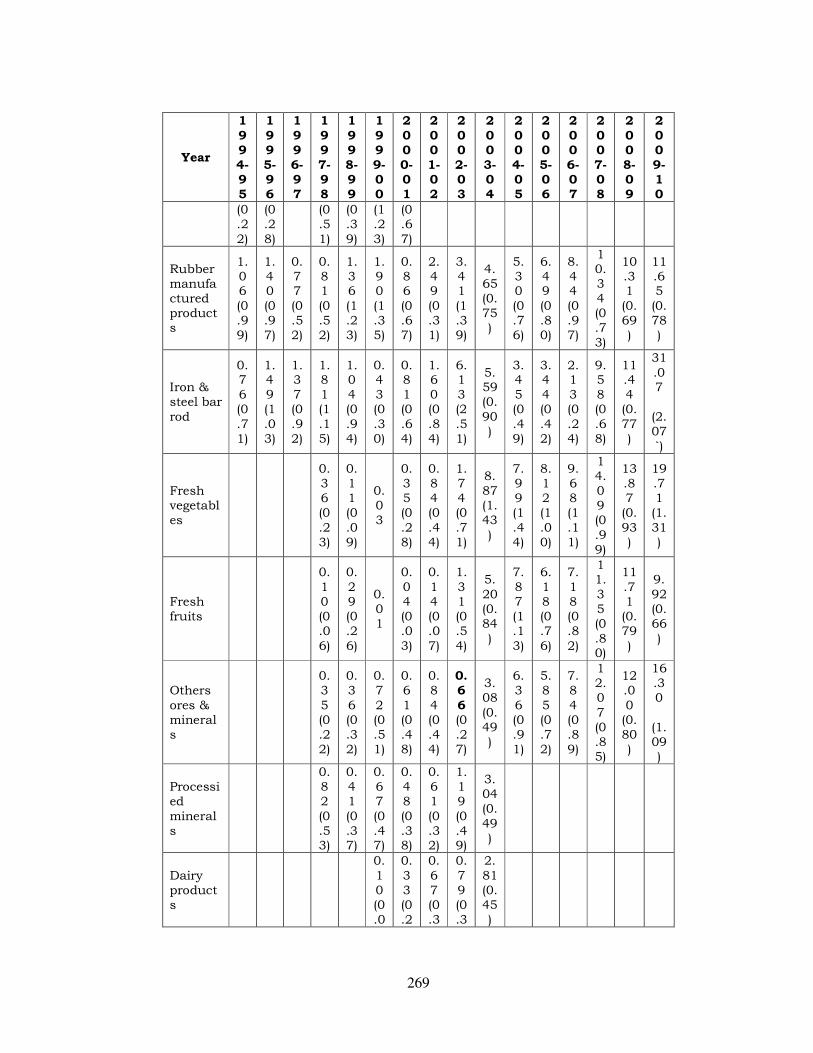
269
Year
1
994-95
1
995-96
1
996-97
1
997-98
1
998-99
1
999-00
2
000-01
2
001-02
2
002-03
2
003-04
2
004-05
2
005-06
2
006-07
2
007-08
2
008-09
2
009-10
(0.22)
(0.28)
(0.51)
(0.39)
(1.23)
(0.67)
Rubber manufactured products
1.06 (0.99)
1.40 (0.97)
0.77 (0.52)
0.81 (0.52)
1.36 (1.23)
1.90 (1.35)
0.86 (0.67)
2.49 (0.31)
3.41 (1.39)
4.65 (0.75)
5.30 (0.76)
6.49 (0.80)
8.44 (0.97)
10.34 (0.73)
10.31 (0.69)
11.65 (0.78)
Iron & steel bar rod
0.76 (0.71)
1.49 (1.03)
1.37 (0.92)
1.81 (1.15)
1.04 (0.94)
0.43 (0.30)
0.81 (0.64)
1.60 (0.84)
6.13 (2.51)
5.59 (0.90)
3.45 (0.49)
3.44 (0.42)
2.13 (0.24)
9.58 (0.68)
11.44 (0.77)
31.07
(2.07`)
Fresh vegetables
0.36 (0.23)
0.11 (0.09)
0.03
0.35 (0.28)
0.84 (0.44)
1.74 (0.71)
8.87 (1.43)
7.99 (1.44)
8.12 (1.00)
9.68 (1.11)
14.09 (0.99)
13.87 (0.93)
19.71 (1.31)
Fresh fruits
0.10 (0.06)
0.29 (0.26)
0.01
0.04 (0.03)
0.14 (0.07)
1.31 (0.54)
5.20 (0.84)
7.87 (1.13)
6.18 (0.76)
7.18 (0.82)
11.35 (0.80)
11.71 (0.79)
9.92 (0.66)
Others ores & minerals
0.35 (0.22)
0.36 (0.32)
0.72 (0.51)
0.61 (0.48)
0.84 (0.44)
0.6
6 (0.27)
3.08 (0.49)
6.36 (0.91)
5.85 (0.72)
7.84 (0.89)
12.07 (0.85)
12.00 (0.80)
16.30
(1.09)
Processied minerals
0.82 (0.53)
0.41 (0.37)
0.67 (0.47)
0.48 (0.38)
0.61 (0.32)
1.19 (0.49)
3.04 (0.49)
Dairy products
0.10 (0.0
0.33 (0.2
0.67 (0.3
0.79 (0.3
2.81 (0.45)
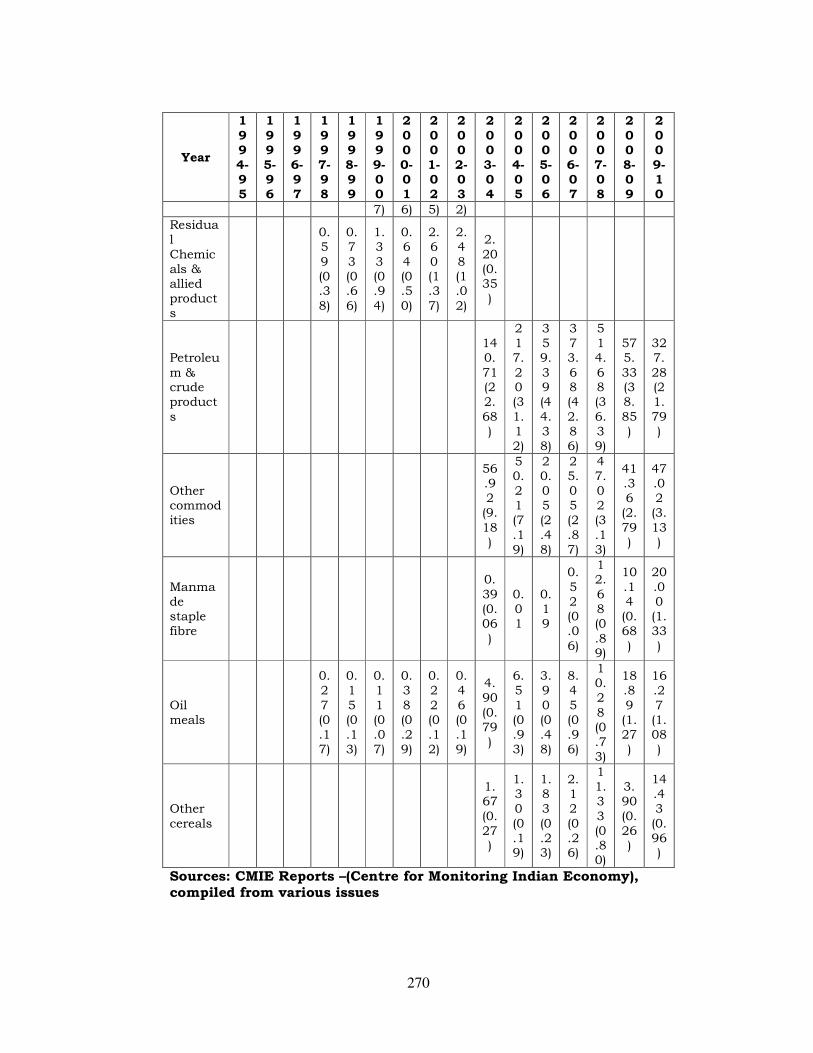
270
Year
1
994-95
1
995-96
1
996-97
1
997-98
1
998-99
1
999-00
2
000-01
2
001-02
2
002-03
2
003-04
2
004-05
2
005-06
2
006-07
2
007-08
2
008-09
2
009-10
7) 6) 5) 2) Residual Chemicals & allied products
0.59 (0.38)
0.73 (0.66)
1.33 (0.94)
0.64 (0.50)
2.60 (1.37)
2.48 (1.02)
2.20 (0.35)
Petroleum & crude products
140.71 (22.68)
217.20 (31.12)
359.39 (44.38)
373.68 (42.86)
514.68 (36.39)
575.33 (38.85)
327.28 (21.79)
Other commodities
56.92 (9.18)
50.21 (7.19)
20.05 (2.48)
25.05 (2.87)
47.02 (3.13)
41.36 (2.79)
47.02 (3.13)
Manmade staple fibre
0.39 (0.06)
0.01
0.19
0.52 (0.06)
12.68 (0.89)
10.14 (0.68)
20.00 (1.33)
Oil meals
0.27 (0.17)
0.15 (0.13)
0.11 (0.07)
0.38 (0.29)
0.22 (0.12)
0.46 (0.19)
4.90 (0.79)
6.51 (0.93)
3.90 (0.48)
8.45 (0.96)
10.28 (0.73)
18.89 (1.27)
16.27 (1.08)
Other cereals
1.67 (0.27)
1.30 (0.19)
1.83 (0.23)
2.12 (0.26)
11.33 (0.80)
3.90 (0.26)
14.43 (0.96)
Sources: CMIE Reports –(Centre for Monitoring Indian Economy), compiled from various issues
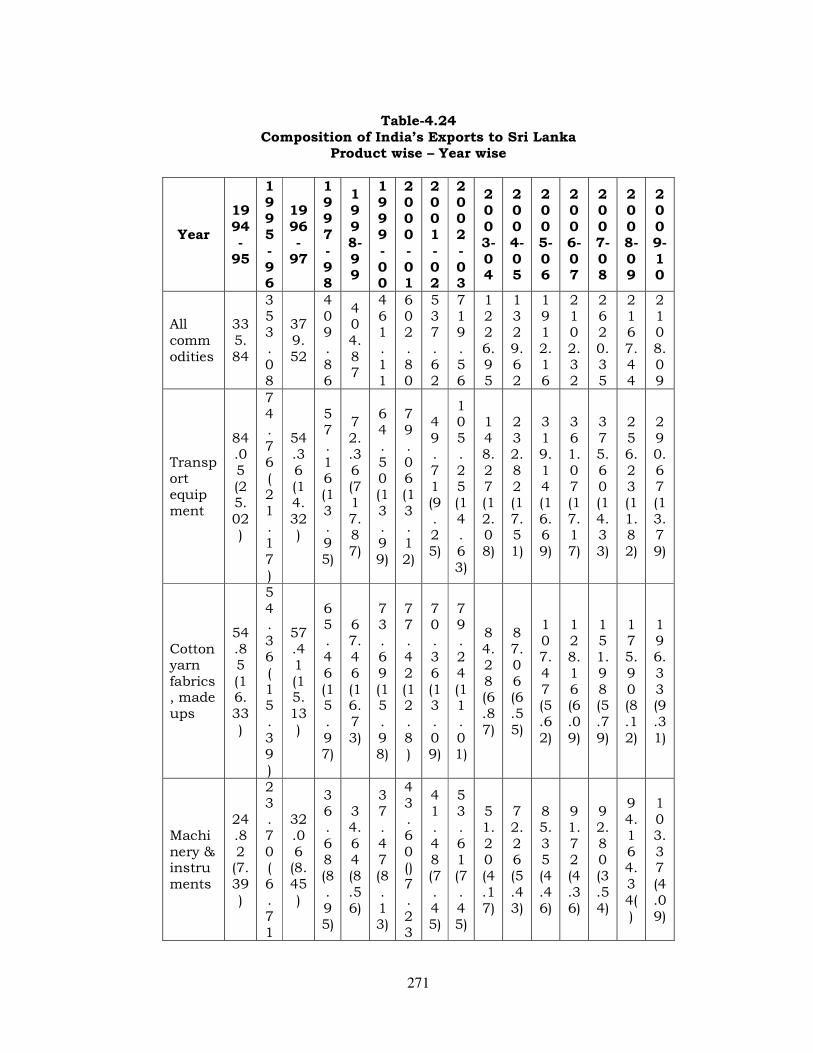
271
Table-4.24 Composition of India’s Exports to Sri Lanka
Product wise – Year wise
Year
1994-
95
1995-96
1996-
97
1997-98
1998-99
1999-00
2000-01
2001-02
2002-03
2003-04
2004-05
2005-06
2006-07
2007-08
2008-09
2009-10
All commodities
335.84
353.08
379.52
409.86
404.87
461.11
602.80
537.62
719.56
1226.95
1329.62
1912.16
2102.32
2620.35
2167.44
2108.09
Transport equipment
84.05 (25.02)
74.76 (21.17)
54.36 (14.32)
57.16 (13.95)
72..36 (717.87)
64.50 (13.99)
79.06 (13.12)
49.71 (9.25)
105.25 (14.63)
148.27 (12.08)
232.82 (17.51)
319.14 (16.69)
361.07 (17.17)
375.60 (14.33)
256.23 (11.82)
290.67 (13.79)
Cotton yarn fabrics, made ups
54.85 (16.33)
54.36 (15.39)
57.41 (15.13)
65.46 (15.97)
67.46 (16.73)
73.69 (15.98)
77.42 (12.8 )
70.36 (13.09)
79.24 (11.01)
84.28 (6.87)
87.06 (6.55)
107.47 (5.62)
128.16 (6.09)
151.98 (5.79)
175.90 (8.12)
196.33 (9.31)
Machinery & instruments
24.82 (7.39)
23.70 (6.71
32.06 (8.45)
36.68 (8.95)
34.64 (8.56)
37.47 (8.13)
43.60 ()7.23
41.48 (7.45)
53.61 (7.45)
51.20 (4.17)
72.26 (5.43)
85.35 (4.46)
91.72 (4.36)
92.80 (3.54)
94.16 4.34()
103.37 (4.09)
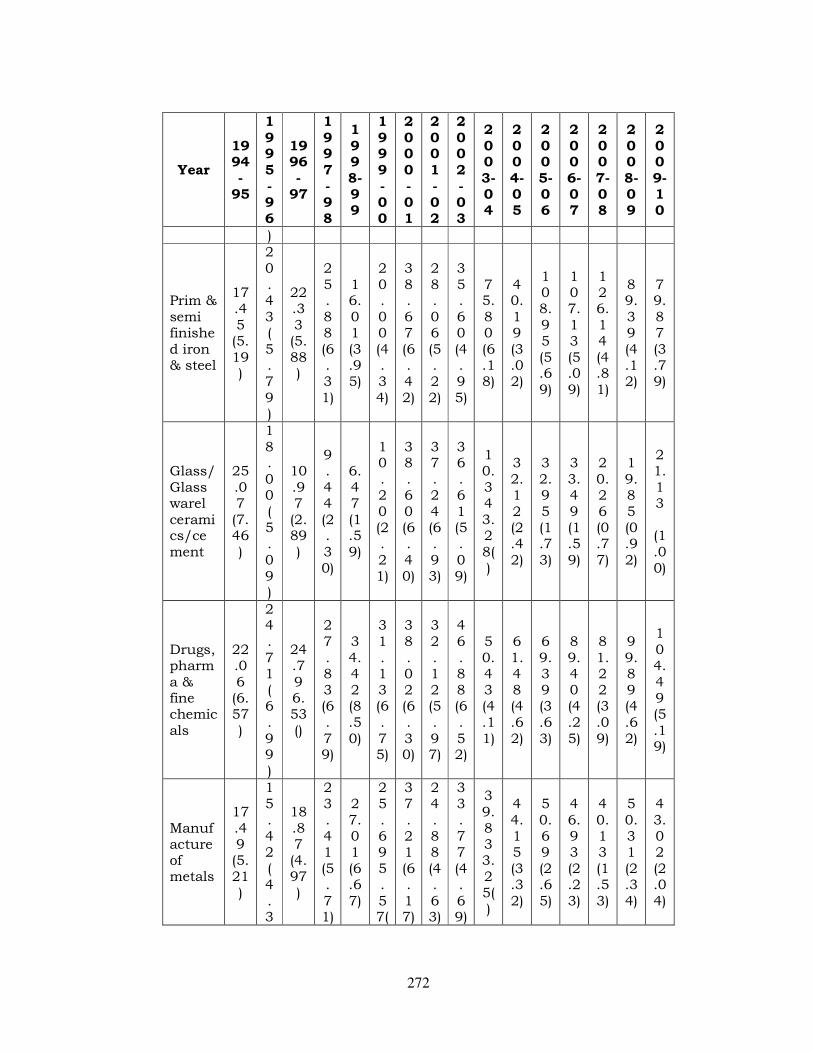
272
Year
1994-
95
1995-96
1996-
97
1997-98
1998-99
1999-00
2000-01
2001-02
2002-03
2003-04
2004-05
2005-06
2006-07
2007-08
2008-09
2009-10
)
Prim & semi finished iron & steel
17.45 (5.19)
20.43 (5.79)
22.33 (5.88)
25.88 (6.31)
16.01 (3.95)
20.00 (4.34)
38.67 (6.42)
28.06 (5.22)
35.60 (4.95)
75.80 (6.18)
40.19 (3.02)
108.95 (5.69)
107.13 (5.09)
126.14 (4.81)
89.39 (4.12)
79.87 (3.79)
Glass/Glass warel ceramics/cement
25.07 (7.46)
18.00 (5.09)
10.97 (2.89)
9.44 (2.30)
6.47 (1.59)
10.20 (2.21)
38.60 (6.40)
37.24 (6.93)
36.61 (5.09)
10.34 3.28()
32.12 (2.42)
32.95 (1.73)
33.49 (1.59)
20.26 (0.77)
19.85 (0.92)
21.13
(1.00)
Drugs, pharma & fine chemicals
22.06 (6.57)
24.71 (6.99)
24.79 6.53()
27.83 (6.79)
34.42 (8.50)
31.13 (6.75)
38.02 (6.30)
32.12 (5.97)
46.88 (6.52)
50.43 (4.11)
61.48 (4.62)
69.39 (3.63)
89.40 (4.25)
81.22 (3.09)
99.89 (4.62)
104.49 (5.19)
Manufacture of metals
17.49 (5.21)
15.42 (4.3
18.87 (4.97)
23.41 (5.71)
27.01 (6.67)
25.69 5.57(
37.21 (6.17)
24.88 (4.63)
33.77 (4.69)
39.83 3.25()
44.15 (3.32)
50.69 (2.65)
46.93 (2.23)
40.13 (1.53)
50.31 (2.34)
43.02 (2.04)
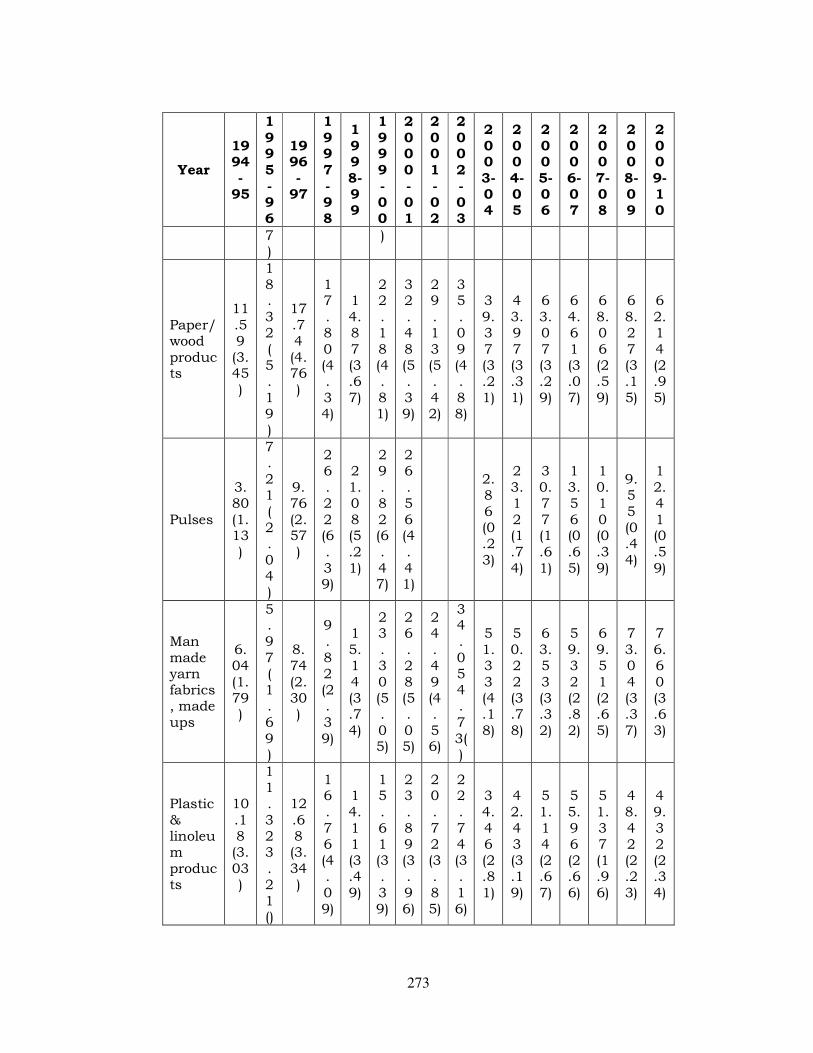
273
Year
1994-
95
1995-96
1996-
97
1997-98
1998-99
1999-00
2000-01
2001-02
2002-03
2003-04
2004-05
2005-06
2006-07
2007-08
2008-09
2009-10
7)
)
Paper/wood products
11.59 (3.45)
18.32 (5.19)
17.74 (4.76)
17.80 (4.34)
14.87 (3.67)
22.18 (4.81)
32.48 (5.39)
29.13 (5.42)
35.09 (4.88)
39.37 (3.21)
43.97 (3.31)
63.07 (3.29)
64.61 (3.07)
68.06 (2.59)
68.27 (3.15)
62.14 (2.95)
Pulses
3.80 (1.13)
7.21 (2.04)
9.76(2.57)
26.22 (6.39)
21.08 (5.21)
29.82 (6.47)
26.56 (4.41)
2.86 (0.23)
23.12 (1.74)
30.77 (1.61)
13.56 (0.65)
10.10 (0.39)
9.55 (0.44)
12.41 (0.59)
Man made yarn fabrics, made ups
6.04 (1.79)
5.97 (1.69)
8.74 (2.30)
9.82 (2.39)
15.14 (3.74)
23.30 (5.05)
26.28 (5.05)
24.49 (4.56)
34.05 4.73()
51.33 (4.18)
50.22 (3.78)
63.53 (3.32)
59.32 (2.82)
69.51 (2.65)
73.04 (3.37)
76.60 (3.63)
Plastic & linoleum products
10.18 (3.03)
11.32 3.21()
12.68 (3.34)
16.76 (4.09)
14.11 (3.49)
15.61 (3.39)
23.89 (3.96)
20.72 (3.85)
22.74 (3.16)
34.46 (2.81)
42.43 (3.19)
51.14 (2.67)
55.96 (2.66)
51.37 (1.96)
48.42 (2.23)
49.32 (2.34)
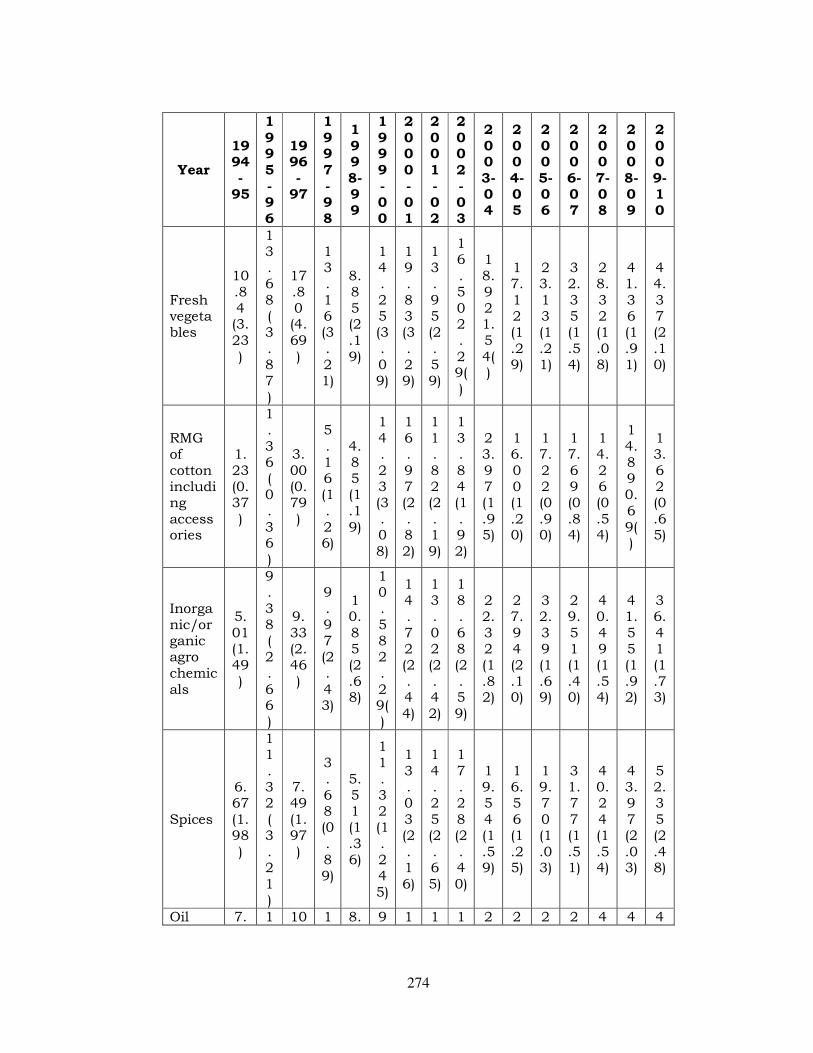
274
Year
1994-
95
1995-96
1996-
97
1997-98
1998-99
1999-00
2000-01
2001-02
2002-03
2003-04
2004-05
2005-06
2006-07
2007-08
2008-09
2009-10
Fresh vegetables
10.84 (3.23)
13.68 (3.87)
17.80 (4.69)
13.16 (3.21)
8.85 (2.19)
14.25 (3.09)
19.83 (3.29)
13.95 (2.59)
16.50 2.29()
18.92 1.54()
17.12 (1.29)
23.13 (1.21)
32.35 (1.54)
28.32 (1.08)
41.36 (1.91)
44.37 (2.10)
RMG of cotton including accessories
1.23 (0.37)
1.36 (0.36)
3.00 (0.79)
5.16 (1.26)
4.85 (1.19)
14.23 (3.08)
16.97 (2.82)
11.82 (2.19)
13.84 (1.92)
23.97 (1.95)
16.00 (1.20)
17.22 (0.90)
17.69 (0.84)
14.26 (0.54)
14.89 0.69()
13.62 (0.65)
Inorganic/organic agro chemicals
5.01 (1.49)
9.38 (2.66)
9.33 (2.46)
9.97 (2.43)
10.85 (2.68)
10.58 2.29()
14.72 (2.44)
13.02 (2.42)
18.68 (2.59)
22.32 (1.82)
27.94 (2.10)
32.39 (1.69)
29.51 (1.40)
40.49 (1.54)
41.55 (1.92)
36.41 (1.73)
Spices
6.67 (1.98)
11.32 (3.21)
7.49 (1.97)
3.68 (0.89)
5.51 (1.36)
11.32 (1.245)
13.03 (2.16)
14.25 (2.65)
17.28 (2.40)
19.54 (1.59)
16.56 (1.25)
19.70 (1.03)
31.77 (1.51)
40.24 (1.54)
43.97 (2.03)
52.35 (2.48)
Oil 7. 1 10 1 8. 9 1 1 1 2 2 2 2 4 4 4
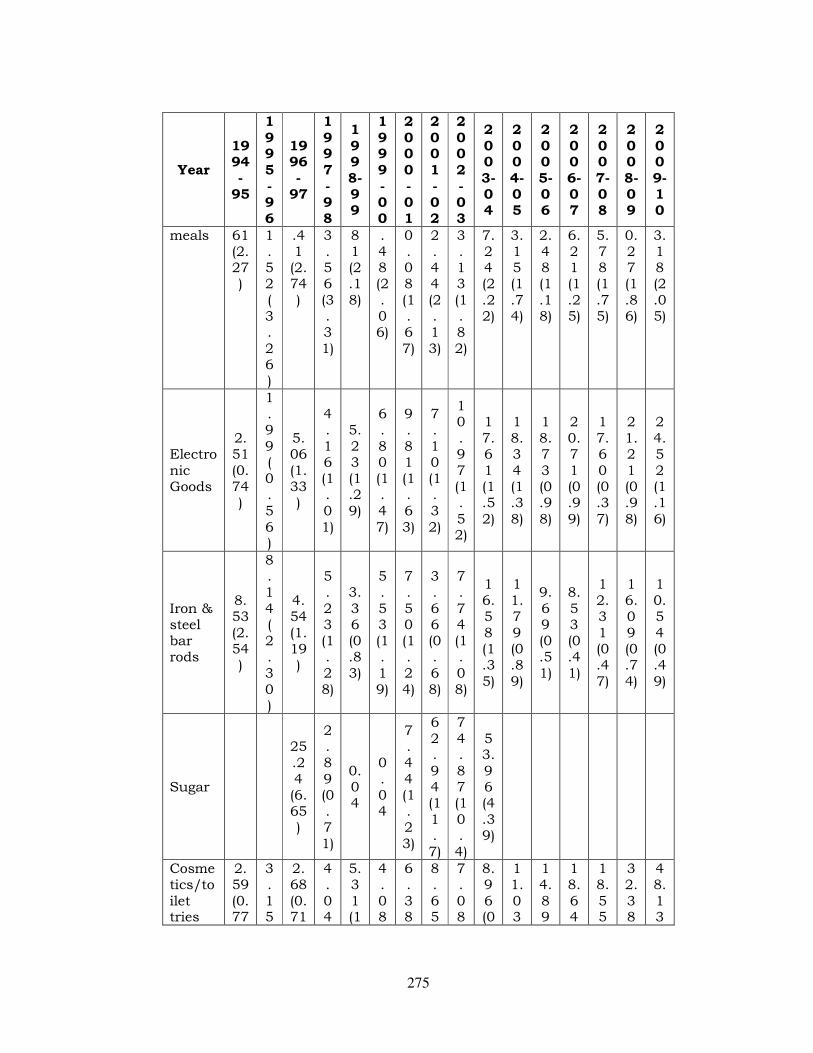
275
Year
1994-
95
1995-96
1996-
97
1997-98
1998-99
1999-00
2000-01
2001-02
2002-03
2003-04
2004-05
2005-06
2006-07
2007-08
2008-09
2009-10
meals 61 (2.27)
1.52 (3.26)
.41 (2.74)
3.56 (3.31)
81 (2.18)
.48 (2.06)
0.08 (1.67)
2.44 (2.13)
3.13 (1.82)
7.24 (2.22)
3.15 (1.74)
2.48 (1.18)
6.21 (1.25)
5.78 (1.75)
0.27 (1.86)
3.18 (2.05)
Electronic Goods
2.51 (0.74)
1.99 (0.56)
5.06 (1.33)
4.16 (1.01)
5.23 (1.29)
6.80 (1.47)
9.81 (1.63)
7.10 (1.32)
10.97 (1.52)
17.61 (1.52)
18.34 (1.38)
18.73 (0.98)
20.71 (0.99)
17.60 (0.37)
21.21 (0.98)
24.52 (1.16)
Iron & steel bar rods
8.53 (2.54)
8.14 (2.30)
4.54 (1.19)
5.23 (1.28)
3.36 (0.83)
5.53 (1.19)
7.50 (1.24)
3.66 (0.68)
7.74 (1.08)
16.58 (1.35)
11.79 (0.89)
9.69 (0.51)
8.53 (0.41)
12.31 (0.47)
16.09 (0.74)
10.54 (0.49)
Sugar
25.24 (6.65)
2.89 (0.71)
0.04
0.04
7.44 (1.23)
62.94 (11.7)
74.87 (10.4)
53.96 (4.39)
Cosmetics/toilet tries
2.59 (0.77
3.15
2.68 (0.71
4.04
5.31 (1
4.08
6.38
8.65
7.08
8.96 (0
11.03
14.89
18.64
18.55
32.38
48.13
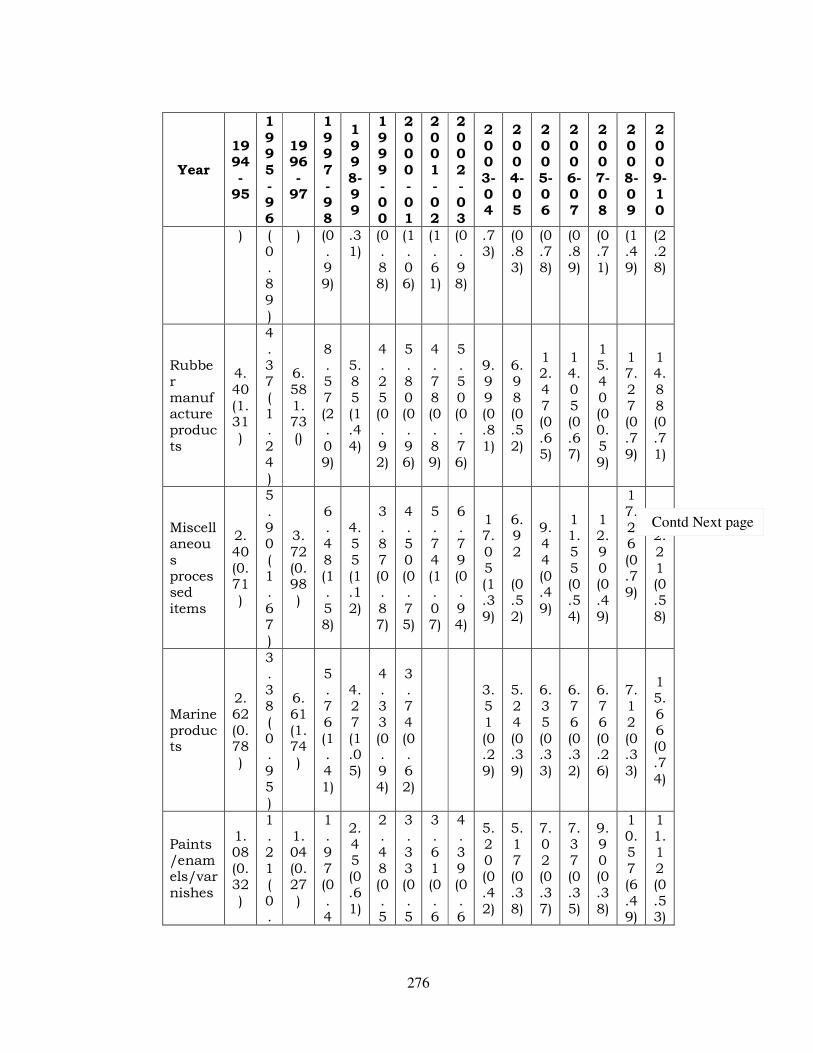
276
Year
1994-
95
1995-96
1996-
97
1997-98
1998-99
1999-00
2000-01
2001-02
2002-03
2003-04
2004-05
2005-06
2006-07
2007-08
2008-09
2009-10
) (0.89)
) (0.99)
.31)
(0.88)
(1.06)
(1.61)
(0.98)
.73)
(0.83)
(0.78)
(0.89)
(0.71)
(1.49)
(2.28)
Rubber manufacture products
4.40 (1.31)
4.37 (1.24)
6.58 1.73()
8.57 (2.09)
5.85 (1.44)
4.25 (0.92)
5.80 (0.96)
4.78 (0.89)
5.50 (0.76)
9.99 (0.81)
6.98 (0.52)
12.47 (0.65)
14.05 (0.67)
15.40 (00.59)
17.27 (0.79)
14.88 (0.71)
Miscellaneous processed items
2.40 (0.71)
5.90 (1.67)
3.72 (0.98)
6.48 (1.58)
4.55 (1.12)
3.87 (0.87)
4.50 (0.75)
5.74 (1.07)
6.79 (0.94)
17.05 (1.39)
6.92
(0.52)
9.44 (0.49)
11.55 (0.54)
12.90 (0.49)
17.26 (0.79)
12.21 (0.58)
Marine products
2.62 (0.78)
3.38 (0.95)
6.61 (1.74)
5.76 (1.41)
4.27 (1.05)
4.33 (0.94)
3.74 (0.62)
3.51 (0.29)
5.24 (0.39)
6.35 (0.33)
6.76 (0.32)
6.76 (0.26)
7.12 (0.33)
15.66 (0.74)
Paints/enamels/varnishes
1.08 (0.32)
1.21 (0.
1.04 (0.27)
1.97 (0.4
2.45 (0.61)
2.48 (0.5
3.33 (0.5
3.61 (0.6
4.39 (0.6
5.20 (0.42)
5.17 (0.38)
7.02 (0.37)
7.37 (0.35)
9.90 (0.38)
10.57 (6.49)
11.12 (0.53)
Contd Next page
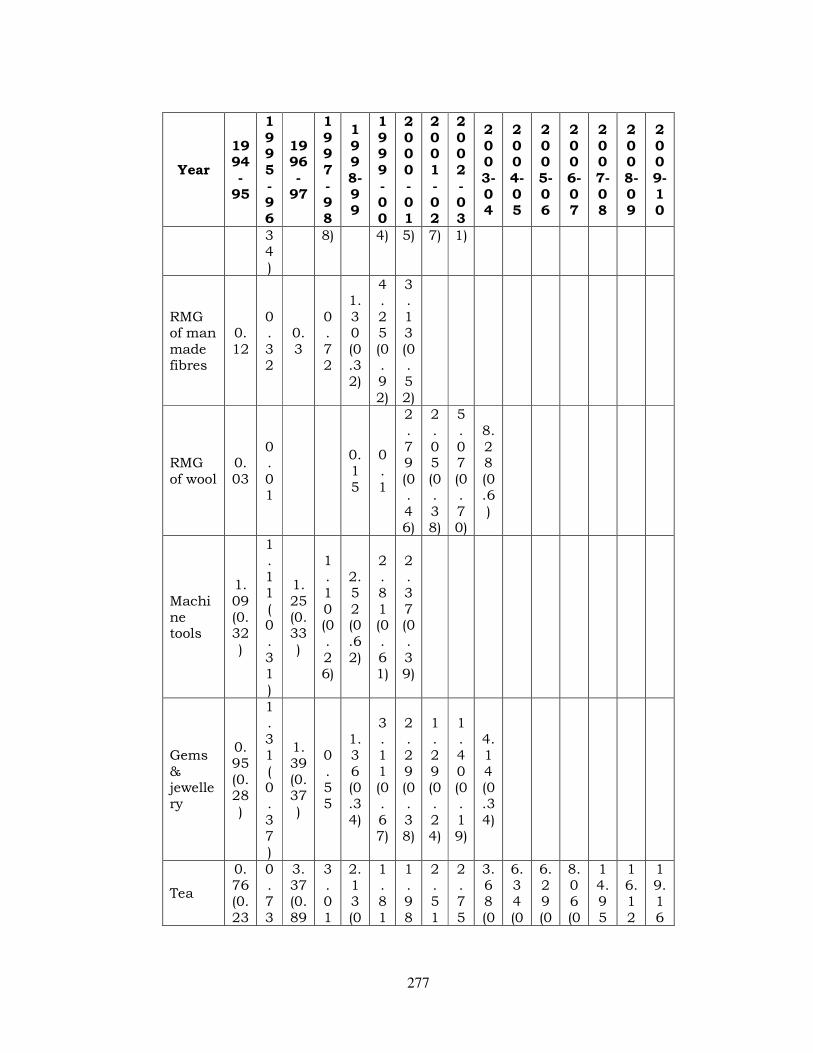
277
Year
1994-
95
1995-96
1996-
97
1997-98
1998-99
1999-00
2000-01
2001-02
2002-03
2003-04
2004-05
2005-06
2006-07
2007-08
2008-09
2009-10
34)
8) 4) 5) 7) 1)
RMG of man made fibres
0.12
0.32
0.3
0.72
1.30 (0.32)
4.25 (0.92)
3.13 (0.52)
RMG of wool
0.03
0.01
0.15
0.1
2.79 (0.46)
2.05 (0.38)
5.07 (0.70)
8.28 (0.6)
Machine tools
1.09 (0.32)
1.11 (0.31)
1.25 (0.33)
1.10 (0.26)
2.52 (0.62)
2.81 (0.61)
2.37 (0.39)
Gems & jewellery
0.95(0.28)
1.31 (0.37)
1.39 (0.37)
0.55
1.36 (0.34)
3.11 (0.67)
2.29 (0.38)
1.29 (0.24)
1.40 (0.19)
4.14 (0.34)
Tea
0.76 (0.23
0.73
3.37 (0.89
3.01
2.13 (0
1.81
1.98
2.51
2.75
3.68 (0
6.34 (0
6.29 (0
8.06 (0
14.95
16.12
19.16
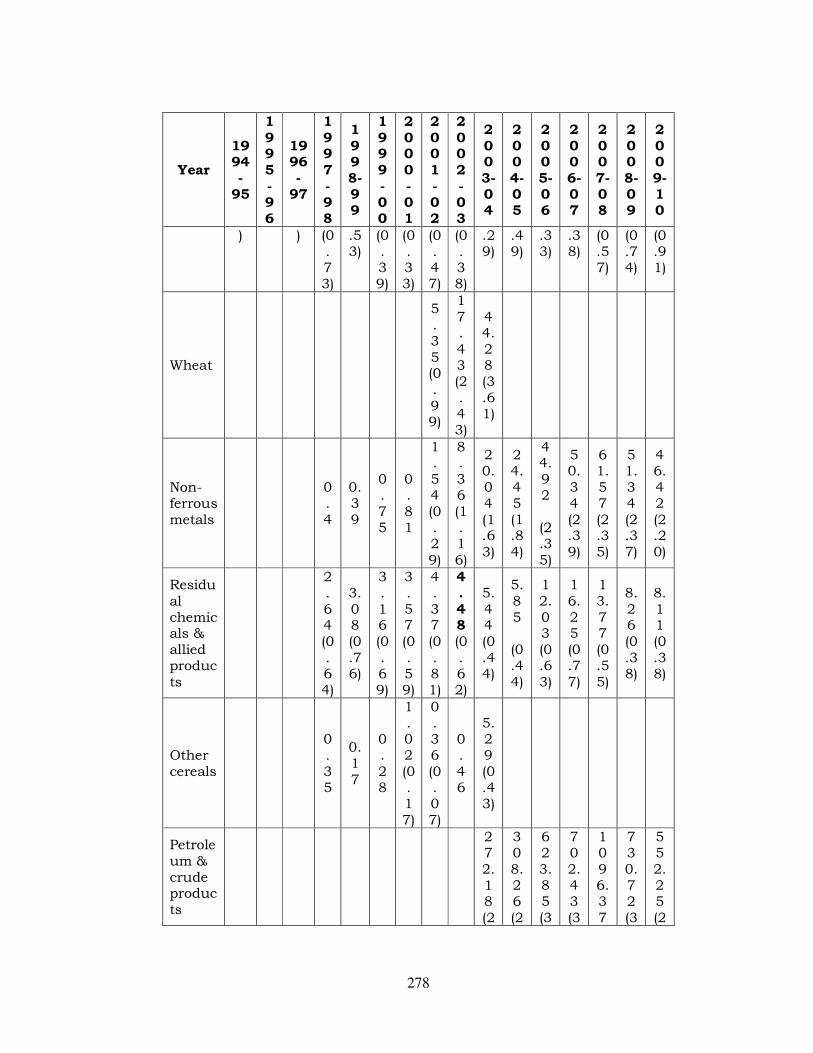
278
Year
1994-
95
1995-96
1996-
97
1997-98
1998-99
1999-00
2000-01
2001-02
2002-03
2003-04
2004-05
2005-06
2006-07
2007-08
2008-09
2009-10
) ) (0.73)
.53)
(0.39)
(0.33)
(0.47)
(0.38)
.29)
.49)
.33)
.38)
(0.57)
(0.74)
(0.91)
Wheat
5.35 (0.99)
17.43 (2.43)
44.28 (3.61)
Non-ferrous metals
0.4
0.39
0.75
0.81
1.54 (0.29)
8.36 (1.16)
20.04 (1.63)
24.45 (1.84)
44.92
(2.35)
50.34 (2.39)
61.57 (2.35)
51.34 (2.37)
46.42 (2.20)
Residual chemicals & allied products
2.64 (0.64)
3.08 (0.76)
3.16 (0.69)
3.57 (0.59)
4.37 (0.81)
4.48 (0.62)
5.44 (0.44)
5.85
(0.44)
12.03 (0.63)
16.25 (0.77)
13.77 (0.55)
8.26 (0.38)
8.11 (0.38)
Other cereals
0.35
0.17
0.28
1.02 (0.17)
0.36 (0.07)
0.46
5.29 (0.43)
Petroleum & crude products
272.18 (2
308.26 (2
623.85 (3
702.43 (3
1096.37
730.72 (3
552.25 (2
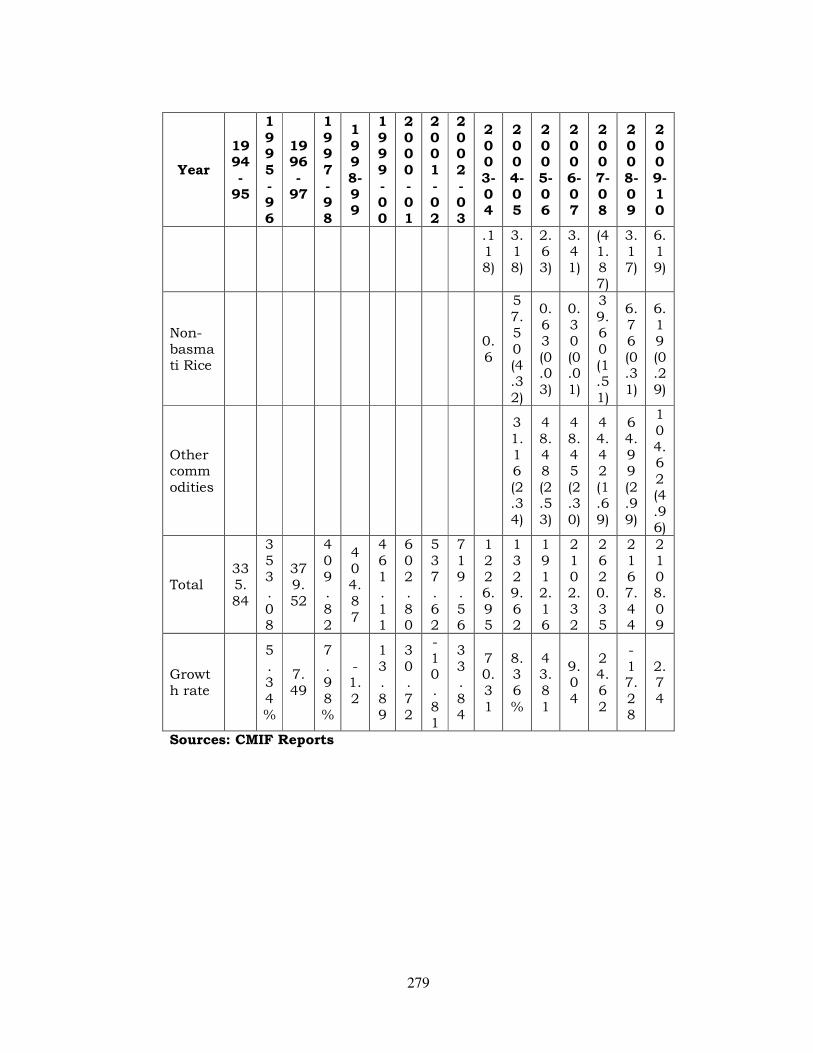
279
Year
1994-
95
1995-96
1996-
97
1997-98
1998-99
1999-00
2000-01
2001-02
2002-03
2003-04
2004-05
2005-06
2006-07
2007-08
2008-09
2009-10
.118)
3.18)
2.63)
3.41)
(41.87)
3.17)
6.19)
Non-basmati Rice
0.6
57.50 (4.32)
0.63 (0.03)
0.30 (0.01)
39.60 (1.51)
6.76 (0.31)
6.19 (0.29)
Other commodities
31.16 (2.34)
48.48 (2.53)
48.45 (2.30)
44.42 (1.69)
64.99 (2.99)
104.62 (4.96)
Total 335.84
353.08
379.52
409.82
404.87
461.11
602.80
537.62
719.56
1226.95
1329.62
1912.16
2102.32
2620.35
2167.44
2108.09
Growth rate
5.34%
7.49
7.98%
-1.2
13.89
30.72
-10.81
33.84
70.31
8.36%
43.81
9.04
24.62
-17.28
2.74
Sources: CMIF Reports
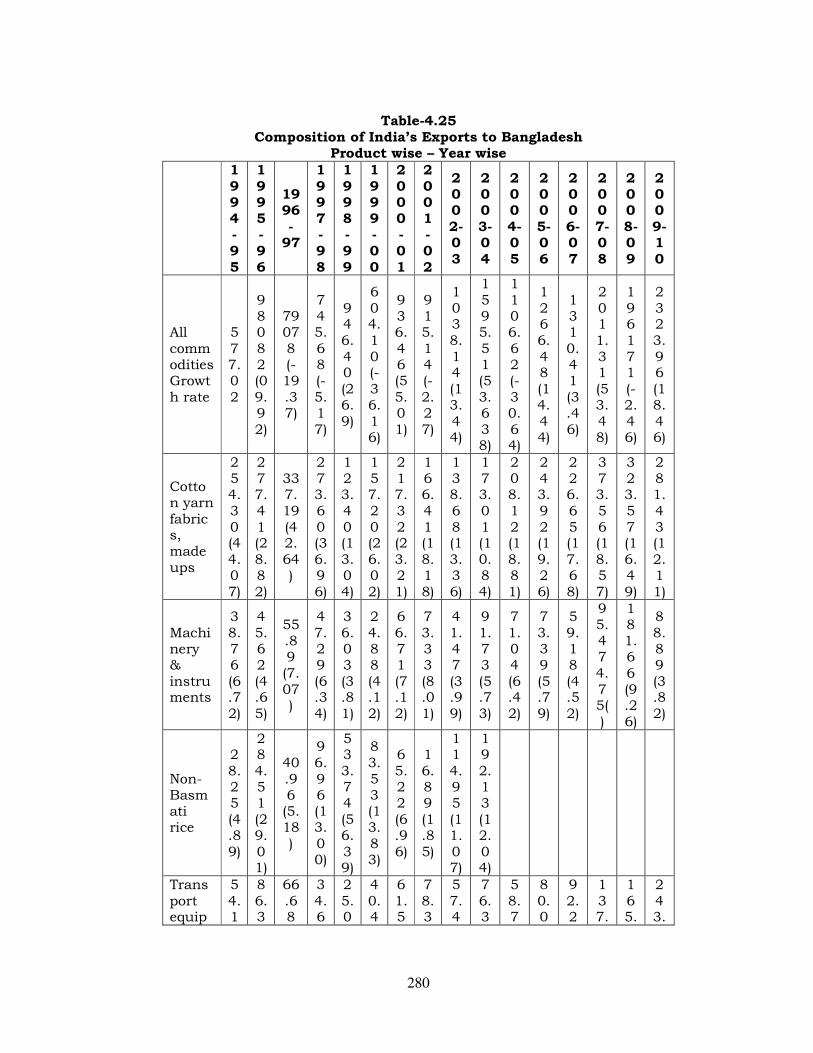
280
Table-4.25 Composition of India’s Exports to Bangladesh
Product wise – Year wise
1994-95
1995-96
1996-
97
1997-98
1998-99
1999-00
2000-01
2001-02
2002-03
2003-04
2004-05
2005-06
2006-07
2007-08
2008-09
2009-10
All commodities Growth rate
577.02
98082 (09.92)
79078 (-19.37)
745.68 (-5.17)
946.40 (26.9)
604.10 (-36.16)
936.46 (55.01)
915.14 (-2.27)
1038.14 (13.44)
1595.51 (53.638)
1106.62 (-30.64)
1266.48 (14.44)
1310.41 (3.46)
2011.31 (53.48)
196171 (-2.46)
2323.96 (18.46)
Cotton yarn fabrics, made ups
254.30 (44.07)
277.41 (28.82)
337.19 (42.64)
273.60 (36.96)
123.40 (13.04)
157.20 (26.02)
217.32 (23.21)
166.41 (18.18)
138.68 (13.36)
173.01 (10.84)
208.12 (18.81)
243.92 (19.26)
226.65 (17.68)
373.56 (18.57)
323.57 (16.49)
281.43 (12.11)
Machinery & instruments
38.76 (6.72)
45.62 (4.65)
55.89 (7.07)
47.29 (6.34)
36.03 (3.81)
24.88 (4.12)
66.71 (7.12)
73.33 (8.01)
41.47 (3.99)
91.73 (5.73)
71.04 (6.42)
73.39 (5.79)
59.18 (4.52)
95.47 4.75()
181.66 (9.26)
88.89 (3.82)
Non-Basmati rice
28.25 (4.89)
284.51 (29.01)
40.96 (5.18)
96.96 (13.00)
533.74 (56.39)
83.53 (13.83)
65.22 (6.96)
16.89 (1.85)
114.95 (11.07)
192.13 (12.04)
Transport equip
54.1
86.3
66.68
34.6
25.0
40.4
61.5
78.3
57.4
76.3
58.7
80.0
92.2
137.
165.
243.
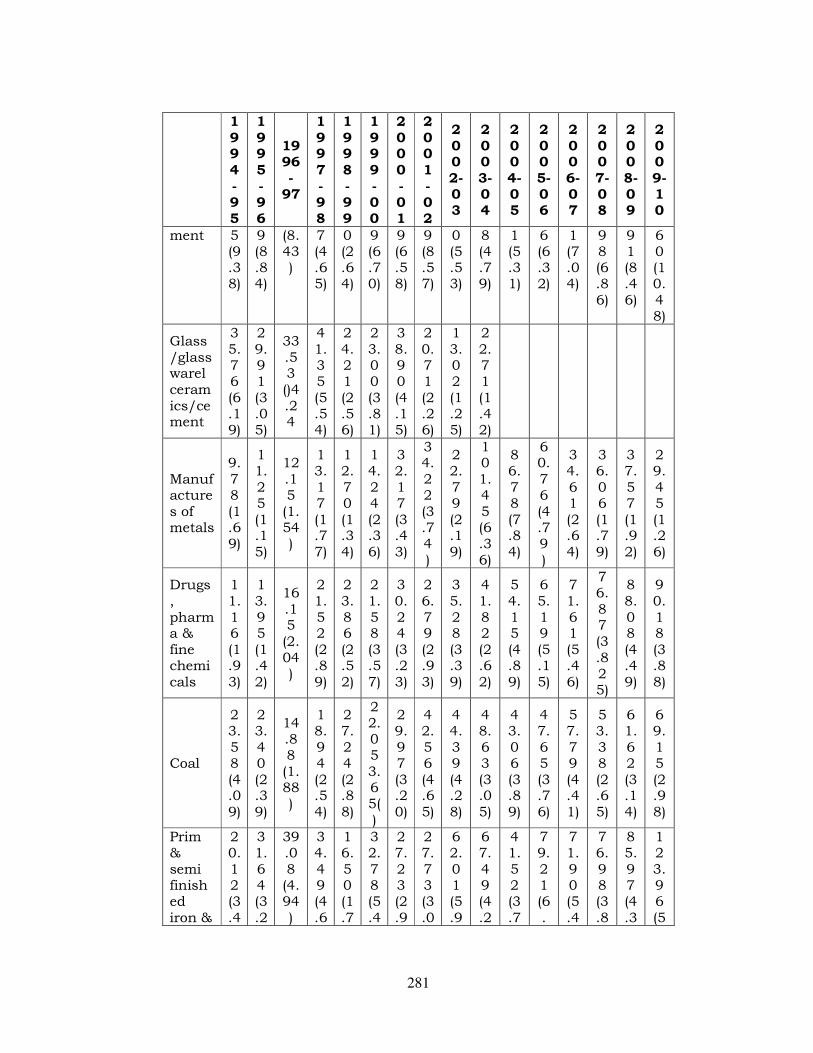
281
1994-95
1995-96
1996-
97
1997-98
1998-99
1999-00
2000-01
2001-02
2002-03
2003-04
2004-05
2005-06
2006-07
2007-08
2008-09
2009-10
ment 5 (9.38)
9 (8.84)
(8.43)
7 (4.65)
0 (2.64)
9 (6.70)
9 (6.58)
9 (8.57)
0 (5.53)
8 (4.79)
1 (5.31)
6 (6.32)
1 (7.04)
98 (6.86)
91 (8.46)
60 (10.48)
Glass/glass warel ceramics/cement
35.76 (6.19)
29.91 (3.05)
33.53 ()4.24
41.35 (5.54)
24.21 (2.56)
23.00 (3.81)
38.90 (4.15)
20.71 (2.26)
13.02 (1.25)
22.71 (1.42)
Manufactures of metals
9.78 (1.69)
11.25 (1.15)
12.15 (1.54)
13.17 (1.77)
12.70 (1.34)
14.24 (2.36)
32.17 (3.43)
34.22 (3.74 )
22.79 (2.19)
101.45 (6.36)
86.78 (7.84)
60.76 (4.79 )
34.61 (2.64)
36.06 (1.79)
37.57 (1.92)
29.45 (1.26)
Drugs, pharma & fine chemicals
11.16 (1.93)
13.95 (1.42)
16.15 (2.04)
21.52 (2.89)
23.86 (2.52)
21.58 (3.57)
30.24 (3.23)
26.79 (2.93)
35.28 (3.39)
41.82 (2.62)
54.15 (4.89)
65.19 (5.15)
71.61 (5.46)
76.87 (3.825)
88.08 (4.49)
90.18 (3.88)
Coal
23.58 (4.09)
23.40 (2.39)
14.88 (1.88)
18.94 (2.54)
27.24 (2.88)
22.05 3.65()
29.97 (3.20)
42.56 (4.65)
44.39 (4.28)
48.63 (3.05)
43.06 (3.89)
47.65 (3.76)
57.79 (4.41)
53.38 (2.65)
61.62 (3.14)
69.15 (2.98)
Prim & semi finished iron &
20.12 (3.4
31.64 (3.2
39.08 (4.94)
34.49 (4.6
16.50 (1.7
32.78 (5.4
27.23 (2.9
27.73 (3.0
62.01 (5.9
67.49 (4.2
41.52 (3.7
79.21 (6.
71.90 (5.4
76.98 (3.8
85.97 (4.3
123.96 (5
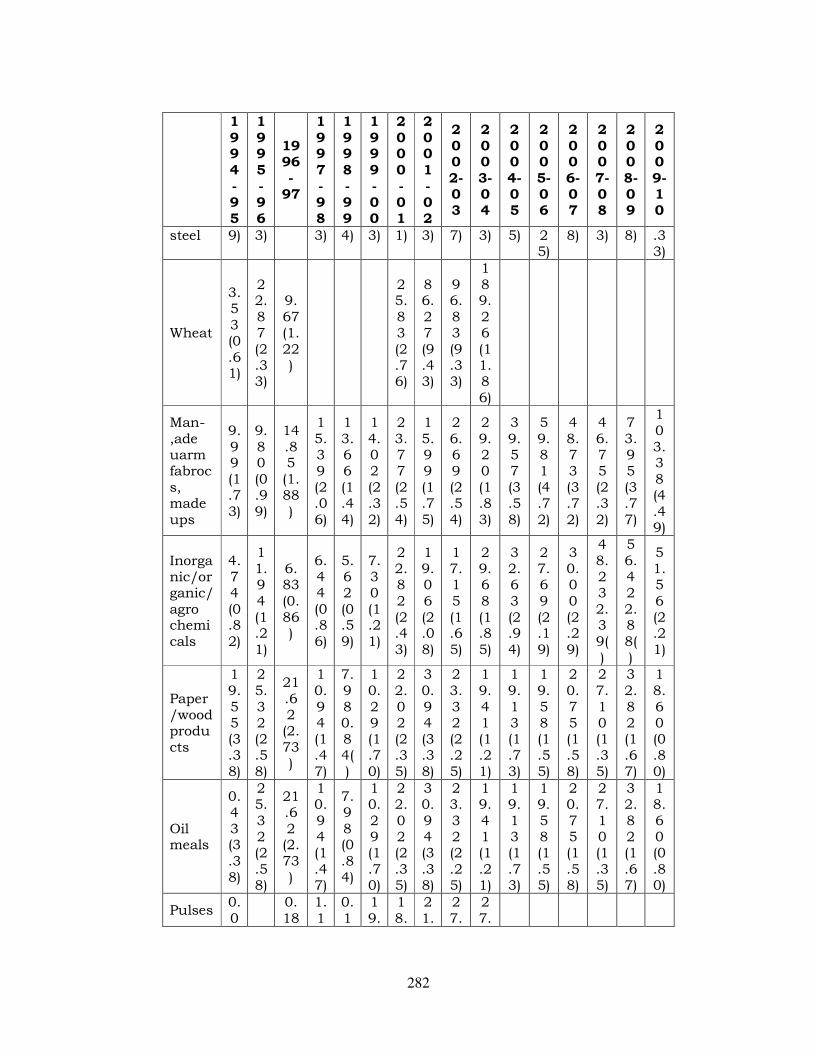
282
1994-95
1995-96
1996-
97
1997-98
1998-99
1999-00
2000-01
2001-02
2002-03
2003-04
2004-05
2005-06
2006-07
2007-08
2008-09
2009-10
steel 9) 3) 3) 4) 3) 1) 3) 7) 3) 5) 25)
8) 3) 8) .33)
Wheat
3.53 (0.61)
22.87 (2.33)
9.67 (1.22)
25.83 (2.76)
86.27 (9.43)
96.83 (9.33)
189.26 (11.86)
Man-,ade uarm fabrocs, made ups
9.99 (1.73)
9.80 (0.99)
14.85 (1.88)
15.39 (2.06)
13.66 (1.44)
14.02 (2.32)
23.77 (2.54)
15.99 (1.75)
26.69 (2.54)
29.20 (1.83)
39.57 (3.58)
59.81 (4.72)
48.73 (3.72)
46.75 (2.32)
73.95 (3.77)
103.38 (4.49)
Inorganic/organic/agro chemicals
4.74 (0.82)
11.94 (1.21)
6.83 (0.86)
6.44 (0.86)
5.62 (0.59)
7.30 (1.21)
22.82 (2.43)
19.06 (2.08)
17.15 (1.65)
29.68 (1.85)
32.63 (2.94)
27.69 (2.19)
30.00 (2.29)
48.23 2.39()
56.42 2.88()
51.56 (2.21)
Paper/wood products
19.55 (3.38)
25.32 (2.58)
21.62 (2.73)
10.94 (1.47)
7.98 0.84()
10.29 (1.70)
22.02 (2.35)
30.94 (3.38)
23.32 (2.25)
19.41 (1.21)
19.13 (1.73)
19.58 (1.55)
20.75 (1.58)
27.10 (1.35)
32.82 (1.67)
18.60 (0.80)
Oil meals
0.43 (3.38)
25.32 (2.58)
21.62 (2.73)
10.94 (1.47)
7.98 (0.84)
10.29 (1.70)
22.02 (2.35)
30.94 (3.38)
23.32 (2.25)
19.41 (1.21)
19.13 (1.73)
19.58 (1.55)
20.75 (1.58)
27.10 (1.35)
32.82 (1.67)
18.60 (0.80)
Pulses 0.0
0.18
1.1
0.1
19.
18.
21.
27.
27.
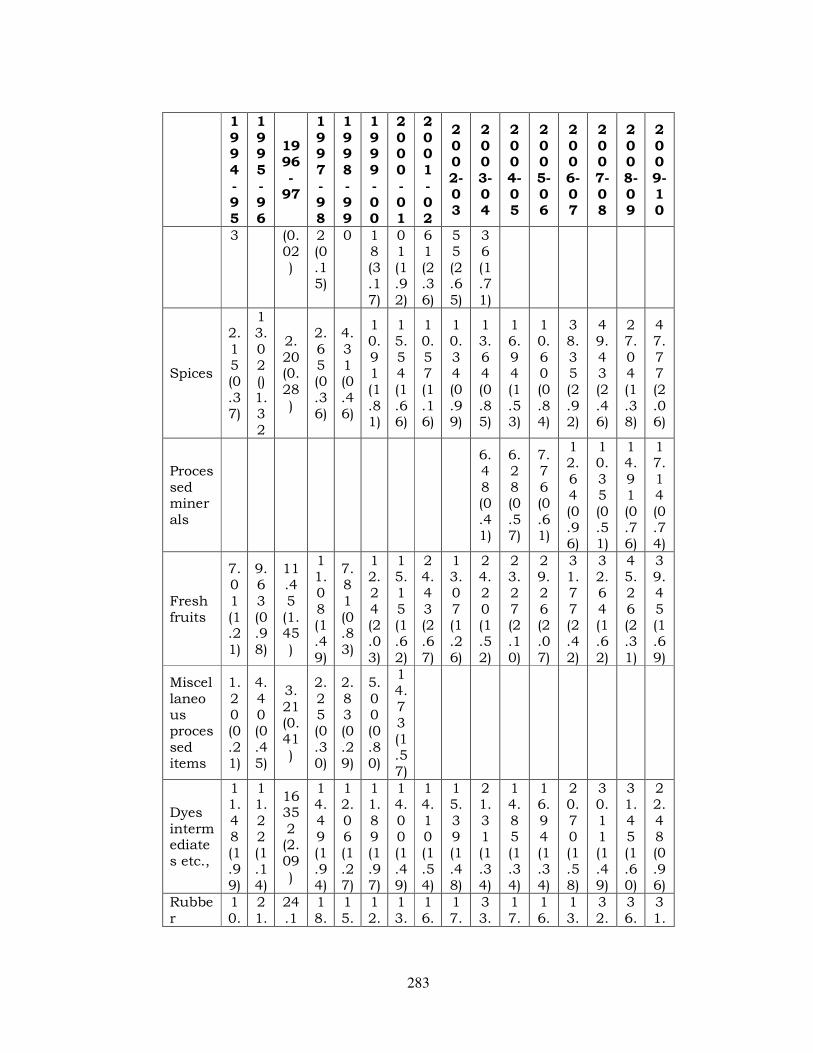
283
1994-95
1995-96
1996-
97
1997-98
1998-99
1999-00
2000-01
2001-02
2002-03
2003-04
2004-05
2005-06
2006-07
2007-08
2008-09
2009-10
3 (0.02)
2 (0.15)
0 18 (3.17)
01 (1.92)
61 (2.36)
55 (2.65)
36 (1.71)
Spices
2.15 (0.37)
13.02 ()1.32
2.20 (0.28)
2.65 (0.36)
4.31 (0.46)
10.91 (1.81)
15.54 (1.66)
10.57 (1.16)
10.34 (0.99)
13.64 (0.85)
16.94 (1.53)
10.60 (0.84)
38.35 (2.92)
49.43 (2.46)
27.04 (1.38)
47.77 (2.06)
Processed minerals
6.48 (0.41)
6.28 (0.57)
7.76 (0.61)
12.64 (0.96)
10.35 (0.51)
14.91 (0.76)
17.14 (0.74)
Fresh fruits
7.01 (1.21)
9.63 (0.98)
11.45 (1.45)
11.08 (1.49)
7.81 (0.83)
12.24 (2.03)
15.15 (1.62)
24.43 (2.67)
13.07 (1.26)
24.20 (1.52)
23.27 (2.10)
29.26 (2.07)
31.77 (2.42)
32.64 (1.62)
45.26 (2.31)
39.45 (1.69)
Miscellaneous processed items
1.20 (0.21)
4.40 (0.45)
3.21 (0.41)
2.25 (0.30)
2.83 (0.29)
5.00 (0.80)
14.73 (1.57)
Dyes intermediates etc.,
11.48 (1.99)
11.22 (1.14)
16352 (2.09)
14.49 (1.94)
12.06 (1.27)
11.89 (1.97)
14.00 (1.49)
14.10 (1.54)
15.39 (1.48)
21.31 (1.34)
14.85 (1.34)
16.94 (1.34)
20.70 (1.58)
30.11 (1.49)
31.45 (1.60)
22.48 (0.96)
Rubber
10.
21.
24.1
18.
15.
12.
13.
16.
17.
33.
17.
16.
13.
32.
36.
31.
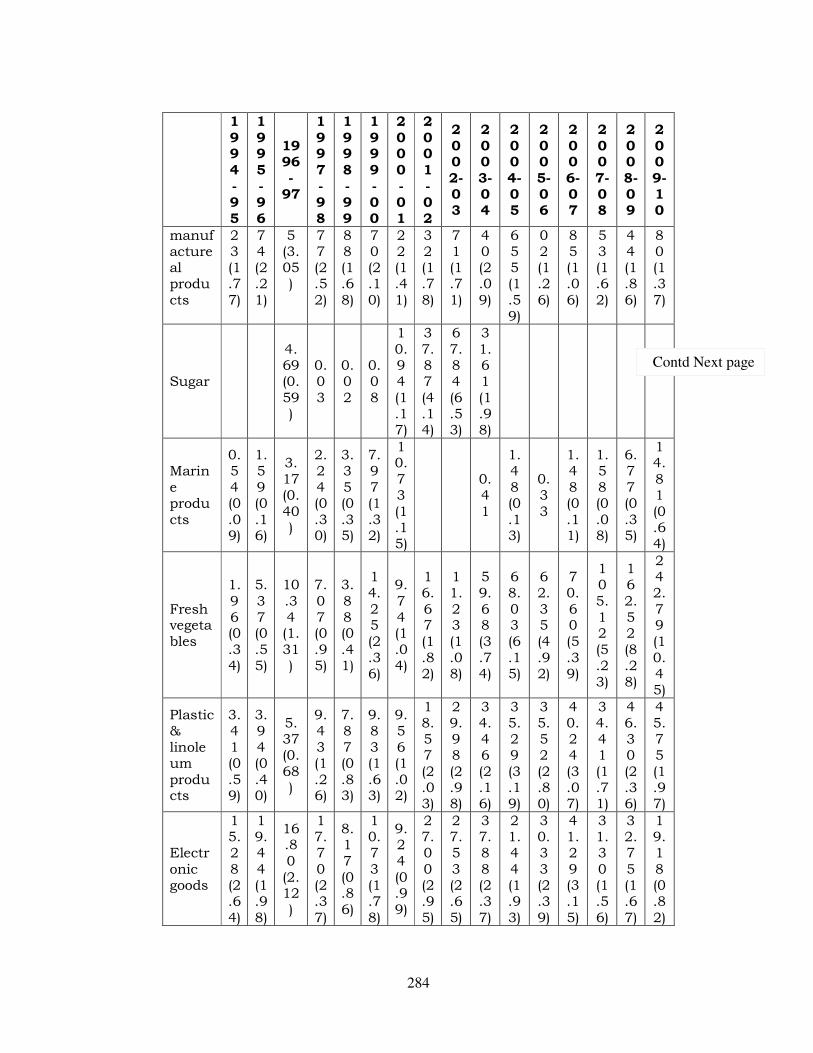
284
1994-95
1995-96
1996-
97
1997-98
1998-99
1999-00
2000-01
2001-02
2002-03
2003-04
2004-05
2005-06
2006-07
2007-08
2008-09
2009-10
manufactureal products
23 (1.77)
74 (2.21)
5 (3.05)
77 (2.52)
88 (1.68)
70 (2.10)
22 (1.41)
32 (1.78)
71 (1.71)
40 (2.09)
655 (1.59)
02 (1.26)
85 (1.06)
53 (1.62)
44 (1.86)
80 (1.37)
Sugar
4.69 (0.59)
0.03
0.02
0.08
10.94 (1.17)
37.87 (4.14)
67.84 (6.53)
31.61 (1.98)
Marine products
0.54 (0.09)
1.59 (0.16)
3.17 (0.40)
2.24 (0.30)
3.35 (0.35)
7.97 (1.32)
10.73 (1.15)
0.41
1.48 (0.13)
0.33
1.48 (0.11)
1.58 (0.08)
6.77 (0.35)
14.81 (0.64)
Fresh vegetables
1.96 (0.34)
5.37 (0.55)
10.34 (1.31)
7.07 (0.95)
3.88 (0.41)
14.25 (2.36)
9.74 (1.04)
16.67 (1.82)
11.23 (1.08)
59.68 (3.74)
68.03 (6.15)
62.35 (4.92)
70.60 (5.39)
105.12 (5.23)
162.52 (8.28)
242.79 (10.45)
Plastic & linoleum products
3.41 (0.59)
3.94 (0.40)
5.37 (0.68)
9.43 (1.26)
7.87 (0.83)
9.83 (1.63)
9.56 (1.02)
18.57 (2.03)
29.98 (2.98)
34.46 (2.16)
35.29 (3.19)
35.52 (2.80)
40.24 (3.07)
34.41 (1.71)
46.30 (2.36)
45.75 (1.97)
Electronic goods
15.28 (2.64)
19.44 (1.98)
16.80 (2.12)
17.70 (2.37)
8.17 (0.86)
10.73 (1.78)
9.24 (0.99)
27.00 (2.95)
27.53 (2.65)
37.88 (2.37)
21.44 (1.93)
30.33 (2.39)
41.29 (3.15)
31.30 (1.56)
32.75 (1.67)
19.18 (0.82)
Contd Next page
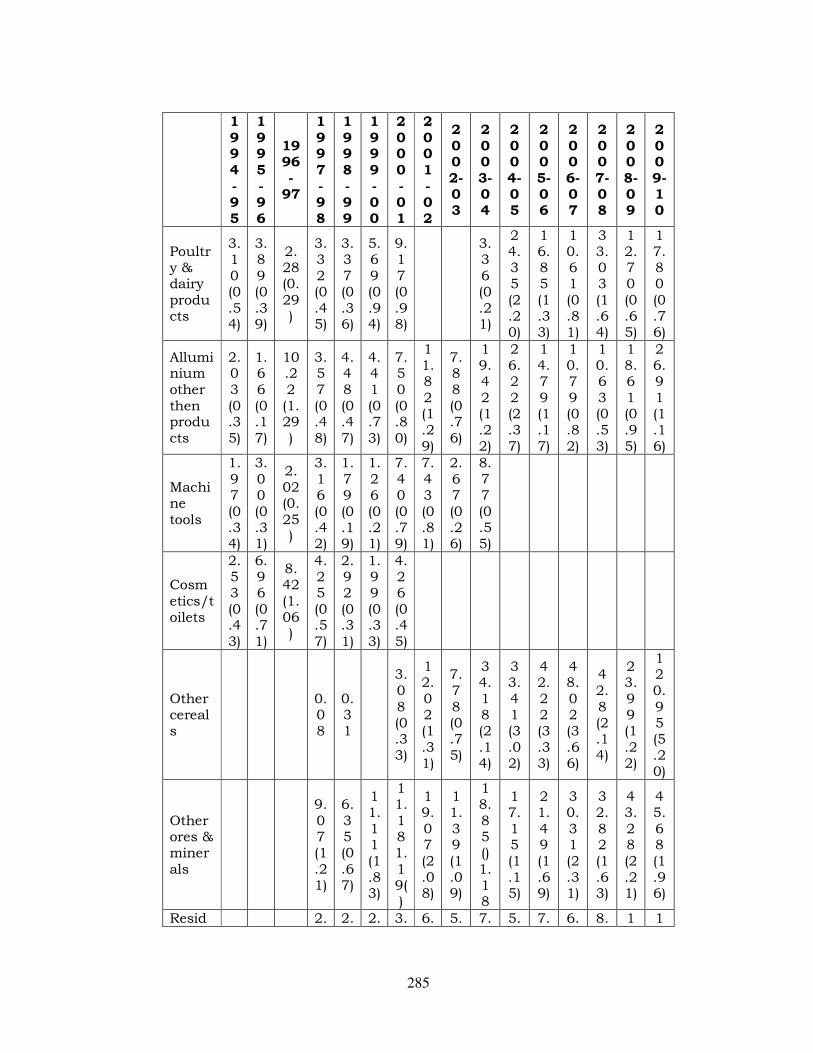
285
1994-95
1995-96
1996-
97
1997-98
1998-99
1999-00
2000-01
2001-02
2002-03
2003-04
2004-05
2005-06
2006-07
2007-08
2008-09
2009-10
Poultry & dairy products
3.10 (0.54)
3.89 (0.39)
2.28 (0.29)
3.32 (0.45)
3.37 (0.36)
5.69 (0.94)
9.17 (0.98)
3.36 (0.21)
24.35 (2.20)
16.85 (1.33)
10.61 (0.81)
33.03 (1.64)
12.70 (0.65)
17.80 (0.76)
Alluminium other then products
2.03 (0.35)
1.66 (0.17)
10.22 (1.29)
3.57 (0.48)
4.48 (0.47)
4.41 (0.73)
7.50 (0.80)
11.82 (1.29)
7.88 (0.76)
19.42 (1.22)
26.22 (2.37)
14.79 (1.17)
10.79 (0.82)
10.63 (0.53)
18.61 (0.95)
26.91 (1.16)
Machine tools
1.97 (0.34)
3.00 (0.31)
2.02(0.25)
3.16 (0.42)
1.79 (0.19)
1.26 (0.21)
7.40 (0.79)
7.43 (0.81)
2.67 (0.26)
8.77 (0.55)
Cosmetics/toilets
2.53 (0.43)
6.96 (0.71)
8.42 (1.06)
4.25 (0.57)
2.92 (0.31)
1.99 (0.33)
4.26 (0.45)
Other cereals
0.08
0.31
3.08 (0.33)
12.02 (1.31)
7.78 (0.75)
34.18 (2.14)
33.41 (3.02)
42.22 (3.33)
48.02 (3.66)
42.8 (2.14)
23.99 (1.22)
120.95 (5.20)
Other ores & minerals
9.07 (1.21)
6.35 (0.67)
11.11 (1.83)
11.18 1.19()
19.07 (2.08)
11.39 (1.09)
18.85 ()1.18
17.15 (1.15)
21.49 (1.69)
30.31 (2.31)
32.82 (1.63)
43.28 (2.21)
45.68 (1.96)
Resid 2. 2. 2. 3. 6. 5. 7. 5. 7. 6. 8. 1 1
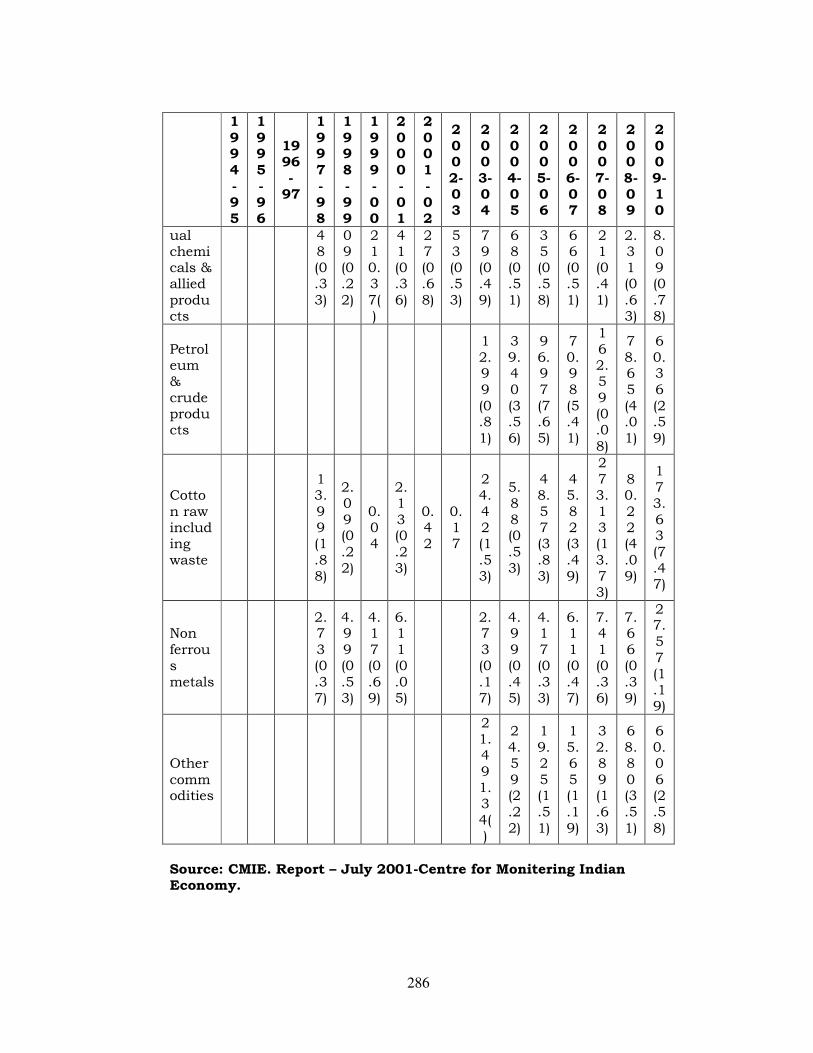
286
1994-95
1995-96
1996-
97
1997-98
1998-99
1999-00
2000-01
2001-02
2002-03
2003-04
2004-05
2005-06
2006-07
2007-08
2008-09
2009-10
ual chemicals & allied products
48 (0.33)
09 (0.22)
21 0.37()
41 (0.36)
27 (0.68)
53 (0.53)
79 (0.49)
68 (0.51)
35 (0.58)
66 (0.51)
21 (0.41)
2.31 (0.63)
8.09 (0.78)
Petroleum & crude products
12.99 (0.81)
39.40 (3.56)
96.97 (7.65)
70.98 (5.41)
162.59 (0.08)
78.65 (4.01)
60.36 (2.59)
Cotton raw including waste
13.99 (1.88)
2.09 (0.22)
0.04
2.13 (0.23)
0.42
0.17
24.42 (1.53)
5.88 (0.53)
48.57 (3.83)
45.82 (3.49)
273.13 (13.73)
80.22 (4.09)
173.63 (7.47)
Non ferrous metals
2.73 (0.37)
4.99 (0.53)
4.17 (0.69)
6.11 (0.05)
2.73 (0.17)
4.99 (0.45)
4.17 (0.33)
6.11 (0.47)
7.41 (0.36)
7.66 (0.39)
27.57 (1.19)
Other commodities
21.49 1.34()
24.59 (2.22)
19.25 (1.51)
15.65 (1.19)
32.89 (1.63)
68.80 (3.51)
60.06 (2.58)
Source: CMIE. Report – July 2001-Centre for Monitering Indian Economy.

287
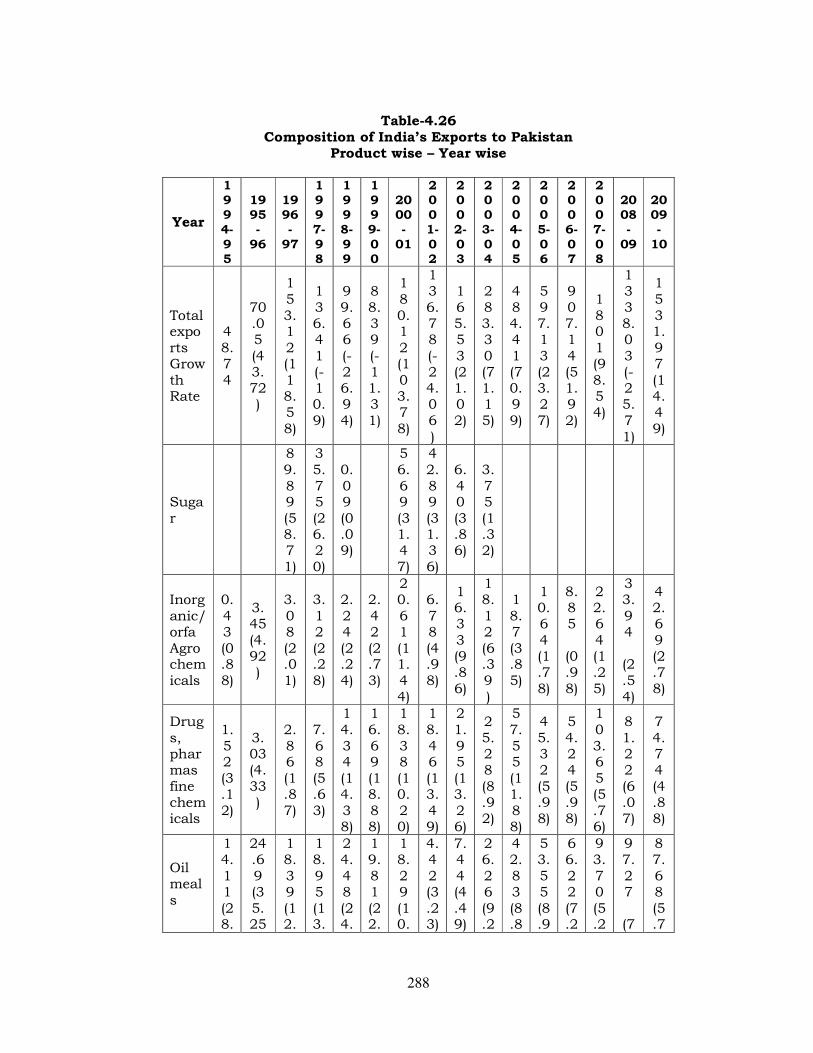
288
Table-4.26 Composition of India’s Exports to Pakistan
Product wise – Year wise
Year
1994-
95
1995-
96
1996-
97
1997-
98
1998-
99
1999-
00
2000-
01
2001-
02
2002-
03
2003-
04
2004-
05
2005-
06
2006-
07
2007-
08
2008-
09
2009-
10
Total exports Growth Rate
48.74
70.05 (43.72)
153.12 (118.58)
136.41 (-10.9)
99.66 (-26.94)
88.39 (-11.31)
180.12 (103.78)
136.78 (-24.06 )
165.53 (21.02)
283.30 (71.15)
484.41 (70.99)
597.13 (23.27)
907.14 (51.92)
1801 (98.54)
1338.03 (-25.71)
1531.97 (14.49)
Sugar
89.89 (58.71)
35.75 (26.20)
0.09 (0.09)
56.69 (31.47)
42.89 (31.36)
6.40 (3.86)
3.75 (1.32)
Inorganic/orfa Agro chemicals
0.43 (0.88)
3.45 (4.92)
3.08 (2.01)
3.12 (2.28)
2.24 (2.24)
2.42 (2.73)
20.61 (11.44)
6.78 (4.98)
16.33 (9.86)
18.12 (6.39 )
18.7 (3.85)
10.64 (1.78)
8.85
(0.98)
22.64 (1.25)
33.94
(2.54)
42.69 (2.78)
Drugs, pharmas fine chemicals
1.52 (3.12)
3.03 (4.33)
2.86 (1.87)
7.68 (5.63)
14.34 (14.38)
16.69 (18.88)
18.38 (10.20)
18.46 (13.49)
21.95 (13.26)
25.28 (8.92)
57.55 (11.88)
45.32 (5.98)
54.24 (5.98)
103.65 (5.76)
81.22 (6.07)
74.74 (4.88)
Oil meals
14.11 (28.
24.69 (35.25
18.39 (12.
18.95 (13.
24.48 (24.
19.81 (22.
18.29 (10.
4.42 (3.23)
7.44 (4.49)
26.26 (9.2
42.83 (8.8
53.55 (8.9
66.22 (7.2
93.70 (5.2
97.27
(7
87.68 (5.7
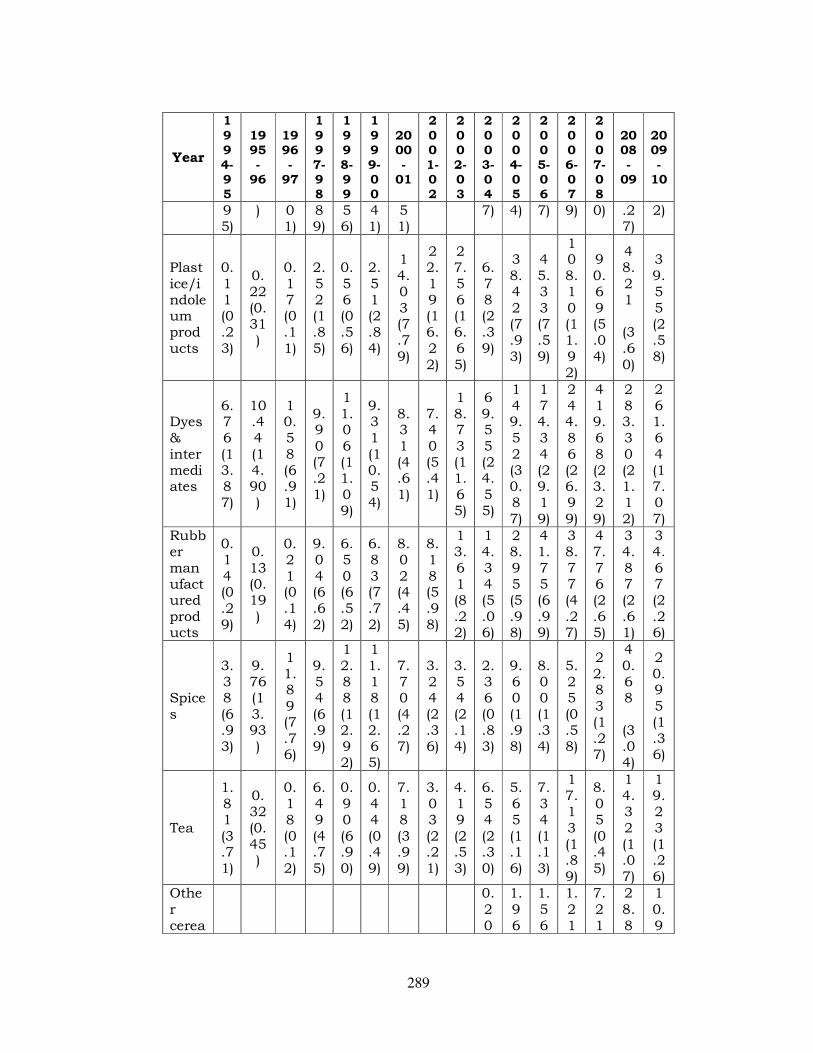
289
Year
1
994-95
1995-
96
1996-
97
1
997-98
1
998-99
1
999-00
2000-
01
2
001-02
2
002-03
2
003-04
2
004-05
2
005-06
2
006-07
2
007-08
2008-
09
2009-
10
95)
) 01)
89)
56)
41)
51)
7) 4) 7) 9) 0) .27)
2)
Plastice/indoleum products
0.11 (0.23)
0.22 (0.31)
0.17 (0.11)
2.52 (1.85)
0.56 (0.56)
2.51 (2.84)
14.03 (7.79)
22.19 (16.22)
27.56 (16.65)
6.78 (2.39)
38.42 (7.93)
45.33 (7.59)
108.10 (11.92)
90.69 (5.04)
48.21
(3.60)
39.55 (2.58)
Dyes & intermediates
6.76 (13.87)
10.44 (14.90)
10.58 (6.91)
9.90 (7.21)
11.06 (11.09)
9.31 (10.54)
8.31 (4.61)
7.40 (5.41)
18.73 (11.65)
69.55 (24.55)
149.52 (30.87)
174.34 (29.19)
244.86 (26.99)
419.68 (23.29)
283.30 (21.12)
261.64 (17.07)
Rubber manufactured products
0.14 (0.29)
0.13 (0.19)
0.21 (0.14)
9.04 (6.62)
6.50 (6.52)
6.83 (7.72)
8.02 (4.45)
8.18 (5.98)
13.61 (8.22)
14.34 (5.06)
28.95 (5.98)
41.75 (6.99)
38.77 (4.27)
47.76 (2.65)
34.87 (2.61)
34.67 (2.26)
Spices
3.38 (6.93)
9.76 (13.93)
11.89 (7.76)
9.54 (6.99)
12.88 (12.92)
11.18 (12.65)
7.70 (4.27)
3.24 (2.36)
3.54 (2.14)
2.36 (0.83)
9.60 (1.98)
8.00 (1.34)
5.25 (0.58)
22.83 (1.27)
40.68
(3.04)
20.95 (1.36)
Tea
1.81 (3.71)
0.32 (0.45)
0.18 (0.12)
6.49 (4.75)
0.90 (6.90)
0.44 (0.49)
7.18 (3.99)
3.03 (2.21)
4.19 (2.53)
6.54 (2.30)
5.65 (1.16)
7.34 (1.13)
17.13 (1.89)
8.05 (0.45)
14.32 (1.07)
19.23 (1.26)
Other cerea
0.20
1.96
1.56
1.21
7.21
28.8
10.9
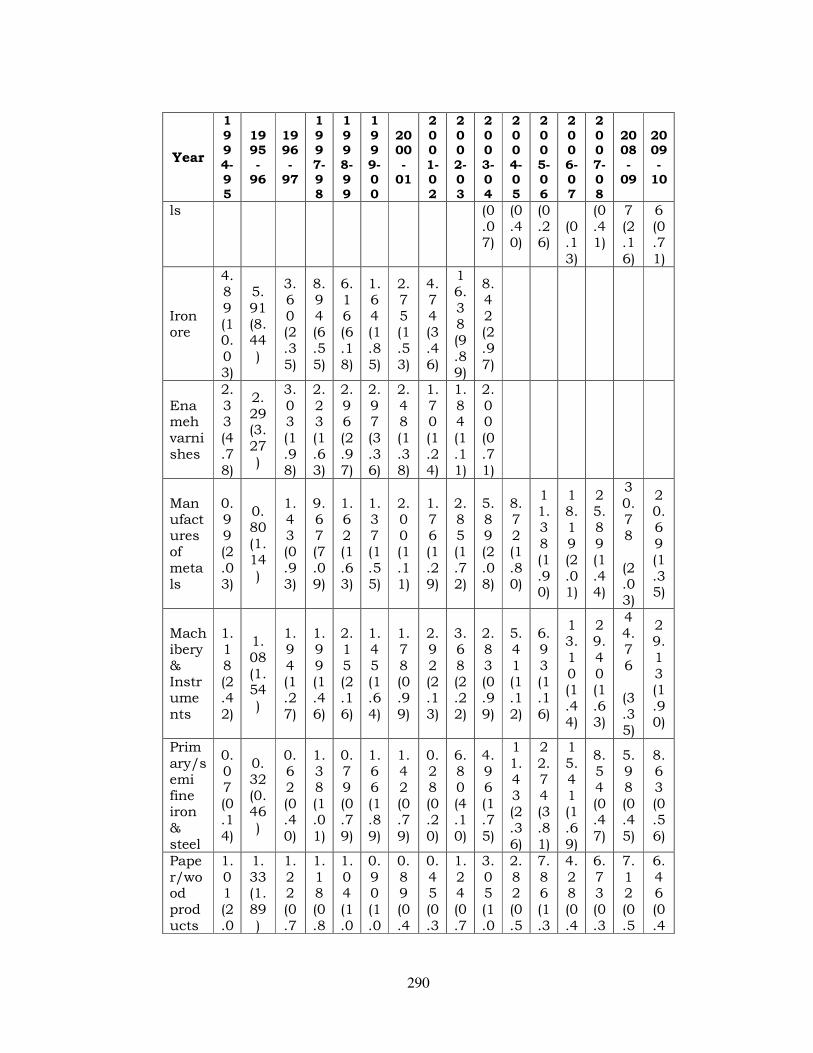
290
Year
1
994-95
1995-
96
1996-
97
1
997-98
1
998-99
1
999-00
2000-
01
2
001-02
2
002-03
2
003-04
2
004-05
2
005-06
2
006-07
2
007-08
2008-
09
2009-
10
ls (0.07)
(0.40)
(0.26)
(0.13)
(0.41)
7 (2.16)
6 (0.71)
Iron ore
4.89 (10.03)
5.91 (8.44)
3.60 (2.35)
8.94 (6.55)
6.16 (6.18)
1.64 (1.85)
2.75 (1.53)
4.74 (3.46)
16.38 (9.89)
8.42 (2.97)
Enameh varnishes
2.33 (4.78)
2.29 (3.27)
3.03 (1.98)
2.23 (1.63)
2.96 (2.97)
2.97 (3.36)
2.48 (1.38)
1.70 (1.24)
1.84 (1.11)
2.00 (0.71)
Manufactures of metals
0.99 (2.03)
0.80 (1.14)
1.43 (0.93)
9.67 (7.09)
1.62 (1.63)
1.37 (1.55)
2.00 (1.11)
1.76 (1.29)
2.85 (1.72)
5.89 (2.08)
8.72 (1.80)
11.38 (1.90)
18.19 (2.01)
25.89 (1.44)
30.78
(2.03)
20.69 (1.35)
Machibery & Instruments
1.18 (2.42)
1.08 (1.54)
1.94 (1.27)
1.99 (1.46)
2.15 (2.16)
1.45 (1.64)
1.78 (0.99)
2.92 (2.13)
3.68 (2.22)
2.83 (0.99)
5.41 (1.12)
6.93 (1.16)
13.10 (1.44)
29.40 (1.63)
44.76
(3.35)
29.13 (1.90)
Primary/semi fine iron & steel
0.07 (0.14)
0.32 (0.46)
0.62 (0.40)
1.38 (1.01)
0.79 (0.79)
1.66 (1.89)
1.42 (0.79)
0.28 (0.20)
6.80 (4.10)
4.96 (1.75)
11.43 (2.36)
22.74 (3.81)
15.41 (1.69)
8.54 (0.47)
5.98 (0.45)
8.63 (0.56)
Paper/wood products
1.01 (2.0
1.33(1.89)
1.22 (0.7
1.18 (0.8
1.04 (1.0
0.90 (1.0
0.89 (0.4
0.45 (0.3
1.24 (0.7
3.05 (1.0
2.82 (0.5
7.86 (1.3
4.28 (0.4
6.73 (0.3
7.12 (0.5
6.46 (0.4
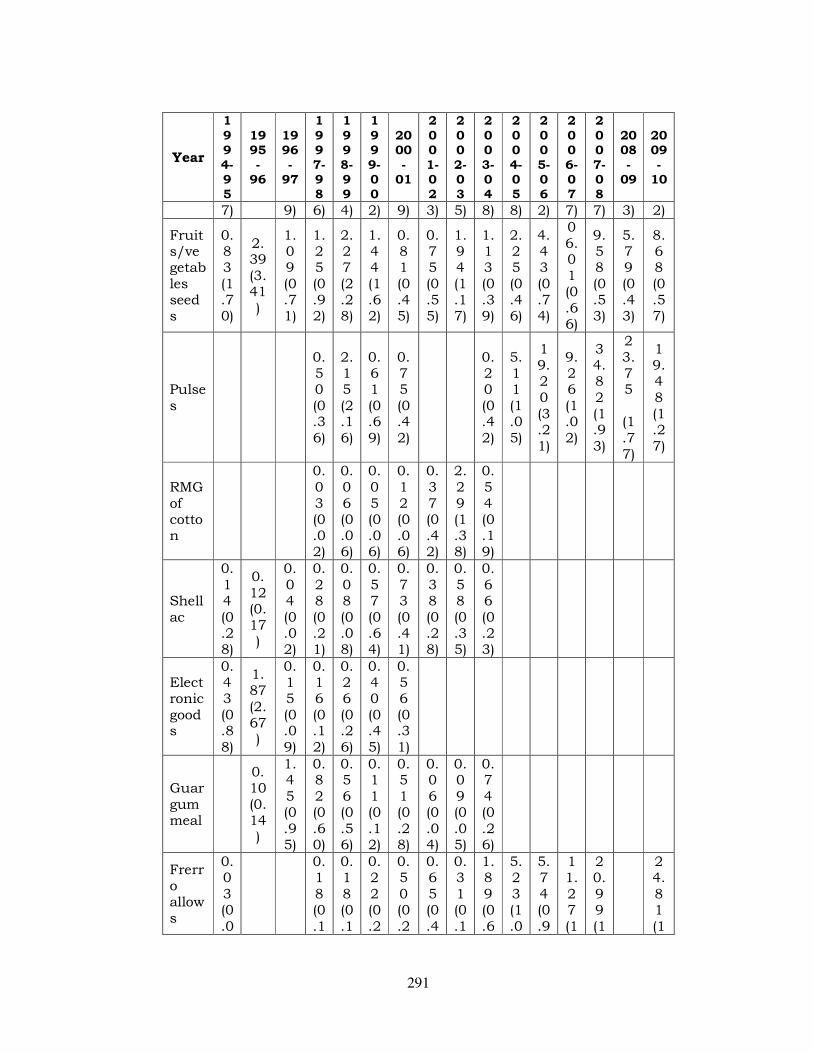
291
Year
1
994-95
1995-
96
1996-
97
1
997-98
1
998-99
1
999-00
2000-
01
2
001-02
2
002-03
2
003-04
2
004-05
2
005-06
2
006-07
2
007-08
2008-
09
2009-
10
7) 9) 6) 4) 2) 9) 3) 5) 8) 8) 2) 7) 7) 3) 2)
Fruits/vegetables seeds
0.83 (1.70)
2.39 (3.41)
1.09 (0.71)
1.25 (0.92)
2.27 (2.28)
1.44 (1.62)
0.81 (0.45)
0.75 (0.55)
1.94 (1.17)
1.13 (0.39)
2.25 (0.46)
4.43 (0.74)
06.01 (0.66)
9.58 (0.53)
5.79 (0.43)
8.68 (0.57)
Pulses
0.50 (0.36)
2.15 (2.16)
0.61 (0.69)
0.75 (0.42)
0.20 (0.42)
5.11 (1.05)
19.20 (3.21)
9.26 (1.02)
34.82 (1.93)
23.75
(1.77)
19.48 (1.27)
RMG of cotton
0.03 (0.02)
0.06 (0.06)
0.05 (0.06)
0.12 (0.06)
0.37 (0.42)
2.29 (1.38)
0.54 (0.19)
Shellac
0.14 (0.28)
0.12 (0.17)
0.04 (0.02)
0.28 (0.21)
0.08 (0.08)
0.57 (0.64)
0.73 (0.41)
0.38 (0.28)
0.58 (0.35)
0.66 (0.23)
Electronic goods
0.43 (0.88)
1.87 (2.67)
0.15 (0.09)
0.16 (0.12)
0.26 (0.26)
0.40 (0.45)
0.56 (0.31)
Guargum meal
0.10 (0.14)
1.45 (0.95)
0.82 (0.60)
0.56 (0.56)
0.11 (0.12)
0.51 (0.28)
0.06 (0.04)
0.09 (0.05)
0.74 (0.26)
Frerro allows
0.03 (0.0
0.18 (0.1
0.18 (0.1
0.22 (0.2
0.50 (0.2
0.65 (0.4
0.31 (0.1
1.89 (0.6
5.23 (1.0
5.74 (0.9
11.27 (1
20.99 (1
24.81 (1
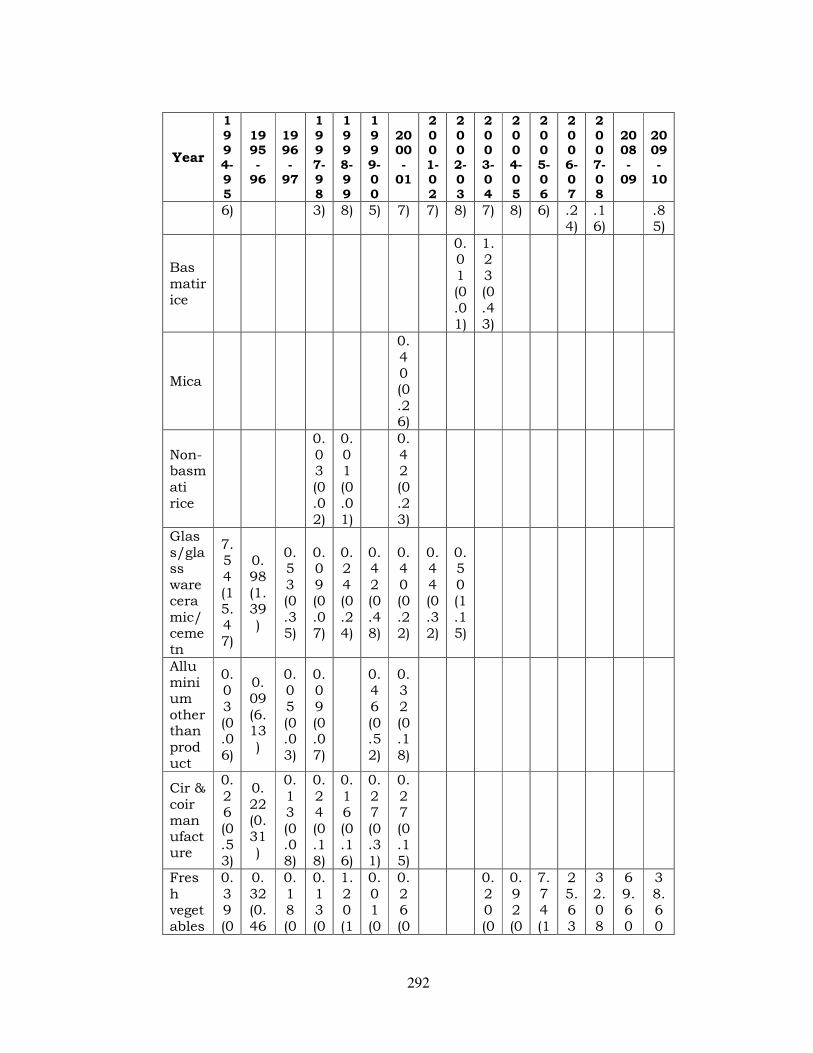
292
Year
1
994-95
1995-
96
1996-
97
1
997-98
1
998-99
1
999-00
2000-
01
2
001-02
2
002-03
2
003-04
2
004-05
2
005-06
2
006-07
2
007-08
2008-
09
2009-
10
6) 3) 8) 5) 7) 7) 8) 7) 8) 6) .24)
.16)
.85)
Basmatirice
0.01 (0.01)
1.23 (0.43)
Mica
0.40 (0.26)
Non-basmati rice
0.03 (0.02)
0.01 (0.01)
0.42 (0.23)
Glass/glass ware ceramic/cemetn
7.54 (15.47)
0.98 (1.39)
0.53 (0.35)
0.09 (0.07)
0.24 (0.24)
0.42 (0.48)
0.40 (0.22)
0.44 (0.32)
0.50 (1.15)
Alluminium other than product
0.03 (0.06)
0.09 (6.13)
0.05 (0.03)
0.09 (0.07)
0.46 (0.52)
0.32 (0.18)
Cir & coir manufacture
0.26 (0.53)
0.22 (0.31)
0.13 (0.08)
0.24 (0.18)
0.16 (0.16)
0.27 (0.31)
0.27 (0.15)
Fresh vegetables
0.39 (0
0.32 (0.46
0.18 (0
0.13 (0
1.20 (1
0.01 (0
0.26 (0
0.20 (0
0.92 (0
7.74 (1
25.63
32.08
69.60
38.60
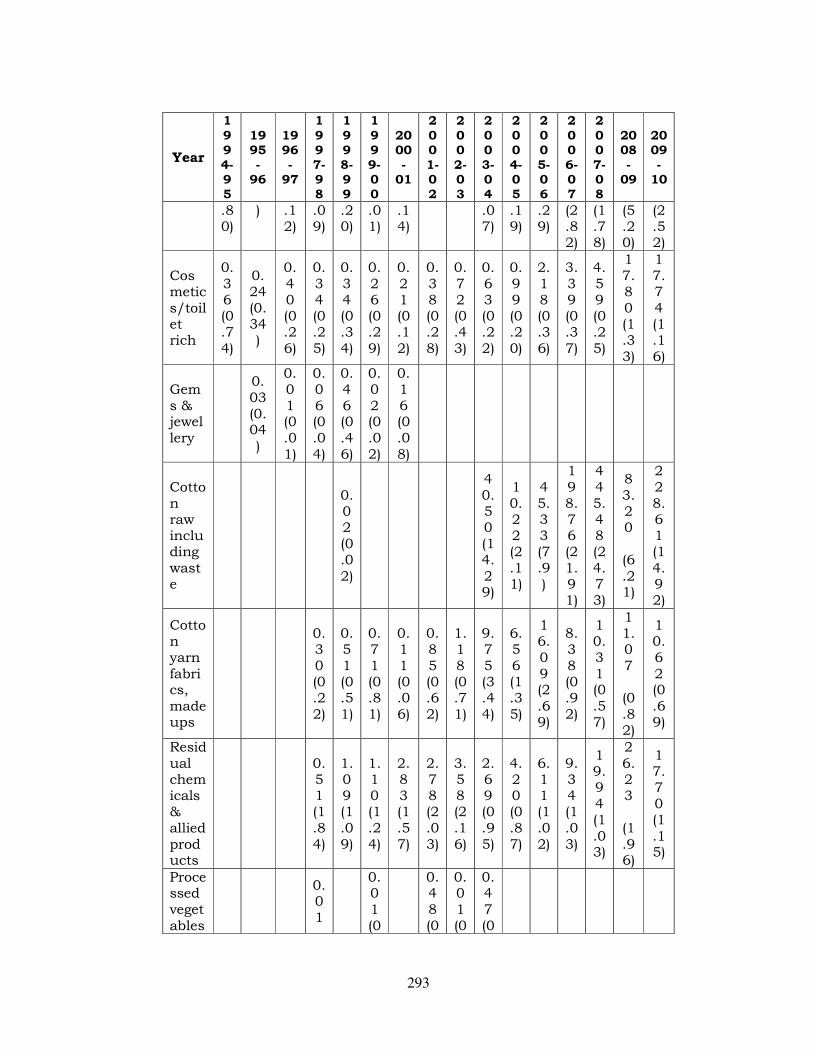
293
Year
1
994-95
1995-
96
1996-
97
1
997-98
1
998-99
1
999-00
2000-
01
2
001-02
2
002-03
2
003-04
2
004-05
2
005-06
2
006-07
2
007-08
2008-
09
2009-
10
.80)
) .12)
.09)
.20)
.01)
.14)
.07)
.19)
.29)
(2.82)
(1.78)
(5.20)
(2.52)
Cosmetics/toilet rich
0.36 (0.74)
0.24 (0.34)
0.40 (0.26)
0.34 (0.25)
0.34 (0.34)
0.26 (0.29)
0.21 (0.12)
0.38 (0.28)
0.72 (0.43)
0.63 (0.22)
0.99 (0.20)
2.18 (0.36)
3.39 (0.37)
4.59 (0.25)
17.80 (1.33)
17.74 (1.16)
Gems & jewellery
0.03 (0.04)
0.01 (0.01)
0.06 (0.04)
0.46 (0.46)
0.02 (0.02)
0.16 (0.08)
Cotton raw including waste
0.02 (0.02)
40.50 (14.29)
10.22 (2.11)
45.33 (7.9)
198.76 (21.91)
445.48 (24.73)
83.20
(6.21)
228.61 (14.92)
Cotton yarn fabrics, made ups
0.30 (0.22)
0.51 (0.51)
0.71 (0.81)
0.11 (0.06)
0.85 (0.62)
1.18 (0.71)
9.75 (3.44)
6.56 (1.35)
16.09 (2.69)
8.38 (0.92)
10.31 (0.57)
11.07
(0.82)
10.62 (0.69)
Residual chemicals & allied products
0.51 (1.84)
1.09 (1.09)
1.10 (1.24)
2.83 (1.57)
2.78 (2.03)
3.58 (2.16)
2.69 (0.95)
4.20 (0.87)
6.11 (1.02)
9.34 (1.03)
19.94 (1.03)
26.23
(1.96)
17.70 (1.15)
Processed vegetables
0.01
0.01 (0
0.48 (0
0.01 (0
0.47 (0
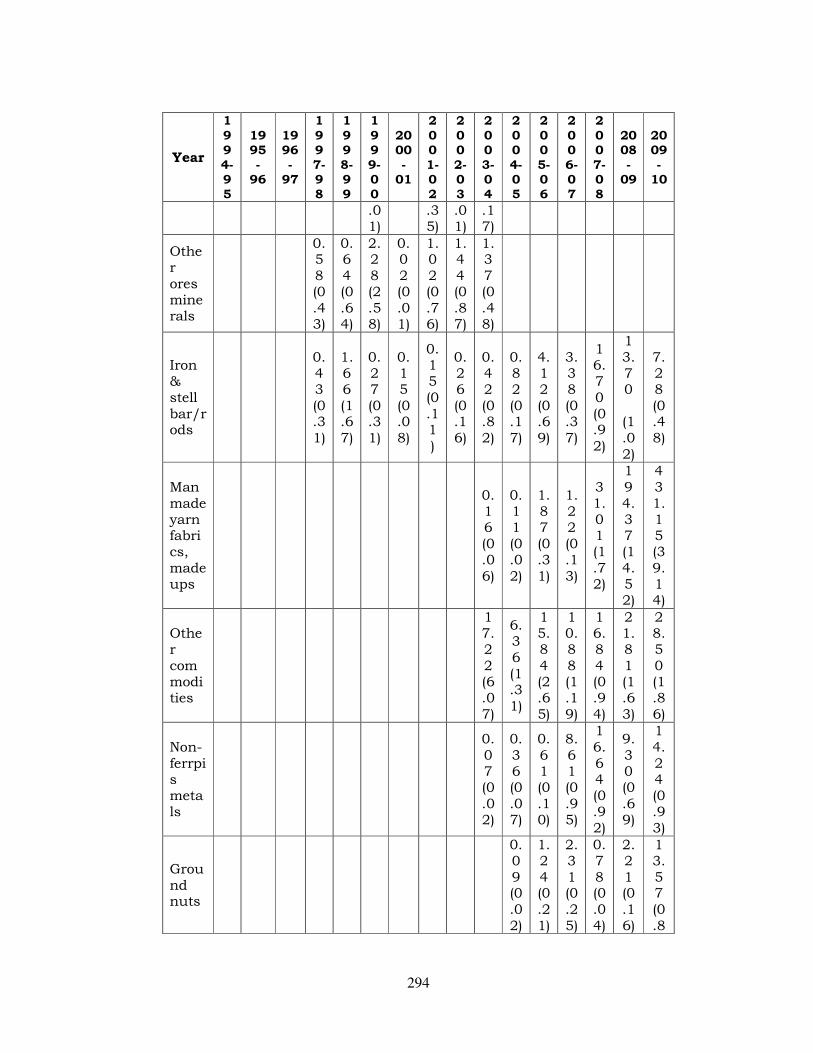
294
Year
1
994-95
1995-
96
1996-
97
1
997-98
1
998-99
1
999-00
2000-
01
2
001-02
2
002-03
2
003-04
2
004-05
2
005-06
2
006-07
2
007-08
2008-
09
2009-
10
.01)
.35)
.01)
.17)
Other ores minerals
0.58 (0.43)
0.64 (0.64)
2.28 (2.58)
0.02 (0.01)
1.02 (0.76)
1.44 (0.87)
1.37 (0.48)
Iron & stell bar/rods
0.43 (0.31)
1.66 (1.67)
0.27 (0.31)
0.15 (0.08)
0.15 (0.11 )
0.26 (0.16)
0.42 (0.82)
0.82 (0.17)
4.12 (0.69)
3.38 (0.37)
16.70 (0.92)
13.70
(1.02)
7.28 (0.48)
Man made yarn fabrics, made ups
0.16 (0.06)
0.11 (0.02)
1.87 (0.31)
1.22 (0.13)
31.01 (1.72)
194.37 (14.52)
431.15 (39.14)
Other commodities
17.22 (6.07)
6.36 (1.31)
15.84 (2.65)
10.88 (1.19)
16.84 (0.94)
21.81 (1.63)
28.50 (1.86)
Non-ferrpis metals
0.07 (0.02)
0.36 (0.07)
0.61 (0.10)
8.61 (0.95)
16.64 (0.92)
9.30 (0.69)
14.24 (0.93)
Ground nuts
0.09 (0.02)
1.24 (0.21)
2.31 (0.25)
0.78 (0.04)
2.21 (0.16)
13.57 (0.8
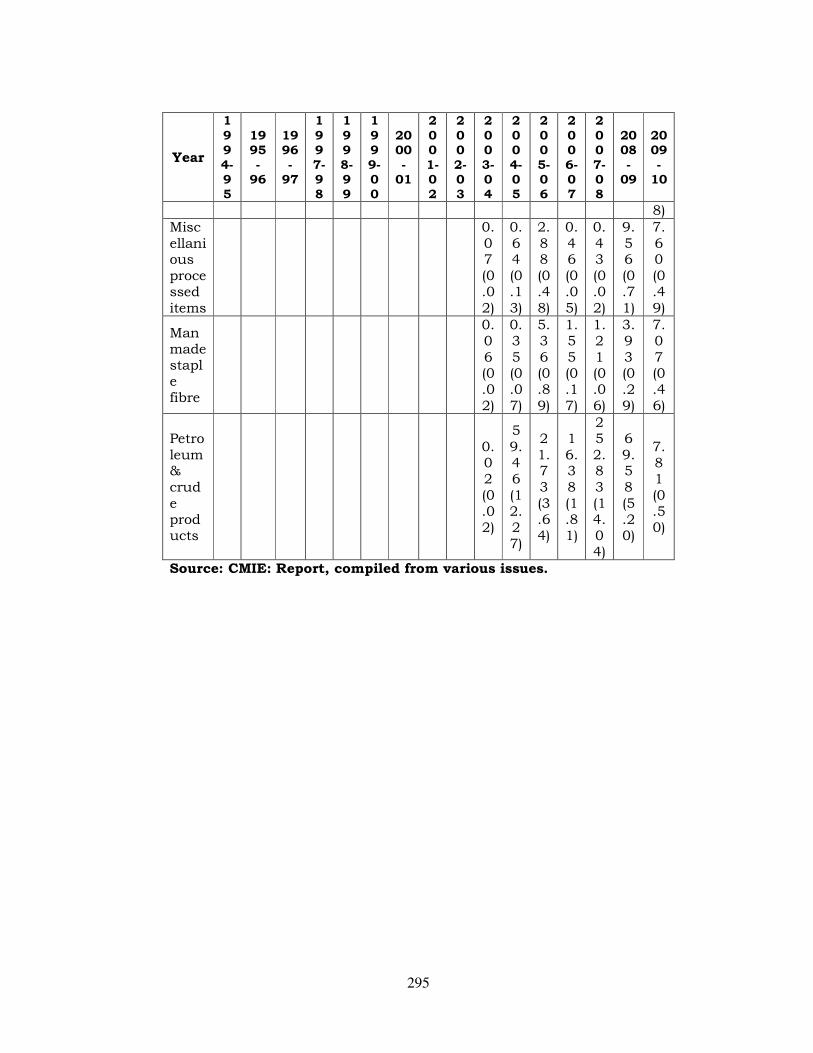
295
Year
1
994-95
1995-
96
1996-
97
1
997-98
1
998-99
1
999-00
2000-
01
2
001-02
2
002-03
2
003-04
2
004-05
2
005-06
2
006-07
2
007-08
2008-
09
2009-
10
8) Miscellanious processed items
0.07 (0.02)
0.64 (0.13)
2.88 (0.48)
0.46 (0.05)
0.43 (0.02)
9.56 (0.71)
7.60 (0.49)
Man made staple fibre
0.06 (0.02)
0.35 (0.07)
5.36 (0.89)
1.55 (0.17)
1.21 (0.06)
3.93 (0.29)
7.07 (0.46)
Petroleum & crude products
0.02 (0.02)
59.46 (12.27)
21.73 (3.64)
16.38 (1.81)
252.83 (14.04)
69.58 (5.20)
7.81 (0.50)
Source: CMIE: Report, compiled from various issues.