Embed Size (px)
Citation preview
i
Revised Draft
India-Sri Lanka FTA:
Lessons for SAFTA
Dushni Weerakoon*
Jayanthi Thennakoon**
* Deputy Director & Fellow, Institute of Policy Studies, Sri Lanka, Email: [email protected] ** Research Officer, Institute of Policy Studies of Sri Lanka, Email: [email protected] This paper is written under a research grant from the Economic Affairs Division of the Commonwealth Secretarial, London to CUTS International, Jaipur. Views expressed in this paper are those of the authors and not necessarily reflect those of their institutions and of the Commonwealth Secretariat and CUTS International.
ii
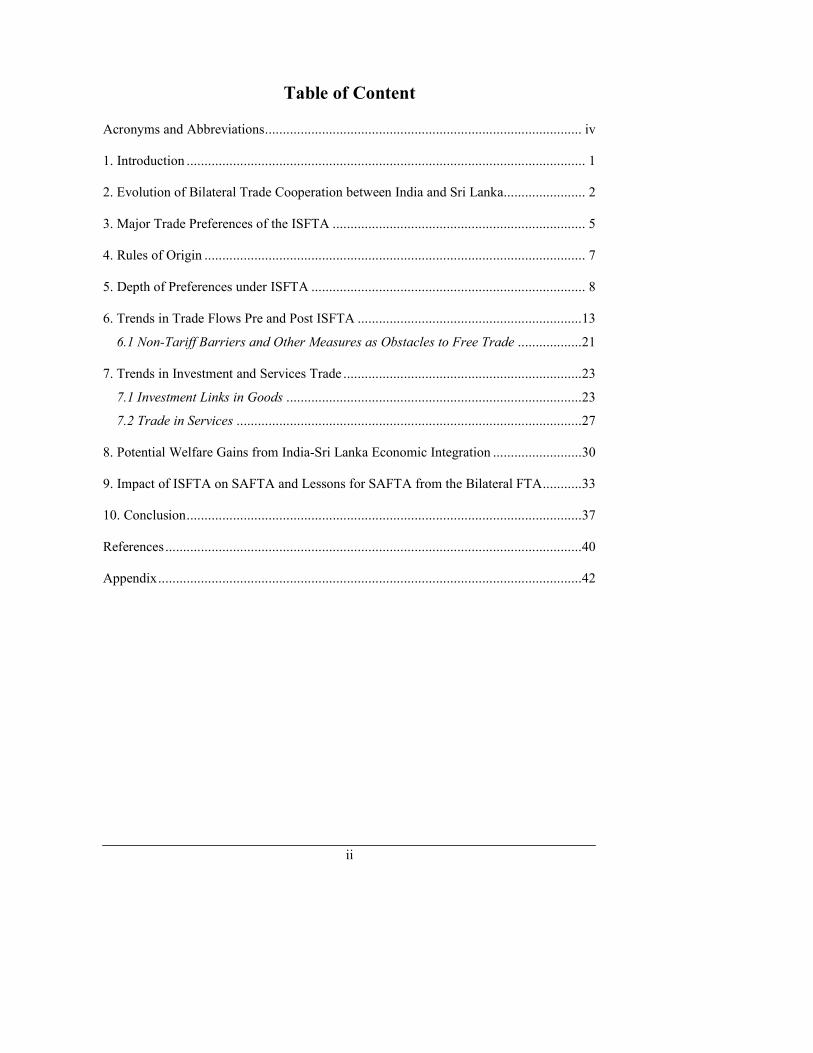
Table of Content Acronyms and Abbreviations......................................................................................... iv
1. Introduction ................................................................................................................ 1
2. Evolution of Bilateral Trade Cooperation between India and Sri Lanka....................... 2
3. Major Trade Preferences of the ISFTA ....................................................................... 5
4. Rules of Origin ........................................................................................................... 7
5. Depth of Preferences under ISFTA ............................................................................. 8
6. Trends in Trade Flows Pre and Post ISFTA ...............................................................13
6.1 Non-Tariff Barriers and Other Measures as Obstacles to Free Trade ..................21
7. Trends in Investment and Services Trade ...................................................................23
7.1 Investment Links in Goods ...................................................................................23
7.2 Trade in Services .................................................................................................27
8. Potential Welfare Gains from India-Sri Lanka Economic Integration .........................30
9. Impact of ISFTA on SAFTA and Lessons for SAFTA from the Bilateral FTA...........33
10. Conclusion...............................................................................................................37
References .....................................................................................................................40
Appendix.......................................................................................................................42
iii
List of Tables
Table 1: Tariff Liberalisation Programme (TLP) of ISFTA and
SAFTA at HS-6-digit Level ............................................................................ 6
Table 2: Rules of Origin of ISFTA and SAFTA............................................................ 7
Table 3: Applicability of ISFTA Preferences to Actual Trade ....................................... 9
Table 4: Concessions Granted by India vis-à-vis Sri Lankan Exports .......................... 11
Table 5: Concessions Granted by Sri Lanka vis-à-vis Indian Exports .......................... 12
Table 6: Selected Product Categories under Zero Duty List of India and their Average MFN Tariffs ............................................................ 13
Table 7: India-Sri Lanka Merchandise Trade (2000:2006) .......................................... 13
Table 8: Sri Lanka’s Exports to India under ISFTA Categories ................................... 16
Table 9: Imports from India under ISFTA Categories ................................................. 17
Table 10: Significance of Vanaspathi and Copper in Sri Lanka’s Exports to India .... 18
Table 11: Composition of Sri Lanka’s Exports Receiving Zero Duty Treatment under ISFTAa .......................................................... 19
Table 12: Composition of Sri Lanka’s Exports under India’s ISFTA Negative List ..... 20
Table 13: Composition of Selected Indian Exports under Sri Lanka’s ISFTA Negative List................................................................ 20
Table 14: Source Country Profile of FDI in Sri Lanka ................................................ 24
Table 15: Estimated Investment from India in Sri Lanka ............................................ 25
Table 16: Indian Manufacturing Projects in Sri Lanka Related to the ISFTA .............. 26
Table 17: Indian Service Suppliers in Sri Lanka.......................................................... 27
Table 18: Tourist Arrivals from Country of Origin...................................................... 28
Table 19: Sector-wise Distribution of Negative Lists of ISFTA and SAFTA............... 33
Table 20: Trade Restriction under SAFTA.................................................................. 34
Table 21: Bilateral Trade Restriction under SAFTA.................................................... 35
List of Figures
Figure 1: Exports of Sri Lanka, 1980-2006, (US$mn) ................................................... 3
Figure 2: Exports of India, 1980-2006 (US$mn) .......................................................... 4
Figure 3: Average Customs Duties and Percentage of Tariff Lines Subject to QRs ..... 10
Figure 4: Structure of Indian Exports to Sri Lanka (US$)............................................ 14
Figure 5: Structure of Sri Lanka’s Exports to India (US$)........................................... 15
Figure 6: Indian Investment Projects: Exports, Imports and Domestic Value Addition 31
Figure 7: Employment Generation of Indian Projects 1996-2005 ................................ 32
iv
Acronyms and Abbreviations
ASEAN Association of Southeast Asian Nations
BIMSTEC Bay of Bengal Initiative for Multi-Sectoral Technical and
Economic Cooperation
CGE Computable General Equilibrium
CU Custom Union
DFQF Duty Free Quota Free
EU European Union
GDP Gross Domestic Product
GTAP Global Trade Analysis Project
EU European Union
FTA Free Trade Area
LDCs Lease Developed Countries
NAFTA North American Free Trade Area
NTBs Non-Tariff Barriers
RMGs Readymade Garments
RoO Rules of Origin
RTA Regional Trade Agreement
QRs Quantitative Restrictions
SAARC South Asian Association of Regional Cooperation
SAFTA South Asian Free Trade Area
SAPTA South Asian Preferential Trade Agreement
S&DT Special and Differential Treatment
TLP Trade Liberalisation Programme
WTO World Trade Organisation
1
1. Introduction
Economic links between India and Sri Lanka have a long history – with recorded commercial links going as far back as the 4th century – and with both countries falling under British rule during the 19th century, these links strengthened to the point where legal barriers to movement of goods and labour practically disappeared. But in the early years of the post-independence period, despite close political ties economic ties weakened as both countries implemented inward-looking economic policies. However, with Sri Lanka initiating a liberalisation drive in 1977-78 that subsequently encompassed other South Asian countries including India, economic links between the two once again started to strengthen. This process has been further encouraged by the South Asian regional integration initiatives and by a bilateral free trade agreement (FTA) between the two countries. While exploratory studies on prospects for a bilateral trade agreement between India and Sri Lanka were initiated in the early 1990s, the emergence of the possibility of regional preferential agreement (RTA) – proposed by Sri Lanka and Nepal in 1990 and accepted by the South Asian Association for Regional Cooperation (SAARC) in 1993 – effectively pushed a bilateral agreement to the background. This was reinforced by the implementation of the South Asian Preferential Trade Agreement (SAPTA) in 1995 and an agreement to forge ahead towards a South Asian Free Trade Agreement (SAFTA) in 1996, complemented by progressive unilateral liberalisation efforts of most South Asian economies, particularly from the early 1990s. However, regional efforts came un-stuck in 1998 with the heightening of tension between India and Pakistan following nuclear test explosions by both countries. With the near halt of SAARC related efforts to push forward regional economic integration, India and Sri Lanka embarked on a bilateral agreement – the India-Sri Lanka Free Trade Agreement (ISFTA) – signed in December 1998. Bilateral trade between the two countries had been expanding rapidly in the 1990s, driven primarily by unilateral liberalisation efforts with trade flows being largely in favour of India. In fact, India emerged as Sri Lanka’s primary source of imports in 1996 – overtaking Japan for the first time. While India’s interests in furthering trade relations could be understood given its broader industrial base and ability to meet Sri Lanka’s import needs, the key factors prompting Sri Lanka’s interests were the prospect of ‘early-mover’ access to a large market that would help the country to diversify its industrial base and the potential for to raise its profile as a destination for foreign direct investment (FDI) on the basis of preferential access to a still relatively ‘protected’ Indian market. Notwithstanding such perceived benefits to Sri Lanka, there was little discussion on the proposed ISFTA at the domestic level. In fact, the ISFTA was signed peremptorily in December 1998, with both countries agreeing to negotiate and finalise the finer points – in particular, the composition of the negative list of items – to allow full implementation to begin in February 1999. Opposition to the agreement was voiced from within Sri Lanka’s domestic industrial sector (as well as from particular sectors within India) with regards to potential adverse implications from heightened competition from cheaper
2
imports. Nevertheless, the agreement came into effect in March 2000 (with negotiations delayed as both governments attempted to address domestic interest pressure concerns) and has since continued to be implemented according to the schedules that were agreed upon. In the backdrop of the SAFTA agreement implemented in July 2006, the ISFTA provides useful lessons for other South Asian economies, both in terms of the initial conditions prior to the negotiation of the bilateral agreement and in terms of the progress in strengthening trade and economic linkages post-implementation. This report is intended to review the evolution and current status of the economic ties between India and Sri Lanka. It reviews the historical background, analyses trends in trade in goods and investment, and discusses these in the broad economic, policy and political context, with emphasis on the policy liberalisation process and moves towards regional integration. The report examines the nature and impact of regional initiatives under SAARC (SAPTA/SAFTA), and bilateral agreements, in particular the ISFTA. The report is organised as follows: Section 2 examines the evolution of bilateral trade cooperation between India and Sri Lanka; Section 3 analyses the terms of the ISFTA; Section 4 details the depth of preferences under the ISFTA; Section 5 examines the trends in trade flows pre and post-ISFTA; Section 6 assesses the trends in investment and services flows between India and Sri Lanka; Section 7 looks at potential welfare gains from closer bilateral economic integration between the two countries; Section 8 explores potential impacts of the ISFTA on SAFTA; Section 9 provides some lessons for the SAFTA process from the experience of the ISFTA; and Section 10 is the conclusion part.
2. Evolution of Bilateral Trade Cooperation between India and Sri Lanka
Sri Lanka’s central position in the Indian Ocean and its geographic proximity to South India – and the resultant cultural and historical ties – were factors that influenced the early development of trade between the two countries. These links persisted till colonial times when economic relations between the two countries were geared very much towards producing goods for the colonial powers and meeting food requirements resulting from shortages. Existing trade links were strengthened during the colonial period, primarily on account of Indian labour that was brought to Sri Lanka to work on the plantations. In 1938, for example, 42.5 percent of Sri Lanka’s import bill was spent on imports from India and the larger share of such imports was related to plantation labour (Wanigaratne, 1991). After independence, Sri Lanka made a concerted attempt to diversify such dependence by increasing production of certain previously imported items at home and securing alternative sources from a wider range of countries. By the late 1940s, Sri Lanka’s imports from India had declined to around 15 percent of its total imports, while exports to India totaled around two percent of all Sri Lanka’s exports – a trend that continued into the 1950s (Kodikara, 1965). The trend towards autarky in both countries around the turn of the 1960s – albeit at different speeds – also heralded a steady decline in Indo-Sri Lanka trade.
3
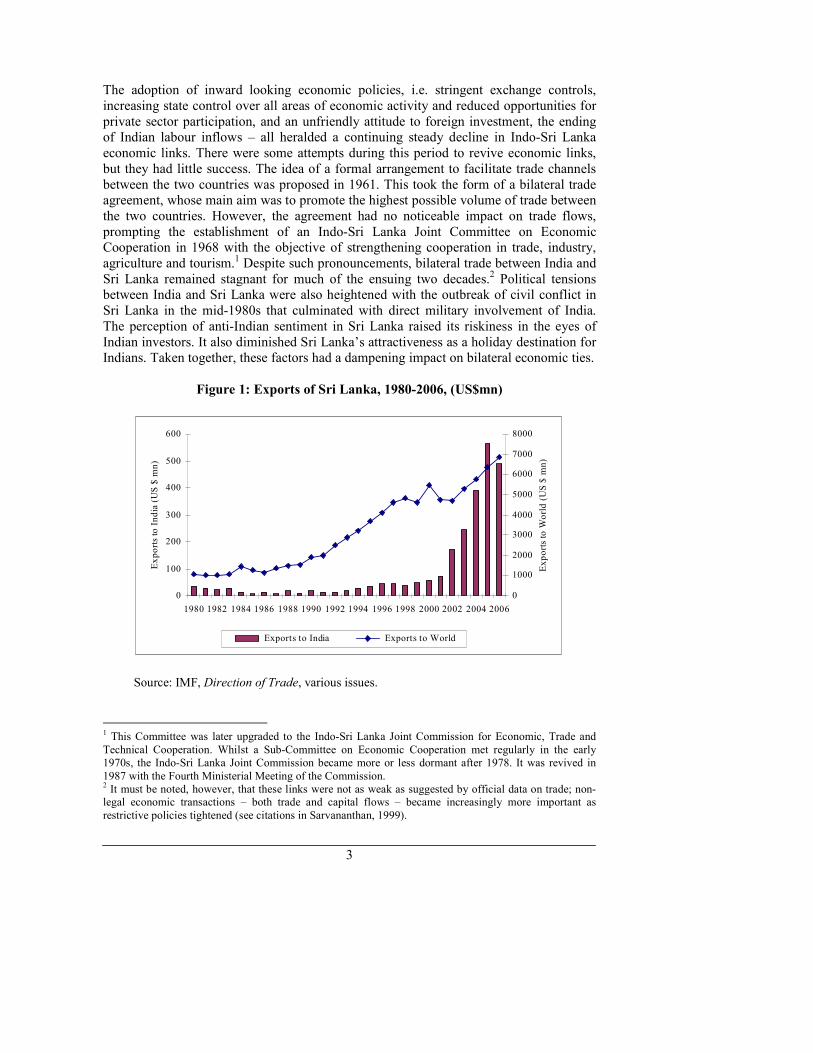
The adoption of inward looking economic policies, i.e. stringent exchange controls, increasing state control over all areas of economic activity and reduced opportunities for private sector participation, and an unfriendly attitude to foreign investment, the ending of Indian labour inflows – all heralded a continuing steady decline in Indo-Sri Lanka economic links. There were some attempts during this period to revive economic links, but they had little success. The idea of a formal arrangement to facilitate trade channels between the two countries was proposed in 1961. This took the form of a bilateral trade agreement, whose main aim was to promote the highest possible volume of trade between the two countries. However, the agreement had no noticeable impact on trade flows, prompting the establishment of an Indo-Sri Lanka Joint Committee on Economic Cooperation in 1968 with the objective of strengthening cooperation in trade, industry, agriculture and tourism.1 Despite such pronouncements, bilateral trade between India and Sri Lanka remained stagnant for much of the ensuing two decades.2 Political tensions between India and Sri Lanka were also heightened with the outbreak of civil conflict in Sri Lanka in the mid-1980s that culminated with direct military involvement of India. The perception of anti-Indian sentiment in Sri Lanka raised its riskiness in the eyes of Indian investors. It also diminished Sri Lanka’s attractiveness as a holiday destination for Indians. Taken together, these factors had a dampening impact on bilateral economic ties.
Figure 1: Exports of Sri Lanka, 1980-2006, (US$mn)
0
100
200
300
400
500
600
1980 1982 1984 1986 1988 1990 1992 1994 1996 1998 2000 2002 2004 2006
Exports to India (US $ mn)
0
1000
2000
3000
4000
5000
6000
7000
8000
Exports to World (US $ mn)
Exports to India Exports to World
Source: IMF, Direction of Trade, various issues.
1 This Committee was later upgraded to the Indo-Sri Lanka Joint Commission for Economic, Trade and
Technical Cooperation. Whilst a Sub-Committee on Economic Cooperation met regularly in the early 1970s, the Indo-Sri Lanka Joint Commission became more or less dormant after 1978. It was revived in
1987 with the Fourth Ministerial Meeting of the Commission. 2 It must be noted, however, that these links were not as weak as suggested by official data on trade; non-legal economic transactions – both trade and capital flows – became increasingly more important as
restrictive policies tightened (see citations in Sarvananthan, 1999).
4
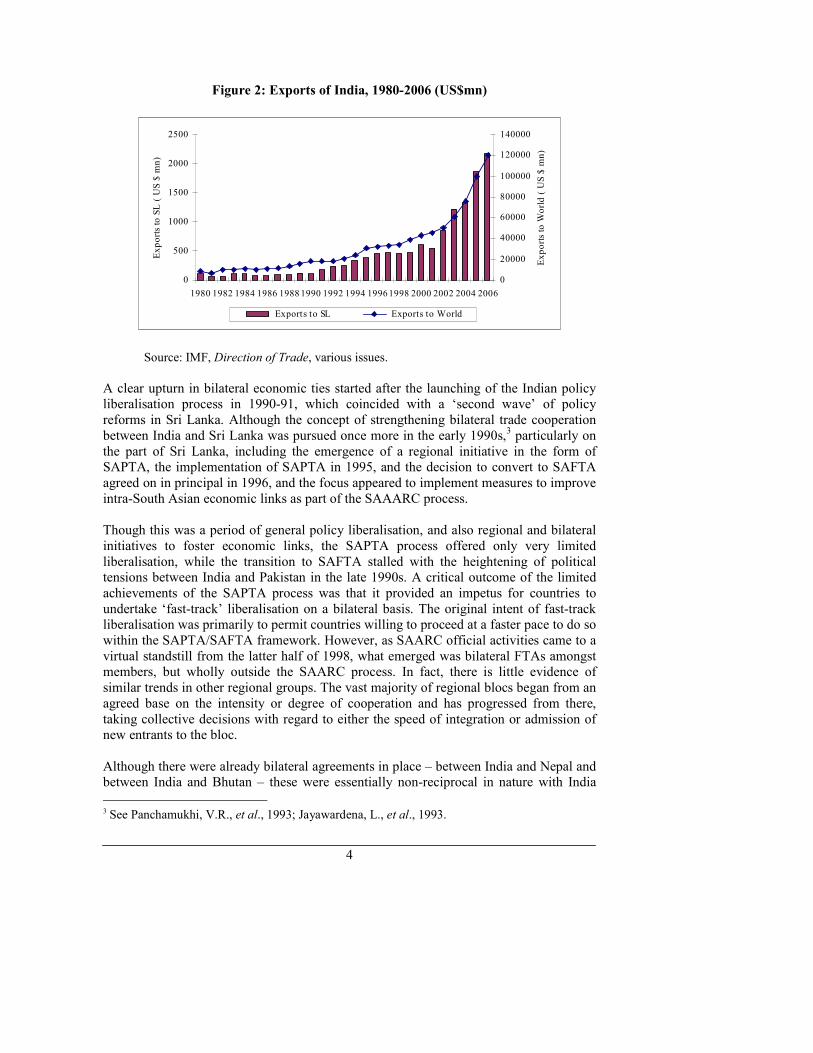
Figure 2: Exports of India, 1980-2006 (US$mn)
0
500
1000
1500
2000
2500
1980 1982 1984 1986 19881990 1992 1994 19961998 2000 2002 2004 2006
Exports to SL ( US $ mn)
0
20000
40000
60000
80000
100000
120000
140000
Exports to World ( US $ mn)
Exports to SL Exports to World
Source: IMF, Direction of Trade, various issues.
A clear upturn in bilateral economic ties started after the launching of the Indian policy liberalisation process in 1990-91, which coincided with a ‘second wave’ of policy reforms in Sri Lanka. Although the concept of strengthening bilateral trade cooperation between India and Sri Lanka was pursued once more in the early 1990s,
3 particularly on the part of Sri Lanka, including the emergence of a regional initiative in the form of SAPTA, the implementation of SAPTA in 1995, and the decision to convert to SAFTA agreed on in principal in 1996, and the focus appeared to implement measures to improve intra-South Asian economic links as part of the SAAARC process. Though this was a period of general policy liberalisation, and also regional and bilateral initiatives to foster economic links, the SAPTA process offered only very limited liberalisation, while the transition to SAFTA stalled with the heightening of political tensions between India and Pakistan in the late 1990s. A critical outcome of the limited achievements of the SAPTA process was that it provided an impetus for countries to undertake ‘fast-track’ liberalisation on a bilateral basis. The original intent of fast-track liberalisation was primarily to permit countries willing to proceed at a faster pace to do so within the SAPTA/SAFTA framework. However, as SAARC official activities came to a virtual standstill from the latter half of 1998, what emerged was bilateral FTAs amongst members, but wholly outside the SAARC process. In fact, there is little evidence of similar trends in other regional groups. The vast majority of regional blocs began from an agreed base on the intensity or degree of cooperation and has progressed from there, taking collective decisions with regard to either the speed of integration or admission of new entrants to the bloc. Although there were already bilateral agreements in place – between India and Nepal and between India and Bhutan – these were essentially non-reciprocal in nature with India
3 See Panchamukhi, V.R., et al., 1993; Jayawardena, L., et al., 1993.
5
offering market access on a unilateral basis. The defining bilateral FTA to emerge in the region was the India-Sri Lanka FTA (ISFTA) signed in December 1998. It was a culmination not only of the slow progress made through the South Asian regional initiatives but also a mark of renewed political confidence between the two countries.4 There were concerns that while some Sri Lankan exports (such as rubber products, ceramic products and leather goods) catering to particular niche markets in India and enjoying a comparative advantage may benefit from liberalisation, some small and medium industrial enterprises (SMEs), and producers of livestock and subsidised agricultural products not protected under the negative list will face stiffer import competition from Indian exporters, who arguably enjoy the advantages of a relatively sophisticated industrial and agricultural base, and economies of scale provided by the larger domestic market. On the other hand, it was also considered that in some products where current exports are non-existent or minimal, there may be scope for expansion of Sri Lankan exports to the Indian market. While it was obvious that the largest gains from trade would likely to come from opening up precisely those sectors where domestic industries will come under strong import competition, they were naturally also the sectors where domestic producers felt most vulnerable, where adjustment costs were likely to be considerable, and where political resistance the strongest.
3. Major Trade Preferences of the ISFTA
The negotiating approach adopted on the ISFTA was on a negative list basis with both countries agreeing with the need to safeguard ‘sensitive’ domestic industries. However, a defining feature of the ISFTA was the adoption of ‘less than full reciprocity’ with Sri Lanka was given significant concessions on the grounds of asymmetries in the two economies. Such non-reciprocity was extended to the negotiations on the negative list, rules of origin (RoO) and the agreed period of implementation of the tariff liberalisation schedule. As summarised in Table 1, under the FTA signed in December 1998, India submitted a negative list of 429 items; agreed to remove tariffs on 1351 products immediately upon the coming into force of the treaty;5 and, agreed to phase out prevailing tariffs on the balance items over a span of three years (50 percent reduction of Indian customs duties in the first year, 75 percent in the second year, and 100 percent in the third year). In addition, India granted Tariff Rate Quota (TRQ) for three commodities – tea, garments and textiles – In the Indian negative list. In the case of tea, a preferential market access of 50 percent for 15 million kg of tea per annum was offered, with only two designated ports of entry (Kolkata and Kochin). In the case of garments, preferential market access
4 Pakistan in turn proposed an FTA with Sri Lanka, the Framework Agreement of which was signed in July
2002. 5 The products were to be named within 60 days of the signing of the agreement. However, the exchange of lists was delayed until March 2000 due to various reasons, including some opposition by both Indian and
Sri Lankan interest groups.
6
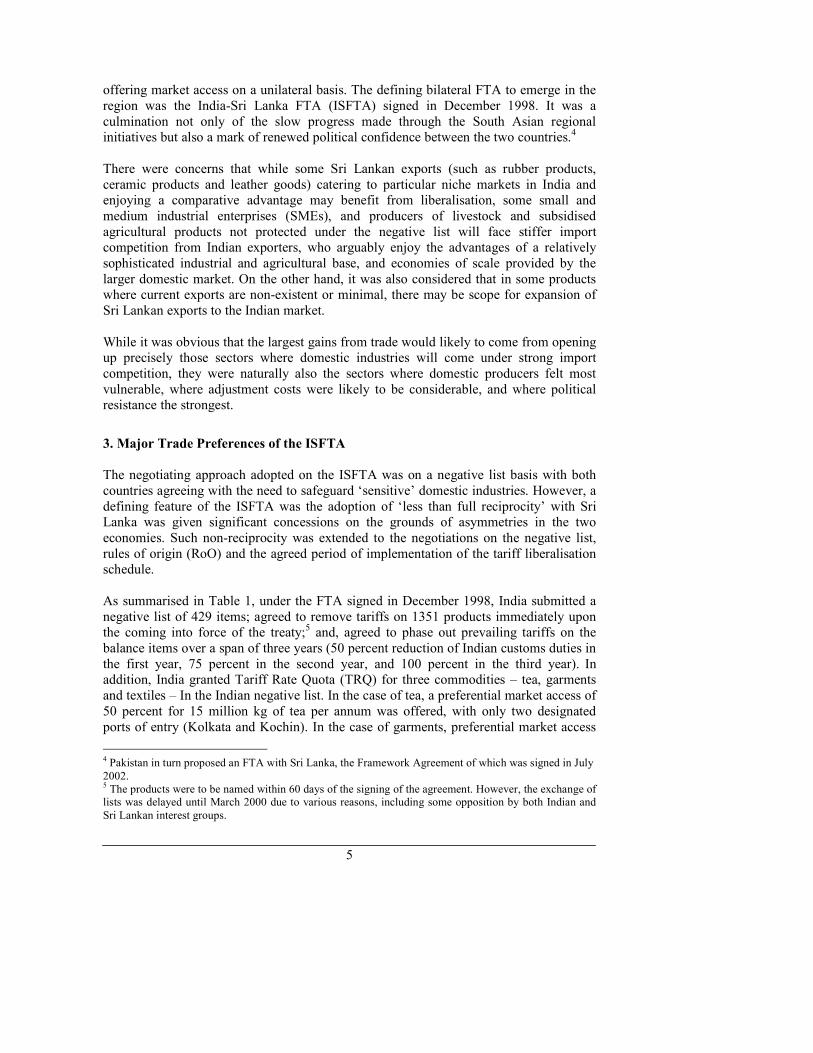
of 50 percent was granted for 8 million pieces per annum of which a minimum of six million pieces should contain fabric of Indian origin. In the case of textiles, a preferential duty margin of 25 percent was granted for textile items with no quantitative restrictions. In sum, Sri Lanka was, therefore, to have duty free access to the Indian market (excluding those items coming under the negative list) three years after the FTA becomes operative.
Table 1: Tariff Liberalisation Programme (TLP) of ISFTA and SAFTA at
HS-6-digit Level
ISFTA SAFTA
Negative list India 419 India 884 Sri Lanka 1180 Sri Lanka 1065 Immediate zero duty India 1351 Sri Lanka 319 TLP India 50, 75, 100%
reduction over 3 years
India Reduce tariffs to 20% over 2 years; Reduce to 0-5% over next 5 years
Sri Lanka 70, 90, 100% reduction on 889 items over 3 years; 35, 70, 100% reduction on the rest over 8 years
Sri Lanka Reduce tariffs to 20% over 2 years; Reduce to 0-5% over next 6 years
Source: Respective agreements
In return, Sri Lanka submitted a negative list consisting of 1180 items; agreed to grant immediate duty free access to India on 319 items; and offered a 50 percent margin of preference on a further 889 items (with the preferential reduction raised to 70, 90 and 100 percent over a three year period). The duty on the balance items (excluding those that do not fall within Sri Lanka’s negative list) were expected to be phased out over an eight year period – 35 percent of the existing duty level by the end of the first three of the eight years; 70 percent of the existing duty level by the end of the sixth year; and 100 percent removal of duties by the end of the eighth year. Thus, India will have duty free access to the Sri Lankan market for her exports (excluding those items in the negative list) after eight years of the signing of the FTA. In terms of the actual implementation of the ISFTA, it was delayed as negotiations on the respective negative lists took more than the initial planned period of 60 days. In fact, the ISFTA which was to begin implementation in February 1999 began implementation only in March 2000. One of the key contentious areas for negotiation was that of granting access to Sri Lankan tea exports. While Sri Lanka requested preferential access for its tea, the final settlement only allowed preferential access based on a TRQ. Nevertheless, with the delayed initiation of the ISFTA in March 2000, as of March 2003 India had completed the required trade liberalization programme. Sri Lanka too had granted duty free concessions as the initial step in March 2000, followed by the offer of
7
duty free treatment on an additional 880 tariff lines in March 2003. In addition, 35 percent margin of preference was offered for 2082 tariff lines. The margin of preference on the 2802 products were brought down by 70 percent in September 2006 and it is expected to offer complete duty free access for these tariff lines by 2008.6
4. Rules of Origin
Another key area is that of rules of origin (RoO) which are is an important provision in any FTA. These can take the form of: (i) a percentage test according to which a minimum percentage of total value addition should be achieved on the basis of domestic inputs; (ii) a change in tariff heading test whereby the tariff heading of the final product is different from the tariff headings of its components; and (iii) specified process tests that require a product to undergo certain stipulated processes.
Table 2: Rules of Origin of ISFTA and SAFTA
ISFTA SAFTA
Single country ROO DVA (% of FOB) India and Pakistan 35% 40% Sri Lanka 35% 35% LDCs 30% CTH 4-digit 4-digit Cumulative ROO Minimum aggregate content 35% 50% Input from exporting country 25% 20% Derogation from general rule DVA: 25, 30, 40 or 60%
CTH: at 4 or 6-digit Process: PSR
Source: Respective agreements.
The ISFTA RoO marked a departure from those adopted in SAPTA which called for a domestic value addition (DVA) criterion only.7 A single criterion may be subject to several weaknesses. For example, a percentage criterion may create a bias against low cost and efficient production systems in a particular country. An inefficient producer with
6 Nevertheless, other forms of obstacles such as the prevalence of state sales taxes, customs delays and quality checks (sometimes requesting additional quality requirements that do not exist in the agreement) faced by Sri Lanka exporters to India have been cited as examples of obstacles to free flow of goods even under the ISFTA.
7 Under SAPTA, the required percentage domestic content was initially set at 50 per cent for non-LDC member countries and 40 per cent for LDC member countries of SAARC. These ratios were considered
restrictive and were subsequently phased down to 40 percent for non-LDC member states and 30 per cent for LDC countries.
8
high domestic costs of operation may find it easier to meet the percentage criterion than a more efficient producer with low domestic costs. Inefficiency may also arise if imported inputs are substituted with costlier domestic inputs in order to meet local content requirements. In addition, fluctuations in world prices of commodities may also impact on the ability to satisfy percentage test requirements. While a producer may meet the percentage criterion in any one year, significant fluctuation in the price of inputs may render the product ineligible the next year. A change of tariff heading (CTH) test on the other hand is not subject to an intrinsic bias in favour of high cost production or susceptible to changes in international commodity prices. This test is deemed to have the advantages of simplicity and predictability. However, given that HS codes were devised primarily for the purpose of commodity classification of data and not for origin determination purposes, CTH alone may not be sufficient to establish the originating status of goods. As a result, a change in CTH may not be sufficient to confer origin. A second critical issue arising from CTH is the level of commodity classification at which it is applied to confer “substantial transformation”. Given some of the drawbacks in applying any single criterion, increasingly a combination of methods is being employed in most FTAs. As set out in Table 3, the ISFTA in turn agreed on a combination of a DVA and CTH criteria to be applied in tandem as follows: � DVA criterion which states that the DVA in the exporting country should not be less than 35 percent of the freight on board (FOB) value of the finished product;
� CTH criterion which states that the HS Codes of the imported raw materials and the finished products should be different at 4-digit level; and
� Cumulative RoO: a minimum DVA of 25 percent is allowed, provided the raw materials imported from the other contracting state accounts for not less that 10 percent of the FOB value of the particular product.
In the absence of DVA estimates for individual countries, the 35 percent DVA requirement can be considered to be in line with existing RoO requirements in other regional initiatives where a percentage test is applied. Nevertheless, the imposition of CTH at HS 4-digit can be considered restrictive in view of the fact that many products may remain ineligible from satisfying originating status at that level. A more liberal approach would have been to agree on CTH at HS 6-digit level. In addition, the ISFTA RoO did not make provision for derogation.
5. Depth of Preferences under ISFTA
To ascertain the degree of preferences extended, the preferences granted have to be looked at in terms of the actual bilateral trade at the time of implementation of the ISFTA (see Table 3). Although concessions were exchange on all products at the HS 6-digit level, bilateral trade was limited between the two countries, particularly Sri Lanka’s exports to India. At the time of implementation of the ISFTA, Sri Lanka exported a total of 380 products (or tariff lines), while India’s exports composition to Sri Lanka was relatively more diverse covering a total of 2907 product lines.
9
Of Sri Lanka’s rather extensive negative list of 1180 items, a relatively high share of nearly 623 products actually being imported from India stood to be excluded from receiving any benefits. By contrast, of the Indian negative list of 429 products, Sri Lankan exports consisted of only 50 items. Where both countries have offered zero tariff reduction, India’s export interests are again receiving only marginal benefits. Of 319 items on which Sri Lanka reduced its tariffs to zero, the actual number of Indian exports that received immediate benefits stood at only 3 items. By contrast, on the 1351 items on which India offered immediate zero tariffs, Sri Lankan exporters stood to gain from at least 68 products traded products.
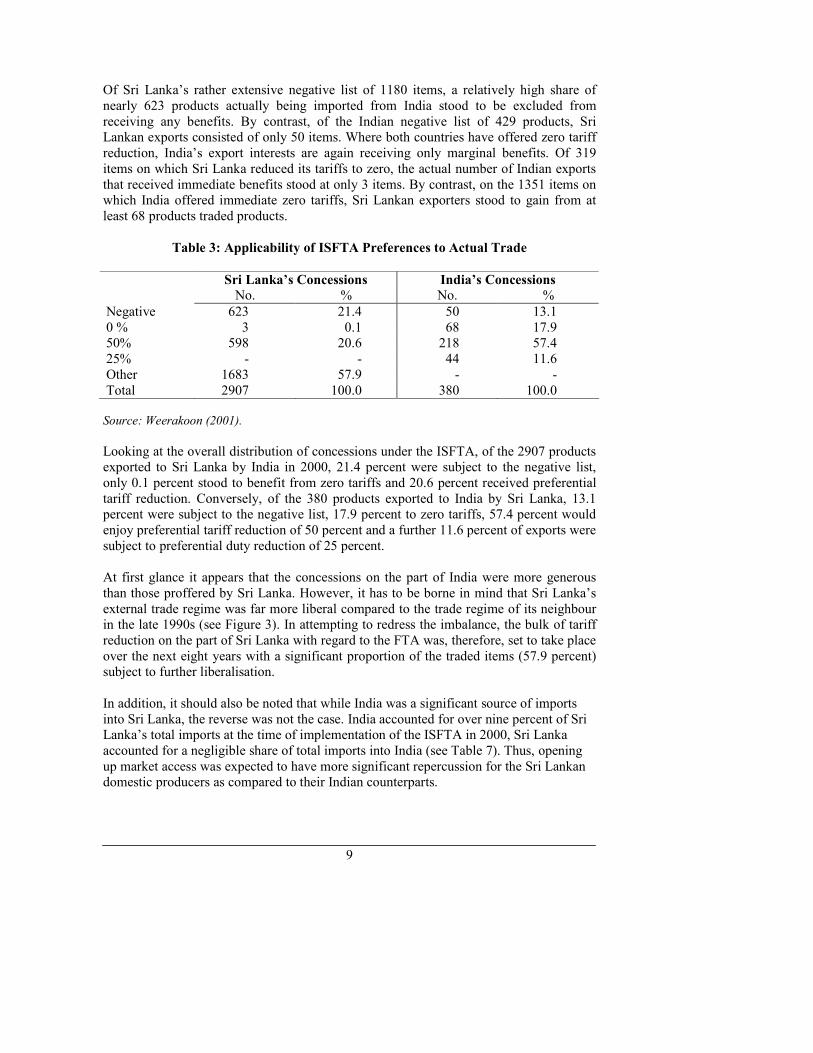
Table 3: Applicability of ISFTA Preferences to Actual Trade
Sri Lanka’s Concessions India’s Concessions
No. % No. %
Negative 623 21.4 50 13.1 0 % 3 0.1 68 17.9 50% 598 20.6 218 57.4 25% - - 44 11.6 Other 1683 57.9 - - Total 2907 100.0 380 100.0 Source: Weerakoon (2001).
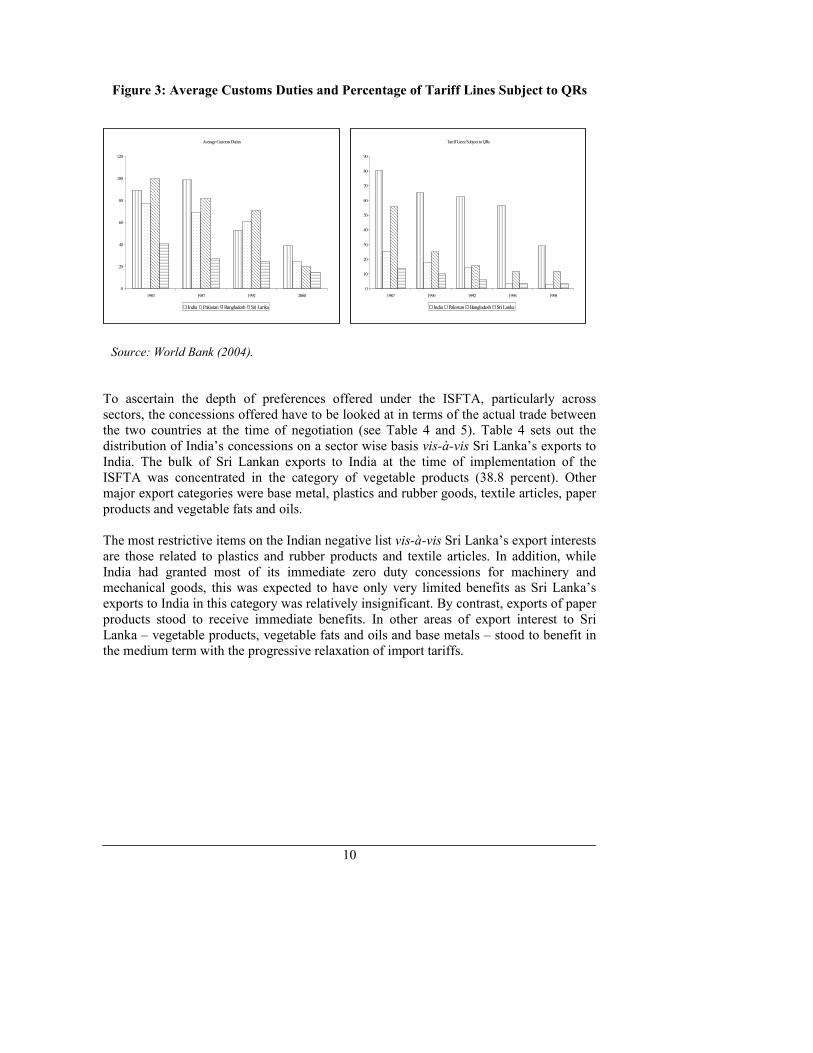
Looking at the overall distribution of concessions under the ISFTA, of the 2907 products exported to Sri Lanka by India in 2000, 21.4 percent were subject to the negative list, only 0.1 percent stood to benefit from zero tariffs and 20.6 percent received preferential tariff reduction. Conversely, of the 380 products exported to India by Sri Lanka, 13.1 percent were subject to the negative list, 17.9 percent to zero tariffs, 57.4 percent would enjoy preferential tariff reduction of 50 percent and a further 11.6 percent of exports were subject to preferential duty reduction of 25 percent. At first glance it appears that the concessions on the part of India were more generous than those proffered by Sri Lanka. However, it has to be borne in mind that Sri Lanka’s external trade regime was far more liberal compared to the trade regime of its neighbour in the late 1990s (see Figure 3). In attempting to redress the imbalance, the bulk of tariff reduction on the part of Sri Lanka with regard to the FTA was, therefore, set to take place over the next eight years with a significant proportion of the traded items (57.9 percent) subject to further liberalisation. In addition, it should also be noted that while India was a significant source of imports into Sri Lanka, the reverse was not the case. India accounted for over nine percent of Sri Lanka’s total imports at the time of implementation of the ISFTA in 2000, Sri Lanka accounted for a negligible share of total imports into India (see Table 7). Thus, opening up market access was expected to have more significant repercussion for the Sri Lankan domestic producers as compared to their Indian counterparts.
10
Figure 3: Average Customs Duties and Percentage of Tariff Lines Subject to QRs
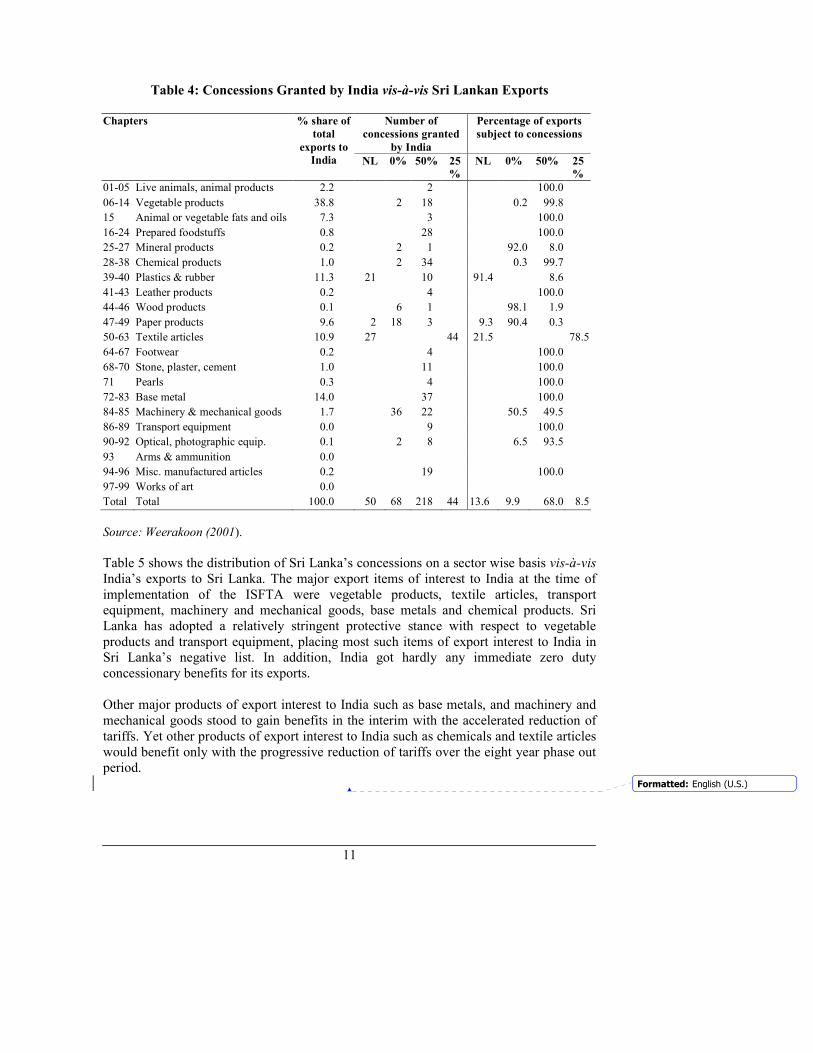
To ascertain the depth of preferences offered under the ISFTA, particularly across sectors, the concessions offered have to be looked at in terms of the actual trade between the two countries at the time of negotiation (see Table 4 and 5). Table 4 sets out the distribution of India’s concessions on a sector wise basis vis-à-vis Sri Lanka’s exports to India. The bulk of Sri Lankan exports to India at the time of implementation of the ISFTA was concentrated in the category of vegetable products (38.8 percent). Other major export categories were base metal, plastics and rubber goods, textile articles, paper products and vegetable fats and oils. The most restrictive items on the Indian negative list vis-à-vis Sri Lanka’s export interests are those related to plastics and rubber products and textile articles. In addition, while India had granted most of its immediate zero duty concessions for machinery and mechanical goods, this was expected to have only very limited benefits as Sri Lanka’s exports to India in this category was relatively insignificant. By contrast, exports of paper products stood to receive immediate benefits. In other areas of export interest to Sri Lanka – vegetable products, vegetable fats and oils and base metals – stood to benefit in the medium term with the progressive relaxation of import tariffs.
Average Customs Duties
0
20
40
60
80
100
120
1983 1987 1992 2000
India Pakistan Bangladesh Sri Lanka
Tariff Lines Subject to QRs
0
10
20
30
40
50
60
70
80
90
1987 1990 1992 1996 1998
India Pakistan Bangladesh Sri Lanka
Source: World Bank (2004).
11
Table 4: Concessions Granted by India vis-à-vis Sri Lankan Exports
Number of
concessions granted
by India
Percentage of exports
subject to concessions
Chapters % share of
total
exports to
India NL 0% 50% 25
%
NL 0% 50% 25
%
01-05 Live animals, animal products 2.2 2 100.0
06-14 Vegetable products 38.8 2 18 0.2 99.8
15 Animal or vegetable fats and oils 7.3 3 100.0
16-24 Prepared foodstuffs 0.8 28 100.0
25-27 Mineral products 0.2 2 1 92.0 8.0
28-38 Chemical products 1.0 2 34 0.3 99.7
39-40 Plastics & rubber 11.3 21 10 91.4 8.6
41-43 Leather products 0.2 4 100.0
44-46 Wood products 0.1 6 1 98.1 1.9
47-49 Paper products 9.6 2 18 3 9.3 90.4 0.3
50-63 Textile articles 10.9 27 44 21.5 78.5
64-67 Footwear 0.2 4 100.0
68-70 Stone, plaster, cement 1.0 11 100.0
71 Pearls 0.3 4 100.0
72-83 Base metal 14.0 37 100.0
84-85 Machinery & mechanical goods 1.7 36 22 50.5 49.5
86-89 Transport equipment 0.0 9 100.0
90-92 Optical, photographic equip. 0.1 2 8 6.5 93.5
93 Arms & ammunition 0.0
94-96 Misc. manufactured articles 0.2 19 100.0
97-99 Works of art 0.0
Total Total 100.0 50 68 218 44 13.6 9.9 68.0 8.5
Source: Weerakoon (2001).
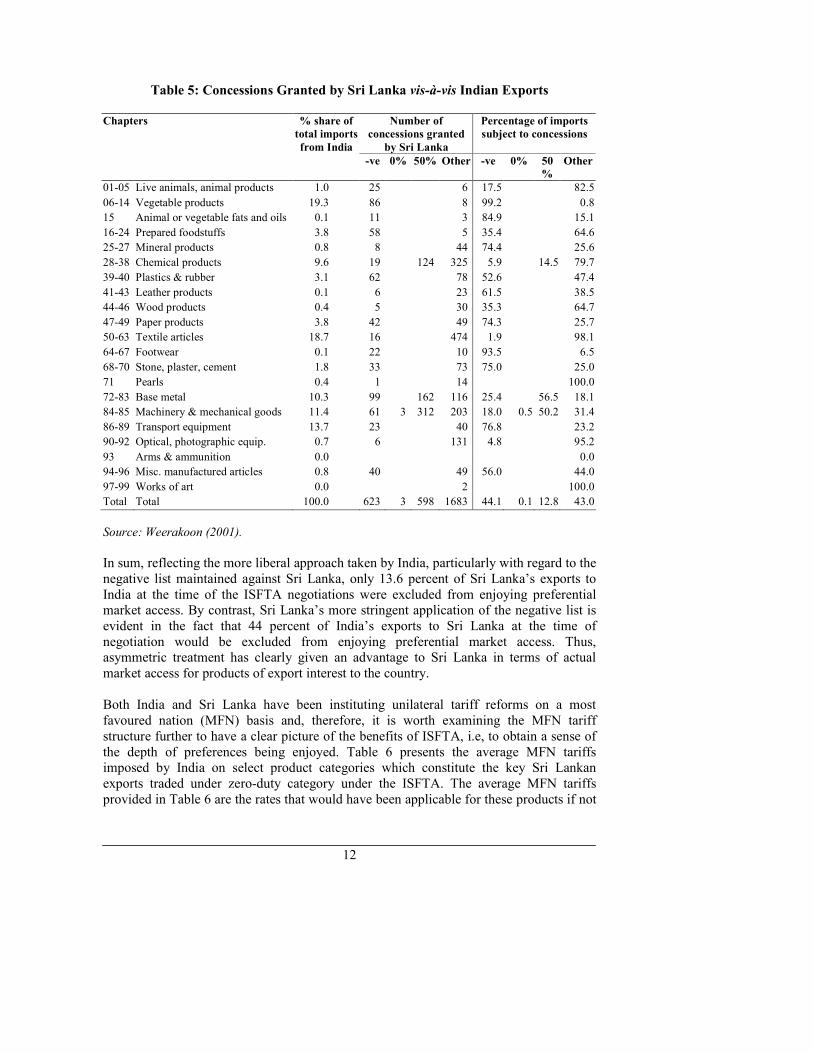
Table 5 shows the distribution of Sri Lanka’s concessions on a sector wise basis vis-à-vis India’s exports to Sri Lanka. The major export items of interest to India at the time of implementation of the ISFTA were vegetable products, textile articles, transport equipment, machinery and mechanical goods, base metals and chemical products. Sri Lanka has adopted a relatively stringent protective stance with respect to vegetable products and transport equipment, placing most such items of export interest to India in Sri Lanka’s negative list. In addition, India got hardly any immediate zero duty concessionary benefits for its exports. Other major products of export interest to India such as base metals, and machinery and mechanical goods stood to gain benefits in the interim with the accelerated reduction of tariffs. Yet other products of export interest to India such as chemicals and textile articles would benefit only with the progressive reduction of tariffs over the eight year phase out period.
Formatted: English (U.S.)
12
Table 5: Concessions Granted by Sri Lanka vis-à-vis Indian Exports
Number of
concessions granted
by Sri Lanka
Percentage of imports
subject to concessions
Chapters % share of
total imports
from India
-ve 0% 50% Other -ve 0% 50
%
Other
01-05 Live animals, animal products 1.0 25 6 17.5 82.5
06-14 Vegetable products 19.3 86 8 99.2 0.8
15 Animal or vegetable fats and oils 0.1 11 3 84.9 15.1
16-24 Prepared foodstuffs 3.8 58 5 35.4 64.6
25-27 Mineral products 0.8 8 44 74.4 25.6
28-38 Chemical products 9.6 19 124 325 5.9 14.5 79.7
39-40 Plastics & rubber 3.1 62 78 52.6 47.4
41-43 Leather products 0.1 6 23 61.5 38.5
44-46 Wood products 0.4 5 30 35.3 64.7
47-49 Paper products 3.8 42 49 74.3 25.7
50-63 Textile articles 18.7 16 474 1.9 98.1
64-67 Footwear 0.1 22 10 93.5 6.5
68-70 Stone, plaster, cement 1.8 33 73 75.0 25.0
71 Pearls 0.4 1 14 100.0
72-83 Base metal 10.3 99 162 116 25.4 56.5 18.1
84-85 Machinery & mechanical goods 11.4 61 3 312 203 18.0 0.5 50.2 31.4
86-89 Transport equipment 13.7 23 40 76.8 23.2
90-92 Optical, photographic equip. 0.7 6 131 4.8 95.2
93 Arms & ammunition 0.0 0.0
94-96 Misc. manufactured articles 0.8 40 49 56.0 44.0
97-99 Works of art 0.0 2 100.0
Total Total 100.0 623 3 598 1683 44.1 0.1 12.8 43.0
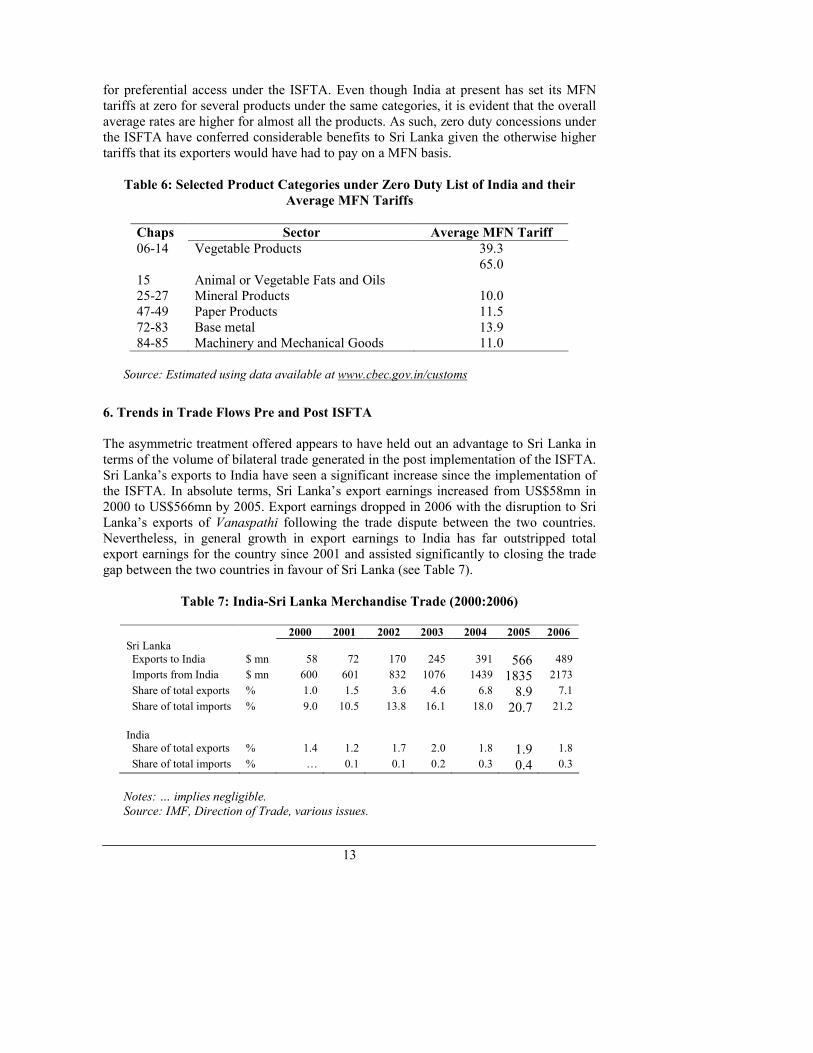
Source: Weerakoon (2001). In sum, reflecting the more liberal approach taken by India, particularly with regard to the negative list maintained against Sri Lanka, only 13.6 percent of Sri Lanka’s exports to India at the time of the ISFTA negotiations were excluded from enjoying preferential market access. By contrast, Sri Lanka’s more stringent application of the negative list is evident in the fact that 44 percent of India’s exports to Sri Lanka at the time of negotiation would be excluded from enjoying preferential market access. Thus, asymmetric treatment has clearly given an advantage to Sri Lanka in terms of actual market access for products of export interest to the country. Both India and Sri Lanka have been instituting unilateral tariff reforms on a most favoured nation (MFN) basis and, therefore, it is worth examining the MFN tariff structure further to have a clear picture of the benefits of ISFTA, i.e, to obtain a sense of the depth of preferences being enjoyed. Table 6 presents the average MFN tariffs imposed by India on select product categories which constitute the key Sri Lankan exports traded under zero-duty category under the ISFTA. The average MFN tariffs provided in Table 6 are the rates that would have been applicable for these products if not
13
for preferential access under the ISFTA. Even though India at present has set its MFN tariffs at zero for several products under the same categories, it is evident that the overall average rates are higher for almost all the products. As such, zero duty concessions under the ISFTA have conferred considerable benefits to Sri Lanka given the otherwise higher tariffs that its exporters would have had to pay on a MFN basis.
Table 6: Selected Product Categories under Zero Duty List of India and their
Average MFN Tariffs
Chaps Sector Average MFN Tariff
06-14 Vegetable Products 39.3
15 Animal or Vegetable Fats and Oils 65.0
25-27 Mineral Products 10.0 47-49 Paper Products 11.5 72-83 Base metal 13.9 84-85 Machinery and Mechanical Goods 11.0
Source: Estimated using data available at www.cbec.gov.in/customs
6. Trends in Trade Flows Pre and Post ISFTA
The asymmetric treatment offered appears to have held out an advantage to Sri Lanka in terms of the volume of bilateral trade generated in the post implementation of the ISFTA. Sri Lanka’s exports to India have seen a significant increase since the implementation of the ISFTA. In absolute terms, Sri Lanka’s export earnings increased from US$58mn in 2000 to US$566mn by 2005. Export earnings dropped in 2006 with the disruption to Sri Lanka’s exports of Vanaspathi following the trade dispute between the two countries. Nevertheless, in general growth in export earnings to India has far outstripped total export earnings for the country since 2001 and assisted significantly to closing the trade gap between the two countries in favour of Sri Lanka (see Table 7).
Table 7: India-Sri Lanka Merchandise Trade (2000:2006)
2000 2001 2002 2003 2004 2005 2006
Sri Lanka
Exports to India $ mn 58 72 170 245 391 566 489
Imports from India $ mn 600 601 832 1076 1439 1835 2173
Share of total exports % 1.0 1.5 3.6 4.6 6.8 8.9 7.1
Share of total imports % 9.0 10.5 13.8 16.1 18.0 20.7 21.2
India Share of total exports % 1.4 1.2 1.7 2.0 1.8 1.9 1.8
Share of total imports % … 0.1 0.1 0.2 0.3 0.4 0.3
Notes: … implies negligible.
Source: IMF, Direction of Trade, various issues.
14
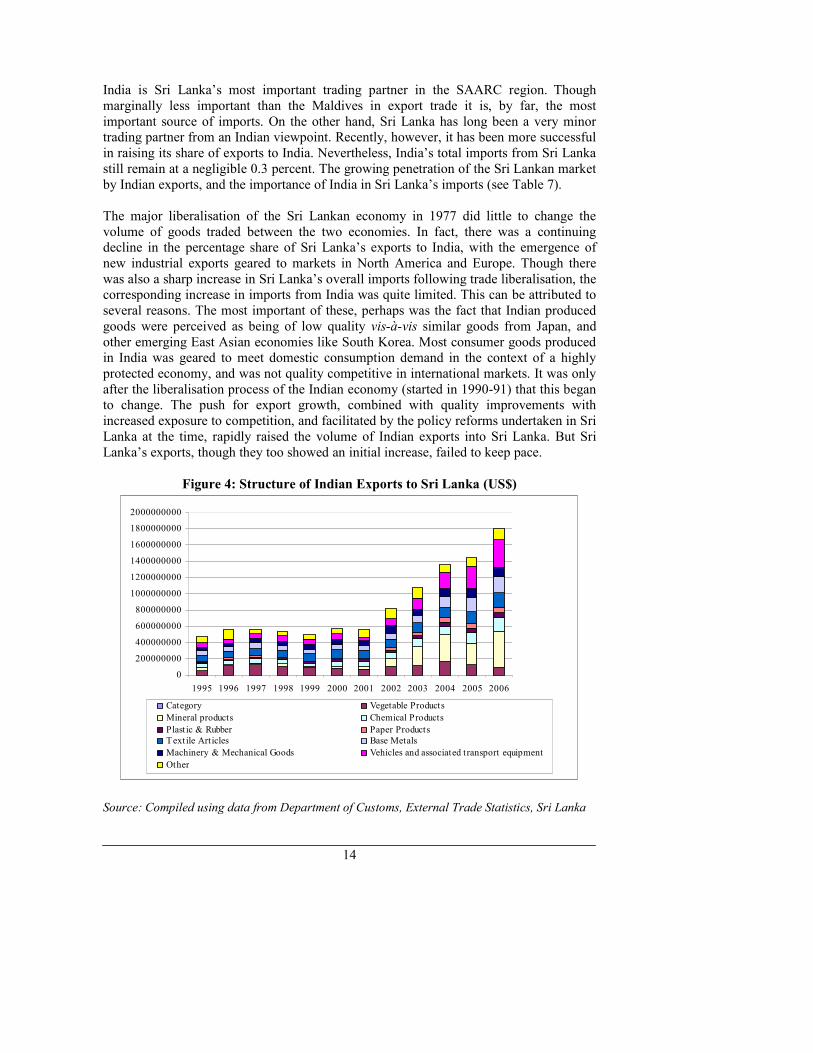
India is Sri Lanka’s most important trading partner in the SAARC region. Though marginally less important than the Maldives in export trade it is, by far, the most important source of imports. On the other hand, Sri Lanka has long been a very minor trading partner from an Indian viewpoint. Recently, however, it has been more successful in raising its share of exports to India. Nevertheless, India’s total imports from Sri Lanka still remain at a negligible 0.3 percent. The growing penetration of the Sri Lankan market by Indian exports, and the importance of India in Sri Lanka’s imports (see Table 7). The major liberalisation of the Sri Lankan economy in 1977 did little to change the volume of goods traded between the two economies. In fact, there was a continuing decline in the percentage share of Sri Lanka’s exports to India, with the emergence of new industrial exports geared to markets in North America and Europe. Though there was also a sharp increase in Sri Lanka’s overall imports following trade liberalisation, the corresponding increase in imports from India was quite limited. This can be attributed to several reasons. The most important of these, perhaps was the fact that Indian produced goods were perceived as being of low quality vis-à-vis similar goods from Japan, and other emerging East Asian economies like South Korea. Most consumer goods produced in India was geared to meet domestic consumption demand in the context of a highly protected economy, and was not quality competitive in international markets. It was only after the liberalisation process of the Indian economy (started in 1990-91) that this began to change. The push for export growth, combined with quality improvements with increased exposure to competition, and facilitated by the policy reforms undertaken in Sri Lanka at the time, rapidly raised the volume of Indian exports into Sri Lanka. But Sri Lanka’s exports, though they too showed an initial increase, failed to keep pace.
Figure 4: Structure of Indian Exports to Sri Lanka (US$)
0
200000000
400000000
600000000
800000000
1000000000
1200000000
1400000000
1600000000
1800000000
2000000000
1995 1996 1997 1998 1999 2000 2001 2002 2003 2004 2005 2006
Category Vegetable Products
Mineral products Chemical Products
Plast ic & Rubber Paper Products
Textile Art icles Base Metals
Machinery & Mechanical Goods Vehicles and associated transport equipment
Other
Source: Compiled using data from Department of Customs, External Trade Statistics, Sri Lanka
15
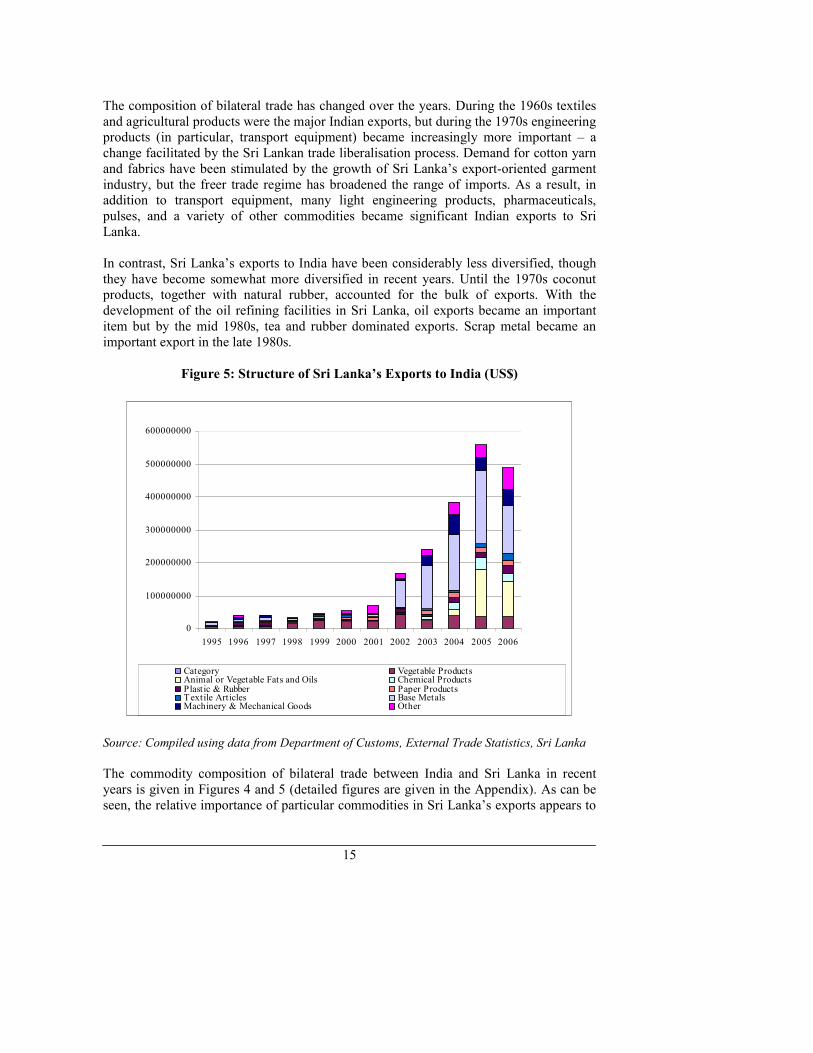
The composition of bilateral trade has changed over the years. During the 1960s textiles and agricultural products were the major Indian exports, but during the 1970s engineering products (in particular, transport equipment) became increasingly more important – a change facilitated by the Sri Lankan trade liberalisation process. Demand for cotton yarn and fabrics have been stimulated by the growth of Sri Lanka’s export-oriented garment industry, but the freer trade regime has broadened the range of imports. As a result, in addition to transport equipment, many light engineering products, pharmaceuticals, pulses, and a variety of other commodities became significant Indian exports to Sri Lanka. In contrast, Sri Lanka’s exports to India have been considerably less diversified, though they have become somewhat more diversified in recent years. Until the 1970s coconut products, together with natural rubber, accounted for the bulk of exports. With the development of the oil refining facilities in Sri Lanka, oil exports became an important item but by the mid 1980s, tea and rubber dominated exports. Scrap metal became an important export in the late 1980s.
Figure 5: Structure of Sri Lanka’s Exports to India (US$)
0
100000000
200000000
300000000
400000000
500000000
600000000
1995 1996 1997 1998 1999 2000 2001 2002 2003 2004 2005 2006
Category Vegetable ProductsAnimal or Vegetable Fats and Oils Chemical ProductsPlast ic & Rubber Paper ProductsTextile Articles Base MetalsMachinery & Mechanical Goods Other
Source: Compiled using data from Department of Customs, External Trade Statistics, Sri Lanka
The commodity composition of bilateral trade between India and Sri Lanka in recent years is given in Figures 4 and 5 (detailed figures are given in the Appendix). As can be seen, the relative importance of particular commodities in Sri Lanka’s exports appears to
16
have changed quite substantially. Sri Lanka’s total exports to India has shown a remarkable upward trend since 2002 and accelerated sharply from 2003 with the provision of duty free access to the Indian market as per the agreement. The growth is mostly visible in product categories of base metal, animal or vegetable fats and oils, machinery and mechanical goods and chemical products etc. For instance, the top exports to India in 2005, ranked in terms of value included vegetable fats and oils, copper products, aluminum wire, antibiotics, spices such as cloves, pepper, edible preparations of fats and oils and waste and scrap metal and paper, etc. A notable feature is that India has also increased its demand for imports from Sri Lanka which are currently being produced in the Indian domestic market. For instance, despite their domestic production, Indian demand for imported tyres and tubes from Sri Lanka has been increasing in recent years due to the raid expansion of the automobile industry in India. Even before the implementation of the ISFTA, India had been a significant and growing source of imports for Sri Lanka for a wide variety of products. The major import categories before the 1990s were agricultural products, food and beverages, cotton and fibre, machinery and equipment, and base metal. However, this pattern changed quite visibly during the latter half of the 1990s. The most significant imports at present include motor vehicles and parts, mineral fuel, pharmaceuticals, and cement. The top imports from India in 2006 included petroleum oils, motor vehicles – such as motorcycles, diesel or semi-diesel motor vehicles, ambulances, prison vans, hearses and auto trishaws, etc., – pharmaceutical products, residues and waste from the food industry such as oil-cake and other solid residues of soya-bean and mineral products such as cement.
Table 8: Sri Lanka’s Exports to India under ISFTA Categories
Average
1999-2000 2001 2002 2003 2004 2005
2006
Negative List 10.5 6.9 3.6 2.7 5.8 2.4 3.3 No. of items 37 34 51 53 69 69 70 Zero Duty 77.6 86.0 94.0 94.3 92.0 95.7 92.7 No. of items 300 383 469 560 664 723 708 Residual List
a 11.8 7.1 2.4 2.9 2.2 1.8 4.0
No. of items 63 73 100 99 154 162 156 Growth in Exports (%) Exports to India 15.7 27.5 143.3 43.1 59.9 45.1 -12.5
Exports to ROWb 19.8 -12.8 -2.4 9.2 12.2 10.2
14.4 Notes: a: Includes Tariff Rate Quotas on textiles and tea
b: Rest of the world
Source: Estimated using data from Department of Customs, External Trade Statistics, Sri Lanka.
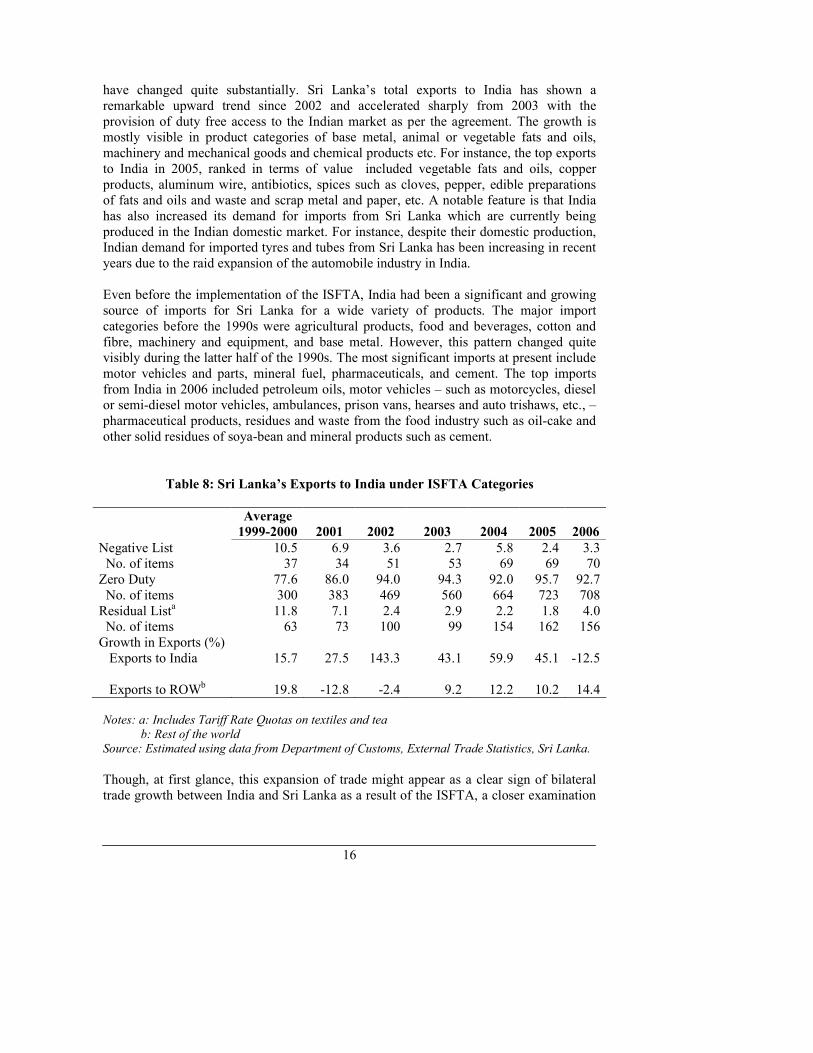
Though, at first glance, this expansion of trade might appear as a clear sign of bilateral trade growth between India and Sri Lanka as a result of the ISFTA, a closer examination
17
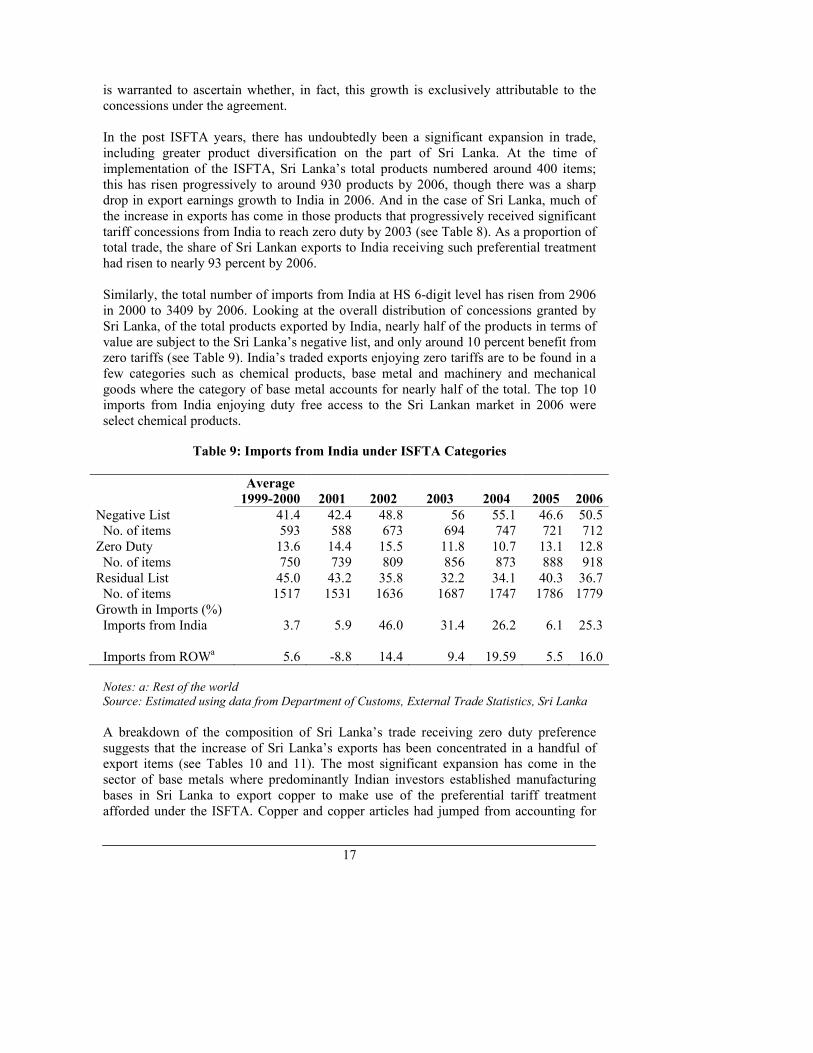
is warranted to ascertain whether, in fact, this growth is exclusively attributable to the concessions under the agreement. In the post ISFTA years, there has undoubtedly been a significant expansion in trade, including greater product diversification on the part of Sri Lanka. At the time of implementation of the ISFTA, Sri Lanka’s total products numbered around 400 items; this has risen progressively to around 930 products by 2006, though there was a sharp drop in export earnings growth to India in 2006. And in the case of Sri Lanka, much of the increase in exports has come in those products that progressively received significant tariff concessions from India to reach zero duty by 2003 (see Table 8). As a proportion of total trade, the share of Sri Lankan exports to India receiving such preferential treatment had risen to nearly 93 percent by 2006. Similarly, the total number of imports from India at HS 6-digit level has risen from 2906 in 2000 to 3409 by 2006. Looking at the overall distribution of concessions granted by Sri Lanka, of the total products exported by India, nearly half of the products in terms of value are subject to the Sri Lanka’s negative list, and only around 10 percent benefit from zero tariffs (see Table 9). India’s traded exports enjoying zero tariffs are to be found in a few categories such as chemical products, base metal and machinery and mechanical goods where the category of base metal accounts for nearly half of the total. The top 10 imports from India enjoying duty free access to the Sri Lankan market in 2006 were select chemical products.
Table 9: Imports from India under ISFTA Categories
Average
1999-2000 2001 2002 2003 2004 2005
2006
Negative List 41.4 42.4 48.8 56 55.1 46.6 50.5 No. of items 593 588 673 694 747 721 712 Zero Duty 13.6 14.4 15.5 11.8 10.7 13.1 12.8 No. of items 750 739 809 856 873 888 918 Residual List 45.0 43.2 35.8 32.2 34.1 40.3 36.7 No. of items 1517 1531 1636 1687 1747 1786 1779 Growth in Imports (%) Imports from India 3.7 5.9 46.0 31.4 26.2 6.1 25.3
Imports from ROWa 5.6 -8.8 14.4 9.4 19.59 5.5
16.0 Notes: a: Rest of the world
Source: Estimated using data from Department of Customs, External Trade Statistics, Sri Lanka
A breakdown of the composition of Sri Lanka’s trade receiving zero duty preference suggests that the increase of Sri Lanka’s exports has been concentrated in a handful of export items (see Tables 10 and 11). The most significant expansion has come in the sector of base metals where predominantly Indian investors established manufacturing bases in Sri Lanka to export copper to make use of the preferential tariff treatment afforded under the ISFTA. Copper and copper articles had jumped from accounting for
18
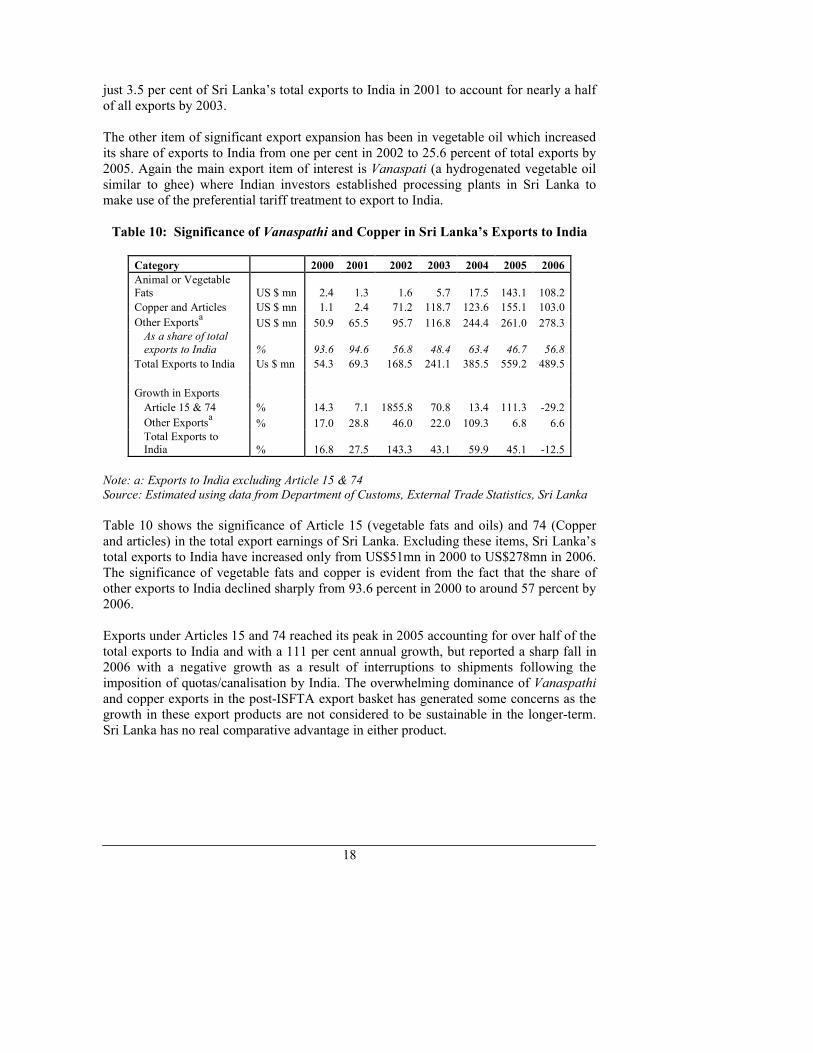
just 3.5 per cent of Sri Lanka’s total exports to India in 2001 to account for nearly a half of all exports by 2003. The other item of significant export expansion has been in vegetable oil which increased its share of exports to India from one per cent in 2002 to 25.6 percent of total exports by 2005. Again the main export item of interest is Vanaspati (a hydrogenated vegetable oil similar to ghee) where Indian investors established processing plants in Sri Lanka to make use of the preferential tariff treatment to export to India.
Table 10: Significance of Vanaspathi and Copper in Sri Lanka’s Exports to India
Category 2000 2001 2002 2003 2004 2005 2006
Animal or Vegetable Fats US $ mn 2.4 1.3 1.6 5.7 17.5 143.1 108.2
Copper and Articles US $ mn 1.1 2.4 71.2 118.7 123.6 155.1 103.0
Other Exportsa US $ mn 50.9 65.5 95.7 116.8 244.4 261.0 278.3
As a share of total
exports to India % 93.6 94.6 56.8 48.4 63.4 46.7 56.8
Total Exports to India Us $ mn 54.3 69.3 168.5 241.1 385.5 559.2 489.5
Growth in Exports
Article 15 & 74 % 14.3 7.1 1855.8 70.8 13.4 111.3 -29.2
Other Exportsa % 17.0 28.8 46.0 22.0 109.3 6.8 6.6
Total Exports to India % 16.8 27.5 143.3 43.1 59.9 45.1 -12.5
Note: a: Exports to India excluding Article 15 & 74
Source: Estimated using data from Department of Customs, External Trade Statistics, Sri Lanka
Table 10 shows the significance of Article 15 (vegetable fats and oils) and 74 (Copper and articles) in the total export earnings of Sri Lanka. Excluding these items, Sri Lanka’s total exports to India have increased only from US$51mn in 2000 to US$278mn in 2006. The significance of vegetable fats and copper is evident from the fact that the share of other exports to India declined sharply from 93.6 percent in 2000 to around 57 percent by 2006. Exports under Articles 15 and 74 reached its peak in 2005 accounting for over half of the total exports to India and with a 111 per cent annual growth, but reported a sharp fall in 2006 with a negative growth as a result of interruptions to shipments following the imposition of quotas/canalisation by India. The overwhelming dominance of Vanaspathi and copper exports in the post-ISFTA export basket has generated some concerns as the growth in these export products are not considered to be sustainable in the longer-term. Sri Lanka has no real comparative advantage in either product.
19
Table 11: Composition of Sri Lanka’s Exports Receiving Zero Duty Treatment
under ISFTAa
Sector
Average
1999-2000 2001 2002 2003 2004 2005
2006
01-05 Live animals, animal products 1.7 0.5 0.1 0.3 0.2 0.2 0.1
06-14 Vegetable products 40.5 28.1 26.3 9.0 7.3 6.2 6.9
15 Animal or vegetable fats and oils 5.0 1.9 1.0 2.4 4.5 25.6 22.1
16-24 Prepared foodstuffs 1.0 1.2 0.4 0.8 0.9 0.6 1.8
25-27 Mineral products 5.0 24.4 5.2 0.5 0.3 0.5 0.5
28-38 Chemical products 0.7 1.2 1.1 2.7 5.3 6.3 4.9
39-40 Plastics & rubber 0.9 0.7 0.9 1.6 1.7 1.1 2.0
41-43 Leather products 0.0 0.1 0.7 0.6 0.7 0.4 0.5
44-46 Wood products 0.1 0.0 0.7 1.7 2.3 2.0 2.1
47-49 Paper products 7.6 8.4 3.8 3.8 3.3 2.7 3.4
50-63 Textile articles 0.0 0.0 0.0 0.0 0.0 0.0 0.0
64-67 Footwear 0.2 0.1 0.0 0.0 0.1 0.0 0.0
68-70 Stone, plaster, cement 0.7 2.4 0.8 2.3 3.6 1.7 5.5
71 Pearls 0.2 0.1 0.1 0.3 0.4 0.5 0.4
72-83 Base metal 11.6 11.2 47.6 55.1 43.8 39.9 29.6
Copper and articles thereof (1.5) (3.5) (42.3) (49.2) (32.1) (27.7) (21.0)
84-85 Machinery & mechanical goods 2.0 4.0 3.4 12.2 15.5 6.8 10.5
86-89 Transport equipment 0.1 0.4 0.3 0.1 0.8 0.1 0.8
90-92 Optical, photographic equip. 0.1 0.1 0.4 0.1 0.1 0.1 0.1
93 Arms & ammunition 0.0 0.0 0.0 0.0 0.0 0.0 0.0
94-96 Misc. manufactured articles 0.3 1.4 1.1 0.9 1.1 1.2 1.6
97-99 Works of art 0.0 0.0 0.0 0.0 0.0 0.0 0.0
Total Zero Duty List 77.6 86.0 94.0 94.3 92.0 95.7 92.7
Notes: As a percentage of total exports to India.
Source: Estimated using data from Department of Customs, External Trade Statistics, Sri Lanka
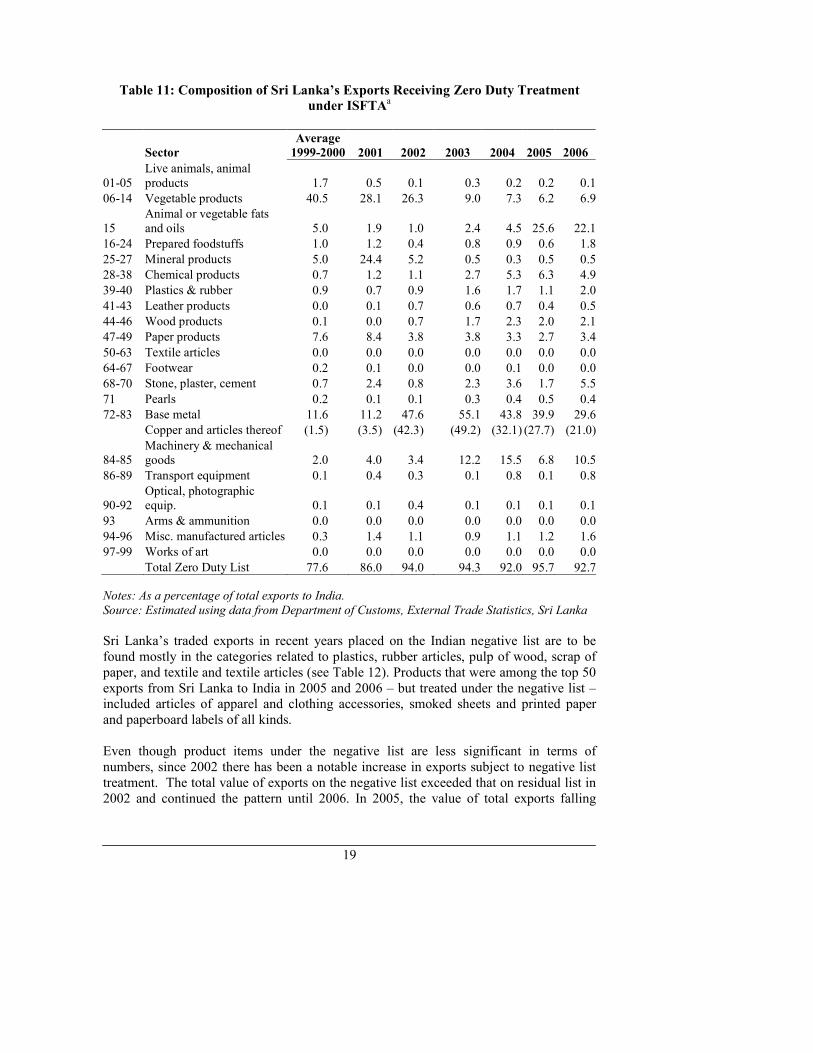
Sri Lanka’s traded exports in recent years placed on the Indian negative list are to be found mostly in the categories related to plastics, rubber articles, pulp of wood, scrap of paper, and textile and textile articles (see Table 12). Products that were among the top 50 exports from Sri Lanka to India in 2005 and 2006 – but treated under the negative list – included articles of apparel and clothing accessories, smoked sheets and printed paper and paperboard labels of all kinds. Even though product items under the negative list are less significant in terms of numbers, since 2002 there has been a notable increase in exports subject to negative list treatment. The total value of exports on the negative list exceeded that on residual list in 2002 and continued the pattern until 2006. In 2005, the value of total exports falling
20
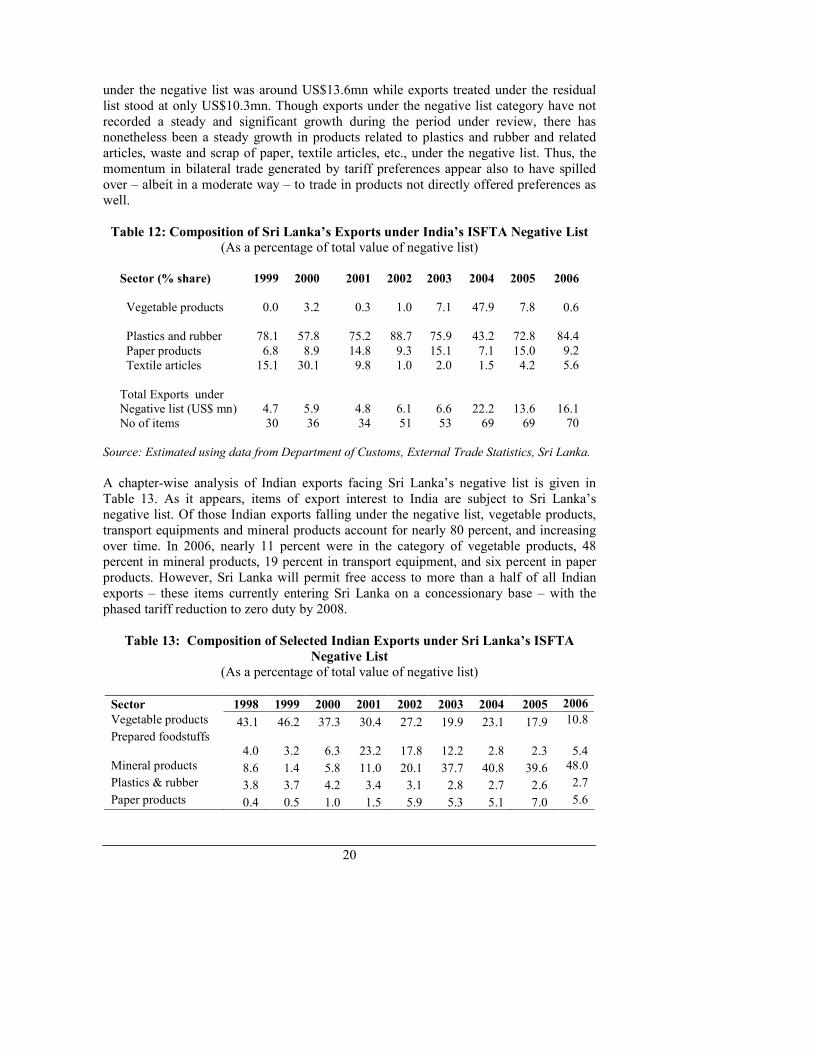
under the negative list was around US$13.6mn while exports treated under the residual list stood at only US$10.3mn. Though exports under the negative list category have not recorded a steady and significant growth during the period under review, there has nonetheless been a steady growth in products related to plastics and rubber and related articles, waste and scrap of paper, textile articles, etc., under the negative list. Thus, the momentum in bilateral trade generated by tariff preferences appear also to have spilled over – albeit in a moderate way – to trade in products not directly offered preferences as well.
Table 12: Composition of Sri Lanka’s Exports under India’s ISFTA Negative List
(As a percentage of total value of negative list)
Sector (% share) 1999 2000 2001 2002 2003 2004 2005 2006
Vegetable products 0.0 3.2 0.3 1.0 7.1 47.9 7.8
0.6
Plastics and rubber 78.1 57.8 75.2 88.7 75.9 43.2 72.8
84.4
Paper products 6.8 8.9 14.8 9.3 15.1 7.1 15.0 9.2
Textile articles 15.1 30.1 9.8 1.0 2.0 1.5 4.2 5.6
Total Exports under Negative list (US$ mn) 4.7 5.9 4.8 6.1 6.6 22.2 13.6
16.1
No of items 30 36 34 51 53 69 69 70
Source: Estimated using data from Department of Customs, External Trade Statistics, Sri Lanka.
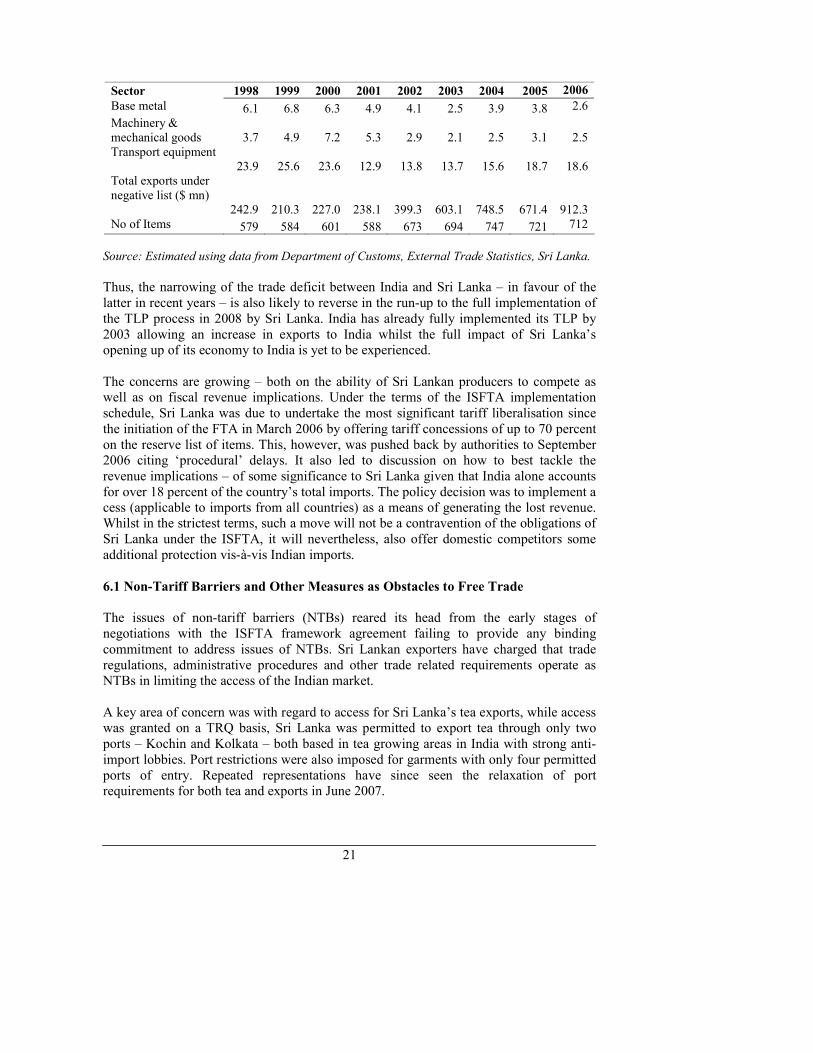
A chapter-wise analysis of Indian exports facing Sri Lanka’s negative list is given in Table 13. As it appears, items of export interest to India are subject to Sri Lanka’s negative list. Of those Indian exports falling under the negative list, vegetable products, transport equipments and mineral products account for nearly 80 percent, and increasing over time. In 2006, nearly 11 percent were in the category of vegetable products, 48 percent in mineral products, 19 percent in transport equipment, and six percent in paper products. However, Sri Lanka will permit free access to more than a half of all Indian exports – these items currently entering Sri Lanka on a concessionary base – with the phased tariff reduction to zero duty by 2008.
Table 13: Composition of Selected Indian Exports under Sri Lanka’s ISFTA
Negative List
(As a percentage of total value of negative list)
Sector 1998 1999 2000 2001 2002 2003 2004 2005 2006
Vegetable products 43.1 46.2 37.3 30.4 27.2 19.9 23.1 17.9 10.8
Prepared foodstuffs 4.0 3.2 6.3 23.2 17.8 12.2 2.8 2.3
5.4
Mineral products 8.6 1.4 5.8 11.0 20.1 37.7 40.8 39.6 48.0
Plastics & rubber 3.8 3.7 4.2 3.4 3.1 2.8 2.7 2.6 2.7
Paper products 0.4 0.5 1.0 1.5 5.9 5.3 5.1 7.0 5.6
21
Sector 1998 1999 2000 2001 2002 2003 2004 2005 2006
Base metal 6.1 6.8 6.3 4.9 4.1 2.5 3.9 3.8 2.6
Machinery & mechanical goods 3.7 4.9 7.2 5.3 2.9 2.1 2.5 3.1
2.5
Transport equipment 23.9 25.6 23.6 12.9 13.8 13.7 15.6 18.7
18.6
Total exports under negative list ($ mn)
242.9 210.3 227.0 238.1 399.3 603.1 748.5 671.4
912.3 No of Items 579 584 601 588 673 694 747 721 712
Source: Estimated using data from Department of Customs, External Trade Statistics, Sri Lanka.
Thus, the narrowing of the trade deficit between India and Sri Lanka – in favour of the latter in recent years – is also likely to reverse in the run-up to the full implementation of the TLP process in 2008 by Sri Lanka. India has already fully implemented its TLP by 2003 allowing an increase in exports to India whilst the full impact of Sri Lanka’s opening up of its economy to India is yet to be experienced.
The concerns are growing – both on the ability of Sri Lankan producers to compete as well as on fiscal revenue implications. Under the terms of the ISFTA implementation schedule, Sri Lanka was due to undertake the most significant tariff liberalisation since the initiation of the FTA in March 2006 by offering tariff concessions of up to 70 percent on the reserve list of items. This, however, was pushed back by authorities to September 2006 citing ‘procedural’ delays. It also led to discussion on how to best tackle the revenue implications – of some significance to Sri Lanka given that India alone accounts for over 18 percent of the country’s total imports. The policy decision was to implement a cess (applicable to imports from all countries) as a means of generating the lost revenue. Whilst in the strictest terms, such a move will not be a contravention of the obligations of Sri Lanka under the ISFTA, it will nevertheless, also offer domestic competitors some additional protection vis-à-vis Indian imports.
6.1 Non-Tariff Barriers and Other Measures as Obstacles to Free Trade
The issues of non-tariff barriers (NTBs) reared its head from the early stages of negotiations with the ISFTA framework agreement failing to provide any binding commitment to address issues of NTBs. Sri Lankan exporters have charged that trade regulations, administrative procedures and other trade related requirements operate as NTBs in limiting the access of the Indian market. A key area of concern was with regard to access for Sri Lanka’s tea exports, while access was granted on a TRQ basis, Sri Lanka was permitted to export tea through only two ports – Kochin and Kolkata – both based in tea growing areas in India with strong anti-import lobbies. Port restrictions were also imposed for garments with only four permitted ports of entry. Repeated representations have since seen the relaxation of port requirements for both tea and exports in June 2007.
22
In addition, the imposition of state taxes in India has been one of the most pervasive NTBs. Sri Lankan exporters often complain about entry taxes and sales taxes in the southern stat of Tamil Nadu (Kelegama and Mukherji, 2007). Under prevailing state taxes, Sri Lankan imports are charged taxes at a rate of 21 percent while local manufacturers pay only 10.5 percent in sales taxes. The Indian position has been that goods from other parts of India are also subject to similar state sales taxes – at a rate higher than that prevailing for domestic producers of the Tamil Nadu state for example – and therefore are not discriminatory. Other concerns have risen with regard to unilateral imposition of quotas. Sri Lanka's shipments of Vanaspati under the ISFTA have been a cause of contention in bilateral trade relations with the sharp increase in exports giving India grounds to slap quantitative restrictions on the ground of ‘serious injury’ to local industry. Similar problems have emerged in the case of copper, pepper and bakery shortenings. It has been argued that exports of Vanaspati from Sri Lanka was flooding the Indian market and destabilising the domestic Indian industry. During trade negotiations in 2003, both countries had agreed to cap Vanaspati shipments from Sri Lanka to 250,000 metric tonnes but subsequently India had requested that such imports should be capped at 100,000 metric tonnes, a request not received with favour by Sri Lanka. Consequently, India unilaterally decided to restrict imports of Vanaspati oil from Sri Lanka, appointing the National Agricultural Cooperative Marketing Federation of India Ltd. (NAFED) as the sole agency for such imports in 2006. Such a canalisation policy has had significant adverse affects on Sri Lankan Vanaspati factories with some likely to be shut down as a result of the regulations imposed by India. In January 2007, following further negotiations, the NAFED requirement was removed with India agreeing to the previous quota of 250,000 metric tonnes of imports per annum. Similarly, restrictions were imposed on bakery shortenings, margarine and black pepper. Besides, RoO requirements have also acted to limit potential benefits of the ISFTA. In the case of tea, for example, in order for blended tea to meet DVA and CTH criteria under the RoO, a CTH at 4-digit HS code is required which is near impossible to meet. As a result, even blended Sri Lankan tea with Indian tea (meeting the regional cumulation of 25 percent DVA) cannot fulfil the CTH requirement. The RoO requirement in combination with port restrictions have meant that Sri Lanka tea exports to India have less than 2.7 percent of the quota of 15 million kg permitted – and remains at less than one percent of Sri Lanka’s total tea exports (Kelegama and Mukherji, 2007). Similarly, in the case of garments – which requires that of the quota of 8 million pieces, 2 million pieces should be of Indian fabric – RoO and port entry requirements have meant that utilisation of the quota has been less than one percent by 2006 (Kelegama and Mukherji, 2007). There have also been disputes with regard to the flouting of RoO, particularly with regard to exports of copper. Since exporters of copper from Sri Lanka have to import the raw materials, there have been several disputes with regard to flouring of the 35 percent value addition criteria in this sector. Indian counterparts monitoring the implementation of the
23
ISFTA have, in fact, examined some of the operating business and factories and where RoO were found to have been flouted, forced to close down.
7. Trends in Investment and Services Trade
Following the implementation of the ISFTA, India and Sri Lanka agreed in 2002 to explore means of extending economic cooperation. A Joint Study Group identified potential areas of cooperation under a Comprehensive Economic Partnership Agreement (CEPA) by extending economic cooperation to trade in services and investment.
8 While
Sri Lanka and India have had several rounds of technical level negotiations since 2004 to draw up a framework agreement, progress has been slow due to attention being focused on ironing out implementation problems under the ISFTA. Nevertheless the CEPA is expected to be finalised in 2007 in view of growing links in investment and services trade between the two countries.
7.1 Investment Links in Goods
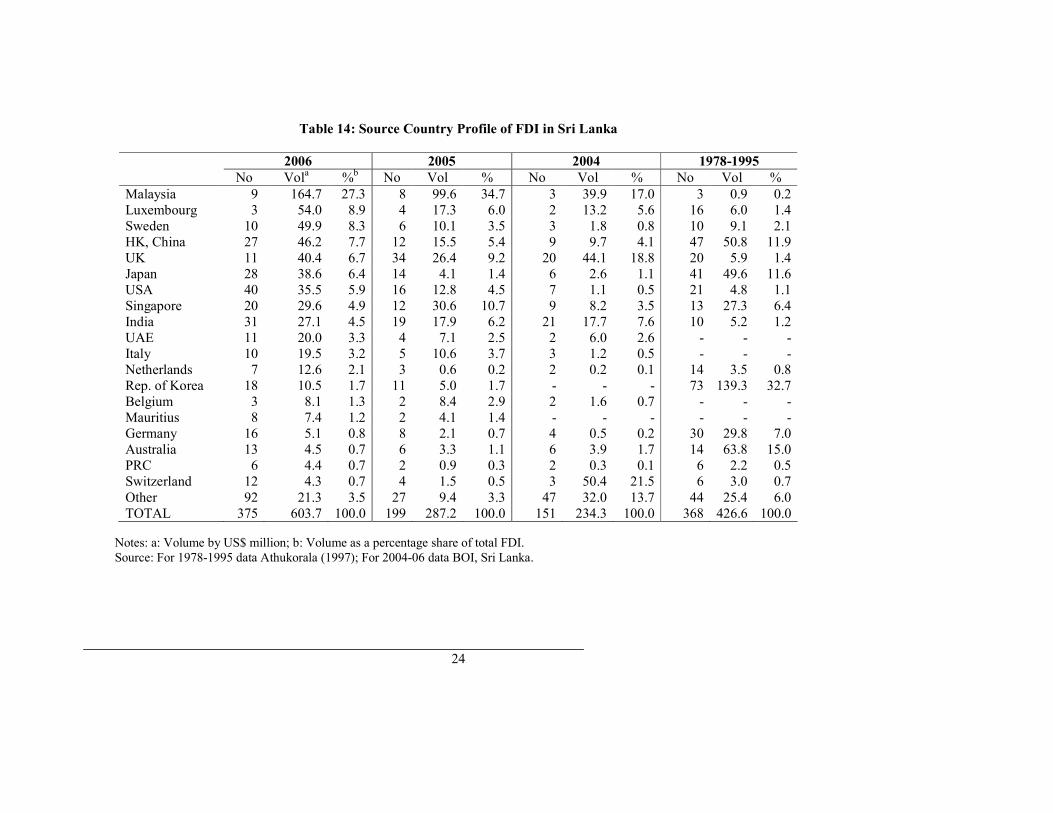
India-Sri Lanka investment links have been quite minor, although growing at present. Though Sri Lanka started to attract significant FDI after 1977,
9 Indian investment in Sri
Lanka has been quite small in terms of its total contribution to FDI, though it is the largest investor from the SAARC region. India has increasing its share of FDI in Sri Lanka from 1.2 per cent during 1978-1995 to over 5.6 per cent during 2004-2006 (Table 14). At times, tense political relationships with India have discouraged more active Indian involvement in the economy. However, with a marked improvement in bilateral relations since the late 1990s, Indian investment has picked up sharply. This process has been assisted by improved economic links following the signing of a bilateral FTA between India and Sri Lanka in 1998. While the FTA was confined to trade in goods, improved business links and business confidence has undoubtedly had an impact in generating more FDI from India into Sri Lanka. However, as an outward destination, Sri Lanka remains fairly marginal to Indian investors – attracting only an estimated one per cent of total Indian outbound FDI.
8 Including the pruning the prevailing sensitive lists of both countries to speed up liberalization of trade in goods. 9 The dominance of FDI by East Asian countries is the result of the early influx of ‘quota-hopping’ firms in to the Sri Lankan garment industry, the main manufacturing industry with large FDI.
24
Table 14: Source Country Profile of FDI in Sri Lanka
2006 2005 2004 1978-1995
No Vola %b No Vol % No Vol % No Vol %
Malaysia 9 164.7 27.3 8 99.6 34.7 3 39.9 17.0 3 0.9 0.2 Luxembourg 3 54.0 8.9 4 17.3 6.0 2 13.2 5.6 16 6.0 1.4 Sweden 10 49.9 8.3 6 10.1 3.5 3 1.8 0.8 10 9.1 2.1 HK, China 27 46.2 7.7 12 15.5 5.4 9 9.7 4.1 47 50.8 11.9 UK 11 40.4 6.7 34 26.4 9.2 20 44.1 18.8 20 5.9 1.4 Japan 28 38.6 6.4 14 4.1 1.4 6 2.6 1.1 41 49.6 11.6 USA 40 35.5 5.9 16 12.8 4.5 7 1.1 0.5 21 4.8 1.1 Singapore 20 29.6 4.9 12 30.6 10.7 9 8.2 3.5 13 27.3 6.4 India 31 27.1 4.5 19 17.9 6.2 21 17.7 7.6 10 5.2 1.2 UAE 11 20.0 3.3 4 7.1 2.5 2 6.0 2.6 - - - Italy 10 19.5 3.2 5 10.6 3.7 3 1.2 0.5 - - - Netherlands 7 12.6 2.1 3 0.6 0.2 2 0.2 0.1 14 3.5 0.8 Rep. of Korea 18 10.5 1.7 11 5.0 1.7 - - - 73 139.3 32.7 Belgium 3 8.1 1.3 2 8.4 2.9 2 1.6 0.7 - - - Mauritius 8 7.4 1.2 2 4.1 1.4 - - - - - - Germany 16 5.1 0.8 8 2.1 0.7 4 0.5 0.2 30 29.8 7.0 Australia 13 4.5 0.7 6 3.3 1.1 6 3.9 1.7 14 63.8 15.0 PRC 6 4.4 0.7 2 0.9 0.3 2 0.3 0.1 6 2.2 0.5 Switzerland 12 4.3 0.7 4 1.5 0.5 3 50.4 21.5 6 3.0 0.7 Other 92 21.3 3.5 27 9.4 3.3 47 32.0 13.7 44 25.4 6.0 TOTAL 375 603.7 100.0 199 287.2 100.0 151 234.3 100.0 368 426.6 100.0
Notes: a: Volume by US$ million; b: Volume as a percentage share of total FDI. Source: For 1978-1995 data Athukorala (1997); For 2004-06 data BOI, Sri Lanka.
25
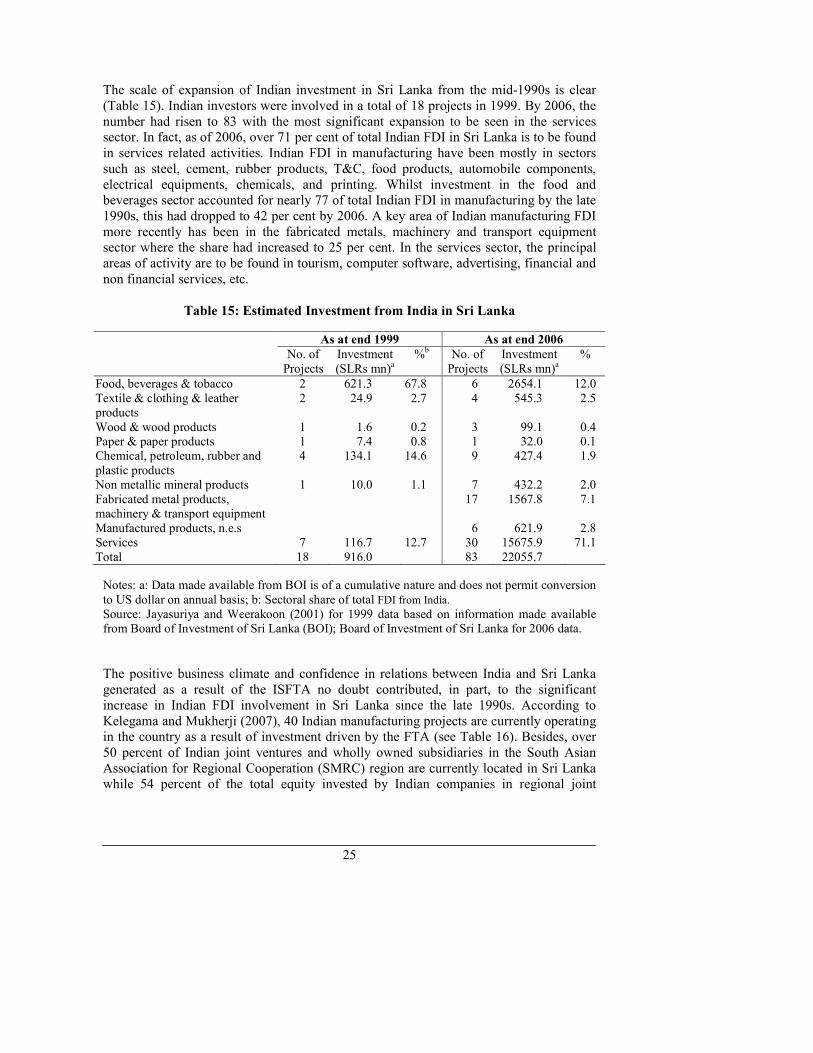
The scale of expansion of Indian investment in Sri Lanka from the mid-1990s is clear (Table 15). Indian investors were involved in a total of 18 projects in 1999. By 2006, the number had risen to 83 with the most significant expansion to be seen in the services sector. In fact, as of 2006, over 71 per cent of total Indian FDI in Sri Lanka is to be found in services related activities. Indian FDI in manufacturing have been mostly in sectors such as steel, cement, rubber products, T&C, food products, automobile components, electrical equipments, chemicals, and printing. Whilst investment in the food and beverages sector accounted for nearly 77 of total Indian FDI in manufacturing by the late 1990s, this had dropped to 42 per cent by 2006. A key area of Indian manufacturing FDI more recently has been in the fabricated metals, machinery and transport equipment sector where the share had increased to 25 per cent. In the services sector, the principal areas of activity are to be found in tourism, computer software, advertising, financial and non financial services, etc.
Table 15: Estimated Investment from India in Sri Lanka
As at end 1999 As at end 2006
No. of Projects
Investment (SLRs mn)a
%b No. of Projects
Investment (SLRs mn)a
%
Food, beverages & tobacco 2 621.3 67.8 6 2654.1 12.0 Textile & clothing & leather products
2 24.9 2.7 4 545.3 2.5
Wood & wood products 1 1.6 0.2 3 99.1 0.4 Paper & paper products 1 7.4 0.8 1 32.0 0.1 Chemical, petroleum, rubber and plastic products
4 134.1 14.6 9 427.4 1.9
Non metallic mineral products 1 10.0 1.1 7 432.2 2.0 Fabricated metal products, machinery & transport equipment
17 1567.8 7.1
Manufactured products, n.e.s 6 621.9 2.8 Services 7 116.7 12.7 30 15675.9 71.1 Total 18 916.0 83 22055.7
Notes: a: Data made available from BOI is of a cumulative nature and does not permit conversion to US dollar on annual basis; b: Sectoral share of total FDI from India. Source: Jayasuriya and Weerakoon (2001) for 1999 data based on information made available from Board of Investment of Sri Lanka (BOI); Board of Investment of Sri Lanka for 2006 data.
The positive business climate and confidence in relations between India and Sri Lanka generated as a result of the ISFTA no doubt contributed, in part, to the significant increase in Indian FDI involvement in Sri Lanka since the late 1990s. According to Kelegama and Mukherji (2007), 40 Indian manufacturing projects are currently operating in the country as a result of investment driven by the FTA (see Table 16). Besides, over 50 percent of Indian joint ventures and wholly owned subsidiaries in the South Asian Association for Regional Cooperation (SMRC) region are currently located in Sri Lanka while 54 percent of the total equity invested by Indian companies in regional joint
26
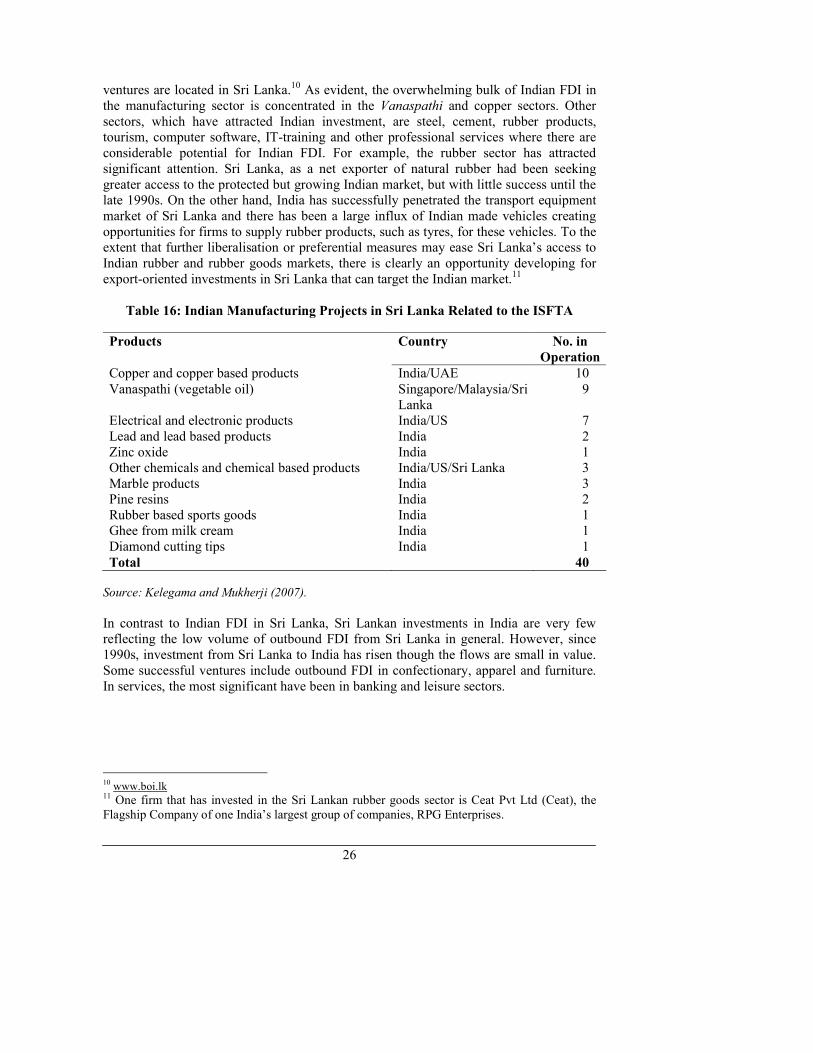
ventures are located in Sri Lanka.10 As evident, the overwhelming bulk of Indian FDI in the manufacturing sector is concentrated in the Vanaspathi and copper sectors. Other sectors, which have attracted Indian investment, are steel, cement, rubber products, tourism, computer software, IT-training and other professional services where there are considerable potential for Indian FDI. For example, the rubber sector has attracted significant attention. Sri Lanka, as a net exporter of natural rubber had been seeking greater access to the protected but growing Indian market, but with little success until the late 1990s. On the other hand, India has successfully penetrated the transport equipment market of Sri Lanka and there has been a large influx of Indian made vehicles creating opportunities for firms to supply rubber products, such as tyres, for these vehicles. To the extent that further liberalisation or preferential measures may ease Sri Lanka’s access to Indian rubber and rubber goods markets, there is clearly an opportunity developing for export-oriented investments in Sri Lanka that can target the Indian market.
11
Table 16: Indian Manufacturing Projects in Sri Lanka Related to the ISFTA
Products Country No. in
Operation
Copper and copper based products India/UAE 10
Vanaspathi (vegetable oil) Singapore/Malaysia/Sri Lanka
9
Electrical and electronic products India/US 7 Lead and lead based products India 2 Zinc oxide India 1 Other chemicals and chemical based products India/US/Sri Lanka 3 Marble products India 3 Pine resins India 2 Rubber based sports goods India 1 Ghee from milk cream India 1 Diamond cutting tips India 1
Total 40 Source: Kelegama and Mukherji (2007).
In contrast to Indian FDI in Sri Lanka, Sri Lankan investments in India are very few reflecting the low volume of outbound FDI from Sri Lanka in general. However, since 1990s, investment from Sri Lanka to India has risen though the flows are small in value. Some successful ventures include outbound FDI in confectionary, apparel and furniture. In services, the most significant have been in banking and leisure sectors.
10 www.boi.lk 11 One firm that has invested in the Sri Lankan rubber goods sector is Ceat Pvt Ltd (Ceat), the Flagship Company of one India’s largest group of companies, RPG Enterprises.
27
7.2 Trade in Services
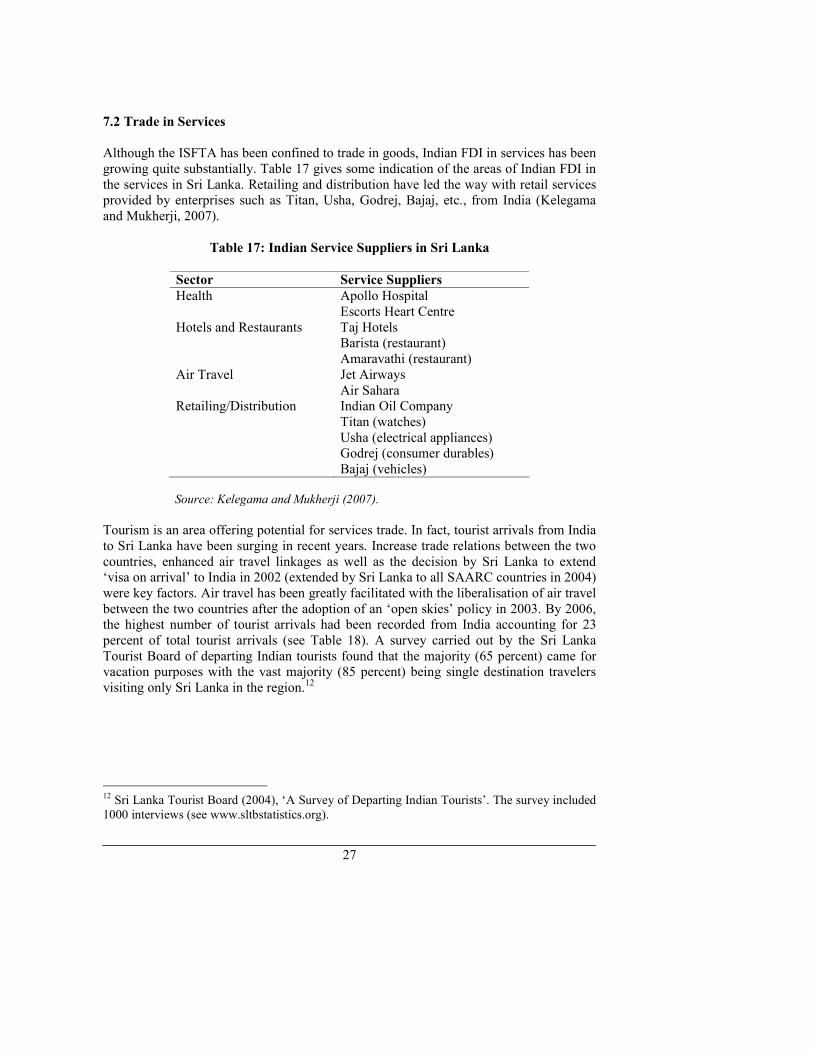
Although the ISFTA has been confined to trade in goods, Indian FDI in services has been growing quite substantially. Table 17 gives some indication of the areas of Indian FDI in the services in Sri Lanka. Retailing and distribution have led the way with retail services provided by enterprises such as Titan, Usha, Godrej, Bajaj, etc., from India (Kelegama and Mukherji, 2007).
Table 17: Indian Service Suppliers in Sri Lanka
Sector Service Suppliers
Health Apollo Hospital Escorts Heart Centre Hotels and Restaurants Taj Hotels Barista (restaurant) Amaravathi (restaurant) Air Travel Jet Airways Air Sahara Retailing/Distribution Indian Oil Company Titan (watches) Usha (electrical appliances) Godrej (consumer durables) Bajaj (vehicles) Source: Kelegama and Mukherji (2007).
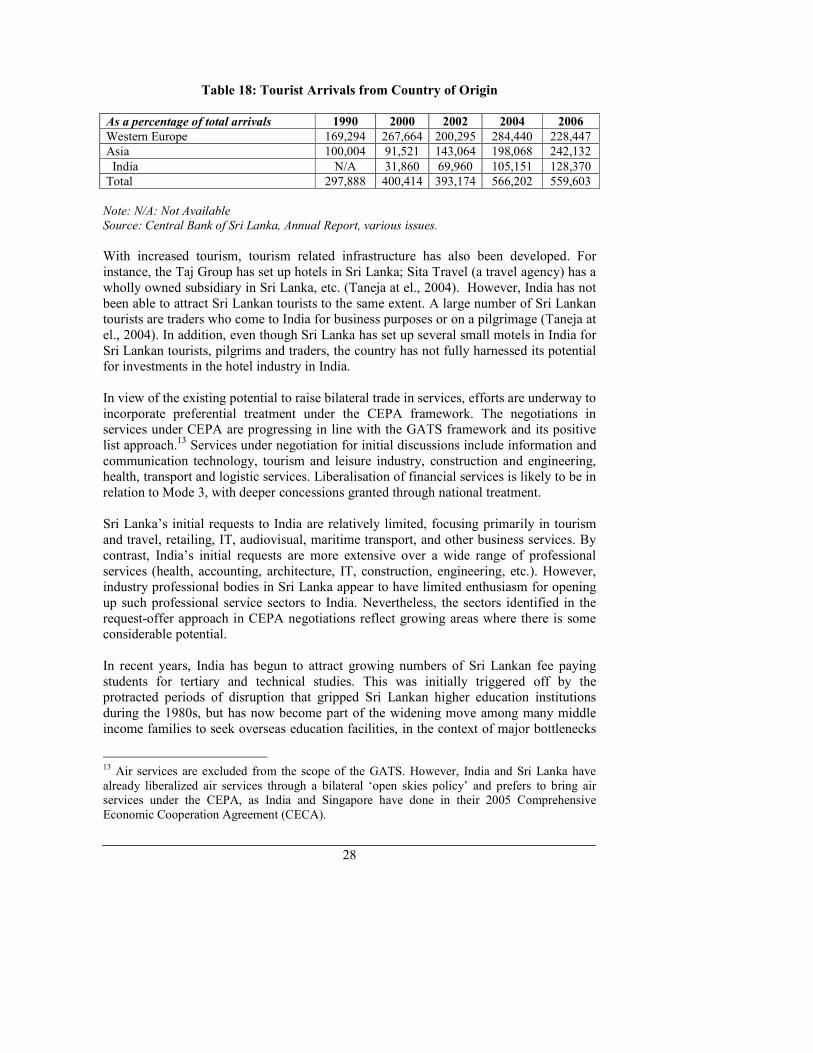
Tourism is an area offering potential for services trade. In fact, tourist arrivals from India to Sri Lanka have been surging in recent years. Increase trade relations between the two countries, enhanced air travel linkages as well as the decision by Sri Lanka to extend ‘visa on arrival’ to India in 2002 (extended by Sri Lanka to all SAARC countries in 2004) were key factors. Air travel has been greatly facilitated with the liberalisation of air travel between the two countries after the adoption of an ‘open skies’ policy in 2003. By 2006, the highest number of tourist arrivals had been recorded from India accounting for 23 percent of total tourist arrivals (see Table 18). A survey carried out by the Sri Lanka Tourist Board of departing Indian tourists found that the majority (65 percent) came for vacation purposes with the vast majority (85 percent) being single destination travelers visiting only Sri Lanka in the region.12
12 Sri Lanka Tourist Board (2004), ‘A Survey of Departing Indian Tourists’. The survey included 1000 interviews (see www.sltbstatistics.org).
28
Table 18: Tourist Arrivals from Country of Origin
As a percentage of total arrivals 1990 2000 2002 2004 2006
Western Europe 169,294 267,664 200,295 284,440 228,447
Asia 100,004 91,521 143,064 198,068 242,132
India N/A 31,860 69,960 105,151 128,370
Total 297,888 400,414 393,174 566,202 559,603
Note: N/A: Not Available
Source: Central Bank of Sri Lanka, Annual Report, various issues.
With increased tourism, tourism related infrastructure has also been developed. For instance, the Taj Group has set up hotels in Sri Lanka; Sita Travel (a travel agency) has a wholly owned subsidiary in Sri Lanka, etc. (Taneja at el., 2004). However, India has not been able to attract Sri Lankan tourists to the same extent. A large number of Sri Lankan tourists are traders who come to India for business purposes or on a pilgrimage (Taneja at el., 2004). In addition, even though Sri Lanka has set up several small motels in India for Sri Lankan tourists, pilgrims and traders, the country has not fully harnessed its potential for investments in the hotel industry in India. In view of the existing potential to raise bilateral trade in services, efforts are underway to incorporate preferential treatment under the CEPA framework. The negotiations in services under CEPA are progressing in line with the GATS framework and its positive list approach.
13 Services under negotiation for initial discussions include information and
communication technology, tourism and leisure industry, construction and engineering, health, transport and logistic services. Liberalisation of financial services is likely to be in relation to Mode 3, with deeper concessions granted through national treatment. Sri Lanka’s initial requests to India are relatively limited, focusing primarily in tourism and travel, retailing, IT, audiovisual, maritime transport, and other business services. By contrast, India’s initial requests are more extensive over a wide range of professional services (health, accounting, architecture, IT, construction, engineering, etc.). However, industry professional bodies in Sri Lanka appear to have limited enthusiasm for opening up such professional service sectors to India. Nevertheless, the sectors identified in the request-offer approach in CEPA negotiations reflect growing areas where there is some considerable potential. In recent years, India has begun to attract growing numbers of Sri Lankan fee paying students for tertiary and technical studies. This was initially triggered off by the protracted periods of disruption that gripped Sri Lankan higher education institutions during the 1980s, but has now become part of the widening move among many middle income families to seek overseas education facilities, in the context of major bottlenecks
13 Air services are excluded from the scope of the GATS. However, India and Sri Lanka have already liberalized air services through a bilateral ‘open skies policy’ and prefers to bring air services under the CEPA, as India and Singapore have done in their 2005 Comprehensive Economic Cooperation Agreement (CECA).
29
in the Sri Lankan higher education system. India offers a much cheaper, and hence affordable, alternative to developed countries such as UK, US and Australia. This has been also helped by India’s emergence as a major centre of information technology. Indian exports of such education services (though they are offered in situ at present) seem likely to have considerable further growth potential. This is also the case with provision of managerial and technical expertise in many areas, including IT and health services.
14 Such services trade will accompany higher levels of bilateral investment. Apart from provision of formal education services, India has also become an important destination for Sri Lanka for research and training in various disciplines. India has been extending various professional courses in financial management, textile engineering, railways, auditing and accounting, rural banking and plantation management, etc., (Taneja at el., 2004). Furthermore, in addition to government to government tie-ups in the field of training, there have also been several private sector initiatives such as training opportunities offered by Delhi-based Apollo and AIMs. Since 1995, 50 software development companies have begun operations in Sri Lanka. There is a significance Indian presence in the IT sector in Sri Lanka with, for example, Indian firms like Tata Infotech and Aptech India joining as technical collaboration partners to provide IT training in Sri Lanka. A Sri Lankan company (JKH) and an Indian business process outsourcing (BPO) firm (Raman Roy Associates) have recently announced plans to establish their first BPO investment in India. Indian presence in Sri Lanka’s telecommunication sector has also been expanding. For instance, Indian telecom companies such as Videsh Sanchar Nigam Limited (VSNL) and Bharat Sanchar Nigam Limited (BSNL) have already entered the Sri Lankan market. However, even though Indian companies have expressed their expansion plans in Sri Lanka, none of the Telecom companies in Sri Lanka have indicated an interest in entering the Indian market but has made extensive requests to India to open up some sub sectors of telecommunication services (Taneja at el., 2004). Trade in health services between India and Sri Lanka takes place through all four modes. India has become an important destination for medical tourism from Sri Lanka due to the shortage of provisions of tertiary healthcare services in Sri Lanka. Given growing demand and Sri Lanka’s dependence on Indian health care services, the Apollo Group set up a hospital in Sri Lanka and has also set up a nursing school in Sri Lanka. Nevertheless, there are conditions imposed on entry of doctors qualified abroad. India has requested Sri Lanka to undertake full commitment in market access and additional commitment in recognizing the qualifications of Indian health professionals on the basis of multilateral ‘request-offer approach’ in services trade. There is also scope for collaboration between India and Sri Lanka in the area of construction services such as project management, engineering and architectural consultancy and maintenance services, etc. Infrastructure development in Sri Lanka with
14 India has already entered the health services sector with the establishment of Apollo Hospitals.
30
private participation is an urgent priority where the demand for construction services, particularly in the areas of highways, bridges, railways, roads and housing is rapidly growing. Given the geographic proximity, growing demand and government-backed investment incentives, several Indian companies have already invested in building and civil constructions. For instance, Ansals and SMS Property Developers of India are key investors in the residential construction sector in Sri Lanka. Financial services sector is yet another area with a scope for further bilateral cooperation between India and Sri Lanka. Both countries have liberalised the sector very slowly with the state sector being the dominant entity. Currently, there are three Indian banks conducting banking operations in Sri Lanka offering most banking activities (except some such as credit card facilities), whereas only two Sri Lankan banks are operating in India with their services limited only to commercial operations and catering primarily to Sri Lankans.
8. Potential Welfare Gains from India-Sri Lanka Economic Integration
In view of the relative short notice afforded prior to the signing of the ISFTA framework agreement, there is almost no available literature that examined the potential for expansion in bilateral trade with the implementation of a FTA. Post implementation studies of the ISFTA have also not looked explicitly at related economy-wide or sector specific welfare gains. Much of the available literature has dealt with the depth of liberalisation under the ISFTA and analysis of post-implementation trade flows.
15
Even had such studies been attempted, the post-implementation experience is unlikely to have been captured. The rapid increase in trade, particularly in Sri Lanka’s exports to India, has originated in two specific commodities – copper wire and vegetable oil – where Sri Lanka has no obvious comparative advantage. Given the heavy import dependence of these two commodities, questions have also been raised about the true benefits accruing to the domestic economy, irrespective of the increased gross export earnings figures. Wickramasinghe (2006) has attempted to estimate domestic value addition (DVA) of Indian investment projects and finds an increasing trend over the years, which is confirmed again by the 2-year moving average line depicted in Figure 6.
15 See Kelegama (1999); Weerakoon (2001); Mukherji (2000); Wickramasinghe (2006); and Kelegama and Mukherji (2007).
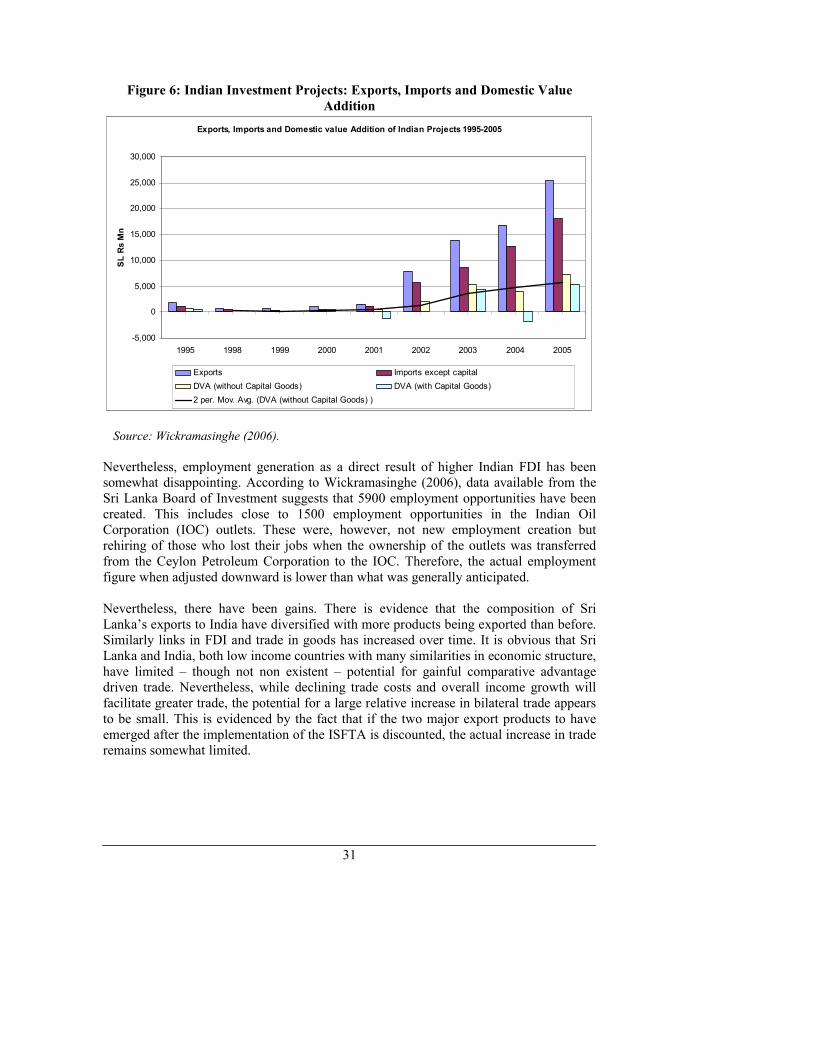
31
Figure 6: Indian Investment Projects: Exports, Imports and Domestic Value
Addition
Exports, Imports and Domestic value Addition of Indian Projects 1995-2005
-5,000
0
5,000
10,000
15,000
20,000
25,000
30,000
1995 1998 1999 2000 2001 2002 2003 2004 2005
SL Rs Mn
Exports Imports except capital
DVA (without Capital Goods) DVA (with Capital Goods)
2 per. Mov. Avg. (DVA (without Capital Goods) )
Source: Wickramasinghe (2006).
Nevertheless, employment generation as a direct result of higher Indian FDI has been somewhat disappointing. According to Wickramasinghe (2006), data available from the Sri Lanka Board of Investment suggests that 5900 employment opportunities have been created. This includes close to 1500 employment opportunities in the Indian Oil Corporation (IOC) outlets. These were, however, not new employment creation but rehiring of those who lost their jobs when the ownership of the outlets was transferred from the Ceylon Petroleum Corporation to the IOC. Therefore, the actual employment figure when adjusted downward is lower than what was generally anticipated.
Nevertheless, there have been gains. There is evidence that the composition of Sri Lanka’s exports to India have diversified with more products being exported than before. Similarly links in FDI and trade in goods has increased over time. It is obvious that Sri Lanka and India, both low income countries with many similarities in economic structure, have limited – though not non existent – potential for gainful comparative advantage driven trade. Nevertheless, while declining trade costs and overall income growth will facilitate greater trade, the potential for a large relative increase in bilateral trade appears to be small. This is evidenced by the fact that if the two major export products to have emerged after the implementation of the ISFTA is discounted, the actual increase in trade remains somewhat limited.
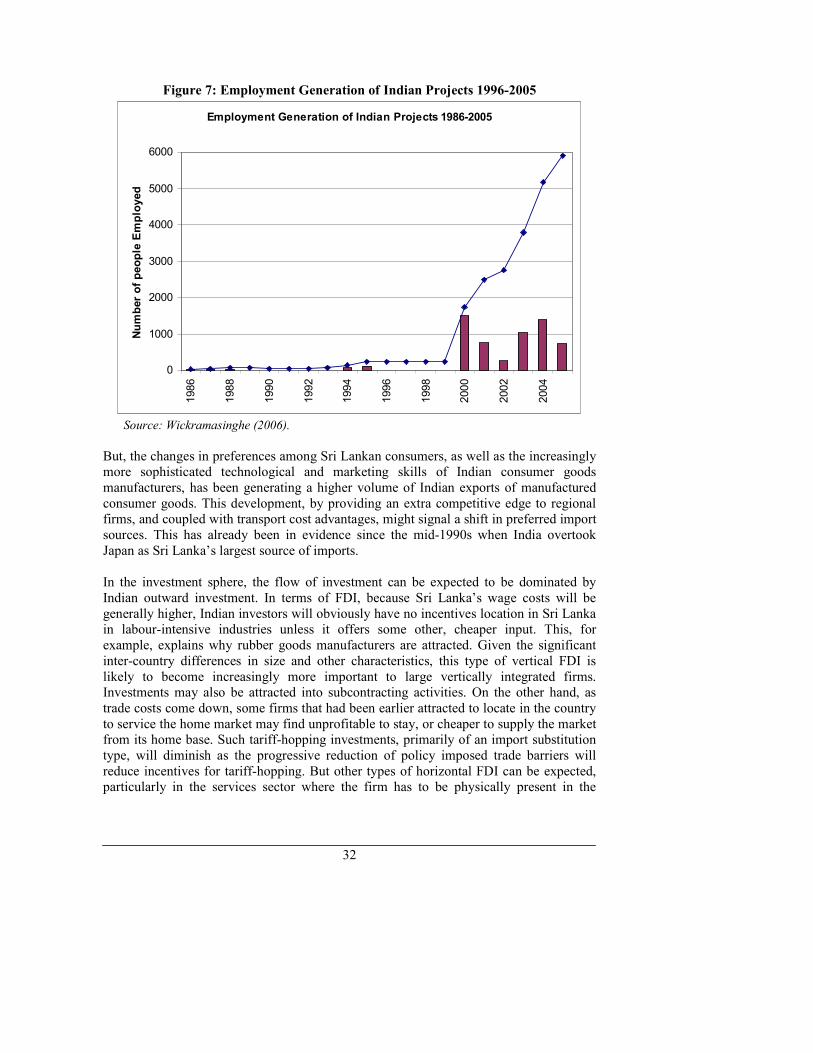
32
Figure 7: Employment Generation of Indian Projects 1996-2005
Employment Generation of Indian Projects 1986-2005
0
1000
2000
3000
4000
5000
6000
1986
1988
1990
1992
1994
1996
1998
2000
2002
2004
Number of people Employed
Source: Wickramasinghe (2006).
But, the changes in preferences among Sri Lankan consumers, as well as the increasingly more sophisticated technological and marketing skills of Indian consumer goods manufacturers, has been generating a higher volume of Indian exports of manufactured consumer goods. This development, by providing an extra competitive edge to regional firms, and coupled with transport cost advantages, might signal a shift in preferred import sources. This has already been in evidence since the mid-1990s when India overtook Japan as Sri Lanka’s largest source of imports. In the investment sphere, the flow of investment can be expected to be dominated by Indian outward investment. In terms of FDI, because Sri Lanka’s wage costs will be generally higher, Indian investors will obviously have no incentives location in Sri Lanka in labour-intensive industries unless it offers some other, cheaper input. This, for example, explains why rubber goods manufacturers are attracted. Given the significant inter-country differences in size and other characteristics, this type of vertical FDI is likely to become increasingly more important to large vertically integrated firms. Investments may also be attracted into subcontracting activities. On the other hand, as trade costs come down, some firms that had been earlier attracted to locate in the country to service the home market may find unprofitable to stay, or cheaper to supply the market from its home base. Such tariff-hopping investments, primarily of an import substitution type, will diminish as the progressive reduction of policy imposed trade barriers will reduce incentives for tariff-hopping. But other types of horizontal FDI can be expected, particularly in the services sector where the firm has to be physically present in the
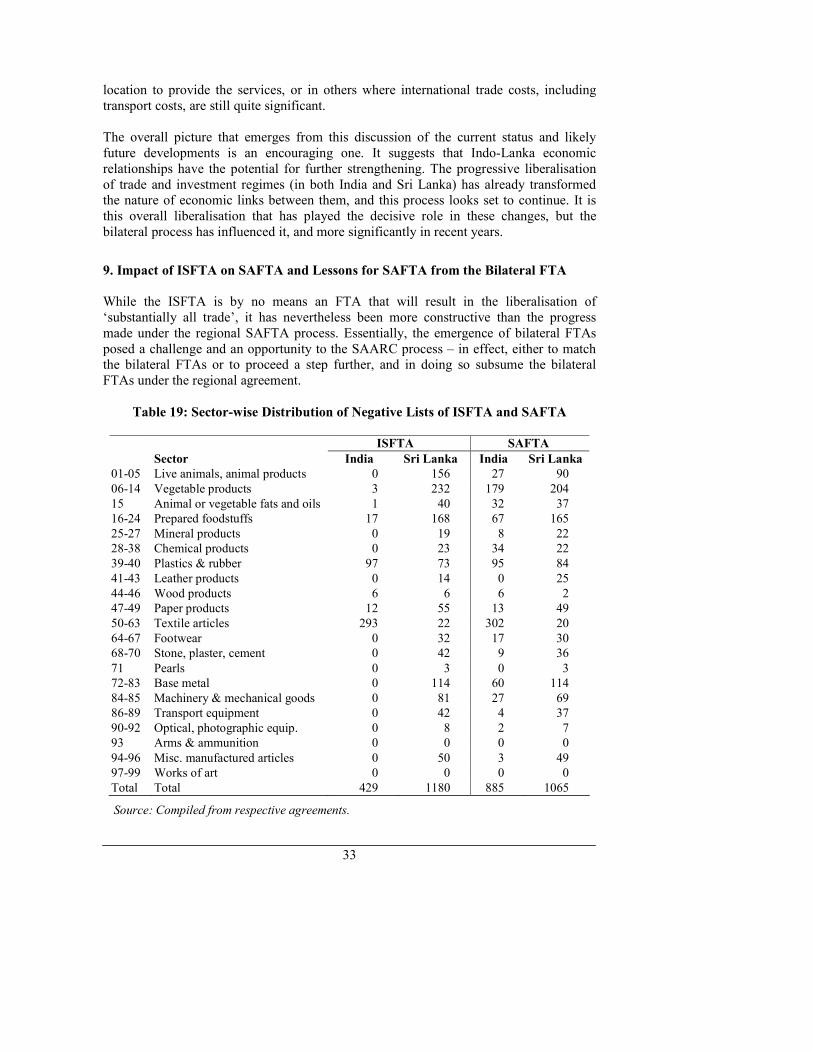
33
location to provide the services, or in others where international trade costs, including transport costs, are still quite significant. The overall picture that emerges from this discussion of the current status and likely future developments is an encouraging one. It suggests that Indo-Lanka economic relationships have the potential for further strengthening. The progressive liberalisation of trade and investment regimes (in both India and Sri Lanka) has already transformed the nature of economic links between them, and this process looks set to continue. It is this overall liberalisation that has played the decisive role in these changes, but the bilateral process has influenced it, and more significantly in recent years.
9. Impact of ISFTA on SAFTA and Lessons for SAFTA from the Bilateral FTA
While the ISFTA is by no means an FTA that will result in the liberalisation of ‘substantially all trade’, it has nevertheless been more constructive than the progress made under the regional SAFTA process. Essentially, the emergence of bilateral FTAs posed a challenge and an opportunity to the SAARC process – in effect, either to match the bilateral FTAs or to proceed a step further, and in doing so subsume the bilateral FTAs under the regional agreement.
Table 19: Sector-wise Distribution of Negative Lists of ISFTA and SAFTA
ISFTA SAFTA
Sector India Sri Lanka India Sri Lanka
01-05 Live animals, animal products 0 156 27 90
06-14 Vegetable products 3 232 179 204
15 Animal or vegetable fats and oils 1 40 32 37
16-24 Prepared foodstuffs 17 168 67 165
25-27 Mineral products 0 19 8 22
28-38 Chemical products 0 23 34 22
39-40 Plastics & rubber 97 73 95 84
41-43 Leather products 0 14 0 25
44-46 Wood products 6 6 6 2
47-49 Paper products 12 55 13 49
50-63 Textile articles 293 22 302 20
64-67 Footwear 0 32 17 30
68-70 Stone, plaster, cement 0 42 9 36
71 Pearls 0 3 0 3
72-83 Base metal 0 114 60 114
84-85 Machinery & mechanical goods 0 81 27 69
86-89 Transport equipment 0 42 4 37
90-92 Optical, photographic equip. 0 8 2 7
93 Arms & ammunition 0 0 0 0
94-96 Misc. manufactured articles 0 50 3 49
97-99 Works of art 0 0 0 0
Total Total 429 1180 885 1065
Source: Compiled from respective agreements.
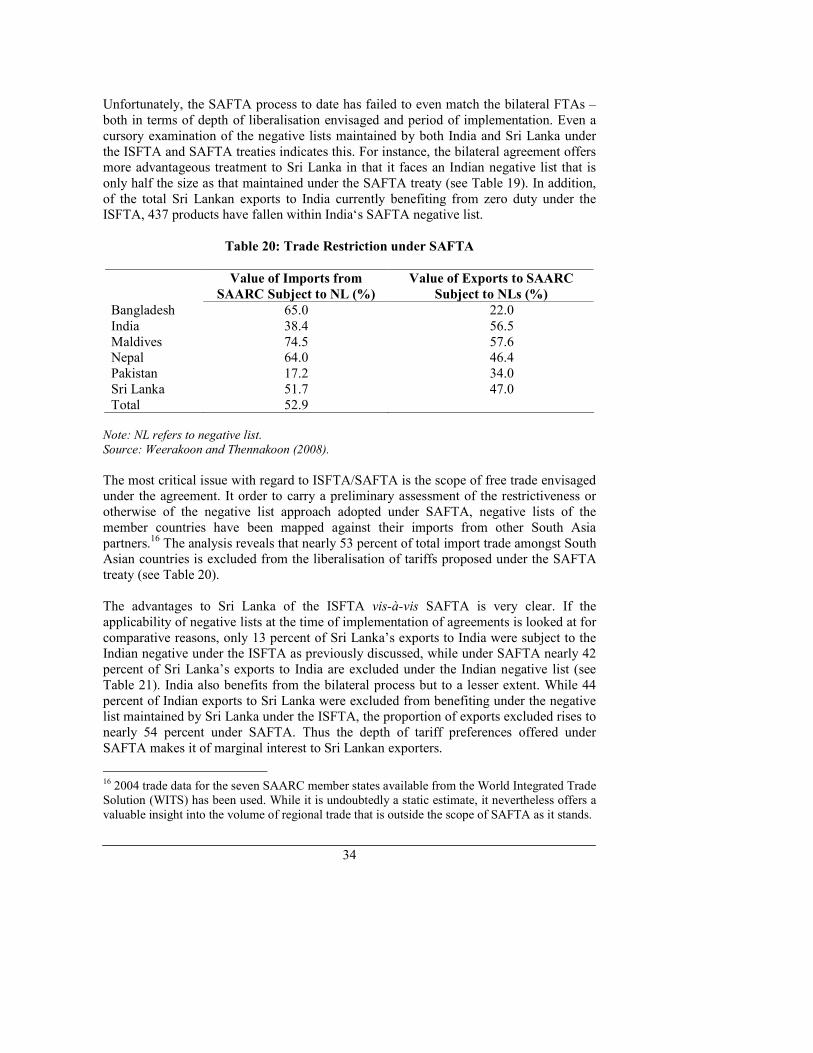
34
Unfortunately, the SAFTA process to date has failed to even match the bilateral FTAs – both in terms of depth of liberalisation envisaged and period of implementation. Even a cursory examination of the negative lists maintained by both India and Sri Lanka under the ISFTA and SAFTA treaties indicates this. For instance, the bilateral agreement offers more advantageous treatment to Sri Lanka in that it faces an Indian negative list that is only half the size as that maintained under the SAFTA treaty (see Table 19). In addition, of the total Sri Lankan exports to India currently benefiting from zero duty under the ISFTA, 437 products have fallen within India‘s SAFTA negative list.
Table 20: Trade Restriction under SAFTA
Value of Imports from
SAARC Subject to NL (%)
Value of Exports to SAARC
Subject to NLs (%)
Bangladesh 65.0 22.0
India 38.4 56.5 Maldives 74.5 57.6 Nepal 64.0 46.4 Pakistan 17.2 34.0 Sri Lanka 51.7 47.0 Total 52.9 Note: NL refers to negative list.
Source: Weerakoon and Thennakoon (2008).
The most critical issue with regard to ISFTA/SAFTA is the scope of free trade envisaged under the agreement. It order to carry a preliminary assessment of the restrictiveness or otherwise of the negative list approach adopted under SAFTA, negative lists of the member countries have been mapped against their imports from other South Asia partners.
16 The analysis reveals that nearly 53 percent of total import trade amongst South
Asian countries is excluded from the liberalisation of tariffs proposed under the SAFTA treaty (see Table 20).
The advantages to Sri Lanka of the ISFTA vis-à-vis SAFTA is very clear. If the applicability of negative lists at the time of implementation of agreements is looked at for comparative reasons, only 13 percent of Sri Lanka’s exports to India were subject to the Indian negative under the ISFTA as previously discussed, while under SAFTA nearly 42 percent of Sri Lanka’s exports to India are excluded under the Indian negative list (see Table 21). India also benefits from the bilateral process but to a lesser extent. While 44 percent of Indian exports to Sri Lanka were excluded from benefiting under the negative list maintained by Sri Lanka under the ISFTA, the proportion of exports excluded rises to nearly 54 percent under SAFTA. Thus the depth of tariff preferences offered under SAFTA makes it of marginal interest to Sri Lankan exporters.
16 2004 trade data for the seven SAARC member states available from the World Integrated Trade Solution (WITS) has been used. While it is undoubtedly a static estimate, it nevertheless offers a valuable insight into the volume of regional trade that is outside the scope of SAFTA as it stands.
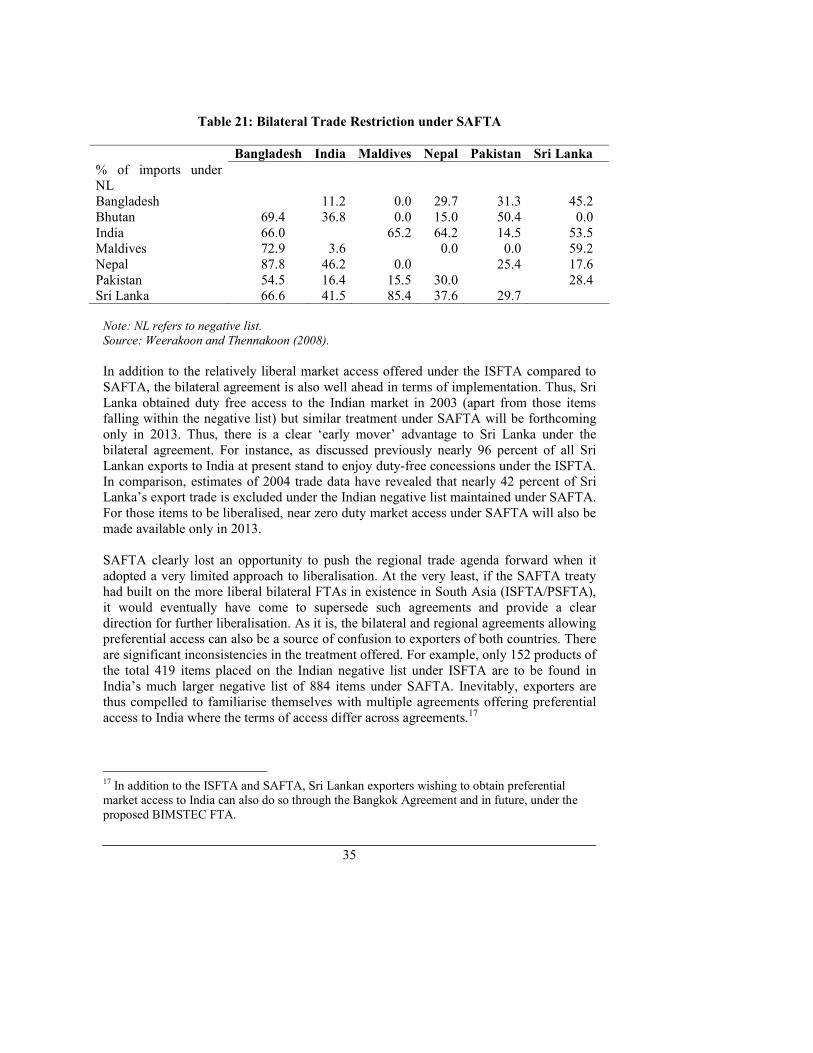
35
Table 21: Bilateral Trade Restriction under SAFTA
Bangladesh India Maldives Nepal Pakistan Sri Lanka
% of imports under NL
Bangladesh 11.2 0.0 29.7 31.3 45.2 Bhutan 69.4 36.8 0.0 15.0 50.4 0.0 India 66.0 65.2 64.2 14.5 53.5 Maldives 72.9 3.6 0.0 0.0 59.2 Nepal 87.8 46.2 0.0 25.4 17.6 Pakistan 54.5 16.4 15.5 30.0 28.4 Sri Lanka 66.6 41.5 85.4 37.6 29.7 Note: NL refers to negative list.
Source: Weerakoon and Thennakoon (2008).
In addition to the relatively liberal market access offered under the ISFTA compared to SAFTA, the bilateral agreement is also well ahead in terms of implementation. Thus, Sri Lanka obtained duty free access to the Indian market in 2003 (apart from those items falling within the negative list) but similar treatment under SAFTA will be forthcoming only in 2013. Thus, there is a clear ‘early mover’ advantage to Sri Lanka under the bilateral agreement. For instance, as discussed previously nearly 96 percent of all Sri Lankan exports to India at present stand to enjoy duty-free concessions under the ISFTA. In comparison, estimates of 2004 trade data have revealed that nearly 42 percent of Sri Lanka’s export trade is excluded under the Indian negative list maintained under SAFTA. For those items to be liberalised, near zero duty market access under SAFTA will also be made available only in 2013. SAFTA clearly lost an opportunity to push the regional trade agenda forward when it adopted a very limited approach to liberalisation. At the very least, if the SAFTA treaty had built on the more liberal bilateral FTAs in existence in South Asia (ISFTA/PSFTA), it would eventually have come to supersede such agreements and provide a clear direction for further liberalisation. As it is, the bilateral and regional agreements allowing preferential access can also be a source of confusion to exporters of both countries. There are significant inconsistencies in the treatment offered. For example, only 152 products of the total 419 items placed on the Indian negative list under ISFTA are to be found in India’s much larger negative list of 884 items under SAFTA. Inevitably, exporters are thus compelled to familiarise themselves with multiple agreements offering preferential access to India where the terms of access differ across agreements.17
17 In addition to the ISFTA and SAFTA, Sri Lankan exporters wishing to obtain preferential market access to India can also do so through the Bangkok Agreement and in future, under the proposed BIMSTEC FTA.
36
Besides the alternative bilateral FTAs, other strategic trade policy initiatives in the region are also likely to hold implications for the future of SAFTA. India’s ‘Look East’ policy has prompted engaging trade and investment links through bilateral and regional initiatives with economies of East Asia (Grare and Mattoo, 2001). India and ASEAN are currently negotiating an FTA that is likely to be implemented from 2007, complemented by a Comprehensive Economic Cooperation Agreement (CECA) signed with Singapore in 2005. Additionally, negotiations are underway towards comprehensive economic cooperation arrangements with South Korea and Japan, as well as initial explorations of a similar agreement with China. India has, in fact, articulated a vision of an Asian Economic Community and sees its growing engagement with East Asian countries as building blocs towards such an eventual outcome. Some of the smaller South Asian partners in SAFTA – Sri Lanka, Nepal and Bhutan – are more advantageously placed than other member states to benefit from India’s closer economic integration with East Asia. All three countries have obtained relatively favourable access to the Indian market through bilateral arrangements. Further arrangements in the pipelines will also grant Bangladesh opportunities to further its access to the Indian market. These include arrangements such as the proposed transition of the Bangkok Agreement to an FTA under the Asia Pacific Trade Agreement (APTA) and the implementation of an FTA under the Bay of Bengal Initiative for Multi-Sectoral Technical and Economic Cooperation (BIMSTEC). APTA includes India, Sri Lanka and Bangladesh, while BIMSTEC includes all SAFTA members with the exception of the Maldives and Pakistan. The entry of China into APTA can give it fresh momentum, while BIMSTEC – devoid of many of the political tensions that have dogged SAFTA – has already progressed at a much faster pace than the SAFTA negotiations. BIMSTEC is scheduled to begin implementation of an FTA in 2007 where the framework agreement includes provision for fast-track liberalization as well as for the inclusion of services and investment negotiations. The net result of these alternative bilateral and regional agreements in South Asia – with India playing a pivotal role – may eventually becoming something approximating free trade within the region, although excluding the integration of the two key economies in South Asia – i.e., India and Pakistan. The implementation of SAFTA has already run into problems with Pakistan insisting that the SAFTA treaty is subject to the positive list of goods that India is permitted to export to Pakistan. Such conflicts can derail the SAFTA process and hence eventually the possibilities of regional integration under the SAARC process. Unfortunately, SAFTA has legged well behind the bilateral initiatives and in the process left mixed signals as to the future of economic cooperation in South Asia. For the present, in the current environment where prospects for achieving meaningful liberalisation under a South Asian regional initiative looks bleak, the bilateral process obviously has much more to offer and looks set to be pursued in the longer-term. However, the possibilities of substantially strengthening SAFTA should not be overlooked. It can still play a useful role in achieving the political and economic goals that were intended to be achieved through regional economic integration in South Asia. The SAFTA framework agreement is an improvement on the ISFTA in two key areas.
37
First, SAFTA placed a ceiling on the size of the negative list that each country could maintain – a feature that was clearly absent in the ISFTA. Where the SAFTA framework agreement failed was in not insisting on a binding requirement of the member countries thereafter to undertake to progressively prune the size of the initial negative list. The only provision that the SAFTA treaty has made is for a ‘review’ of the negative list at least every four years “with a view to reducing the number of items”. The underlying intention may be to prune it – but the provision is very vague and has no teeth to require any movement from the current position of member countries. Given that SAFTA has left the issue of negative lists fairly open ended – where even four years is also a fairly long time horizon to wait to see any improvement in the agreement – there is always the danger that the agreement will fall short of free trade even in the long term. The second area of improvement in SAFTA vis-à-vis the ISFTA was in the provision of a clear dispute settlement mechanism (DSM) with procedures laid down in terms of implementation. In the absence of such a formal procedure in the ISFTA, disputes such as that over Vanaspathi can become protracted and delay the process of further liberalization. If the SAFTA process is to contribute towards strengthening trade and investment linkages in South Asia, the policy options needed are clear: (i) to introduce a binding commitment in the framework agreement to prune the negative lists over time; (ii) to shorten the period of implementation of the tariff liberalisation process; and (iii) to direct attention to eliminate/reduce non-tariff barriers that impede trade within the region. These should be incorporated alongside efforts already underway to include investment and services into the framework agreement at the earliest.
10. Conclusion
Bilateral trade between India and Sri Lanka has been growing rapidly since the 1990s largely as a result of unilateral liberalisation efforts undertaken by two countries. Trade flows have further accelerated since early 2000 with the implementation of a bilateral FTA. Although efforts to foster economic linkages through the SAARC process got underway from the late 1990s with the implementation of SAPTA, the implementation process remained less effective and slow moving due to the lack of commitment among the member countries. With the poor performance of regional efforts in economic integration, India and Sri Lanka, therefore, embarked on an alternative course to strengthen bilateral economic ties, facilitated by a significant improvement in political relations between the two countries from the late 1990s. The key factor behind India’s pursuit of an FTA with Sri Lanka was to further expand its import penetration in to the country. Sri Lanka on the other hand, viewed an FTA with India as a means of broadening its industrial base by taking advantage of the ‘first mover’ access to the large and growing Indian market. Given the existing economies of scale disparities between the two countries, the ISFTA offered Sri Lanka asymmetric treatment, particularly in terms of the size of the negative list it was permitted to maintain and in terms of the period of
38
implementation. As such, despite some objections from domestic interest groups in both countries, the ISFTA was signed in 1998 and came into effect in 2000 with the primary objectives of broadening domestic markets and enhancing bilateral trade by employing important instruments such as significant tariff reductions and more moderate RoO as compared to SAPTA. The operationalisation of the ISFTA in 2000 was an important step taken by the two countries to harness the economic complementarities between them. As expected, post-ISFTA bilateral trade performance between India and Sri Lanka indicates that exports and imports have grown considerably, accompanied by significant product diversification. Despite the fact that the ISFTA was confined to trade in goods, increases in trade links between India and Sri Lanka have been further triggered by large investment flows as well as services integration between two countries over time. Nevertheless, investment flows have been mostly one sided as would be expected – flowing from India to Sri Lanka – where the bulk of Indian investment in manufacturing in the post-ISFTA phase has come from Indian investors keen to take advantage of preferential duty access to the Indian market in key sectors such as Vanaspathi and copper. Nevertheless, the potential for greater linkages in investment and services has been fairly obvious based on recent performance, and in part has encouraged both countries to further deepen integration in these areas under the CEPA framework. It is evident from detailed analysis of post-ISFTA trade flows that Sri Lanka’s exports to India have expanded significantly. However, it is also clear that the overwhelming share of the increase has originated in a few commodities, raising concerns about the sustainability of the growth momentum in the long term. The bulk of the exports have been concentrated in two items, namely the vegetable fats and oils and copper and articles of copper, which are not considered to be sustainable in the long run. Sri Lanka has no clear comparative advantage in the two products – Vanaspathi and copper – that have been driving export expansion, where the majority of raw materials and inputs are imported from third countries (some times leading to manufacturers flouting rules of origin requirements as well). Furthermore, Sri Lanka is yet to experience the full impact of opening up of its economy to the large and dynamic Indian market. It is expected that India will significantly improve its export presence in Sri Lanka after the full implementation of ISFTA in 2008. Though the ISFTA has resulted in a substantial increase in trade between India and Sri Lanka, the agreements remains fairly restrictive given the size of the negative lists being maintained, particularly by Sri Lanka. While efforts are underway to prune the negative lists under the on-going CEPA negotiations, the extent of pruning is likely to remain limited given the understandable concerns regarding the impact on key sensitive sectors such as agriculture. Sri Lanka in particular is unlikely to push for further liberalisation in view of the fact that it is yet to fully experience the implementation of terms already agreed upon until 2008. However, the ISFTA has been more constructive and progressive relative to the regional SAFTA agreement. The SAFTA agreement is found to be significant more restrictive in
39
terms of the negative lists being maintained. For Sri Lanka in particular, SAFTA offers much less favorable access to the Indian market, both in terms of the depth of liberalisation and the period of implementation. Looking at the respective negative lists, it is evident that the ISFTA offered both countries relatively more liberal market access at the time of negotiation than that agreed under SAFTA. Both India and Sri Lanka have benefited from the ISFTA to take an early mover advantage and strengthen trade and economic linkages between the two countries. A similar process is underway between Pakistan and Sri Lanka under the respective bilateral FTA currently in force (in addition to preferential access granted by India to Nepal and Bhutan bilaterally). Given these developments, SAFTA also has the potential to build on existing economic integration links in the region. However, in order to ensure that SAFTA remains relevant and a potential force to generate such integration, it has to be strengthened significantly in key areas. These include implementation of the terms negotiated and agreed upon as a start, thereafter focusing attention on reducing the size of negative lists maintained by member countries and addressing concerns with regard to NTBs that act to constrain trade flows. Finally, the time frame for implementation of SAFTA can be brought forward to ensure that it complements, and perhaps over time supersedes the bilateral trade agreements currently operating in the South Asian region.
40
References
Central Bank of Sri Lanka, (2005). Annual Report. Grarer, F., and A. Mattoo, eds., (2001). India and ASEAN: The Politics of India’s Look
East Policy, New Delhi: Manohar Publishers.
International Monetary Fund (IMF), Various Issues, “Direction of Trade Statistics”, IMF
Jayasuriya, S., and D. Weerakoon, (2001). “India-Sri Lanka Trade and Investment Links” in P. Shome (ed.), India and Economic Cooperation in South Asia, Indian Council for Research on International Economic Relations, New Delhi. Jayawardena, L., L. Ali and L. Hulugalle, (1993). “Indo-Sri Lanka Economic Cooperation: Facilitating Trade Expansion through a Reciprocal Preference Scheme”, Study Group Series No. 9, UNU/WIDER.
Kelegama, S., and I.N. Mukherji, (2007). “India-Sri Lanka Bilateral Free Trade Agreement: Six Years Performance and Beyond”, RIS Discussion Paper No. 119, RIS, New Delhi.
Kelegama, S., (1999). “Indo-Sri Lanka Trade and Bilateral Free Trade Agreement: A Sri Lankan Perspective”, Asia-Pacific Development Journal, Vol. 6, No. 2.
Kodikara, S., (1965)., Indo-Ceylon Relations since Independence, The Ceylon Institute of World Affairs, Colombo Apothecaries Co.
Mukherji, I.N., (2000). “Indo-Sri Lanka Trade and Investment Linkages: With Special Reference to SAPTA and Free Trade Agreement”, South Asia Economic Journal, vol. 1, no. 1, March 2000.
Panchamukhi, V.R., V.L. Rao and N. Kumar, (1993). “Indo-Sri Lanka Economic Cooperation: An Operational Programme”, Research and Information System for the Non-Aligned and Other Developing Countries, New Delhi.
Sarvananthan, M. (1999). “ An Assessment of Technical and Physical Contraband Trade between India and Sri Lanka”, Unpublished PhD Thesis, University of Wales.
Taneja, N. , A. Mukherjee, S. Jayanetti and T. Jayawardane, (2004)., “Indo-Sri Lanka Trade in Services: FTA II and Beyond”, Working paper No 145, Indian Council for Research on International Economic Relations
Wanigaratne, R.A.M.C., (1991). “Indo-Sri Lanka Economic Cooperation” in Kodikara, S. (ed.) Dilemmas of Indo-Sri Lanka Relations, Bandaranaike Centre for International Studies, Colombo.
41
Weerakoon, D., and J. Thennakoon, (2008)., “SAFTA: Which Way Forward?” Journal of
South Asian Development, Vol. 3, No. 1 (forthcoming).
Weerakoon, D. (2001). Indo-Sri Lanka Free trade agreement; How free is it?, Economic and Political Weekly, February 24, 2001
Weerakoon, D., and J. Wijayasiri, (2001). “Regional Economic Cooperation in South Asia: A Sri Lankan Perspective’, International Economic Series No. 6, Institute of Policy Studies, Colombo.
Wickremasinghe, U., (2006). “Indo-Lanka Free Trade Agreement: A Survey of Progress and Lessons for the Future”, paper presented at the Roundtable on Regional Integration, 24 November 2006, Colombo, Sri Lanka.
World Bank, (2004). Trade Policies in South Asia, World Bank, Washington: DC.
Web Site of Board of Investment of Sri Lanka (www.boi.lk )
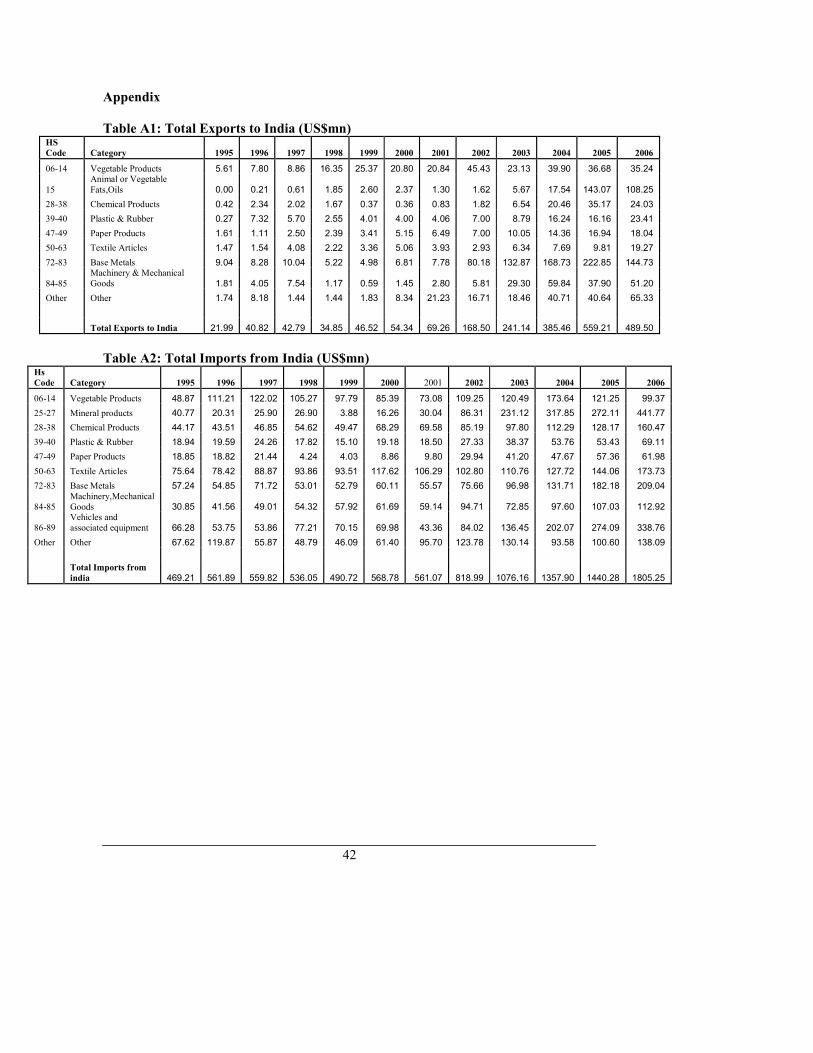
42
Appendix
Table A1: Total Exports to India (US$mn) HS
Code Category 1995 1996 1997 1998 1999 2000 2001 2002 2003 2004 2005 2006
06-14 Vegetable Products 5.61 7.80 8.86 16.35 25.37 20.80 20.84 45.43 23.13 39.90 36.68 35.24
15
Animal or Vegetable
Fats,Oils 0.00 0.21 0.61 1.85 2.60 2.37 1.30 1.62 5.67 17.54 143.07 108.25
28-38 Chemical Products 0.42 2.34 2.02 1.67 0.37 0.36 0.83 1.82 6.54 20.46 35.17 24.03
39-40 Plastic & Rubber 0.27 7.32 5.70 2.55 4.01 4.00 4.06 7.00 8.79 16.24 16.16 23.41
47-49 Paper Products 1.61 1.11 2.50 2.39 3.41 5.15 6.49 7.00 10.05 14.36 16.94 18.04
50-63 Textile Articles 1.47 1.54 4.08 2.22 3.36 5.06 3.93 2.93 6.34 7.69 9.81 19.27
72-83 Base Metals 9.04 8.28 10.04 5.22 4.98 6.81 7.78 80.18 132.87 168.73 222.85 144.73
84-85
Machinery & Mechanical Goods 1.81 4.05 7.54 1.17 0.59 1.45 2.80 5.81 29.30 59.84 37.90 51.20
Other Other 1.74 8.18 1.44 1.44 1.83 8.34 21.23 16.71 18.46 40.71 40.64 65.33
Total Exports to India 21.99 40.82 42.79 34.85 46.52 54.34 69.26 168.50 241.14 385.46 559.21 489.50
Table A2: Total Imports from India (US$mn) Hs
Code Category 1995 1996 1997 1998 1999 2000 2001 2002 2003 2004 2005 2006
06-14 Vegetable Products 48.87 111.21 122.02 105.27 97.79 85.39 73.08 109.25 120.49 173.64 121.25 99.37
25-27 Mineral products 40.77 20.31 25.90 26.90 3.88 16.26 30.04 86.31 231.12 317.85 272.11 441.77
28-38 Chemical Products 44.17 43.51 46.85 54.62 49.47 68.29 69.58 85.19 97.80 112.29 128.17 160.47
39-40 Plastic & Rubber 18.94 19.59 24.26 17.82 15.10 19.18 18.50 27.33 38.37 53.76 53.43 69.11
47-49 Paper Products 18.85 18.82 21.44 4.24 4.03 8.86 9.80 29.94 41.20 47.67 57.36 61.98
50-63 Textile Articles 75.64 78.42 88.87 93.86 93.51 117.62 106.29 102.80 110.76 127.72 144.06 173.73
72-83 Base Metals 57.24 54.85 71.72 53.01 52.79 60.11 55.57 75.66 96.98 131.71 182.18 209.04
84-85 Machinery,Mechanical Goods 30.85 41.56 49.01 54.32 57.92 61.69 59.14 94.71 72.85 97.60 107.03 112.92
86-89 Vehicles and associated equipment 66.28 53.75 53.86 77.21 70.15 69.98 43.36 84.02 136.45 202.07 274.09 338.76
Other Other 67.62 119.87 55.87 48.79 46.09 61.40 95.70 123.78 130.14 93.58 100.60 138.09
Total Imports from
india 469.21 561.89 559.82 536.05 490.72 568.78 561.07 818.99 1076.16 1357.90 1440.28 1805.25