Embed Size (px)
Citation preview
ARTICLE SERIES: Imaging Commentary 3621
IntroductionThe plasma membrane is the barrier that all molecules must crossto enter or exit the cell, and a large number of biological processesoccur at or near the plasma membrane. These processes aredifficult to image with traditional epifluorescence or confocalmicroscopy techniques, because details near the cell surface areeasily obscured by fluorescence that originates from the bulk ofthe cell. Total internal reflection fluorescence (TIRF) microscopy– also known as evanescent wave or evanescent field microscopy– provides a means to selectively excite fluorophores near theadherent cell surface while minimizing fluorescence fromintracellular regions. This serves to reduce cellular photodamageand increase the signal-to-noise ratio. TIRF primarily illuminatesonly fluorophores very close (e.g. within 100 nm) to the cover-slip–sample interface. The background fluorescence is minimizedbecause the excitation of fluorophores further away from thecover slip is reduced. The plasma membrane of an adherent celllies well within the region of excitation, allowing imaging ofprocesses occurring at or near the membrane. On the basis ofthese unique features, TIRF has been employed to addressnumerous questions in cell biology.
This Commentary details key issues for researchers who areusing, or are considering using, TIRF for live cell imaging. Webegin with a brief selection of specific areas of cell biologicalresearch in which the use of TIRF imaging has made a majorimpact. Subsequently, we describe the physical basis of TIRF, anddiscuss key issues to consider when setting up and employingTIRF. Finally, we identify several potential pitfalls and providehelpful suggestions. A basic knowledge of fluorescence microscopyis assumed. For general background on fluorescence microscopy,we refer readers to North (North, 2006) and Waters (Waters, 2009)For reviews containing an extensive treatment of TIRF theory andadvanced applications, we refer readers to Axelrod (Axelrod, 2003;Axelrod, 2008).
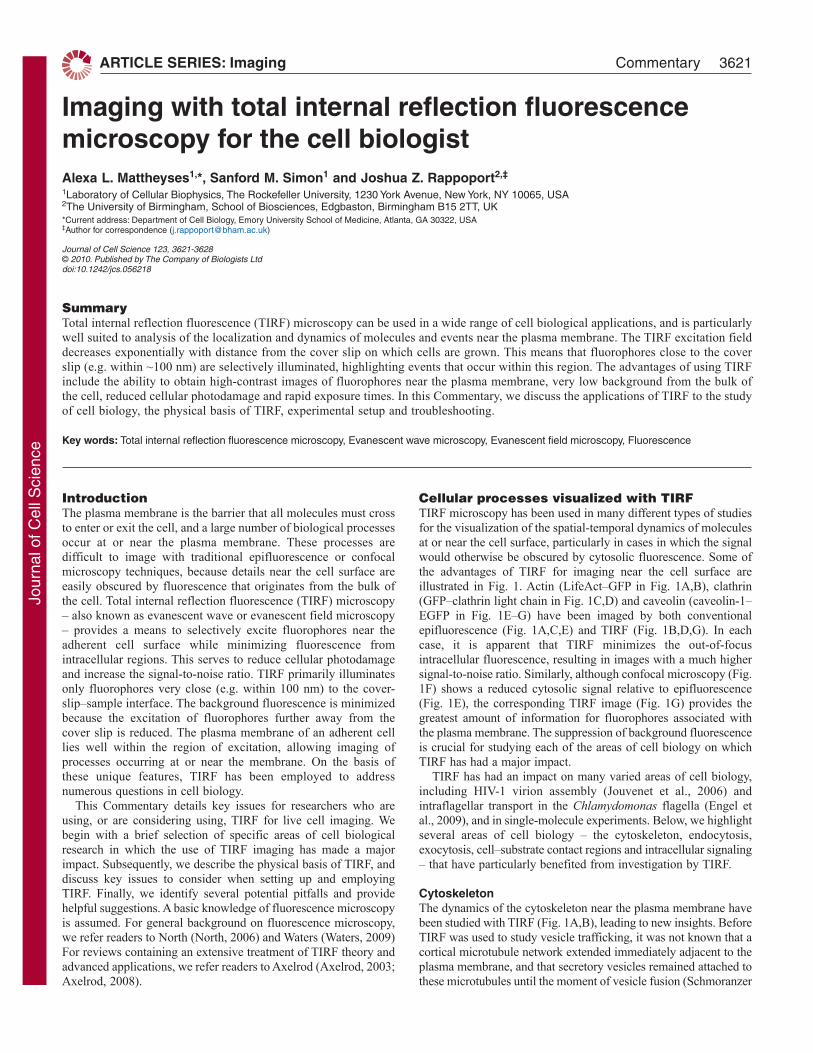
Cellular processes visualized with TIRFTIRF microscopy has been used in many different types of studiesfor the visualization of the spatial-temporal dynamics of moleculesat or near the cell surface, particularly in cases in which the signalwould otherwise be obscured by cytosolic fluorescence. Some ofthe advantages of TIRF for imaging near the cell surface areillustrated in Fig. 1. Actin (LifeAct–GFP in Fig. 1A,B), clathrin(GFP–clathrin light chain in Fig. 1C,D) and caveolin (caveolin-1–EGFP in Fig. 1E–G) have been imaged by both conventionalepifluorescence (Fig. 1A,C,E) and TIRF (Fig. 1B,D,G). In eachcase, it is apparent that TIRF minimizes the out-of-focusintracellular fluorescence, resulting in images with a much highersignal-to-noise ratio. Similarly, although confocal microscopy (Fig.1F) shows a reduced cytosolic signal relative to epifluorescence(Fig. 1E), the corresponding TIRF image (Fig. 1G) provides thegreatest amount of information for fluorophores associated withthe plasma membrane. The suppression of background fluorescenceis crucial for studying each of the areas of cell biology on whichTIRF has had a major impact.
TIRF has had an impact on many varied areas of cell biology,including HIV-1 virion assembly (Jouvenet et al., 2006) andintraflagellar transport in the Chlamydomonas flagella (Engel etal., 2009), and in single-molecule experiments. Below, we highlightseveral areas of cell biology – the cytoskeleton, endocytosis,exocytosis, cell–substrate contact regions and intracellular signaling– that have particularly benefited from investigation by TIRF.
CytoskeletonThe dynamics of the cytoskeleton near the plasma membrane havebeen studied with TIRF (Fig. 1A,B), leading to new insights. BeforeTIRF was used to study vesicle trafficking, it was not known that acortical microtubule network extended immediately adjacent to theplasma membrane, and that secretory vesicles remained attached tothese microtubules until the moment of vesicle fusion (Schmoranzer
SummaryTotal internal reflection fluorescence (TIRF) microscopy can be used in a wide range of cell biological applications, and is particularlywell suited to analysis of the localization and dynamics of molecules and events near the plasma membrane. The TIRF excitation fielddecreases exponentially with distance from the cover slip on which cells are grown. This means that fluorophores close to the coverslip (e.g. within ~100 nm) are selectively illuminated, highlighting events that occur within this region. The advantages of using TIRFinclude the ability to obtain high-contrast images of fluorophores near the plasma membrane, very low background from the bulk ofthe cell, reduced cellular photodamage and rapid exposure times. In this Commentary, we discuss the applications of TIRF to the studyof cell biology, the physical basis of TIRF, experimental setup and troubleshooting.
Key words: Total internal reflection fluorescence microscopy, Evanescent wave microscopy, Evanescent field microscopy, Fluorescence
Imaging with total internal reflection fluorescencemicroscopy for the cell biologistAlexa L. Mattheyses1,*, Sanford M. Simon1 and Joshua Z. Rappoport2,‡
1Laboratory of Cellular Biophysics, The Rockefeller University, 1230 York Avenue, New York, NY 10065, USA2The University of Birmingham, School of Biosciences, Edgbaston, Birmingham B15 2TT, UK*Current address: Department of Cell Biology, Emory University School of Medicine, Atlanta, GA 30322, USA‡Author for correspondence ([email protected])
Journal of Cell Science 123, 3621-3628 © 2010. Published by The Company of Biologists Ltddoi:10.1242/jcs.056218
Jour
nal o
f Cel
l Sci
ence
and Simon, 2003). This finding was made possible, in part, by thespatial restriction and high signal-to-noise ratio of the excitationfield, as well as by the rapid acquisition rates that are possible whenusing wide-field acquisition. Furthermore, the increased excitationof fluorophores near the cover slip permitted the quantification ofmicrotubule motility in the axial direction, revealing howmicrotubules are targeted to focal adhesions (Krylyshkina et al.,2003). TIRF also provided the spatial and temporal resolution tostudy the dynamics of actin and actin-associated proteins near theplasma membrane in several endocytosis studies (Kaksonen et al.,2005; Merrifield et al., 2002). Finally, fluorescence specklemicroscopy, in which a limiting amount of cytoskeleton monomersare fluorescently labeled, combined with TIRF was able to deliverimportant information about the dynamics and flow of cytoskeletonfilaments (Danuser and Waterman-Storer, 2006).
EndocytosisThe formation of endocytic vesicles involves the recruitment ofcytosolic proteins to the adherent plasma membrane. When viewedwith standard epifluorescence, the surface patches of the vesicle coatprotein clathrin are difficult to discern from background fluorescenceand intracellular clathrin structures (Fig. 1C). The initial report toimage clathrin during endocytosis in live cells employedepifluorescence and was thus restricted to analyzing only thoseevents that occurred in the cell periphery, because of out-of-focussignals (Gaidarov et al., 1999). By contrast, when TIRF is used, theclathrin patches on or near the membrane appear as distinct features(Fig. 1D). Imaging the dynamics of endocytosis is aided by rapidimage acquisition, background elimination and the exponentialdecrease in excitation intensity with distance from the cover slip.TIRF has made it possible to gain insight into the components thatare necessary for vesicle formation and the dynamics of this process(Rappoport, 2008). A main focus of studies that have applied TIRFto analyze endocytosis has been to determine the ‘life history’ of theformation of individual clathrin-coated vesicles. These studies havedemonstrated that some proteins are present throughout theendocytosis process (e.g. clathrin and epsin) (Rappoport et al., 2006;Rappoport and Simon, 2003), whereas the localization of otherproteins to the coated vesicle either increased over time (e.g.dynamin) (Merrifield et al., 2002; Rappoport et al., 2008; Rappoportand Simon, 2003) or decreased (e.g. AP-2) (Rappoport et al., 2003;Rappoport et al., 2005).
ExocytosisThe thin TIRF excitation field allows identification of secretorycarriers near the membrane (Lang et al., 1997). Specific criteria,which involve quantifying the total fluorescence, as well as itspeak and spread, have been established to quantify and characterizethe fusion of vesicles with the plasma membrane (Schmoranzer etal., 2000). The exponential decay of the TIRF excitation fieldallows the small motions of individual fluorescence-markedsecretory carriers in the direction normal to the substrate andplasma membrane (the axial or z-direction) to be manifested asintensity changes. The precision of tracking such axial movementscan be as small as 2 nm, which is considerably smaller than theresolution limit of light microscopy (Allersma et al., 2006). Becauseof the high contrast and low background, the position of the centersof vesicles can be measured with an accuracy of about 10 nm andmotions before fusion that are smaller than the granule diametercan be followed. By observing single vesicles as they approachedand fused with a membrane, it was found that many of the vesiclesdid not deliver all of their cargo in a single fusion step, but requiredtwo or more fusions to fully discharge their cargo (Jaiswal et al.,2009; Schmoranzer et al., 2000).
Cell–substrate contact regionsTIRF has also been used to investigate cell–substrate contact regionsusing several different approaches. Similar to the examples above,the restricted excitation field was shown to be crucial for studyingfocal adhesions with regard to their location, composition, motionand specific biochemistry (Axelrod, 1981; Choi et al., 2008). Onetechnique for identifying cell–substrate contacts involves adding afluorophore to the surrounding solution (Todd et al., 1988). Theintensity of fluorescence can be used to calculate the distance of themembrane from the surface and to ‘map’ the bottom surface ofthe cell (Gingell et al., 1987). This technique requires the thinexcitation field of TIRF, as other imaging methods would result in
3622 Journal of Cell Science 123 (21)
A B
C D
E F G
Epifluorescence TIRF
Epifluorescence TIRF
Epifluorescence TIRFConfocal
Fig. 1. Comparison of images obtained using epifluorescence and TIRF. Inboth cases, the microscope was focused at the adherent plasma membrane andimages were acquired with one of three modes of excitation: epifluorescence,TIRF or confocal. (A,B)Actin (LifeAct–GFP) in a migrating MDCK cell.(C,D)Clathrin (clathrin light chain–GFP) in a HeLa cell. (E–G) Caveolin-1(caveolin-1–EGFP) in MDCK cells. In each case, TIRF clearly eliminates ofout-of-focus fluorescence and reveals details at or near the cell surface. Scalebars: 10m.
Jour
nal o
f Cel
l Sci
ence
overwhelming background fluorescence. Recent work has analyzedfocal adhesion disassembly in real time with TIRF and hasdemonstrated an unexpected role for clathrin in this process (Ezrattyet al., 2009). This was made possible by the ability to rapidly acquireimages of two spectrally distinct fluorophores, with axial information,at the adherent plasma membrane.
Intracellular signalingTIRF has also been used to visualize different modes of intracellularsignaling. For instance, TIRF has been instrumental in studiesaddressing plasma membrane recruitment and spatial distributionsof signaling molecules such as phosphoinositide lipids (Haugh etal., 2000). Furthermore, a plasma-membrane-targeted biosensorrevealed temporal oscillations of cAMP signaling, indicating apreviously unidentified basis for regulation of upstream targets(Dyachok et al., 2006). Single plasma membrane Ca2+ channelshave been imaged with good spatial and temporal resolution,providing information inaccessible to electrophysiological means,and revealing an uneven spatial distribution and diversity in kinetics(Demuro and Parker, 2004). TIRF and patch-clamp methods havebeen successfully combined to demonstrate the localization andcoordination of open calcium channels and ER calcium-sensingmolecules, revealing the spatial dynamics of intracellular Ca2+
signaling (Luik et al., 2006).
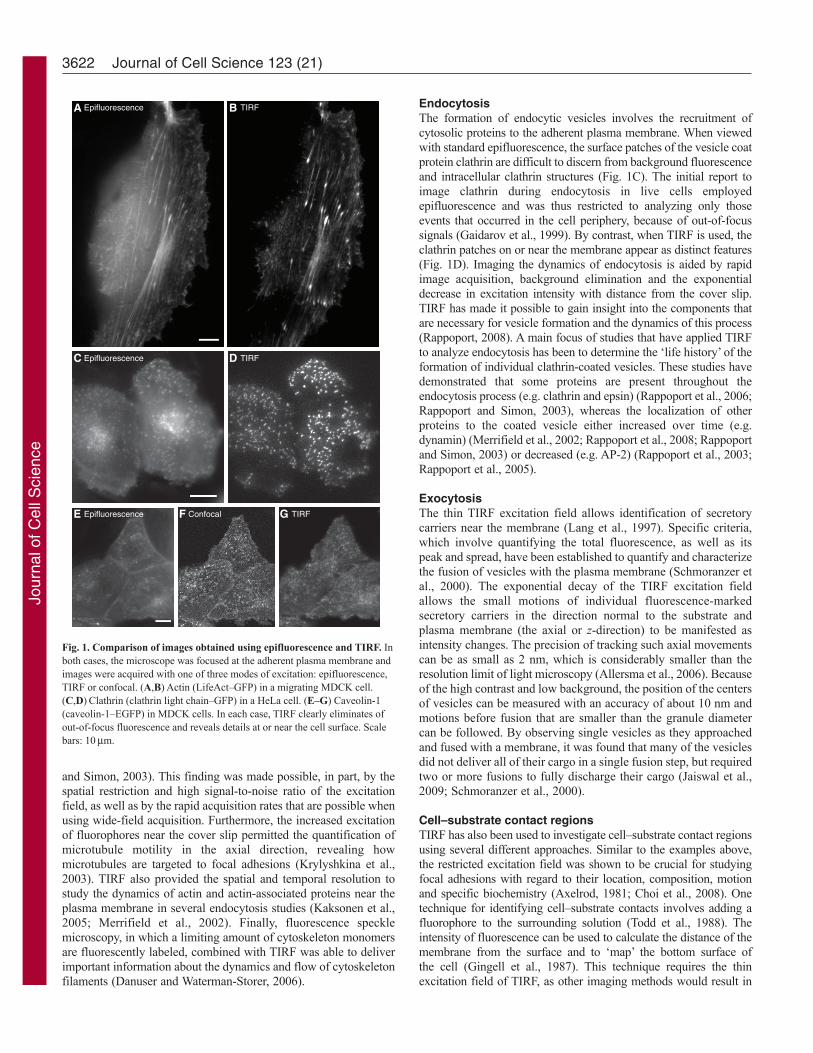
Physical basis of TIRFTo understand the setup, optimization and common pitfalls ofTIRF, it is important to understand the physical basis of thetechnique. In the following section, we provide a brief descriptionof some key parameters in the context of cellular imaging. Webegin by considering the excitation light encountering the cover-slip–sample interface (Fig. 2). It is this interaction that producesthe thin excitation field used in TIRF microscopy.
In the configuration most commonly used for cellular imaging,through-the-objective TIRF, the laser beam is focused off-axis atthe back focal plane (BFP) of the objective lens. When the lightexits the objective lens, it passes through the immersion oil and intothe cover slip, which are matched in refractive index. When theexcitation light beam propagating through the glass cover slipencounters the interface with the aqueous sample, the direction oftravel of the light beam is altered (Fig. 2B). If the angle of incidenceof the excitation light on the interface, , is greater than the ‘criticalangle’, the light beam undergoes total internal reflection (TIR) anddoes not propagate into the sample. The critical angle, c, is givenby Snell’s law:
c sin–1(n1 / n2) ,
where n1 and n2 are the refractive indices of the sample and thecover slip, respectively. To achieve TIR, the refractive index ofthe sample must be less than that of the cover slip.
If the angle of incidence is less than c, most of the excitationlight propagates through the sample; this is what occurs inepifluorescence (Fig. 2). However, if the angle of incidence isgreater than c, the excitation light is reflected off the cover-slip–sample interface back into the cover slip. In this case, some of theincident energy penetrates through the interface, creating a standingwave called the evanescent field. This is the excitation fieldemployed in TIRF microscopy.
The intensity (I) of the evanescent field decays exponentiallywith distance from the interface (z). Therefore, a fluorophore thatis closer to the interface will be excited more strongly than a
fluorophore that is further from the interface. The intensity of theevanescent field at any position z is described by:
Iz I0–z/d ,
where I0 is the intensity of the evanescent field at z0. I0 is relatedto the intensity of the incident beam by a complex function of andpolarization (Axelrod, 1989). The depth of the evanescent field, d,refers to the distance from the cover slip at which the excitationintensity decays to 1/e, or 37%, of I0. Depth d is defined by:
d (0 / 4) * (n22sin2 – n1
2)–1/2 ,
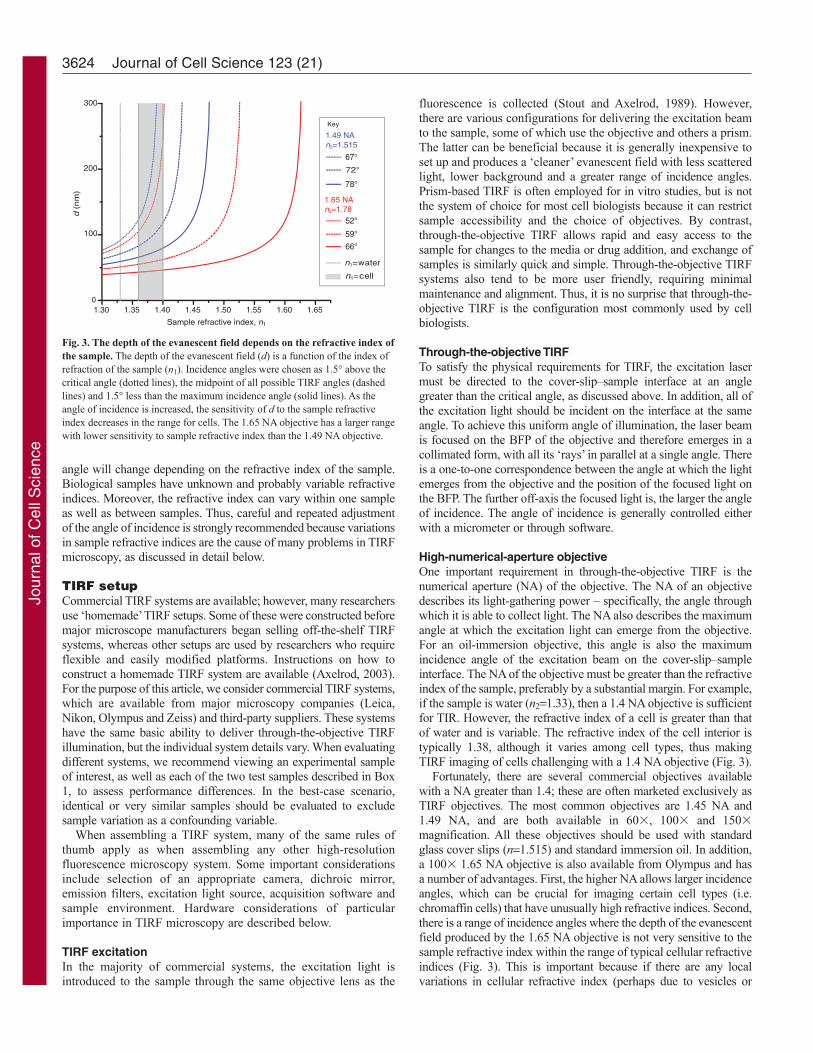
where 0 is the wavelength of the excitation light in a vacuum.Typical values for d are in the range 60–100 nm. The depth of theevanescent field is affected by several parameters, includingincidence angle, wavelength, and the refractive indices of the sampleand the cover slip. The depth decreases (i.e. the excitation fieldbecomes more narrow) as the incidence angle increases. The longerthe wavelength, the greater the depth (i.e. the thicker the excitationvolume). In addition, for a given incidence angle, the depth dependson the refractive index of the sample. As the refractive index of thesample increases, the depth increases (Fig. 3).
Practically speaking, the excitation wavelength and refractiveindex of the cover slip are set, and the user controls the angle ofincidence. Generally, this angle should be increased until it surpassesthe critical angle. It is not advisable to ‘set’ a predefined angle ofincidence without evaluating the evanescent field, because the critical
3623TIRF microscopy for the cell biologist
Incident
Evanescentfield
Reflected
Cover slip n2
Sample n1
θ
θc
Incident
Cover slip n2
Sample n1
A
B
Epifluorescence
TIRF
Fig. 2. The physical basis of epifluorescence and TIRF illumination.Schematic illustrating the cover-slip–sample interface. (A)Epifluorescence.The excitation beam travels directly through the cover-slip–sample interface.All of the fluorophores in the entire sample are excited. (B)TIRF. Theexcitation beam enters from the left at incidence angle , which is greater thanthe critical angle, c (indicated by the dashed line). Angles are measured fromthe normal. The excitation beam is reflected off the cover-slip–sampleinterface and an evanescent field is generated on the opposite side of theinterface, in the sample. Only fluorophores in the evanescent field are excited,as indicated by the green color. The refractive index of the sample (n1) must beless than the index of refraction of the cover slip (n2) to achieve TIR.
Jour
nal o
f Cel
l Sci
ence
angle will change depending on the refractive index of the sample.Biological samples have unknown and probably variable refractiveindices. Moreover, the refractive index can vary within one sampleas well as between samples. Thus, careful and repeated adjustmentof the angle of incidence is strongly recommended because variationsin sample refractive indices are the cause of many problems in TIRFmicroscopy, as discussed in detail below.
TIRF setupCommercial TIRF systems are available; however, many researchersuse ‘homemade’ TIRF setups. Some of these were constructed beforemajor microscope manufacturers began selling off-the-shelf TIRFsystems, whereas other setups are used by researchers who requireflexible and easily modified platforms. Instructions on how toconstruct a homemade TIRF system are available (Axelrod, 2003).For the purpose of this article, we consider commercial TIRF systems,which are available from major microscopy companies (Leica,Nikon, Olympus and Zeiss) and third-party suppliers. These systemshave the same basic ability to deliver through-the-objective TIRFillumination, but the individual system details vary. When evaluatingdifferent systems, we recommend viewing an experimental sampleof interest, as well as each of the two test samples described in Box1, to assess performance differences. In the best-case scenario,identical or very similar samples should be evaluated to excludesample variation as a confounding variable.
When assembling a TIRF system, many of the same rules ofthumb apply as when assembling any other high-resolutionfluorescence microscopy system. Some important considerationsinclude selection of an appropriate camera, dichroic mirror,emission filters, excitation light source, acquisition software andsample environment. Hardware considerations of particularimportance in TIRF microscopy are described below.
TIRF excitationIn the majority of commercial systems, the excitation light isintroduced to the sample through the same objective lens as the
fluorescence is collected (Stout and Axelrod, 1989). However,there are various configurations for delivering the excitation beamto the sample, some of which use the objective and others a prism.The latter can be beneficial because it is generally inexpensive toset up and produces a ‘cleaner’ evanescent field with less scatteredlight, lower background and a greater range of incidence angles.Prism-based TIRF is often employed for in vitro studies, but is notthe system of choice for most cell biologists because it can restrictsample accessibility and the choice of objectives. By contrast,through-the-objective TIRF allows rapid and easy access to thesample for changes to the media or drug addition, and exchange ofsamples is similarly quick and simple. Through-the-objective TIRFsystems also tend to be more user friendly, requiring minimalmaintenance and alignment. Thus, it is no surprise that through-the-objective TIRF is the configuration most commonly used by cellbiologists.
Through-the-objective TIRFTo satisfy the physical requirements for TIRF, the excitation lasermust be directed to the cover-slip–sample interface at an anglegreater than the critical angle, as discussed above. In addition, all ofthe excitation light should be incident on the interface at the sameangle. To achieve this uniform angle of illumination, the laser beamis focused on the BFP of the objective and therefore emerges in acollimated form, with all its ‘rays’ in parallel at a single angle. Thereis a one-to-one correspondence between the angle at which the lightemerges from the objective and the position of the focused light onthe BFP. The further off-axis the focused light is, the larger the angleof incidence. The angle of incidence is generally controlled eitherwith a micrometer or through software.
High-numerical-aperture objectiveOne important requirement in through-the-objective TIRF is thenumerical aperture (NA) of the objective. The NA of an objectivedescribes its light-gathering power – specifically, the angle throughwhich it is able to collect light. The NA also describes the maximumangle at which the excitation light can emerge from the objective.For an oil-immersion objective, this angle is also the maximumincidence angle of the excitation beam on the cover-slip–sampleinterface. The NA of the objective must be greater than the refractiveindex of the sample, preferably by a substantial margin. For example,if the sample is water (n21.33), then a 1.4 NA objective is sufficientfor TIR. However, the refractive index of a cell is greater than thatof water and is variable. The refractive index of the cell interior istypically 1.38, although it varies among cell types, thus makingTIRF imaging of cells challenging with a 1.4 NA objective (Fig. 3).
Fortunately, there are several commercial objectives availablewith a NA greater than 1.4; these are often marketed exclusively asTIRF objectives. The most common objectives are 1.45 NA and1.49 NA, and are both available in 60�, 100� and 150�magnification. All these objectives should be used with standardglass cover slips (n1.515) and standard immersion oil. In addition,a 100� 1.65 NA objective is also available from Olympus and hasa number of advantages. First, the higher NA allows larger incidenceangles, which can be crucial for imaging certain cell types (i.e.chromaffin cells) that have unusually high refractive indices. Second,there is a range of incidence angles where the depth of the evanescentfield produced by the 1.65 NA objective is not very sensitive to thesample refractive index within the range of typical cellular refractiveindices (Fig. 3). This is important because if there are any localvariations in cellular refractive index (perhaps due to vesicles or
3624 Journal of Cell Science 123 (21)
1.30 1.35 1.40 1.45 1.50 1.55 1.60 1.650
100
200
300
d (
nm
)
Sample refractive index, n1
1.49 NAn2=1.515
67° 72°
78°
1.65 NAn2=1.78
52°
59°
66°
n1=water
n1=cell
Key
Fig. 3. The depth of the evanescent field depends on the refractive index ofthe sample. The depth of the evanescent field (d) is a function of the index ofrefraction of the sample (n1). Incidence angles were chosen as 1.5° above thecritical angle (dotted lines), the midpoint of all possible TIRF angles (dashedlines) and 1.5° less than the maximum incidence angle (solid lines). As theangle of incidence is increased, the sensitivity of d to the sample refractiveindex decreases in the range for cells. The 1.65 NA objective has a larger rangewith lower sensitivity to sample refractive index than the 1.49 NA objective.
Jour
nal o
f Cel
l Sci
ence
organelles), the 1.65 NA objective can create a uniform evanescentfield. The major drawbacks of the 1.65 NA objective are that itrequires a special and volatile immersion oil, and expensive non-standard cover slips (n1.78).
Laser light sourceIt is possible to use either a laser or an arc lamp such as xenon ormercury for TIRF excitation. Some benefits of using an arc lamp arethat it enables easy selection of excitation wavelengths with a filterwheel and the illumination field contains no interference fringes (seebelow). In this configuration, any light from the arc lamp that wouldarrive at the sample at less than the critical angle must be discarded.Therefore, a significant percent of the excitation power is lost,resulting in lower excitation intensity and dimmer images. Arc lampsources for TIRF are commercially available and work well forsamples that are intrinsically bright.
Lasers are the most common source for TIRF excitation and theTIRF system should have one laser line optimized for eachfluorophore. The lasers can be mounted together and combined sothat multiple fluorophores can be imaged either simultaneously oralternately. An acousto-optic tunable filter (AOTF) or filter wheelcan be used for rapid switching between excitation wavelengths.
CameraTIRF is a technique that captures the full field of an image, ratherthan scanning a single point. For the collection of images, a cooledcharge-coupled device (CCD) camera is used. There is a wide rangeof CCD cameras to choose from, including electron multiplying(EM) CCDs. When rapid imaging in very low light situations isrequired, EMCCDs offer benefits over conventional CCDs. However,TIRF does not require an EMCCD and camera selection should bedetermined on the basis of the same considerations as for wide-fieldfluorescence imaging (Moomaw, 2007; Spring, 2007). When intensitychanges are to be quantified, the linearity of the camera in responseto incoming photons is an important consideration.
Image splitterTIRF illumination is restricted within a single focal plane andrelatively short exposure times (e.g. many frames per second) areroutinely employed, making the technique especially useful forimaging dynamic processes. One of the developments that havemade TIRF particularly powerful is the ability to image multiplefluorophores, either simultaneously or in very rapid succession.Image splitters, such as those sold by Cairn (Cairn Research Limited,UK) and Photometrics (Tucson, AZ, USA), allow simultaneousacquisition of emission from two to four spectrally distinctfluorophores on different regions of a CCD camera. This is anoptimal method for imaging very rapid events; however, it reducesthe size of the field that can be imaged. Alternatively, splitters thatproject two spectrally distinct images on two separate cameras arealso available. Both methods can generate potential problems whenaligning and overlaying the spectrally distinct channels, also knownas image registration.
Sample environmentLive cell imaging often requires stable maintenance of the sample at37°C, as temperature gradients can be a major source of focal drift.The thin optical section imaged with TIRF makes it particularlysensitive to small changes in focus, which degrade image quality. Anumber of solutions to this problem involve controlling temperature,and possibly also humidity and pCO2 (partial pressure of CO2).
Stage-top incubators combined with objective heaters are one strategyfor maintaining a stable temperature, although whole-scope incubatorsallow the entire system to equilibrate with fewer problems. Severalcompanies are now offering focus-maintaining solutions, which reduceor eliminate focal drift resulting from temperature gradients.
Selection, preparation and analysis of TIRFsamplesTIRF is ideal for imaging events occurring at a surface. However,there are several variables that must be considered before embarkingon experiments.
Selection of cell typeThe cells must be adherent, because TIRF illuminates only theregion near the cover slip and cannot be used to image non-adherentcells. For some cell lines, it can be necessary to coat cover slips withextracellular matrix molecules or substances such as polylysine orcollagen to ensure cell adherence. On the other hand, confluentmonolayers of cells can generate areas of high refractive index,which can make imaging with TIRF difficult.
As outlined above, the refractive index of the cells should bebelow the NA of the objective. For example, chromaffin cells havea very high refractive index, which can make it difficult to obtainTIRF images using standard 1.45 NA or 1.49 NA objectives; the1.65 NA objective was shown to yield good TIRF images (Allersmaet al., 2004). Moreover, apoptotic cells generally have a higher indexof refraction than non-apoptotic cells. Also, it is important to keepin mind that intracellular organelles have different refractive indices.Attempting TIRF imaging of a cell with a high refractive index canresult in scattering of propagated light through the sample. To addressthis problem, it might be possible to increase the angle of incidenceuntil the propagated light disappears. If this is not effective, thesample might require a 1.65 NA objective or the use of a prism-based system.
Sample preparationTIRF is ideal for imaging live cells. Because of the thin excitationfield, most of the imaged cell is not exposed to the excitation light,leading to fewer phototoxic effects. If cells are fixed, they should bemounted in a low refractive index media, such as PBS. Mountingmedium that hardens or contains glycerol is useful for long-termsample storage, but it usually has a higher refractive index, renderingimaging of these samples with TIRF impossible. Finally, it shouldbe noted that some dyes commonly used in cell biology (i.e. FM4-64 and DiI) adhere to the cover-slip surface and can obscure imagingunless the sample is properly washed after staining.
Data interpretationWhen interpreting TIRF data, it is important to remember that theexcitation field is not discrete, but exponentially decaying. Thepenetration depth, which is usually between 60 and 100 nm, describesthe distance from the cover slip at which the excitation intensity is1/e, or ~37%, of its value at the cover slip. The evanescent fieldexponentially decays, and objects located further than 100 nm fromthe surface of the cover slip can still be excited and imaged.
Particular care must be taken when interpreting the intensity ofobjects in an image obtained by TIRF. The intensity is affected bymore than just the number of fluorophores; other factors include theaxial (z) position and the orientation of the excitation dipole ofthe fluorophore relative to the polarization of the evanescent field.For example, 100 fluorophores positioned at z0 will have the same
3625TIRF microscopy for the cell biologist
Jour
nal o
f Cel
l Sci
ence
intensity as 370 fluorophores at zd (I1/e�370100). Thus, intensityalone cannot be used to infer relative number of fluorophores or zpositions between objects.
It follows that changes in intensity from a single object can be dueto changes in multiple parameters, including the number of associatedfluorophores, movements in z, the orientation of the object or theoccurrence of photobleaching. The intensity of an object will increaseif it gains fluorophores or moves closer to the cover slip, or ifthe excitation dipole rotates to align with the polarization of theevanescent field. In some cases, the specific biological context ofthe experiment can help to clarify the source of the intensity change;for example, the number of fluorophores on the inside of a secretoryvesicle typically remains constant and, therefore, alteration inintensity can generally be interpreted as movement in z (Allersma etal., 2006). Also, in endocytosis, a loss of fluorescence can beinterpreted as due to internalization only when it can be clearlydistinguished from photobleaching. Alternatively, an epifluorescenceimage can be used for normalization and movement in z can beinterpreted regardless of fluctuations in the number of fluorophores(Saffarian and Kirchhausen, 2008).
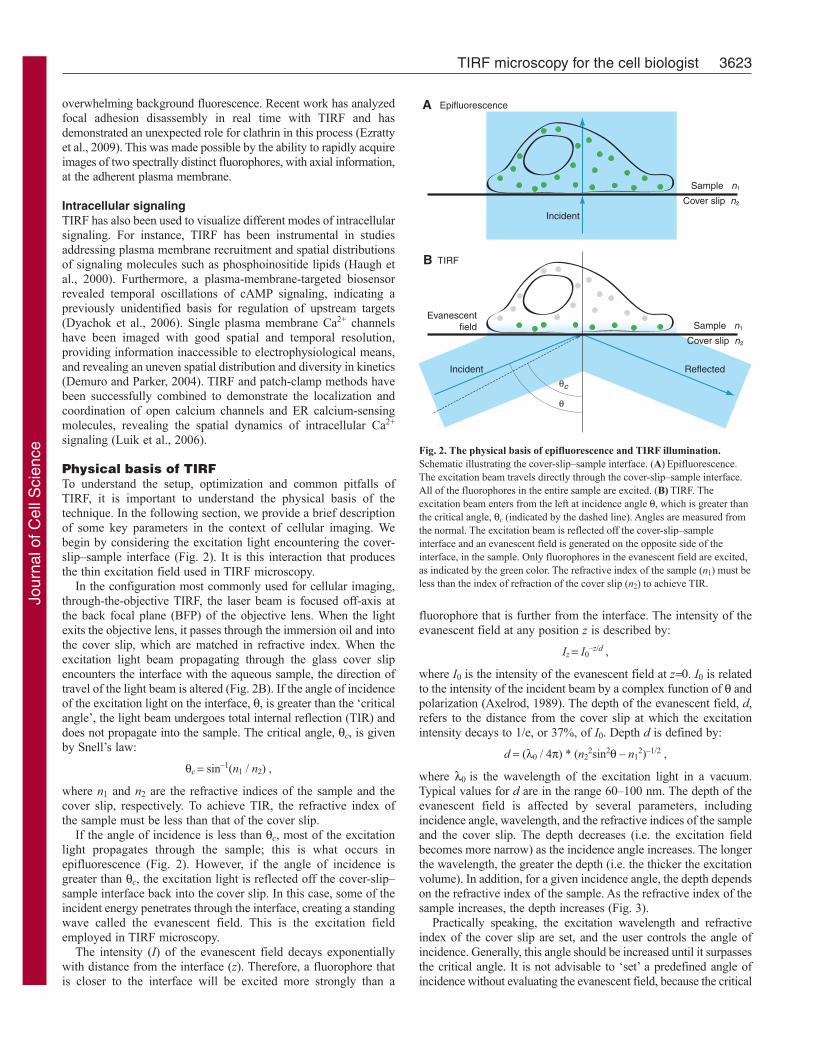
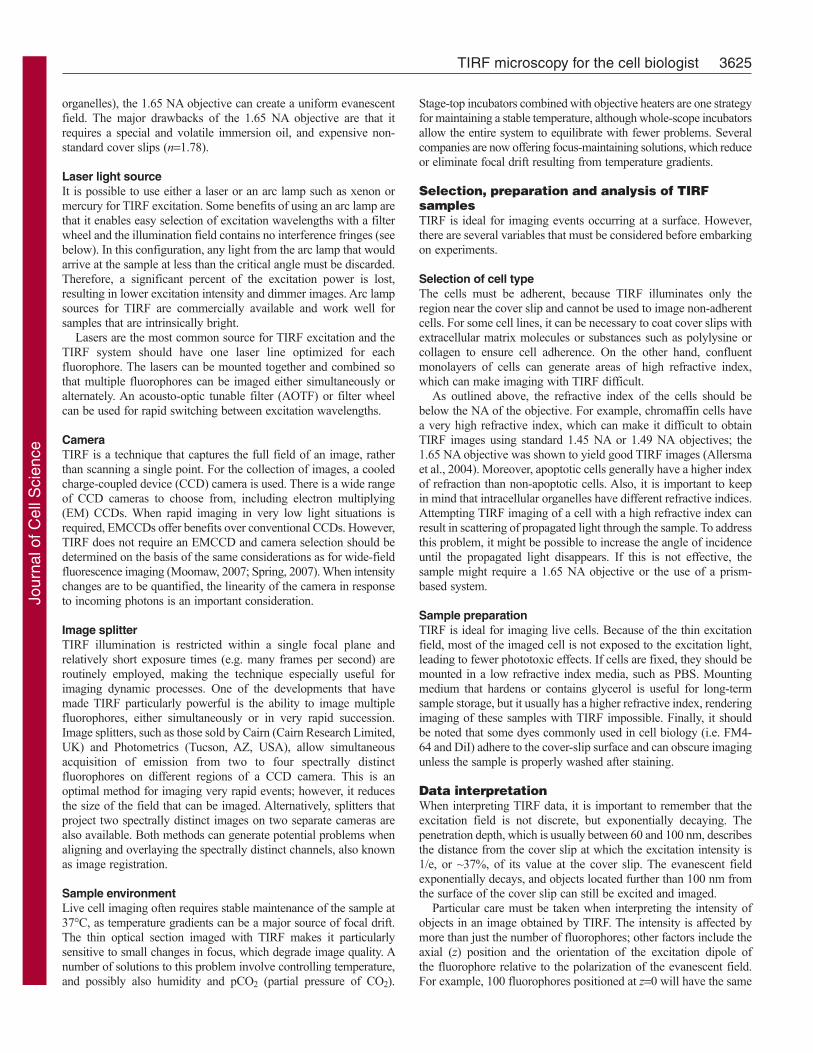
Troubleshooting and practical adviceIn this section, we discuss commonly encountered problems whenusing TIRF microscopy. One of the most common is contaminationof the image with propagating light, which can arise from a subcriticalincidence angle or scattering from the sample. Both these scenariossignificantly degrade the quality of TIRF images. Propagating lightskimming at an angle through the sample will have similarcharacteristics to epifluorescence. Fig. 4A–D demonstrates thedifferences between TIRF and epifluorescence. The most notablecharacteristics are that, in epifluorescence, there is out-of-focusfluorescence and the sample can be focused in more than one plane.In TIRF, the background fluorescence is eliminated and the samplecan only be focused in one plane. If a system is misaligned, it ispossible for the image to appear to be half in TIR and half inepifluorescence. If a sample has areas of higher refractive index,‘comets’ of propagating light can be seen. As a simple rule of thumb,if the image can be focused in more than one z plane, then propagatinglight is a problem (Fig. 4A–D; supplementary material Movie 1).The first step to overcome this problem is to vary the incidenceangle. It is likely that the source of the problem is that the excitationangle is very close to the critical angle, or that dense organelles witha high refractive index found deeper in the cell are causing propagatedlight. This can be eliminated by increasing the incidence angle.However, if this is not the source of the problem, several otherpotential causes of propagating light can originate in the physical setup and/or the sample. It is simplest to begin by checking theparameters of the set up before exploring the sample itself asthe cause of the propagated light.
Laser alignmentThe most basic reason for contamination with propagated light is animproperly aligned excitation source. This will often manifest itselfas a field that is half in and half out of TIRF, or the completeinability to obtain TIRF. As discussed above, the excitation laserbeam must be focused on the BFP of the objective. If this is not thecase, light will emerge from the objective at a variety of angles. It isimportant to follow manufacturer’s instructions to check and correctthe focus on the BFP.
Similarly, proper setting of the incidence angle is essential. Theonset of TIRF should be obvious as a sudden darkening of
the background and a flat two-dimensional look to the features nearthe surface (Fig. 1; supplementary material Movie 1). When thesample is viewed in TIRF, no new features should become apparentif the microscope is focused up into the sample, because there is onlyone plane of focus. Specific details of what should be observed foreach of the two test samples are described in Box 1 and Fig. 4.
Interference fringesLaser illumination can produce interference fringes, which are causedby optical imperfections in the beam path. The interference fringesmanifest themselves as an alternating light-dark pattern of excitationintensity at the sample plane (Fig. 4E). Although it is possible toobtain a correction image with which the image can be normalized,fringes are often specific to the sample and position in the xy plane,and are unlikely to be the same in the sample and the correction
3626 Journal of Cell Science 123 (21)
A B
C D
E F
Fig. 4. TIRF test samples. The differences between epifluorescence and TIRFand the quality of the evanescent field can be examined using a test sample offluorescent beads (A–D). In epifluorescence (incidence angle 0), there is alarge fluorescent background and beads appear in focus at both the cover slipz0 (A) and deeper into the sample z>0 (C). In TIRF (>c), the background issignificantly less than in epifluorescence (B) and there are no beads in focusdeeper into the sample (z>0) because the excitation field does not extend deepinto the sample (D). The region imaged was constant, and identical exposuretimes and scalings were applied to all four images. DiI deposited on a coverslip reveals (E) interference fringes. For contrast, the same region is shownwith elimination of the interference fringes (F). Scale bars: 10m.
Jour
nal o
f Cel
l Sci
ence
image. There are several alterations to the TIRF set up that willeliminate fringes and create a uniform excitation field (Fig. 4F)(Fiolka et al., 2008; Inoue et al., 2001; Kuhn and Pollard, 2005;Mattheyses et al., 2006), although none are currently commerciallyavailable. When ordering filters and dichroics, it is recommended tospecify that they will be used for TIRF imaging to reduce problemswith interference fringes. Cleaning dust off optical surfaces, ensuringthat the dichroic mirror is strain free and selecting the best of severalobjectives can reduce the number and severity of interference fringes.It is important to keep in mind that the excitation field might not beuniform; therefore, changes in intensity between objects located indifferent xy positions might be due to differences in excitation andnot differences in the objects. The xy uniformity of the field can beexamined with test samples, as detailed in Box 1 and Fig. 4.
PhotobleachingPhotobleaching is the photon-induced decomposition of afluorophore. It generally causes a permanent loss of fluorescenceand dimming of the observed sample over time. In TIRF, it isimportant to keep in mind the unusual geometry of the excitationfield. Fluorophores must be close to the origin of the evanescentfield to be photobleached. Depending on the residence time of thefluorescent protein in the evanescent field, this will produce differenteffects. A fluorescently tagged membrane protein will bephotobleached with normal kinetics because it resides in theexcitation field. However, soluble fluorescently tagged proteins thatdiffuse in and out of the excitation field will not photobleach asquickly, because of the constant exchange between molecules in theevanescent field and those in the bulk of the cytoplasm. The intensityof the evanescent field is strongest closer to the cover slip and it isimportant to keep in mind the potential for photobleaching orphotolysis when labeled molecules are present close to the cover slip(Jaiswal et al., 2007). Heat and free radicals generated by excitationlight in any form of fluorescence microscopy can damage cellularproteins and structures, causing, for example, vesicle rupture or evencell death.
ConclusionsTIRF is a useful and accessible imaging technique used in cellbiology for selective excitation of fluorophores at or near thecell membrane, while eliminating background fluorescence. TIRFfacilitates the collection of information regarding processes in livingcells that occur at the membrane, and enables the analysis of individualcellular and molecular events. This Commentary has provided a brieftechnical review of the physical basis of TIRF, highlighted somecommon issues that can arise when setting up and employing TIRFmicroscopy, suggested solutions to some of these potential problems,and provided examples of different types of cellular processes thatcan be effectively analyzed by TIRF imaging. The past few yearshave seen a great upswing in the application of TIRF microscopy incell biology; of the nearly 1000 papers concerning TIRF publishedsince approximately 1980, about 70% were written in the past fiveyears! In the future, we can anticipate dissemination of this powerfultechnique to all areas of cell biology. Combining the ability toselectively probe dynamics at or near the cell membrane with differenttechniques, and the development of novel methods to make use ofthe properties of fluorophores and the geometry of TIRF will lead togreat advances in our understanding of cell biology. Spectroscopicproperties of fluorophores such as polarization (Anantharam et al.,2010; Sund et al., 1999) and anisotropic emission of fluorescence(Hellen and Axelrod, 1987) offer additional avenues for the
development of novel techniques that will explore the environmentand orientation of molecules. Furthermore, combining TIRF withother techniques, such as fluorescence recovery after photobleaching(FRAP) (Thompson et al., 1981), fluorescence correlationspectroscopy (FCS) (Lieto et al., 2003; Ohsugi et al., 2006),
3627TIRF microscopy for the cell biologist
Box 1. Determining the quality of a TIRF set upThe test samples described below can be used to check thequality of any TIRF set up. They should always be prepared usinga cover slip with the correct thickness and refractive index for theobjective.
Test samplesFluorescent microbeads. These can be purchased from manysources, including Invitrogen (Carlsbad, CA) and BangsLaboratories (Fishers, IN). The beads should be of subresolutionsize (100 nm diameter or less), and selected to have excitationand emission spectra that match typical experimental conditions.The beads should be diluted in water and applied to the coverslip. PBS can be added to increase the number of beads thatadhere to the surface.DiI. A convenient, uniform, fluorescent film can be easily made ona cover slip surface with the lipophilic fluorophore DiI (Invitrogen,Carlsbad, CA). Dissolve the DiI at 0.5 mg/ml in ethanol and placea single droplet of the solution on a glass cover slip. Then, beforethe solution dries, rinse the cover slip with distilled water. Amonolayer of DiI fluorophore will remain adhered to the glass.Above the DiI-coated surface, add distilled water, being sure toadd enough so that its upper surface is flat. The water-solublefluorophore fluorescein (Invitrogen, Carlsbad, CA) can be usedfor this step instead of water. Fluorescein will allow detection ofthe critical angle. The fluorophores can be excited with a 488 nmlaser and observed with a long-pass filter. DiI will appear red-orange and fluorescein green.
Evaluation criteriaThe angle of illumination. Fluorescent microbeads are the idealsample for evaluating TIRF. There are two populations of beads inthe sample – immobile beads adhered to the surface and dynamicbeads in solution moving by Brownian motion. If the angle ofincidence is greater than the critical angle, the image will beoverwhelmed by the dynamic beads in solution. When theincidence angle is increased, there should be a stark boundary atwhich the dynamic beads are no longer observed and theimmobile surface-bound beads become visible. At this point, if youfocus upwards into the sample, you should see the surface beadsmoving out of focus, but no new beads appearing – this is TIRF.
If it appears that TIRF is not achievable or that half of the fieldis in TIRF while the other half is in epi-illumination, a likely causeis that the excitation beam is not focused very well on the BFP.This can happen easily and is one of the first things to checkwhen experiencing problems using TIRF.Interference fringes. When the excitation light exceeds the criticalangle, the DiI sample will reveal the interference fringe pattern,which usually manifests itself as concentric rings. The DiI willmost likely have its own heterogeneities, which aredistinguishable from the interference fringes; the sampleheterogeneities will move as the sample is moved, whereas theinterference fringes will remain for the most part unchanged.
It is important to keep in mind that it is not possible to set theangle of incidence on a test sample and expect it to be correct foran experimental sample. The test sample is used to verify thealignment of the system. Because of differences in the refractiveindices between the test samples and experimental samples, theangle of incidence will need to be established for eachexperimental sample.
Jour
nal o
f Cel
l Sci
ence
fluorescence resonance energy transfer (FRET) (Riven et al., 2006;Wang et al., 2008) or atomic force microscopy (AFM) (Brown et al.,2009; Kellermayer et al., 2006), will provide a wide variety of dataon molecular dynamics in living cells. The superior backgroundreduction provided by TIRF has allowed the development of severalsuper-resolution techniques (Patterson et al., 2010). In the future,TIRF will continue to provide a unique view of cell biology.
J.Z.R. is funded through BBSRC grant BB/H002308/1. The authorsthank Alexandre Benmerah for GFP-tagged clathrin, Ari Helenius forGFP-tagged caveolin-1 and Roland Wedlich-Soldner for GFP-taggedLifeAct. The authors also thank Natalie Poulter for assistance in thegeneration of Fig. 1. The TIRF microscope used in this research togenerate Fig. 1 was obtained through the Birmingham Science CityTranslational Medicine Clinical Research and Infrastructure TrialsPlatform, with support from Advantage West Midlands (AWM). S.S.M.is funded through NIH grant R01 GM087977. Deposited in PMC forrelease after 12 months.
Supplementary material available online athttp://jcs.biologists.org/cgi/content/full/123/21/3621/DC1
ReferencesAllersma, M. W., Wang, L., Axelrod, D. and Holz, R. W. (2004). Visualization of regulated
exocytosis with a granule membrane probe using total internal reflection microscopy. Mol.Biol. Cell 15, 4658-4668.
Allersma, M. W., Bittner, M. A., Axelrod, D. and Holz, R. W. (2006). Motion matters:secretory granule motion adjacent to the plasma membrane and exocytosis. Mol. Biol. Cell17, 2424-2438.
Anantharam, A., Onoa, B., Edwards, R. H., Holz, R. W. and Axelrod, D. (2010).Localized topological changes of the plasma membrane upon exocytosis visualized bypolarized TIRFM. J. Cell Biol. 188, 415-428.
Axelrod, D. (1981). Cell-substrate contacts illuminated by total internal reflection fluorescence.J. Cell Biol. 89, 141-145.
Axelrod, D. (1989). Total internal-reflection fluorescence microscopy. Methods Cell Biol. 30,245-270.
Axelrod, D. (2003). Total internal reflection fluorescence microscopy in cell biology.Biophotonics B 361, 1-33.
Axelrod, D. (2008). Total internal reflection fluorescence microscopy. In Biophysical Toolsfor Biologists, Vol. 2, In Vivo Techniques (ed. J. J. Correia and H. W. Detrich), pp. 169-221. San Diego, CA: Academic Press.
Brown, A. E. X., Hategan, A., Safer, D., Goldman, Y. E. and Discher, D. E. (2009). Cross-correlated TIRF/AFM reveals asymmetric distribution of force-generating heads alongself-assembled, “synthetic” myosin filaments. Biophys. J. 96, 1952-1960.
Choi, C. K., Vicente-Manzanares, M., Zareno, J., Whitmore, L. A., Mogilner, A. andHorwitz, A. R. (2008). Actin and alpha-actinin orchestrate the assembly and maturationof nascent adhesions in a myosin II motor-independent manner. Nat. Cell Biol. 10, 1039-1050.
Danuser, G. and Waterman-Storer, C. M. (2006). Quantitative fluorescent specklemicroscopy of cytoskeleton dynamics. Annu. Rev. Biophys. Biomol. Struct. 35, 361-387.
Demuro, A. and Parker, I. (2004). Imaging the activity and localization of single voltage-gated Ca2+ channels by total internal reflection fluorescence microscopy. Biophys. J. 86,3250-3259.
Dyachok, O., Isakov, Y., Sagetorp, J. and Tengholm, A. (2006). Oscillations of cyclic AMPin hormone-stimulated insulin-secreting beta-cells. Nature 439, 349-352.
Engel, B. D., Lechtreck, K. F., Sakai, T., Ikebe, M., Witman, G. B. and Marshall, W. F.(2009). Total internal reflection fluorescence (TIRF) microscopy of chlamydomonasflagella. Methods Cell Biol. 93, 157-177.
Ezratty, E. J., Bertaux, C., Marcantonio, E. E. and Gundersen, G. G. (2009). Clathrinmediates integrin endocytosis for focal adhesion disassembly in migrating cells. J. CellBiol. 187, 733-747.
Fiolka, R., Belyaev, Y., Ewers, H. and Stemmer, A. (2008). Even illumination in total internalreflection fluorescence microscopy using laser light. Microsc. Res. Tech. 71, 45-50.
Gaidarov, I., Santini, F., Warren, R. A. and Keen, J. H. (1999). Spatial control of coated-pit dynamics in living cells. Nat. Cell Biol. 1, 1-7.
Gingell, D., Heavens, O. S. and Mellor, J. S. (1987). General electromagnetic theory of totalinternal-reflection fluorescence-the quantitative basis for mapping cell substratumtopography. J. Cell Sci. 87, 677-693.
Haugh, J. M., Codazzi, F., Teruel, M. and Meyer, T. (2000). Spatial sensing in fibroblastsmediated by 3� phosphoinositides. J. Cell Biol. 151, 1269-1279.
Hellen, E. H. and Axelrod, D. (1987). Fluorescence emission at dielectric and metal-filminterfaces. J. Opt. Soc. Am. B 4, 337-350.
Inoue, S., Knudson, R. A., Goda, M., Suzuki, K., Nagano, C., Okada, N., Takahashi, H.,Ichie, K., Iida, M. and Yamanaka, K. (2001). Centrifuge polarizing microscope. I.Rationale, design and instrument performance. J. Microsc. 201, 341-356.
Jaiswal, J. K., Fix, M., Takano, T., Nedergaard, M. and Simon, S. M. (2007). Resolvingvesicle fusion from lysis to monitor calcium-triggered lysosomal exocytosis in astrocytes.Proc. Natl. Acad. Sci. USA 104, 14151-14156.
Jaiswal, J. K., Rivera, V. M. and Simon, S. M. (2009). Exocytosis of post-Golgi vesiclesis regulated by components of the endocytic machinery. Cell 137, 1308-1319.
Jouvenet, N., Neil, S. J. D., Bess, C., Johnson, M. C., Virgen, C. A., Simon, S. M. andBieniasz, P. D. (2006). Plasma membrane is the site of productive HIV-1 particle assembly.PLoS Biol. 4, 2296-2310.
Kaksonen, M., Toret, C. P. and Drubin, D. G. (2005). A modular design for the clathrin-and actin-mediated endocytosis machinery. Cell 123, 305-320.
Kellermayer, M. S. Z., Karsai, A., Kengyel, A., Nagy, A., Bianco, P., Huber, T., Kulcsar,A., Niedetzky, C., Proksch, R. and Grama, L. (2006). Spatially and temporallysynchronized atomic force and total internal reflection fluorescence microscopy for imagingand manipulating cells and biomolecules. Biophys. J. 91, 2665-2677.
Krylyshkina, O., Anderson, K. I., Kaverina, I., Upmann, I., Manstein, D. J., Small, J. V.and Toomre, D. K. (2003). Nanometer targeting of microtubules to focal adhesions. J.Cell Biol. 161, 853-859.
Kuhn, J. R. and Pollard, T. D. (2005). Real-time measurements of actin filamentpolymerization by total internal reflection fluorescence microscopy. Biophys. J. 88, 1387-1402.
Lang, T., Wacker, I., Steyer, J., Kaether, C., Wunderlich, I., Soldati, T., Gerdes, H. H.and Almers, W. (1997). Ca2+-triggered peptide secretion neurotechnique in single cellsimaged with green fluorescent protein and evanescent-wave microscopy. Neuron 18, 857-863.
Lieto, A. M., Cush, R. C. and Thompson, N. L. (2003). Ligand-receptor kinetics measuredby total internal reflection with fluorescence correlation spectroscopy. Biophys. J. 85,3294-3302.
Luik, R. M., Wu, M. M., Buchanan, J. and Lewis, R. S. (2006). The elementary unit ofstore-operated Ca2+ entry: local activation of CRAC channels by STIM1 at ER-plasmamembrane junctions. J. Cell Biol. 174, 815-825.
Mattheyses, A. L., Shaw, K. and Axelrod, D. (2006). Effective elimination of laserinterference fringing in fluorescence microscopy by spinning azimuthal incidence angle.Microsc. Res. Tech. 69, 642-647.
Merrifield, C. J., Feldman, M. E., Wan, L. and Almers, W. (2002). Imaging actin anddynamin recruitment during invagination of single clathrin-coated pits. Nat. Cell Biol. 4,691-698.
Moomaw, B. (2007). Camera technologies for low light imaging: overview and relativeadvantages. In Digital Microscopy, 3rd edn (ed. G. Sluder and D. E. Wolf), pp. 251-283.San Diego, CA: Elsevier Academic Press.
North, A. J. (2006). Seeing is believing? A beginners’ guide to practical pitfalls in imageacquisition. J. Cell Biol. 172, 9-18.
Ohsugi, Y., Saito, K., Tamura, M. and Kinjo, M. (2006). Lateral mobility of membrane-binding proteins in living cells measured by total internal reflection fluorescence correlationspectroscopy. Biophys. J. 91, 3456-3464.
Patterson, G., Davidson, M., Manley, S. and Lippincott-Schwartz, J. (2010).Superresolution imaging using single-molecule localization. Annu. Rev. Phys. Chem. 61,345-367.
Rappoport, J. Z. (2008). Focusing on clathrin-mediated endocytosis. Biochem. J. 412, 415-423.
Rappoport, J. Z. and Simon, S. M. (2003). Real-time analysis of clathrin-mediatedendocytosis during cell migration. J. Cell Sci. 116, 847-855.
Rappoport, J. Z., Taha, B. W., Lemeer, S., Benmerah, A. and Simon, S. M. (2003). TheAP-2 complex is excluded from the dynamic population of plasma membrane-associatedclathrin. J. Biol. Chem. 278, 47357-47360.
Rappoport, J. Z., Benmerah, A. and Simon, S. M. (2005). Analysis of the AP-2 adaptorcomplex and cargo during clathrin-mediated endocytosis. Traffic 6, 539-547.
Rappoport, J. Z., Kemal, S., Benmerah, A. and Simon, S. M. (2006). Dynamics of clathrinand adaptor proteins during endocytosis. Am. J. Physiol. Cell Physiol. 291, C1072-C1081.
Rappoport, J. Z., Heyman, K. P., Kemal, S. and Simon, S. M. (2008). Dynamics ofdynamin during clathrin mediated endocytosis in PC12 cells. PLoS ONE 3, e2416.
Riven, I., Iwanir, S. and Reuveny, E. (2006). GIRK channel activation involves a localrearrangement of a preformed G protein channel complex. Neuron 51, 561-573.
Saffarian, S. and Kirchhausen, T. (2008). Differential evanescence nanometry: live-cellfluorescence measurements with 10-nm axial resolution on the plasma membrane. Biophys.J. 94, 2333-2342.
Schmoranzer, J. and Simon, S. M. (2003). Role of microtubules in fusion of post-Golgivesicles to the plasma membrane. Mol. Biol. Cell 14, 1558-1569.
Schmoranzer, J., Goulian, M., Axelrod, D. and Simon, S. M. (2000). Imaging constitutiveexocytosis with total internal reflection fluorescence microscopy. J. Cell Biol. 149, 23-31.
Spring, K. R. (2007). Cameras for digital microscopy. In Digital Microscopy, 3rd edn (ed.G. Sluder and D. E. Wolf), pp. 171-187. San Diego, CA: Elsevier Academic Press.
Stout, A. L. and Axelrod, D. (1989). Evanescent field excitation of fluorescence by epi-illumination microscopy. Appl. Opt. 28, 5237-5242.
Sund, S. E., Swanson, J. A. and Axelrod, D. (1999). Cell membrane orientation visualizedby polarized total internal reflection fluorescence. Biophys. J. 77, 2266-2283.
Thompson, N. L., Burghardt, T. P. and Axelrod, D. (1981). Measuring surface dynamicsof biomolecules by total internal-reflection fluorescence with photobleaching recovery orcorrelation spectroscopy. Biophys. J. 33, 435-454.
Todd, I., Mellor, J. S. and Gingell, D. (1988). Mapping cell glass contacts of dictyosteliumamebas by total internal-reflection aqueous fluorescence overcomes a basic ambiguity ofinterference reflection microscopy. J. Cell Sci. 89, 107-114.
Wang, L., Bittner, M. A., Axelrod, D. and Holz, R. W. (2008). The structural and functionalimplications of linked SNARE motifs in SNAP25. Mol. Biol. Cell 19, 3944-3955.
Waters, J. C. (2009). Accuracy and precision in quantitative fluorescence microscopy. J. CellBiol. 185, 1135-1148.
3628 Journal of Cell Science 123 (21)
Jour
nal o
f Cel
l Sci
ence