Embed Size (px)
Citation preview
Hunting for Trends in DataUsing Microsoft Access
Jennifer LaFleurNational Institute for Computer-Assisted Reporting
When Bob Imrie, an Associated Press reporter in Wausau, WI, went searching forinformation about hunting accidents, he ended up right on target. The state filed hard-copy reports on every accident detailing information such as weather, topography and thenumber of pieces of orange the victim was wearing. Imry had no way of digging outtrends from the voluminous hard-copy reports and he had never used a computerdatabase. But with some help over the phone from some nerdy colleagues, he created hisown database to look at trends in hunting accidents in Wisconsin.
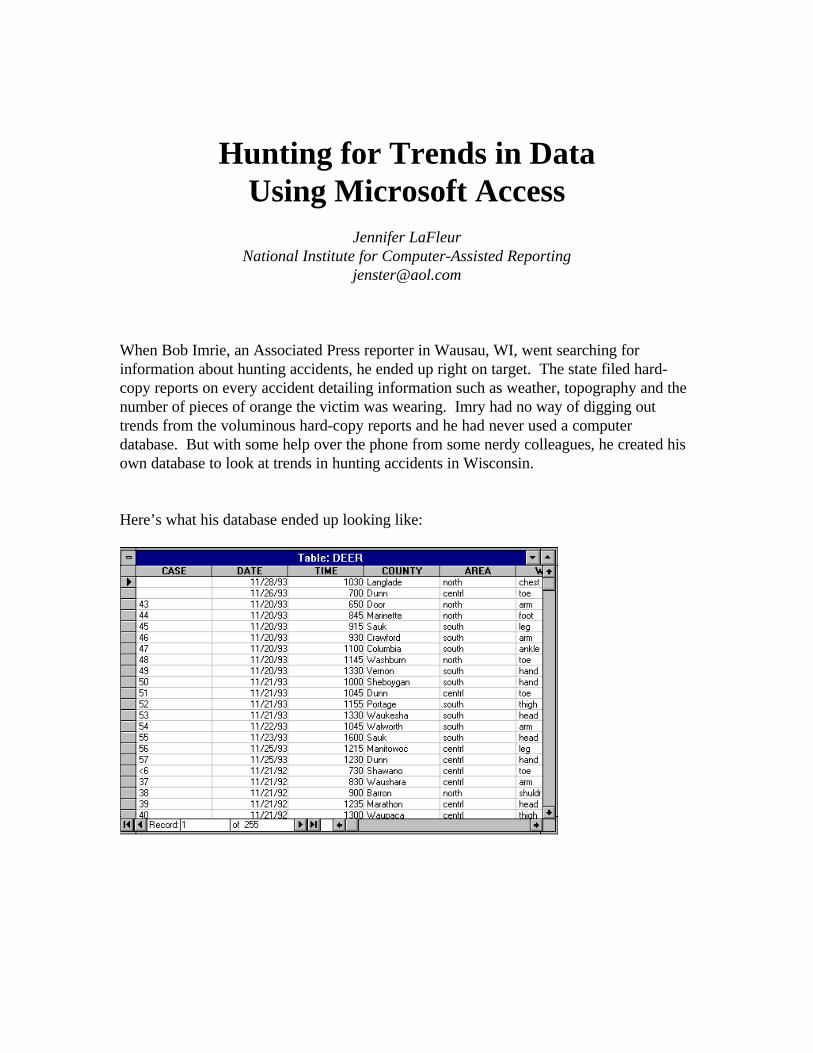
Here’s what his database ended up looking like:
2
The record layout, which is the map to any database, is below. It shows the fields Imrycreated in the database, whether they were characters or numbers and the width of eachfield:
Field Field Name Type Width Description
1 CASE Character 10 This is an identifier he created 2 DATE Date 8 Date of accident 3 TIME Numeric 4 Time of accident 4 COUNTY Character 11 County of accident 5 AREA Character 6 Region of state (he created the areas) 6 WOUND Character 6 Part of body wounded 7 INJURY Character 5 Severity of injury 8 TYPE Character 2 Self-inflicted, or other (si=self-inflicted, sp=second
person) 9 CAUSE Character 30 Description of cause 10 SAGE Numeric 2 Age of shooter 11 VAGE Numeric 2 Age of victim 12 FIREARM Character 7 Type of firearm 13 FACTION Character 6 Faction of gun 14 ALCOHOL Character 3 Alcohol involved 15 ALCOLEV Numeric 5 Alcohol level 16 WEATHER Character 11 Weather 17 TOPOGRO Character 10 Typography 18 SEXPER Numeric 2 Years of shooter’s experience 19 VEXPER Numeric 2 Years of victim’s experience 20 SGRADUATE Character 3 Shooter graduate of safety school 21 VGRADUATE Character 3 Victim graduate of safety school 22 SSEX Character 1 Sex of shooter 23 VSEX Character 1 Sex of victim 24 GUNBRND Character 13 Brand of gun 25 GUNGUAGE Character 10 Guage of gun 26 TEMP Numeric 2 Temperature 27 MUZDIS Numeric 5 Muzzle distance 28 LAND Character 3 Private or public 29 VORANGE Numeric 1 Number of pieces of orange worn by victim 30 GUNSIGHT Character 5 Open, scope or other 31 VACTIVTY Character 10 Victim’s activity 32 LOCATION Character 6 Location of victim 33 PRECIP Character 3 Precipitation
3
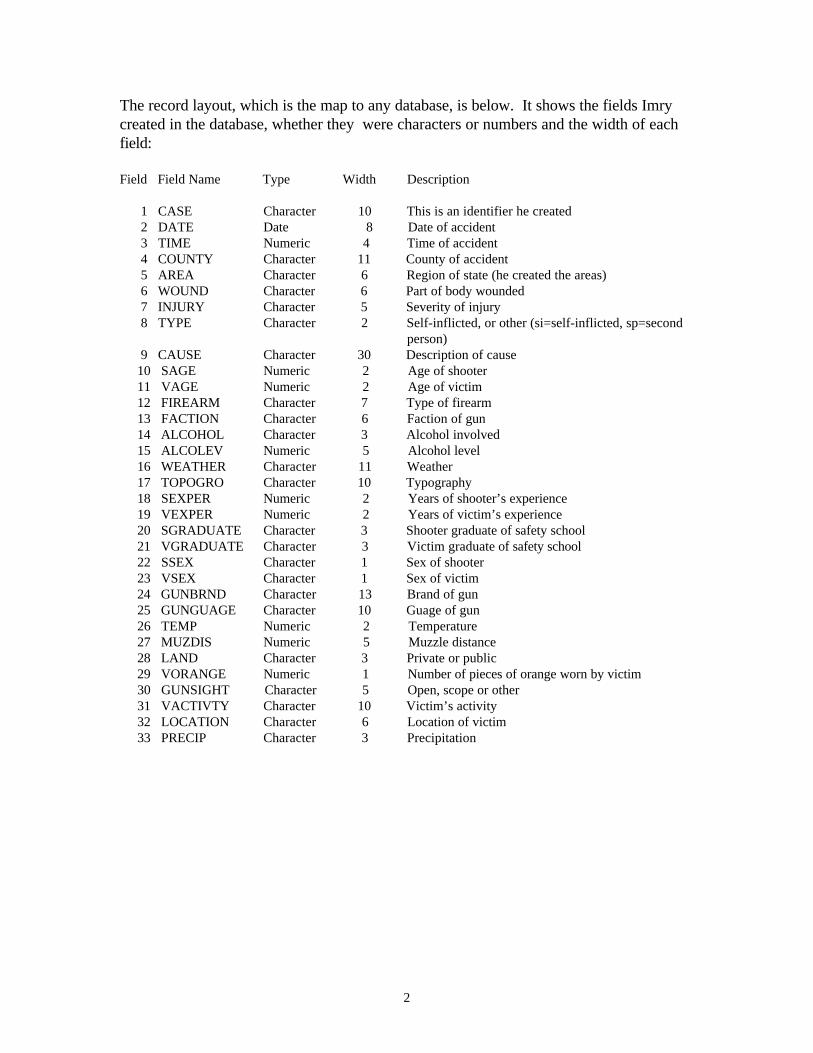
To bring up the data yourself, go to FILE/OPEN and in the data directory, open a filecalled Hunting.mdb.
In Access a database may contain several individual data sets called “tables.” To open theDeer table, select it and click OPEN. Access will open the database to a browse window.
Interview your data.
Just as you do with people, you must get to know your data. Study it, look for patterns,look for special codes, upper case, lower case: all this will help when it’s time to askquestions.
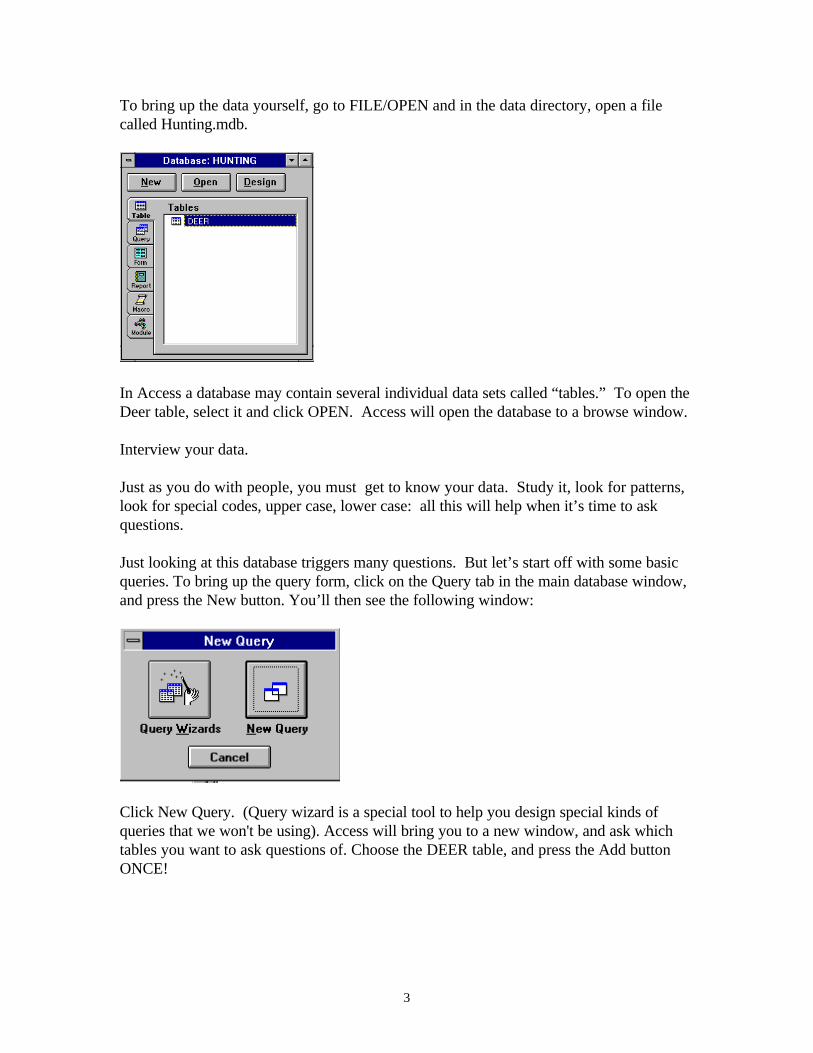
Just looking at this database triggers many questions. But let’s start off with some basicqueries. To bring up the query form, click on the Query tab in the main database window,and press the New button. You’ll then see the following window:
Click New Query. (Query wizard is a special tool to help you design special kinds ofqueries that we won't be using). Access will bring you to a new window, and ask whichtables you want to ask questions of. Choose the DEER table, and press the Add buttonONCE!

4
Then press the Close button.
Let’s review the query form because it’s the place you’ll hang out the most in Access:
1. Field... Select Fields: this is where you pick the pieces of information you want to see2. Sort... Put in order: do you want the most at the top, the oldest at the top?3. Criteria: Pick the records you want. This allows you to limit filter out just some ofyour records.
These steps may seem overly fussy, but if you follow them in more complex queries youcan save yourself some trouble. Let’s practice the first step by doing a query to show thefollowing fields: DATE, COUNTY, WOUND and INJURY. Do this by dragging each ofthese field names from the list of fields in the upstairs window area down into thedownstairs window area. (You can also double-click on the name of the field.) When youchoose a field, Access automatically adds an X to the checkbox. This means it will showin your result.
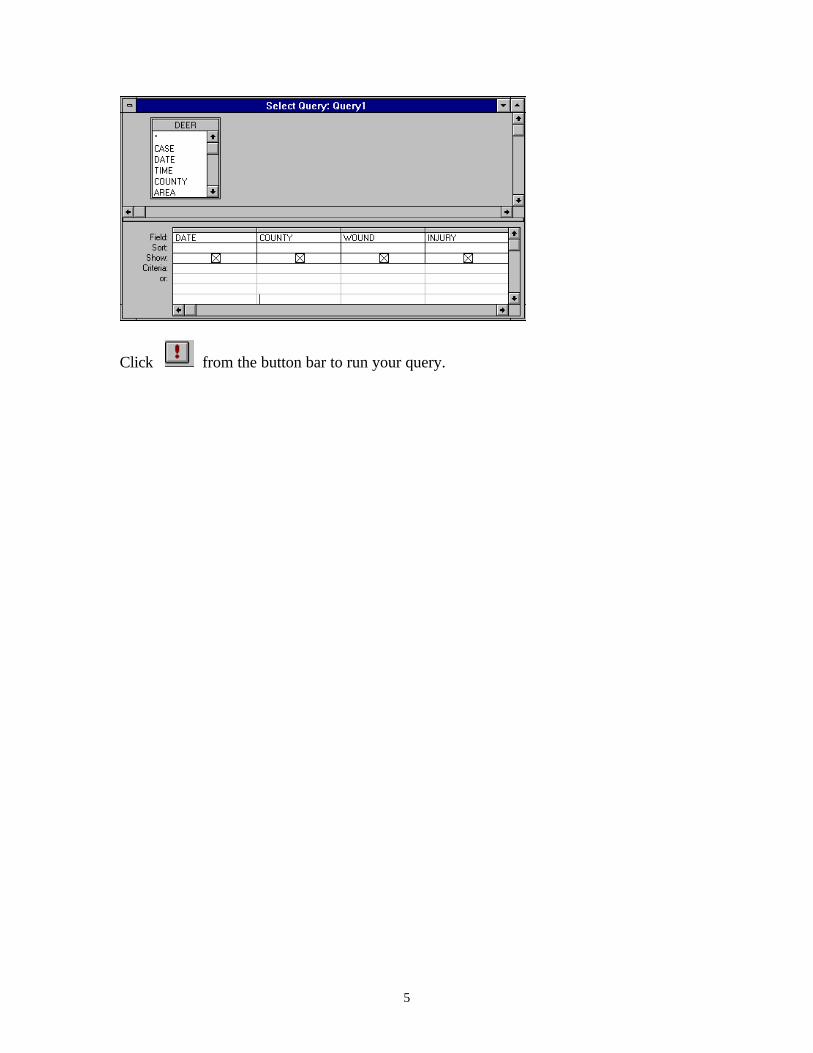
5
Click from the button bar to run your query.

6
Your result should look like this:
The second step to any query is to sort it. In this case, we could organize the records byDATE. To go from your results back to your query window, hit the VIEW/QUERYDESIGN. Or use these buttons to toggle between the answer and the query form:
^ ^design table
To sort the data click in the box right below the field name. In this case, click below date.The query form also says “sort” on the left end of this line.
Pick the kind of sort you want.
Run the query. Your answer should appear in descending date order (or the most recentfirst).
7
Limit the records
Step three of any query lets you take a bite out of your data. Say you didn’t really careabout all the deer hunting accidents in Wisconsin, you just wanted to see them for JacksonCounty. That’s where the CRITERIA line of the query comes in handy. Click on thecriteria line, in the COUNTY field and type: Jackson
Access is sometimes case-sensitive, so if Jackson is upper case -- type it that way in yourquery.
Other comparisons:
If you’re screening your data, but you don’t know the whole word in a field, Access willlet you estimate using a *, which is called a “wildcard.” A wildcard stands for anycombination of letters or numbers.
Typing this in the cause field would pull out all causes beginning with Careless:
Careless* à Acces will change this to Like "Careless*"
This would pull out all causes containing the word wife:
*wife*
Let’s get Boolean
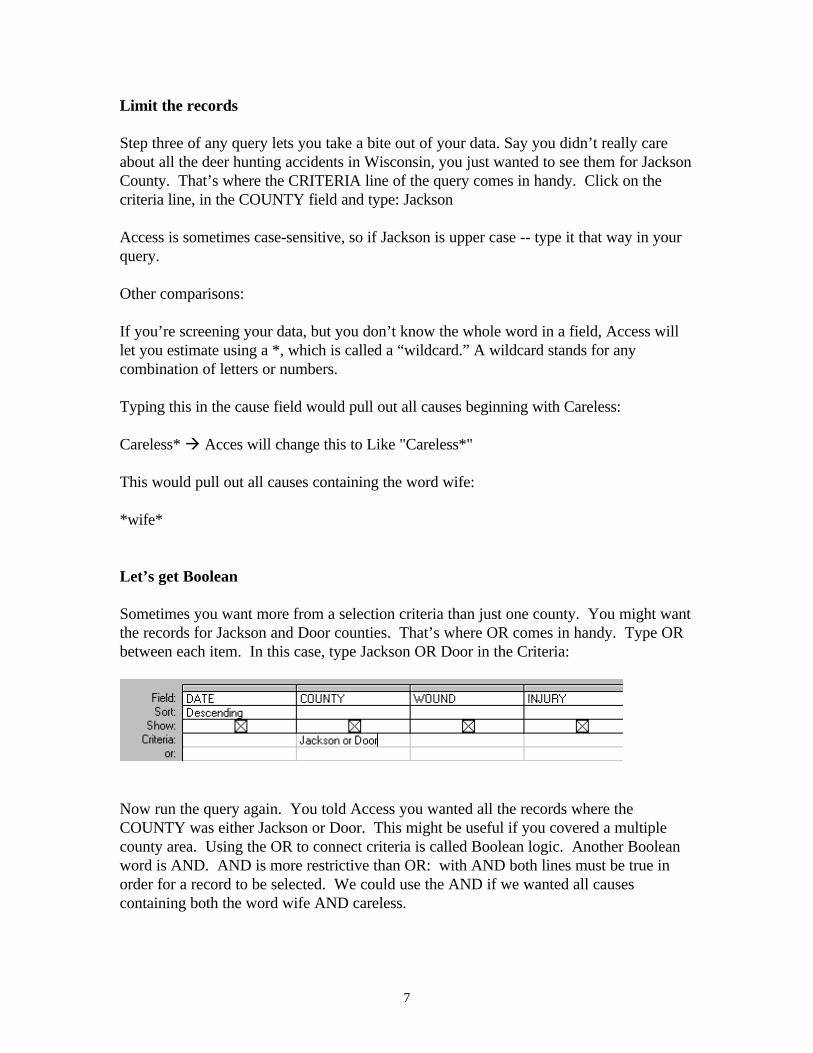
Sometimes you want more from a selection criteria than just one county. You might wantthe records for Jackson and Door counties. That’s where OR comes in handy. Type ORbetween each item. In this case, type Jackson OR Door in the Criteria:
Now run the query again. You told Access you wanted all the records where theCOUNTY was either Jackson or Door. This might be useful if you covered a multiplecounty area. Using the OR to connect criteria is called Boolean logic. Another Booleanword is AND. AND is more restrictive than OR: with AND both lines must be true inorder for a record to be selected. We could use the AND if we wanted all causescontaining both the word wife AND careless.
8
This example also uses the *. This is a “wildcard” that stands for any combination ofletters and numbers in Access. Careless* stands for any cause starting with Careless.*wife* stands for any cause containing the word wife.
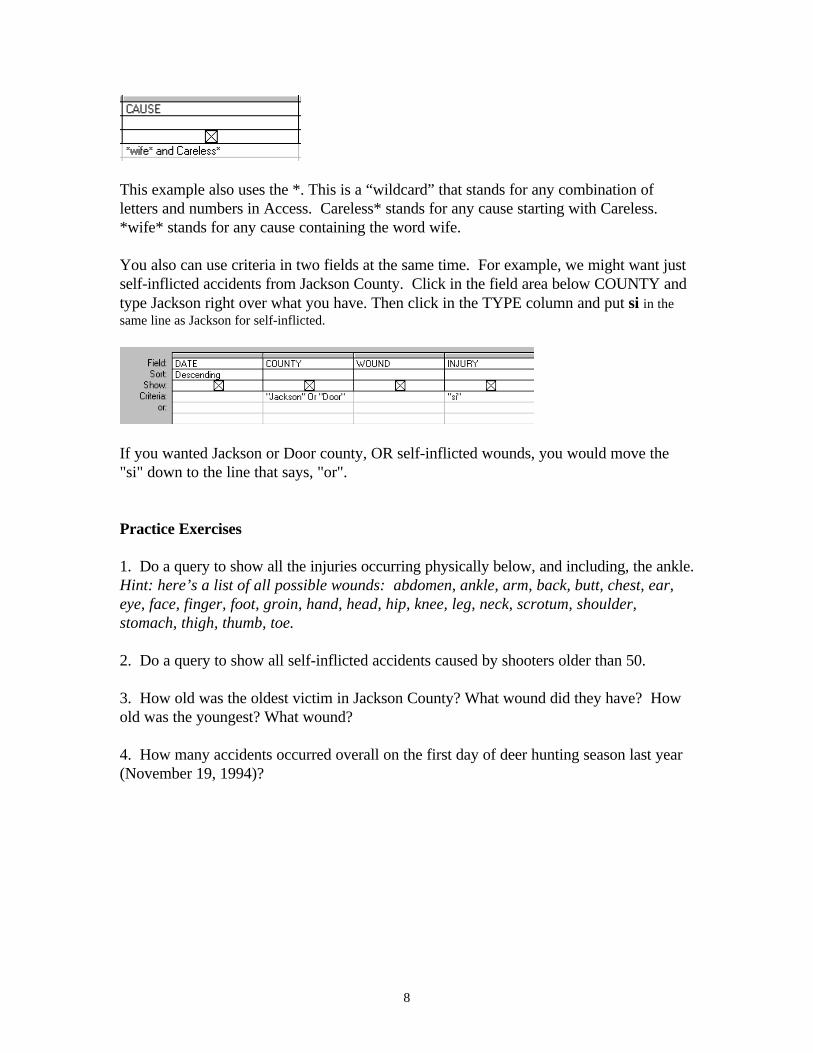
You also can use criteria in two fields at the same time. For example, we might want justself-inflicted accidents from Jackson County. Click in the field area below COUNTY andtype Jackson right over what you have. Then click in the TYPE column and put si in thesame line as Jackson for self-inflicted.
If you wanted Jackson or Door county, OR self-inflicted wounds, you would move the"si" down to the line that says, "or".
Practice Exercises
1. Do a query to show all the injuries occurring physically below, and including, the ankle.Hint: here’s a list of all possible wounds: abdomen, ankle, arm, back, butt, chest, ear,eye, face, finger, foot, groin, hand, head, hip, knee, leg, neck, scrotum, shoulder,stomach, thigh, thumb, toe.
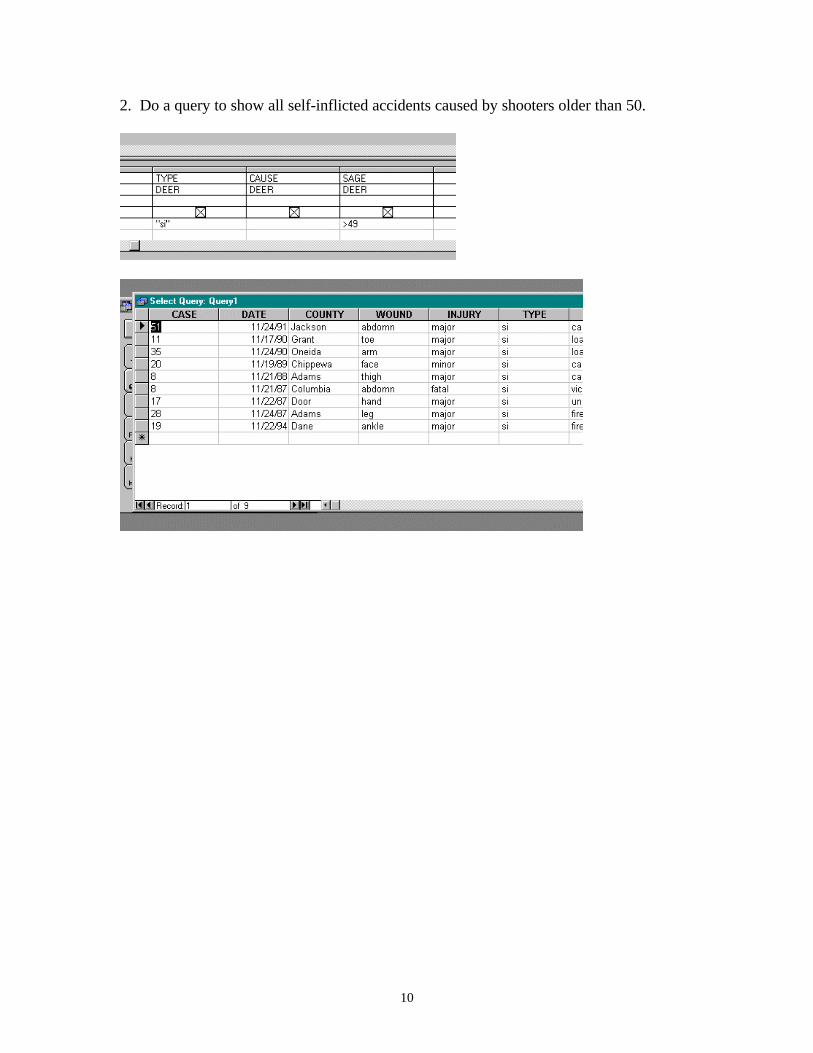
2. Do a query to show all self-inflicted accidents caused by shooters older than 50.
3. How old was the oldest victim in Jackson County? What wound did they have? Howold was the youngest? What wound?
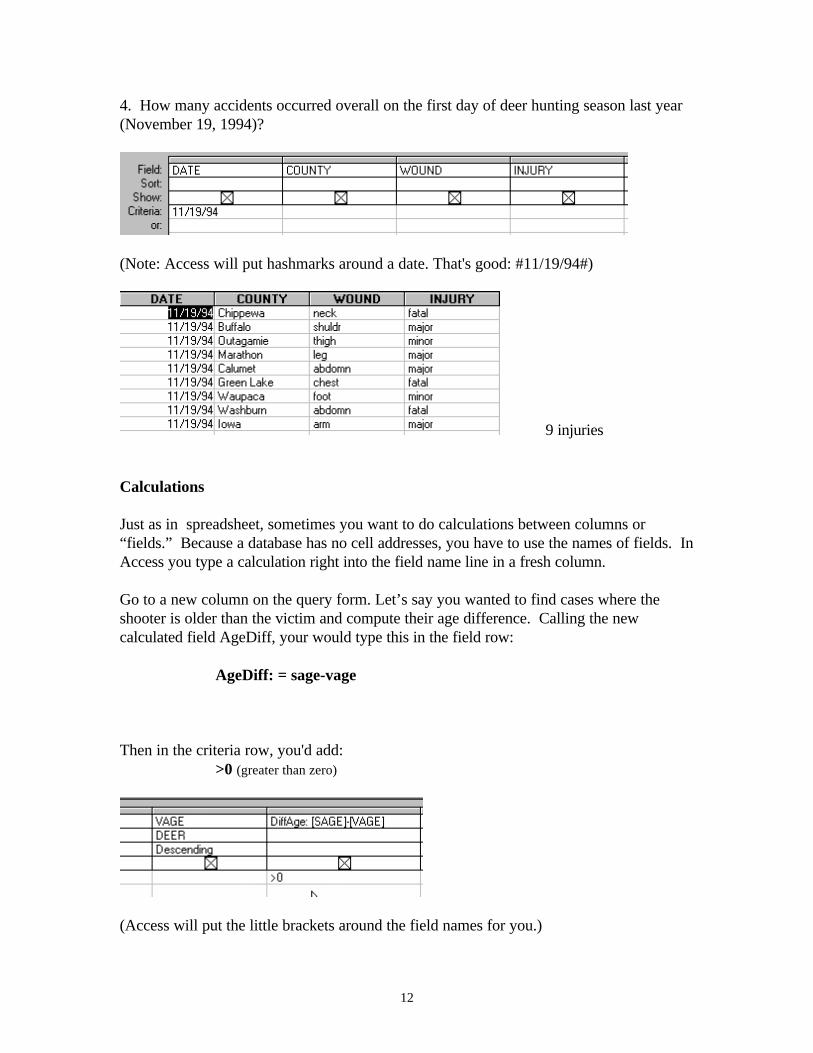
4. How many accidents occurred overall on the first day of deer hunting season last year(November 19, 1994)?
9
Answers
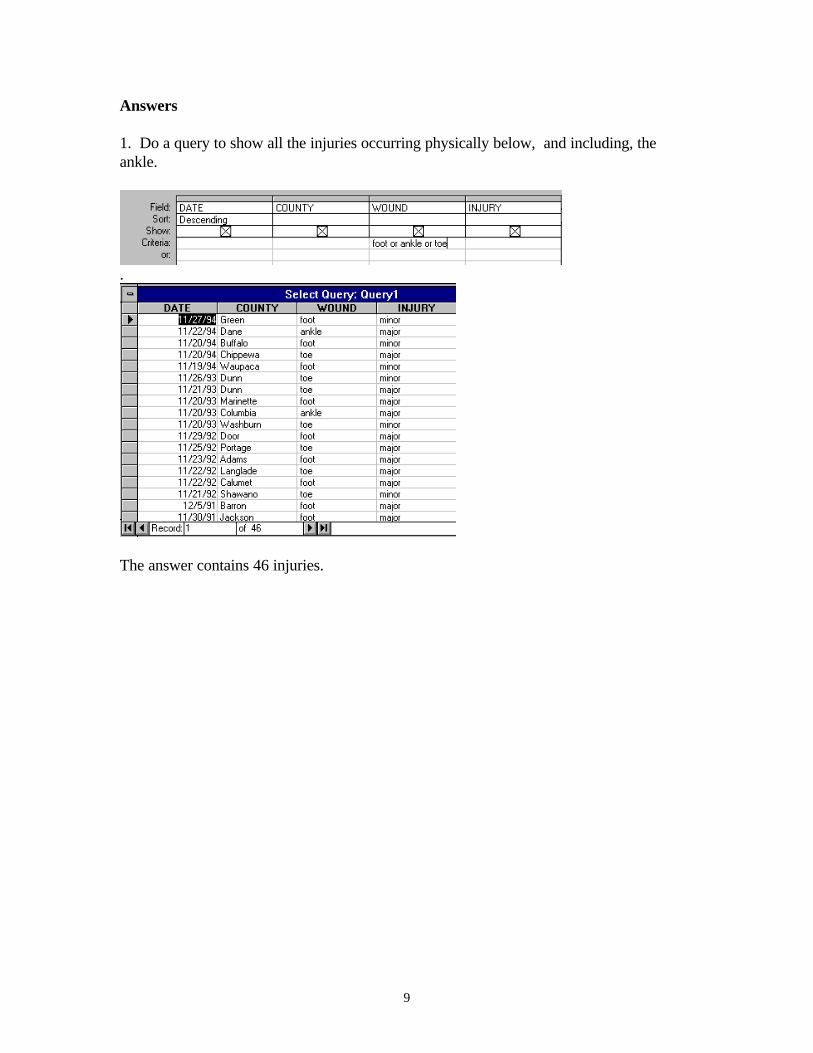
1. Do a query to show all the injuries occurring physically below, and including, theankle.
.
The answer contains 46 injuries.
10
2. Do a query to show all self-inflicted accidents caused by shooters older than 50.

11
3. How old was the oldest victim in Jackson County? What wound did they have? Howold was the youngest? What wound?
Oldest: 62, thigh Youngest: 14, foot
12
4. How many accidents occurred overall on the first day of deer hunting season last year(November 19, 1994)?
(Note: Access will put hashmarks around a date. That's good: #11/19/94#)
9 injuries
Calculations
Just as in spreadsheet, sometimes you want to do calculations between columns or“fields.” Because a database has no cell addresses, you have to use the names of fields. InAccess you type a calculation right into the field name line in a fresh column.
Go to a new column on the query form. Let’s say you wanted to find cases where theshooter is older than the victim and compute their age difference. Calling the newcalculated field AgeDiff, your would type this in the field row:
AgeDiff: = sage-vage
Then in the criteria row, you'd add:>0 (greater than zero)
(Access will put the little brackets around the field names for you.)

13
Then click the Run button.
14
Data Groupies
The fourth step of any query is the most powerful: GROUP BY lets you summarize yourentire database. For example, in our deer database, we might want to know what the mostcommon injury is. Before you do the query, think about what your result might look like.(I always think about what the chart I might print in the newspaper would look like.) Inthis case I would have two columns: the wounds and the number of times each woundoccurred. My headline would be: What Gets Wounded in All Hunting Accidents.Let’s step through the four query steps:
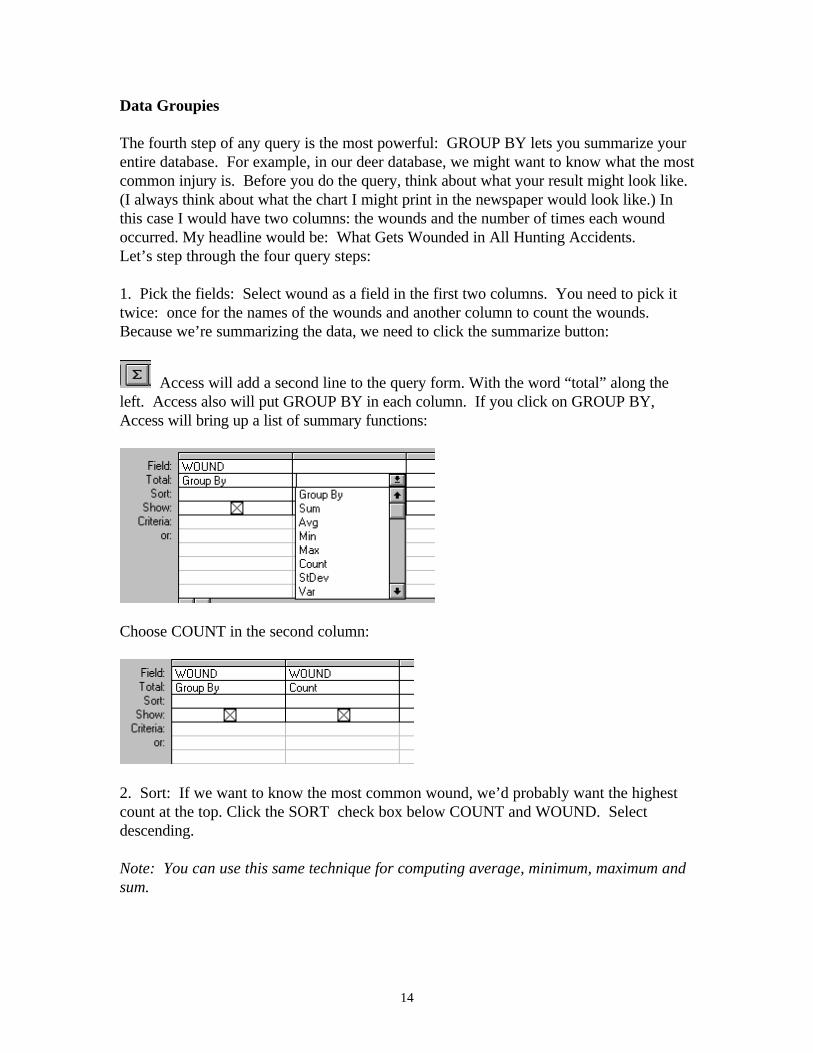
1. Pick the fields: Select wound as a field in the first two columns. You need to pick ittwice: once for the names of the wounds and another column to count the wounds.Because we’re summarizing the data, we need to click the summarize button:
Access will add a second line to the query form. With the word “total” along theleft. Access also will put GROUP BY in each column. If you click on GROUP BY,Access will bring up a list of summary functions:
Choose COUNT in the second column:
2. Sort: If we want to know the most common wound, we’d probably want the highestcount at the top. Click the SORT check box below COUNT and WOUND. Selectdescending.
Note: You can use this same technique for computing average, minimum, maximum andsum.
15
3. Pick the records: Think of this step as the headline on your chart in the paper. In thiscase our headline is for ALL hunting accidents, not just self-inflicted, not just old hunters,but everyone. So here, we have no selection criteria, because we are not narrowing ourpopulation.
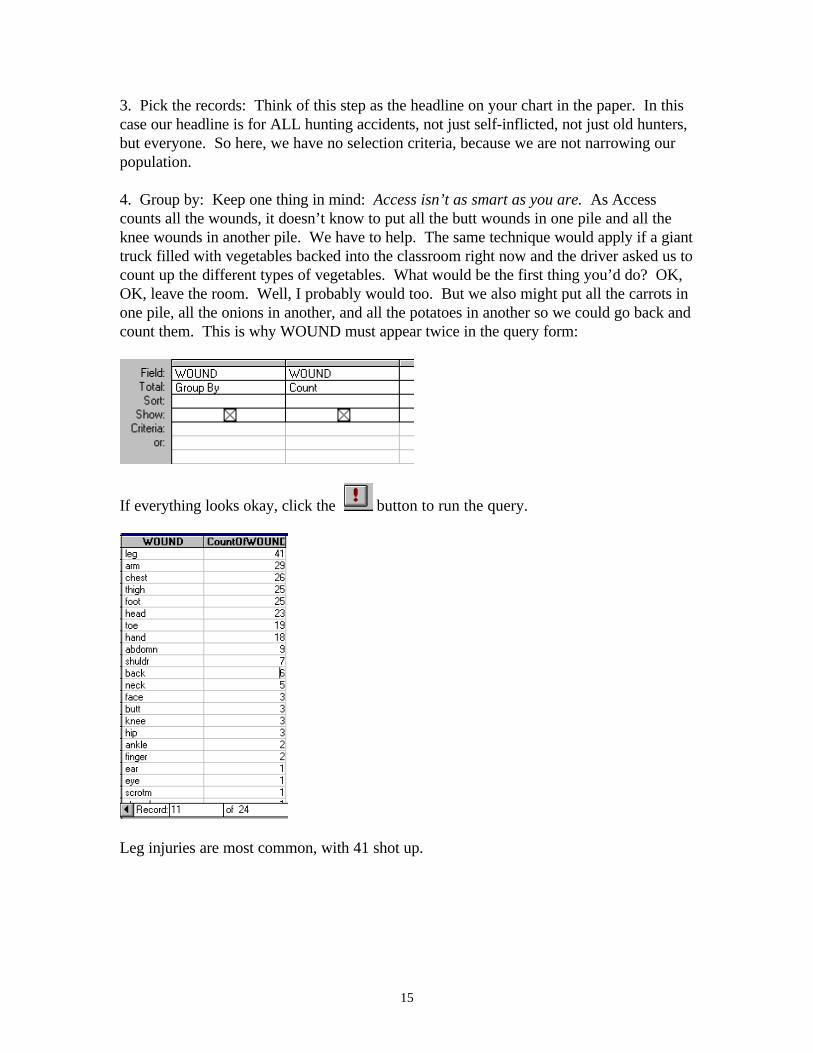
4. Group by: Keep one thing in mind: Access isn’t as smart as you are. As Accesscounts all the wounds, it doesn’t know to put all the butt wounds in one pile and all theknee wounds in another pile. We have to help. The same technique would apply if a gianttruck filled with vegetables backed into the classroom right now and the driver asked us tocount up the different types of vegetables. What would be the first thing you’d do? OK,OK, leave the room. Well, I probably would too. But we also might put all the carrots inone pile, all the onions in another, and all the potatoes in another so we could go back andcount them. This is why WOUND must appear twice in the query form:
If everything looks okay, click the button to run the query.
Leg injuries are most common, with 41 shot up.
16
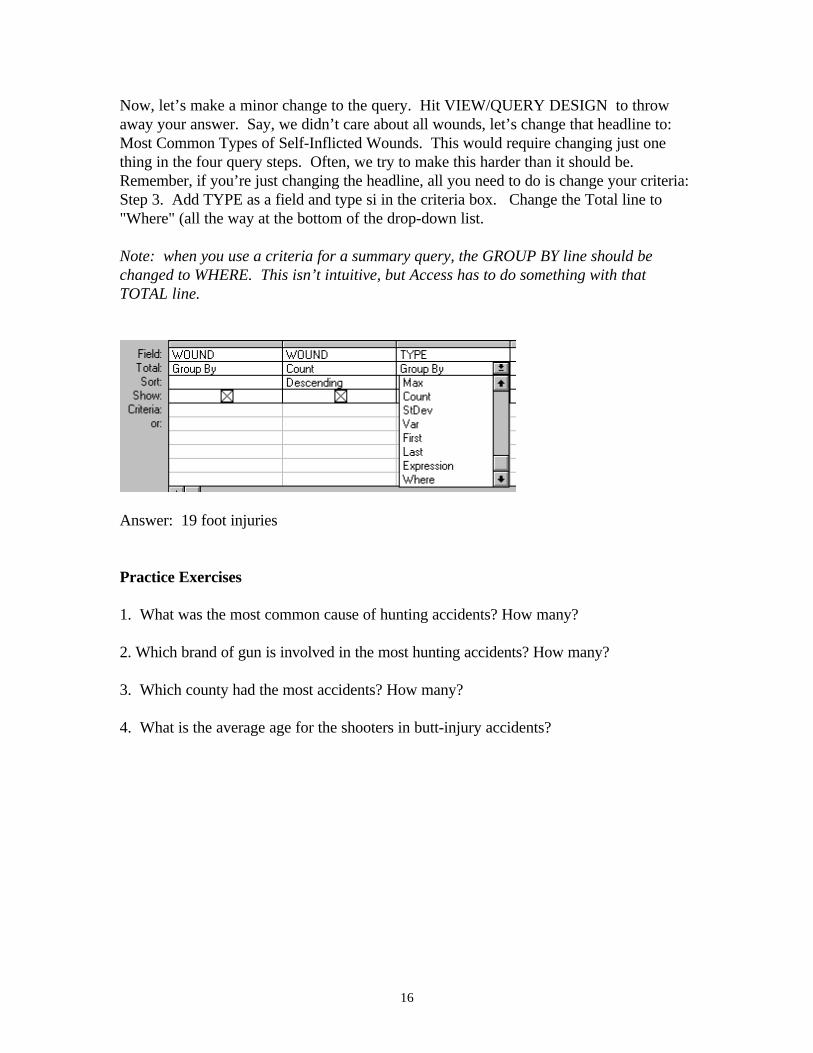
Now, let’s make a minor change to the query. Hit VIEW/QUERY DESIGN to throwaway your answer. Say, we didn’t care about all wounds, let’s change that headline to:Most Common Types of Self-Inflicted Wounds. This would require changing just onething in the four query steps. Often, we try to make this harder than it should be.Remember, if you’re just changing the headline, all you need to do is change your criteria:Step 3. Add TYPE as a field and type si in the criteria box. Change the Total line to"Where" (all the way at the bottom of the drop-down list.
Note: when you use a criteria for a summary query, the GROUP BY line should bechanged to WHERE. This isn’t intuitive, but Access has to do something with thatTOTAL line.
Answer: 19 foot injuries
Practice Exercises
1. What was the most common cause of hunting accidents? How many?
2. Which brand of gun is involved in the most hunting accidents? How many?
3. Which county had the most accidents? How many?
4. What is the average age for the shooters in butt-injury accidents?
17
Answers
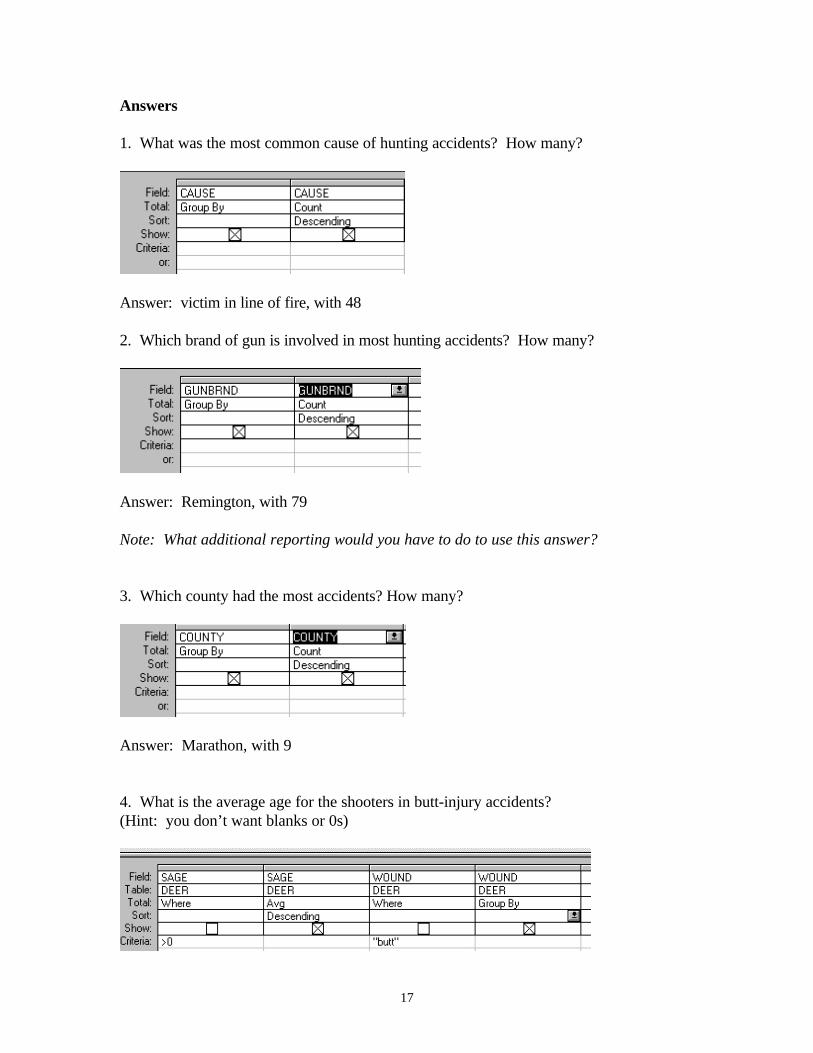
1. What was the most common cause of hunting accidents? How many?
Answer: victim in line of fire, with 48
2. Which brand of gun is involved in most hunting accidents? How many?
Answer: Remington, with 79
Note: What additional reporting would you have to do to use this answer?
3. Which county had the most accidents? How many?
Answer: Marathon, with 9
4. What is the average age for the shooters in butt-injury accidents?(Hint: you don’t want blanks or 0s)
18
Answer: 16.5
Multi-Groupies
Another approach to the counting up self-inflicted wounds might be to group by bothWOUND and TYPE.
The steps:
1. Select WOUND, TYPE and COUNT of ?????. It can be difficult to decide what tocount, but here’s a hint: count will total the different combinations of everything yougroup by. But it will only count records that are filled in for the field you select. In ourdatabase, WOUND is always filled out. So let’s just ask for COUNT in a new WOUNDcolumn.
2. Order by: Do it so the biggest count is on top.
3. Selection criteria: I know, I know, we just pulled out self-inflicted. But now we wantboth self-inflicted, plus the other types. So remove the selection criteria.
4. Group by: group by both WOUND and TYPE.
19
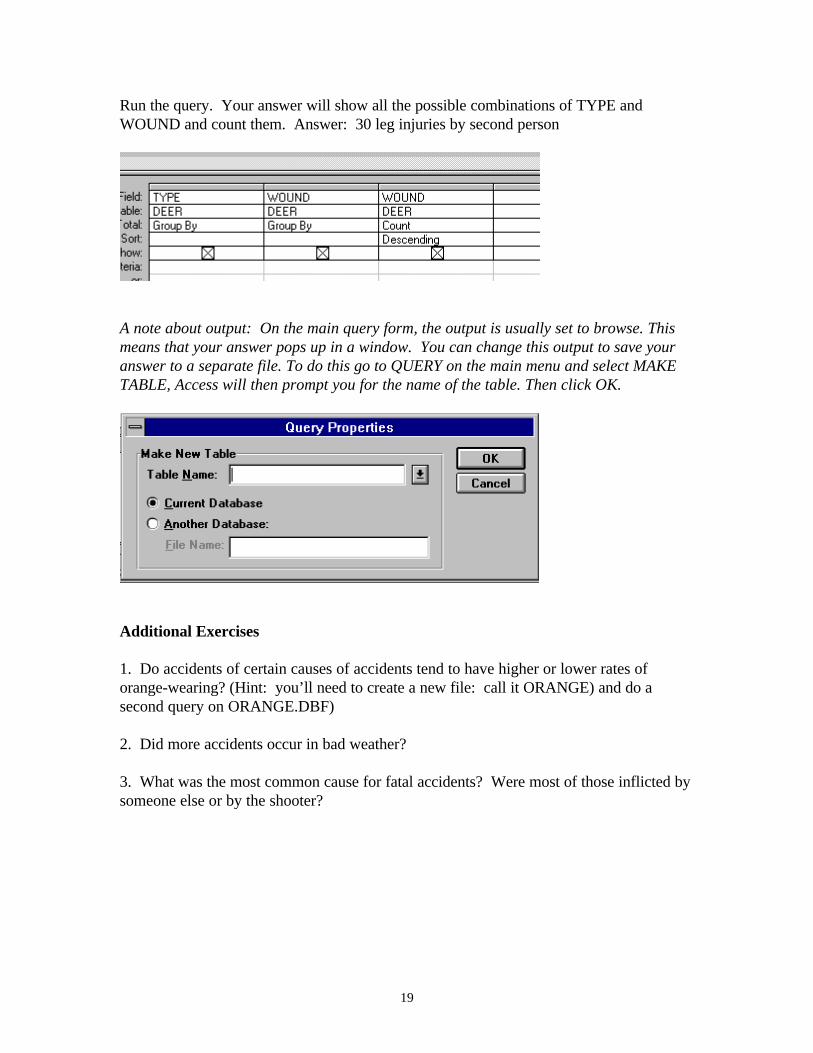
Run the query. Your answer will show all the possible combinations of TYPE andWOUND and count them. Answer: 30 leg injuries by second person
A note about output: On the main query form, the output is usually set to browse. Thismeans that your answer pops up in a window. You can change this output to save youranswer to a separate file. To do this go to QUERY on the main menu and select MAKETABLE, Access will then prompt you for the name of the table. Then click OK.
Additional Exercises
1. Do accidents of certain causes of accidents tend to have higher or lower rates oforange-wearing? (Hint: you’ll need to create a new file: call it ORANGE) and do asecond query on ORANGE.DBF)
2. Did more accidents occur in bad weather?
3. What was the most common cause for fatal accidents? Were most of those inflicted bysomeone else or by the shooter?
20
Answers
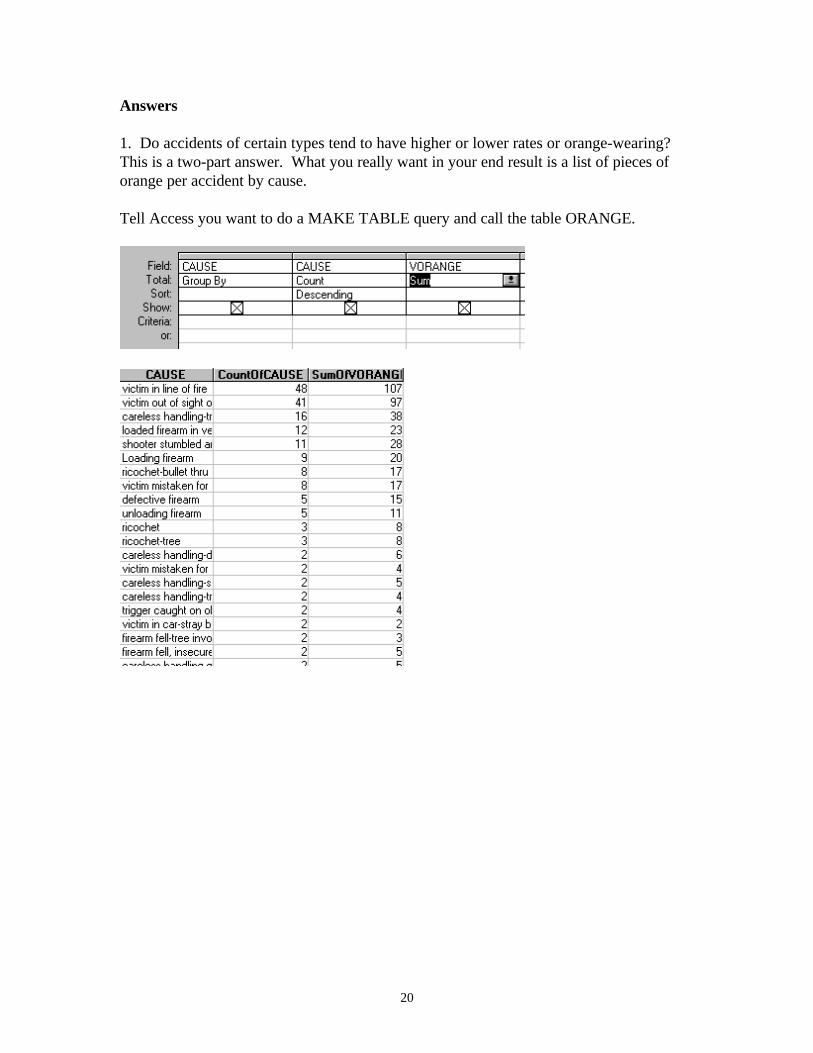
1. Do accidents of certain types tend to have higher or lower rates or orange-wearing?This is a two-part answer. What you really want in your end result is a list of pieces oforange per accident by cause.
Tell Access you want to do a MAKE TABLE query and call the table ORANGE.
21
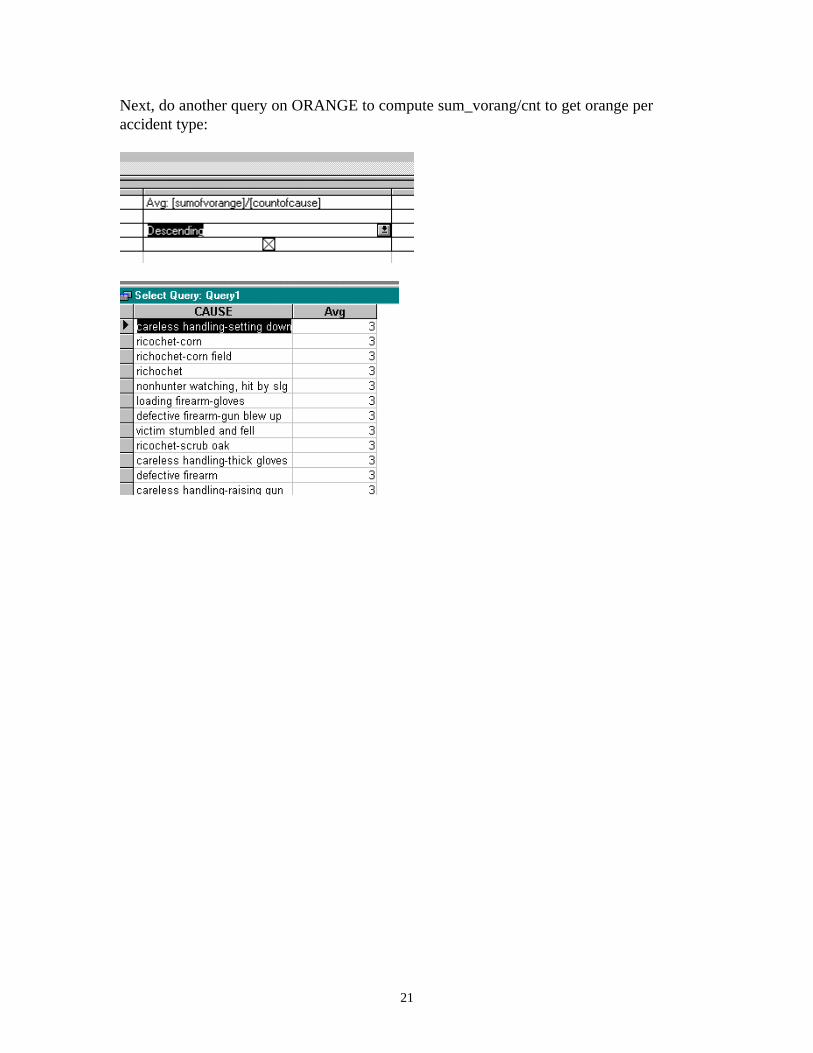
Next, do another query on ORANGE to compute sum_vorang/cnt to get orange peraccident type:

22
3. Did more accidents occur in bad weather? What other fields could you use for thisquery?
Answer: no, most accidents occurred in clear weather.
23
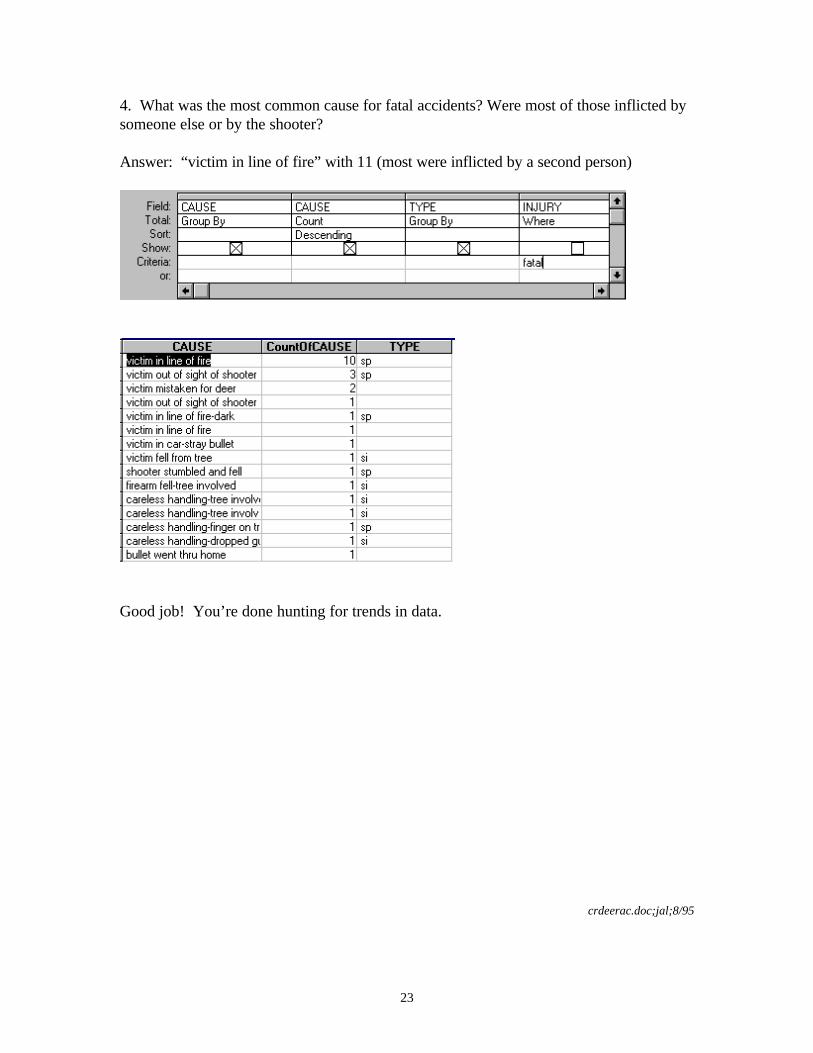
4. What was the most common cause for fatal accidents? Were most of those inflicted bysomeone else or by the shooter?
Answer: “victim in line of fire” with 11 (most were inflicted by a second person)
Good job! You’re done hunting for trends in data.
crdeerac.doc;jal;8/95