Embed Size (px)
Citation preview
1
High performance organizations in the Vietnamese banking industry
André de Waal, Hai Duong and Vu Ton
ABSTRACT
Since Vietnam joined the World Trade Organization (WTO) in January 2007, the
country has faced a number of challenges to comply with WTO requirements. One of
these challenges was to reorganize Vietnam’s banking sector so it would comply with
WTO commitments, entailing that banks from other countries are now allowed to do
business in Vietnam with the same rights and privileges as local banks. This spurred
Vietnamese banks on to improve their competitiveness and increase their
performance as otherwise they would inevitably lag behind foreign competitors. The
research described in this paper was aimed at finding the factors that make
Vietnamese banks excellent. Using the HPO framework (Waal, 2007) made it
possible to not only identify the factors that have a direct correlation with the
performance of a Vietnamese bank, but to also establish the characteristics that make
the difference between a leading bank and a lagging bank. These characteristics are a
unique strategy, excellent process management, continuous improvement of core
competencies and products and services, management that applies fast decision and
action taking, employees which are flexible and resilient and who are involved in
important business processes, and a diverse and complementary workforce.
Keywords: high performance organizations, competitive performance, banking industry, Vietnam
INTRODUCTION
Vietnam’s economy continues to grow strongly, with GDP in 2006 growing 8.2 percent
(IMF, 2006) and in 2007 at 8.4% (General Statistics Office of Vietnam, 2007). Both the
industry and service sectors (which include trade, hospitality and tourism, banking, education,
real estate, and consulting services) contributes 40 percent to the total country GDP while the
portion for agricultural sector (where 57 percent of the total population is employed) was
merely 20 percent (Nguyen, 2005). The increase in the service and industry shares of the GDP
is largely a consequence of the expansion of the private sector (Citigroup, 2007). At the end
2
of 2005, the population of Vietnam was 83.1 million (World Bank, 2007). Seventy percent of
this population is living in rural areas versus 30 percent living in urban areas (General
Statistics Office of Vietnam). Most of the citizens in rural area have limited access to banking
service except for loan services, and only eight percent of them has a bank account. Overall,
95 percent of the country’s population is in the labour force. However, quality of the work
force is an issue, there is a shortage of high quality human resources especially in the banking
and financial sectors (Nguyen, 2005).
Since Vietnam joined the World Trade Organization (WTO) in January 2007, the country has
faced a number of challenges to comply with WTO requirements. One of these challenges
was to review Vietnam’s policies in the banking sector so these would comply with WTO
commitments, while at the same time implementing bilateral agreements such as the ASEAN
Free Trade Agreement (AFTA) and Bilateral Trade Agreement (BTA) (Le Xuan Nghia,
2006). This resulted in a rigorous restructuring and reform program in the Vietnamese
banking sector, which spurred the Vietnamese banks on to do everything in their power to
improve their competitiveness and increase their performance as otherwise they would
inevitably lag behind foreign competitors. This is all the more important as, because of the
WTO regulations, banks from other countries are now allowed to do business in Vietnam with
the same rights and privileges as local banks.
The Vietnamese banking industry can currently be divided into four categories: 7 state-owned
commercial banks (SOCBs), 35 joint stock banks (JSBs), 37 foreign owned banks (FBs), and
6 joint venture banks (JVBs). Because JVBS have a market share in terms of lending or
deposit of below 2 percent and because they exhibit the characteristics of both partnering
banks, it was decided to focus the research on the Vietnamese (SOCBs and JSBs) and foreign
owned bank. Table 1 provides market shares for these banks.
3
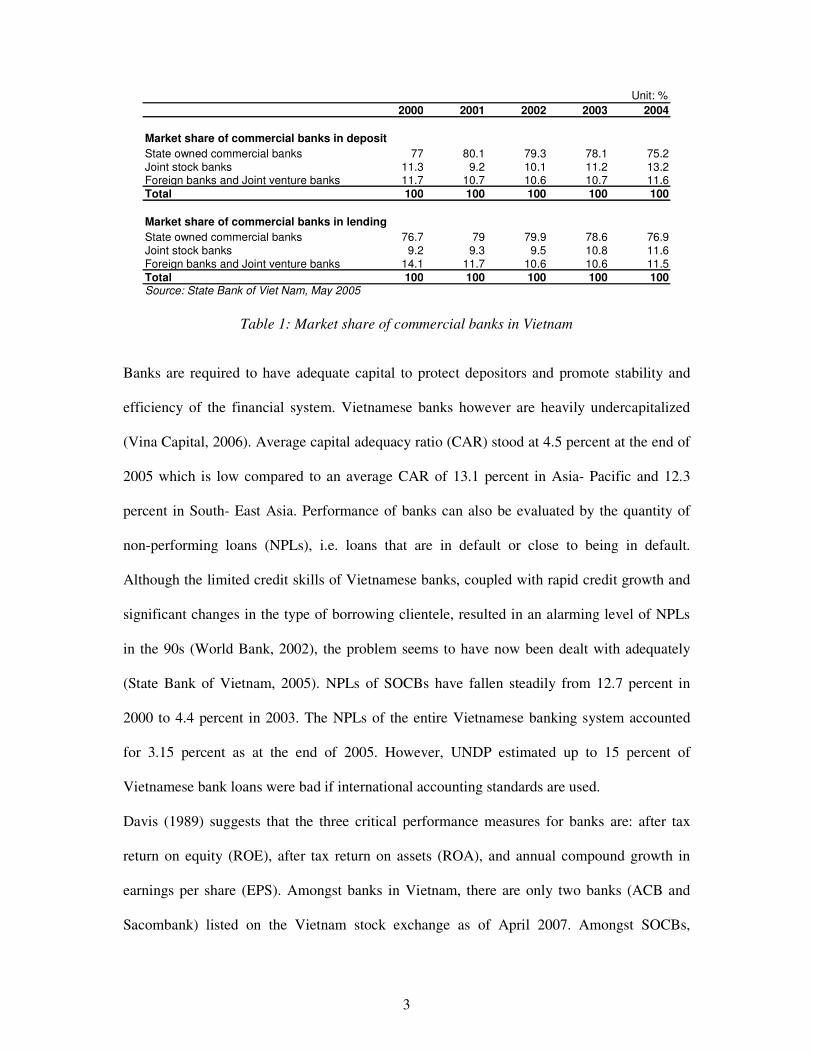
Unit: %
2000 2001 2002 2003 2004
State owned commercial banks 77 80.1 79.3 78.1 75.2Joint stock banks 11.3 9.2 10.1 11.2 13.2Foreign banks and Joint venture banks 11.7 10.7 10.6 10.7 11.6
Total 100 100 100 100 100
State owned commercial banks 76.7 79 79.9 78.6 76.9Joint stock banks 9.2 9.3 9.5 10.8 11.6Foreign banks and Joint venture banks 14.1 11.7 10.6 10.6 11.5
Total 100 100 100 100 100Source: State Bank of Viet Nam, May 2005
Market share of commercial banks in lending
Market share of commercial banks in deposit
Table 1: Market share of commercial banks in Vietnam
Banks are required to have adequate capital to protect depositors and promote stability and
efficiency of the financial system. Vietnamese banks however are heavily undercapitalized
(Vina Capital, 2006). Average capital adequacy ratio (CAR) stood at 4.5 percent at the end of
2005 which is low compared to an average CAR of 13.1 percent in Asia- Pacific and 12.3
percent in South- East Asia. Performance of banks can also be evaluated by the quantity of
non-performing loans (NPLs), i.e. loans that are in default or close to being in default.
Although the limited credit skills of Vietnamese banks, coupled with rapid credit growth and
significant changes in the type of borrowing clientele, resulted in an alarming level of NPLs
in the 90s (World Bank, 2002), the problem seems to have now been dealt with adequately
(State Bank of Vietnam, 2005). NPLs of SOCBs have fallen steadily from 12.7 percent in
2000 to 4.4 percent in 2003. The NPLs of the entire Vietnamese banking system accounted
for 3.15 percent as at the end of 2005. However, UNDP estimated up to 15 percent of
Vietnamese bank loans were bad if international accounting standards are used.
Davis (1989) suggests that the three critical performance measures for banks are: after tax
return on equity (ROE), after tax return on assets (ROA), and annual compound growth in
earnings per share (EPS). Amongst banks in Vietnam, there are only two banks (ACB and
Sacombank) listed on the Vietnam stock exchange as of April 2007. Amongst SOCBs,
4
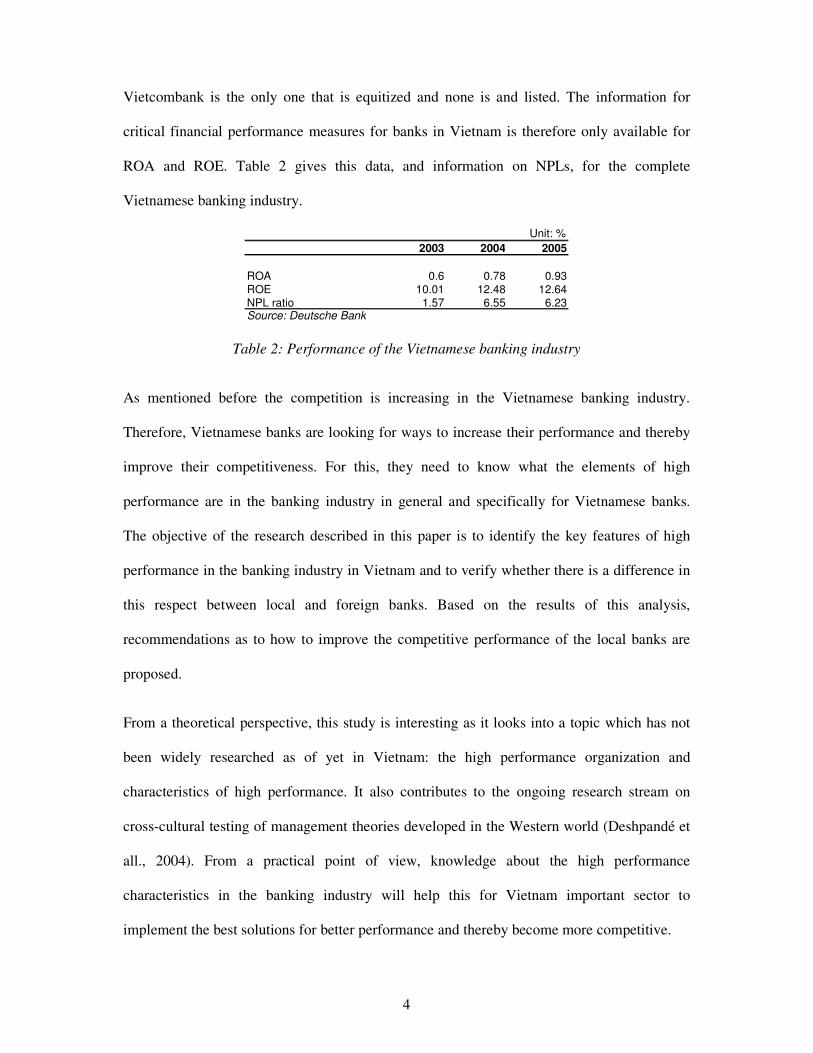
Vietcombank is the only one that is equitized and none is and listed. The information for
critical financial performance measures for banks in Vietnam is therefore only available for
ROA and ROE. Table 2 gives this data, and information on NPLs, for the complete
Vietnamese banking industry.
Unit: %
2003 2004 2005
ROA 0.6 0.78 0.93ROE 10.01 12.48 12.64NPL ratio 1.57 6.55 6.23Source: Deutsche Bank
Table 2: Performance of the Vietnamese banking industry
As mentioned before the competition is increasing in the Vietnamese banking industry.
Therefore, Vietnamese banks are looking for ways to increase their performance and thereby
improve their competitiveness. For this, they need to know what the elements of high
performance are in the banking industry in general and specifically for Vietnamese banks.
The objective of the research described in this paper is to identify the key features of high
performance in the banking industry in Vietnam and to verify whether there is a difference in
this respect between local and foreign banks. Based on the results of this analysis,
recommendations as to how to improve the competitive performance of the local banks are
proposed.
From a theoretical perspective, this study is interesting as it looks into a topic which has not
been widely researched as of yet in Vietnam: the high performance organization and
characteristics of high performance. It also contributes to the ongoing research stream on
cross-cultural testing of management theories developed in the Western world (Deshpandé et
all., 2004). From a practical point of view, knowledge about the high performance
characteristics in the banking industry will help this for Vietnam important sector to
implement the best solutions for better performance and thereby become more competitive.
5
This paper is organized as follows. The next section discusses the high performance
organizations framework used in the study. The research approach section presents details of
the research design and procedure. The research findings section presents the results of the
completed questionnaires and interviews held at the various banks. The conclusion and
recommendations section highlights key research findings, presents key recommendations to
enable banks in Vietnam to achieve high performance, and discusses the limitations of the
research.
HPO FRAMEWORK
Recent years has seen an increasing stream of literature containing data on characteristics of
high performance organizations (HPO) and high performance frameworks. This study uses
the HPO framework as developed by Waal (2007, 2008) as this framework is based on a meta
analysis of over 280 HPO studies and therefore contains both an extensive and comprehensive
overview of the state of the art in this field. In this framework, HPOs are defined as
organizations that achieve results (both financial and non-financial) that are better than those
of their peer group over a period of time of at least five to ten years (Waal, 2007, 2008). The
basis for the framework was an extensive literature search of both scientific and professional
publications. The criteria for including studies in the comparison were: (1) the study focused
specifically at identifying HPO characteristics in certain aspects of business (such as
processes, human resources, or technology) which are explicitly linked to achieving high
performance; (2) the study consisted of either a survey with a sufficient number of
respondents so that its results can be assumed to be (fairly) representative, or of in-depth case
studies of several companies so the results are at least valid for more than a single
organization; and (3) the written documentation contains an account and justification of the
research method, research approach and selection of the research population, a clear analysis,
and clear retraceable conclusions and results, so the quality of the research can be assessed.
6
No distinction was made in the industries of the organizations studied or the countries where
these companies were established. Based on the described criteria, the literature search
yielded 280 studies which satisfied the criteria completely or partly. For each of the literature
sources the elements the authors give as being important for becoming a HPO were then
identified. These elements were transferred to a matrix in which they were classified in one of
the factors of the framework. Because every author used a different terminology in his study,
the elements were grouped into categories within each factor. Subsequently, a matrix per
factor was constructed in which each category constitutes a characteristic. For each of the
characteristics the ‘weighted importance’ was calculated, i.e. the number of times it occurred
in the various study types. Finally, the characteristics which the highest weighted importance
were chosen as the HPO characteristics that potentially make up an HPO. These
characteristics were subsequently included in a survey which was administered worldwide
and which yielded more than 2500 responses. In this survey the respondents indicated how
good their organizations were on the various HPO characteristics (on a scale of 1 to 10) and
also what their organizational results were compared to their peer group. This competitive
performance was calculated with two formulas: (1) Relative Performance (RP) versus
competitors: RP = 1 – ([RPT - RPS] / [RPT]), in which RPT = total number of competitors
and RPS = number of competitors with worse performance; (2) Historic Performance (HP)
past five years versus competitors (worse, the same, or better). These subjective measures of
organizational performance have been shown to be a good indication of real performance
(Dawes, 1999; Devinney et al., 2005; Dollinger and Golden, 1992; Glaister and Buckley,
1998; Heap and Bolton, 2004; Wall, 2004). With a statistical analysis (both correlation and
factor analysis) the factors which had the strongest correlation with organizational
performance were extracted and identified as HPO factors. In the first step of the statistical
analysis a principal component analysis with oblimin rotation was performed. This yielded
7
the grouping of 35 characteristics in five distinct HPO factors (see Appendix A). The factors
were then put in a non-parametric Mann-Whitney test to identify which ones had a
statistically significant correlation with competitive performance. The correlation was as
expected: the high-performing group scored higher on the five HPO factors than the less well-
performing group. This means that organizations that pay more attention to these HPO factors
achieve better results than their peers, in every industry, sector and country in the world.
Conversely, organizations which score low on HPO factors rank performance-wise at the
bottom of their industry. The five HPO factors are described below, further details can be
found in Waal (2005, 2007, 2008).
HPO factor 1: High Management Quality
The first factor is the quality of management of the organization. In a HPO management
combines many characteristics. It maintains trust relationships with people on all
organizational levels by valuing employees’ loyalty, treating smart people smart, showing
people respect, creating and maintaining individual relationships with employees,
encouraging belief and trust in others, and treating people fairly. Managers of a HPO live with
integrity and are a role model by being honest and sincere, showing commitment, enthusiasm
and respect, having a strong set of ethics and standards, being credible and consistent,
maintaining a sense of vulnerability and by not being self-complacent. They apply decisive,
action-focused decision-making by avoiding over-analysis but instead coming up with
decisions and effective actions, while at the same time fostering action-taking by others. HPO
management coaches and facilitates employees to achieve better results by being supportive,
helping them, protecting them from outside interference, and by being available. Management
holds people responsible for results and is decisive about non-performers by always focusing
on the achievement of results, maintaining clear accountability for performance, and making
tough decisions. Managers of a HPO develop an effective, confident and strong management
8
style by communicating the values and by making sure the strategy is known and embraced
by all organizational members.
HPO factor 2: Openness coupled with Action Orientation
The second factor concerns characteristics that not only create an open culture in the
organization but also focus on using the openness to take dedicated action to achieve results.
Management values the opinion of employees by frequently engaging in a dialogue with them
and by involving them in all important business and organizational processes. HPO
management allows experiments and mistakes by permitting employees to take risks, being
willing to take risks themselves, and seeing mistakes as an opportunity to learn. In this
respect, management welcomes and stimulates change by continuously striving for renewal,
developing dynamic managerial capabilities to enhance flexibility, and being personally
involved in change activities. People in an HPO spend much time on communication,
knowledge exchange and learning in order to obtain new ideas to do their work better and
make the complete organization performance-driven.
HPO factor 3: Long Term Commitment
The third factor indicates that long-term commitment is far more important than short-term
gain. And this long-term commitment is extended to all stakeholders of the organization, that
is shareholders but also employees, suppliers, clients and the society at large. A HPO
continuously strives to enhance customer value creation by learning what customers want,
understanding their values, building excellent relationships with them, having direct contact
with them, engaging them, being responsive to them, and focusing on continuously enhancing
customer value. A HPO maintains good and long-term relationships with all stakeholders by
networking broadly, being generous to society, and creating mutual, beneficial opportunities
and win-win relationships. A HPO also grows through partnerships with suppliers and
customers, thereby turning the organization into an international network corporation.
9
Management of a HPO is committed to the organization for the long haul by balancing
common purpose with self-interest, and teaching organizational members to put the needs of
the enterprise as a whole first. They grow new management from the own ranks by
encouraging people to become leaders, filling positions with internal talent, and promoting
from within. A HPO creates a safe and secure workplace by giving people a sense of safety
(physical and mental) and job security and by not immediately laying off people (until it
cannot be avoided, as a last resort).
HPO factor 4: Focus on Continuous Improvement and Renewal
The fourth factor is very much in line with a trend which has been keeping organizations busy
for the past two decades: continuous improvement and innovation. This starts with a HPO
adopting a strategy that will set the company apart by developing many new options and
alternatives to compensate for dying strategies. After that, the organization will do everything
in its power to fulfil this unique strategy. It continuously simplifies, improves and aligns all
its processes to improve its ability to respond to events efficiently and effectively and to
eliminate unnecessary procedures, work, and information overload. The company also
measures and reports everything that matters so it rigorously measures progress, consequently
monitors goal fulfilment and confronts the brutal facts. It reports these facts not only to
management but to everyone in the organization so that all organizational members have the
financial and non-financial information needed to drive improvement at their disposal. People
in a HPO feel a moral obligation to continuously strive for the best results. The organization
continuously innovates products, processes and services thus constantly creating new sources
of competitive advantage by rapidly develop new products and services to respond to market
changes. It also masters its core competencies and is an innovator in them by deciding and
sticking to what the company does best, keeping core competencies inside the firm and
outsourcing non-core competencies.
10
HPO factor 5: High Workforce Quality
Complementary to the first factor high management quality, the fifth factor addresses
workforce quality. A HPO makes sure it assembles a diverse and complementary
management team and workforce and recruits a workforce with maximum flexibility, to help
detect the complexities in operations and to incite creativity in solving them. A HPO
continuously works on the development of its workforce by training them to be both resilient
and flexible, letting them learn from others by going into partnerships with suppliers and
customers, inspiring them to work on their skills so they can accomplish extraordinary results,
and holding them responsible for their performance so they will be creative in looking for
new productive ways to achieve the desired results.
RESEARCH APPROACH
This study is considered to be a replicate study of which the results are compared with
existing results. Due to the nature of the replication study, we adopted the comparative study
approach. We used the HPO questionnaire as developed by Waal (2007). This questionnaire
is divided into three sections. The first section deals with organisational characteristics, with
35 questions used to collect data about the HPO characteristics (see Appendix A). The second
section collects data on relative performance. The third section collect general information
about the respondents such as organisational level, function, functional level, number of
employees, corporate life cycle, and type of organisation. We used the original questionnaire
in English, made relevant revisions and translated the questionnaire into Vietnamese. Back-
translation of the questionnaire was also carried out.
The questionnaire was send to members of the Board of Directors, CEO, Heads of
Departments, CFO, Chief Accountant, Human Resources Director, Branch Manager and other
Senior management members of banks in Ho Chi Minh City and Hanoi. We contacted our key
11
contacts at the banks who were at middle-management and above. They have assisted us in
getting their colleagues to complete the questionnaire. Respondents received the questionnaire
either in soft or hard copy. The follow-up was in the form of email reminders or by telephone.
The survey was conducted from 04 May to 20 June 2007. To facilitate the respondents to
complete the questionnaire, we called them to ensure that respondents understood key
concepts of the questionnaire. Upon receipt of completed questionnaires, we conducted a
quality check to ensure that the questionnaires had been filled in fully and properly. The
questionnaire was distributed to 350 potential respondents, we received 156 completed and
valid questionnaires, a response rate of 44.6 percent. Sample size determination is obviously
one of the most important aspects in the design of a reliable study. If the sample size is too
small, the test will lack power and the confidence interval will be too large. But a too large
sample size will be a waste of resources. Bollen (1989) proposed that the sample size should
be 5 times of total observed items, this is to say that for example a sample size at 50 is
suitable for a set of 10 questions. In this study, we have a sample size of 156 respondents
from 26 banks operating in Vietnam. This size is considered to be large enough as mentioned
above. Appendix B provides information on the participating banks and gives the profile of
the respondents.
Computer Statistical Package for Social Science (SPSS – version 13) was used as the main
tool to analyse collected date and calculate the HPO factor scores. Four steps were taken in
this analysis. In step 1 each measurement scale was examined for its reliability. Reliability of
a scale refers to how consistent or stable the ratings generated by the scale are likely to be
(Parasuraman, 1991). High reliable scales are those in which the items are highly inter-
correlated, it means that they are measuring the same construct (Hair et al., 1992). Cronbach’s
alpha was employed to test the reliability, the constructs with Cronbach’s alpha values > 0.6
and item total correlation >0.5 were accepted (Nunnally & Burnstein, 1994). In step 2, factor
12
analysis was employed to assess unidimensionality and convergent validity of individual
constructs (using principal component analysis, rotation with Promax method, and
eigenvalues ≥ 0.1). Unidimensionality is defined as the existence of one construct underlying
a set of items (Garver and Mentzer, 1999). It is achieved in the condition that total variance
explained is higher than 50 percent together with a factor loading higher than 0.5. Items with
low factor loadings (< 0.50) were removed because they did not converge properly with the
latent construct they were designed to measure (Hair et al., 1998; Garver and Mentzer, 1999).
The third step entailed a joint factor analysis to test the convergent and discriminant validity
of all constructs. Validity of a measurement scale is the extent to which the scale fully
captures all aspects of the construct to be measured (Parasuraman, 1991). Convergent validity
and discriminant validity together form the construct validity. Discriminant validity was
assessed by the extent to which the items representing a latent construct discriminate that
construct from other items representing other latent constructs (Garver and Mentzer, 1999).
Convergent validity is a form of construct validity which refers to the degree to which
multiple attempts to measure the same concept are in agreement (Campbell and Fiske, 1959).
In the fourth step, multiple regression was applied to test the relationship between the HPO
factors and competitive performance. In this step, the collinearity statistic of all independent
variables was tested in order to conduct and examine the tolerance of each factor; the score
had to be closed to 1. Also intercorrelation or multicollinearity among variables was checked
by using the Variance Inflating Factor (VIF). This is the procedure to check whether the
applied model was in the right function form and the inclusion of variables was meaningful
and the statistical assumptions were not violated. A VIF which is lower than 2 ensures a low
level of intercorrelation among variables. The order of importance of different constructs was
evaluated by standardized regression coefficient (beta) with the significant levels which had
to be lower than 0.05. Beta represents the strength of the impact of a particular HPO factor on
13
competitive performance. The higher the value of beta is, the stronger the impact level of a
HPO factor on performance.
RESEARCH FINDINGS
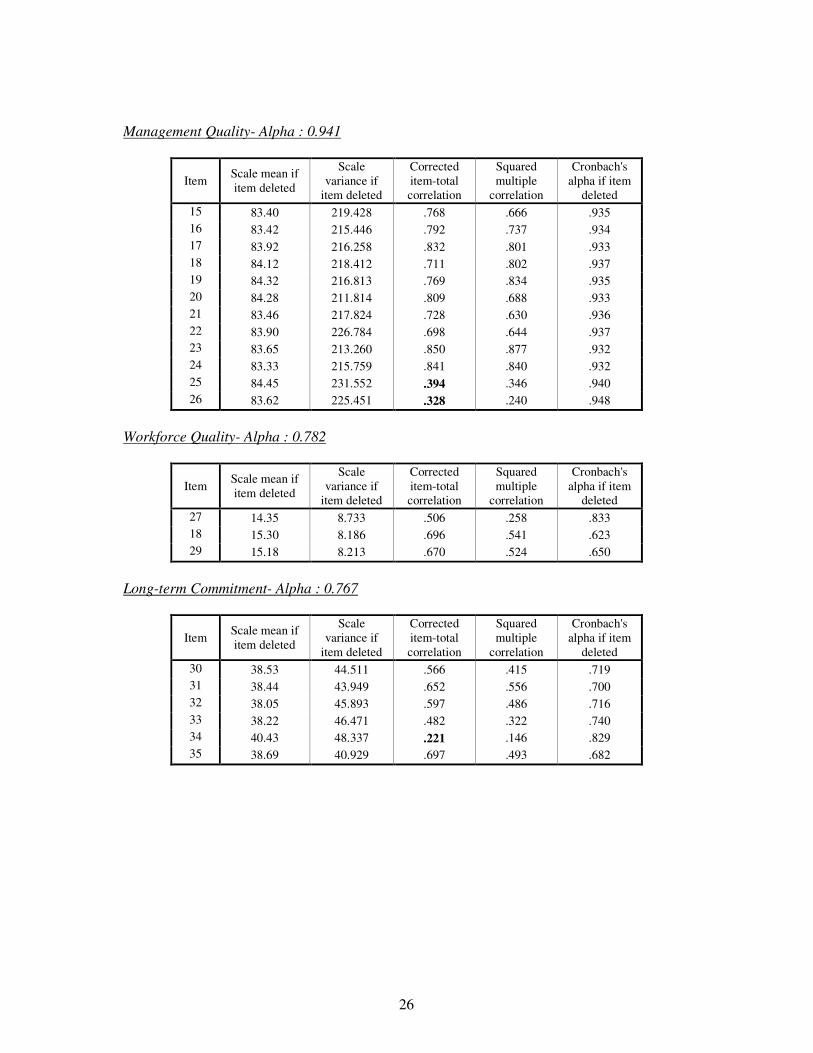
The reliability test indicated that there were some items that should be eliminated before
running the factor analysis due to the fact that their item-total correlation was lower than 0.4.
This means that those items could not be applied for the Vietnamese banking industry. Most
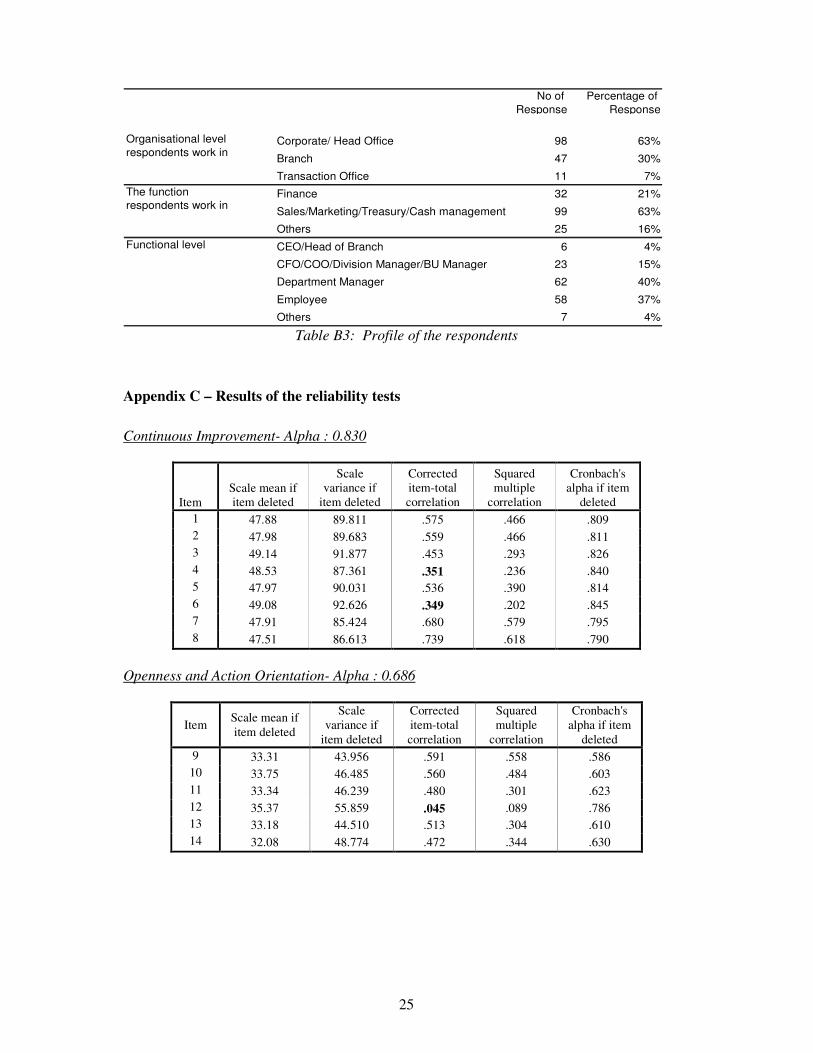
of the Cronbach’s alpha met the satisfactory level, with values varying from 0.686 to 0.941.
The reliability of all constructs was therefore achieved (see Appendix C). The Kaiser-Meyer-
Olkin (KMO) values for all scales in varied from 0.656 to 0.813 which exceeded the value
0.600 proposed by Kaise (1974) to confirm the appropriateness of using a factor analysis for
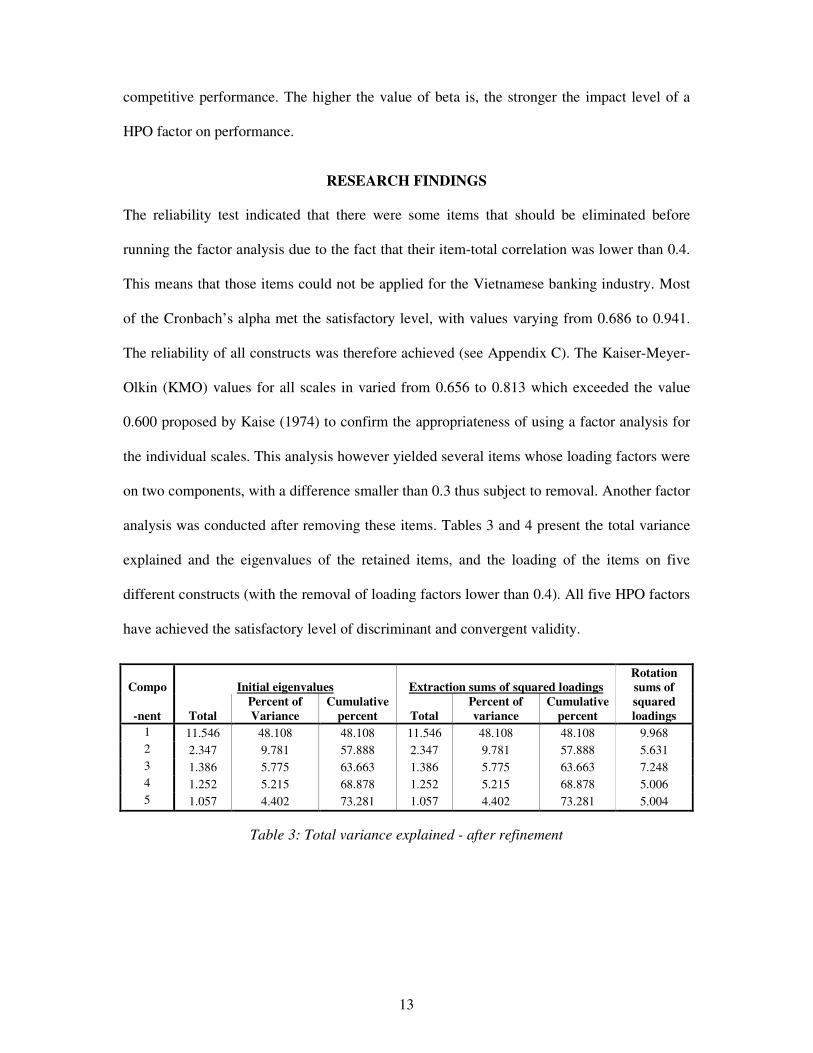
the individual scales. This analysis however yielded several items whose loading factors were
on two components, with a difference smaller than 0.3 thus subject to removal. Another factor
analysis was conducted after removing these items. Tables 3 and 4 present the total variance
explained and the eigenvalues of the retained items, and the loading of the items on five
different constructs (with the removal of loading factors lower than 0.4). All five HPO factors
have achieved the satisfactory level of discriminant and convergent validity.
Compo Initial eigenvalues Extraction sums of squared loadings Rotation
sums of
-nent Total
Percent of
Variance
Cumulative
percent Total
Percent of
variance
Cumulative
percent
squared
loadings
1 11.546 48.108 48.108 11.546 48.108 48.108 9.968
2 2.347 9.781 57.888 2.347 9.781 57.888 5.631
3 1.386 5.775 63.663 1.386 5.775 63.663 7.248
4 1.252 5.215 68.878 1.252 5.215 68.878 5.006
5 1.057 4.402 73.281 1.057 4.402 73.281 5.004
Table 3: Total variance explained - after refinement
14
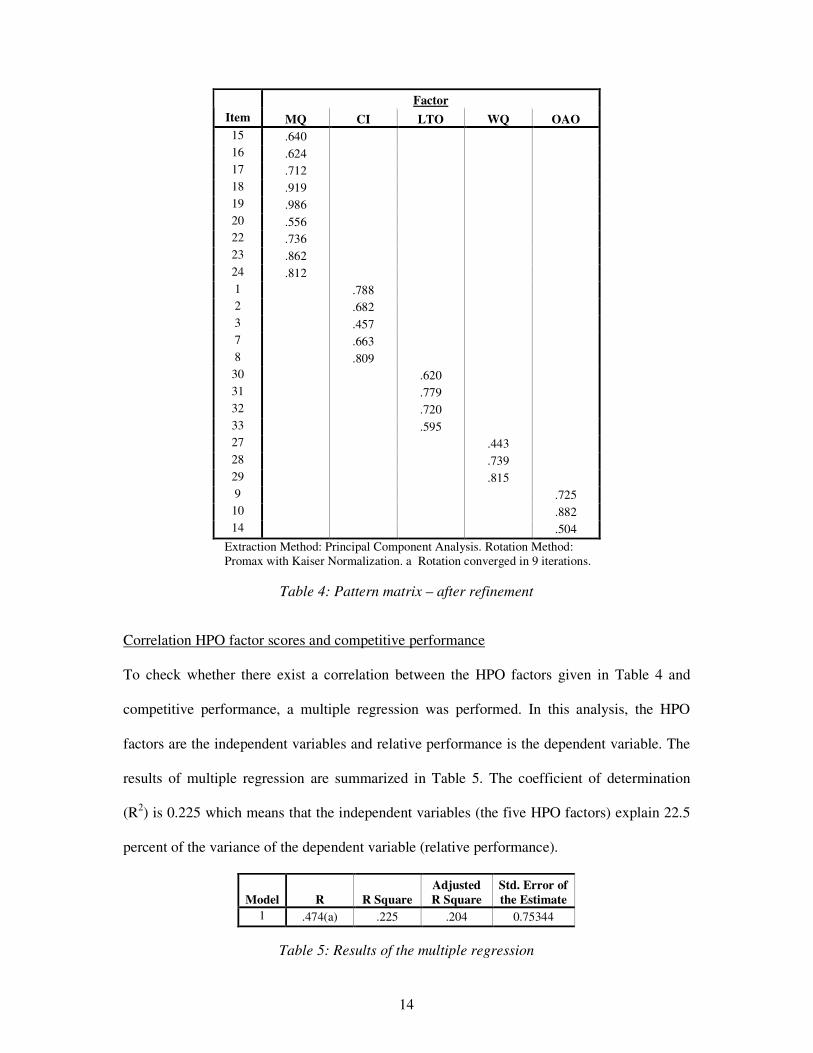
Factor
Item MQ CI LTO WQ OAO
15 .640
16 .624
17 .712
18 .919
19 .986
20 .556
22 .736
23 .862
24 .812
1 .788
2 .682
3 .457
7 .663
8 .809
30 .620
31 .779
32 .720
33 .595
27 .443
28 .739
29 .815
9 .725
10 .882
14 .504
Extraction Method: Principal Component Analysis. Rotation Method:
Promax with Kaiser Normalization. a Rotation converged in 9 iterations.
Table 4: Pattern matrix – after refinement
Correlation HPO factor scores and competitive performance
To check whether there exist a correlation between the HPO factors given in Table 4 and
competitive performance, a multiple regression was performed. In this analysis, the HPO
factors are the independent variables and relative performance is the dependent variable. The
results of multiple regression are summarized in Table 5. The coefficient of determination
(R2) is 0.225 which means that the independent variables (the five HPO factors) explain 22.5
percent of the variance of the dependent variable (relative performance).
Model R R Square
Adjusted
R Square
Std. Error of
the Estimate
1 .474(a) .225 .204 0.75344
Table 5: Results of the multiple regression
15
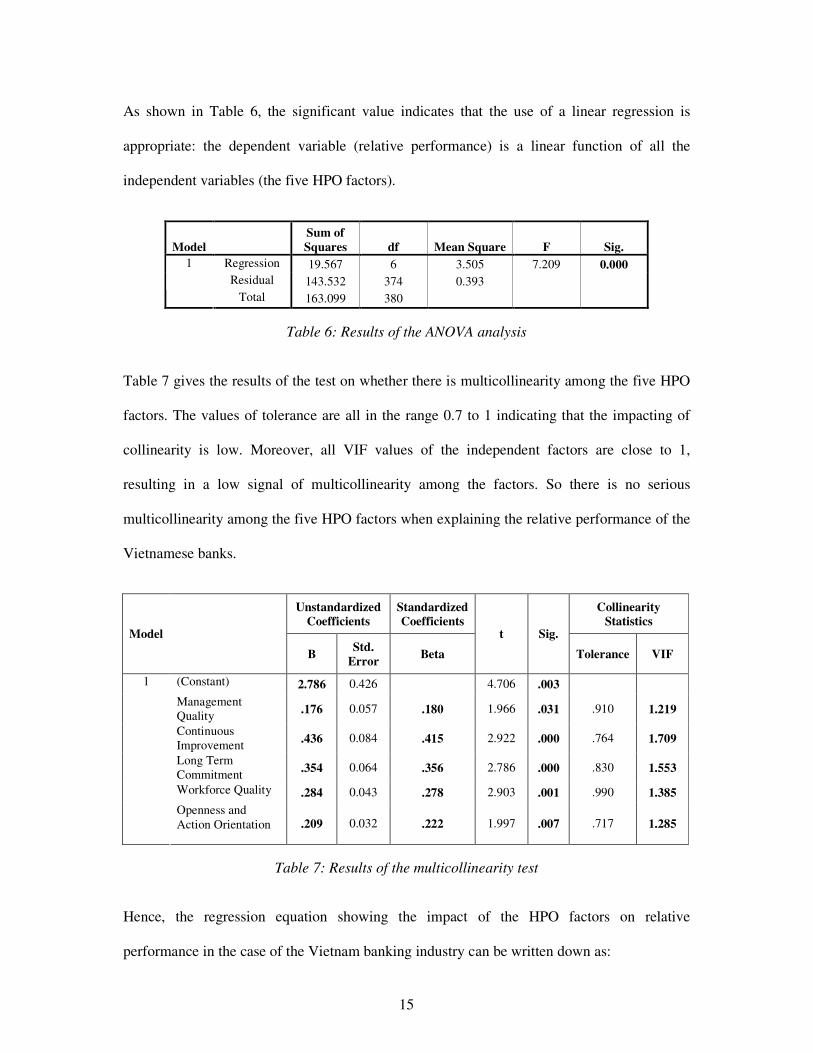
As shown in Table 6, the significant value indicates that the use of a linear regression is
appropriate: the dependent variable (relative performance) is a linear function of all the
independent variables (the five HPO factors).
Model
Sum of
Squares df Mean Square F Sig.
Regression 19.567 6 3.505 7.209 0.000
Residual 143.532 374 0.393
1
Total 163.099 380
Table 6: Results of the ANOVA analysis
Table 7 gives the results of the test on whether there is multicollinearity among the five HPO
factors. The values of tolerance are all in the range 0.7 to 1 indicating that the impacting of
collinearity is low. Moreover, all VIF values of the independent factors are close to 1,
resulting in a low signal of multicollinearity among the factors. So there is no serious
multicollinearity among the five HPO factors when explaining the relative performance of the
Vietnamese banks.
Unstandardized Coefficients
Standardized Coefficients
Collinearity Statistics
Model
B
Std.
Error Beta
t Sig.
Tolerance VIF
(Constant) 2.786 0.426 4.706 .003
Management
Quality .176 0.057 .180 1.966 .031 .910 1.219
Continuous
Improvement .436 0.084 .415 2.922 .000 .764 1.709
Long Term
Commitment .354 0.064 .356 2.786 .000 .830 1.553
Workforce Quality .284 0.043 .278 2.903 .001 .990 1.385
1
Openness and
Action Orientation .209 0.032 .222 1.997 .007 .717 1.285
Table 7: Results of the multicollinearity test
Hence, the regression equation showing the impact of the HPO factors on relative
performance in the case of the Vietnam banking industry can be written down as:
16
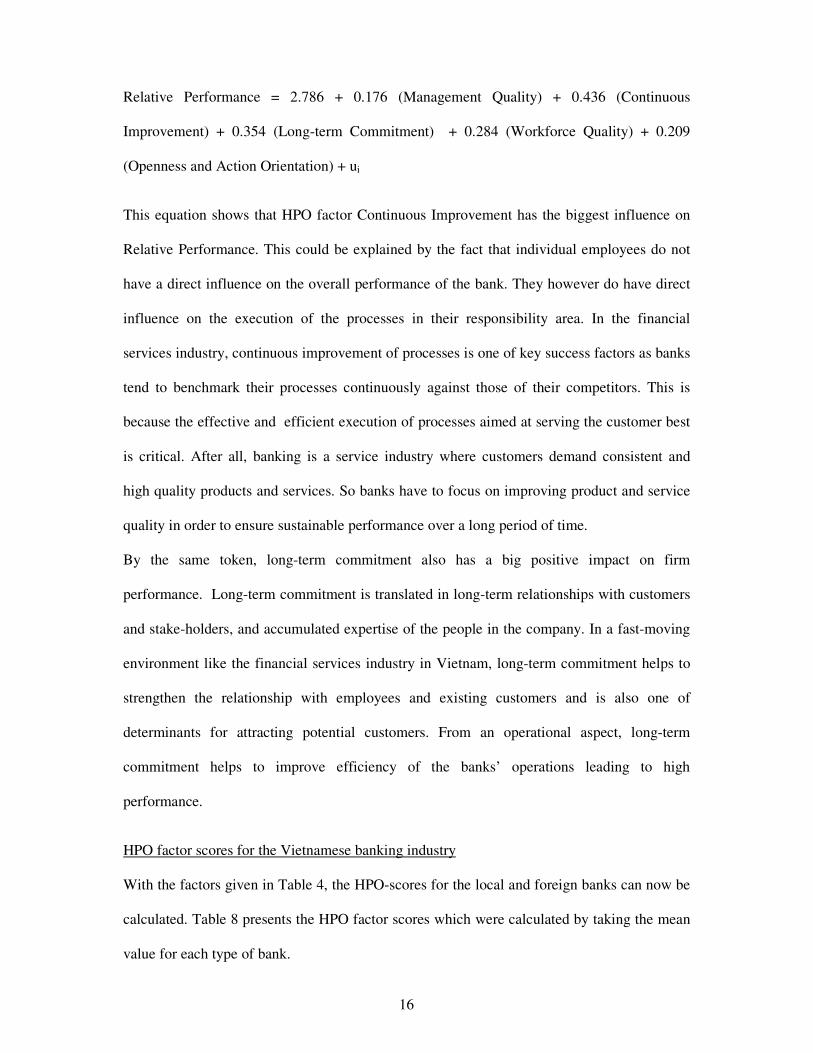
Relative Performance = 2.786 + 0.176 (Management Quality) + 0.436 (Continuous
Improvement) + 0.354 (Long-term Commitment) + 0.284 (Workforce Quality) + 0.209
(Openness and Action Orientation) + ui
This equation shows that HPO factor Continuous Improvement has the biggest influence on
Relative Performance. This could be explained by the fact that individual employees do not
have a direct influence on the overall performance of the bank. They however do have direct
influence on the execution of the processes in their responsibility area. In the financial
services industry, continuous improvement of processes is one of key success factors as banks
tend to benchmark their processes continuously against those of their competitors. This is
because the effective and efficient execution of processes aimed at serving the customer best
is critical. After all, banking is a service industry where customers demand consistent and
high quality products and services. So banks have to focus on improving product and service
quality in order to ensure sustainable performance over a long period of time.
By the same token, long-term commitment also has a big positive impact on firm
performance. Long-term commitment is translated in long-term relationships with customers
and stake-holders, and accumulated expertise of the people in the company. In a fast-moving
environment like the financial services industry in Vietnam, long-term commitment helps to
strengthen the relationship with employees and existing customers and is also one of
determinants for attracting potential customers. From an operational aspect, long-term
commitment helps to improve efficiency of the banks’ operations leading to high
performance.
HPO factor scores for the Vietnamese banking industry
With the factors given in Table 4, the HPO-scores for the local and foreign banks can now be
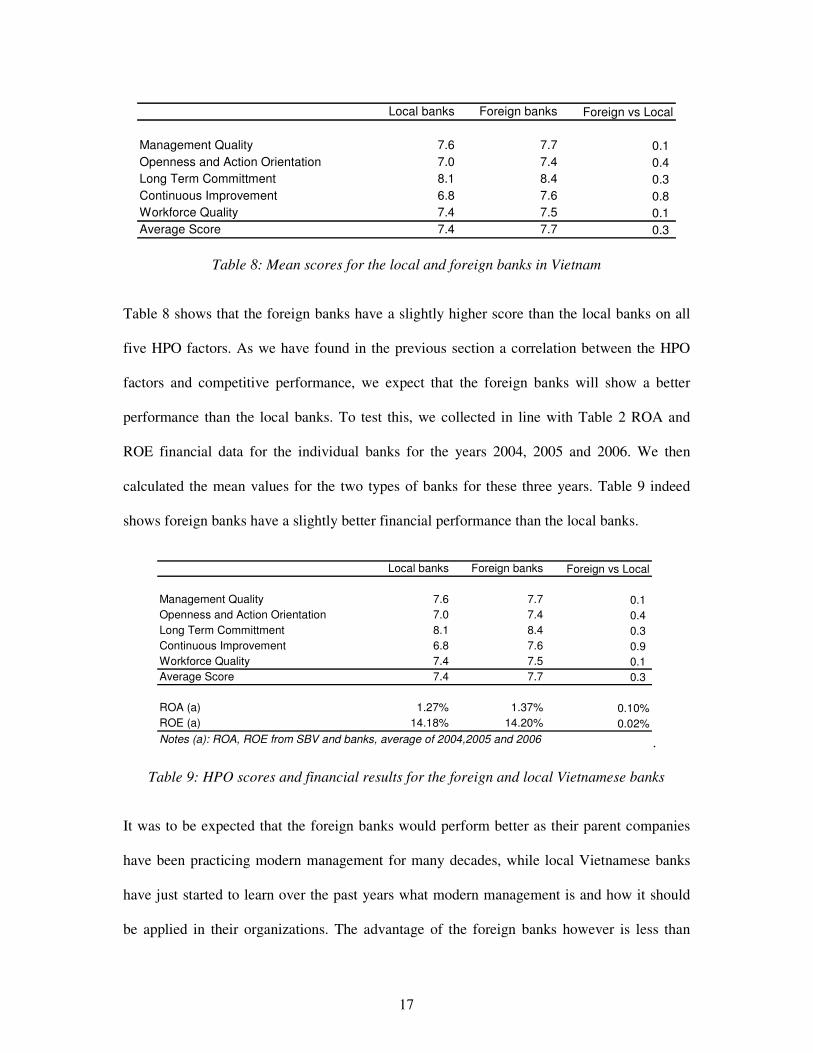
calculated. Table 8 presents the HPO factor scores which were calculated by taking the mean
value for each type of bank.
17
Local banks Foreign banks Foreign vs Local
Management Quality 7.6 7.7 0.1
Openness and Action Orientation 7.0 7.4 0.4
Long Term Committment 8.1 8.4 0.3
Continuous Improvement 6.8 7.6 0.8
Workforce Quality 7.4 7.5 0.1
Average Score 7.4 7.7 0.3
Table 8: Mean scores for the local and foreign banks in Vietnam
Table 8 shows that the foreign banks have a slightly higher score than the local banks on all
five HPO factors. As we have found in the previous section a correlation between the HPO
factors and competitive performance, we expect that the foreign banks will show a better
performance than the local banks. To test this, we collected in line with Table 2 ROA and
ROE financial data for the individual banks for the years 2004, 2005 and 2006. We then
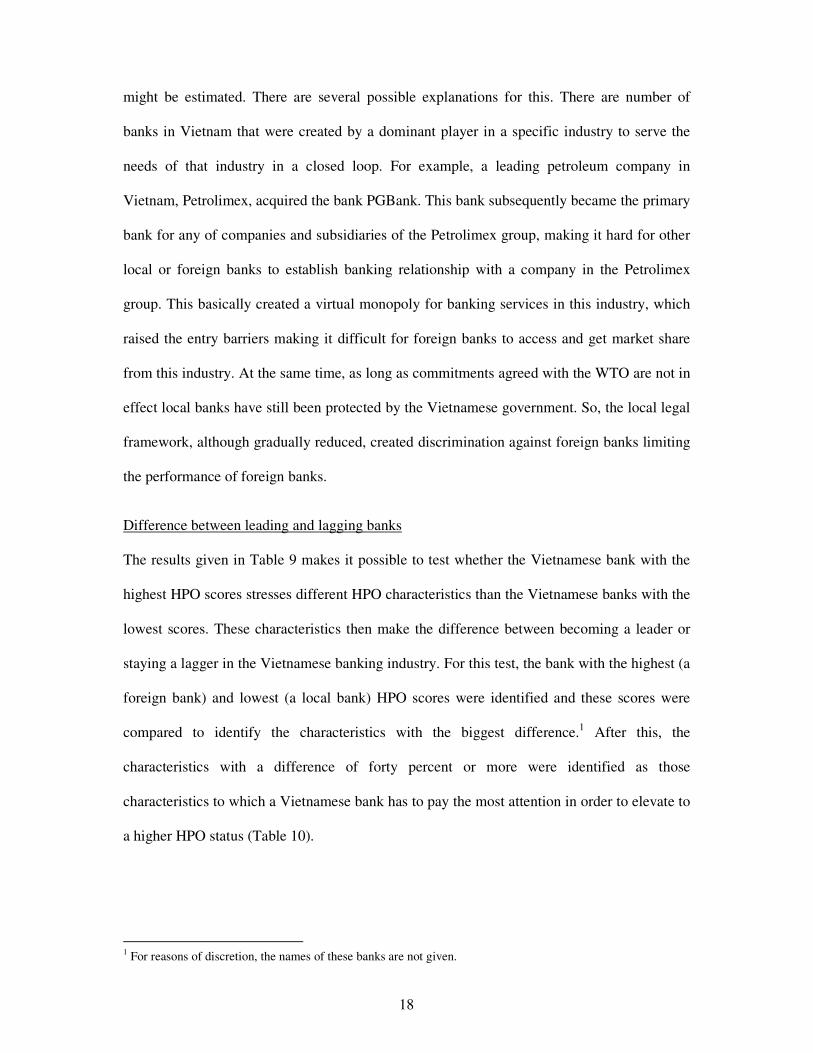
calculated the mean values for the two types of banks for these three years. Table 9 indeed
shows foreign banks have a slightly better financial performance than the local banks.
Local banks Foreign banks Foreign vs Local
Management Quality 7.6 7.7 0.1
Openness and Action Orientation 7.0 7.4 0.4
Long Term Committment 8.1 8.4 0.3
Continuous Improvement 6.8 7.6 0.9
Workforce Quality 7.4 7.5 0.1
Average Score 7.4 7.7 0.3
ROA (a) 1.27% 1.37% 0.10%
ROE (a) 14.18% 14.20% 0.02%
Notes (a): ROA, ROE from SBV and banks, average of 2004,2005 and 2006 .
Table 9: HPO scores and financial results for the foreign and local Vietnamese banks
It was to be expected that the foreign banks would perform better as their parent companies
have been practicing modern management for many decades, while local Vietnamese banks
have just started to learn over the past years what modern management is and how it should
be applied in their organizations. The advantage of the foreign banks however is less than
18
might be estimated. There are several possible explanations for this. There are number of
banks in Vietnam that were created by a dominant player in a specific industry to serve the
needs of that industry in a closed loop. For example, a leading petroleum company in
Vietnam, Petrolimex, acquired the bank PGBank. This bank subsequently became the primary
bank for any of companies and subsidiaries of the Petrolimex group, making it hard for other
local or foreign banks to establish banking relationship with a company in the Petrolimex
group. This basically created a virtual monopoly for banking services in this industry, which
raised the entry barriers making it difficult for foreign banks to access and get market share
from this industry. At the same time, as long as commitments agreed with the WTO are not in
effect local banks have still been protected by the Vietnamese government. So, the local legal
framework, although gradually reduced, created discrimination against foreign banks limiting
the performance of foreign banks.
Difference between leading and lagging banks
The results given in Table 9 makes it possible to test whether the Vietnamese bank with the
highest HPO scores stresses different HPO characteristics than the Vietnamese banks with the
lowest scores. These characteristics then make the difference between becoming a leader or
staying a lagger in the Vietnamese banking industry. For this test, the bank with the highest (a
foreign bank) and lowest (a local bank) HPO scores were identified and these scores were
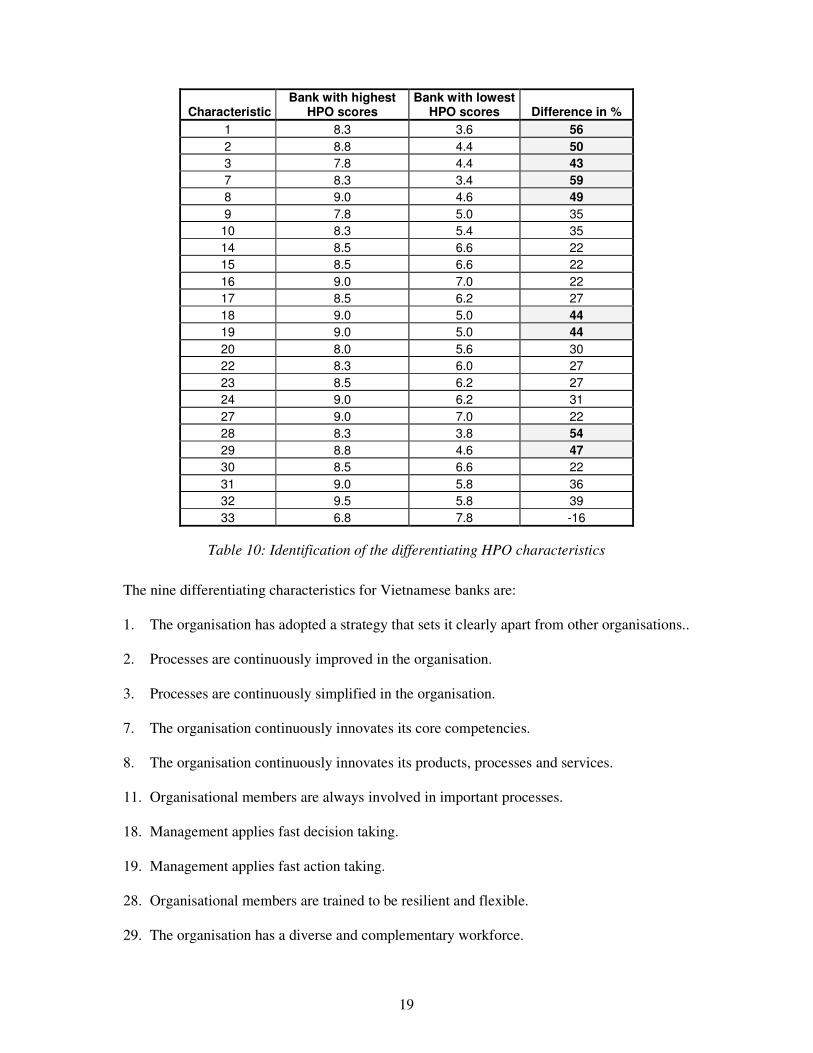
compared to identify the characteristics with the biggest difference.1 After this, the
characteristics with a difference of forty percent or more were identified as those
characteristics to which a Vietnamese bank has to pay the most attention in order to elevate to
a higher HPO status (Table 10).
1 For reasons of discretion, the names of these banks are not given.
19
Characteristic Bank with highest
HPO scores Bank with lowest
HPO scores Difference in %
1 8.3 3.6 56
2 8.8 4.4 50
3 7.8 4.4 43
7 8.3 3.4 59
8 9.0 4.6 49
9 7.8 5.0 35
10 8.3 5.4 35
14 8.5 6.6 22
15 8.5 6.6 22
16 9.0 7.0 22
17 8.5 6.2 27
18 9.0 5.0 44
19 9.0 5.0 44
20 8.0 5.6 30
22 8.3 6.0 27
23 8.5 6.2 27
24 9.0 6.2 31
27 9.0 7.0 22
28 8.3 3.8 54
29 8.8 4.6 47
30 8.5 6.6 22
31 9.0 5.8 36
32 9.5 5.8 39
33 6.8 7.8 -16
Table 10: Identification of the differentiating HPO characteristics
The nine differentiating characteristics for Vietnamese banks are:
1. The organisation has adopted a strategy that sets it clearly apart from other organisations..
2. Processes are continuously improved in the organisation.
3. Processes are continuously simplified in the organisation.
7. The organisation continuously innovates its core competencies.
8. The organisation continuously innovates its products, processes and services.
11. Organisational members are always involved in important processes.
18. Management applies fast decision taking.
19. Management applies fast action taking.
28. Organisational members are trained to be resilient and flexible.
29. The organisation has a diverse and complementary workforce.
20
HPO scores on these nine characteristics are significantly higher for the leading bank than for
the lagging bank, implying that the leading bank pays more attention to these. This is
important to know for bank management because, although this type of research as described
in this paper can only show correlation and not causality, management can actively start (or
keep) working on improving these nine characteristics. In this way, their attention is focussed
on those activities in the bank that add most value to the organization.
CONCLUSIONS
Historically, the performance of banks is evaluated by qualitative analysis of financial ratio’s.
The research described in this paper shows that the HPO framework can be used to identify
and explain performance differences in the Vietnamese banking industry in much more detail.
This is all the more important as the Vietnamese banking industry is integrating into the
global economy. From managerial point of view, the framework helps to find sound
improvement recommendations for the Vietnamese banking industry, especially the local
banks. In this respect, managers can immediately start ‘upgrading’ their organization. It
should be kept in mind however that, because organizations and environments are continually
evolving, improvement ideas and practices need to be adapted continuously. If this is not
done, organizations run the risk of meeting the same fate as many organizations characterized
as excellent in the past (Peters and Waterman, 1982). Their performance foundered in the
years after they had been denominated as examples of excellence. HPO managers are flexible
and creative enough to not let such a downfall happen so that they can make and keep their
organization world-class.
Limitations of this study can mainly be found in the number of questionnaires received.
Although the total of 156 valid questionnaires is large enough for statistical processing, it is
not enough to state with confidence conclusions about individual banks. It was also difficult
to find reliable data on the financial performance of individual banks. Further research could
21
be based on a larger sample of respondents which a larger database of HPO and financial data.
Non-performing loans also mirror the performance of banks. As the data for NPL published
and/or estimated by one source are very much different from other sources, we recommend
that further study should take place to find the relationship between the HPO factor scores and
NPL. It is also recommended to broaden the scope of study to cover the complete financial
services industry not only including banks but also non-bank financial institutions, so that the
HPO factors can be validated for the complete industry. After this, other Vietnamese
industries could be subject to the HPO framework.
REFERENCES
Bollen, K.A. (1989), Structural Equation with Latent Variables, New York: John Wiley & Sons
Citigroup (2007), Vietnam Macro Monthly, Economics Research Vietnam
Collins, J.C. (2001), Good to great. Why some companies make the leap … and others don’t, London:
Random House
Collins, J.C. and Porras, J.I. (1994), Built to last. Successful habits of visionary companies, New
York: Harper Business
Davis, S.L. (1989), Managing change in the excellent banks, the lessons of experience from twelve
excellent banking institutions, New York: St.Martin’s Press
Deshpandé, R., Farley, J.U. and Bowman, D. (2004), Tigers, dragons, and others: profiling high
performance in Asian firms, Journal of International Marketing, 12, 3: 5-29
Garver, M.S. and Mentzer, J.T. (1999). Logistics research methods: employing structural equation
modelling to test for construct validity, Journal of Business Logistics, 20, 1: 33-57
Hair, J.F., Anderson, R.E., Tatham, R.L. and Black, W.C. (1998). Multivariate Data Analysis, 5th
edition, New Jersey: Prentice-Hall
IMF, (2006), Vietnam: Statistical Appendix, Washington D.C.
Le Xuan Nghia (2006), Study on competitiveness and impacts of liberalization of financial services:
The case of banking services, UNDP Report, Hanoi
Nguyen Xuan Thang, (2005), Service sector development: a key to Vietnam’s sustainable growth,
UNDP report Hanoi
Peters, T. and Waterman, R. (1982), In Search Of Excellence, Warner Books
Parasuraman, A., Zeithml, V.A. and Berry, L. (1985), A conceptual model of service quality and its
implications for future research, Journal of Marketing, 49, 4: 41-50
State Bank of Vietnam (2005), Market share of commercial banks in Vietnam, Hanoi
22
Vina Capital (2006), Banking sector report, Hong Kong
Waal, A.A. de (2005), The foundations of Nirvana, White paper, Hyperion
Waal, A.A. de (2007), High Performance Organizations: een stand van zaken, Holland Management
Review, 16: 22-7
Waal, A.A. de (2008), The secret of high performance organizations, forthcoming
World Bank, (2002), Banking sector review, Vietnam
World Bank (2007), Vietnam Country Data, www.worldbank.org, accessed on June 20, 2007
André A. de Waal (lead author) is associate professor of Strategic Management at the
Maastricht School of Management (the Netherlands) and director of the Center for
Organizational Performance. Hai Duong is a graduate of Maastricht School of Management
and partner and CFO of Vietnam Partners LLC. Vu Ton is a graduate of Maastricht School of
Management and head of Human Resources HSBC Vietnam.
23
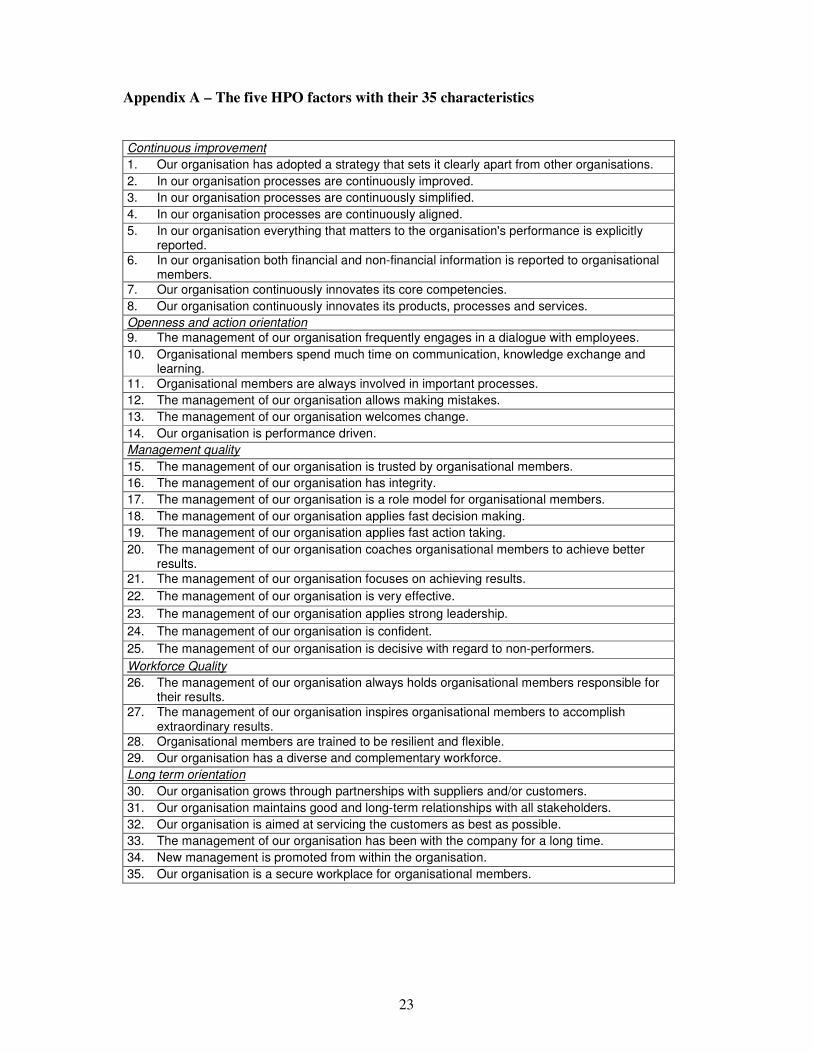
Appendix A – The five HPO factors with their 35 characteristics
Continuous improvement
1. Our organisation has adopted a strategy that sets it clearly apart from other organisations.
2. In our organisation processes are continuously improved.
3. In our organisation processes are continuously simplified.
4. In our organisation processes are continuously aligned.
5. In our organisation everything that matters to the organisation's performance is explicitly reported.
6. In our organisation both financial and non-financial information is reported to organisational members.
7. Our organisation continuously innovates its core competencies.
8. Our organisation continuously innovates its products, processes and services.
Openness and action orientation
9. The management of our organisation frequently engages in a dialogue with employees.
10. Organisational members spend much time on communication, knowledge exchange and learning.
11. Organisational members are always involved in important processes.
12. The management of our organisation allows making mistakes.
13. The management of our organisation welcomes change.
14. Our organisation is performance driven.
Management quality
15. The management of our organisation is trusted by organisational members.
16. The management of our organisation has integrity.
17. The management of our organisation is a role model for organisational members.
18. The management of our organisation applies fast decision making.
19. The management of our organisation applies fast action taking.
20. The management of our organisation coaches organisational members to achieve better results.
21. The management of our organisation focuses on achieving results.
22. The management of our organisation is very effective.
23. The management of our organisation applies strong leadership.
24. The management of our organisation is confident.
25. The management of our organisation is decisive with regard to non-performers.
Workforce Quality
26. The management of our organisation always holds organisational members responsible for their results.
27. The management of our organisation inspires organisational members to accomplish extraordinary results.
28. Organisational members are trained to be resilient and flexible.
29. Our organisation has a diverse and complementary workforce.
Long term orientation
30. Our organisation grows through partnerships with suppliers and/or customers.
31. Our organisation maintains good and long-term relationships with all stakeholders.
32. Our organisation is aimed at servicing the customers as best as possible.
33. The management of our organisation has been with the company for a long time.
34. New management is promoted from within the organisation.
35. Our organisation is a secure workplace for organisational members.
24
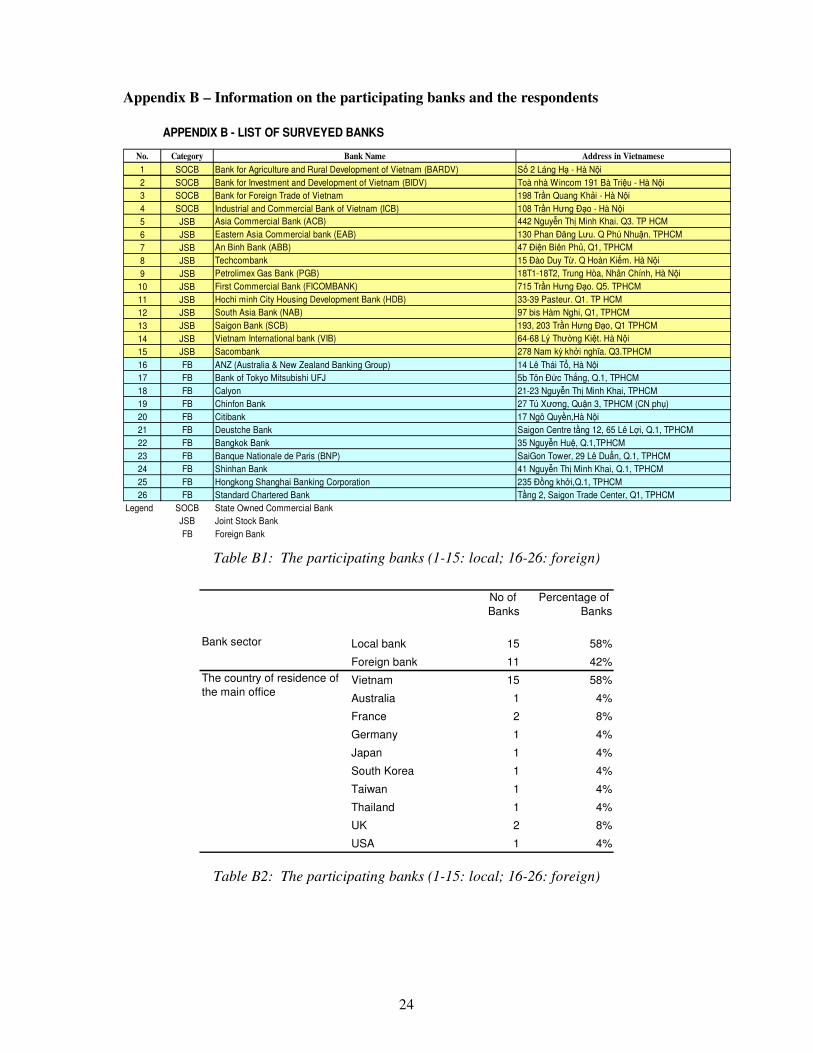
Appendix B – Information on the participating banks and the respondents
APPENDIX B - LIST OF SURVEYED BANKS
No. Category Bank Name Address in Vietnamese
1 SOCB Bank for Agriculture and Rural Development of Vietnam (BARDV) Số 2 Láng Hạ - Hà Nội
2 SOCB Bank for Investment and Development of Vietnam (BIDV) Toà nhà Wincom 191 Bà Triệu - Hà Nội
3 SOCB Bank for Foreign Trade of Vietnam 198 Trần Quang Khải - Hà Nội
4 SOCB Industrial and Commercial Bank of Vietnam (ICB) 108 Trần Hưng Đạo - Hà Nội
5 JSB Asia Commercial Bank (ACB) 442 Nguyễn Thị Minh Khai. Q3. TP HCM
6 JSB Eastern Asia Commercial bank (EAB) 130 Phan Đăng Lưu. Q Phú Nhuận. TPHCM
7 JSB An Binh Bank (ABB) 47 Điện Biên Phủ, Q1, TPHCM
8 JSB Techcombank 15 Đào Duy Từ. Q Hoàn Kiếm. Hà Nội
9 JSB Petrolimex Gas Bank (PGB) 18T1-18T2, Trung Hòa, Nhân Chính, Hà Nội
10 JSB First Commercial Bank (FICOMBANK) 715 Trần Hưng Đạo. Q5. TPHCM
11 JSB Hochi minh City Housing Development Bank (HDB) 33-39 Pasteur. Q1. TP HCM
12 JSB South Asia Bank (NAB) 97 bis Hàm Nghi, Q1, TPHCM
13 JSB Saigon Bank (SCB) 193, 203 Trần Hưng Đạo, Q1 TPHCM
14 JSB Vietnam International bank (VIB) 64-68 Lý Thường Kiệt. Hà Nội
15 JSB Sacombank 278 Nam kỳ khởi nghĩa. Q3.TPHCM
16 FB ANZ (Australia & New Zealand Banking Group) 14 Lê Thái Tổ, Hà Nội
17 FB Bank of Tokyo Mitsubishi UFJ 5b Tôn Đức Thắng, Q.1, TPHCM
18 FB Calyon 21-23 Nguyễn Thị Minh Khai, TPHCM
19 FB Chinfon Bank 27 Tú Xương, Quận 3, TPHCM (CN phụ)
20 FB Citibank 17 Ngô Quyền,Hà Nội
21 FB Deustche Bank Saigon Centre tầng 12, 65 Lê Lợi, Q.1, TPHCM
22 FB Bangkok Bank 35 Nguyễn Huệ, Q.1,TPHCM
23 FB Banque Nationale de Paris (BNP) SaiGon Tower, 29 Lê Duẩn, Q.1, TPHCM
24 FB Shinhan Bank 41 Nguyễn Thị Minh Khai, Q.1, TPHCM
25 FB Hongkong Shanghai Banking Corporation 235 Đồng khởi,Q.1, TPHCM
26 FB Standard Chartered Bank Tầng 2, Saigon Trade Center, Q1, TPHCM
Legend SOCB State Owned Commercial Bank
JSB Joint Stock Bank
FB Foreign Bank
Table B1: The participating banks (1-15: local; 16-26: foreign)
No of
Banks
Percentage of
Banks
Bank sector Local bank 15 58%
Foreign bank 11 42%
Vietnam 15 58%
Australia 1 4%
France 2 8%
Germany 1 4%
Japan 1 4%
South Korea 1 4%
Taiwan 1 4%
Thailand 1 4%
UK 2 8%
USA 1 4%
The country of residence of
the main office
Table B2: The participating banks (1-15: local; 16-26: foreign)
25
No of
Response
Percentage of
Response
Corporate/ Head Office 98 63%
Branch 47 30%
Transaction Office 11 7%
Finance 32 21%
Sales/Marketing/Treasury/Cash management 99 63%
Others 25 16%
Functional level CEO/Head of Branch 6 4%
CFO/COO/Division Manager/BU Manager 23 15%
Department Manager 62 40%
Employee 58 37%
Others 7 4%
Organisational level
respondents work in
The function
respondents work in
Table B3: Profile of the respondents
Appendix C – Results of the reliability tests
Continuous Improvement- Alpha : 0.830
Item
Scale mean if
item deleted
Scale
variance if
item deleted
Corrected
item-total
correlation
Squared
multiple
correlation
Cronbach's
alpha if item
deleted
1 47.88 89.811 .575 .466 .809
2 47.98 89.683 .559 .466 .811
3 49.14 91.877 .453 .293 .826
4 48.53 87.361 .351 .236 .840
5 47.97 90.031 .536 .390 .814
6 49.08 92.626 .349 .202 .845
7 47.91 85.424 .680 .579 .795
8 47.51 86.613 .739 .618 .790
Openness and Action Orientation- Alpha : 0.686
Item Scale mean if
item deleted
Scale
variance if
item deleted
Corrected
item-total
correlation
Squared
multiple
correlation
Cronbach's
alpha if item
deleted
9 33.31 43.956 .591 .558 .586
10 33.75 46.485 .560 .484 .603
11 33.34 46.239 .480 .301 .623
12 35.37 55.859 .045 .089 .786
13 33.18 44.510 .513 .304 .610
14 32.08 48.774 .472 .344 .630
26
Management Quality- Alpha : 0.941
Item Scale mean if
item deleted
Scale
variance if
item deleted
Corrected
item-total
correlation
Squared
multiple
correlation
Cronbach's
alpha if item
deleted
15 83.40 219.428 .768 .666 .935
16 83.42 215.446 .792 .737 .934
17 83.92 216.258 .832 .801 .933
18 84.12 218.412 .711 .802 .937
19 84.32 216.813 .769 .834 .935
20 84.28 211.814 .809 .688 .933
21 83.46 217.824 .728 .630 .936
22 83.90 226.784 .698 .644 .937
23 83.65 213.260 .850 .877 .932
24 83.33 215.759 .841 .840 .932
25 84.45 231.552 .394 .346 .940
26 83.62 225.451 .328 .240 .948
Workforce Quality- Alpha : 0.782
Item Scale mean if
item deleted
Scale
variance if
item deleted
Corrected
item-total
correlation
Squared
multiple
correlation
Cronbach's
alpha if item
deleted
27 14.35 8.733 .506 .258 .833
18 15.30 8.186 .696 .541 .623
29 15.18 8.213 .670 .524 .650
Long-term Commitment- Alpha : 0.767
Item Scale mean if
item deleted
Scale
variance if
item deleted
Corrected
item-total
correlation
Squared
multiple
correlation
Cronbach's
alpha if item
deleted
30 38.53 44.511 .566 .415 .719
31 38.44 43.949 .652 .556 .700
32 38.05 45.893 .597 .486 .716
33 38.22 46.471 .482 .322 .740
34 40.43 48.337 .221 .146 .829
35 38.69 40.929 .697 .493 .682