Embed Size (px)
Citation preview

Grailog KS Viz 2.0: Graph-Logic Knowledge
Visualization by XML-Based Translation
by
Leah Bidlake
Bachelor of Computer Science, UNB, 2005Bachelor of Education, UNB, 2005
A THESIS SUBMITTED IN PARTIAL FULFILLMENT OFTHE REQUIREMENTS FOR THE DEGREE OF
Master of Computer Science
In the Graduate Academic Unit of Computer Science
Supervisors: Harold Boley, Ph.D., Faculty of Computer ScienceChris Baker, Ph.D., Faculty of Computer Science
Examining Board: Weichang Du, Ph.D., Faculty of Computer Science, ChairBruce Spencer, Ph.D., Faculty of Computer ScienceMonica Wachowicz, Ph.D., Faculty of Engineering
This thesis is accepted by theDean of Graduate Studies
THE UNIVERSITY OF NEW BRUNSWICK
June, 2016
c©Leah Bidlake, 2016
Abstract
Knowledge visualization is the expression of knowledge through graphical
presentations with the goal of validating or communicating knowledge. For-
mal knowledge, which is used in Data Modeling, the Semantic Web, etc., is
based on ontologies and rules, which can be represented in (Description and
Horn) logics and presented as (generalized) graphs. Graph Inscribed Logic
(Grailog) can be used to visualize RuleML knowledge. The earlier Grailog KS
Viz transforms Datalog RuleML to Grailog visualizations in Scalable Vector
Graphics (SVG).
This thesis develops a tool, Grailog KS Viz 2.0, that is able to visualize Horn
Logic (Hornlog) with Equality. It uses XSLT 2.0 with internal JavaScript to
process arbitrary levels of function nesting in a recursive manner. The tool
has also been extended from n-ary relations with n ≥ 2 to those with n ≥
1 (including classes as unary relations), based on the labelnode normal form
of Grailog.
ii

JavaScript is used to calculate the coordinates for positioning, and determines
the dimensions of, the SVG elements and viewport, but is no longer required
in the static image. Our Purifier thus removes the internal JavaScript from
the static Grailog/SVG visualization generated by the tool. This assures
that there are no malicious scripts, reduces the time required to render the
Grailog/SVG visualization, and greatly reduces the final file size.
The visualization of function applications with multiple levels of nesting gen-
erated by Grailog KS Viz 2.0 was evaluated using test cases that illuminate
knowledge about graph-theoretical definitions. A larger use case was devel-
oped for teaching the business rules of managing the financial aspect of a
non-profit organization. The processing speed as well as quality and accu-
racy of the rendered SVG are consistently high across common modern Web
browsers.
Grailog KS Viz 2.0 thus provides increased security, expressivity, and effi-
ciency for viewing, sharing, and storing Grailog/SVG visualizations.
iii

Acknowledgements
I would like to thank Dr. Harold Boley and Dr. Chris Baker for being my
thesis supervisors and for their support throughout the process of researching
and writing this thesis.
iv

Table of Contents
Abstract ii
Acknowledgments iv
List of Tables ix
List of Figures x
1 Introduction 1
1.1 Objectives . . . . . . . . . . . . . . . . . . . . . . . . . . . . . 3
1.2 Thesis Organization . . . . . . . . . . . . . . . . . . . . . . . . 4
2 Background 6
2.1 Knowledge Visualization . . . . . . . . . . . . . . . . . . . . . 7
2.2 Human Readability and Usability of Visualizations . . . . . . 7
2.3 Languages . . . . . . . . . . . . . . . . . . . . . . . . . . . . . 10
2.3.1 Graph Inscribed Logic (Grailog) . . . . . . . . . . . . . 10
2.3.2 RuleML . . . . . . . . . . . . . . . . . . . . . . . . . . 11
2.3.3 Scalable Vector Graphics (SVG) . . . . . . . . . . . . . 12
v

2.3.4 Extensible Stylesheet Language Transformations (XSLT) 12
2.3.5 JavaScript . . . . . . . . . . . . . . . . . . . . . . . . . 13
2.4 Grailog KS Viz . . . . . . . . . . . . . . . . . . . . . . . . . . 14
2.5 Security Aspects . . . . . . . . . . . . . . . . . . . . . . . . . 15
2.6 Related Work . . . . . . . . . . . . . . . . . . . . . . . . . . . 17
3 Design 20
3.1 Usage Scenario . . . . . . . . . . . . . . . . . . . . . . . . . . 21
3.2 Architecture . . . . . . . . . . . . . . . . . . . . . . . . . . . . 22
3.3 Requirements . . . . . . . . . . . . . . . . . . . . . . . . . . . 27
3.4 Supported Grailog Constructs . . . . . . . . . . . . . . . . . . 28
3.5 SVG Elements Involved . . . . . . . . . . . . . . . . . . . . . . 31
4 Implementation 35
4.1 Renderer XSLT . . . . . . . . . . . . . . . . . . . . . . . . . . 35
4.1.1 Viewport . . . . . . . . . . . . . . . . . . . . . . . . . 36
4.1.2 XPath Expressions . . . . . . . . . . . . . . . . . . . . 38
4.1.3 Constructing ID Names for SVG Elements . . . . . . . 39
4.1.4 XSLT Templates . . . . . . . . . . . . . . . . . . . . . 41
4.1.4.1 RuleML, Initialize, and Assert Templates . . 42
4.1.4.2 Implies Template . . . . . . . . . . . . . . . . 43
4.1.4.3 And Template . . . . . . . . . . . . . . . . . 44
4.1.4.4 Atom Template . . . . . . . . . . . . . . . . . 44
4.1.4.5 Equal Template . . . . . . . . . . . . . . . . . 46
vi

4.1.4.6 NestedExpr Template . . . . . . . . . . . . . 47
4.2 Purifier XSLT . . . . . . . . . . . . . . . . . . . . . . . . . . . 51
5 A Use Case in Mathematics 53
5.1 Test Cases in Math Education . . . . . . . . . . . . . . . . . . 54
5.2 Use Case in Financial Mathematics . . . . . . . . . . . . . . . 55
5.3 Unit Testing . . . . . . . . . . . . . . . . . . . . . . . . . . . . 56
5.4 Evaluation . . . . . . . . . . . . . . . . . . . . . . . . . . . . . 57
6 Conclusions 61
6.1 Results . . . . . . . . . . . . . . . . . . . . . . . . . . . . . . . 61
6.2 Future Work . . . . . . . . . . . . . . . . . . . . . . . . . . . . 64
Bibliography 73
A Graph-Theory Test Cases 74
A.1 Test Case 1 . . . . . . . . . . . . . . . . . . . . . . . . . . . . 74
A.2 Test Case 2 . . . . . . . . . . . . . . . . . . . . . . . . . . . . 83
A.3 Test Case 3 . . . . . . . . . . . . . . . . . . . . . . . . . . . . 86
A.4 Test Case 4 . . . . . . . . . . . . . . . . . . . . . . . . . . . . 88
A.5 Test Case 5 . . . . . . . . . . . . . . . . . . . . . . . . . . . . 92
B Financial Use Case 96
B.1 Hornlog RuleML . . . . . . . . . . . . . . . . . . . . . . . . . 96
B.2 Grailog/SVG . . . . . . . . . . . . . . . . . . . . . . . . . . . 105
vii

C Installation and Use 115
C.1 Local Testing of the Renderer . . . . . . . . . . . . . . . . . . 116
C.2 Online Testing of the Renderer . . . . . . . . . . . . . . . . . 117
C.3 Using the Purifier . . . . . . . . . . . . . . . . . . . . . . . . . 117
C.4 GraphTheory Test Case . . . . . . . . . . . . . . . . . . . . . 118
Vita
viii

List of Tables
5.1 Comparison of Grailog KS Viz and Grailog KS Viz 2.0 features. 57
List of Figures
3.1 High level architecture of the visualization process. . . . . . . 23
3.2 Sample Grailog/SVG presentation of graph theory knowledge. 26
3.3 Hyperarcs for n-ary relations with a) n=1 and, generally, b)
n≥1. . . . . . . . . . . . . . . . . . . . . . . . . . . . . . . . . 28
3.4 Hyperarcs for n-ary relations with (constructor) function ap-
plication in any argument position. . . . . . . . . . . . . . . . 29
3.5 Arbitrary levels of nested function applications. . . . . . . . . 29
3.6 Datalog+ equality. . . . . . . . . . . . . . . . . . . . . . . . . 30
3.7 Hornlog+ equality. . . . . . . . . . . . . . . . . . . . . . . . . 30
3.8 Single-premise rules containing n-ary relations (n≥1) and Datalog+
equality. . . . . . . . . . . . . . . . . . . . . . . . . . . . . . . 31
ix

3.9 Multi-premise rules containing n-ary relations (n≥1) and Datalog+
equality. . . . . . . . . . . . . . . . . . . . . . . . . . . . . . . 31
3.10 Multi-premise rule containing n-ary relations (n≥1) with ar-
bitrary levels of nested function application. . . . . . . . . . . 32
3.11 Multi-premise rule containing Hornlog+ equality with arbi-
trary levels of nested function application. . . . . . . . . . . . 32
C.1 Grailog/SVG visualization of GraphTheory RuleML/XML. . . 120
x

Chapter 1
Introduction
Knowledge Visualization (KV) is an area of research that focuses on the
articulation of knowledge through visualizations with the goal of communi-
cating knowledge to others or of analyzing knowledge [22]. Knowledge may
be visualized using a variety of 2-dimensional or even 3-dimensional formats,
ranging from images and graphs to interactive and dynamic immersive en-
vironments [11]. Disciplines including e-learning and e-business can benefit
from the use of KV to increase the rate and quality of knowledge transfer [22].
The Semantic Web employs formal knowledge, which may be presented vi-
sually using graph theory or represented symbolically using predicate logic.
Formal knowledge can be expressed as ontologies or rules, both of which
1

can be visualized using graphs. In a graph, the nodes (vertices) represent
instances or classes and the arcs (edges) between them represent binary rela-
tionships. Formal knowledge visualizations can also use hyperarcs to connect
n ≥ 1 nodes: Directed hyperarcs can pass through intermediate nodes, al-
lowing for an encoding-free representation of n-ary relationships [6].
KV is important to be able to teach and study knowledge without need for
encoding it as a 1-dimensional (natural or formal) textual document. Instead,
KV allows a more immediate 2-dimensional knowledge (re)presentation of
entities and their connections. KV provides ways to navigate knowledge - to
find entities and their connections more easily. On a yet higher lever, KV
can also show the organization of knowledge and give a study road map.
Graph inscribed logic (Grailog) is an expressive approach to KV based both
on (generalized) graph theory and (advanced) logic. Grailog graphs contain
labelnodes which present individuals or classes/relations, the latter permit-
ted as starting points of directed hyperarcs, which can pass through multiple
nodes. The various languages of Grailog roughly correspond to languages
of the Rule Markup Language (RuleML) system, which can be serialized
in Extensible Markup Language (XML). This work will focus on the Re-
lational Grailog languages, corresponding to Datalog/Hornlog/... RuleML,
which can be used for KV of relations in mathematics, science (e.g., biology),
engineering, as well as IT (e.g., bioinformatics), including for visualizations
2

of the relational data (facts) and views (rules) provided by relational speci-
fication/programming languages such as Prolog.
Grailog KS Viz [20] is a tool that transforms “Data Logic” (Datalog) RuleML/
XML knowledge to Grailog visualizations in SVG/XML (Scalable Vector
Graphics) using an XSLT (Extensible Stylesheet Language Transformations)
translator. The XSLT translates an XML file containing RuleML into SVG,
and a browser maps this SVG-encoded Grailog diagram into a 2-dimensional
rendering.
1.1 Objectives
The primary objective of this thesis is to further develop Grailog KS Viz into
a KV tool, Grailog KS Viz 2.0, for a computationally complete language on
the level of Horn Logic (Hornlog). To achieve this objective, the tool has to
be extended to include recursively nested terms visualized as complex nodes
(boxes) containing a function-application hyperarc. Two other objectives
regarding expressiveness are the visualization of head equality as in Datalog+
(and Hornlog+) represented as a special binary atom, and the visualization
of unary relations, which requires the labelnode normal form of Grailog. An
implementation-level objective is to remove the internal JavaScript from the
generated static SVG/XML file, as it is no longer required after the position
3

and dimension values have been calculated. To accomplish this, an XSLT
stylesheet has to be created to complete the transformation to pure SVG.
The removal of JavaScript by our “Purifier” will serve a dual purpose. One
purpose will be to provide assurances to users that the SVG visualizations do
not contain malicious scripts. Another purpose will be to increase efficiency
for viewing, storing, and sharing the visualizations by reducing both the file
size and the time required to render them.
1.2 Thesis Organization
The remainder of this thesis is organized into the following sections:
• Chapter 2 (Background) provides an overview of knowledge visualiza-
tion and its benefits, the human readability and usability of graph
visualizations, the languages that are used in the tool, the previous im-
plementation of the tool, relevant security aspects, and related work.
• Chapter 3 (Design) describes a usage scenario of the tool, the architec-
ture of the tool, an example test case, the requirements met by the tool,
the Grailog constructs supported by the tool, and the SVG elements
used to create these constructs.
• Chapter 4 (Implementation) describes the development of the Renderer
4

XSLT and Purifier XSLT.
• Chapter 5 (Use Case in Mathematics) outlines the test cases in math
education, the use case in financial mathematics, the unit testing, and
evaluation of the tool.
• Chapter 6 (Conclusion) provides a summary of the work completed in
this thesis, the results, and possible extensions of this work.
5

Chapter 2
Background
The foundations that will be needed to develop this thesis are discussed in
the following sections. Section 2.1 describes knowledge visualization and its
benefits. The human readability and preferred aesthetics of visualizations
are discussed in Section 2.2. In Section 2.3, the languages used in the de-
velopment of the tool are introduced. In Section 2.4, the previous version of
Grailog KS Viz is reviewed. The research areas that are discussed in Section
2.5 address the security aspects of SVG and JavaScript. Lastly, in Section
2.6 existing related tools that are used for knowledge visualization will be
reviewed.
6

2.1 Knowledge Visualization
The goal of KV is to provide a more expressive means in order to improve the
creation and transfer of knowledge. KV can also enhance the communica-
tion of new perspectives about, or connections between, prior knowledge [9].
Visualization of procedural knowledge, which includes rules and processes,
allows ease of sharing knowledge and collaboration by the use of shared men-
tal models [26]. Benefits of employing visual presentations include assisting
individuals in communicating, improving the ability to remember and recall
knowledge, capturing and retaining the attention, and promoting the discov-
ery of new insights [8]. Knowledge is constantly evolving, and its structure
continually changes to adapt [18]. The tool allows the visual presentation of
knowledge to be easily and efficiently updated or changed as new connections
and understandings are identified.
2.2 Human Readability and Usability of Vi-
sualizations
The research that has been conducted on the usability of graph visualizations
is based largely on the human readability of graphs [3]. The readability of
graphs is most commonly associated with understanding and is determined
7

by the user’s ability to answer questions regarding graphs. Purchase [25]
conducted an empirical study in order to determine which aesthetics have
the most impact on the usability of graphs. In the study, usability was
determined by the performance of the participants when answering questions
about the structure of the graphs, and the participants’ preference of graph
based on the visual appeal. The graphs used in the study included both
syntactic and semantic graphs. Syntactic graphs are generic and contain no
real references or information, while semantic graphs are domain-specific [25].
The semantic graphs used in the study were Unified Modeling Language
(UML) graphs. The results of the study indicated that the performance of
participants was significantly impacted by the number of edge crossings in
the syntactic graphs. Both the response time and the number of errors were
significantly greater in graphs with many crossings compared to all other
aesthetic considerations [25]. In the semantic experiments, participants were
asked to select the UML class diagram they preferred. The highest preference
was for the diagrams with the fewest crossings. The study concluded that
the most important aesthetic to consider in graph visualizations is reducing
the number of edge crossings.
To further investigate the claim that edge crossings have the greatest impact
on the human readability of graphs, Huang [15] performed a study to de-
termine the extent of the impact. The study compared the number of edge
crossings to the crossing angle, which is the angle between crossing edges.
8

The purpose of the study was to determine the relative importance of one
aesthetic over another by examining the relative impact on human perfor-
mance. Human performance was based on the accuracy of completing the
tasks, and the time and mental effort required. The study also examined
the visual efficiency of the graphs. A high visual efficiency is attained when
there is high accuracy with short response time and low mental effort [15].
The results of the study indicated that the number of edge crossings had a
greater impact on task performance, mental effort and visual efficiency than
the crossing angle. The recommendations made as a result of the study were
to minimize the number of edge crossings whenever possible, and when edge
crossings are necessary the crossing angle should be as large as possible to
reduce the negative impact of the crossing [15].
The visualization of large Grailog knowledge bases using node sharing may
result in numerous hyperarc crossings. Because of the above-discussed us-
ability findings [25, 15], Grailog KS Viz 2.0 thus uses the Grailog node-copy
normal form, which allows us to eliminate all hyperarc crossings. Therefore,
the Grailog visualizations produced by the tool should be easier to under-
stand and preferable by users compared to visualizations using node sharing.
Another consideration when using node sharing is the placement of shared
nodes in a visualization. The visualization’s layout can be significantly al-
tered by the location of a shared node, which can impact the user’s percep-
9

tion and understanding of the graph [14]. Therefore, the decision of where to
place a shared node in a visualization is non-trivial and can result in layouts
of varying readability. The use of node copies in the Grailog visualizations
generated by the tool will provide consistent layouts whose readability is not
dependent on heuristic node placement.
2.3 Languages
The transformation from RuleML to Grailog visualization utilizes a variety of
languages. The languages used in the development of the tool are described
in the following subsections.
2.3.1 Graph Inscribed Logic (Grailog)
Grailog presents a given 1-dimensional symbolic data/knowledge represen-
tation in a 2-dimensional graph-logic visualization [6]. Grailog visualiza-
tions are created by mapping symbolic logic constructs to graph logic con-
structs [6]. Grailog graphs are designed to support human readability of
logic. Graph generalizations used in Grailog include n-ary directed hyper-
arcs, recursive graphs that contain nested graphs to any level of nesting,
and labelnode graphs [6]. The Grailog constructs supported by the tool are
10

described in more detail in Section 3.4.
2.3.2 RuleML
RuleML [5] constitutes a system of families of languages used for knowledge
representation. The primary focus of RuleML is the sharing and interoper-
ability of facts and rules on the Web [7]. Pretty-printed (level-indented, tree-
visualizing) RuleML/XML text [1] could be dubbed a “1 1/2”-dimensional
representation, as it is a 2-dimensional presentation but keeps copies for all
tags occurring in multiple locations of the XML tree, as in the 1-dimensional
serialization transmitted on the Web. The Grailog presentation used in this
thesis likewise keeps duplicate nodes, retaining the node-copy form of pretty-
printed RuleML/XML for a similar node-copy form of Grailog. In this thesis,
RuleML is assumed to be serialized in XML as input for KV translation to
Grailog output. Using XML serialization allows easy access and sharing on
the Web as well as translation with an XSLT stylesheet. In the thesis, the
focus will be on the Derivation RuleML languages Datalog and Hornlog.
Datalog and Hornlog are used to represent relational information. The infor-
mation could initially be given in the form of (controlled) natural language
but is assumed to be transformed into a set of facts and rules in an XML seri-
alization. The Datalog/XML and Hornlog/XML is then XSLT-transformed
11

to Grailog visualization.
2.3.3 Scalable Vector Graphics (SVG)
The SVG format, itself serialized in XML, is used for visualization as it
is compatible with all modern Web browsers and its scalability allows for
flexible KV. SVG graphics can be enlarged to show detail without affecting
the quality of the image. The scalability of SVG allows the same size graphic
to be viewed on devices with different screen resolutions and sizes [33]. SVG
can act as a Web application since it may contain scripts that are executed
each time the image is rendered [13]. The graphic objects required for Grailog
visualizations can all be rendered using SVG. The SVG elements used to
represent the Grailog constructs are further discussed in Section 3.5.
2.3.4 Extensible Stylesheet Language Transformations
(XSLT)
The transformation from RuleML/XML to SVG is realized by an XSLT
stylesheet that contains internal JavaScript. XSLT can be seen as a functional
programming language over XML trees [24]. We use XSLT Version 2.0 [30].
An XSLT stylesheet specifies the rules for transformations using XSL vocab-
12

ulary. Templates are used in stylesheets to transform XML by describing the
output formatting for the matching nodes in the source XML [30]. A more
detailed description of templates is given in Section 4.1.4. XPath expressions
are embedded in XSLT and are used to determine the hierarchical structure
and position of nodes in the XML tree. The use of XPath expressions is dis-
cussed in more detail in Section 4.1.2. The transformation is completed by
an XSLT processor which is built into modern Web browsers. In order to au-
tomate the transformation in a Web browser, the source XML must contain
a stylesheet processing instruction in the prolog (the term “prolog” refers
to the header of XML documents and is unrelated the term “Prolog” refer-
ring to the standard logic programming language) that refers to the XSLT
stylesheet to be used.
2.3.5 JavaScript
JavaScript is an object-oriented scripting language that can be used on all
platforms and Web browsers. JavaScript is commonly used in Web applica-
tions and can be executed on-the-fly by Web browsers [28]. Grailog KS Viz
2.0 uses internal scripting in the stylesheet to change the size and position
attributes of SVG elements and the dimension of the viewport as required by
the input from the XML source document. The security aspects of JavaScript
and solutions to security concerns are expanded upon in Section 2.4.
13

2.4 Grailog KS Viz
Grailog KS Viz [20] was developed in two versions; mono-spaced font and
normal. In the mono-spaced font version, the type and size of font is specified.
The font is courier which uses the same width for every character. This
allows the length of the string to be calculated by multiplying the number of
characters in the string by the width of a courier font character. The normal
version, as it is referred to in [20], does not specify the font to be used in
the visualization. The length of the string is determined using the method
getComputedTextLength. In the normal version, the font is determined by
the Web browser. The reason given for developing two versions was that
the XMLSerializer object was not supported by Google Chrome even when
using the SVG file [20]. After testing these two versions, it has been found
that the normal version in Internet Explorer (IE) does not render the directed
hyperarcs for all font settings. The normal version in Mozilla Firefox does not
calculate the length of the nodes properly to fit the text for all font settings.
The reason the mono-space font version was not supported by Google Chrome
is because the XMLSerializer object was not properly instantiated. The
SVG generated by the current implementation, Grailog KS Viz 2.0, that uses
XMLSerializer and mono-space font can be viewed in common Web browsers
including IE, Google Chrome, Firefox, and Safari. The work done in this
thesis uses the XMLSerializer and specifies mono-space font as this provides
consistent rendering and is not affected by the Web browser font settings.
14

The earlier implementation [20] does not allow for the important case of unary
(n=1) relations. A unary relation - when there is only a single argument
node - corresponds to a type/class of which the argument node is a member.
Hornlog relations, characterized by arbitrarily nested functional expressions
(i.e., complex terms) as relational arguments, are not supported by Grailog
KS Viz either. Hornlog inherits the Datalog relational arguments and extends
them to also allow functional expressions [5].
2.5 Security Aspects
SVG is to be considered an application, rather than a plain image, as it may
contain active content including scripts [13]. Malicious scripts contained in
the SVG, when interpreted by the browser, can present a security risk. The
SVG/XML generated by Grailog KS Viz 2.0 contains internal JavaScript
which is executed each time the image is generated. The internal JavaScript
has two primary functions: to calculate, assign and access the position and
size values of the SVG elements and viewport, and to access the contents of
nodes provided by the user. Neither of these functions pose a threat to users
of the tool. Yet, users may choose to remove the JavaScript from the static
image of the SVG, as described in Section 3.2, to assure their clients that the
images do not contain malicious scripts.
15

A commonly used security policy for Web browsers that is employed in
Google Chrome, IE, and Firefox is the Same Origin Policy (SOP). This pol-
icy requires scripts, and the resources they are accessing, to originate from
the same location [4]. The policy only allows the internal JavaScript in the
Grailog KS Viz 2.0 stylesheet to access sources or content that have the same
origin. Origin is defined as the protocol, domain name and port number
for Google Chrome. The SOPs for IE and Firefox are not as strict, as they
allow exceptions for the port number. IE only requires the same protocol
and domain name, and Firefox only requires the port number to be the same
if one is specified [23]. The SOP used in Google Chrome does not recognize
files stored locally in the same directory as having the same URL, therefore,
they are treated as having unique security origins. Consequently, Google
Chrome cannot render the Grailog SVG using files stored in a local directory
offline. IE and Firefox allow locally stored files to render the Grailog SVG.
In IE, the user is prompted to allow active content to be run, but if the user
allows them the browser will properly render the drawing. In all cases, the
browser security settings must allow JavaScript to execute in order to render
the drawing.
Another security tool that is used with Firefox is NoScript, an add-on that
deactivates JavaScript code execution [4]. If users interacting with NoScript
are not interactively allowing it, the Firefox browsers employing this add-on
would not be able to properly render the SVG as the internal JavaScript
16

would not be allowed to execute.
2.6 Related Work
Similar tools are being developed to support users in the visualization of
knowledge. One piece of work is the development of SVG visualization for
the Fresnel Editor [17]. This application visualizes Resource Description
Framework (RDF) data using SVG. RDF data are statements in the form of
triples. The visualization process developed for the Fresnel Editor was also
applied to the medical field in a tool called Medico SVG used for diagnosis
purposes [17].
Another piece of work is GrOWL, which is a tool used for visualizing and
editing Web Ontology Language (OWL) [21]. The visualization is in a graph
form that utilizes colour, shape, and shading of the nodes in order to convey
distinct properties [21]. The tool was developed as a Java application and
applet as well as a Protege plug-in. Applications for GrOWL visualization
models include education and economics. GrOWL has been used to provide
estimates for ecosystem services using an Ecosystem Services Database [21]
and in bioinformatics classes as a learning tool. GrOWL does not use node-
copy normal form, creating graphs with crossing edges, which can be difficult
to read [25]. In order to provide more meaningful graphs, the tool provides
17

the user with a filtering mechanism and a locality restricted view [21]. These
mechanisms alter the graphs to provide the user with only the components
that are associated with the selected node they want to view.
PaladinRM [2] is a visualization tool that graphically presents system re-
quirements and their organization. This software is primarily designed to be
used in team-based management of projects to show relationships between
system requirements. The tool uses hierarchical tree-based graph structures
that represent the relationships between defining and complying system re-
quirements. PaladinRM eliminates duplicate nodes that appear in multiple
levels of the tree structure when the data is displayed graphically. The tool
transforms RDF serialized in XML.
Google’s Knowledge Graph enhances Google Search by allowing searches to
go beyond simply matching keywords by giving users the relevant informa-
tion about their search [27]. The Knowledge Graph is composed of objects,
facts about the objects, and the relationships between the objects. Informa-
tion is added to the knowledge graph by collecting data about the entities
which represent the nodes of the graph. The entities are then connected to
closely related objects in the knowledge graph. Sources for the graph include
Freebase, Wikipedia, and the CIA World Factbook [27].
Facebook’s Open Graph allows third party applications to read and write con-
tent objects, and connections among them, in Facebook’s social graph [19].
18

Facebook users can authorize the application to gain access to the content ob-
jects, such as their profile information, photos, and friends, in their Facebook
account. Users then create Open Graph stories with the application that are
shared with Facebook. These stories consist of actions which are published,
retrieved, and modified using the Graph API. The Graph API models the
information on Facebook using nodes to represent the entities (i.e., a user, a
photo), edges to represent the connections between the entities, and fields to
provide information about the entity [10].
19

Chapter 3
Design
In Section 3.1, a description of how the tool is to be used is given. The high
level architecture of the tool is described in Section 3.2 and an example of
a RuleML source and its Grailog/SVG rendering is given. The requirements
of Grailog KS Viz 2.0 are discussed in Section 3.3. The Grailog constructs
that can be presented by the tool are outlined in Section 3.4. In Section 3.5,
the SVG elements needed to create the Grailog constructs are described.
20
3.1 Usage Scenario
Grailog KS Viz 2.0 can be used across all platforms and requires only a
modern Web browser. The latest versions, in May 2016, of IE (11), Firefox
(45.0.1), Google Chrome (49), and Safari (9) all contain an XSLT processor
and support SVG. The transformation does not require the use of an online
XSLT processing tool, which would require two explicit inputs, the RuleML/
XML and the XSLT stylesheet. Instead, Grailog KS Viz 2.0 completes the
transformation using one explicit input, the RuleML/XML, opened in a Web
browser. The rendering of the RuleML/XML document is done by the Web
browser’s built-in XSLT processor, where the stylesheet is given as an im-
plicit input in the processing instruction of the document’s prolog [32]. The
processing instruction includes a reference to the XSLT stylesheet that the
processor uses to transform the source XML document. The use of the
Web browser’s XSLT processor allows the rendering to be done offline us-
ing documents stored as local files. The RuleML/XML source documents
can be created and edited using an XML or text editor. Users must be
able to represent the knowledge to be visualized in RuleML/XML (which
itself can be generated online from the Prolog-like RuleML/POSL syntax:
http://www.jdrew.org/oojdrew/demo.html). Reader can refer to Appendix
A.1 for the knowledge representation of a test case given in Prolog, POSL,
and RuleML. Grailog KS Viz 2.0 does not allow namespaces in the RuleML/
XML.
21

3.2 Architecture
The high level architecture of Grailog KS Viz 2.0 is described in two parts.
The Renderer performs the transformation of the RuleML/XML to Grailog
visualization in SVG/XML, which contains internal JavaScript. The Purifier
removes the JavaScript from the static SVG file that results in pure SVG.
The Renderer requires a source document containing Hornlog RuleML seri-
alized in XML that includes a stylesheet processing instruction in the prolog.
The XSLT processor uses the Renderer XSLT, referred to there, to render
the Grailog/SVG/XML. The XSLT defines the mapping from the RuleML
tags to their Grailog visualization, using JavaScript to calculate the posi-
tion and size values for the SVG tags. The result of the Renderer XSLT is a
Grailog/SVG/XML visualization that contains JavaScript. The values calcu-
lated and assigned by the JavaScript are not static in the SVG/XML, instead
they are recalculated by the JavaScript each time the image is rendered.
22

Figure 3.1: High level architecture of the visualization process.
Our first example of a Grailog/SVG visualization (cf. Figure 3.2) is the result
of the transformation of graph theory knowledge represented in RuleML/
XML by the Renderer XSLT. The box above the“⇒” contains five conjoined
rule premises, namely a ternary hyperarc, three unary hyperarcs, and an
equality between two variables. The box below the“⇒” contains the rule
conclusion, here written as an equality between a variable and a (non-unique)
constant name. A controlled natural language sentence describing the graph
theory knowledge is given in pretty print formatting.
If
E connects V, U,
V is Equal to U,
V is a vertex,
23

U is a vertex,
And
E is an edge
Then
E is Equal to EdgeLoop
RuleML is the symbolic representation of the knowledge. The RuleML con-
tained in the source document is transformed by the Renderer XSLT.
<RuleML>
<Assert>
<Implies>
<And>
<Atom>
<Rel>connects</Rel>
<Var>E</Var>
<Var>V</Var>
<Var>U</Var>
</Atom>
<Equal>
<Var>V</Var>
<Var>U</Var>
</Equal>
<Atom>
<Rel>vertex</Rel>
<Var>V</Var>
</Atom>
<Atom>
<Rel>vertex</Rel>
<Var>U</Var>
</Atom>
<Atom>
<Rel>edge</Rel>
<Var>E</Var>
</Atom>
24

</And>
<Equal>
<Var>E</Var>
<Ind>EdgeLoop</Ind>
</Equal>
</Implies>
</Assert>
</RuleML>
The result of the transformation by the Renderer XSLT is the above-discussed
Grailog/SVG visualization in Figure 3.2, which uses Grailog’s labelnode nor-
mal form, where a hyperarc label becomes the starting node of that hyperarc.
The Purifier uses the input of a static SVG source document that contains a
stylesheet processing instruction referring to the Purifier XSLT in the prolog.
When the static SVG source is opened in a Web browser, the XSLT proces-
sor applies the Purifier XSLT to the document. The formatting instructions
of the XSLT produce a pure SVG visualization of Grailog that contains no
JavaScript. To maintain the ability to use the tool offline and without requir-
ing additional software or the use of a Web server, the Grailog/SVG/XML
must be saved as a static SVG image by the user before the Purifier XSLT
is applied. Removing the internal JavaScript may be of interest to users of
the tool who want to provide clients with a level of security when sharing
their images. In addition to the increased security it provides, removing the
JavaScript increases efficiency by reducing both the time required to render
the visualization and the file size of the Grailog/SVG. Automating the pro-
25

cess of saving a static SVG file from a Web browser is beyond the scope of
this thesis.
Figure 3.2: Sample Grailog/SVG presentation of graph theory knowledge.
26

3.3 Requirements
To move from Grailog KS Viz to Grailog KS Viz 2.0, new capability was
added to create a tool that visualizes Hornlog, which can address many
modeling needs. Hornlog is a Turing-complete RuleML language, more ex-
pressive than the Datalog language of the previous tool version, which is not
able to visualize Hornlog’s function applications. Grailog KS Viz 2.0 has
been expanded by developing advanced capability to allow the visualization
of Hornlog function applications (complex terms), which can be nested to
any depth, and of Hornlog+ equalities. The visualizations are now based
on the labelnode normal form of Grailog to allow the expression of unary
relations such as types or classes.
Grailog KS Viz 2.0 is an intermediary between graph rendering such as
Graphviz [12], where node copies are not used, and symbolic pretty printing
that uses node copies plus text wrapping with indentation. The tool devel-
oped in this thesis uses a normal form where a node is duplicated each time
it is referenced, e.g. to avoid hyperarc crossings. Assuming a virtual infinite
plane with the origin in the upper-left corner, the visualization can extend
without fixed bound in the horizontal and vertical directions, so no equiv-
alent to text wrapping will ever be required. Using this node-copy normal
form allows the algorithm’s visualization time to grow only linearly in the
number of assertions (facts and rules), which is important when dealing with
27

large knowledge bases. Using the normal form thus allows scalability, which
is important when dealing with databases containing large amounts of data
(facts). Moreover, the node-copy normal form is the more favourable form for
human readability as it eliminates hyperarc crossings [25]. In [14], studies
determined that the preferred visualization of node-link diagrams is node-
copy form. Nesting of nodes, which is required for functional expressions, is
another aspect that would complicate the visualization if node sharing were
to be used. Therefore, the use of the node-copy normal form is preferable.
3.4 Supported Grailog Constructs
Grailog KS Viz 2.0 allows the visualization of unary (n=1) relations. These
relations contain only a single argument node and are used to represent a
member of a type or class. In order to accommodate unary cases, the tool
uses the labelnode normal form of Grailog.
Figure 3.3: Hyperarcs for n-ary relations with a) n=1 and, generally, b) n≥1.
Passive or constructor function applications are supported in Grailog KS
28

Viz 2.0. The constructor function application contains a function node from
which the hyperarc originates, cuts through any intermediate nodes, and
points to the final node. The function application may contain n≥1 individ-
ual constants, variables, or nested constructor function applications. Used
as arguments of relation applications and equalities, constructor function
applications can be visualized as complex nodes each containing a function
application hyperarc, whose arguments may themselves contain such function
applications.
Figure 3.4: Hyperarcs for n-ary relations with (constructor) function appli-cation in any argument position.
Figure 3.5: Arbitrary levels of nested function applications.
29

Figure 3.6: Datalog+ equality.
Figure 3.7: Hornlog+ equality.
Datalog+ and Hornlog+ equality can also be visualized. Datalog+ equality
is presented as a special binary atom. Elements that may be specified as
equal include individual constants with non-unique name specifications and
individual variables. Hornlog+ equality allows function applications that
may be nested as elements. Both Hornlog+ and Datalog+ with equality in
Grailog KS Viz 2.0 are always symmetric and do not have an orientation to
distinguish syntax on the left-hand side and right-hand side.
Grailog KS Viz 2.0 has been extended to visualize single- and multi-premise
rules that contain any combination of n-ary (n≥1) relations and equalities
in the premise(s) and conclusion of the rule. The Grailog structures in the
premise(s) and conclusion may also contain nested function applications.
30

Figure 3.8: Single-premise rules containing n-ary relations (n≥1) andDatalog+ equality.
Figure 3.9: Multi-premise rules containing n-ary relations (n≥1) andDatalog+ equality.
3.5 SVG Elements Involved
SVG elements that are used to represent the Grailog constructs include text,
rectangles, rounded rectangles, polygons, patterns, markers, straight paths,
convex paths, and concave paths. A coordinate system is used to position
31

Figure 3.10: Multi-premise rule containing n-ary relations (n≥1) with arbi-trary levels of nested function application.
Figure 3.11: Multi-premise rule containing Hornlog+ equality with arbitrarylevels of nested function application.
32

the SVG elements on the SVG viewport, a rectangular area of the image
that is visible to the user. The coordinates for positioning elements and
the dimensions of the viewport are calculated using XPath expressions and
JavaScript. The XPath expressions are used to determine the position of the
nodes in the XML tree structure and the depth of the tree. JavaScript is
used to calculate the size and position of the SVG elements.
Each SVG text element is assigned the contents of the corresponding source
RuleML/XML node as its value. The font size and family of the text element
is specified so that the rendered SVG is not effected by the Web browser’s
font settings. The positioning and length of the text is crucial to calculating
the positioning of subsequent elements.
The SVG rect element [33] is used to draw a rectangle for individual con-
stants, the size of which is dependent on the length of the text in, or above,
the node. The rect element is also used to draw rectangles with rounded
corners by specifying the length of the radius of the rounded corners, us-
ing the attributes rx and ry. Rounded rectangles are used to contain the
premise(s) and conclusion of rules. The dimensions of the rounded rectangles
expand vertically and horizontally to accommodate relations and equalities
with nested function applications.
The SVG polygon element draws an enclosed shape that consists of connected
straight edges [33]. Polygons are used to represent individual variables and
33

are filled with a hatched pattern that is defined using the SVG pattern ele-
ment [33]. The size of the polygon is dependent on the length of the text in
the variable node.
The marker element is used to define the drawing of an arrow head at the
end of a path element. To draw hyperarcs pointing from the labelnode to
the final node of a relation, the path element is used to draw a straight edge
and the marker attribute refers to the arrow head as defined by the marker
element to be drawn at the end of the path [33]. The hyperarc pointing from
the premise(s) to the conclusion of a rule is drawn using the line attribute
of the path element to specify the location of four lines which results in a
double-shafted arrow.
The labelnode normal form of Grailog presents the relation as a node from
which the hyperarc originates. A labelnode consists of four convex paths
that are drawn using the SVG cubic Bezier curve command [33]. The cubic
Bezier curve command is also used to draw concave edges that are required
to visualize constructor function applications.
34

Chapter 4
Implementation
In Section 4.1 a description of the Renderer XSLT used to transform the
RuleML/XML source document to Grailog/SVG/XML is provided. The
Purifier XSLT, which removes the internal JavaScript from the static SVG
image of the visualization, is discussed in Section 4.2.
4.1 Renderer XSLT
The Renderer XSLT stylesheet is responsible for creating the root ‘svg’ el-
ement, establishing the viewport, and drawing the required Grailog con-
structs. The Renderer XSLT requires the use of XPath expressions and
35

internal JavaScript. This section will discuss in more detail the elements and
templates developed to accomplish the required visualization.
4.1.1 Viewport
The SVG canvas allows for a virtually infinite area for the content to be
rendered [33]. The viewport is a finite rectangular subregion of this canvas
where the rendered SVG is visible to the user. The viewport is able to expand
horizontally and vertically, as required, to accommodate any actual drawing
size. The viewport originates at the upper-left corner and its dimensions
are determined by the attributes width and height. The width and height
attributes of the viewport are set to the global variables maxCoordX and
coordY, respectively, that are initialized and updated by the JavaScript. The
SVG coordinate system begins at the upper-left corner and the positive x-
coordinates point to the right and the positive y-coordinates point down [33].
Since the Grailog constructs are drawn in relation to the text contained in
the source RuleML/XML nodes, the initial x and y-coordinates allow the
SVG elements to be drawn around (to the left and above) the text element.
The unit identifier for the coordinates is not specified, which is equivalent to
pixel units and is referred to as user units [33].
The dimensions of the viewport are updated using JavaScript as each SVG
36

element is created. The height of the viewport expands vertically without
bound. The JavaScript variable containing the y-coordinate is updated as
each SVG element is drawn. The width of the viewport is extended hori-
zontally to the right as required to view the widest Grailog structure. There
are two variables that contain x-coordinates that need to be updated using
JavaScript as the elements are created. The variable coordX is used to deter-
mine the relative placement of the Grailog constructs that are drawn starting
on the left-hand side of the viewport and extending across to the right. The
variable coordX is overwritten every time a construct is drawn beginning at
the left-hand side of the viewport. The variable maxCoordX is used to store
the largest x-coordinate of all the structures. After each Grailog structure is
drawn, JavaScript is used to compare the x-coordinate for that structure with
the largest x-coordinate up to that point stored in the variable maxCoordX,
and updates it as required. The following sample code is the JavaScript used
to determine the width of the viewport after the last element in a relation is
drawn.
if (parseFloat(<xsl:value-of select
="concat(’text’,’Relation’,$countRelations,position())"/>x)
+parseFloat(<xsl:value-of select
="concat(’text’,’Relation’,$countRelations,position())"/>
length)+horizSpace<![CDATA[>]]>maxCoordX){
maxCoordX=parseFloat(<xsl:value-of select="concat(’text’,
’Relation’,$countRelations,position())"/>x)
+parseFloat(<xsl:value-of select="concat(’text’,’Relation’,
$countRelations,position())"/>length)+horizSpace;}
37

4.1.2 XPath Expressions
XPath is used for addressing parts of an XML document by navigating
through its hierarchical structure [34]. These expressions are used in the
tool to determine the Grailog construct each node is mapped to and the rela-
tive position of the node elements in the XML tree. A subset of XPath is used
for matching by testing XML-tree nodes against RuleML “type tags” (also
called “Nodes”, with upper-case “N”, as opposed to RuleML “role tags”,
also called “edges”, with lower-case “e”), which determines the appropriate
XSLT template to be used. To determine the Grailog construct the nodes
are located in and their position in the construct, location paths that select
a set of nodes relative to the context node are used. The commonly used
location paths include ancestor-or-self, preceding-sibling, parent, child, and
descendant. The node set functions count, position, and last are also used.
The count function returns the number of nodes in a node set, position re-
turns the position of the context node in the node set, and last returns the
position of the last node in the node set [34]. The values returned by XPath
expressions are also used in the naming of SVG elements and for calculating
the vertical spacing between nested elements.
One limitation of XPath expressions, that had to be overcome in order to
recursively nest constructor function applications, was the inability to dis-
tinguish between the descendants of siblings that had the same (element-
38

name) path to the parent node. To accomplish this, the NestedExpr tem-
plate, which is responsible for rendering the function applications, uses the
parameter countFunctInLevel. The calling template sets the parameter to
the number of preceding-siblings in the node set that are function applica-
tions. When a nested function application occurs, the NestedExpr template
is called recursively and the parameter is updated by adding the number of
preceding-siblings in that node set to the previous value in the parameter.
This parameter ensures that when siblings both contain nested functions in
the same nested position, their elements will have unique ID names (further
discussed in Section 4.1.3).
4.1.3 Constructing ID Names for SVG Elements
All SVG elements have the ID attribute available to them. An element
can only specify one ID attribute that is used to identify them and it must
be unique for each element [31]. The JavaScript uses the ID attributes of
elements in order to retrieve (get) and assign (set) their size and position
attributes. Each time a template processes a matching node, unique ID
names are assigned to each of the elements. To ensure each element has
a unique ID name, they are created by concatenating a sequence of strings
and numbers. In order to create meaningful ID names, the strings that are
used include the type of SVG element (text, rect, etc.) and the Grailog
39
structure the element is mapped to (relation, rule, etc.). The numbers in the
ID name refer to the hierarchical position of the node in the XML tree. By
using the position of the nodes for the numerical values in the ID name, the
JavaScript can refer to the attributes of other SVG elements by calculating
their position relative to the context node.
The numbers used in the ID name of relations and equalities include the
number of previous Grailog structures in the XML of that type and a number
representing the position of the context node in the node set. In the case of
single- and multi-premise rules, the SVG elements require additional numbers
in their ID names that are used to index each equality and relation in the
premise(s) and conclusion of the rule. The string component of the ID name
for elements in rules, relations, and equalities are literal values. The sample
code shown below is the XSLT used to specify the ID name attribute for a
rectangle element that is used to represent an individual in a relation.
<xsl:attribute name="id">
<xsl:value-of select="concat(’rect’,’Relation’,
$countRelations,position())"/>
</xsl:attribute>
The ID names for constructor function application elements contain even
more numeric values to represent the level of nesting, the number of preceding
siblings on the same level that are function applications, a number that is
used to index the descendants of siblings, and the position of the context node
40
in the node set. The string component describing the Grailog structure used
in the ID name for the function application elements is a variable instead of
a literal value. The string is passed as a parameter to the template to ensure
that function applications that occur in different types of Grailog constructs
are given unique ID names. The following sample code is the XSLT used
to specify the ID name attribute for a polygon element used to represent a
variable in a function application.
<xsl:attribute name="id">
<xsl:value-of select="concat(’polygon’,$constantType,
$countType,$countFunctions,$countFunctInLevel,
$functionLevel,position(),$index)"/>
</xsl:attribute>
The JavaScript, when referring to the elements using their ID name, must
follow the same concatenation pattern that the XSLT used to create them.
Since multiple elements are often used in the JavaScript calculations, a single
calculation can result in a long line of code.
4.1.4 XSLT Templates
Templates define the processing that can be applied to nodes [30]. The two
types of XSLT templates used in Grailog KS Viz 2.0 are templates that are
applied to nodes that match a specific pattern and named templates that
41

are invoked when they are called by name [30]. In the Renderer XSLT, the
templates applied to matching nodes, including RuleML, Assert, Implies,
And, Atom, and Equal are given RuleML tag names. The named templates,
Initialize and NestedExpr, are given descriptive names as the templates are
called by name; they are not matched against a node pattern. Templates may
contain parameters that specify the variables whose values are set when the
template is called. Since XSLT variable elements are bound to the supplied
value, template parameters are used to update or change the binding of a
variable [30].
4.1.4.1 RuleML, Initialize, and Assert Templates
The root SVG node is constructed in a template that matches the pattern
of the root RuleML node in the XML source. This template defines the
hatched pattern used for variables, and the arrow head marker that is drawn
at the end of hyperarcs. The template calls the named template Initialize
which assigns the initial x and y-coordinates, and instantiates the JavaScript
object XMLSerializer and String variables used for determining the length
of text in the nodes. The Initialize template applies the Assert template
to nodes with the matching pattern. The Assert template contains only
the XSLT apply-templates element with no attribute specified, therefore all
the child nodes of Assert are selected. For each child node that is selected,
42
the XSLT processor finds the template that matches the node’s pattern and
applies the template to the node [30].
4.1.4.2 Implies Template
The Implies template processes matching nodes that are encountered in
the RuleML/XML. The template draws the surrounding rectangles for the
premise(s) and conclusion of single- and multi-premise rules, and the hyper-
arc that originates at the bottom of the rectangle surrounding the premise(s)
and points down to the rectangle surrounding the conclusion. The template
uses JavaScript-calculated values to determine the position and size of the
drawings. The rounded rectangles require unbounded vertical and horizontal
growth to accommodate nested function applications that may be present
in the elements contained in the rule. The height of each rounded rectan-
gle is calculated by finding the difference between the y-coordinate of the
first element in the premise(s) and the y-coordinate after drawing the final
element in the premise(s). The Implies template allows both relations and
equalities in the premise(s) of the rule and either a relation or equality in the
conclusion. The template uses conditional statements to match the pattern
of child nodes. The XPath count function is used to determine if the rule is
single- or multi-premise and if the child nodes are relations or equalities so
that the appropriate template is called to draw each element. In a single-
43

premise rule, if the premise or conclusion matches the pattern Atom then the
template Atom is applied. If the premise or conclusion of a single-premise
rule matches the pattern Equal, then the template Equal is applied. If there
is a multi-premise rule which is determined by matching the pattern And,
then the template And is applied to draw the elements in the premises, and
either the Atom or Equal template is applied to draw the conclusion.
4.1.4.3 And Template
The template And is responsible for drawing the Grailog constructs contained
in the multi-premise of a rule. The And template uses a for-each instruction
to process the child nodes. Conditional statements are used to determine if
the child node matches the pattern Atom or Equal, and draws the appropriate
elements. The relations and equalities drawn in the multi-premise of the
rule may contain constructor function applications. If the child node of either
a relation or equality is a function application, then the named template
NestedExpr is invoked and the required parameters are passed.
4.1.4.4 Atom Template
The template Atom processes nodes with a matching pattern. The parent of
the Atom node is matched as either Implies or Assert. If the parent node is
44

Assert, then the JavaScript sets the coordinates to start at the left-hand side
of the viewport. If the parent node is Implies, then the template determines if
the relation is the premise of a single-premise rule, or the conclusion of either
a single- or multi-premise rule and determines the correct starting coordinate
for each case.
In order to render Grailog using the labelnode-normal form, the Atom tem-
plate draws the relation node found in the first position inside a labelnode.
Subsequent nodes up to, but not including, the last node are all processed
using a for-each instruction. The context node pattern is matched as either a
variable, individual, or constructor function application. If the context node
is a variable or individual, then the Grailog construct is drawn by the Atom
template. If the context node is a function application, then the Nested-
Expr template is called and the required parameters are passed. As each
child node of Atom is processed, the JavaScript updates the x-coordinate
by adding the length of the element and additional spacing to separate the
elements.
To process the last node, there is a separate for-each instruction. The last
element is matched as either a variable, individual, or function application.
The path originating at the labelnode and pointing to the final node is drawn
first. The coordinates for the path to begin and end at are calculated using
JavaScript before drawing the last element. To render the last element, the
45

for-each instruction either draws the variable or individual element, or calls
the NestedExpr template to draw the nested function application.
4.1.4.5 Equal Template
The template Equal is applied when nodes with a matching pattern are
encountered. Equality is drawn as a special binary atom with no orientation
tags that distinguish their placement. The child node in the first position
is drawn on the left-hand side and the child node in the second position is
drawn on the right-hand side. Datalog+ equality may contain individuals
and variables, Hornlog+ equality may additionally contain nested function
applications.
The parent of the Equal node is determined by matching it with the pattern
Assert or Implies. The starting coordinates of the first child element of Equal
is calculated using JavaScript. For each child node in the first position, the
template uses conditional statements to determine if it matches the pattern
for a variable, individual, or function application. If the child node is a vari-
able or individual, then the Equal template draws the appropriate element.
If the child node is a function application, then it is drawn by calling the
NestedExpr template and passing the required parameters. A separate for-
each instruction is used to process the child node in the second (and last)
position. In this instruction the second element and a double path between
46

the elements, representing equality, are drawn. The starting coordinate of
the paths are calculated using JavaScript by adding the x-coordinate of the
first element to the length of the element. The second element is drawn at
the end of the double path.
4.1.4.6 NestedExpr Template
The NestedExpr template is a recursive, named template. The template
draws constructor function applications as an element within a relation or
equality. The function application may be nested to any depth. There are
local parameters declared for the template that are used to create unique ID
names for each element that is drawn. The sample code given below is the
XSLT that creates the named template NestedExpr and defines the template
parameters.
<xsl:template name="NestedExpr">
<xsl:param name="constantType" select="’’"/>
<xsl:param name="functionLevel" select="1"/>
<xsl:param name="countType" select="0"/>
<xsl:param name="countFunctInLevel" select
="count(preceding-sibling::Expr)+1"/>
<xsl:param name="index" select
="count(preceding-sibling::Expr)+1"/>
When the template is invoked, the parameters that are passed replace the
default values defined by the template. The parameters that are passed by
47

the calling template include a string that indicates the Grailog structure the
function application occurs in. This variable is used as part of each element’s
ID name. The other parameters include numerical values that are also used
in the creation of ID names. The parameter that indicates the number of
levels of nesting is set to one by the calling template and is incremented only
when the NestedExpr template is called recursively. Another numerical value
passed by the calling template is the number of matching Grailog structures
(rules, relations, or equalities) that have previously occurred in the XML
tree. This value is not changed when the template is called recursively. The
following sample XSLT code is from the Atom template. The NestedExpr
template is called, and parameter values are passed in order to draw nested
function applications within a relation.
<xsl:variable name="countFunctionsInAtom" select
="count(preceding-sibling::Expr)+1"/>
<!-- call template to draw function in a relation -->
<xsl:call-template name="NestedExpr">
<xsl:with-param name="constantType"
select="’FunctionInAtom’"/>
<xsl:with-param name="functionLevel" select="1"/>
<xsl:with-param name="countType" select="$countRelations"/>
<xsl:with-param name="countFunctInLevel"
select="$countFunctionsInAtom"/>
<xsl:with-param name="index" select="$countFunctionsInAtom"/>
</xsl:call-template>
In order to differentiate between nested function applications that have the
same (element-name) path to the root node, a parameter containing the
48

number of preceding-siblings that are function applications in the node set
is passed to the NestedExpr template. When the template is called recur-
sively, the number of preceding-siblings in the current level is added to the
preceding-siblings in the previous level. Lastly, the number of preceding-
siblings that are function applications in the node set of the calling template
is passed as a parameter and is not changed when the template is called re-
cursively. The following sample code is the XSLT for calling the NestedExpr
template recursively.
<xsl:if test="ancestor-or-self::Expr">
<xsl:call-template name="NestedExpr">
<xsl:with-param name="constantType"
select="$constantType"/>
<xsl:with-param name="functionLevel"
select="$functionLevel+1"/>
<xsl:with-param name="countType" select="$countType"/>
<xsl:with-param name="countFunctInLevel" select
="$countFunctInLevel+$countCurrentLevelFunctions"/>
<xsl:with-param name="index" select="$countFunctInLevel"/>
</xsl:call-template>
</xsl:if>
The template processes the child nodes of the function application using for-
each instructions. The child node in the first position of the function appli-
cation, the function element, is processed inside its own for-each instruction.
The coordinates of the function element are determined by examining the
current level of nesting. For the first level of nesting, the function element is
drawn using the last updated x and y-coordinate. For levels of nesting deeper
49

than one, the x-coordinate is incremented by a global constant to leave a hor-
izontal space between elements. The y-coordinate of the function element,
for levels deeper than one, is calculated by adding a multiple of the level of
nesting to the y-coordinate of the first level function element. This allows
the function applications to expand vertically to accommodate any depth of
nesting. The subsequent nodes up to, but not including, the last node are
drawn using another for-each instruction. Each node’s pattern is matched
using conditional statements to either variable, individual, or expression tags.
The variable and individual elements are drawn in the matching conditional
statements. If the node is an expression, the NestedExpr template is called
recursively and the appropriate parameters are incremented or updated. The
final for-each instruction in the template processes the last node in the func-
tion application. In addition to this, the instruction draws the hyperarc that
originates from the function element and points to the last node, and the four
paths that form the rectangle with a concave top and bottom that encloses
all the elements of the function application. The coordinates for each path in
the rectangle are calculated using JavaScript. The first and last position el-
ements in the node set, along with the number of descendants of the context
node that are function applications, are used to calculate the coordinates of
the paths. The number of descendants of the context node that are function
applications does not give the exact depth of nesting within the node as it
counts child nodes and siblings of child nodes. However, this measure of
depth allows enough vertical spacing to enclose all nested elements as the
50

number of descendants is greater than or equal to the level of nesting.
4.2 Purifier XSLT
The Purifier XSLT stylesheet removes the internal JavaScript from the static
SVG image of a Grailog visualization. The use of this stylesheet is optional
as it does not change the presentation of the SVG elements. The Purifier
XSLT is made up of two templates. The identity template [30], which is
widely known, matches all nodes and their attributes, and just copies them.
To remove the JavaScript, an empty template that matches the script nodes
is used. This script template matches a specific node pattern and therefore
has a higher priority than the identity template, which matches all nodes.
Therefore, the script nodes are only processed by the empty template where
nothing is generated, resulting in the script elements not being copied. All
other nodes are matched only by the identity template, which copies the node
and its attributes. The result of applying the Purifier XSLT is pure SVG.
The following code is the XSLT for the two templates used in the Purifier
XSLT.
<!-- Identity template recursively copies
nodes and their attributes -->
<xsl:template match="@*|node()">
<xsl:copy>
<xsl:apply-templates select="@*|node()"/>
51

</xsl:copy>
</xsl:template>
<!-- Empty template does not copy script elements -->
<xsl:template match="svg:script"/>
Reader can refer to Appendix A.1 for the underlying SVG/XML without
JavaScript, which is provided for the test case. The JavaScript was removed
by applying the Purifier XSLT.
52

Chapter 5
A Use Case in Mathematics
In Section 5.1, the test cases in math education that were developed to
evaluate the tool are described. A larger use case in financial mathematics is
discussed in Section 5.2. In Section 5.3, a description of the unit testing that
compares Grailog KS Viz and Grailog KS Viz 2.0 is given. An evaluation of
the size and time efficiency of Grailog KS Viz 2.0 is given in Section 5.4.
The evaluation of the tool will include its practicability (visualization accu-
rateness, response times, file size, maintainability) for users of the system.
Users must be able to represent the knowledge to be visualized in RuleML.
53

5.1 Test Cases in Math Education
Grailog visualization can have many uses in education, science, and IT. Ed-
ucation uses a variety of graphic organizers to present knowledge, including
concept maps which show relationships between concepts. KV tools have
many applications in the science domain. For example, KV is used in the
medical field for diagnosis and for mapping of scientific knowledge. By ex-
tending the Grailog visualizations to include Hornlog, Grailog KS Viz 2.0
can be used to present equality-defined mathematical functions, thereby ex-
panding its use to math and science education.
In order to evaluate the capability of the KV tool, a set of input and out-
put pairs were used for unit testing. The test cases were designed to test
specific features by designing inputs to ensure the output requirements are
met [16]. The test cases demonstrate the tool’s visualization accurateness,
including its ability to visualize functions for building complex terms with
multiple levels of nesting. There were five test cases created to visualize
graph theory knowledge. Portions of graph theory in textbook English were
first manually visualized in Grailog. The RuleML/XML was then written
and the visualization rendered using the tool in order to validate the output
against the manual visualization. The ensuing feedback loop led to the 2.0
version of the tool. Using graph theory as the topic of the test cases also
serves another purpose, as background knowledge in this field is relevant for
54

understanding Grailog visualization. Reader can refer to Appendix A for
the complete set of test cases, including the RuleML/XML source and the
rendered Grailog/SVG visualization.
5.2 Use Case in Financial Mathematics
A single larger use case was developed in the area of financial mathematics.
The use case is for teaching business rules for managing the financial aspect
of a non-profit organization. Ultimately, the use case could evolve into a form
of corporate memory which captures the knowledge of domain experts in an
organization in such a way that it can be used, e.g., for knowledge transfer
(such as training new personnel) and knowledge validation.
For concreteness, business rules for the non-profit organization RuleML Inc
were employed as a use case instantiation. These financial rules were first
represented in Hornlog RuleML and then transformed to Grailog/SVG by the
Renderer XSLT. The financial rules that are covered by the use case include
incoming and outgoing transactions, and transfers between accounts. Reader
can refer to Appendix B for the Hornlog RuleML and resulting Grailog/SVG
visualization.
55

5.3 Unit Testing
The evaluation of the Datalog visualization using Grailog KS Viz and Hornlog
visualization using Grailog KS Viz 2.0 compares the expressiveness of the
graphs and the suitability of the tools. Sample knowledge bases of increasing
graph-logic expressivity were visualized by the Grailog KS Viz and Grailog
KS Viz 2.0 tools. The resulting KVs were systematically contrasted with
each other and tool benchmarks were taken (cf. Table 5.1). The criteria for
expressiveness comparison are obvious from the table.
To compare the quality of the SVG that is produced as a result of using the
tool to transform RuleML/XML to Grailog/SVG/XML, the W3C Markup
Validation Service [29] was used. The same RuleML/XML source was trans-
formed by both Grailog KS Viz and Grailog KS Viz 2.0 and the resulting
SVG was tested online using the validation service. The SVG/XML that
was generated when Grailog KS Viz was referenced in the stylesheet process-
ing instruction was considered invalid. The validation service found errors
while checking the SVG produced by Grailog KS Viz as SVG 1.1. The
SVG/XML that was generated using Grailog KS Viz 2.0 to transform the
same RuleML/XML source was checked as valid. The online service success-
fully performed a formal validation of the SVG produced by Grailog KS Viz
2.0 as SVG 1.1. The validation was performed before the Purifier XSLT was
applied and is therefore independent of the Purifier.
56
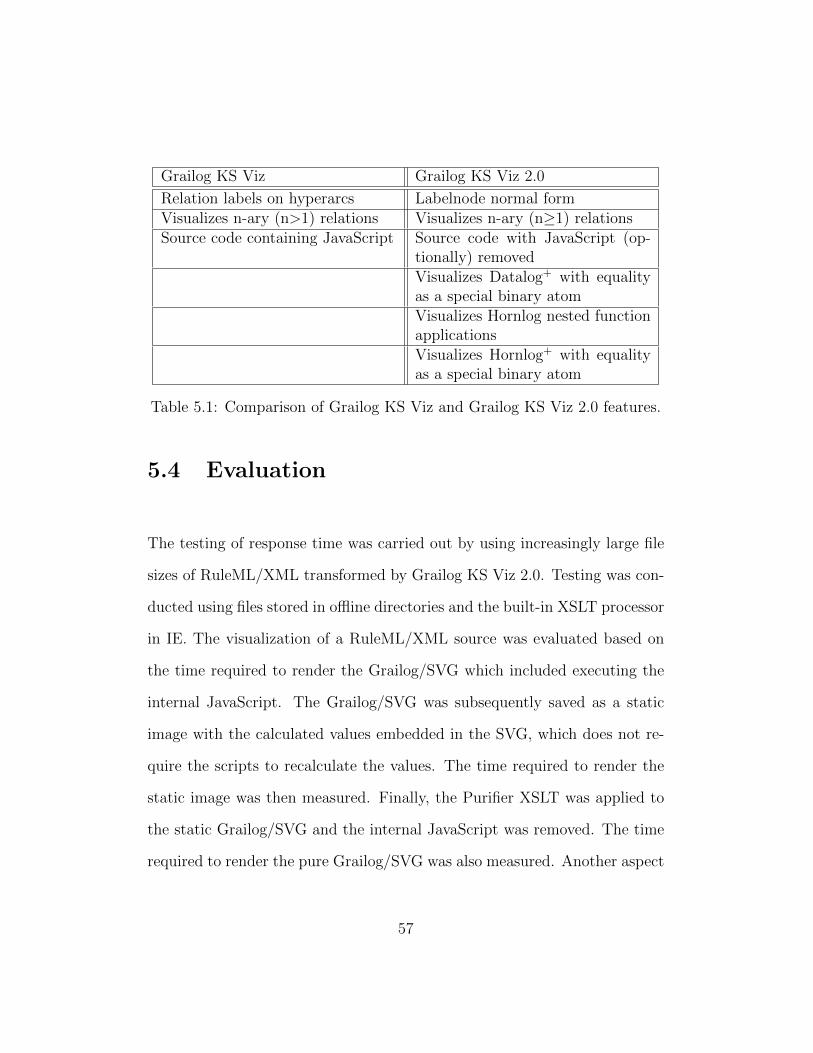
Grailog KS Viz Grailog KS Viz 2.0
Relation labels on hyperarcs Labelnode normal formVisualizes n-ary (n>1) relations Visualizes n-ary (n≥1) relationsSource code containing JavaScript Source code with JavaScript (op-
tionally) removedVisualizes Datalog+ with equalityas a special binary atomVisualizes Hornlog nested functionapplicationsVisualizes Hornlog+ with equalityas a special binary atom
Table 5.1: Comparison of Grailog KS Viz and Grailog KS Viz 2.0 features.
5.4 Evaluation
The testing of response time was carried out by using increasingly large file
sizes of RuleML/XML transformed by Grailog KS Viz 2.0. Testing was con-
ducted using files stored in offline directories and the built-in XSLT processor
in IE. The visualization of a RuleML/XML source was evaluated based on
the time required to render the Grailog/SVG which included executing the
internal JavaScript. The Grailog/SVG was subsequently saved as a static
image with the calculated values embedded in the SVG, which does not re-
quire the scripts to recalculate the values. The time required to render the
static image was then measured. Finally, the Purifier XSLT was applied to
the static Grailog/SVG and the internal JavaScript was removed. The time
required to render the pure Grailog/SVG was also measured. Another aspect
57

of evaluating the efficiency of the tool was to compare the file sizes of the
generated Grailog/SVG before and after applying the Purifier XSLT.
Employing Grailog KS Viz 2.0 to render any SVG/XML visualization in a
Web browser requires the use of JavaScript. The transformation of any
RuleML/XML source by the Renderer XSLT will invoke the Initialize tem-
plate. The Initialize template uses JavaScript to initialize the height and
width variables used in calculating the dimensions of the viewport, as well as
variables used in other templates. Each additional element that is required
in the visualization utilizes JavaScript to calculate the dimensions of the el-
ement and the coordinates for placement of the element on the viewport.
Therefore, even the most basic SVG visualization will contain JavaScript
that can be removed by the Purifier XSLT, resulting in a smaller file size.
To demonstrate this, a small visualization of a unary relation represented in
RuleML/XML was transformed to Grailog/SVG/XML using the Renderer
XSLT. The RuleML/XML representation contained in a file size of 1KB is
given below.
<RuleML>
<Assert>
<Atom>
<Rel>vertex</Rel>
<Var>V</Var>
</Atom>
</Assert>
</RuleML>
58

The resulting visualization was saved as a static SVG file, which contains
JavaScript. The static SVG file was 9KB in size and contained 121 lines
of code. The Purifier XSLT was then applied to the static Grailog/SVG to
remove the internal JavaScript. The file size of the pure Grailog/SVG was
2KB and contained 26 lines of code. Its visualization is provided below.
Larger file sizes of RuleML/XML were then used to compare the rendering
time and file sizes of the Grailog/SVG in its various forms. The visualization
of a 28KB RuleML/XML file containing 1,607 lines required on average 2.70
seconds to complete, which includes executing the internal JavaScript. Ren-
dering the visualization using the static image required less time, since the
scripts do not have to be executed again, and took on average 1.23 seconds.
The file size of the static Grailog/SVG file was 4,049KB. After the Purifier
XSLT was applied to the static Grailog/SVG, the resulting SVG file was re-
duced to 577KB in size. The time required to render the pure Grailog/SVG
was on average of 0.439 seconds.
The input RuleML/XML file size of 55KB, which has 3,207 lines, completed
the JavaScript execution and visualization in an average of 6.41 seconds.
The file size of the static SVG image was 8,118KB. The rendering of the
59

static Grailog/SVG required on average 2.57 seconds. The removal of the
JavaScript using the Purifier XSLT resulted in a file size of 1,159KB, whose
rendering took on average 0.992 seconds.
When the file size was increased to 108KB with 6,407 lines, the time to visual-
ize the Grailog/SVG was on average 13.94 seconds. The static Grailog/SVG
image was 16,392KB in size. The time required to render the static SVG
image was on average 6.59 seconds. The file size was 2,348KB after the Pu-
rifier XSLT removed the JavaScript and the rendering of the visualization
required 1.89 seconds on average.
From the results of the three data groups it is hypothesized that the vi-
sualization time for the input RuleML/XML increases linearly with the file
size. The removal of the JavaScript using the Purifier XSLT reduces the time
required to render the visualization, and results in significantly smaller file
sizes. Grailog KS Viz 2.0 thus provides users the option to more efficiently
view, store, and share visualizations.
60

Chapter 6
Conclusions
The objective of this thesis was to move from Grailog KS Viz to Grailog KS
Viz 2.0 by adding new capability including visualizing Hornlog, a computa-
tionally complete language. In Section 6.1, a summary of the results of this
work is given. Suggestions for future work that could enhance the tool are
provided in Section 6.2.
6.1 Results
Grailog KS Viz 2.0 has been extended to the labelnode normal form of
Grailog including n-ary (e.g., unary) relations. The tool is able to visual-
61

ize Datalog+ with (head) equality as a binary atom and Hornlog, including
Hornlog+ equality, allowing complex terms with arbitrary levels of nested
function applications. Single- and multi-premise rules containing any combi-
nation of n-ary relations, Datalog+ equality, and Hornlog in the premise(s)
and conclusion are visualized using the tool.
The tool developed in this thesis uses a normal form of visualization where
node copies are created, instead of node sharing. A main reason for this
approach is the scalability of the node-copy normal form for large databases.
On the other hand, the growth rate when sharing nodes is not scalable since
reuse requires searching for the location of each node in the graph. Another
benefit is that the readability of the node-copy form, which avoids any hy-
perarc crossings, is significantly greater (while the graph connectivity is not
made explicit).
In order to draw nested function applications, a recursive template with
parameters is used. The recursive template utilizes parameters to set the
variables that are required in the creation of unique ID names for the SVG
elements. When the template for nested function applications is called, the
parameters are passed by the calling template. This approach is significantly
different from the original design in that the recursive template is used to
draw nested function applications that occur in any construct by using pa-
rameters.
62

To provide assurances that there are no malicious scripts contained in the
generated SVG, the internal JavaScript can be removed. The rendered SVG,
when saved as a static image and by referencing the Purifier XSLT in its
stylesheet processing instruction, can be transformed to contain only pure
SVG. The removal of JavaScript, which is no longer required in the static
image, provides increased security when sharing the Grailog/SVG visualiza-
tions.
The removal of JavaScript from the Grailog/SVG also results in faster gener-
ation of the SVG and smaller file sizes for more efficient storage and sharing.
The file size of the efficiency test cases used in the evaluation of the tool
was each reduced by 86%. The gains of time efficiency by using the pure
SVG to render the visualization were increasingly greater as the file size in-
creased. The time required to render the visualization of the largest file was
reduced by 53% when the static Grailog/SVG image was rendered compared
to the Grailog/SVG with active scripts. When the JavaScript was removed
using the Purifier XSLT, the time to render the Grailog/SVG was reduced
by another 71% compared to the rendering time of the static image. When
large knowledge bases are being visualized, these time and space efficiencies
become increasingly more important and evident.
The SVG/XML generated by the Renderer XSLT of Grailog KS Viz 2.0
has been validated using the W3C Markup Validation Service [29], and was
63

successfully checked as SVG 1.1. The tool has been successfully tested on
common Web browsers using only their built-in XSLT processor to complete
the rendering. The quality and accuracy of the visualizations are consistent
for all tested Web browsers. IE and Firefox are able to render the Grailog
visualization using a RuleML/XML source file stored in a local or online
directory. Google Chrome and Safari transform the RuleML/XML source
file stored in an online directory.
The advantages of using KV were evident in the development of the test cases
and use case. The Grailog/SVG visualization was consistently chosen by the
users over the source RuleML representation when working collaboratively
on improvements.
6.2 Future Work
The work done in this thesis uses only the XSLT processor built into the
Web browser. This approach requires the RuleML/XML source to contain
a stylesheet processing instruction in the prolog referring to the Renderer
XSLT. Likewise, the static SVG image must also contain a stylesheet pro-
cessing instruction referring to the Purifier XSLT. The user must edit the
static SVG image and add the stylesheet processing instruction. The benefit
of using the built-in XSLT processor is that the tool can be used offline and
64

without the need for additional tools. Another approach would be to use
an online XSLT processing tool to complete the transformations by provid-
ing both the RuleML/XML and the Renderer XSLT as inputs. The use of
an online processing tool would allow the user to apply the Purifier XSLT
to the static SVG image without having to first add the stylesheet process-
ing instruction. Other considerations for future work could include the use
of a Web service that would automate the saving of the rendered Grailog
visualization as a static image file and apply the Purifier XSLT stylesheet.
The recursive template to visualize nested function applications, which was
developed to meet the main objective of this thesis, demonstrates how the
software could be improved to increase reusability for future development.
This template demonstrates how improvements to existing templates could
be made that will allow the tool to be expanded more efficiently.
A possible extension to the tool, for the visualization of nested functions,
is to have them appear increasingly smaller in size according to their depth
of nesting. The scaled-down functions could then be viewed using the zoom
function of the browser.
Other future work could include the optional merging of labelnode copies.
Eliminating duplicate nodes is a common approach to visualization and is
used in tools such as GrOWL [21] and PaladinRM [2]. When node copies are
removed, readability of the graphs is diminished. Therefore, if node copies
65

are eliminated, then other capabilities should be added to allow the user
the option to select a narrow view of the graph to reduce confusion from
crossing edges. As a follow-up on our experimental findings, the time and
space complexity of Grailog KS Viz 2.0 could be formally analyzed.
A complementary tool that could be developed would be an inverse transla-
tor. Such a conversion of Grailog visualization to RuleML knowledge repre-
sentation could lead to visual editing of machine-readable logic.
New capability could also be added to the tool in order to visualize more
languages of (Deliberation) RuleML. For example, the tool could be extended
to allow First Order Logic (FOL), Higher-Order, or Modal RuleML.
66

Bibliography
[1] Nada Alsalmi, Leah Bidlake, Ao Cheng, Thea Gegenberg, and
Emily Wilson. Normalizers for RuleML 1.0 in XSLT 2.0,
2011. http://www2.unb.ca/˜lbidlak1/CS 6975 FinalReportWebV.pdf.
Accessed May 2016.
[2] Mark Austin, Vimal Mayank, and Natalya Shmunis. Paladinrm: Graph-
based visualization of requirements organized for team-based design.
SYS Systems Engineering, 9(2):129–145, 2006.
[3] Chris Bennett, Jody Ryall, Leo Spalteholz, and Amy Gooch. The
aesthetics of graph visualization. In Proceedings of the Third Eu-
rographics Conference on Computational Aesthetics in Graphics,
Visualization and Imaging, Computational Aesthetics’07, pages 57–64,
Aire-la-Ville, Switzerland, Switzerland, 2007. Eurographics Association.
https://www.researchgate.net/publication/220795329 The Aesthetics
of Graph Visualization. Accessed June 2016.
67

[4] Nataliia Bielova. Survey on javascript security policies and their en-
forcement mechanisms in a web browser. JLAP Journal of Logic and
Algebraic Programming, 82(8):243–262, 2013.
[5] Harold Boley. The RuleML Family of Web Rule Languages. In Jose Julio
Alferes, James Bailey, Wolfgang May, and Uta Schwertel, editors, PP-
SWR, volume 4187 of Lecture Notes in Computer Science, pages 1–17.
Springer, 2006.
[6] Harold Boley. Grailog 1.0: Graph-Logic Visualization of Ontologies and
Rules. In Proc. 7th International Web Rule Symposium: Research Based
and Industry Focused (RuleML 2013), Seattle, Washington, USA, vol-
ume 8035 of Lecture Notes in Computer Science, pages 52–67. Springer,
July 2013.
[7] Harold Boley and Tara Athen. RuleML Primer. The RuleML Ini-
tiative, 2013. http://ruleml.org/papers/Primer/RuleMLPrimer2012-08-
09/RuleMLPrimer-p0-2012-08-09.html. Accessed February 2016.
[8] Remo Aslak Burkhard. Towards a framework and a model for knowl-
edge visualization: synergies between information and knowledge visu-
alization. In Knowledge and information visualization, pages 238–255.
Springer, 2005.
[9] Martin J Eppler and Remo A Burkhard. Knowledge visualiza-
tion. Technical report, Universita della Svizzera italiana, 2004.
68

http://doc.rero.ch/record/5196/files/1 wpca0402.pdf. Accessed April
2016.
[10] Facebook for Developers. The Graph API.
https://developers.facebook.com/docs/sharing/opengraph. Accessed
March 2016.
[11] Christopher Foster. Learning for understanding: Engaging and Interac-
tive Knowledge Visualization. Dept. Computer Science, Durham Uni-
versity, 2008. https://www.dur.ac.uk/resources/tel/TR-TEL-08-01.pdf.
Accessed February 2016.
[12] Emden R Gansner and Stephen C North. An open graph visualization
system and its applications to software engineering. Software Practice
and Experience, 30(11):1203–1233, 2000.
[13] Mario Heiderich, Tilman Frosch, Meiko Jensen, and Thorsten Holz.
Crouching tiger - hidden payload: Security risks of scalable vectors
graphics. In Proceedings of the 18th ACM Conference on Computer
and Communications Security, CCS ’11, pages 239–250, New York, NY,
USA, 2011. ACM.
[14] N. Henry, A. Bezerianos, and JD. Fekete. Improving the readability of
clustered social networks using node duplication. IEEE Transactions on
Visualization and Computer Graphics, 14(6), 2008.
69

[15] Weidong Huang and Maolin Huang. Exploring the relative importance
of crossing number and crossing angle. In Proceedings of the 3rd Inter-
national Symposium on Visual Information Communication, page 10.
ACM, 2010.
[16] IEEE Standards Board. IEEE Standard for Software Unit Testing:
An American National Standard, ANSI/IEEE Std 1008-1987. IEEE
Standards: Software Engineering, Volume Two: Process Standards,
1999. http://s3.amazonaws.com/akitaonrails/files/std1008-1987.pdf.
Accessed February 2016.
[17] Milos Kalab. SVG-based Knowledge Visualization, 2012.
http://www.dfki.de/ sonntag/dp-milos.pdf. Accessed February 2016.
[18] Tanja Keller and Sigmar-Olaf Tergan. Visualizing knowledge and infor-
mation: An introduction. In Knowledge and information visualization,
pages 1–23. Springer, 2005.
[19] Moo Nam Ko, Gorrell P Cheek, Mohamed Shehab, and Ravi Sandhu.
Social-networks connect services. Computer, 8:37–43, 2010.
[20] Martin Koch, Sven Schmidt, Harold Boley, and Rainer Herpers. Grailog
KS Viz: A Grailog Visualizer for Datalog RuleML Using an XSLT Trans-
lator to SVG. In Paul Fodor and Dumitru Roman, editors, Proceedings
of the RuleML 2013 Challenge, at the 7th International Web Rule Sym-
posium. CEUR, July 2013.
70

[21] S. Krivov, R. Williams, F. Villa, Software Engineering, and the Seman-
tic Web. GrOWL: A tool for visualization and editing of OWL ontolo-
gies. Web Semantics: Science, Services and Agents on the World Wide
Web, 5(2):54–57, 2007.
[22] Robert Meyer. Knowledge visualization. Media Informatics Advanced
Seminar on Information Visualization., 2008/2009. Accessed February
2016.
[23] Mozilla Developer Network. Same-origin policy - Web Secu-
rity. https://developer.mozilla.org/en-US/docs/Web/Security/Same-
origin policy. Accessed March 2016.
[24] Dimitre Novatchev. The functional programming language
xslt-a proof through examples. Online article, TopXML,
2001. http://edu.cs.uni-magdeburg.de/EC/lehre/sommersemester-
2010/funktionale-programmierung/uebungen/gruppe-2/aufgabenblatt-
12/XSLTasFP.pdf. Accessed April 2016.
[25] Helen C Purchase, David Carrington, and Jo-Anne Allder. Empirical
evaluation of aesthetics-based graph layout. Empirical Software Engi-
neering, 7(3):233–255, 2002.
[26] Daniel W. Rasmus. Visualizing knowledge. Knowledge Management
(KM) World, 22(9):8 – 29, 2013.
71

[27] Amit Singhal. Introducing the knowledge graph:
things, not strings. Official Google Blog, May, 2012.
https://googleblog.blogspot.ca/2012/05/introducing-knowledge-graph-
things-not.html. Accessed March 2016.
[28] W3C. JavaScript Web APIs. W3C Standards,
http://www.w3.org/TR/2011/REC-SVG11-20110816/. Accessed
February 2016.
[29] W3C. W3C Markup Validation Service. W3C,
https://validator.w3.org/. Accessed April 2016.
[30] W3C. XSL Transformations (XSLT) Version 2.0. W3C Recommen-
dation, https://www.w3.org/TR/2007/REC-xslt20-20070123/, January
2007. Accessed February 2016.
[31] W3C. Extensible Markup Language (XML) 1.0 (Fifth Edition). W3C
Recommendation, https://www.w3.org/TR/xml/, November 2008. Ac-
cessed April 2016.
[32] W3C. Associating Style Sheets with XML documents 1.0 (Second
Edition). W3C Recommendation, http://www.w3.org/TR/2011/REC-
SVG11-20110816/, October 2010. Accessed March 2016.
[33] W3C. Scalable Vector Graphics (SVG) 1.1 (Second Edition). W3C Rec-
ommendation, http://www.w3.org/TR/2011/REC-SVG11-20110816/,
August 2011. Accessed February 2016.
72

[34] W3C. XML Path Language (XPath) Version 1.0. W3C Recommen-
dation, https://www.w3.org/TR/xpath/, September 2015. Accessed
March 2016.
73

Appendix A
Graph-Theory Test Cases
The test cases depicting graph theory knowledge were developed using Horn-
log RuleML serialized in XML. The Renderer XSLT was applied to the
RuleML/XML using the XSLT processor built into the Web browser. The
resulting Grailog/SVG visualization accurately displays the RuleML/XML.
A.1 Test Case 1
This test case is written in controlled natural language, then represented
in machine-readable logic using Prolog, POSL, and RuleML, and then pre-
sented in Grailog/SVG as rendered by the tool. The underlying SVG/XML
74

after the internal JavaScript is removed by the Purifier XSLT is also given.
Due to the large size of the SVG/XML source with the internal JavaScript
(607 lines) it is not provided here but can be viewed online (GraphTheory-
TestCase1.ruleml.xml) by selecting view source from the context menu of the
browser.
If
Vk is a vertex,
Vj is a vertex,
And
the pair of vertices Vk, Vj is an edge
Then
Vk is an adjacent vertex to Vj
adjacentVertex(Vk,Vj) :-
vertex(Vk),
vertex(Vj),
edge(pair(Vk,Vj)).
adjacentVertex(?Vk,?Vj) :-
vertex(?Vk),
vertex(?Vj),
edge(pair[?Vk,?Vj]).
75

<RuleML>
<Assert>
<Implies>
<And>
<Atom>
<Rel>vertex</Rel>
<Var>Vk</Var>
</Atom>
<Atom>
<Rel>vertex</Rel>
<Var>Vj</Var>
</Atom>
<Atom>
<Rel>edge</Rel>
<Expr>
<Fun per="copy">pair</Fun>
<Var>Vk</Var>
<Var>Vj</Var>
</Expr>
</Atom>
</And>
<Atom>
<Rel>adjacentVertex</Rel>
<Var>Vk</Var>
<Var>Vj</Var>
</Atom>
</Implies>
</Assert>
</RuleML>
76

77

<?xml version="1.0" encoding="iso-8859-1"?>
<?xml-stylesheet type="text/xsl" href="Purifier.xslt"?>
<!DOCTYPE svg PUBLIC "-//W3C//DTD SVG 1.1//EN"
"http://www.w3.org/Graphics/SVG/1.1/DTD/svg11.dtd">
<svg id="rootSVG" width="491.313" height="900" version="1.1"
xmlns="http://www.w3.org/2000/svg">
<defs>
<marker id="arrow" viewBox="0 0 15 15" refX="1" refY="6"
markerUnits="strokeWidth" markerWidth="10" markerHeight="7"
orient="auto">
<path style="fill: none; stroke: black; stroke-width: 2;"
d="M 0 1 L 10 6 L 0 11 L 10 6 L 0 6"></path>
</marker>
<pattern id="hatched" patternUnits="userSpaceOnUse"
patternTransform="rotate(45)" x="0" y="0" width="3.5"
height="3.5">
<path fill="none" stroke="#01a9db" stroke-linecap="square"
stroke-width="1" d="M 0 0 l 0 3.5"></path>
</pattern>
</defs>
<path id="double_arrowRule1" style="fill: none; stroke: black;
stroke-width: 2;" d="M 55 580 L 65 590 L 75 580 L 68 587
L 68 560 L 68 587 L 65 590 L 62 587 L 62 560"></path>
<rect id="round_rect1Rule1" style="fill: none; stroke: #000000;
stroke-width: 1;" x="30" y="60" width="361.313" height="500"
rx="10" ry="10"></rect>
<rect id="round_rect2Rule1" style="fill: none; stroke: #000000;
stroke-width: 1;" x="30" y="592" width="312.969" height="148"
rx="10" ry="10"></rect>
<path id="curvePathMPRule1111" style="fill: none; stroke: black;
stroke-width: 1;" d="M 50 105 C 35 90 122.656 90 107.656 105">
</path>
<path id="curvePath2MPRule1111" style="fill: none; stroke: black;
stroke-width: 1;" d="M 107.656 105
C 122.656 90 122.656 140 107.656 125"></path>
<path id="curvePath3MPRule1111" style="fill: none; stroke: black;
stroke-width: 1;" d="M 107.656 125
78

C 122.656 140 35 140 50 125"></path>
<path id="curvePath4MPRule1111" style="fill: none; stroke: black;
stroke-width: 1;" d="M 50 105 C 35 90 35 140 50 125"></path>
<text id="textMPRule1111" style="font-family: courier,monospace;
font-size: 16px;" x="50" y="120">vertex</text>
<polygon id="polygonMPRule1112" style="fill: url(#hatched);
stroke:#000000; stroke-width: 1;" points="157.656,95 176.875,95
186.875,105 186.875,125 176.875,135 157.656,135 147.656,125
147.656,105"></polygon>
<text id="textMPRule1112" style="font-family: courier,monospace;
font-size: 16px;" x="157.6563" y="120">Vk</text>
<path id="pathMPRule111" fill="none"
marker-end="url("#arrow")"
stroke="black" stroke-width="1.5"
d="M 107.656 100 L 144.656 100"></path>
<path id="curvePathMPRule1121" style="fill: none; stroke: black;
stroke-width: 1;" d="M 50 215
C 35 200 122.656 200 107.656 215"></path>
<path id="curvePath2MPRule1121" style="fill: none; stroke: black;
stroke-width: 1;" d="M 107.656 215
C 122.656 200 122.656 250 107.656 235"></path>
<path id="curvePath3MPRule1121" style="fill: none; stroke: black;
stroke-width: 1;" d="M 107.656 235
C 122.656 250 35 250 50 235"></path>
<path id="curvePath4MPRule1121" style="fill: none; stroke: black;
stroke-width: 1;" d="M 50 215
C 35 200 35 250 50 235"></path>
<text id="textMPRule1121" style="font-family: courier,monospace;
font-size: 16px;" x="50" y="230">vertex</text>
<polygon id="polygonMPRule1122" style="fill: url(#hatched);
stroke:#000000; stroke-width: 1;" points="157.656,205 176.875,
205 186.875,215 186.875,235 176.875,245 157.656,245 147.656,235
147.656,215"></polygon>
<text id="textMPRule1122" style="font-family: courier,monospace;
font-size: 16px;" x="157.6563" y="230">Vj</text>
79

<path id="pathMPRule112" fill="none"
marker-end="url("#arrow")" stroke="black"
stroke-width="1.5" d="M 107.656 210 L 144.656 210"></path>
<path id="curvePathMPRule1131" style="fill: none; stroke: black;
stroke-width: 1;" d="M 50 325
C 35 310 103.438 310 88.4375 325"></path>
<path id="curvePath2MPRule1131" style="fill: none; stroke: black;
stroke-width: 1;" d="M 88.4375 325
C 103.438 310 103.438 360 88.4375 345"></path>
<path id="curvePath3MPRule1131" style="fill: none; stroke: black;
stroke-width: 1;" d="M 88.4375 345
C 103.438 360 35 360 50 345"></path>
<path id="curvePath4MPRule1131" style="fill: none; stroke: black;
stroke-width: 1;" d="M 50 325 C 35 310 35 360 50 345"></path>
<text id="textMPRule1131" style="font-family: courier,monospace;
font-size: 16px;" x="50" y="340">edge</text>
<path id="pathMPRule113" fill="none"
marker-end="url("#arrow")" stroke="black"
stroke-width="1.5" d="M 88.4375 320 L 123.438 320"></path>
<text id="textMPRule1132" x="88.4375"></text>
<path id="curvePathFunctionInMPMPRule131111" style="fill: none;
stroke: black; stroke-width: 1;" d="M 139.438 355
C 154.438 370 192.875 370 207.875 355"></path>
<path id="curvePath2FunctionInMPMPRule131111" style="fill: none;
stroke: black; stroke-width: 1;" d="M 207.875 355
C 192.875 370 192.875 390 207.875 405"></path>
<path id="curvePath3FunctionInMPMPRule131111" style="fill: none;
stroke: black; stroke-width: 1;" d="M 207.875 405
C 192.875 390 154.438 390 139.438 405"></path>
<path id="curvePath4FunctionInMPMPRule131111" style="fill: none;
stroke: black; stroke-width: 1;" d="M 139.438 355
C 154.438 370 154.438 390 139.438 405"></path>
<text id="textFunctionInMPMPRule1311111"
style="font-family:courier,monospace; font-size: 16px;"
x="154.4375" y="385">pair</text>
80

<polygon id="polygonFunctionInMPMPRule1311121"
style="fill: url(#hatched); stroke: #000000; stroke-width: 1;"
points="242.875,360 262.094,360 272.094,370 272.094,390 262.094,
400 242.875,400 232.875,390 232.875,370"></polygon>
<text id="textFunctionInMPMPRule1311121"
style="font-family: courier,monospace; font-size: 16px;"
x="242.875" y="385">Vk</text>
<path id="pathFunctionInMPMPRule131111" fill="none"
marker-end="url("#arrow")" stroke="black"
stroke-width="1.5" d="M 199.875 365 L 297.094 365"></path>
<polygon id="polygonFunctionInMPMPRule1311131"
style="fill: url(#hatched); stroke: #000000; stroke-width: 1;"
points="312.094,360 331.313,360 341.313,370 341.313,390 331.313,
400 312.094,400 302.094,390 302.094,370"></polygon>
<text id="textFunctionInMPMPRule1311131"
style="font-family: courier,monospace; font-size: 16px;"
x="312.0938" y="385">Vj</text>
<path id="curvePathExprFunctionInMPMPRule131111"
style="fill: none; stroke: black; stroke-width: 1;"
d="M 129.438 300 C 139.438 305 366.313 310 371.313 300"></path>
<path id="curvePathExpr2FunctionInMPMPRule131111" style="fill: none;
stroke: black; stroke-width: 1;"
d="M 371.313 300 L 371.313 440"></path>
<path id="curvePathExpr3FunctionInMPMPRule131111" style="fill: none;
stroke: black; stroke-width: 1;" d="M 371.313 440
C 361.313 435 134.438 430 129.438 440"></path>
<path id="curvePathExpr4FunctionInMPMPRule131111" style="fill: none;
stroke: black; stroke-width: 1;"
d="M 129.438 300 L 129.438 440"></path>
<path id="curvePathRule121" style="fill: none; stroke: black;
stroke-width: 1;" d="M 50 650
C 35 635 199.531 635 184.531 650"></path>
<path id="curvePath2Rule121" style="fill: none; stroke: black;
81

stroke-width: 1;" d="M 184.531 650
C 199.531 635 199.531 685 184.531 670"></path>
<path id="curvePath3Rule121" style="fill: none; stroke: black;
stroke-width: 1;" d="M 184.531 670
C 199.531 685 35 685 50 670"></path>
<path id="curvePath4Rule121" style="fill: none; stroke: black;
stroke-width: 1;" d="M 50 650 C 35 635 35 685 50 670"></path>
<text id="textRule121" style="font-family: courier,monospace;
font-size: 16px;" x="50" y="665">adjacentVertex</text>
<polygon id="polygonRule122" style="fill: url(#hatched);
stroke: #000000; stroke-width: 1;" points="234.531,640 253.75,
640 263.75,650 263.75,670 253.75,680 234.531,680 224.531,670
224.531,650"></polygon>
<text id="textRule122" style="font-family: courier,monospace;
font-size: 16px;" x="234.5313" y="665">Vk</text>
<polygon id="polygonRule123" style="fill: url(#hatched);
stroke: #000000; stroke-width: 1;" points="303.75,640 322.969,
640 332.969,650 332.969,670 322.969,680 303.75,680 293.75,670
293.75,650"></polygon>
<text id="textRule123" style="font-family: courier,monospace;
font-size: 16px;" x="303.7501" y="665">Vj</text>
<path id="pathRule12" fill="none"
marker-end="url("#arrow")" stroke="black"
stroke-width="1.5" d="M 184.531 645 L 290.75 645"></path>
</svg>
82

A.2 Test Case 2
This test case is again written in controlled natural language, then repre-
sented in RuleML logic, and finally presented in Grailog/SVG as rendered
by the tool.
If
U is a vertex,
V is a vertex,
W is a vertex,
E is
Equal to
the pair of vertices U, V,
F is
Equal to
the pair of vertices V, W,
E is an edge,
And
F is an edge
Then
E is an adjacent edge to F
<RuleML>
<Assert>
<Implies>
<And>
<Atom>
<Rel>vertex</Rel>
<Var>U</Var>
</Atom>
<Atom>
<Rel>vertex</Rel>
<Var>V</Var>
83

</Atom>
<Atom>
<Rel>vertex</Rel>
<Var>W</Var>
</Atom>
<Equal>
<Var>E</Var>
<Expr>
<Fun per="copy">pair</Fun>
<Var>U</Var>
<Var>V</Var>
</Expr>
</Equal>
<Equal>
<Var>F</Var>
<Expr>
<Fun per="copy">pair</Fun>
<Var>V</Var>
<Var>W</Var>
</Expr>
</Equal>
<Atom>
<Rel>edge</Rel>
<Var>E</Var>
</Atom>
<Atom>
<Rel>edge</Rel>
<Var>F</Var>
</Atom>
</And>
<Atom>
<Rel>adjacentEdge</Rel>
<Var>E</Var>
<Var>F</Var>
</Atom>
</Implies>
</Assert>
</RuleML>
84

85

A.3 Test Case 3
This test case is a way to capture: The graph over a vertex set and edge set
is the same as the pair constructed from the set of vertices and the set of
pairs of vertices.
<RuleML>
<Assert>
<Implies>
<And>
<Atom>
<Rel>vertex</Rel>
<Var>Vk</Var>
</Atom>
<Atom>
<Rel>vertex</Rel>
<Var>Vj</Var>
</Atom>
</And>
<Equal>
<Expr>
<Fun per="copy">graph</Fun>
<Var>V</Var>
<Var>E</Var>
</Expr>
<Expr>
<Fun per="copy">pair</Fun>
<Expr>
<Fun per="copy">set</Fun>
<Var>Vk</Var>
</Expr>
<Expr>
86

<Fun per="copy">set</Fun>
<Expr>
<Fun per="copy">pair</Fun>
<Var>Vk</Var>
<Var>Vj</Var>
</Expr>
</Expr>
</Expr>
</Equal>
</Implies>
</Assert>
</RuleML>
87

A.4 Test Case 4
This test case is a way to capture: A graph over a vertex set and edge set is
a simple graph if there is a vertex set of 1 or more vertices and an edge set
of 0 or more pairs of vertices, where the pairs of vertices must be distinct.
88

<RuleML>
<Assert>
<Implies>
<And>
<Atom>
<Rel>vertex</Rel>
<Var>Vk</Var>
</Atom>
<Atom>
<Rel>vertex</Rel>
<Var>Vj</Var>
</Atom>
<Atom>
<Rel>distinct</Rel>
<Expr>
<Fun per="copy">pair</Fun>
<Var>Vk</Var>
<Var>Vj</Var>
</Expr>
</Atom>
<Equal>
<Var>V</Var>
<Expr>
<Fun per="copy">set</Fun>
<Var>Vk</Var>
</Expr>
</Equal>
<Equal>
<Var>E</Var>
<Expr>
<Fun per="copy">set</Fun>
<Expr>
<Fun per="copy">pair</Fun>
<Var>Vk</Var>
<Var>Vj</Var>
</Expr>
</Expr>
</Equal>
89

<Atom>
<Rel>greaterOrEqual</Rel>
<Expr>
<Fun per="copy">cardinality</Fun>
<Var>V</Var>
</Expr>
<Ind>1</Ind>
</Atom>
<Atom>
<Rel>greaterOrEqual</Rel>
<Expr>
<Fun per="copy">cardinality</Fun>
<Var>E</Var>
</Expr>
<Ind>0</Ind>
</Atom>
</And>
<Atom>
<Rel>simpleGraph</Rel>
<Expr>
<Fun per="copy">graph</Fun>
<Var>V</Var>
<Var>E</Var>
</Expr>
</Atom>
</Implies>
</Assert>
</RuleML>
90

91

A.5 Test Case 5
This test case is a way to capture: A graph constructed from a set of vertices
and edges is a subgraph if it contains a subset of edges and vertices that are
the result of removing a graph over some vertex and edge elements from a
larger graph.
<RuleML>
<Assert>
<Implies>
<And>
<Atom>
<Rel>vertex</Rel>
<Var>U</Var>
</Atom>
<Atom>
<Rel>vertex</Rel>
<Var>W</Var>
</Atom>
<Equal>
<Var>E2</Var>
<Expr>
<Fun per="copy">edgeSubSet</Fun>
<Var>E1</Var>
</Expr>
</Equal>
<Equal>
<Var>V2</Var>
<Expr>
<Fun per="copy">vertexSubSet</Fun>
<Var>V1</Var>
</Expr>
</Equal>
<Equal>
92

<Expr>
<Fun per="copy">graph</Fun>
<Var>V2</Var>
<Var>E2</Var>
</Expr>
<Expr>
<Fun per="copy">graphDiff</Fun>
<Expr>
<Fun per="copy">graph</Fun>
<Var>V1</Var>
<Var>E1</Var>
</Expr>
<Expr>
<Fun per="copy">graph</Fun>
<Var>U</Var>
<Expr>
<Fun per="copy">set</Fun>
<Expr>
<Fun per="copy">pair</Fun>
<Var>U</Var>
<Var>W</Var>
</Expr>
</Expr>
</Expr>
</Expr>
</Equal>
</And>
<Atom>
<Rel>subGraph</Rel>
<Expr>
<Fun per="copy">graph</Fun>
<Var>V2</Var>
<Var>E2</Var>
</Expr>
<Expr>
<Fun per="copy">graph</Fun>
<Var>V1</Var>
<Var>E1</Var>
93

</Expr>
</Atom>
</Implies>
</Assert>
</RuleML>
94
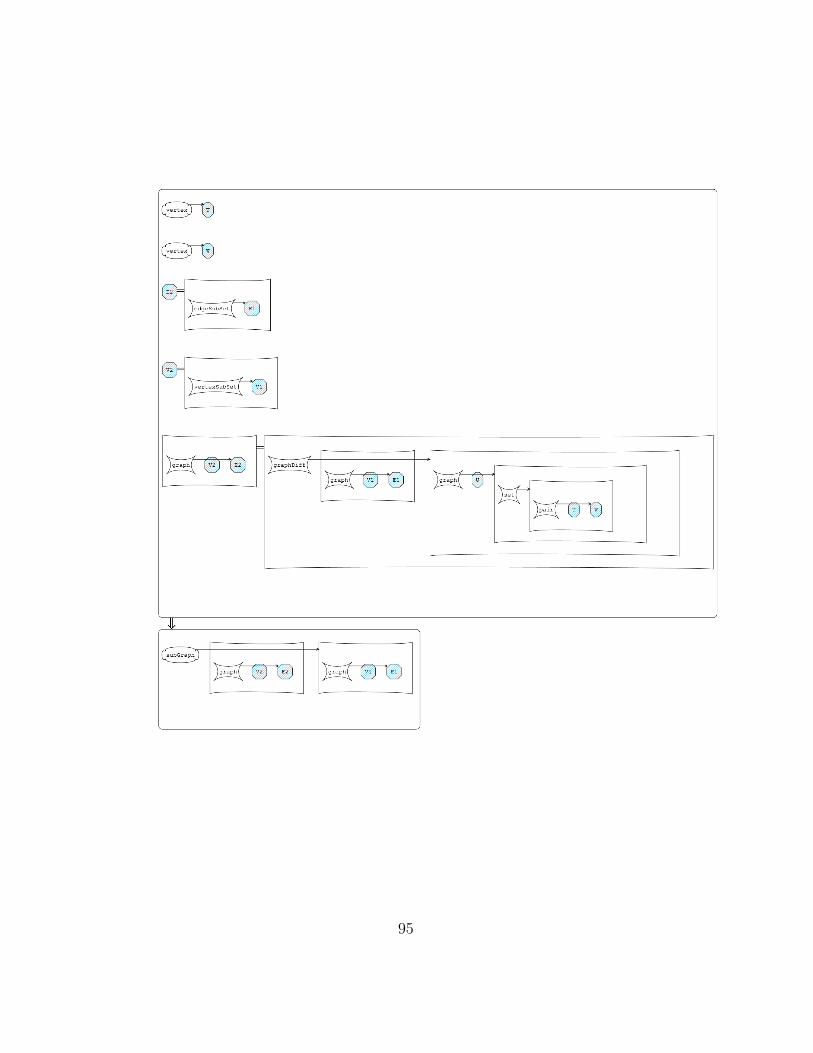
95

Appendix B
Financial Use Case
Typical financial business rules for international non-profit organizations such
as RuleML Inc were transformed from RuleML/XML to Grailog/SVG vi-
sualization. The financial rules that were covered by the use case include
incoming and outgoing transactions.
B.1 Hornlog RuleML
In developing the use case, the financial rules involving different sources of
income and expense were expressed in Hornlog RuleML. The size of this
RuleML/XML input file is 8KB.
96

<RuleML>
<Assert>
<!-- Sponsor Level is associated with
a colour and amount in USD -->
<Atom>
<Rel>sponsorLevel</Rel>
<Ind>Bronze</Ind>
<Ind>500.00</Ind>
</Atom>
<Atom>
<Rel>sponsorLevel</Rel>
<Ind>Silver</Ind>
<Ind>1000.00</Ind>
</Atom>
<Atom>
<Rel>sponsorLevel</Rel>
<Ind>Gold</Ind>
<Ind>3000.00</Ind>
</Atom>
<Atom>
<Rel>sponsorLevel</Rel>
<Ind>Platinum</Ind>
<Ind>5000.00</Ind>
</Atom>
<Atom>
<Rel>sponsorLevel</Rel>
<Ind>Emerald</Ind>
<Ind>7500.00</Ind>
</Atom>
<!-- Sponsor of RuleML Symposium -->
<Atom>
<Rel>sponsor</Rel>
<Expr>
<Fun per="copy">name</Fun>
<Ind>OASISLegalXML</Ind>
</Expr>
<Ind>Silver</Ind>
</Atom>
97

<!-- Speakers at RuleML Symposium -->
<Atom>
<Rel>speaker</Rel>
<Expr>
<Fun per="copy">name</Fun>
<Ind>MichaelGruninger</Ind>
</Expr>
<Ind>Keynote</Ind>
</Atom>
<Atom>
<Rel>speaker</Rel>
<Expr>
<Fun per="copy">name</Fun>
<Ind>BenjaminGrosof</Ind>
</Expr>
<Ind>InvitedTalk</Ind>
</Atom>
<!-- Type of speaker is associated
with a reimbursement -->
<Atom>
<Rel>reimburse</Rel>
<Ind>Keynote</Ind>
<Ind>400.00</Ind>
</Atom>
<Atom>
<Rel>reimburse</Rel>
<Ind>InvitedTalk</Ind>
<Ind>0.00</Ind>
</Atom>
<Atom>
<Rel>reimburse</Rel>
<Ind>Tutorial</Ind>
<Ind>0.00</Ind>
</Atom>
<!-- Registration fee is associated
with a type of participant -->
<Atom>
<Rel>registrationFee</Rel>
98

<Ind>Student</Ind>
<Ind>Early</Ind>
<Ind>150.00</Ind>
</Atom>
<Atom>
<Rel>registrationFee</Rel>
<Ind>Student</Ind>
<Ind>Late</Ind>
<Ind>250.00</Ind>
</Atom>
<Atom>
<Rel>registrationFee</Rel>
<Ind>MemberOrPartner</Ind>
<Ind>Early</Ind>
<Ind>400.00</Ind>
</Atom>
<Atom>
<Rel>registrationFee</Rel>
<Ind>MemberOrPartner</Ind>
<Ind>Late</Ind>
<Ind>500.00</Ind>
</Atom>
<Atom>
<Rel>registrationFee</Rel>
<Ind>NonMember</Ind>
<Ind>Early</Ind>
<Ind>450.00</Ind>
</Atom>
<Atom>
<Rel>registrationFee</Rel>
<Ind>NonMember</Ind>
<Ind>Late</Ind>
<Ind>550.00</Ind>
</Atom>
<!-- The web service fee is associated
with a type of participant -->
<Atom>
<Rel>webServiceFee</Rel>
99

<Ind>Student</Ind>
<Ind>4.74</Ind>
</Atom>
<Atom>
<Rel>webServiceFee</Rel>
<Ind>MemberOrPartner</Ind>
<Ind>9.95</Ind>
</Atom>
<Atom>
<Rel>webServiceFee</Rel>
<Ind>NonMember</Ind>
<Ind>9.95</Ind>
</Atom>
<!-- Participants at RuleML Symposium -->
<Atom>
<Rel>participant</Rel>
<Expr>
<Fun per="copy">id</Fun>
<Ind>179676719</Ind>
</Expr>
<Ind>Student</Ind>
<Ind>Late</Ind>
</Atom>
<Atom>
<Rel>participant</Rel>
<Expr>
<Fun per="copy">id</Fun>
<Ind>177691773</Ind>
</Expr>
<Ind>MemberOrPartner</Ind>
<Ind>Early</Ind>
</Atom>
<!-- Conversion from USD to CAD
at a rate of 1.3 -->
<Implies>
<Atom>
<Rel>mulitply</Rel>
<Var>USDAmount</Var>
100
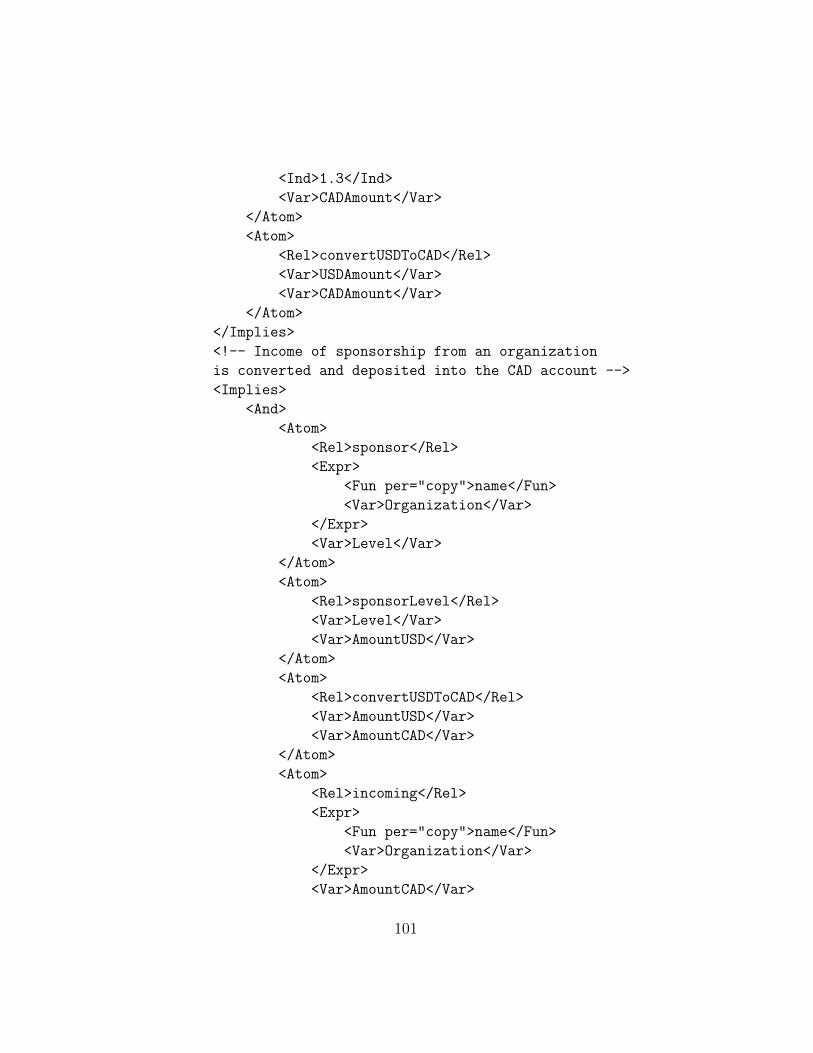
<Ind>1.3</Ind>
<Var>CADAmount</Var>
</Atom>
<Atom>
<Rel>convertUSDToCAD</Rel>
<Var>USDAmount</Var>
<Var>CADAmount</Var>
</Atom>
</Implies>
<!-- Income of sponsorship from an organization
is converted and deposited into the CAD account -->
<Implies>
<And>
<Atom>
<Rel>sponsor</Rel>
<Expr>
<Fun per="copy">name</Fun>
<Var>Organization</Var>
</Expr>
<Var>Level</Var>
</Atom>
<Atom>
<Rel>sponsorLevel</Rel>
<Var>Level</Var>
<Var>AmountUSD</Var>
</Atom>
<Atom>
<Rel>convertUSDToCAD</Rel>
<Var>AmountUSD</Var>
<Var>AmountCAD</Var>
</Atom>
<Atom>
<Rel>incoming</Rel>
<Expr>
<Fun per="copy">name</Fun>
<Var>Organization</Var>
</Expr>
<Var>AmountCAD</Var>
101

<Ind>CIBCToronto</Ind>
</Atom>
</And>
<Atom>
<Rel>income</Rel>
<Expr>
<Fun per="copy">sponsorship</Fun>
<Expr>
<Fun per="copy">name</Fun>
<Ind>OASISLegalXML</Ind>
</Expr>
<Var>Level</Var>
<Var>AmountCAD</Var>
</Expr>
</Atom>
</Implies>
<!-- Conversion from gross income to net income -->
<Implies>
<And>
<Atom>
<Rel>webServiceFee</Rel>
<Var>ParticipantType</Var>
<Var>FeeAmount</Var>
</Atom>
<Atom>
<Rel>subtract</Rel>
<Var>GrossUSDAmount</Var>
<Var>FeeAmount</Var>
<Var>NetUSDAmount</Var>
</Atom>
</And>
<Atom>
<Rel>convertGrossToNet</Rel>
<Var>GrossUSDAmount</Var>
<Var>NetUSDAmount</Var>
<Var>ParticipantType</Var>
</Atom>
</Implies>
102

<!-- Income of registration from a participant
is deposited into the Paypal account -->
<Implies>
<And>
<Atom>
<Rel>participant</Rel>
<Expr>
<Fun per="copy">id</Fun>
<Var>IDNumber</Var>
</Expr>
<Var>ParticipantType</Var>
<Var>RegistrationType</Var>
</Atom>
<Atom>
<Rel>registrationFee</Rel>
<Var>ParticipantType</Var>
<Var>RegistrationType</Var>
<Var>AmountUSD</Var>
</Atom>
<Atom>
<Rel>convertGrossToNet</Rel>
<Var>AmountUSD</Var>
<Var>NetAmountUSD</Var>
<Var>ParticipantType</Var>
</Atom>
<Atom>
<Rel>incoming</Rel>
<Expr>
<Fun per="copy">id</Fun>
<Var>IDNumber</Var>
</Expr>
<Var>NetAmountUSD</Var>
<Ind>Paypal</Ind>
</Atom>
</And>
<Atom>
<Rel>income</Rel>
<Expr>
103

<Fun per="copy">registration</Fun>
<Expr>
<Fun per="copy">id</Fun>
<Var>IDNumber</Var>
</Expr>
<Var>ParticipantType</Var>
<Var>RegistrationType</Var>
<Var>NetAmountUSD</Var>
</Expr>
</Atom>
</Implies>
<!-- Expense of a speaker is converted and
withdrawn from the CAD bank account -->
<Implies>
<And>
<Atom>
<Rel>speaker</Rel>
<Expr>
<Fun per="copy">name</Fun>
<Var>SpeakerName</Var>
</Expr>
<Var>SpeakerType</Var>
</Atom>
<Atom>
<Rel>reimburse</Rel>
<Var>SpeakerType</Var>
<Var>AmountUSD</Var>
</Atom>
<Atom>
<Rel>convertUSDToCAD</Rel>
<Var>AmountUSD</Var>
<Var>AmountCAD</Var>
</Atom>
<Atom>
<Rel>outgoing</Rel>
<Expr>
<Fun per="copy">name</Fun>
<Var>SpeakerName</Var>
104

</Expr>
<Var>AmountCAD</Var>
<Ind>CIBCToronto</Ind>
</Atom>
</And>
<Atom>
<Rel>expense</Rel>
<Expr>
<Fun per="copy">symposiumSpeaker</Fun>
<Expr>
<Fun per="copy">name</Fun>
<Var>SpeakerName</Var>
</Expr>
<Var>SpeakerType</Var>
<Var>AmountCAD</Var>
</Expr>
</Atom>
</Implies>
</Assert>
</RuleML>
B.2 Grailog/SVG
The Renderer XSLT was used to transform the Hornlog RuleML/XML source
to Grailog/SVG visualization of the financial rules. The size of the Grailog/
SVG/XML output file with JavaScript is 634KB, and without JavaScript is
97KB. It took on average 0.410s to render the visualization from the RuleML/
XML. The rendering using the static SVG required on average 0.082s, and
the pure SVG with the JavaScript removed took on average 0.076s to render.
105

106

107

108

109

110

111

112

113

114

Appendix C
Installation and Use
Grailog KS Viz 2.0 is employed to visualize rule-knowledge bases in RuleML/
XML as Grailog graphs in SVG/XML using common modern Web browsers.
The SVG initially contains internal JavaScript that is used to calculate and
assign position values and attribute values. The Grailog KS Viz 2.0 files, re-
ferred to in this guide using relative URL’s, are located at the root URL
https://github.com/RuleML/GrailogKSViz/blob/2.0/. The GraphTheory
test case for testing Grailog KS Viz 2.0 was implemented: starting with
a RuleML/XML document GraphTheory.ruleml (GraphTheory.ruleml.xml)
(save file and open in an XML or text editor to view and edit the source
RuleML), adding a stylesheet processing instruction in the prolog, and visual-
izing it with any common Web browser as SVG/XML document
115
GraphTheory.svg. The RuleML/XML as input is transformed using the Web
browser’s XSLT 2.0 processor. To perform all testing using only the browser’s
XSLT processor, the XML document’s prolog must contain a stylesheet pro-
cessing instruction that references the XSLT to be applied. For local and
online testing browser security settings must allow JavaScript to run.
C.1 Local Testing of the Renderer
For testing Grailog KS Viz 2.0 on local machines, all documents must be
stored as local files in the same directory. The RuleML/XML document
must contain a reference to the Renderer XSLT stylesheet (Renderer.xslt) in
order to apply the transformation. Open the saved GraphTheory.ruleml file
in an editor and copy the stylesheet processing instruction into the prolog:
<?xml-stylesheet type="text/xsl" href="Renderer.xslt"?>
To view the Grailog visualization, open the RuleML/XML document in a
common Web browser (e.g., IE or Firefox), either by dragging and dropping
the RuleML/XML file onto the application (shortcut) or choosing the ‘open
with’ option from the context menu and selecting the Web browser applica-
tion. Local testing cannot be done using Google Chrome due to its strict
Same Origin Policy (SOP), which does not recognize the files stored in the
116

same local directory as being from the same origin.
C.2 Online Testing of the Renderer
For testing Grailog KS Viz 2.0 online, the RuleML/XML document Graph-
Theory.ruleml and the Renderer XSLT stylesheet must be stored in the same
online directory. Then create a hyperlink to the RuleML/XML document.
In the Web browser, select the hyperlink to the RuleML/XML document:
the browser’s XSLT processor will render the Grailog visualization. Online
testing can be done using common Web browsers (e.g., IE, Firefox, Google
Chrome, or Safari).
C.3 Using the Purifier
The internal JavaScript can be removed (only) after the visualization has
been rendered and saved as a static SVG image. The Purifier XSLT stylesheet
(Purifier.xslt) must be stored in the same directory as the static SVG image.
Due to strict security policies, Google Chrome cannot be used to perform the
purifying. To remove JavaScript tags from the generated Grailog SVG/XML:
1. render the Grailog visualization in browser
117

2. save the SVG image in the same directory as the Purifier XSLT by
selecting from the browser’s context menu:
(a) ‘Save picture as’ in IE
(b) ‘Save page as’ in Firefox
3. open the saved SVG file in an editor and copy the stylesheet processing
instruction into the prolog:
<?xml-stylesheet type="text/xsl" href="Purifier.xslt"?>
4. open the edited file in IE or Firefox to get the Purifier XSLT applied
The final SVG may be saved to any location and will not contain any
JavaScript. The final rendering may be viewed in IE and Firefox. Due
to strict security policies, to view the final SVG in Google Chrome, the file
must be edited again to remove the stylesheet processing instruction from the
prolog, which is no longer required after the Purifier has been applied. Once
the reference is removed, the SVG can also be viewed in Google Chrome.
C.4 GraphTheory Test Case
In the current section the RuleML/XML for the GraphTheory test case em-
ployed in this Installation and Use guide is provided. The test case is written
118

in controlled natural language, then represented in RuleML logic, and finally
presented in Grailog.
If
N1 is a node
And
N2 is a node
Then
the undirected arc from N1 to N2 is
Equal to
the undirected arc from N2 to N1
<RuleML>
<Assert>
<Implies>
<And>
<Atom>
<Rel>node</Rel>
<Var>N1</Var>
</Atom>
<Atom>
<Rel>node</Rel>
<Var>N2</Var>
</Atom>
</And>
<Equal>
<Expr>
<Fun per="copy">undirectedArc</Fun>
<Var>N1</Var>
<Var>N2</Var>
</Expr>
<Expr>
<Fun per="copy">undirectedArc</Fun>
<Var>N2</Var>
119

<Var>N1</Var>
</Expr>
</Equal>
</Implies>
</Assert>
</RuleML>
Figure C.1: Grailog/SVG visualization of GraphTheory RuleML/XML.
120

Vita
Candidate’s full name: Leah BidlakeUniversity attended:
• University of New Brunswick (Fredericton) 1999-2005 Bachelor of Com-puter Science
• University of New Brunswick (Fredericton) 1999-2005 Bachelor of Ed-ucation
Presentations:
• Grailog KS Viz 2.0: Graph-Logic Knowledge Visualization by XML-Based Translation The 6th Atlantic Workshop of Semantics andServices (AWoSS), December 9, 2015. University of New Brunswick,Fredericton, NB
• Translating HornlogEq RuleML to Grailog for SVG VisualizationRuleML Webinar, June 20, 2016