Embed Size (px)
Citation preview

GAMCO WESTWOOD FUNDS
CommentaryMarch 31, 2011
Mighty MitesSM Fund
SmallCap Equity Fund
Income Fund
Equity Fund
Balanced Fund
Intermediate Bond Fund
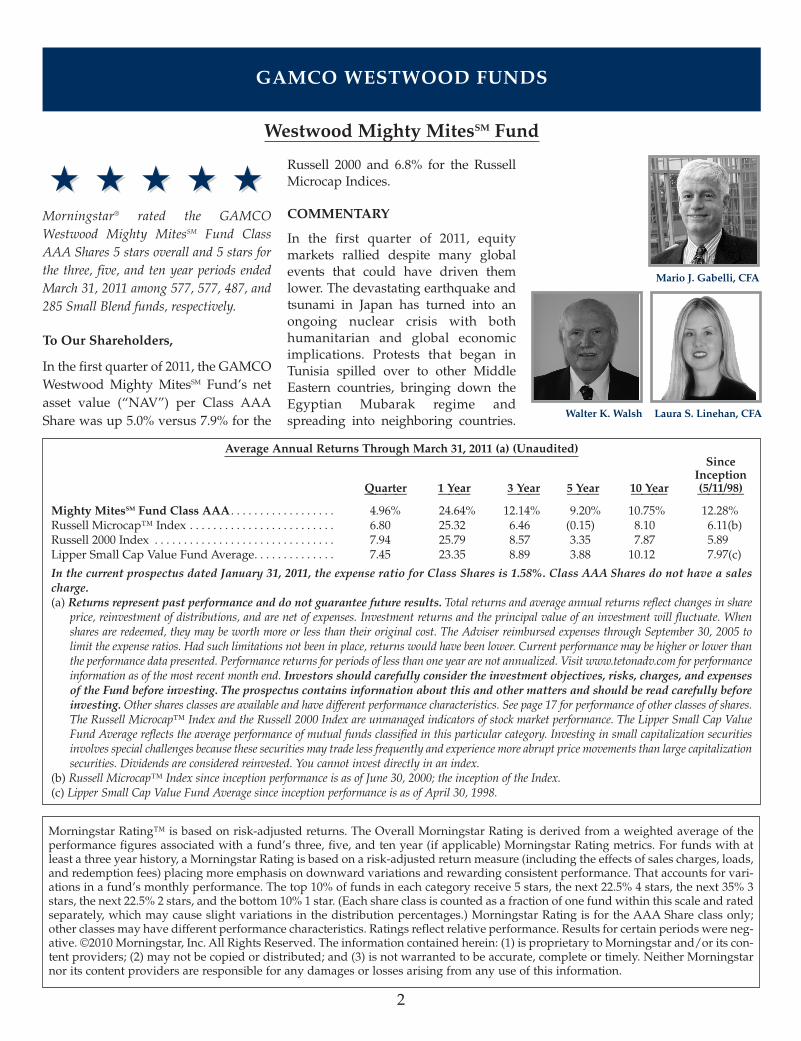
́́ ́ ́ ́ ́́ ́ ́ ́Morningstar® rated the GAMCOWestwood Mighty MitesSM Fund ClassAAA Shares 5 stars overall and 5 stars forthe three, five, and ten year periods endedMarch 31, 2011 among 577, 577, 487, and285 Small Blend funds, respectively.
To Our Shareholders,
In the first quarter of 2011, the GAMCOWestwood Mighty MitesSM Fund’s netasset value (“NAV”) per Class AAAShare was up 5.0% versus 7.9% for the
Russell 2000 and 6.8% for the RussellMicrocap Indices.
COMMENTARY
In the first quarter of 2011, equitymarkets rallied despite many globalevents that could have driven themlower. The devastating earthquake andtsunami in Japan has turned into anongoing nuclear crisis with bothhumanitarian and global economicimplications. Protests that began inTunisia spilled over to other MiddleEastern countries, bringing down theEgyptian Mubarak regime andspreading into neighboring countries.
2
GAMCO WESTWOOD FUNDS
Average Annual Returns Through March 31, 2011 (a) (Unaudited)Since
InceptionQuarter 1 Year 3 Year 5 Year 10 Year (5/11/98)———— ——— ——— ——— ——–— ——–——
Mighty MitesSM Fund Class AAA . . . . . . . . . . . . . . . . . . 4.96% 24.64% 12.14% 9.20% 10.75% 12.28% Russell Microcap™ Index . . . . . . . . . . . . . . . . . . . . . . . . . 6.80 25.32 6.46 (0.15) 8.10 6.11(b)Russell 2000 Index . . . . . . . . . . . . . . . . . . . . . . . . . . . . . . . 7.94 25.79 8.57 3.35 7.87 5.89Lipper Small Cap Value Fund Average. . . . . . . . . . . . . . 7.45 23.35 8.89 3.88 10.12 7.97(c)
In the current prospectus dated January 31, 2011, the expense ratio for Class Shares is 1.58%. Class AAA Shares do not have a salescharge. (a) Returns represent past performance and do not guarantee future results. Total returns and average annual returns reflect changes in share
price, reinvestment of distributions, and are net of expenses. Investment returns and the principal value of an investment will fluctuate. Whenshares are redeemed, they may be worth more or less than their original cost. The Adviser reimbursed expenses through September 30, 2005 tolimit the expense ratios. Had such limitations not been in place, returns would have been lower. Current performance may be higher or lower thanthe performance data presented. Performance returns for periods of less than one year are not annualized. Visit www.tetonadv.com for performanceinformation as of the most recent month end. Investors should carefully consider the investment objectives, risks, charges, and expensesof the Fund before investing. The prospectus contains information about this and other matters and should be read carefully beforeinvesting. Other shares classes are available and have different performance characteristics. See page 17 for performance of other classes of shares.The Russell Microcap™ Index and the Russell 2000 Index are unmanaged indicators of stock market performance. The Lipper Small Cap ValueFund Average reflects the average performance of mutual funds classified in this particular category. Investing in small capitalization securitiesinvolves special challenges because these securities may trade less frequently and experience more abrupt price movements than large capitalizationsecurities. Dividends are considered reinvested. You cannot invest directly in an index.
(b) Russell Microcap™ Index since inception performance is as of June 30, 2000; the inception of the Index.(c) Lipper Small Cap Value Fund Average since inception performance is as of April 30, 1998.
Westwood Mighty MitesSM Fund
Morningstar Rating™ is based on risk-adjusted returns. The Overall Morningstar Rating is derived from a weighted average of theperformance figures associated with a fund’s three, five, and ten year (if applicable) Morningstar Rating metrics. For funds with atleast a three year history, a Morningstar Rating is based on a risk-adjusted return measure (including the effects of sales charges, loads,and redemption fees) placing more emphasis on downward variations and rewarding consistent performance. That accounts for vari-ations in a fund’s monthly performance. The top 10% of funds in each category receive 5 stars, the next 22.5% 4 stars, the next 35% 3stars, the next 22.5% 2 stars, and the bottom 10% 1 star. (Each share class is counted as a fraction of one fund within this scale and ratedseparately, which may cause slight variations in the distribution percentages.) Morningstar Rating is for the AAA Share class only;other classes may have different performance characteristics. Ratings reflect relative performance. Results for certain periods were neg-ative. ©2010 Morningstar, Inc. All Rights Reserved. The information contained herein: (1) is proprietary to Morningstar and/or its con-tent providers; (2) may not be copied or distributed; and (3) is not warranted to be accurate, complete or timely. Neither Morningstarnor its content providers are responsible for any damages or losses arising from any use of this information.
Walter K. Walsh
Mario J. Gabelli, CFA
Laura S. Linehan, CFA

3
The United States is now involvedmilitarily in establishing a no-fly zonein Libya, preventing a humanitariandisaster and possibly helping to wrestQaddafi from power. Europe continuesto wrestle with budget and bankingcrises, and faces its own protestsregarding austerity measures. Yet themarkets are still up.
Back home, consumer headwindsinclude rising fuel, food, and clothingcosts. The national average price ofgasoline has risen 22% in the past year,and shows no signs of abating. Oilprices are being driven higher by insta-bility in the Middle East and thenuclear crisis in Japan. Higher oil pricesare not just felt at the pump, but affectprices of all goods that require trans-portation – food and clothing, forexample, and those with petroleum-based cost inputs. The consumer walletis definitely pinched by this dynamic.Finally, the housing market has not yetrecovered, with the S&P/Case-Shiller20-City Composite falling 3.1% yearover year.
It appears, however, the markets arefocused on the good news: Real GDProse at an annual rate of 3.1 percent inthe fourth quarter of 2010, up from thethird quarter’s 2.6 percent growth rate.Notably, personal consumption expen-ditures were up 4.4%. The employmentsituation continued to improve, withnonfarm payroll employment increasingby 216,000 in March, and an unem-ployment rate of 8.8 percent, downfrom its peak of 10.1 percent in Octoberof 2009. Lower unemployment spursconsumer spending, which accountsfor 70% of the U.S. economy, and isvital to growth.
In the quarter, three of four portfoliocompanies that received takeoveroffers rejected them. In January, FisherCommunications (0.8% of net assets asof March 31, 2011) rejected a bid worth$23.99 per share from HuntingdonREIT. In February, Bel Fuse made anunsolicited, and ultimately rejected,bid for Pulse Electronics (0.5%) for$6.00 per share. Then on March 17th,Stern Agee offered $6.25 per share forSWS Group (0.1%), but was alsorebuffed. A deal that is in the workswas announced on February 20th,when CSR Corp. (0.2%) agreed toacquire Zoran Corp. (0.2%) for $13.03in stock. We continue to expect mergerand acquisition activity amongst ourportfolio companies going forward.
We are pleased with the resiliency ofthe markets, given the many head-winds. There may be hiccups goingforward. We continue to do what wedo best, which is bottom-up, funda-mental stock picking. We look forstocks that are mispriced by Mr.Market, trading at a discount to ourassessment of their Private MarketValues, adding a margin of safety toexcellent growth opportunities.
Let’s Talk Investments
The following are stock specifics onselected holdings of our Fund.Favorable earnings prospects do notnecessarily translate into higher stockprices, but they do express a positivetrend that we believe will develop overtime. Individual securities mentionedare not necessarily representative ofthe entire portfolio. For the followingholdings, the percentage of net assetsand their share prices are presented asof March 31, 2011.
Top Contributors
• Ascent Media Corp. (1.7% of net assetsas of March 31, 2011) (ASCMA - $48.85 -Nasdaq) We bought Ascent, a spinofffrom Discovery Holding Company,because it was a “net-net,” tradingbelow cash, but with a valuablecollection of businesses. Managementplanned to use the cash to make a large acquisition in the telecom/mediaarea. The company agreed to sellsubstantially all of its operating busi-nesses for $181 million. Then itannounced a transformative acqui-sition of Monitronics International,Inc., a rapidly growing security moni-toring company, for $1.2 billion.
• Swisher Hygiene Inc. (0.9%) (SWI -$6.12 - TSE), a hygiene solutionscompany. Mighty MitesSM originallyowned Eskimo Pie, which wasacquired by CoolBrands in 2000.CoolBrands became bogged down inlitigation in 2006, and sold most of itsbusinesses. During this process, wewere buying shares at prices below thecash on the balance sheet. CoolBrandssettled its litigation and was ultimatelymerged with Swisher International, acommercial cleaning company.Notably, Swisher is controlled byWayne Huizenga, Chairman, and Steve Berrard, CEO, who were instru-mental in transforming Blockbuster,AutoNation, and Waste Managementinto multi-billion dollar companies.Swisher has already announcedseveral acquisitions in the first quarter,continuing its strategy to transformitself and expand its product offerings.
• Dawson Geophysical Co. (0.6%)(DWSN - $43.88 - Nasdaq), a provider ofonshore seismic data acquisitionservices. The company reported very
Top Ten Holdings (Percent of Net Assets)March 31, 2011
Ascent Media Corp. 1.7%Ferro Corp. 1.4%ADPT Corp. 1.2%Schiff Nutrition International Inc. 1.1%Journal Communications Inc. 1.0%
Epoch Holding Corp. 1.0%Biglari Holdings Inc. 1.0%Universal Technical Institute Inc. 0.9%Materion Corp. 0.9%Cantel Medical Corp. 0.9%

4
strong earnings growth in the fourthquarter of 2010, is debt-free, and has astrengthening order book and agrowing number of requests forproposals. Dawson provides higherresolution sub-surface images to explo-ration and production customers, usedto efficiently find and produce oil andgas. The company is active in theBakken, Niobrara, Marcellus,Haynesville , Barnett, and Eagle Fordshales.
• Ferro Corp. (1.4%) (FOE - $16.59 -NYSE), a specialty materials andchemical company whose end marketsinclude consumer and other elec-tronics, solar cells, construction, auto-motive, appliances, and packaging.Continued growth in sales areexpected in 2011, especially driven byconductive metal pastes for solarpanels, inks for digital tile decoration,and compounded materials. Thecompany has spent the last severalyears cutting its cost structure andstrengthening its balance sheet, whichalong with the improving economy ledto substantially improved results in2010. Management is now focused onprofitable growth, with efficiencies andcost control at the forefront.
Bottom Contributors
• IRIS International Inc. (0.7%) (IRIS -$9.02 - Nasdaq), a molecular diagnosticcompany whose core business ofurinalysis has an installed base of over
3,000 systems, and recurring revenueof consumables and service. IRIS isinvesting heavily in NADiA, a systemto identify post-surgical prostatecancer patients with a low risk of recur-rence to prevent overtreatment, and isawaiting key regulatory clearances. Inthe meantime, the company purchasedArista Molecular, a high complexityCLIA-certified laboratory, for a directcommercial channel for NADiA. Aristais estimated to dilute 2011 EPS by$0.20. Although the company’s invest-ments are taking longer than antici-pated to bear fruit, we believe thatNADiA presents a solid growth oppor-tunity.
• Zep Inc. (0.5%) (ZEP - $17.41 - NYSE),a distributor of cleaning and mainte-nance solutions including hand careproducts, cleaners, degreasers, deodor-izers, disinfectants, and sanitizers. Thecompany reported positive organicgrowth in its automotive and food endmarkets, but other customers continueto be negatively impacted by sustainedhigh rates of unemployment andreduced government spending. Zepwill continue to broaden its businessesto help move away from the unem-ployment correlation. We expect signif-icant consolidation in this highly frag-mented market.
• Sonesta International Hotels Corp.(0.6%) (SNSTA - $19.19 - Nasdaq),which owns and operates the 400 roomRoyal Sonesta Hotel Boston in
Cambridge, MA and operates the 500room Royal Sonesta Hotel in NewOrleans, LA under a long-term lease.The company also has a developmentpartnership with Miami-based FortuneInternational for the site of the formerSonesta Beach Resort Key Biscayneand has received approval for a 165unit residential project for a total of625,000 saleable square feet. Underexisting management agreements,Sonesta also operates hotels in CoconutGrove, FL and Egypt.
• Quidel Corp. (0.3%) (QDEL - $11.96 -Nasdaq), a diagnostic testing company.Quidel sells high-margin influenzatests and had a particularly strong2009, as it was a pandemic year withH1N1. Flu activity was much lighter in2010, and sales and margins took a hit.The company is focused on growingsales of Thyretain, a test for Grave’sDisease, which leads to hyperthy-roidism. Quidel also continues to workon new product development.
Conclusion
Our portfolio management teamcontinues to seek inefficiently pricedcompanies selling at a discount to theirprivate market value (PMV). Our goalis to deliver attractive risk adjustedreturns for our investors over the longrun.
We appreciate your confidence andtrust.
Sincerely,
Mario J. Gabelli, CFA Walter K. Walsh Laura S. Linehan, CFACo-Portfolio Manager Co-Portfolio Manager Co-Portfolio Manager
April 11, 2011

5
́́́ ́Morningstar® rated the GAMCOWestwood SmallCap Equity Fund ClassAAA Shares 2 stars overall and 3 stars forthe three year period, 4 stars for the fiveyear period, and 1 star for the ten yearperiod ended March 31, 2011 among 577,577, 487, and 285 Small Blend funds,respectively.
To Our Shareholders,
The GAMCO Westwood SmallCapEquity Fund’s NAV per Class AAAShare appreciated 11.0% during theMarch quarter versus a gain of 7.9% forthe Russell 2000 Index. Our outperfor-mance is attributable to strong gainsamong company holdings in the indus-trial, technology, and energy sectors.Moreover, performance benefited fromannounced acquisitions of four port-folio companies by corporate acquirers.In previous letters, we have highlightedthis major wave of merger and acqui-sition activity sweeping the small caplandscape as fourteen of our companieswere acquired last year by eitherstrategic or financial buyers.
COMMENTARYDuring the March 2011 quarter, thefollowing portfolio companiesannounced plans to merge: DanversBancorp, Inc. (DNBK), was acquired by People’s United Financial, Inc.(PBCT); Genoptix, Inc. (GXDX),acquired by Novartis AG (NVS); PrideInternational, Inc. (PDE), by Ensco PLC(ESV); and Herley Industries, Inc.(HRLY) by Kratos Defense & SecuritySolutions, Inc. (KTOS).We believe the inherent pricing ineffi-ciencies in the small capitalization assetclass have been amplified due to themassive downsizing of Wall StreetResearch during the financial crisis. Notsurprisingly, given the attractive valua-tions, we are witnessing the early stagesof a major wave of merger and acqui-sition activity by both strategic buyersand private equity investors. Ourbottom up, fundamental researchdriven process attempts to identifycompanies selling at a discount to theirintrinsic value. As such, diversifiedsmall cap portfolios stand to benefitfrom this trend. Some 70% of transac-tions last year, for example, were lessthan $5 billion, so smaller companiesare increasingly acquisition targets.
At Teton Advisors,we believe thisconsolidation act-ivity will continuegiven the $3trillion in cash oncorporate balancesheets. Banks havereturned to lend-ing, supportingdeal financing, and the Federal Reserveshould continue to maintain an easymonetary policy which should bringprivate equity players back to dealmaking. As value investors, we concen-trate on buying companies at discountsto their intrinsic value. We also look attheir fundamentals, market positionand business model. As bottom up,research driven investors, we employmany of the same criteria used bystrategic corporate acquirers andprivate equity firms. The near universalrestructuring and cost cuttingthroughout corporate America in late2008 and 2009 lowered the risk profileof many acquisition targets. Therecession’s severity also afforded largerfirms the opportunity to fill gaps intheir product strategies or to acquirestrategic assets.
Westwood SmallCap Equity Fund
Average Annual Returns Through March 31, 2011 (a) (Unaudited)Since
InceptionQuarter 1 Year 3 Year 5 Year 10 Year (4/15/97)———— ——— ——— ——— ——–— ——–——
SmallCap Equity Fund Class AAA . . . . . . . . . . . . . . . . . 11.03% 32.39% 12.31% 6.71% 5.73% 7.75% Russell 2000 Index. . . . . . . . . . . . . . . . . . . . . . . . . . . . . . . . . 7.94 25.79 8.57 3.35 7.87 8.09In the current prospectus dated January 31, 2011, the gross expense ratio for Class AAA Shares is 1.99%. The net expense ratio is 1.50%,after contractual reimbursements by Teton Advisors, Inc. (the “Adviser”) in place through January 31, 2012. Class AAA Shares do nothave a sales charge. (a) Returns represent past performance and do not guarantee future results. Total returns and average annual returns reflect changes in share
price, reinvestment of distributions, and are net of expenses. Investment returns and the principal value of an investment will fluctuate. Whenshares are redeemed, they may be worth more or less than their original cost. The Adviser reimbursed expenses to limit the expense ratio. Had suchlimitation not been in place, returns would have been lower. Current performance may be lower or higher than the performance data presented.Performance returns for periods of less than one year are not annualized. Visit www.tetonadv.com for performance information as of the mostrecent month end. Investors should carefully consider the investment objectives, risks, charges, and expenses of the Fund beforeinvesting. The prospectus contains information about this and other matters and should be read carefully before investing. Othershares classes are available and have different performance characteristics. See page 17 for performance of other classes of shares. The Russell 2000Index is an unmanaged indicator of stock market performance. Investing in small capitalization securities involves special challenges because thesesecurities may trade less frequently and experience more abrupt price movements than large capitalization securities. Dividends are consideredreinvested. You cannot invest directly in an index.
Nicholas F. Galluccio
Morningstar Rating™ is based on risk-adjusted returns. The Overall Morningstar Rating is derived from a weighted average of theperformance figures associated with a fund’s three, five, and ten year (if applicable) Morningstar Rating metrics. For funds with atleast a three year history, a Morningstar Rating is based on a risk-adjusted return measure (including the effects of sales charges, loads,and redemption fees) placing more emphasis on downward variations and rewarding consistent performance. That accounts for vari-ations in a fund’s monthly performance. The top 10% of funds in each category receive 5 stars, the next 22.5% 4 stars, the next 35% 3stars, the next 22.5% 2 stars, and the bottom 10% 1 star. (Each share class is counted as a fraction of one fund within this scale and ratedseparately, which may cause slight variations in the distribution percentages.) Morningstar Rating is for the AAA Share class only;other classes may have different performance characteristics. Ratings reflect relative performance. Results for certain periods were neg-ative. ©2010 Morningstar, Inc. All Rights Reserved. The information contained herein: (1) is proprietary to Morningstar and/or its con-tent providers; (2) may not be copied or distributed; and (3) is not warranted to be accurate, complete or timely. Neither Morningstarnor its content providers are responsible for any damages or losses arising from any use of this information.

6
From a macro perspective, we believeU.S. economic growth is about to enter aself-sustaining phase as evidenced byimproving corporate earnings andemployment. An abrupt shift inmonetary policy to tighten credit wouldundoubtedly negatively impact equitymarkets and the equities of smaller capi-talization companies. However, giventhe fragile housing and lagging labormarkets, it is more likely that, even witha phasing out of the Federal Reserve’squantitative easing program QE2 thisJune, the Fed will maintain a ratheraccommodative monetary policy whichis typically benign for small capital-ization equities. Federal Reserve policymakers in March differed over whetherto begin removing some stimulus aftercompletion of their $600 billion bond-purchase program. We do not expect anabrupt change in policy. According to theMarch minutes of the Federal OpenMarket Committee (FOMC) “almost all”Fed officials saw no need to “taper”Treasury buying after June, discardingtheir prior language of reducing the paceof purchases. We believe the Fed issingularly focused on using monetarypolicy to elevate inflation and inflationexpectations. As such, we have added toholdings in the metal, mining andenergy sectors which stand to benefitfrom pricing power. Despite theimprovement in non-farm payrollemployment in March to 216K jobsversus, expectations of a 190K gain,(along with a decline in unemploymentto 8.8% from 8.9%), the Fed will bereluctant to tighten until we enter aperiod of self sustaining economicgrowth.
Let’s Talk Investments
The following are stock specifics onselected holdings of our Fund.Favorable earnings prospects do notnecessarily translate into higher stockprices, but they do express a positivetrend that we believe will develop overtime. Individual securities mentionedare not necessarily representative of theentire portfolio. For the followingholdings, the percentage of net assets
and their share prices are presented asof March 31, 2011.Among the best performing stocks thisquarter were: Brigham Exploration Co(1.2% of net assets as of March 31, 2011),LeCroy Corporation (1.1%), and TrinityIndustries, Inc. (1.3%).
Brigham Exploration Co (BEXP - $37.18 -Nasdaq) explores and develops domesticonshore oil and gas formations utilizingtechnologically advanced techniques. Inaddition to rising energy prices in thequarter, BEXP reported strong results,driven by accelerated production of oilfrom the Bakken region of Montana andNorth Dakota. Furthermore, thecompany outlined an increased plan fordrilling activity in 2011.LeCroy Corporation (LCRY - $13.37 -Nasdaq) a niche builder of high-endoscilloscopes and protocol analyzersused by design engineers for industrial,optical network, and consumer elec-tronic end markets. The companyentered the year with an unseasonablystrong order book across all geogra-phies and end markets, an improvingbalance sheet, and receding liquidityconcerns. Given the significant consoli-dation of the space in past years, LCRYcontinues to benefit from both anincreasingly rational competitive setand scarcity value as a technology asset.Trinity Industries, Inc. (TRN - $36.67 -NYSE) is a leading manufacturer ofrailcars and inland barges, both cyclicalindustries. As the domestic economyexits the recession and rail trafficimproves, operators have begun toincrease capital expenditures and placesignificantly improved orders withTRN. Trinity is in the early stages of amultiyear upcycle.Among the worst performing stocks inthe quarter were: Akamai Technologies,Inc. (0.2%), Hudson Valley Holding Corp.(0.6%), and The Jones Group, Inc. (0.9%).Akamai Technologies, Inc. (AKAM -$38.00 - Nasdaq) the developer ofsoftware systems which acceleratedelivery of internet content, declined asa result of diminished expectations thatthe company would be acquired.
Furthermore, a well-known customeropportunistically shifted business tocapture discounted pricing by acompetitor, reigniting a long-runningdebate as to whether AKAM’spremium pricing strategy could be atrisk. Given the company’s dominantmarket share over a long period,breadth in product offering andrational behavior in the past, webelieve this threat is overstated.Hudson Valley Holding Corp. (HUVL -$22.00 - Nasdaq) provides communitybanking services in WestchesterCounty, New York and Connecticut.Hudson Valley’s underperformance inthe quarter was attributable to concernsover its exposure to construction loans.We believe improving credit conditionsshould alleviate the necessity foroutsized loan loss provisions; thisshould result in improved profitability.The Jones Group, Inc. (JNY - $13.75 -NYSE) designs and markets brandedapparel, dresses, footwear, jeans,sportswear, jewelry, and handbagsthrough department stores andbranded specialty retail and outletstores. Excess inventory and risingcotton prices depressed margins in thequarter, causing the stock to decline.We believe the company’s long termprospects are attractive.
Conclusion
Our research team is working dili-gently to deliver attractive risk adjustedreturns for our fund investors. Webelieve the portfolio is well positionedto participate in this next marketrecovery cycle.We appreciate your confidence andtrust.
Sincerely,
Nicholas F. GalluccioPortfolio ManagerPresident and CEOTeton Advisors, Inc.April 11, 2011
Top Ten Holdings (Percent of Net Assets)March 31, 2011
Patterson Cos. Inc. 1.6%Electro Scientific Industries Inc. 1.4%Mine Safety Appliances Co. 1.3%FTI Consulting Inc. 1.3%Trinity Industries Inc. 1.3%
Qlogic Corp. 1.3%Brigham Exploration Co. 1.2%First Niagara Financial Group Inc. 1.1%Lecroy Corp. 1.1%Vishay Intertechnology Corp. 1.0%

7
́́ ́ ́ ́́ ́ ́Morningstar® rated the GAMCOWestwood Income Fund Class AAA Shares4 stars overall and 4 stars for the three andfive year periods and 5 stars for the ten yearperiod ended March 31, 2011 among 1,120,1,120, 945, and 522 Large Value funds,respectively.
To Our Shareholders,The stock market closed on a solid gainin the first quarter, overcoming severenatural, geopolitical, and financialshocks. In January, popular protestssprang up in the Middle East andNorth Africa, surprising everyone asthey developed into full rebellionsagainst long-term incumbent govern-ments and spread widely. In midMarch, the worst earthquake to ever hitJapan combined with the tsunami andsevere damage to a nuclear plant, sentinvestors fleeing. The stock marketgave back all its gains by the middle ofMarch but rose strongly in the last two
weeks of the quarter, taking only thepositive economic news into account.
The nation’s biggest companies increasedtheir dividends by a record amount in thefirst quarter. According to a report fromStandard and Poor’s, 117 companies inthe S&P 500 Index said they wouldraise or start paying dividends, for atotal additional payout amounting to arecord $16.6 billion. This compareswith 78 companies raising their divi-dends in the first quarter a year ago.
We expect the increases in dividends tocontinue for some time. Dividendpolicy lags corporate earnings by a yearto eighteen months, as managementsreassess their experience to determinewhat they can sustain. As evidence ofthis, corporate earnings peaked in 2007and tumbled down in 2008, butdividend cuts were the largest in thefollowing year. Now, with two years ofstrong earnings increases, corporateearnings are approaching record levelsand the payout ratio of earnings in theform of dividends remains low, approx-
imately 34% versusa long term aver-age of 50%. Inaddition, the cashin companies’ cof-fers is at an alltime high.
PerformanceThe GAMCO Westwood Income Fund’s(the “Fund”) net asset value (“NAV”)per Class AAA Shares gained 5.6% inthe first quarter compared with gains of5.9% for the S&P 500 and 5.9% for theLipper Equity Income Fund Average.The S&P 500 is divided into ten sectorsand all had positive gains in the quarter.The strongest was, of course, energy,with the stocks in this sector rising anaverage of 17% as the price of oil rosefrom $90 a barrel to $108, pricing in thepotential for disruption from the MiddleEast. Industrial stocks posted the nexthighest return, with an average of 9%;both of these sectors have had stronggains for the past twelve months, withenergy reflecting oil’s price increase andindustrials benefiting from oil’s price
Westwood Income Fund
Average Annual Returns Through March 31, 2011 (a)(c) (Unaudited) SinceInception
Quarter 1 Year 3 Year 5 Year 10 Year (9/30/97)———— ——— ——— ——— ——–— ——–——Income Fund Class AAA. . . . . . . . . . . . . . . . . . . . . . . . . . 5.64% 14.32% 1.60% 1.23% 8.99% 7.15% S&P 500 Index. . . . . . . . . . . . . . . . . . . . . . . . . . . . . . . . . . . . 5.92 15.65 2.35 2.62 3.29 4.34Lipper Equity Income Fund Average . . . . . . . . . . . . . . . . 5.85 14.93 1.84 2.34 4.10 4.46Blended Index (b). . . . . . . . . . . . . . . . . . . . . . . . . . . . . . . . . 5.22 2.88 1.28 (1.98) (0.09) 0.11 10 Year Treasury Note Index . . . . . . . . . . . . . . . . . . . . . . . 4.51 (9.89) 0.21 (6.57) (3.46) (4.13)In the current prospectus dated January 31, 2011, the gross expense ratio for Class AAA is 3.19%. The net expense ratio is 2.00%, aftercontractual reimbursements by Teton Advisors, Inc. (the “Adviser”) in place through January 31, 2012. Class AAA Shares do not have asales charge. (a) Returns represent past performance and do not guarantee future results. Total returns and average annual returns reflect changes in share
price, reinvestment of dividends, and are net of expenses. Investment returns and the principal value of an investment will fluctuate. When sharesare redeemed, they may be worth more or less than their original cost. The Adviser reimbursed expenses to limit the expense ratio. Had suchlimitation not been in place, returns would have been lower. Current performance may be lower or higher than the performance data presented.Performance returns for periods of less than one year are not annualized. Visit www.tetonadv.com for performance information as of the mostrecent month end. Investors should carefully consider the investment objectives, risks, charges, and expenses of the Fund beforeinvesting. The prospectus contains information about this and other matters and should be read carefully before investing. Othershares classes are available and have different performance characteristics. See page 17 for performance of other classes of shares. The Standard &Poor’s (“S&P”) 500 Index is an unmanaged indicator of stock market performance. The Lipper Equity Income Fund Average includes the 30largest equity funds tracked by Lipper, Inc. The 10 Year Treasury Note Index is an unmanaged index tracking U.S. Treasury Notes with a 10 yearmaturity. Dividends are considered reinvested. You cannot invest directly in an index.
(b) The Blended Index consists of a 50% blend of each of the 10 Year Treasury Note Index and the S&P 500 Index.(c) As per the January 31, 2011 prospectus, the fund’s benchmarks are the S&P 500 Index and the Lipper Equity Income Fund Average.
Morningstar Rating™ is based on risk-adjusted returns. The Overall Morningstar Rating is derived from a weighted average of theperformance figures associated with a fund’s three, five, and ten year (if applicable) Morningstar Rating metrics. For funds with atleast a three year history, a Morningstar Rating is based on a risk-adjusted return measure (including the effects of sales charges, loads,and redemption fees) placing more emphasis on downward variations and rewarding consistent performance. That accounts for vari-ations in a fund’s monthly performance. The top 10% of funds in each category receive 5 stars, the next 22.5% 4 stars, the next 35% 3stars, the next 22.5% 2 stars, and the bottom 10% 1 star. (Each share class is counted as a fraction of one fund within this scale and ratedseparately, which may cause slight variations in the distribution percentages.) Morningstar Rating is for the AAA Share class only;other classes may have different performance characteristics. Ratings reflect relative performance. Results for certain periods were neg-ative. ©2010 Morningstar, Inc. All Rights Reserved. The information contained herein: (1) is proprietary to Morningstar and/or its con-tent providers; (2) may not be copied or distributed; and (3) is not warranted to be accurate, complete or timely. Neither Morningstarnor its content providers are responsible for any damages or losses arising from any use of this information.
Barbara G. Marcin, CFA

8
gain of 17% in the first quarter accom-panied by more encouraging economicreports and continued manufacturingand export strength. The surprise mightbe from the health care sector, whichwas dormant in 2010 and rose 6% in thefirst quarter. The three sectors with theleast return, all returning about 3%,were the financial, utility, and consumerstaple stocks, apparently not as inter-esting to investors who were looking forstocks with more upside in animproving economy.
Not surprisingly, our stocks in the Fundwith the best performance in the quarter,rising more than 15%, included ourenergy holdings such as Chevron (3.0%of net assets as of March 31, 2011),ConocoPhillips (3.7%), and DevonEnergy (1.7%). Other large holdings withsimilar gains included Pfizer (2.6%),Tupperware (2.2%), and EMC (0.5%).
The Tumultuous Quarter
The first quarter offered a rollercoasterof returns, with the Dow JonesIndustrial Average rising almost 7% bymid-month on an improving economy,giving back all of those returns by mid-March, and then shrugging off theseextraordinary events and concerns toclose up 6.4%. In January, a revolution inTunisia quickly forced out its presidentof 23 years, and then violent demonstra-tions spread to Egypt, Yemen, Bahrain,Jordan, Syria, Libya, and even SaudiArabia over economic grievances,political governance, and corruption.
Governments worldwide struggled toquickly reassess their own self interests,goals, and allies in the region, whilefinancial markets struggled to price inpotential changes in the price of oil andgovernment policies. The United Statesled a coalition of forces to invade Libyain March, in response to ColonelGaddafi’s pronouncements that hewould crush the rebels. However,within two weeks, at quarter end, itbecame clear that this coalition hadunderestimated the amount of muni-tions and help that the rebellion wouldneed to sustain itself, and ColonelGaddafi promised a very long war tokeep his position.
The disaster in Japan thwarted hopesfor its economic recovery this year.Global industries whose manufac-turing would be disrupted due to
sourcing a substantial part of theirproduct in Japan included componentsfor computers and electronic devicesfor cars. Unaccountably, the yen surgedin chaotic trading to an all time high of76.32 yen to the U.S. dollar, promptingthe first concerted effort by the G-7countries to intervene in the currencymarkets since 2000.
In the United States showdownserupted as governors in Wisconsin andOhio, acting upon their newly electedmandates, attempted to pass reformbudgets that would end collectivebargaining and allow workers to optout of paying union dues. Polls showedthat even though Americans expectedcuts to be made and accepted in publicworkers’ pensions and benefits to helpclose state and local budget deficits, themajority supported the right tocollective bargaining, indicating a deepappreciation for these workers’ contri-butions to public service as policeofficers, teachers, and firefighters.
In Europe, the political and financialdrama that has plagued the EuropeanUnion erupted again, causing doubtsover its future as a unified entity. Thegovernment of Portugal resigned whenthe mostly opposition legislaturerefused to pass its austerity budget,leaving it leaderless and in a difficultposition to refinance its debt frominvestors. Not only does this throw upanother country in need of a bailoutfrom the Union, and rekindle questionsabout the size and power of theregion’s bailout funds, but it throwsinto question the ability of the Union toresolve anything, as their strategy hasrevolved around states slashing deficitsand willingly implementing austeritybudgets in return for rescue loans.
This year is setting up to be a blockbusterfor deals and mergers, starting off withthe huge announced acquisitions ofGenzyme by Sanofi Aventis, Bulgari byLVMH, and T-Mobile USA by AT&T inthe first quarter. According to data fromThomson Reuters, worldwide mergersand acquisitions have doubled involume in the United States and Europeand have risen 58% worldwide, makingthis the best start to a year since 2007.The fundamentals of an improvingeconomy, record corporate earnings, andrecord cash on corporate balance sheetsappear to support a continued strongyear for deals.
Let’s Talk Investments
The following are stock specifics onselected holdings of our Fund.Favorable earnings prospects do notnecessarily translate into higher stockprices, but they do express a positivetrend that we believe will develop overtime. Individual securities mentionedare not necessarily representative of theentire portfolio. For the followingholdings, the percentage of net assetsand their share prices are presented asof March 31, 2011.
Air Products and Chemicals Inc. (1.7% ofnet assets as of March 31, 2011 ) (APD -$90.18 - NYSE), an industrial gas supplybusiness, has numerous strengths,including a significant market share, anextensive global production and distri-bution network, and a diverse customerbase. The company has a highproportion of long-term contracts thatcontribute to stable demand andpricing. Secular trends in the industrialgas business include rising energydemand, with growing demand forhydrogen for oil refining and oxygen forcoal gasification; increasing environ-mental regulation, providing opportu-nities that should benefit gas; andgrowth in emerging economies.
International Paper (2.8%) (IP- $30.18 -NYSE) has undergone a dramatic trans-formation over the past few years asmanagement has done as promised,executing on its plan to improve returnon capital and margins, exit non-corebusinesses to deliver a higher return oncapital, pay down debt and return cashto shareholders. The company hasreduced capacity and lowered fixedcosts to improve margins. In the firstquarter, the company announced that itwould acquire the majority of theleading paper manufacturer in India,which is the fastest growing papermarket in the world. InternationalPaper has paid dividends without inter-ruption since 1946, but cut its dividendin March of 2009 to instead reduce debt.The company increased its dividendthree times in the past twelve months,to $1.05 now, above its pre-recessionlevel, indicating its commitment toreturn cash to shareholders.
E.I. du Pont de Nemours & Company(4.1%) (DD - $54.97 - NYSE) continuesto benefit from the improved globaleconomy as well as the restructuring of

9
its businesses to concentrate uponthose with a higher return on capital.The company is experiencing broadbased gains in volumes across itsproducts and geographies, and its agri-cultural products are continuing to gainmarket share. The company has a highdividend yield which we believe is wellsupported by its cash flow and growthoutlook as well as evidence ofmanagement’s commitment to returnearnings to shareholders.
Honeywell International (2.2%) (HON -$59.71 - NYSE) is a leading producer ofavionics, power, and electronic systemsfor the aerospace market, processautomation, and security products forthe industrial, residential, andcommercial building markets. Thecompany also makes turbochargers forthe automotive industry and providestechnologies to the energy market.HON has excellent products, a strongbalance sheet, and generates sub-stantial free cash flow that could beused for internal growth, acquisitions,and stock repurchases. In addition, thecompany is executing on its long-termstrategy to expand in less costly regionsof the world while reducing costs inmore costly countries by closing plants,consolidating facilities, and imple-menting six sigma and lean manufac-turing. These dynamics should positionHON for bigger profitability gains inthe future.
Looking Ahead
As the first quarter ends, consensus isgenerally optimistic for growth in theU.S. economy, with the average of econ-omists projecting 3.7% growth in thegross domestic product for the secondquarter. Manufacturing continues to bestrongly driven by exports. However,the so far mediocre growth has not beenenough as of yet to create enough jobsto absorb workers and lower unem-ployment, particularly as housing andconstruction remain weak.
Still looming as a potential threat togrowth, oil prices continued to soar inthe first quarter, as supportive U.S. jobsdata reinforced economic growthexpectations and Libya’s conflict andMiddle East unrest kept supply threatsin focus. Oil has climbed from $90 at thebeginning of the year to $108 by quarterend, reflecting both a stronger globaleconomy, if not here in the UnitedStates, and the threat of disruption fromthe turmoil in most Middle Easternproducing countries. The rise in oilprice is supported by continuedviolence in Libya as Colonel Gaddafi isnow vowing a long war to keep hisposition. The invasion, initially led bythe United States, France, and Britainand then assumed by NATO, appears tohave misjudged the amount of muni-tions and troops help the rebels wouldneed to sustain their effort.
The administration, which justannounced the creation of the 2012 re-election organization, remains, alongwith the Federal Reserve, determinedto hold rates down and providestimulus as long as the economy is lessthan robust. So we expect this policybehavior to continue, and when thesecond quantitative easing programends as scheduled in June, we expectthe Federal Reserve to remain on hold,and possibly even discuss being readywith more easing policy.
Nevertheless, there is a growingdiscomfort that we are again holdingrates too low too long, and fostering thenext problem of some imbalance that isnot evident now. The chairman of theFederal Reserve, Ben Bernanke, believesthat he does not have to consider thesignificant inflation of raw materials,commodities, and input prices to be aproblem until he sees widespreadinflation in finished goods. This isunlikely to happen in a global economywhere labor is cheap, the consumer isweak, and there is broad transparentpricing and movement of goods.
As the quarter ends, we are once againslipping down the path towardgovernment shut down as Americanpoliticians fight over what to pay forand what to cut from the budget, aproblem exacerbated by one quarter ofthe year already being over.
Stock markets worldwide haveresponded to the accommodation of theFederal Reserve, accompanied, untilthis year, by easing in other countries.The Federal Reserve, holding the riskfree rate down at zero, has pushedinvestors out on the risk curve,evidenced by the strong stock markets,bullish sentiments, record low “junk”or high yield spreads, and tremendousbuyout deal activity. It has become amantra on television and in thefinancial press that dividend payingstocks are a better buy than bonds, andthat stocks are also the right choice toprotect against the rising bond yieldsand inflation that will follow.
We are finding good value in manycompanies that have some combinationof long term growth prospects,exposure to faster growing globalmarkets, good balance sheets to seedgrowth and or make acquisitions, andstrong cash generation. These includeKraft Foods (3.5% of net assets as ofMarch 31, 2011), General Mills (4.4%),Honeywell (2.2%), International Paper(2.8%), Air Products and Chemicals(1.7%), Tupperware (2.2%), AmericanWater Works (3.4%), Mead JohnsonNutrition (2.7%), and DuPont (4.1%).
Sincerely,
Barbara G. Marcin, CFAPortfolio Manager
May 9, 2011
Top Ten Holdings (Percent of Net Assets)March 31, 2011
Bank One Capital Trust VI, 7.200% Pfd. 5.7%American Express Credit Corp., MTN, 0.417%, 06/16/11 4.6%Halliburton Co. 4.6%General Mills Inc. 4.4%E.I. du Pont de Nemours & Co. 4.1%
ConocoPhillips 3.7%Wells Fargo & Co. 3.5%Kraft Foods Inc. 3.5%American Water Works Co. Inc. 3.4%Apple Inc. 3.2%

10
́́́ ́ ´́Morningstar® rated the GAMCO WestwoodEquity Fund Class AAA Shares 3 starsoverall and 2 stars for the three year periodand 3 stars for the five year period and 4stars for the ten year period ended March 31,2011 among 1,757, 1,757, 1,471, and 816Large Blend funds, respectively.
To Our Shareholders,
For the quarter ended March 31, 2011,the net asset value (“NAV”) of theGAMCO Westwood Equity Fund ClassAAA Shares posted a return of 6.0%versus 1.1% for the Lipper Large CapValue Fund Average and 5.9% for theS&P 500 Index.
Market Commentary
Events in the Middle East and Japanwere a key factor in the market’s firstquarter gain but also of importance
were concerns about the potential peakin selected leading economic indicatorsand continued concerns over housing,inflation and the fiscal health of statesand municipalities. January started theyear well with strong earnings andeconomic reports. By month endhowever, protests in Egypt helped pushmarkets lower. Violence in Libya andcrude oil’s surge kept the pressure on inearly February but sentiment wasstrong and corporate earnings reportsand improving employment conditionsfueled the optimism. With events andconcerns weighing on investors, Marchreturns, while still positive, laggedthose of January and February asprotests and natural disasters took theirtoll on investor psyche. The bestperforming sectors were those tied tohigher commodity prices such asEnergy as well as economic optimismsuch as Producer Durables. Sectors thatlagged were the Consumer Staples asinvestors worried about rising foodcosts and Financial Services.
Performance Drivers:
The largest contributor to performancewas stock selection in FinancialServices, Consumer Discretionary andProducer Durables. The largestdetractors to relative performance werestock selection in Energy andTechnology.
Within Financial Services, companiessuch as Franklin Resources (2.1% of netassets as of March 31, 2011), whichbenefit from strong markets overall,posted some of the strongest absoluteperformance in the sector. Holdings inthe insurance segment, with stable cash generation characteristics, alsoperformed well. Performance was
Westwood Equity Fund
Average Annual Returns Through March 31, 2011 (a) (Unaudited)Since
InceptionQuarter 1 Year 3 Year 5 Year 10 Year 15 Year 20 Year (1/2/87)———— ——— ——— ——— ——–— ——–— ——–— ——–——
Equity Fund Class AAA . . . . . . . . . . . . . . . . . . 6.02% 11.89% (1.17)% 2.27% 3.69% 7.62% 9.61% 9.97% S&P 500 Index . . . . . . . . . . . . . . . . . . . . . . . . . . . 5.92 15.65 2.35 2.62 3.29 6.80 8.72 9.75(b)Lipper Large Cap Value Fund Average . . . . . . 1.06 6.68 6.10 5.77 5.34 5.85 6.44 9.08(b)In the current prospectus dated January 31, 2011, the expense ratio for Class Shares is 1.54%. Class AAA Shares do not have a salescharge.(a) Returns represent past performance and do not guarantee future results. Total returns and average annual returns reflect changes in share
price, reinvestment of distributions, and are net of expenses. Investment returns and the principal value of an investment will fluctuate. Whenshares are redeemed, they may be worth more or less than their original cost. Current performance may be lower or higher than the performancedata presented. Performance returns for periods of less than one year are not annualized. Visit www.tetonadv.com for performance information asof the most recent month end. Investors should carefully consider the investment objectives, risks, charges, and expenses of the Fundbefore investing. The prospectus contains information about this and other matters and should be read carefully before investing.Other shares classes are available and have different performance characteristics. See page 17 for performance of other classes of shares. The S&P500 Index is an unmanaged indicator of stock market performance, while the Lipper Large Cap Value Fund Average reflects the averageperformance of mutual funds classified in this particular category. Dividends are considered reinvested. You cannot invest directly in an index.
(b) S&P 500 Index and the Lipper Large Cap Value Fund Average since inception performance are as of December 31, 1986.
Morningstar Rating™ is based on risk-adjusted returns. The Overall Morningstar Rating is derived from a weighted average of theperformance figures associated with a fund’s three, five, and ten year (if applicable) Morningstar Rating metrics. For funds with atleast a three year history, a Morningstar Rating is based on a risk-adjusted return measure (including the effects of sales charges, loads,and redemption fees) placing more emphasis on downward variations and rewarding consistent performance. That accounts for vari-ations in a fund’s monthly performance. The top 10% of funds in each category receive 5 stars, the next 22.5% 4 stars, the next 35% 3stars, the next 22.5% 2 stars, and the bottom 10% 1 star. (Each share class is counted as a fraction of one fund within this scale and ratedseparately, which may cause slight variations in the distribution percentages.) Morningstar Rating is for the AAA Share class only;other classes may have different performance characteristics. Ratings reflect relative performance. Results for certain periods were neg-ative. ©2010 Morningstar, Inc. All Rights Reserved. The information contained herein: (1) is proprietary to Morningstar and/or its con-tent providers; (2) may not be copied or distributed; and (3) is not warranted to be accurate, complete or timely. Neither Morningstarnor its content providers are responsible for any damages or losses arising from any use of this information.
Susan M. Byrne

11
offset by weakness in AFLAC (2.0%),which pulled back as investors tried todigest the impact that the disasters inJapan might have on financialperformance of the company.
In Consumer Discretionary, WaltDisney (2.1%), along with CBS Corp.(1.1%), had a good quarter as strong adrates and demand figures werereleased along with Comcast (2.0%),which reported a positive earningssurprise based on good subscribergrowth in broadband services.Offsetting some of this strength wasweakness in Wal-Mart (1.9%) andGeneral Motors (1.9%) as each fell onthe potential for rising gas prices nega-tively impacting sales.
Producer Durables benefited from topcontributor ITT Corp. (2.0%), whichrose after announcing that they intendto split the company into three publicentities – Water, Defense, andInformation Solutions and IndustrialProducts. By splitting the company,previously hidden value can beuncovered as each unit will likelyreceive multiples appropriate for itssegment rather than as a conglomerateof varied, non-related companies.
Within Energy, overall performancefailed to keep pace with the strength ofthe index sector despite strong priceindividual performance from selectedholdings such as Exxon Mobil (2.0%)and Chevron (2.1%). Natural gas, usedin many electric utility generators, hadits price move higher as the coldweather spread across the countrycausing increased demand for elec-tricity while crude oil prices remainedelevated allowing companies holdingoil and gas assets to perform well.Together, higher energy prices posi-tively impacted the share prices ofmany companies in the sector. NationalOilwell however, detracted fromperformance as the shares were soldbefore the security’s price rise later inthe period.
Our underweight in Technology, a lowperforming sector on an absolute basis,was also a benefit to relativeperformance however, stock selectionfailed to keep pace with thebenchmark. Strong performance wasdelivered by holdings such as EMC,which delivered results that were high-lighted by record core and VMwarerevenues, IBM (2.0%), which reportedearnings that showed it is seeing a
broad based recovery that is beinghelped by new product cycles, andMotorola Mobility, which rose onoptimism surrounding its potential as anewly formed company. This strongperformance however, was offset byweakness in Cisco Systems andMicrosoft Corp (2.0%). Cisco Systemsrecently posted disappointing earningsbased on margin contraction due toswitch and router product transitionsand ongoing consumer weakness whileMicrosoft results disappointed on salesof its Windows product. Lastly,performance of new holding TEConnectivity Ltd. (2.0%) detracted asnear term uncertainty surrounding theimpact to supply and demand funda-mentals from the situation in Japanimpacted performance.
Sincerely,
Susan M. ByrnePortfolio Manager
April 11, 2011
Top Ten Holdings (Percent of Net Assets)March 31, 2011
Metlife Inc. 3.0%Pfizer Inc. 3.0%JPMorgan Chase & Co. 3.0%AT&T Inc. 3.0%Wells Fargo & Co. 3.0%
Johnson & Johnson 3.0%Anadarko Petroleum Corp. 2.2%Abbott Laboratories 2.2%The Walt Disney Co. 2.1%Dominion Resources Inc. 2.1%

12
́́ ́ ́́ ́Morningstar® rated the GAMCO WestwoodBalanced Fund Class AAA Shares 3 starsoverall and 2 stars for the three year periodand 3 stars for the five and ten year periodsended March 31, 2011 among 932, 932, 734,and 408 Moderate Allocation funds, respec-tively.
To Our Shareholders,
In the first quarter, the fund return of4.0% , net of fees and expenses,
exceeded the 2.5% return of thebenchmark: 60% S&P 500 StockIndex/40% Barclays CapitalGovernment/Credit Bond Index. Thefund is designed to provide exposure toequities while reducing overall risk viathe inclusion of short-to-intermediatefixed income securities. The EquityFund strategy comments apply to theequity portion of the Balanced Fund.The bond portion typically invests inhigh quality notes with lower interestrate sensitivity than the typical bondindex, with the objective of dampeningthe volatility of equity holdings.
Top and Bottom Fixed IncomeContributors
Recall that the contribution of a security(or a sector) is the product of itspercentage of the portfolio times itsreturn. We discussed in the com-
Westwood Balanced Fund
Average Annual Returns Through March 31, 2011 (a)(d) (Unaudited)Since
InceptionQuarter 1 Year 3 Year 5 Year 10 Year 15 Year (10/1/91)———— ——— ——— ——— ——–— ——–— ——–——
Balanced Fund Class AAA. . . . . . . . . . . . . . . . . . . . . . . . . . . . 4.02% 9.09% 1.37% 3.69% 4.45% 7.13% 8.75% Barclays Capital Government/Credit Bond Index . . . . . . . 0.28 5.26 4.82 5.83 5.53 6.15 6.58(c)S&P 500 Index . . . . . . . . . . . . . . . . . . . . . . . . . . . . . . . . . . . . . . . 5.92 15.65 2.35 2.62 3.29 6.80 8.67(c)60% S&P 500 Index and 40% Barclays Capital Government/Credit Bond Index (b) . . . . . . . . . . . . . . . . . . 2.54 9.42 3.83 4.55 4.63 6.41 7.42
Lipper Mixed Asset Target Allocation Moderate Fund Average . . . . . . . . . . . . . . . . . . . . . . . . . . . . . . . . . . . . . 3.72 11.70 3.30 3.78 4.58 6.35 7.42(c)
Barclays Capital Government/Corporate Bond Index . . . . 0.22 5.27 4.81 5.79 5.47 0.00(e) 5.64(e)60% S&P 500 Index and 40% Barclays Capital Government/Corporate Bond Index (f) . . . . . . . . . . . . . . . 3.64 11.50 3.33 3.89 4.16 4.08 7.46
In the current prospectus dated January 31, 2011, the expense ratio for Class AAA Shares is 1.24%. Class AAA Shares do not have a salescharge.(a) Returns represent past performance and do not guarantee future results. Total returns and average annual returns reflect changes in share
price and reinvestment of distributions and are net of expenses. Investment returns and the principal value of an investment will fluctuate. Whenshares are redeemed, they may be worth more or less than their original cost. The Adviser reimbursed expenses in years prior to 1998 to limit theexpense ratio. Had such limitation not been in place, returns would have been lower. Current performance may be lower or higher than theperformance data presented. Performance returns for periods of less than one year are not annualized. Visit www.tetonadv.com for performanceinformation as of the most recent month end. Investors should carefully consider the investment objectives, risks, charges, and expensesof the Fund before investing. The prospectus contains information about this and other matters and should be read carefully beforeinvesting. Other shares classes are available and have different performance characteristics. See page 17 for performance of other classes of shares.The S&P 500 Index is an unmanaged indicator of stock market performance. The Barclays Capital Government/Credit Bond Index and BarclaysCapital Government/Corporate Bond Index are market value weighted indices that track the performance of fixed rate, publicly placed, dollardenominated obligations. The Lipper Mixed Asset Target Allocation Moderate Fund Average reflects the average performance of mutual fundsclassified in this particular category. Dividends are considered reinvested. You cannot invest directly in an index.
(b) The Blended Index consists of a 60% blend of each of the S&P 500 Index and 40% Barclays Capital Government/Credit Bond Index.(c) S&P 500 Index, Barclays Capital Government/Credit Bond Index and the Lipper Mixed Asset Target Allocation Moderate Fund Average since
inception performance are as of September 30, 1991. (d) As per the January 31, 2011 prospectus, the fund’s benchmarks are the 60% S&P 500 and the 40% Barclays Capital Government/Credit Bond
Blended Index.(e) The Barclays Capital Government/Corporate Bond Index since inception performance is as of December 31, 1998.(f) The Blended Index consists of a 60% blend of each of the S&P 500 Index and 40% Barclays Capital Government/Corporate Bond Index.
Morningstar Rating™ is based on risk-adjusted returns. The Overall Morningstar Rating is derived from a weighted average of theperformance figures associated with a fund’s three, five, and ten year (if applicable) Morningstar Rating metrics. For funds with atleast a three year history, a Morningstar Rating is based on a risk-adjusted return measure (including the effects of sales charges, loads,and redemption fees) placing more emphasis on downward variations and rewarding consistent performance. That accounts for vari-ations in a fund’s monthly performance. The top 10% of funds in each category receive 5 stars, the next 22.5% 4 stars, the next 35% 3stars, the next 22.5% 2 stars, and the bottom 10% 1 star. (Each share class is counted as a fraction of one fund within this scale and ratedseparately, which may cause slight variations in the distribution percentages.) Morningstar Rating is for the AAA Share class only;other classes may have different performance characteristics. Ratings reflect relative performance. Results for certain periods were neg-ative. ©2010 Morningstar, Inc. All Rights Reserved. The information contained herein: (1) is proprietary to Morningstar and/or its con-tent providers; (2) may not be copied or distributed; and (3) is not warranted to be accurate, complete or timely. Neither Morningstarnor its content providers are responsible for any damages or losses arising from any use of this information.
Susan M. Byrne Mark R. Freeman, CFA

13
Top Ten Issuers (a) (Percent of Net Assets)March 31, 2011
Fannie Mae Notes 5.6%Freddie Mac Notes 5.1%JPMorgan Chase & Co 2.5%Bank of America Corp. 2.4%AT&T Inc. 2.3%
Apache Corp. 2.3%Anadarko Petroleum Corp. 2.2%Pfizer Inc. 1.8%Johnson & Johnson 1.8%Wells Fargo & Co. 1.7%
mentary on the Intermediate Bond Fundthat U.S. Treasury debt lagged theperformance of U.S. Agency debt, whichlagged the performance of U.S.Corporate and non-corporate debt; andlong-maturity Treasury debt took thebrunt of the hit in a rising rate envi-ronment. This was also the case in theIntermediate Barclays CapitalGovernment/Credit Bond Index, anindex of maturity no longer than 10years and one to which the bond portionin the Balanced Fund is often compared.
The shorter duration of the bonds in theBalanced Fund was also a factor in ourperformance of the fund. Additionalcontributors to out performance weresecurity selection in U.S. Treasuries
(notably TIPs) and in Utility bonds, andover weighting U.S. Credits and Baa-rated corporate debt. The top fixedincome contributors included twosecurities in the Intermediate BondFund – the Bank of America note (1.1%of net assets as of March 31, 2011) andthe TIPs, two additional TIPs - U.S.Treasury Inflation Indexed note 1.375%due 07-15-18 and 1.250% due 04-15-14,and Anadarko 5.950% due 09-15-16(0.9%).
Detracting the most from performanceof the fixed income portion of the fundwere two of the five notes listed for theIntermediate Bond Fund – the JPMorgan and Fannie Mae notes.
Changes in Fixed Income Holdings:
During the quarter there were no salesand a single purchase, U.S. TreasuryInflation Indexed note 1.375% due 01-15-20 (1.4%).Sincerely,
Susan M. ByrneCo-Portfolio Manager
Mark R. Freeman, CFACo-Portfolio Manager
April 11, 2011
(a) Bonds and equity positions have been combined.

14
́́Morningstar® rated the GAMCOWestwood Intermediate Bond Fund ClassAAA Shares 2 stars overall and 2 stars forthe three, five, and ten year periods endedMarch 31, 2011 among 1,021, 1,021, 873,and 563 Intermediate-Term Bond funds,respectively.
To Our Shareholders,
For the quarter ended March 31, 201,the net asset value (“NAV”) of theGAMCO Westwood Intermediate BondFund Class AAA Shares posted a returnof 0.4%, net of fees and expenses,versus 0.2% for the Barclays CapitalGovernment/Credit Bond Index, theFund’s benchmark.
Market Background
As was the case for most asset classes,volatility was a defining characteristicof the bond market in the first quarterof 2011. After a relatively quiet January,bond yields moved sharply higher inFebruary on (1) signs of an improvingeconomic outlook and (2) growingconcerns over inflation in response tosurging commodity prices, especiallyoil. But the rise in rates provedtemporary as the catastrophe in Japanon March 11th prompted a strong bidfor bonds and sharp decline in rates.However, the flight-to-safety Treasurybid proved to be relatively short-livedas investors once again turned theirattention to a steady stream ofeconomic data showing the U.S.recovery remained on track.
After all was saidand done Treasuryyields finished thequarter 0.15– 0.26%higher than at thebeginning of theyear (led by thethree-year note),reflecting expecta-tions for the Federal Reserve to raiseofficial rates earlier than previouslyexpected. Despite the volatility ininterest rates and a steady stream ofnew supply of debt during the quarter,investors continued to show strongdemand for corporate bonds and otherspread sectors, which in turn pushedcredit spreads even lower and pricescorrespondingly higher.The slight increase in yield-to-maturityproduced another quarter of negative
Westwood Intermediate Bond Fund
Average Annual Returns Through March 31, 2011 (a)(c) (Unaudited)Since
InceptionQuarter 1 Year 3 Year 5 Year 10 Year 15 Year (10/1/91)———— ——— ——— ——— ——–— ——–— ——–——
Intermediate Bond Fund Class AAA . . . . . . . . . . . . . . . . . 0.36% 3.97% 4.24% 4.89% 4.44% 5.30% 5.53% Barclays Capital Government/Credit Bond Index . . . . . . 0.28 5.26 4.82 5.83 5.53 6.15 6.58(b)Lipper Intermediate Investment Grade Debt Fund Average . . . . . . . . . . . . . . . . . . . . . . . . . . . . . . . 1.06 6.68 6.10 5.77 5.34 5.85 6.22(b)
Barclays Capital Government/Corporate Bond Index . . 0.22 5.27 4.81 5.79 5.47 N/A(d) 5.64(d)In the current prospectus dated January 31, 2011, the gross expense ratio for AAA Shares is 1.49%. The net expense ratio is 1.02%, aftercontractual reimbursements, by Teton Advisors Inc. (the “Adviser”) in place through January 31, 2012. Class AAA Shares do not have asales charge. (a) Returns represent past performance and do not guarantee future results. Total returns and average annual returns reflect changes in share
price, investment of distributions, and are net of expenses. Investment returns and the principal value of an investment will fluctuate. When sharesare redeemed, they may be worth more or less than their original cost. The Adviser reimbursed expenses to limit the expense ratio. Had suchlimitation not been in place, returns would have been lower. Current performance may be lower or higher than the performance data presented.Performance returns for periods of less than one year are not annualized. Visit www.tetonadv.com for performance information as of the mostrecent month end. The Fund is subject to interest rate and credit risks. Investors should carefully consider the investment objectives, risks,charges, and expenses of the Fund before investing. The prospectus contains information about this and other matters and should beread carefully before investing. Other shares classes are available and have different performance characteristics. See page 17 for performanceof other classes of shares. The Barclays Capital Government/Credit Bond Index and Barclays Capital Government/Corporate Bond Index aremarket value weighted indices that track the performance of fixed rate, publicly placed, dollar denominated obligations. The Lipper IntermediateInvestment Grade Debt Fund Average reflects the average performance of mutual funds classified in this particular category. Dividends areconsidered reinvested. You cannot invest directly in an index.
(b) The Barclays Capital Government/Credit Bond Index and the Lipper Intermediate Investment Grade Debt Fund Average since inceptionperformance are as of September 30, 1991.
(c) As per the January 31, 2011 prospectus, the fund’s benchmark is the Barclays Capital Government/Credit Bond Index.(d) The Barclays Capital Government/Corporate Bond Index since inception performance is as of December 31, 1998.
Mark R. Freeman, CFA
Morningstar Rating™ is based on risk-adjusted returns. The Overall Morningstar Rating is derived from a weighted average of theperformance figures associated with a fund’s three, five, and ten year (if applicable) Morningstar Rating metrics. For funds with atleast a three year history, a Morningstar Rating is based on a risk-adjusted return measure (including the effects of sales charges, loads,and redemption fees) placing more emphasis on downward variations and rewarding consistent performance. That accounts for vari-ations in a fund’s monthly performance. The top 10% of funds in each category receive 5 stars, the next 22.5% 4 stars, the next 35% 3stars, the next 22.5% 2 stars, and the bottom 10% 1 star. (Each share class is counted as a fraction of one fund within this scale and ratedseparately, which may cause slight variations in the distribution percentages.) Morningstar Rating is for the AAA Share class only;other classes may have different performance characteristics. Ratings reflect relative performance. Results for certain periods were neg-ative. ©2010 Morningstar, Inc. All Rights Reserved. The information contained herein: (1) is proprietary to Morningstar and/or its con-tent providers; (2) may not be copied or distributed; and (3) is not warranted to be accurate, complete or timely. Neither Morningstarnor its content providers are responsible for any damages or losses arising from any use of this information.

15
Top Ten Holdings (Percent of Net Assets)March 31, 2011
U.S. Treasury Notes 17.9%Fannie Mae Notes 13.3%Freddie Mac Notes 10.1%U.S. Treasury Bonds 5.6%Ginnie Mae Pools 2.3%
International Bank for Reconstruction & Development, 8.625%, 10/15/16 2.0%Bank of America Corp., 5.375%, 06/15/14 2.0%Berkshire Hathaway Inc., 5.125%, 09/15/12 1.9%Dominion Resources Inc., 6.400%, 06/15/18 1.9%Merrill Lynch & Co Inc., 5.000%, 01/15/15 1.8%
returns for the Treasury market, withthe most interest-rate sensitive secu-rities performing worst: the 30-yearbond returned a loss of 1.7% for theperiod. A notable exception in thissector was U.S. TIPs (TreasuryInflation-Indexed securities, or Treas-ury inflation-protected securities). Thedecline in credit spreads resulted inmodestly positive returns for mostnon-government sectors of the bondmarket. TIPs, securities backed bycommercial real estate, and corporatebonds of financial institutions were thetop performers in the first quarter,posting gains of 2% or more. Within thecredit sector, higher yielding Baa-ratedbonds again strongly outperformed A-,Aa-, and Aaa-rated securities.
Fund Performance Analysis:
The fund’s first quarter return of 0.3%,net of all fees and expenses, exceededthe 0.28% return of the Barclays CapitalGovernment Credit Bond Index
(BCGC). The portfolio’s severalcontributors to out performanceincluded (1) Allocation: the underweight in U.S. Governments, particu-larly in U.S. Treasuries, the over weightin U.S. credits – notably financial insti-tutions and Baa-rated notes – and theinclusion of Mortgage-Backed Securitiesissued by Ginnie Mae and Fannie Mae;and (2) Security Selection: industrialnotes and TIPs. Of importance was thelower interest rate sensitivity of thefund, as measured by duration,achieved by deliberately under-weighting long-maturity debt – thearea of the yield curve more negativelyimpacted by rising rates in mostsectors. Negative factors were an underweight in non-corporate credits andsecurity selection in Utilities and in U.S.Agency debt.
Arrow Electronics 6.000% due 04-01-20(1.3% of net assets as of March 31, 2011)topped individual contributors, joinedby two financial institutions notes:
Bank of America Corp. 5.375% due 06-15-14 (2.0%) and Merrill Lynch &Co. 5.000% due 01-15-15 (1.8%), andU.S. Treasury Inflation Indexed Note2.500% due 07-15-16 (2.1%).
Securities contributing the least, inorder, were: JP Morgan 6.300% due 04-23-19 (1.4%), Fannie Mae 5.000%due 04-15-15 (2.1%), Kraft Foods5.375% due 02-10-20 (1.6%), DominionResources 6.400% due 06-15-18 (1.9%),and U.S. Treasury 5.375% due 02-15-31(1.1%).
Changes in Holdings:
There were no purchases during thequarter. The single sale was Fannie Mae5.375% due 11-15-11.
Sincerely,
Mark R. Freeman, CFAPortfolio ManagerApril 11, 2011

16
Nasdaq Symbols (Cusip) Table
GAMCO Westwood Funds Class AAA Class A Class B Class C Class I—————————————— —————— ———— ———— ———— ————Mighty MitesSM WEMMX WMMAX WMMBX WMMCX WEIMXSmallCap Equity WESCX WESAX 361439821 WWSCX WWSIXIncome WESRX WEIAX — WEICX WESIXEquity WESWX WEECX — WEQCX WEEIXBalanced WEBAX WEBCX WBCBX WBCCX WBBIXIntermediate Bond WEIBX WEAIX WEBIX WECIX WEIIX
Minimum Initial Investment
Each fund, other than the MightyMitesSM Fund, has a minimum initialinvestment requirement for regularaccounts of $1,000; there are no subse-quent investment minimums; no initialminimum is required for those estab-lishing an Automatic Investment Plan;and all of the GAMCO WestwoodFunds are available through financialintermediaries including the no trans-action fee programs at many majorbrokerage firms. The minimum initialinvestment for the Mighty MitesSM
Fund is $10,000 for all accounts. There are no subsequent investmentminimums. The minimum investmentfor each fund’s Class I Shares is$500,000, which shares are purchasedby institutions directly through Gabelli & Company, Inc., the Fund’sdistributor, or brokers that have
entered into selling agreements withthe distributor specifically with respectto Class I Shares.
www.tetonadv.com
Please visit us on the Internet. Ourhomepage at www.tetonadv.comcontains information about theGAMCO Westwood Funds, with linksto information about the GabelliMutual Funds, IRAs, 401(k)s, currentand historical quarterly reports, closingprices, and other current news. Wewelcome your comments and questionsvia e-mail at [email protected].
The Funds’ daily net asset values areavailable in the financial press and eachevening after 7:00 PM (Eastern Time) bycalling 800-WESTWOOD (800-937-8966).Please call us during the business day,between 8:00 AM – 7:00 PM (EasternTime), for further information. Thank
you for investing in the GAMCOWestwood Funds. We look forward toserving your investment objectives in theyears ahead.
e-delivery
We are pleased to offer electronicdelivery of fund documents. Directshareholders of our mutual funds cannow elect to receive their Annual,Semiannual, and Quarterly FundReports, Manager Commentaries, andProspectuses via e-delivery. For moreinformation or to sign up for e-delivery, please visit our website atwww.tetonadv.com. You may also signup for our e-mail alerts and receiveearly notice of quarterly report avail-ability, news events, media sightings,and mutual fund prices and per-formance via our website.

17
GAMCO WESTWOOD FUNDS(Unaudited)
Class AAA Shares Class A Shares——––—–——————––———————————————— ——––—–——————————————————————Average Annual Returns – March 31, 2011 (a) Average Annual Returns – March 31, 2011 (a)(b)(e)
Current CurrentExpense Expense Ratio after Ratio after
Gross Adviser Maximum Gross Adviser MaximumSince Expense Reimburse- Sales Since Expense Reimburse- Sales
1 Year 5 Year 10 Year Inception Ratio ments Charge 1 Year 5 Year 10 Year Inception Ratio ments Charge——––—–——————––———————————————— ——––—–——————————————————————Mighty MitesSM . . . . . 24.64% 9.20% 10.75% 12.28% 1.58% 1.58% None 19.37% 8.10% 10.08% 11.74% 1.83% 1.83% 4.00%SmallCap Equity . . . 32.39 6.71 5.73 7.75 1.99 1.50 None 26.84 5.60 5.13 7.31 2.24 1.75 4.00Income . . . . . . . . . . . . 14.32 1.23 8.99 7.15 3.19 2.00 None 9.57 0.18 8.30 6.65 3.44 2.25 4.00Equity . . . . . . . . . . . . . 11.89 2.27 3.69 9.97 1.54 1.54 None 7.13 1.19 3.00 9.56 1.79 1.79 4.00Balanced . . . . . . . . . . . 9.09 3.69 4.45 8.75 1.24 1.24 None 4.34 2.58 3.76 8.25 1.49 1.49 4.00Intermediate Bond . . 3.97 4.89 4.44 5.53 1.49 1.02 None (0.32) 3.95 3.92 5.26 1.59 1.12 4.00
Class B Shares Class C Shares——––—–——————––———————————————— ——––—–——————————————————————Average Annual Returns – March 31, 2011 (a)(c)(e) Average Annual Returns – March 31, 2011 (a)(d)(e)
Current CurrentExpense Expense Ratio after Ratio after
Gross Adviser Maximum Gross Adviser MaximumSince Expense Reimburse- Sales Since Expense Reimburse- Sales
1 Year 5 Year 10 Year Inception Ratio ments Charge 1 Year 5 Year 10 Year Inception Ratio ments Charge——––—–——————––———————————————— ——––—–——————————————————————Mighty MitesSM . . . . . 18.64% 8.09% 9.94% 11.64% 2.33% 2.33% 5.00% 22.67% 8.42% 9.97% 11.66% 2.33% 2.33% 1.00%SmallCap Equity . . . 26.45 5.61 4.96 7.19 2.74 2.25 5.00 30.48 5.94 4.92 7.16 2.74 2.25 1.00Income . . . . . . . . . . . . Class B Shares have been discontinued. 12.47 0.46 8.37 6.70 3.94 2.75 1.00Equity . . . . . . . . . . . . . Class B Shares have been discontinued. 10.06 1.52 2.93 9.54 2.29 2.29 1.00Balanced . . . . . . . . . . . 3.20 2.52 3.65 8.22 1.99 1.99 5.00 7.27 2.92 3.71 8.25 1.99 1.99 1.00Intermediate Bond . . (1.82) 3.79 3.63 5.12 2.24 1.77 5.00 2.18 4.19 3.70 5.15 2.24 1.77 1.00
Class I Shares——––—–——————––————————————————Average Annual Returns – March 31, 2011 (a)(e)
CurrentExpense Ratio after
Gross Adviser MaximumSince Expense Reimburse- Sales
1 Year 5 Year 10 Year Inception Ratio ments Charge——––—–——————––————————————————Mighty MitesSM . . . . . 24.89% 9.37% 10.84% 12.35% 1.33% 1.33% NoneSmallCap Equity . . . 32.74 6.88 5.81 7.81 1.74 1.25 NoneIncome . . . . . . . . . . . . 14.77 1.41 9.09 7.23 2.94 1.75 NoneEquity . . . . . . . . . . . . . 12.19 2.46 3.79 10.01 1.29 1.29 NoneBalanced . . . . . . . . . . . 9.30 3.84 4.53 8.79 0.99 0.99 NoneIntermediate Bond . . 4.22 5.05 4.52 5.57 1.24 0.77 None
(a) Returns represent past performance and do not guarantee future results. Total returns and average annual returns reflect changes in share priceand reinvestment of distributions and are net of expenses. Investment returns and the principal value of an investment will fluctuate. When sharesare redeemed, they may be worth more or less than their original cost. For the SmallCap Equity, Income, and Intermediate Bond Funds (and for theMighty MitesSM Fund through September 30, 2005), the Adviser reimbursed expenses to limit the expense ratio. Had such limitations not been inplace, returns would have been lower. The contractual expense limitations are in effect through January 31, 2011 and are renewable annually by theAdviser. Current performance may be lower or higher than the performance data presented. Visit www.tetonadv.com for performance information asof the most recent month end. Investors should carefully consider the investment objectives, risks, charges, and expenses of the Funds beforeinvesting. The prospectus contains information about this and other matters and should be read carefully before investing.
(b) Includes the effect of the maximum 4.0% sales charge at the beginning of the period.(c) Assuming payment of the maximum contingent deferred sales charge (CDSC). The maximum CDSC for Class B Shares is 5% and is reduced to 0%
after six years.(d) Assuming payment of the maximum CDSC. A CDSC of 1% is imposed on redemptions made within one year of purchase.(e) The performance of the Class AAA Shares is used to calculate performance for the periods prior to the issuance of Class A Shares, Class B Shares, Class
C Shares, and Class I Shares. The performance for the Class B Shares and Class C Shares would have been lower due to the additional expensesassociated with these classes of shares. The performance for the Class I Shares would have been higher due to the lower expenses associated with thisclass of shares. The inception dates for the Class AAA Shares and the initial issuance dates for the Class A Shares, Class B Shares, Class C Shares, andClass I Shares after which shares remained continuously outstanding are listed below.
Class AAA Shares Class A Shares Class B Shares Class C Shares Class I Shares——————————— ————————— ————————— ————————— —————————Mighty MitesSM . . . . . . . . . . 05/11/98 11/26/01 06/06/01 08/03/01 01/11/08SmallCap Equity . . . . . . . . . 04/15/97 11/26/01 03/27/01 11/26/01 01/11/08Income . . . . . . . . . . . . . . . . . 09/30/97 05/09/01 11/26/01 11/26/01 01/11/08Equity . . . . . . . . . . . . . . . . . . 01/02/87 01/28/94 03/27/01 02/13/01 01/11/08Balanced . . . . . . . . . . . . . . . . 10/01/91 04/06/93 03/27/01 09/25/01 01/11/08Intermediate Bond . . . . . . . 10/01/91 07/26/01 03/27/01 10/22/01 01/11/08

GAMCO Westwood Funds and Your Personal Privacy
Who are we?
The GAMCO Westwood Funds are investment companies registered with the Securitiesand Exchange Commission under the Investment Company Act of 1940. We aremanaged by Teton Advisors, Inc., which is an affiliate of GAMCO Investors, Inc., apublicly held company that has subsidiaries that provide investment advisory orbrokerage services for a variety of clients. Teton Advisors, Inc. is a publicly heldcompany that provides investment advisory services to the GAMCO Westwood Funds.
What kind of non-public information do we collect about you if you become a Fundshareholder?
If you apply to open an account directly with us, you will be giving us some non-publicinformation about yourself. The non-public information we collect about you is:
• Information you give us on your application form. This could include your name,address, telephone number, social security number, bank account number, andother information.
• Information about your transactions with us, any transactions with our affiliates, andtransactions with the entities we hire to provide services to you. This would includeinformation about the shares that you buy or redeem. If we hire someone else toprovide services—like a transfer agent—we will also have information about thetransactions that you conduct through them.
What information do we disclose and to whom do we disclose it?
We do not disclose any non-public personal information about our customers orformer customers to anyone other than our affiliates, our service providers who needto know such information, and as otherwise permitted by law. If you want to find outwhat the law permits, you can read the privacy rules adopted by the Securities andExchange Commission. They are in volume 17 of the Code of Federal Regulations, Part248. The Commission often posts information about its regulations on its website,www.sec.gov.
What do we do to protect your personal information?
We restrict access to non-public personal information about you to the people whoneed to know that information in order to provide services to you or the Fund and toensure that we are complying with the laws governing the securities business. Wemaintain physical, electronic, and procedural safeguards to keep your personalinformation confidential.

VALUE ________________________________________Gabelli Asset FundSeeks to invest primarily in a diversified portfolio ofcommon stocks selling at significant discounts totheir private market value. The Fund’s primary objective is growth of capital. (Multiclass)
Team Managed
Gabelli Blue Chip Value FundSeeks long term growth of capital through investmentprimarily in the common stocks of established companies which are temporarily out of favor. Thefund’s objective is to identify a catalyst or sequence ofevents that will return the company to a higher value. (Multiclass)
Portfolio Manager: Barbara G. Marcin, CFA
GAMCO Westwood Equity FundSeeks to invest primarily in the common stock of wellseasoned companies that have recently reported positive earnings surprises and are trading belowWestwood’s proprietary growth rate estimates. TheFund’s primary objective is capital appreciation.(Multiclass) Portfolio Manager: Susan M. Byrne
FOCUSED VALUE ______________________________Gabelli Value Fund Seeks to invest in securities of companies believed tobe undervalued. The Fund’s primary objective is long-term capital appreciation. (Multiclass)
Team Managed
SMALL CAP VALUE ____________________________Gabelli Small Cap FundSeeks to invest primarily in common stock of smallercompanies (market capitalizations at the time ofinvestment of $2 billion or less) believed to have rapidrevenue and earnings growth potential. The Fund’s primary objective is capital appreciation. (Multiclass)
Portfolio Manager: Mario J. Gabelli, CFA
GAMCO Westwood SmallCap Equity FundSeeks to invest primarily in smaller capitalizationequity securities – market caps of $2.5 billion or less.The Fund’s primary objective is long-term capitalappreciation. (Multiclass)
Portfolio Manager: Nicholas F. Galluccio
Gabelli Woodland Small Cap Value FundSeeks to invest primarily in the common stocks ofsmaller companies (market capitalizations generallyless than $3.0 billion) believed to be undervalued withshareholder oriented management teams that areemploying strategies to grow the company’s value.The Fund’s primary objective is capital appreciation.(Multiclass) Portfolio Manager: Elizabeth M. Lilly, CFA
GROWTH ______________________________________GAMCO Growth FundSeeks to invest primarily in large cap stocks believedto have favorable, yet undervalued, prospects for earnings growth. The Fund’s primary objective is capital appreciation. (Multiclass)
Portfolio Manager: Howard F. Ward, CFA
GAMCO International Growth Fund Seeks to invest in the equity securities of foreignissuers with long-term capital appreciation potential.The Fund offers investors global diversification.(Multiclass) Portfolio Manager: Caesar Bryan
AGGRESSIVE GROWTH _________________________GAMCO Global Growth Fund Seeks capital appreciation through a disciplinedinvestment program focusing on the globalization andinteractivity of the world’s marketplace. The Fundinvests in companies at the forefront of acceleratedgrowth. The Fund’s primary objective is capital appreciation. (Multiclass) Team Managed
MICRO-CAP ___________________________________GAMCO Westwood Mighty MitesSM FundSeeks to invest in micro-cap companies that havemarket capitalizations of $300 million or less. TheFund’s primary objective is long-term capital appreciation. (Multiclass) Team Managed
EQUITY INCOME _______________________________Gabelli Equity Income FundSeeks to invest primarily in equity securities withabove average market yields. The Fund pays monthlydividends and seeks a high level of total return with anemphasis on income. (Multiclass)
Portfolio Manager: Mario J. Gabelli, CFA
GAMCO Westwood Balanced FundSeeks to invest in a balanced and diversified portfolioof stocks and bonds. The Fund’s primary objective isboth capital appreciation and current income.(Multiclass)
Co- Portfolio Managers: Susan M. Byrne Mark R. Freeman, CFA
GAMCO Westwood Income FundSeeks to provide a high level of current income as wellas long-term capital appreciation by investing inincome producing equity and fixed income securities.(Multiclass) Portfolio Manager: Barbara G. Marcin, CFA
SPECIALTY EQUITY ____________________________
GAMCO Vertumnus Fund (formerly GAMCO GlobalConvertible Securities Fund)Seeks to invest principally in bonds and preferredstocks which are convertible into common stock of foreign and domestic companies. The Fund’s primaryobjective is total return through a combination of current income and capital appreciation. (Multiclass)
Portfolio Manager: Mario J. Gabelli, CFA
GAMCO Global Opportunity FundSeeks to invest in common stock of companies whichhave rapid growth in revenues and earnings and potential for above average capital appreciation or areundervalued. The Fund’s primary objective is capitalappreciation. (Multiclass) Team Managed
Gabelli SRI Green FundSeeks to invest in common and preferred stocksmeeting guidelines for social responsibility (avoidingdefense contractors and manufacturers of alcohol,abortifacients, gaming, and tobacco products) andsustainability (companies engaged in climate change,energy security and independence, natural resourceshortages, organic living, and urbanization). The Fund’sprimary objective is capital appreciation. (Multiclass)
Co-Portfolio Managers: Christopher C. Desmarais John M. Segrich, CFA
SECTOR ______________________________________GAMCO Global Telecommunications Fund Seeks to invest in telecommunications companiesthroughout the world – targeting undervaluedcompanies with strong earnings and cash flowdynamics. The Fund’s primary objective is capitalappreciation. (Multiclass) Team Managed
GAMCO Gold Fund Seeks to invest in a global portfolio of equity securities of gold mining and related companies. TheFund’s objective is long-term capital appreciation.Investment in gold stocks is considered speculativeand is affected by a variety of worldwide economic,financial, and political factors. (Multiclass)
Portfolio Manager: Caesar Bryan
Gabelli Utilities FundSeeks to provide a high level of total return through acombination of capital appreciation and currentincome. (Multiclass)
Portfolio Manager: Mario J. Gabelli, CFA
MERGER AND ARBITRAGE _____________________Gabelli ABC FundSeeks to invest in securities with attractive oppor - tunities for appreciation or investment income. TheFund’s primary objective is total return in variousmarket conditions without excessive risk of capital loss. (No-load) Portfolio Manager: Mario J. Gabelli, CFA
Gabelli Enterprise Mergers and Acquisitions FundSeeks to invest in securities believed to be likelyacquisition targets within 12–18 months or in arbitragetransactions of publicly announced mergers or othercorporate reorganizations. The Fund’s primary objectiveis capital appreciation. (Multiclass)
Portfolio Manager: Mario J. Gabelli, CFA
CONTRARIAN _________________________________
GAMCO Mathers FundSeeks long-term capital appreciation in various marketconditions without excessive risk of capital loss. (No-load) Portfolio Manager: Henry Van der Eb, CFA
Comstock Capital Value FundSeeks capital appreciation and current income. TheFund may use either long or short positions to achieveits objective. (Multiclass)
Portfolio Managers: Charles L. MinterMartin Weiner, CFA
FIXED INCOME ________________________________GAMCO Westwood Intermediate Bond FundSeeks to invest in a diversified portfolio of bonds withvarious maturities. The Fund’s primary objective istotal return. (Multiclass)
Portfolio Manager: Mark R. Freeman, CFA
CASH MANAGEMENT-MONEY MARKET __________Gabelli U.S. Treasury Money Market FundSeeks to invest exclusively in short-term U.S. Treasurysecurities. The Fund’s primary objective is to providehigh current income consistent with the preservationof principal and liquidity. (No-load)
Co-Portfolio Managers: Judith A. RaneriRonald S. Eaker
An investment in the above Money Market Fund is neither insured nor guaranteed by the FederalDeposit Insurance Corporation or any governmentagency. Although the Fund seeks to preserve thevalue of your investment at $1.00 per share, it ispossible to lose money by investing in the Fund.
The Funds may invest in foreign securities whichinvolve risks not ordinarily associated withinvestments in domestic issues, including currencyfluctuation, economic, and political risks.
GABELLI FAMILY OF FUNDS
To receive a prospectus, call 800-GABELLI (800-422-3554). Investors should carefully consider the investment objectives, risks, charges, and expenses of a fundbefore investing. The prospectus contains more information about this and other matters and should be read carefully before investing.
Distributed by Gabelli & Company, Inc., One Corporate Center, Rye, NY 10580.

GAMCO WESTWOOD FUNDS
GAMCO Westwood Mighty MitesSM FundGAMCO Westwood SmallCap Equity Fund
GAMCO Westwood Income FundGAMCO Westwood Equity FundGAMCO Westwood Balanced Fund
GAMCO Westwood Intermediate Bond Fund
One Corporate Center Rye, New York 10580-1422
General and Account Information:800-WESTWOOD [800-937-8966]
fax: 914-921-5118website: www.tetonadv.come-mail: [email protected]
ANTHONY J. COLAVITAPresidentAnthony J. Colavita, P.C.
JAMES P. CONNFormer Chief Investment OfficerFinancial Security AssuranceHoldings Ltd.
WERNER J. ROEDER, MDMedical DirectorLawrence Hospital
SALVATORE J. ZIZZAChairmanZizza & Co., Ltd.
BRUCE N. ALPERTPresident and Secretary
AGNES MULLADYTreasurer
PETER D. GOLDSTEINChief Compliance Officer
Investment AdviserTeton Advisors, Inc.
DistributorGabelli & Company, Inc.
CustodianThe Bank of New York Mellon
Legal CounselPaul, Hastings, Janofsky & Walker LLP
Board of Trustees
Officers
This report is submitted for the information of the shareholders of the GAMCO Westwood Funds. It is not authorized for distribution to prospectiveinvestors unless preceded or accompanied by an effective prospectus.
GABWWQ111SC
We have separated the portfolio managers’ commentary from the financial statements and investment portfolio due tocorporate governance regulations stipulated by the Sarbanes-Oxley Act of 2002. We have done this to ensure that the contentof the portfolio managers’ commentary is unrestricted. The financial statements and investment portfolio are mailedseparately from the commentary. Both the commentary and the financial statements, including the portfolio of investments,will be available on our website at www.tetonadv.com.

GAMCO WESTWOOD FUNDS
Semi Annual ReportMarch 31, 2011
Mighty MitesSM Fund
SmallCap Equity Fund
Income Fund
Equity Fund
Balanced Fund
Intermediate Bond Fund

2
GAMCO WESTWOOD FUNDS(Unaudited)
Class AAA Shares Class A Shares——––—–——————––———————————————— ——––—–——————————————————————Average Annual Returns – March 31, 2011 (a) Average Annual Returns – March 31, 2011 (a)(b)(e)
Current CurrentExpense ExpenseRatio after Ratio after
Gross Adviser Maximum Gross Adviser MaximumSince Expense Reimburse- Sales Since Expense Reimburse- Sales
1Year 5Year 10Year Inception Ratio ments Charge 1Year 5Year 10Year Inception Ratio ments Charge——––—–——————––———————————————— ——––—–——————————————————————Mighty MitesSM . . . . . 24.64% 9.20% 10.75% 12.28% 1.58% 1.58% None 19.37% 8.10% 10.08% 11.74% 1.83% 1.83% 4.00%SmallCap Equity . . . 32.39 6.71 5.73 7.75 1.99 1.50 None 26.84 5.60 5.13 7.31 2.24 1.75 4.00Income . . . . . . . . . . . . 14.32 1.23 8.99 7.15 3.19 2.00 None 9.57 0.18 8.30 6.65 3.44 2.25 4.00Equity . . . . . . . . . . . . . 11.89 2.27 3.69 9.97 1.54 1.54 None 7.13 1.19 3.00 9.56 1.79 1.79 4.00Balanced . . . . . . . . . . . 9.09 3.69 4.45 8.75 1.24 1.24 None 4.34 2.58 3.76 8.25 1.49 1.49 4.00Intermediate Bond . . 3.97 4.89 4.44 5.53 1.49 1.02 None (0.32) 3.95 3.92 5.26 1.59 1.12 4.00
Class B Shares Class C Shares——––—–——————––———————————————— ——––—–——————————————————————Average Annual Returns – March 31, 2011 (a)(c)(e) Average Annual Returns – March 31, 2011 (a)(d)(e)
Current CurrentExpense ExpenseRatio after Ratio after
Gross Adviser Maximum Gross Adviser MaximumSince Expense Reimburse- Sales Since Expense Reimburse- Sales
1Year 5Year 10Year Inception Ratio ments Charge 1Year 5Year 10Year Inception Ratio ments Charge——––—–——————––———————————————— ——––—–——————————————————————Mighty MitesSM . . . . . 18.64% 8.09% 9.94% 11.64% 2.33% 2.33% 5.00% 22.67% 8.42% 9.97% 11.66% 2.33% 2.33% 1.00%SmallCap Equity . . . 26.45 5.61 4.96 7.19 2.74 2.25 5.00 30.48 5.94 4.92 7.16 2.74 2.25 1.00Income . . . . . . . . . . . . Class B Shares have been discontinued. 12.47 0.46 8.37 6.70 3.94 2.75 1.00Equity . . . . . . . . . . . . . Class B Shares have been discontinued. 10.06 1.52 2.93 9.54 2.29 2.29 1.00Balanced . . . . . . . . . . . 3.20 2.52 3.65 8.22 1.99 1.99 5.00 7.27 2.92 3.71 8.25 1.99 1.99 1.00Intermediate Bond . . (1.82) 3.79 3.63 5.12 2.24 1.77 5.00 2.18 4.19 3.70 5.15 2.24 1.77 1.00
Class I Shares——––—–——————––————————————————Average Annual Returns – March 31, 2011 (a)(e)
CurrentExpenseRatio after
Gross Adviser MaximumSince Expense Reimburse- Sales
1Year 5Year 10Year Inception Ratio ments Charge——––—–——————––————————————————Mighty MitesSM . . . . . 24.89% 9.37% 10.84% 12.35% 1.33% 1.33% NoneSmallCap Equity . . . 32.74 6.88 5.81 7.81 1.74 1.25 NoneIncome . . . . . . . . . . . . 14.77 1.41 9.09 7.23 2.94 1.75 NoneEquity . . . . . . . . . . . . . 12.19 2.46 3.79 10.01 1.29 1.29 NoneBalanced . . . . . . . . . . . 9.30 3.84 4.53 8.79 0.99 0.99 NoneIntermediate Bond . . 4.22 5.05 4.52 5.57 1.24 0.77 None
(a) Returns represent past performance and do not guarantee future results. Total returns and average annual returns reflect changes in share priceand reinvestment of distributions and are net of expenses. Investment returns and the principal value of an investment will fluctuate. When sharesare redeemed, they may be worth more or less than their original cost. For the SmallCap Equity, Income, and Intermediate Bond Funds (and for theMighty MitesSM Fund through September 30, 2005), the Adviser reimbursed expenses to limit the expense ratio. Had such limitations not been inplace, returns would have been lower. The contractual expense limitations are in effect through January 31, 2012 and are renewable annually by theAdviser. Current performance may be lower or higher than the performance data presented. Visit www.tetonadv.com for performance information asof the most recent month end. Investors should carefully consider the investment objectives, risks, charges, and expenses of the Funds beforeinvesting. The prospectus contains information about this and other matters and should be read carefully before investing.
(b) Includes the effect of the maximum 4.0% sales charge at the beginning of the period.(c) Assuming payment of the maximum contingent deferred sales charge (CDSC). The maximum CDSC for Class B Shares is 5% and is reduced to 0%after six years.
(d) Assuming payment of the 1% maximum CDSC imposed on redemptions made within one year of purchase.(e) The performance of the Class AAA Shares is used to calculate performance for the periods prior to the issuance of Class A Shares, Class B Shares,Class C Shares, and Class I Shares. The performance for the Class B Shares and Class C Shares would have been lower due to the additional expensesassociated with these classes of shares. The performance for the Class I Shares would have been higher due to the lower expenses associated with thisclass of shares. The inception dates for the Class AAA Shares and the initial issuance dates for the Class A Shares, Class B Shares, Class C Shares,and Class I Shares after which shares remained continuously outstanding are listed below.
Class AAA Shares Class A Shares Class B Shares Class C Shares Class I SharesMighty MitesSM . . . . . . . . . . . 05/11/98 11/26/01 06/06/01 08/03/01 01/11/08SmallCap Equity . . . . . . . . . 04/15/97 11/26/01 03/27/01 11/26/01 01/11/08Income . . . . . . . . . . . . . . . . . . 09/30/97 05/09/01 — 11/26/01 01/11/08Equity . . . . . . . . . . . . . . . . . . 01/02/87 01/28/94 — 02/13/01 01/11/08Balanced . . . . . . . . . . . . . . . . 10/01/91 04/06/93 03/27/01 09/25/01 01/11/08Intermediate Bond . . . . . . . . 10/01/91 07/26/01 03/27/01 10/22/01 01/11/08

3
Morningstar® Ratings Based on Risk Adjusted returns as of March 31, 2011.
Overall Rating 3 Year Rating 5 Year Rating 10 Year Rating
Morningstar # of # of # of # ofFUND Category Stars Funds Stars Funds Stars Funds Stars Funds
GAMCOWestwood Mighty MitesSM AAA Small Blend ����� 577 ����� 577 ����� 487 ����� 285
GAMCOWestwood Mighty MitesSM A Small Blend ����� 577 ����� 577 ����� 487 ����� 285
GAMCOWestwood Mighty MitesSM B Small Blend ����� 577 ����� 577 ����� 487 ����� 285
GAMCOWestwood Mighty MitesSM C Small Blend ����� 577 ����� 577 ����� 487 ����� 285
GAMCOWestwood Mighty MitesSM I Small Blend ����� 577 ����� 577 ����� 487 ����� 285
GAMCOWestwood SmallCap Equity AAA Small Blend �� 577 ��� 577 ���� 487 � 285
GAMCOWestwood SmallCap Equity A Small Blend ��� 577 ��� 577 ��� 487 � 285
GAMCOWestwood SmallCap Equity I Small Blend ��� 577 ��� 577 ���� 487 � 285
GAMCOWestwood Income AAA Large Value ���� 1120 ���� 1120 ���� 945 ����� 522
GAMCOWestwood Income A Large Value ��� 1120 ��� 1120 ��� 945 ����� 522
GAMCOWestwood Income C Large Value ��� 1120 ���� 1120 ��� 945 ����� 522
GAMCOWestwood Income I Large Value ���� 1120 ���� 1120 ���� 945 ����� 522
GAMCOWestwood Equity AAA Large Blend ��� 1757 �� 1757 ��� 1471 ���� 816
GAMCOWestwood Equity A Large Blend ��� 1757 � 1757 ��� 1471 ��� 816
GAMCOWestwood Equity C Large Blend ��� 1757 �� 1757 ��� 1471 ��� 816
GAMCOWestwood Equity I Large Blend �� 1757 �� 1757 ���� 1471 ���� 816
GAMCOWestwood Balanced AAA Moderate Allocation ��� 932 �� 932 ��� 734 ��� 408
GAMCOWestwood Balanced A Moderate Allocation ��� 932 �� 932 ��� 734 ��� 408
GAMCOWestwood Balanced B Moderate Allocation ��� 932 �� 932 ��� 734 ��� 408
GAMCOWestwood Balanced C Moderate Allocation ��� 932 �� 932 ��� 734 ��� 408
GAMCOWestwood Balanced I Moderate Allocation ��� 932 ��� 932 ���� 734 ��� 408
GAMCOWestwood Intermediate Bond AAA Intermediate-Term Bond �� 1021 �� 1021 �� 873 �� 563
GAMCOWestwood Intermediate Bond A Intermediate-Term Bond �� 1021 �� 1021 �� 873 � 563
GAMCOWestwood Intermediate Bond B Intermediate-Term Bond � 1021 � 1021 �� 873 � 563
GAMCOWestwood Intermediate Bond C Intermediate-Term Bond �� 1021 �� 1021 �� 873 � 563
GAMCOWestwood Intermediate Bond I Intermediate-Term Bond �� 1021 �� 1021 ��� 873 �� 563
The Overall Morningstar Rating™ is derived from a weighted average of the performance figures associated with its three, five and ten year (if applicable) MorningstarRating metrics. Data presented reflects past performance, which is no guarantee of future results. Ratings are for Class AAA, A, B, C, or I shares; other classes may havedifferent performance characteristics. Unrated classes of fund shares are not listed. For each fund with at least a three year history, Morningstar calculates a MorningstarRating based on a Morningstar Risk-Adjusted Return measure (including the effects of sales charges, loads, and redemption fees) that accounts for variation in a fund'smonthly performance, placing more emphasis on downward variations and rewarding consistent performance. The top 10% of the funds in each category receive 5 stars,the next 22.5% receive 4 stars, the next 35% receive 3 stars, the next 22.5% receive 2 stars, and the bottom 10% receive 1 star. (Each share class is counted as a fraction ofone fund within this scale and rated separately, which may cause slight variations in the distribution percentages.) Strong relative performance is not indicative of positivefund returns. © 2010 Morningstar, Inc. All rights reserved. The information contained herein: (1) is proprietary to Morningstar and/or its content providers; (2) may notbe copied or distributed; and (3) is not warranted to be accurate, complete or timely. Neither Morningstar nor its content providers are responsible for any damages orlosses arising from any use of this information.
Teton Advisors is the investment manager for all GAMCOWestwood Funds. Investors should carefully consider the investment objectives, risks, sales charges and expenses of the Funds beforeinvesting. Each Fund’s prospectus contains this and other information about each Fund and is available, by calling 800-WESTWOOD, online at www.tetonadv.com or from your financialadviser. The prospectus should be read carefully before investing. Distributed by Gabelli & Company, One Corporate Center, Rye, NY 10580. Call 800-WESTWOOD for a prospectus.

4
We believe it is important for you to understand the impactof fees and expenses regarding your investment. All mutualfunds have operating expenses. As a shareholder of a fund,you incur ongoing costs, which include costs for portfoliomanagement, administrative services, and shareholderreports (like this one), among others. Operating expenses,which are deducted from a fund’s gross income, directlyreduce the investment return of a fund. When a fund’sexpenses are expressed as a percentage of its average netassets, this figure is known as the expense ratio. Thefollowing examples are intended to help you understand theongoing costs (in dollars) of investing in your Fund and tocompare these costs with those of other mutual funds. Theexamples are based on an investment of $1,000 made at thebeginning of the period shown and held for the entire period.The Expense Table below illustrates your Fund’s costs intwo ways:Actual Fund Return: This section provides informationabout actual account values and actual expenses. You mayuse this section to help you to estimate the actual expensesthat you paid over the period after any fee waivers andexpense reimbursements. The “Ending Account Value”shown is derived from the Fund’s actual return during thepast six months, and the “Expenses Paid During Period”shows the dollar amount that would have been paid by aninvestor who started with $1,000 in the Fund. You may usethis information, together with the amount you invested, toestimate the expenses that you paid over the period.To do so, simply divide your account value by $1,000 (forexample, an $8,600 account value divided by $1,000 = 8.6),then multiply the result by the number given for your Fundunder the heading “Expenses Paid During Period” toestimate the expenses you paid during this period.Hypothetical 5% Return: This section provides informationabout hypothetical account values and hypothetical expensesbased on the Fund’s actual expense ratio. It assumes ahypothetical annualized return of 5% before expenses duringthe period shown. In this case – because the hypotheticalreturn used is not the Fund’s actual return – the results do notapply to your investment and you cannot use the hypotheticalaccount value and expense to estimate the actual endingaccount balance or expenses you paid for the period. Thisexample is useful in making comparisons of the ongoing costsof investing in the Fund and other funds. To do so, comparethis 5% hypothetical example with the 5% hypotheticalexamples that appear in shareholder reports of other funds.Please note that the expenses shown in the table are meantto highlight your ongoing costs only and do not reflect anytransactional costs such as sales charges (loads),redemption fees, or exchange fees, if any, which aredescribed in the Prospectus. If these costs were applied toyour account, your costs would be higher. Therefore, the 5%hypothetical return is useful in comparing ongoing costsonly, and will not help you determine the relative total costsof owning different funds.
Beginning Ending Annualized ExpensesAccount Value Account Value Expense Paid During10/01/10 03/31/11 Ratio Period*
GAMCOWestwood Mighty MitesSM FundActual Fund ReturnClass AAA $1,000.00 $1,184.90 1.41% $ 7.68Class A $1,000.00 $1,183.50 1.66% $ 9.04Class B $1,000.00 $1,180.70 2.16% $11.74Class C $1,000.00 $1,180.60 2.16% $11.74Class I $1,000.00 $1,186.20 1.16% $ 6.32Hypothetical 5% ReturnClass AAA $1,000.00 $1,017.90 1.41% $ 7.09Class A $1,000.00 $1,016.65 1.66% $ 8.35Class B $1,000.00 $1,014.16 2.16% $10.85Class C $1,000.00 $1,014.16 2.16% $10.85Class I $1,000.00 $1,019.15 1.16% $ 5.84GAMCOWestwood SmallCap Equity FundActual Fund ReturnClass AAA $1,000.00 $1,333.80 1.50% $ 8.73Class A $1,000.00 $1,332.30 1.75% $10.18Class B $1,000.00 $1,329.10 2.25% $13.07Class C $1,000.00 $1,329.60 2.25% $13.07Class I $1,000.00 $1,335.30 1.25% $ 7.28Hypothetical 5% ReturnClass AAA $1,000.00 $1,017.45 1.50% $ 7.54Class A $1,000.00 $1,016.21 1.75% $ 8.80Class B $1,000.00 $1,013.71 2.25% $11.30Class C $1,000.00 $1,013.71 2.25% $11.30Class I $1,000.00 $1,018.70 1.25% $ 6.29GAMCOWestwood Income FundActual Fund ReturnClass AAA $1,000.00 $1,140.10 1.67% $ 8.91Class A $1,000.00 $1,139.40 1.79% $ 9.55Class C $1,000.00 $1,135.10 2.42% $12.88Class I $1,000.00 $1,142.80 1.43% $ 7.64Hypothetical 5% ReturnClass AAA $1,000.00 $1,016.60 1.67% $ 8.40Class A $1,000.00 $1,016.01 1.79% $ 9.00Class C $1,000.00 $1,012.86 2.42% $12.14Class I $1,000.00 $1,017.80 1.43% $ 7.19GAMCOWestwood Equity FundActual Fund ReturnClass AAA $1,000.00 $1,170.90 1.55% $ 8.39Class A $1,000.00 $1,169.40 1.80% $ 9.74Class C $1,000.00 $1,168.10 2.30% $12.43Class I $1,000.00 $1,172.50 1.30% $ 7.04Hypothetical 5% ReturnClass AAA $1,000.00 $1,017.20 1.55% $ 7.80Class A $1,000.00 $1,015.96 1.80% $ 9.05Class C $1,000.00 $1,013.46 2.30% $11.55Class I $1,000.00 $1,018.45 1.30% $ 6.54GAMCOWestwood Balanced FundActual Fund ReturnClass AAA $1,000.00 $1,100.00 1.24% $ 6.49Class A $1,000.00 $1,098.20 1.49% $ 7.79Class B $1,000.00 $1,096.00 1.99% $10.40Class C $1,000.00 $1,096.60 1.99% $10.40Class I $1,000.00 $1,101.50 0.99% $ 5.19Hypothetical 5% ReturnClass AAA $1,000.00 $1,018.75 1.24% $ 6.24Class A $1,000.00 $1,017.50 1.49% $ 7.49Class B $1,000.00 $1,015.01 1.99% $10.00Class C $1,000.00 $1,015.01 1.99% $10.00Class I $1,000.00 $1,020.00 0.99% $ 4.99GAMCOWestwood Intermediate Bond FundActual Fund ReturnClass AAA $1,000.00 $ 988.20 1.00% $ 4.96Class A $1,000.00 $ 987.70 1.10% $ 5.45Class B $1,000.00 $ 984.50 1.75% $ 8.66Class C $1,000.00 $ 984.20 1.75% $ 8.66Class I $1,000.00 $ 989.50 0.75% $ 3.72Hypothetical 5% ReturnClass AAA $1,000.00 $1,019.95 1.00% $ 5.04Class A $1,000.00 $1,019.45 1.10% $ 5.54Class B $1,000.00 $1,016.21 1.75% $ 8.80Class C $1,000.00 $1,016.21 1.75% $ 8.80Class I $1,000.00 $1,021.19 0.75% $ 3.78* Expenses are equal to the Fund’s annualized expense ratio for the last sixmonths multiplied by the average account value over the period,multiplied by the number of days in the most recent fiscal half year (182days), then divided by 365.
GAMCO Westwood FundsDisclosure of Fund Expenses (Unaudited)For the Six Month Period from October 1, 2010 through March 31, 2011 Expense Table

5
Summary of Portfolio Holdings (Unaudited)
The following tables present portfolio holdings as a percent of total net assets as of March 31, 2011:
Financial Services . . . . . . . . . . . . . . . . . . . . . . . . . . . . 14.9%Electronics . . . . . . . . . . . . . . . . . . . . . . . . . . . . . . . . . . 12.2%Semiconductors . . . . . . . . . . . . . . . . . . . . . . . . . . . . . . 9.2%Energy and Utilities . . . . . . . . . . . . . . . . . . . . . . . . . . 8.8%U.S. Government Obligations . . . . . . . . . . . . . . . . . . 7.0%Health Care . . . . . . . . . . . . . . . . . . . . . . . . . . . . . . . . . 6.3%Equipment and Supplies . . . . . . . . . . . . . . . . . . . . . . 5.4%Computer Software and Services . . . . . . . . . . . . . . . 5.2%Business Services . . . . . . . . . . . . . . . . . . . . . . . . . . . . 4.7%Diversified Industrial . . . . . . . . . . . . . . . . . . . . . . . . . 3.4%Retail . . . . . . . . . . . . . . . . . . . . . . . . . . . . . . . . . . . . . . . 2.8%Machinery . . . . . . . . . . . . . . . . . . . . . . . . . . . . . . . . . . 2.8%Aerospace . . . . . . . . . . . . . . . . . . . . . . . . . . . . . . . . . . . 2.6%Metals and Mining . . . . . . . . . . . . . . . . . . . . . . . . . . . 2.2%Computer Hardware . . . . . . . . . . . . . . . . . . . . . . . . . 1.7%Specialty Chemicals . . . . . . . . . . . . . . . . . . . . . . . . . . 1.6%Automotive . . . . . . . . . . . . . . . . . . . . . . . . . . . . . . . . . 1.5%Building and Construction . . . . . . . . . . . . . . . . . . . . 1.4%Telecommunications . . . . . . . . . . . . . . . . . . . . . . . . . . 1.2%
Consumer Products . . . . . . . . . . . . . . . . . . . . . . . . . . 1.2%Commercial Services . . . . . . . . . . . . . . . . . . . . . . . . . 0.9%IT Services . . . . . . . . . . . . . . . . . . . . . . . . . . . . . . . . . . 0.7%Publishing . . . . . . . . . . . . . . . . . . . . . . . . . . . . . . . . . . 0.6%Communications Equipment . . . . . . . . . . . . . . . . . . 0.6%Entertainment . . . . . . . . . . . . . . . . . . . . . . . . . . . . . . . 0.5%Food Products . . . . . . . . . . . . . . . . . . . . . . . . . . . . . . . 0.5%Automotive: Parts and Accessories . . . . . . . . . . . . . 0.5%Aviation: Parts and Services . . . . . . . . . . . . . . . . . . . 0.3%Health Care Providers and Services . . . . . . . . . . . . 0.3%Food and Beverage . . . . . . . . . . . . . . . . . . . . . . . . . . . 0.2%Restaurants . . . . . . . . . . . . . . . . . . . . . . . . . . . . . . . . . 0.2%Transportation . . . . . . . . . . . . . . . . . . . . . . . . . . . . . . . 0.1%Consumer Services . . . . . . . . . . . . . . . . . . . . . . . . . . . 0.1%Real Estate . . . . . . . . . . . . . . . . . . . . . . . . . . . . . . . . . . 0.1%Other Assets and Liabilities (Net) . . . . . . . . . . . . . . (1.7)%————
100.0%————————
GAMCOWestwood SmallCap Equity Fund
Financial Services . . . . . . . . . . . . . . . . . . . . . . . . . . . . 18.8%Food and Beverage . . . . . . . . . . . . . . . . . . . . . . . . . . . 13.4%Health Care . . . . . . . . . . . . . . . . . . . . . . . . . . . . . . . . . 9.6%Energy and Utilities: Oil . . . . . . . . . . . . . . . . . . . . . . 8.4%Energy and Utilities: Services . . . . . . . . . . . . . . . . . . 6.9%Specialty Chemicals . . . . . . . . . . . . . . . . . . . . . . . . . . 5.8%Diversified Industrial . . . . . . . . . . . . . . . . . . . . . . . . . 4.5%Telecommunications . . . . . . . . . . . . . . . . . . . . . . . . . . 4.4%Computer Hardware . . . . . . . . . . . . . . . . . . . . . . . . . 3.8%Banking . . . . . . . . . . . . . . . . . . . . . . . . . . . . . . . . . . . . . 3.6%Energy and Utilities: Water . . . . . . . . . . . . . . . . . . . . 3.4%
Energy and Utilities: Natural Gas . . . . . . . . . . . . . . 3.0%Electronics . . . . . . . . . . . . . . . . . . . . . . . . . . . . . . . . . . 3.0%Paper and Forest Products . . . . . . . . . . . . . . . . . . . . 2.8%Automotive . . . . . . . . . . . . . . . . . . . . . . . . . . . . . . . . . 2.3%Consumer Products . . . . . . . . . . . . . . . . . . . . . . . . . . 2.2%Retail . . . . . . . . . . . . . . . . . . . . . . . . . . . . . . . . . . . . . . . 1.4%Energy and Utilities: Integrated . . . . . . . . . . . . . . . . 0.9%Agriculture . . . . . . . . . . . . . . . . . . . . . . . . . . . . . . . . . . 0.7%Computer Software and Services . . . . . . . . . . . . . . . 0.5%Other Assets and Liabilities (Net) . . . . . . . . . . . . . . 0.6%————
100.0%————————
GAMCOWestwood Income Fund
U.S. Government Obligations . . . . . . . . . . . . . . . . . . 29.5%Health Care . . . . . . . . . . . . . . . . . . . . . . . . . . . . . . . . . 7.7%Diversified Industrial . . . . . . . . . . . . . . . . . . . . . . . . . 5.4%Electronics . . . . . . . . . . . . . . . . . . . . . . . . . . . . . . . . . . 5.3%Computer Software and Services . . . . . . . . . . . . . . . 4.7%Equipment and Supplies . . . . . . . . . . . . . . . . . . . . . . 4.5%Financial Services . . . . . . . . . . . . . . . . . . . . . . . . . . . . 3.7%Business Services . . . . . . . . . . . . . . . . . . . . . . . . . . . . 3.1%Automotive: Parts and Accessories . . . . . . . . . . . . . 3.0%Broadcasting . . . . . . . . . . . . . . . . . . . . . . . . . . . . . . . . 2.9%Consumer Products . . . . . . . . . . . . . . . . . . . . . . . . . . 2.9%Specialty Chemicals . . . . . . . . . . . . . . . . . . . . . . . . . . 2.5%Publishing . . . . . . . . . . . . . . . . . . . . . . . . . . . . . . . . . . 2.0%Food and Beverage . . . . . . . . . . . . . . . . . . . . . . . . . . . 2.0%Restaurants . . . . . . . . . . . . . . . . . . . . . . . . . . . . . . . . . 1.7%Machinery . . . . . . . . . . . . . . . . . . . . . . . . . . . . . . . . . . 1.7%Hotels and Gaming . . . . . . . . . . . . . . . . . . . . . . . . . . 1.6%Retail . . . . . . . . . . . . . . . . . . . . . . . . . . . . . . . . . . . . . . . 1.5%Aviation: Parts and Services . . . . . . . . . . . . . . . . . . . 1.3%Metals and Mining . . . . . . . . . . . . . . . . . . . . . . . . . . . 1.3%Commercial Services . . . . . . . . . . . . . . . . . . . . . . . . . 1.2%Educational Services . . . . . . . . . . . . . . . . . . . . . . . . . . 1.1%Energy and Utilities: Water . . . . . . . . . . . . . . . . . . . . 1.0%Energy and Utilities: Services . . . . . . . . . . . . . . . . . . 0.9%Real Estate . . . . . . . . . . . . . . . . . . . . . . . . . . . . . . . . . . 0.9%
Energy and Utilities: Natural Gas . . . . . . . . . . . . . . 0.8%Semiconductors . . . . . . . . . . . . . . . . . . . . . . . . . . . . . . 0.7%Telecommunications . . . . . . . . . . . . . . . . . . . . . . . . . . 0.6%Energy and Utilities: Oil . . . . . . . . . . . . . . . . . . . . . . 0.6%Building and Construction . . . . . . . . . . . . . . . . . . . . 0.5%Communications Equipment . . . . . . . . . . . . . . . . . . 0.4%Energy and Utilities: Integrated . . . . . . . . . . . . . . . . 0.4%Consumer Services . . . . . . . . . . . . . . . . . . . . . . . . . . . 0.4%Manufactured Housing and Recreational Vehicles 0.4%Entertainment . . . . . . . . . . . . . . . . . . . . . . . . . . . . . . . 0.4%Aerospace . . . . . . . . . . . . . . . . . . . . . . . . . . . . . . . . . . . 0.3%Environmental Control . . . . . . . . . . . . . . . . . . . . . . . 0.3%Transportation . . . . . . . . . . . . . . . . . . . . . . . . . . . . . . . 0.2%Automotive . . . . . . . . . . . . . . . . . . . . . . . . . . . . . . . . . 0.2%Agriculture . . . . . . . . . . . . . . . . . . . . . . . . . . . . . . . . . . 0.1%Energy and Utilities: Alternative Energy . . . . . . . . 0.1%Paper and Forest Products . . . . . . . . . . . . . . . . . . . . 0.1%Closed-end Business Development Company . . . . 0.1%Energy and Utilities: Electric . . . . . . . . . . . . . . . . . . . 0.1%Computer Hardware . . . . . . . . . . . . . . . . . . . . . . . . . 0.0%Cable . . . . . . . . . . . . . . . . . . . . . . . . . . . . . . . . . . . . . . . 0.0%Airlines . . . . . . . . . . . . . . . . . . . . . . . . . . . . . . . . . . . . . 0.0%Other Assets and Liabilities (Net) . . . . . . . . . . . . . . (0.1)%————
100.0%————————
GAMCOWestwood Mighty MitesSM Fund
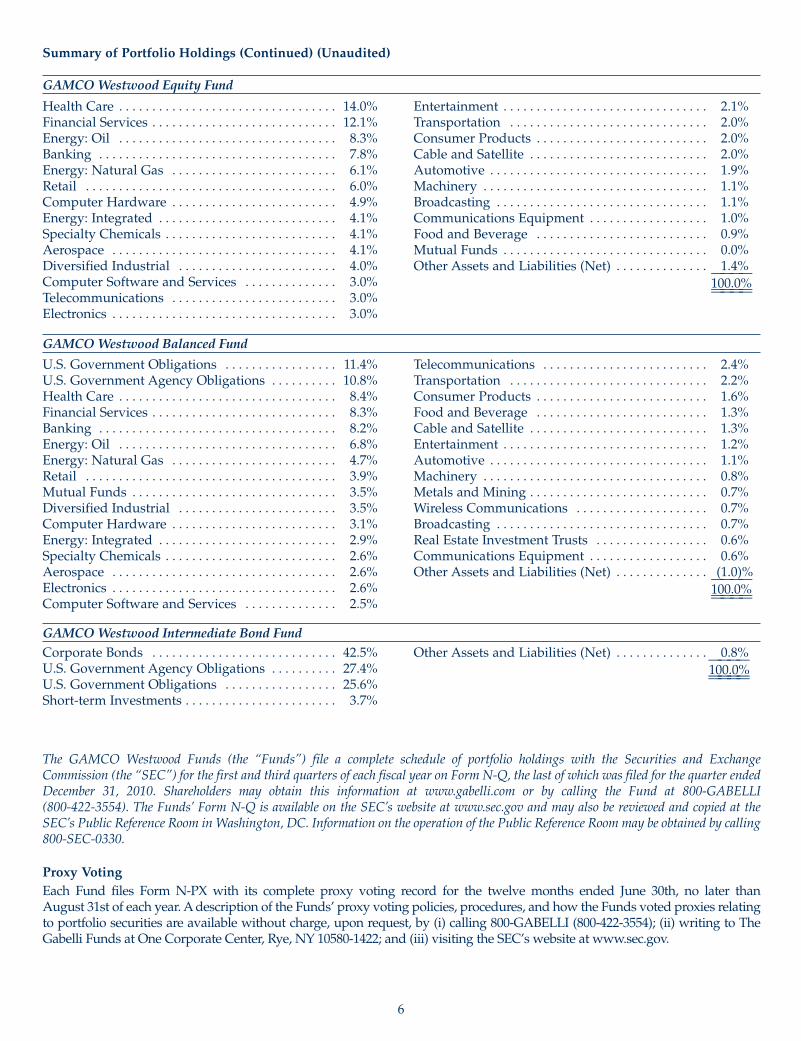
6
Health Care . . . . . . . . . . . . . . . . . . . . . . . . . . . . . . . . . 14.0%Financial Services . . . . . . . . . . . . . . . . . . . . . . . . . . . . 12.1%Energy: Oil . . . . . . . . . . . . . . . . . . . . . . . . . . . . . . . . . 8.3%Banking . . . . . . . . . . . . . . . . . . . . . . . . . . . . . . . . . . . . 7.8%Energy: Natural Gas . . . . . . . . . . . . . . . . . . . . . . . . . 6.1%Retail . . . . . . . . . . . . . . . . . . . . . . . . . . . . . . . . . . . . . . 6.0%Computer Hardware . . . . . . . . . . . . . . . . . . . . . . . . . 4.9%Energy: Integrated . . . . . . . . . . . . . . . . . . . . . . . . . . . 4.1%Specialty Chemicals . . . . . . . . . . . . . . . . . . . . . . . . . . 4.1%Aerospace . . . . . . . . . . . . . . . . . . . . . . . . . . . . . . . . . . 4.1%Diversified Industrial . . . . . . . . . . . . . . . . . . . . . . . . 4.0%Computer Software and Services . . . . . . . . . . . . . . 3.0%Telecommunications . . . . . . . . . . . . . . . . . . . . . . . . . 3.0%Electronics . . . . . . . . . . . . . . . . . . . . . . . . . . . . . . . . . . 3.0%
Entertainment . . . . . . . . . . . . . . . . . . . . . . . . . . . . . . . 2.1%Transportation . . . . . . . . . . . . . . . . . . . . . . . . . . . . . . 2.0%Consumer Products . . . . . . . . . . . . . . . . . . . . . . . . . . 2.0%Cable and Satellite . . . . . . . . . . . . . . . . . . . . . . . . . . . 2.0%Automotive . . . . . . . . . . . . . . . . . . . . . . . . . . . . . . . . . 1.9%Machinery . . . . . . . . . . . . . . . . . . . . . . . . . . . . . . . . . . 1.1%Broadcasting . . . . . . . . . . . . . . . . . . . . . . . . . . . . . . . . 1.1%Communications Equipment . . . . . . . . . . . . . . . . . . 1.0%Food and Beverage . . . . . . . . . . . . . . . . . . . . . . . . . . 0.9%Mutual Funds . . . . . . . . . . . . . . . . . . . . . . . . . . . . . . . 0.0%Other Assets and Liabilities (Net) . . . . . . . . . . . . . . 1.4%————
100.0%————————
GAMCOWestwood Equity Fund
U.S. Government Obligations . . . . . . . . . . . . . . . . . 11.4%U.S. Government Agency Obligations . . . . . . . . . . 10.8%Health Care . . . . . . . . . . . . . . . . . . . . . . . . . . . . . . . . . 8.4%Financial Services . . . . . . . . . . . . . . . . . . . . . . . . . . . . 8.3%Banking . . . . . . . . . . . . . . . . . . . . . . . . . . . . . . . . . . . . 8.2%Energy: Oil . . . . . . . . . . . . . . . . . . . . . . . . . . . . . . . . . 6.8%Energy: Natural Gas . . . . . . . . . . . . . . . . . . . . . . . . . 4.7%Retail . . . . . . . . . . . . . . . . . . . . . . . . . . . . . . . . . . . . . . 3.9%Mutual Funds . . . . . . . . . . . . . . . . . . . . . . . . . . . . . . . 3.5%Diversified Industrial . . . . . . . . . . . . . . . . . . . . . . . . 3.5%Computer Hardware . . . . . . . . . . . . . . . . . . . . . . . . . 3.1%Energy: Integrated . . . . . . . . . . . . . . . . . . . . . . . . . . . 2.9%Specialty Chemicals . . . . . . . . . . . . . . . . . . . . . . . . . . 2.6%Aerospace . . . . . . . . . . . . . . . . . . . . . . . . . . . . . . . . . . 2.6%Electronics . . . . . . . . . . . . . . . . . . . . . . . . . . . . . . . . . . 2.6%Computer Software and Services . . . . . . . . . . . . . . 2.5%
Telecommunications . . . . . . . . . . . . . . . . . . . . . . . . . 2.4%Transportation . . . . . . . . . . . . . . . . . . . . . . . . . . . . . . 2.2%Consumer Products . . . . . . . . . . . . . . . . . . . . . . . . . . 1.6%Food and Beverage . . . . . . . . . . . . . . . . . . . . . . . . . . 1.3%Cable and Satellite . . . . . . . . . . . . . . . . . . . . . . . . . . . 1.3%Entertainment . . . . . . . . . . . . . . . . . . . . . . . . . . . . . . . 1.2%Automotive . . . . . . . . . . . . . . . . . . . . . . . . . . . . . . . . . 1.1%Machinery . . . . . . . . . . . . . . . . . . . . . . . . . . . . . . . . . . 0.8%Metals and Mining . . . . . . . . . . . . . . . . . . . . . . . . . . . 0.7%Wireless Communications . . . . . . . . . . . . . . . . . . . . 0.7%Broadcasting . . . . . . . . . . . . . . . . . . . . . . . . . . . . . . . . 0.7%Real Estate Investment Trusts . . . . . . . . . . . . . . . . . 0.6%Communications Equipment . . . . . . . . . . . . . . . . . . 0.6%Other Assets and Liabilities (Net) . . . . . . . . . . . . . . (1.0)%————
100.0%————————
GAMCOWestwood Balanced Fund
Corporate Bonds . . . . . . . . . . . . . . . . . . . . . . . . . . . . 42.5%U.S. Government Agency Obligations . . . . . . . . . . 27.4%U.S. Government Obligations . . . . . . . . . . . . . . . . . 25.6%Short-term Investments . . . . . . . . . . . . . . . . . . . . . . . 3.7%
Other Assets and Liabilities (Net) . . . . . . . . . . . . . . 0.8%————100.0%————————
GAMCOWestwood Intermediate Bond Fund
The GAMCO Westwood Funds (the “Funds”) file a complete schedule of portfolio holdings with the Securities and ExchangeCommission (the “SEC”) for the first and third quarters of each fiscal year on Form N-Q, the last of which was filed for the quarter endedDecember 31, 2010. Shareholders may obtain this information at www.gabelli.com or by calling the Fund at 800-GABELLI(800-422-3554). The Funds’ Form N-Q is available on the SEC’s website at www.sec.gov and may also be reviewed and copied at theSEC’s Public Reference Room in Washington, DC. Information on the operation of the Public Reference Room may be obtained by calling800-SEC-0330.
Proxy VotingEach Fund files Form N-PX with its complete proxy voting record for the twelve months ended June 30th, no later thanAugust 31st of each year.Adescription of the Funds’ proxy voting policies, procedures, and how the Funds voted proxies relatingto portfolio securities are available without charge, upon request, by (i) calling 800-GABELLI (800-422-3554); (ii) writing to TheGabelli Funds at One Corporate Center, Rye, NY 10580-1422; and (iii) visiting the SEC’s website at www.sec.gov.
Summary of Portfolio Holdings (Continued) (Unaudited)
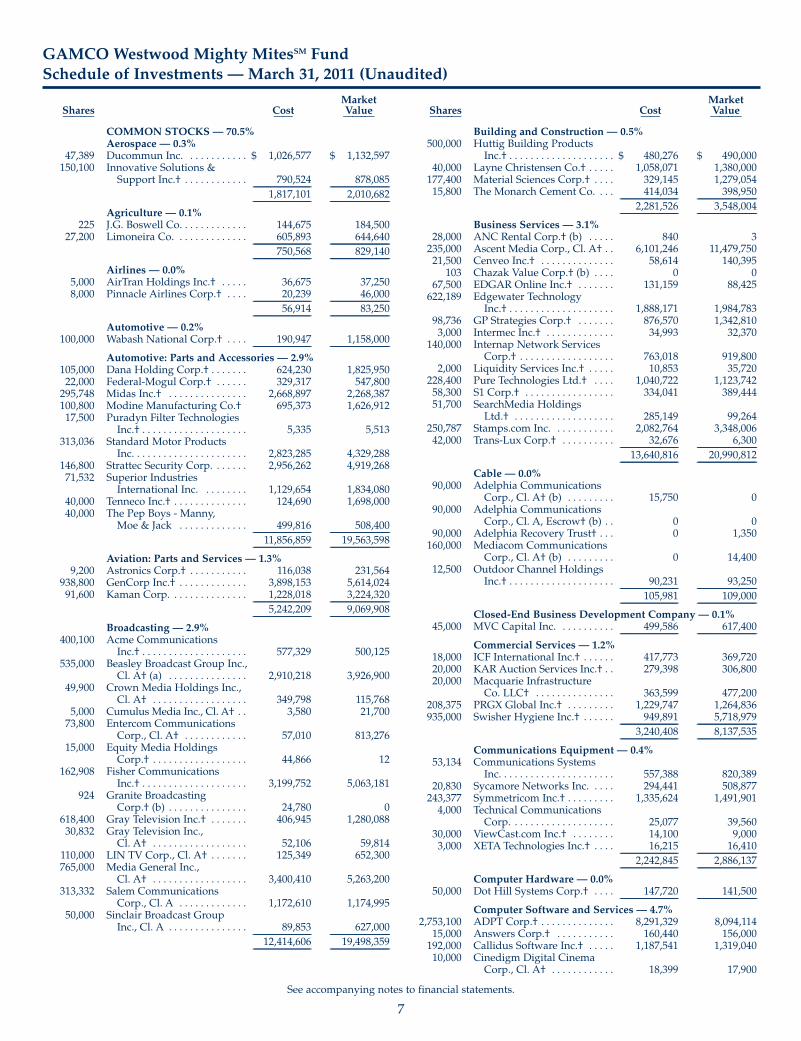
7
See accompanying notes to financial statements.
GAMCO Westwood Mighty MitesSM FundSchedule of Investments — March 31, 2011 (Unaudited)
MarketShares Cost Value——–— —— ——–—
MarketShares Cost Value——–— —— ——–—
COMMON STOCKS — 70.5%Aerospace — 0.3%
47,389 Ducommun Inc. . . . . . . . . . . . $ 1,026,577 $ 1,132,597150,100 Innovative Solutions &
Support Inc.† . . . . . . . . . . . . 790,524 878,085----------------------------------------- ------------------------------------------
1,817,101 2,010,682----------------------------------------- ------------------------------------------
Agriculture — 0.1%225 J.G. Boswell Co. . . . . . . . . . . . . 144,675 184,500
27,200 Limoneira Co. . . . . . . . . . . . . . 605,893 644,640----------------------------------------- ------------------------------------------
750,568 829,140----------------------------------------- ------------------------------------------
Airlines — 0.0%5,000 AirTran Holdings Inc.† . . . . . 36,675 37,2508,000 Pinnacle Airlines Corp.† . . . . 20,239 46,000
----------------------------------------- ------------------------------------------56,914 83,250
----------------------------------------- ------------------------------------------Automotive — 0.2%
100,000 Wabash National Corp.† . . . . 190,947 1,158,000----------------------------------------- ------------------------------------------
Automotive: Parts and Accessories — 2.9%105,000 Dana Holding Corp.† . . . . . . . 624,230 1,825,95022,000 Federal-Mogul Corp.† . . . . . . 329,317 547,800295,748 Midas Inc.† . . . . . . . . . . . . . . . 2,668,897 2,268,387100,800 Modine Manufacturing Co.† 695,373 1,626,91217,500 Puradyn Filter Technologies
Inc.† . . . . . . . . . . . . . . . . . . . . 5,335 5,513313,036 Standard Motor Products
Inc. . . . . . . . . . . . . . . . . . . . . . 2,823,285 4,329,288146,800 Strattec Security Corp. . . . . . . 2,956,262 4,919,26871,532 Superior Industries
International Inc. . . . . . . . . 1,129,654 1,834,08040,000 Tenneco Inc.† . . . . . . . . . . . . . . 124,690 1,698,00040,000 The Pep Boys - Manny,
Moe & Jack . . . . . . . . . . . . . 499,816 508,400----------------------------------------- ------------------------------------------11,856,859 19,563,598
----------------------------------------- ------------------------------------------Aviation: Parts and Services — 1.3%
9,200 Astronics Corp.† . . . . . . . . . . . 116,038 231,564938,800 GenCorp Inc.† . . . . . . . . . . . . . 3,898,153 5,614,02491,600 Kaman Corp. . . . . . . . . . . . . . . 1,228,018 3,224,320
----------------------------------------- ------------------------------------------5,242,209 9,069,908
----------------------------------------- ------------------------------------------Broadcasting — 2.9%
400,100 Acme CommunicationsInc.† . . . . . . . . . . . . . . . . . . . . 577,329 500,125
535,000 Beasley Broadcast Group Inc.,Cl. A† (a) . . . . . . . . . . . . . . . 2,910,218 3,926,900
49,900 Crown Media Holdings Inc.,Cl. A† . . . . . . . . . . . . . . . . . . 349,798 115,768
5,000 Cumulus Media Inc., Cl. A† . . 3,580 21,70073,800 Entercom Communications
Corp., Cl. A† . . . . . . . . . . . . 57,010 813,27615,000 Equity Media Holdings
Corp.† . . . . . . . . . . . . . . . . . . 44,866 12162,908 Fisher Communications
Inc.† . . . . . . . . . . . . . . . . . . . . 3,199,752 5,063,181924 Granite Broadcasting
Corp.† (b) . . . . . . . . . . . . . . . 24,780 0618,400 Gray Television Inc.† . . . . . . . 406,945 1,280,08830,832 Gray Television Inc.,
Cl. A† . . . . . . . . . . . . . . . . . . 52,106 59,814110,000 LIN TV Corp., Cl. A† . . . . . . . 125,349 652,300765,000 Media General Inc.,
Cl. A† . . . . . . . . . . . . . . . . . . 3,400,410 5,263,200313,332 Salem Communications
Corp., Cl. A . . . . . . . . . . . . . 1,172,610 1,174,99550,000 Sinclair Broadcast Group
Inc., Cl. A . . . . . . . . . . . . . . . 89,853 627,000----------------------------------------- ------------------------------------------12,414,606 19,498,359
----------------------------------------- ------------------------------------------
Building and Construction — 0.5%500,000 Huttig Building Products
Inc.† . . . . . . . . . . . . . . . . . . . . $ 480,276 $ 490,00040,000 Layne Christensen Co.† . . . . . 1,058,071 1,380,000177,400 Material Sciences Corp.† . . . . 329,145 1,279,05415,800 The Monarch Cement Co. . . . 414,034 398,950
----------------------------------------- ------------------------------------------2,281,526 3,548,004
----------------------------------------- ------------------------------------------Business Services — 3.1%
28,000 ANC Rental Corp.† (b) . . . . . 840 3235,000 Ascent Media Corp., Cl. A† . . 6,101,246 11,479,75021,500 Cenveo Inc.† . . . . . . . . . . . . . . 58,614 140,395
103 Chazak Value Corp.† (b) . . . . 0 067,500 EDGAR Online Inc.† . . . . . . . 131,159 88,425622,189 Edgewater Technology
Inc.† . . . . . . . . . . . . . . . . . . . . 1,888,171 1,984,78398,736 GP Strategies Corp.† . . . . . . . 876,570 1,342,8103,000 Intermec Inc.† . . . . . . . . . . . . . 34,993 32,370
140,000 Internap Network ServicesCorp.† . . . . . . . . . . . . . . . . . . 763,018 919,800
2,000 Liquidity Services Inc.† . . . . . 10,853 35,720228,400 Pure Technologies Ltd.† . . . . 1,040,722 1,123,74258,300 S1 Corp.† . . . . . . . . . . . . . . . . . 334,041 389,44451,700 SearchMedia Holdings
Ltd.† . . . . . . . . . . . . . . . . . . . 285,149 99,264250,787 Stamps.com Inc. . . . . . . . . . . . 2,082,764 3,348,00642,000 Trans-Lux Corp.† . . . . . . . . . . 32,676 6,300
----------------------------------------- ------------------------------------------13,640,816 20,990,812
----------------------------------------- ------------------------------------------Cable — 0.0%
90,000 Adelphia CommunicationsCorp., Cl. A† (b) . . . . . . . . . 15,750 0
90,000 Adelphia CommunicationsCorp., Cl. A, Escrow† (b) . . 0 0
90,000 Adelphia Recovery Trust† . . . 0 1,350160,000 Mediacom Communications
Corp., Cl. A† (b) . . . . . . . . . 0 14,40012,500 Outdoor Channel Holdings
Inc.† . . . . . . . . . . . . . . . . . . . . 90,231 93,250----------------------------------------- ------------------------------------------
105,981 109,000----------------------------------------- ------------------------------------------
Closed-End Business Development Company — 0.1%45,000 MVC Capital Inc. . . . . . . . . . . 499,586 617,400
----------------------------------------- ------------------------------------------Commercial Services — 1.2%
18,000 ICF International Inc.† . . . . . . 417,773 369,72020,000 KAR Auction Services Inc.† . . 279,398 306,80020,000 Macquarie Infrastructure
Co. LLC† . . . . . . . . . . . . . . . 363,599 477,200208,375 PRGX Global Inc.† . . . . . . . . . 1,229,747 1,264,836935,000 Swisher Hygiene Inc.† . . . . . . 949,891 5,718,979
----------------------------------------- ------------------------------------------3,240,408 8,137,535
----------------------------------------- ------------------------------------------Communications Equipment — 0.4%
53,134 Communications SystemsInc. . . . . . . . . . . . . . . . . . . . . . 557,388 820,389
20,830 Sycamore Networks Inc. . . . . 294,441 508,877243,377 Symmetricom Inc.† . . . . . . . . . 1,335,624 1,491,9014,000 Technical Communications
Corp. . . . . . . . . . . . . . . . . . . . 25,077 39,56030,000 ViewCast.com Inc.† . . . . . . . . 14,100 9,0003,000 XETA Technologies Inc.† . . . . 16,215 16,410
----------------------------------------- ------------------------------------------2,242,845 2,886,137
----------------------------------------- ------------------------------------------Computer Hardware — 0.0%
50,000 Dot Hill Systems Corp.† . . . . 147,720 141,500----------------------------------------- ------------------------------------------
Computer Software and Services — 4.7%2,753,100 ADPT Corp.† . . . . . . . . . . . . . . 8,291,329 8,094,114
15,000 Answers Corp.† . . . . . . . . . . . 160,440 156,000192,000 Callidus Software Inc.† . . . . . 1,187,541 1,319,04010,000 Cinedigm Digital Cinema
Corp., Cl. A† . . . . . . . . . . . . 18,399 17,900

8
See accompanying notes to financial statements.
GAMCO Westwood Mighty MitesSM FundSchedule of Investments (Continued) — March 31, 2011 (Unaudited)
MarketShares Cost Value——–— —— ——–—
MarketShares Cost Value——–— —— ——–—
COMMON STOCKS (Continued)Computer Software and Services (Continued)
87,938 Computer Task GroupInc.† . . . . . . . . . . . . . . . . . . . . $ 766,258 $ 1,168,696
6,000 Emulex Corp.† . . . . . . . . . . . . 67,834 64,020600,000 FalconStor Software Inc.† . . . 2,232,151 2,730,000351,100 Furmanite Corp.† . . . . . . . . . . 2,025,658 2,808,8001,910 Gemalto NV . . . . . . . . . . . . . . . 10,942 93,941
310,208 Global Sources Ltd.† . . . . . . . 2,228,018 3,607,71945,300 GSE Systems Inc.† . . . . . . . . . 245,965 102,378235,000 Harris Interactive Inc.† . . . . . 276,114 231,71075,600 interCLICK Inc.† . . . . . . . . . . . 373,621 532,98091,129 Kratos Defense & Security
Solutions Inc.† . . . . . . . . . . . 1,124,602 1,297,677250,000 L-1 Identity Solutions
Inc.† . . . . . . . . . . . . . . . . . . . . 2,933,660 2,945,0003,000 Lawson Software Inc.† . . . . . . 36,585 36,300
332,394 Lionbridge TechnologiesInc.† . . . . . . . . . . . . . . . . . . . . 1,213,805 1,140,111
4,100 Magma Design AutomationInc.† . . . . . . . . . . . . . . . . . . . . 11,864 27,962
92,700 Mercury Computer SystemsInc.† . . . . . . . . . . . . . . . . . . . . 1,294,258 1,961,532
400 MTS Systems Corp. . . . . . . . . 10,336 18,220239,500 NaviSite Inc.† . . . . . . . . . . . . . 1,307,072 1,314,85537,700 Schawk Inc. . . . . . . . . . . . . . . . 613,292 732,888154,831 Tier Technologies Inc.† . . . . . 878,492 851,57110,000 Trident Microsystems Inc.† . . 19,494 11,5003,800 Tyler Technologies Inc.† . . . . 39,378 90,098
----------------------------------------- ------------------------------------------27,367,108 31,355,012
----------------------------------------- ------------------------------------------Consumer Products — 2.9%
134,670 A. T. Cross Co., Cl. A† . . . . . . 1,347,357 1,435,58218,000 Adams Golf Inc.† . . . . . . . . . . 122,578 98,10029,000 Callaway Golf Co. . . . . . . . . . 191,165 197,78057,000 Heelys Inc.† . . . . . . . . . . . . . . . 214,205 131,1004,300 Johnson Outdoors Inc.,
Cl. A† . . . . . . . . . . . . . . . . . . 33,657 65,317128,000 Kid Brands Inc.† . . . . . . . . . . . 1,163,466 940,80015,300 Lakeland Industries Inc.† . . . 147,120 136,476453,723 Marine Products Corp.† . . . . 2,857,504 3,598,02312,500 MarineMax Inc.† . . . . . . . . . . . 51,551 123,250
300 National Presto IndustriesInc. . . . . . . . . . . . . . . . . . . . . . 8,618 33,804
79,090 Oil-Dri Corp. of America . . . . 1,281,456 1,684,61722,550 PC Group Inc.† . . . . . . . . . . . . 36,025 4,11530,000 RC2 Corp.† . . . . . . . . . . . . . . . 845,113 843,000823,240 Schiff Nutrition International
Inc. . . . . . . . . . . . . . . . . . . . . . 5,691,570 7,499,71658,400 Steinway Musical
Instruments Inc.† . . . . . . . . 1,096,857 1,297,06441,530 Syratech Corp.† . . . . . . . . . . . . 10,383 1,053291,800 The Wet Seal Inc., Cl. A† . . . . 1,105,394 1,248,904
----------------------------------------- ------------------------------------------16,204,019 19,338,701
----------------------------------------- ------------------------------------------Consumer Services — 0.4%
440,500 1-800-FLOWERS.COM Inc.,Cl. A† . . . . . . . . . . . . . . . . . . 1,246,021 1,453,650
33,800 Bowlin Travel CentersInc.† . . . . . . . . . . . . . . . . . . . . 41,186 55,770
1,100 Collectors Universe Inc. . . . . . 2,704 15,587120,000 Stewart Enterprises Inc.,
Cl. A . . . . . . . . . . . . . . . . . . . 701,161 916,8003,500 Valassis Communications
Inc.† . . . . . . . . . . . . . . . . . . . . 4,639 101,990----------------------------------------- ------------------------------------------
1,995,711 2,543,797----------------------------------------- ------------------------------------------
Diversified Industrial — 5.4%44,200 American Railcar Industries
Inc.† . . . . . . . . . . . . . . . . . . . . 571,194 1,103,232195,391 Ampco-Pittsburgh Corp. . . . . 4,880,878 5,388,884
78,600 Burnham Holdings Inc.,Cl. A . . . . . . . . . . . . . . . . . . . $ 1,136,739 $ 1,204,545
119,397 Chase Corp. . . . . . . . . . . . . . . . 1,668,037 2,204,069120,720 China Wind Systems Inc.† . . 536,358 394,75447,800 Graham Corp. . . . . . . . . . . . . . 673,691 1,144,332336,403 Griffon Corp.† . . . . . . . . . . . . . 3,708,690 4,416,971376,800 Handy & Harman Ltd.† . . . . 2,201,555 4,529,13625,000 Haulotte Group SA† . . . . . . . 134,090 508,418193,300 Katy Industries Inc.† . . . . . . . 452,241 110,18120,000 Lydall Inc.† . . . . . . . . . . . . . . . 144,517 177,800552,557 Magnetek Inc.† . . . . . . . . . . . . 1,102,168 1,215,625287,900 Myers Industries Inc. . . . . . . . 2,599,918 2,858,847408,525 National Patent
Development Corp.† . . . . . 639,996 620,95851,500 Park-Ohio Holdings Corp.† . . 762,087 1,063,99013,700 RWC Inc.† . . . . . . . . . . . . . . . . 238,058 126,72525,100 Stamford Industrial Group
Inc.† . . . . . . . . . . . . . . . . . . . . 92,108 4855,000 Standex International Corp. . . 1,650,136 2,083,950280,800 Tech/Ops Sevcon Inc.† (a) . . 1,358,390 1,585,11646,083 Tredegar Corp. . . . . . . . . . . . . 895,767 994,471106,568 Twin Disc Inc. . . . . . . . . . . . . . 1,320,116 3,433,62177,207 Vishay Precision Group
Inc.† . . . . . . . . . . . . . . . . . . . . 1,315,682 1,209,834----------------------------------------- ------------------------------------------28,082,416 36,375,507
----------------------------------------- ------------------------------------------Educational Services — 1.1%
325,000 Corinthian Colleges Inc.† . . . 1,839,563 1,436,500301,519 Universal Technical Institute
Inc. . . . . . . . . . . . . . . . . . . . . . 5,614,605 5,864,545108,500 Voyager Learning Co.,
Escrow† (b) . . . . . . . . . . . . . 0 0----------------------------------------- ------------------------------------------
7,454,168 7,301,045----------------------------------------- ------------------------------------------
Electronics — 5.3%27,000 A123 Systems Inc.† . . . . . . . . . 353,170 171,45050,000 Alliance Semiconductor
Corp. . . . . . . . . . . . . . . . . . . . 156,408 15,50045,451 Ballantyne Strong Inc.† . . . . . 205,439 325,884100,300 Bel Fuse Inc., Cl. A . . . . . . . . . 1,870,022 2,406,1971,800 Bel Fuse Inc., Cl. B . . . . . . . . . 36,012 39,61873,950 BTU International Inc.† . . . . . 296,355 813,450264,500 CTS Corp. . . . . . . . . . . . . . . . . . 1,997,985 2,856,60026,867 Dialight plc . . . . . . . . . . . . . . . 293,760 321,09778,149 Electro Scientific Industries
Inc.† . . . . . . . . . . . . . . . . . . . . 984,884 1,356,66749,300 IMAX Corp.† . . . . . . . . . . . . . . 199,628 1,576,614169,500 IntriCon Corp.† . . . . . . . . . . . . 664,727 671,220216,700 LeCroy Corp.† . . . . . . . . . . . . . 755,533 2,897,27951,500 Mesa Laboratories Inc. . . . . . . 1,278,929 1,543,97075,000 Methode Electronics Inc. . . . . 384,225 906,00069,500 MoSys Inc.† . . . . . . . . . . . . . . . 130,660 417,69563,800 Newport Corp.† . . . . . . . . . . . 399,295 1,137,55451,300 Park Electrochemical Corp. . . 1,098,915 1,654,42570,000 Pericom Semiconductor
Corp.† . . . . . . . . . . . . . . . . . . 699,279 725,900502,300 Pulse Electronics Corp. . . . . . 2,429,665 3,038,91575,600 Schmitt Industries Inc.† . . . . . 203,516 313,740208,300 Stoneridge Inc.† . . . . . . . . . . . 910,658 3,045,346134,900 Ultra Clean Holdings Inc.† . . 287,575 1,394,866185,150 Ultralife Corp.† . . . . . . . . . . . . 1,072,722 936,85982,900 Ultratech Inc.† . . . . . . . . . . . . . 1,353,070 2,437,2602,500 Universal Display Corp.† . . . 70,448 137,600
116,400 Zoran Corp.† . . . . . . . . . . . . . . 847,383 1,209,396204,000 Zygo Corp.† . . . . . . . . . . . . . . . 1,594,969 2,982,480
----------------------------------------- ------------------------------------------20,575,232 35,333,582
----------------------------------------- ------------------------------------------Energy and Utilities: Alternative Energy — 0.1%
89,590 China Hydroelectric Corp.,ADR† . . . . . . . . . . . . . . . . . . 536,631 650,423
----------------------------------------- ------------------------------------------

9
See accompanying notes to financial statements.
GAMCO Westwood Mighty MitesSM FundSchedule of Investments (Continued) — March 31, 2011 (Unaudited)
COMMON STOCKS (Continued)Energy and Utilities: Electric — 0.1%
105,080 Comverge Inc.† . . . . . . . . . . . . $ 831,654 $ 489,673----------------------------------------- ------------------------------------------
Energy and Utilities: Integrated — 0.4%229,600 Headwaters Inc.† . . . . . . . . . . 901,950 1,354,64030,500 MGE Energy Inc. . . . . . . . . . . 1,062,659 1,234,94595,200 Progress Energy Inc.,
CVO† . . . . . . . . . . . . . . . . . . 10,472 13,804----------------------------------------- ------------------------------------------
1,975,081 2,603,389----------------------------------------- ------------------------------------------
Energy and Utilities: Natural Gas — 0.8%15,242 American DG Energy Inc.† . . 45,802 33,22835,500 Chesapeake Utilities Corp. . . 969,521 1,477,51053,671 Corning Natural Gas Corp. . . 857,412 1,281,66335,000 Delta Natural Gas Co. Inc. . . 957,694 1,103,55095,800 Gastar Exploration Ltd.† . . . . 406,048 465,58817,700 RGC Resources Inc. . . . . . . . . 401,299 607,11020,300 U.S. Energy Corp.† . . . . . . . . . 85,659 127,078
----------------------------------------- ------------------------------------------3,723,435 5,095,727
----------------------------------------- ------------------------------------------Energy and Utilities: Oil — 0.6%
46,400 Bronco Drilling Co. Inc.† . . . . 405,575 524,32040,700 Callon Petroleum Co.† . . . . . . 287,403 316,23939,500 Gulf Island Fabrication
Inc. . . . . . . . . . . . . . . . . . . . . . 1,016,935 1,270,71573,000 RAM Energy Resources
Inc.† . . . . . . . . . . . . . . . . . . . . 137,638 151,84063,600 Tesco Corp.† . . . . . . . . . . . . . . 543,737 1,396,02055,000 Triangle Petroleum Corp.† . . 346,997 456,500
----------------------------------------- ------------------------------------------2,738,285 4,115,634
----------------------------------------- ------------------------------------------Energy and Utilities: Services — 0.9%
800 Covanta Holding Corp. . . . . . 13,498 13,66487,848 Dawson Geophysical Co.† . . 2,513,852 3,854,77060,000 RPC Inc. . . . . . . . . . . . . . . . . . . 173,633 1,519,20067,620 Seawell Ltd.† . . . . . . . . . . . . . . 256,348 467,0839,500 Subsea 7 SA, ADR . . . . . . . . . 32,064 240,16010,000 TGC Industries Inc.† . . . . . . . 77,992 77,700
700 Union Drilling Inc.† . . . . . . . . 4,515 7,175----------------------------------------- ------------------------------------------
3,071,902 6,179,752----------------------------------------- ------------------------------------------
Energy and Utilities: Water — 1.0%6,000 Artesian Resources Corp.,
Cl. A . . . . . . . . . . . . . . . . . . . 73,323 116,94042,174 Cadiz Inc.† . . . . . . . . . . . . . . . . 513,311 514,1012,500 California Water Service
Group . . . . . . . . . . . . . . . . . . 55,553 92,92540,000 Consolidated Water Co.
Ltd. . . . . . . . . . . . . . . . . . . . . 450,805 436,00035,000 Energy Recovery Inc.† . . . . . . 210,777 111,3008,500 Middlesex Water Co. . . . . . . . 137,355 154,61582,200 Pennichuck Corp. . . . . . . . . . . 1,769,062 2,341,87899,300 SJW Corp. . . . . . . . . . . . . . . . . 2,338,311 2,298,79528,500 The York Water Co. . . . . . . . . 398,710 496,185
----------------------------------------- ------------------------------------------5,947,207 6,562,739
----------------------------------------- ------------------------------------------Entertainment — 0.4%
31,100 Canterbury Park HoldingCorp.† . . . . . . . . . . . . . . . . . . 310,005 376,932
1,802 Chestnut Hill Ventures† (b) . . 67,956 82,092237,500 Dover Motorsports Inc.† . . . . 495,954 475,000531,441 Entravision Communications
Corp., Cl. A† . . . . . . . . . . . . 1,276,874 1,440,2051,500 LodgeNet Interactive
Corp.† . . . . . . . . . . . . . . . . . . 4,488 5,46060,000 Triple Crown Media Inc.† . . . 16,280 180
----------------------------------------- ------------------------------------------2,171,557 2,379,869
----------------------------------------- ------------------------------------------Environmental Control — 0.3%
10,000 BioteQ EnvironmentalTechnologies Inc.† . . . . . . . 16,559 7,427
274,000 Casella Waste Systems Inc.,Cl. A† . . . . . . . . . . . . . . . . . . $ 1,371,004 $ 1,964,580
300 Sharps Compliance Corp.† . . 759 1,416----------------------------------------- ------------------------------------------
1,388,322 1,973,423----------------------------------------- ------------------------------------------
Equipment and Supplies — 4.5%1,000 AZZ Inc. . . . . . . . . . . . . . . . . . . 34,894 45,600
177,500 Baldwin Technology Co. Inc.,Cl. A† . . . . . . . . . . . . . . . . . . 357,962 285,775
271,500 Capstone Turbine Corp.† . . . 436,300 491,41558,500 CIRCOR International Inc. . . 1,747,317 2,750,670278,549 Core Molding Technologies
Inc.† . . . . . . . . . . . . . . . . . . . . 904,951 2,116,972225,000 Federal Signal Corp. . . . . . . . . 1,494,046 1,464,750
700 Genoil Inc.† . . . . . . . . . . . . . . . 158 134299,600 Gerber Scientific Inc.† . . . . . . 1,516,601 2,804,2568,500 Gildemeister AG . . . . . . . . . . . 61,536 192,1368,000 GrafTech International
Ltd.† . . . . . . . . . . . . . . . . . . . 49,988 165,040564,600 Interpump Group SpA† . . . . 4,026,294 4,788,882158,313 L.S. Starrett Co., Cl. A . . . . . . 1,839,306 2,222,71520,000 Maezawa Kyuso Industries
Co. Ltd. . . . . . . . . . . . . . . . . . 108,117 279,39483,700 Met-Pro Corp. . . . . . . . . . . . . . 909,408 996,03011,800 Mine Safety Appliances
Co. . . . . . . . . . . . . . . . . . . . . . 367,269 432,706202,900 SL Industries Inc.† . . . . . . . . . 1,471,924 3,715,099
700 SRS Labs Inc.† . . . . . . . . . . . . . 3,850 5,97833,492 The Eastern Co. . . . . . . . . . . . . 483,875 640,36712,000 The Gorman-Rupp Co. . . . . . 359,951 472,68012,000 The Greenbrier Cos. Inc.† . . . 149,918 340,56036,379 Titan Machinery Inc.† . . . . . . 503,585 918,570266,000 TransAct Technologies
Inc.† . . . . . . . . . . . . . . . . . . . . 1,492,952 3,178,70055,500 Vicor Corp. . . . . . . . . . . . . . . . . 409,310 915,19526,000 WaterFurnace Renewable
Energy Inc. . . . . . . . . . . . . . . 521,940 653,285500 Watts Water Technologies
Inc., Cl. A . . . . . . . . . . . . . . . 7,648 19,095----------------------------------------- ------------------------------------------19,259,100 29,896,004
----------------------------------------- ------------------------------------------Financial Services — 3.7%
49,400 Anchor Bancorp.† . . . . . . . . . . 508,737 528,58016,100 Berkshire Bancorp Inc.† . . . . . 219,414 99,6593,900 Berkshire Hills Bancorp
Inc. . . . . . . . . . . . . . . . . . . . . . 78,058 81,31575 Burke & Herbert Bank
and Trust Co. . . . . . . . . . . . . 95,726 180,37540,000 Capital Financial Holdings
Inc.† . . . . . . . . . . . . . . . . . . . . 35,200 2,8006,791 Capitol Federal Financial
Inc. . . . . . . . . . . . . . . . . . . . . . 75,244 76,53438,000 CNA Surety Corp.† . . . . . . . . 827,734 959,88029,000 Crazy Woman Creek
Bancorp Inc.† . . . . . . . . . . . . 501,616 311,750413,000 Epoch Holding Corp. . . . . . . . 2,770,792 6,517,140
42 Farmers & Merchants Bankof Long Beach . . . . . . . . . . . 203,006 177,030
10,546 Fidelity Southern Corp.† . . . . 69,325 84,368172,600 Flushing Financial Corp. . . . . 2,414,747 2,571,740
10 Guaranty Corp., Cl. A† . . . . . 137,500 75,00064,649 Hallmark Financial Services† 580,440 541,7596,600 Hampden Bancorp Inc. . . . . . 75,984 87,6485,674 Hampton Roads
Bankshares Inc.† . . . . . . . . . 18,089 4,82339,900 Heritage Financial Group Inc. 414,190 507,92760,125 Hudson Valley Holding Corp. 1,248,867 1,322,75087,273 JMP Group Inc. . . . . . . . . . . . . 725,143 751,42030,000 Kaiser Federal Financial
Group Inc. . . . . . . . . . . . . . . 300,000 369,000
MarketShares Cost Value——–— —— ——–—
MarketShares Cost Value——–— —— ——–—

10
See accompanying notes to financial statements.
GAMCO Westwood Mighty MitesSM FundSchedule of Investments (Continued) — March 31, 2011 (Unaudited)
COMMON STOCKS (Continued)Financial Services (Continued)
90,843 KKR & Co. LP . . . . . . . . . . . . . $ 265,210 $ 1,490,73479,162 Meadowbrook Insurance
Group Inc. . . . . . . . . . . . . . . 709,881 819,32790,000 Medallion Financial Corp. . . . 695,704 791,10046,500 Nara Bancorp Inc.† . . . . . . . . . 400,243 447,33011,055 New York Community
Bancorp Inc. . . . . . . . . . . . . . 143,811 190,80928,500 Newport Bancorp Inc.† . . . . . 356,595 397,0055,697 Northrim BanCorp Inc. . . . . . 119,035 108,75640,000 Oritani Financial Corp. . . . . . 412,856 507,2008,300 Provident New York
Bancorp . . . . . . . . . . . . . . . . 105,316 85,65645,000 Pzena Investment
Management Inc., Cl. A . . . 203,004 317,70028,866 Sanders Morris Harris
Group Inc. . . . . . . . . . . . . . . 177,619 231,217116 Sunwest Bank† . . . . . . . . . . . . 322,722 319,290
82,456 SWS Group Inc. . . . . . . . . . . . . 871,686 500,5088,500 The Ziegler Companies
Inc.† . . . . . . . . . . . . . . . . . . . . 163,481 154,318250 TIB Financial Corp.† . . . . . . . 5,178 4,895
7,500 Tree.com Inc.† . . . . . . . . . . . . . 61,967 44,25036,600 Washington Trust Bancorp
Inc. . . . . . . . . . . . . . . . . . . . . . 819,774 868,88487,100 Westfield Financial Inc. . . . . . 746,912 789,12640,039 Whitney Holding Corp. . . . . . 207,806 545,33138,100 Wilshire Bancorp Inc.† . . . . . . 330,044 186,690100,000 WisdomTree Investments
Inc.† . . . . . . . . . . . . . . . . . . . . 402,626 568,00030,000 Xenith Bankshares Inc.† . . . . . 127,500 128,100
----------------------------------------- ------------------------------------------18,948,782 24,747,724
----------------------------------------- ------------------------------------------Food and Beverage — 2.0%
1,000 Andrew Peller Ltd., Cl. A . . . 9,614 9,54119,300 Boston Beer Co. Inc.,
Cl. A† . . . . . . . . . . . . . . . . . . 485,730 1,787,56616,000 Calavo Growers Inc. . . . . . . . . 362,638 349,600132,900 Caribou Coffee Co. Inc.† . . . . 1,259,942 1,351,59335,000 Feihe International Inc.† . . . . 305,571 301,3501,100 Hanover Foods Corp.,
Cl. A . . . . . . . . . . . . . . . . . . . 110,881 99,632700 Inventure Foods Inc.† . . . . . . 1,862 2,716
2,000 J & J Snack Foods Corp. . . . . . 28,830 94,140231,425 Lifeway Foods Inc.† . . . . . . . . 2,245,078 2,411,44915,000 MGP Ingredients Inc. . . . . . . . 69,302 130,80030,000 Peet’s Coffee & Tea Inc.† . . . . 1,228,197 1,442,7007,800 Rock Field Co. Ltd. . . . . . . . . . 125,557 128,2815,500 Scheid Vineyards Inc.,
Cl. A† . . . . . . . . . . . . . . . . . . 95,382 50,05045,000 Smart Balance Inc.† . . . . . . . . 187,124 206,550131,700 Snyders-Lance Inc. . . . . . . . . . 2,871,747 2,614,24548,000 The Hain Celestial Group
Inc.† . . . . . . . . . . . . . . . . . . . . 989,778 1,549,440270,000 Tingyi (Cayman Islands)
Holding Corp. . . . . . . . . . . . 393,787 660,200280,000 Vitasoy International
Holdings Ltd. . . . . . . . . . . . 133,057 228,57719,300 Willamette Valley Vineyards
Inc.† . . . . . . . . . . . . . . . . . . . . 89,008 60,795----------------------------------------- ------------------------------------------10,993,085 13,479,225
----------------------------------------- ------------------------------------------Health Care — 7.7%
5,000 Alere Inc.† . . . . . . . . . . . . . . . . 94,541 195,70029,000 AngioDynamics Inc.† . . . . . . . 366,776 438,480150,000 Animal Health International
Inc.† . . . . . . . . . . . . . . . . . . . . 633,765 630,00012,800 ArthroCare Corp.† . . . . . . . . . 140,635 426,75269,100 Bio-Reference Laboratories
Inc.† . . . . . . . . . . . . . . . . . . . . 1,494,774 1,550,604
338,855 BioLase Technology Inc.† . . . $ 473,052 $ 1,650,22410,000 Boiron SA . . . . . . . . . . . . . . . . . 166,957 422,3241,000 Bruker Corp.† . . . . . . . . . . . . . 5,980 20,850
223,326 Cantel Medical Corp. . . . . . . . 4,890,381 5,750,64514,000 Cardica Inc.† . . . . . . . . . . . . . . 66,719 49,840105,000 CardioNet Inc.† . . . . . . . . . . . . 544,934 502,95062,500 Cepheid Inc.† . . . . . . . . . . . . . 595,116 1,751,250702,300 Continucare Corp.† . . . . . . . . 1,967,747 3,757,305103,800 Cutera Inc.† . . . . . . . . . . . . . . . 858,374 889,56660,000 Cynosure Inc., Cl. A† . . . . . . . 508,551 833,4005,000 DexCom Inc.† . . . . . . . . . . . . . 65,375 77,60020,163 DGT Holdings Corp.† . . . . . . 295,791 193,5651,000 Elite Pharmaceuticals Inc.† . . 2,690 78
108,300 Exactech Inc.† . . . . . . . . . . . . . 1,812,890 1,900,6654,870 Heska Corp.† . . . . . . . . . . . . . . 59,840 31,65573,600 Hooper Holmes Inc.† . . . . . . . 69,670 54,4641,300 ICU Medical Inc.† . . . . . . . . . . 34,815 56,91410,000 Indevus Pharmaceuticals
Inc., Escrow† (b) . . . . . . . . . 0 11,000473,000 InfuSystems Holdings
Inc.† . . . . . . . . . . . . . . . . . . . . 1,268,317 1,277,100486,401 IRIS International Inc.† . . . . . 5,120,761 4,387,337172,913 LeMaitre Vascular Inc. . . . . . . 1,184,413 1,177,53891,700 Neogen Corp.† . . . . . . . . . . . . 559,479 3,794,5461,800 NMT Medical Inc.† . . . . . . . . . 5,643 30650,000 Opko Health Inc.† . . . . . . . . . 108,408 186,50017,500 Orthofix International NV† . . 279,401 568,050117,800 Pain Therapeutics Inc.† . . . . . 536,167 1,126,168157,300 Palomar Medical
Technologies Inc.† . . . . . . . 2,200,032 2,335,90510,000 PreMD Inc.† . . . . . . . . . . . . . . . 18,320 41152,561 Quidel Corp.† . . . . . . . . . . . . . 1,733,466 1,824,630402,290 Rochester Medical Corp.† . . . 4,498,306 4,618,28984,400 RTI Biologics Inc.† . . . . . . . . . 499,719 241,38424,000 Skilled Healthcare Group
Inc., Cl. A† . . . . . . . . . . . . . . 259,360 345,360213,900 Strategic Diagnostics Inc.† . . 207,526 481,275120,900 SurModics Inc.† . . . . . . . . . . . 1,417,581 1,511,25095,000 Syneron Medical Ltd.† . . . . . . 819,192 1,238,8002,000 Targanta Therapeutics Corp.,
Escrow† (b) . . . . . . . . . . . . . 0 1,280500 ThermoGenesis Corp.† . . . . . 1,140 1,045
200,000 TomoTherapy Inc.† . . . . . . . . . 915,760 914,000101,000 Trinity Biotech plc, ADR† . . . 860,693 947,38082,900 United-Guardian Inc. . . . . . . . 734,019 1,236,039137,331 Vascular Solutions Inc.† . . . . . 1,369,271 1,498,28123,300 Young Innovations Inc. . . . . . 433,256 731,620
----------------------------------------- ------------------------------------------40,179,603 51,639,955
----------------------------------------- ------------------------------------------Hotels and Gaming — 1.6%
53,540 Churchill Downs Inc. . . . . . . . 1,698,594 2,221,910256,000 Dover Downs Gaming &
Entertainment Inc. . . . . . . . 1,261,527 919,0402,500 Florida Gaming Corp.† . . . . . 6,252 8,4374,000 Gaylord Entertainment
Co.† . . . . . . . . . . . . . . . . . . . . 55,334 138,720192,922 Morgans Hotel Group Co.† . . 1,564,870 1,890,6368,500 Multimedia Games Inc.† . . . . 76,734 48,70526,500 Pinnacle Entertainment
Inc.† . . . . . . . . . . . . . . . . . . . . 200,316 360,930211,473 Sonesta International Hotels
Corp., Cl. A (a) . . . . . . . . . . 3,418,145 4,057,110106,000 The Marcus Corp. . . . . . . . . . . 1,257,478 1,155,400
----------------------------------------- ------------------------------------------9,539,250 10,800,888
----------------------------------------- ------------------------------------------Machinery — 1.7%
35,000 Astec Industries Inc.† . . . . . . . 1,066,959 1,305,15011,000 DXP Enterprises Inc.† . . . . . . 140,765 253,880134,000 Flow International Corp.† . . . 210,750 588,260146,400 Global Power Equipment
Group Inc.† . . . . . . . . . . . . . 3,434,289 4,026,000
MarketShares Cost Value——–— —— ——–—
MarketShares Cost Value——–— —— ——–—

11
See accompanying notes to financial statements.
GAMCO Westwood Mighty MitesSM FundSchedule of Investments (Continued) — March 31, 2011 (Unaudited)
COMMON STOCKS (Continued)Machinery (Continued)
6,000 Hardinge Inc. . . . . . . . . . . . . . . $ 54,215 $ 82,20063,911 Key Technology Inc.† . . . . . . . 1,233,907 1,291,6416,000 Lindsay Corp. . . . . . . . . . . . . . 180,673 474,12046,300 Tennant Co. . . . . . . . . . . . . . . . 927,753 1,946,45214,800 The Middleby Corp.† . . . . . . . 464,969 1,379,656
----------------------------------------- ------------------------------------------7,714,280 11,347,359
----------------------------------------- ------------------------------------------Manufactured Housing and Recreational Vehicles — 0.4%
1,212,300 All American Group Inc.† . . . 1,748,372 276,40415,500 Cavco Industries Inc.† . . . . . . 401,106 699,98038,300 Nobility Homes Inc.† . . . . . . . 408,896 352,36025,300 Skyline Corp. . . . . . . . . . . . . . . 559,803 507,26542,000 Winnebago Industries
Inc.† . . . . . . . . . . . . . . . . . . . . 461,483 561,540----------------------------------------- ------------------------------------------
3,579,660 2,397,549----------------------------------------- ------------------------------------------
Metals and Mining — 1.3%87,400 5N Plus Inc.† . . . . . . . . . . . . . . 315,355 835,686650,000 Alkane Resources Ltd.† . . . . . 704,489 1,280,785100,000 Allana Potash Corp.† . . . . . . . 197,161 189,78920,000 Camino Minerals Corp.† . . . . 3,744 7,014100,000(c)Duluth Metals Ltd.† . . . . . . . . 298,512 271,274142,800 Materion Corp.† . . . . . . . . . . . 2,892,831 5,826,240600,000 Tanami Gold NL† . . . . . . . . . . 556,226 546,137
----------------------------------------- ------------------------------------------4,968,318 8,956,925
----------------------------------------- ------------------------------------------Paper and Forest Products — 0.1%
6,749 Keweenaw Land AssociationLtd.† . . . . . . . . . . . . . . . . . . . 619,836 632,719
----------------------------------------- ------------------------------------------Publishing — 2.0%
171,300 Belo Corp., Cl. A† . . . . . . . . . . 348,288 1,509,153133,571 Cambium Learning Group
Inc.† . . . . . . . . . . . . . . . . . . . . 511,753 454,141863,800 Il Sole 24 Ore SpA† . . . . . . . . . 1,655,253 1,615,907
1,126,000 Journal CommunicationsInc., Cl. A† . . . . . . . . . . . . . . 2,699,482 6,756,000
373,089 PRIMEDIA Inc. . . . . . . . . . . . . 1,240,801 1,816,943145,000 The E.W. Scripps Co.,
Cl. A† . . . . . . . . . . . . . . . . . . 533,809 1,435,500----------------------------------------- ------------------------------------------
6,989,386 13,587,644----------------------------------------- ------------------------------------------
Real Estate — 0.9%7,000 Bresler & Reiner Inc.† . . . . . . 130,140 7,70014,100 Capital Properties Inc.,
Cl. A . . . . . . . . . . . . . . . . . . . 173,352 183,1596,000 Capital Properties Inc.,
Cl. B (b)(d) . . . . . . . . . . . . . . 0 77,94078,000 Cohen & Steers Inc. . . . . . . . . 1,576,930 2,315,04070,900 Griffin Land & Nurseries
Inc. . . . . . . . . . . . . . . . . . . . . . 1,958,784 2,281,5621,900 Gyrodyne Co. of America
Inc.† . . . . . . . . . . . . . . . . . . . . 49,716 139,6506,300 Holobeam Inc.† . . . . . . . . . . . . 113,939 119,700
124,500 Reading International Inc.,Cl. A† . . . . . . . . . . . . . . . . . . 627,682 628,725
39,800 Reading International Inc.,Cl. B† . . . . . . . . . . . . . . . . . . 336,054 288,550
2,508 Royalty LLC† (b)(d) . . . . . . . . 0 7,550----------------------------------------- ------------------------------------------
4,966,597 6,049,576----------------------------------------- ------------------------------------------
Restaurants — 1.7%15,279 Biglari Holdings Inc.† . . . . . . 4,249,234 6,471,42080,500 Denny’s Corp.† . . . . . . . . . . . . 252,176 326,83095,105 Famous Dave’s of America
Inc.† . . . . . . . . . . . . . . . . . . . . 888,321 930,127155,229 Nathan’s Famous Inc.† . . . . . 2,127,230 2,682,35743,000 The Cheesecake Factory
Inc.† . . . . . . . . . . . . . . . . . . . . 1,265,428 1,293,870----------------------------------------- ------------------------------------------
8,782,389 11,704,604----------------------------------------- ------------------------------------------
Retail — 1.5%41,000 Aaron’s Inc.† . . . . . . . . . . . . . . $ 726,779 $ 1,039,76070,000 Big 5 Sporting Goods
Corp. . . . . . . . . . . . . . . . . . . . 943,564 834,400243,400 Coldwater Creek Inc.† . . . . . . 854,521 642,57679,800 Hot Topic Inc. . . . . . . . . . . . . . 499,225 454,860129,200 Ingles Markets Inc., Cl. A . . . 2,050,344 2,559,452125,071 Krispy Kreme Doughnuts
Inc.† . . . . . . . . . . . . . . . . . . . . 844,969 880,50013,800 Movado Group Inc.† . . . . . . . 168,084 202,58428,000 Pier 1 Imports Inc.† . . . . . . . . 293,203 284,20060,900 Rush Enterprises Inc.,
Cl. A† . . . . . . . . . . . . . . . . . . 955,468 1,205,82057,500 Rush Enterprises Inc.,
Cl. B† . . . . . . . . . . . . . . . . . . 623,178 999,92521,800 The Bon-Ton Stores Inc.† . . . . 178,394 337,900330,000 The Great Atlantic & Pacific
Tea Co. Inc.† . . . . . . . . . . . . 61,465 75,90011,300 Village Super Market Inc.,
Cl. A . . . . . . . . . . . . . . . . . . . 295,331 328,830----------------------------------------- ------------------------------------------
8,494,525 9,846,707----------------------------------------- ------------------------------------------
Semiconductors — 0.7%122,400 Advanced Analogic
Technologies Inc.† . . . . . . . 474,312 462,672135,975 Cascade Microtech Inc.† . . . . 690,498 840,325100,000 Conexant Systems Inc.† . . . . . 219,500 238,000132,700 Entegris Inc.† . . . . . . . . . . . . . . 656,924 1,163,77989,500 Entropic Communications
Inc.† . . . . . . . . . . . . . . . . . . . . 491,413 756,2751,319 GSI Group Inc.† . . . . . . . . . . . 10,602 13,58793,700 IXYS Corp.† . . . . . . . . . . . . . . . 991,052 1,258,391
----------------------------------------- ------------------------------------------3,534,301 4,733,029
----------------------------------------- ------------------------------------------Specialty Chemicals — 2.5%
9,109 A. Schulman Inc. . . . . . . . . . . . 217,352 225,17410,000 Chemtura Corp.† . . . . . . . . . . 165,169 172,000558,500 Ferro Corp.† . . . . . . . . . . . . . . . 2,228,966 9,265,515267,226 General Chemical Group
Inc.† . . . . . . . . . . . . . . . . . . . . 59,859 3,34030,000 Hawkins Inc. . . . . . . . . . . . . . . 429,913 1,232,4001,000 KMG Chemicals Inc. . . . . . . . 3,270 19,660
270,000 Omnova Solutions Inc.† . . . . 509,785 2,124,900202,500 Zep Inc. . . . . . . . . . . . . . . . . . . 2,741,477 3,525,525
----------------------------------------- ------------------------------------------6,355,791 16,568,514
----------------------------------------- ------------------------------------------Telecommunications — 0.6%
45,200 Atlantic Tele-Network Inc. . . 1,776,694 1,680,988150,000 Cincinnati Bell Inc.† . . . . . . . . 420,006 402,000
75 ConsolidatedCommunicationsHoldings Inc. . . . . . . . . . . . . 1,336 1,405
1,500 Electronic SystemsTechnology Inc.† . . . . . . . . . 1,058 885
60,000 HickoryTech Corp. . . . . . . . . . 563,742 545,40080 Horizon Telecom Inc.,
Cl. A . . . . . . . . . . . . . . . . . . . 9,250 7,200350 Horizon Telecom Inc.,
Cl. B . . . . . . . . . . . . . . . . . . . 39,964 24,50030,000 ICO Global Communications
(Holdings) Ltd.† . . . . . . . . . 48,782 80,10056,100 New Ulm Telecom Inc. . . . . . 547,403 314,160
400 North State Telephone Co.,Cl. A . . . . . . . . . . . . . . . . . . . 31,368 31,800
500 Otelco Inc., IDS . . . . . . . . . . . . 9,074 9,6907,788 Preformed Line Products Co. 338,590 538,69618,500 Shenandoah
Telecommunications Co. . . 104,466 334,110500 SureWest Communications† . . 5,393 7,190
17,875 Windstream Corp. . . . . . . . . . 179,823 230,051----------------------------------------- ------------------------------------------
4,076,949 4,208,175----------------------------------------- ------------------------------------------
MarketShares Cost Value——–— —— ——–—
MarketShares Cost Value——–— —— ——–—

12
See accompanying notes to financial statements.
GAMCO Westwood Mighty MitesSM FundSchedule of Investments (Continued) — March 31, 2011 (Unaudited)
MarketShares Cost Value——–— —— ——–—
COMMON STOCKS (Continued)Transportation — 0.2%
1,000 K-Sea TransportationPartners LP† . . . . . . . . . . . . $ 8,125 $ 8,180
8,200 PHI Inc.† . . . . . . . . . . . . . . . . . 130,182 188,60082,200 Providence and Worcester
Railroad Co. . . . . . . . . . . . . . 1,108,795 1,374,7951,000 Trailer Bridge Inc.† . . . . . . . . . 5,382 3,810
----------------------------------------- ------------------------------------------1,252,484 1,575,385
----------------------------------------- ------------------------------------------TOTAL COMMON STOCKS 338,805,150 473,113,580
----------------------------------------- ------------------------------------------
PREFERRED STOCKS — 0.1%Automotive: Parts and Accessories — 0.1%
20,000 Jungheinrich AG Pfd. . . . . . . . 229,855 803,549----------------------------------------- ------------------------------------------
CONVERTIBLE PREFERRED STOCKS — 0.0%Food and Beverage — 0.0%
500 Seneca Foods Corp., ZeroCoupon Cv. Pfd.,Ser. 2003 (b)† . . . . . . . . . . . . 7,625 14,935
----------------------------------------- ------------------------------------------
RIGHTS — 0.0%Equipment and Supplies — 0.0%
8,500 Gildemeister AG,expire 04/11/11† . . . . . . . . . 0 5,674
----------------------------------------- ------------------------------------------
WARRANTS — 0.0%Broadcasting — 0.0%
63 Granite BroadcastingCorp., Ser. A,expire 06/04/12† (b) . . . . . 0 0
63 Granite BroadcastingCorp., Ser. B,expire 06/04/12† (b) . . . . . 0 0
----------------------------------------- ------------------------------------------0 0
----------------------------------------- ------------------------------------------TOTAL WARRANTS . . . . . . 0 0
----------------------------------------- ------------------------------------------PrincipalAmount---------------------------
U.S. GOVERNMENT OBLIGATIONS — 29.5%$198,431,000 U.S. Treasury Bills,
0.115% to 0.210%††,04/07/11 to 09/22/11 . . . . 198,336,905 198,353,593
----------------------------------------- ------------------------------------------TOTALINVESTMENTS— 100.1% $537,379,535 672,291,331
----------------------------------------------------------------------------------Other Assets and Liabilities (Net) — (0.1)% . . (792,527)
------------------------------------------NET ASSETS — 100.0% . . . . . . . . . . . . . . . . . . . $671,498,804
------------------------------------------------------------------------------------
(a) Security considered an affiliated holding because the Fund owns atleast 5% of its outstanding shares.
(b) Security fair valued under procedures established by the Board ofTrustees. The procedures may include reviewing available financialinformation about the company and reviewing the valuation ofcomparable securities and other factors on a regular basis. AtMarch 31, 2011, the market value of fair valued securitiesamounted to $209,200 or 0.03% of net assets.
(c) Denoted in units.(d) At March 31, 2011, the Fund held investments in restricted and
illiquid securities amounting to $85,490 or 0.01% of net assets,which were valued under methods approved by the Board ofTrustees, as follows:
03/31/11Carrying
Acquisition Acquisition Acquisition ValueShares Issuer Date Cost Per Unit—–—––– —––— —––— —––— –—––––—6,000 Capital Properties Inc., Cl. B 11/20/03 — $12.99002,508 Royalty LLC . . . . . . . . . . . . . 09/09/03 — 3.0104
† Non-income producing security.†† Represents annualized yield at date of purchase.ADR American Depositary ReceiptCVO Contingent Value Obligation

13
See accompanying notes to financial statements.
GAMCO Westwood SmallCap Equity FundSchedule of Investments — March 31, 2011 (Unaudited)
COMMON STOCKS — 94.7%Aerospace — 2.6%
10,000 AAR Corp.† . . . . . . . . . . . . . . . $ 219,569 $ 277,2001,500 Curtiss-Wright Corp. . . . . . . . 56,908 52,710700 Esterline Technologies
Corp.† . . . . . . . . . . . . . . . . . . 19,504 49,50412,200 Hexcel Corp.† . . . . . . . . . . . . . 199,873 240,2184,600 Kaman Corp. . . . . . . . . . . . . . . 82,901 161,920
-------------------------------------- -------------------------------------578,755 781,552
-------------------------------------- -------------------------------------Automotive — 1.5%
2,400 AutoNation Inc.† . . . . . . . . . . 44,468 84,888500 Group 1 Automotive Inc. . . . 16,425 21,400
1,100 Navistar International Corp.† 41,893 76,2633,700 Penske Automotive Group
Inc.† . . . . . . . . . . . . . . . . . . . . 63,090 74,0746,900 Rush Enterprises Inc., Cl. A† 86,636 136,6206,100 Wabash National Corp.† . . . . 44,638 70,638
-------------------------------------- -------------------------------------297,150 463,883
-------------------------------------- -------------------------------------Automotive: Parts and Accessories — 0.5%
1,900 Federal-Mogul Corp.† . . . . . . 24,695 47,3104,300 Midas Inc.† . . . . . . . . . . . . . . . 54,734 32,981600 Monro Muffler Brake Inc. . . . 12,436 19,788
1,600 Superior IndustriesInternational Inc. . . . . . . . . 22,818 41,024
-------------------------------------- -------------------------------------114,683 141,103
-------------------------------------- -------------------------------------Aviation: Parts and Services — 0.3%
2,000 Astronics Corp.† . . . . . . . . . . . 18,913 50,3402,100 Ducommun Inc. . . . . . . . . . . . 40,426 50,190
-------------------------------------- -------------------------------------59,339 100,530
-------------------------------------- -------------------------------------Building and Construction — 1.4%
2,600 Chicago Bridge &Iron Co., NV . . . . . . . . . . . . 50,128 105,716
8,300 Dycom Industries Inc.† . . . . . 110,715 143,9221,400 Insituform Technologies Inc.,
Cl. A† . . . . . . . . . . . . . . . . . . 20,052 37,4505,700 MYR Group Inc.† . . . . . . . . . . 137,940 136,344900 NCI Building Systems Inc.† . 11,629 11,403
-------------------------------------- -------------------------------------330,464 434,835
-------------------------------------- -------------------------------------Business Services — 4.7%
5,500 ABM Industries Inc. . . . . . . . . 139,602 139,645600 Alliance Data Systems
Corp.† . . . . . . . . . . . . . . . . . . 24,717 51,5341,050 Ascent Media Corp., Cl. A† . 24,024 51,2935,200 Convergys Corp.† . . . . . . . . . . 65,494 74,6727,043 Edgewater Technology Inc.† . 47,384 22,46710,200 FTI Consulting Inc.† . . . . . . . . 354,329 390,9664,800 G & K Services Inc., Cl. A . . . 136,886 159,6006,600 GP Strategies Corp.† . . . . . . . 34,196 89,7603,000 Healthcare Services
Group Inc. . . . . . . . . . . . . . . 34,839 52,7401,200 Kforce Inc.† . . . . . . . . . . . . . . . 13,629 21,9603,000 MDC Partners Inc., Cl. A . . . . 17,240 50,31018,400 PRGX Global Inc.† . . . . . . . . . 111,942 111,6882,200 Schawk Inc. . . . . . . . . . . . . . . . 25,150 42,7683,600 Tetra Tech Inc.† . . . . . . . . . . . . 81,412 88,88412,100 Tier Technologies Inc.† . . . . . 83,081 66,550
-------------------------------------- -------------------------------------1,193,925 1,414,837
-------------------------------------- -------------------------------------Commercial Services — 0.9%
5,500 Checkpoint Systems Inc.† . . . 118,396 123,6402,000 ICF International Inc.† . . . . . . 44,927 41,0806,100 KAR Auction Services Inc.† . 79,424 93,574
-------------------------------------- -------------------------------------242,747 258,294
-------------------------------------- -------------------------------------
Communications Equipment — 0.6%5,400 Harmonic Inc.† . . . . . . . . . . . . $ 28,608 $ 50,6522,200 Plantronics Inc. . . . . . . . . . . . . 33,352 80,5647,900 Symmetricom Inc.† . . . . . . . . . 32,176 48,427
-------------------------------------- -------------------------------------94,136 179,643
-------------------------------------- -------------------------------------Computer Hardware — 1.7%
4,200 Cray Inc.† . . . . . . . . . . . . . . . . . 25,738 27,0906,000 NCR Corp.† . . . . . . . . . . . . . . . 64,440 113,04020,900 QLogic Corp.† . . . . . . . . . . . . . 330,147 387,695
-------------------------------------- -------------------------------------420,325 527,825
-------------------------------------- -------------------------------------Computer Software and Services — 5.2%
1,600 Akamai Technologies Inc.† . . 34,693 60,8002,000 AOL Inc.† . . . . . . . . . . . . . . . . . 47,985 39,0604,600 Avid Technology Inc.† . . . . . . 74,691 102,5804,000 Bottomline Technologies
Inc.† . . . . . . . . . . . . . . . . . . . . 60,672 100,5602,500 Cadence Design Systems
Inc.† . . . . . . . . . . . . . . . . . . . . 14,093 24,37511,000 Callidus Software Inc.† . . . . . 68,478 75,5702,700 Dynamics Research Corp.† . . 29,252 44,1451,600 Evolving Systems Inc. . . . . . . 11,504 11,5845,600 Fair Isaac Corp. . . . . . . . . . . . . 117,149 177,0166,500 Lawson Software Inc.† . . . . . . 43,285 78,65029,600 Magma Design Automation
Inc.† . . . . . . . . . . . . . . . . . . . . 59,927 201,8724,900 Mercury Computer Systems
Inc.† . . . . . . . . . . . . . . . . . . . . 38,143 103,6847,700 Parametric Technology
Corp.† . . . . . . . . . . . . . . . . . . 110,109 173,1733,900 Progress Software Corp.† . . . 57,332 113,451900 Rovi Corp.† . . . . . . . . . . . . . . . 15,567 48,285
8,900 S1 Corp.† . . . . . . . . . . . . . . . . . 46,727 59,4521,900 Teradata Corp.† . . . . . . . . . . . . 39,636 96,33012,600 THQ Inc.† . . . . . . . . . . . . . . . . . 128,128 57,456
-------------------------------------- -------------------------------------997,371 1,568,043
-------------------------------------- -------------------------------------Consumer Products — 1.2%
7,700 A. T. Cross Co., Cl. A† . . . . . . 76,012 82,0823,000 Cinemark Holdings Inc. . . . . 56,277 58,0503,400 Cineplex Inc. . . . . . . . . . . . . . . 81,808 81,2215,900 Knoll Inc. . . . . . . . . . . . . . . . . . 68,581 123,664300 The Warnaco Group Inc.† . . . 8,475 17,157
-------------------------------------- -------------------------------------291,153 362,174
-------------------------------------- -------------------------------------Consumer Services — 0.1%
3,400 TiVo Inc.† . . . . . . . . . . . . . . . . . 30,661 29,784-------------------------------------- -------------------------------------
Diversified Industrial — 3.4%2,500 A.M. Castle & Co.† . . . . . . . . . 25,591 47,2005,750 Barnes Group Inc. . . . . . . . . . . 122,162 120,0605,760 Columbus McKinnon Corp.† 116,181 106,3304,381 Federal Signal Corp. . . . . . . . . 52,055 28,5206,400 Furmanite Corp.† . . . . . . . . . . 30,986 51,2004,788 Griffon Corp.† . . . . . . . . . . . . . 41,704 62,8663,200 Kaydon Corp. . . . . . . . . . . . . . 115,189 125,4083,800 Kennametal Inc. . . . . . . . . . . . 153,414 148,200700 Lawson Products Inc. . . . . . . . 12,648 16,128
7,100 RSC Holdings Inc.† . . . . . . . . 84,314 102,0985,600 Sealed Air Corp. . . . . . . . . . . . 119,933 149,296700 Texas Industries Inc. . . . . . . . . 23,737 31,661
2,600 Tredegar Corp. . . . . . . . . . . . . 36,867 56,108-------------------------------------- -------------------------------------
934,781 1,045,075-------------------------------------- -------------------------------------
Electronics — 12.2%2,100 Analogic Corp. . . . . . . . . . . . . 82,989 118,7553,600 Avnet Inc.† . . . . . . . . . . . . . . . . 77,517 122,72414,800 Ballantyne Strong Inc.† . . . . . 75,510 106,116
MarketShares Cost Value——–— —— ——–—
MarketShares Cost Value——–— —— ——–—

14
See accompanying notes to financial statements.
GAMCO Westwood SmallCap Equity FundSchedule of Investments (Continued) — March 31, 2011 (Unaudited)
COMMON STOCKS (Continued)Electronics — (Continued)
800 Coherent Inc.† . . . . . . . . . . . . . $ 14,414 $ 46,48824,700 Electro Scientific Industries
Inc.† . . . . . . . . . . . . . . . . . . . . 350,035 428,7922,200 FARO Technologies Inc.† . . . . 49,512 88,0006,200 General Cable Corp.† . . . . . . . 212,244 268,4607,500 International Rectifier Corp.† 102,298 247,9503,600 IXYS Corp.† . . . . . . . . . . . . . . . 23,882 48,34825,300 LeCroy Corp.† . . . . . . . . . . . . . 150,987 338,2611,600 Littelfuse Inc. . . . . . . . . . . . . . . 27,951 91,3607,100 Molex Inc. . . . . . . . . . . . . . . . . 127,140 178,35210,950 Newport Corp.† . . . . . . . . . . . 107,424 195,2392,200 OSI Systems Inc.† . . . . . . . . . . 46,594 82,5665,300 Park Electrochemical Corp. . . 117,965 170,92527,500 Pulse Electronics Corp. . . . . . 129,130 166,3757,400 Radisys Corp.† . . . . . . . . . . . . 61,848 64,08411,800 TTM Technologies Inc.† . . . . . 122,530 214,2883,300 Ultralife Corp.† . . . . . . . . . . . . 12,908 16,69817,100 Vishay Intertechnology Inc.† 95,865 303,3546,800 Woodward Inc. . . . . . . . . . . . . 213,202 235,0084,700 Zebra Technologies Corp.,
Cl. A† . . . . . . . . . . . . . . . . . . 109,207 184,428-------------------------------------- -------------------------------------
2,311,152 3,716,571-------------------------------------- -------------------------------------
Energy and Utilities — 8.8%9,400 Brigham Exploration Co.† . . . 123,481 349,4921,000 Flint Energy Services Ltd.† . . 11,308 17,4111,000 GeoResources Inc.† . . . . . . . . . 21,931 31,2706,100 Global Industries Ltd.† . . . . . 55,722 59,7199,700 Goodrich Petroleum Corp.† . 206,539 215,5343,300 Gulf Island Fabrication Inc. . 73,016 106,1616,700 Key Energy Services Inc.† . . . 96,056 104,18515,200 Matrix Service Co.† . . . . . . . . 164,869 211,28021,500 Newpark Resources Inc.† . . . 136,895 168,9908,000 Patterson-UTI Energy Inc. . . . 199,486 235,12011,600 Petrohawk Energy Corp.† . . . 233,596 284,6642,600 PetroQuest Energy Inc.† . . . . 20,150 24,33615,100 Pike Electric Corp.† . . . . . . . . 143,874 143,75219,400 Pioneer Drilling Co.† . . . . . . . 184,614 267,7204,400 Rowan Companies Inc.† . . . . 80,133 194,3923,300 Superior Energy Services
Inc.† . . . . . . . . . . . . . . . . . . . . 56,408 135,3004,300 Tesco Corp.† . . . . . . . . . . . . . . 38,672 94,385500 Unit Corp.† . . . . . . . . . . . . . . . 16,134 30,975
-------------------------------------- -------------------------------------1,862,884 2,674,686
-------------------------------------- -------------------------------------Entertainment — 0.5%
1,600 Discovery CommunicationsInc., Cl. A† . . . . . . . . . . . . . . 19,468 63,840
6,350 Take-Two InteractiveSoftware Inc.† . . . . . . . . . . . 54,091 97,599
-------------------------------------- -------------------------------------73,559 161,439
-------------------------------------- -------------------------------------Equipment and Supplies — 5.4%
1,700 AZZ Inc. . . . . . . . . . . . . . . . . . . 56,528 77,5201,900 CIRCOR International Inc. . . 79,904 89,3386,500 Crown Holdings Inc.† . . . . . . 217,022 250,77014,000 Gerber Scientific Inc.† . . . . . . 89,535 131,0402,400 GrafTech International Ltd.† . 28,504 49,5124,000 IDEX Corp. . . . . . . . . . . . . . . . 112,163 174,60011,100 Mine Safety Appliances Co. . 332,709 407,0371,600 Mueller Industries Inc. . . . . . . 54,335 58,5921,850 Robbins & Myers Inc. . . . . . . 36,264 85,0811,800 Tennant Co. . . . . . . . . . . . . . . . 44,744 75,6722,500 The Greenbrier Cos. Inc.† . . . 32,375 70,9501,300 The Toro Co. . . . . . . . . . . . . . . 49,446 86,0861,200 Titan Machinery Inc.† . . . . . . 13,234 30,3003,400 Vicor Corp. . . . . . . . . . . . . . . . . 31,099 56,066
-------------------------------------- -------------------------------------1,177,862 1,642,564
-------------------------------------- -------------------------------------
Financial Services — 14.9%6,000 Anchor Bancorp.† . . . . . . . . . . $ 60,000 $ 64,2003,000 Astoria Financial Corp. . . . . . 42,740 43,1101,000 BankUnited Inc. . . . . . . . . . . . 27,000 28,7101,000 Berkshire Hills Bancorp Inc. . 22,854 20,8507,700 Boston Private Financial
Holdings Inc. . . . . . . . . . . . . 55,319 54,4391,600 Brookline Bancorp Inc. . . . . . . 15,947 16,84810,400 Brown & Brown Inc. . . . . . . . . 234,969 268,3203,700 Cardinal Financial Corp. . . . . 29,674 43,1421,400 Citizens & Northern Corp. . . 22,229 23,5344,200 Columbia Banking System
Inc. . . . . . . . . . . . . . . . . . . . . . 59,989 80,51410,000 Cowen Group Inc., Cl. A† . . . 50,000 40,1001,900 Epoch Holding Corp. . . . . . . . 17,511 29,9826,850 FBR Capital Markets Corp.† . 35,763 24,5231,100 Fidelity National Financial
Inc., Cl. A . . . . . . . . . . . . . . . 15,729 15,5435,000 Financial Institutions Inc. . . . 81,750 87,5009,000 First Horizon National Corp. 109,294 100,89025,000 First Niagara Financial
Group Inc. . . . . . . . . . . . . . . 300,000 339,50010,800 Flushing Financial Corp. . . . . 145,696 160,9205,000 HF Financial Corp. . . . . . . . . . 40,000 55,8008,845 Hudson Valley Holding
Corp. . . . . . . . . . . . . . . . . . . . 167,809 194,590700 IBERIABANK Corp. . . . . . . . . 33,331 42,091
2,500 Investors Bancorp Inc.† . . . . . 22,438 37,2256,300 KBW Inc. . . . . . . . . . . . . . . . . . 163,541 164,9976,700 Knight Capital Group Inc.,
Cl. A† . . . . . . . . . . . . . . . . . . 99,269 89,7803,900 Meadowbrook Insurance
Group Inc. . . . . . . . . . . . . . . 22,850 40,36512,600 Nara Bancorp Inc.† . . . . . . . . . 94,500 121,2126,000 National Penn Bancshares
Inc. . . . . . . . . . . . . . . . . . . . . . 31,500 46,4403,950 NewAlliance Bancshares Inc. 48,300 58,6181,400 Newport Bancorp Inc.† . . . . . 16,870 19,5023,800 Old National Bancorp . . . . . . 41,329 40,73612,800 Oriental Financial Group Inc. 155,635 160,6402,600 Orrstown Financial Services
Inc. . . . . . . . . . . . . . . . . . . . . . 70,200 72,8006,100 Sterling Bancorp . . . . . . . . . . . 65,989 61,0612,900 Stifel Financial Corp.† . . . . . . 149,137 208,1912,900 SVB Financial Group† . . . . . . 78,942 165,0976,200 Texas Capital Bancshares
Inc.† . . . . . . . . . . . . . . . . . . . . 145,575 161,13820,000 The Bancorp Inc.† . . . . . . . . . . 165,000 184,6004,200 The NASDAQ OMX Group
Inc.† . . . . . . . . . . . . . . . . . . . . 83,624 108,5284,200 The Navigators Group Inc.† . 201,054 216,3006,200 Umpqua Holdings Corp. . . . . 60,759 70,9288,550 Valley National Bancorp . . . . 110,429 119,3581,000 Washington Banking Co. . . . . 9,000 14,10012,400 Washington Federal Inc. . . . . 201,213 215,0169,300 Washington Trust Bancorp
Inc. . . . . . . . . . . . . . . . . . . . . . 185,189 220,7824,300 Webster Financial Corp. . . . . 52,272 92,1493,750 Westfield Financial Inc. . . . . . 35,041 33,975400 WSFS Financial Corp. . . . . . . 11,024 18,840
15,000 Xenith Bankshares Inc.† . . . . . 63,750 64,050-------------------------------------- -------------------------------------
3,952,034 4,541,534-------------------------------------- -------------------------------------
Food and Beverage — 0.2%2,200 The Cheesecake Factory Inc.† 34,683 66,198
-------------------------------------- -------------------------------------Food Products — 0.5%
12,700 Viterra Inc. . . . . . . . . . . . . . . . . 134,051 154,051-------------------------------------- -------------------------------------
MarketShares Cost Value——–— —— ——–—
MarketShares Cost Value——–— —— ——–—

15
See accompanying notes to financial statements.
GAMCO Westwood SmallCap Equity FundSchedule of Investments (Continued) — March 31, 2011 (Unaudited)
COMMON STOCKS (Continued)Health Care — 6.3%
4,700 AngioDynamics Inc.† . . . . . . . $ 61,900 $ 71,0641,100 ArthroCare Corp.† . . . . . . . . . 28,958 36,6741,000 Assisted Living Concepts
Inc., Cl. A† . . . . . . . . . . . . . . 28,102 39,1405,300 Community Health Systems
Inc.† . . . . . . . . . . . . . . . . . . . . 177,028 211,9473,600 Continucare Corp.† . . . . . . . . 8,964 19,2601,200 Cynosure Inc., Cl. A† . . . . . . . 9,468 16,6681,900 ICU Medical Inc.† . . . . . . . . . . 66,515 83,1822,700 Kindred Healthcare Inc.† . . . 49,813 64,4764,500 Omnicare Inc. . . . . . . . . . . . . . 114,257 134,9555,900 Omnicell Inc.† . . . . . . . . . . . . . 68,687 89,91614,800 Patterson Companies Inc. . . . 440,968 476,412
500 PSS World Medical Inc.† . . . . 8,155 13,5755,375 Rochester Medical Corp.† . . . 55,049 61,7051,000 STERIS Corp. . . . . . . . . . . . . . . 29,319 34,5401,100 Syneron Medical Ltd.† . . . . . . 9,144 14,3441,000 Teleflex Inc. . . . . . . . . . . . . . . . 50,031 57,9804,900 Thoratec Corp.† . . . . . . . . . . . 132,376 127,0577,900 VCAAntech Inc.† . . . . . . . . . . 174,617 198,9223,300 Zoll Medical Corp.† . . . . . . . . 85,529 147,873
-------------------------------------- -------------------------------------1,598,880 1,899,690
-------------------------------------- -------------------------------------Health Care Providers and Services — 0.3%
10,500 AMN Healthcare ServicesInc.† . . . . . . . . . . . . . . . . . . . . 58,279 90,930
-------------------------------------- -------------------------------------IT Services — 0.7%
12,000 Heartland Payment SystemsInc. . . . . . . . . . . . . . . . . . . . . . 207,081 210,360
-------------------------------------- -------------------------------------Machinery — 2.8%
3,500 DXP Enterprises Inc.† . . . . . . 43,739 80,7801,150 Dynamic Materials Corp. . . . 33,061 32,14219,400 Flow International Corp.† . . . 83,064 85,1661,200 Gardner Denver Inc. . . . . . . . 38,672 93,6364,000 Lydall Inc.† . . . . . . . . . . . . . . . 35,570 35,5606,500 The Manitowoc Co. Inc. . . . . 43,760 142,22010,600 Trinity Industries Inc. . . . . . . . 258,094 388,702
-------------------------------------- -------------------------------------535,960 858,206
-------------------------------------- -------------------------------------Metals and Mining — 2.2%
2,700 5N Plus Inc.† . . . . . . . . . . . . . . 12,937 25,8163,000 AK Steel Holding Corp. . . . . 49,650 47,3403,900 Carpenter Technology Corp. . 163,157 166,5696,500 Century Aluminum Co.† . . . . 112,542 121,420950 Franco-Nevada Corp. . . . . . . . 21,629 34,874
9,300 Globe Specialty Metals Inc. . . 134,166 211,6681,700 Materion Corp.† . . . . . . . . . . . 25,979 69,360
-------------------------------------- -------------------------------------520,060 677,047
-------------------------------------- -------------------------------------Publishing — 0.6%
8,500 Belo Corp., Cl. A† . . . . . . . . . . 17,711 74,8853,900 Journal Communications Inc.,
Cl. A† . . . . . . . . . . . . . . . . . . 18,539 23,4001,900 Meredith Corp. . . . . . . . . . . . . 52,935 64,4482,500 The Dolan Co.† . . . . . . . . . . . . 27,630 30,350
-------------------------------------- -------------------------------------116,815 193,083
-------------------------------------- -------------------------------------Real Estate — 0.1%
1,200 Kennedy-Wilson HoldingsInc.† . . . . . . . . . . . . . . . . . . . . 11,926 13,032
-------------------------------------- -------------------------------------Restaurants — 0.2%
5,700 Denny’s Corp.† . . . . . . . . . . . . 13,949 23,1425,200 Morton’s Restaurant Group
Inc.† . . . . . . . . . . . . . . . . . . . . 33,000 37,492-------------------------------------- -------------------------------------
46,949 60,634-------------------------------------- -------------------------------------
Retail — 2.8%12,500 American Eagle Outfitters
Inc. . . . . . . . . . . . . . . . . . . . . . $ 188,254 $ 198,6254,700 Ethan Allen Interiors Inc. . . . 90,254 102,9303,300 Foot Locker Inc. . . . . . . . . . . . 46,557 65,0763,900 Saks Inc.† . . . . . . . . . . . . . . . . . 7,341 44,1094,100 Stage Stores Inc. . . . . . . . . . . . 67,492 78,80219,200 The Jones Group Inc. . . . . . . . 267,200 264,0006,900 The Wet Seal Inc., Cl. A† . . . . 23,184 29,5321,900 Williams-Sonoma Inc. . . . . . . 25,114 76,950
-------------------------------------- -------------------------------------715,396 860,024
-------------------------------------- -------------------------------------Semiconductors — 9.2%
23,700 Advanced AnalogicTechnologies Inc.† . . . . . . . 98,170 89,586
10,600 Advanced Energy IndustriesInc.† . . . . . . . . . . . . . . . . . . . . 162,653 173,310
5,600 Atmel Corp.† . . . . . . . . . . . . . . 28,728 76,32811,700 ATMI Inc.† . . . . . . . . . . . . . . . . 195,242 220,89613,000 Brooks Automation Inc.† . . . . 88,776 178,49013,000 Cascade Microtech Inc.† . . . . 74,326 80,3407,950 Cohu Inc. . . . . . . . . . . . . . . . . . 116,546 122,11216,600 Entegris Inc.† . . . . . . . . . . . . . . 32,145 145,58227,500 FormFactor Inc.† . . . . . . . . . . . 354,590 283,25015,000 FSI International Inc.† . . . . . . 23,016 65,70018,500 Integrated Device Technology
Inc.† . . . . . . . . . . . . . . . . . . . . 142,640 136,3455,000 Kulicke & Soffa Industries
Inc.† . . . . . . . . . . . . . . . . . . . . 10,089 46,7504,100 Microsemi Corp.† . . . . . . . . . . 41,022 84,9111,800 MKS Instruments Inc. . . . . . . 38,742 59,94010,600 ON Semiconductor Corp.† . . 69,162 104,6226,600 Pericom Semiconductor
Corp.† . . . . . . . . . . . . . . . . . . 58,279 68,4426,950 PLX Technology Inc.† . . . . . . 45,126 25,36747,600 Rubicon Ltd.† . . . . . . . . . . . . . 44,541 41,76713,000 Silicon Image Inc.† . . . . . . . . . 34,880 116,6106,000 STEC Inc.† . . . . . . . . . . . . . . . . 69,593 120,54012,800 Ultra Clean Holdings Inc.† . . 24,331 132,3521,550 Ultratech Inc.† . . . . . . . . . . . . . 20,411 45,5705,700 Varian Semiconductor
Equipment AssociatesInc.† . . . . . . . . . . . . . . . . . . . . 153,064 277,419
1,900 Veeco Instruments Inc.† . . . . . 62,119 96,596-------------------------------------- -------------------------------------
1,988,191 2,792,825-------------------------------------- -------------------------------------
Specialty Chemicals — 1.6%3,200 Arch Chemicals Inc. . . . . . . . . 96,125 133,0883,969 Ferro Corp.† . . . . . . . . . . . . . . . 49,408 65,8464,400 H.B. Fuller Co. . . . . . . . . . . . . . 99,098 94,5122,700 Olin Corp. . . . . . . . . . . . . . . . . 60,345 61,8842,200 Valspar Corp. . . . . . . . . . . . . . . 45,355 86,0202,650 Zep Inc. . . . . . . . . . . . . . . . . . . 41,708 46,137
-------------------------------------- -------------------------------------392,039 487,487
-------------------------------------- -------------------------------------Telecommunications — 1.2%
5,400 Atlantic Tele-Network Inc. . . 210,729 200,8266,700 Sierra Wireless Inc.† . . . . . . . . 72,655 73,23120,900 TeleCommunication Systems
Inc., Cl. A† . . . . . . . . . . . . . . 85,605 86,1085,800 UTStarcom Inc.† . . . . . . . . . . . 12,875 13,630
-------------------------------------- -------------------------------------381,864 373,795
-------------------------------------- -------------------------------------Transportation — 0.1%
1,600 Marten Transport Ltd. . . . . . . 35,539 35,680-------------------------------------- -------------------------------------
TOTAL COMMON STOCKS 21,740,694 28,817,414-------------------------------------- -------------------------------------
MarketShares Cost Value——–— —— ——–—
MarketShares Cost Value——–— —— ——–—

16
See accompanying notes to financial statements.
GAMCO Westwood SmallCap Equity FundSchedule of Investments (Continued) — March 31, 2011 (Unaudited)
Principal MarketAmount Cost Value————–— —— ——–—
U.S. GOVERNMENT OBLIGATIONS — 7.0%$2,150,000 U.S. Treasury Bills, 0.125%
to 0.160%††, 06/16/11 to09/22/11 . . . . . . . . . . . . . . . $ 2,148,889 $ 2,149,098
-------------------------------------- -------------------------------------TOTALINVESTMENTS— 101.7% $23,889,583 30,966,512
----------------------------------------------------------------------------Other Assets and Liabilities (Net) — (1.7)% . . (529,727)
-------------------------------------NET ASSETS — 100.0% . . . . . . . . . . . . . . . . . . . $30,436,785
--------------------------------------------------------------------------
† Non-income producing security.†† Represents annualized yield at date of purchase.

17
See accompanying notes to financial statements.
GAMCO Westwood Income FundSchedule of Investments — March 31, 2011 (Unaudited)
COMMON STOCKS — 86.3%Agriculture — 0.7%
1,000 Archer-Daniels-Midland Co. $ 28,410 $ 36,010------------------------------------ -----------------------------------
Automotive — 2.3%4,000 General Motors Co.† . . . . . . . 132,000 124,120
------------------------------------ -----------------------------------Banking — 3.6%
2,000 Bank of America Corp. . . . . . 27,640 26,6604,000 U.S. Bancorp . . . . . . . . . . . . . . 131,903 105,7204,574 Valley National Bancorp . . . . 81,811 63,853
------------------------------------ -----------------------------------241,354 196,233
------------------------------------ -----------------------------------Computer Hardware — 3.8%
500 Apple Inc.† . . . . . . . . . . . . . . . 45,563 174,225200 International Business
Machines Corp. . . . . . . . . . . 25,251 32,614------------------------------------ -----------------------------------
70,814 206,839------------------------------------ -----------------------------------
Computer Software and Services — 0.5%1,000 EMC Corp.† . . . . . . . . . . . . . . . 12,780 26,550
------------------------------------ -----------------------------------Consumer Products — 2.2%
2,000 Tupperware Brands Corp. . . . 96,142 119,420------------------------------------ -----------------------------------
Diversified Industrial — 4.5%6,000 General Electric Co. . . . . . . . . 94,338 120,3002,000 Honeywell International Inc. 78,538 119,420
------------------------------------ -----------------------------------172,876 239,720
------------------------------------ -----------------------------------Electronics — 3.0%
8,000 Intel Corp. . . . . . . . . . . . . . . . . 188,828 161,360------------------------------------ -----------------------------------
Energy and Utilities: Integrated — 0.9%1,334 FirstEnergy Corp. . . . . . . . . . . 50,482 49,478
------------------------------------ -----------------------------------Energy and Utilities: Natural Gas — 3.0%
6,000 Spectra Energy Corp. . . . . . . . 155,279 163,080------------------------------------ -----------------------------------
Energy and Utilities: Oil — 8.4%1,500 Chevron Corp. . . . . . . . . . . . . . 127,333 161,1452,500 ConocoPhillips . . . . . . . . . . . . 200,189 199,6501,000 Devon Energy Corp. . . . . . . . 47,078 91,770
------------------------------------ -----------------------------------374,600 452,565
------------------------------------ -----------------------------------Energy and Utilities: Services — 6.9%
5,000 Halliburton Co. . . . . . . . . . . . . 180,373 249,2001,000 Noble Corp. . . . . . . . . . . . . . . . 48,914 45,6201,000 Transocean Ltd.† . . . . . . . . . . . 82,810 77,950
------------------------------------ -----------------------------------312,097 372,770
------------------------------------ -----------------------------------Energy and Utilities: Water — 3.4%
6,500 American Water WorksCo. Inc. . . . . . . . . . . . . . . . . . 113,655 182,325
------------------------------------ -----------------------------------Financial Services — 5.7%
1 Alleghany Corp.† . . . . . . . . . . 104 10627,000 Citigroup Inc.† . . . . . . . . . . . . 121,500 119,3406,000 Wells Fargo & Co. . . . . . . . . . . 193,140 190,200
------------------------------------ -----------------------------------314,744 309,646
------------------------------------ -----------------------------------Food and Beverage — 13.4%
7,000 ConAgra Foods Inc. . . . . . . . . 174,145 166,2506,522 General Mills Inc. . . . . . . . . . . 193,302 238,3796,000 Kraft Foods Inc., Cl. A . . . . . . 196,380 188,1602,000 PepsiCo Inc. . . . . . . . . . . . . . . . 107,960 128,820
------------------------------------ -----------------------------------671,787 721,609
------------------------------------ -----------------------------------Health Care — 9.6%
2,883 Bristol-Myers Squibb Co. . . . 70,582 76,1981,500 Johnson & Johnson . . . . . . . . . 85,403 88,8752,520 Mead Johnson Nutrition Co. 107,163 145,9842,000 Merck & Co. Inc. . . . . . . . . . . . 70,774 66,0206,940 Pfizer Inc. . . . . . . . . . . . . . . . . . 146,422 140,951
------------------------------------ -----------------------------------480,344 518,028
------------------------------------ -----------------------------------
Paper and Forest Products — 2.8%5,000 International Paper Co. . . . . . $ 144,201 $ 150,900
------------------------------------ -----------------------------------Retail — 1.4%
2,000 The Home Depot Inc. . . . . . . . 79,247 74,120------------------------------------ -----------------------------------
Specialty Chemicals — 5.8%1,000 Air Products & Chemicals
Inc. . . . . . . . . . . . . . . . . . . . . . 78,554 90,1804,000 E. I. du Pont de Nemours
and Co. . . . . . . . . . . . . . . . . . 198,318 219,880------------------------------------ -----------------------------------
276,872 310,060------------------------------------ -----------------------------------
Telecommunications — 4.4%4,000 AT&T Inc. . . . . . . . . . . . . . . . . . 128,045 122,4003,000 Verizon Communications
Inc. . . . . . . . . . . . . . . . . . . . . . 118,791 115,620------------------------------------ -----------------------------------
246,836 238,020------------------------------------ -----------------------------------
TOTAL COMMON STOCKS 4,163,348 4,652,853------------------------------------ -----------------------------------
PREFERRED STOCKS — 8.5%Financial Services — 8.5%
12,000 Bank One Capital Trust VI,7.200% Pfd. . . . . . . . . . . . . . 305,738 308,280
5,900 Wells Fargo Capital Trust IV,7.000% Pfd. . . . . . . . . . . . . . 150,504 148,975
------------------------------------ -----------------------------------456,242 457,255
------------------------------------ -----------------------------------TOTAL PREFERREDSTOCKS . . . . . . . . . . . . . . . 456,242 457,255
------------------------------------ -----------------------------------PrincipalAmount---------------------------
CORPORATE BONDS — 4.6%Financial Services — 4.6%
$250,000 American Express CreditCorp., MTN,0.414%, 06/16/11 (a) . . . . . 250,000 250,061
------------------------------------ -----------------------------------TOTALINVESTMENTS— 99.4% . $ 4,869,590 5,360,169
------------------------------------------------------------------------Other Assets and Liabilities (Net) — 0.6% . . . . 33,162
-----------------------------------NET ASSETS — 100.0% . . . . . . . . . . . . . . . . . . . $ 5,393,331
----------------------------------------------------------------------
(a) Floating rate security. The rate disclosed is that in effect atMarch 31, 2011.
† Non-income producing security.MTN Medium Term Note
MarketShares Cost Value——–— —— ——–—
MarketShares Cost Value——–— —— ——–—

18
See accompanying notes to financial statements.
GAMCO Westwood Equity FundSchedule of Investments — March 31, 2011 (Unaudited)
COMMON STOCKS — 98.6%Aerospace — 4.1%
14,900 General Dynamics Corp. . . . . $ 1,151,680 $ 1,140,74423,300 Raytheon Co. . . . . . . . . . . . . . . 988,478 1,185,27131,000 The Boeing Co. . . . . . . . . . . . . 1,894,390 2,291,830
--------------------------------------- ------------------------------------------4,034,548 4,617,845
--------------------------------------- ------------------------------------------Automotive — 1.9%
69,900 General Motors Co.† . . . . . . . 2,463,312 2,168,997--------------------------------------- ------------------------------------------
Banking — 7.8%157,600 Bank of America Corp. . . . . . 2,399,667 2,100,80874,084 JPMorgan Chase & Co. . . . . . 2,134,433 3,415,272107,100 Wells Fargo & Co. . . . . . . . . . . 2,169,434 3,395,070
--------------------------------------- ------------------------------------------6,703,534 8,911,150
--------------------------------------- ------------------------------------------Broadcasting — 1.1%
51,100 CBS Corp., Cl. B, Non-Voting 1,014,101 1,279,544--------------------------------------- ------------------------------------------
Cable and Satellite — 2.0%92,500 Comcast Corp., Cl. A . . . . . . . 1,606,538 2,286,600
--------------------------------------- ------------------------------------------Communications Equipment — 1.0%
52,900 Corning Inc. . . . . . . . . . . . . . . . 823,599 1,091,327--------------------------------------- ------------------------------------------
Computer Hardware — 4.9%149,000 Dell Inc.† . . . . . . . . . . . . . . . . . 2,165,249 2,161,99014,200 International Business
Machines Corp. . . . . . . . . . . 1,636,084 2,315,594100,500 Xerox Corp. . . . . . . . . . . . . . . . 1,011,501 1,070,325
--------------------------------------- ------------------------------------------4,812,834 5,547,909
--------------------------------------- ------------------------------------------Computer Software and Services — 3.0%
88,900 Microsoft Corp. . . . . . . . . . . . . 2,471,963 2,254,50435,000 Oracle Corp. . . . . . . . . . . . . . . 638,744 1,167,950
--------------------------------------- ------------------------------------------3,110,707 3,422,454
--------------------------------------- ------------------------------------------Consumer Products — 2.0%
34,880 Philip Morris InternationalInc. . . . . . . . . . . . . . . . . . . . . . 1,666,724 2,289,174
--------------------------------------- ------------------------------------------Diversified Industrial — 4.0%
39,500 Honeywell International Inc. 1,575,221 2,358,54537,600 ITT Corp. . . . . . . . . . . . . . . . . . 1,758,739 2,257,880
--------------------------------------- ------------------------------------------3,333,960 4,616,425
--------------------------------------- ------------------------------------------Electronics — 3.0%
53,400 Intel Corp. . . . . . . . . . . . . . . . . 1,008,192 1,077,07866,200 TE Connectivity Ltd. . . . . . . . 2,397,109 2,305,084
--------------------------------------- ------------------------------------------3,405,301 3,382,162
--------------------------------------- ------------------------------------------Energy: Integrated — 4.1%
64,200 American Electric PowerCo. Inc. . . . . . . . . . . . . . . . . . 2,199,923 2,255,988
53,500 Dominion Resources Inc. . . . . 2,011,385 2,391,450--------------------------------------- ------------------------------------------
4,211,308 4,647,438--------------------------------------- ------------------------------------------
Energy: Natural Gas — 6.1%17,406 Apache Corp. . . . . . . . . . . . . . 1,291,302 2,278,79446,500 EQT Corp. . . . . . . . . . . . . . . . . 1,962,500 2,320,35043,900 Sempra Energy . . . . . . . . . . . . 2,266,128 2,348,650
--------------------------------------- ------------------------------------------5,519,930 6,947,794
--------------------------------------- ------------------------------------------Energy: Oil — 8.3%
30,100 Anadarko Petroleum Corp. . . 1,489,886 2,465,79222,100 Chevron Corp. . . . . . . . . . . . . . 1,528,097 2,374,20327,500 Exxon Mobil Corp. . . . . . . . . . 2,009,523 2,313,57522,010 Occidental Petroleum Corp. . 1,252,122 2,299,825
--------------------------------------- ------------------------------------------6,279,628 9,453,395
--------------------------------------- ------------------------------------------Entertainment — 2.1%
56,000 The Walt Disney Co. . . . . . . . 1,667,672 2,413,040--------------------------------------- ------------------------------------------
Financial Services — 12.1%35,100 ACE Ltd. . . . . . . . . . . . . . . . . . $ 1,694,663 $ 2,270,97042,300 Aflac Inc. . . . . . . . . . . . . . . . . . 2,064,394 2,232,59418,300 Ameriprise Financial Inc. . . . 778,063 1,117,76419,000 Franklin Resources Inc. . . . . . 2,052,467 2,376,52076,600 MetLife Inc. . . . . . . . . . . . . . . . 2,972,252 3,426,31836,400 The Allstate Corp. . . . . . . . . . . 1,152,605 1,156,79219,600 The Travelers Companies
Inc. . . . . . . . . . . . . . . . . . . . . . 758,554 1,165,808--------------------------------------- ------------------------------------------11,472,998 13,746,766
--------------------------------------- ------------------------------------------Food and Beverage — 0.9%
36,300 Sysco Corp. . . . . . . . . . . . . . . . 827,956 1,005,510--------------------------------------- ------------------------------------------
Health Care — 14.0%50,000 Abbott Laboratories . . . . . . . . 2,602,990 2,452,50045,500 Bristol-Myers Squibb Co. . . . 1,090,057 1,202,56543,000 Covidien plc . . . . . . . . . . . . . . 1,666,740 2,233,42056,900 Johnson & Johnson . . . . . . . . . 3,568,661 3,371,32530,300 Merck & Co. Inc. . . . . . . . . . . . 941,316 1,000,203168,400 Pfizer Inc. . . . . . . . . . . . . . . . . . 2,742,747 3,420,20445,500 Teva Pharmaceutical
Industries Ltd., ADR . . . . . 2,438,596 2,282,735--------------------------------------- ------------------------------------------15,051,107 15,962,952
--------------------------------------- ------------------------------------------Machinery — 1.1%
13,400 Deere & Co. . . . . . . . . . . . . . . . 589,822 1,298,326--------------------------------------- ------------------------------------------
Retail — 6.0%68,000 CVS Caremark Corp. . . . . . . . 1,979,162 2,333,760100,800 The Gap Inc. . . . . . . . . . . . . . . 1,898,934 2,284,12841,800 Wal-Mart Stores Inc. . . . . . . . . 2,270,021 2,175,690
--------------------------------------- ------------------------------------------6,148,117 6,793,578
--------------------------------------- ------------------------------------------Specialty Chemicals — 4.1%
42,100 E. I. du Pont de Nemoursand Co. . . . . . . . . . . . . . . . . . 1,324,109 2,314,237
61,200 The Dow Chemical Co. . . . . . 2,051,263 2,310,300--------------------------------------- ------------------------------------------
3,375,372 4,624,537--------------------------------------- ------------------------------------------
Telecommunications — 3.0%111,500 AT&T Inc. . . . . . . . . . . . . . . . . . 3,128,891 3,411,900
--------------------------------------- ------------------------------------------Transportation — 2.0%
23,300 Union Pacific Corp. . . . . . . . . 1,236,408 2,291,089--------------------------------------- ------------------------------------------
TOTAL COMMON STOCKS 92,484,367 112,209,912--------------------------------------- ------------------------------------------
SHORT-TERM INVESTMENTS — 0.0%Mutual Funds — 0.0%
49,204 Dreyfus Treasury & AgencyCash ManagementFund, 0.110% * . . . . . . . . . . . 49,204 49,204
--------------------------------------- ------------------------------------------TOTALINVESTMENTS— 98.6% . $ 92,533,571 112,259,116
------------------------------------------------------------------------------Other Assets and Liabilities (Net) — 1.4% . . . . 1,563,170
------------------------------------------NET ASSETS — 100.0% . . . . . . . . . . . . . . . . . . . $ 113,822,286
------------------------------------------------------------------------------------
† Non-income producing security.* Current yield.ADR American Depositary Receipt
MarketShares Cost Value——–— —— ——–—
MarketShares Cost Value——–— —— ——–—

19
See accompanying notes to financial statements.
GAMCO Westwood Balanced FundSchedule of Investments — March 31, 2011 (Unaudited)
COMMON STOCKS — 61.1%Aerospace — 2.6%
8,900 General Dynamics Corp. . . . . $ 687,941 $ 681,38414,100 Raytheon Co. . . . . . . . . . . . . . . 506,276 717,26722,000 The Boeing Co. . . . . . . . . . . . . 1,347,224 1,626,460
----------------------------------------- ------------------------------------------2,541,441 3,025,111
----------------------------------------- ------------------------------------------Automotive — 1.1%
42,000 General Motors Co.† . . . . . . . 1,478,357 1,303,260----------------------------------------- ------------------------------------------
Banking — 4.9%109,400 Bank of America Corp. . . . . . 1,655,876 1,458,30247,696 JPMorgan Chase & Co. . . . . . 1,195,039 2,198,78665,500 Wells Fargo & Co. . . . . . . . . . . 1,304,465 2,076,350
----------------------------------------- ------------------------------------------4,155,380 5,733,438
----------------------------------------- ------------------------------------------Broadcasting — 0.7%
31,100 CBS Corp., Cl. B, Non-Voting 617,229 778,744----------------------------------------- ------------------------------------------
Cable and Satellite — 1.3%63,100 Comcast Corp., Cl. A . . . . . . . 1,109,842 1,559,832
----------------------------------------- ------------------------------------------Communications Equipment — 0.6%
34,300 Corning Inc. . . . . . . . . . . . . . . . 542,534 707,609----------------------------------------- ------------------------------------------
Computer Hardware — 3.1%89,600 Dell Inc.† . . . . . . . . . . . . . . . . . 1,300,320 1,300,0969,400 International Business
Machines Corp. . . . . . . . . . . 1,040,899 1,532,85874,900 Xerox Corp. . . . . . . . . . . . . . . . 763,879 797,685
----------------------------------------- ------------------------------------------3,105,098 3,630,639
----------------------------------------- ------------------------------------------Computer Software and Services — 1.8%
56,100 Microsoft Corp. . . . . . . . . . . . . 1,505,984 1,422,69621,780 Oracle Corp. . . . . . . . . . . . . . . 390,559 726,799
----------------------------------------- ------------------------------------------1,896,543 2,149,495
----------------------------------------- ------------------------------------------Consumer Products — 1.6%
27,820 Philip Morris InternationalInc. . . . . . . . . . . . . . . . . . . . . . 1,272,269 1,825,827
----------------------------------------- ------------------------------------------Diversified Industrial — 2.4%
24,100 Honeywell International Inc. 959,161 1,439,01122,990 ITT Corp. . . . . . . . . . . . . . . . . . 1,064,808 1,380,550
----------------------------------------- ------------------------------------------2,023,969 2,819,561
----------------------------------------- ------------------------------------------Electronics — 1.9%
41,500 Intel Corp. . . . . . . . . . . . . . . . . 772,931 837,05539,600 TE Connectivity Ltd. . . . . . . . 1,433,953 1,378,872
----------------------------------------- ------------------------------------------2,206,884 2,215,927
----------------------------------------- ------------------------------------------Energy: Integrated — 2.4%
39,300 American Electric Power Co.Inc. . . . . . . . . . . . . . . . . . . . . . 1,336,155 1,381,002
33,200 Dominion Resources Inc. . . . . 1,239,473 1,484,040----------------------------------------- ------------------------------------------
2,575,628 2,865,042----------------------------------------- ------------------------------------------
Energy: Natural Gas — 3.8%12,655 Apache Corp. . . . . . . . . . . . . . 938,839 1,656,79328,200 EQT Corp. . . . . . . . . . . . . . . . . 1,189,587 1,407,18027,100 Sempra Energy . . . . . . . . . . . . 1,398,529 1,449,850
----------------------------------------- ------------------------------------------3,526,955 4,513,823
----------------------------------------- ------------------------------------------Energy: Oil — 4.9%
19,300 Anadarko Petroleum Corp. . . 962,887 1,581,05613,300 Chevron Corp. . . . . . . . . . . . . . 914,631 1,428,81916,700 Exxon Mobil Corp. . . . . . . . . . 1,146,479 1,404,97113,200 Occidental Petroleum Corp. . 639,332 1,379,268
----------------------------------------- ------------------------------------------3,663,329 5,794,114
----------------------------------------- ------------------------------------------Entertainment — 1.2%
33,700 The Walt Disney Co. . . . . . . . 926,566 1,452,133----------------------------------------- ------------------------------------------
Financial Services — 7.4%24,600 ACE Ltd. . . . . . . . . . . . . . . . . . $ 1,072,327 $ 1,591,62027,100 Aflac Inc. . . . . . . . . . . . . . . . . . 1,322,282 1,430,33811,000 Ameriprise Financial Inc. . . . 467,680 671,88013,200 Franklin Resources Inc. . . . . . 1,402,690 1,651,05646,100 MetLife Inc. . . . . . . . . . . . . . . . 1,780,409 2,062,05321,800 The Allstate Corp. . . . . . . . . . . 690,272 692,80411,700 The Travelers Companies
Inc. . . . . . . . . . . . . . . . . . . . . . 452,589 695,916----------------------------------------- ------------------------------------------
7,188,249 8,795,667----------------------------------------- ------------------------------------------
Food and Beverage — 0.5%23,100 Sysco Corp. . . . . . . . . . . . . . . . 526,894 639,870
----------------------------------------- ------------------------------------------Health Care — 8.4%
30,300 Abbott Laboratories . . . . . . . . 1,583,237 1,486,21527,400 Bristol-Myers Squibb Co. . . . 653,900 724,18225,700 Covidien plc . . . . . . . . . . . . . . 970,931 1,334,85835,700 Johnson & Johnson . . . . . . . . . 2,270,988 2,115,22522,900 Merck & Co. Inc. . . . . . . . . . . . 693,104 755,929107,200 Pfizer Inc. . . . . . . . . . . . . . . . . . 1,737,312 2,177,23227,500 Teva Pharmaceutical
Industries Ltd., ADR . . . . . 1,493,597 1,379,675----------------------------------------- ------------------------------------------
9,403,069 9,973,316----------------------------------------- ------------------------------------------
Machinery — 0.8%10,100 Deere & Co. . . . . . . . . . . . . . . . 449,473 978,589
----------------------------------------- ------------------------------------------Retail — 3.9%
46,700 CVS Caremark Corp. . . . . . . . 1,332,084 1,602,74474,900 The Gap Inc. . . . . . . . . . . . . . . 1,372,905 1,697,23425,700 Wal-Mart Stores Inc. . . . . . . . . 1,395,735 1,337,685
----------------------------------------- ------------------------------------------4,100,724 4,637,663
----------------------------------------- ------------------------------------------Specialty Chemicals — 2.6%
28,600 E. I. du Pont de Nemoursand Co. . . . . . . . . . . . . . . . . . 904,240 1,572,142
39,600 The Dow Chemical Co. . . . . . 1,322,364 1,494,900----------------------------------------- ------------------------------------------
2,226,604 3,067,042----------------------------------------- ------------------------------------------
Telecommunications — 1.9%72,900 AT&T Inc. . . . . . . . . . . . . . . . . . 2,119,490 2,230,740
----------------------------------------- ------------------------------------------Transportation — 1.3%
15,800 Union Pacific Corp. . . . . . . . . 829,342 1,553,614----------------------------------------- ------------------------------------------
TOTAL COMMON STOCKS 58,485,869 72,251,056----------------------------------------- ------------------------------------------
SHORT-TERM INVESTMENTS — 3.5%Mutual Funds — 3.5%
4,168,299 Dreyfus Treasury & AgencyCash Management Fund,0.110% * . . . . . . . . . . . . . . . . 4,168,299 4,168,299
----------------------------------------- ------------------------------------------PrincipalAmount---------------------------
CORPORATE BONDS — 14.2%Banking — 3.3%
$ 1,250,000 Bank of America Corp.,5.375%, 06/15/14 . . . . . . . . 1,272,489 1,338,605
500,000 Barclays Bank plc, Ser. 1,5.000%, 09/22/16 . . . . . . . . 511,496 530,724
1,125,000 Citigroup Inc.,5.500%, 10/15/14 . . . . . . . . 1,128,140 1,214,401
750,000 JPMorgan Chase & Co.,6.300%, 04/23/19 . . . . . . . . 771,172 831,491
----------------------------------------- ------------------------------------------3,683,297 3,915,221
----------------------------------------- ------------------------------------------Computer Software and Services — 0.7%
750,000 Oracle Corp.,4.950%, 04/15/13 . . . . . . . . 750,184 808,342
----------------------------------------- ------------------------------------------
MarketShares Cost Value——–— —— ——–—
MarketShares Cost Value——–— —— ——–—
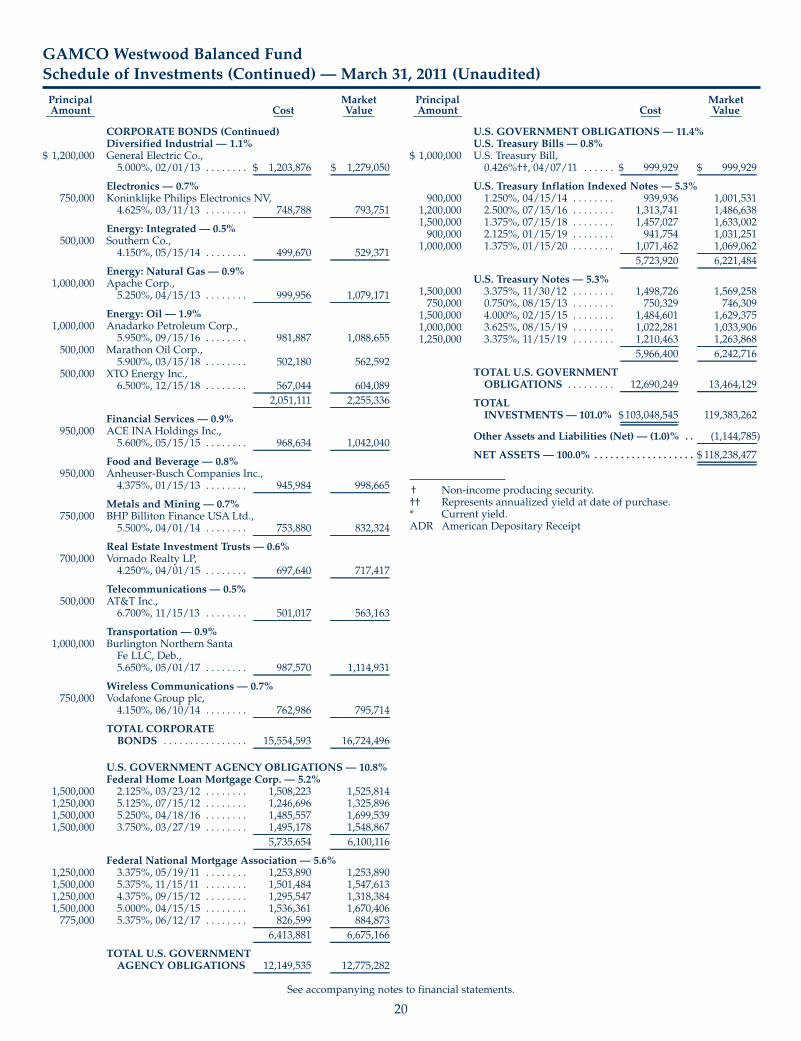
20
See accompanying notes to financial statements.
GAMCO Westwood Balanced FundSchedule of Investments (Continued) — March 31, 2011 (Unaudited)
CORPORATE BONDS (Continued)Diversified Industrial — 1.1%
$ 1,200,000 General Electric Co.,5.000%, 02/01/13 . . . . . . . . $ 1,203,876 $ 1,279,050
----------------------------------------- ------------------------------------------Electronics — 0.7%
750,000 Koninklijke Philips Electronics NV,4.625%, 03/11/13 . . . . . . . . 748,788 793,751
----------------------------------------- ------------------------------------------Energy: Integrated — 0.5%
500,000 Southern Co.,4.150%, 05/15/14 . . . . . . . . 499,670 529,371
----------------------------------------- ------------------------------------------Energy: Natural Gas — 0.9%
1,000,000 Apache Corp.,5.250%, 04/15/13 . . . . . . . . 999,956 1,079,171
----------------------------------------- ------------------------------------------Energy: Oil — 1.9%
1,000,000 Anadarko Petroleum Corp.,5.950%, 09/15/16 . . . . . . . . 981,887 1,088,655
500,000 Marathon Oil Corp.,5.900%, 03/15/18 . . . . . . . . 502,180 562,592
500,000 XTO Energy Inc.,6.500%, 12/15/18 . . . . . . . . 567,044 604,089
----------------------------------------- ------------------------------------------2,051,111 2,255,336
----------------------------------------- ------------------------------------------Financial Services — 0.9%
950,000 ACE INAHoldings Inc.,5.600%, 05/15/15 . . . . . . . . 968,634 1,042,040
----------------------------------------- ------------------------------------------Food and Beverage — 0.8%
950,000 Anheuser-Busch Companies Inc.,4.375%, 01/15/13 . . . . . . . . 945,984 998,665
----------------------------------------- ------------------------------------------Metals and Mining — 0.7%
750,000 BHP Billiton Finance USA Ltd.,5.500%, 04/01/14 . . . . . . . . 753,880 832,324
----------------------------------------- ------------------------------------------Real Estate Investment Trusts — 0.6%
700,000 Vornado Realty LP,4.250%, 04/01/15 . . . . . . . . 697,640 717,417
----------------------------------------- ------------------------------------------Telecommunications — 0.5%
500,000 AT&T Inc.,6.700%, 11/15/13 . . . . . . . . 501,017 563,163
----------------------------------------- ------------------------------------------Transportation — 0.9%
1,000,000 Burlington Northern SantaFe LLC, Deb.,5.650%, 05/01/17 . . . . . . . . 987,570 1,114,931
----------------------------------------- ------------------------------------------Wireless Communications — 0.7%
750,000 Vodafone Group plc,4.150%, 06/10/14 . . . . . . . . 762,986 795,714
----------------------------------------- ------------------------------------------TOTAL CORPORATEBONDS . . . . . . . . . . . . . . . . 15,554,593 16,724,496
----------------------------------------- ------------------------------------------
U.S. GOVERNMENT AGENCY OBLIGATIONS — 10.8%Federal Home Loan Mortgage Corp. — 5.2%
1,500,000 2.125%, 03/23/12 . . . . . . . . 1,508,223 1,525,8141,250,000 5.125%, 07/15/12 . . . . . . . . 1,246,696 1,325,8961,500,000 5.250%, 04/18/16 . . . . . . . . 1,485,557 1,699,5391,500,000 3.750%, 03/27/19 . . . . . . . . 1,495,178 1,548,867
----------------------------------------- ------------------------------------------5,735,654 6,100,116
----------------------------------------- ------------------------------------------Federal National Mortgage Association — 5.6%
1,250,000 3.375%, 05/19/11 . . . . . . . . 1,253,890 1,253,8901,500,000 5.375%, 11/15/11 . . . . . . . . 1,501,484 1,547,6131,250,000 4.375%, 09/15/12 . . . . . . . . 1,295,547 1,318,3841,500,000 5.000%, 04/15/15 . . . . . . . . 1,536,361 1,670,406775,000 5.375%, 06/12/17 . . . . . . . . 826,599 884,873
----------------------------------------- ------------------------------------------6,413,881 6,675,166
----------------------------------------- ------------------------------------------TOTAL U.S. GOVERNMENTAGENCY OBLIGATIONS 12,149,535 12,775,282
----------------------------------------- ------------------------------------------
U.S. GOVERNMENT OBLIGATIONS — 11.4%U.S. Treasury Bills — 0.8%
$ 1,000,000 U.S. Treasury Bill,0.426%††, 04/07/11 . . . . . . $ 999,929 $ 999,929
----------------------------------------- ------------------------------------------U.S. Treasury Inflation Indexed Notes — 5.3%
900,000 1.250%, 04/15/14 . . . . . . . . 939,936 1,001,5311,200,000 2.500%, 07/15/16 . . . . . . . . 1,313,741 1,486,6381,500,000 1.375%, 07/15/18 . . . . . . . . 1,457,027 1,633,002900,000 2.125%, 01/15/19 . . . . . . . . 941,754 1,031,251
1,000,000 1.375%, 01/15/20 . . . . . . . . 1,071,462 1,069,062----------------------------------------- ------------------------------------------
5,723,920 6,221,484----------------------------------------- ------------------------------------------
U.S. Treasury Notes — 5.3%1,500,000 3.375%, 11/30/12 . . . . . . . . 1,498,726 1,569,258750,000 0.750%, 08/15/13 . . . . . . . . 750,329 746,309
1,500,000 4.000%, 02/15/15 . . . . . . . . 1,484,601 1,629,3751,000,000 3.625%, 08/15/19 . . . . . . . . 1,022,281 1,033,9061,250,000 3.375%, 11/15/19 . . . . . . . . 1,210,463 1,263,868
----------------------------------------- ------------------------------------------5,966,400 6,242,716
----------------------------------------- ------------------------------------------TOTAL U.S. GOVERNMENTOBLIGATIONS . . . . . . . . . 12,690,249 13,464,129
----------------------------------------- ------------------------------------------TOTALINVESTMENTS— 101.0% $103,048,545 119,383,262
----------------------------------------------------------------------------------Other Assets and Liabilities (Net) — (1.0)% . . (1,144,785)
------------------------------------------NET ASSETS — 100.0% . . . . . . . . . . . . . . . . . . . $ 118,238,477
------------------------------------------------------------------------------------
† Non-income producing security.†† Represents annualized yield at date of purchase.* Current yield.ADR American Depositary Receipt
Principal MarketAmount Cost Value————–— —— ——–—
Principal MarketAmount Cost Value————–— —— ——–—

21
See accompanying notes to financial statements.
GAMCO Westwood Intermediate Bond FundSchedule of Investments — March 31, 2011 (Unaudited)
SHORT-TERM INVESTMENTS — 3.7%Mutual Funds — 3.7%
610,036 Dreyfus Treasury & AgencyCash Management Fund,0.110% * . . . . . . . . . . . . . . . . $ 610,036 $ 610,036
--------------------------------------- ---------------------------------------PrincipalAmount---------------------------
CORPORATE BONDS — 42.5%Aerospace — 1.4%
$ 200,000 The Boeing Co.,6.000%, 03/15/19 . . . . . . . . 204,653 230,490
--------------------------------------- ---------------------------------------Banking — 6.4%
300,000 Bank of America Corp.,5.375%, 06/15/14 . . . . . . . . 305,397 321,265
225,000 Barclays Bank plc, Ser. 1,5.000%, 09/22/16 . . . . . . . . 225,967 238,826
250,000 Citigroup Inc.,5.500%, 10/15/14 . . . . . . . . 250,698 269,867
200,000 JPMorgan Chase & Co.,6.300%, 04/23/19 . . . . . . . . 198,882 221,731
--------------------------------------- ---------------------------------------980,944 1,051,689
--------------------------------------- ---------------------------------------Computer Hardware — 1.2%
200,000 Hewlett-Packard Co.,2.250%, 05/27/11 . . . . . . . . 200,166 200,166
--------------------------------------- ---------------------------------------Computer Software and Services — 2.5%
250,000 Microsoft Corp.,1.625%, 09/25/15 . . . . . . . . 249,824 242,296
150,000 Oracle Corp.,4.950%, 04/15/13 . . . . . . . . 149,977 161,669
--------------------------------------- ---------------------------------------399,801 403,965
--------------------------------------- ---------------------------------------Consumer Products — 1.1%
150,000 Philip Morris International Inc.,6.875%, 03/17/14 . . . . . . . . 150,506 172,276
--------------------------------------- ---------------------------------------Diversified Industrial — 1.6%
250,000 General Electric Co.,5.000%, 02/01/13 . . . . . . . . 250,807 266,469
--------------------------------------- ---------------------------------------Electronics — 2.6%
200,000 Arrow Electronics Inc.,6.000%, 04/01/20 . . . . . . . . 199,801 212,035
200,000 Koninklijke PhilipsElectronics NV,4.625%, 03/11/13 . . . . . . . . 199,709 211,667
--------------------------------------- ---------------------------------------399,510 423,702
--------------------------------------- ---------------------------------------Energy and Utilities: Electric Integrated — 2.9%
275,000 Dominion Resources Inc.,6.400%, 06/15/18 . . . . . . . . 330,932 314,430
150,000 Southern Co.,4.150%, 05/15/14 . . . . . . . . 149,901 158,811
--------------------------------------- ---------------------------------------480,833 473,241
--------------------------------------- ---------------------------------------Energy and Utilities: Natural Gas — 1.3%
200,000 Apache Corp.,5.250%, 04/15/13 . . . . . . . . 199,813 215,834
--------------------------------------- ---------------------------------------Energy and Utilities: Oil — 3.7%
200,000 Anadarko Petroleum Corp.,5.950%, 09/15/16 . . . . . . . . 196,379 217,731
125,000 Marathon Oil Corp.,5.900%, 03/15/18 . . . . . . . . 125,545 140,648
200,000 XTO Energy Inc.,6.500%, 12/15/18 . . . . . . . . 226,818 241,636
--------------------------------------- ---------------------------------------548,742 600,015
--------------------------------------- ---------------------------------------
Financial Services — 6.9%$ 175,000 ACE INAHoldings Inc.,
5.600%, 05/15/15 . . . . . . . . $ 174,599 $ 191,955300,000 Berkshire Hathaway Finance
Corp.,5.125%, 09/15/12 . . . . . . . . 311,570 317,771
260,000 International Bank forReconstruction &Development,8.625%, 10/15/16 . . . . . . . . 293,967 333,562
275,000 Merrill Lynch & Co. Inc., MTN,Series C,5.000%, 01/15/15 . . . . . . . . 275,122 291,187
--------------------------------------- ---------------------------------------1,055,258 1,134,475
--------------------------------------- ---------------------------------------Food and Beverage — 4.5%
250,000 Anheuser-Busch Companies Inc.,4.375%, 01/15/13 . . . . . . . . 248,946 262,807
200,000 Dr Pepper Snapple Group Inc.,2.350%, 12/21/12 . . . . . . . . 199,960 203,992
250,000 Kraft Foods Inc.,5.375%, 02/10/20 . . . . . . . . 254,104 264,402
--------------------------------------- ---------------------------------------703,010 731,201
--------------------------------------- ---------------------------------------Metals and Mining — 1.4%
200,000 BHP Billiton Finance USA Ltd.,5.500%, 04/01/14 . . . . . . . . 201,035 221,953
--------------------------------------- ---------------------------------------Real Estate Investment Trusts — 1.6%
250,000 Vornado Realty LP,4.250%, 04/01/15 . . . . . . . . 249,236 256,221
--------------------------------------- ---------------------------------------Telecommunications — 1.2%
175,000 AT&T Inc.,6.700%, 11/15/13 . . . . . . . . 175,357 197,107
--------------------------------------- ---------------------------------------Transportation — 2.2%
200,000 Burlington Northern Santa FeLLC, Deb.,5.650%, 05/01/17 . . . . . . . . 199,332 222,986
125,000 CSX Corp.,6.250%, 04/01/15 . . . . . . . . 124,956 141,446
--------------------------------------- ---------------------------------------324,288 364,432
--------------------------------------- ---------------------------------------TOTAL CORPORATEBONDS . . . . . . . . . . . . . . . . 6,523,959 6,943,236
--------------------------------------- ---------------------------------------
U.S. GOVERNMENT AGENCY OBLIGATIONS — 27.4%Federal Home Loan Bank — 1.7%
250,000 5.375%, 05/18/16 . . . . . . . . 250,955 284,860--------------------------------------- ---------------------------------------
Federal Home Loan Mortgage Corp. — 10.1%400,000 2.125%, 03/23/12 . . . . . . . . 402,451 406,884250,000 5.125%, 07/15/12 . . . . . . . . 253,945 265,179225,000 5.000%, 07/15/14 . . . . . . . . 243,142 249,711325,000 5.250%, 04/18/16 . . . . . . . . 356,546 368,233350,000 3.750%, 03/27/19 . . . . . . . . 345,204 361,402
--------------------------------------- ---------------------------------------1,601,288 1,651,409
--------------------------------------- ---------------------------------------Federal National Mortgage Association — 13.3%
350,000 3.375%, 05/19/11 . . . . . . . . 350,859 350,859250,000 4.375%, 09/15/12 . . . . . . . . 259,141 263,677375,000 4.375%, 03/15/13 . . . . . . . . 391,304 400,760350,000 2.750%, 02/05/14 . . . . . . . . 362,302 363,898300,000 5.000%, 04/15/15 . . . . . . . . 308,338 334,081275,000 5.375%, 06/12/17 . . . . . . . . 293,309 313,98762,235 Pool #745122,
5.500%, 09/01/20 . . . . . . 62,005 67,62967,329 Pool #255554,
5.500%, 01/01/35 . . . . . . 68,116 72,427--------------------------------------- ---------------------------------------
2,095,374 2,167,318--------------------------------------- ---------------------------------------
MarketShares Cost Value————–— —— ——–—
Principal MarketAmount Cost Value————–— —— ——–—
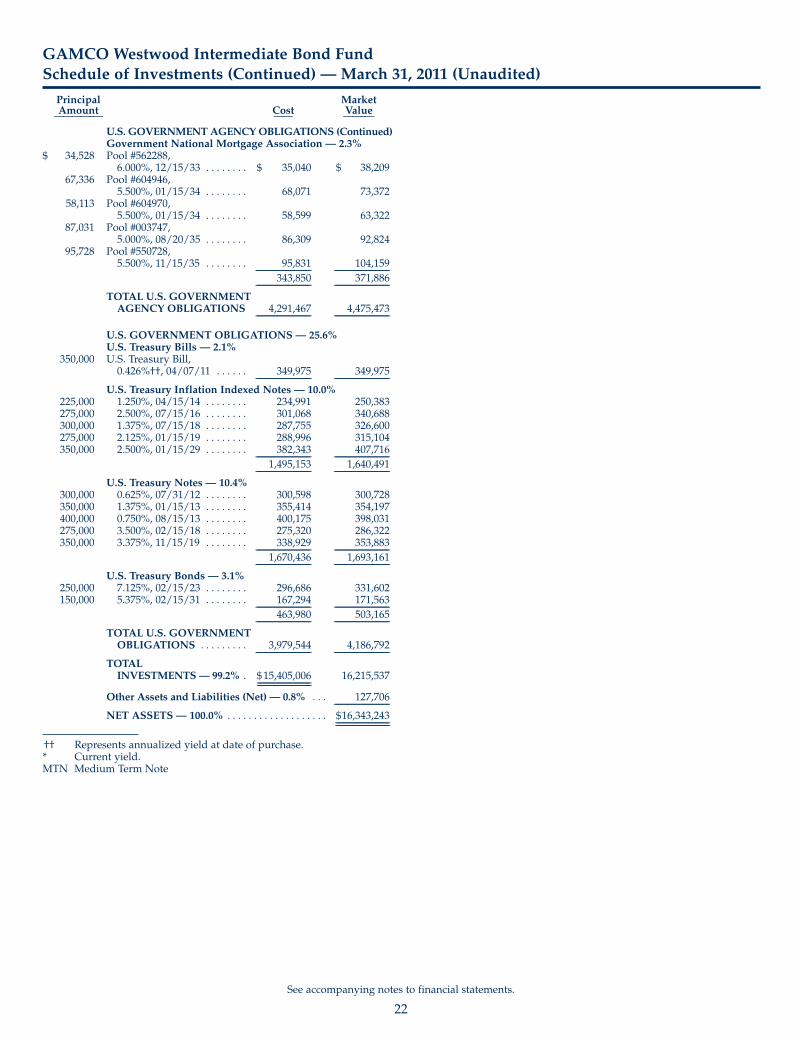
22
See accompanying notes to financial statements.
GAMCO Westwood Intermediate Bond FundSchedule of Investments (Continued) — March 31, 2011 (Unaudited)
U.S. GOVERNMENTAGENCYOBLIGATIONS (Continued)Government National Mortgage Association — 2.3%
$ 34,528 Pool #562288,6.000%, 12/15/33 . . . . . . . . $ 35,040 $ 38,209
67,336 Pool #604946,5.500%, 01/15/34 . . . . . . . . 68,071 73,372
58,113 Pool #604970,5.500%, 01/15/34 . . . . . . . . 58,599 63,322
87,031 Pool #003747,5.000%, 08/20/35 . . . . . . . . 86,309 92,824
95,728 Pool #550728,5.500%, 11/15/35 . . . . . . . . 95,831 104,159
--------------------------------------- ---------------------------------------343,850 371,886
--------------------------------------- ---------------------------------------TOTAL U.S. GOVERNMENTAGENCY OBLIGATIONS 4,291,467 4,475,473
--------------------------------------- ---------------------------------------
U.S. GOVERNMENT OBLIGATIONS — 25.6%U.S. Treasury Bills — 2.1%
350,000 U.S. Treasury Bill,0.426%††, 04/07/11 . . . . . . 349,975 349,975
--------------------------------------- ---------------------------------------U.S. Treasury Inflation Indexed Notes — 10.0%
225,000 1.250%, 04/15/14 . . . . . . . . 234,991 250,383275,000 2.500%, 07/15/16 . . . . . . . . 301,068 340,688300,000 1.375%, 07/15/18 . . . . . . . . 287,755 326,600275,000 2.125%, 01/15/19 . . . . . . . . 288,996 315,104350,000 2.500%, 01/15/29 . . . . . . . . 382,343 407,716
--------------------------------------- ---------------------------------------1,495,153 1,640,491
--------------------------------------- ---------------------------------------U.S. Treasury Notes — 10.4%
300,000 0.625%, 07/31/12 . . . . . . . . 300,598 300,728350,000 1.375%, 01/15/13 . . . . . . . . 355,414 354,197400,000 0.750%, 08/15/13 . . . . . . . . 400,175 398,031275,000 3.500%, 02/15/18 . . . . . . . . 275,320 286,322350,000 3.375%, 11/15/19 . . . . . . . . 338,929 353,883
--------------------------------------- ---------------------------------------1,670,436 1,693,161
--------------------------------------- ---------------------------------------U.S. Treasury Bonds — 3.1%
250,000 7.125%, 02/15/23 . . . . . . . . 296,686 331,602150,000 5.375%, 02/15/31 . . . . . . . . 167,294 171,563
--------------------------------------- ---------------------------------------463,980 503,165
--------------------------------------- ---------------------------------------TOTAL U.S. GOVERNMENTOBLIGATIONS . . . . . . . . . 3,979,544 4,186,792
--------------------------------------- ---------------------------------------TOTALINVESTMENTS— 99.2% . $15,405,006 16,215,537
----------------------------------------------------------------------------Other Assets and Liabilities (Net) — 0.8% . . . 127,706
---------------------------------------NET ASSETS — 100.0% . . . . . . . . . . . . . . . . . . . $16,343,243
----------------------------------------------------------------------------
†† Represents annualized yield at date of purchase.* Current yield.MTN Medium Term Note
Principal MarketAmount Cost Value————–— —— ——–—

23
See accompanying notes to financial statements.
GAMCO Westwood FundsStatements of Assets and LiabilitiesMarch 31, 2011 (Unaudited)
Mighty SmallCap Income Equity Balanced IntermediateMitesSM Fund Equity Fund Fund Fund Fund Bond Fund———–——— ———–——— ———–——— ———–——— ———–——— ———–———Assets:
Investments, at value (cost $529,692,782, $23,889,583,$4,869,590, $92,533,571, $103,048,545, and$15,405,006, respectively) . . . . . . . . . . . . . . . . . . . . . . . . $662,722,205 $30,966,512 $5,360,169 $112,259,116 $119,383,262 $16,215,537
Investments in affiliates, at value (cost $7,686,753) . . . 9,569,126 — — — — —Cash . . . . . . . . . . . . . . . . . . . . . . . . . . . . . . . . . . . . . . . . . . . 2,370 32,056 41,210 — — —Receivable for Fund shares issued . . . . . . . . . . . . . . . . . 5,169,523 670,840 36 95,383 345,580 2,609Receivable for investments sold . . . . . . . . . . . . . . . . . . . 45,054 — 196,681 2,480,961 823,313 —Dividends and interest receivable . . . . . . . . . . . . . . . . . . 147,141 11,843 7,496 169,963 569,861 151,897Prepaid expenses . . . . . . . . . . . . . . . . . . . . . . . . . . . . . . . . 67,774 26,523 23,518 39,524 37,964 26,840
—–––————— —–———— —–—–—–— —–––————— —–––————— —–————Total Assets . . . . . . . . . . . . . . . . . . . . . . . . . . . . . . . . . . . . . 677,723,193 31,707,774 5,629,110 115,044,947 121,159,980 16,396,883
—–––————— —–———— —–—–—–— —–––————— —–––————— —–————Liabilities:
Payable for investments purchased . . . . . . . . . . . . . . . . 4,479,125 1,017,255 202,921 799,926 1,689,030 —Payable for Fund shares redeemed . . . . . . . . . . . . . . . . . 798,823 189,682 — 191,176 1,041,260 118Distributions payable . . . . . . . . . . . . . . . . . . . . . . . . . . . . — — — — — 12,766Payable for investment advisory fees . . . . . . . . . . . . . . . 532,649 19,808 431 96,237 75,333 1,918Payable for distribution fees . . . . . . . . . . . . . . . . . . . . . . . 197,358 8,875 1,204 25,658 29,008 3,867Payable for accounting fees . . . . . . . . . . . . . . . . . . . . . . . 7,500 — — 7,500 7,500 —Payable for legal and audit fees . . . . . . . . . . . . . . . . . . . . 75,550 25,935 24,944 31,897 33,000 24,772Payable for shareholder communications expenses . . . 63,501 3,038 2,069 30,175 23,596 2,917Payable for shareholder services fees . . . . . . . . . . . . . . . 67,159 4,316 2,876 39,002 21,751 3,553Other accrued expenses . . . . . . . . . . . . . . . . . . . . . . . . . . 2,724 2,080 1,334 1,090 1,025 3,729
—–––————— —–———— —–—–—–— —–––————— —–––————— —–————Total Liabilities . . . . . . . . . . . . . . . . . . . . . . . . . . . . . . . . . 6,224,389 1,270,989 235,779 1,222,661 2,921,503 53,640
—–––————— —–———— —–—–—–— —–––————— —–––————— —–————Net Assets . . . . . . . . . . . . . . . . . . . . . . . . . . . . . . . . . . . . . . $671,498,804 $30,436,785 $5,393,331 $113,822,286 $118,238,477 $16,343,243
—–––————— —–———— —–—–—–— —–––————— —–––————— —–—————–––————— —–———— —–—–—–— —–––————— —–––————— —–————Net Assets Consist of:Paid-in capital . . . . . . . . . . . . . . . . . . . . . . . . . . . . . . . . . . . $529,292,882 $28,276,593 $7,561,609 $119,948,296 $113,271,766 $15,415,693Accumulated net investment income/(loss) . . . . . . . . . (5,964,275) (94,844) 376 170,377 12,782 4,905Accumulated net realized gain/(loss) on investmentsand foreign currency transactions . . . . . . . . . . . . . . . . 13,258,360 (4,821,894) (2,659,233) (26,021,932) (11,380,788) 112,114
Net unrealized appreciation on investments . . . . . . . . . 134,911,796 7,076,929 490,579 19,725,545 16,334,717 810,531Net unrealized appreciation on foreign currency . . . . . 41 1 — — — —
—–––————— —–———— —–—–—–— —–––————— —–––————— —–————Net Assets . . . . . . . . . . . . . . . . . . . . . . . . . . . . . . . . . . . . . . $671,498,804 $30,436,785 $5,393,331 $113,822,286 $118,238,477 $16,343,243
—–––————— —–———— —–—–—–— —–––————— —–––————— —–—————–––————— —–———— —–—–—–— —–––————— —–––————— —–————Shares of Beneficial Interest each at $0.001 par value;unlimited number of shares authorized:Class AAA:Net assets . . . . . . . . . . . . . . . . . . . . . . . . . . . . . . . . . . . . . . . $444,192,860 $19,487,097 $5,172,537 $106,418,922 $106,398,044 $15,095,590
—–––————— —–———— —–—–—–— —–––————— —–––————— —–—————–––————— —–———— —–—–—–— —–––————— —–––————— —–————Shares of beneficial interest outstanding . . . . . . . . . . . . 24,408,507 1,093,428 606,178 11,188,813 9,624,260 1,301,423
—–––———— ——–—— —–—— —–––———— —–––———— —–————–––———— ——–—— —–—— —–––———— —–––———— —–———Net Asset Value, offering, and redemption price per share $18.20 $17.82 $8.53 $9.51 $11.06 $11.60
—–––—— —–––—— ——— ——— —–––—— —–––———–––—— —–––—— ——— ——— —–––—— —–––——Class A:Net assets . . . . . . . . . . . . . . . . . . . . . . . . . . . . . . . . . . . . . . . $89,344,942 $5,905,154 $47,487 $5,425,568 $4,971,451 $529,640
—–———— —–––———— ———— —–––———— —–––———— —————–———— —–––———— ———— —–––———— —–––———— ————Shares of beneficial interest outstanding . . . . . . . . . . . . 4,985,710 336,189 5,380 572,175 447,795 45,669
—–——— —–—— ——— —–——— —–—— ————–——— —–—— ——— —–——— —–—— ———Net Asset Value and redemption price per share . . . . $17.92 $17.56 $8.83 $9.48 $11.10 $11.60
—–––—— —–––—— ——— ——— —–––—— —–––———–––—— —–––—— ——— ——— —–––—— —–––——Maximum offering price per share (NAV ÷ 0.96, based onmaximum sales charge of 4.00% of the offering price) $18.67 $18.29 $9.20 $9.88 $11.56 $12.08
—–––—— —–––—— ——— ——— —–––—— —–––———–––—— —–––—— ——— ——— —–––—— —–––——Class B:Net assets . . . . . . . . . . . . . . . . . . . . . . . . . . . . . . . . . . . . . . . $45,249 $7,372 $— $— $42,396 $30,306
—–——— —–––—— —–— —–––—— —–——— —–————–——— —–––—— —–— —–––—— —–——— —–———Shares of beneficial interest outstanding . . . . . . . . . . . . 2,690 441 — — 3,784 2,613
—–––—— —––– —–— ——— ——— ————–––—— —––– —–— ——— ——— ———Net Asset Value and offering price per share(a) . . . . . $16.82 $16.72 $— $— $11.20 $11.60
—–––—— —–––—— —–— ——— —–––—— —–––———–––—— —–––—— —–— ——— —–––—— —–––——Class C:Net assets . . . . . . . . . . . . . . . . . . . . . . . . . . . . . . . . . . . . . . . $90,105,962 $4,200,071 $101,687 $1,041,848 $5,053,206 $564,564
—–———— ——–––——— ——–—— ——–––——— —–––———— –––—————–———— ——–––——— ——–—— ——–––——— —–––———— –––————Shares of beneficial interest outstanding . . . . . . . . . . . . 5,391,607 253,320 10,734 112,786 450,908 51,193
—–——— ——— ——— —–——— —–——— —–————–——— ——— ——— —–——— —–——— —–———Net Asset Value and offering price per share(a) . . . . . $16.71 $16.58 $9.47 $9.24 $11.21 $11.03
—–––—— —–––—— ——— ——— —–––—— —–––———–––—— —–––—— ——— ——— —–––—— —–––——Class I:Net assets . . . . . . . . . . . . . . . . . . . . . . . . . . . . . . . . . . . . . . . $47,809,791 $837,091 $71,620 $935,948 $1,773,380 $123,143
—–———— –––———— —–—— –––———— —–––———— —————–———— –––———— —–—— –––———— —–––———— ————Shares of beneficial interest outstanding . . . . . . . . . . . . 2,609,047 46,608 8,390 98,338 160,496 10,607
—–——— —–––—— ——— —–——— —–——— —–––———–——— —–––—— ——— —–——— —–——— —–––——Net Asset Value, offering, and redemption price per share $18.32 $17.96 $8.54 $9.52 $11.05 $11.61
—–––—— —–––—— ——— ——— —–––—— —–––———–––—— —–––—— ——— ——— —–––—— —–––——
(a) Redemption price varies based on the length of time held.

24
See accompanying notes to financial statements.
GAMCO Westwood FundsStatements of OperationsFor the Six Months Ended March 31, 2011 (Unaudited)
Mighty SmallCap Income Equity Balanced IntermediateMitesSM Fund Equity Fund Fund Fund Fund Bond Fund———–——— ————–—— ————— ————— ——–——— ———–———
Investment Income:Dividends - unaffiliated (net of foreign withholdingtaxes of $2,129, $304, $0, $0, $277, and $0,respectively) . . . . . . . . . . . . . . . . . . . . . . . . . . . . . . . . . . . $ 1,726,679 $ 85,869 $ 78,584 $ 1,236,885 $ 816,509 $ 197
Dividends - affiliated . . . . . . . . . . . . . . . . . . . . . . . . . . . . . 16,350 — — — — —Interest . . . . . . . . . . . . . . . . . . . . . . . . . . . . . . . . . . . . . . . . . 122,125 653 651 — 810,944 288,134-------------------------------------- ---------------------------------- ----------------------------- ------------------------------------- ------------------------------------- ------------------------------Total Investment Income . . . . . . . . . . . . . . . . . . . . . . . . . 1,865,154 86,522 79,235 1,236,885 1,627,453 288,331-------------------------------------- ---------------------------------- ----------------------------- ------------------------------------- ------------------------------------- ------------------------------
Expenses:Investment advisory fees . . . . . . . . . . . . . . . . . . . . . . . . . 2,575,099 105,686 26,965 559,723 446,890 51,218Distribution fees – Class AAA . . . . . . . . . . . . . . . . . . . . . 434,677 17,504 6,322 130,360 134,211 19,376Distribution fees – Class A . . . . . . . . . . . . . . . . . . . . . . . . 173,543 10,882 438 14,156 12,571 883Distribution fees – Class B . . . . . . . . . . . . . . . . . . . . . . . . 301 33 — — 315 173Distribution fees – Class C . . . . . . . . . . . . . . . . . . . . . . . . 316,874 7,901 484 5,298 24,825 4,397Accounting fees . . . . . . . . . . . . . . . . . . . . . . . . . . . . . . . . . 22,500 — — 22,500 22,500 —Custodian fees . . . . . . . . . . . . . . . . . . . . . . . . . . . . . . . . . . 41,808 6,792 2,707 10,441 10,099 3,465Interest expense . . . . . . . . . . . . . . . . . . . . . . . . . . . . . . . . . — 3 15 205 — 11Legal and audit fees . . . . . . . . . . . . . . . . . . . . . . . . . . . . . . 37,344 15,500 13,857 25,829 26,020 14,902Registration expenses . . . . . . . . . . . . . . . . . . . . . . . . . . . . 38,853 17,251 20,492 25,373 25,168 17,958Shareholder communications expenses . . . . . . . . . . . . . 71,907 3,106 1,757 21,885 17,536 2,434Shareholder services fees . . . . . . . . . . . . . . . . . . . . . . . . . 234,311 7,929 2,724 60,067 39,917 5,419Trustees’ fees . . . . . . . . . . . . . . . . . . . . . . . . . . . . . . . . . . . . 7,949 330 100 2,068 2,220 342Miscellaneous expenses . . . . . . . . . . . . . . . . . . . . . . . . . . 16,797 4,591 3,947 8,529 8,922 6,365-------------------------------------- ---------------------------------- ----------------------------- ------------------------------------- ------------------------------------- ------------------------------Total Expenses . . . . . . . . . . . . . . . . . . . . . . . . . . . . . . . . . . 3,971,963 197,508 79,808 886,434 771,194 126,943-------------------------------------- ---------------------------------- ----------------------------- ------------------------------------- ------------------------------------- ------------------------------
Less:Expense reimbursements (See Note 3) . . . . . . . . . . . . . . — (29,077) (34,420) — — (38,081)Advisory fee reduction on unsupervisedassets (See Note 3) . . . . . . . . . . . . . . . . . . . . . . . . . . . . . (55,554) — — — — —
Custodian fee credits . . . . . . . . . . . . . . . . . . . . . . . . . . . . . — — — (10,371) (9,736) —-------------------------------------- ---------------------------------- ----------------------------- ------------------------------------- ------------------------------------- ------------------------------Total Reimbursements, Reductions, and Credits . . . . (55,554) (29,077) (34,420) (10,371) (9,736) (38,081)-------------------------------------- ---------------------------------- ----------------------------- ------------------------------------- ------------------------------------- ------------------------------Net Expenses . . . . . . . . . . . . . . . . . . . . . . . . . . . . . . . . . . . 3,916,409 168,431 45,388 876,063 761,458 88,862-------------------------------------- ---------------------------------- ----------------------------- ------------------------------------- ------------------------------------- ------------------------------Net Investment Income/(Loss) . . . . . . . . . . . . . . . . . . . . (2,051,255) (81,909) 33,847 360,822 865,995 199,469-------------------------------------- ---------------------------------- ----------------------------- ------------------------------------- ------------------------------------- ------------------------------
Net Realized and Unrealized Gain/(Loss) onInvestments and Foreign Currency:Net realized gain on investments . . . . . . . . . . . . . . . . . . 14,260,525 728,289 34,916 8,587,682 6,430,090 112,219Net realized loss on foreign currency transactions . . . . (60) (355) — — — —-------------------------------------- ---------------------------------- ----------------------------- ------------------------------------- ------------------------------------- ------------------------------Net realized gain on investments and foreigncurrency transactions . . . . . . . . . . . . . . . . . . . . . . . . . . . 14,260,465 727,934 34,916 8,587,682 6,430,090 112,219-------------------------------------- ---------------------------------- ----------------------------- ------------------------------------- ------------------------------------- ------------------------------
Net change in unrealized appreciation/depreciation:on investments . . . . . . . . . . . . . . . . . . . . . . . . . . . . . . . . 70,598,542 5,139,298 634,529 8,719,584 4,105,845 (523,727)on foreign currency translations . . . . . . . . . . . . . . . . . (69) 1 — — — —-------------------------------------- ---------------------------------- ----------------------------- ------------------------------------- ------------------------------------- ------------------------------
Net change in unrealized appreciation/depreciationon investments and foreign currency translations . . 70,598,473 5,139,299 634,529 8,719,584 4,105,845 (523,727)-------------------------------------- ---------------------------------- ----------------------------- ------------------------------------- ------------------------------------- ------------------------------
Net Realized and Unrealized Gain/(Loss) onInvestments and Foreign Currency . . . . . . . . . . . . . . 84,858,938 5,867,233 669,445 17,307,266 10,535,935 (411,508)-------------------------------------- ---------------------------------- ----------------------------- ------------------------------------- ------------------------------------- ------------------------------
Net Increase/(Decrease) in Net Assets Resultingfrom Operations . . . . . . . . . . . . . . . . . . . . . . . . . . . . . . . $82,807,683 $5,785,324 $703,292 $17,668,088 $11,401,930 $(212,039)-------------------------------------- ---------------------------------- ----------------------------- ------------------------------------- ------------------------------------- -------------------------------------------------------------------- ---------------------------------- ----------------------------- ------------------------------------- ------------------------------------- ------------------------------

25
See accompanying notes to financial statements.
GAMCO Westwood FundsStatements of Changes in Net Assets
Mighty MitesSM Fund SmallCap Equity Fund——––——————––————— ——––——————––—————
For the Six For the For the Six For theMonths Ended Year Ended Months Ended Year EndedMarch 31, 2011 September 30, March 31, 2011 September 30,(Unaudited) 2010 (Unaudited) 2010————————— ————————— ————————— —————————
Operations:Net investment loss . . . . . . . . . . . . . . . . . . . . . . . . . . . . . . . . . . . . . . . . . . . . $ (2,051,255) $ (2,035,421) $ (81,909) $ (126,537)Net realized gain on investments and foreign
currency transactions . . . . . . . . . . . . . . . . . . . . . . . . . . . . . . . . . . . . . . . . 14,260,465 10,978,383 727,934 1,082,077Net change in unrealized appreciation on investments
and foreign currency transactions . . . . . . . . . . . . . . . . . . . . . . . . . . . . . 70,598,473 33,904,771 5,139,299 945,012———–———— ———–———— ———–———— ———–————Net Increase in Net Assets Resulting from Operations . . . . . . . . . . . . 82,807,683 42,847,733 5,785,324 1,900,552———–———— ———–———— ———–———— ———–————
Distributions to Shareholders:Net investment income
Class AAA . . . . . . . . . . . . . . . . . . . . . . . . . . . . . . . . . . . . . . . . . . . . . . . . . (1,069,974) — — —Class A . . . . . . . . . . . . . . . . . . . . . . . . . . . . . . . . . . . . . . . . . . . . . . . . . . . . (134,992) — — —Class I . . . . . . . . . . . . . . . . . . . . . . . . . . . . . . . . . . . . . . . . . . . . . . . . . . . . . (151,906) — — ————–———— ———–———— ———–———— ———–————
(1,356,872) — — ————–———— ———–———— ———–———— ———–————Net realized gain
Class AAA . . . . . . . . . . . . . . . . . . . . . . . . . . . . . . . . . . . . . . . . . . . . . . . . . (7,450,321) (37,124) — —Class A . . . . . . . . . . . . . . . . . . . . . . . . . . . . . . . . . . . . . . . . . . . . . . . . . . . . (1,501,929) (4,628) — —Class B . . . . . . . . . . . . . . . . . . . . . . . . . . . . . . . . . . . . . . . . . . . . . . . . . . . . (2,195) (26) — —Class C . . . . . . . . . . . . . . . . . . . . . . . . . . . . . . . . . . . . . . . . . . . . . . . . . . . . (1,401,229) (3,910) — —Class I . . . . . . . . . . . . . . . . . . . . . . . . . . . . . . . . . . . . . . . . . . . . . . . . . . . . . (685,228) (2,984) — ————–———— ———–———— ———–———— ———–————
(11,040,902) (48,672) — ————–———— ———–———— ———–———— ———–————Total Distributions to Shareholders . . . . . . . . . . . . . . . . . . . . . . . . . . . . . (12,397,774) (48,672) — ————–———— ———–———— ———–———— ———–————
Shares of Beneficial Interest Transactions:Proceeds from shares issued
Class AAA . . . . . . . . . . . . . . . . . . . . . . . . . . . . . . . . . . . . . . . . . . . . . . . . . 174,167,818 128,720,205 7,216,205 3,017,670Class A . . . . . . . . . . . . . . . . . . . . . . . . . . . . . . . . . . . . . . . . . . . . . . . . . . . . 43,156,804 37,358,815 1,546,260 1,082,263Class B . . . . . . . . . . . . . . . . . . . . . . . . . . . . . . . . . . . . . . . . . . . . . . . . . . . . 3,399 — — 1,692Class C . . . . . . . . . . . . . . . . . . . . . . . . . . . . . . . . . . . . . . . . . . . . . . . . . . . . 44,293,153 25,737,887 2,935,887 586,710Class I . . . . . . . . . . . . . . . . . . . . . . . . . . . . . . . . . . . . . . . . . . . . . . . . . . . . . 24,939,017 10,894,878 329,465 1,389,079———–———— ———–———— ———–———— ———–————
286,560,191 202,711,785 12,027,817 6,077,414———–———— ———–———— ———–———— ———–————Proceeds from reinvestment of distributions
Class AAA . . . . . . . . . . . . . . . . . . . . . . . . . . . . . . . . . . . . . . . . . . . . . . . . . 7,225,290 33,740 — —Class A . . . . . . . . . . . . . . . . . . . . . . . . . . . . . . . . . . . . . . . . . . . . . . . . . . . . 1,326,762 3,921 — —Class B . . . . . . . . . . . . . . . . . . . . . . . . . . . . . . . . . . . . . . . . . . . . . . . . . . . . 2,195 26 — —Class C . . . . . . . . . . . . . . . . . . . . . . . . . . . . . . . . . . . . . . . . . . . . . . . . . . . . 1,059,902 2,929 — —Class I . . . . . . . . . . . . . . . . . . . . . . . . . . . . . . . . . . . . . . . . . . . . . . . . . . . . . 420,005 1,751 — ————–———— ———–———— ———–———— ———–————
10,034,154 42,367 — ————–———— ———–———— ———–———— ———–————Cost of shares redeemed
Class AAA . . . . . . . . . . . . . . . . . . . . . . . . . . . . . . . . . . . . . . . . . . . . . . . . . (46,880,481) (68,496,152) (1,976,337) (2,689,387)Class A . . . . . . . . . . . . . . . . . . . . . . . . . . . . . . . . . . . . . . . . . . . . . . . . . . . . (12,987,585) (9,881,228) (371,583) (218,956)Class B . . . . . . . . . . . . . . . . . . . . . . . . . . . . . . . . . . . . . . . . . . . . . . . . . . . . (45,922) (50,832) — (1,741)Class C . . . . . . . . . . . . . . . . . . . . . . . . . . . . . . . . . . . . . . . . . . . . . . . . . . . . (4,002,682) (2,880,022) (66,555) (104,065)Class I . . . . . . . . . . . . . . . . . . . . . . . . . . . . . . . . . . . . . . . . . . . . . . . . . . . . . (5,648,583) (2,769,144) (946,210) (693,469)———–———— ———–———— ———–———— ———–————
(69,565,253) (84,077,378) (3,360,685) (3,707,618)———–———— ———–———— ———–———— ———–————Net Increase in Net Assets from Shares ofBeneficial Interest Transactions . . . . . . . . . . . . . . . . . . . . . . . . . . . . . . 227,029,092 118,676,774 8,667,132 2,369,796———–———— ———–———— ———–———— ———–————
Redemption Fees . . . . . . . . . . . . . . . . . . . . . . . . . . . . . . . . . . . . . . . . . . . . . . 5,581 689 317 1,751———–———— ———–———— ———–———— ———–————Net Increase in Net Assets . . . . . . . . . . . . . . . . . . . . . . . . . . . . . . . . . . . . . 297,444,582 161,476,524 14,452,773 4,272,099
Net Assets:Beginning of period . . . . . . . . . . . . . . . . . . . . . . . . . . . . . . . . . . . . . . . . . . . . 374,054,222 212,577,698 15,984,012 11,711,913———–———— ———–———— ———–———— ———–————End of period . . . . . . . . . . . . . . . . . . . . . . . . . . . . . . . . . . . . . . . . . . . . . . . . . $671,498,804 $374,054,222 $30,436,785 $15,984,012———–———— ———–———— ———–———— ———–———————–———— ———–———— ———–———— ———–————Undistributed net investment income . . . . . . . . . . . . . . . . . . . . . . . . . . . . — — — ————–———— ———–———— ———–———— ———–———————–———— ———–———— ———–———— ———–————

26
See accompanying notes to financial statements.
GAMCO Westwood FundsStatements of Changes in Net Assets (Continued)
Income Fund Equity Fund—————————––——––———— —————————––——––————For the Six For the For the Six For the
Months Ended Year Ended Months Ended Year EndedMarch 31, 2011 September 30, March 31, 2011 September 30,(Unaudited) 2010 (Unaudited) 2010————————— ————————— ————————— —————————
Operations:Net investment income . . . . . . . . . . . . . . . . . . . . . . . . . . . . . . . . . . . . . . . . . $ 33,847 $ 87,370 $ 360,822 $ 678,220Net realized gain/(loss) on investments . . . . . . . . . . . . . . . . . . . . . . . . . . 34,916 (96,177) 8,587,682 8,500,599Net change in unrealized appreciation/depreciation on investments . . 634,529 508,524 8,719,584 (229,649)
—————— ——————— —————–— —————–—Net Increase in Net Assets Resulting from Operations . . . . . . . . . . . . . 703,292 499,717 17,668,088 8,949,170
—————— ——————— —————–— —————–—Distributions to Shareholders:
Net investment incomeClass AAA . . . . . . . . . . . . . . . . . . . . . . . . . . . . . . . . . . . . . . . . . . . . . . . . . (31,435) (76,135) (588,343) (1,172,352)Class A . . . . . . . . . . . . . . . . . . . . . . . . . . . . . . . . . . . . . . . . . . . . . . . . . . . . (1,358) (2,880) (16,239) (45,986)Class B . . . . . . . . . . . . . . . . . . . . . . . . . . . . . . . . . . . . . . . . . . . . . . . . . . . . — — — (17)Class C . . . . . . . . . . . . . . . . . . . . . . . . . . . . . . . . . . . . . . . . . . . . . . . . . . . . (182) (604) — (3,199)Class I . . . . . . . . . . . . . . . . . . . . . . . . . . . . . . . . . . . . . . . . . . . . . . . . . . . . . (491) (885) (7,652) (7,670)
—————— ——————— —————–— —————–—Total Distributions to Shareholders . . . . . . . . . . . . . . . . . . . . . . . . . . . . . (33,466) (80,504) (612,234) (1,229,224)
—————— ——————— —————–— —————–—Shares of Beneficial Interest Transactions:
Proceeds from shares issuedClass AAA . . . . . . . . . . . . . . . . . . . . . . . . . . . . . . . . . . . . . . . . . . . . . . . . . 535,271 449,585 3,835,690 12,835,644Class A . . . . . . . . . . . . . . . . . . . . . . . . . . . . . . . . . . . . . . . . . . . . . . . . . . . . 14,629 288,780 452,465 1,187,734Class C . . . . . . . . . . . . . . . . . . . . . . . . . . . . . . . . . . . . . . . . . . . . . . . . . . . . 960 13,137 49,423 171,700Class I . . . . . . . . . . . . . . . . . . . . . . . . . . . . . . . . . . . . . . . . . . . . . . . . . . . . . 9,266 14,274 73,390 640,637
—————— ——————— —————–— —————–—560,126 765,776 4,410,968 14,835,715
—————— ——————— —————–— —————–—Proceeds from reinvestment of distributions
Class AAA . . . . . . . . . . . . . . . . . . . . . . . . . . . . . . . . . . . . . . . . . . . . . . . . . 29,441 71,125 543,647 1,098,889Class A . . . . . . . . . . . . . . . . . . . . . . . . . . . . . . . . . . . . . . . . . . . . . . . . . . . . 1,350 2,878 15,626 43,561Class B . . . . . . . . . . . . . . . . . . . . . . . . . . . . . . . . . . . . . . . . . . . . . . . . . . . . — — — 17Class C . . . . . . . . . . . . . . . . . . . . . . . . . . . . . . . . . . . . . . . . . . . . . . . . . . . . 145 515 — 3,159Class I . . . . . . . . . . . . . . . . . . . . . . . . . . . . . . . . . . . . . . . . . . . . . . . . . . . . . 405 783 7,644 7,670
—————— ——————— —————–— —————–—31,341 75,301 566,917 1,153,296
—————— ——————— —————–— —————–—Cost of shares redeemed
Class AAA . . . . . . . . . . . . . . . . . . . . . . . . . . . . . . . . . . . . . . . . . . . . . . . . . (843,220) (947,840) (13,797,287) (53,540,807)Class A . . . . . . . . . . . . . . . . . . . . . . . . . . . . . . . . . . . . . . . . . . . . . . . . . . . . (330,577) (50,559) (2,548,698) (1,083,380)Class B . . . . . . . . . . . . . . . . . . . . . . . . . . . . . . . . . . . . . . . . . . . . . . . . . . . . — (79)* (7,254)** (88)Class C . . . . . . . . . . . . . . . . . . . . . . . . . . . . . . . . . . . . . . . . . . . . . . . . . . . . (8,279) (190,868) (171,269) (309,984)Class I . . . . . . . . . . . . . . . . . . . . . . . . . . . . . . . . . . . . . . . . . . . . . . . . . . . . . (266) (22,634) (337,244) (333,598)
—————— ——————— —————–— —————–—(1,182,342) (1,211,980) (16,861,752) (55,267,857)—————— ——————— —————–— —————–—
Net Decrease in Net Assets fromShares of Beneficial Interest Transactions . . . . . . . . . . . . . . . . . . . . (590,875) (370,903) (11,883,867) (39,278,846)
—————— ——————— —————–— —————–—Redemption Fees . . . . . . . . . . . . . . . . . . . . . . . . . . . . . . . . . . . . . . . . . . . . . . 52 — — —
—————— ——————— —————–— —————–—Net Increase/(Decrease) in Net Assets . . . . . . . . . . . . . . . . . . . . . . . . . . . 79,003 48,310 5,171,987 (31,558,900)
Net Assets:Beginning of period . . . . . . . . . . . . . . . . . . . . . . . . . . . . . . . . . . . . . . . . . . . . 5,314,328 5,266,018 108,650,299 140,209,199
—————— ——————— —————–— —————–—End of period . . . . . . . . . . . . . . . . . . . . . . . . . . . . . . . . . . . . . . . . . . . . . . . . . $5,393,331 $ 5,314,328 $113,822,286 $108,650,299
—————— ——————— —————–— —————–——————— ——————— —————–— —————–—Undistributed net investment income . . . . . . . . . . . . . . . . . . . . . . . . . . . . $ 376 — $ 170,377 $ 421,789
—————— ——————— —————–— —————–——————— ——————— —————–— —————–—
* Income Fund’s Class B Shares were fully redeemed and closed on December 1, 2009.** Equity Fund’s Class B Shares were fully redeemed and closed on March 1, 2011.

27
See accompanying notes to financial statements.
GAMCO Westwood FundsStatements of Changes in Net Assets (Continued)
Balanced Fund Intermediate Bond Fund——––———————––————— ——––———————––—————
For the Six For the For the Six For theMonths Ended Year Ended Months Ended Year EndedMarch 31, 2011 September 30, March 31, 2011 September 30,(Unaudited) 2010 (Unaudited) 2010————————— ————————— ————————— —————————
Operations:Net investment income . . . . . . . . . . . . . . . . . . . . . . . . . . . . . . . . . . . . . . . . . $ 865,995 $ 1,805,394 $ 199,469 $ 397,954Net realized gain on investments . . . . . . . . . . . . . . . . . . . . . . . . . . . . . . . . 6,430,090 4,758,237 112,219 33,821Net change in unrealized appreciation/depreciation on investments . . 4,105,845 1,729,287 (523,727) 695,999
————––——–— —————— —————–— —————–—Net Increase/(Decrease) in Net Assets Resulting from Operations . . 11,401,930 8,292,918 (212,039) 1,127,774
————––——–— —————— —————–— —————–—Distributions to Shareholders:
Net investment incomeClass AAA . . . . . . . . . . . . . . . . . . . . . . . . . . . . . . . . . . . . . . . . . . . . . . . . . (798,907) (1,688,728) (184,546) (368,264)Class A . . . . . . . . . . . . . . . . . . . . . . . . . . . . . . . . . . . . . . . . . . . . . . . . . . . . (30,899) (67,141) (5,789) (10,734)Class B . . . . . . . . . . . . . . . . . . . . . . . . . . . . . . . . . . . . . . . . . . . . . . . . . . . . (197) (763) (280) (1,479)Class C . . . . . . . . . . . . . . . . . . . . . . . . . . . . . . . . . . . . . . . . . . . . . . . . . . . . (17,892) (35,350) (6,856) (14,335)Class I . . . . . . . . . . . . . . . . . . . . . . . . . . . . . . . . . . . . . . . . . . . . . . . . . . . . . (14,928) (27,648) (1,998) (3,841)
————––——–— —————— —————–— —————–—(862,823) (1,819,630) (199,469) (398,653)
————––——–— —————— —————–— —————–—Net realized gain
Class AAA . . . . . . . . . . . . . . . . . . . . . . . . . . . . . . . . . . . . . . . . . . . . . . . . . — — (28,090) (103,560)Class A . . . . . . . . . . . . . . . . . . . . . . . . . . . . . . . . . . . . . . . . . . . . . . . . . . . . — — (887) (3,757)Class B . . . . . . . . . . . . . . . . . . . . . . . . . . . . . . . . . . . . . . . . . . . . . . . . . . . . — — (64) (903)Class C . . . . . . . . . . . . . . . . . . . . . . . . . . . . . . . . . . . . . . . . . . . . . . . . . . . . — — (1,914) (4,280)Class I . . . . . . . . . . . . . . . . . . . . . . . . . . . . . . . . . . . . . . . . . . . . . . . . . . . . . — — (334) (780)
————––——–— —————— —————–— —————–—— — (31,289) (113,280)
————––——–— —————— —————–— —————–—Total Distributions to Shareholders . . . . . . . . . . . . . . . . . . . . . . . . . . . . . (862,823) (1,819,630) (230,758) (511,933)
————––——–— —————— —————–— —————–—Shares of Beneficial Interest Transactions:
Proceeds from shares issuedClass AAA . . . . . . . . . . . . . . . . . . . . . . . . . . . . . . . . . . . . . . . . . . . . . . . . . 6,524,689 12,228,366 1,600,038 4,725,121Class A . . . . . . . . . . . . . . . . . . . . . . . . . . . . . . . . . . . . . . . . . . . . . . . . . . . . 105,146 210,320 178,166 287,448Class B . . . . . . . . . . . . . . . . . . . . . . . . . . . . . . . . . . . . . . . . . . . . . . . . . . . . — 13,292 — —Class C . . . . . . . . . . . . . . . . . . . . . . . . . . . . . . . . . . . . . . . . . . . . . . . . . . . . 332,343 1,095,718 161,930 1,558,481Class I . . . . . . . . . . . . . . . . . . . . . . . . . . . . . . . . . . . . . . . . . . . . . . . . . . . . . 290,755 895,950 87,383 140,294
————––——–— —————— —————–— —————–—7,252,933 14,443,646 2,027,517 6,711,344
————––——–— —————— —————–— —————–—Proceeds from reinvestment of distributions
Class AAA . . . . . . . . . . . . . . . . . . . . . . . . . . . . . . . . . . . . . . . . . . . . . . . . . 770,422 1,627,433 140,916 326,510Class A . . . . . . . . . . . . . . . . . . . . . . . . . . . . . . . . . . . . . . . . . . . . . . . . . . . . 27,317 60,259 4,865 10,834Class B . . . . . . . . . . . . . . . . . . . . . . . . . . . . . . . . . . . . . . . . . . . . . . . . . . . . 123 430 243 1,262Class C . . . . . . . . . . . . . . . . . . . . . . . . . . . . . . . . . . . . . . . . . . . . . . . . . . . . 13,143 24,903 7,567 17,068Class I . . . . . . . . . . . . . . . . . . . . . . . . . . . . . . . . . . . . . . . . . . . . . . . . . . . . . 14,920 27,636 2,316 4,325
————––——–— —————— —————–— —————–—825,925 1,740,661 155,907 359,999
————––——–— —————— —————–— —————–—Cost of shares redeemed
Class AAA . . . . . . . . . . . . . . . . . . . . . . . . . . . . . . . . . . . . . . . . . . . . . . . . . (17,177,065) (36,266,445) (3,283,045) (2,507,576)Class A . . . . . . . . . . . . . . . . . . . . . . . . . . . . . . . . . . . . . . . . . . . . . . . . . . . . (739,304) (1,412,210) (127,678) (349,373)Class B . . . . . . . . . . . . . . . . . . . . . . . . . . . . . . . . . . . . . . . . . . . . . . . . . . . . (45,882) (41,933) (7,412) (94,401)Class C . . . . . . . . . . . . . . . . . . . . . . . . . . . . . . . . . . . . . . . . . . . . . . . . . . . . (703,832) (1,257,696) (1,296,869) (489,893)Class I . . . . . . . . . . . . . . . . . . . . . . . . . . . . . . . . . . . . . . . . . . . . . . . . . . . . . (457,242) (668,924) (86,860) (347,556)
————––——–— —————— —————–— —————–—(19,123,325) (39,647,208) (4,801,864) (3,788,799)
————––——–— —————— —————–— —————–—Net Increase/(Decrease) in Net Assets fromShares of Beneficial Interest Transactions . . . . . . . . . . . . . . . . . . . . . (11,044,467) (23,462,901) (2,618,440) 3,282,544
————––——–— —————— —————–— —————–—Net Increase/(Decrease) in Net Assets . . . . . . . . . . . . . . . . . . . . . . . . . . . (505,360) (16,989,613) (3,061,237) 3,898,385
Net Assets:Beginning of period . . . . . . . . . . . . . . . . . . . . . . . . . . . . . . . . . . . . . . . . . . . . 118,743,837 135,733,450 19,404,480 15,506,095
————––——–— —————— —————–— —————–—End of period . . . . . . . . . . . . . . . . . . . . . . . . . . . . . . . . . . . . . . . . . . . . . . . . . $118,238,477 $118,743,837 $16,343,243 $19,404,480
————––——–— —————— —————–— —————–—————––——–— —————— —————–— —————–—Undistributed net investment income . . . . . . . . . . . . . . . . . . . . . . . . . . . . $ 12,782 $ 9,610 $ 4,905 $ 4,905
————––——–— —————— —————–— —————–—————––——–— —————— —————–— —————–—

28
Seeaccompany
ingno
testo
financialstatements.
GAMCOWestwoodFunds
FinancialHighlights
Selected
dataforashareof
beneficialinterestou
tstand
ingthroug
hout
each
period
:
Income(Loss)from
InvestmentOperations
DistributionstoShareholders
RatiostoAverageNetAssets/SupplementalData
——————————–—
————————————
—————————————————————————————————
——————————————–—
—————————————
Operating
Expenses
Operating
Net
Net
Net
Netof
Expenses
NetAsset
Net
Realizedand
Total
Net
Asset
Assets,
Net
Waivers/
Before
Value,
Investment
Unrealized
From
Net
Realized
Value,
Endof
Investment
Reimburse-
Waivers/
Portfolio
PeriodEnded
Beginning
Income
Gain(Loss)on
InvestmentInvestment
Gainon
Returnof
Total
Redemption
Endof
Total
Period
Income
ments/
Reimburse-
Turnover
September30
ofPeriod
(Loss)(a)(b)
Investments
Operations
Income
Investments
Capital
Distributions
Fees(a)
Period
Return†
(in000’s)
(Loss)(b)
Reductions
ments(c)
Rate††
———————
—————
——————
———————
——————
—————
———————
———————
————––——
——————
————
————
———————
———————
———————
——————
————
MightyMites
SMFund
ClassAAA
2011(d)
$15.81
$(0.06)
$2.93
$2.87
$(0.06)
$(0.42)
—$(0.48)
$0.00(e)
$18.20
18.5%
$444,193
(0.68)%(f)
1.41%(f)
1.43%(f)(g)
14%
2010
13.49
(0.10)
2.42
2.32
—(0.00)(e)
—(0.00)(e)
0.00(e)
15.81
17.2
261,810
(0.67)
1.55
1.58(g)
272009
13.41
(0.08)
0.47
0.39
—(0.29)
$(0.02)
(0.31)
0.00(e)
13.49
3.5
170,181
(0.69)
1.65
1.66(g)
322008
17.05
(0.00)(e)
(2.11)
(2.11)
(0.06)
(1.47)
—(1.53)
0.00(e)
13.41
(13.2)
55,808
(0.01)
1.71
1.71
182007
16.01
0.08
3.42
3.50
—(2.46)
—(2.46)
0.00(e)
17.05
23.9
48,252
0.48
1.64
1.64
212006
16.73
(0.04)
1.34
1.30
—(2.02)
—(2.02)
—16.01
9.0
36,843
(0.28)
1.61
1.61
4ClassA
2011(d)
$15.57
$(0.08)
$2.89
$2.81
$(0.04)
$(0.42)
—$(0.46)
$0.00(e)
$17.92
18.4%
$89,345
(0.92)%(f)
1.66%(f)
1.68%(f)(g)
14%
2010
13.32
(0.13)
2.38
2.25
—(0.00)(e)
—(0.00)(e)
0.00(e)
15.57
16.9
48,464
(0.91)
1.80
1.83(g)
272009
13.26
(0.10)
0.47
0.37
—(0.29)
$(0.02)
(0.31)
0.00(e)
13.32
3.4
16,187
(0.90)
1.90
1.91(g)
322008
16.94
(0.04)
(2.10)
(2.14)
(0.07)
(1.47)
—(1.54)
0.00(e)
13.26
(13.5)
6,134
(0.27)
1.96
1.96
182007
15.94
0.36
3.10
3.46
—(2.46)
—(2.46)
0.00(e)
16.94
23.8
2,246
2.13
1.89
1.89
212006
16.70
(0.10)
1.36
1.26
—(2.02)
—(2.02)
—15.94
8.7
3(0.63)
1.86
1.86
4ClassB
2011(d)
$14.64
$(0.09)
$2.69
$2.60
—$(0.42)
—$(0.42)
$0.00(e)
$16.82
18.1%
$45
(1.11)%(f)
2.16%(f)
2.18%(f)(g)
14%
2010
12.59
(0.19)
2.24
2.05
—(0.00)(e)
—(0.00)(e)
0.00(e)
14.64
16.3
77(1.41)
2.30
2.33(g)
272009
12.63
(0.14)
0.41
0.27
—(0.29)
$(0.02)
(0.31)
0.00(e)
12.59
2.8
116
(1.34)
2.40
2.41(g)
322008
16.21
(0.10)
(2.01)
(2.11)
—(1.47)
—(1.47)
0.00(e)
12.63
(13.9)
169
(0.73)
2.46
2.46
182007
15.43
(0.06)
3.30
3.24
—(2.46)
—(2.46)
0.00(e)
16.21
23.0
422
(0.40)
2.39
2.39
212006
16.31
(0.15)
1.29
1.14
—(2.02)
—(2.02)
—15.43
8.1
452
(1.00)
2.36
2.36
4ClassC
2011(d)
$14.55
$(0.12)
$2.70
$2.58
—$(0.42)
—$(0.42)
$0.00(e)
$16.71
18.1%
$90,106
(1.48)%(f)
2.16%(f)
2.18%(f)(g)
14%
2010
12.51
(0.19)
2.23
2.04
—(0.00)(e)
—(0.00)(e)
0.00(e)
14.55
16.3
40,297
(1.41)
2.30
2.33(g)
272009
12.55
(0.15)
0.42
0.27
—(0.29)
$(0.02)
(0.31)
0.00(e)
12.51
2.8
13,566
(1.42)
2.40
2.41(g)
322008
16.13
(0.10)
(2.00)
(2.10)
$(0.01)
(1.47)
—(1.48)
0.00(e)
12.55
(13.9)
4,671
(0.78)
2.46
2.46
182007
15.35
0.10
3.14
3.24
—(2.46)
—(2.46)
0.00(e)
16.13
23.2
2,041
0.65
2.39
2.39
212006
16.24
(0.15)
1.28
1.13
—(2.02)
—(2.02)
—15.35
8.1
311
(1.01)
2.36
2.36
4ClassI
2011(d)
$15.92
$(0.04)
$2.95
$2.91
$(0.09)
$(0.42)
—$(0.51)
$0.00(e)
$18.32
18.6%
$47,810
(0.49)%(f)
1.16%(f)
1.18%(f)(g)
14%
2010
13.55
(0.06)
2.43
2.37
—(0.00)(e)
—(0.00)(e)
0.00(e)
15.92
17.5
23,406
(0.41)
1.30
1.33(g)
272009
13.44
(0.06)
0.48
0.42
—(0.29)
$(0.02)
(0.31)
0.00(e)
13.55
3.7
12,528
(0.48)
1.40
1.41(g)
322008(h)
13.96
0.03
(0.55)
(0.52)
——
——
0.00(e)
13.44
(3.7)
893
0.26(f)
1.46(f)
1.46(f)
18
†Totalreturnrepresentsaggregatetotalreturnof
ahy
pothetical$1,000
investmentatthe
beginn
ingof
theperiod
andsold
attheendof
theperiod
includ
ingreinvestmento
fdistributions
anddoes
notreflectapplicablesalescharges.Totalreturnforaperiod
ofless
than
oneyear
isno
tann
ualized.
††Effective
in2008,a
change
inaccoun
ting
policywas
adop
tedwithregard
tothecalculationof
thepo
rtfolio
turnover
rateto
includ
ecash
proceedsdue
tomergers.H
adthispo
licybeen
adop
ted
retroactively,thepo
rtfolio
turnover
ratefortheyear
ended
Septem
ber30,2007wou
ldhave
been
23%.T
hepo
rtfolio
turnover
ratefortheyear
ended
2006
wou
ldhave
been
asshow
n.Also,forthe
year
ended
Septem
ber30,2009,thecalculationof
thepo
rtfolio
turnover
rateexclud
edfrom
purchasesthevalueof
securities
acqu
ired
inconn
ection
withtheFu
nd’sReorganization(see
Note9).
(a)Persharedataiscalculated
usingtheaverageshares
outstand
ingmetho
d.
(b)Due
tocapitalshare
activity,netinvestmentincom
epershareandtheratioto
averagenetassetsareno
tnecessarily
correlated
amon
gthedifferentclasses
ofshares.
(c)The
fund
incurred
interestexpenseduringtheyear
ended
Septem
ber30,2006.Ifinterestexpensehadno
tbeenincurred,the
ratios
ofop
eratingexpenses
toaveragenetassetswou
ldhave
been
1.57%
(ClassAAA),1.82%
(ClassA),2.32%
(Class
BandClass
C),respectively.For
theyearsended
Septem
ber30,2010,2009,2008,and2007,the
effectof
interestexpensewas
minim
al.For
thesix
mon
thsended
March
31,2011,therewas
nointerestexpense.
(d)Forthesixmon
thsended
March
31,2011,un
audited.
(e)Amou
ntrepresentsless
than
$0.005
pershare.
(f)Ann
ualized.
(g)Beforeadvisory
feereduction
onun
supervised
assetstotalin
g0.02%,0.03%
,and
0.01%
ofnetassetsforthesixmon
thsended
March
31,2011andtheyearsended
Septem
ber30,2010and2009,
respectively.
(h)From
thecommencemento
foffering
Class
IShares
onJanu
ary11,2008throug
hSeptem
ber30,2008.

29
GAMCOWestwoodFunds
FinancialHighlights
Selected
dataforashareof
beneficialinterestou
tstand
ingthroug
hout
each
period
:Income(Loss)from
InvestmentOperations
DistributionstoShareholders
RatiostoAverageNetAssets/SupplementalData
——————————––––—————————————
——————————————————
————————————————————–—
—————————————
Operating
Operating
Net
Net
Net
Expenses
Expenses
NetAsset
Net
Realizedand
Total
Asset
Assets,
Net
Netof
Before
Value,
Investment
Unrealized
From
Net
Value,
Endof
Investment
Waivers/
Waivers/
Portfolio
PeriodEnded
Beginning
Income
Gain(Loss)on
Investment
Investment
Total
Redemption
Endof
Total
Period
Income
Reimburse-
Reimburse-
Turnover
September30
ofPeriod
(Loss)(a)
Investments
Operations
Income
Distributions
Fees(a)
Period
Return†
(in000’s)
(Loss)
ments††
ments†††
Rate
———————
—————
—————
————————
——————
——————
————————
——————––—
————
————
—————
———————
———————
——————
—————
SmallCapEquityFund
ClassAAA
2011(b)
$13.36
$(0.05)
$4.51
$4.46
——
$0.00(c)
$17.82
33.4%
$19,487
(0.68)%(d)1.50%(d)(e)
1.78%(d)
13%
2010
11.60
(0.10)
1.86
1.76
——
0.00(c)
13.36
15.2
10,435
(0.81)
1.50(e)
1.99
282009
11.99
(0.06)
(0.33)
(0.39)
——
—11.60
(3.3)
8,856
(0.68)
1.50(e)
2.80
552008
14.99
(0.03)
(2.97)
(3.00)
——
—11.99
(20.0)
8,491
(0.23)
1.58(e)
2.62
123
2007
12.51
(0.04)
2.68
2.64
$(0.16)
$(0.16)
—14.99
21.2
8,672
(0.28)
1.71
2.24
902006
11.29
0.14
1.08
1.22
——
—12.51
10.8
8,717
1.16
1.71
2.02
81ClassA
2011(b)
$13.18
$(0.07)
$4.45
$4.38
——
$0.00(c)
$17.56
33.2%
$5,905
(0.92)%(d)1.75%(d)(e)
2.03%(d)
13%
2010
11.47
(0.13)
1.84
1.71
——
0.00(c)
13.18
14.9
3,509
(1.06)
1.75(e)
2.24
282009
11.88
(0.09)
(0.32)
(0.41)
——
—11.47
(3.5)
2,200
(0.98)
1.75(e)
3.05
552008
14.89
(0.06)
(2.95)
(3.01)
——
—11.88
(20.2)
703
(0.49)
1.83(e)
2.87
123
2007
12.45
(0.09)
2.67
2.58
$(0.14)
$(0.14)
—14.89
20.9
778
(0.62)
1.96
2.49
902006
11.25
0.13
1.07
1.20
——
—12.45
10.7
403
1.04
1.96
2.27
81ClassB
2011(b)
$12.58
$(0.11)
$4.25
$4.14
——
$0.00(c)
$16.72
32.9%
$8
(1.43)%(d)2.25%(d)(e)
2.53%(d)
13%
2010
11.01
(0.19)
1.76
1.57
——
0.00(c)
12.58
14.3
6(1.56)
2.25(e)
2.74
282009
11.46
(0.12)
(0.33)
(0.45)
——
—11.01
(3.9)
5(1.43)
2.25(e)
3.55
552008
14.44
(0.12)
(2.86)
(2.98)
——
—11.46
(20.6)
5(0.97)
2.33(e)
3.37
123
2007
12.03
(0.15)
2.60
2.45
$(0.04)
$(0.04)
—14.44
20.4
7(1.05)
2.46
2.99
902006
10.93
0.05
1.05
1.10
——
—12.03
10.1
60.44
2.46
2.77
81ClassC
2011(b)
$12.47
$(0.11)
$4.22
$4.11
——
$0.00(c)
$16.58
33.0%
$4,200
(1.45)%(d)2.25%(d)(e)
2.53%(d)
13%
2010
10.91
(0.18)
1.74
1.56
——
0.00(c)
12.47
14.3
911
(1.55)
2.25(e)
2.74
282009
11.36
(0.12)
(0.33)
(0.45)
——
—10.91
(4.0)
345
(1.43)
2.25(e)
3.55
552008
14.31
(0.12)
(2.83)
(2.95)
——
—11.36
(20.6)
196
(0.94)
2.33(e)
3.37
123
2007
11.97
(0.14)
2.57
2.43
$(0.09)
$(0.09)
—14.31
20.4
298
(1.04)
2.46
2.99
902006
10.87
0.09
1.01
1.10
——
—11.97
10.1
238
0.74
2.46
2.77
81ClassI
2011(b)
$13.45
$(0.03)
$4.54
$4.51
——
$0.00(c)
$17.96
33.5%
$837
(0.41)%(d)1.25%(d)(e)
1.53%(d)
13%
2010
11.65
(0.08)
1.88
1.80
——
0.00(c)
13.45
15.5
1,123
(0.59)
1.25(e)
1.74
282009
12.00
(0.04)
(0.31)
(0.35)
——
—11.65
(2.9)
306
(0.47)
1.25(e)
2.55
552008(f)
12.92
(0.01)
(0.91)
(0.92)
——
—12.00
(7.1)
165
(0.06)(d)
1.36(d)(e)
2.40(d)
123
†Totalreturnrepresentsaggregatetotalreturnof
ahy
pothetical$1,000
investmentatthe
beginn
ingof
theperiod
andsold
attheendof
theperiod
includ
ingreinvestmento
fdistributions
anddoes
notreflectapplicablesalescharges.Totalreturnforaperiod
ofless
than
oneyear
isno
tann
ualized.
††The
ratios
dono
tincludeareduction
forcustod
ianfeecreditson
cash
balances
maintainedwiththecustod
ian(“CustodianFeeCredits”).Includ
ingsuch
CustodianFeeCredits,theratios
forthe
yearsended
Septem
ber30,2009,2008,2007,and2006
wou
ldhave
been
1.50%,1.51%
,1.50%
,and
1.50%
(ClassAAA),1.75%,1.76%
,1.75%
,and
1.75%
(ClassA),2.25%,2.26%
,2.25%
,and
2.25%
(Class
BandClass
C),and1.25%
and1.26%
(Class
I)respectively.For
thesixmon
thsended
March
31,2011andtheyear
ended
Septem
ber30,2010,therewereno
CustodianFeeCredits.
†††
The
ratios
dono
tincludeareduction
forCustodianFeeCredits.Includ
ingsuch
CustodianFeeCredits,theratios
fortheyearsended
Septem
ber30,2009,2008,2007,and2006
wou
ldhave
been
2.80%,2.55%
,2.03%
,and
1.81%
(ClassAAA),3.05%,2.80%
,2.28%
,and
2.06%,(C
lassA),3.55%,3.30%
,2.78%
,and
2.56%
(Class
BandClass
C),and2.55%
and2.30%
(Class
I),respectively.Forthe
sixmon
thsended
March
31,2011andtheyear
ended
Septem
ber30,2010,therewereno
CustodianFeeCredits.
(a)
Persharedataiscalculated
usingtheaverageshares
outstand
ingmetho
d.
(b)
Forthesixmon
thsended
March
31,2011,un
audited.
(c)
Amou
ntrepresentsless
than
$0.005
pershare.
(d)
Ann
ualized.
(e)
The
Fund
incurred
interestexpenseof
$682
duringtheyear
ended
Septem
ber30,2008.Apo
rtionof
thisinterestexpensewas
paid
forby
prioryearsCustodianFeeCredits.The
impactto
the
ratios
ofop
eratingexpenses
totheaveragenetassetswas
minim
al.Ifinterestexpensehadno
tbeenincurred,the
ratioof
operatingexpenses
totheaveragenetassetswou
ldhave
been
1.50%
(ClassAAA),1.75%
(ClassA),2.25%
(Class
BandClass
C),and1.25%
(Class
I),respectively.Forthesixmon
thsended
March
31,2011andtheyearsended
Septem
ber30,2010and2009
theeffect
ofinterestexpensewas
minim
al.
(f)
From
thecommencemento
foffering
Class
IShares
onJanu
ary11,2008throug
hSeptem
ber30,2008.
2929
Seeaccompany
ingno
testo
financialstatements.

3030
Seeaccompany
ingno
testo
financialstatements.
GAMCOWestwoodFunds
FinancialHighlights
Selected
dataforashareof
beneficialinterestou
tstand
ingthroug
hout
each
period
:
Income(Loss)from
InvestmentOperations
DistributionstoShareholders
RatiostoAverageNetAssets/SupplementalData
——————————––––————————————————
————————————————————————————————
——————————————————–—
—————————————
Net
Operating
Operating
Realizedand
Net
Net
Expenses
Expenses
NetAsset
Unrealized
Total
Net
Asset
Assets,
Netof
Before
Value,
Net
Gain
From
Net
Realized
Value,
Endof
Net
Waivers/
Waivers/
Portfolio
PeriodEnded
Beginning
Investment
(Loss)on
InvestmentInvestment
Gainon
Returnof
Total
Redemption
Endof
Total
Period
Investment
Reimburse-
Reimburse-
Turnover
September30
ofPeriod
Income(a)
Investments
Operations
Income
Investments
Capital
Distributions
Fees(a)
Period
Return†
(in000’s)
Income
ments††(b)
ments†††
Rate
———————
——————
—————
————————
———————
———————
———————
————––—
————––——
———————
————
—————
——————
——————
———————
—————————
——————
IncomeFund
ClassAAA
2011(c)
$7.53
$0.05
$1.00
$1.05
$(0.05)
——
$(0.05)
$0.00(d)
$8.53
14.0%
$5,172
1.27%(e)
1.67%(e)
2.94%(e)
11%
2010
6.96
0.13
0.56
0.69
(0.12)
——
(0.12)
—7.53
9.9
4,822
1.73
1.50
3.19
102009
7.85
0.16
(0.85)
(0.69)
(0.18)
—$(0.02)
(0.20)
—6.96
(8.1)
4,869
2.57
1.63
3.06
142008
10.21
0.26
(2.05)
(1.79)
(0.34)
$(0.21)
(0.02)
(0.57)
—7.85
(18.2)
7,285
2.83
1.58
2.48
282007
12.04
0.50
0.59
1.09
(0.47)
(2.45)
—(2.92)
—10.21
10.0
17,871
4.65
1.76
2.20
642006
16.53
0.55
(0.31)
0.24
(0.40)
(4.33)
—(4.73)
—12.04
3.4
12,054
4.36
1.65
2.02
141
ClassA
2011(c)
$7.79
$0.04
$1.04
$1.08
$(0.04)
——
$(0.04)
$0.00(d)
$8.83
13.9%
$47
1.07%(e)
1.79%(e)
3.24%(e)
11%
2010
7.20
0.10
0.59
0.69
(0.10)
——
(0.10)
—7.79
9.7
341
1.29
1.75
3.44
102009
8.12
0.08
(0.81)
(0.73)
(0.17)
—$(0.02)
(0.19)
—7.20
(8.4)
771.28
1.88
3.31
142008
10.54
0.24
(2.11)
(1.87)
(0.32)
$(0.21)
(0.02)
(0.55)
—8.12
(18.3)
512.53
1.83
2.73
282007
12.34
0.50
0.59
1.09
(0.44)
(2.45)
—(2.89)
—10.54
9.7
804.45
2.01
2.45
642006
16.76
0.54
(0.32)
0.22
(0.31)
(4.33)
—(4.64)
—12.34
3.2
974.21
1.90
2.27
141
ClassC
2011(c)
$8.36
$0.02
$1.11
$1.13
$(0.02)
——
$(0.02)
$0.00(d)
$9.47
13.5%
$102
0.52%(e)
2.42%(e)
3.69%(e)
11%
2010
7.70
0.08
0.62
0.70
(0.04)
——
(0.04)
—8.36
9.1
971.04
2.25
3.94
102009
8.65
0.11
(0.91)
(0.80)
(0.13)
—$(0.02)
(0.15)
—7.70
(8.8)
261
1.68
2.38
3.81
142008
11.22
0.20
(2.26)
(2.06)
(0.28)
$(0.21)
(0.02)
(0.51)
—8.65
(18.8)
319
1.99
2.33
3.23
282007
12.98
0.38
0.71
1.09
(0.40)
(2.45)
—(2.85)
—11.22
9.1
397
3.35
2.51
2.94
642006
17.26
0.50
(0.32)
0.18
(0.13)
(4.33)
—(4.46)
—12.98
2.8
163.71
2.40
2.77
141
ClassI
2011(c)
$7.53
$0.06
$1.01
$1.07
$(0.06)
——
$(0.06)
$0.00(d)
$8.54
14.3%
$72
1.49%(e)
1.43%(e)
2.69%(e)
11%
2010
6.97
0.14
0.56
0.70
(0.14)
——
(0.14)
—7.53
10.1
541.97
1.25
2.94
102009
7.85
0.19
(0.85)
(0.66)
(0.20)
—$(0.02)
(0.22)
—6.97
(7.8)
593.13
1.38
2.81
142008(f)
9.14
0.18
(1.18)
(1.00)
(0.27)
—(0.02)
(0.29)
—7.85
(11.2)
118
2.82(e)
1.36(e)
2.26(e)
28
†Totalreturnrepresentsaggregatetotalreturnof
ahy
pothetical$1,000
investmentatthe
beginn
ingof
theperiod
andsold
attheendof
theperiod
includ
ingreinvestmento
fdistributions
anddoesno
treflectapplicablesalescharges.Totalreturnforaperiod
ofless
than
oneyear
isno
tann
ualized.
††The
ratios
dono
tincludeareduction
forcustod
ianfeecreditson
cash
balances
maintainedwiththecustod
ian(“CustodianFeeCredits”).Includ
ingsuch
CustodianFeeCredits,theratios
fortheyearsended
Septem
ber30,2009,2008,2007,and2006
wou
ldhave
been
1.50%,1.51%
,1.50%
,and
1.50%
(ClassAAA),1.75%,1.76%
,1.75%
,and
1.75%
(ClassA),2.25%,2.26%
,2.25%
,and2.25%
(Class
C),and1.25%
and1.26%
(Class
I)respectively.For
thesixmon
thsended
March
31,2011andtheyear
ended
Septem
ber30,2010,therewereno
CustodianFeeCredits.
†††
The
ratios
dono
tincludeareduction
forCustodianFeeCredits.Includ
ingsuch
CustodianFeeCredits,theratios
fortheyearsended
Septem
ber30,2009,2008,2007,and2006
wou
ldhave
been
2.93%,2.41%
,1.94%
,and
1.87%
(ClassAAA),3.18%,2.66%
,2.19%
,and
2.12%
(ClassA),3.68%,3.16%
,2.68%
,and
2.62%
(Class
C),and2.68%
and2.16%
(Class
I),respectively.Forthe
sixmon
thsended
March
31,2011andtheyear
ended
Septem
ber30,2010,therewereno
CustodianFeeCredits.
(a)
Persharedataiscalculated
usingtheaverageshares
outstand
ingmetho
d.
(b)
The
Fund
incurred
interestexpenseof
$1,169
and$4,188
duringtheyearsended
Septem
ber30,2009andSeptem
ber30,2008,respectively.A
llof
theinterestexpensefor2009
andapo
rtion
ofthisinterestexpensein
2008
was
paid
forby
prioryearscustod
ianfeecredits.Thiswou
ldim
pacttheratios
ofop
eratingexpenses
totheaveragenetassetsby
0.02%
and0.03%
forall
Classes,respectively.Ifinterestexpensehadno
tbeenincurred,the
ratios
ofop
eratingexpenses
totheaveragenetassetswou
ldhave
been
1.48%
and1.50%
ClassAAA),1.73
and1.75%
(ClassA),2.23%
and2.25%
(Class
C),and1.23%
and1.25%
(Class
I),respectively.Forthesixmon
thsended
March
31,2011andtheyearsended
Septem
ber30,2010and2007,the
effectof
interestexpensewas
minim
al.For
theyear
ended
Septem
ber30,2006,therewas
nointerestexpense.
(c)
Forthesixmon
thsended
March
31,2011,un
audited.
(d)
Amou
ntrepresentsless
than
$0.005
pershare.
(e)
Ann
ualized.
(f)
From
thecommencemento
foffering
Class
IShares
onJanu
ary11,2008throug
hSeptem
ber30,2008.

GAMCOWestwoodFunds
FinancialHighlights
Selected
dataforashareof
beneficialinterestou
tstand
ingthroug
hout
each
period
:
Income(Loss)from
InvestmentOperations
DistributionstoShareholders
RatiostoAverageNetAssets/SupplementalData
——————————––––—————————————
—————————————————————————
————————–—
——————————————
Net
Realized
NetAsset
Net
and
Total
Net
NetAssets,
Net
Value,
Investment
Unrealized
From
Net
NetRealized
AssetValue,
Endof
Investment
Portfolio
PeriodEnded
Beginning
Income
Gain(Loss)on
Investment
Investment
Gainon
Total
Endof
Total
Period
Income
Operating
Turnover
September30
ofPeriod
(Loss)(a)
Investments
Operations
Income
Investments
Distributions
Period
Return†
(in000’s)
(Loss)
Expenses††
Rate
———————
—————
——————
————————
———————
—————
———————
———————
———————
—————
—————
————
—————
—————
EquityFund
ClassAAA
2011(b)
$8.17
$0.03
$1.36
$1.39
$(0.05)
—$(0.05)
$9.51
17.1%
$106,419
0.66%(c)
1.57%(c)(d)
21%
2010
7.72
0.04
0.48
0.52
(0.07)
—(0.07)
8.17
6.8
99,986
0.55
1.56(d)
522009
9.21
0.08
(1.48)
(1.40)
(0.09)
—(0.09)
7.72
(15.2)
132,314
1.21
1.59(d)
111
2008
12.63
0.08
(1.87)
(1.79)
(0.05)
$(1.58)
(1.63)
9.21
(16.0)
167,946
0.73
1.49
712007
12.51
0.04
2.15
2.19
(0.05)
(2.02)
(2.07)
12.63
19.7
189,913
0.37
1.52
582006
11.08
0.06
1.42
1.48
(0.05)
—(0.05)
12.51
13.4
169,404
0.55
1.54
73ClassA
2011(b)
$8.13
$0.02
$1.35
$1.37
$(0.02)
—$(0.02)
$9.48
16.9%
$5,425
0.38%(c)
1.82%(c)(d)
21%
2010
7.69
0.02
0.48
0.50
(0.06)
—(0.06)
8.13
6.5
6,616
0.31
1.81(d)
522009
9.11
0.06
(1.43)
(1.37)
(0.05)
—(0.05)
7.69
(15.0)
6,131
0.89
1.84(d)
111
2008
12.57
0.05
(1.89)
(1.84)
(0.04)
$(1.58)
(1.62)
9.11
(16.6)
5,079
0.47
1.74
712007
12.45
0.01
2.15
2.16
(0.02)
(2.02)
(2.04)
12.57
19.5
3,527
0.12
1.77
582006
11.05
0.03
1.41
1.44
(0.04)
—(0.04)
12.45
13.1
2,780
0.27
1.79
73ClassC
2011(b)
$7.91
$(0.00)(e)
$1.33
$1.33
——
—$9.24
16.8%
$1,042
(0.09)%(c)2.32%(c)(d)
21%
2010
7.49
(0.02)
0.46
0.44
$(0.02)
—$(0.02)
7.91
5.9
999
(0.19)
2.31(d)
522009
8.95
0.02
(1.44)
(1.42)
(0.04)
—(0.04)
7.49
(15.8)
1,067
0.37
2.34(d)
111
2008
12.36
(0.00)(e)
(1.83)
(1.83)
—$(1.58)
(1.58)
8.95
(16.7)
736
(0.02)
2.24
712007
12.31
(0.05)
2.12
2.07
—(2.02)
(2.02)
12.36
18.8
320
(0.39)
2.27
582006
10.97
(0.03)
1.40
1.37
(0.03)
—(0.03)
12.31
12.6
316
(0.28)
2.29
73ClassI
2011(b)
$8.19
$0.04
$1.36
$1.40
$(0.07)
—$(0.07)
$9.52
17.3%
$936
0.89%(c)
1.32%(c)(d)
21%
2010
7.73
0.06
0.49
0.55
(0.09)
—(0.09)
8.19
7.1
1,043
0.81
1.31(d)
522009
9.23
0.10
(1.49)
(1.39)
(0.11)
—(0.11)
7.73
(15.0)
691
1.44
1.34(d)
111
2008(f)
10.35
0.07
(1.19)
(1.12)
——
—9.23
(10.8)
797
1.00(c)
1.24(c)
71
†Totalreturnrepresentsaggregatetotalreturnof
ahy
pothetical$1,000
investmentatthe
beginn
ingof
theperiod
andsold
attheendof
theperiod
includ
ingreinvestmento
fdistributions
anddoesno
treflectapplicablesalescharges.Totalreturnforaperiod
ofless
than
oneyear
isno
tann
ualized.
††The
ratios
dono
tincludeareduction
forcustod
ianfeecreditson
cash
balances
maintainedwiththecustod
ian(“CustodianFeeCredits”).Includ
ingsuch
CustodianFeeCredits,the
ratios
forthesixmon
thsended
March
31,2011andtheyearsended
Septem
ber30,2010,2009,2008,2007,and
2006
wou
ldhave
been
1.55%,1.54%
,1.57%
,1.47%
,1.47%
,and
1.50%,
(ClassAAA),1.80%,1.79%
,1.82%
,1.72%
,1.72%
,and
1.75%(ClassA),2.30%,2.29%
,2.32%
,2.22%
,2.22%
,and
2.25%(ClassC),and1.30%,1.29%
,1.32%
and1.22%(ClassI),respectively.
(a)Persharedataiscalculated
usingtheaverageshares
outstand
ingmetho
d.
(b)Forthesixmon
thsended
March
31,2011,un
audited.
(c)Ann
ualized.
(d)The
Fund
incurred
interestexpenseof
$205,$1,854,and$106
duringthesixmon
thsended
March
31,2011andyearsended
Septem
ber30,2010and2009,respectively.Thisinterest
expensewas
paid
forby
prioryearscustod
ianfeecredits.The
effectof
interestexpensewas
minim
al.
(e)Amou
ntrepresentsless
than
$0.005
pershare.
(f)From
thecommencemento
foffering
Class
IShares
onJanu
ary11,2008throug
hSeptem
ber30,2008.
31
Seeaccompany
ingno
testo
financialstatements.
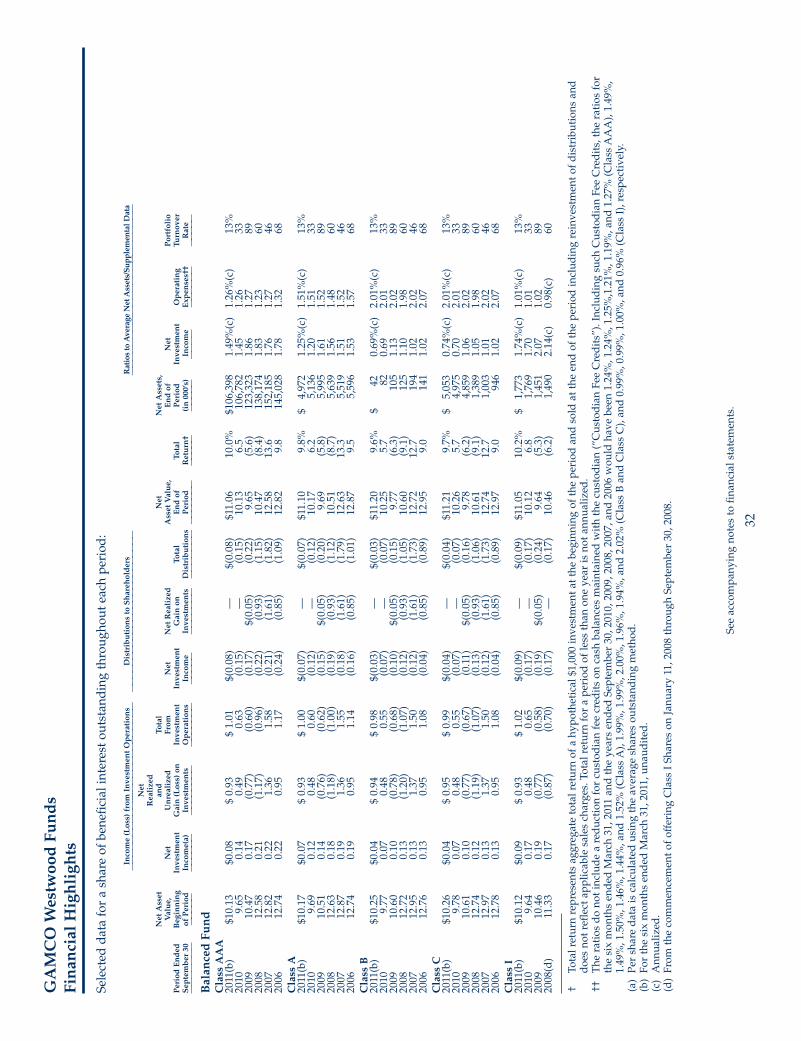
32
GAMCOWestwoodFunds
FinancialHighlights
Selected
dataforashareof
beneficialinterestou
tstand
ingthroug
hout
each
period
:
Income(Loss)from
InvestmentOperations
DistributionstoShareholders
RatiostoAverageNetAssets/SupplementalData
——————————––––—————————————
—————————————————————————
————————–—
——————————————
Net
Realized
NetAsset
and
Total
Net
NetAssets,
Value,
Net
Unrealized
From
Net
NetRealized
AssetValue,
Endof
Net
Portfolio
PeriodEnded
Beginning
Investment
Gain(Loss)on
Investment
Investment
Gainon
Total
Endof
Total
Period
Investment
Operating
Turnover
September30
ofPeriod
Income(a)
Investments
Operations
Income
Investments
Distributions
Period
Return†
(in000’s)
Income
Expenses††
Rate
———————
—————
——————
————————
———————
—————
———————
———————
———————
—————
—————
————
——————
—————
BalancedFund
ClassAAA
2011(b)
$10.13
$0.08
$0.93
$1.01
$(0.08)
—$(0.08)
$11.06
10.0%
$106,398
1.49%(c)
1.26%(c)
13%
2010
9.65
0.14
0.49
0.63
(0.15)
—(0.15)
10.13
6.5
106,782
1.45
1.26
332009
10.47
0.17
(0.77)
(0.60)
(0.17)
$(0.05)
(0.22)
9.65
(5.6)
123,323
1.86
1.27
892008
12.58
0.21
(1.17)
(0.96)
(0.22)
(0.93)
(1.15)
10.47
(8.4)
138,174
1.83
1.23
602007
12.82
0.22
1.36
1.58
(0.21)
(1.61)
(1.82)
12.58
13.6
152,185
1.76
1.27
462006
12.74
0.22
0.95
1.17
(0.24)
(0.85)
(1.09)
12.82
9.8
145,028
1.78
1.32
68ClassA
2011(b)
$10.17
$0.07
$0.93
$1.00
$(0.07)
—$(0.07)
$11.10
9.8%
$4,972
1.25%(c)
1.51%(c)
13%
2010
9.69
0.12
0.48
0.60
(0.12)
—(0.12)
10.17
6.2
5,136
1.20
1.51
332009
10.51
0.14
(0.76)
(0.62)
(0.15)
$(0.05)
(0.20)
9.69
(5.8)
5,995
1.61
1.52
892008
12.63
0.18
(1.18)
(1.00)
(0.19)
(0.93)
(1.12)
10.51
(8.7)
5,639
1.56
1.48
602007
12.87
0.19
1.36
1.55
(0.18)
(1.61)
(1.79)
12.63
13.3
5,519
1.51
1.52
462006
12.74
0.19
0.95
1.14
(0.16)
(0.85)
(1.01)
12.87
9.5
5,596
1.53
1.57
68ClassB
2011(b)
$10.25
$0.04
$0.94
$0.98
$(0.03)
—$(0.03)
$11.20
9.6%
$42
0.69%(c)
2.01%(c)
13%
2010
9.77
0.07
0.48
0.55
(0.07)
—(0.07)
10.25
5.7
820.69
2.01
332009
10.60
0.10
(0.78)
(0.68)
(0.10)
$(0.05)
(0.15)
9.77
(6.3)
105
1.13
2.02
892008
12.72
0.13
(1.20)
(1.07)
(0.12)
(0.93)
(1.05)
10.60
(9.1)
125
1.10
1.98
602007
12.95
0.13
1.37
1.50
(0.12)
(1.61)
(1.73)
12.72
12.7
194
1.02
2.02
462006
12.76
0.13
0.95
1.08
(0.04)
(0.85)
(0.89)
12.95
9.0
141
1.02
2.07
68ClassC
2011(b)
$10.26
$0.04
$0.95
$0.99
$(0.04)
—$(0.04)
$11.21
9.7%
$5,053
0.74%(c)
2.01%(c)
13%
2010
9.78
0.07
0.48
0.55
(0.07)
—(0.07)
10.26
5.7
4,975
0.70
2.01
332009
10.61
0.10
(0.77)
(0.67)
(0.11)
$(0.05)
(0.16)
9.78
(6.2)
4,859
1.06
2.02
892008
12.74
0.12
(1.19)
(1.07)
(0.13)
(0.93)
(1.06)
10.61
(9.1)
1,389
1.05
1.98
602007
12.97
0.13
1.37
1.50
(0.12)
(1.61)
(1.73)
12.74
12.7
1,003
1.01
2.02
462006
12.78
0.13
0.95
1.08
(0.04)
(0.85)
(0.89)
12.97
9.0
946
1.02
2.07
68ClassI
2011(b)
$10.12
$0.09
$0.93
$1.02
$(0.09)
—$(0.09)
$11.05
10.2%
$1,773
1.74%(c)
1.01%(c)
13%
2010
9.64
0.17
0.48
0.65
(0.17)
—(0.17)
10.12
6.8
1,769
1.70
1.01
332009
10.46
0.19
(0.77)
(0.58)
(0.19)
$(0.05)
(0.24)
9.64
(5.3)
1,451
2.07
1.02
892008(d)
11.33
0.17
(0.87)
(0.70)
(0.17)
—(0.17)
10.46
(6.2)
1,490
2.14(c)
0.98(c)
60
†Totalreturnrepresentsaggregatetotalreturnof
ahy
pothetical$1,000
investmentatthe
beginn
ingof
theperiod
andsold
attheendof
theperiod
includ
ingreinvestmento
fdistributions
and
doesno
treflectapplicablesalescharges.Totalreturnforaperiod
ofless
than
oneyear
isno
tann
ualized.
††The
ratios
dono
tincludeareduction
forcustod
ianfeecreditson
cash
balances
maintainedwiththecustod
ian(“CustodianFeeCredits”).Includ
ingsuch
CustodianFeeCredits,theratios
for
thesixmon
thsended
March
31,2011andtheyearsended
Septem
ber30,2010,2009,2008,2007,and
2006
wou
ldhave
been
1.24%,1.24%
,1.25%
,1.21%
,1.19%
,and
1.27%
(ClassAAA),1.49%,
1.49%,1.50%
,1.46%
,1.44%
,and
1.52%
(ClassA),1.99%,1.99%
,2.00%
,1.96%
,1.94%
,and
2.02%
(Class
BandClass
C),and0.99%,0.99%
,1.00%
,and
0.96%
(Class
I),respectively.
(a)Persharedataiscalculated
usingtheaverageshares
outstand
ingmetho
d.
(b)Forthesixmon
thsended
March
31,2011,un
audited.
(c)Ann
ualized.
(d)From
thecommencemento
foffering
Class
IShares
onJanu
ary11,2008throug
hSeptem
ber30,2008.
Seeaccompany
ingno
testo
financialstatements.
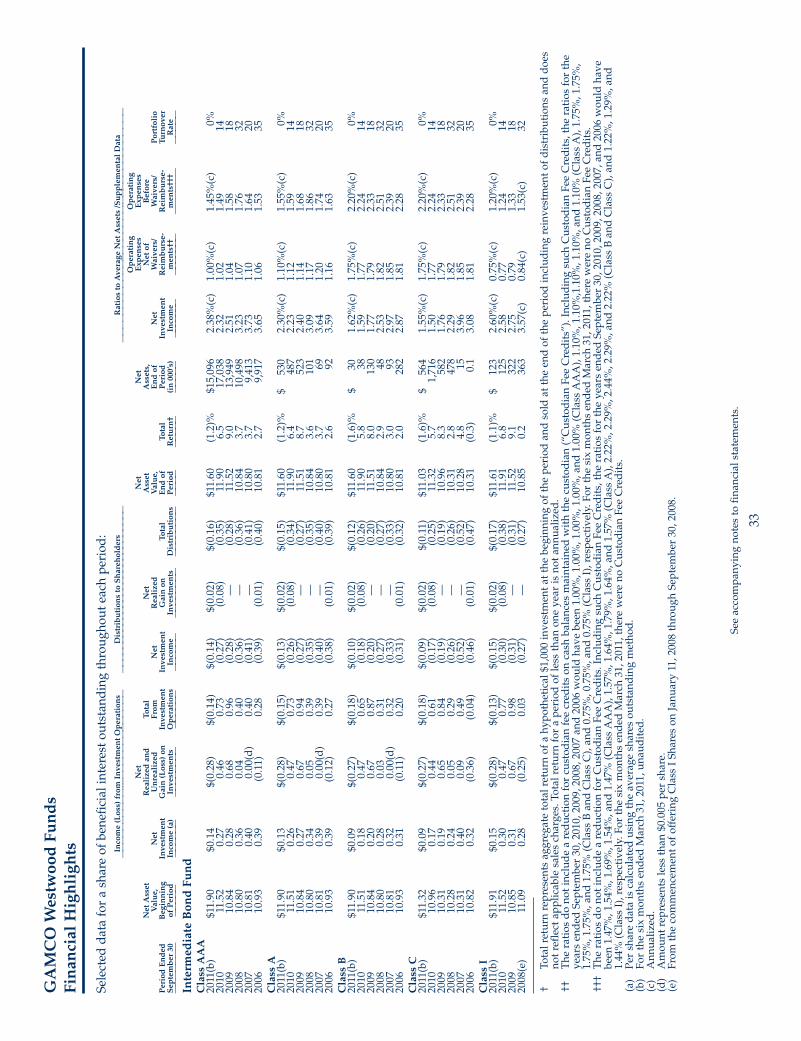
33
Seeaccompany
ingno
testo
financialstatements.
GAMCOWestwoodFunds
FinancialHighlights
Selected
dataforashareof
beneficialinterestou
tstand
ingthroug
hout
each
period
:Income(Loss)from
InvestmentOperations
DistributionstoShareholders
RatiostoAverageNetAssets/SupplementalData
——————————––––—————————————
————————————————————————————
————————————————————–—
—————————————
Operating
Operating
Net
Net
Net
Expenses
Expenses
NetAsset
Realizedand
Total
Net
Asset
Assets,
Netof
Before
Value,
Net
Unrealized
From
Net
Realized
Value,
Endof
Net
Waivers/
Waivers/
Portfolio
PeriodEnded
Beginning
Investment
Gain(Loss)on
Investment
Investment
Gainon
Total
Endof
Total
Period
Investment
Reimburse-
Reimburse-
Turnover
September30
ofPeriod
Income(a)
Investments
Operations
Income
Investments
Distributions
Period
Return†
(in000’s)
Income
ments††
ments†††
Rate
———————
—————
——————
————————
——————
——————
————————
————————
————
—————
—————
———————
———————
——————
—————
IntermediateBondFund
ClassAAA
2011(b)
$11.90
$0.14
$(0.28)
$(0.14)
$(0.14)
$(0.02)
$(0.16)
$11.60
(1.2)%
$15,096
2.38%(c)
1.00%(c)
1.45%(c)
0%2010
11.52
0.27
0.46
0.73
(0.27)
(0.08)
(0.35)
11.90
6.5
17,038
2.32
1.02
1.49
142009
10.84
0.28
0.68
0.96
(0.28)
—(0.28)
11.52
9.0
13,949
2.51
1.04
1.58
182008
10.80
0.36
0.04
0.40
(0.36)
—(0.36)
10.84
3.7
10,498
3.23
1.07
1.76
322007
10.81
0.40
0.00(d)
0.40
(0.41)
—(0.41)
10.80
3.7
9,413
3.73
1.10
1.64
202006
10.93
0.39
(0.11)
0.28
(0.39)
(0.01)
(0.40)
10.81
2.7
9,917
3.65
1.06
1.53
35ClassA
2011(b)
$11.90
$0.13
$(0.28)
$(0.15)
$(0.13)
$(0.02)
$(0.15)
$11.60
(1.2)%
$530
2.30%(c)
1.10%(c)
1.55%(c)
0%2010
11.51
0.26
0.47
0.73
(0.26)
(0.08)
(0.34)
11.90
6.4
487
2.23
1.12
1.59
142009
10.84
0.27
0.67
0.94
(0.27)
—(0.27)
11.51
8.7
523
2.40
1.14
1.68
182008
10.80
0.34
0.05
0.39
(0.35)
—(0.35)
10.84
3.6
101
3.09
1.17
1.86
322007
10.81
0.39
0.00(d)
0.39
(0.40)
—(0.40)
10.80
3.7
693.64
1.20
1.74
202006
10.93
0.39
(0.12)
0.27
(0.38)
(0.01)
(0.39)
10.81
2.6
923.59
1.16
1.63
35ClassB
2011(b)
$11.90
$0.09
$(0.27)
$(0.18)
$(0.10)
$(0.02)
$(0.12)
$11.60
(1.6)%
$30
1.62%(c)
1.75%(c)
2.20%(c)
0%2010
11.51
0.18
0.47
0.65
(0.18)
(0.08)
(0.26)
11.90
5.8
381.59
1.77
2.24
142009
10.84
0.20
0.67
0.87
(0.20)
—(0.20)
11.51
8.0
130
1.77
1.79
2.33
182008
10.80
0.28
0.03
0.31
(0.27)
—(0.27)
10.84
2.9
482.53
1.82
2.51
322007
10.81
0.32
0.00(d)
0.32
(0.33)
—(0.33)
10.80
3.0
932.97
1.85
2.39
202006
10.93
0.31
(0.11)
0.20
(0.31)
(0.01)
(0.32)
10.81
2.0
282
2.87
1.81
2.28
35ClassC
2011(b)
$11.32
$0.09
$(0.27)
$(0.18)
$(0.09)
$(0.02)
$(0.11)
$11.03
(1.6)%
$564
1.55%(c)
1.75%(c)
2.20%(c)
0%2010
10.96
0.17
0.44
0.61
(0.17)
(0.08)
(0.25)
11.32
5.7
1,716
1.50
1.77
2.24
142009
10.31
0.19
0.65
0.84
(0.19)
—(0.19)
10.96
8.3
582
1.76
1.79
2.33
182008
10.28
0.24
0.05
0.29
(0.26)
—(0.26)
10.31
2.8
478
2.29
1.82
2.51
322007
10.31
0.40
0.09
0.49
(0.52)
—(0.52)
10.28
4.8
153.96
1.85
2.39
202006
10.82
0.32
(0.36)
(0.04)
(0.46)
(0.01)
(0.47)
10.31
(0.3)
0.1
3.08
1.81
2.28
35ClassI
2011(b)
$11.91
$0.15
$(0.28)
$(0.13)
$(0.15)
$(0.02)
$(0.17)
$11.61
(1.1)%
$123
2.60%(c)
0.75%(c)
1.20%(c)
0%2010
11.52
0.30
0.47
0.77
(0.30)
(0.08)
(0.38)
11.91
6.8
125
2.58
0.77
1.24
142009
10.85
0.31
0.67
0.98
(0.31)
—(0.31)
11.52
9.1
322
2.75
0.79
1.33
182008(e)
11.09
0.28
(0.25)
0.03
(0.27)
—(0.27)
10.85
0.2
363
3.57(c)
0.84(c)
1.53(c)
32
†Totalreturnrepresentsaggregatetotalreturnof
ahy
pothetical$1,000
investmentatthe
beginn
ingof
theperiod
andsold
attheendof
theperiod
includ
ingreinvestmento
fdistributions
anddoes
notreflectapplicablesalescharges.Totalreturnforaperiod
ofless
than
oneyear
isno
tann
ualized.
††The
ratios
dono
tincludeareduction
forcustod
ianfeecreditson
cash
balances
maintainedwiththecustod
ian(“CustodianFeeCredits”).Includ
ingsuch
CustodianFeeCredits,theratios
forthe
yearsended
Septem
ber30,2010,2009,2008,2007
and2006
wou
ldhave
been
1.00%,1.00%
,1.00%
,1.00%
,and
1.00%
(ClassAAA),1.10%,1.10%
,1.10%
,1.10%
,and
1.10%
(ClassA),1.75%,1.75%
,1.75%,1.75%
,and
1.75%
(Class
BandClass
C),and0.75%,0.75%
,and
0.75%
(Class
I),respectively.Forthesixmon
thsended
March
31,2011,therewereno
CustodianFeeCredits.
†††
The
ratios
dono
tincludeareduction
forCustodianFeeCredits.Includ
ingsuch
CustodianFeeCredits,theratios
fortheyearsended
Septem
ber30,2010,2009,2008,2007,and
2006
wou
ldhave
been
1.47%,1.54%
,1.69%
,1.54%
,and
1.47%
(ClassAAA),1.57%,1.64%
,1.79%
,1.64%
,and
1.57%
(ClassA),2.22%,2.29%
,2.44%
,2.29%
,and
2.22%
(Class
BandClass
C),and1.22%,1.29%
,and
1.44%
(Class
I),respectively.Forthesixmon
thsended
March
31,2011,therewereno
CustodianFeeCredits.
(a)
Persharedataiscalculated
usingtheaverageshares
outstand
ingmetho
d.
(b)
Forthesixmon
thsended
March
31,2011,un
audited.
(c)
Ann
ualized.
(d)
Amou
ntrepresentsless
than
$0.005
pershare.
(e)
From
thecommencemento
foffering
Class
IShares
onJanu
ary11,2008throug
hSeptem
ber30,2008.

34
GAMCO Westwood FundsNotes to Financial Statements (Unaudited)
1. Organization. The GAMCOWestwood Funds (the “Trust”) was organized as a Massachusetts business trust on June 12,1986. The Trust is registered under the Investment Company Act of 1940, as amended (the “1940 Act”), as a diversifiedopen-end management investment company and currently consists of six active separate investment portfolios: GAMCOWestwood Mighty MitesSM Fund (“Mighty MitesSM Fund”), GAMCO Westwood SmallCap Equity Fund (“SmallCap EquityFund”), GAMCO Westwood Income Fund (“Income Fund”), GAMCO Westwood Equity Fund (“Equity Fund”), GAMCOWestwood Balanced Fund (“Balanced Fund”), and GAMCO Westwood Intermediate Bond Fund (“Intermediate BondFund”), (individually, a “Fund” and collectively, the “Funds”), each with five classes of shares outstanding except for theIncome Fund and Equity Fund with four classes outstanding. Each class of shares outstanding bears the same voting,dividend, liquidation, and other rights and conditions, except that the expenses incurred in the distribution and marketingof such shares are different for each class.
The investment objectives of each Fund are as follows:
• Mighty MitesSM Fund seeks to provide long-term capital appreciation by investing primarily in micro-capitalizationequity securities.
• SmallCap Equity Fund seeks to provide long-term capital appreciation by investing primarily in smaller capitalizationequity securities.
• Income Fund seeks to provide a high level of current income as well as long-term capital appreciation.
• Equity Fund seeks to provide capital appreciation. The Equity Fund’s secondary goal is to produce current income.
• Balanced Fund seeks to provide capital appreciation and current income resulting in a high total investment returnconsistent with prudent investment risk and a balanced investment approach.
• Intermediate Bond Fund seeks to maximize total return, while maintaining a level of current income consistent with themaintenance of principal and liquidity.
2. Significant Accounting Policies. The Trust’s financial statements are prepared in accordance with U.S. generallyaccepted accounting principles (“GAAP”), which may require the use of management estimates and assumptions. Actualresults could differ from those estimates. The following is a summary of significant accounting policies followed by theFunds in the preparation of its financial statements.
Security Valuation. Portfolio securities listed or traded on a nationally recognized securities exchange or traded in the U.S.over-the-counter market for which market quotations are readily available are valued at the last quoted sale price or amarket’s official closing price as of the close of business on the day the securities are being valued. If there were no salesthat day, the security is valued at the average of the closing bid and asked prices or, if there were no asked prices quotedon that day, then the security is valued at the closing bid price on that day. If no bid or asked prices are quoted on such day,the security is valued at the most recently available price or, if the Board of Trustees (the “Board”) so determines, by suchother method as the Board shall determine in good faith to reflect its fair market value. Portfolio securities traded on morethan one national securities exchange or market are valued according to the broadest and most representative market, asdetermined by Teton Advisors, Inc. (the “Adviser”).
Portfolio securities primarily traded on a foreign market are generally valued at the preceding closing values of suchsecurities on the relevant market, but may be fair valued pursuant to procedures established by the Board if marketconditions change significantly after the close of the foreign market but prior to the close of business on the day thesecurities are being valued. Debt instruments with remaining maturities of sixty days or less that are not credit impairedare valued at amortized cost, unless the Board determines such amount does not reflect the securities’ fair value, in whichcase these securities will be fair valued as determined by the Board. Debt instruments having a maturity greater than sixtydays for which market quotations are readily available are valued at the average of the latest bid and asked prices. If therewere no asked prices quoted on such day, the security is valued using the closing bid price. U.S. government obligationswith maturities greater than sixty days are normally valued using a model that incorporates market observable data suchas reported sales of similar securities, broker quotes, yields, bids, offers, and reference data. Certain securities are valuedprincipally using dealer quotations.
Securities and assets for which market quotations are not readily available are fair valued as determined by the Board. Fairvaluation methodologies and procedures may include, but are not limited to: analysis and review of available financial andnon-financial information about the company; comparisons with the valuation and changes in valuation of similarsecurities, including a comparison of foreign securities with the equivalent U.S. dollar value ADR securities at the close ofthe U.S. exchange; and evaluation of any other information that could be indicative of the value of the security.
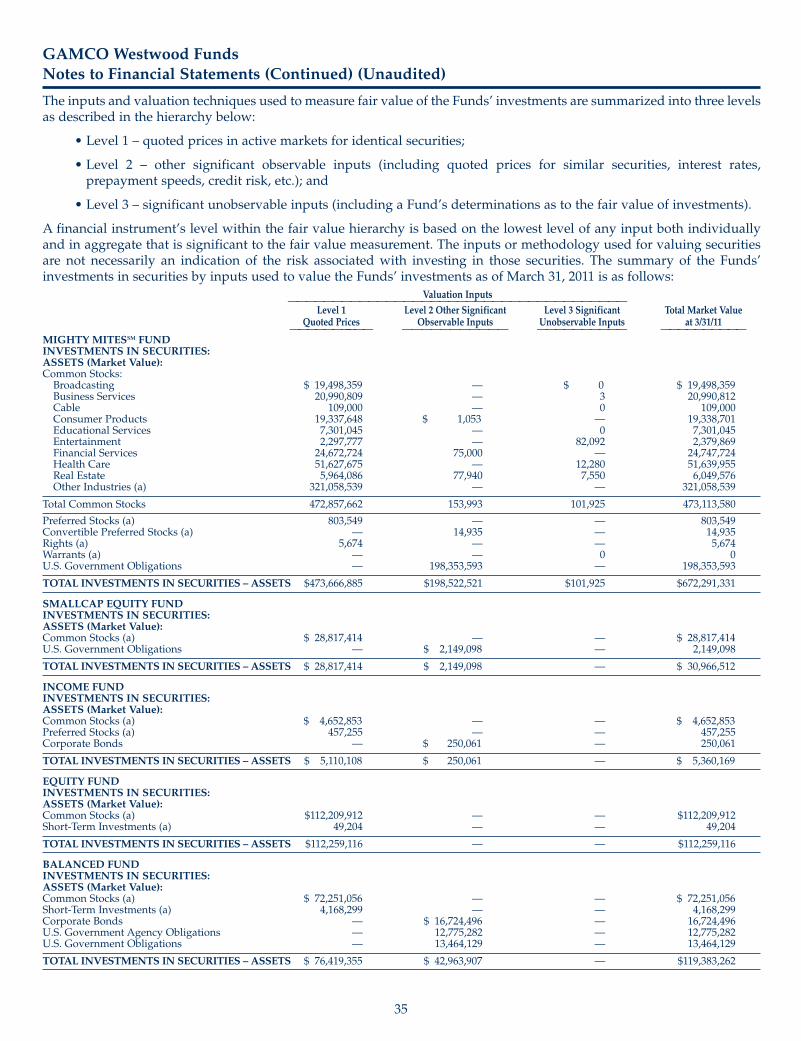
35
GAMCO Westwood FundsNotes to Financial Statements (Continued) (Unaudited)
The inputs and valuation techniques used to measure fair value of the Funds’ investments are summarized into three levelsas described in the hierarchy below:
• Level 1 – quoted prices in active markets for identical securities;
• Level 2 – other significant observable inputs (including quoted prices for similar securities, interest rates,prepayment speeds, credit risk, etc.); and
• Level 3 – significant unobservable inputs (including a Fund’s determinations as to the fair value of investments).
A financial instrument’s level within the fair value hierarchy is based on the lowest level of any input both individuallyand in aggregate that is significant to the fair value measurement. The inputs or methodology used for valuing securitiesare not necessarily an indication of the risk associated with investing in those securities. The summary of the Funds’investments in securities by inputs used to value the Funds’ investments as of March 31, 2011 is as follows:
Valuation Inputs——————————————————————————————————————Level 1 Level 2 Other Significant Level 3 Significant Total Market Value
Quoted Prices Observable Inputs Unobservable Inputs at 3/31/11—————————— ——————————— —————————— ——————————
MIGHTY MITESSM FUNDINVESTMENTS IN SECURITIES:ASSETS (Market Value):Common Stocks:Broadcasting $ 19,498,359 — $ 0 $ 19,498,359Business Services 20,990,809 — 3 20,990,812Cable 109,000 — 0 109,000Consumer Products 19,337,648 $ 1,053 — 19,338,701Educational Services 7,301,045 — 0 7,301,045Entertainment 2,297,777 — 82,092 2,379,869Financial Services 24,672,724 75,000 — 24,747,724Health Care 51,627,675 — 12,280 51,639,955Real Estate 5,964,086 77,940 7,550 6,049,576Other Industries (a) 321,058,539 — — 321,058,539
Total Common Stocks 472,857,662 153,993 101,925 473,113,580
Preferred Stocks (a) 803,549 — — 803,549Convertible Preferred Stocks (a) — 14,935 — 14,935Rights (a) 5,674 — — 5,674Warrants (a) — — 0 0U.S. Government Obligations — 198,353,593 — 198,353,593
TOTAL INVESTMENTS IN SECURITIES – ASSETS $473,666,885 $198,522,521 $101,925 $672,291,331
SMALLCAP EQUITY FUNDINVESTMENTS IN SECURITIES:ASSETS (Market Value):Common Stocks (a) $ 28,817,414 — — $ 28,817,414U.S. Government Obligations — $ 2,149,098 — 2,149,098
TOTAL INVESTMENTS IN SECURITIES – ASSETS $ 28,817,414 $ 2,149,098 — $ 30,966,512
INCOME FUNDINVESTMENTS IN SECURITIES:ASSETS (Market Value):Common Stocks (a) $ 4,652,853 — — $ 4,652,853Preferred Stocks (a) 457,255 — — 457,255Corporate Bonds — $ 250,061 — 250,061
TOTAL INVESTMENTS IN SECURITIES – ASSETS $ 5,110,108 $ 250,061 — $ 5,360,169
EQUITY FUNDINVESTMENTS IN SECURITIES:ASSETS (Market Value):Common Stocks (a) $112,209,912 — — $112,209,912Short-Term Investments (a) 49,204 — — 49,204
TOTAL INVESTMENTS IN SECURITIES – ASSETS $112,259,116 — — $112,259,116
BALANCED FUNDINVESTMENTS IN SECURITIES:ASSETS (Market Value):Common Stocks (a) $ 72,251,056 — — $ 72,251,056Short-Term Investments (a) 4,168,299 — — 4,168,299Corporate Bonds — $ 16,724,496 — 16,724,496U.S. Government Agency Obligations — 12,775,282 — 12,775,282U.S. Government Obligations — 13,464,129 — 13,464,129
TOTAL INVESTMENTS IN SECURITIES – ASSETS $ 76,419,355 $ 42,963,907 — $119,383,262

36
GAMCO Westwood FundsNotes to Financial Statements (Continued) (Unaudited)
Valuation Inputs (Continued)——————————————————————————————————————Level 1 Level 2 Other Significant Level 3 Significant Total Market Value
Quoted Prices Observable Inputs Unobservable Inputs at 3/31/11—————————— ——————————— —————————— ——————————
INTERMEDIATE BOND FUNDINVESTMENTS IN SECURITIES:ASSETS (Market Value):Short-Term Investments (a) $ 610,036 — — $ 610,036Corporate Bonds — $ 6,943,236 — 6,943,236U.S. Government Agency Obligations — 4,475,473 — 4,475,473U.S. Government Obligations — 4,186,792 — 4,186,792
TOTAL INVESTMENTS IN SECURITIES – ASSETS $ 610,036 $ 15,605,501 — $ 16,215,537
(a) Please refer to the Schedule of Investments for the industry classifications of these portfolio holdings.
The Funds did not have significant transfers between Level 1 and Level 2 during the six months ended March 31, 2011.
There were no Level 3 investments held at March 31, 2011 or September 30, 2010 for SmallCap Equity Fund, Income Fund,Equity Fund, Balanced Fund, and Intermediate Bond Fund.
The following table reconciles Level 3 investments for which significant unobservable inputs were used to determine fairvalue:
Net change inunrealizedappreciation/depreciationduring theperiod
Change in on Level 3Accrued unrealized Transfers Transfers Balance investments
Balance as discounts/ Realized appreciation/ into out of as of heldMIGHTY MITESSM FUND of 9/30/10 (premiums) gain/(loss) depreciation† Purchases Sales Level 3 †† Level 3 †† 3/31/11 at 3/31/11†INVESTMENTS IN SECURITIES:ASSETS (Market Value):Common Stocks:Broadcasting $ 1 $— $— $ (1) $— $— $— $— $ 0 $ (1)Business Services 0 — — — — — 3 — 3 —Cable 0 — — — — — — — 0 —Educational Services 0 — — — — — — — 0 —Entertainment 82,092 — — — — — — — 82,092 —Health Care 12,280 — — — — — — — 12,280 —Real Estate 1,413 — — 6,137 — — — — 7,550 6,137Telecommunications 10 — (3) (7) — (0) — — — —
Total Common Stocks 95,796 — (3) 6,129 — (0) 3 — 101,925 6,136
Warrants:Broadcasting — — — — — — 0 — 0 —
TOTAL INVESTMENTS IN SECURITIES $95,796 $— $(3) $6,129 $— $(0) $ 3 $— $101,925 $6,136
† Net change in unrealized appreciation/depreciation on investments is included in the related amounts in the Statement of Operations.†† The Fund’s policy is to recognize transfers into and transfers out of Level 3 as of the beginning of the reporting period.
In January 2010, the Financial Accounting Standards Board (“FASB”) issued amended guidance to improve disclosureabout fair value measurements which requires additional disclosures about transfers between Levels 1 and 2 and separatedisclosures about purchases, sales, issuances, and settlements in the reconciliation of fair value measurements usingsignificant unobservable inputs (Level 3). FASB also clarified existing disclosure requirements relating to the levels ofdisaggregation of fair value measurement and inputs and valuation techniques used to measure fair value. The amendedguidance is effective for financial statements for fiscal years beginning after December 15, 2009 and interim periods withinthose fiscal years. Management has adopted the amended guidance and determined that there was no material impact tothe Funds’ financial statements except for additional disclosures made in the notes. Disclosures about purchases, sales,issuances, and settlements in the rollforward of activity in Level 3 fair value measurements are effective for fiscal yearsbeginning after December 15, 2010 and for interim periods within those fiscal years. Management is currently evaluatingthe impact of the additional disclosure requirements on the Funds’ financial statements.

37
GAMCO Westwood FundsNotes to Financial Statements (Continued) (Unaudited)
Securities Sold Short. The Mighty MitesSM Fund may enter into short sale transactions. Short selling involves sellingsecurities that may or may not be owned and, at times, borrowing the same securities for delivery to the purchaser, withan obligation to replace such borrowed securities at a later date. The proceeds received from short sales are recorded asliabilities and the Mighty MitesSM Fund records an unrealized gain or loss to the extent of the difference between theproceeds received and the value of an open short position on the day of determination. The Mighty MitesSM Fund recordsa realized gain or loss when the short position is closed out. By entering into a short sale, the Mighty MitesSM Fund bearsthe market risk of an unfavorable change in the price of the security sold short. Dividends on short sales are recorded asan expense by the Mighty MitesSM Fund on the ex-dividend date and interest expense is recorded on the accrual basis. AtMarch 31, 2011, there were no short sales outstanding for the Mighty MitesSM Fund.
Foreign Currency Translations. The books and records of the Funds are maintained in U.S. dollars. Foreign currencies,investments, and other assets and liabilities are translated into U.S. dollars at the current exchange rates. Purchases andsales of investment securities, income, and expenses are translated at the exchange rate prevailing on the respective datesof such transactions. Unrealized gains and losses that result from changes in foreign exchange rates and/or changes inmarket prices of securities have been included in unrealized appreciation/depreciation on investments and foreigncurrency translations. Net realized foreign currency gains and losses resulting from changes in exchange rates includeforeign currency gains and losses between trade date and settlement date on investment securities transactions, foreigncurrency transactions, and the difference between the amounts of interest and dividends recorded on the books of theFunds and the amounts actually received. The portion of foreign currency gains and losses related to fluctuation inexchange rates between the initial purchase trade date and subsequent sale trade date is included in realized gain/loss oninvestments.
Foreign Securities. The Funds may directly purchase securities of foreign issuers. Investing in securities of foreign issuersinvolves special risks not typically associated with investing in securities of U.S. issuers. The risks include possiblerevaluation of currencies, the inability to repatriate funds, less complete financial information about companies, andpossible future adverse political and economic developments. Moreover, securities of many foreign issuers and theirmarkets may be less liquid and their prices more volatile than securities of comparable U.S. issuers.
Foreign Taxes. The Funds may be subject to foreign taxes on income, gains on investments, or currency repatriation, aportion of which may be recoverable. The Funds will accrue such taxes and recoveries as applicable, based upon theircurrent interpretation of tax rules and regulations that exist in the markets in which they invest.
Restricted and Illiquid Securities. Each Fund may invest up to 10% (except for the Mighty MitesSM Fund, SmallCap EquityFund, and Income Fund which may invest up to 15%) of its net assets in securities for which the markets are illiquid.Illiquid securities include securities the disposition of which is subject to substantial legal or contractual restrictions. Thesale of illiquid securities often requires more time and results in higher brokerage charges or dealer discounts and otherselling expenses than does the sale of securities eligible for trading on national securities exchanges or in the over-the-counter markets. Restricted securities may sell at a price lower than similar securities that are not subject to restrictions onresale. Securities freely saleable among qualified institutional investors under special rules adopted by the SEC may betreated as liquid if they satisfy liquidity standards established by the Board. The continued liquidity of such securities isnot as well assured as that of publicly traded securities, and accordingly the Board will monitor their liquidity. For therestricted and illiquid securities the Mighty MitesSM Fund held as of March 31, 2011, refer to its Schedule of Investments.
Investments in other Investment Companies. All Funds may invest, from time to time, in shares of other investmentcompanies (or entities that would be considered investment companies but are excluded from the definition pursuant tocertain exceptions under the 1940 Act) (the “Acquired Funds”) in accordance with the 1940 Act and related rules.Shareholders in these Funds would bear the pro rata portion of the periodic expenses of the Acquired Funds in addition tothe Fund’s expenses. For the six months ended March 31, 2011, the Mighty MitesSM Fund’s, Equity Fund’s, Balanced Fund’s,and Intermediate Bond Fund’s pro rata portion of the periodic expenses charged by the Acquired Funds was less than onebasis point for each of these four funds. During the six months ended March 31, 2011, the Income Fund and SmallCapEquity Fund held no investments in other investment companies.
Securities Transactions and Investment Income. Securities transactions are accounted for on the trade date with realizedgain or loss on investments determined by using the identified cost method. Interest income (including amortization ofpremium and accretion of discount) is recorded on the accrual basis. Premiums and discounts on debt securities areamortized using the effective yield to maturity method. Dividend income is recorded on the ex-dividend date except forcertain dividends from foreign securities that are recorded as soon after the ex-dividend date as a Fund becomes aware ofsuch dividends.
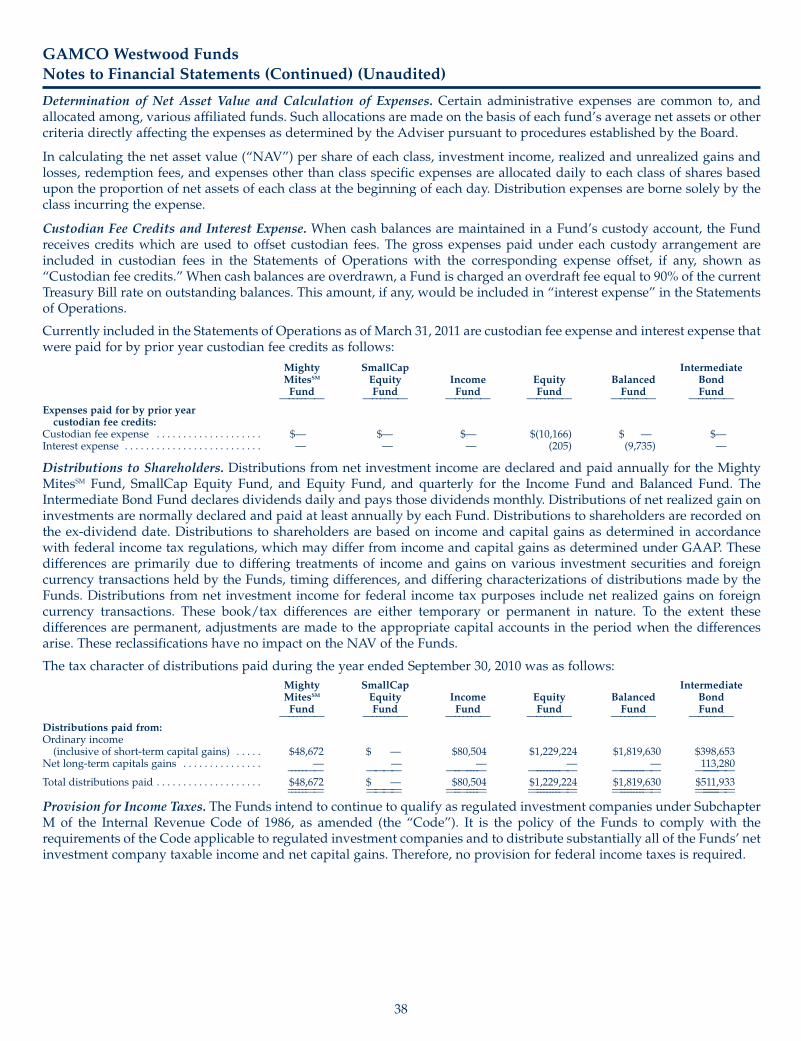
38
Determination of Net Asset Value and Calculation of Expenses. Certain administrative expenses are common to, andallocated among, various affiliated funds. Such allocations are made on the basis of each fund’s average net assets or othercriteria directly affecting the expenses as determined by the Adviser pursuant to procedures established by the Board.
In calculating the net asset value (“NAV”) per share of each class, investment income, realized and unrealized gains andlosses, redemption fees, and expenses other than class specific expenses are allocated daily to each class of shares basedupon the proportion of net assets of each class at the beginning of each day. Distribution expenses are borne solely by theclass incurring the expense.
Custodian Fee Credits and Interest Expense. When cash balances are maintained in a Fund’s custody account, the Fundreceives credits which are used to offset custodian fees. The gross expenses paid under each custody arrangement areincluded in custodian fees in the Statements of Operations with the corresponding expense offset, if any, shown as“Custodian fee credits.” When cash balances are overdrawn, a Fund is charged an overdraft fee equal to 90% of the currentTreasury Bill rate on outstanding balances. This amount, if any, would be included in “interest expense” in the Statementsof Operations.
Currently included in the Statements of Operations as of March 31, 2011 are custodian fee expense and interest expense thatwere paid for by prior year custodian fee credits as follows:
Mighty SmallCap IntermediateMitesSM Equity Income Equity Balanced BondFund Fund Fund Fund Fund Fund
—––––—— —––––—— —––––—— —––––—— —––––—— —––––——Expenses paid for by prior yearcustodian fee credits:
Custodian fee expense . . . . . . . . . . . . . . . . . . . . $— $— $— $(10,166) $ — $—Interest expense . . . . . . . . . . . . . . . . . . . . . . . . . . — — — (205) (9,735) —
Distributions to Shareholders. Distributions from net investment income are declared and paid annually for the MightyMitesSM Fund, SmallCap Equity Fund, and Equity Fund, and quarterly for the Income Fund and Balanced Fund. TheIntermediate Bond Fund declares dividends daily and pays those dividends monthly. Distributions of net realized gain oninvestments are normally declared and paid at least annually by each Fund. Distributions to shareholders are recorded onthe ex-dividend date. Distributions to shareholders are based on income and capital gains as determined in accordancewith federal income tax regulations, which may differ from income and capital gains as determined under GAAP. Thesedifferences are primarily due to differing treatments of income and gains on various investment securities and foreigncurrency transactions held by the Funds, timing differences, and differing characterizations of distributions made by theFunds. Distributions from net investment income for federal income tax purposes include net realized gains on foreigncurrency transactions. These book/tax differences are either temporary or permanent in nature. To the extent thesedifferences are permanent, adjustments are made to the appropriate capital accounts in the period when the differencesarise. These reclassifications have no impact on the NAV of the Funds.
The tax character of distributions paid during the year ended September 30, 2010 was as follows:Mighty SmallCap IntermediateMitesSM Equity Income Equity Balanced BondFund Fund Fund Fund Fund Fund
—––––—— —––––—— —––––—— —––––—— —––––—— —––––——Distributions paid from:Ordinary income(inclusive of short-term capital gains) . . . . . $48,672 $ — $80,504 $1,229,224 $1,819,630 $398,653
Net long-term capitals gains . . . . . . . . . . . . . . . — — — — — 113,280–––––—— ———— —–—–––— —–––––––—— —–––––––—— —–––––——
Total distributions paid . . . . . . . . . . . . . . . . . . . . $48,672 $ — $80,504 $1,229,224 $1,819,630 $511,933–––––—— ———— —–—–––— —–––––––—— —–––––––—— —–––––——–––––—— ———— —–—–––— —–––––––—— —–––––––—— —–––––——
Provision for Income Taxes. The Funds intend to continue to qualify as regulated investment companies under SubchapterM of the Internal Revenue Code of 1986, as amended (the “Code”). It is the policy of the Funds to comply with therequirements of the Code applicable to regulated investment companies and to distribute substantially all of the Funds’ netinvestment company taxable income and net capital gains. Therefore, no provision for federal income taxes is required.
GAMCO Westwood FundsNotes to Financial Statements (Continued) (Unaudited)

39
The following summarizes capital loss carryforwards and expiration dates for each Fund at September 30, 2010:Mighty SmallCap IntermediateMitesSM Equity Income Equity Balanced BondFund Fund Fund Fund Fund Fund
—––––—— —––––—— —––––—— —––––—— —––––—— —––––——Expiring in Fiscal Year:2011 . . . . . . . . . . . . . . . . . . . . . . . . . . . . . . . . . . . . . — $4,845,486 — — — —2012 . . . . . . . . . . . . . . . . . . . . . . . . . . . . . . . . . . . . — — — — — —2013 . . . . . . . . . . . . . . . . . . . . . . . . . . . . . . . . . . . . — — — — — —2014 . . . . . . . . . . . . . . . . . . . . . . . . . . . . . . . . . . . . — — — — — —2015 . . . . . . . . . . . . . . . . . . . . . . . . . . . . . . . . . . . . — — — — — —2016 . . . . . . . . . . . . . . . . . . . . . . . . . . . . . . . . . . . . — 210 — — — —2017 . . . . . . . . . . . . . . . . . . . . . . . . . . . . . . . . . . . . — 585,663 $1,094,920 $ 4,107,080 $ 2,011,631 —2018 . . . . . . . . . . . . . . . . . . . . . . . . . . . . . . . . . . . . — — 1,503,324 28,980,997 14,635,639 —
These capital loss carryforwards are available to reduce future required distributions of net capital gains to shareholders.
During the year ended September 30, 2010, the SmallCap Equity Fund utilized capital loss carryforwards of $135,125, and$1,835,749 of capital loss carryforwards expired.
Under the current tax law, capital losses related to securities realized after October 31 and prior to the Funds’ fiscal yearend may be treated as occurring on the first day of the following year. For the year ended September 30, 2010, the IncomeFund deferred capital losses of $95,748 and the SmallCap Equity Fund deferred currency losses of $8.
The following summarizes the tax cost of investments and the related net unrealized appreciation/depreciation at March 31,2011:
Mighty SmallCap IntermediateMitesSM Equity Income Equity Balanced BondFund Fund Fund Fund Fund Fund
—––––—— —––––—— —––––—— —––––—— —––––—— —––––——Aggregate cost of investments . . . . . . . . . . . . . . $538,289,526 $24,006,614 $4,869,745 $94,043,169 $104,265,553 $15,405,006
——––––––—— —–––––––—— ——––––—— ——––––––—— ——––––––—— ——––––––————––––––—— —–––––––—— ——––––—— ——––––––—— ——––––––—— ——––––––——Gross unrealized appreciation . . . . . . . . . . . . . . $145,104,010 $ 7,455,824 $ 627,657 $21,240,417 $ 17,386,694 $ 869,105Gross unrealized depreciation . . . . . . . . . . . . . . (11,102,205) (495,926) (137,233) (3,024,470) (2,268,985) (58,574)
——––––––—— —–––––––—— ——––––—— ——––––––—— ——––––––—— ——––––––——Net unrealized appreciation/depreciation . . . $134,001,805 $ 6,959,898 $ 490,424 $18,215,947 $ 15,117,709 $ 810,531
——––––––—— —–––––––—— ——––––—— ——––––––—— ——––––––—— ——––––––————––––––—— —–––––––—— ——––––—— ——––––––—— ——––––––—— ——––––––——
The Funds are required to evaluate tax positions taken or expected to be taken in the course of preparing the Funds’ taxreturns to determine whether the tax positions are “more-likely-than-not” of being sustained by the applicable taxauthority. Income tax and related interest and penalties would be recognized by the Funds as tax expense in the Statementof Operations if the tax positions were deemed not to meet the more-likely-than-not threshold. For the six months endedMarch 31, 2011, the Funds did not incur any income tax, interest, or penalties. As of March 31, 2011, the Adviser hasreviewed all open tax years and concluded that there was no impact to the Funds’ net assets or results of operations. Taxyears ended September 30, 2007 through September 30, 2010 remain subject to examination by the Internal Revenue Serviceand state taxing authorities. On an ongoing basis, the Adviser will monitor the Funds’ tax positions to determine ifadjustments to this conclusion are necessary.
3. Investment Advisory Agreements and Other Transactions. The Funds have entered into investment advisoryagreements (the “Advisory Agreements”) with the Adviser which provide that the Funds will pay the Adviser a fee,computed daily and paid monthly, at the annual rate of 1.00% for the Mighty MitesSM Fund, SmallCap Equity Fund, IncomeFund, and Equity Fund, 0.75% for the Balanced Fund, and 0.60% for the Intermediate Bond Fund, of the value of the Fund’saverage daily net assets. In accordance with the Advisory Agreements, the Adviser provides a continuous investmentprogram for the Funds’ portfolios, oversees the administration of all aspects of the Funds’ business and affairs, and paysthe compensation of all Officers and Trustees of the Funds who are affiliated persons of the Adviser.
There was a reduction in the advisory fee paid to theAdviser relating to certain portfolio holdings, i.e., unsupervised assets,of the Funds with respect to which the Adviser transferred dispositive and voting control to the Funds’ Proxy VotingCommittee. During the six months ended March 31, 2011, the Mighty MitesSM Fund’s Proxy Voting Committee exercisedcontrol and discretion over all rights to vote or consent with respect to such securities, and the Adviser reduced its fee withrespect to such securities by $55,554.
GAMCO Westwood FundsNotes to Financial Statements (Continued) (Unaudited)
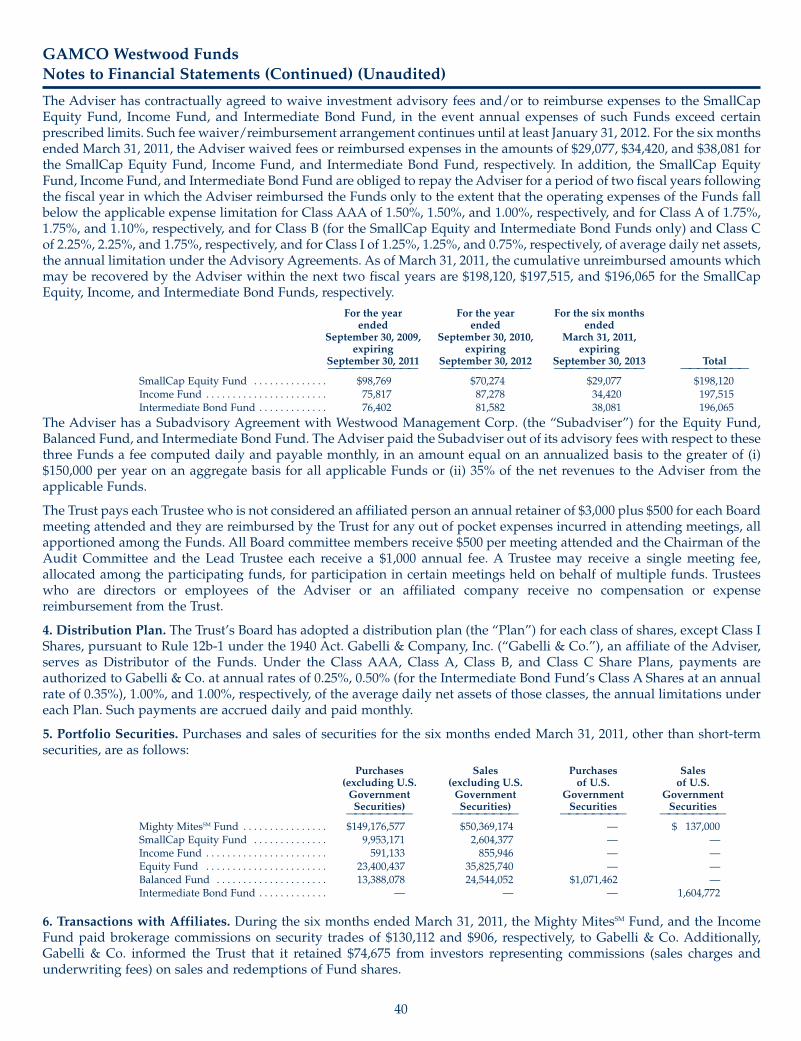
40
GAMCO Westwood FundsNotes to Financial Statements (Continued) (Unaudited)
The Adviser has contractually agreed to waive investment advisory fees and/or to reimburse expenses to the SmallCapEquity Fund, Income Fund, and Intermediate Bond Fund, in the event annual expenses of such Funds exceed certainprescribed limits. Such fee waiver/reimbursement arrangement continues until at least January 31, 2012. For the six monthsended March 31, 2011, the Adviser waived fees or reimbursed expenses in the amounts of $29,077, $34,420, and $38,081 forthe SmallCap Equity Fund, Income Fund, and Intermediate Bond Fund, respectively. In addition, the SmallCap EquityFund, Income Fund, and Intermediate Bond Fund are obliged to repay theAdviser for a period of two fiscal years followingthe fiscal year in which the Adviser reimbursed the Funds only to the extent that the operating expenses of the Funds fallbelow the applicable expense limitation for Class AAA of 1.50%, 1.50%, and 1.00%, respectively, and for Class A of 1.75%,1.75%, and 1.10%, respectively, and for Class B (for the SmallCap Equity and Intermediate Bond Funds only) and Class Cof 2.25%, 2.25%, and 1.75%, respectively, and for Class I of 1.25%, 1.25%, and 0.75%, respectively, of average daily net assets,the annual limitation under the Advisory Agreements. As of March 31, 2011, the cumulative unreimbursed amounts whichmay be recovered by the Adviser within the next two fiscal years are $198,120, $197,515, and $196,065 for the SmallCapEquity, Income, and Intermediate Bond Funds, respectively.
For the year For the year For the six monthsended ended ended
September 30, 2009, September 30, 2010, March 31, 2011,expiring expiring expiring
September 30, 2011 September 30, 2012 September 30, 2013 Total——————————— ——————————— ——————————— ————————
SmallCap Equity Fund . . . . . . . . . . . . . . $98,769 $70,274 $29,077 $198,120Income Fund . . . . . . . . . . . . . . . . . . . . . . . 75,817 87,278 34,420 197,515Intermediate Bond Fund . . . . . . . . . . . . . 76,402 81,582 38,081 196,065
The Adviser has a Subadvisory Agreement with Westwood Management Corp. (the “Subadviser”) for the Equity Fund,Balanced Fund, and Intermediate Bond Fund. TheAdviser paid the Subadviser out of its advisory fees with respect to thesethree Funds a fee computed daily and payable monthly, in an amount equal on an annualized basis to the greater of (i)$150,000 per year on an aggregate basis for all applicable Funds or (ii) 35% of the net revenues to the Adviser from theapplicable Funds.
The Trust pays each Trustee who is not considered an affiliated person an annual retainer of $3,000 plus $500 for each Boardmeeting attended and they are reimbursed by the Trust for any out of pocket expenses incurred in attending meetings, allapportioned among the Funds. All Board committee members receive $500 per meeting attended and the Chairman of theAudit Committee and the Lead Trustee each receive a $1,000 annual fee. A Trustee may receive a single meeting fee,allocated among the participating funds, for participation in certain meetings held on behalf of multiple funds. Trusteeswho are directors or employees of the Adviser or an affiliated company receive no compensation or expensereimbursement from the Trust.
4. Distribution Plan. The Trust’s Board has adopted a distribution plan (the “Plan”) for each class of shares, except Class IShares, pursuant to Rule 12b-1 under the 1940 Act. Gabelli & Company, Inc. (“Gabelli & Co.”), an affiliate of the Adviser,serves as Distributor of the Funds. Under the Class AAA, Class A, Class B, and Class C Share Plans, payments areauthorized to Gabelli & Co. at annual rates of 0.25%, 0.50% (for the Intermediate Bond Fund’s Class A Shares at an annualrate of 0.35%), 1.00%, and 1.00%, respectively, of the average daily net assets of those classes, the annual limitations undereach Plan. Such payments are accrued daily and paid monthly.
5. Portfolio Securities. Purchases and sales of securities for the six months ended March 31, 2011, other than short-termsecurities, are as follows:
Purchases Sales Purchases Sales(excluding U.S. (excluding U.S. of U.S. of U.S.Government Government Government GovernmentSecurities) Securities) Securities Securities———————— ———————— ———————— ————————
Mighty MitesSM Fund . . . . . . . . . . . . . . . . $149,176,577 $50,369,174 — $ 137,000SmallCap Equity Fund . . . . . . . . . . . . . . 9,953,171 2,604,377 — —Income Fund . . . . . . . . . . . . . . . . . . . . . . . 591,133 855,946 — —Equity Fund . . . . . . . . . . . . . . . . . . . . . . . 23,400,437 35,825,740 — —Balanced Fund . . . . . . . . . . . . . . . . . . . . . 13,388,078 24,544,052 $1,071,462 —Intermediate Bond Fund . . . . . . . . . . . . . — — — 1,604,772
6. Transactions with Affiliates. During the six months ended March 31, 2011, the Mighty MitesSM Fund, and the IncomeFund paid brokerage commissions on security trades of $130,112 and $906, respectively, to Gabelli & Co. Additionally,Gabelli & Co. informed the Trust that it retained $74,675 from investors representing commissions (sales charges andunderwriting fees) on sales and redemptions of Fund shares.
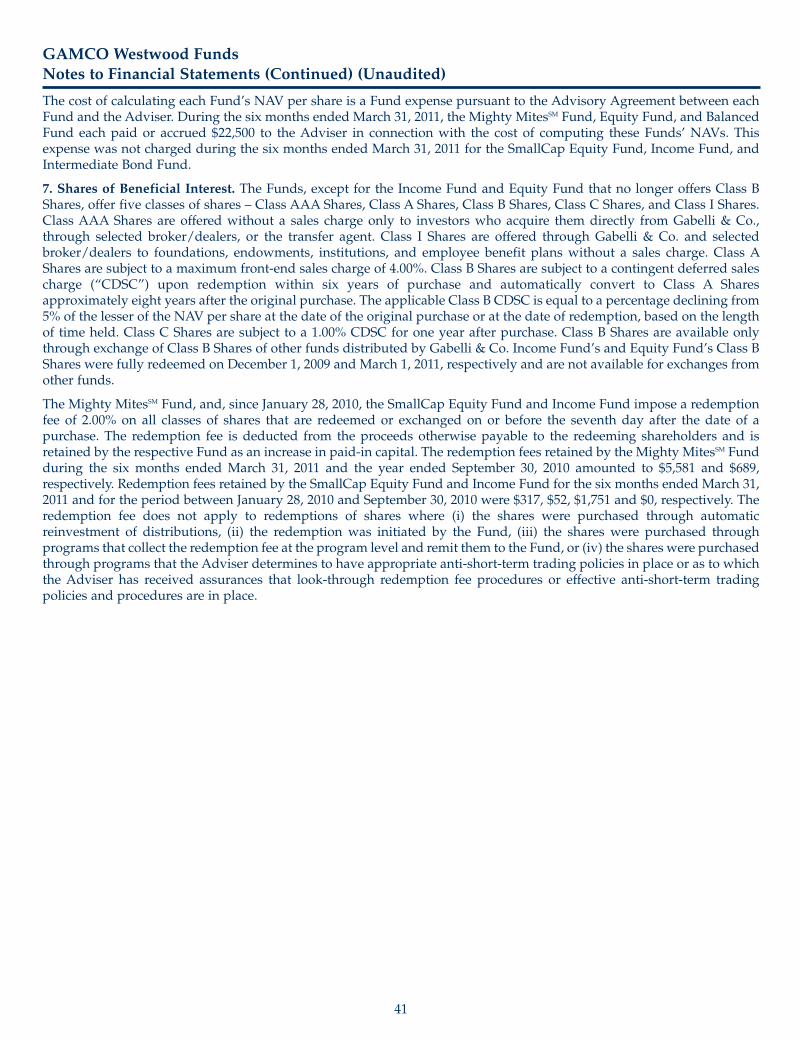
41
The cost of calculating each Fund’s NAV per share is a Fund expense pursuant to the Advisory Agreement between eachFund and the Adviser. During the six months ended March 31, 2011, the Mighty MitesSM Fund, Equity Fund, and BalancedFund each paid or accrued $22,500 to the Adviser in connection with the cost of computing these Funds’ NAVs. Thisexpense was not charged during the six months ended March 31, 2011 for the SmallCap Equity Fund, Income Fund, andIntermediate Bond Fund.
7. Shares of Beneficial Interest. The Funds, except for the Income Fund and Equity Fund that no longer offers Class BShares, offer five classes of shares – Class AAA Shares, Class A Shares, Class B Shares, Class C Shares, and Class I Shares.Class AAA Shares are offered without a sales charge only to investors who acquire them directly from Gabelli & Co.,through selected broker/dealers, or the transfer agent. Class I Shares are offered through Gabelli & Co. and selectedbroker/dealers to foundations, endowments, institutions, and employee benefit plans without a sales charge. Class AShares are subject to a maximum front-end sales charge of 4.00%. Class B Shares are subject to a contingent deferred salescharge (“CDSC”) upon redemption within six years of purchase and automatically convert to Class A Sharesapproximately eight years after the original purchase. The applicable Class B CDSC is equal to a percentage declining from5% of the lesser of the NAV per share at the date of the original purchase or at the date of redemption, based on the lengthof time held. Class C Shares are subject to a 1.00% CDSC for one year after purchase. Class B Shares are available onlythrough exchange of Class B Shares of other funds distributed by Gabelli & Co. Income Fund’s and Equity Fund’s Class BShares were fully redeemed on December 1, 2009 and March 1, 2011, respectively and are not available for exchanges fromother funds.
The Mighty MitesSM Fund, and, since January 28, 2010, the SmallCap Equity Fund and Income Fund impose a redemptionfee of 2.00% on all classes of shares that are redeemed or exchanged on or before the seventh day after the date of apurchase. The redemption fee is deducted from the proceeds otherwise payable to the redeeming shareholders and isretained by the respective Fund as an increase in paid-in capital. The redemption fees retained by the Mighty MitesSM Fundduring the six months ended March 31, 2011 and the year ended September 30, 2010 amounted to $5,581 and $689,respectively. Redemption fees retained by the SmallCap Equity Fund and Income Fund for the six months ended March 31,2011 and for the period between January 28, 2010 and September 30, 2010 were $317, $52, $1,751 and $0, respectively. Theredemption fee does not apply to redemptions of shares where (i) the shares were purchased through automaticreinvestment of distributions, (ii) the redemption was initiated by the Fund, (iii) the shares were purchased throughprograms that collect the redemption fee at the program level and remit them to the Fund, or (iv) the shares were purchasedthrough programs that the Adviser determines to have appropriate anti-short-term trading policies in place or as to whichthe Adviser has received assurances that look-through redemption fee procedures or effective anti-short-term tradingpolicies and procedures are in place.
GAMCO Westwood FundsNotes to Financial Statements (Continued) (Unaudited)

42
GAMCO Westwood FundsNotes to Financial Statements (Continued) (Unaudited)
Transactions in shares of beneficial interest were as follows:For the Six For the For the Six For the For the Six For the
Months Ended Year Ended Months Ended Year Ended Months Ended Year EndedMarch 31, 2011 September 30, March 31, 2011 September 30, March 31, 2011 September 30,(Unaudited) 2010 (Unaudited) 2010 (Unaudited) 2010————————— ————————— ————————— ————————— ————————— —————————
Mighty MitesSM Fund SmallCap Equity Fund Income Fund——————–—–————————— ——————–—–————————— ——————–—–—————————
Class AAAShares sold . . . . . . . . . . . . . . . . . . . . . . . . . . . . . . . . . . . 10,136,531 8,736,054 432,129 232,247 65,113 61,267Shares issued upon reinvestment of distributions . . 445,730 2,532 — — 3,740 9,616Shares redeemed . . . . . . . . . . . . . . . . . . . . . . . . . . . . . . (2,736,554) (4,793,343) (119,907) (214,599) (102,913) (129,829)
——–——— ——––——— ——–——— ——–——— ——–——— ——–———Net increase/(decrease) in Class AAA Shares . . . 7,845,707 3,945,243 312,222 17,648 (34,060) (58,946)
——–——— ——––——— ——–——— ——–——— ——–——— ——–—————–——— ——––——— ——–——— ——–——— ——–——— ——–———Class AShares sold . . . . . . . . . . . . . . . . . . . . . . . . . . . . . . . . . . . 2,557,331 2,583,100 92,816 91,708 1,706 39,505Shares issued upon reinvestment of distributions . . 83,026 298 — — 170 378Shares redeemed . . . . . . . . . . . . . . . . . . . . . . . . . . . . . . (767,346) (686,314) (22,833) (17,281) (40,257) (6,795)
——–——— ——––——— ——–——— ——–——— ——–——— ——–———Net increase/(decrease) in Class A Shares . . . . . . 1,873,011 1,897,084 69,983 74,427 (38,381) 33,088
——–——— ——––——— ——–——— ——–——— ——–——— ——–—————–——— ——––——— ——–——— ——–——— ——–——— ——–———Class B*Shares sold . . . . . . . . . . . . . . . . . . . . . . . . . . . . . . . . . . . 209 — — 133 — —Shares issued upon reinvestment of distributions . . 146 2 — — — —Shares redeemed . . . . . . . . . . . . . . . . . . . . . . . . . . . . . . (2,954) (3,880) — (143) — (10)
——–——— ——––——— ——–——— ——–——— ——–——— ——–———Net decrease in Class B Shares . . . . . . . . . . . . . . . . (2,599) (3,878) — (10) — (10)
——–——— ——––——— ——–——— ——–——— ——–——— ——–—————–——— ——––——— ——–——— ——–——— ——–——— ——–———Class CShares sold . . . . . . . . . . . . . . . . . . . . . . . . . . . . . . . . . . . 2,806,813 1,898,393 184,823 50,161 108 1,464Shares issued upon reinvestment of distributions . . 71,039 237 — — 17 63Shares redeemed . . . . . . . . . . . . . . . . . . . . . . . . . . . . . . (255,832) (213,750) (4,567) (8,735) (968) (23,854)
——–——— ——––——— ——–——— ——–——— ——–——— ——–———Net increase/(decrease) in Class C Shares . . . . . . 2,622,020 1,684,880 180,256 41,426 (843) (22,327)
——–——— ——––——— ——–——— ——–——— ——–——— ——–—————–——— ——––——— ——–——— ——–——— ——–——— ——–———Class IShares sold . . . . . . . . . . . . . . . . . . . . . . . . . . . . . . . . . . . 1,439,642 740,998 19,571 109,191 1,166 1,883Shares issued upon reinvestment of distributions . . 25,751 131 — — 51 106Shares redeemed . . . . . . . . . . . . . . . . . . . . . . . . . . . . . . (326,228) (195,587) (56,487) (51,916) (35) (3,172)
——–——— ——––——— ——–——— ——–——— ——–——— ——–———Net increase/(decrease) in Class I Shares . . . . . . . 1,139,165 545,542 (36,916) 57,275 1,182 (1,183)
——–——— ——––——— ——–——— ——–——— ——–——— ——–—————–——— ——––——— ——–——— ——–——— ——–——— ——–———Equity Fund Balanced Fund Intermediate Bond Fund
——————–—–————————— ——————–—–————————— ——————–—–—————————Class AAAShares sold . . . . . . . . . . . . . . . . . . . . . . . . . . . . . . . . . . . 425,463 1,629,832 606,757 1,229,228 136,937 408,397Shares issued upon reinvestment of distributions . . 65,103 137,019 72,870 162,237 12,021 28,200Shares redeemed . . . . . . . . . . . . . . . . . . . . . . . . . . . . . . (1,545,228) (6,668,783) (1,600,427) (3,632,606) (278,980) (216,571)
——–——— ——––——— ——–——— ——–——— ——–——— ——–———Net increase/(decrease) in Class AAA Shares . . . (1,054,662) (4,901,932) (920,800) (2,241,141) (130,022) 220,026
——–——— ——––——— ——–——— ——–——— ——–——— ——–—————–——— ——––——— ——–——— ——–——— ——–——— ——–———Class AShares sold . . . . . . . . . . . . . . . . . . . . . . . . . . . . . . . . . . . 50,017 147,529 9,797 21,197 15,380 24,621Shares issued upon reinvestment of distributions . . 1,876 5,445 2,574 5,985 415 936Shares redeemed . . . . . . . . . . . . . . . . . . . . . . . . . . . . . . (293,688) (136,675) (69,620) (141,135) (10,997) (30,124)
——–——— ——––——— ——–——— ——–——— ——–——— ——–———Net increase/(decrease) in Class A Shares . . . . . . (241,795) 16,299 (57,249) (113,953) 4,798 (4,567)
——–——— ——––——— ——–——— ——–——— ——–——— ——–—————–——— ——––——— ——–——— ——–——— ——–——— ——–———Class B**Shares sold . . . . . . . . . . . . . . . . . . . . . . . . . . . . . . . . . . . — — — 1,335 — —Shares issued upon reinvestment of distributions . . — 2 12 42 21 104Shares redeemed . . . . . . . . . . . . . . . . . . . . . . . . . . . . . . (791) (11) (4,239) (4,101) (636) (8,155)
——–——— ——––——— ——–——— ——–——— ——–——— ——–———Net decrease in Class B Shares . . . . . . . . . . . . . . . . (791) (9) (4,227) (2,724) (615) (8,051)
——–——— ——––——— ——–——— ——–——— ——–——— ——–—————–——— ——––——— ——–——— ——–——— ——–——— ——–———Class CShares sold . . . . . . . . . . . . . . . . . . . . . . . . . . . . . . . . . . . 6,005 21,984 30,804 109,432 14,570 141,211Shares issued upon reinvestment of distributions . . — 403 1,228 2,454 676 1,543Shares redeemed . . . . . . . . . . . . . . . . . . . . . . . . . . . . . . (19,466) (38,560) (65,837) (124,274) (115,662) (44,256)
——–——— ——––——— ——–——— ——–——— ——–——— ——–———Net increase/(decrease) in Class C Shares . . . . . . (13,461) (16,173) (33,805) (12,388) (100,416) 98,498
——–——— ——––——— ——–——— ——–——— ——–——— ——–—————–——— ——––——— ——–——— ——–——— ——–——— ——–———Class IShares sold . . . . . . . . . . . . . . . . . . . . . . . . . . . . . . . . . . . 8,256 78,474 26,732 89,745 7,361 12,158Shares issued upon reinvestment of distributions . . 916 955 1,411 2,755 198 373Shares redeemed . . . . . . . . . . . . . . . . . . . . . . . . . . . . . . (38,198) (41,387) (42,411) (68,243) (7,468) (29,971)
——–——— ——––——— ——–——— ——–——— ——–——— ——–———Net increase/(decrease) in Class I Shares . . . . . . . (29,026) 38,042 (14,268) 24,257 91 (17,440)
——–——— ——––——— ——–——— ——–——— ——–——— ——–—————–——— ——––——— ——–——— ——–——— ——–——— ——–———
*Income Fund's Class B Shares were fully redeemed on December 1, 2009.**Equity Fund's Class B Shares were fully redeemed on March 1, 2011.

43
GAMCO Westwood FundsNotes to Financial Statements (Continued) (Unaudited)
8. Transactions in Securities of Affiliated Issuers. The 1940 Act defines affiliated issuers as those in which a Fund’sholdings of an issuer represent 5% or more of the outstanding voting securities of the issuer. A summary of the MightyMitesSM Fund’s transactions in the securities of these issuers during the six months ended March 31, 2011 is set forth below:
PercentNet Change In Value at Owned of
Beginning Shares Ending Dividend Unrealized March 31, SharesShares Purchased Shares Income Appreciation 2011 Outstanding
Beasley Broadcast Group Inc., Cl. A* . . . . . . . . 133,400 401,600 535,000 — $ 923,594 $3,926,900 8.89%Corning Natural Gas Corp.** . . . . . . . . . . . . . . . 53,671 — — — — — —Sonesta International Hotels Corp., Cl. A* . . . 161,100 50,373 211,473 $16,350 752,426 4,057,110 5.72%Tech/Ops Sevcon Inc. . . . . . . . . . . . . . . . . . . . . . 252,300 28,500 280,800 — 131,132 1,585,116 8.36%Total $16,350 $1,807,152 $9,569,126
* Security was not affiliated at September 30, 2010.** Security is no longer considered affiliated at March 31, 2011.
9. Indemnifications. The Funds enter into contracts that contain a variety of indemnifications. The Funds’ maximumexposure under these arrangements is unknown. However, the Funds have not had prior claims or losses pursuant to thesecontracts. Management has reviewed the Funds’ existing contracts and expects the risk of loss to be remote.
10. Other Matters. On April 24, 2008, the Adviser entered into a settlement with the SEC to resolve an inquiry regardingprior frequent trading activity in shares of the GAMCO Global Growth Fund (the “Global Growth Fund”) by one investorwho was banned from the Global Growth Fund in August 2002. In the administrative settlement order, the SEC found thatthe Adviser had willfully violated Section 206(2) of the 1940 Act, Section 17(d) of the 1940 Act and Rule 17d-1 thereunder,and had willfully aided and abetted and caused violations of Section 12(d)(1)(B)(i) of the 1940 Act. Under the terms of thesettlement, the Adviser, while neither admitting nor denying the SEC’s findings and allegations, paid $16 million (whichincluded a $5 million civil monetary penalty), approximately $12.8 million of which is in the process of being paid toshareholders of the Global Growth Fund in accordance with a plan developed by an independent distribution consultantand approved by the independent directors of the Global Growth Fund and acceptable to the staff of the SEC, and agreedto cease and desist from future violations of the above referenced federal securities laws and rule. The SEC order also notedthe cooperation that the Adviser had given the staff of the SEC during its inquiry. The settlement did not have a materialadverse impact on the Adviser or its ability to fulfill its obligations under the Advisory Agreement. On the same day, theSEC filed a civil action against the Executive Vice President and Chief Operating Officer of the Adviser, alleging violationsof certain federal securities laws arising from the same matter. The officer is also an officer of the Fund, the Global GrowthFund, and other funds in the Gabelli/GAMCO fund complex. The officer denied the allegations and is continuing in hispositions with the Adviser and the funds. The court dismissed certain claims and found that the SEC was not entitled topursue various remedies against the officer while leaving one remedy in the event the SEC were able to prove violationsof law. The court subsequently dismissed without prejudice the remaining remedy against the officer, which allowed theSEC to appeal the court’s rulings. On October 29, 2010 the SEC filed its appeal with the U.S. Court ofAppeals for the SecondCircuit regarding the lower court’s orders. TheAdviser currently expects that any resolution of the action against the officerwill not have a material adverse impact on the Fund or the Adviser or its ability to fulfill its obligations under the AdvisoryAgreement.
11. Subsequent Events. Management has evaluated the impact on the Funds of all subsequent events occurring throughthe date the financial statements were issued and has determined that there were no subsequent events requiringrecognition or disclosure in the financial statements, other than the following:
Mighty MitesSM FundAt the Trust’s Board meeting on May 25, 2011, the Trustees approved a change in the Mighty MitesSM Fund’s “Principal
Investment Strategies” to increase the market capitalization of micro-cap companies from $300 million to $500 million.
Effective June 1, 2011, “The Mighty MitesSM Fund primarily invests in common stocks of smaller companies that have amarket capitalization (defined as shares outstanding times current market price) of $500 million or less at the time theMighty MitesSM Fund’s initial investment”.
This report is submitted for the information of the shareholders of the GAMCO Westwood Funds. It is not authorized for distribution to prospectiveinvestors unless preceded or accompanied by an effective prospectus.
GABWWQ111SR
GAMCO WESTWOOD FUNDS
GAMCO Westwood Mighty MitesSM FundGAMCO Westwood SmallCap Equity Fund
GAMCO Westwood Income FundGAMCO Westwood Equity FundGAMCO Westwood Balanced Fund
GAMCO Westwood Intermediate Bond Fund
One Corporate CenterRye, New York 10580-1422
General and Account Information:800-WESTWOOD [800-937-8966]
fax: 914-921-5118website: www.tetonadv.come-mail: [email protected]
ANTHONY J. COLAVITAPresidentAnthony J. Colavita, P.C.
JAMES P. CONNFormer Chief Investment OfficerFinancial Security AssuranceHoldings Ltd.
WERNER J. ROEDER, MDMedical DirectorLawrence Hospital
SALVATORE J. ZIZZAChairmanZizza & Co., Ltd.
BRUCE N. ALPERTPresident and Secretary
AGNES MULLADYTreasurer
PETER D. GOLDSTEINChief Compliance Officer
Investment AdviserTeton Advisors, Inc.
DistributorGabelli & Company, Inc.
CustodianThe Bank of New York Mellon
Legal CounselPaul, Hastings, Janofsky & Walker LLP
Board of Trustees
Officers
We have separated the portfolio managers’ commentaries from the financial statements and investment portfolio due tocorporate governance regulations stipulated by the Sarbanes-OxleyAct of 2002. We have done this to ensure that the contentof the portfolio managers’ commentaries are unrestricted. The financial statements and investment portfolio are mailedseparately from the commentaries. Both the commentaries and the financial statements, including the portfolio ofinvestments, will be available on our website at www.tetonadv.com.


![proxy2008.htm Page 1 of 29 - GAMCO Investors · DEF 14A 1 proxy2008.htm PROXY FILED WITH SEC ON APRIL XX, 2008 [Missing Graphic Reference] GAMCO ... which acts as a general partner](https://img.pdfslide.us/doc/110x75/5b505ccb7f8b9a3e6e8e4452/page-1-of-29-gamco-investors-def-14a-1-proxy-filed-with-sec-on-april-xx-2008.jpg)