Embed Size (px)
Citation preview

Event Study Analysis of
Share Price and Stock Market Index Data
Lihuang Tong
September 2010
Dissertation submitted in partial fulfilment for the degree of
Master of Science in Computing for Financial Markets
Department of Computing Science and Mathematics
University of Stirling
- i -
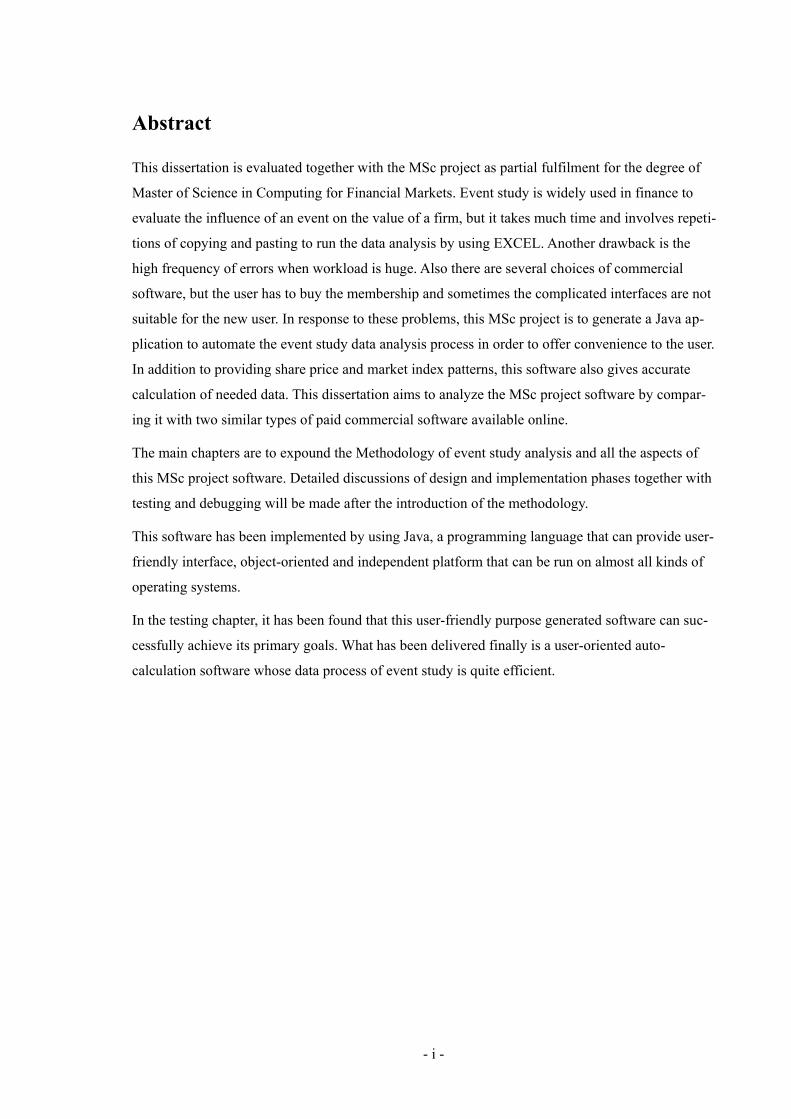
Abstract
This dissertation is evaluated together with the MSc project as partial fulfilment for the degree of
Master of Science in Computing for Financial Markets. Event study is widely used in finance to
evaluate the influence of an event on the value of a firm, but it takes much time and involves repeti-
tions of copying and pasting to run the data analysis by using EXCEL. Another drawback is the
high frequency of errors when workload is huge. Also there are several choices of commercial
software, but the user has to buy the membership and sometimes the complicated interfaces are not
suitable for the new user. In response to these problems, this MSc project is to generate a Java ap-
plication to automate the event study data analysis process in order to offer convenience to the user.
In addition to providing share price and market index patterns, this software also gives accurate
calculation of needed data. This dissertation aims to analyze the MSc project software by compar-
ing it with two similar types of paid commercial software available online.
The main chapters are to expound the Methodology of event study analysis and all the aspects of
this MSc project software. Detailed discussions of design and implementation phases together with
testing and debugging will be made after the introduction of the methodology.
This software has been implemented by using Java, a programming language that can provide user-
friendly interface, object-oriented and independent platform that can be run on almost all kinds of
operating systems.
In the testing chapter, it has been found that this user-friendly purpose generated software can suc-
cessfully achieve its primary goals. What has been delivered finally is a user-oriented auto-
calculation software whose data process of event study is quite efficient.

- ii -
Attestation
I understand the nature of plagiarism, and I am aware of the University's policy on this
I certify that this dissertation reports original work by me during my University project except for
the following (adjust according to the circumstances):
Event study in finance in Section 2 definition is taken from [2]
Ways of doing event study in Section 2.2 the market model assertion is taken from [6]
Event study time line in Section2.2 reference is taken from [8].
Introduction of Eventus in Section 3.2 introduction is taken from [10]
Support output file in Section 3.2.1 function is taken from [11]
Signature (you must sign and date this page) Date

- iii -
Acknowledgements
This MSc project is a three-month fruitful result and it is based on one year hard working with
Computing for Financial Markets Postgraduate Course in University of Stirling. I would like to
take this chance to appreciate all the people who have given me help.
I would like to appreciate all the faculty of Computing Science and Mathematics for imparting var-
ious kinds of useful knowledge and giving great help to me over this academic year. Specifically, I
would like to extend my heartfelt thanks to Dr. Mario Kolberg, supervisor of this MSc project,
whose suggestions and directions are inspiring and enlightening. I would also like to show my grat-
itude to Dr. Simon Jones and Dr. David Cairns since it was their detailed instruction on Java
programming that helped me to conquer so many difficulties before I ultimately produced this
piece of software. My appreciation will also be expressed to Dr. Kevin Campbell. Without those
precious data and suggestions he provided for me, I would not have been able to conduct the soft-
ware testing so successfully.
- iv -
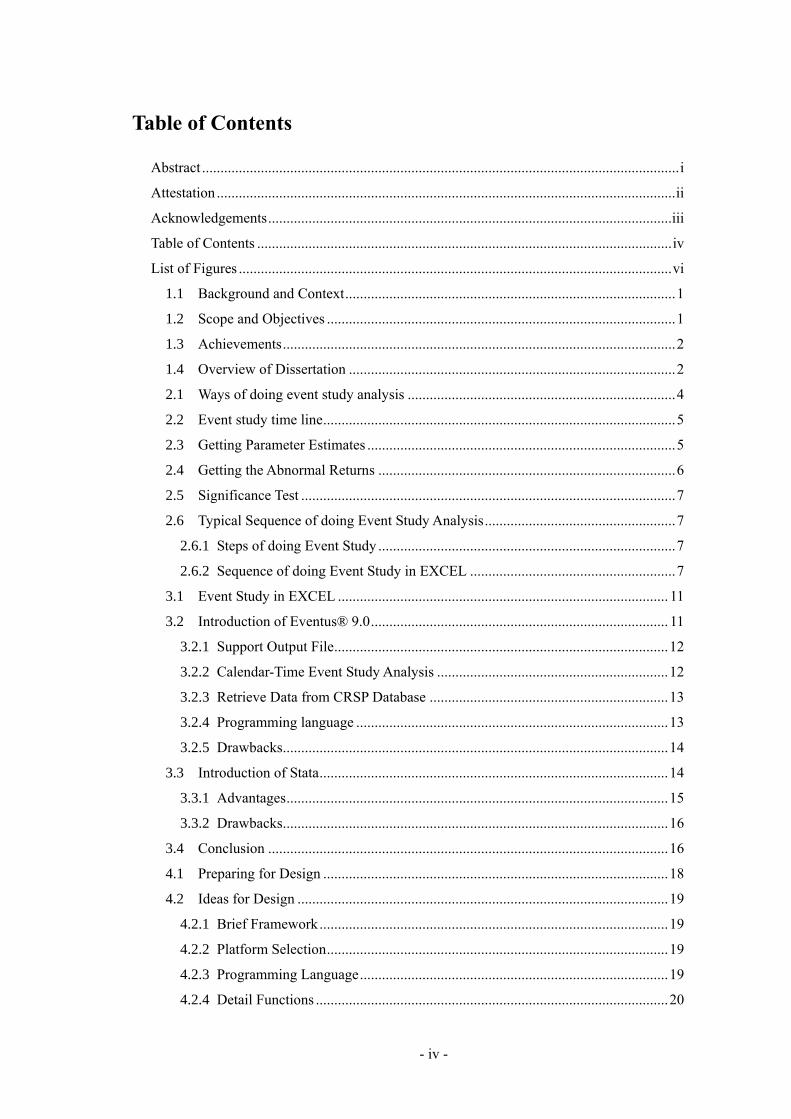
Table of Contents
Abstract .................................................................................................................................. i
Attestation ............................................................................................................................. ii
Acknowledgements .............................................................................................................. iii
Table of Contents ................................................................................................................. iv
List of Figures ...................................................................................................................... vi
1.1 Background and Context .......................................................................................... 1
1.2 Scope and Objectives ............................................................................................... 1
1.3 Achievements ........................................................................................................... 2
1.4 Overview of Dissertation ......................................................................................... 2
2.1 Ways of doing event study analysis ......................................................................... 4
2.2 Event study time line ................................................................................................ 5
2.3 Getting Parameter Estimates .................................................................................... 5
2.4 Getting the Abnormal Returns ................................................................................. 6
2.5 Significance Test ...................................................................................................... 7
2.6 Typical Sequence of doing Event Study Analysis .................................................... 7
2.6.1 Steps of doing Event Study ................................................................................. 7
2.6.2 Sequence of doing Event Study in EXCEL ........................................................ 7
3.1 Event Study in EXCEL .......................................................................................... 11
3.2 Introduction of Eventus® 9.0 ................................................................................. 11
3.2.1 Support Output File ........................................................................................... 12
3.2.2 Calendar-Time Event Study Analysis ............................................................... 12
3.2.3 Retrieve Data from CRSP Database ................................................................. 13
3.2.4 Programming language ..................................................................................... 13
3.2.5 Drawbacks......................................................................................................... 14
3.3 Introduction of Stata ............................................................................................... 14
3.3.1 Advantages ........................................................................................................ 15
3.3.2 Drawbacks......................................................................................................... 16
3.4 Conclusion ............................................................................................................. 16
4.1 Preparing for Design .............................................................................................. 18
4.2 Ideas for Design ..................................................................................................... 19
4.2.1 Brief Framework ............................................................................................... 19
4.2.2 Platform Selection ............................................................................................. 19
4.2.3 Programming Language .................................................................................... 19
4.2.4 Detail Functions ................................................................................................ 20
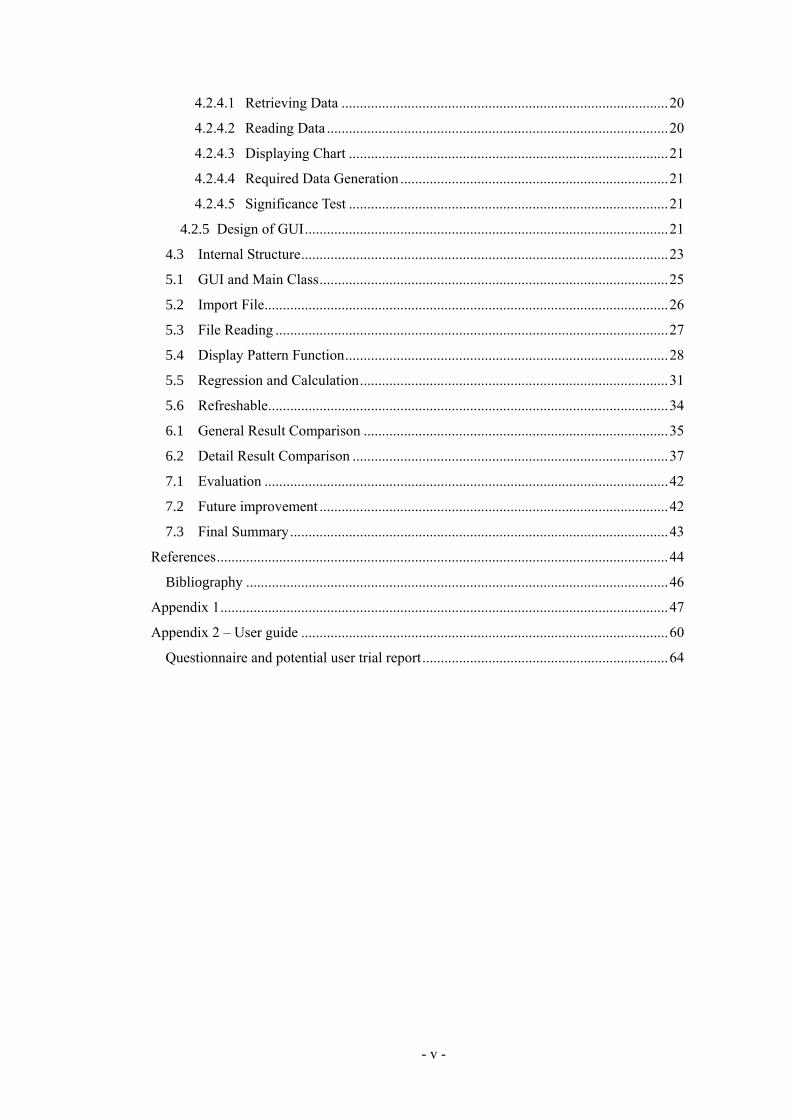
- v -
4.2.4.1 Retrieving Data ......................................................................................... 20
4.2.4.2 Reading Data ............................................................................................. 20
4.2.4.3 Displaying Chart ....................................................................................... 21
4.2.4.4 Required Data Generation ......................................................................... 21
4.2.4.5 Significance Test ....................................................................................... 21
4.2.5 Design of GUI ................................................................................................... 21
4.3 Internal Structure .................................................................................................... 23
5.1 GUI and Main Class ............................................................................................... 25
5.2 Import File .............................................................................................................. 26
5.3 File Reading ........................................................................................................... 27
5.4 Display Pattern Function ........................................................................................ 28
5.5 Regression and Calculation .................................................................................... 31
5.6 Refreshable ............................................................................................................. 34
6.1 General Result Comparison ................................................................................... 35
6.2 Detail Result Comparison ...................................................................................... 37
7.1 Evaluation .............................................................................................................. 42
7.2 Future improvement ............................................................................................... 42
7.3 Final Summary ....................................................................................................... 43
References ........................................................................................................................... 44
Bibliography ................................................................................................................... 46
Appendix 1 .......................................................................................................................... 47
Appendix 2 – User guide .................................................................................................... 60
Questionnaire and potential user trial report ................................................................... 64
- vi -
List of Figures
Figure 1. Event study time line ...................................................................................................... 5
Figure 2. Getting Alpha and Beta .................................................................................................. 6
Figure 3. Getting Expected Return ................................................................................................ 6
Figure 4. Getting Abnormal Return ............................................................................................... 6
Figure 5. First step in EXCEL ....................................................................................................... 8
Figure 6. Second Step in EXCEL .................................................................................................. 9
Figure 7. Third step in EXCEL ..................................................................................................... 9
Figure 8. Fourth step in EXCEL .................................................................................................. 10
Figure 9. Fifth step in EXCEL..................................................................................................... 10
Figure 10. Eventus Interface ...................................................................................................... 12
Figure 11. Stata Interface ........................................................................................................... 14
Figure 12. Stata Graphic Function 1 .......................................................................................... 15
Figure 13. Stata Graphic Function 2 .......................................................................................... 15
Figure 14. Stata Graphic Function 3 .......................................................................................... 16
Figure 15. Original draft interface on workbook ....................................................................... 22
Figure 16. Internal Structure ...................................................................................................... 23
Figure 17. Project Software Interface ........................................................................................ 25
Figure 18. File Chooser Window ............................................................................................... 26
Figure 19. File to be input ......................................................................................................... 27
Figure 20. Import and display the share price ........................................................................... 29
Figure 21. Import and display the market index ........................................................................ 29
Figure 22. Enlarge and shrink the price charts .......................................................................... 30
Figure 23. CAR over Event Period ............................................................................................ 31
Figure 24. Text Fields for inputting the required values ............................................................ 32
Figure 25. Results being carried out .......................................................................................... 32
Figure 26. Detail results of the Market Model .......................................................................... 33
Figure 27. Detail results of the Zero-One Model ...................................................................... 33
Figure 28. Detail results of the Mean-Adjusted Model ............................................................. 34
Figure 29. Detail result for the Market Model produced by this software ................................ 38
(Lengths of positive and negative periods are both15 days and estimation period is 60 days.) ...... 38
Figure 30. Detail result for the Market Model produced by EXCEL ........................................ 39
Figure 31. Detail result for the Zero-One Model produced by this software ............................ 39
Figure 32. Detail result for the Zero-One Model produced by EXCEL .................................... 40
Figure 33. Detail result for the Mean-Adjusted Model produced by this software ................... 40
- vii -
Figure 34. Detail result for the Mean-Adjusted Model produced by EXCEL ........................... 41
Figure 35. BOC general results by software .............................................................................. 47
Figure 36. BOC general results by EXCEL............................................................................... 47
Figure 37. COURTAULDS PLC general results by software ................................................... 47
Figure 38. COURTAULDS PLC general results by EXCEL .................................................... 48
Figure 39. ICI IMPERIAL CHEMICAL INDUSTRIES PLC general results by software ....... 48
Figure 40. ICI IMPERIAL CHEMICAL INDUSTRIES PLC general results by EXCEL ........ 48
Figure 41. LAPORTE PLC general results by software ............................................................ 48
Figure 42. LAPORTE PLC general results by EXCEL ............................................................. 49
Figure 43. YULE CATTO & CO PLC general results by software .......................................... 49
Figure 44. YULE CATTO & CO PLC general results by EXCEL ........................................... 49
Figure 45. BOC the Market Model detail results by software ................................................... 50
Figure 46. BOC the Market Model detail results by EXCEL .................................................... 50
Figure 47. BOC the Zero-One Model detail results by software ............................................... 51
Figure 48. BOC the Zero-One Model detail results by EXCEL ................................................ 51
Figure 49. COURTAULDS PLC the Market Model detail results by software ........................ 51
Figure 50. COURTAULDS PLC the Market Model detail results by EXCEL ......................... 52
Figure 51. COURTAULDS PLC the Zero-One Model detail results by software .................... 52
Figure 52. COURTAULDS PLC the Zero-One Model detail results by EXCEL ..................... 53
Figure 53. ICI IMPERIAL CHEMICAL INDUSTRIES PLC the Market Model detail results by
software 53
Figure 54. ICI IMPERIAL CHEMICAL INDUSTRIES PLC the Market Model detail results by
EXCEL 54
Figure 55. ICI IMPERIAL CHEMICAL INDUSTRIES PLC the Zero-One Model detail results
by software ............................................................................................................................... 54
Figure 56. ICI IMPERIAL CHEMICAL INDUSTRIES PLC the Zero-One Model detail results
by EXCEL ................................................................................................................................ 55
Figure 57. LAPORTE PLC the Market Model detail results by software ................................. 56
Figure 58. LAPORTE PLC the Market Model detail results by EXCEL .................................. 56
Figure 59. LAPORTE PLC the Zero-One Model detail results by software ............................. 56
Figure 60. LAPORTE PLC the Zero-One Model detail results by EXCEL .............................. 57
Figure 61. YULE CATTO & CO PLC the Market Model detail results by software ................ 58
Figure 62. YULE CATTO & CO PLC the Market Model detail results by EXCEL ................ 58
Figure 63. YULE CATTO & CO PLC the Zero-One Model detail results by software ............ 58
Figure 64. YULE CATTO & CO PLC the Zero-One Model detail results by EXCEL ............ 59
Figure 65. Interface of AutoCalculation .................................................................................... 61
Figure 66. Display Pattern in General Result Panel .................................................................. 62

- viii -
Figure 67. CAR chart panel ....................................................................................................... 62
- 1 -
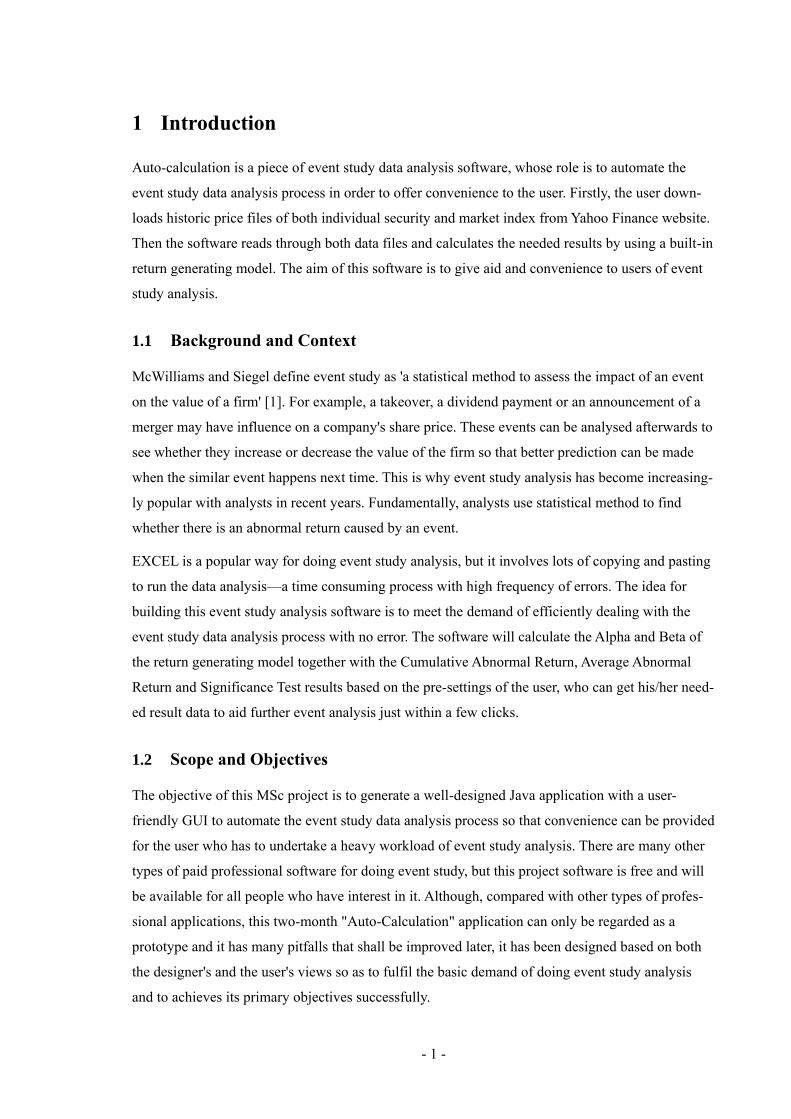
1 Introduction
Auto-calculation is a piece of event study data analysis software, whose role is to automate the
event study data analysis process in order to offer convenience to the user. Firstly, the user down-
loads historic price files of both individual security and market index from Yahoo Finance website.
Then the software reads through both data files and calculates the needed results by using a built-in
return generating model. The aim of this software is to give aid and convenience to users of event
study analysis.
1.1 Background and Context
McWilliams and Siegel define event study as 'a statistical method to assess the impact of an event
on the value of a firm' [1]. For example, a takeover, a dividend payment or an announcement of a
merger may have influence on a company's share price. These events can be analysed afterwards to
see whether they increase or decrease the value of the firm so that better prediction can be made
when the similar event happens next time. This is why event study analysis has become increasing-
ly popular with analysts in recent years. Fundamentally, analysts use statistical method to find
whether there is an abnormal return caused by an event.
EXCEL is a popular way for doing event study analysis, but it involves lots of copying and pasting
to run the data analysis—a time consuming process with high frequency of errors. The idea for
building this event study analysis software is to meet the demand of efficiently dealing with the
event study data analysis process with no error. The software will calculate the Alpha and Beta of
the return generating model together with the Cumulative Abnormal Return, Average Abnormal
Return and Significance Test results based on the pre-settings of the user, who can get his/her need-
ed result data to aid further event analysis just within a few clicks.
1.2 Scope and Objectives
The objective of this MSc project is to generate a well-designed Java application with a user-
friendly GUI to automate the event study data analysis process so that convenience can be provided
for the user who has to undertake a heavy workload of event study analysis. There are many other
types of paid professional software for doing event study, but this project software is free and will
be available for all people who have interest in it. Although, compared with other types of profes-
sional applications, this two-month "Auto-Calculation" application can only be regarded as a
prototype and it has many pitfalls that shall be improved later, it has been designed based on both
the designer's and the user's views so as to fulfil the basic demand of doing event study analysis
and to achieves its primary objectives successfully.
- 2 -
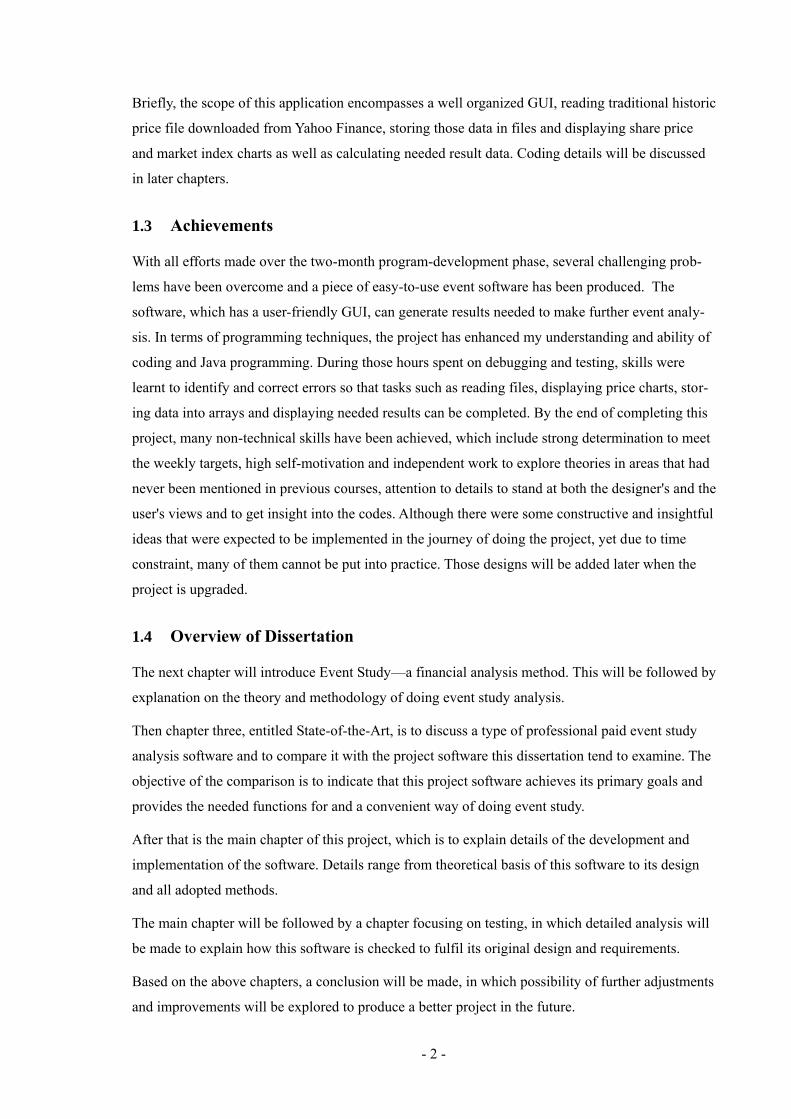
Briefly, the scope of this application encompasses a well organized GUI, reading traditional historic
price file downloaded from Yahoo Finance, storing those data in files and displaying share price
and market index charts as well as calculating needed result data. Coding details will be discussed
in later chapters.
1.3 Achievements
With all efforts made over the two-month program-development phase, several challenging prob-
lems have been overcome and a piece of easy-to-use event software has been produced. The
software, which has a user-friendly GUI, can generate results needed to make further event analy-
sis. In terms of programming techniques, the project has enhanced my understanding and ability of
coding and Java programming. During those hours spent on debugging and testing, skills were
learnt to identify and correct errors so that tasks such as reading files, displaying price charts, stor-
ing data into arrays and displaying needed results can be completed. By the end of completing this
project, many non-technical skills have been achieved, which include strong determination to meet
the weekly targets, high self-motivation and independent work to explore theories in areas that had
never been mentioned in previous courses, attention to details to stand at both the designer's and the
user's views and to get insight into the codes. Although there were some constructive and insightful
ideas that were expected to be implemented in the journey of doing the project, yet due to time
constraint, many of them cannot be put into practice. Those designs will be added later when the
project is upgraded.
1.4 Overview of Dissertation
The next chapter will introduce Event Study—a financial analysis method. This will be followed by
explanation on the theory and methodology of doing event study analysis.
Then chapter three, entitled State-of-the-Art, is to discuss a type of professional paid event study
analysis software and to compare it with the project software this dissertation tend to examine. The
objective of the comparison is to indicate that this project software achieves its primary goals and
provides the needed functions for and a convenient way of doing event study.
After that is the main chapter of this project, which is to explain details of the development and
implementation of the software. Details range from theoretical basis of this software to its design
and all adopted methods.
The main chapter will be followed by a chapter focusing on testing, in which detailed analysis will
be made to explain how this software is checked to fulfil its original design and requirements.
Based on the above chapters, a conclusion will be made, in which possibility of further adjustments
and improvements will be explored to produce a better project in the future.

- 3 -
In the appendix, a user specification of this software will be provided for quick start.
- 4 -
2 Event Study in Finance
This MSc project is for building an auto event study data process software. So before this software
is developed, the event study theory and several financial terms shall be clarified. This chapter will
start from Event Study.
According to McWilliams and Siegel, 'event study is a statistical method to assess the impact of an
event on the value of a firm' [2] and this method is gaining popularity in analysing many situations.
For example, the announcement of a merger, a takeover, changes in management like CEO's resig-
nation or an issue of dividend payment. All of such events can be analysed to see how they affect
the company's value and react on the company's share price so that financial analysts can refer to
the experience this time to make better prediction in the future about whether a similar event will
have a positive or negative influence.
2.1 Ways of doing event study analysis
The basic method of doing event study analysis is to find whether there is an abnormal return
caused by this event [3]. It is widely acknowledged by most financial scholars that the abnormal
return is the difference between the actual return and the expected return of a security. The abnor-
mal return will be defined as long as we get the expected return.
There are many ways to calculate the expected return of a security, such as the Market Model, the
Zero-One Model and the Mean-Adjusted Returns Model. The most prevalent way is to use the
Market Model, which is assumed to have 'a liner relationship between the expected return of a
company's share price and the stock market index' [4]. According to the Market Model, the return
of a security not only depends on the return of the market portfolio, but also depends on conditions
called systematic risk that are unique to the firm [5]. That means the influence shall be separated
into two parts. One of them is generally to the firm, such as changes in interest rate, or price fluctu-
ation in raw materials. The other part is uniquely to the company, such as changes in management,
issues of dividend of payment or an announcement of a takeover. 'The market model states that the
security's performance is related to its portfolio's performance according to its beta' [6]. Thus the
expected return of a security can be calculated by using the Simple Liner Regression Model based
on the market return. In statistics, simple linear regression is any approach to modelling the rela-
tionship between one scalar variable y and one variable denoted X [7]. The aim is to find out the
relationship between two sets of values in order to build the equation and model the unknown pa-
rameters.
After that is to calculate the Cumulative Abnormal Return and Average Abnormal Return and see
whether this event has a positive or negative influence on the company.

- 5 -
In terms of the Zero-One Model, it is assumed that in this model the parameter estimate Alpha
equals zero and Beta equals one.
The Mean-Adjusted Model just assumes that the expected return equals the mean of daily returns
of the share price in the estimation period.
2.2 Event study time line
Campbell thinks that 'event Study involves the conversion of calendar time to event time.' [8] The
original file downloaded from the Internet is the common "open-high-low-close" file and it only
contains calendar time. Firstly, we need to identify the specific event date and two more time peri-
ods in order to run the data analysis. One time period is called Test Period or Event Period. The
other time period is called Estimation Period or Control Period. Please see the event study time line
below:
Figure 1. Event study time line
The round point at right is the Event Date-----one specific calendar date in original share price file
and we denote it as 't'.
Positive Test Period means for how long this event will affect the company's share price after it
happens and we denote it as 't + p'. Negative Test Period means for how many days this event will
affect the company's share price before the occurrence of this event, say, a rumor or an official an-
nouncement of an acquisition. We denote it as 't – p'. The Test period is constructed by these three
parts.
On the left is the Estimation period, which means how many days we need to get the parameter
estimates by applying the return generating model.
2.3 Getting Parameter Estimates
The return generating model is based on the Least Square Regression by using calculus. The com-
plicated steps of derivation process are omitted here. Please see the formulas of getting the two
parameter estimates Alpha and Beta bellow:

- 6 -
Figure 2. Getting Alpha and Beta
Alpha and Beta are the two parameter estimates and are determined in estimation period. Alpha is
the intercept of the regression line and stands for risk free rate. Beta is the slop coefficient of the
regression line and stands for systematic risk. In the formula, is the daily return of market index in
estimation period and is the average daily return of market index in estimation period. Similarly,
is the daily return of individual share price in estimation period and is the average daily return of
individual share price in estimation period.
2.4 Getting the Abnormal Returns
After Alpha and Beta have been obtained, the focus should be turned to Event Period, in which the
daily expected return of individual share price can be obtained by replacing the parameter estima-
tions to event period. The formula is shown in the following figure.
Figure 3. Getting Expected Return
Daily expected return of individual share price can be determined by replacing the Alpha and Beta
from estimation period here.
Then the daily abnormal return in test period can be calculated by applying this equation. Please
see the equation below:
Figure 4. Getting Abnormal Return
The daily abnormal return of the individual share price in test period equals the difference between
the daily actual return in test period and the daily expected return in test period.
After that, the cumulative abnormal return in test period and average abnormal return in test period
can be calculated based on the daily abnormal return in test period.

- 7 -
These are the typical required results for supporting further analysis of the event to see whether this
event leads to a positive or negative effect on the value of the company.
2.5 Significance Test
Sometimes a result value may only be generated by chance. The result value always needs to be
tested to see whether it is statistically significant. This leads to the Significance Test. Basic method
is to see whether the final value generated from significance test is located in the accept region. The
formula is: the mean of the tested sample times the square root of the tested sample size then divid-
ed by the standard deviation of the tested sample. People normally use the 95% significance level
and the accept region is from -1.96 to +1.96. If the final value is between -1.96 to +1.96, this result
value will be called statistically significant.
2.6 Typical Sequence of doing Event Study Analysis
2.6.1 Steps of doing Event Study
1. Identify specific calendar event dates of a company and set it as an event date point. [9]
2. Determine the length of both event period and estimation period.
3. Download the historical files of both share price and stock market index data. The data files
should contain the calendar dates of both estimation period and event period.
4. Calculate the daily returns of both individual share price and market index data. Normally,
daily returns are used, so the returns shall be daily returns. These are actual returns.
5. Calculate the two parameter estimates Alpha and Beta by using the return generating model to
the data from the estimation period.
6. Get back to event period and use the two parameter estimates get from the estimation period to
determine the (daily) expected return of the share price in event period.
7. Calculate the (daily) abnormal returns in event period and derive cumulative abnormal return
and average abnormal return in event period.
8. Do significant test for the required results.
2.6.2 Sequence of doing Event Study in EXCEL
Microsoft EXCEL is one of the most popular ways to run the data analysis process. So before start-
ing design and implementing the project software, it is vital to figure out the stages and sequences
involved in doing event study data analysis in EXCEL
- 8 -
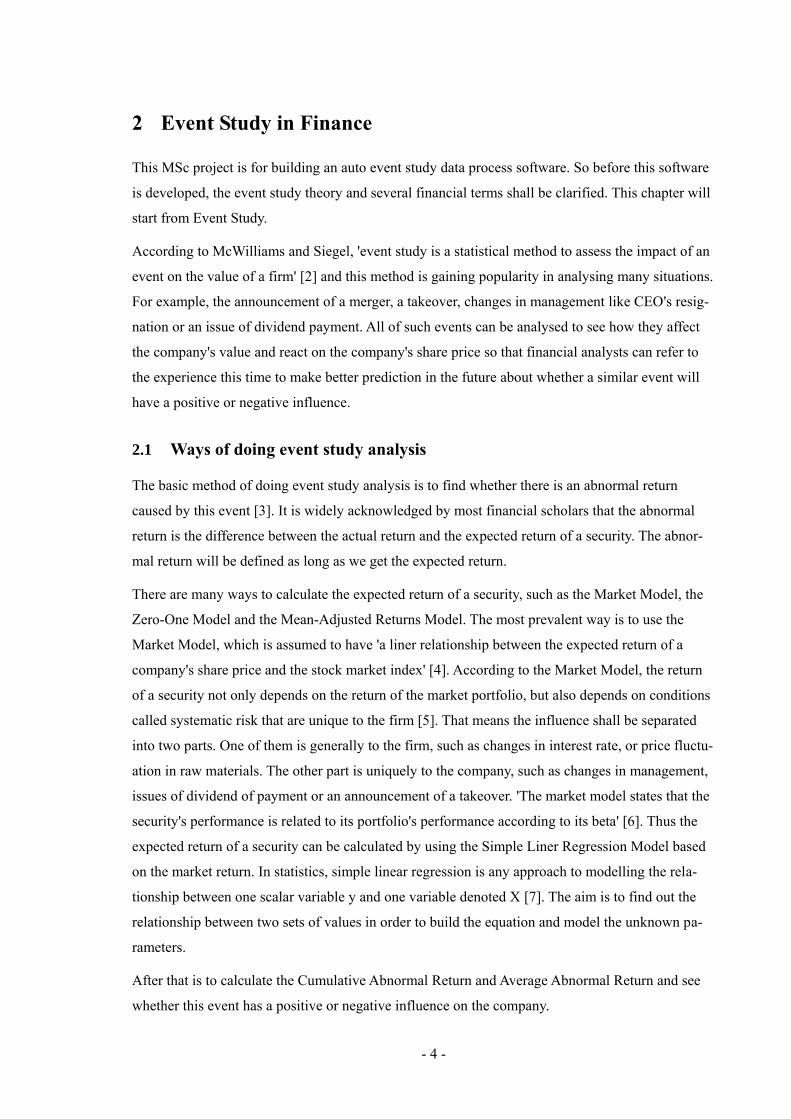
Before any calculation and analysis, the data must be retrieved firstly. So the first step is to down-
load the historic prices for both individual component stock and market portfolio index data. Here
the FTSE 100 index and BOCL.L are used as an example. First, the use logs on to the YAHOO fi-
nance website and selects the BOCL.L and FTSE 100 and then the user clicks historic prices and
downloads them based on the manually presetting of specific time periods encompassing both
event period and estimation period. After the user clicks the 'download' bottom, the default type is
for downloading a Microsoft EXCEL spreadsheet of the common 'Open-High-Low-Close-Volume-
Adj Close' data on local hard disk. The original file is like this and can be read in EXCEL 2003 or
later version. Please see the screenshot below, here FTSE 100 is taken as an example:
Figure 5. First step in EXCEL
The other individual share price file is almost the same as this one. There are seven columns in to-
tal in this file, but only two of them are needed, which are the data column and the close price
column.
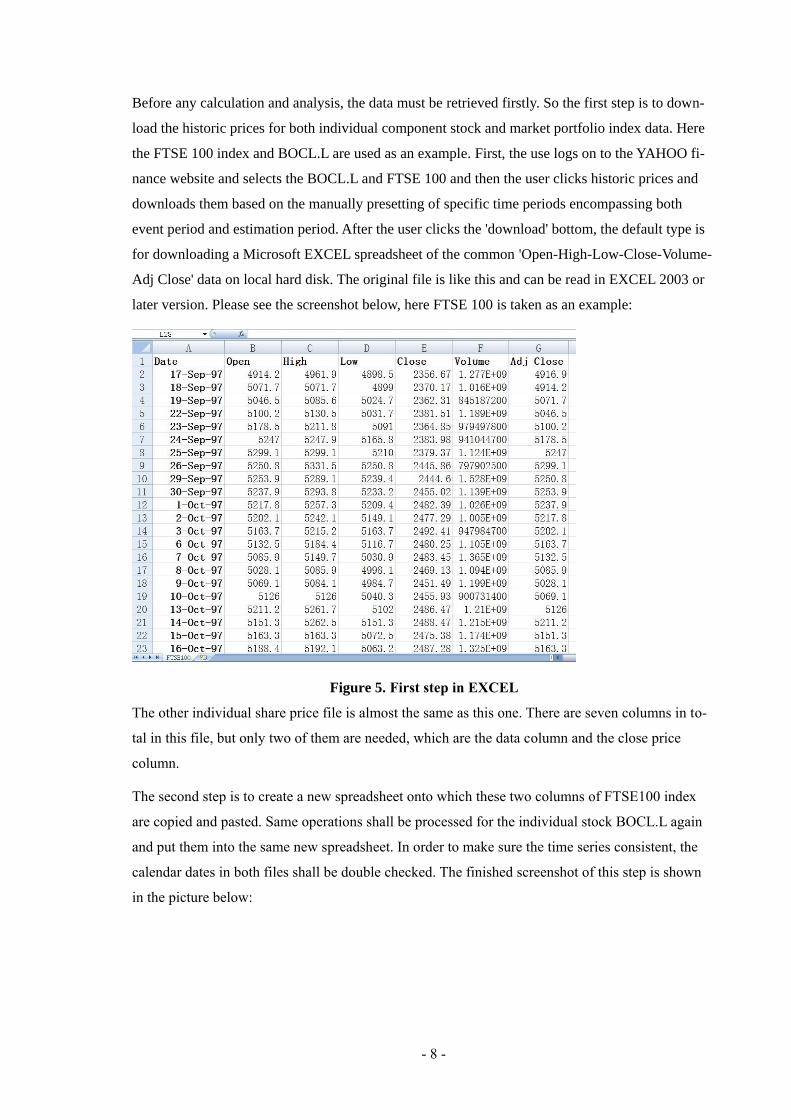
The second step is to create a new spreadsheet onto which these two columns of FTSE100 index
are copied and pasted. Same operations shall be processed for the individual stock BOCL.L again
and put them into the same new spreadsheet. In order to make sure the time series consistent, the
calendar dates in both files shall be double checked. The finished screenshot of this step is shown
in the picture below:
- 9 -
Figure 6. Second Step in EXCEL
This one is for share price, the other one is for market index. What should be done next is to con-
vert them into returns. So the third step is for calculating both daily returns. The way of calculating
the return of day 't' is by applying this equation: (the close price of day 't' minus the close price of
day 't-1') / the close price of day 't-1'. Please see the picture below:
Figure 7. Third step in EXCEL
Here is an example. The length of event period is 31days—15days before the event date and 15
days after the event date. And the estimation period is 60 days, which cannot be displayed in the
above figure due to the large size of the picture.
- 10 -
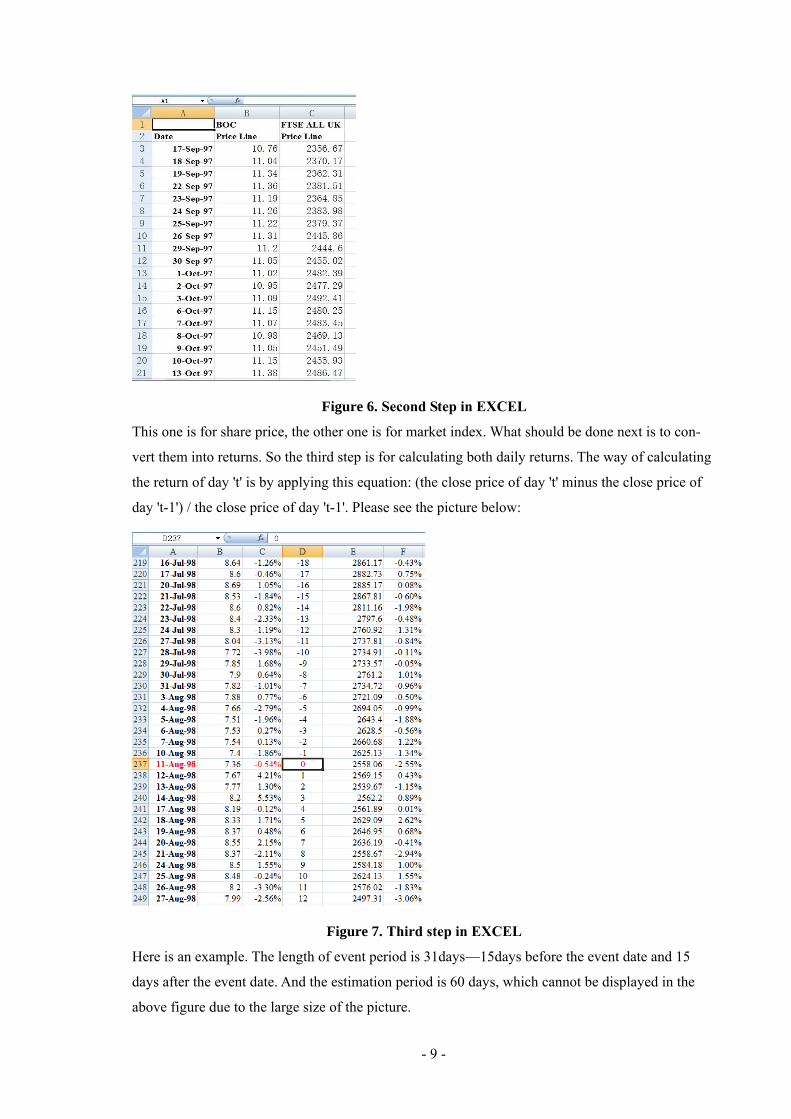
The fourth step is to do the regression in the function of data analysis in order to get the two pa-
rameter estimates Alpha and Beta. What should be selected are the two areas for X value and Y
value in the 60days estimation period. Then the result will be generated. Please see the picture be-
low:
Figure 8. Fourth step in EXCEL
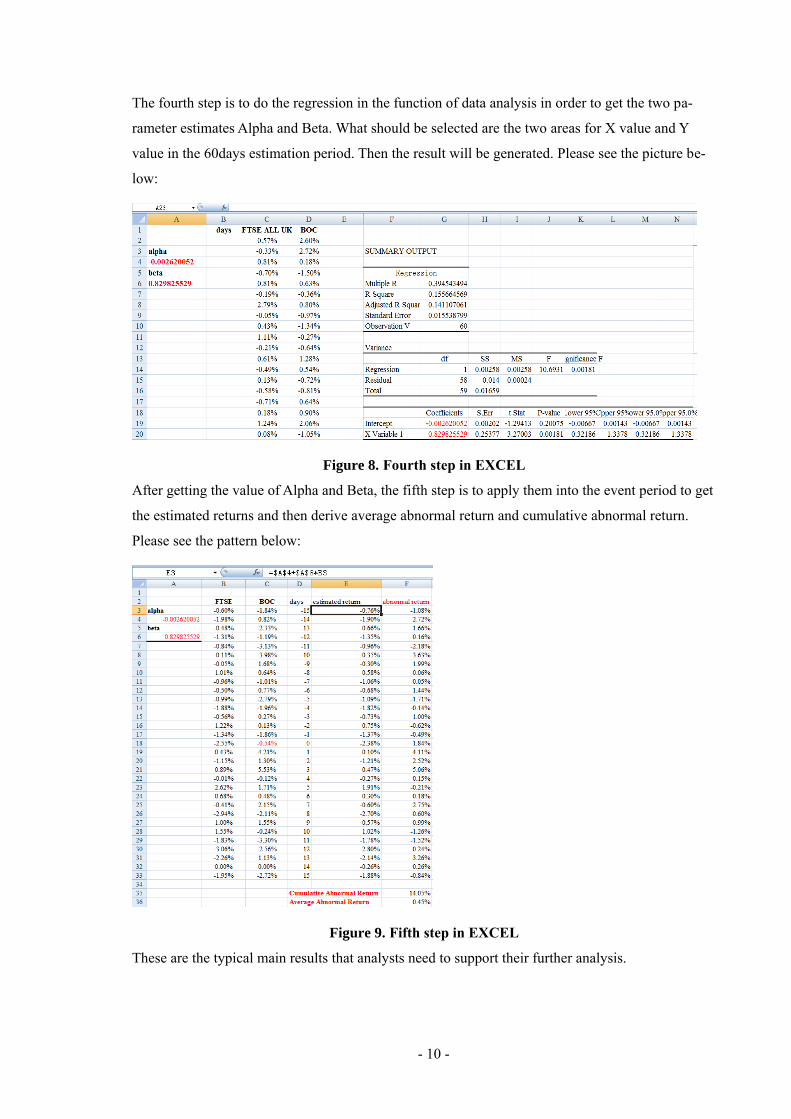
After getting the value of Alpha and Beta, the fifth step is to apply them into the event period to get
the estimated returns and then derive average abnormal return and cumulative abnormal return.
Please see the pattern below:
Figure 9. Fifth step in EXCEL
These are the typical main results that analysts need to support their further analysis.

- 11 -
3 State-of-The-Art
Although EXCEL is one option to carry out an event study analysis, any search on Google will still
produces several types of commercial event study software, all of which look like very professional.
They have very sophisticated interface as well as a large number of complicated functions. After
the designer compares such software, 'Eventus' and 'Stata' have been selected as two examples that
can represent excellent event study application.
The following subchapter will give a brief introduction of the advantage and disadvantage of doing
event study analysis in Microsoft EXCEL and a quick look of the useful functions of both event
study software Eventus® 9.0 and professional statistic data management Stata® as they are two
types of paid professional software with outstanding data processing ability.
3.1 Event Study in EXCEL
The typical sequences and screen shoots of doing event study analysis in EXCEL have been dis-
cussed in the previous chapter. Using Microsoft EXCEL is one option to run the data analysis
process. The advantage of using EXCEL is that this software is an accurate application with almost
all powerful functions in it. Also it is one of the most popular commercial software in the world to
process calculation. The proficient user knows how to manipulate it and get the required data
through the data analysis function. Furthermore, the data analysis result is also able to provide
graphic functions and settings can be personalized in order to meet the user's requirements. Alt-
hough it is a type of powerful software, it is not exclusively for doing event study analysis after all.
The five steps required to run the data analysis process involves too much copying and pasting. The
real operations of doing event study in EXCEL are much more trivial than those pictures shown in
the previous chapter. If the user needs to do event study analysis for ten different companies, then
the whole process is error-prone since the workload is too trivial and heavy. Further event analysis
is fully based on these accurate result data. If error figures arise in the supporting data, the later
analysis will be totally useless.
3.2 Introduction of Eventus® 9.0
According to its official website statements, 'Cowan Research LC produces Eventus software for
financial research, education and consulting. Eventus performs state-of-the-art event study estima-
tion and testing by using the CRSP stock database or other stock return data and it also provides
fast event-oriented data retrieval from the CRSP stock database' [10]. The interface of the software
is like the picture below:
- 12 -
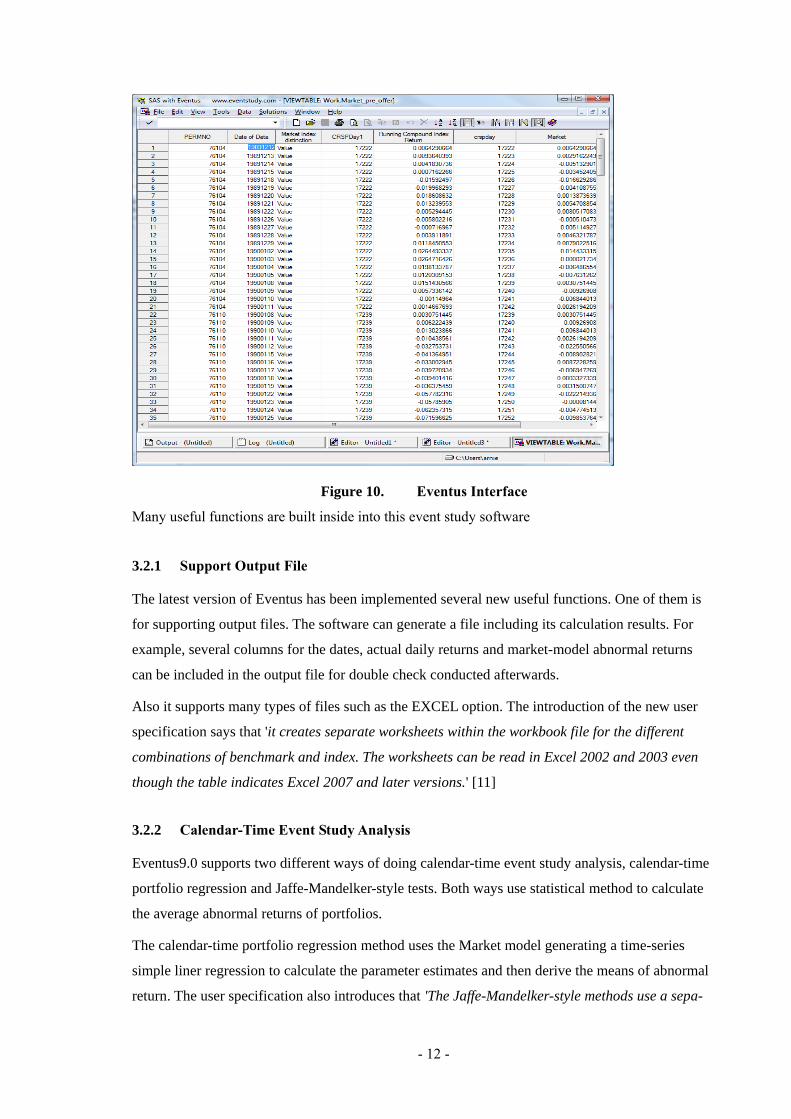
Figure 10. Eventus Interface
Many useful functions are built inside into this event study software
3.2.1 Support Output File
The latest version of Eventus has been implemented several new useful functions. One of them is
for supporting output files. The software can generate a file including its calculation results. For
example, several columns for the dates, actual daily returns and market-model abnormal returns
can be included in the output file for double check conducted afterwards.
Also it supports many types of files such as the EXCEL option. The introduction of the new user
specification says that 'it creates separate worksheets within the workbook file for the different
combinations of benchmark and index. The worksheets can be read in Excel 2002 and 2003 even
though the table indicates Excel 2007 and later versions.' [11]
3.2.2 Calendar-Time Event Study Analysis
Eventus9.0 supports two different ways of doing calendar-time event study analysis, calendar-time
portfolio regression and Jaffe-Mandelker-style tests. Both ways use statistical method to calculate
the average abnormal returns of portfolios.
The calendar-time portfolio regression method uses the Market model generating a time-series
simple liner regression to calculate the parameter estimates and then derive the means of abnormal
return. The user specification also introduces that 'The Jaffe-Mandelker-style methods use a sepa-
- 13 -
rate estimation period to derive the parameters of a linear benchmark model, if one is used, at the
security level, and also, in most of the methods of this type, to obtain the variances of portfolio
mean abnormal returns.' [12]
Finally the average abnormal return and cumulative abnormal return are tested directly by applying
the significance test.
As it has two ways of calculating the abnormal returns, namely the Market Model and the Jaffe-
Mandelker-style, the result is more rigorous and can be cross-referred to support further analysis.
3.2.3 Retrieve Data from CRSP Database
Another edge of Eventus is that it uses CRSP stock database, which not only offers convenience to
the user but also ensures the accuracy of retrieving required data.
Unlike normal software which requires the user to download individual share price and market in-
dex historic data from website manually or to get them on the fixed web page through software
interface, this software can directly retrieve required information from the CRSP database.
CRSP is 'centre for research for security prices' located in the University of Chicago. It is widely
acknowledged by most financial analysts that CRSP database is a non-profit securities price data-
base that contains all the historic prices of listed companies in NYSE, AMEX and NASDAQ and
provides full interpretation of historical information. The database is updated daily and monthly
through rigorous check and verification to make sure the prices and data accurate and comprehen-
sive.
So by using online database, especially these kinds of professional historic securities price data-
bases, the user can benefits a lot since they are more accurate and convenient. The database will be
updated from time to time. No problem will arise at the stage of data retrieving. If the user down-
loads the historic prices themselves or get them through the software on fixed web page, they
probably will need to be concerned about the accuracy of the data, check time series consistency or
the changes on the source page. All of these will lead to problems since retrieving data is one of the
main stages in the event study analysis software.
3.2.4 Programming language
As is known to all, Java coding language is an object orientated and platform independent language
developed by SUN cooperation. It is a simple, stable, secure, high-performance and platform inde-
pendent programming language. This Eventus event study analysis software is implemented in Java
so that its operating system is independent. It can be run on Windows operating system or Mac OS
operating system even the Linux operating system.
- 14 -
3.2.5 Drawbacks
One issue with the package is that the result of this software only provides calculating the average
abnormal return. The result doesn't encompass the cumulative abnormal return. Although it is a
very easy calculation, this index is also an important parameter to analysts. So in my project soft-
ware, it provides both cumulative abnormal return and average abnormal return for the result.
The huge drawback of this software is its complicatedness. As the statements in the specification,
this software with those new functions is not suitable for the new user. It is targeted at professional
analysts who are quite experienced in using Eventus and who are proficient users of computers. It
is quite hard for the new users to understand the software and to successfully start using this soft-
ware when looking at the interface and function buttons even if they are provided with the
specification.
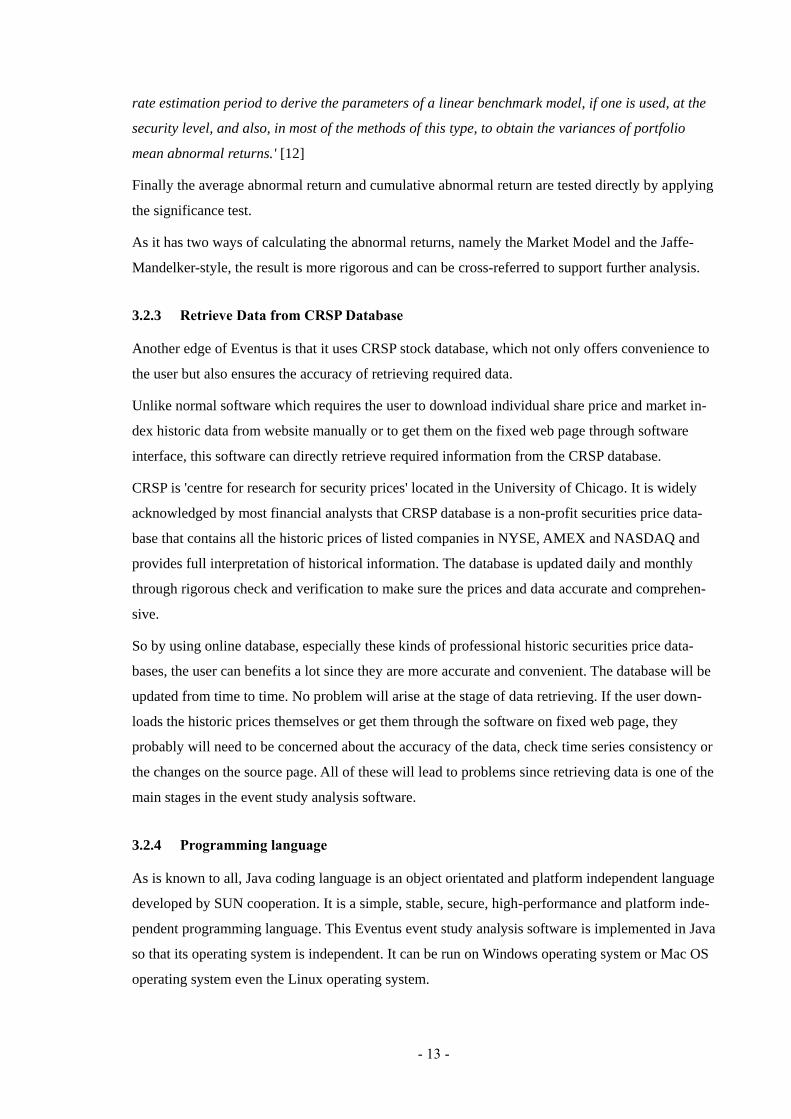
3.3 Introduction of Stata
Stata is also a type of paid commercial software which was developed by StataCorp LP. The pack-
age contains all the data analysis and graphic functions exclusively for statistical data process. The
interface has been showed in the following screenshots:
Figure 11. Stata Interface
- 15 -
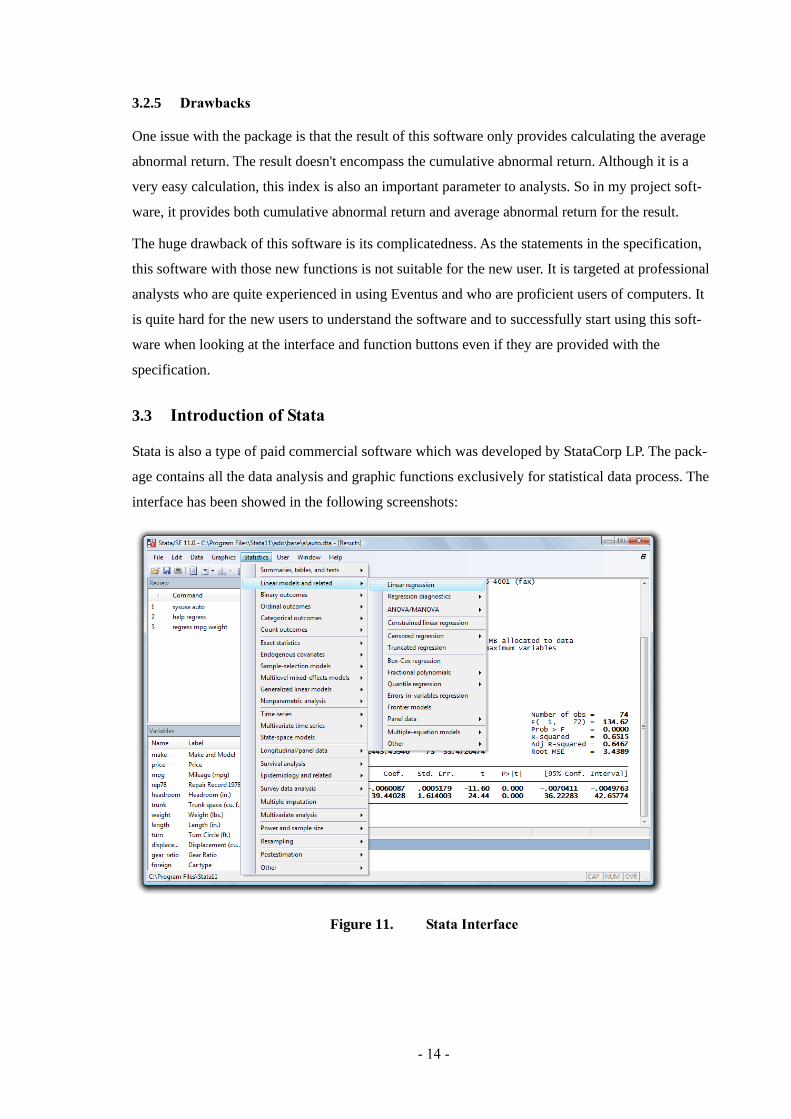
3.3.1 Advantages
This is a type of more mature software with hundreds of statistical tools on the interface. Also the
GUI has been designed more reasonable and more user-friendly. It support many kinds of files in-
cluding EXCEL '.csv' file, which means it allows the user to directly input the original price files
downloaded from YAHOO Finance or Google Finance. The biggest advantage of this package is
that the user can not only process all the statistical data analysis to get the accurate result but also
use the various kinds of professional quality graphical functions to give a clear idea of the result
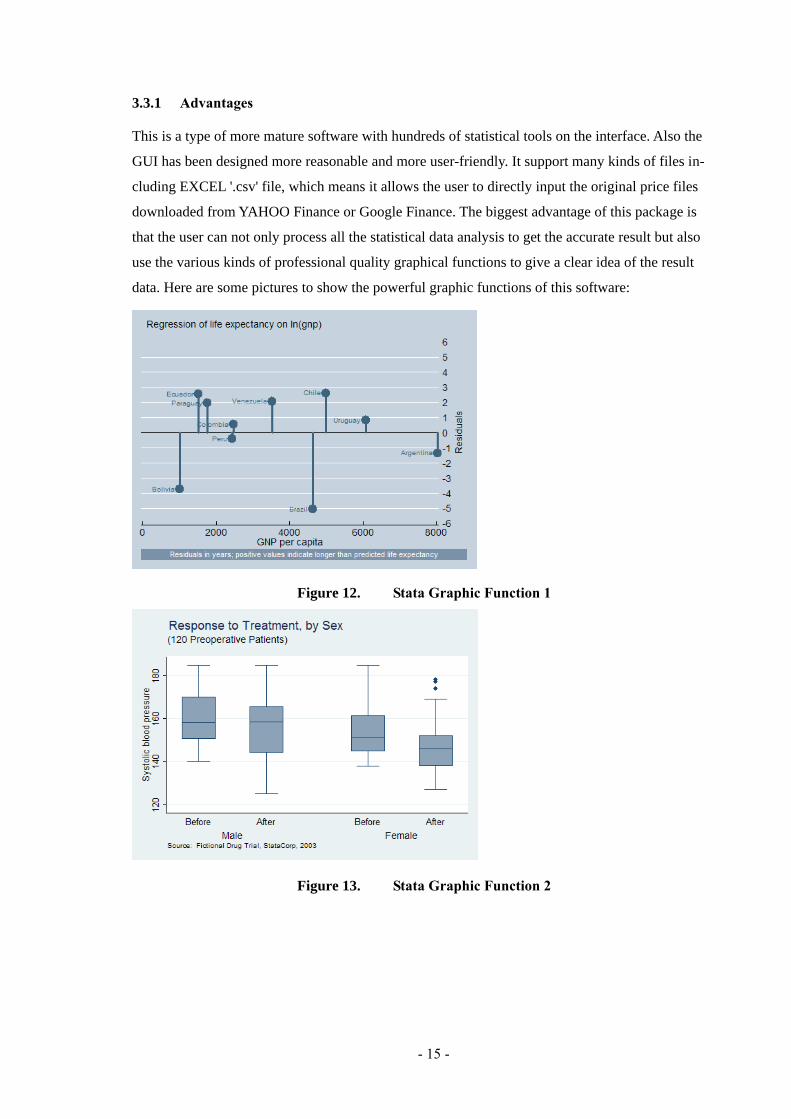
data. Here are some pictures to show the powerful graphic functions of this software:
Figure 12. Stata Graphic Function 1
Figure 13. Stata Graphic Function 2
- 16 -
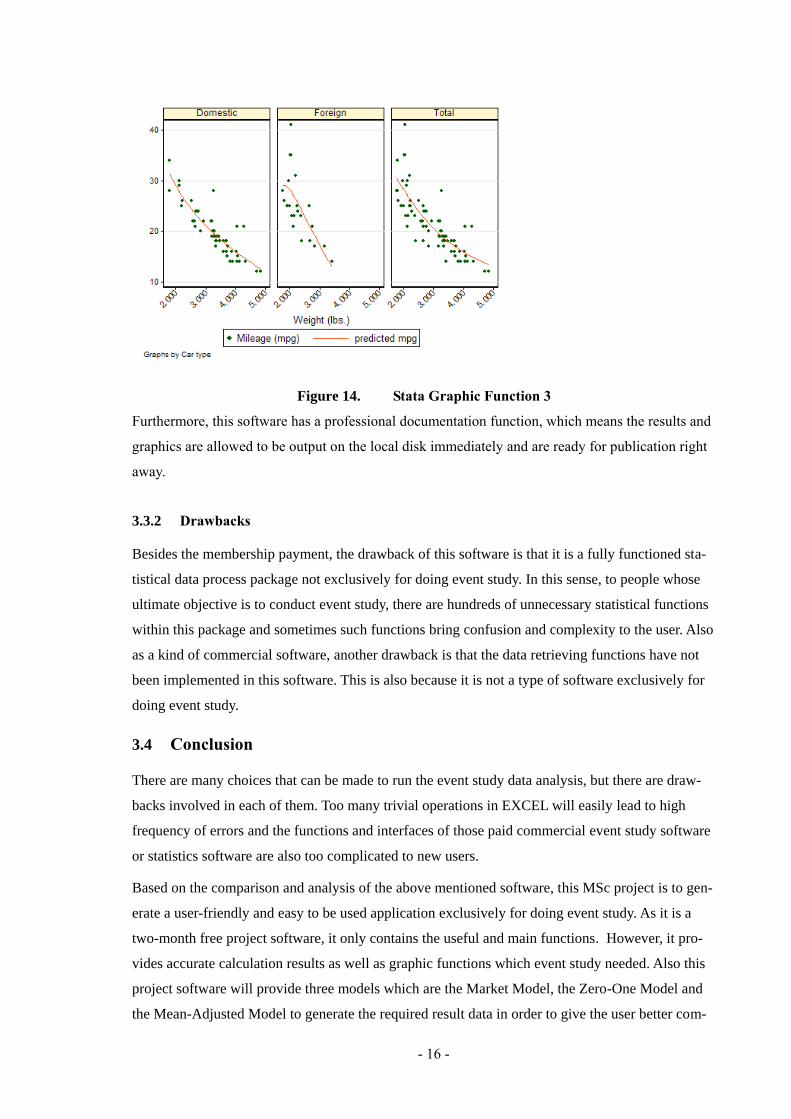
Figure 14. Stata Graphic Function 3
Furthermore, this software has a professional documentation function, which means the results and
graphics are allowed to be output on the local disk immediately and are ready for publication right
away.
3.3.2 Drawbacks
Besides the membership payment, the drawback of this software is that it is a fully functioned sta-
tistical data process package not exclusively for doing event study. In this sense, to people whose
ultimate objective is to conduct event study, there are hundreds of unnecessary statistical functions
within this package and sometimes such functions bring confusion and complexity to the user. Also
as a kind of commercial software, another drawback is that the data retrieving functions have not
been implemented in this software. This is also because it is not a type of software exclusively for
doing event study.
3.4 Conclusion
There are many choices that can be made to run the event study data analysis, but there are draw-
backs involved in each of them. Too many trivial operations in EXCEL will easily lead to high
frequency of errors and the functions and interfaces of those paid commercial event study software
or statistics software are also too complicated to new users.
Based on the comparison and analysis of the above mentioned software, this MSc project is to gen-
erate a user-friendly and easy to be used application exclusively for doing event study. As it is a
two-month free project software, it only contains the useful and main functions. However, it pro-
vides accurate calculation results as well as graphic functions which event study needed. Also this
project software will provide three models which are the Market Model, the Zero-One Model and
the Mean-Adjusted Model to generate the required result data in order to give the user better com-

- 17 -
parison. The purpose is to give convenience to those users who encounter many difficulties when
using the error-prone EXCEL and who are not experienced and professional enough to understand
the complicated functions of paid commercial event study software.
- 18 -
4 Project Software Design
In this chapter, the designing process of this project software will be introduced in detail to give a
clear concept about how this project idea is produced.
Before coding details are described, firstly, the brief framework of this project software shall be
introduced. The basic criterion of developing any kind of competent software is to meet the origi-
nality of design as well as needs of clients.
4.1 Preparing for Design
At the beginning of designing this project software, efforts are made to find out what an event
study is and how its data analysis process runs.
As has been mentioned in Chapter two, event study is a popular statistical method to evaluate the
influence of an event such as a merger, a takeover or an issue of dividend payment in order to ana-
lyse how this event affects the company's share price. And the detailed sequences also have been
introduced in Chapter Two. The primarily required parameter is average abnormal return together
with the cumulative abnormal return. Then analysts, by reading these two data and the specific dai-
ly abnormal returns, are able to know whether there is a positive or negative impact on the
company through this event period and then to utilize these data to support their further analysis.
Since the theory and normal sequences of doing event study analysis have been clarified, now the
design stage can be launched. According to the steps of doing event study introduced in Chapter
Two, the design of this project software is fully based on the theory of the data analysis process of
doing event study analysis. At the beginning the design stage, brief design idea is that this project
software should contain the functions of:
Identifying the event date and determining the lengths of event period and estimation period;
Retrieving data from online website or containing a database,
Reading data file;
Calculations of daily returns, Alpha and Beta, cumulative abnormal return and average abnor-
mal return.
Being about to conduct significance test for the result
Having a user-friendly Graphical User Interface.

- 19 -
4.2 Ideas for Design
4.2.1 Brief Framework
The design idea is primarily based on the theory of event study analysis, which has been introduced
in Chapter Two. Also the design refers to the way people conduct event study by using Microsoft
EXCEL as well as the analysis of other types of commercial event study software. But unlike EX-
CEL or other types of commercial software that contain many complicated functions and a
complex GUI, this software aims to produce a piece of exclusive event study software with user-
friendly GUI.
4.2.2 Platform Selection
According to the project requirements on the university website, this software development can
result in two different projects. One is for designing an application on computer. The other is for
designing an application for mobile phones. In my opinion, the current suitable mobile phone oper-
ating systems for this kind of application are only APPLE iPhone OS system and Google Android
system. The performance of mobile phones like iPhone 4 or HTC Hero based on either of these two
operating systems is high enough to run this kind of small Java application. Even though the
memory is enough for retrieving and reading large amount of data, the deadly pitfall is the screen
size of such phones. Both iPhone and Google G series represent the typical screen size of these
smart phones. Although their screens are big enough to check mails and surf the web for a short
time, in my opinion, these screens are far from ideal for displaying the required information gener-
ated by this event study application. Furthermore, according to the investigation made before
staring the project proposal, there are few people willing to run this kind of event study application
on a screen less than four inches.
According to the above-mentioned analysis and investigation result, the final decision has been
made to develop an event study application for PC.
4.2.3 Programming Language
This software has been implemented by Java. The reason for choosing this specific language is that
Java is not only a required programming language of this project, but also a simple, object-oriented,
stable, secure, high-performance and easy-transplant programming language. The superiority of
object-oriented and platform independent makes it possible to be run without any modification on
almost on all kinds of operating system ranging from Windows operating system to Mac OS oper-
ating system and even the Linux operating system. This reflects a saying—'write once and run
anywhere'. Another advantage is that Java is born for the Internet and this language can do many
things that other programming language cannot, which is what most users want to see.
- 20 -
4.2.4 Detail Functions
A brief function list has been made in the first session of this chapter. Now this session is to exam-
ine the detailed functions before application interface is discussed.
4.2.4.1 Retrieving Data
At the beginning of the design phase, many options are available for data retrieving. One is to re-
trieve data directly from online website like YAHOO Finance. Another is to get data from local or
remote database like Eventus, which has been introduced in Chapter Three.
Unfortunately, due to the two-month time constraint and the nature of this non-profitable software,
there is very little possibility to retrieve online data directly on webpage. To be more specific, un-
like paid commercial software, this software will not be updated by changing codes from time to
time, which means the function of retrieving data cannot be performed as long as there is some
change of the layout of websites from which this software get data. Considering the time constraint,
the function of retrieving data will not be implemented in the development phase. Therefore, the
idea of obtaining data directly from the Internet or including a database will not be taken into con-
sideration. The final decision on retrieving data is as follows:
The user firstly manually downloads the required common 'Open-High-Low-Close' historic price
file online from YAHOO Finance. And it is assumed that no difficulties will be encountered at this
step. And it takes only a few minutes to download data. Another merit of this way to obtain data is
that the user is allowed sufficient flexibility.
4.2.4.2 Reading Data
The second step is reading file. Normally if the user has installed Microsoft Office application, the
file downloaded from the Internet is the Microsoft EXCEL spreadsheet. However, because of the
time constraint, decision has been made to only support reading '.txt' files. This may require the use
to undertake an extra mini task after the spreadsheets are downloaded on the local hard disk. That is
to open the spreadsheet and click 'save as' to save the downloaded data as Text Document and then
to delete the last blank line in the Text Document files. Another thing has to be mentioned here is
that the user must make time consistent in both price files before saving it as '.txt' files. When the
preparation of files is ready and in order to select and open the price files, only one more 'local file
choose' function shall be implemented in the software within this step. Then all the preparation of
using this project application to choose and read data is ready. By implementing the previously dis-
cussed steps, the application will be able to read the historic price text document files.

- 21 -
4.2.4.3 Displaying Chart
Inspired by other securities software during the designing process, the designer of this software
assumes it will be of great help if the user is allowed the opportunity to directly compare the trends
of both individual share price and market portfolio index data with the assistance of charts and
graphs. Therefore, the third step has been settled for displaying the share price and market index
data patterns. And it would be reasonable if displaying share price and market index pattern is
combined with the process of reading data into the same stage. Therefore, after the user selects the
required file manually, the second and third step will be carried out together. Another graphic func-
tion is displaying cumulative abnormal return over event period. It also will be of great help if the
user is provided with both result data values and corresponding graphs.
4.2.4.4 Required Data Generation
The step that follows is for calculating the daily returns of individual share price and market index.
In order to get these results, data comes from step two will be further processed to generate cumu-
lative abnormal return and average abnormal return. However, prior to the further process of the
exact event data, lengths of positive and negative event period, length of estimation period need to
be clarified, so decision has been made to provide several text fields for inputting these types of
needed information. Then what the user needs to do is to click the 'Apply' button to run the data
calculation and all the required result data will be generated instantly.
As has been mentioned in the previous session, 'user-friendly' is one merit of this software. So
when providing the 'Apply' button, the designer also adds a 'Clear' button for the user to erase in-
formation on the interface and system memory.
4.2.4.5 Significance Test
Finally, it is necessary to test the significance of the required result values. This software is not im-
plemented multiple event study data analysis process due to the time constraint and it is useless to
run the significance test if the user only holds one result. So decision on Significance Test function
has been made to provide a text filed for the user to manually input the required values.
4.2.5 Design of GUI
GUI stands for Graphical-User-Interface. According to its meaning, it is a way for users to com-
municate with the internal software. It serves as a bridge to link the outside world with the inside
codes. It is vital for every application to have a user-friendly GUI so the user can easily understand
the functions of different parts and start using the software quickly. This project software is for
building an easy-to-use and user-friendly event study application and therefore the interface shall
- 22 -
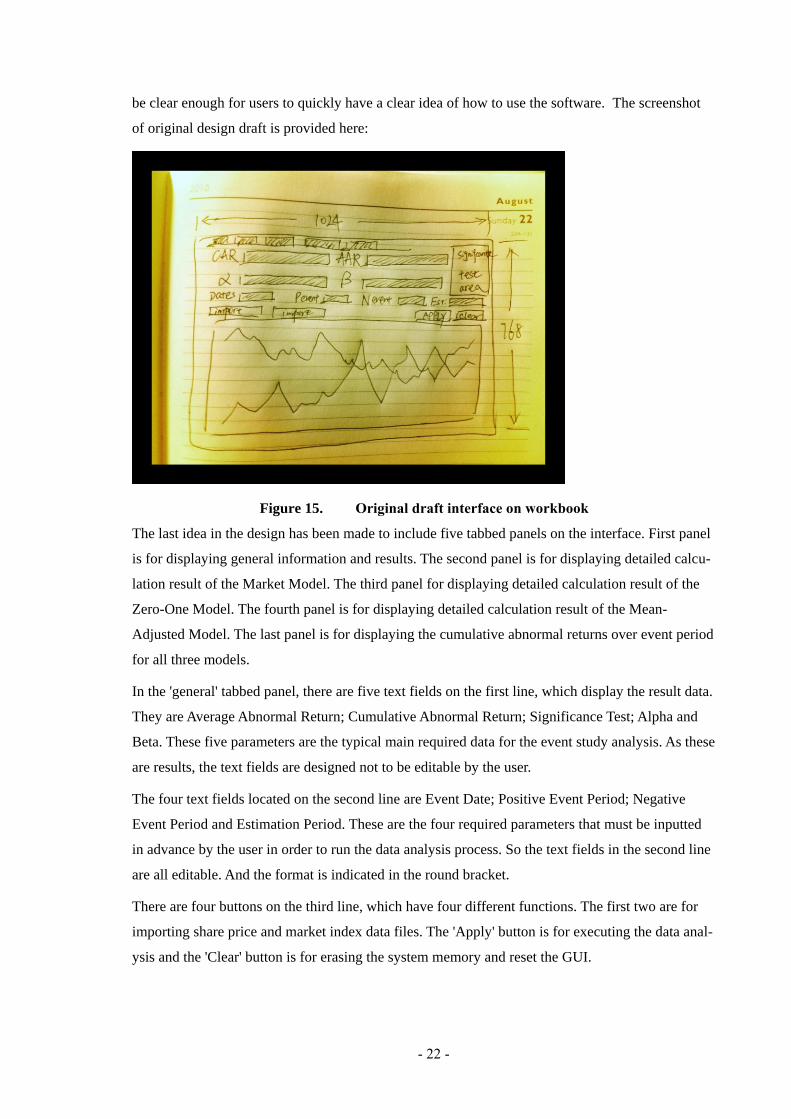
be clear enough for users to quickly have a clear idea of how to use the software. The screenshot
of original design draft is provided here:
Figure 15. Original draft interface on workbook
The last idea in the design has been made to include five tabbed panels on the interface. First panel
is for displaying general information and results. The second panel is for displaying detailed calcu-
lation result of the Market Model. The third panel for displaying detailed calculation result of the
Zero-One Model. The fourth panel is for displaying detailed calculation result of the Mean-
Adjusted Model. The last panel is for displaying the cumulative abnormal returns over event period
for all three models.
In the 'general' tabbed panel, there are five text fields on the first line, which display the result data.
They are Average Abnormal Return; Cumulative Abnormal Return; Significance Test; Alpha and
Beta. These five parameters are the typical main required data for the event study analysis. As these
are results, the text fields are designed not to be editable by the user.
The four text fields located on the second line are Event Date; Positive Event Period; Negative
Event Period and Estimation Period. These are the four required parameters that must be inputted
in advance by the user in order to run the data analysis process. So the text fields in the second line
are all editable. And the format is indicated in the round bracket.
There are four buttons on the third line, which have four different functions. The first two are for
importing share price and market index data files. The 'Apply' button is for executing the data anal-
ysis and the 'Clear' button is for erasing the system memory and reset the GUI.

- 23 -
The lower part of GUI is for displaying the share price and market index data patterns by using a
XY axis. X-coordinate is for displaying the time series. Y-coordinate is for displaying the price and
market index. So the user can make comparison of the trends for both patterns.
In the 'Market Model' tabbed panel, the software will display the calculation details for the ex-
pected returns and abnormal returns of each day in event period for the Market Model by using J
Table method. This can provide direct comparison for the impact on each day through the event
period and give better support for further analysis.
The 'Zero-One Model' panel and 'Mean-Adjusted Model' panel are similar to 'Market Model' panel.
They both use J Table method to display detailed calculation result for giving better support for
further analysis.
In the 'CAR over event period' panel, a graphic function is provided to give a direct comparison of
all the cumulative abnormal returns over event period generated by three different return generating
models. This function has been fulfilled by XY Series method. So the user is able to directly see the
three different changes and trend of the cumulative abnormal return over the entire event period in
order to find relationships between the event and the abnormal returns.
4.3 Internal Structure
Class diagram represents a kind of static diagram in unified modelling language of software engi-
neering to show the relationships between system classes and to display the internal structure of the
software. [13]
A class diagram provided here is to give a clear picture of the internal structure of this project soft-
ware. Please see the diagram below:
Figure 16. Internal Structure
In this picture, there are four classes with four different tasks.

- 24 -
AutoCalculation is the main class of this software containing GUI and action performed method.
There are three sub-classes included here. Two of them are for reading different files. ReadSP is for
reading individual share price file. ReadMi is for reading stock market index data file. The last one
is Regreesion which is for managing all the calculations in this software. The main class knows
about all the remaining three sub-classes.
In the design phase, the browsing file function is going to be achieved by using 'JFileChooser'
method in main class. The functions of opening and reading files functions are going to be
achieved by using 'StringTokenizer' method in the first two sub-classes separately. The Regression
designed to in charge of the remaining calculation and graphic functions by using algorithm in that
class.
All of the above mentioned classes and their corresponding functions have formed the internal
structure and relationship of this project software.
- 25 -
5 Project Software Implementation
This chapter will begin with the implementation phase to explain how each function listed in the
previous chapter has been achieved. This project software has been implemented by Java. It has
one main class and three sub-classes. Two of its sub-classes are for reading files and the remaining
one sub-class is for doing regression and result calculation. The analysis will begin with the main
class followed by the description of the subclasses.
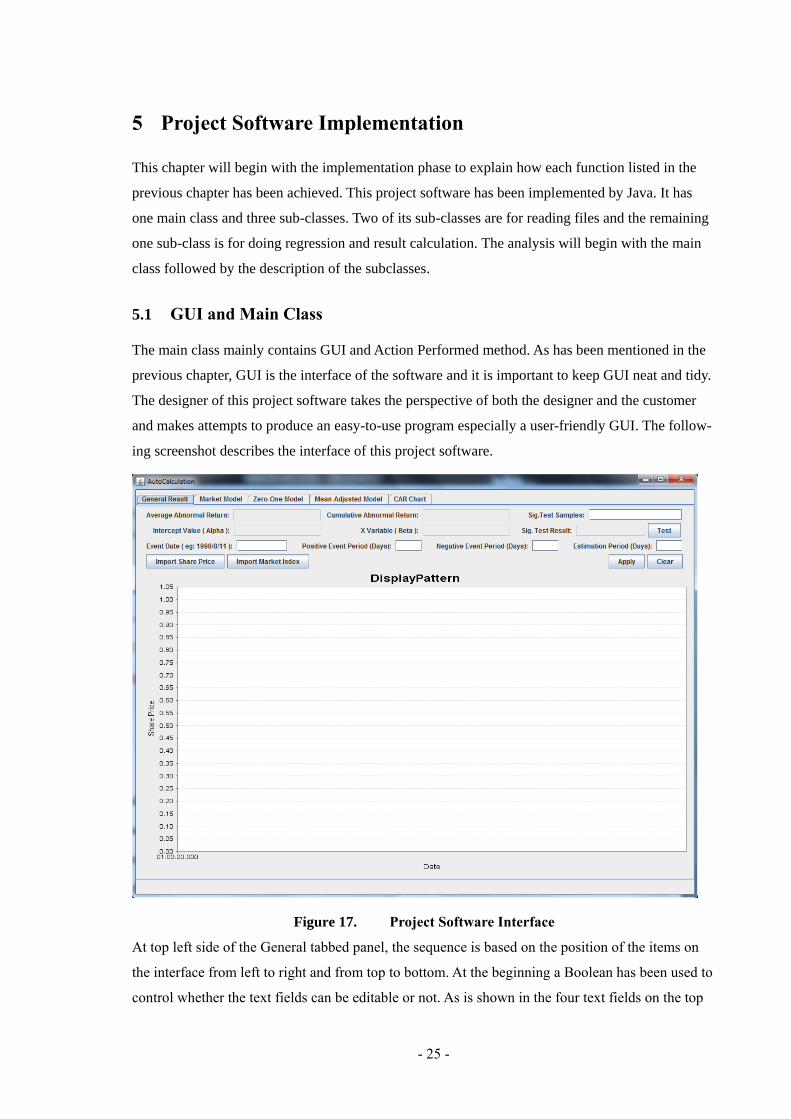
5.1 GUI and Main Class
The main class mainly contains GUI and Action Performed method. As has been mentioned in the
previous chapter, GUI is the interface of the software and it is important to keep GUI neat and tidy.
The designer of this project software takes the perspective of both the designer and the customer
and makes attempts to produce an easy-to-use program especially a user-friendly GUI. The follow-
ing screenshot describes the interface of this project software.
Figure 17. Project Software Interface
At top left side of the General tabbed panel, the sequence is based on the position of the items on
the interface from left to right and from top to bottom. At the beginning a Boolean has been used to
control whether the text fields can be editable or not. As is shown in the four text fields on the top

- 26 -
left side, default means 'cannot be editable'. The four text fields are the results so they have been set
to be default. The text field on the top right are provided for inputting the required information for
doing significance test and the other text fields below is for displaying the result. So the upper one
is 'editable' and the lower one is to be default. There are four text fields provided on the third line is
for users inputting required parameter variables and they also has been set to 'editable'. The original
price charts are designed to be displayed on a chart panel and the size of the panel is 'Dimension
1000*600'.
Furthermore, the initial size of the software is 1024*768 pixels which suits the resolution of normal
display.
What has been achieved here is a neat and ordered software interface with reasonable consideration
for the user. Other panels will be discussed in later sub-chapter.
5.2 Import File
The import file function has been fulfilled by using an instance of 'JFileChooser' class.
When the user clicks a file import button on the software interface, the 'showOpenDialog' will be
executed in Action Performed method and the file chooser window will be displayed. Only if a file
has been selected, 'JFileChooser.APPROVE_OPTION' will be approved and further codes will be
triggered. Here is the screenshot of the FileChooser window.
Figure 18. File Chooser Window
Now the user is able to select and to highlight a required file at local place in 'FileChooser' window.
After the user clicks the open button, the absolute path of this selected file will be retrieved and be
put into an invisible text field. The format of the absolute path is a string and it will be immediately
transferred to its corresponding file reading class for further file locating.
- 27 -
What has been achieved here is a file choose window. It allows the user to search and open a re-
quired file in local place.
5.3 File Reading
This is one of the key parts in the project software development cycle. If error arises in reading
files, then the remaining calculation will all be wrong and useless. Because this application in-
volves reading two different source files concurrently, so the decision has been made to create two
different sub-classes but to provide the same function in order to make the structure clear. One is
for importing the share price file. The other is for importing the market index data file. The codes
implemented in both ReadSp.java and ReadMi.java are the despite the different names they use.
(Read share price and Read Market index) So only the ReadSp.java will be taken as an example to
explain how the file reading function has been achieved.
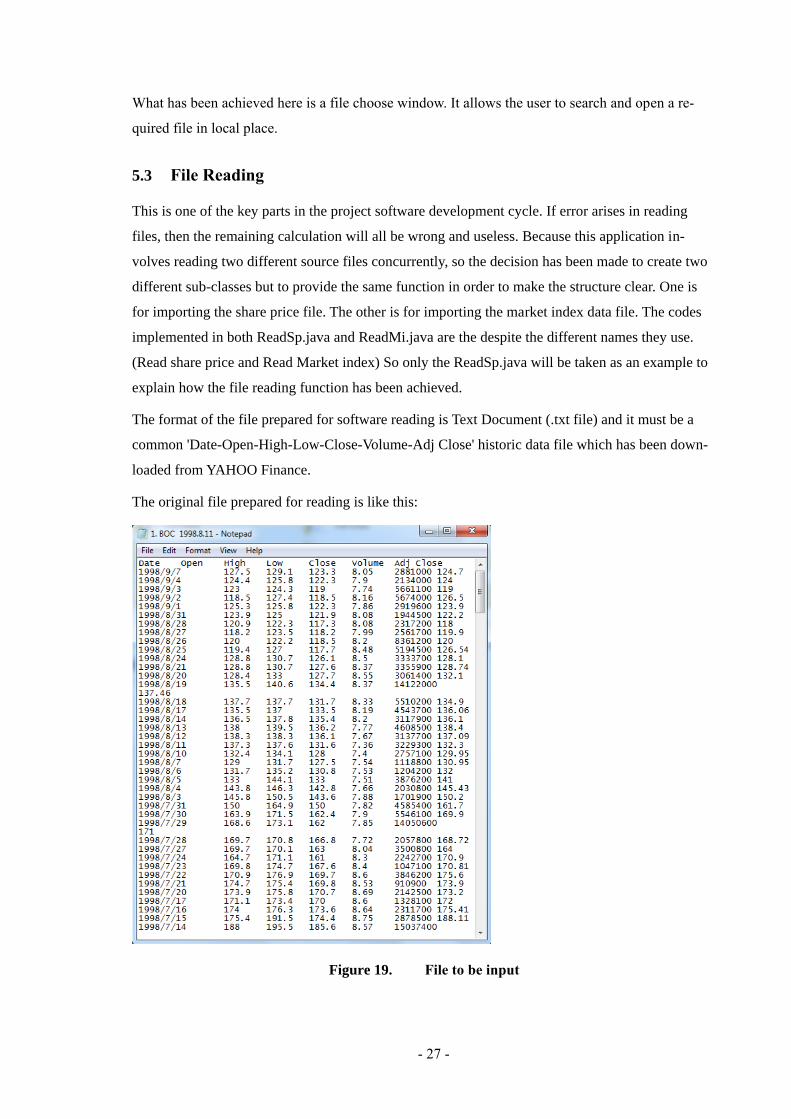
The format of the file prepared for software reading is Text Document (.txt file) and it must be a
common 'Date-Open-High-Low-Close-Volume-Adj Close' historic data file which has been down-
loaded from YAHOO Finance.
The original file prepared for reading is like this:
Figure 19. File to be input

- 28 -
There are altogher six columns total in the file representing the 'Data Open High Low Close Vol-
ume Adj Close' and each column is separated by a 'Tab'. Only two of them are needed, which are
Date and Close price for calculating the expected returns later, but the software will read all values
in the file and store them into arrays. The way this project software extracts the Date and Close
price columns is by using the 'StringTokenizer' method to split up these columns from 'Tab'. The
conversion involved here is from type 'String' to type 'Double' involved here. Daily returns of both
individual share price and market index will be generated and stored into arrays at the same time
waiting for further process.
What has been achieved in this phase is a file reading function. This function identifies the location
of the file which the user chooses in the local place. With this function, the file can be opened, the
inside columns can be split and the data can be read line by line. This will be followed by another
two steps, namely converting the individual data from type 'String' to type 'Double' and storing
them into arrays for further processing and calculation. Meanwhile, the daily returns of both indi-
vidual share price and market index will be generated and stored into arrays in the system memory.
5.4 Display Pattern Function
The aim for building this display pattern function is to give a direct comparison of both individual
share price and market index in visually in order to give support for doing technical analysis.
This display function has been fulfilled by using a 'TimeSeriesChart'. There are two common ways
of displaying charts in Java: the XY series method and the Time Series method. The reason why
Time Series method is adopted here is that the required unit of X-coordinate is measured by time.
However, the unit of X-coordinate of XY series only supports a value which does not meet the re-
quirement here.
Decision has been made that this stage needs to be triggered immediately after the historic price file
has been read successfully. Screenshots of this function is provided below:

- 29 -
Figure 20. Import and display the share price
Figure 21. Import and display the market index
Multiple Y Axis has been implemented for better comparison. A second Y Axis on the right side has
been built here due to the huge difference in unit of the individual share price and the market index

- 30 -
in order to put both charts together. Different color and line shape chose is also for better distinc-
tion.
A useful function that the 'TimeSeriesChart' provided here is to support enlarging or shrinking the
pattern with specific price interval and time period by dragging on the particular area from left to
right in the chart panel. So the user can get a more precise patter and to analyse the price within a
shorter period of time on the chart panel. Also dragging from right to left will reset the pattern to its
original size. The following figure is the enlarged share price pattern:
Figure 22. Enlarge and shrink the price charts
The range has been chosen from November 1997 to April 1998 and the price interval is between
8.5GBP to 10.2GBP. (BOC is one of the component stocks of UK FTSE 100) This is quite useful
for detailed technical analysis.
Another chart is in 'CAR chart' panel, which is for displaying the cumulative abnormal return over
event period. This chart is implemented by XY Series. Values on X Axis stands for the event period
and Values on Y Axis is the cumulative abnormal return over event period. All three results from
the three different models will be displayed on this chart panel right after the 'Apply' button has
been clicked. Please see the following figure:

- 31 -
Figure 23. CAR over Event Period
The function of enlarging and shrinking the chart is also available to the user in CAR chart
In summary, what have been achieved in this phase are two displaying pattern functions. One is for
showing share price and market index data. Another is for showing cumulative abnormal returns
over event period. The software will automatically display the original price chart right after the
user imports the price file. (Reading file and getting data is the step before display chart, but this
occurs in the background and only takes a few milliseconds, which the user can hardly notice.) And
the function of enlarging and shrinking the patterns will also be provided for further intensive ob-
servation.
5.5 Regression and Calculation
After reading the historic price files, the project software is ready to calculate the required data for
doing event study analysis.
Theory and sequences have been discussed in Charter Two. Before calculating the two parameter
estimates—Alpha and Beta, one more step is required to determine the four key elements of doing
event study analysis, namely the specific event date, the length of positive event period, length of
negative event period and the length of estimation period. Before the user clicks the Apply button,
the four text fields on the interface need to be filled in with the corresponding elements that are
- 32 -
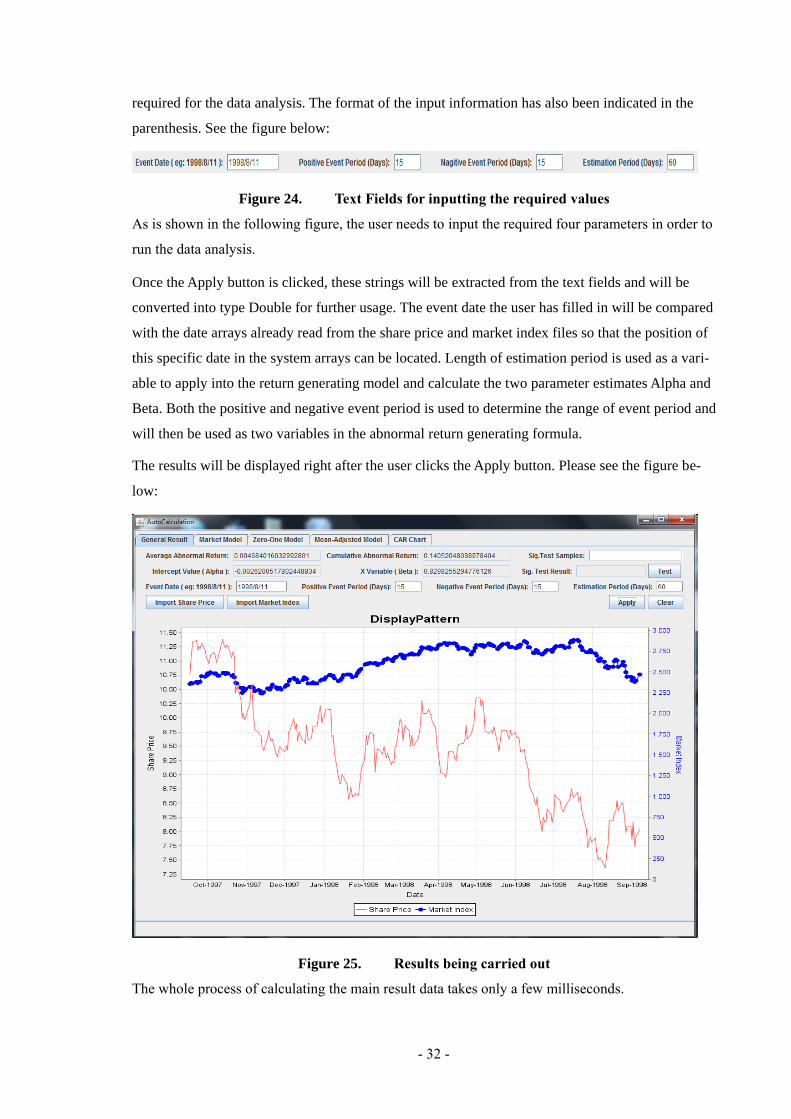
required for the data analysis. The format of the input information has also been indicated in the
parenthesis. See the figure below:
Figure 24. Text Fields for inputting the required values
As is shown in the following figure, the user needs to input the required four parameters in order to
run the data analysis.
Once the Apply button is clicked, these strings will be extracted from the text fields and will be
converted into type Double for further usage. The event date the user has filled in will be compared
with the date arrays already read from the share price and market index files so that the position of
this specific date in the system arrays can be located. Length of estimation period is used as a vari-
able to apply into the return generating model and calculate the two parameter estimates Alpha and
Beta. Both the positive and negative event period is used to determine the range of event period and
will then be used as two variables in the abnormal return generating formula.
The results will be displayed right after the user clicks the Apply button. Please see the figure be-
low:
Figure 25. Results being carried out
The whole process of calculating the main result data takes only a few milliseconds.

- 33 -
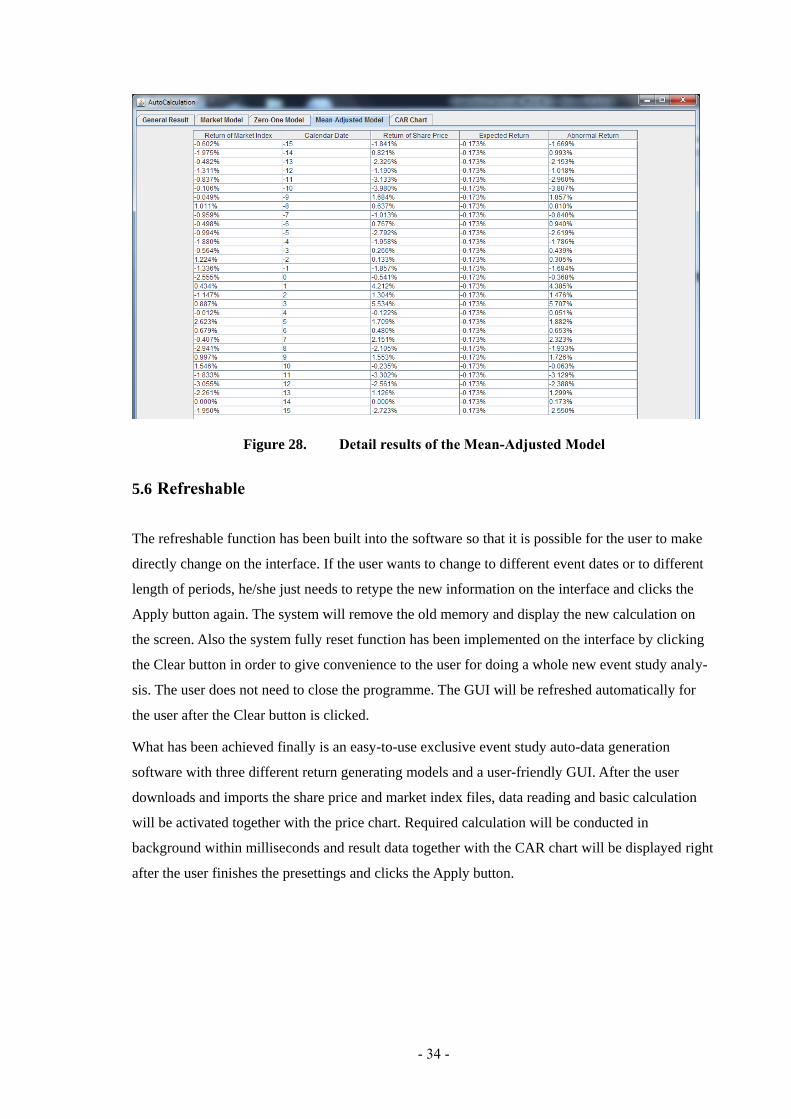
Specific detail result values in Market Model tabbed panel, Zero-One Model panel and Mean-
Adjusted panel are provided for the user to do intensive analysis. J Table method is adopted here in
order to give a neat and clear impression for the user. Please see the three figures below:
Figure 26. Detail results of the Market Model
Figure 27. Detail results of the Zero-One Model
- 34 -
Figure 28. Detail results of the Mean-Adjusted Model
5.6 Refreshable
The refreshable function has been built into the software so that it is possible for the user to make
directly change on the interface. If the user wants to change to different event dates or to different
length of periods, he/she just needs to retype the new information on the interface and clicks the
Apply button again. The system will remove the old memory and display the new calculation on
the screen. Also the system fully reset function has been implemented on the interface by clicking
the Clear button in order to give convenience to the user for doing a whole new event study analy-
sis. The user does not need to close the programme. The GUI will be refreshed automatically for
the user after the Clear button is clicked.
What has been achieved finally is an easy-to-use exclusive event study auto-data generation
software with three different return generating models and a user-friendly GUI. After the user
downloads and imports the share price and market index files, data reading and basic calculation
will be activated together with the price chart. Required calculation will be conducted in
background within milliseconds and result data together with the CAR chart will be displayed right
after the user finishes the presettings and clicks the Apply button.
- 35 -
6 Testing
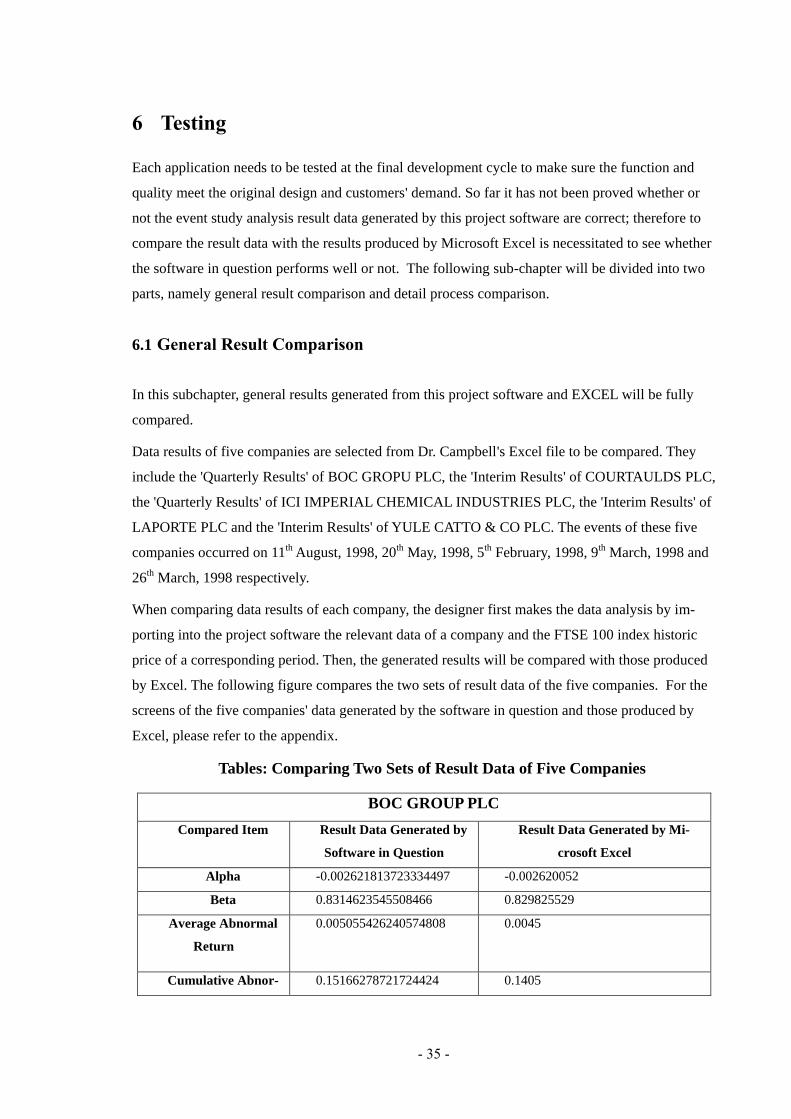
Each application needs to be tested at the final development cycle to make sure the function and
quality meet the original design and customers' demand. So far it has not been proved whether or
not the event study analysis result data generated by this project software are correct; therefore to
compare the result data with the results produced by Microsoft Excel is necessitated to see whether
the software in question performs well or not. The following sub-chapter will be divided into two
parts, namely general result comparison and detail process comparison.
6.1 General Result Comparison
In this subchapter, general results generated from this project software and EXCEL will be fully
compared.
Data results of five companies are selected from Dr. Campbell's Excel file to be compared. They
include the 'Quarterly Results' of BOC GROPU PLC, the 'Interim Results' of COURTAULDS PLC,
the 'Quarterly Results' of ICI IMPERIAL CHEMICAL INDUSTRIES PLC, the 'Interim Results' of
LAPORTE PLC and the 'Interim Results' of YULE CATTO & CO PLC. The events of these five
companies occurred on 11th August, 1998, 20th May, 1998, 5th February, 1998, 9th March, 1998 and
26th March, 1998 respectively.
When comparing data results of each company, the designer first makes the data analysis by im-
porting into the project software the relevant data of a company and the FTSE 100 index historic
price of a corresponding period. Then, the generated results will be compared with those produced
by Excel. The following figure compares the two sets of result data of the five companies. For the
screens of the five companies' data generated by the software in question and those produced by
Excel, please refer to the appendix.
Tables: Comparing Two Sets of Result Data of Five Companies
BOC GROUP PLC
Compared Item Result Data Generated by
Software in Question
Result Data Generated by Mi-
crosoft Excel
Alpha -0.002621813723334497 -0.002620052
Beta 0.8314623545508466 0.829825529
Average Abnormal
Return
0.005055426240574808 0.0045
Cumulative Abnor- 0.15166278721724424 0.1405
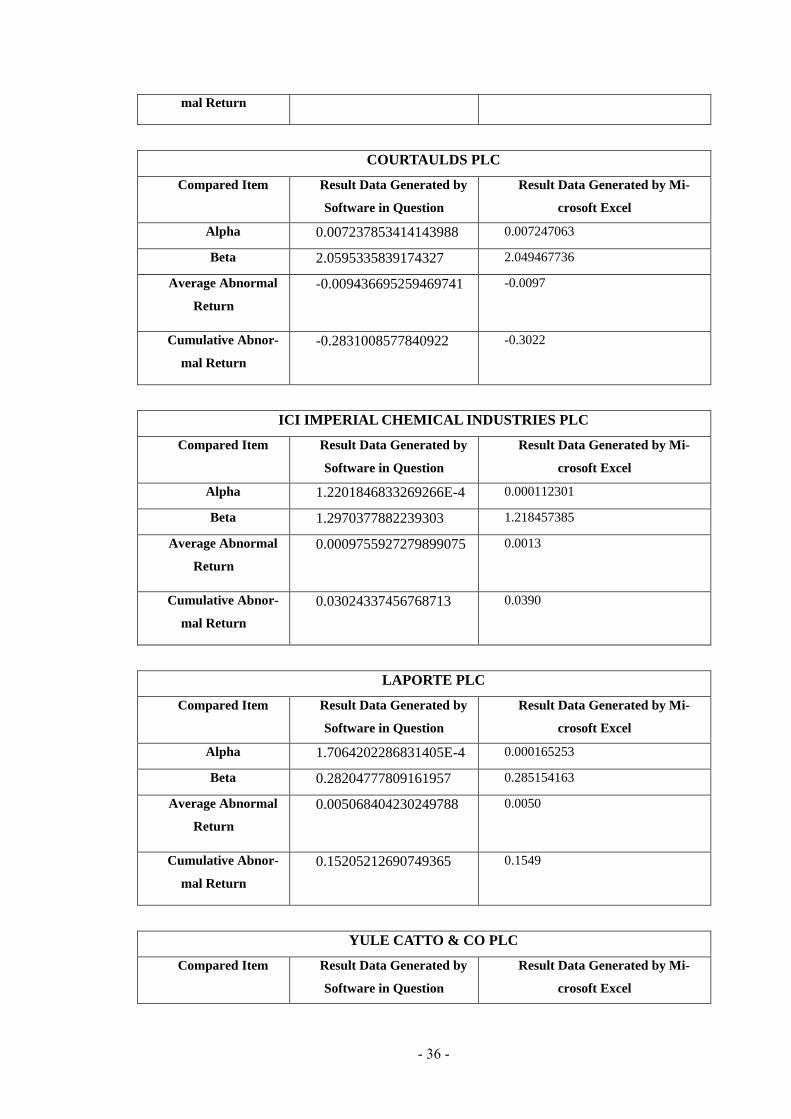
- 36 -
mal Return
COURTAULDS PLC
Compared Item Result Data Generated by
Software in Question
Result Data Generated by Mi-
crosoft Excel
Alpha 0.007237853414143988 0.007247063
Beta 2.0595335839174327 2.049467736
Average Abnormal
Return
-0.009436695259469741 -0.0097
Cumulative Abnor-
mal Return
-0.2831008577840922 -0.3022
ICI IMPERIAL CHEMICAL INDUSTRIES PLC
Compared Item Result Data Generated by
Software in Question
Result Data Generated by Mi-
crosoft Excel
Alpha 1.2201846833269266E-4 0.000112301
Beta 1.2970377882239303 1.218457385
Average Abnormal
Return
0.0009755927279899075 0.0013
Cumulative Abnor-
mal Return
0.03024337456768713 0.0390
LAPORTE PLC
Compared Item Result Data Generated by
Software in Question
Result Data Generated by Mi-
crosoft Excel
Alpha 1.7064202286831405E-4 0.000165253
Beta 0.28204777809161957 0.285154163
Average Abnormal
Return
0.005068404230249788 0.0050
Cumulative Abnor-
mal Return
0.15205212690749365 0.1549
YULE CATTO & CO PLC
Compared Item Result Data Generated by
Software in Question
Result Data Generated by Mi-
crosoft Excel

- 37 -
Alpha 0.0031748628544948465 0.003184533
Beta 0.05814129541357404 0.052812971
Average Abnormal
Return
-5.568843293248892E-4 -0.0006
Cumulative Abnor-
mal Return
-0.016706529879746676 -0.0195
As can be seen from the table above, the difference between the values of Alpha and Beta generat-
ed by two types of software is slight, with errors being controlled within an acceptable range. The
reason for the existence of errors is that different decimal places have been chosen when the actual
daily returns are calculated. At the testing stage, the 'system out println' method is used to compare
the results of each actual daily return calculated by this software with those calculated by EXCEL.
Besides the difference in decimal places adopted, they are all perfectly match. This leads to errors
in Alpha and Beta, two important values that will be applied into the return generating model.
It seems that there is discrepancy in the values of Cumulative abnormal return and Average abnor-
mal return. That is due to error in Alpha and Beta and also due to the different decimal places used
in calculating daily expected return and daily abnormal return when applying the two parameter
estimates back into event period.
Specific detailed check will be discussed in next sub-chapter to eliminate this is not the software's
mistake.
What needs to be mentioned here is a value with too many decimal digits will change the way the
value display on the screen. The value will end with E-N, with the 'N' standing for the number of
decimal places
To summarize, this sub-chapter is for general result checking and comparison. All the data generat-
ed by this project software are similar to those generated by Microsoft EXCEL. The error is caused
by two factors. Firstly, different decimal places are chosen to display the result. Secondly, when the
decimal places of a variable in a formula differ, the final result will in turn be a bit different, in
which case error arises. The sub-chapter that follows is to elaborate on the detail checking and the
cause of the errors.
6.2 Detail Result Comparison
In this subchapter, detail results generated from this project software and EXCEL will be fully
compared.
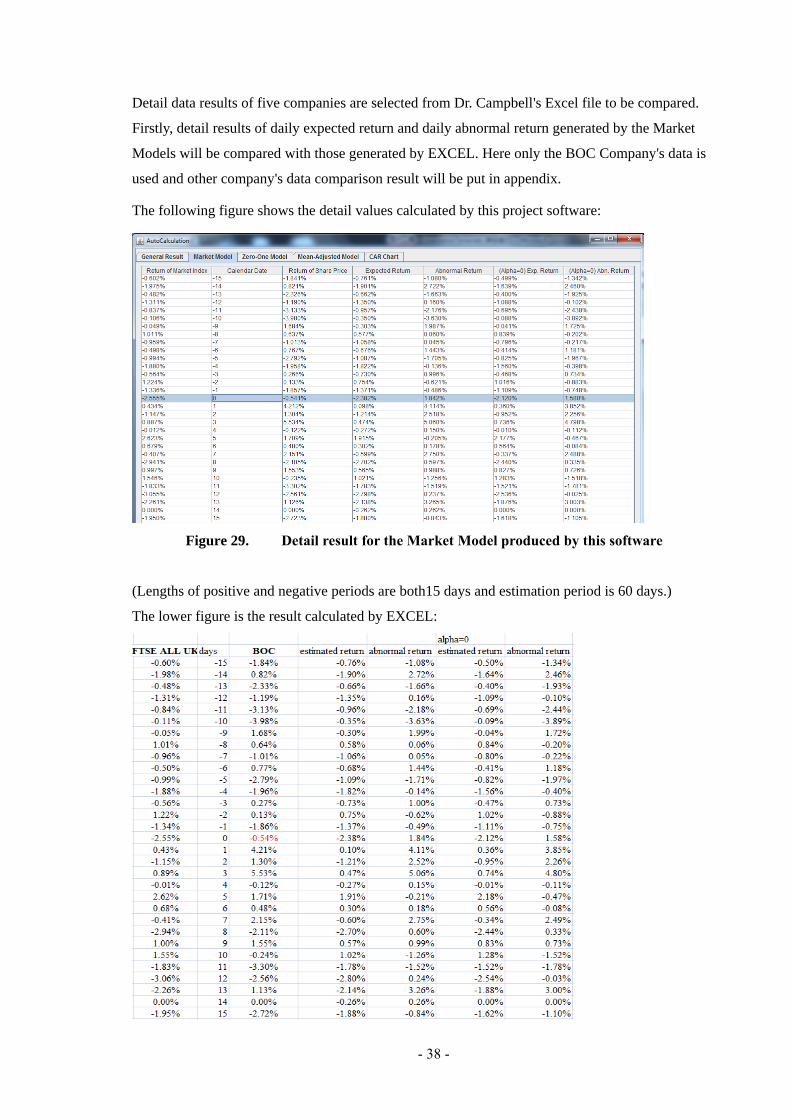
- 38 -
Detail data results of five companies are selected from Dr. Campbell's Excel file to be compared.
Firstly, detail results of daily expected return and daily abnormal return generated by the Market
Models will be compared with those generated by EXCEL. Here only the BOC Company's data is
used and other company's data comparison result will be put in appendix.
The following figure shows the detail values calculated by this project software:
Figure 29. Detail result for the Market Model produced by this software
(Lengths of positive and negative periods are both15 days and estimation period is 60 days.)
The lower figure is the result calculated by EXCEL:

- 39 -
Figure 30. Detail result for the Market Model produced by EXCEL
Most of the results are perfectly match and the very tiny error exists here is also due to the different
decimal places adopted and errors in Alpha and Beta. Calculations of both expected returns and
abnormal returns are fully based on the values of actual returns and the two parameter estimates.
This eliminates the question in the previous sub-chapter that the tiny errors in the two parameter
estimates Alpha and Beta are not caused by system miscalculating.
This software also provides two more ways of calculating detail daily expected return and abnor-
mal return, which are the Zero-more Model and the Mean-Adjusted Model.
The following figures also give comparisons with those data generated by EXCEL. Firstly, the Ze-
ro-One Model in this software:
Figure 31. Detail result for the Zero-One Model produced by this software
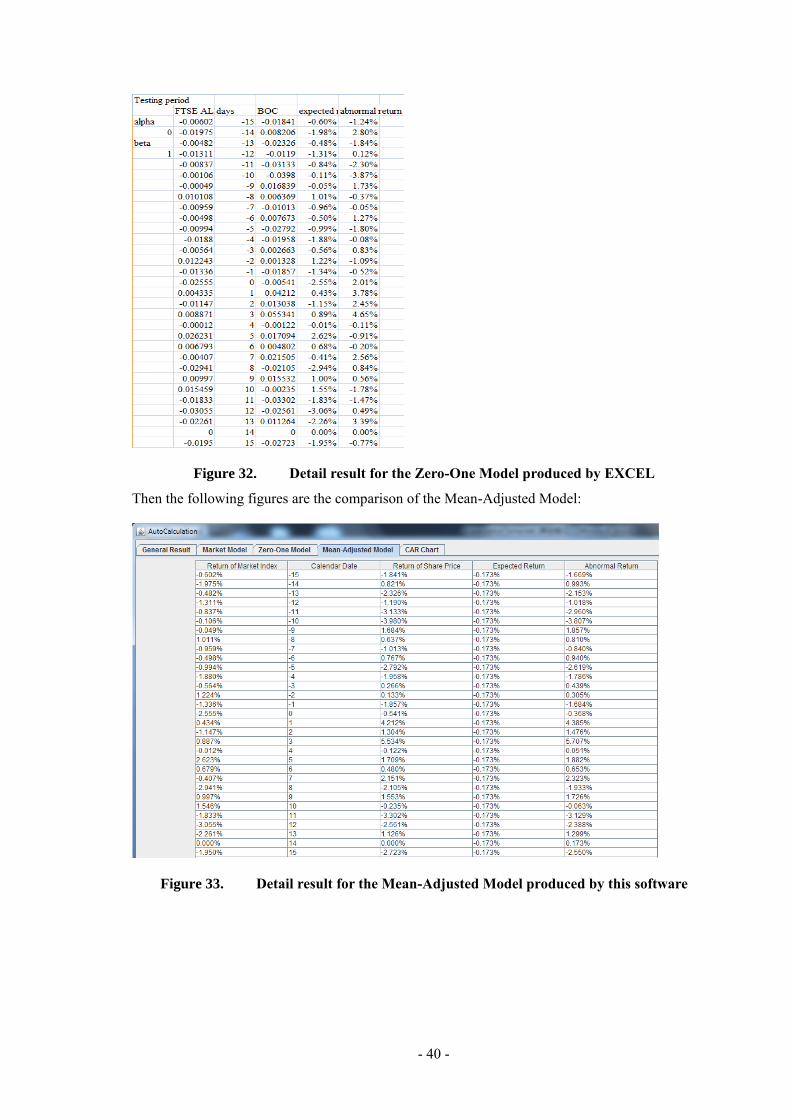
- 40 -
Figure 32. Detail result for the Zero-One Model produced by EXCEL
Then the following figures are the comparison of the Mean-Adjusted Model:
Figure 33. Detail result for the Mean-Adjusted Model produced by this software
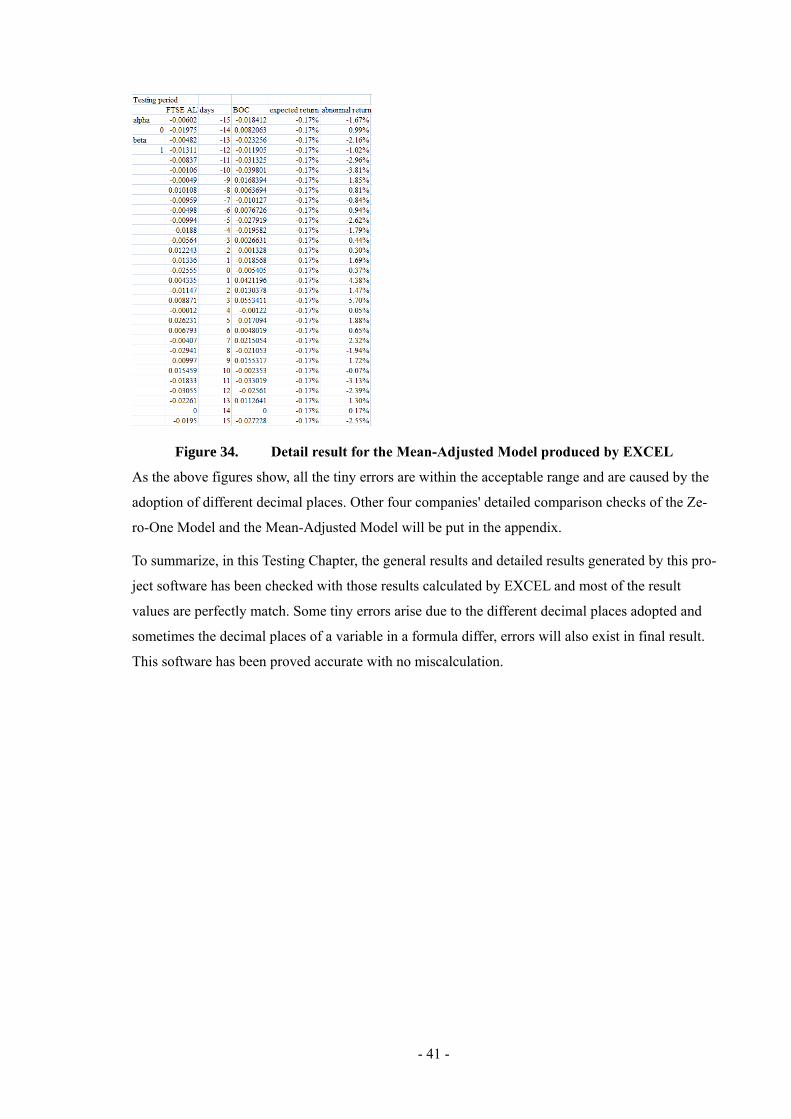
- 41 -
Figure 34. Detail result for the Mean-Adjusted Model produced by EXCEL
As the above figures show, all the tiny errors are within the acceptable range and are caused by the
adoption of different decimal places. Other four companies' detailed comparison checks of the Ze-
ro-One Model and the Mean-Adjusted Model will be put in the appendix.
To summarize, in this Testing Chapter, the general results and detailed results generated by this pro-
ject software has been checked with those results calculated by EXCEL and most of the result
values are perfectly match. Some tiny errors arise due to the different decimal places adopted and
sometimes the decimal places of a variable in a formula differ, errors will also exist in final result.
This software has been proved accurate with no miscalculation.

- 42 -
7 Conclusion
Event study is widely used recent years in finance. It is a method to evaluate the influence of an
event on the value of a firm. EXCEL is one option to conduct the required data analysis process,
but it takes much time and involves repetitions of copying and pasting. Both the use and the soft-
ware are error-prone under heavy workload. Also there are several other choices of paid
commercial software, but the user has to buy the membership and these types of software all have
very complicated interfaces and are not suitable for new user. The aim of this project software is to
generate a Java application in response to these problems and to automate the event study data
analysis process in order to offer convenience to the user. In addition to providing original price
files patterns and result graphic function, this software also gives accurate calculation of needed
data and successfully achieves its primary goals.
7.1 Evaluation
The evaluation is based on the achievements and user feedback of this MSc project software.
The advantage of this software is that it is an exclusive event study data generation software, which
provides the three most popular return generating models, namely the Market Model, the Zero-One
Model and the Mean-Adjusted Model. This package has been implemented by Java so that it is ob-
ject-oriented and platform independent. It has a user-friendly GUI and provides accurate results and
clear comparison together with the graphic functions. The designer of this project software, after
studying the way EXCEL and other commercial Software produce event study data analysis, takes
the perspective of both the designer and the customer and makes attempts to deliver an easy-to-use
program especially a user-friendly GUI.
According to the user feedbacks, there are two major drawbacks within this package. One is the
auto-data retrieving function is not implemented. The user thinks it will be much more user-
friendly if the data can be collected automatically by the software. The other is this package does
not have multiple data processing functions. It will also be of great help if this package can conduct
the data analysis of more than one company in the same run. User feedbacks will be put into ap-
pendix.
7.2 Future improvement
Besides the two major drawbacks illustrated in the previous sub-chapter, which are retrieving data
online and multiple data processing function, there are also small pitfalls that need to be improved
in the future. Tasks that need to be improved in the future are listed below:

- 43 -
Directly read EXCEL.csv files.
Ignore the last blank lines in the converted document TXT file.
Auto-manage the inconsistency of the time series of both share price file and market index file.
Catch error exceptions when the format of the values of the event date, days of posi-
tive/negative event period and days of estimation period inputted by the user does not meet the
system requirement.
Add user guide into the software interface for fast check.
7.3 Final Summary
With all efforts made during these three-month program-development phase, a piece of user-
friendly event study application has been developed successfully. Much experience gained on the
problem solving of this MSc project software. Both the ability of coding and Java programming has
been enhanced.
- 44 -
References
[1] Event Study, McWilliams and Siegel, 1997
http://en.wikipedia.org/wiki/Event_study
[2] Event Study, McWilliams and Siegel, 1997
http://en.wikipedia.org/wiki/Event_study
[3] Event Study Basic method, Ronald J. Gilson and Bernard S. Black 1995, 194-5
http://en.wikipedia.org/wiki/Event_study
[4] MacKinlay, A. C. "Event Studies in Economics and Finance," Journal of Economic Literature
Vol. XXXV, Issue 1, 1997).
http://www.jstor.org/pss/2729691
[5] Campbell R. Harvey, 2004
http://en.wikipedia.org/wiki/
[6] Farlex Financial Dictionary. © 2009 Farlex, Inc
http://financial-dictionary.thefreedictionary.com/Market+Model
[7] Linear regression, Wikipedia
http://en.wikipedia.org/wiki/Linear_regression
[8] Dissertation Presentation, Kevin Campbell, 2005
[9] Dissertation Presentation, Kevin Campbell, 2005
- 45 -
[10] Eventus Cowan Research LC, 2010
http://www.eventstudy.com/
[11] What's new in Eventus, 2010
http://www.eventstudy.com/
[12] What's new in Eventus, 2010
http://www.eventstudy.com/
[13] Class Diagram
http://en.wikipedia.org/wiki/Class_diagram

- 46 -
Bibliography
Java for Students, Douglas Bell & Mike Parr, fifth edition, 2006
Java in a Nutshell, David Flanagan, 4th Edition, 2002
Introduction to econometrics, Christopher Dougherty, Third Edition, 2002
Fibonacci Trader, Gary Scott Scullion, 2006
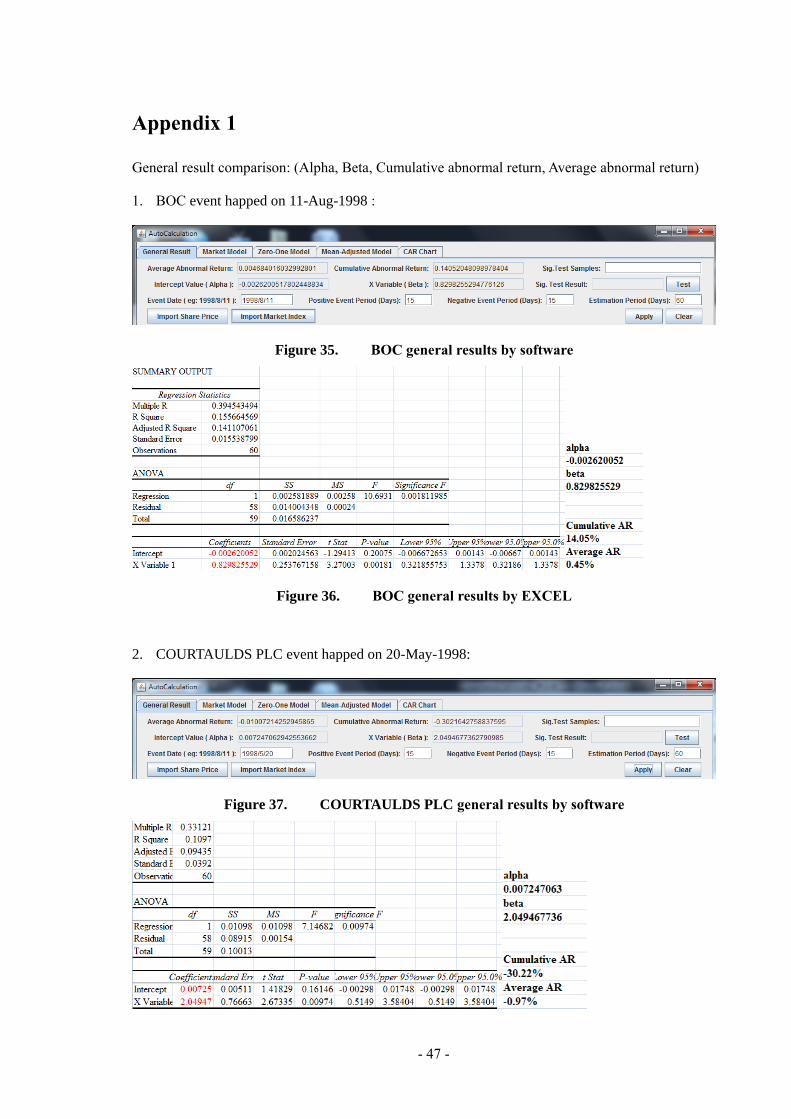
- 47 -
Appendix 1
General result comparison: (Alpha, Beta, Cumulative abnormal return, Average abnormal return)
1. BOC event happed on 11-Aug-1998 :
Figure 35. BOC general results by software
Figure 36. BOC general results by EXCEL
2. COURTAULDS PLC event happed on 20-May-1998:
Figure 37. COURTAULDS PLC general results by software
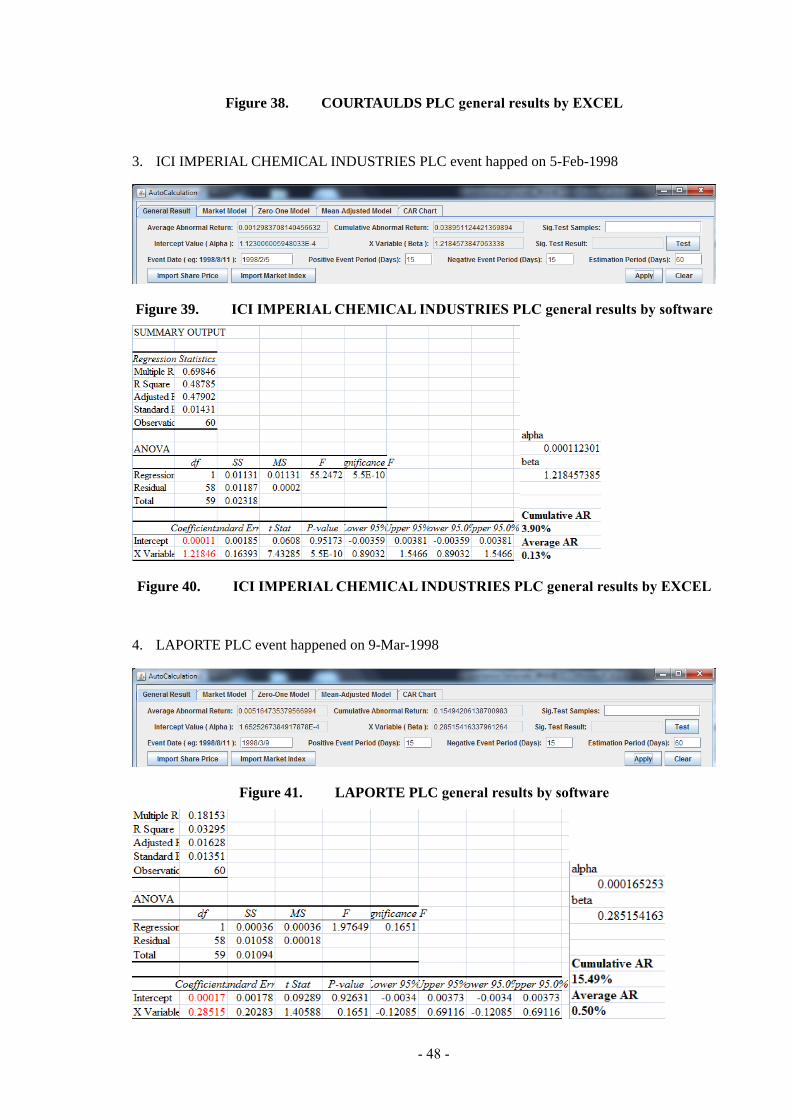
- 48 -
Figure 38. COURTAULDS PLC general results by EXCEL
3. ICI IMPERIAL CHEMICAL INDUSTRIES PLC event happed on 5-Feb-1998
Figure 39. ICI IMPERIAL CHEMICAL INDUSTRIES PLC general results by software
Figure 40. ICI IMPERIAL CHEMICAL INDUSTRIES PLC general results by EXCEL
4. LAPORTE PLC event happened on 9-Mar-1998
Figure 41. LAPORTE PLC general results by software
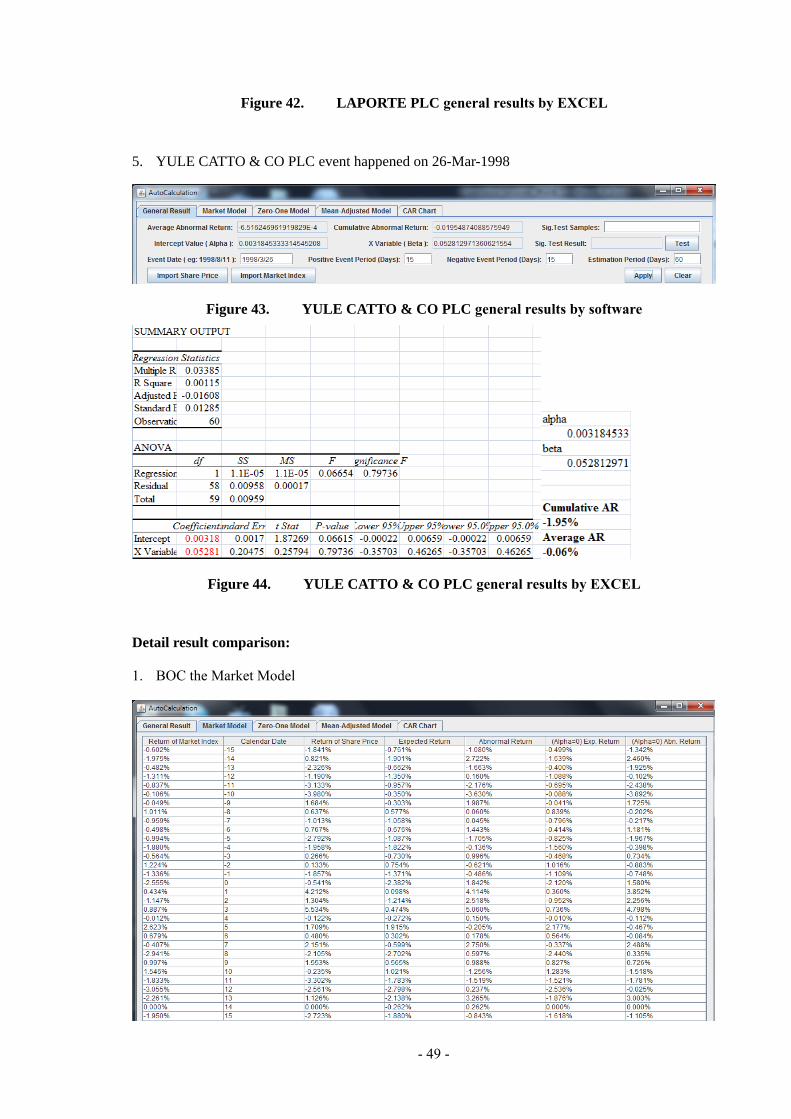
- 49 -
Figure 42. LAPORTE PLC general results by EXCEL
5. YULE CATTO & CO PLC event happened on 26-Mar-1998
Figure 43. YULE CATTO & CO PLC general results by software
Figure 44. YULE CATTO & CO PLC general results by EXCEL
Detail result comparison:
1. BOC the Market Model
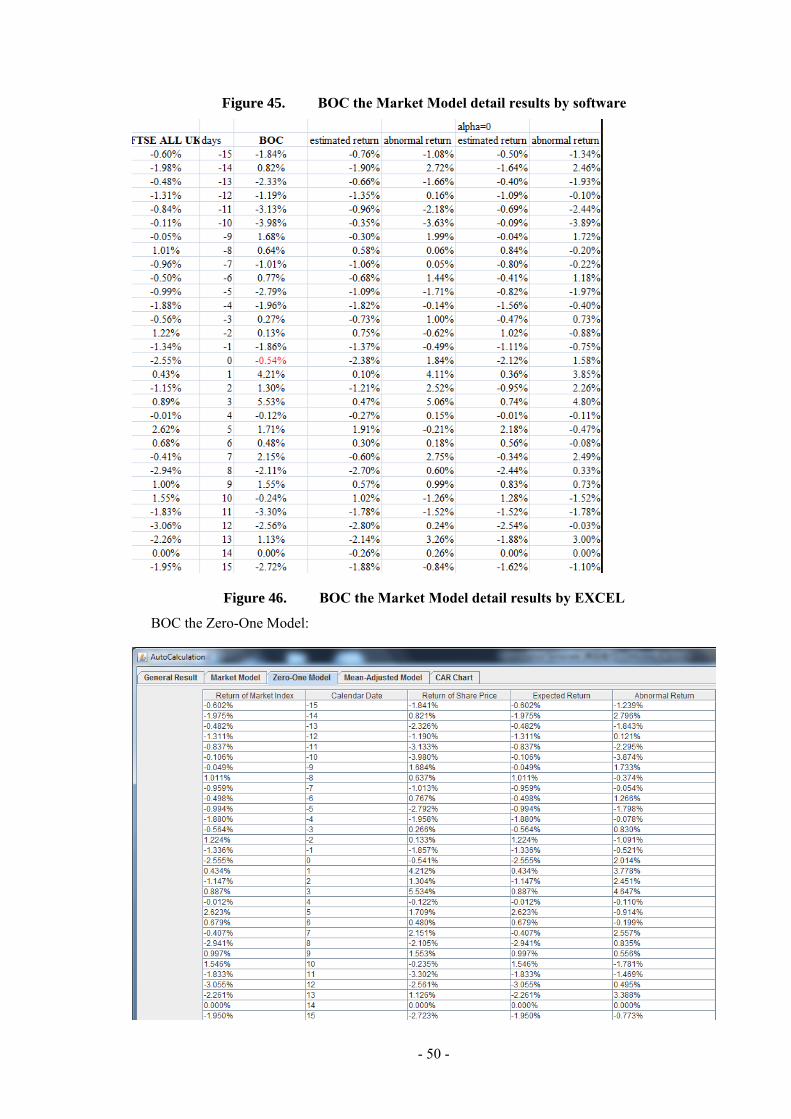
- 50 -
Figure 45. BOC the Market Model detail results by software
Figure 46. BOC the Market Model detail results by EXCEL
BOC the Zero-One Model:
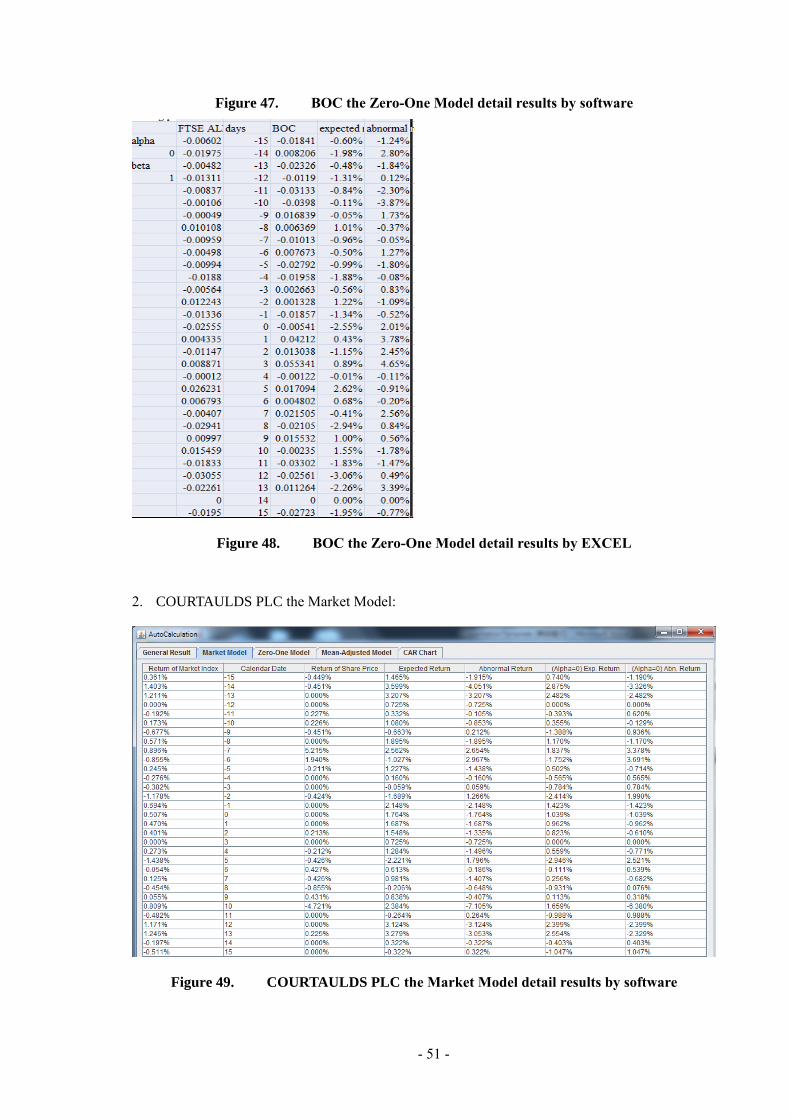
- 51 -
Figure 47. BOC the Zero-One Model detail results by software
Figure 48. BOC the Zero-One Model detail results by EXCEL
2. COURTAULDS PLC the Market Model:
Figure 49. COURTAULDS PLC the Market Model detail results by software

- 52 -
Figure 50. COURTAULDS PLC the Market Model detail results by EXCEL
COURTAULDS PLC the Zero-One Model:
Figure 51. COURTAULDS PLC the Zero-One Model detail results by software

- 53 -
Figure 52. COURTAULDS PLC the Zero-One Model detail results by EXCEL
3. ICI IMPERIAL CHEMICAL INDUSTRIES PLC the Market Model:
Figure 53. ICI IMPERIAL CHEMICAL INDUSTRIES PLC the Market Model detail
results by software

- 54 -
Figure 54. ICI IMPERIAL CHEMICAL INDUSTRIES PLC the Market Model detail
results by EXCEL
ICI IMPERIAL CHEMICAL INDUSTRIES PLC the Zero-One Model:
Figure 55. ICI IMPERIAL CHEMICAL INDUSTRIES PLC the Zero-One Model detail
results by software

- 55 -
Figure 56. ICI IMPERIAL CHEMICAL INDUSTRIES PLC the Zero-One Model detail
results by EXCEL
4. LAPORTE PLC the Market Model:

- 56 -
Figure 57. LAPORTE PLC the Market Model detail results by software
Figure 58. LAPORTE PLC the Market Model detail results by EXCEL
LAPORTE PLC the Zero-One Model:
Figure 59. LAPORTE PLC the Zero-One Model detail results by software
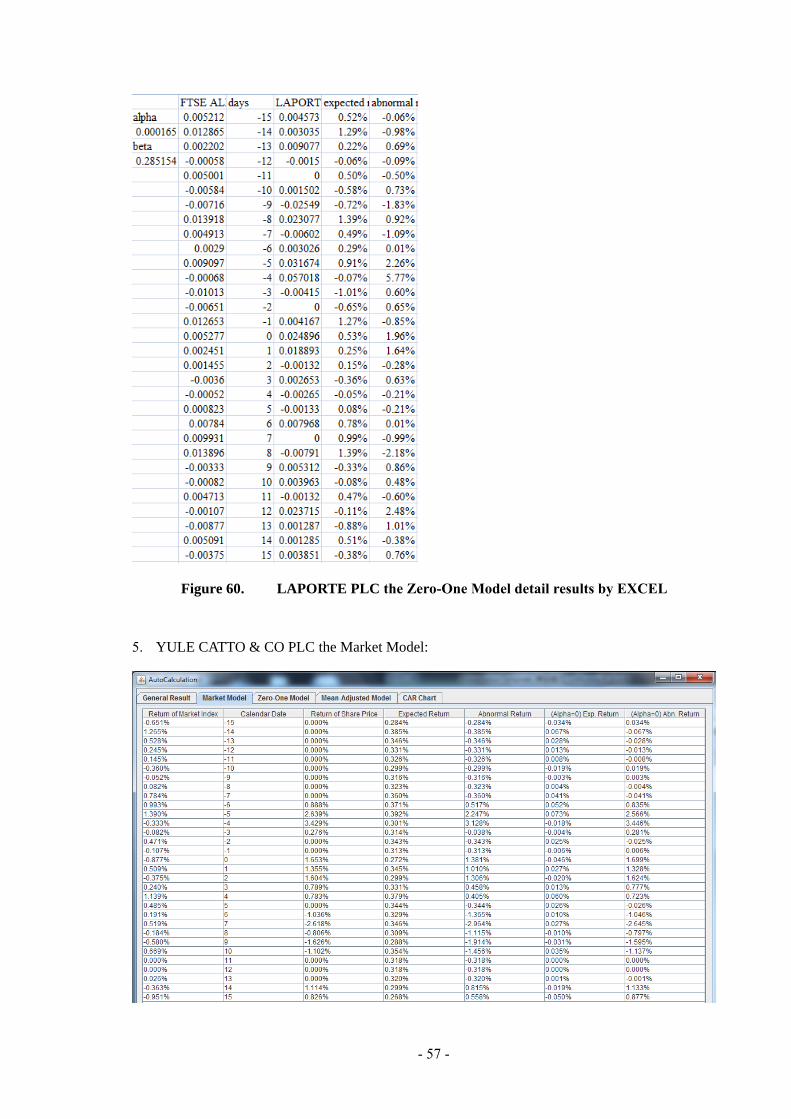
- 57 -
Figure 60. LAPORTE PLC the Zero-One Model detail results by EXCEL
5. YULE CATTO & CO PLC the Market Model:

- 58 -
Figure 61. YULE CATTO & CO PLC the Market Model detail results by software
Figure 62. YULE CATTO & CO PLC the Market Model detail results by EXCEL
YULE CATTO & CO PLC the Zero-One Model:
Figure 63. YULE CATTO & CO PLC the Zero-One Model detail results by software
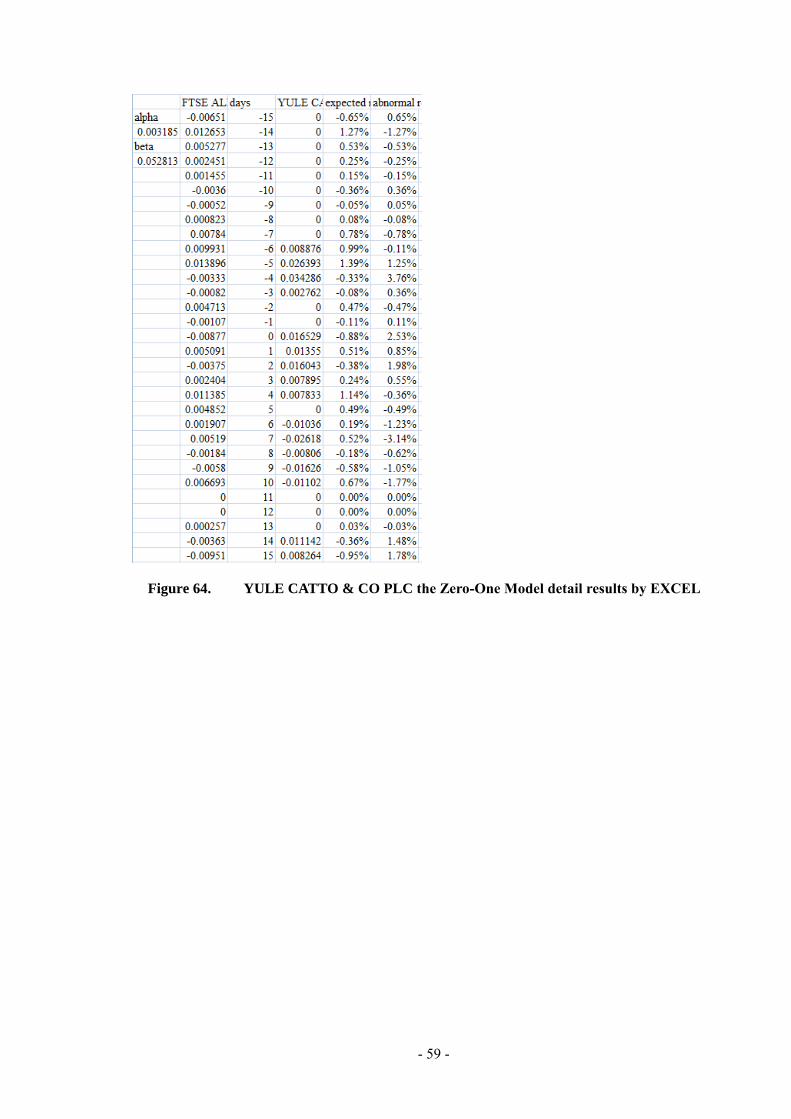
- 59 -
Figure 64. YULE CATTO & CO PLC the Zero-One Model detail results by EXCEL
- 60 -
Appendix 2 – User guide
Introduction
AutoCalculation is an Event-Study data processing tool which incorporates three models for cal-
culating the abnormal return. The software, with an aim to provide a user-friendly GUI, attaches
charts to display the share price, the market index as well as the cumulative abnormal returns gen-
erated based on three different models, namely Market Model, Zero-One Model and Mean-
Adjusted Model.
Interface
The interface of the software consists of five tabbed panel, each of which performs different func-
tions. By simply clicking the tab, you can switch from one panel to another to view different
results.
The first panel, entitled 'General Result', is divided into three parts, with the upper part for dis-
playing results and imputing data, the middle part used for buttons and the lower part allocated for
displaying the share price and the market price.
The second, third and fourth panels display tables of detailed even-period data calculated with the
corresponding model stated in the tab, namely Market Model, Zero-One Model or Mean-Adjusted
Model. It should be noted that these three panels contain no data when you initially use the soft-
ware.
The fifth panel, CAR Chart, show the cumulative abnormal returns generated with three different
models during the event period.
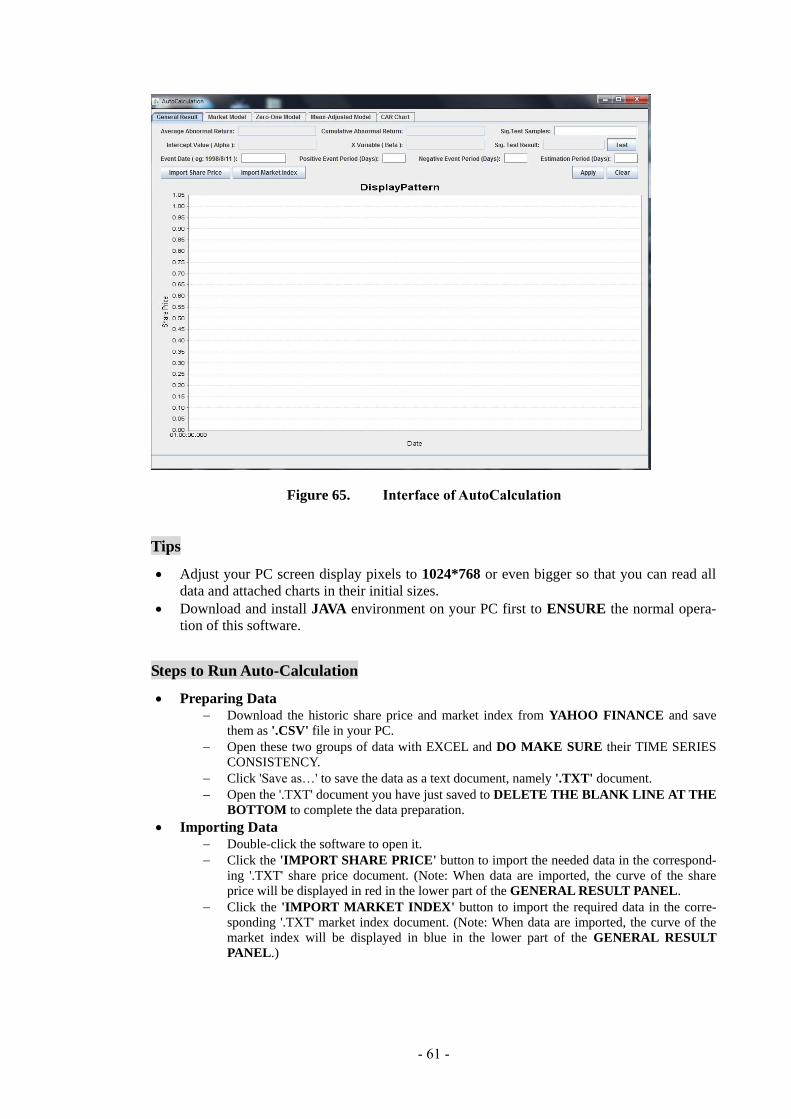
- 61 -
Figure 65. Interface of AutoCalculation
Tips
Adjust your PC screen display pixels to 1024*768 or even bigger so that you can read all
data and attached charts in their initial sizes.
Download and install JAVA environment on your PC first to ENSURE the normal opera-
tion of this software.
Steps to Run Auto-Calculation
Preparing Data
Download the historic share price and market index from YAHOO FINANCE and save
them as '.CSV' file in your PC.
Open these two groups of data with EXCEL and DO MAKE SURE their TIME SERIES
CONSISTENCY.
Click 'Save as…' to save the data as a text document, namely '.TXT' document.
Open the '.TXT' document you have just saved to DELETE THE BLANK LINE AT THE
BOTTOM to complete the data preparation.
Importing Data
Double-click the software to open it.
Click the 'IMPORT SHARE PRICE' button to import the needed data in the correspond-
ing '.TXT' share price document. (Note: When data are imported, the curve of the share
price will be displayed in red in the lower part of the GENERAL RESULT PANEL.
Click the 'IMPORT MARKET INDEX' button to import the required data in the corre-
sponding '.TXT' market index document. (Note: When data are imported, the curve of the
market index will be displayed in blue in the lower part of the GENERAL RESULT
PANEL.)
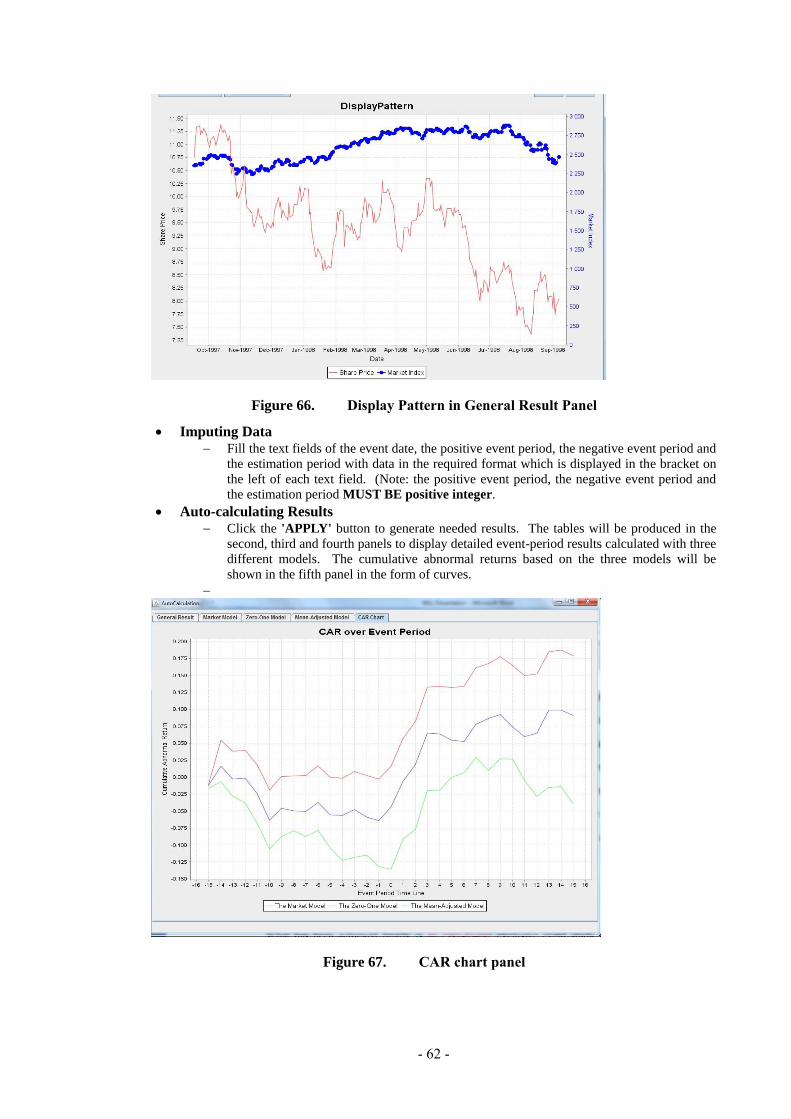
- 62 -
Figure 66. Display Pattern in General Result Panel
Imputing Data
Fill the text fields of the event date, the positive event period, the negative event period and
the estimation period with data in the required format which is displayed in the bracket on
the left of each text field. (Note: the positive event period, the negative event period and
the estimation period MUST BE positive integer.
Auto-calculating Results
Click the 'APPLY' button to generate needed results. The tables will be produced in the
second, third and fourth panels to display detailed event-period results calculated with three
different models. The cumulative abnormal returns based on the three models will be
shown in the fifth panel in the form of curves.
Figure 67. CAR chart panel

- 63 -
The significance test components are included the General Result Panel. Type the required
testing samples into the given text fields separate each sample by a ',' (comma). Click the
'TEST' button to generate the significance, which will then be displayed in the lower test field.
If you would like to know results of different event of a company, change the event date and
the estimation period in the GENERAL RESULT PANEL and click the 'APPLY' button to re-
place the previous results. This change also applies to significance test.
If you would like to conduct another Event Study, just click the 'CLEAR' button to refresh all
the interfaces to be ready for new data.

- 64 -
Questionnaire and potential user trial report
This project software has been sent to four different potential users for trial reports. One comes
from Advanced Computing students, one comes from Banking and Finance students, one comes
from Investment Analysis students and one comes from Financial PHD students.
Most of them have a good impression on the User Interface and think this software is user-friendly
and very easy to be used. All of them approve the result data is accurate after their trial.
Pitfalls and further improvements are included below:
Strong needs for processing multiple events within the same run.
It would be better if this software can retrieve data automatically online.
It also would be better if this software can directly read the CSV file downloaded from website.
Store or output the data result function also needs to be implemented.