Embed Size (px)
Citation preview
Electric Power Systems
– An Overview
Y. Baghzouz
Professor of Electrical Engineering
University of Nevada, Las Vegas

Overview
Power Generation
Conventional and renewable power generation
Power transmission & Distribution
Cables and other transmission & distribution system equipment
Power Utilization
Demand curves, load characteristics
Power System Analysis
Power flow, fault currents, economic dispatch.

Basic Power System Layout
Conventional (non-renewable)
primary energy source

World Electricity Generation by
Source (2014)
Source: US Energy Information Administration (EIA)
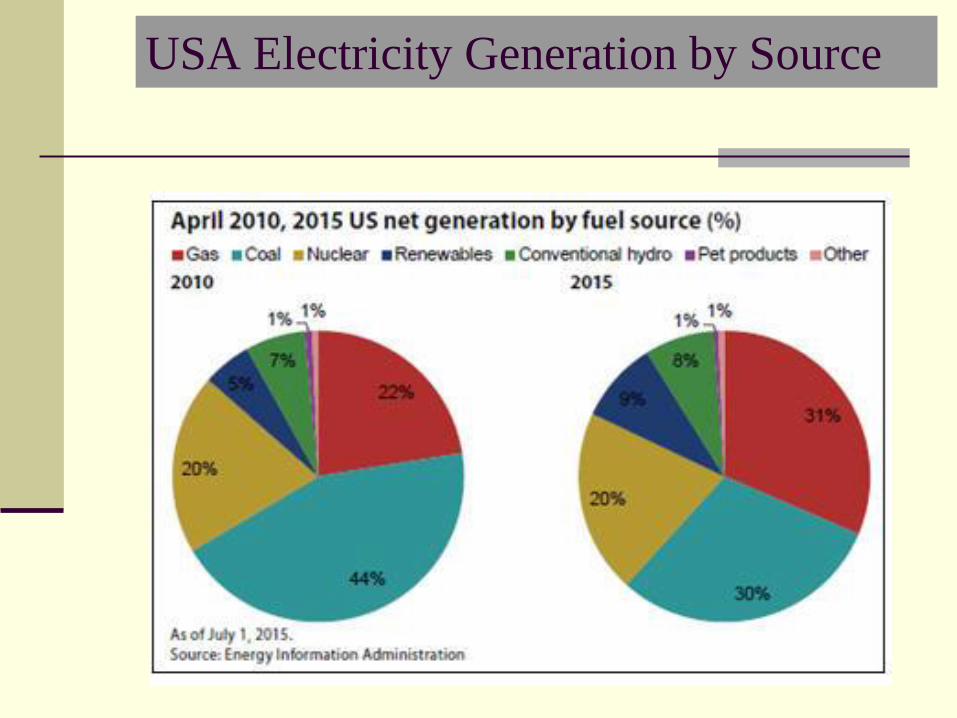
USA Electricity Generation by Source
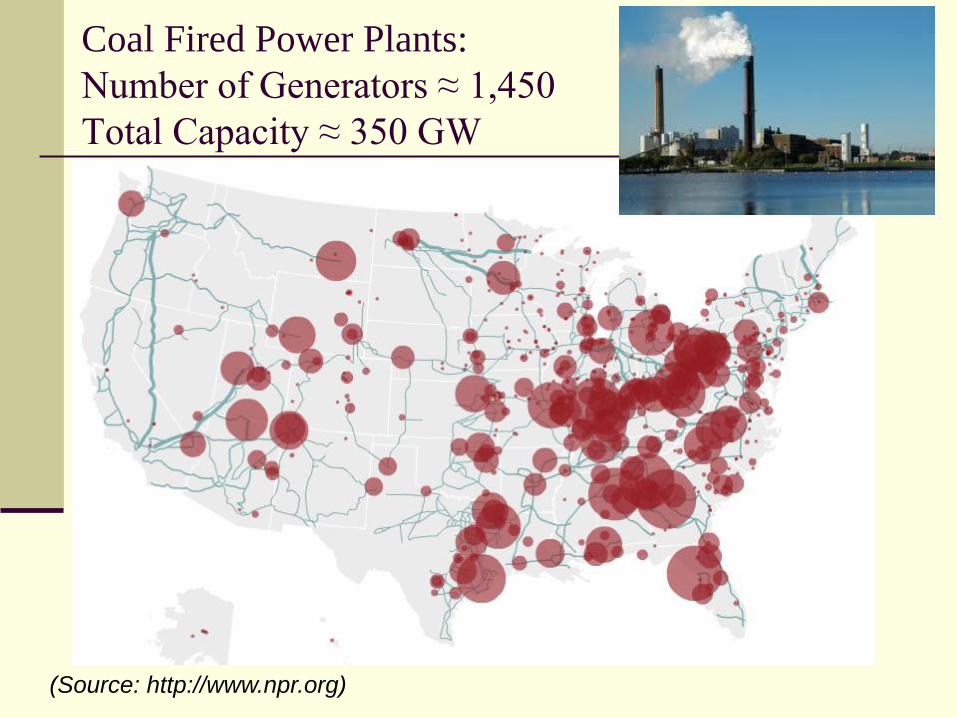
Coal Fired Power Plants:
Number of Generators ≈ 1,450
Total Capacity ≈ 350 GW
(Source: http://www.npr.org)

Diagram of a modern coal power plant
(Source: Masters, Renewable and Efficient Electric Power Systems, 2004)

Steam Turbines and their Governors
Steam turbines can have non-reheat, single-reheat or double-reheat.
The steam flow is controlled by the governor.
Main and reheat stop valves are normally fully open - they are used only during generator start-up and shut down.

The electric generator
Governor controls turbine torque and power
Exciter controls voltage and reactive power

Nuclear Power Plants:
Number of Generators ≈ 100
Total Capacity ≈ 100 GW
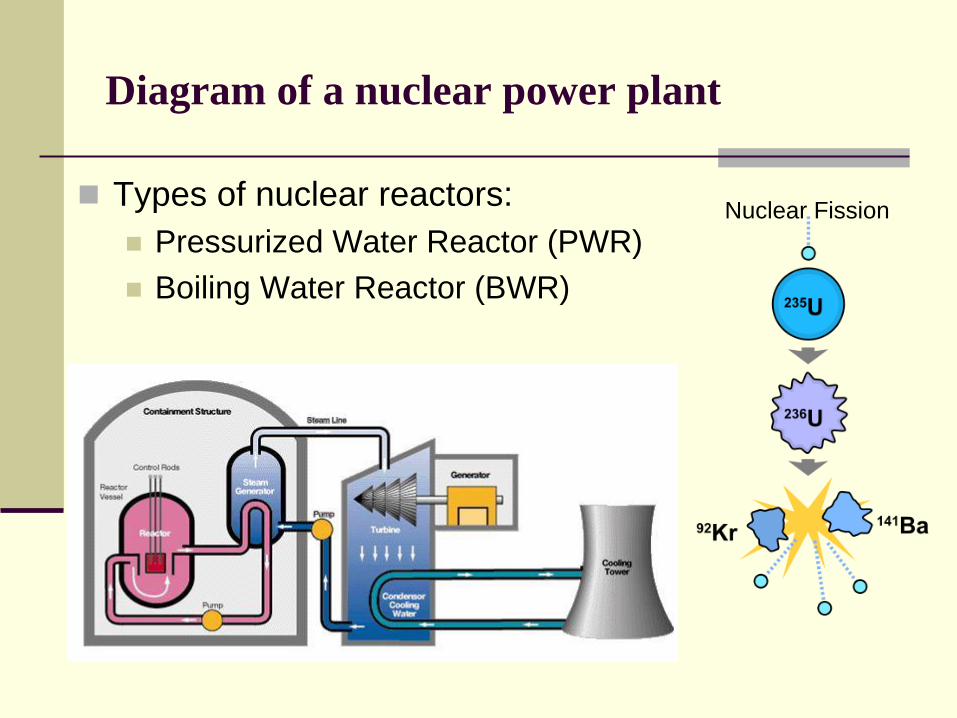
Diagram of a nuclear power plant
Types of nuclear reactors:
Pressurized Water Reactor (PWR)
Boiling Water Reactor (BWR)
Nuclear Fission

Natural Gas Power Plants:
Number of Generators ≈ 5,500
Total Capacity ≈ 450 GW
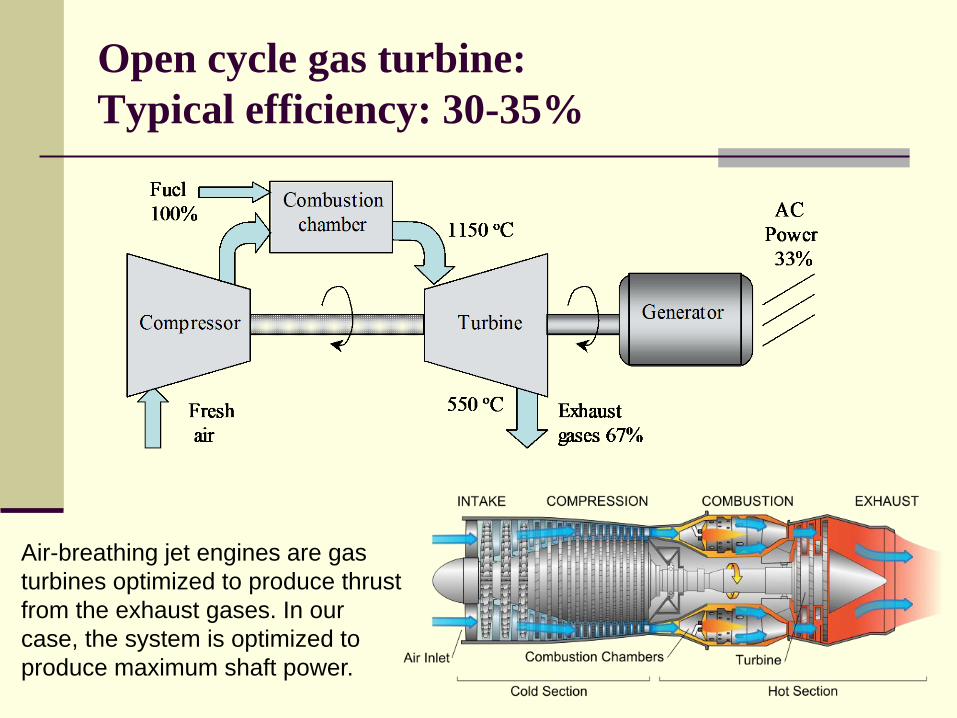
Open cycle gas turbine:
Typical efficiency: 30-35%
Air-breathing jet engines are gas
turbines optimized to produce thrust
from the exhaust gases. In our
case, the system is optimized to
produce maximum shaft power.

Combined cycle power plant:
Typical efficiency: 60-65%
Efficiencies are even higher when the steam is used for district heating
or industrial processes.
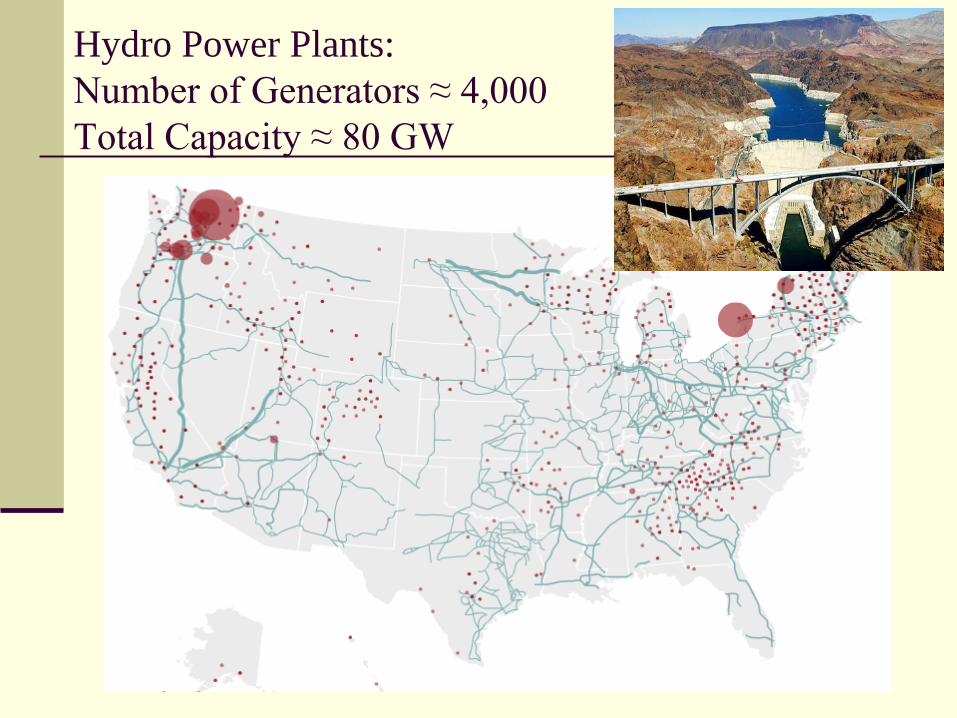
Hydro Power Plants:
Number of Generators ≈ 4,000
Total Capacity ≈ 80 GW
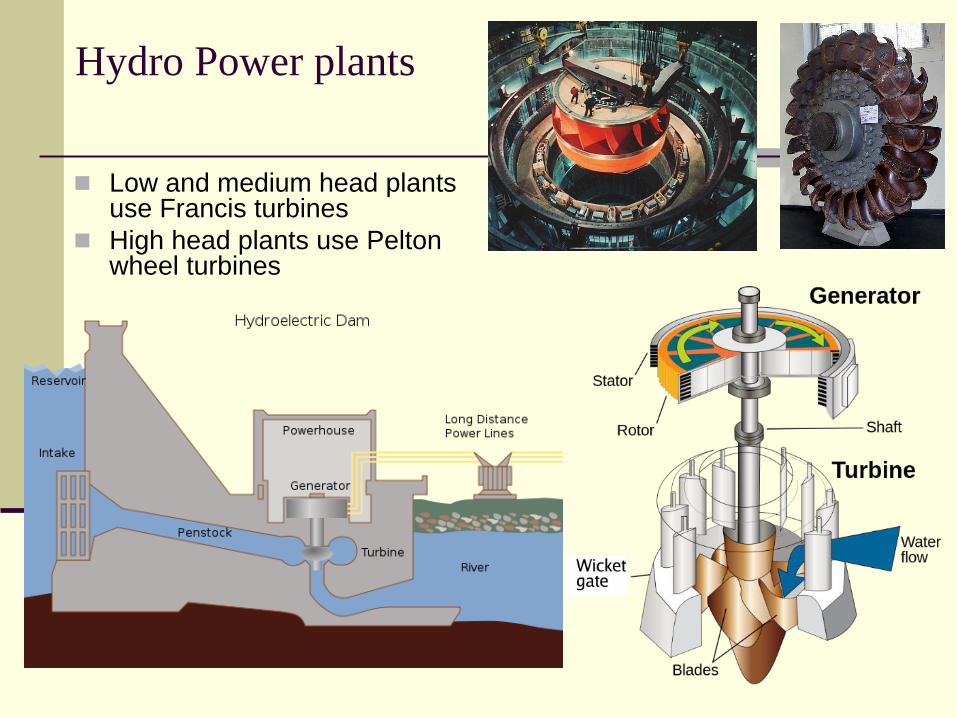
Hydro Power plants
Low and medium head plants use Francis turbines
High head plants use Pelton wheel turbines

Hydropower relies on the water
cycle. Herein:
Solar energy heats water on
the surface, causing it to
evaporate.
This water vapor condenses
into clouds and falls back onto
the surface as precipitation
(rain, snow, etc.).
The water flows through rivers
back into the oceans, where it
can evaporate and begin the
cycle over again
Hydropower is renewable

Renewable Resources
GEO-
THERMAL
HYDRO
Earth Derived
Energy

States with Renewable Portfolio Standards
Source: NREL

Renewable Resources
GEO-
THERMAL
HYDRO
Earth Derived
Energy

Growth in Solar Photovoltaics

Solar Resource (available worldwide)

Largest PV Systems in CA – over 500 MW

Large Solar PV plants in Nevada

Mid-Size and small PV Plants in Nevada
50 MW (Prim)
30 MW (1-axis tracking @ NAFB)
Numerous distributed PV systems (few kW – 500 kW)
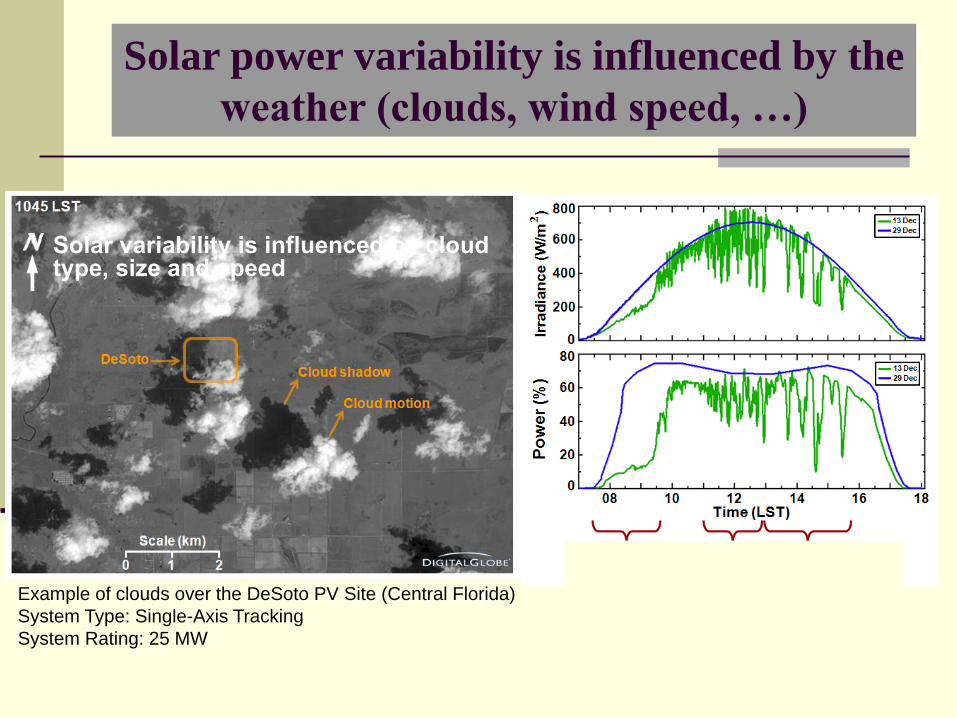
Example of clouds over the DeSoto PV Site (Central Florida)
System Type: Single-Axis Tracking
System Rating: 25 MW
Solar variability is influenced by cloud type, size and speed
Solar power variability is influenced by the
weather (clouds, wind speed, …)

PV Power variability of local 15 MW plant
Due to lack of inertia, PV power can change rapidly
under cloudy skies, many times per day!
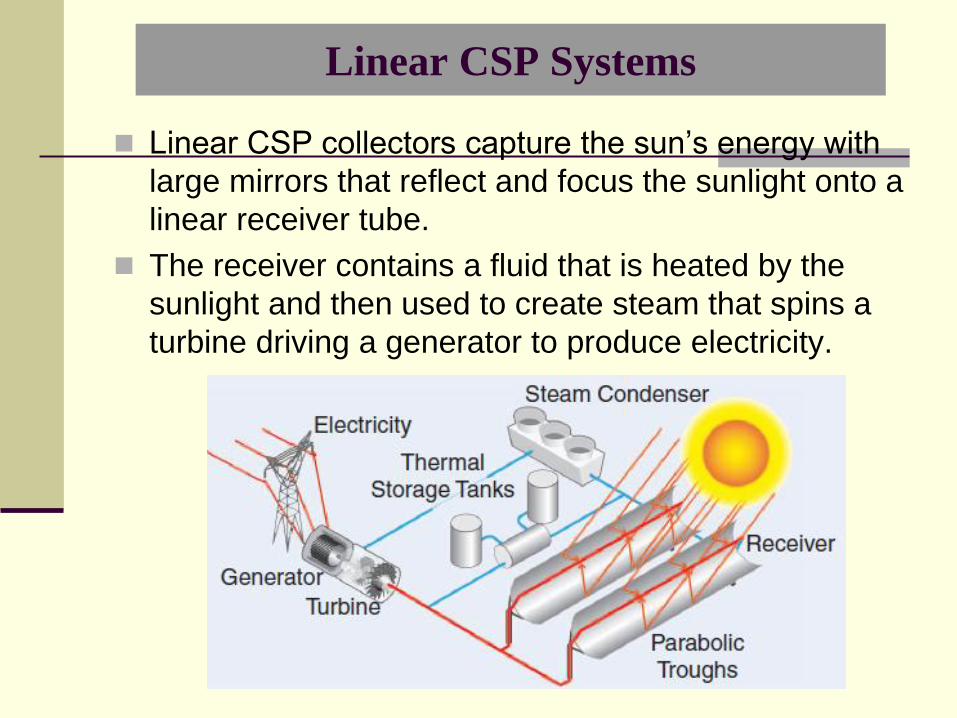
Linear CSP Systems
Linear CSP collectors capture the sun’s energy with
large mirrors that reflect and focus the sunlight onto a
linear receiver tube.
The receiver contains a fluid that is heated by the
sunlight and then used to create steam that spins a
turbine driving a generator to produce electricity.

Linear CSP in Nevada: NV Solar I (65 MW)

Power Tower CSP Systems
Sun-tracking mirrors (heliostats) focus sunlight onto a
receiver at the top of a tower. A heat-transfer fluid heated
in the receiver is used to generate steam, which in turn is
used by turbine generator to produce electricity.
Some power towers use water/steam as the heat transfer
fluid. Other advanced designs are experimenting with
molten nitrate salt because of its superior heat-transfer
capabilities.

Power Tower CSP in Nevada:
Tonopah – 110 MW

World’s largest - Ivanpah Solar, CA: 350 MW

Energy can be extracted from the power of the waves, from the tide, or from ocean currents – limited success.
Ocean Power
Point absorber Oscillating column
Tidal power Ocean current
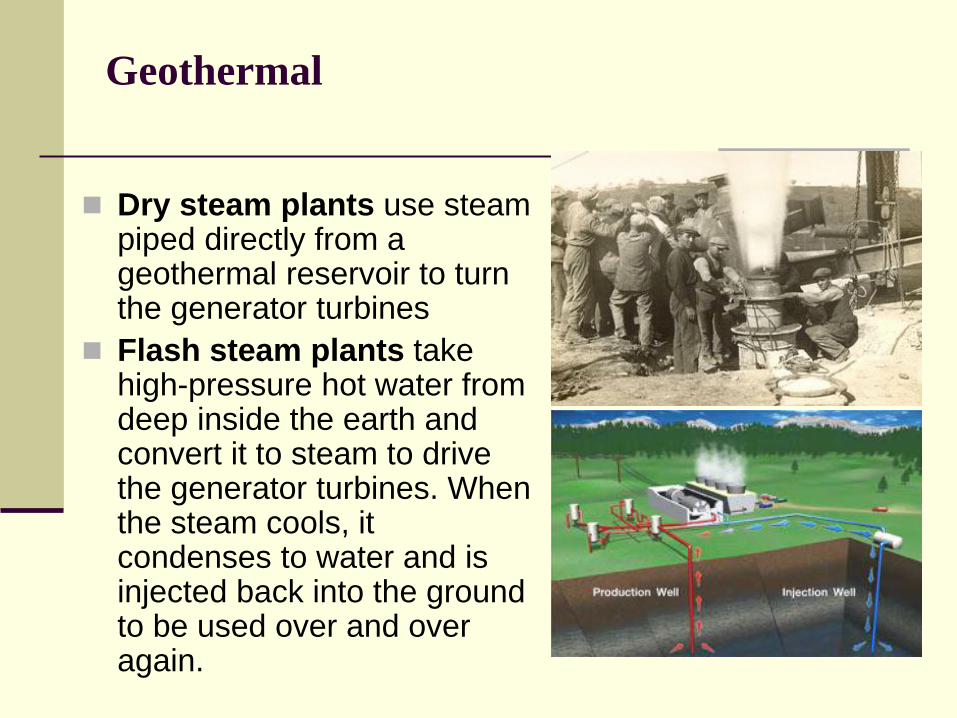
Dry steam plants use steam piped directly from a geothermal reservoir to turn the generator turbines
Flash steam plants take high-pressure hot water from deep inside the earth and convert it to steam to drive the generator turbines. When the steam cools, it condenses to water and is injected back into the ground to be used over and over again.
Geothermal


NV Geothermal Current Capacity: 385 MW
Source: NV Energy Website
• Geothermal power is controllable
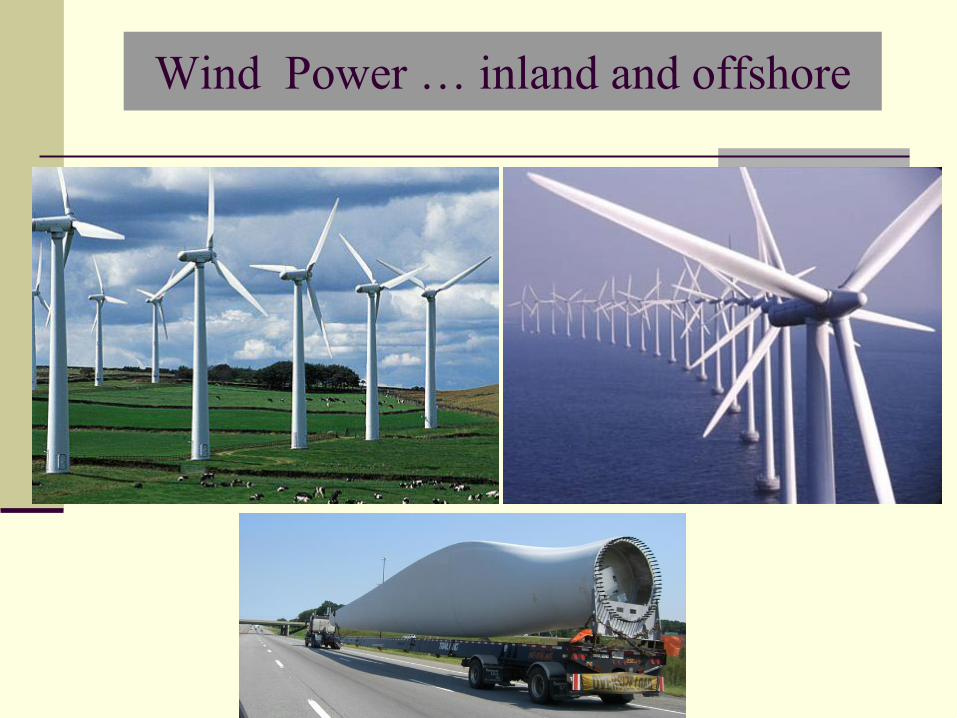
Wind Power … inland and offshore
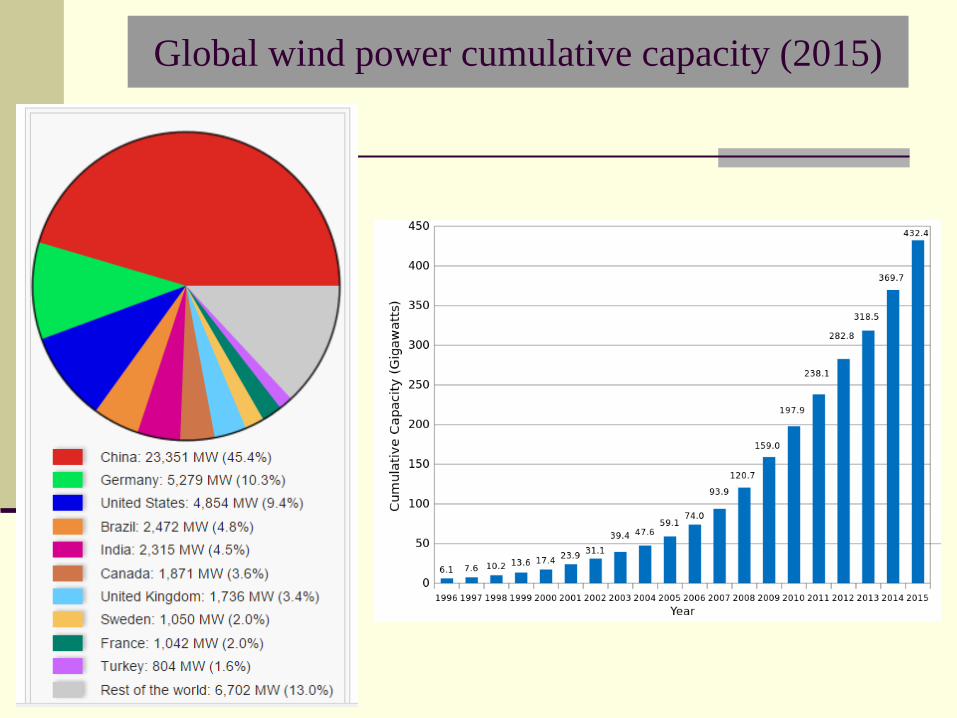
Global wind power cumulative capacity (2015)

US Wind Resource Map
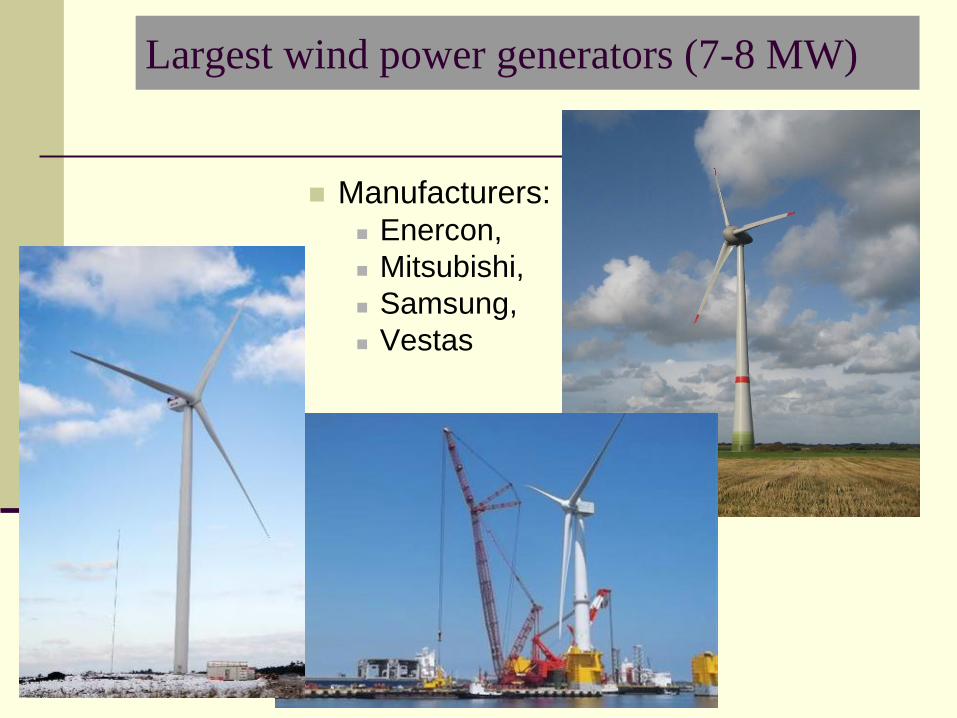
Largest wind power generators (7-8 MW)
Manufacturers: Enercon,
Mitsubishi,
Samsung,
Vestas

California wind farm: Tihachapi - 4,500 MW

Wind Power in Nevada: Spring Valley (Pine County): 150 MW

Variability and Uncertainty of Wind Power
Like solar resources, wind power can be highly variable
due to sudden changes in wind speed, and uncertain as
timing of this variable generation is less predictable.
Source: NREL

Renewable Plants
in Nevada
Geothermal: 550 MW
Solar: 750 MW (large)
Solar rooftops: 250 MW
Hydro: 250 MW (including HD)
Other: 30 MW
----------
Total: 1.83 GW
Peak Load: 7.3 GW
Source: NV Energy website

Nevada fossil fuel
power plants
Natural Gas: 5.8 GW
Coal: 0.75 GW
-------
Total Capacity: 6.55
GW
Peak Load: 7.3 GW

US Map of Various Sources of
Power Generation
http://www.eia.gov/state/maps.cfm

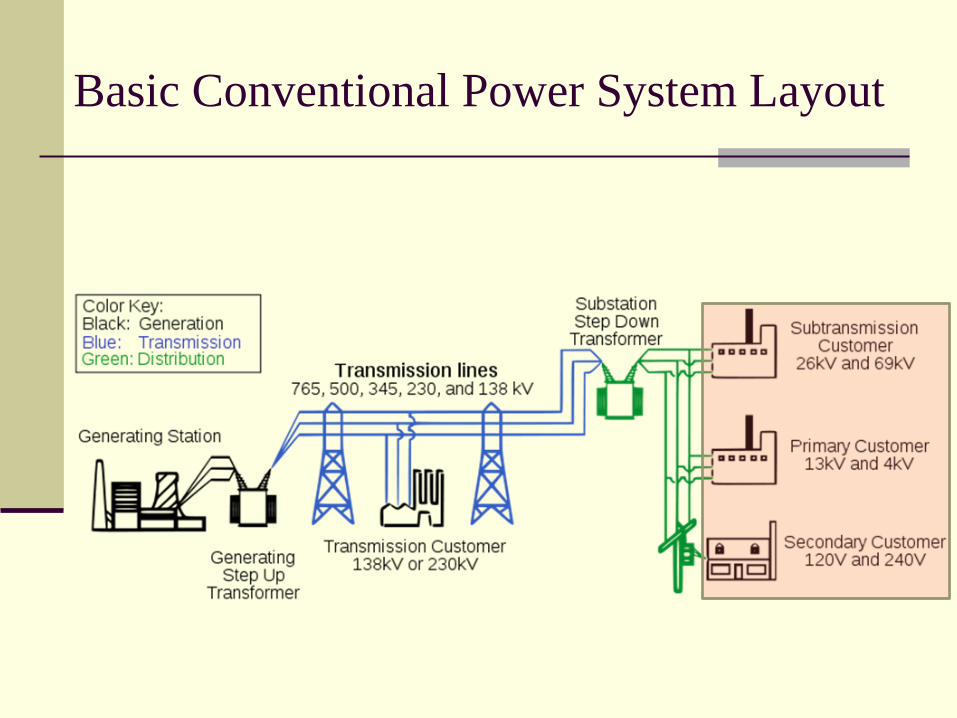
Basic Conventional Power System Layout

Step-up (Station) transformers:
Size up to 1000 MVA
generator voltage up to 25 kV
Transmission voltage up to 765 kV
Forced Air and Forced Oil Cooling.

Basic Conventional Power System Layout

US Power Transmission Grid
Video of “One Nevada” Power Line
http://www.myrgroup.com/electrical-
construction-projects/one-nevada-500kv-
transmission-line-on-line-project-southwest-
intertie-project-swip/
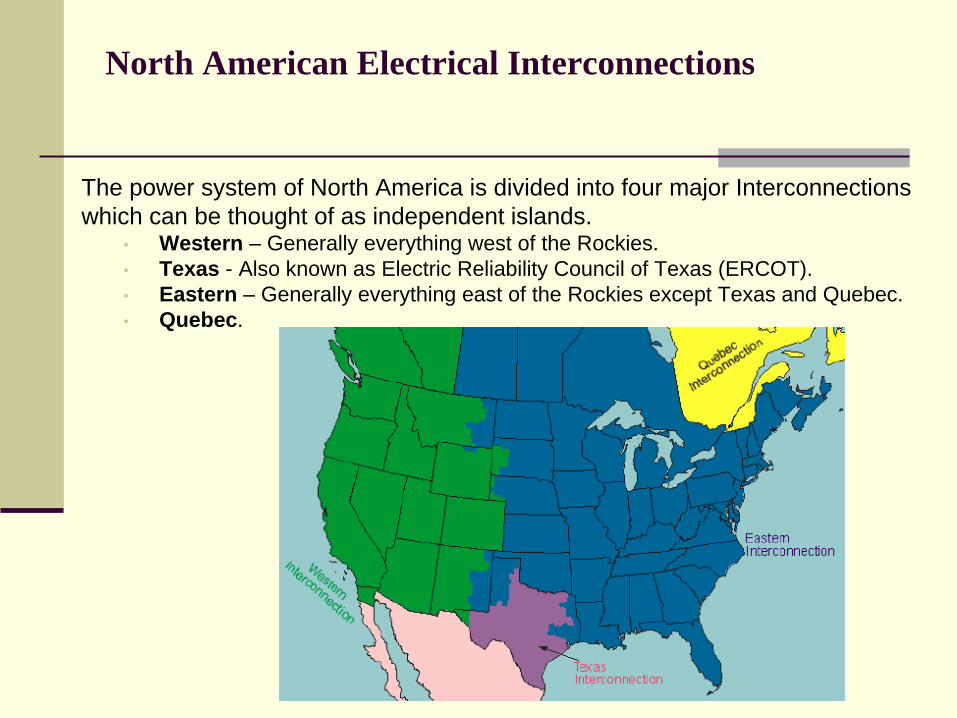
North American Electrical Interconnections
The power system of North America is divided into four major Interconnections
which can be thought of as independent islands. • Western – Generally everything west of the Rockies.
• Texas - Also known as Electric Reliability Council of Texas (ERCOT).
• Eastern – Generally everything east of the Rockies except Texas and Quebec.
• Quebec.
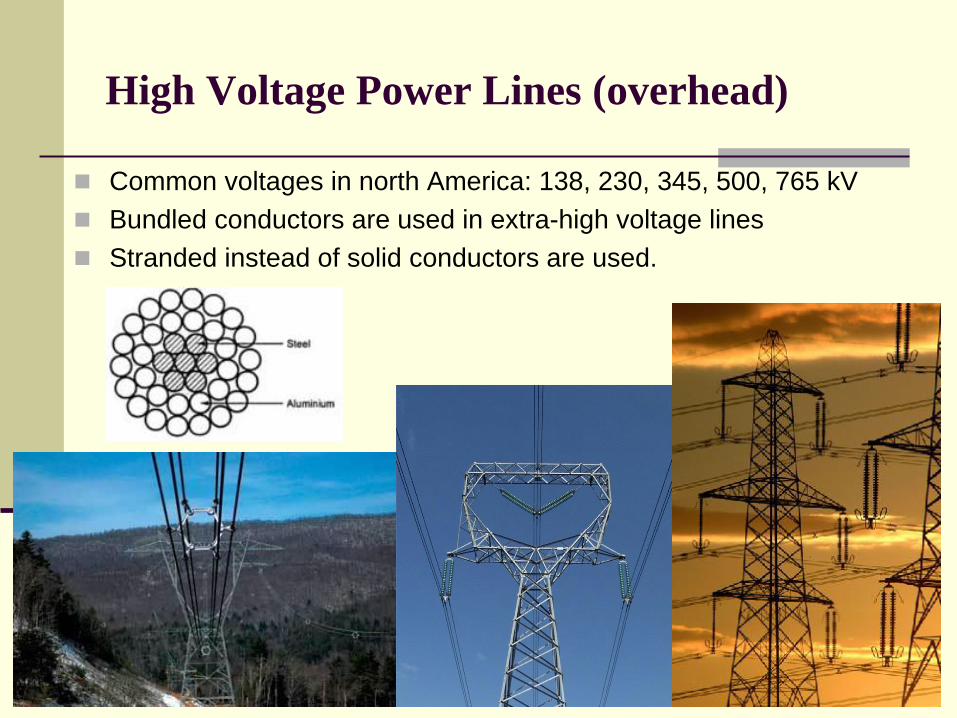
High Voltage Power Lines (overhead)
Common voltages in north America: 138, 230, 345, 500, 765 kV
Bundled conductors are used in extra-high voltage lines
Stranded instead of solid conductors are used.

Cable lines are designed to be placed underground in
urban areas or under water. The conductors are insulated
from one another and surrounded by protective sheath.
Cable lines are more expensive and harder to maintain.
They also have a large capacitance – not suitable for long
distance.
High Voltage Power Cables (underground)

Tree Trimming underneath power lines
Before
After
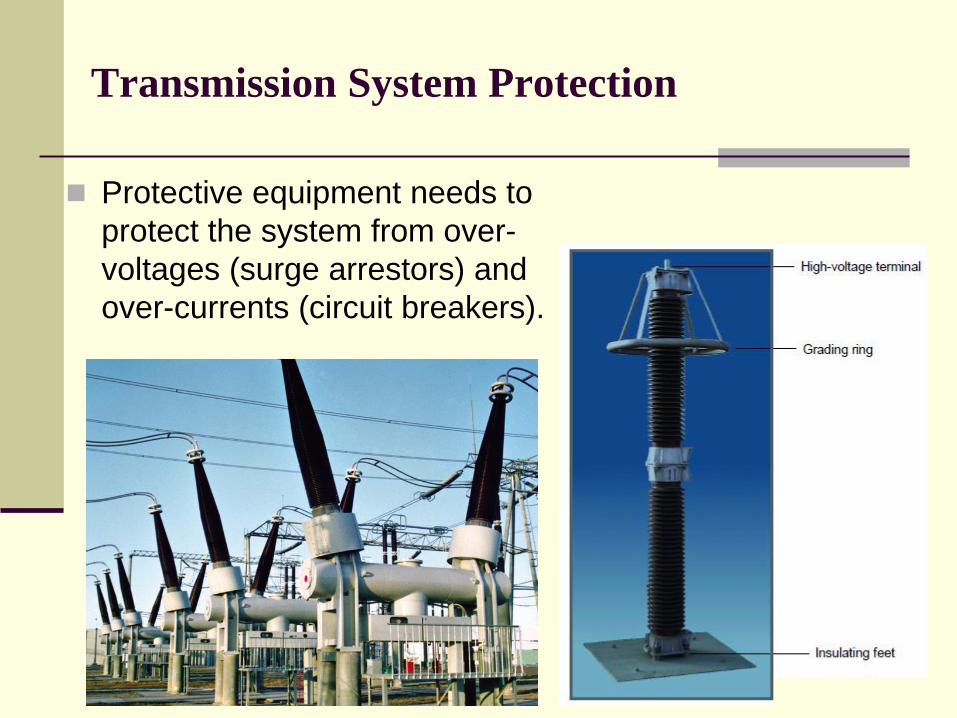
Transmission System Protection
Protective equipment needs to
protect the system from over-
voltages (surge arrestors) and
over-currents (circuit breakers).
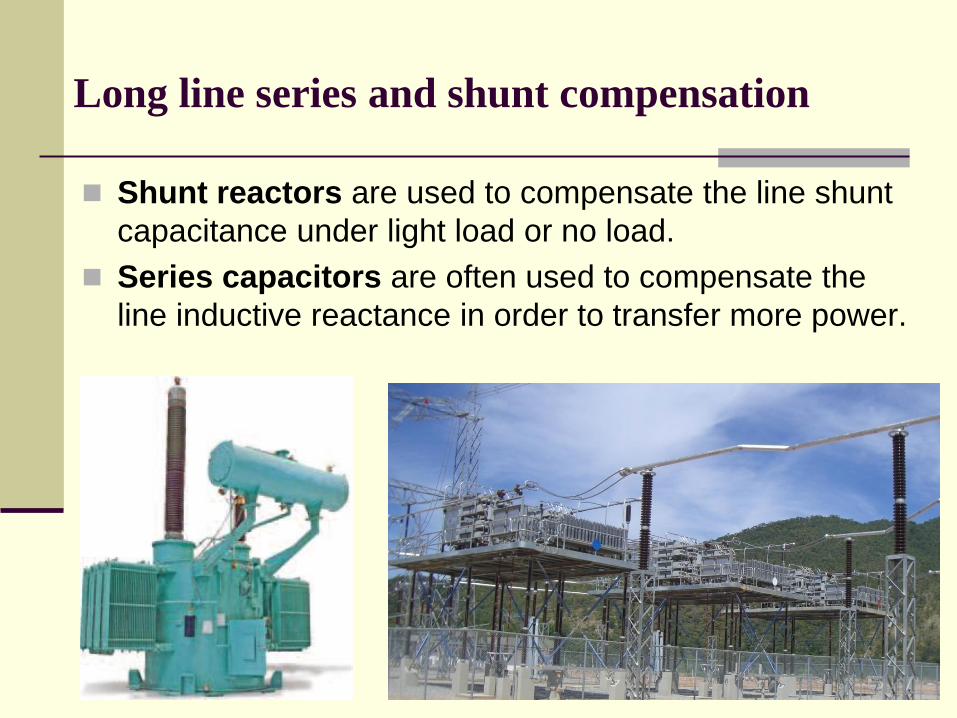
Long line series and shunt compensation
Shunt reactors are used to compensate the line shunt
capacitance under light load or no load.
Series capacitors are often used to compensate the
line inductive reactance in order to transfer more power.

Basic Conventional Power System Layout

Substation Transformers
Typical size; 20 MVA
Primary voltage down to 69 kV
Secondary voltage down to 4.16kV

Distribution Substation Layout

Power distribution lines
(placed underground in new urban areas)
Primary Distribution voltages: 4.16, 12.47, 13.2, 13.8, 25, 34.5 kV
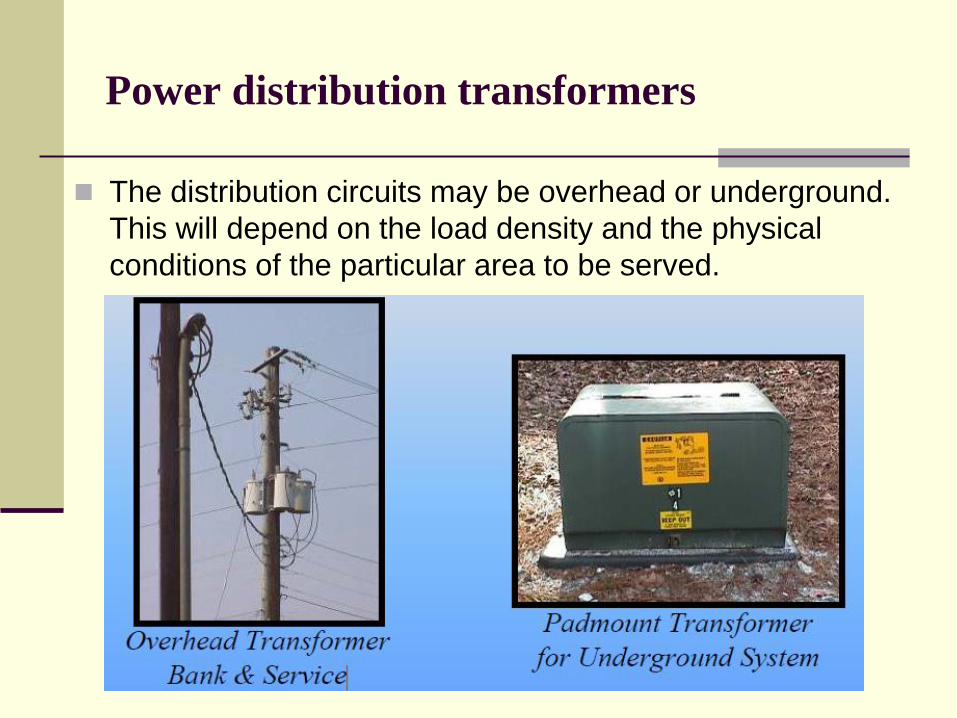
Power distribution transformers
The distribution circuits may be overhead or underground.
This will depend on the load density and the physical
conditions of the particular area to be served.
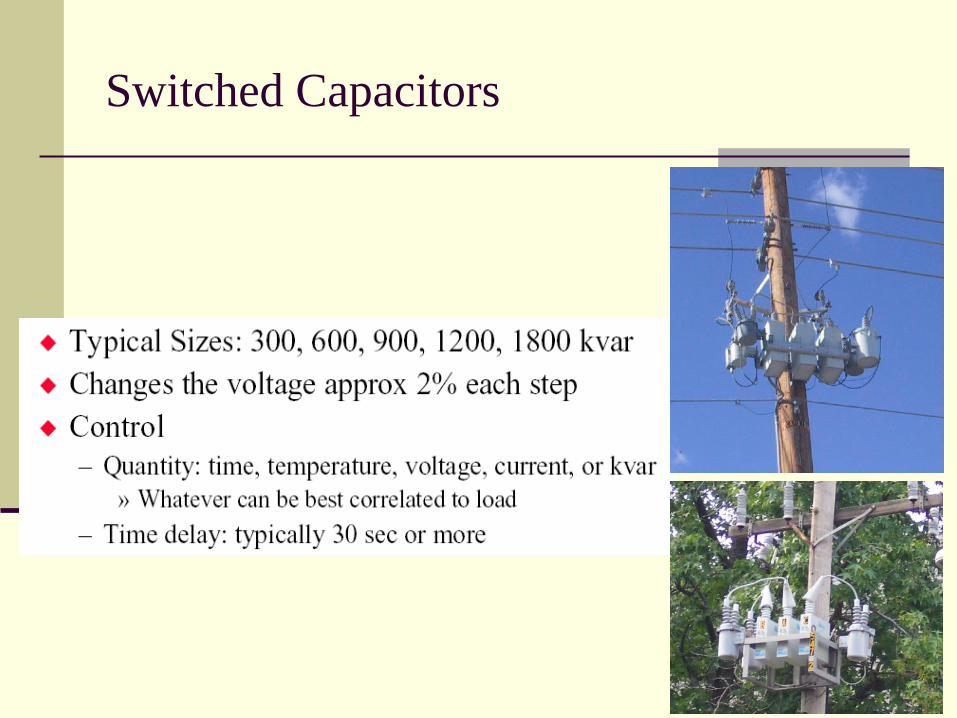
Switched Capacitors
Basic Conventional Power System Layout

Electrical Power Utilization (electric load)
Utilization voltage: 120V, 208V*,
240V, 277V, 480V*, 600V*
2/3 –3/4 of electricity is consumed by motors
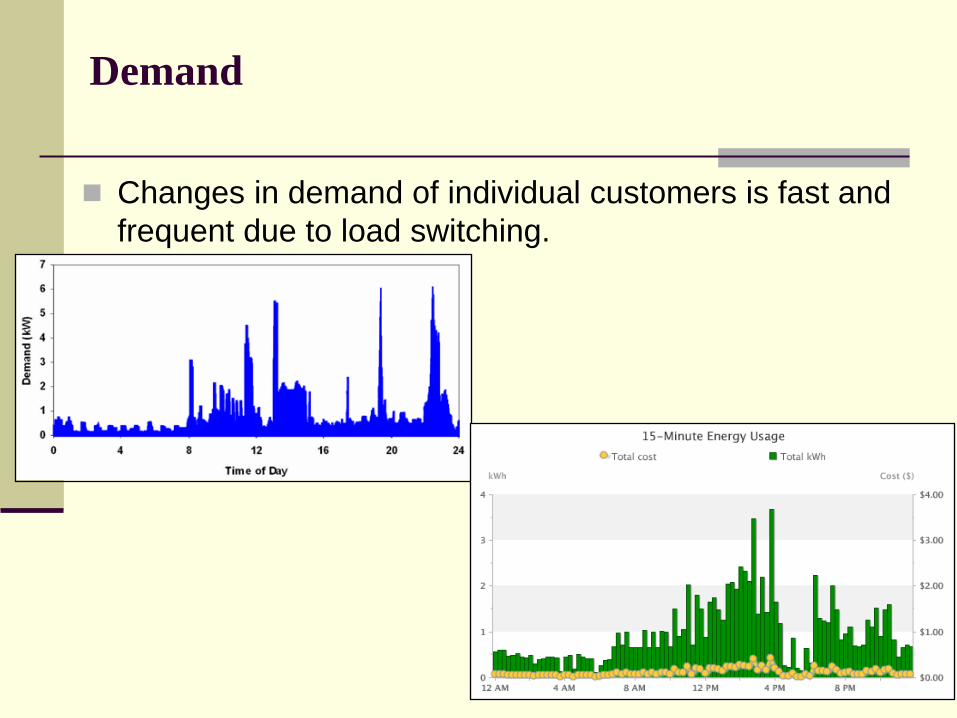
Demand
Changes in demand of individual customers is fast and
frequent due to load switching.

Substation Load: 48 hours
The aggregated demand at the substation is smoother,
and total load fluctuations are usually small.
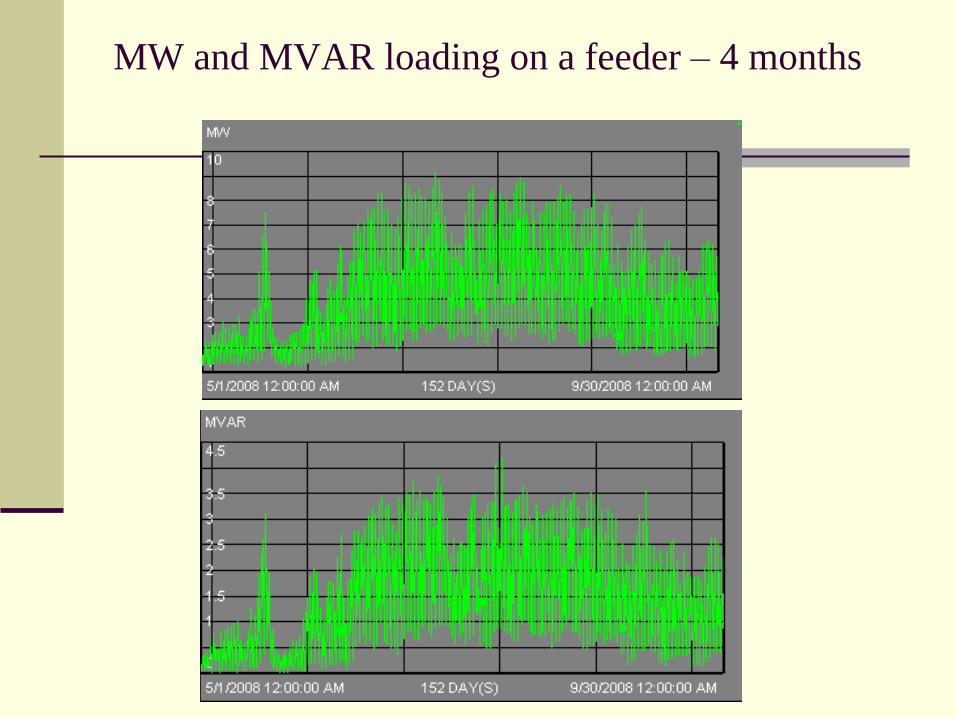
MW and MVAR loading on a feeder – 4 months
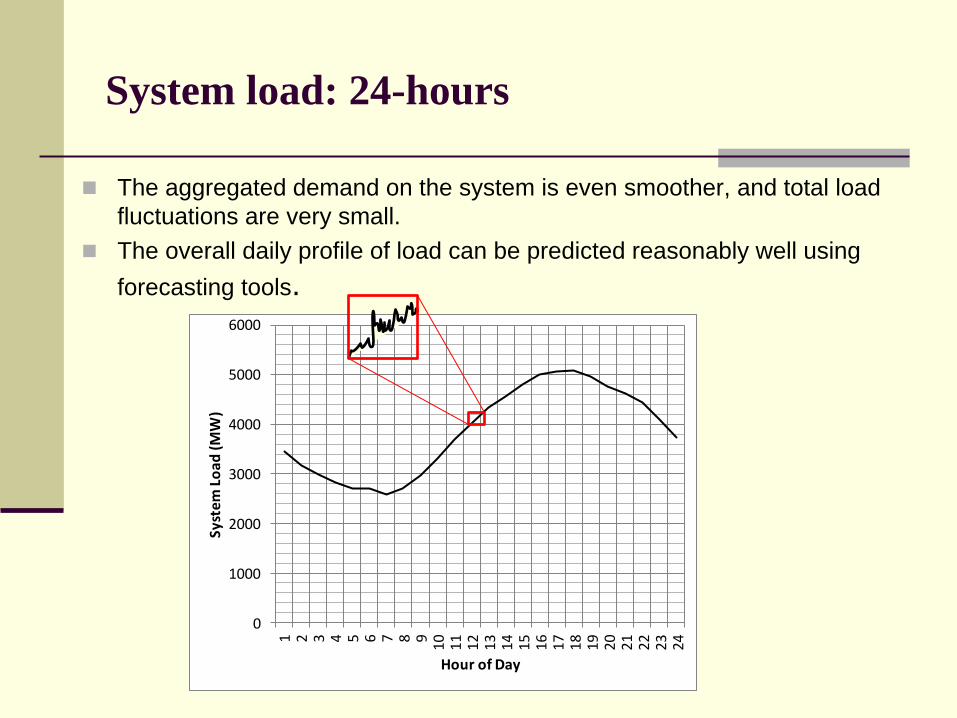
System load: 24-hours
The aggregated demand on the system is even smoother, and total load
fluctuations are very small.
The overall daily profile of load can be predicted reasonably well using
forecasting tools.
0
1000
2000
3000
4000
5000
6000
1 2 3 4 5 6 7 8 910 11 12 13 14 15 16 17 18 19 20 21 22 23 24
Syst
em L
oad
(MW
)
Hour of Day

Seasonal Load Patterns
The local load is dominated by winter and summer patterns, with May
and October as shoulder months.

Regional Updated Demand Curves
http://www.eia.gov/beta/realtime_grid/#/summ
ary/demand?end=20170115&start=20161215
®ions=01
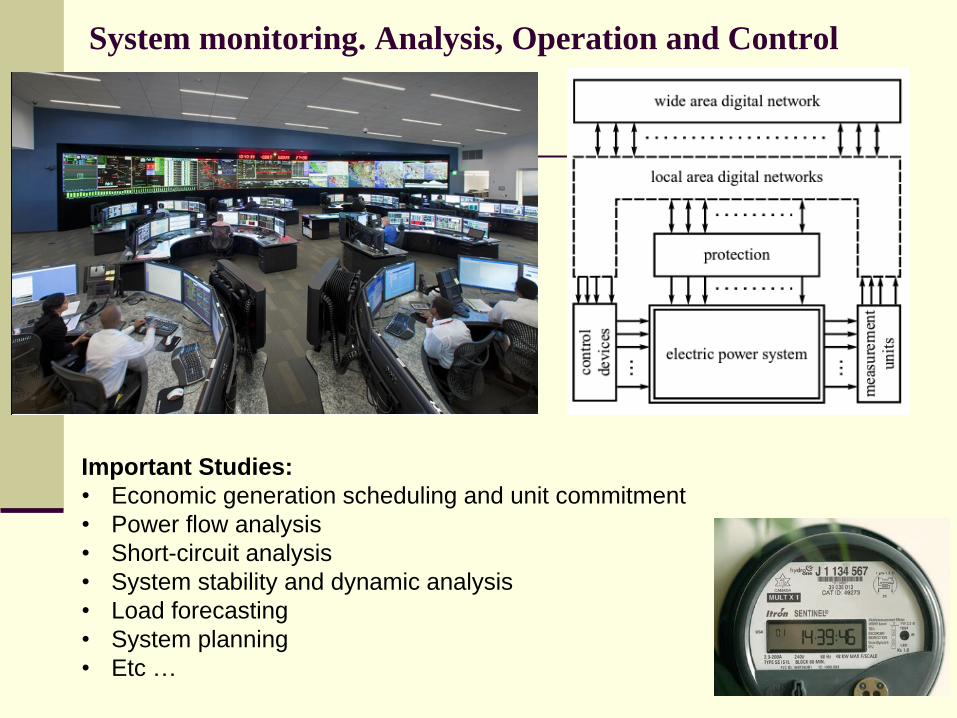
System monitoring. Analysis, Operation and Control
Important Studies:
• Economic generation scheduling and unit commitment
• Power flow analysis
• Short-circuit analysis
• System stability and dynamic analysis
• Load forecasting
• System planning
• Etc …
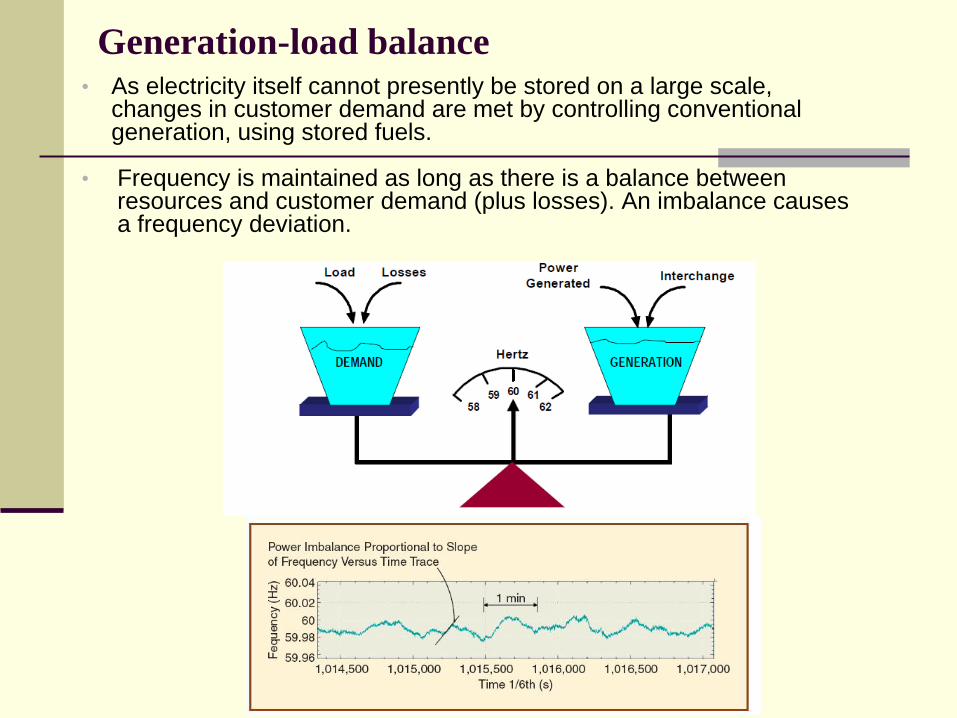
Generation-load balance • As electricity itself cannot presently be stored on a large scale,
changes in customer demand are met by controlling conventional generation, using stored fuels.
• Frequency is maintained as long as there is a balance between resources and customer demand (plus losses). An imbalance causes a frequency deviation.
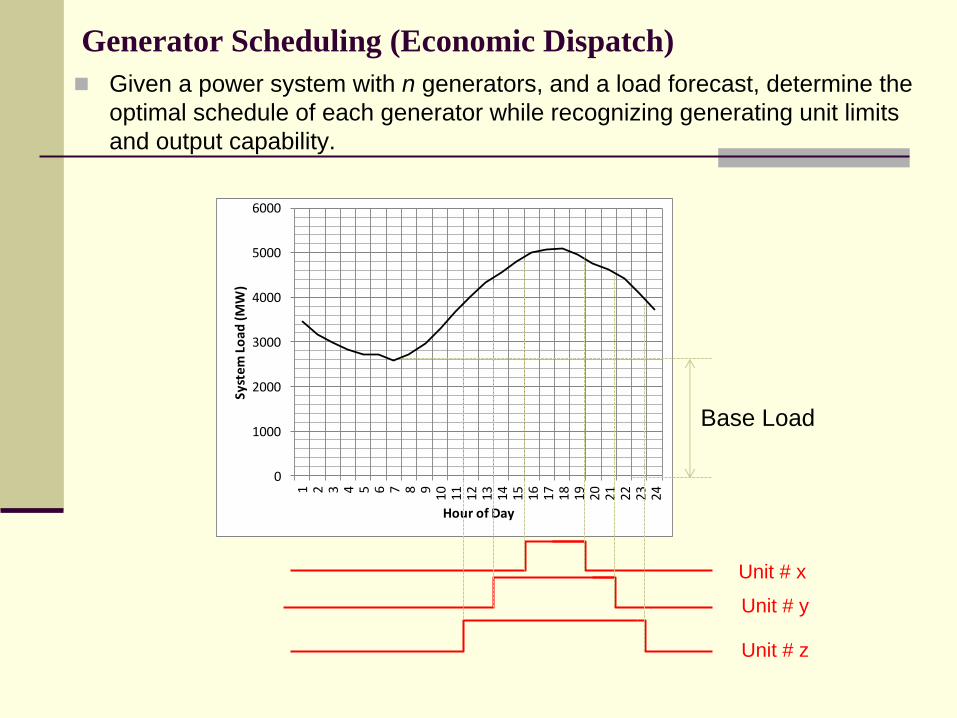
Generator Scheduling (Economic Dispatch)
Given a power system with n generators, and a load forecast, determine the
optimal schedule of each generator while recognizing generating unit limits
and output capability.
0
1000
2000
3000
4000
5000
6000
1 2 3 4 5 6 7 8 910 11 12 13 14 15 16 17 18 19 20 21 22 23 24
Syst
em L
oad
(MW
)
Hour of Day
Unit # z
Unit # y
Unit # x
Base Load

Red indicates under-
voltage at Bus 3
Power Flow Analysis

Power distribution – big problem in
some parts of the world!
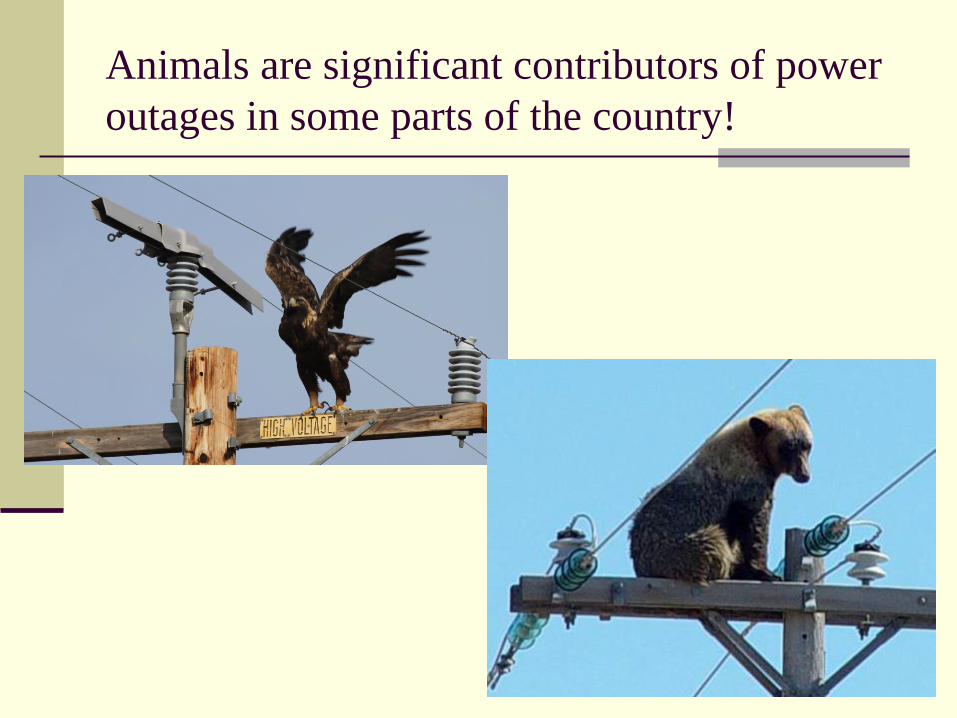
Animals are significant contributors of power
outages in some parts of the country!

END!