Embed Size (px)
Citation preview

EFFECTS OF MILITARY OVERFLIGHTS ON HABITAT USE AND SELECTION
BY FEMALE DALL'S SHEEP, YUKON-TANANA UPLANDS, ALASKA
By
Bradley R. Wendling
RECOMMENDED:
AdViSOl)lCOlllltte~· ~F c~ C~am
APPROVED: ~.M, ~a Ji)7i;l . Dean, College of Natural Science and Mathematics
Date

EFFECTS OF MILITARY OVERFLIGHTS ON HABITAT USE AND SELECTION
BY FEMALE DALL’S SHEEP, YUKON-TANANA UPLANDS, ALASKA
A
THESIS
Presented to the Faculty of the University of Alaska Fairbanks
In Partial Fulfillment of the Requirements
for the Degree of
MASTER OF SCIENCE
By
Bradley R. Wendling, B.S.
Fairbanks, Alaska
December 2008

iii
ABSTRACT
My objective was to assess the potential effects of military overflights on home
range size, movement rates, habitat use, and habitat selection of female Dall’s sheep
(Ovis dalli) during 2-week sequential periods, April-July, 1999-2002. I examined sheep
in 2 study areas overlain with designated military training airspace within the Yukon-
Tanana uplands, Alaska. I examined the effects of study area, year, and sequential time
period on: 1) mean home range size, 2) mean minimum hourly distance traveled by
sheep, and 3) mean use and selection ratios for the habitat variables of elevation, slope,
terrain ruggedness, aspect, and landcover class. Mean number of daily military sorties
within sequential periods was used as a covariate in all analyses. I assessed habitat
selection at 3 successive spatial scales defined as: 1) the regional geographical range of
female Dall’s sheep in the Yukon-Tanana uplands, 2) study areas (defined as the
distribution of sheep within a localized area), and 3) selection within individual 2-week
home ranges. Sheep home range size, movement rates, habitat use and selection ratios at
the scale of region and study area differed between study areas, among years within study
areas, and among sequential time periods within years within study areas, but did not
vary in relation to military overflight intensity. I detected an effect of sorties on selection
ratios at the home range scale; however, sorties explained <4% of the residual variation
in these variables. I conclude that increases in intensity of military training operations
during Major Flying Exercises (MFE’s) over the Yukon-Tanana uplands were a relatively
insignificant source of variance in activity and habitat use compared to the effects of
seasons, years, and study areas.

iv
TABLE OF CONTENTS
Page
Signature Page ...... ………………………………………………………………………..i
Title Page ...... ………………………………………….…………………………………ii
Statistical Analysis ..... ……………………………………………………………….18
Collar Data ..... ……………………………………………………………………….22
Sorties...... ……………………………………………………………………………24
Behavior ..... ………………………………………………………………………….27
Habitat Selection at the Scale of Study Area ..... …………………………………….58
Habitat Selection at the Regional Scale ..... ………………………………………….59
Abstract ............................................................................................................................. iii
Table of Contents.............................................................................................................. iv
List of Figures .......... …………………………………………………………………….vi
List of Tables .................................................................................................................... ix
List of Appendices ............................................................................................................. x
Acknowledgments............................................................................................................. xi
Introduction........................................................................................................................ 1
Study Areas........................................................................................................................ 6
Methods.............................................................................................................................. 9
Results............................................................................................................................. .22
Habitat Use at the Scale of Home Range..... ………………………………………...36
Habitat Selection at the Scale of Home Range ..... …………………………………..47

v
Page
Discussion........................................................................................................................ 60
Future Studies ............................................................................................................. 68
Literature Cited ................................................................................................................ 70

vi
LIST OF FIGURES
Page
Fig. 1. Cirque Lakes and West Point study areas and Military Operations Areas, Yukon -Tanana uplands, Alaska, 1999-2002...................................................................... 7
Fig. 2. Example of spatial scales of analysis used to examine female Dall’s sheep habitat selection, Yukon-Tanana uplands, Alaska, 1999-2002 ....................................... 14
Fig. 3. Relationship between numbers of sorties entering Military Operations Area (MOA) 1 and MOA 2, Yukon-Tanana uplands, Alaska, ~April 1 – August 10, 1999-2002 ............................................................................................................ 17
Fig. 4. Relationship between number of GPS locations and percent of maximum home range size of 17 female Dall’s sheep, June 26 – July 9, in the Cirque Lakes and West Point study areas, Yukon-Tanana uplands, Alaska, 1999 .......................... 25
Fig. 5. Estimated number of low (below 1524 m) and close (<1.6 km away) sorties entering Yukon MOA 1, Yukon-Tanana uplands, during approximate 2-week periods, early-April – early August, 1999-2002 .................................................. 29
Fig. 6. Bivariate plots depicting the relationship between sorties entering MOA 1 and female Dall’s sheep home range size (top panel) and the minimum distance traveled per hour (lower panel) in the Cirque Lakes and West Point study areas, Yukon-Tanana uplands, Alaska, 1999-2002........................................................ 30
Fig. 7. Average home range size and movement rates in relation to the number of sorties entering MOA 1 for female Dall’s sheep in the Cirque Lakes (CL) and West Point (WP) study areas, Yukon-Tanana uplands, Alaska, 1999-2002................. 31
Fig. 8. Average home range size and movement rates in relation to the number of sorties entering MOA 1 for female Dall’s sheep, by 2 week sequential time periods, Yukon-Tanana uplands, Alaska, 1999-2002........................................................ 32
Fig. 9. Mean home range size of female Dall’s sheep in the Cirque Lakes and West Point study areas, Yukon-Tanana uplands, Alaska, 1999-2002.................................... 34
Fig. 10. Mean minimum distance moved per hour by female Dall’s sheep in the Cirque Lakes and West Point study areas, Yukon-Tanana uplands, Alaska, 1999-2002 ........................................................................................................................... 35

vii
Page
Fig. 11. Mean proportional use of forest landcover by female Dall’s sheep in the Cirque Lakes and West Point study areas, Yukon-Tanana uplands, Alaska, 1999-2002 ........................................................................................................................... 37
Fig. 12. Mean proportional use of herbaceous/shrub landcover by female Dall’s sheep in the Cirque Lakes and West Point study areas, Yukon-Tanana uplands, Alaska, 1999-2002.......................................................................................................... 38
Fig. 13. Mean proportional use of sparse landcover by female Dall’s sheep in the Cirque Lakes and West Point study areas, Yukon-Tanana uplands, Alaska, 1999-2002 ........................................................................................................................... 39
Fig. 14. Mean proportional use of north aspect by female Dall’s sheep in the Cirque Lakes and West Point study areas, Yukon-Tanana uplands, Alaska, 1999-2002 ........................................................................................................................... 40
Fig. 15. Mean proportional use of south aspect by female Dall’s sheep in the Cirque Lakes and West Point study areas, Yukon-Tanana uplands, Alaska, 1999-2002 ........................................................................................................................... 41
Fig. 16. Mean proportional use of west aspect by female Dall’s sheep in the Cirque Lakes and West Point study areas, Yukon-Tanana uplands, Alaska, 1999-2002 ........................................................................................................................... 42
Fig. 17. Mean proportional use of east aspect by female Dall’s sheep in the Cirque Lakes and West Point study areas, Yukon-Tanana uplands, Alaska, 1999-2002........ 43
Fig. 18. Mean terrain ruggedness used by female Dall’s sheep in the Cirque Lakes and West Point study areas, Yukon-Tanana uplands, Alaska, 1999-2002............... 44
Fig. 19. Mean percent slope used by female Dall’s sheep in the Cirque Lakes and West Point study areas, Yukon-Tanana uplands, Alaska, 1999-2002........................ 45
Fig. 20. Mean elevation used by female Dall’s sheep in the Cirque Lakes and West Point study areas, Yukon-Tanana uplands, Alaska, 1999-2002 ................................. 46
Fig. 21. Selection ratios for forest landcover by female Dall’s sheep in the Cirque Lakes (CL) and West Point (WP) study areas, Yukon-Tanana uplands, Alaska, 19992002 ................................................................................................................... 48

viii
Page
Fig. 22. Selection ratios for herbaceous/shrub landcover by female Dall’s sheep in the Cirque Lakes (CL) and West Point (WP) study areas, Yukon-Tanana uplands, Alaska, 1999-2002............................................................................................. 49
Fig. 23. Selection ratios for sparse vegetation landcover by female Dall’s sheep in the Cirque Lakes (CL) and West Point (WP) study areas, Yukon-Tanana uplands, Alaska, 1999-2002............................................................................................. 50
Fig. 24. Selection ratios for north aspect by female Dall’s sheep in the Cirque Lakes (CL) and West Point (WP) study areas, Yukon-Tanana uplands, Alaska, 19992002 ................................................................................................................... 51
Fig. 25. Selection ratios for south aspect by female Dall’s sheep in the Cirque Lakes (CL) and West Point (WP) study areas, Yukon-Tanana uplands, Alaska, 19992002 ................................................................................................................... 52
Fig. 26. Selection ratios for west aspect by female Dall’s sheep in the Cirque Lakes (CL) and West Point (WP) study areas, Yukon-Tanana uplands, Alaska, 1999-2002 .. ........................................................................................................................... 53
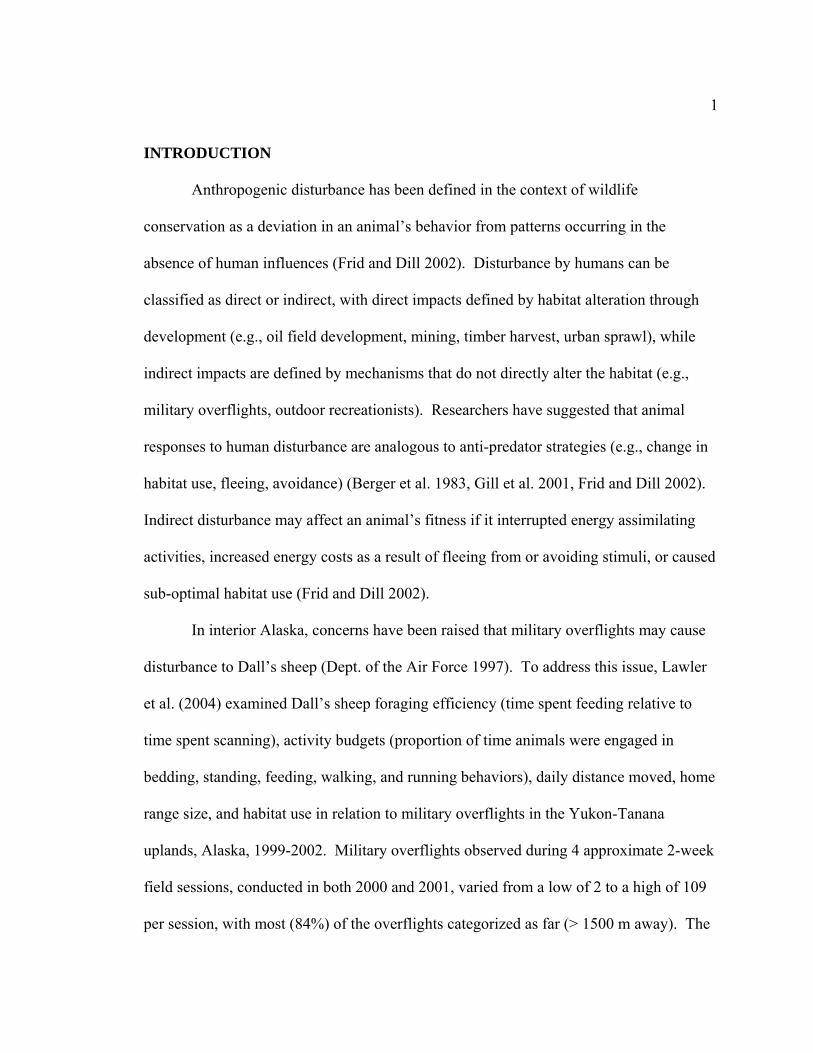
Fig. 27. Selection ratios for east aspect by female Dall’s sheep in the Cirque Lakes (CL) and West Point (WP) study areas, Yukon-Tanana uplands, Alaska, 1999-2002 .. ........................................................................................................................... 54
Fig. 28. Selection ratios for terrain ruggedness index by female Dall’s sheep in the Cirque Lakes (CL) and West Point (WP) study areas, Yukon-Tanana uplands, Alaska 1999-2002.............................................................................................. 55
Fig. 29. Selection ratios for percent slope by female Dall’s sheep in the Cirque Lakes (CL) and West Point (WP) study areas, Yukon-Tanana uplands, 1999-2002... 56
Fig. 30. Selection ratios for elevation by female Dall’s sheep in the Cirque Lakes (CL) and West Point (WP) study areas, Yukon-Tanana uplands, 1999-2002 ........... 57

ix
LIST OF TABLES
Page
Table 1. Two-week periods used for analysis of habitat selection at the West Point and Cirque Lakes study areas, Yukon-Tanana uplands, Alaska 1999-2002 .............. 10
Table 2. Mean distance (m) of 2D-fixes and 3D-fixes from the arithmetic mean calculated from the 3D-fixes of stationary GPS collars. Cirque Lakes and West Point study areas, Yukon-Tanana uplands, Alaska, 1999-2002 .......................... 23
Table 3. Mean number of daily sorties entering Military Operations Area 1 (MOA), Yukon-Tanana uplands, Alaska, 1999-2002........................................................ 26
Table 4. Comparison of the total number of sorties entering MOA 1 with the number of military overflights observed by Lawler et al. (2004), at the Cirque Lakes (CL) and West Point (WP) study areas within the Yukon-Tanana uplands, Alaska, 2000-2001 ............................................................................................................ 28

x
LIST OF APPENDICES
Page
Appendix 1. Landcover types (n=25) derived from Landsat TM satellite earth cover classification maps characterized the Yukon-Tanana uplands, Alaska, 1999-2002 (Ducks Unlimited, Inc. 1998) .............................................................................. 78
Appendix 2. Mean monthly temperatures (°C), and precipitation (cm) (National Weather Service), Eagle and Central, Alaska, 1999-2002 ................................................. 79
Appendix 3. Summary statistics for Dall’s sheep aerial surveys within the Cirque Lakes and West Point study areas, Yukon-Tanana uplands, Alaska, 1983-2002 .......... 80

xi
ACKNOWLEDGMENTS
I express gratitude to my major advisor Dr. Brad Griffith for his guidance. I
thank committee members Dr. Jim Lawler and Dr. Ed Murphy for providing valuable
manuscript criticisms. The National Park Service, the United States Air Force, and the
Alaska Cooperative Fish and Wildlife Research Unit funded this research. I appreciate
Dick Shideler and the Alaska Department of Fish and Game for providing me with a
graduate internship while I finished my degree. Kathy Pearse and Michelle Das of the
Alaska Cooperative Fish and Wildlife Research Unit, Carol Piser and Shannon
Christensen of the Department of Biology and Wildlife, University of Alaska Fairbanks,
provided essential administrative support. Hilmar Maier provided expert GIS assistance.
Dr. John Citta, Dr. Kent Schwaegerle, and Dr. Kelly Stewart provided their expertise
with SAS code. Fellow graduate students Kalin Kellie and Todd Brinkman
enthusiastically commented on early drafts of this thesis.
1
INTRODUCTION
Anthropogenic disturbance has been defined in the context of wildlife
conservation as a deviation in an animal’s behavior from patterns occurring in the
absence of human influences (Frid and Dill 2002). Disturbance by humans can be
classified as direct or indirect, with direct impacts defined by habitat alteration through
development (e.g., oil field development, mining, timber harvest, urban sprawl), while
indirect impacts are defined by mechanisms that do not directly alter the habitat (e.g.,
military overflights, outdoor recreationists). Researchers have suggested that animal
responses to human disturbance are analogous to anti-predator strategies (e.g., change in
habitat use, fleeing, avoidance) (Berger et al. 1983, Gill et al. 2001, Frid and Dill 2002).
Indirect disturbance may affect an animal’s fitness if it interrupted energy assimilating
activities, increased energy costs as a result of fleeing from or avoiding stimuli, or caused
sub-optimal habitat use (Frid and Dill 2002).
In interior Alaska, concerns have been raised that military overflights may cause
disturbance to Dall’s sheep (Dept. of the Air Force 1997). To address this issue, Lawler
et al. (2004) examined Dall’s sheep foraging efficiency (time spent feeding relative to
time spent scanning), activity budgets (proportion of time animals were engaged in
bedding, standing, feeding, walking, and running behaviors), daily distance moved, home
range size, and habitat use in relation to military overflights in the Yukon-Tanana
uplands, Alaska, 1999-2002. Military overflights observed during 4 approximate 2-week
field sessions, conducted in both 2000 and 2001, varied from a low of 2 to a high of 109
per session, with most (84%) of the overflights categorized as far (> 1500 m away). The

2
behavior of female Dall’s sheep were significantly affected by group size, presence of
lambs, distance to rocky terrain, study area, year, and date sequence (Lawler et al. 2004).
Military overflights did not significantly affect activity budgets, foraging efficiency, daily
distance moved, home range size, or habitat use of female Dall’s sheep (Lawler et al.
2004).
Research investigating effects of military overflights on bighorn sheep (Ovis
canadensis) suggested that responses to military jet aircraft noise were minimal
(Weisenberger et al. 1996, Krausman et al. 1998). F-16 aircraft flown with a 90% power
setting 125 m above-ground-level (AGL) over a 320-ha sheep enclosure produced sound
pressure levels (decibels) of 85 – 110 dB, but did not alter behavior of bighorn sheep
(Krausman et al. 1998). Heart rate of enclosed sheep increased above preflight levels
during 21 of 149 overflights, and returned to preflight levels within 60 seconds ≥ 71% of
the time, and within 120 seconds ≥ 92% of the time. Heart rates of captive bighorn sheep
exposed to simulated overflight noise from military jet aircraft increased following the
noise exposure for ≥ 3 minutes in the summer; however, they returned to resting rates in
≤ 1 minute in the spring (Weisenberger et al. 1996). Sheep demonstrated habituation to
disturbance stimuli with increased number of exposures to simulated aircraft noise
(Weisenberger et al. 1996).
Other studies reported negative responses of mountain sheep to non-military
overflight activity. Female bighorn sheep moved significantly farther the day of
helicopter surveys than on non-survey days in spring, summer and autumn and
consistently abandoned sampling blocks during helicopter surveys (Bleich et al. 1994).

3
In another study Dall’s sheep reacted to 43 of 56 helicopter overflights (77%) by fleeing
distances of 15 m – 1.5 km and reacted to helicopters at distances from 100 m to 3 km
(Frid 1999). Low-flying aircraft, including helicopters, elicited a heart-rate response in
bighorn ewes at distances less than 400 m (MacArthur et al. 1982). Foraging efficiency
of bighorn sheep was 42.7% during the winter in areas with sightseeing helicopter
activity compared to 74.6% in areas with no helicopter activity (Stockwell et al. 1991).
Bighorn sheep responses to light aircraft (Cessna 172 and 182) varied with the altitude of
the aircraft, although overflights < 50 m above ground caused sheep to leave an area
(Krausman and Hervert 1983).
Investigations of the effects of military and non-military overflights on ungulates
other than mountain sheep have shown mixed results similar to those obtained for
mountain sheep. Habitat use of mule deer (Odocoileus hemionus), was consistent before,
during and after overflights of low-flying, fixed-wing, aircraft (Cessna 172, 182 or Maule
(M-5-235C)) (Krausman et al. 1986). Behavior (i.e., time spent bedding, standing,
foraging, and traveling) of pronghorn (Antilocarpa americana), was not affected by
military activity (i.e., overflight noise, noise from ordnance delivery, ground-based
human activity) (Krausman et al. 2004).
Military fighter jets flying at low altitudes (i.e., flights to within 30 m AGL) had
negative effects (e.g., increased daily movement rates) on caribou (Rangifer tarandus) in
a few studies (Harrington and Veitch 1991, 1992, Maier et al. 1998). Caribou in the Red
Wine Mountain herd reacted to direct overflights (30 m AGL and within 50 m of the
animals) by running 22 of 27 times (Harrington and Veitch 1991). Median movement

4
time after exposure to the overflight was 9 seconds (Harrington and Veitch 1991).
Further, 70% of 260 caribou in the George River herd reacted to 13 overflights of 30-50
m AGL by running, with 35% of the individual animals running 10 seconds or longer
(Harrington and Veitch 1991). Post-calving female caribou exposed to military jet
overflights traveled significantly farther than control animals (Maier et al. 1998). Some
researchers suggested overflights of military fighter jets during calving and post-calving
had potential population-level effects through increased vulnerability of newborn calves
to predation and starvation (Harrington and Veitch 1991, 1992; Maier et al. 1998). In
contrast, there was no evidence that controlled military jet overflights caused the death of
caribou calves or resulted in increased movements of cow-calf pairs over the 24 hour
period following exposure to overflights (Lawler et al. 2005).
Research examining the effects of disturbance on animal performance has focused
primarily on energetic costs (e.g., heart rates, feeding efficiency, movement rates).
Theoretically, organisms selecting optimal habitats will successfully rear more offspring
than animals selecting sub-optimal habitats (Levins 1968). Habitat selection (when
resources are used disproportionately to their availability) is a complex process that
varies spatially, temporally, and with the natural history of the animal. Identifying
appropriate scales of analysis is therefore critical to studies of habitat selection (Orians
and Wittenberger 1991, Johnson et al. 2002, Boyce et al. 2003). Assessment of habitat
selection by female yellow-headed blackbirds (Xanthocephalus xanthocephalus)
demonstrated the selection of nest sites on the basis of vegetation density rather than food
availability at a small scale, while selection criteria at a broader scale were positively

5
correlated to food availability (Orians and Wittenberger 1991). Had the studies of
yellow-headed blackbirds been confined to a single arbitrary scale, the dynamics of their
decision making processes would have been obscured (Orians and Wittenberger 1991).
The Final Alaska Major Operations Areas (MOA’s) Environmental Impact
Statement (EIS) Record of Decision (Dept. of the Air Force 1997) specified the need to
evaluate the effects of military overflights on Dall’s sheep populations. If female sheep
responded to military jets I would expect either an increase in movement rates as sheep
moved away from disturbance stimuli or decreased movement rates if female sheep
selected and remained in habitats affording protection from disturbance stimuli (e.g.,
rugged terrain). I expected some variation in home range size, movement rates, habitat
use, and habitat selection as result of changing availability of resources with snow cover,
and seasonal migrations (Geist 1971, Whitten 1975, Seip and Bunnell 1985, Hansen
1996). If female sheep responded to military jets I would predict shifts in habitat use,
habitat selection, home range size and movement rates as overflight intensity varied. For
my thesis I defined these shifts to be potentially biologically significant if the variation in
habitat use, habitat selection, movement rates, and home range size associated with
military overflight intensity was detectable after accounting for the variation attributed to
annual, seasonal, and study area differences. My objective was to assess the effects of
increases in military overflight intensity during Major Flying Exercises (MFE’s),
compared to the background level of military overflights during Routine Flying Days
(RFD’s), on female Dall’s sheep behavior.

6
My thesis extended the studies of Lawler et al. (2004) by examining potential
effects of military overflight intensity on female Dall’s sheep, home range size,
movement rates, habitat use, and habitat selection. I assessed habitat selection across
three spatial scales as described by Johnson (1980): 1) the regional geographical range of
female Dall’s sheep in the Yukon-Tanana uplands, 2) study areas (defined as the
distribution of sheep within a localized area), and 3) selection within individual 2-week
home ranges.
STUDY AREAS
In 1976, the United States Air Force (USAF) established MOA’s in Alaska
designated for flight training. Since 1976, flight training has been characterized as
RFD’s or MFE’s. USAF characterizes MFE’s as an increase of ≥ 50% of the routine
daily flying activity or an increase of 50 sorties (deployment of one military aircraft) per
day (J. Hostman, United States Air Force, pers. comm.).
Two study areas within MOA 1 and MOA 2 in east central Alaska were selected
based on similar environmental characteristics, minimal hunting and recreational
pressure, and low densities of sheep. The names designated for the study areas were: 1)
Cirque Lakes, located in the southwest portion of the Yukon-Charley Rivers National
Preserve, and 2) West Point, which was approximately 35 km to the west of Cirque Lakes
(Fig. 1). Military flights were restricted to >30 m AGL throughout most of the year in
both study areas with 2 exceptions: 1) From May 10 through June 15 (lambing period)
military overflights were restricted to a minimum >1525 m AGL in a 7 nautical mile

7
Fig.1. Cirque Lakes and West Point study areas and Military Operations Areas, Yukon – Tanana uplands, Alaska, 1999-2002.

8
radius centered at 64°48’00’’N 143°45’00’’W, and 2) from April 15 to August 31
military overflights were restricted within 2 nautical miles of either riverbank of the
Charley River to >610 m AGL (11th Air Force Noise/Flight Sensitive Areas List 2002).
Both of these exceptions impact the Cirque Lakes study area.
Both study areas were within the geographical region of the Yukon-Tanana
uplands and were similar geologically and ecologically (Kelleyhouse and Heimer 1989).
The Yukon-Tanana uplands were characterized as low, rounded mountains atypical of the
more precipitous sheep habitats found within Alaska (e.g., Alaska Range, Brooks Range,
Chugach Mountains, and Wrangell-St. Elias). Treeline in both study areas varied by
aspect and ranged between 915 m and 1070 m. Vegetation in both study areas consisted
of herbaceous plants, graminoids (Carex species and grass species) and dwarf shrubs
(Salix species, Vaccinium vitis-idea, Empetrum nigrum, Dryas octopetela, and Ledum
palustris). Spruce (Picea spp.) forests characterized lower elevations of both study areas.
Twenty-five landcover types, derived from satellite earth cover classification maps, were
common to both study areas (Ducks Unlimited, Inc. 1998; Appendix 1).
There were no historic climate data within the study areas. The closest weather
stations were in Eagle, Alaska; approximately 100 km east of the Cirque Lakes study
area, and Central, Alaska, approximately 45 km north of the West Point study area.
Average monthly high and low temperatures for Eagle, Alaska ranged from a low of
-36.4° C (January, 1999) to a high of 22.4° C (June, 1999; National Weather Service;
Appendix 2). Average monthly high and low temperatures for Central, Alaska ranged
from a low of –37.3° C (February, 1999), to a high of 23.2° C (June, 1999, 2000;

9
National Weather Service; Appendix 2). Average monthly precipitation for Eagle,
Alaska ranged from a low of 0.0 cm (April, 2000), to a high of 12.0 cm (July, 2001;
National Weather Service; Appendix 2). Average precipitation for Central, Alaska
ranged from a low of 0.1 cm (May, 2000 and March, 2002), to a high of 10.0 cm (July,
2001; National Weather Service; Appendix 2).
METHODS
Each March, 1999-2002, up to 10 female sheep (2-10 years-old) were captured in
each study area using a hand-held net gun fired from helicopters, and fitted with
GPS_2000L radio-collars equipped with two-axis activity sensors (LOTEK™
Engineering Inc., Newmarket, Ontario, Canada). Collars recorded coordinates every 4
hours (h) during 1999 and every 3 h during 2000-2002. Collars were retrieved and data
downloaded by February of the following year.
For analysis, I used 9 sequential, approximately 2-week periods, beginning
around April 1, and ending around August 10, for the 4 years of study (Table 1). I
assumed the sequential time periods encompassed 3 distinct life history stages: 1) third-
trimester of gestation (~ March 15 – May 15; Periods 1-3), 2) lambing (~ May 15 – June
15; periods 4-6), and 3) lactation (~ June 15 – Oct 15; periods 7-9) (Rachlow and Bowyer
1991). Variation in timing of period dates among years was a result of aligning periods
to scheduled MFE’s (Table 1). I obtained 14-128 locations per sheep for each period.

10 Table 1. Two-week periods used for analysis of habitat selection at the West Point and Cirque Lakes study areas, Yukon-Tanana uplands, Alaska 1999-2002. Bold italics indicate a Major Flying Exercises (MFE’s) during that period.
1999 2000 2001 2002 Period Start End # Days Start End # Days Start End # Days Start End # Days
1 4/1 4/15 15 3/30 4/14 16 4/1 4/14 14 4/2 4/17 16 2 4/16 4/30 15 4/15 4/28 14 4/15 4/30 16 4/18 5/3 16 3 5/1 5/14 14 4/27 5/10 14 5/3 5/18 16 5/1 5/15 15 4 5/15 5/28 13 5/11 5/24 14 5/19 6/1 14 5/16 5/29 14 5 5/26 6/9 14 5/22 6/4 14 5/24 6/6 14 5/23 6/5 14 6 6/10 6/25 16 6/5 6/20 16 6/7 6/22 16 6/6 6/21 16 7 6/26 7/9 14 6/21 7/4 14 6/23 7/7 15 6/22 7/6 15 8 7/8 7/23 16 7/10 7/25 16 7/12 7/27 16 7/11 7/26 16 9 7/24 8/6 14
7/26 8/9 15
7/28 8/11 15
7/27 8/10 15

11
Software in the LOTEK collar assigned an accuracy value to each coordinate
based on the number of satellites communicating with the collar, and the quality of
communication of the collar with the satellites. Coordinates derived under good
conditions were assigned a value of three dimensions (3D), and coordinates derived
under less ideal conditions were assigned a value of two dimensions (2D), and during
poor conditions no coordinates were obtained. Prior to May 1, 2000, Selective
Availability (a United States military process that degrades the accuracy of GPS units)
was enabled, resulting in less precise locations.
To estimate the comparative accuracy of 2D and 3D locations before and after
selective availability, I examined the assumed post-mortem data of collars retrieved from
deceased sheep. Sheep were assumed deceased when GPS collars recorded 6 consecutive
locations with activity values of 0. I compared the average distance of 2D-fixes and 3D
fixes from the arithmetic mean position of the collars calculated from the 3D-fixes of
these stationary collars (n=14) before and after selective availability had been turned off.
To assure that the collars of deceased sheep had not been moved by scavengers, I
examined the activity data retrieved from the collars, and 2 individual collars with < 7
consecutive days of locations with activity values of 0 were omitted from the analysis.
For my purposes of analyzing habitat selection, if average error estimates were less than
45m (GIS pixel size) location error was assumed to be inconsequential.
Collar failure, variable sampling intervals, death of sheep and variable satellite
coverage resulted in variation in the number of locations obtained for each sheep. To
estimate adequate sample size for home range calculations, I estimated the minimum

12
number of locations necessary for minimum convex polygon (MCP (Mohr 1947)) size to
become asymptotic. For a conservative estimate of necessary sample size, I examined
the 2-week home range size of all sheep (n=17) alive throughout July 1999 (period 8,
Table1). I assumed home ranges would be largest in the summer (Simmons 1982) thus
requiring more locations for accurate home range calculations (Girard et al. 2002).
Further, I assumed that collars deployed in 1999 would be less likely to have sufficient
data for home range calculations based on the longer sampling interval (coordinates
collected every 4 h in 1999).
I randomly subsampled the location dataset to generate 7 separate datasets
composed of 10, 20, 30, 40, 50, 60, or 70 locations from the full 2-week data set for each
sheep. I then calculated the MCP for each sample and compared the MCP for the sample
(i.e., MCPsample) with the MCP from the entire dataset (i.e., MCPall_data) in percentage
form:
Percent MCP coverage = 100*(MCPsample/MCPall_data).
To determine the mean number of locations at which 95% of area in the MCPall_data was
covered, I fitted a generalized Von Bertalanffy growth curve (McLaren 1993) to the data
(SAS Institute Inc. 1999) as follows:
( −k( xi j −t0 ))y j = S(1− exp ) .
In that relationship the percentage of MCP coverage for sheep i in sample j is xij, the
asymptotic percentage of MCP coverage is S, the rate at which the asymptotic percentage
is approached is k (i.e., the growth rate), and the percentage covered with zero locations
is t0. Variables S and t0 were held constant. At infinite sample size, home ranges become

13
asymptotic at 100% coverage, so S was set to 1. Likewise, when no data were collected,
zero percent of the home range is covered, so t0 was set to 0, therefore, only k, the growth
rate, is estimated.
Behavioral data (MCP home range size and movement rates) were calculated for
each sheep/year/period. Movement rates were estimated as the average straight-line
distance between consecutive GPS locations divided by the elapsed time between
locations.
To assess habitat selection I sampled used and available but unused habitat at 3
successively smaller spatial scales (Johnson 1980, Wiens 1989, Orians and Wittenberger
1991, Wiens et al. 1993). I defined: 1) Regional scale as the area encompassing home
ranges of all sheep within a period, 2) Study Area scale as the area encompassing home
ranges of all sheep within a period for both the Cirque Lakes and West Point areas
separately, and 3) Home Range scale as the area encompassing used locations specific to
individual sheep within a period (Fig. 2). Home range was estimated as a MCP for all
radio-collared sheep relocations within a period. MCP’s were estimated using animal
movement extension to Arcview 3.2 (Hooge and Eichenlaub 1997).
To examine habitat selection, random unused points were generated (Arcview
extension Random Point Generator 1.3, Jenness Enterprises) for each MCP for each scale
of analysis. To assure random points generated for a unique scale and MCP were unused;
all points within 45 m (GIS pixel size) of any used location for the same unique scale and
MCP were omitted. I attempted to obtain a 1:1 ratio of unused to used locations for each
sheep, within each period and scale of analysis (Manly et al. 2002).

14
Fig. 2. Example of spatial scales of analysis used to examine female Dall’s sheep habitat selection, Yukon-Tanana uplands, Alaska 1999-2002. I defined Regional scale as the minimum convex polygon (MCP) for all used sheep locations within a unique year/period, Study Area scale as the MCP for all used sheep locations within a unique year/study area/period, and Home Range scale as the MCP for locations of each sheep within a unique year/study area/period.

15
Habitat attributes at the used and unused locations were derived from remotely
sensed data using GIS (ARC/INFO, Environmental Systems Research Institute,
Redlands, California, USA). Layers within my GIS included a 60 meter pixel Digital
Elevation Model (DEM) (United States Geological Survey,
http://agdc.usgs.gov/data/usgs/geodata/dem/63K/), Landsat TM satellite earth cover
classification maps (resolution 30 m) developed by Ducks Unlimited (Ducks Unlimited
1998), and an index of terrain ruggedness modified from Nicholson et al. (1997)
described below.
The Ducks Unlimited (1998) classification of land cover types was based on the
classification scheme of Viereck et al. (1992). To increase the power of statistical
analyses, the original number of landcover classes (n=25) was broadly re-classified to
four classes (forest, herbaceous/shrub, sparse vegetation/rock gravel, unknown/non
habitat) based on dominant overstory (Appendix 1). The unknown/non-habitat class was
used to calculate proportional use of forest, herbaceous/shrub, sparse vegetation/rock
gravel landcover classes, and then excluded from all other analyses. I re-sampled the
Landsat maps (resolution 30 m) using nearest neighbor assignment and the DEM’s
(resolution 60 m) using bilinear interpolation to obtain a matching pixel size of 45m
(Mather 1999).
To describe terrain ruggedness, I used the model of Nicholson et al. (1997). This
model accounted for variation in slope and aspect within and surrounding each pixel.
Specifically, the index was equal to the sum of the standard deviation of slope and the
mean angular dispersion of aspect within a specified distance of the pixel center. For this

16
model, I chose 450 m as the distance over which to calculate mean angular dispersion.
When considering the hourly movements of all sheep in all years I found that only 4.4%
of the 60,317 estimated movement rates, exceeded 450 m. Hence a radius of 450 m
reflects the area a sheep typically encounters in 1 hour. I summed the standard deviation
of slope and the mean angular dispersion of aspect rather than computing the terrain
ruggedness index as the product of the standard deviation of slope and the mean angular
dispersion of aspect as described by Nicholson et al. (1997). This avoided a 10-fold
increase of the range of ruggedness estimates and preserved the proportional range of the
original data in each component of ruggedness. Estimates of slope (%), elevation
(meters), aspect class (N, S, E, W), landcover class, and terrain ruggedness at sites used
by sheep, and at unused points, were derived from the GIS layers.
The number of sorties entering MOA 1 and MOA 2 per day was obtained from
United States Air Force personnel (G. Rolf, United States Air Force, pers. comm.) and
provided an estimate of overflight intensity in the general area. Simple linear regression
(SAS Institute Inc. 1999) was used to examine the relationship between the number of
sorties entering MOA 1 and MOA 2 each day. There was a positive linear relationship
between the number of sorties entering MOA 1 and MOA 2 (r2 = 0.92; Fig. 3). Cirque
Lakes was completely within MOA 1 while West Point was within MOA 1 and MOA 2
(Fig. 1). Because of the high correlation between sorties entering MOA 1 and MOA 2,
and because both study areas were completely or partially within MOA 1, I used the
number of daily sorties in MOA 1 as an estimate of overflight intensity for both the

17
MO
A 1
200
y = 0.9793x + 2.028 175 r 2 = 0.92
150 n = 505
125
100
75
50
25
0
0 25 50 75 100 125 150 175 200
MOA 2
Fig. 3. Relationship between numbers of sorties entering Military Operations Area (MOA) 1 and MOA 2, Yukon-Tanana uplands, Alaska, ~April 1 – August 10, 19992002.

18
Cirque Lakes and West Point study areas. I used Analysis of Variance (SAS Institute
Inc. 1999) to estimate the influence of year, periods nested within years, and military
flight training activity classification (RFD’s, MFE’s) on the number of sorties launched
per day. For each sheep/year/period, I averaged the mean number of daily sorties
entering the MOA’s on the days the collar of each sheep recorded coordinates.
I performed a post hoc analysis estimating the proportion of sorties launched that
were observed by Lawler et al. (2004) by year and study area. Combining data from both
study areas, I estimated the number of military overflights observed per hour by Lawler
et al. (2004) for each day of sheep observation. I used linear regression to examine the
relationship between the hourly observation rate of military overflights and the number of
sorties launched during the same days of observation by Lawler et al. (2004). I
developed a crude estimate of the proportion of all sorties entering MOA 1 that would
have been classed as low and close by Lawler et al. (2004) by assuming that the
proportion of low and close aircraft observed by Lawler et al. (2004) was consistent
among years, between study areas, and among periods. I estimated the number of low and
close aircraft as a proportion of the total number of sorties launched by year and period in
MOA 1.
Statistical Analyses
I used bivariate plots to gain a visual understanding of how sorties related to home
range size and the minimum distance traveled per hour. In addition to the effect of
sorties, home range sizes and movement rates may vary as a function of study area, year,
and period. To statistically estimate the effects of the number of sorties on home range

19
sizes and the minimum distance traveled per hour, I used two approaches based upon
Analysis of Covariance (ANCOVA). First, I included all variables, except for the
number of sorties, in a nested design. Periods were nested within years and years were
nested within study areas. The nested analysis assumes home range size and movement
rates vary by study area, years within study area, and periods within years and study area.
In effect, the nested analysis ‘controls’ for variation between study areas, years and
periods and only allows the number of sorties to explain the residual variation after
accounting for the nested effects. This is a conservative approach; the effect of sortie will
only be observed after the other sources of variation have been accounted for. There is a
possibility that some of the variability due to the number of sorties will be attributed to
some of the nested effects if the number of sorties covaries with study area, year, or
period. Hence, I also investigated a second approach, where study area, year, and period
were crossed (factorial ANCOVA). For each unique sheep/period, I averaged the number
of sorties entering MOA 1 for the days the GPS collar actually obtained coordinates, and
used that average as a covariate in my analyses. Within the factorial design, I limited
inferences to two-way interactions to aid interpretation.
I calculated the mean elevation, slope, and terrain ruggedness, proportion of
aspect (north, south, east, west), and proportion of landcover class (forest,
herbaceous/shrub, sparse vegetation/rock gravel; Appendix 1) of used and unused
locations for each sheep within each period for each scale of analysis. For habitat use, a
vector of average elevation, slope, and terrain ruggedness, proportional use of aspect, and

20
proportional use of landcover class was calculated from used locations of each sheep
within each period.
Experimental design for the assessment of habitat selection at the scale of region
and study area incorporated design 3, while assessment of habitat selection at the scale of
home range incorporated design 2 (Thomas and Taylor 1990). Habitat selection was
estimated as a vector of selection ratios calculated from the means of used and unused
points (e.g. mean use / mean unused) for all dependent variables for each sheep within
the periods for each scale of analysis (regional, study area, home range; Neu et al. 1974,
Alldredge and Ratti 1986, 1992, Thomas and Taylor 1990, Manly et al. 2002). For
categorical variables (aspect and landcover class) selection ratios with a value > 1
represented selection for, while selection ratios < 1 represented avoidance of, the habitat
attribute. For continuous variables (elevation, percent slope, and terrain ruggedness),
selection ratios > 1 represented selection for higher than mean unused, while selection
ratios < 1 represented selection of lower than mean unused.
To assess the effect of sorties on habitat use and selection, I used multivariate
analysis of covariance (MANCOVA). For the MANCOVA, I nested period within year
and year within study area (class variables). For each unique sheep/period, I averaged the
number of sorties entering MOA 1 for the days the GPS collar actually obtained
coordinates, and used that average as a covariate in my analyses to estimate if sorties
influenced variation associated with the dependent variables. This is an appropriate
design because there were 10 dependent variables (elevation, slope, terrain ruggedness,
aspect (N, S, E, W), landcover class (forest, herbaceous/shrub, sparse vegetation/rock

21
gravel) for both habitat use and habitat selection; use of a MANCOVA allowed assessing
all variables at the same time and the nested design allows the test to focus on the effect
of sorties. The nested design is appropriate for two reasons. First, I expected habitat use
and selection to vary by period, year, and study area, independent of the number of
sorties. Second, as mentioned above, this is a conservative approach. I argue that a
conservative approach is more appropriate for this observational study in which controls
(e.g. sheep populations never exposed to military overflights) were not available for
comparison with the animals exposed to military overflights. All analyses were
conducted using PROC GLM in SAS (SAS Institute Inc. 1999) and I used Type 3 SS to
assess the influence of the class effects and sorties covariate. I examined the univariate
output of the MANCOVA to assess the significance of the dependent variables. When
the sorties covariate was found significant I performed linear regression (SAS Institute
Inc. 1999) to assess the amount of variation on the dependent variable attributed to the
covariate. Analyses were conducted with α = 0.05.
I assessed the habitat variables for multicollinearity. While multicollinearity in
MANCOVA does not affect the interpretation of class effects, it can affect the
interpretation of individual independent variables by: 1) increasing confidence intervals
on the regression coefficients to the point where they include 0, and 2) affect individual
P-values to the point where they could change from significance to non-significance or
vice versa (Grimm and Yarnold 1995). I assumed partial correlation coefficients greater
than 0.8 might exceed a tolerance for multicollinearity that could potentially affect
statistical models (Grimm and Yarnold 1995). If multicollinearity was detected in my

22
data sets, I conducted the analyses with one of the highly correlated variables eliminated
and also with all variables included. Analyses were compared to determine if there were
any differences in conclusions as a result of retaining or eliminating correlated dependent
variables.
RESULTS
Collar Data
Prior to discontinuation of Selective Availability on May 1st, 2000, mean distance
of 2D-fixes from the arithmetic mean of the stationary 3D-fixes ranged from 105.6 to
109.0 m, while mean distance of 3D-fixes from the arithmetic mean of the stationary 3D
fixes ranged from 46.4 to 85.1 m (Table 2). After selective availability was turned off,
mean distance of 2D-fixes from the arithmetic mean of 3D-fixes ranged from 4.4 to 19.3
m, while mean distance of 3D-fixes from their arithmetic mean ranged from 2.9 to 6.0 m
(Table 2). Imprecision of 2D and 3D relocation data was less than 45 m GIS pixel size
after May 1, 2000. Relocation data prior to the discontinuation of selective availability
introduced additional variation in my statistical models; however, I assumed that the
variation would be minimal because: 1) original DEM pixels were resampled to a smaller
pixel size, and bilinear interpolation assigns values based on the correlation of
surrounding pixels, and 2) by broadly reclassifying the original Landsat TM satellite
earth cover classification maps, I portrayed a more homogenous vegetative landscape
and, 3) of the 4 GPS collars I used to assess the accuracy of 2D and 3D-fixes prior to the
discontinuation of selective availability I found that on average 55.2 % of the 2D-fixes

23
.
Table 2. Mean distance (m) of 2D-fixes and 3D-fixes from the arithmetic mean calculated from the 3D-fixes of stationary GPS collars. Cirque Lakes and West Point study areas, Yukon-Tanana uplands, Alaska, 1999-2002. Estimates prior to the discontinuation of selective availability (May, 1 2000) are indicated by bold font.
2D-fix 3D-fix Total fixes Average 2D Average 3D Average Sheep Year Beginning End (n) (n) (n) distance 95% CI distance 95% CI distance 95% CI 169 1999 3-May 13-May 25 6 31 105.6 +/-27.3 70.8 +/-26.2 98.8 +/-23.0 173 1999 26-Oct 10-Nov 28 68 96 109.0 +/-63.0 46.4 +/-8.0 64.6 +/-19.9 179 2000 5-Apr 8-May 67 23 90 106.5 +/-16.5 68.0 +/-11.3 96.7 +/-13.1 175 2000 20-Mar 9-Apr 83 23 106 106.6 +/-16.1 85.1 +/-35.3 102.0 +/-14.7 176 2000 7-May 13-Jul 223 288 511 4.4 +/-0.9 2.9 +/-0.2 6.2 +/-0.4 172 2000 22-Jun 22-Sep 441 88 529 10.0 +/-0.8 5.6 +/-0.8 9.2 +/-0.7 162 2000 27-May 22-Sep 48 15 63 7.5 +/-1.8 5.0 +/-2.2 6.9 +/-0.17 173 2000 30-Oct 26-Nov 136 68 204 10.7 +/-1.8 5.8 +/-1.1 9.1 +/-1.3 166 2001 29-Mar 28-Jun 400 76 476 10.5 +/-0.9 5.6 +/-0.8 9.8 +/-0.8 169 2001 2-Dec 22-Dec 120 13 133 19.3 +/-4.8 6.0 +/-3.4 18.0 +/-4.4 161 2001 15-Dec 22-Dec 26 22 48 6.9 +/-2.0 3.8 +/-1.0 5.45 +/-1.2 173 2001 1-Dec 22-Dec 97 71 168 11.0 +/-2.4 5.2 +/-0.9 8.6 +/-1.5

24
and 75.3% of the 3D-fixes were within one pixel (90 m) of the true Pixel in which the
location occurred.
Within the von Bertalanffy growth model, the growth rate, k, was 0.059 (95% CI
= 0.054 – 0.065; Fig. 4). This model predicted that with 45, 50, and 55 locations, the
mean coverage in home ranges would be 93.0, 94.8, and 96 percent, respectively. The
95% confidence limit for the mean percentage covered at 50 samples was 93.3% to
96.0%. Sheep with < 50 locations for individual combinations of year/period were
omitted from all analyses.
I wanted ~ 1:1 ratio of unused to used locations for each sheep, within each period
of analysis, at the study area and regional scales. I obtained a cumulative total of 60,912
used locations for analysis of habitat use and selection across all scales of analysis. I
developed a cumulative total of 60,780 unused locations for both the regional and study
area scale, and 132,624 unused locations at the scale of home range. Small home range
sizes resulted in difficulty generating random points greater than 45 m from used
locations for 10 sheep/period combinations. Any sheep/period with < 20 randomly
unused locations was omitted from the analysis (n=10).
Sorties
There were significantly more (P < 0.001) sorties entering MOA 1 per day during
MFE’s (X̄ = 45.4, SE = 3.97, n = 128 days) than during RFD’s (X̄ = 14.6, SE = 0.79, n =
407 days; Table 3). Mean number of daily sorties entering MOA 1 differed significantly
among years (P < 0.026), and among periods within years (P < 0.001) (Table 3).

25
% M
CP
Are
a
0
20
40
60
80
100
0 20 40 60 80
Number of locations Fig. 4. Relationship between number of GPS locations and percent of maximum home range size of 17 female Dall’s sheep, June 26 – July 9, in the Cirque Lakes and West Point study areas, Yukon-Tanana uplands, Alaska, 1999. A generalized Von Bertalanffy growth curve with 95% confidence intervals and an intercept forced at 0 was fit to the data. On average, sheep obtained 94.8 % +/- 2.1 of their maximum home range size with 50 locations. Maximum number of observed locations ranged from 58 – 85 with 16 sheep having > 75 locations.

26
Table 3. Mean number of daily sorties entering Military Operations Area 1 (MOA), Yukon-Tanana uplands, Alaska, 1999-2002. Significant differences existed between years (P < 0.026), and between periods within years (P < 0.001). Major Flying Exercises (MFE’s) are indicated with bold italics. Periods 1-9 were sequential, approximately 2week periods, beginning around April 1, and ending around August 10. Variation in period dates among years was a result of assigning periods to scheduled MFE’s.
1999 2000 2001 2002 Period Mean 95% CI Mean 95% CI Mean 95% CI Mean 95% CI
1 23.4 +/- 11.0 19.1 +/- 9.1 11.0 +/- 6.2 13.5 +/- 7.7 2 18.3 +/- 8.0 23.6 +/- 13.5 14.3 +/- 5.9 29.6 +/- 13.9 3 17.9 +/- 7.9 9.4 +/- 4.9 44.4 +/- 18.8 15.5 +/- 11.3 4 11.6 +/- 6.1 7.9 +/- 4.4 21.0 +/- 12.0 10.4 +/- 7.9 5 13.5 +/- 7.5 4.6 +/- 3.3 12.5 +/- 7.1 7.7 +/- 5.7 6 24.1 +/- 10.4 12.7 +/- 6.6 22.6 +/- 9.8 55.2 +/- 22.5 7 18.3 +/- 11.9 11.6 +/- 7.9 13.2 +/- 7.4 6.8 +/- 4.4 8 59.0 +/- 25.6 15.4 +/- 6.1 37.4 +/- 21.0 94.4 +/- 35.5 9 13.5 +/- 7.3 13.3 +/- 6.2 30.3 +/- 20.2 14.8 +/- 9.0

27
The USAF documented sorties entering MOA 1 on 44 days that field crews were
observing sheep and observed military overflight activity in the Cirque Lakes and West
Point study areas (Lawler et al. 2004). The proportion of sorties that were observed by
Lawler et al. (2004) in MOA 1 ranged from a high of 28.0% at West Point during May 9
–18, 2000, to a low of 1.2% at Cirque Lakes during February 21 – March 5, 2000 (Table
4). The rate of sorties observed ranged from 0.12 – 8.00 per hour, while the number of
sorties entering MOA 1 ranged from 1 – 50 per day (Lawler et al. 2004). Linear
regression revealed a weak positive relationship (r2 = 0.25) between the number of flights
observed and the total number of sorties entering MOA 1 during the same time period.
During 600 hours of sheep observations, Lawler et al. (2004) observed 376
military aircraft of which 28 (7.4%) were categorized as low (below 1524 m) and close
(<1.6 km away). I estimated that the number of sorties that would have been low within
MOA 1 ranged from a low of 4.8 during June 5-20, 2000, to a high of 112.5 during July
11-26, 2002 (Fig. 5).
Behavior
A visual inspection of the bivariate plots revealed little evidence of an increasing
trend between sorties, home range size and movement rates (Fig. 6-8). Further, the trend
did not exhibit a monotonic increase with the number of sorties and means were highly
variable. The nested ANCOVA analytical approach revealed home range size differed
between study areas (P < 0.001), and among periods within years within study areas (P <
0.001). Based upon univariate R2 statistics, study area and period accounted for 62% of
the variation in home range size. Home range size was larger, (P < 0.001) for sheep in

28 Table 4. Comparison of the total number of sorties entering MOA 1 with the number of military overflights observed by Lawler et al. (2004), at the Cirque Lakes (CL) and West Point (WP) study areas within the Yukon-Tanana uplands, Alaska, 2000-2001. Year Field Dates Sorties # observed CL % observed CL # observed WP % observed WP 2000 Feb. 21 -Mar. 5 460 6 1.3 12 2.6
April 10-21 276 22 8.0 12 4.3 May 9 - 18 82 5 6.1 23 28.0
July 15 -21 97 2 2.1 10 10.3
2001 March 13-24 295 27 9.2 50 16.9 May 6-16 521 109 20.9 23 4.4 June 7-21 349 22 6.3 34 9.7
July 22 - Aug. 2 356 9 2.5 7 2.0

29
Estimated N umber of Low and Close Sorties
0
30
60
90
120
early April early May early June early July early August
So
rtie
s
1999 2000 2001 2002
Fig 5. Estimated number of low (below 1524 m) and close (<1.6 km away) sorties entering Yukon MOA 1, Yukon-Tanana uplands, during approximate 2-week periods, early-April through early-August, 1999-2002.

30
250
200
150
100
50
0
0 20 40 60 80 100
Sorties Per Day
450
400
350
300
250
200
150
100
50
0 0 20 40 60 80 100 120
Sorties Per Day
Fig. 6. Bivariate plots depicting the relationship between sorties entering MOA 1 and female Dall’s sheep home range size (top panel) and the minimum distance traveled per hour (lower panel) in the Cirque Lakes and West Point study areas, Yukon-Tanana uplands, Alaska, 1999-2002.
MC
P K
M2
Met
ers
Per H
our
120

31
0
20
40
60
80
100
120
10 20 30 40 50 60 70 80 90 100
Sorties Per Day
MCP
KM
2
Cirque Lakes West Point
0
50
100
150
200
250
10 20 30 40 50 60 70 80 90 100
Sorties Per Day
Met
ers
Per H
our
Cirque Lakes West Point
Fig. 7. Average home range size and movement rates in relation to the number of sorties entering MOA 1 for female Dall’s sheep in the Cirque Lakes (CL) and West Point (WP) study areas, Yukon-Tanana uplands, Alaska, 1999-2002.

32
0 20 40
60 80
100 120 140
10 20 30 40 50 60 70 80 90 100
Sorties Per Day
MC
P K
M2
1 2 3 4 5 6 7 8 9
0
50
100
150
200
250
300
350
10 20 30 40 50 60 70 80 90 100
Sorties Per Day
Met
ers
Per H
our
1 2 3 4 5 6 7 8 9
Fig. 8. Average home range size and movement rates in relation to the number of sorties entering MOA 1 for female Dall’s sheep, by 2 week sequential time periods, Yukon-Tanana uplands, Alaska, 1999-2002.

33
West Point (X̄ = 44.3 km2, SE = 3.2) than Cirque Lakes (X̄ = 13.1 km2, SE = 3.9; (Fig.
9)). The sorties covariate provided no additional explanatory power of home range size,
after accounting for the effects of study areas, and periods within years within study areas
(P = 0.319).
The nested ANCOVA analytical approach revealed movement rates differed
between study areas (P < 0.001), and among periods within years within study areas (P <
0.001). Study area and period accounted for 64% of the variation in home in movement
rates. Mean minimum distance traveled per hour was longer (P < 0.001) for sheep in
West Point (X̄ = 122.6 m, SE = 3.8) than Cirque Lakes (X̄ = 102.4 m, SE = 3.9, (Fig.
10)). The sorties covariate provided no additional explanatory power of movement rates,
after accounting for the effects of study areas, and periods within years within study areas
(P = 0.660).
The factorial ANCOVA yielded similar results to the nested design; home range
size differed between study areas and the interaction of study area and period was
supported. For home range size, neither sorties (P>0.997) nor any of the two-way
interactions between sorties and study area (P=0.076), year (P=0.298), or period
(P=0.535) were a significant source of variation. Movement rates differed between study
areas and the data supported study area by year, study area by period, and year by period
interactions. Neither sorties (P=0.851) nor any two-way interactions between sorties and
study area (P=0.071), year (P=0.058), or period (P=0.206) were a significant source of
variation in movement rates.

34
Home Range Size, Cirque Lakes
0 40 80
120 160 200
early Ap ril
(1)
early May
(3 )
early June
(5)
early July
(7)
ea rly Augu st
(9 )
Time Period
KM
2
1999 2000 2001 2002
Home Range Size, West Point
0
40
80
120
160
200
early April
(1 )
early May
(3)
early June
(5)
ea rly July
(7)
early Augu st
(9 )
Time Period
KM2
1999 2000 2001 2002
Fig. 9. Mean home range size of female Dall’s sheep in the Cirque Lakes and West Point study areas, Yukon-Tanana uplands, Alaska, 1999-2002.

35
M inimum Distance Moved per Hour, Cirque Lakes
0 50
100 150 200 250 300
early April
(1 )
early May
(3)
early June
(5)
early Ju ly
(7)
early August
(9)
Time Period
Met
ers
per
hour
1999 2000 2001 2002
Minimum Distance Moved Per Hour, West Point
0 50
100 150 200 250 300
early April
(1 )
early May
(3)
early June
(5)
ea rly July
(7)
early August
(9)
Time Period
Met
ers
per H
our
1999 2000 2001 2002
Fig. 10. Mean minimum distance moved per hour by female Dall’s sheep in the Cirque Lakes and West Point study areas, Yukon-Tanana uplands, Alaska, 1999-2002.

36
Habitat Use at the Scale of Home Range
Pearson’s correlation coefficients indicated multicollinearity between elevation
and forest landcover (r = 0.87). I omitted elevation from my habitat use data, and
performed MANCOVA on my reduced data sets. Excluding elevation from my analyses
did not change the overall significance or coefficients from those results obtained from
the complete data set. Results from models with elevation included are reported below.
Use of landcover class (Fig. 11-13), aspect (Fig. 14-17), terrain ruggedness (Fig.
18), slope (Fig. 19), and elevation (Fig. 20) differed between study areas (Wilks' Lambda,
F9, 514 = 151.83, P < 0.001), among years within each study area (Wilks' Lambda, F54, 2626
= 8.82, P < 0.001), and among periods within years within study areas (Wilks' Lambda,
F576, 4609 = 3.01, P < 0.001). Study area, year, and period accounted for 29.7 – 61.2 % of
the variation in habitat use and best explained variation in use of herbaceous/shrub
landcover (61.2%; Fig. 12) proportional use of north aspect (56.5%; Fig. 14), and use of
rugged terrain (42.5%; Fig. 18). Mean proportional use of herbaceous/shrub landcover
was significantly higher (P < 0.001) in West Point (X̄ = 33.4 %, SE = 1.0) than Cirque
Lakes (X̄ = 12.6 %, SE = 0.8, Fig. 12). In both study areas mean proportional use of
north aspect accounted for less than 25% of the aspect usage; however, use of north
aspect was greater (P < 0.001) at West Point (X̄ = 10.5 %, SE = 0.5) than Cirque Lakes
(X̄ = 7.2 %, SE = 0.5, Fig. 14). In both study areas there was increased proportional use
of north (Fig. 14) and east aspects (Fig. 17), and decreased proportional use of south
aspects (Fig. 15) as summer progressed. Sheep at Cirque Lakes used steeper slopes (X̄ =

37
Use of Forest Landcover at West Point
0 20 40 60 80
early April
(1)
early May
(3)
early June
(5)
early July
(7)
early August
(9)
Time Period
% u
se
1999 2000 2001 2002
Use of Forest Landcover at Cirque Lakes
0 20 40 60 80
early April
(1)
early May
(3)
early June
(5)
early July
(7)
early August
(9)
Time Period
% u
se
1999 2000 2001 2002
Fig. 11. Mean proportional use of forest landcover by female Dall’s sheep in the Cirque Lakes and West Point study areas, Yukon-Tanana uplands, Alaska, 1999-2002.

38
Use of Herbaceous/Shrub Landcover at Ci rque Lake s
0 10 20 30 40 50 60 70
early A pril early M ay e arly June early July early August
Time Peri od
% u
s e
1999 20 00 2001 200 2
Use of Herbace ous/Shrub Landcover at W est Point
0 10 20 30 40 50 60 70
early A pril early M ay e arly June early July early August
Time Period
% u
s e
1999 20 00 2001 200 2
Fig. 12. Mean proportional use of herbaceous/shrub landcover by female Dall’s sheep in the Cirque Lakes and West Point study areas, Yukon-Tanana uplands, Alaska, 19992002.

39
Use of Sparse Vegata tion Lanc ove r at Cirque Lakes
0
20
40
60
80
10 0
early April early May early June early July early August Time Period
% u
se
1999 2000 2001 2002
Use of Sparse Vegata tion La ndcover a t W est Poi nt
0
20
40
60
80
100
early April early May early June early July early August Time Peri od
% u
se
1999 20 00 200 1 2002
Fig. 13. Mean proportional use of sparse landcover by female Dall’s sheep in the Cirque Lakes and West Point study areas, Yukon-Tanana uplands, Alaska, 1999-2002.

40
Use of North Aspect at Cirque Lakes
0
10
20
30 40
early April
(1)
early May
(3)
early June
(5)
early July
(7)
early August
(9)
Time Period
% u
s e
1999 2 000 2001 20 02
Use of North Aspect at West Point
0
10
20
30
40
early April early May early June early July early August
Time Period
% u
se
1999 2000 2001 2002
Fig. 14. Mean proportional use of north aspect by female Dall’s sheep in the Cirque Lakes and West Point study areas, Yukon-Tanana uplands, Alaska, 1999-2002.

41
Use of South Aspect at Cirque Lakes
0 10 20 30 40 50 60 70 80
early April early May early June early July early August
Time Period
% u
se
1999 2000 2001 2002
Use of South Aspect at W est Point
0 10 20 30 40 50 60 70 80
early A pril early M ay e arly June early July early August
Time Period
% u
s e
199 9 2000 2001 2002
Fig. 15. Mean proportional use of south aspect by female Dall’s sheep in the Cirque Lakes and West Point study areas, Yukon-Tanana uplands, Alaska, 1999-2002.

42
Use of West Aspect at Cirque Lakes
0 10 20 30 40 50 60 70 80
early A pril early May e arly June early July early August
Time Period
% u
s e
199 9 200 0 2001 2 002
Use of West Aspect at West Point
0
10 20
30 40
50
60 70
80
early April early May early June early July early August
Time Period
% u
se
1999 2000 2001 2002
Fig. 16. Mean proportional use of west aspect by female Dall’s sheep in the Cirque Lakes and West Point study areas, Yukon-Tanana uplands, Alaska, 1999-2002.

43
Use of Ea st Aspe ct at Cirque La kes
0
10
20
30
40
50
60
e arly April early May early Ju ne ea rly July early Au gust
Time Period
% u
se
1999 20 00 2001 200 2
Us e of East Aspect at West Point
0
10
20
30
40
50
60
e arly April early May early Ju ne early July early Au gust
Time Period
% u
se
1999 200 0 200 1 20 02
Fig. 17. Mean proportional use of east aspect by female Dall’s sheep in the Cirque Lakes and West Point study areas, Yukon-Tanana uplands, Alaska, 1999-2002.

44
Av erage Terain Rugge dness Index Used at Cirque La kes
0
20
40
60
80
10 0
12 0
early A pril early May early Jun e early July early Au gust
Time Pe ri od
Ter
rain
R ug
ged
nes
s in
dex
1999 2000 2001 2 002
Avera ge Terra in Ruggedness Index Used at West Point
0
20
40
60
80
100
120
early April early M ay early Jun e e arly July early August
Time P eriod
Terr
a in
Ru
gged
nes
s i n
dex
1999 2000 2001 2 002
Fig. 18. Mean terrain ruggedness used by female Dall’s sheep in the Cirque Lakes and West Point study areas, Yukon-Tanana uplands, Alaska, 1999-2002.

45
Average P ercent Slope Used at Cirque Lakes
0
20
40
60
80
ea rly April early M ay early Ju ne early July early A ugust
Time Period
% S
lop
e
1999 20 00 2001 2002
Average Percent Slope Use d at W est Point
0
20
40
60
80
early A pril early May early June early July early August
Time P eriod
% S
lop
e
1999 20 00 2001 200 2
Fig. 19. Mean percent slope used by female Dall’s sheep in the Cirque Lakes and West Point study areas, Yukon-Tanana uplands, Alaska, 1999-2002.

46
Average Elevation Used at Cirque Lakes
0
400
800
1200
1600
2000
early April early May early June early July ealy August
Time Period
met
ers
1999 2000 2001 2002
Average Elevation Used at West Point
0
400
800
1200
1600
2000
early April early May early June early July early August
Time Period
met
ers
1999 2000 2001 2002
Fig. 20. Mean elevation used by female Dall’s sheep in the Cirque Lakes and West Point study areas, Yukon-Tanana uplands, Alaska, 1999-2002.

47
54.5 %, SE = 0.3, P < 0.001) and more rugged terrain (X̄ = 75.5 %, SE = 1.0, P < 0.001)
than sheep at West Point (X̄ = 48.0 %, SE = 0.3, Fig. 19; X̄ = 70.5 %, SE = 0.7, Fig. 18).
Conversely, sheep at West Point used higher elevations (X̄ = 1,336 m, SE = 6.5, P <
0.001) than sheep at Cirque Lakes (X̄ = 1,175 m, SE = 23.8, Fig. 20). The sorties
covariate provided no additional explanatory power of habitat use after the variation of
the class effects was accounted for (Wilks' Lambda, F9, 514 = 1.24, P = 0.270).
Habitat Selection at the Scale of Home Range
Sheep selection of landcover class (Fig. 21-23), aspect (Fig. 24-27), terrain
ruggedness (Fig. 28), slope (Fig. 29), and elevation (Fig. 30) at the scale of home range
differed between study areas (Wilks' Lambda, F10, 503 = 26.79, P < 0.001), among years
within study areas (Wilks' Lambda, F60, 2640 = 4.96, P < 0.001), and among periods within
years within study areas (Wilks' Lambda, F640, 5005 = 2.38, P < 0.001). The number of
sorties was associated with sheep selection of habitat at the scale of home range (Wilks'
Lambda, F10, 503 = 5.73, P<0.001). Sorties decreased selection of herbaceous/shrub
landcover (Fig. 22; P = 0.015), while increasing selection of sparse vegetation landcover
(Fig. 23; P < 0.001), east aspect (Fig. 27; P = 0.088), south aspect (Fig. 25; P = 0.006),
and steeper slopes (Fig. 29; P = 0.011). The sorties covariate only accounted for 1.1% of
the variation in selection of herbaceous/shrub landcover, 3.5% of the variation in
selection of sparse vegetation landcover, 0.2% of the variation in selection of east aspect,
<0.01% of the variation in selection of south aspect, and <0.01% of the variation in
selection slope selection ratios. Study area, year, period, and sorties accounted for 17.9 –
41.3% of the variation in habitat selection at the scale of home range, and best explained

48
Regional Selection Ratios for forest landcover (CL)
0.00
1.00
2.00
3.00
early April early May early June early July early August
Time Period
U /
A
1999 2000 2001 2002
Regional Selection Ratios for forest landcover(WP)
0.00
1.00
2.00
3.00
early April early May early June early July early August
Time Period
U /
A
1999 2000 2001 2002
Study Area Selection Ratios for forest landcover (CL)
0.00
1.00
2.00
3.00
4.00
early April early May early June early July early August
Time Period
U /
A
1999 2000 2001 2002
Study Area Selection Ratios for forest landcover (WP)
0.00
1.00
2.00
3.00
4.00
early April early May early June early July early August
Time Period
U /
A
1999 2000 2001 2002
Home Range Selection Ratios for forest landcover (CL)
0.00
2.00
4.00
6.00
8.00
early April early May early June early July early August
Time Period
U /
A
1999 2000 2001 2002
Home Range Selection Ratios for forest landcover (WP)
0.00
2.00
4.00
6.00
8.00
early April early May early June early July early August
Time Period
U /
A
1999 2000 2001 2002
Fig. 21. Selection ratios for forest landcover by female Dall’s sheep in the Cirque Lakes (CL) and West Point (WP) study areas, Yukon-Tanana uplands, Alaska, 1999-2002.

49
Regional Selection Ratios for herbaceous/shrubs landcover (CL)
0. 00
1. 00
2. 00
3. 00
early April early May early June early July early August
Time Period
U /
A
1999 2 000 200 1 2002
Regional Selection Ratios for herbaceous/shrubs landcover (W P)
0.00
1.00
2.00
3.00
early April early May early June early July early August
Time Period
U /
A
1999 2000 200 1 2002
Study Area Se lection Ratios for herbaceous/shrubs landcover (CL)
0. 00
1. 00
2. 00
early April early May early June early July early August Time Period
U /
A
1999 2000 2001 2002
Study Area Se lection Ratios for herbaceous/shrubs landcover (W P)
0. 00
1. 00
2. 00
early April early May early June early July early August Time Period
U /
A
1999 2000 2001 2002
Home Range Selection Ratios for herbaceous/shrubs landcover (CL)
0.00
1.00
2.00
3.00
4.00
early April early May early June early July early August
Time Period
U /
A
1999 2000 20 01 200 2
Home Range Selection Ratios for herbaceous/shrubs landcover (W P)
0.00
1.00
2.00
3.00
4.00
early April early May early June early July early August
Time Period
U /
A
1999 2000 200 1 2002
Fig. 22. Selection ratios for herbaceous/shrub landcover by female Dall’s sheep in the Cirque Lakes (CL) and West Point (WP) study areas, Yukon-Tanana uplands, Alaska, 1999-2002.
50
Fig. 23. Selection ratios for sparse vegetation landcover by female Dall’s sheep in the Cirque Lakes (CL) and West Point (WP) study areas, Yukon-Tanana uplands, Alaska, 1999-2002.
Regional Selection Ratios for sparse vegetation landcover (CL)
0.00
2.00
4.00
6.00
8.00
10.00
early April early May early June early July early August
Time Period
U /
A
1999 2000 2001 2002
Regional Selection Ratios for sparse vegetation landcover (WP)
0.00
2.00
4.00
6.00
8.00
10.00
early April early May early June early July early August
Time Period
U /
A
1999 2000 2001 2002
Study Area Selection Ratios for sparse vegetation landcover (CL)
0
1
2
3
4
5
early April ear ly May early June early July early August
Time Period
U /
A
1999 2000 2001 2002
Study Area Selec tion Ratios for sparse vegetati on landcover (WP)
0.00
1.00
2.00
3.00
4.00
5.00
early April early May earl y June earl yJuly earlyAugust
Time Period
U /
A
19 99 2000 2001 20 02
Home Ra nge Se lection Ratios for sparse vege tation landcove r (CL)
0.00
5.00
10. 00
15. 00
20. 00
early April early May early June early July early August Time Period
U /
A
1999 2000 2001 2002
Home Ra nge Se lection Ratios for sparse vegetation landcover (WP)
0.00
5.00
10.00
15.00
20.00
earl y April early May early June early July early August
Time Period
U /
A
1999 2000 2001 2002

51
Regional Selection Ratios for north aspect (CL)
0.00
1.00
2.00
early April early May early June early July early August
Time Period
U /
A
1999 2000 2001 2002
Regional Selection Ratios for north aspect (WP)
0.00
1.00
2.00
early April early May early June early July early August
Time Period
U /
A
1999 2000 2001 2002
Study Area Selection Ratios for north aspect (CL)
0.00
1.00
2.00
early April early May early June early July early August
Time Period
U /
A
1999 2000 2001 2002
Study Area Selection Ratios for north aspect (WP)
0.00
1.00
2.00
early April early May early June early July early August
Time Period
U /
A
1999 2000 2001 2002
Home Range Selection Ratios for north aspect (CL)
0.00
1.00
2.00
3.00
4.00
early April early May early June early July early August
Time Period
U /
A
1999 2000 2001 2002
Home Range Selection Ratios for north aspect (WP)
0.00
1.00
2.00
3.00
4.00
ear ly April early May ear ly June ear ly July ear ly August
Time Period
U /
A
1999 2000 2001 2002
Fig. 24. Selection ratios for north aspect by female Dall’s sheep in the Cirque Lakes (CL) and West Point (WP) study areas, Yukon-Tanana uplands, Alaska, 1999-2002.

52
Regional Selection Ratios for south aspect (CL)
0.00
1.00
2.00
3.00
4.00
early April early May early June early July early August
Time Period
U /
A
1999 2000 2001 2002
Regional Selection Ratios for south aspect (WP)
0.00
1.00
2.00
3.00
4.00
ear ly April early May ear ly June ear ly July ear ly August
Time Period
U /
A
1999 2000 2001 2002
Study Area Selection Ratios for south aspect (CL)
0.00
2.00
4.00
6.00
8.00
early April early May early June early July early August
Time Period
U /
A
1999 2000 2001 2002
Study Area Selection Ratios for south aspect (WP)
0.00
2.00
4.00
6.00
8.00
early April early May early June early July early August
Time Period
U /
A
1999 2000 2001 2002
Home Range Selection Ratios for south aspect (CL)
0.00
5.00
10.00
15.00
early April early May early June early July early August
Time Period
U /
A
1999 2000 2001 2002
Home Range Selection Ratios for south aspect (WP)
0.00
5.00
10.00
15.00
early Apr il early May early June early July ear ly August
Time Period
U /
A
1999 2000 2001 2002
Fig. 25. Selection ratios for south aspect by female Dall’s sheep in the Cirque Lakes (CL) and West Point (WP) study areas, Yukon-Tanana uplands, Alaska, 1999-2002.

53
Regional Selection Ratios for west aspect (CL)
0.00
1.00
2.00
3.00
4.00
early April early May early June early July early August
Time Period
U /
A
1999 2000 2001 2002
Regional Selection Ratios for west aspect (WP)
0.00
1.00
2.00
3.00
4.00
early April early May early June early July early August
Time Period
U /
A
1999 2000 2001 2002
Study Area Selection Ratios for west aspect (CL)
0.00
2.00
4.00
6.00
8.00
10.00
early April early May early June early July early August
Time Period
U /
A
1999 2000 2001 2002
Study Area Selection Ratios for west aspect (WP)
0.00
2.00
4.00
6.00
8.00
10.00
early April early May early June early July early August
Time Period
U /
A
1999 2000 2001 2002
Home Range Selection Ratios for w est aspect (CL)
0.00
5.00
10.00
15.00
20.00
25.00
30.00
ear ly April ear ly May ear ly June early July ear ly August
Time Period
U /
A
1999 2000 2001 2002
Home Range Selection Ratios for west aspect (WP)
0.00
5.00
10.00
15.00
20.00
25.00
30.00
early April early May early June early July early August
Time Period
U /
A
1999 2000 2001 2002
Fig. 26. Selection ratios for west aspect by female Dall’s sheep in the Cirque Lakes (CL) and West Point (WP) study areas, Yukon-Tanana uplands, Alaska, 1999-2002.
54
Regional Selection Ratios for east aspect (CL)
0.00
1.00
2.00
3.00
ear ly April ear ly May early June ear ly July early August
Time Period
U /
A
1999 2000 2001 2002
Regional Selection Ratios for east aspect (WP)
0.00
1.00
2.00
3.00
early April early May early June early July early August
Time Period
U /
A
1999 2000 2001 2002
Study Area Selection Ratios for east aspect (CL)
0.00
1.00
2.00
early Apr il early May ear ly June ear ly July early August
Time Period
U /
A
1999 2000 2001 2002
Study Area Selection Ratios for east aspect (WP)
0.00
1.00
2.00
early April early May early June early July early August
Time Period
U /
A
1999 2000 2001 2002
Home Range Selection Ratios for east aspect (CL)
0.00
1.00
2.00
3.00
4.00
5.00
early April early May early June early July early August
Time Period
U /
A
1999 2000 2001 2002
Home Range Selection Ratios for east aspect (WP)
0.00
1.00
2.00
3.00
4.00
5.00
early April early May early June early July early August
Time Period
U /
A
1999 2000 2001 2002
Fig. 27. Selection ratios for east aspect by female Dall’s sheep in the Cirque Lakes (CL) and West Point (WP) study areas, Yukon-Tanana uplands, Alaska, 1999-2002.

55
Regional Selection Ratios for terrain ruggedness (CL)
0.00
1.00
2.00
early April early May early June early July early August
Time Period
U /
A
1999 2000 2001 2002
Regional Selection Ratios for terrain ruggedness (WP)
0.00
1.00
2.00
early April early May early June early July early August
Time Period
U /
A
1999 2000 2001 2002
Study Area Selection Ratios for terr ain r uggedn ess (C L)
0.00
1.00
2.00
3.00
early A pri l early M ay early J une earl y Jul y earl y Augus t
Tim e P erio d
U /
A
1999 2000 2001 2002
Study Area Selection Ratios for terrain ruggedness (WP)
0.00
1.00
2.00
3.00
ear ly April early May ear ly June early July early August
Time Period
U /
A
1999 2000 2001 2002
Home Range Selection Rati os for Terrain Ruggedness (CL)
0. 00
1. 00
2. 00
earlyApril early May early June early July early August
Time Peri od
U /
A
1999 2000 2001 2002
Home Range Se lection Rati os for Terrain Ruggedness (W P)
0.00
1.00
2.00
early Apri l early May early June early July early August
Time Peri od
U /
A
199 9 2000 2 001 2002
Fig. 28. Selection ratios for terrain ruggedness index by female Dall’s sheep in the Cirque Lakes (CL) and West Point (WP) study areas, Yukon-Tanana uplands, Alaska 1999-2002. Selection ratios > 1 represented selection for higher than mean unused, while selection ratios < 1 represented selection of lower than mean unused.

56
Regional Selection Ratios for percent slope (CL)
0.00
1.00
2.00
3.00
4.00
early April early May early June early July early August
Time Period
U /
A
1999 2000 2001 2002
Regional Selection Ratios for percent slope (WP)
0.00
1.00
2.00
3.00
4.00
early April early May early June early July early August
Time Period
U /
A
1999 2000 2001 2002
Study Area Selection Ratios for percent slope (CL)
0.00
1.00
2.00
3.00
4.00
early April early May early June early July early August
Time Period
U /A
1999 2000 2001 2002
Study Area Selection Ratios for percent slope (WP)
0.00
1.00
2.00
3.00
4.00
early April early May early June early July early August
Time Period
U /
A
1999 2000 2001 2002
Home Range Selection Ratios for percent slope (CL)
0.00
2.00
4.00
6.00
8.00
early April early May early June early July early August
Time Period
U /
A
1999 2000 2001 2002
Home Range Selection Ratios for percent slope (WP)
0.00
2.00
4.00
6.00
8.00
early April early May early June early July early August
Time Period
U /
A
1999 2000 2001 2002
Fig. 29. Selection ratios for percent slope by female Dall’s sheep in the Cirque Lakes (CL) and West Point (WP) study areas, Yukon-Tanana uplands, 1999-2002. Selection ratios > 1 represented selection for higher than mean unused, while selection ratios < 1 represented selection of lower than mean unused.

57
Regional Selection Ratios for Elevation (CL)
0.00
1.00
2.00
early April early May early June early July early August
Time Period
U /
A
Regional Selection Ratios for Elevation (WP)
0.00
1.00
2.00
early April early May early June early July early August
Time Period
U /
A
Study Area Selection Ratios for Ele vation (CL)
0.00
1.00
2.00
early April early May early June early July early August
Time Period
U /
A
Study Area Selection Ratios for Elevation (WP)
0.00
1.00
2.00
early April early May early June early July early August
Time Period
U /
A
Home Range Sele ction Ra tios for Eleva tion (CL)
0.00
1.00
2.00
early April early May early June earl yJuly early August
Time Peri od
U /
A
19 99 20 00 20 01 20 02
Home Range Sele ction Ra tios for E levation (WP )
0.00
1.00
2.00
early April earl y May early June early July early August
Ti me Period
U /
A
1999 2000 200 1 2002
Fig. 30. Selection ratios for elevation by female Dall’s sheep in the Cirque Lakes (CL) and West Point (WP) study areas, Yukon-Tanana uplands, 1999-2002. Selection ratios > 1 represented selection for higher than mean unused, while selection ratios < 1 represented selection of lower than mean unused.

58
variation in selection of herbaceous/shrub landcover (41.3%; Fig. 22), north aspect
(41.2%; Fig. 24), and rugged terrain (38.1%; Fig. 28). Relative to what was available in
their study area, sheep at West Point were more selective for rugged terrain (X̄ = 1.18, SE
= 0.01) than were those at Cirque Lakes (X̄ = 1.07, SE = 0.02; Fig. 28), while sheep at
Cirque Lakes selected steeper slopes (X̄ = 1.89, SE = 0.10) than those at West Point (X̄ =
1.18, SE = 0.01; Fig. 29). Sheep in both study areas selected sparse vegetation/rock
gravel land cover (X̄ = 1.25, SE = 0.04; X̄ = 2.19, SE = 0.22; Fig. 23), and southern
aspects (X̄ = 1.82, SE = 0.10; X̄ = 2.61, SE = 0.31; Fig. 25).
Habitat Selection at the Scale of Study Area
Sheep selection of landcover class (Fig. 21-23), aspect (Fig. 24-27), terrain
ruggedness (Fig. 28), slope (Fig. 29), and elevation (Fig. 30), and at the scale of study
area differed between study areas (Wilks' Lambda, F10, 513 = 150.84, P < 0.0001), among
years within study areas (Wilks' Lambda, F60, 2692 = 12.76, P < 0.0001), and among
periods within years within study areas (Wilks' Lambda, F640, 5104 = 3.32, P < 0.0001).
Study area, year, and period accounted for 15.7 – 68.6% of the variation in habitat
selection at the scale of study area, and best explained variation in selection of percent
slope (68.6%; Fig. 29), rugged terrain (58.2%; Fig. 28), and south aspect (56.8%; Fig.25).
Relative to what was available in their study area, sheep at Cirque Lakes selected steeper
slopes (X̄ = 1.88, SE = 0.04) than sheep at West Point (X̄ = 1.29, SE = 0.01; Fig. 29).
Sheep in both study areas selected rugged terrain (X̄ = 1.22, SE = 0.01; X̄ = 1.46, SE =
0.02; Fig. 28) and sparse vegetation/rock gravel land cover (X̄ = 1.60, SE = 0.04; X̄ =
1.74, SE = 0.06; Fig. 23). Sheep at Cirque Lakes selected south aspects (X̄ = 2.66, SE =

59
0.1) more than sheep at West Point (X̄ = 1.46, SE = 0.04; Fig. 25). The sorties covariate
did not add additional explanatory power to the assessment of habitat selection at the
scale of study area after accounting for the effects of study area, year within study area,
and period within year within study area (Wilks' Lambda, F10, 513 = 1.22, P = 0.273).
Habitat Selection at the Regional Scale
Sheep selection of landcover class (Fig. 21-23), aspect (Fig. 24-27), terrain
ruggedness (Fig. 28), elevation (Fig. 30), and slope (Fig. 29) at the regional scale differed
between study areas (Wilks' Lambda, F10, 513 = 76.66, P < 0.0001), among years within
study areas (Wilks' Lambda, F60, 2693 = 7.33, P < 0.0001), and among periods within years
within study areas (Wilks' Lambda, F640, 5104 = 2.69, P < 0.0001). Study area, year, and
period accounted for 25.7 - 59.4% of the variation in habitat selection at the regional
scale, and best explained variation in selection of herbaceous/shrub landcover (59.4%;
Fig. 22), north aspect (55.0%; Fig. 24), and rugged terrain (44.7%; Fig. 28). Relative to
what was available in their study area, sheep at West Point and Cirque Lakes selected
sparse vegetation/rock gravel land cover (X̄ = 4.04, SE = 0.12; X̄ = 3.57, SE = 0.10; Fig.
23), southern aspects (X̄ = 1.50, SE = 0.04; X̄ = 1.80, SE = 0.06; Fig. 25), rugged terrain
(X̄ = 1.28, SE = 0.13; X̄ = 1.37, SE = 0.02; Fig. 28) steep slopes (X̄ = 1.73, SE = 0.01;
X̄ = 1.96, SE = 0.03; Fig. 29), and higher elevations (X̄ = 1.28, SE = 0.01; X̄ = 1.12, SE
= 0.02; Fig. 30) relative to what was available in their study area. The sorties covariate
did not add additional explanatory power to the assessment of habitat selection at the
regional scale after accounting for the effects of study area, year within study area, and
period within year within study area (Wilks' Lambda, F10, 513 = 1.36, P = 0.197).

60
DISCUSSION
The number of sorties entering MOA 1 provided a region-wide estimate of
overflight intensity associated with ongoing military flight-training over the Yukon-
Tanana uplands; however, I had no data pertaining to flight paths, elevation, speed, or
duration. Sortie data revealed nearly a 3-fold increase in sorties during MFE’s; however,
Lawler et al. (2004) reported no significant difference between the number of overflights
observed during RFD’s and MFE’s in the vicinity of sheep in both study areas during
2000 and 2001. If flight paths were random within the MOA structure, I would assume
that an increase in the number of sorties launched would increase the probability of
individual sheep being overflown, but I found a weak relationship between the number of
sorties launched and the number of overflights observed by Lawler et al. (2004),
suggesting that the sortie data were most applicable to larger scale analyses.
Eight MFE’s occurred during the 4 years of study. My crude estimate of the
number of low and close sorties entering MOA 1 indicated considerable annual and
seasonal variation, with generally the highest number of low and close sorties occurring
during late July (Fig. 5). This criterion of low (below 1524 m) and close (<1.6 km away)
was broader than the criteria specified by other researchers examining the potential
effects of military aircraft on ungulate behavior (Harrington and Veitch 1991 (directed
overflights within 30 m AGL), 1992 (within 1 km); Maier et al. 1998 (directed
overflights within 30 m AGL); Krausman et al. 1998 (125 m AGL); Lawler et al. 2005
(slant distances of 30 m to 610 m or greater), however, the design of this study was
observational and focused on the potential effects of actual flight training activity. Given

61
the large size of MOA 1 (16,184 km2), the probability that any individual sheep was
overflown at low altitude was relatively low; therefore, the overall overflight intensity for
my study likely was low.
Lawler et al. (2004) examined potential effects of military overflights on female
Dall’s sheep behavior within the home range scale. Specifically, they examined Dall’s
sheep activity budgets, foraging efficiency, movement rates, home range size, and habitat
use and concluded that factors other than military overflights (e.g., study area, year,
period, group size, presence of lambs, and distance to rocky terrain) explained most
variation in sheep behavior (Lawler et al. 2004). Consistent with Lawler et al. (2004), I
did not detect an appreciable effect of the approximate 3-fold increase in sorties entering
MOA 1 during MFE’s on home range size, movement rates, habitat use, or habitat
selection at the regional, study area, or home range scale for female sheep within the
Cirque Lakes or West Point study areas compared to a baseline average intensity of 14.6
overflights per day during RFD’s.
My models suggested an effect of sorties on selection ratios for landcover class
and aspect at the home range scale, however, sorties explained <4% of the residual
variation in these selection ratios and there was no statistically significant effect at larger
scales. With the majority of variation in habitat selection at the scale of home range
attributed to year, season, and study area (17.9-41.3%), it is unlikely the variation
attributed to sorties I observed was causing biologically meaningful effects. For
example, rocky mountain elk (Cervus elaphus) demonstrated a dramatic shift in diet in
response to hunting pressure, decreasing their utilization of fescue meadows 87% to 34%

62
while shifting to habitat use of forest landcover and increasing their diet of browse in
parallel (Morgantini and Hudson 1995). Small changes in Dall’s sheep selection of
aspect, and a 3.2 % increase in selection of sparse vegetation landcover when they were
already highly selective for sparse vegetation landcover (Fig. 23) makes it difficult to
conclude there would be a biologically meaningful effect. Furthermore, if female Dall’s
sheep responded to military overflights with an anti-predator strategy (Frid and Dill
2002), I would expect they would have selected more rugged terrain, steeper slopes and
higher elevations with increasing sorties, and I did not detect these responses. I conclude
that variables other than military overflights (study area, year, period) were much more
important in explaining daily movement rates, home range size, habitat use and habitat
selection by female Dall’s sheep in the Yukon-Tanana uplands.
Population surveys conducted during 1997-2002 reported considerable variability
in the numbers of sheep counted within and among 8 sampling units within the Yukon-
Tanana uplands (Lawler et al. 2004; Appendix 3). However, region-wide, there was little
annual variability in the Dall’s sheep population within the Yukon-Tanana uplands
(Lawler et al. 2004). Moreover, no significant differences were detected in age ratios,
pregnancy rates, number of lambs per 100 ewes, number of yearlings per 100 ewes, and
survival of ewes between the Cirque Lakes and West Point study areas (Lawler et al.
2004). Given the results presented by Lawler et al. (2004) and results presented here, and
given the relative stability of sheep populations within the region, it is unlikely that
military operations over the Yukon-Tanana uplands were causing substantial biological
effect. While there is substantial evidence that helicopter activity has the potential to

63
negatively affect mountain sheep (Stockwell et al. 1991, Bleich et al. 1994, Frid 1999),
the lack of significant response of female Dall’s sheep in the Yukon-Tanana uplands to
military jet activity is consistent with that reported for other mountain sheep
(Weisenberger et al. 1996, Krausman et al. 1998, Krausman and Hervert 1983).
Increases in military training activities during MFE’s over MOA 1 and MOA 2, during
1999-2002 were unlikely to have caused deleterious effects to Dall’s sheep populations;
however, a substantial change in the quantity of background or maximum level of
overflights could potentially alter the conclusions drawn from my research.
During my study overflight activity in MOA 1 had a baseline level of
approximately 15 sorties per day during RFD’s with nearly a 3-fold increase in sorties
during MFE’s. The greatest overflight intensity during the course of my study occurred
in late July 2002 (period 8; Table 3), with an average of 94.4 +/- 35.4 sorties entering
MOA 1 per day. I may not have observed a level of overflight intensity necessary to
elicit an effect such as a shift in habitat use/selection. In addition, I examined areas that
had an extended history of military aviation activities (> 20 years), and visual and
auditory stimuli from these aircraft have been a continual and persistent part of the
environment since 1976 (Department of the United States Air Force, 1997). It is possible
that sheep had habituated to military overflights because multiple generations of sheep
had been exposed to military operations. Without any preexisting data on sheep behavior
and habitat use/selection in these study areas prior to the implementation of military
overflights it was impossible to determine if habituation had occurred.

64
Sample sizes of GPS-marked sheep for this research were limited. Girard et al.
(2006) demonstrated number of marked animals was more important than sampling
frequency in assessing habitat selection in moose (Alces alces). Necessary number of
animals varied spatially and temporally; however, < 12 individually marked moose would
not have permitted detection of habitat selection because inter-individual variability was
high (Girard et al. 2006). Similarly, sheep in my study areas displayed high inter-
individual variability as well as seasonal variability in habitat use and selection. I assume
that availability of resources for both moose and sheep change seasonally. Alldredge and
Ratti (1986) reported that Type II error rates (failing to reject the null hypothesis when it
is false) decreased with increased number of marked animals. Further, results from
simulation studies by Leban et al. (2001) suggested that a minimum sample of 20 animals
with at least 50 locations per animal was necessary to accurately estimate resource
selection. I had ≤ 10 GPS marked sheep per unique study area/year/period and thus the
possibility for a Type II error was potentially large. Although I failed to meet the
recommendations of Leban et al. (2001), I was able to statistically detect the effects of
sorties on habitat selection at the scale of home range, even when the effect size was
small. For example, in the best approximating model of habitat selection at the scale of
home range, the effect of sorties was statistically supported, but only explained 3.5% of
the variation in selection of sparse vegetation landcover.
While Dall’s sheep populations are limited by various factors (e.g., snow free
areas or quality of pastures in winter) (Hoefs and Cowan 1979, Seip and Bunnell 1985,
Hansen 1996), I failed to detect an effect of an increase in sorties associated with MFE’s

65
on Dall’s sheep habitat use/selection under the present scenario of USAF pilot training
over the Yukon-Tanana uplands. A by-product of this research is the quantification of
female Dall’s sheep habitat use/selection across multiple spatial scales, and establishing
baseline habitat selection data for sheep in this area. This baseline data will be useful in
future studies of Dall’s sheep habitat selection examining the effects of resource
development, climate change etc. Therefore, my results contribute to an understanding of
Dall’s sheep habitat ecology.
In the context of my thesis, I repeatedly measured home range size, movement
rates, habitat use, and habitat selection multiple times each year (1999, 2000, 2001, and
2002) in both the Cirque Lakes and West Point study areas. Specifically, within each
study area and each year, I sampled during 9 sequential 2-week periods. Therefore,
periods were nested within years, which were nested within study areas. While the design
was balanced (i.e. same number of periods within each year and study area), I assumed
there were confounding factors. I assumed habitat use and selection by Dall’s sheep
varied due to changing plant phenology and snow cover, though I did not directly
measure plant phenology or snow cover. I assumed differences between periods would
reflect changes in plant phenology and snow melt off. Annual variability in temperature
and precipitation likely caused variability in plant phenology. Furthermore, the effect of
period was likely confounded with study areas; as different study areas may have
inherently different patterns in plant phenology. In short, the utilization of a nested
design acknowledged the likelihood that study area, year and period were confounded.

66
In northern latitudes mountain sheep are generally limited to foraging areas with
snow depth less than 30 cm during the winter (Hoefs and Cowan 1979, Seip and Bunnell
1985, Hansen 1996), and patterns of diet selection can be affected by as little as 10 to 15
cm of snow (Hansen 1996). Because winter habitat is limited, winter home ranges are
generally smaller than summer home ranges. The extent and juxtaposition of winter
habitats largely determines seasonal movements of Dall’s sheep. For example, in the
western Brooks Range, sheep may occupy separate summer and winter ranges with
activity centers from 8.9 to 19.3 km apart (Ayers 1986). In contrast, some sheep in the
same general area occupy contiguous summer and winter ranges (Ayers 1986). In the
Mackenzie Mountains of the Northwest Territories, Simmons (1982) found that summer
and winter ranges overlapped, but summer ranges were 30-90% larger than winter ranges.
I found home range size of female Dall’s sheep within the West Point and Cirque Lakes
study areas were small during early April (X̄ = 3.81 KM2, SE = 0.58; X̄ = 2.72, SE =
0.02; Fig. 9) suggesting the sheep were restricted to winter range. In both study areas
home ranges expanded as summer progressed with sheep at West Point utilizing much
larger home ranges (X̄ = 139.33 KM2, SE = 10.84) than sheep at Cirque Lakes (X̄ =
25.78 KM2, SE = 6.27; Fig. 9). This pattern was also consistent for movement rates in
both areas; that is movement rates increased as summer progressed, ostensibly to take
advantage of high quality resources as they become available (Fig. 10).
Dall’s sheep have a limited and potentially variable amount of time to acquire
resources necessary for reproduction and over-winter survival (Rachlow and Bowyer
1998). To maximize protein intake during short summers, Dall’s sheep select vegetation

67
in early phenological stages when levels of crude protein and digestibility are high
(Whitten 1975, Winters 1980, Ayres 1986, Hansen 1996). Dall’s sheep in Denali
National Park demonstrated a shift in use of southern aspects to northern aspects as
summer progressed (Whitten 1975). Similarly, sheep in the eastern Alaskan Range
demonstrated an altitudinal shift from lower elevations to higher elevations as summer
progressed (Winters 1980). Therefore, in areas with greater topographic diversity (i.e.
aspects, slopes, ruggedness, and elevations), Dall’s sheep will have access to a greater
number of microclimates, and the amount of high-quality forage is expected to be
available over a longer period of time (Whitten 1975, Winters 1980).
Snow pack begins to melt first on south and west aspects. Vegetation
development occurs rapidly post melt-off. In my study, sheep shifted use from south and
west aspects to east and north aspects as summer progressed (Fig. 14-17). This shift was
most pronounced in the West Point study area (Fig.14-17). Interestingly, the selection of
aspect depended upon the scale of analysis. At West Point, there was no selection for
aspect at the scale of home range; however, seasonal shifts in selection of southern and
western aspects to eastern and northern aspects were detected at study area and regional
scales (Fig.24-27). Sheep at West Point selected higher elevations at the regional and
study area scale; however, at the home range scale there was little selection for higher
elevations until early July and after (Fig. 30)
Dall’s sheep are known to select rugged terrain. For example, in Denali National
Park, Rachlow and Bowyer (1998) found that female sheep selected areas close to escape
terrain (i.e., steep rugged areas). Furthermore, rugged terrain (indexed by subtracting

68
straight-line distances from those measured by following contour lines) was selected by
females during peak lambing. I detected consistent selection by female sheep for rugged
terrain at the regional and study area scale for both the West Point and Cirque Lakes
study areas (Fig. 28). However, sheep at Cirque Lakes were highly variable in selection
of rugged terrain and no patterns could be ascertained at the home range scale (Fig. 28).
Furthermore, sheep at West Point exhibited a distinct shift to no selection of rugged
terrain during the lambing period followed by a distinct shift to more rugged terrain
approximately 1 month post lambing at the study area and home range scale (Fig. 28). I
hypothesize that this delayed shift to rugged terrain may be driven in part by diversity of
microclimates in rugged terrain, which would promote a mosaic of high quality forage
during lactation.
Future Studies
Wildlife researchers are often tasked with identifying the effects of disturbance
events that are pre-existing. Inferences from such observational studies are often limited
because they lack characteristics of experimental studies, such as pre-treatment data,
comparable controls, and assigned treatments (Cook and Campbell 1979). For example,
my study would have greater inference strength if it had been possible to collect base-line
data before overflights commenced. I could have incorporated a quasi-control by
including another similar study area in which there were no overflights. This study
design is analogous to the ‘untreated control group design with pretest and posttest data
collection’ of Cook and Campbell (1979; p. 103). Assigning treatments, in the form of
overflights, would increase inference strength further. Treatments could include a variety

69
of overflight elevations or sound levels. However, the implementation of such a study
would be expensive, logistically difficult and resource managers may be reluctant to
intentionally expose wildlife to overflight activity. The results might also be confounded
by habituation.
The role of habituation in the study of overflights deserves special consideration
because there had been overflights for over 20 years within my study areas. Habituation
to overflights has consequences for both management and the interpretation of my
results. In a management context, habituation may allow sheep to adapt to overflight
disturbance and reduce any effects on levels of fitness. As such, habituation may be
positive. However, habituation complicates the interpretation and application of my
results; specifically, sheep elsewhere that have not been exposed to overflights may be
much more sensitive to overflights than what I observed.
Because of these complications, the most appropriate study design from a
management perspective is to collect pre- and post-treatment data on any population of
sheep that might be affected in the future. Because sheep may habituate, such studies
will have to be of long enough duration to document potential habituation. Monitoring
will be important, especially if populations do not habituate and begin to decline.

70
LITERATURE CITED
ALLDREDGE, J.R., AND J.T. RATTI. 1986. Comparison of some statistical
techniques for analysis of resource selection. Journal of Wildlife Management
50:157-165.
--------, AND -------- 1992. Further comparison of some statistical techniques for
analysis of resource selection. Journal of Wildlife Management 56:1-9.
AYERS, L.A. 1986. The Movement Patterns and Foraging Ecology of Dall Sheep (Ovis
Dalli dalli) in the Noatak National Preserve, Alaska. M.S. thesis, University of
California, Berkeley.
BERGER, J.D., DANKE, J. JOHNSON, AND S.H. BERWICK. 1983. Pronghorn
foraging economy and predator avoidance in a desert ecosystem: implications for the
conservation of large herbivores. Biological Conservation 25:193-208.
BLEICH, V.C., R.T. BOWYER, A.M. PAULI, M.C. NICHOLSON, AND R.W.
ANTHES. 1994. Mountain sheep Ovis canadensis and helicopter surveys:
Ramifications for the conservation of large mammals. Biological Conservation 70:1
7.
BOYCE, M.S., J.S. MAO, E.H. MERRILL, D. FORTIN, M.G. TURNER, J. FRYXELL,
AND P. TURCHIN. 2003. Scale and heterogeneity in habitat selection by elk in
Yellowstone National Park. Ecoscience 10:421-431.
COOK, T.D., AND D.T. CAMPBELL. 1979. Quasi-experimentation: design and
analysis issues for field settings. Houghton Mifflin Company, Boston, USA.

71
DEPARTMENT OF THE AIR FORCE. 1997. Final environmental impact statement,
Alaska Military Operation Areas, Record of decision. Eleventh Air Force, Elmendorf
Air Force Base, Alaska, USA.
--------. 2002. 11th Air Force Noise/Flight Sensitive Areas List. Effective: 1 August
2002. Eleventh Air Force, Elmendorf Air Force Base, AK.
DUCKS UNLIMITED, INC. 1998. Yukon-Charley/Black river/40mile earth cover
classification. Users guide. Ducks unlimited project number AK-0024-22-002. U.S.
Bureau of Land Management number 1422-D910-A4-0205.
FRID, A. 1999. Fleeing decisions by Dall’s sheep exposed to helicopter overflights.
Report submitted to Yukon Fish and Wildlife Branch, Department of Renewable
Resources, Whitehorse, YT.
--------, AND L. DILL. 2002. Human caused disturbance stimuli as a form of predation
risk. Conservation Ecology 6:(1): 11. [online] URL:
http://www.consecol.org/vol6/iss1/art11. Accessed 2008 Oct 2.
GEIST, V. 1971. Mountain sheep: a study in behavior and evolution. University of
Chicago Press, Chicago, Illinois, USA.
GILL, J.A., K. NORRIS, AND A.R. WATKINSON. 2001. Why behavioural responses
may not reflect the population consequences of human disturbance. Biological
Conservation 97:265-268.
GIRARD, I., J.P. OUELLET, R. COURTOIS, C. DUSSAULT, AND L. BRETON.
2002. Effects of sampling effort based on GPS telemetry on home-range size

72
estimations. Journal of Wildlife Management 66:1290-1300.
--------, --------, --------, --------, AND A. CARON. 2006. Balancing number of locations
with number of individuals in Telemetry studies. Journal of Wildlife Management 70:
1249-1256.
GRIMM, L.G., AND P.R. YARNOLD., editors. 1995. Reading and understanding
multivariate statistics. American Psychological Association. Washington, DC, USA.
HANSEN, C.H. 1996. Foraging ecology of female Dall's sheep in the Brooks Range,
Alaska. Dissertation, University of Alaska, Fairbanks, USA.
HARRINGTON, F.H. AND A.M. VEITCH. 1991. Short-term impacts of low-level jet
Fighter training on caribou in Labrador. Arctic 44:318-327.
--------, AND--------1992. Calving success of woodland caribou exposed to low-level jet
overflights. Arctic 45:213-218.
HOEFS, M., AND I.M. COWAN. 1979. Ecological investigation of a population of
Dall sheep (Ovis dalli dalli Nelson). Syesis 12, Suppl.1.
HOOGE, P.N., AND B. EICHENLAUB. 1997. Animal movement extension to arcview.
ver. 1.1. Alaska Science Center - Biological Science Office, U.S. Geological Survey,
Anchorage, AK, USA.
JOHNSON, D. H. 1980. The comparison of usage and availability measurements for
evaluating resource preference. Ecology 61:65-71.
JOHNSON, C.J., K.L. PARKER, D.C. HEARD, AND M.P. GILLINGHAM. 2002.

73
Movement parameters of ungulates and scale-specific responses to the environment.
Journal of Animal Ecology 71:225-235.
KELLEYHOUSE, D.G., AND W.E. HEIMER. 1989. Tanana Hills survey-inventory
report. Pages 103-109 in SO Morgan, editor. Annual report of survey-inventory
activities. Part II. Sheep. Volume XIX. Alaska Department of Fish and Game.
Federal Aid in Wildlife Restoration. Progress Report. Grant W-23-1. Juneau
KRAUSMAN, P.R., AND J.J. HERVERT. 1983. Mountain sheep responses to aerial
surveys. Wildlife Society Bulletin 11:372-375.
--------, Leopold, B.D. AND D.L. Scarbrough. 1986. Desert mule deer response to
aircraft. Wildlife Society Bulletin 14:68-70.
--------, M.C. WALLACE, C.L. HAYES, AND D.W. DEYOUNG. 1998. Effects of jet
aircraft on mountain sheep. Journal of Wildlife Management 62:1246-1254.
--------, L.K. HARRIS, C.L. BLASCH, K.K.G. KOENEN,AND J. FRANCINE. 2004.
Effects of military operations on behavior and hearing of endangered Sonoran
pronghorn. Wildlife Monographs 157:1-41.
LAWLER, J.P., B. GRIFFITH, D. JOHNSON, AND J. BURCH. 2004. Effects of
military jet overflights on Dall’s sheep in interior Alaska. Report to the
Department of the Air Force 11th U.S. Air Force, Elmendorf Air Force Base, Alaska.
--------, A.J. MAGOUN, C.T. SEATON, C.L. GARDNER, R.D. BOERTE, J.M. VER
HOEF, AND P.A. DEL VECCHIO. 2005. Short term impacts of military overflights
on caribou during calving season. Journal of Wildlife Management 69:1133-1146.

74
LEBAN, F.A., M.J. WISDOM, E.O. GARTON, B.K. JOHNSON, AND J.G. KIE. 2001.
Effect of Sample size on the performance of resource selection analyses. Pages 291
307 in MILLSPAUGH, J.J., AND J.M. MARZLUFF, editors. Radio Tracking and
Animal Populations. Academic Press, San Diego, California, USA.
LEVINS, R. 1968. Evolution in changing environments. Princeton University Press,
Princeton, New Jersey, USA.
MACARTHUR, R.A., V. GEIST, AND R.H. JOHNSTON. 1982. Cardiac and
behavioral responses of mountain sheep to human disturbance. Journal of Wildlife
Management 46: 351-358.
MAIER, J.A.K., S.M. MURPHY, R.G. WHITE, AND M.D. SMITH. 1998. Responses
to caribou to overflights by low-altitude jet aircraft. Journal of Wildlife Management
62: 752-766.
MANLY, B.F.J., L.L. MCDONALD, D.L. THOMAS, T.L. MCDONALD, AND W.P.
ERICKSON. 2002. Resource selection by animals: statistical design and analysis
for field studies. Second edition. Kluwer Academic Publishers, Norwell,
Massachusetts, USA.
MATHER, P.M. 1999. Computer processing of remotely sensed imagery. Second
edition. John Wiley, New York, New York, USA.
MCLAREN, I.A. 1993. Growth in pinnipeds. Biological Review. 68: 1-79.
MOHR, C.O. 1947. Table of equivalent populations of North American small mammals.
American Midland Naturalist. 37: 233-249.

75
MORGANTINI, L.E., AND R.J. HUDSON. 1985. Changes in diets of wapiti during a
hunting season. Journal of Range Management. 38: 77-79.
NICHOLSON, M.C., R.T. BOWYER, AND J.G. KIE. 1997. Habitat selection and
survival of mule deer: Tradeoffs associated with migration. Journal of Mammalogy
78: 483-504.
NEU, C.W., C.R. BYERS, AND J.M. PEEK. 1974. A technique for analysis of
utilization-availability data. Journal of Wildlife Management 50:541-545.
ORIANS, G.H., AND J.E. WITTENBERGER. 1991. Spatial and temporal scales in
habitat selection. American Naturalist. 137:29-49.
RACHLOW, J.L., AND R.T. BOWYER. 1991. Interannual variation in timing and
synchrony of parturition in Dall’s sheep. Journal of Mammalogy. 72:487-492.
--------, AND --------. 1998. Habitat selection by Dall's sheep (Ovis dalli): maternal
trade-offs. Journal of Zoology. 245: 457-465.
SAS Institute. INC. 1999. SAS/STAT user’s guide. Release 8.0 edition. SAS Institute.
INC. Cary, North Carolina, USA.
SEIP, D.R., AND F.L. BUNNELL. 1985. Foraging behaviour and food habits of Stone's
sheep. Canadian Journal of Zoology. 63:1638-1646.
SIMMONS, N.M. 1982. Seasonal ranges of Dall’s sheep, Mackenzie Mountains,
Northwest Territories. Arctic 35: 512-518.
STOCKWELL, C.A., G.C. BATEMAN, AND J. BERGER. 1991. Conflicts in national

76
parks: A case study of helicopters and bighorn sheep time budgets at the Grand
Canyon. Biological Conservation 56:317-328.
THOMAS, D.L., AND, E.J. TAYLOR. 1990. Study designs and tests for comparing
resource use and availability. Journal of Wildlife Management 54:322-330.
UNITED STATES GEOLOGICAL SURVEY. 2000. USGS Geospatial Data
Clearinghouse, National Mapping and Remotely Sensed Data: Digital Elevation
Models (DEMs). [online] URL: http://agdc.usgs.gov/data/usgs/geodata/dem/63K/.
Accessed 2008 Oct 2.
VIERECK, L.A., C.T. DRYNESS, A.R. BATTEN, AND K.J. WENZLIC. 1992. The
Alaska vegetation classification. General Technical Report PNW-GTR-286. Portland
OR: USDA FS, Pacific NW Research Station 278 pp.
WEISENBERGER, M.E., P.R. KRAUSMAN, M.C. WALLACE, D.W. DEYOUNG,
AND O.E. MAUGHAN. 1996. Effects of simulated jet aircraft noise on heart rate
and behavior of desert ungulates. Journal of Wildlife Management 60:52-61.
WHITTEN, K.R. 1975. Habitat relationships and population dynamics of Dall sheep
(Ovis dalli dalli) in Mt. McKinley National Park, Alaska. Thesis, University of
Alaska, Fairbanks, USA.
WIENS, J.A., 1989. Spatial scaling in ecology. Functional Ecology 3:385-397.
--------, N.C. STENSETH, B. VAN HORNE, AND R.A. IMS. 1993. Ecological
mechanisms and landscape ecology. Oikos 66:369-380.

77
WINTERS, J. F. 1980. Summer habitat and food utilization by Dall's sheep and their
relation to body and horn size. M.S. thesis, University of Alaska Fairbanks.

78
Appendix 1. Landcover types (n=25) derived from Landsat TM satellite earth cover classification maps characterized the Yukon-Tanana uplands, Alaska, 1999-2002 (Ducks Unlimited, Inc. 1998). The original Ducks Unlimited (1998) classifications of land cover types were based on the classification scheme of Viereck et al. (1992). To increase the power of statistical models, the original number of landcover classes was broadly reclassified to 4 classes (forest, herbaceous/shrub, sparse vegetation/rock gravel, unknown/non-habitat) based on dominant overstory.
Original Landcover Classification Reclassification Characteristic species Closed Needleleaf forest > 60% canopy, Picea spp. Open Needleleaf forest 25-60% canopy, Picea spp.
Open Needleleaf - Lichen forest 25-60% canopy, Picea spp., lichen 10-25% canopy, Picea, Alnus, Betula,
Woodland Needleleaf forest spp. 10-25% canopy, Picea, Alnus, Betula
Woodland Needleleaf - Lichen forest lichen spp. > 60% canopy, Alnus, Betula,and
Closed Deciduous - Birch forest Populus spp. 25-60% canopy Alnus, Betula,and
Open Deciduous forest Populus spp. Closed Mixed Needleleaf/Deciduous forest > 60% Alnus, Betula,and Picea spp. Open Mixed Needleleaf/Deciduous forest 25-60% Alnus, Betula,and Picea spp.
Tall Shrub herbaceous/shrub Alnus and Salix spp. Low Shrub herbaceous/shrub Betula and Salix spp.
Low Shrub - Lichen herbaceous/shrub Betula and Salix lichen spp. Low Shrub - Tussock herbaceous/shrub Betula and Erioferum spp.
Dwarf shrub herbaceous/shrub Dryas, Cassiope, Vaccinium spp. Dryas, Cassiope, Vaccinium lichen
Dwarf shrub - Lichen herbaceous/shrub spp. Dry Herbaceous herbaceous/shrub Carex spp. Tussock Tundra herbaceous/shrub Erioferum spp.
>50% barren, >20% vegetated. Poa Sparsely Vegetated sparse vegetation/rock gravel Carex spp.
Rock/Gravel sparse vegetation/rock gravel NA Non-Vegetated Soil sparse vegetation/rock gravel NA
Clouds unknown/non-habitat NA Cloud Shadows unknown/non-habitat NA Terrain Shadow unknown/non-habitat NA
Clear Water unknown/non-habitat NA Snow unknown/non-habitat NA

79 Appendix 2. Mean monthly temperatures (°C), and precipitation (cm) (National Weather Service), Eagle and Central, Alaska, 1999-2002. Weather Station Central, AK
Average High Temperature (°C)
Year 1999 2000 2001 2002
JAN -32.4 -29.6 -25.0 -27.2
FEB -23.4 -10.2 -11.7 -16.9
MAR -9.3 -3.8
-10.1 -3.8
APR 4.7 4.6 4.5 2.6
MAY 13.9 12.3 11.7 15.6
JUN 23.2 23.2 22.6 22.1
JUL 22.3 22.2 20.7 23.1
AUG 20.8 16.0 19.0 16.9
SEP 13.2 9.6
14.4 13.6
OCT -4.5 -3.0 -4.3 1.8
NOV -18.7 -11.4 -17.5 -8.2
DEC -23.1 -19.8 -21.7 -13.0
Low Temperature (°C) 1999 2000 2001 2002
-36.5 -35.1 -29.8 -32.0
-37.3 -20.9 -24.9 -28.8
-27.4 -19.0 -27.2 -26.6
-12.8 -15.1 -11.9 -14.3
-1.5 -1.5 -1.8 -1.5
7.8 8.0 6.8 5.9
7.6 7.4 8.0 8.9
6.1 2.7 4.6 4.2
-1.7 -2.7 -2.8 -0.1
-12.8 -14.0 -13.7 -8.6
-28.8 -21.1 -25.9 -16.2
-32.9 -28.4 -31.1 -21.9
Precipitation (cm) 1999 2000 2001 2002
0.8 1.4 1.3 1.8
0.6 1.2 1.1 0.4
1.2 0.5 1.3 0.1
0.4 0.2 1.4 1.2
1.5 0.1 0.9 0.5
4.0 4.2 4.3 3.9
4.1 5.6
10.0 4.7
8.6 5.5 3.6 6.2
2.7 2.6 1.0 3.9
3.7 2.1 1.7 4.9
2.1 0.7 0.4 1.1
3.5 1.4 0.8 1.4
Eagle, AK High Temperature (°C) 1999 2000 2001 2002
-30.7 -29.2 -22.2 -23.7
-19.0 -6.8 -9.9
-10.9
-5.2 -1.5 -6.4 -4.9
5.9 4.4 5.4 2.8
13.0 11.8 12.5 16.0
22.4 21.9 21.9 22.3
21.6 20.5 20.6 21.6
20.6 16.2 19.3 16.6
12.7 9.4
14.1 13.8
-1.7 -0.6 -1.2 4.6
-12.9 -7.3
-12.5 -0.7
-17.5 -16.1 -15.8 -6.5
Low Temperature (°C) 1999 2000 2001 2002
-36.4 -34.0 -27.5 -28.7
-32.3 -16.4 -20.0 -24.4
-22.4 -17.9 -24.0 -24.0
-8.5 -12.6 -8.5
-13.2
-1.2 -0.4 -1.2 -0.7
8.3 7.9 6.1 6.0
8.1 8.8 8.7 8.3
6.3 3.4 5.5 5.0
-0.7 0.0 -1.8 0.4
-10.0 -10.7 -10.3 -5.1
-24.2 -16.2 -20.6 -7.3
-29.2 -25.0 -25.9 -11.7
Precipitation (cm.) 1999 2000 2001 2002
0.7 1.0 2.3 1.8
1.4 0.3 1.4 0.3
0.4 0.8 1.6 0.4
2.4 0.0 0.5 1.4
2.7 2.8 3.8 2.1
0.4 5.8 2.4 5.5
5.6 9.8
12.0 3.7
5.3 5.0 0.9 8.0
4.3 4.4 1.8 2.9
2.7 2.5 3.7 4.2
2.7 0.7 1.1 1.7
3.0 2.2 0.8 2.2

80
Appendix 3. Summary statistics for Dall’s sheep aerial surveys within the Cirque Lakes and West Point study areas, Yukon-Tanana uplands, Alaska, 1983-2002 (na = not available).
Year Total Sheep Survey Time Ewes Lambs Yearlings Rams Study Area (h) West Point 1999 140 3.0 63 34 16 27
2000 179 na 82 16 32 49 2001 131 3.0 67 22 9 33 2002 118 2.9 62 21 9 26
Cirque Lakes 1983 66 na 26 10 9 21 1984 27 4.8 16 4 8 1 1990 107 2.5 47 15 19 26 1993 58 2.5 38 9 1 10 1994 63 2.6 21 9 9 24 1995 76 3.2 27 9 11 29 1997 77 3.2 42 13 3 19 1998 62 2.1 18 9 3 32 1999 69 3.7 33 13 15 8 2000 na na na na na na
2001 52 3.4 16 4 5 23 2002 57 2.6 28 16 7 6
Source: Lawler, J.P., B. Griffith, D. Johnson, and J. Burch. 2004. Effects of military jet overflights on Dall’s sheep in interior Alaska. Report to the Department of the Air Force, 11th U.S. Air Force, Elmendorf Air Force Base, Alaska, Appendix A.