Embed Size (px)
Citation preview
Department of Developmental Services1600 Ninth Street, Room 240
Sacramento, CA 95814
A Report to the LegislatureMarch 1, 1999
Department of Developmental Services
Changes in the Population of Persons with Autismand Pervasive Developmental Disorders
in California’s Developmental Services System:1987 through 1998
California Health and Human Services Agency • State of California
TABLE OF CONTENTS
Page
Executive Summary . . . . . . . . . . . . . . . . . . . . . . . . . . . . . . . . . . . . . . . . . . . . . . . . . . . . . . . . . . i.
I. Introduction . . . . . . . . . . . . . . . . . . . . . . . . . . . . . . . . . . . . . . . . . . . . . . . . . . . . . . . . . . . 1
II. An overview of Autism . . . . . . . . . . . . . . . . . . . . . . . . . . . . . . . . . . . . . . . . . . . . . . . . . . . 2A. Background . . . . . . . . . . . . . . . . . . . . . . . . . . . . . . . . . . . . . . . . . . . . . . . . . . . . . . . 2B. Characteristics of Persons with Autism . . . . . . . . . . . . . . . . . . . . . . . . . . . . . . . . . . . 2
III. Recent Developments in the Field and PDD . . . . . . . . . . . . . . . . . . . . . . . . . . . . . . . . . . . 3A. The Broader Definition of Autism . . . . . . . . . . . . . . . . . . . . . . . . . . . . . . . . . . . . . . . 3B. Description of the Other PDD Disorders . . . . . . . . . . . . . . . . . . . . . . . . . . . . . . . . . . 4
1. Pervasive Developmental Disorder, NOS . . . . . . . . . . . . . . . . . . . . . . . . . . . . 42. Asperger's Disorder . . . . . . . . . . . . . . . . . . . . . . . . . . . . . . . . . . . . . . . . . . . . 43. Rett’s Disorder . . . . . . . . . . . . . . . . . . . . . . . . . . . . . . . . . . . . . . . . . . . . . . . 44. Childhood Disintegrative Disorder . . . . . . . . . . . . . . . . . . . . . . . . . . . . . . . . . 4
IV. Rates of Occurrence of Autism . . . . . . . . . . . . . . . . . . . . . . . . . . . . . . . . . . . . . . . . . . . . 5A. Incidence Defined . . . . . . . . . . . . . . . . . . . . . . . . . . . . . . . . . . . . . . . . . . . . . . . . . . . 5B. Approach Used In This Study . . . . . . . . . . . . . . . . . . . . . . . . . . . . . . . . . . . . . . . . . . 5C. Early Start Program . . . . . . . . . . . . . . . . . . . . . . . . . . . . . . . . . . . . . . . . . . . . . . . . . . 6
V. Findings . . . . . . . . . . . . . . . . . . . . . . . . . . . . . . . . . . . . . . . . . . . . . . . . . . . . . . . . . . . . . . 6A. Summary of the 1987 and 1998 Populations . . . . . . . . . . . . . . . . . . . . . . . . . . . . . . . 6B. Changes in Population Rates of Intake . . . . . . . . . . . . . . . . . . . . . . . . . . . . . . . . . . . . 8C. Changes in Autism Population Characteristics . . . . . . . . . . . . . . . . . . . . . . . . . . . . . . 9
VI. Discussion of Findings . . . . . . . . . . . . . . . . . . . . . . . . . . . . . . . . . . . . . . . . . . . . . . . . . . 13A. An Emerging Group of Consumers . . . . . . . . . . . . . . . . . . . . . . . . . . . . . . . . . . . . . 13B. Summary of Changes in the Current Population . . . . . . . . . . . . . . . . . . . . . . . . . . . . 14
VII. Conclusions . . . . . . . . . . . . . . . . . . . . . . . . . . . . . . . . . . . . . . . . . . . . . . . . . . . . . . . . . . 15
VIII. Appendix . . . . . . . . . . . . . . . . . . . . . . . . . . . . . . . . . . . . . . . . . . . . . . . . . . . . . . . . . . . 16A. Diagnostic criteria for 299.00 Autistic Disorder . . . . . . . . . . . . . . . . . . . . . . . . . . . . 16B. Early History of Autism . . . . . . . . . . . . . . . . . . . . . . . . . . . . . . . . . . . . . . . . . . . . . 19
EXECUTIVE SUMMARY
A. Purpose
Budget bill language (AB 1656, Chapter 324, statutes 1998) requires the Department ofDevelopmental Services report to the Legislature on the incidence of autism and pervasivedevelopmental disorders and compare the number of persons with autism to the otherdevelopmental disabilities as defined by Lanterman Developmental Disabilities Act (Division 4.5,commencing with section 4500, of the Welfare and Institutions Code). The report containsfindings and conclusions that are based on an analysis of data provided by the regional centers tothe Department for the period 1987 through 1998.
B. Description of Autism
Autism is a profound and poorly understood developmental disorder that severely impairsa person's abilities, particularly in the areas of language and social relations. Autistic childrentypically are normal in appearance and physically well developed. Their disabilities incommunication and comprehension range from profound to mild. Historically, about 75 percentof persons with autism are classified as mentally retarded. Their most distinctive feature, however- which helps distinguish them from those solely mentally retarded - is that they seem isolatedfrom the world around them.
Autism is manifest uniquely and heterogeneously in a given individual as a collection ofsymptoms which are rarely the same from one individual to another. Two children with the samediagnosis, intellectual ability and family resources are more likely to be recognized more for theirdifferences than their similarities. Variation in the degree of impact on the individual is welldocumented and subtypes of the disorder have been identified. The professional communitycontinues to work to clarify the confusion and controversy concerning the nature, causes,methods of diagnosis, and treatment of autism. As research has uncovered subtle differences inthe onset and development of symptoms, different types of autism have been described. Thecurrent Diagnostic and Statistical Manual Fourth Edition (DSM IV), published in 1994, identifiesfive different disorders referred to collectively as the pervasive developmental disorders (PDDs).
C. Incidence of Autism
The most cited incidence statistic is that autism occurs in 4.5 of every 10,000 live births.This is based on large-scale surveys conducted in the United States and England. In addition, theestimate of children having autistic-like behaviors, i.e., when other disorders under the PDDumbrella are included, the incidence rate may go as high as 15 to 20 of every 10,000 live births. In this report the incidence of autism is not measured. The unit of measure reported here is therate of occurrence of persons with autism or other PDDs in the regional center and developmentalcenter system during a specified period of time. The main question addressed in this report iswhether the number of regional center eligible persons with a diagnosis of autism has increased incomparison to the other Lanterman Act developmental disabilities: Cerebral Palsy, Epilepsy andMental Retardation.
i.
D. Findings
The findings and recommendations presented in the report are derived from analysis ofdemographic and Client Development Evaluation Record (CDER) data compiled at each of the 21regional centers and forwarded electronically to the Department. Data covering a period ofeleven years, beginning in January 1987 and continuing through December 1998, show that thenumber of persons with autism grew markedly faster than the number of persons with otherdevelopmental disabilities. Significantly greater numbers of persons with autism are entering theregional center system. In just the past year, there were 1, 685 persons with autism taken into thesystem. The number of persons entering the system far exceeds the expected number determinedby traditional incidence rates. Estimates suggest that, compared to the other disabilities, netgrowth in the number of persons with autism is on average about 3 percent greater each year. Because the current trend has continued for the past several years, it suggests that relatively fastergrowth in the number of eligible persons with autism will continue. Compared to characteristicsof 11 years ago, the present population of persons with autism are younger, have a greater chanceof exhibiting no or milder forms of mental retardation, are more likely to live at home, and aremore likely to receive an earlier diagnosis.
E. Conclusions
This report was not an investigation of incidence, but was rather an official counting andreporting of the numbers of persons with autism and other developmental disabilities served bythe regional center system over time. This report does not include any data on those persons inCalifornia who are not part of the Developmental Services system. The Department’s CDER dataprovide evidence that support the following two general statements: (1) the number of personsentering the system with autism has increased dramatically over the past 11 years relative to theother three developmental disabilities, and (2) the accelerated rate appears to be sustaining anupward trend into future years. In light of the information presented in this report, it is reasonableto assume that the population of persons with autism will continue to rise faster, relative to theother developmental disabilities. A valid ascertainment of the incidence of autism and other PDDscould not be made. However, the persistent and apparently stable increase in intake rates ofpersons with autism is justification for further and accelerated scientific study. Unfortunately, thequality and type of information examined in this report were not suitable for measuring incidencein the population of persons with autism. Ascertaining the incidence for autism and the otherPDDs will require carefully controlled research. Furthermore, it is far beyond the capability ofthis Department to undertake such studies. Independent study of the factors that have contributedto the increase in the population of persons with autism needs to be conducted by academicinstitutions and medical researchers with the experience and knowledge necessary to conduct suchresearch.
ii.
1
I. Introduction
This report constitutes the response of the Department of Developmental Services tolegislative directives contained in the 1998-99 Budget Act for Item 4300-101-0001, provision 9. The specific requirements are that:
The State Department of Developmental Services shall survey all regionalcenters and secure data from the data base of the department to ascertain theincidence of autism and pervasive developmental disorders in California. Thedepartment shall compile the number of persons who entered the regionalcenter system during the period between January 1, 1988, to January 1,1998, inclusive, with the diagnosis of autism and pervasive developmentaldisorders. The survey shall include a comparison during the period betweenJanuary 1, 1988, to January 1, 1998, inclusive, of the numbers of personswith each of the other disabilities as defined by the LantermanDevelopmental Disabilities Services Act (Division 4.5 (commencing withSection 4500) of the Welfare and Institutions Code) and those diagnosedwith autism and pervasive developmental disorders. The department shallreport its findings to the Legislature by March 1, 1999.
In 1969, landmark legislation, AB 225 (Lanterman) Chapter 1594, was signed into law bygovernor Ronald Reagan; this later became known as the “Lanterman Developmental DisabilitiesServices Act”(California Welfare & Institutions Code, Section 4500-4519). Under the Lantermanlegislation, “The State of California accepts a responsibility for persons with developmentaldisabilities and an obligation to them which it must discharge.” This bill mandated that a networkof regional centers be created throughout the State. In addition, it also mandated the regionalcenters to serve not only persons with mental retardation but also cerebral palsy, epilepsy, autismand other neurological conditions closely related to mental retardation.
Regional centers function as a service hub, coordinating, linking and funding services andsupports in their local communities for all eligible consumers and their families. The CaliforniaLegislature has established that developmentally disabled residents and their families are entitledto government (state and federal) funded services. Regional centers have an obligation to ensurethat essential services are provided through generically funded public agencies or, in the absenceof generic agencies, through regional center funding. Services offered by regional centers includeoutreach and case-finding, assessment and diagnosis, individualized planning and servicecoordination, information and referral, and brokering of services and supports from a network ofcommunity service providers. Additional services include advocacy, crisis intervention andresource development. There are 21 regional centers from San Diego to Eureka that serve eachof the 58 counties in California. The total community population including high risk infants ismore than 150,000. Approximately 3,930 persons reside in the five developmental centers.
2
II. An overview of Autism
A. Background
It has been more than 50 years since Dr. Leo Kanner, a psychiatrist at Johns HopkinsUniversity, wrote the first paper applying the term “early childhood autism” to a group of 11children who were self-absorbed and who had severe social, communication, and behavioralproblems. In the 55 years since autism was identified, a great many developments in diagnosticand treatment methodology have occurred. In the past 20 years there has been an explosion inscientific research in autism. More than 10,000 articles with autism as the subject appear in thescientific literature. The clinical definition of autism and other pervasive developmental disordershas evolved with highly specific behavioral descriptions that cover each age and developmentalspectrum. The diagnostic criteria that define autism are written to ensure that behavioralsymptoms must be observed as distinctly deviant relative to the individual's developmental level ormental age. These refinements in the diagnostic criteria increase the chance of an earlier andaccurate diagnosis. See Appendix B. for the early history of autism.
Additionally, sophisticated teaching and early intervention programs have been developedthat offer realistic hope for long-term developmental growth in children with autism. All of theseadvancements have supported the desire of parents, professionals and advocates for timely andhigh quality services.
B. Characteristics of Persons with Autism
Autism is a profound, and poorly understood developmental disorder that severely impairsa person's abilities, particularly in the areas of language and social relations. In many cases thedisorder is evident during the first 30 months of life. Autistic children typically are normal inappearance and physically well developed. Their disabilities in communication andcomprehension range from profound to mild.
There is no single adjective that can be used to describe every person with autism becausethe disorder is manifest in many different forms. For example, some individuals are antisocial,some are asocial, and others are partially social. Some are aggressive toward themselves and/oraggressive toward others. Approximately half have little or no language. Perhaps 25 percentrepeat (echo) words and/or phrases, and another 25 percent may be capable of acquiring nearlynormal language skills. Since there are no medical tests at this time to determine whether aperson has autism, the diagnosis of autism is given when an individual displays six of 12characteristic behaviors that match the criteria in the Diagnostic and Statistical Manual, FourthEdition (DSM IV), published by the American Psychiatric Association. Persons who presentautistic behaviors but fail to qualify for six or more of the criteria can be diagnosed withPDD,NOS (Pervasive Developmental Disorder, Not Otherwise Specified).
Persons with autism, compared to other disabled persons of commensurate ability, aremore difficult to teach. Comparatively, persons with autism have significantly greater problemsacquiring and using language and relating socially. They are rarely able to work productively in
3
the mainstream of employment. Historically about 75 percent of persons with autism areclassified as mentally retarded. Their most distinctive feature, however - which helps distinguishthem from those solely mentally retarded - is that they seem isolated from the world around them,i.e., they sometimes appear detached, aloof, or in a dreamlike world. Many individuals ofternappear only vaguely aware of others in their environment, including family members. Anothercharacteristic that differentiates autism from persons with a primary diagnosis of mentalretardation is the much greater likelihood that the autistic person will display strange postures,mannerisms, habits, and compulsions. Ritualistic behavior, hand-flapping, unusual foodpreferences, absence of establishing eye contact, apparent insensitivity to pain, and self-injuriousbehaviors are sometimes seen in persons with autism. Appropriate play with other children ortoys is uncommon. There is often a great interest in inanimate objects, especially mechanicaldevices and appliances.
III. Recent Developments in the Field and PDD
A. The Broader Definition of Autism
Autism has multiple causes and is manifest uniquely and heterogeneously in a givenindividual as a collection of symptoms which are rarely the same from one individual to another. Two children with the same diagnosis, intellectual ability and family resources are more likely tobe recognized more for their differences than their similarities. Variation in the degree of impacton the individual is well documented and subtypes of the disorder have been identified. Theprofessional community continues to work to clarify the confusion and controversy concerningthe nature, causes, methods of diagnosis, and treatment of autism. As research has uncoveredsubtle differences in the onset and development of symptoms, different types of autism have beendescribed. In recent years an effort has been made to reclassify autism as one type of pervasivedevelopmental disorder (PDD). The term “autistic spectrum disorder” is frequently employed toacknowledge the diversity and severity of autism. As different types of autism have beenidentified through scientific research, the criteria for diagnosing these other types overlap with thedefinition of autism and tend to make autism more difficult to diagnose. In 1968, the AmericanPsychiatric Association’s definition of autism referred to a single disorder, not a syndrome ofbehavioral and medical effects as it is now known to be. The third edition of the Diagnostic andStatistical Manual, published in 1980, introduced the term “pervasive developmental disorders.”The current Diagnostic and Statistical Manual Fourth Edition (DSM IV), published in 1994,identifies five different disorders referred to collectively as the pervasive developmental disorders. Those disorders include five separate diagnoses:
• Autistic Disorder, (299.00)• Pervasive Developmental Disorder, NOS (not otherwise specified), (299.80)• Asperger’s Disorder, (299.80)• Rett’s Disorder, (299.80)• Childhood Disintegrative Disorder, (299.10)See Appendix A. for the specific diagnostic criteria for each of these conditions.
4
B. Description of the Other PDD Disorders
The following is a brief description of the other four pervasive developmental disorders:
1. Pervasive Developmental Disorder, NOS (PDD,NOS) is diagnosed whenautistic symptoms are present but the full criteria for autistic disorder are not met. Therefore, persons diagnosed with PDD,NOS present with autistic symptoms, buttypically are not as involved with the social and communication deficits as persons whomeet the full criteria for autism. Generally, they are higher functioning and moreresponsive to treatment. PDD,NOS, along with Asperger’s disorder, is thought by someresearchers to be as common as autism.
2. Asperger's Disorder was first described by a German doctor, Hans Asperger, in1944 (one year after Leo Kanner's first paper on autism). In his paper, Dr. Aspergerdiscussed individuals who exhibited many idiosyncratic, odd-like behaviors. Unlikechildren with autism, children diagnosed with Asperger’s disorder develop lucid speechbefore age four years and their grammar and vocabularies are usually adequate for normalconversation. Their speech is sometimes stilted and their repetitive voice tends to be flatand emotionless; their conversations revolve around themselves. Asperger’s disorder ischaracterized by concrete and literal thinking. Persons with Asperger’s disorder areusually obsessed with complex topics, weather, music, astronomy history, etc. Intellectualability for most is in the normal to above normal range in verbal ability and in the belowaverage range on tasks of visual-perceptual organization. Sometimes it is assumed thatthe individual who has autism and average mental ability has Asperger's disorder. However, it appears that there may be several forms of high-functioning autism, of whichAsperger's disorder is only one form.
3. Rett’s Disorder is a degenerative disorder which affects only females and usuallydevelops between six months and 18 months of age. Some of their characteristic behaviorsmay include the following: loss of speech, repetitive hand-wringing, body rocking, andsocial withdrawal. Those individuals suffering from this disorder may be severely toprofoundly mentally retarded. This disorder, along with childhood disintegrative disorder,is extremely rare.
4. Childhood Disintegrative Disorder (CDD) is included among the PDDs becausethese children apparently develop normally for two or more years before suffering adistinct regression in their abilities. Affected children lose previously acquired functionalskills in expressive or receptive language, social skills or adaptive behavior includingbowel or bladder control, play, or motor skills. Individuals with this disorder are rarerthan persons with autism or one of the other PDDs; they exhibit the social, communicativeand behavioral deficits observed in autism including loss of desire for social contact,diminished eye contact, and loss of nonverbal communication.
5
As research into autism continues, the diagnostic criteria published in DSM IV arecontinuing to be modified to reflect what is known about the different types of autism. Asresearch has revealed the essential qualities of the disorder, clearer criteria allow more accuratediagnosis.
IV. Rates of Occurrence of Autism
A. Incidence Defined
Scientific measurement of the incidence of autism requires a carefully controlled study thatcaptures the number of newly diagnosed persons with autism during a specified period of time andin a location with specified boundaries. The study would also have to identify the entirepopulation of persons at risk, i.e., the number of new born infants in a specified location. Toensure the accuracy of the study, a large number of confounding variables would have to becontrolled. Some of the variables that would have to be carefully controlled are accuracy of thediagnosis of autism, determining and counting the at-risk population, consistency of datacollection across a large geographic area, subject finding, etc.
The most cited incidence statistic is that autism occurs in 4.5 of every 10,000 live births.This is based on large-scale surveys conducted in the United States and England. In addition, theestimate of children having autistic-like behaviors, i.e., when other disorders under the PDDumbrella are included, the incidence rate is 15 to 20 of every 10,000 live births. The scientificliterature reports that autism is three times more likely to affect males than females. The genderdifference is not unique to autism since many developmental disabilities have a greater male-to-female ratio.
B. Approach Used In This Study
In this report the incidence of autism is not measured. The unit of measure reported hereis the rate of occurrence of persons with autism or other PDDs in the regional center anddevelopmental center system during a specified period of time. The number of persons withautism, or other disability, varies daily by a small percentage because persons are leaving thesystem and newly eligible persons are entering. Because the number of persons in the systemvaries, data presented in this report were taken at the end of the year for years 1987 and 1998. The values of variables sampled at these two different times are compared to determine whatsignificant changes may have occurred. The main question addressed in this report is whether thenumber of regional center eligible persons with a diagnosis of autism has increased compared tothe other developmental disabilities, i.e., Cerebral Palsy (CP), Epilepsy (EP) and MentalRetardation (MR).
The findings and recommendations presented in the report are derived from analysis ofdemographic and Client Development Evaluation Record (CDER) data compiled at each of the 21regional centers and forwarded electronically to the Department. The CDER file contains
6
consumer diagnostic and evaluation information recorded at the regional center or developmentalcenter when a consumer is given a client development evaluation. This report focuses on the rateof intakes of persons with autism and other developmental disabilities into the regional centersystem over an 11-year period.
Autism is recorded on the CDER with one of three different codes - Level 1, Level 2 andLevel 9. For the purposes of this study, a fourth code (Level 4) was created to capture four othertypes of PDD, including PDD,NOS, Asperger’s Disorder, Rett’s Disorder and ChildhoodDisintegrative Disorder. These PDD codes are recorded in the Mental Disorders section of theCDER. The four levels of classification used to search the Department’s data files are listedaccordingly:
• Level 1 - Autism, full syndrome• Level 2 - Autism, residual state• Level 4 - Composed of DSM IV, PDD codes 299.1, 299.80 and 299.88• Level 9 - Autism suspected, not diagnosed
For the purposes of this report, data are reported using all four levels unless otherwisenoted.
C. Early Start Program
Additionally, the Department provides early intervention services to infants and toddlersunder three years of age who may be at risk or have significant developmental delay. In 1992, theDepartment began entering demographic data for children considered at-risk in the age range birthto three into a different database. Data describing these children are reported on the Early StartProfile. These data were not counted in this report as the majority of these children are not yetdiagnosed with a developmental disability such as autism but are receiving services because ofatypical development or language delay. As of January 6, 1999, there were 15,083 childrenreceiving services through the Early Start program. The data reported here were taken from thetotal number of CDERs on the electronic file at the end of 1987 and 1998. The Departmentestimates that 95 percent of all active cases, including persons in the developmental centers, havea completed CDER on file. At the end of 1987 there were 80,389 CDERs on file. At the end of1998, there were 129,169 CDERs on file.
V. Findings
A. Summary of the 1987 and 1998 Populations
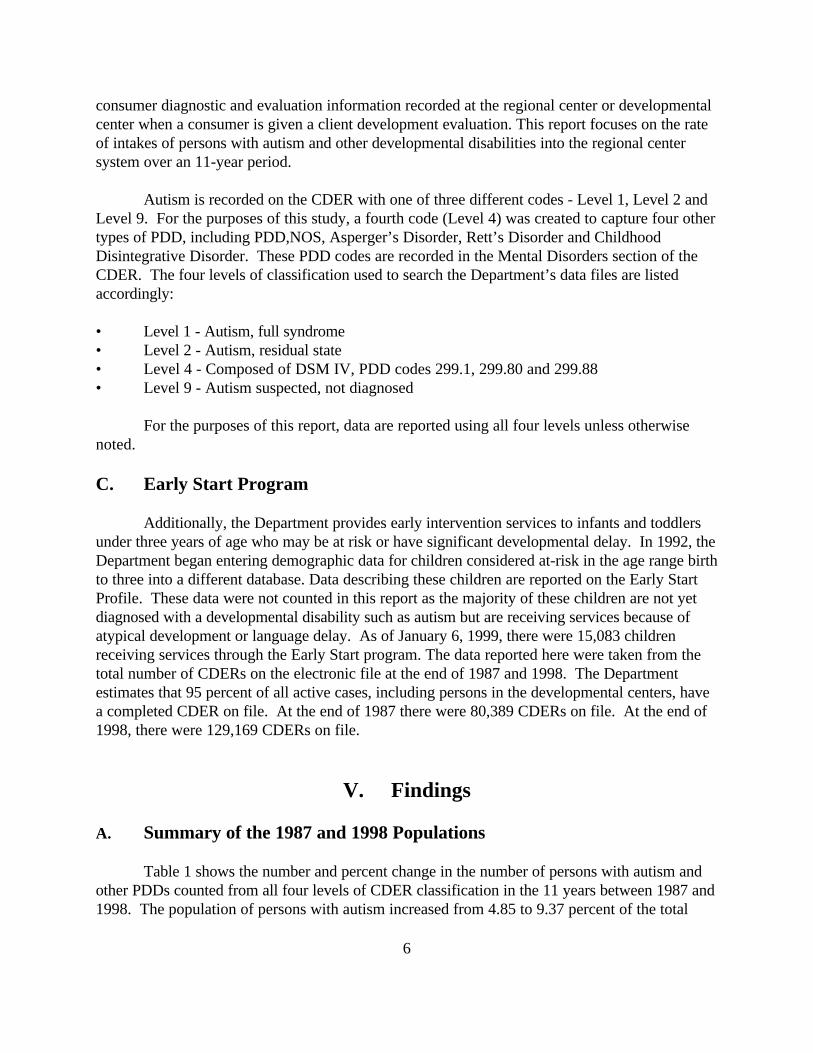
Table 1 shows the number and percent change in the number of persons with autism andother PDDs counted from all four levels of CDER classification in the 11 years between 1987 and1998. The population of persons with autism increased from 4.85 to 9.37 percent of the total
7
state wide client population. At the end of 1998 there were 12,780 persons, of all ages, withautism listed on the CDER. Autism as a percent of the total client population nearly doubled.
Table 1 - Number of Persons with Autism in 1987 and 1998
1987 1998
Total Client Population 80,483 136,383
Persons with Autism (Levels 1, 2 & 4) 3,902 12,780
Percent of Total Client Population 4.85 % 9.37 %
Table 2 presents the total number and percent change between 1987 and 1998 for personswith autism, cerebral palsy, epilepsy and mental retardation. To maintain equivalency in the wayeach diagnostic condition is counted, only CDER classification Levels 1 and 2 for persons withautism are used in this table. Because some individuals have two or more of the four eligibleconditions at the same time, all possible combinations of eligible conditions were used and aseparate count was obtained for each condition or combination of conditions. For example, if anindividual has cerebral palsy, epilepsy and mental retardation, that person would be counted threeseparate times, once for each separate condition to get the total for each separate condition.
Table 2 shows that the percent occurrence of persons with autism increased dramaticallyin comparison to the other conditions for the 11 years between 1987 and 1998. The rate of theincrease is more than four times as great as the other diagnostic categories.
Table 2 - Percent Increase in Diagnostic Populations from 1987 to 1998
1987 1998 Percent Change
Autism (All Combinations) 3,864 11,995 210.43%
Cerebral Palsy (All Combinations) 19,972 28,529 42.84%
Epilepsy (All Combinations) 22683 29,645 30.69%
Mental Retardation (All Combinations) 72,987 108,563 48.74%
Whole Population 80,483 136,383 69.46%
As one example of the increase in the number of persons with autism, between 12/31/97and 12/31/98, there was a net increase of 1,685 persons with autism into the system. Thepopulation of persons with autism increased 16.3 percent in one year, not including persons withother PDD diagnoses. By the end of 1998, there were 785 persons in the system with a diagnosisof one of the (Level 4) PDD diagnoses, i.e., Asperger’s, PDD,NOS or Rett’s disorder.
8
100
200
300
400
500
600
Num
ber
of E
nrol
led
Per
sons
with
Aut
ism
1960 1963 1966 1969 1972 1975 1978 1981 1984 1987 1990 Year of Birth
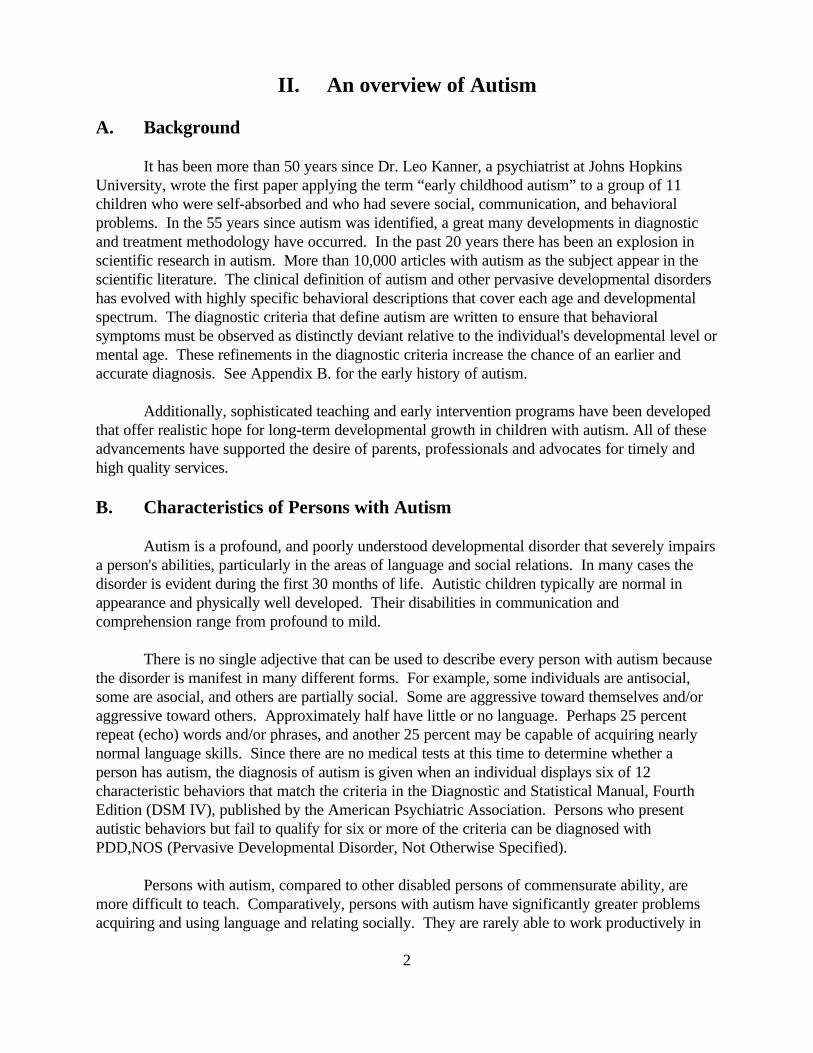
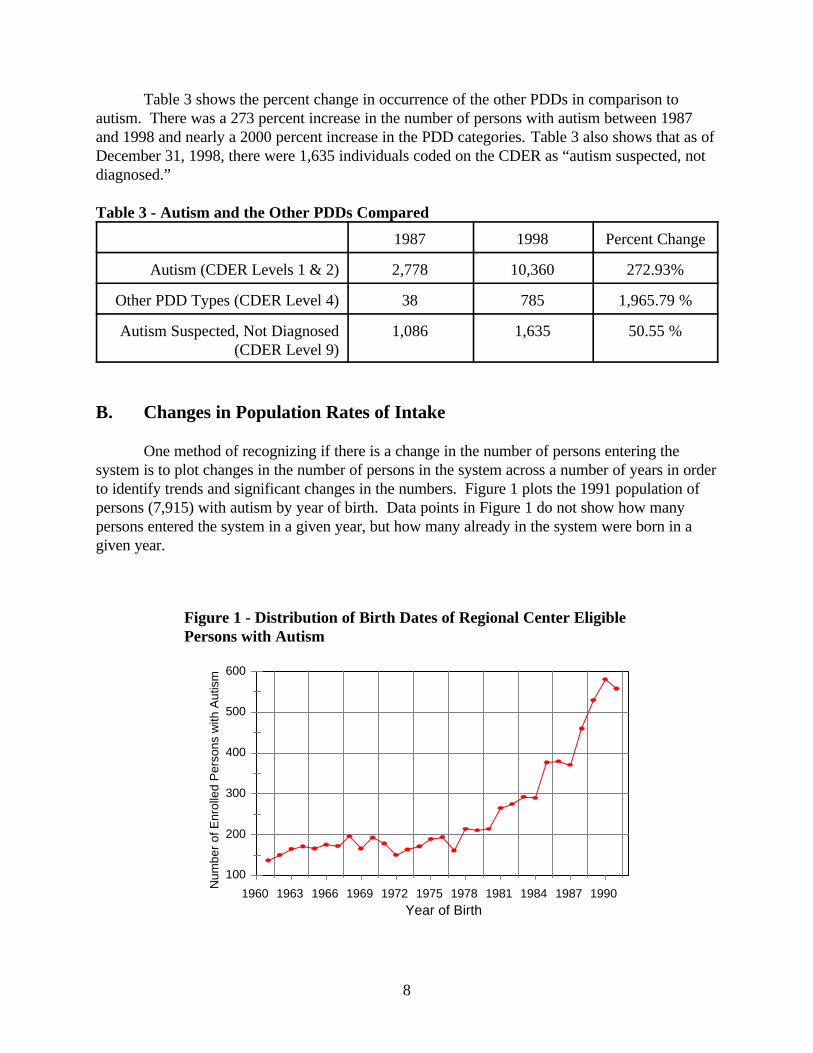
Figure 1 - Distribution of Birth Dates of Regional Center EligiblePersons with Autism
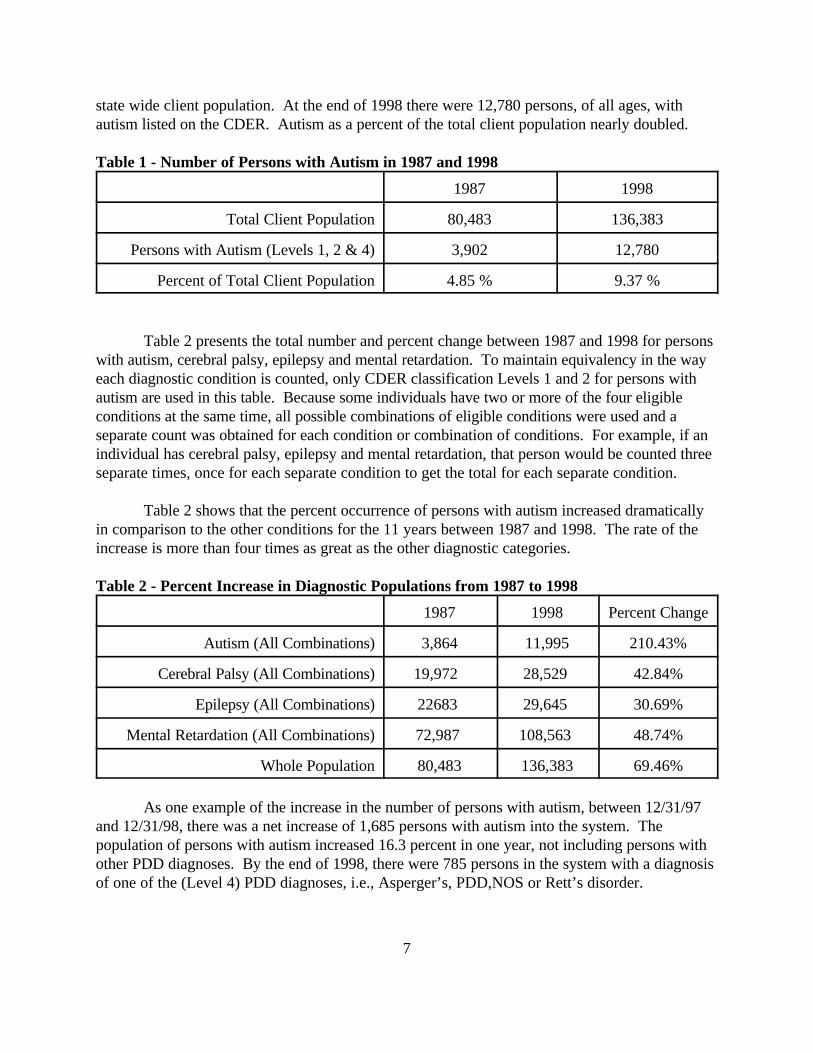
Table 3 shows the percent change in occurrence of the other PDDs in comparison toautism. There was a 273 percent increase in the number of persons with autism between 1987and 1998 and nearly a 2000 percent increase in the PDD categories. Table 3 also shows that as ofDecember 31, 1998, there were 1,635 individuals coded on the CDER as “autism suspected, notdiagnosed.”
Table 3 - Autism and the Other PDDs Compared
1987 1998 Percent Change
Autism (CDER Levels 1 & 2) 2,778 10,360 272.93%
Other PDD Types (CDER Level 4) 38 785 1,965.79 %
Autism Suspected, Not Diagnosed(CDER Level 9)
1,086 1,635 50.55 %
B. Changes in Population Rates of Intake
One method of recognizing if there is a change in the number of persons entering thesystem is to plot changes in the number of persons in the system across a number of years in orderto identify trends and significant changes in the numbers. Figure 1 plots the 1991 population ofpersons (7,915) with autism by year of birth. Data points in Figure 1 do not show how manypersons entered the system in a given year, but how many already in the system were born in agiven year.
9
-2%
-1%
0%
1%
2%
3%
4%
5%
6%
7%
Per
cent
Net
Cha
nge
In P
opul
atio
n
01/24/9407/13/94
01/12/9507/12/95
01/12/9607/15/96
01/10/9707/16/97
01/08/9807/08/98
01/06/99
AUT
CP
EP
MR
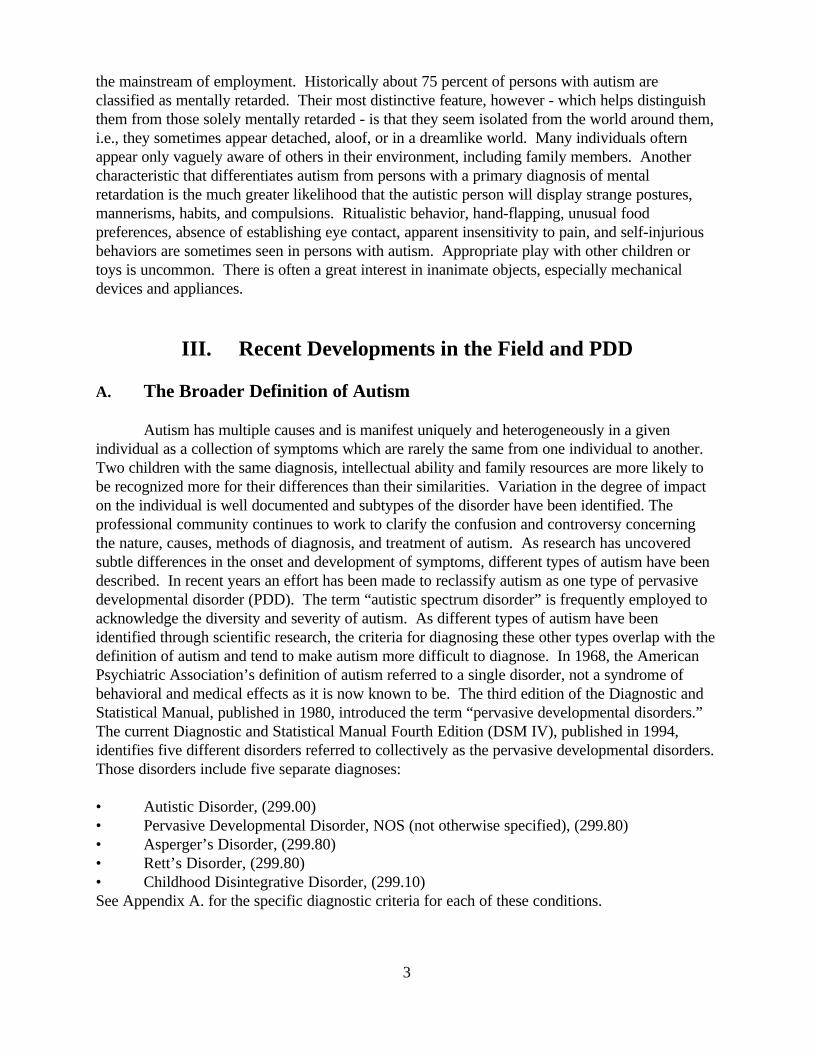
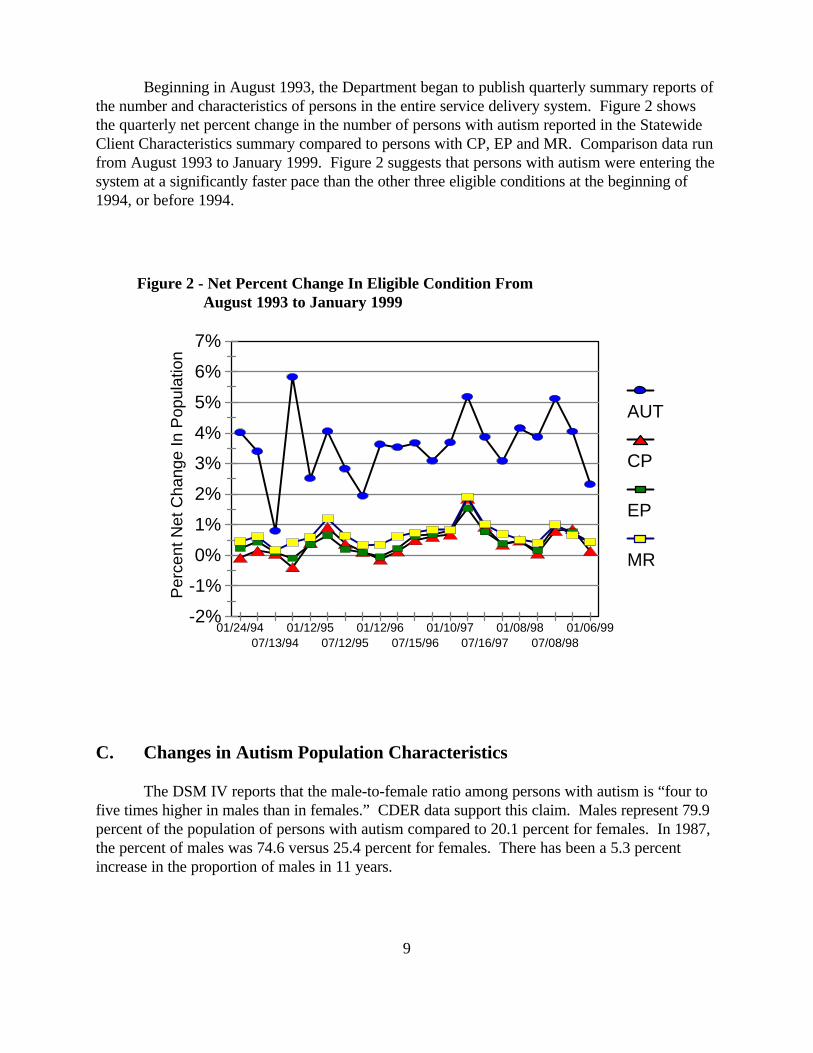
Figure 2 - Net Percent Change In Eligible Condition From August 1993 to January 1999
Beginning in August 1993, the Department began to publish quarterly summary reports ofthe number and characteristics of persons in the entire service delivery system. Figure 2 showsthe quarterly net percent change in the number of persons with autism reported in the StatewideClient Characteristics summary compared to persons with CP, EP and MR. Comparison data runfrom August 1993 to January 1999. Figure 2 suggests that persons with autism were entering thesystem at a significantly faster pace than the other three eligible conditions at the beginning of1994, or before 1994.
C. Changes in Autism Population Characteristics
The DSM IV reports that the male-to-female ratio among persons with autism is “four tofive times higher in males than in females.” CDER data support this claim. Males represent 79.9percent of the population of persons with autism compared to 20.1 percent for females. In 1987,the percent of males was 74.6 versus 25.4 percent for females. There has been a 5.3 percentincrease in the proportion of males in 11 years.
10
0%
5%
10%
15%
20%
25%
30%
35%
Per
cent
of P
opul
atio
n
0 to 45 to 9
10 to 1415 to 19
20 to 2425 to 29
30 to 3435 to 39
40 to 4445 to 49
1998
1987
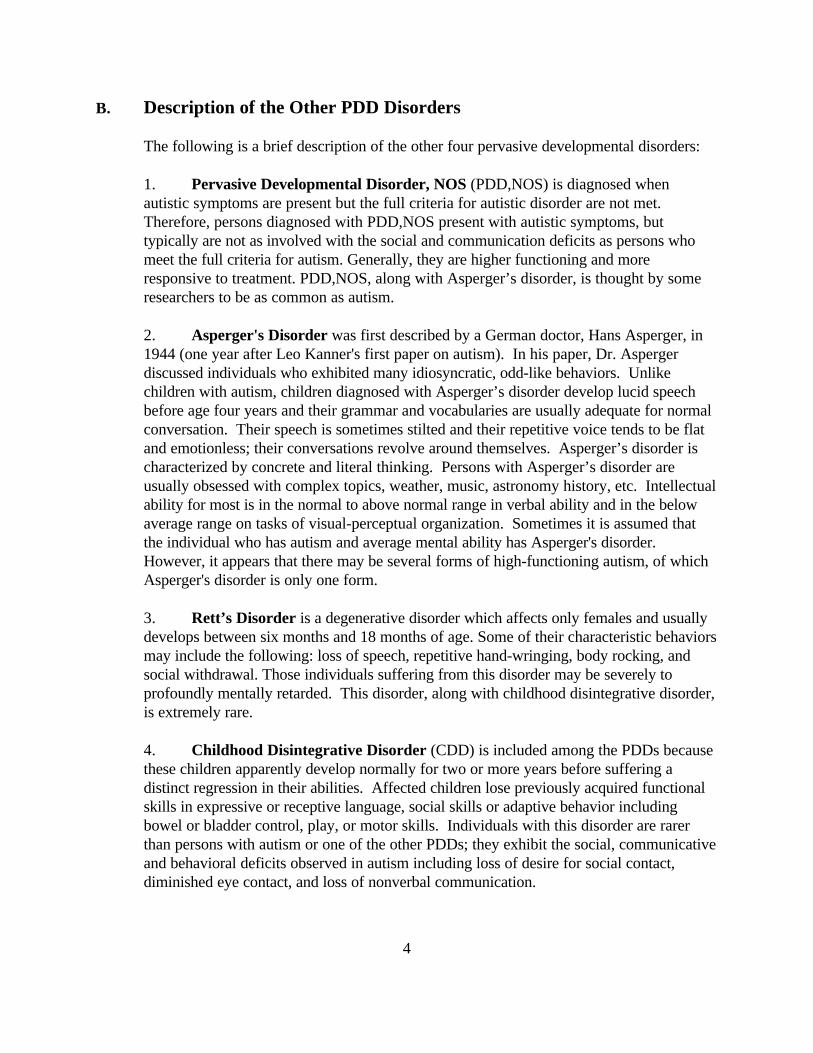
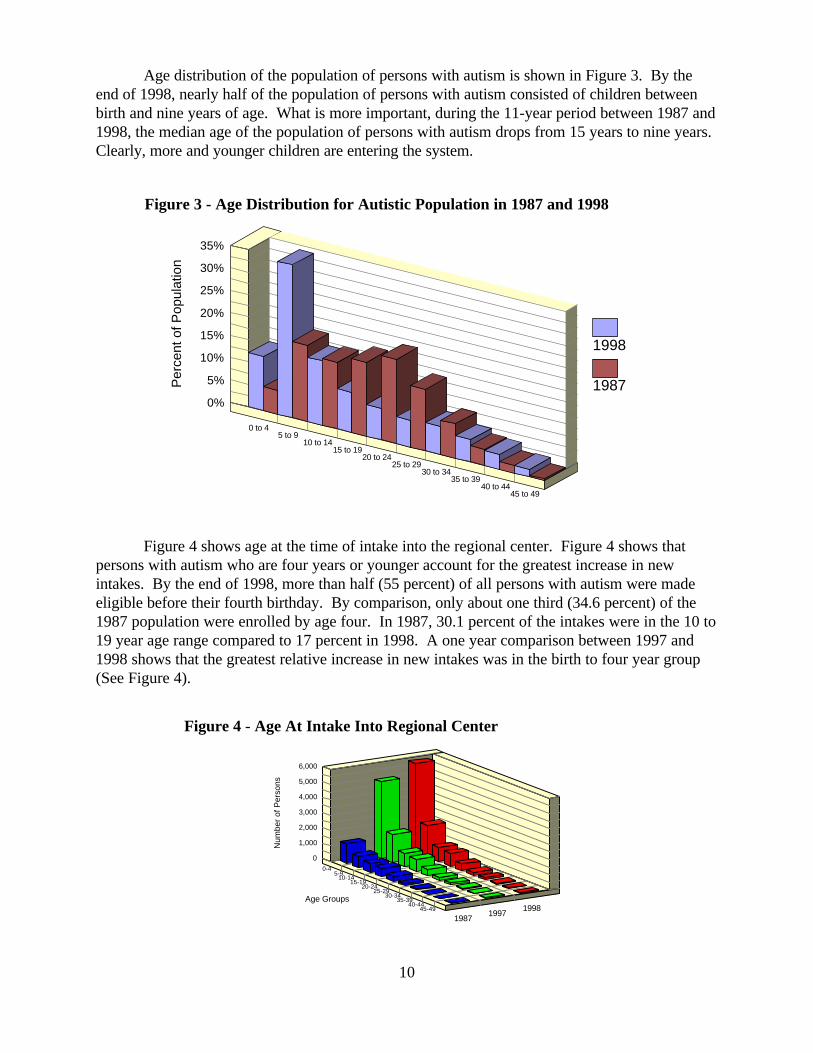
Figure 3 - Age Distribution for Autistic Population in 1987 and 1998
0
1,000
2,000
3,000
4,000
5,000
6,000
Num
ber
of P
erso
ns
0-45-9
10-1415-19
20-2425-29
30-3435-39
40-4445-49
Age Groups
19871997
1998
Figure 4 - Age At Intake Into Regional Center
Age distribution of the population of persons with autism is shown in Figure 3. By theend of 1998, nearly half of the population of persons with autism consisted of children betweenbirth and nine years of age. What is more important, during the 11-year period between 1987 and1998, the median age of the population of persons with autism drops from 15 years to nine years. Clearly, more and younger children are entering the system.
Figure 4 shows age at the time of intake into the regional center. Figure 4 shows thatpersons with autism who are four years or younger account for the greatest increase in newintakes. By the end of 1998, more than half (55 percent) of all persons with autism were madeeligible before their fourth birthday. By comparison, only about one third (34.6 percent) of the1987 population were enrolled by age four. In 1987, 30.1 percent of the intakes were in the 10 to19 year age range compared to 17 percent in 1998. A one year comparison between 1997 and1998 shows that the greatest relative increase in new intakes was in the birth to four year group(See Figure 4).
11
0%10%20%30%40%50%60%70%
Per
cent
Pop
ulat
ion
WhiteHispanic
BLackOther
AsianUnknown
FilipinoNative Amer.
Polynesian 19871998
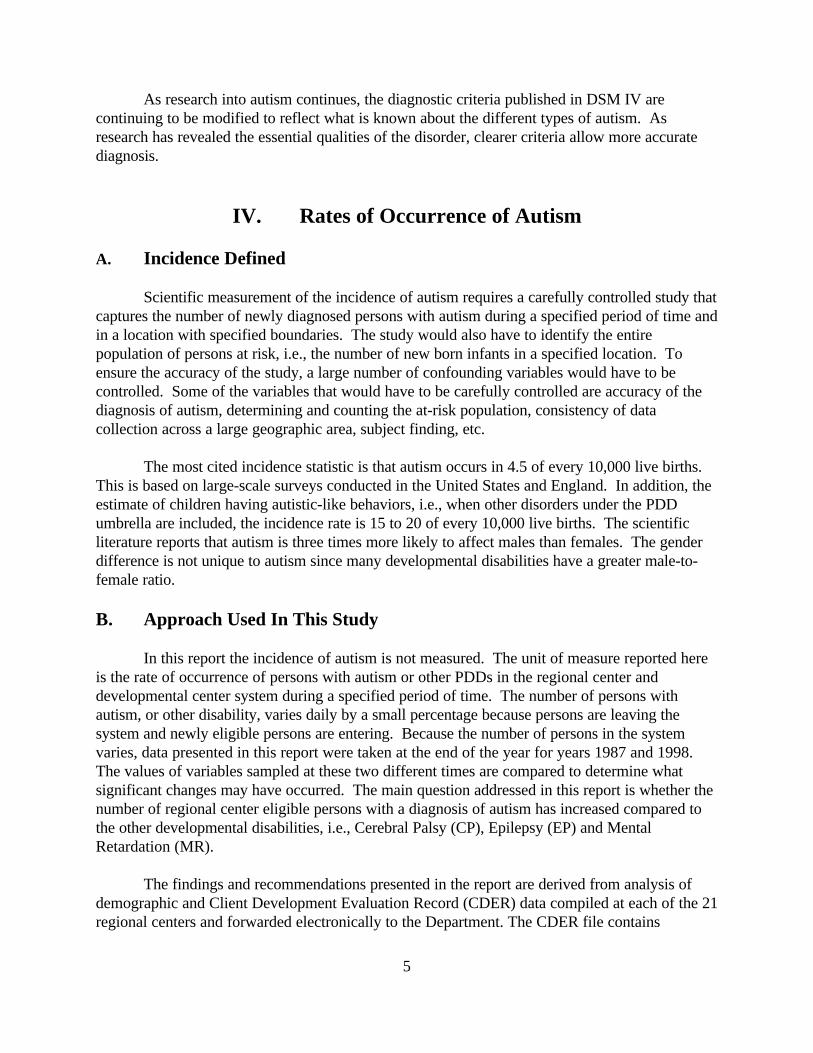
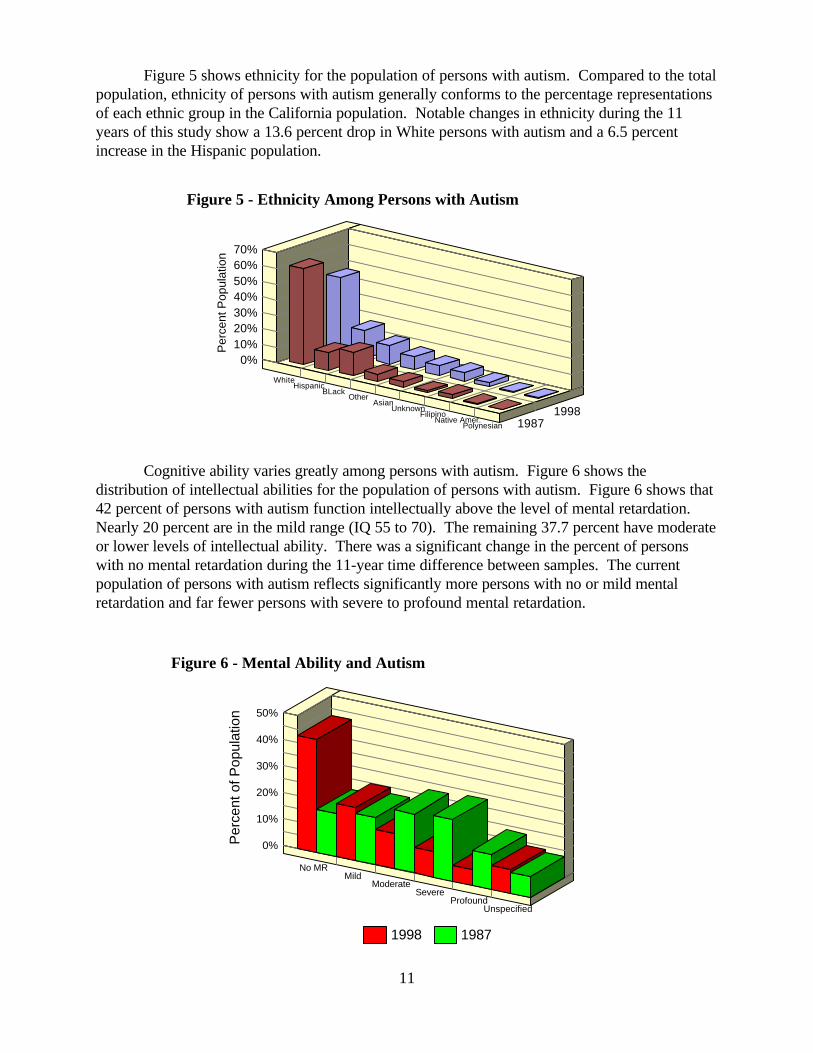
Figure 5 - Ethnicity Among Persons with Autism
0%
10%
20%
30%
40%
50%
Per
cent
of P
opul
atio
n
No MRMild
ModerateSevere
ProfoundUnspecified
1998 1987
Figure 6 - Mental Ability and Autism
Figure 5 shows ethnicity for the population of persons with autism. Compared to the totalpopulation, ethnicity of persons with autism generally conforms to the percentage representationsof each ethnic group in the California population. Notable changes in ethnicity during the 11years of this study show a 13.6 percent drop in White persons with autism and a 6.5 percentincrease in the Hispanic population.
Cognitive ability varies greatly among persons with autism. Figure 6 shows thedistribution of intellectual abilities for the population of persons with autism. Figure 6 shows that42 percent of persons with autism function intellectually above the level of mental retardation. Nearly 20 percent are in the mild range (IQ 55 to 70). The remaining 37.7 percent have moderateor lower levels of intellectual ability. There was a significant change in the percent of personswith no mental retardation during the 11-year time difference between samples. The currentpopulation of persons with autism reflects significantly more persons with no or mild mentalretardation and far fewer persons with severe to profound mental retardation.
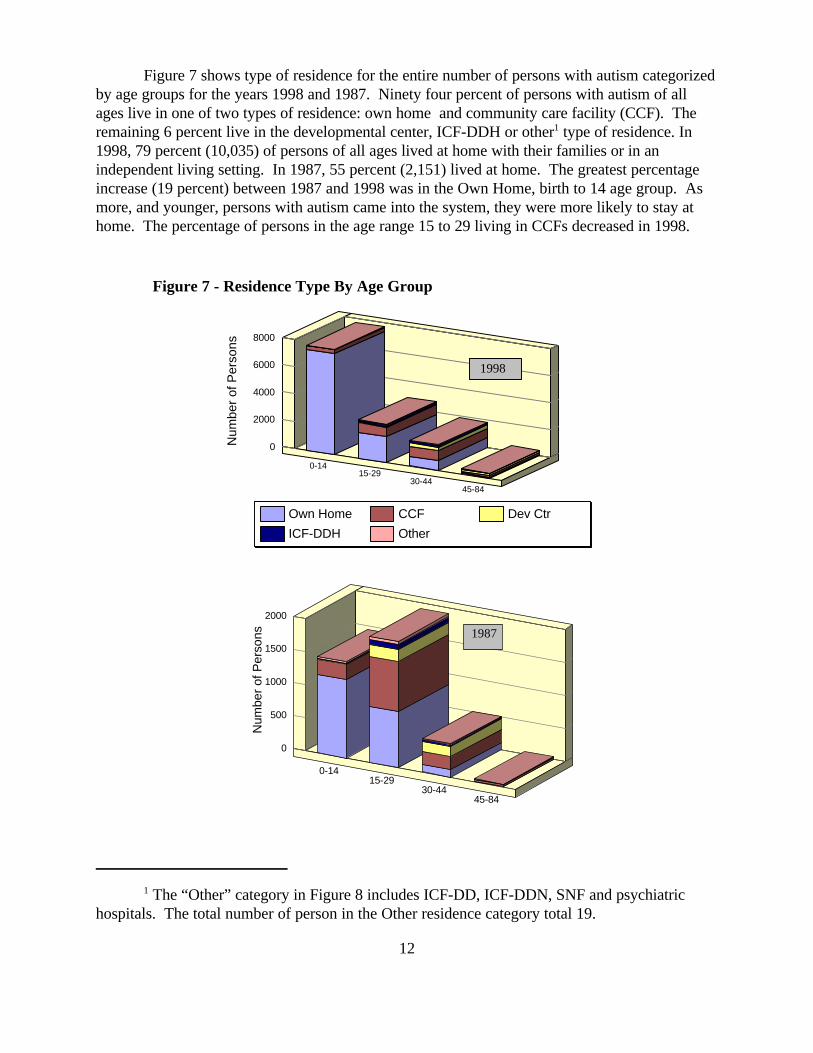
1 The “Other” category in Figure 8 includes ICF-DD, ICF-DDN, SNF and psychiatrichospitals. The total number of person in the Other residence category total 19.
12
0
2000
4000
6000
8000
Num
ber
of P
erso
ns
0-1415-29
30-4445-84
Own Home CCF Dev Ctr
ICF-DDH Other
1998
Figure 7 - Residence Type By Age Group
0
500
1000
1500
2000
Num
ber
of P
erso
ns
0-1415-29
30-4445-84
1987
Figure 7 shows type of residence for the entire number of persons with autism categorizedby age groups for the years 1998 and 1987. Ninety four percent of persons with autism of allages live in one of two types of residence: own home and community care facility (CCF). Theremaining 6 percent live in the developmental center, ICF-DDH or other1 type of residence. In1998, 79 percent (10,035) of persons of all ages lived at home with their families or in anindependent living setting. In 1987, 55 percent (2,151) lived at home. The greatest percentageincrease (19 percent) between 1987 and 1998 was in the Own Home, birth to 14 age group. Asmore, and younger, persons with autism came into the system, they were more likely to stay athome. The percentage of persons in the age range 15 to 29 living in CCFs decreased in 1998.
13
0% 5% 10% 15% 20% 25% 30% 35%Percent of Code Level 4 Population
0-4
5-9
10-14
15-19
20-24
25-29
30-34
35-39
40-44
45-49
50-54
55-59
Age
Gro
ups
N = 73512/22/97
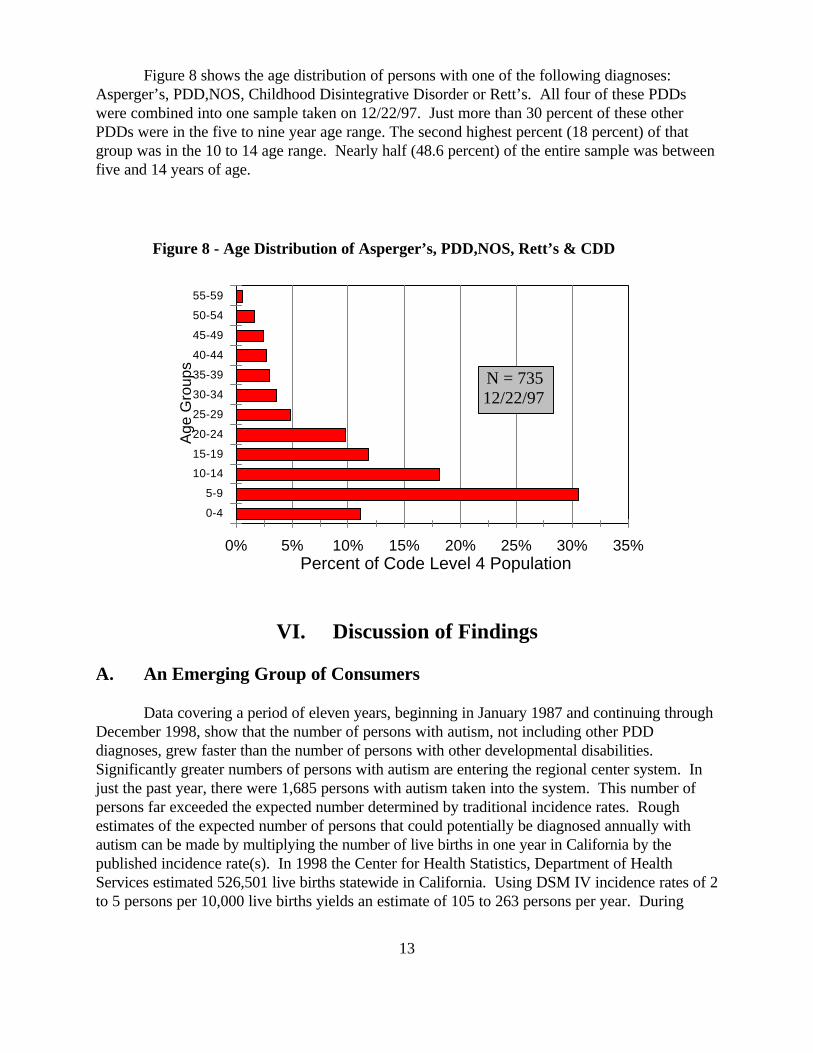
Figure 8 - Age Distribution of Asperger’s, PDD,NOS, Rett’s & CDD
Figure 8 shows the age distribution of persons with one of the following diagnoses: Asperger’s, PDD,NOS, Childhood Disintegrative Disorder or Rett’s. All four of these PDDswere combined into one sample taken on 12/22/97. Just more than 30 percent of these otherPDDs were in the five to nine year age range. The second highest percent (18 percent) of thatgroup was in the 10 to 14 age range. Nearly half (48.6 percent) of the entire sample was betweenfive and 14 years of age.
VI. Discussion of Findings
A. An Emerging Group of Consumers
Data covering a period of eleven years, beginning in January 1987 and continuing throughDecember 1998, show that the number of persons with autism, not including other PDDdiagnoses, grew faster than the number of persons with other developmental disabilities. Significantly greater numbers of persons with autism are entering the regional center system. Injust the past year, there were 1,685 persons with autism taken into the system. This number ofpersons far exceeded the expected number determined by traditional incidence rates. Roughestimates of the expected number of persons that could potentially be diagnosed annually withautism can be made by multiplying the number of live births in one year in California by thepublished incidence rate(s). In 1998 the Center for Health Statistics, Department of HealthServices estimated 526,501 live births statewide in California. Using DSM IV incidence rates of 2to 5 persons per 10,000 live births yields an estimate of 105 to 263 persons per year. During
14
calendar year 1998 there were 11,995 persons with autism or one of the other PDDs and anadditional 1,635 persons suspected of having autism. Using published incidence rates that includeautism, Asperger’s and PDD,NOS, which range from 15 to 20 cases per 10,000 live births, anestimated 790 to 1,053 persons per year could be diagnosed with autism or one of the otherPDDs. The number of new intakes has exceeded the annual estimate of persons likely to bediagnosed with autism for the past few years.
Estimates suggest that, compared to the other disabilities, net growth in the number ofpersons with autism is about 3 percent greater each year. Because the current trend has continuedfor the past several years, it suggests that relatively faster growth in the number of eligible personswith autism may continue well into the next century. Other government reports, such as theNineteenth Annual Report to Congress on the implementation of the Individuals with DisabilitiesEducation Act, document substantial increases in autism. Between fiscal years 1994-95 and1995-96, the 1997 Nineteenth Annual Report to Congress states that the number of children withautism grew by 27.2 percent and was one of “the largest relative increases.”
B. Summary of Changes in the Current Population
The data show that younger children constitute the majority of new intakes. A rapidlyexpanding subpopulation of children diagnosed with one of the other PDDs has emerged since thecreation of the PDD diagnoses. This population grew from 38 individuals in 1987 to 785 in 1998. There are an additional 1,635 individuals “suspected” of having autism and 13,496 moreundiagnosed children in the early start program. An undetermined percentage of individuals inthese groups, upon clarification of their diagnostic status, will further increase the number ofpersons with autism and/or PDD.
Compared to client characteristics of 11 years ago, the population of persons with autismis younger, exhibits no or milder forms of mental retardation, is more likely to live at home and ismore likely to receive an earlier diagnosis. Nearly half of the 1998 population is less than nineyears of age compared to only one fourth of the population in 1987.
The number of persons who function intellectually above the range of mental retardationincreased from 16 percent to 43 percent, a 26 percent point increase in 11 years. The increases inintellectual gains were relatively broad. Level of intellectual functioning in 29 percent of thepopulation of persons with autism shifted from the moderate range (IQ 40 to 54) to the mildrange (IQ 55 to 70) of mental retardation.
By the end of 1998, an individual’s chances of remaining in his/her own home increasedsignificantly for children up to 14 years. In the birth to 14 year group, 74 percent live at home. Inthe 15 to 29 years old group, the greatest proportion of persons with autism live in a CCF.
Except for a 14 percent drop in the number of White persons and a 7 percent increase inHispanic persons with autism, ethnic representation did not change appreciably in 11 years. Overall, ethnic representation roughly paralleled the state census.
15
VII. Conclusions
This report was not an investigation of incidence, but was rather an official counting andreporting of the number of persons with autism and other developmental disabilities served by theregional center system over time. The Department’s CDER data provide preliminary evidencethat support the following two general statements: (1) the number of persons entering the systemwith autism has increased dramatically over the past 11 years relative to the other threedevelopmental disabilities, and (2) the accelerated rate appears to be sustaining an upward trendwhich will continue into future years. In light of the information presented in this report, it isreasonable to assume that the population of persons with autism will continue to rise faster,relative to the other developmental disabilities, for the next several years.
The quality and type of information examined in this report were not suitable formeasuring incidence in the population of persons with autism. Ascertaining the incidence forautism and the other PDDs will require carefully controlled research. Furthermore, it is farbeyond the capability of this Department to undertake such studies. Independent study of thefactors that contribute to increases in the population of persons with autism needs to beconducted by academic institutions with the experience and knowledge necessary to conduct suchresearch. Examples of such institutions are Medical Investigation of NeurodevelopmentalDisorders (MIND Institute) within the University of California system.
The cause(s) of the increase in the population of persons with autism served by theregional center over the past 10 years is unknown. The sheer complexity of this phenomenonprevents any clear conclusions about the exact determinants of the increase. Speculation aboutthe rise in numbers is abundant, but such speculation is not based on scientific research andtypically leads to debate and controversy when offered as a cause. In fact, rampant speculationfollowed by acrimonious debate about the causes of an increase in autism has provoked onecongressman, Representative Christopher H. Smith, to introduce legislation (H.R. 274) aimed atproviding a greater understanding. Representative Smith’s bill addresses the causes andoccurrence of autism and related pervasive developmental disabilities. This measure, entitled theAutism Statistics, Surveillance, Research, and Epidemiology Act of 1999 would provideadditional funding for the Centers for Disease Control and Prevention to create a network ofepidemiological research centers across the country.
What we do know is that the number of young children coming into the system each yearis significantly greater than in the past, and that the demand for services to meet the needs of thisspecial population will continue to grow. If present rates of intake continue, there will be a needfor: (1) greater emphasis on long range planning to develop suitable methods of deliveringservices, (2) strategies for development of new and abundant resources; (3) clinical training ofregional center personnel in diagnostic and treatment standards necessary to adequately adviseparents and (4) creation of forums for information exchange and collaboration between providersand the families of children with autism. In conclusion, there is a real need to accelerate multi-discipline, multi-faceted research efforts in this area.
16
VIII. Appendix
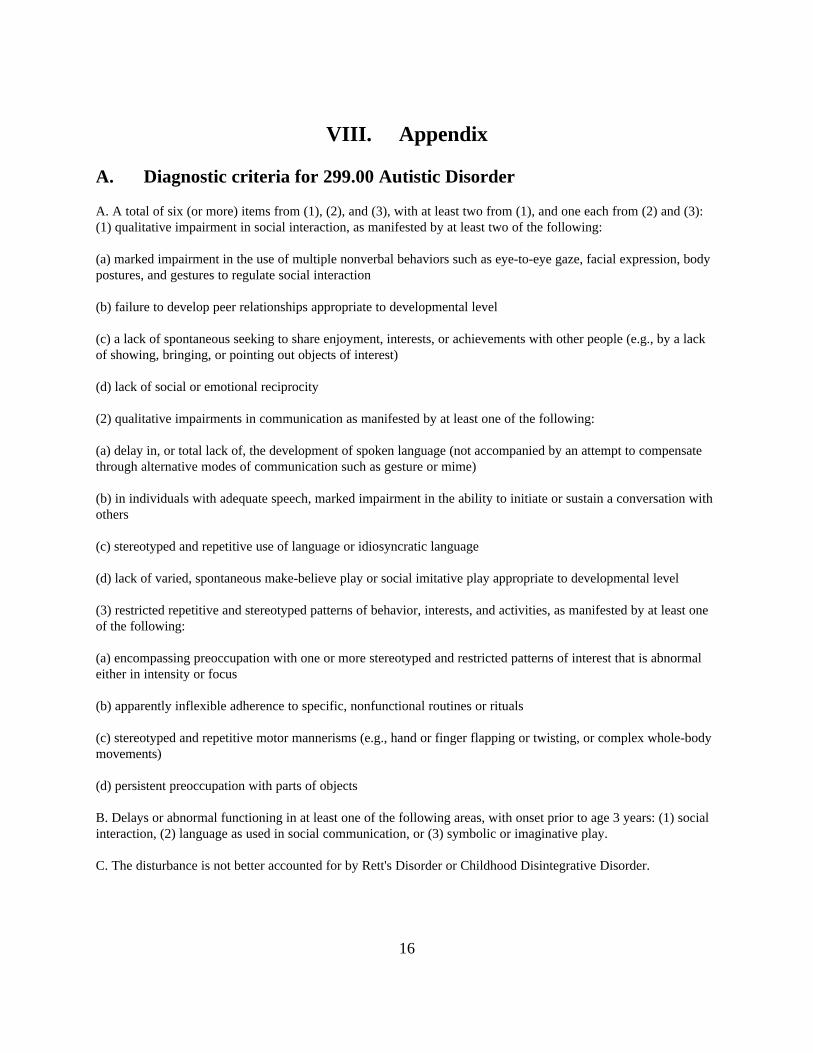
A. Diagnostic criteria for 299.00 Autistic Disorder
A. A total of six (or more) items from (1), (2), and (3), with at least two from (1), and one each from (2) and (3):(1) qualitative impairment in social interaction, as manifested by at least two of the following:
(a) marked impairment in the use of multiple nonverbal behaviors such as eye-to-eye gaze, facial expression, bodypostures, and gestures to regulate social interaction
(b) failure to develop peer relationships appropriate to developmental level
(c) a lack of spontaneous seeking to share enjoyment, interests, or achievements with other people (e.g., by a lackof showing, bringing, or pointing out objects of interest)
(d) lack of social or emotional reciprocity
(2) qualitative impairments in communication as manifested by at least one of the following:
(a) delay in, or total lack of, the development of spoken language (not accompanied by an attempt to compensatethrough alternative modes of communication such as gesture or mime)
(b) in individuals with adequate speech, marked impairment in the ability to initiate or sustain a conversation withothers
(c) stereotyped and repetitive use of language or idiosyncratic language
(d) lack of varied, spontaneous make-believe play or social imitative play appropriate to developmental level
(3) restricted repetitive and stereotyped patterns of behavior, interests, and activities, as manifested by at least oneof the following:
(a) encompassing preoccupation with one or more stereotyped and restricted patterns of interest that is abnormaleither in intensity or focus
(b) apparently inflexible adherence to specific, nonfunctional routines or rituals
(c) stereotyped and repetitive motor mannerisms (e.g., hand or finger flapping or twisting, or complex whole-bodymovements)
(d) persistent preoccupation with parts of objects
B. Delays or abnormal functioning in at least one of the following areas, with onset prior to age 3 years: (1) socialinteraction, (2) language as used in social communication, or (3) symbolic or imaginative play.
C. The disturbance is not better accounted for by Rett's Disorder or Childhood Disintegrative Disorder.
17
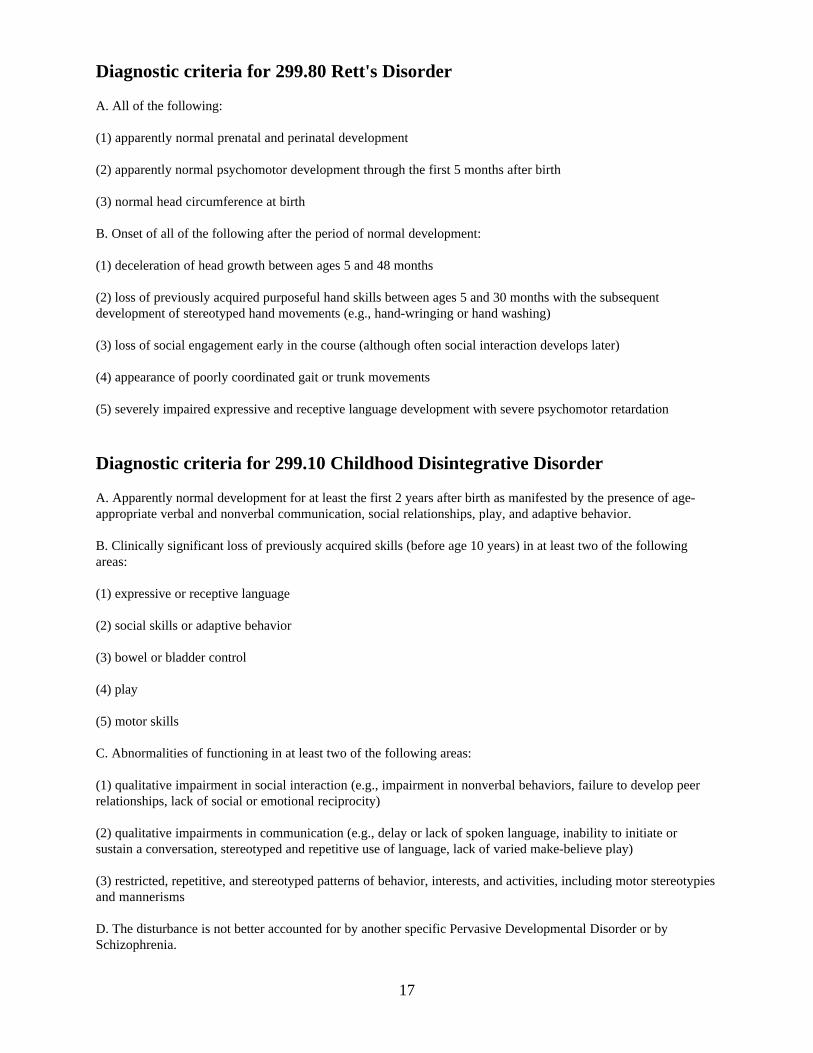
Diagnostic criteria for 299.80 Rett's Disorder
A. All of the following:
(1) apparently normal prenatal and perinatal development
(2) apparently normal psychomotor development through the first 5 months after birth
(3) normal head circumference at birth
B. Onset of all of the following after the period of normal development:
(1) deceleration of head growth between ages 5 and 48 months
(2) loss of previously acquired purposeful hand skills between ages 5 and 30 months with the subsequentdevelopment of stereotyped hand movements (e.g., hand-wringing or hand washing)
(3) loss of social engagement early in the course (although often social interaction develops later)
(4) appearance of poorly coordinated gait or trunk movements
(5) severely impaired expressive and receptive language development with severe psychomotor retardation
Diagnostic criteria for 299.10 Childhood Disintegrative Disorder
A. Apparently normal development for at least the first 2 years after birth as manifested by the presence of age-appropriate verbal and nonverbal communication, social relationships, play, and adaptive behavior.
B. Clinically significant loss of previously acquired skills (before age 10 years) in at least two of the followingareas:
(1) expressive or receptive language
(2) social skills or adaptive behavior
(3) bowel or bladder control
(4) play
(5) motor skills
C. Abnormalities of functioning in at least two of the following areas:
(1) qualitative impairment in social interaction (e.g., impairment in nonverbal behaviors, failure to develop peerrelationships, lack of social or emotional reciprocity)
(2) qualitative impairments in communication (e.g., delay or lack of spoken language, inability to initiate orsustain a conversation, stereotyped and repetitive use of language, lack of varied make-believe play)
(3) restricted, repetitive, and stereotyped patterns of behavior, interests, and activities, including motor stereotypiesand mannerisms
D. The disturbance is not better accounted for by another specific Pervasive Developmental Disorder or bySchizophrenia.
18
Diagnostic criteria for 299.80 Asperger's Disorder
A. Qualitative impairment in social interaction, as manifested by at least two of the following:
(1) marked impairment in the use of multiple nonverbal behaviors such as eye-to-eye gaze, facial expression, bodypostures, and gestures to regulate social interaction
(2) failure to develop peer relationships appropriate to developmental level
(3) a lack of spontaneous seeking to share enjoyment, interests, or achievements with other people (e.g., by a lackof showing, bringing, or pointing out objects of interest to other people)
(4) lack of social or emotional reciprocity
B. Restricted repetitive and stereotyped patterns of behavior, interests, and activities, as manifested by at least oneof the following:
(1) encompassing preoccupation with one or more stereotyped and restricted patterns of interest that is abnormaleither in intensity or focus
(2) apparently inflexible adherence to specific, nonfunctional routines or rituals
(3) stereotyped and repetitive motor mannerisms (e.g., hand or finger flapping or twisting, or complex whole-bodymovements)
(4) persistent preoccupation with parts of objects
C. The disturbance causes clinically significant impairment in social, occupational, or other important areas offunctioning.
D. There is no clinically significant general delay in language (e.g., single words used by age 2 years,communicative phrases used by age 3 years).
E. There is no clinically significant delay in cognitive development or in the development of age-appropriate self-help skills, adaptive behavior (other than in social interaction), and curiosity about the environment in childhood.
F. Criteria are not met for another specific Pervasive Developmental Disorder or Schizophrenia.
299.80 Pervasive Developmental Disorder Not Otherwise Specified (IncludingAtypical Autism)
This category should be used when there is a severe and pervasive impairment in the development ofreciprocal social interaction or verbal and nonverbal communication skills, or when stereotyped behavior, interests,and activities are present, but the criteria are not met for a specific Pervasive Developmental Disorder,Schizophrenia, Schizotypal Personality Disorder, or Avoidant Personality Disorder. For example, this categoryincludes "atypical autism"--presentations that do not meet the criteria for Autistic Disorder because of late age atonset, atypical symptomatology, or subthreshold symptomatology, or all of these.

19
B. Early History of Autism
Our understanding of autism has evolved from a crude and inaccurate description to amore refined and legitimate scientific knowledge. In the beginning, and partly based on Kanner’sperception of autism, it was believed that persons with autism had "good cognitive potentialities."The myth of the autistic child possessing a latent genius endured for several years and has causedgreat distress for family members and teachers who have nearly always failed to find the key to“unlock” the alleged genius. Another misconception linked to Kanner’s belief, and laterperpetuated by Bruno Bettleheim, was the view that it was the parents’ behavior, particularly themother’s, that caused the autistic condition. Kanner observed that parents in his clinic were fromupper-middle-class backgrounds and had a cold manner in dealing with their autistic children. Bettleheim, in the 1960s, picked up this theme and built a theory of the nature of autism in whichthe emotional coldness of parents was the central cause. The term “refrigerator mom” was usedto describe the mother’s hopelessness, despair, and apathy which, when projected onto the child,caused the child to withdraw from reality. Bernard Rimland, a parent and founder of the AutismSociety of America, in the late 1960s played an important role in changing the prevailingpsychoanalytic view of autism that had been popularized by Bettleheim. Rimland put forth aneurologically based approach, which opened the door for the burgeoning biomedical research oftoday.
The abandonment of a psychoanalytic approach to treating autism led to the rapid growthof research and treatment based on behavioral, cognitive-developmental, and recent medicalresearch. Beginning in the 1960s and continuing through the present, psychological research wasapplied to the learning of children with autism. Today the integration of basic behavioral researchand treatment programs into many different treatment settings has led to substantial knowledgeand improved services. Applied behavior analysis has led to a much broader emphasis oneducational programming and the need for early teaching of practical skills for community livingthroughout the life span. The availability and effectiveness of behavioral support services, inconjunction with the concept of normalization and the least restrictive environment, havecontributed to the reversal in a trend to institutionalize children with autism. Before effectivebehavioral support services were so commonplace, children with autism, typically by age nine or10, were so out of control their parents were compelled to place them in institutions. Unfortunately, the medical profession, faced with little or no alternatives, endorsed the idea ofinstitutionalizing children during the 1960s and 1970s.