Embed Size (px)
Citation preview

SESSION 11 – Stability Data – Evaluate, Set Specifications and Prepare Reports
Dan Willingmyre, Neha Frantz,
Philip Pue-Gilchrist, Donnie
Pulliam, Ketan Shah, and Brian K
Nunnally

Agenda
• Introduction
• Inputs and Outputs
• Case Study: Laboratory Variability
• The specification process
• Case Study: Setting Stability Specifications
2

Purpose of Stability Studies
• Evaluate Quality of DS and DP under Environmental Influences:
› Temperature
› Humidity (if applicable)
› Light
› Outcome: Establishment of recommended storage conditions, retest or
expiry periods for DS and shelf life for DP.
• Evaluate Quality based on Product-related factors:
› Interaction of DS with excipients
› Product in container closure systems and packaging materials
3 3

Inputs
• The goal is to set a DP
expiration date on the
label
• Many inputs are needed to
set the DP expiration date
• Within each input are
many more inputs
• Considering each one of
these inputs will allow for a
comprehensive stability
strategy to be developed.
4

Drug Substance
5
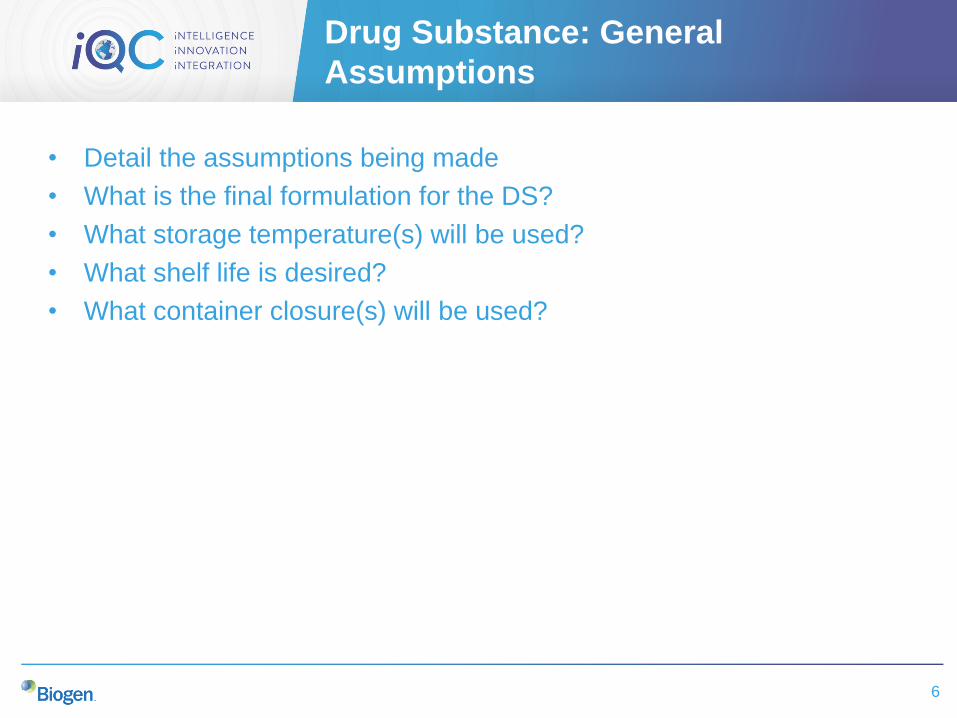
Drug Substance: General
Assumptions
• Detail the assumptions being made
• What is the final formulation for the DS?
• What storage temperature(s) will be used?
• What shelf life is desired?
• What container closure(s) will be used?
6

Development Studies
• Does not replace real-time stability
• Provides insight into stability-indicating attributes
Protocol-driven Accelerated Stability Assessment Program (ASAP) Studies1,2
• Impurities
Forced degradation / characterization
• 6M / accelerated condition on development material to support clinical DP shelf-life.
Real-time stability on feasibility
1: Waterman, K.C., et al (2007), Pharmaceutical Research, Vol. 24, No. 4 April 2007.
2: Waterman, K.C. (2010), AAPS Short Course on Stability Testing in Pharmaceutical Development.

Phase Specific Stability Protocol
Considerations (Small Molecule)
# of Batches 1 1 3a 0-3b
Storage
Conditions
per ICH Q1A (R2)
25°C (Zone II) or 2-8 °C Globally
30°C (Intermediate)
40°C (Accelerated)
Target
Retest/Expiry60 Months
Minimum Data at
submission
Development data (as
applicable) and
3M, minimum
12M real timeN/A (Post-approval
updates)
Initial Retest
Claim
(ICH Q1E)
6M, minimum 24M, minimumExtensions with real-
time data
Storage label
ClaimCRT (20-25 C) or 2-8 C CRT (20-25 C) or 2-8 C
a: at least 1 batch at commercial scale from intended site of mfg
b: depending on # of full scale registration batches, a total of 3 batches at commercial scale.
Phase IPhase
II
Phase
III/RegPVR/
PostApp

Phase Specific Stability – Special
Studies (Small Molecule)
9
Special Study
Description
Photostability
(ICH Q1B)
Evaluate at Ph1 for DS handling /
pack (1 batch)Conduct in PhIII if process / packaging
changes (1 batch)
Temperature cycling/
Short-term excursion
studies
N/A – support handling / TE with
stability data up to 40 C
(accelerated)
Conduct to support supply chain and
handling of drug substance (1 batch)
Temp range = -20oC to up to 70oC
Stability of RSM and
Process Intermediates
N/A unless required or need
determined during early phase.
Conduct prior to registration or during
PVRs
(1 batch)
Phase IPhase
II
Phase
III / RegPVR/
PostApp

Phase Specific Stability Protocol
Considerations (Large Molecule)
# of Batches 1 1 3 / 3 0-3
Storage
Conditions
per ICH Q1A (R2)
Frozen or 2-8 °C
25°C (Accelerated)
Target Expiry 24 Months (minimum)
Minimum Data at
submission
Development data (as
applicable) and 6M (min)12M real time
N/A (Post-approval
updates)
Initial Expiry
Claim (ICH Q1E)12M, minimum 24M, minimum
Extensions with real-
time data
Storage label
ClaimFrozen or 2-8 °C Frozen or 2-8 °C
Phase IPhase
II
Phase
III/PVPostApp

Methods
11

Phase Specific Stability Tests (Small
Molecule DS)
Test List (ICH Q6A)
Appearance Verify consistency and free from foreign matter
XRPD
Chiral
Evaluate as applicable per
ICH Q6A decision trees 4
and 5Specifications as applicable
Assay Required: ICH Q6A
ImpuritiesEvaluate from development studies and ICH Q6A Decision Tree 2;
Report, Identify, Qualify per thresholds stated in ICH Q3A (R2)
Water ContentRequired: ICH Q6A unless otherwise justified
MLTN/A due to
rationale*TBD per ICH Q6A Decision Tree 6
Phase IPhase
II
Phase
III/RegPVR/
PostApp
* PAD control strategy for Phase 1
*
*
Methods validation
*
Specs Proposal/SRB
*

Methods: Large Molecule DS
• Additional methods
for process
impurities (e.g. HCP,
DNA, Leachate(s),
Viral inactivation
surfactants, etc) may
be added
Type of tests Assay Attribute
General
AppearanceColor
Clarity
pH pH
Osmolality Osmolality
Quantity Protein Concentration Total protein concentration
IdentityBinding Assay Identity
icIEF Identity
Biological
ActivityBinding Assay Potency
Purity and
Impurities
SEC Aggregate
Non Reducing CE-
SDS
Total Purity
Single Highest Impurity
icIEFLower pI Isoforms
Main Peak
Safety
Endotoxin (USP,EP) Endotoxin level
BioburdenTAMC
TYMC
13
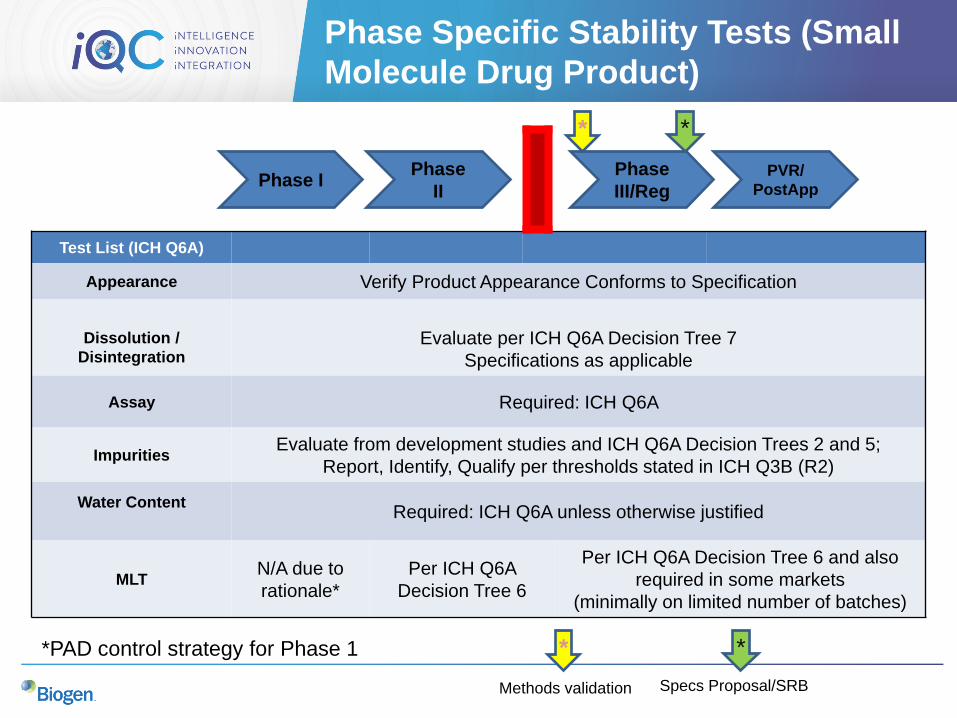
Phase Specific Stability Tests (Small
Molecule Drug Product)
Test List (ICH Q6A)
Appearance Verify Product Appearance Conforms to Specification
Dissolution /
DisintegrationEvaluate per ICH Q6A Decision Tree 7
Specifications as applicable
Assay Required: ICH Q6A
ImpuritiesEvaluate from development studies and ICH Q6A Decision Trees 2 and 5;
Report, Identify, Qualify per thresholds stated in ICH Q3B (R2)
Water ContentRequired: ICH Q6A unless otherwise justified
MLTN/A due to
rationale*
Per ICH Q6A
Decision Tree 6
Per ICH Q6A Decision Tree 6 and also
required in some markets
(minimally on limited number of batches)
Phase IPhase
II
Phase
III/RegPVR/
PostApp
*PAD control strategy for Phase 1
* *
*
Methods validation
*
Specs Proposal/SRB

Methods: Large Molecule DP
• CCI is only tested on
stability
Type of tests Assay Component
General
Appearance
Color
Clarity
Particulates
pH pH
Osmolality Osmolality
QuantityProtein Concentration Total protein concentration
Extractable Volume Volume in container
IdentityBinding Assay Identity
icIEF Identity
Biological Activity Binding Assay Potency
Purity and
Impurities
SEC Aggregation
Non Reducing CE-
SDS
Total Purity
Single Highest Impurity
icIEFLower pI Isoforms
Main Peak
Safety
Endotoxin Endotoxin level
Sterility Sterility
CCI Container closure integrity
Particulates≥10µm Particles
≥25µm Particles
15

0
5
10
15
20
25
30
1 2 3 4 5 6 7 8 9
Ran
ge
Accuracy or Precision?
• Problem statement
– Yield for the material was outside
the 2σ Processing Limits.
– Yield was above 100%.
– Analytical and manufacturing
investigation revealed the
problem was likely to due to an
assay issue.
• Solution
– The problem was the variability
(not the accuracy, per se) of the
quantity assay, so there was a
need to reduce the variability of
the quantity assay.
60
80
100
120
1 2 3 4 5 6 7 8 9
1-P
oin
t A
verag
e

Accuracy versus Precision

What do you do?
Are these the right answers?
Maybe, maybe not?
How do you know????
Run more samples!
Run more replicate injections!

Step 1: Determine your precision
Four common methods
• Use of validation data
• Stability data
• Control data
• Blind control data
19

Use of validation data to determine
precision
Advantages
• Easy to acquire
• Provides variance component
analysis (even if only for a
‘moment in time’)
• Best accepted method
Disadvantages
• Rarely gives accurate assessment
of true variability
• Spotlight effect
› Underestimation of variability
due to intense concentration
and the use of highly skilled
analysts during special
studies such as validations
• Lack of long term variability

Example of using validation data
Analyst Day/Assay Instrument Capillary Result
1/1 6.5
1/2 7.2
1/3 6.7
2/1 8.1
2/2 7.6
1
2/3 8.2
1/1 7.8
1/2 7.6
1/3 7.3
2/1 7.4
2/2 7.0
2
2/3
1 1
7.0
1/1 7.4
1/2 7.6
1/3 7.2
1/4 7.4
1/5
2
7.1
2/1 6.2
2/2 6.6
2/3 6.7
2/4 6.1
3
2/5
2
3
7.1
Mean 7.2
Std 0.55
%RSD 7.7%
RSquare
RSquare Adj
Root Mean Square Error
Mean of Response
Observations (or Sum Wgts)
0.46645
0.377525
0.436357
7.172727
22
Summary of Fit
Model
Error
C. Total
Source
3
18
21
DF
2.9963030
3.4273333
6.4236364
Sum of Squares
0.998768
0.190407
Mean Square
5.2454
F Ratio
0.0089 *
Prob > F
Analysis of Variance
Intercept
Instrument
Capillary
Day
Term
6.66
1.3233333
-1.166667
0.3666667
Estimate
0.596177
0.59083
0.373674
0.251931
Std Error
11.17
2.24
-3.12
1.46
t Ratio
<.0001 *
0.0380 *
0.0059 *
0.1628
Prob>|t|
Parameter Estimates
Response Result

Use of stability data to determine
precision
Advantages
• Provides long term variability
• Relatively immune to Spotlight
effect
• Minimal contribution of
sampling variability
• No contribution due to
manufacturing variability
Disadvantages
• Material must be unchanging
or have a predictable rate of
change
• Can take a long time to
acquire the data set
• Lacks ability to show day to
day variability
• Periodicity can be invisible

Example of using stability data
Timepoint Potency Lot
1 39.06 A
2 42.70 A
3 46.53 A
1 39.86 B
2 40.48 B
3 39.79 B
4 42.14 B
5 37.06 B
1 36.13 C
2 39.36 C
3 37.66 C
4 38.97 C
5 35.20 C
6 40.18 C
1 40.22 D
2 41.34 D
3 40.72 D
Lot
A B C D
Mean 42.76 39.86 37.92 40.76
Standard
Deviation 3.74 1.83 1.95 0.56
RSD (%) 8.74 4.60 5.13 1.38
Estimated Method RSD (%) 5.0

Use of control data to determine
precision
Advantages
• Easy to do, if control data is
available
• Provides variance component
analysis
• Provides long term variability
Disadvantages
• Spotlight effect
› Especially when there are
acceptance criteria or system
suitability criteria associated with
the control
• Control must be run identically
to sample

Example of using control
data
12
12.5
13
13.5
14
14.5
15
15.5
16
0 5 10 15 20 25 30 35 40 45 50 55 60 65 70 75
Indiv
iduals
0
0.5
1
1.5
2
2.5
0 5 10 15 20 25 30 35 40 45 50 55 60 65 70 75
Mo
vin
g R
an
ge
s = 0.326s = 0.132
s = 0.578
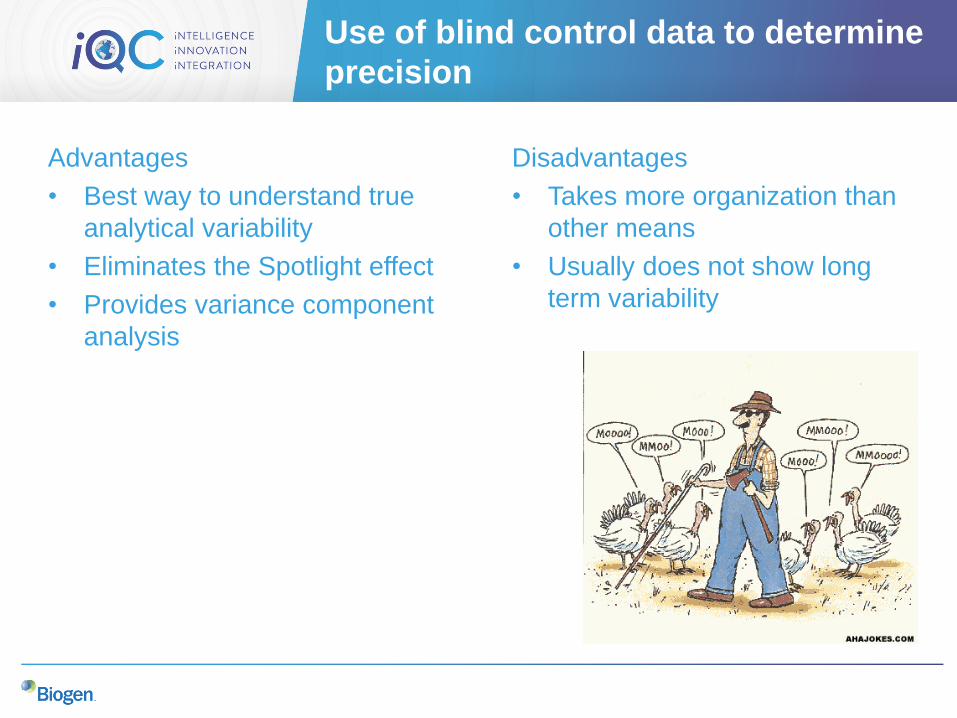
Use of blind control data to determine
precision
Advantages
• Best way to understand true
analytical variability
• Eliminates the Spotlight effect
• Provides variance component
analysis
Disadvantages
• Takes more organization than
other means
• Usually does not show long
term variability

Example of using blind control data
0
1
2
3
4
5
6
7
8
9
10
0 5 10 15 20 25 30 35 40 45 50 55 60 65 70 75
Indiv
iduals
0
1
2
3
4
5
6
7
0 5 10 15 20 25 30 35 40 45 50 55 60 65 70 75
Movin
g R
ange
Laboratory expanded

Step 2: Reduce variability
• So now you know your precision, what’s next
• (Ruthlessly) reduce variability!!!
› The exercise will give an example of the effects of reducing
variability
• Steps
› Identify sources of variation (e.g. reagents, equipment, techniques,
practices, knob twisting, etc.)
› For reagents and equipment – take the randomness out of the
process and standardize
› For techniques and practices – decide on one-way of doing things
› Implement changes
28
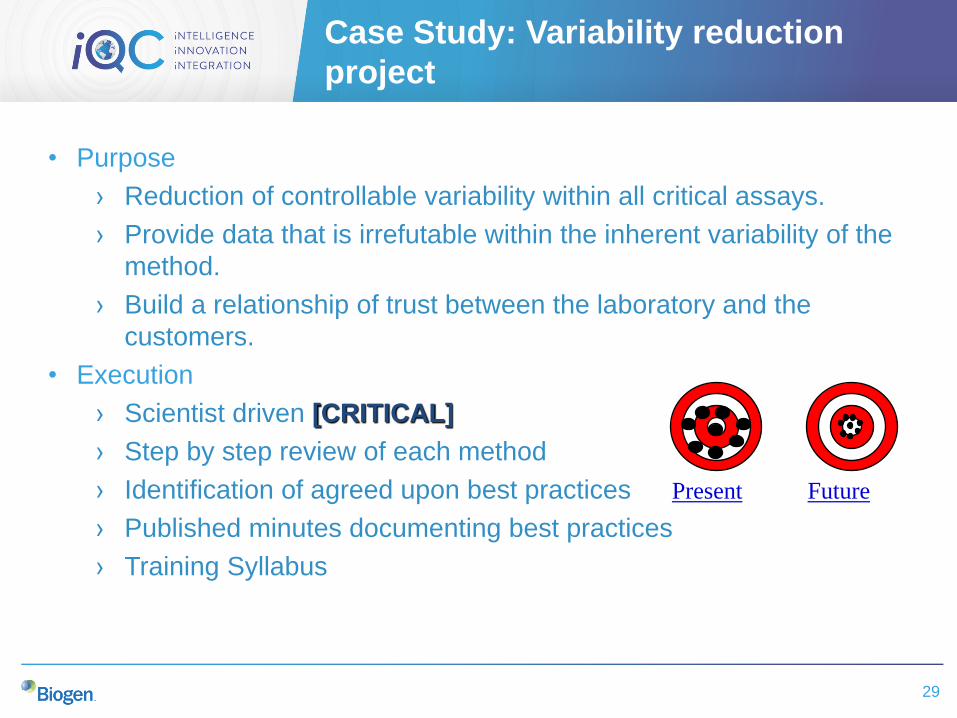
Case Study: Variability reduction
project
• Purpose
› Reduction of controllable variability within all critical assays.
› Provide data that is irrefutable within the inherent variability of the
method.
› Build a relationship of trust between the laboratory and the
customers.
• Execution
› Scientist driven [CRITICAL]
› Step by step review of each method
› Identification of agreed upon best practices
› Published minutes documenting best practices
› Training Syllabus
Present Future
29

Concentration DOE Data Summary
• Scientist portion of the total
variability dropped over 72%
for the drug substance and
47% for the intermediate
• Overall variability dropped
50% for the drug substance
• No drop for the intermediate
– This is due to variability in
dilutions
Assay Control
(Intermediate)
Drug Substance
Total Analyst/
Assay
Total Analyst
Pre-
project
DOE
92.7 79.2 30.6 22.2
Post-
project
DOE
96.5 41.6 15.3 6.2
% Drop
in s
0% 47% 50% 72%
Intermediate – Before = 5.1%; After = 5.6%
Drug Substance – Before = 6.3%; After = 3.2%

Proposed replication strategy
• Two scientists run the assay
independently
› Keep n = 4 replicates, but they must be
independent draws from the sample. This
will also help if there is any homogeneity
variability.
› Averages across scientist
› Averages across two standard curves
(key component of variability)
• No acceptance criterion for agreement
between replicates or between scientists
› The point of the replication strategy is to
average out variability
1 2 3 4
Sample Replicates
Analyst 1
Result Result Result Result
1 2 3 4
Sample Replicates
Analyst 2
Result Result Result Result
A
Concentration
A
Concentration
31
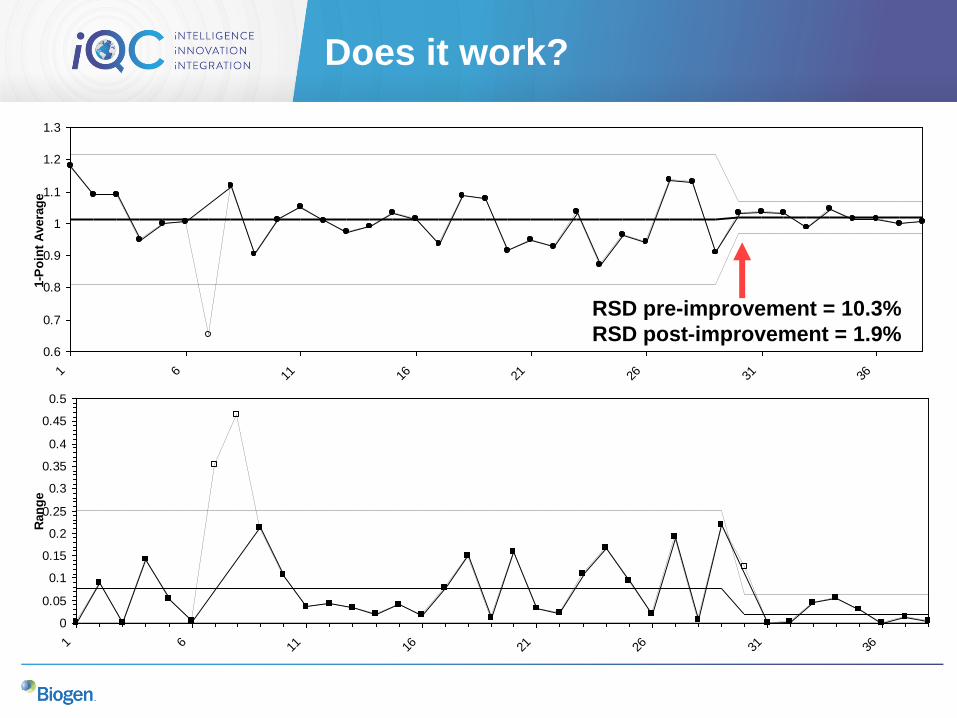
Does it work?
0.6
0.7
0.8
0.9
1
1.1
1.2
1.3
1 6 11 16 21 26 31 36
1-P
oin
t A
vera
ge
0
0.05
0.1
0.15
0.2
0.25
0.3
0.35
0.4
0.45
0.5
1 6 11 16 21 26 31 36
Ran
ge
RSD pre-improvement = 10.3%
RSD post-improvement = 1.9%

Formulation
33

Formulation: Studies
• The various buffer combinations are studied to determine the impact on
quality attributes:
› DOEs to optimize the formulation.
› Short term stability to justify selection.
• Formulation lock
› Research different formulations leading to the selection of a lead
candidate
› Confirming final concentration
› 6 months of stability data will be collected to confirm stability
34

Drug Product
35

Drug Product: General Assumptions
• Detail the assumptions being made
• What is the final formulation for the DP? Is it the same as DS?
• What storage temperature(s) will be used?
• What shelf life is desired?
• What container closure(s) will be used? Are there multiple
presentations?
36

Phase Specific Stability Protocol
Considerations (Small Molecule)
# of Batches 1 / strength 1 / strength 3a 0-3b
Storage Condition
per ICH Q1A (R2)
30°C (Zone IV) Globally
25°C (Zone II) – Back-up condition to 30°C (Zone IV)
40°C (Accelerated)
Target Shelf-life 36M, minimum
Minimum Data at
submission
Development data (as
applicable) and
1 month 40°C (min)
12M LT + 6M Acc.N/A (Post-approval
updates)
Initial shelf-life
6M, min
(with 6M development data,
initial shelf-life 12M)
24M, minimum Extensions with real-
time data
Storage label
Claim
Store below 30°C
(Store below 25°C, if applicable)
Store below 30°C
(Store below 25°C, if applicable)
a: at least 1 batch at commercial scale
b: depending on # of full scale registration batches, a total of 3 batches at commercial scale.
Phase IPhase
II
Phase
III/RegPVR/
PostApp

Phase Specific Stability – Special
Studies (Small Molecule)
Special Study
Description
Photostability
(ICH Q1B)
If DS photosensitive,
evaluate at Ph1
(1 batch)
Conduct in Ph3 / final
commercial image in open dish
and commercial package (as
applicable)
Temperature cycling
Short-term excursion
studies
N/A – support handling / TE with
stability data
Conduct to support supply chain
and handling of drug product,
and unmonitored shipping of
drug (1 batch)
Bulk Hold Studies N/A through phase 2
Conduct on 1 batch per ICH
conditions in bulk container (or
smaller, comparable container).
In-use stability
(for multidose
containers)
EU Guidance:
CPMP/QWP/2934/99
N/A through phase 2
Conduct on 2 batches in worst-
case commercial multidose
container; with one batch at end
of shelf-life.
Phase IPhase
II
Phase
III / RegPVR/
PostApp

Phase Specific Stability Protocol
Considerations (Large Molecule)
# of Batches 1 1 3a 0-3b
Storage Condition
per ICH Q1A (R2)
2 - 8°C
25°C (Accelerated)
40°C (Stressed)
Target Shelf-life 36M, min
Minimum Data at
submission
Development data (as
applicable) and
6M (min)
12M LT + 6M Acc.N/A (Post-approval
updates)
Initial shelf-life 12M, min 24M, minExtensions with real-
time data
Storage label
ClaimStore at 2-8°C
Store at 2-8°C
(X months outside of refrigeration, if
applicable)
Phase IPhase
II
Phase
III/PVPostApp

Phase Specific Stability – Special
Studies (Large Molecule)
Special Study
Description
Photostability
(ICH Q1B)
Conduct in final commercial
package
Temperature cycling
Short-term excursion
studies
Conduct to support supply chain
and handling of drug product (1
batch)
Secondary CCS
Conduct many of the same studies needed for the
original CCS (omit photostability, End to End,
Cycling studies)
End to End
Conduct on 1 batch; Need DS at
expiry and then longterm,
accelerated, stress DP studies
Phase IPhase
II
Phase
III / PVPostApp

Drug Product: Needs
• Final packaging for Photostability studies
• Pstab data for Cycle 2 and Cycle 3 concentrations
• Final formulation
• Specifications
• Confirmation of no method changes
• # vial sizes (assumption is 3) and fill volumes
• “Worst case” justification
• Ask agencies for the ability to use statistics (CMC question)
• Patient convenience needs?
• In use stability data
• Will excipient to protein ratio be the same across all strengths
• Agency agreement on stability strategy
41

Packaging and Device
42
Packaging and Device: General
Assumptions
• Detail the assumptions being made
• Is the container the same or is a switch needed for the device?
• What shelf life is desired?
• What container closure(s) will be used? Are there multiple
presentations?
43

Phase Specific Stability Protocol
Considerations (Devices)
# of Batches N/A N/A 3 0
Storage Condition
per ICH Q1A (R2)
2 - 8°C
25°C (Accelerated)
40°C (Stressed)
Target Shelf-life 36M, min
Minimum Data at
submission12M LT + 6M Acc. N/A
Initial shelf-life 24M, minExtensions with real-
time data
Storage label
Claim
Store at 2-8°C
(X months outside of refrigeration, if
applicable)
Phase IPhase
II
Phase
III/PVPostApp

Phase Specific Stability – Special
Studies (Devices)
Special Study
Description
Photostability
(ICH Q1B)
Conduct in final commercial
package
Temperature cycling
Short-term excursion
studies
Conduct to support supply chain
and handling of drug product (1
batch)
End to End
Conduct on 1 batch; Need DS at
expiry and then longterm,
accelerated, stress DP studies
Phase IPhase
II
Phase
III / PVPostApp

Specifications
46

The Specification Process
• Specifications are reviewed by a committee with a chairperson as the lead
› Committee is a standing cross-functional team with other ad-hoc
members brought in as needed
› Additional Executive committee is available for new modalities,
specification strategy, and higher level discussions.
• Intent is to infuse and maintain consistency of approach for specification setting
and rationale
• The Specification report is the internal technical report supporting the proposed
specifications/strategy; intended to be a more detailed version of the 32S45 and
32P56 filing documents (e.g. extensive explanation of stats where applicable)
47

The Specification Process: Scope
• Specification review process applies to all stages, but is phase-
appropriate
• Platform specifications have been developed for early stage
compounds based on standardization
› Action limits have been added at release while we are still learning
about the molecule
• Inquiries impact specs, this is also in scope of SRB review and
endorsement
48

Specifications: Assumptions
• Clinical specifications are the maximum ever submitted (likely lower)
• Best support for any specification is clinical data
• Manufacturing capability will drive final specifications as well
• Japan only allows one specification; so stability specification is licensed
specification
49

Specifications: Drug Substance
Type of
testAssay Component Release Limit Stability Limit
General
AppearanceColor <YX Same as Release
Clarity < A NTU Same as Release
pH N/A TBD (equal tail tolerance) Same as Release
Osmolality N/A TBD (equal tail tolerance) N/A
Quantity Concentration N/A TBD (equal tail tolerance) N/A
Identity
Binding Assay N/AMeets Biological Activity
SpecificationN/A
icIEF N/AComparable to reference
standardN/A
Biological
ActivityBinding Assay N/A
TBD (equal tail tolerance) +
clinical experienceSame as Release
Safety
Endotoxin
(USP,EP)N/A ≤ Z EU/mL N/A
BioburdenTAMC ≤ Y CFU/10mL N/A
TYMC ≤ Y CFU/10mL N/A
50

Specifications: Drug Substance
(cont’d)
Type of
testsAssay Component Release Limit Stability Limit
Biological
ActivityBinding Assay N/A
TBD (equal tail tolerance) +
clinical experienceSame as Release
Purity and
Impurities
SEC N/ATBD (equal tail tolerance) +
clinical experience
= DS release spec + D X
mos
Purity
Total PurityTBD (equal tail tolerance) +
clinical experience
= DS release spec + D X
mos
Single Highest ImpurityTBD (equal tail tolerance) +
clinical experience
= DS release spec + D X
mos
pI
Lower pI IsoformsTBD (equal tail tolerance) +
clinical experience
= DS release spec + D X
mos
Main PeakTBD (equal tail tolerance) +
clinical experience
= DS release spec + D X
mos
• For highlighted parameters, if DS is stored frozen, there is no need for a different stability
limit as there are no trends over time for frozen material.
• X months is the shelf life of DS
51

Specifications: Drug Product
Type of
testAssay Component Release Limit Stability Limit
General
Appearance
Color <YX Same as Release
Clarity < A NTU Same as Release
Particulates Essentially Free of Particles Same as Release
pH N/A TBD (equal tail tolerance) Same as Release
Osmolality N/A TBD (equal tail tolerance) N/A
Quantity
Concentration N/A TBD (equal tail tolerance) N/A
Extractable
VolumeN/A ≥ X mL N/A
Identity
Binding Assay N/AMeets Biological Activity
SpecificationN/A
icIEF N/AComparable to Reference
StandardN/A
Biological
ActivityBinding Assay N/A
TBD (equal tail tolerance) +
clinical experienceSame as Release
Safety
Endotoxin N/A ≤ Z EU/mL N/A
Sterility N/A No Growth N/A
CCI N/A N/A Pass
Particulates≥10µm Particles ≤6000 Particles/Container Same as Release
≥25µm Particles ≤600 Particles/Container Same as Release
52

Specifications: Drug Product (cont’d)
Type of
testAssay Component Release Limit Stability Limit
Purity and
Impurities
SEC N/ATBD (equal tail tolerance) +
clinical experience
= DS release spec + D Y mos
+ DP Mfg
Purity
Total PurityTBD (equal tail tolerance) +
clinical experience
= DS release spec + D Y mos
+ DP Mfg
Single Highest
Impurity
TBD (equal tail tolerance) +
clinical experience
= DS release spec + D Y mos
+ DP Mfg
icIEF
Lower pI IsoformsTBD (equal tail tolerance) +
clinical experience
= DS release spec + D Y mos
+ DP Mfg
Main PeakTBD (equal tail tolerance) +
clinical experience
= DS release spec + D Y mos
+ DP Mfg
• For highlighted parameters, if DS is stored frozen, the formula will be DP release specification + D Y
months + DP Mfg
53

Label
54

Label
• Label will include expiry and storage temperature
• Package insert will include patient convenience details
55

Setting Specifications for Stability: Case Study

Approach
• Product quality attributes for this compound demonstrate significant change as
a function of storage time and temperature:
• Global Stability collaborated with several groups to set release and stability
specifications.
• DS stability specification calculation = (DS release specification) + (maximum
predicted change over storage)
• DP stability specification calculation = (DS release specification) + (change
predicted during DP manufacturing) + (maximum predicted change over DP
storage)
57

Widening Stability Specifications: Case Study

Case Study: Specification Widening
• A new manufacturer for the DP
was being added for a biotech
product
• As part of the submission, a
specification was widened.
• At the 5±3°C long-term storage
condition, a biphasic trend exists
• Appropriate statistical model was
applied to fit the data set
• The change was then calculated
between the intercept of the
common slope line at T=0 and the
plateau of the upper 99.9%
confidence interval at shelf life.
The resulting value represents the
worst case on stability.
59
• The widening was supported by a
tox/safety assessment.
• The proposed widening was
accepted!

A word about the Regulatory filing…

CTD
Module 3Quality
3.0
CTD Table of Contents 2.1
CTD Introduction 2.2
Quality
Overall
Summary
2.3
Nonclinical
Overview 2.4
Nonclinical Written
and Tabulated
Summaries 2.6
Clinical
Summary
2.7
Clinical
Overview
2.5
Module 2
Not Part of the CTDModule 1Regional
Administrative
Information
1.0
Module 4Nonclinical
Study Reports
4.0
Module 5Clinical Study Reports
5.0
CTD Structure

CMC Granularity
• Granularity depends on the product and life cycle decisions
› Defines how the completed document is broken down, tagged and stored for reuse
› Determines smallest piece of information that is reusable
› Changing granularity during lifecycle is difficult, therefore must be planned at the
beginning.
• More complex products, such as biotech, typically benefit from greater
granularity
• Granularity beyond the ICHM4 granularity annex can be used, such
as sub-sections or attached reports; these are separate
documents/leaves
62
Stability Information (32S7 and 32P8)
• Summary and Conclusions (32S71 and 32P81)
› This includes a summary and analysis of the stability data, including figures
• Post-approval Stability Protocol and Commitment (32S72 and 32P82)
› This includes the post-approval stability protocol, with analytical methods,
specifications, and timepoints tested
• Stability data (32S73 and 32P83)
› This includes the stability data tables
• Additional stability documents (e.g. in-use stability, clinical stability,
stress testing, etc.) may be included as separate documents (e.g.
additional granularity)
• Legacy programs may have slightly different set-ups
63

Specification Information
• DS Specifications are listed in 3.2.S.4.1; DP Specifications in 3.2.P.5.1
• Justification of these specifications are presented in 3.2.S.4.5 (DS)
and 3.2.P.5.6 (DP)
• Justification for method stability indicating behavior can be put in
several places in the dossier – pick one and put hyperlinks in the
other places
64

Managing Multiple Versions
• Ideally, there is only one version of the filing used for all markets
• In practice it is difficult to have a single version (if not impossible)
› Japan requires more detail in the manufacturing and testing sections than any
other market
› Specifications between markets can be difficult to align
• For 32S7 and 32P8, it is often easy to have one version of the stability
data and stability conclusion sections
65