Embed Size (px)
Citation preview

COORDINATING TASKS IN M-FORM AND U-FORM ORGANISATIONS*
Yingyi Qian and Gérard Roland University of California, Berkeley
Chenggang Xu
London School of Economics and Political Science
Contents: Abstract 1. Introduction 2. Modelling Task Coordination as Attribute Matching 3. M-form vs. U-form 4. Generalization 5. Conditions for the Optimality of M-Form and U-Form 6. An Application: Agricultural Reform in China and the former Soviet Union 7. Concluding Remarks References The Suntory Centre Suntory and Toyota International Centres for Economics and Related Disciplines London School of Economics and Political Science Discussion Paper Houghton Street No.TE/03/458 London WC2A 2AE June 2003 Tel.: 020-7955 6698 ___________________________________________________________________ * We are grateful to Masahiko Aoki, Susan Athey, Patrick Bolton, Jacques Cremer, Mathias Dewatripont, Guido Friebel, Oliver Hart, Wei Li, Eric Maskin, Paul Milgrom, John Moore, John Roberts, Dani Rodrik, Jan Svejnar, Oliver Williamson, two anonymous referees, and seminar participants at Berkeley, LSE, Michigan, Stanford, Toulouse, and the participants at the 1999 ESSET symposium in Gerzensee and at the Fifth Nobel Symposium in Economics in Stockholm for helpful discussions and comments. Roland and Xu benefited from an ACE grant and Roland benefited from a fellowship at the Center for Advanced Studies in Behavioral Sciences at Stanford.

Abstract
We model the coordination of specialised tasks inside an organisation as "attribute
matching". Using this method, we compare the performance of organisational forms
(M-form and U-form) in implementing changes such as innovation and reform. In our
framework, organisational forms affect the information structure of an organisation
and thus the way to coordinate changes. Compared to the U-form, the M-form
organisation achieves better coordination but suffers from fewer economies of scale.
The distinctive advantage of the M-form is flexibility of experimentation, which allows
the organisation to introduce more innovation and reform. The theory is illustrated by
the organisational differences between China and the former Soviet Union and
sheds light on their different reform strategies, particularly with regard to the
prevalence of the experimental approach in China.
Keywords: Coordination, task, organisation, reform, innovation, China, Russia.
JEL Nos.: D20, D80, H11, H70, L22, P11.
© by the authors. All rights reserved. Short sections of text, not to exceed two paragraphs, may be quoted without explicit permission, provided that full credit, including © notice, is given to the source.
Contact addresses: Professor Yingyi Qian, Department of Economics, University of California, Berkeley, CA 94720-3880, USA. Email: [email protected] Professor Gérard Roland, Department of Economics, University of California, Berkeley, CA 94720-3880, USA. Email: [email protected] Dr Chenggang Xu, Department of Economics, London School of Economics and Political Science, Houghton Street, London WC2A 2AE, UK: Email: [email protected]

“Organizations are systems of coordinated action among individuals and groups.”
James March and Herbert Simon, Organizations, 2nd edition, 1993
1 Introduction
Understanding how economic activities are coordinated inside organizations has always been one of the
most fascinating questions in economics. Since Adam Smith, economists have recognized that the benefit of
organizing large-scale production comes from coordinated specialization. When there is no specialization, all
agents perform the same operations, there is then no need for coordination and no gain from having agents
work together in one organization. Coordination becomes crucial whenever there is specialization. On the
other hand, coordination is also costly, which limits the extent of specialization within organizations (Becker
and Murphy, 1992).
The coordination problem in organizations is less well understood than the incentive problem. For
example, most models of coordination feature costs of coordination in reduced form. Lack of a workable
model of coordination is a reason for our poorer understanding of coordination inside organizations. In this
paper, we introduce a model based on the concept of coordination as matching the attributes of specialized
tasks. This concept is inspired by the notion of “design attributes” first introduced by Milgrom and Roberts
(1990, 1992) in their studies of the organization of firms. Using the concept of design attributes, Milgrom and
Roberts studied alternative forms of communication (e.g., prices or planned attributes) that should be used to
coordinate a given decision. They find that non-price communication is optimal when errors of “fit” are very
costly and the number of alternative possible designs that fit well is large. While Milgrom and Roberts focus
on the form of communication, we make use of this concept to examine how alternative organizational forms
affect communication channels and thus coordination when the need for attribute matching is pervasive.
Task coordination is like assembling complementary parts, such as the assembling of subroutines for a
software package, synchronizing travel plans and accommodating logistics for a conference, reforming an
economy by restructuring enterprises and establishing corresponding social safety nets and legal institutions,
etc. Each complementary part is characterized by its attributes in dimensions such as time, location, technical
specifications, legal and administrative terms, etc. A product or a service is completed successfully only if
the characteristics of each attribute of the various parts are matched. To take a simple example, the diameter
of a screw must match that of a bolt so that they both meet certain standards of material resistance. In
1

an assembly line they must be transported to a given location at a given time. Most products and services
require a much more sophisticated assembling of parts, each part having numerous attributes which are
relevant in this matching process. Failure in the matching of attributes often implies a breakdown. For
example, the engine of a Rolls Royce car cannot fit into the body of a mini-Morris, a software package will
not work unless all the subroutines fit to each other, and a conference will be a disaster if room allocation
conflicts with other academic programs. Note that our concept of coordination differs from the coordination
problem in games with multiple equilibria.
The attribute matching problem is especially pervasive in implementing changes such as innovation and
reform within an organization, because by its nature such a problem cannot be solved by automation. In
these situations, it is not sufficient to match all attributes in blueprints. Blueprints are often imperfect and
incomplete, leaving room for unexpected contingencies. For example, blueprints for reforms do not specify
details of attribute changes, because most of the attribute changes, which are induced by reforms, are not
well understood at the time a blueprint is designed. Attribute mismatches in implementing innovations and
reforms, which we call “attribute shocks,” are thus inevitable. Coordination is then especially important to
respond to those unexpected contingencies.
But the quality of the coordination, i.e. the adjustment of attributes depends itself on the quality of
communication inside an organization. The communication problem arises because only managers directly
and frequently engaging in a particular task have first-hand information and knowledge about that task.
Communication is necessary for others to use such information and knowledge, but communication is likely
to be imperfect because message transmission, due to technical bugs as well as human misunderstanding, can
go wrong. Hayek’s (1945) famous notion of “local information,” the information about particular location
and circumstance, is well suited to our framework — direct involvement in a task gives rise to good knowledge
about that task. The communication problems we consider do not necessarily relate to geographic distance
and are more general. They arise whenever the absence of direct involvement in a task implies poorer
knowledge about it. For convenience, we often refer to a manager as “local manager” and the knowledge he
possesses as “local information.” But the term “local” used here does not necessarily carry a geographical
meaning.
It is important to note that the communication problem is endogenous, depending on how tasks and
decision-making power are assigned within an organization. That is, the organizational form matters. We
define an M-form (multi-divisional form) organization as one that consists of “self-contained units” where
complementary tasks are grouped together. In contrast, a U-form (unitary form) organization is decomposed
2

into “specialized units” where similar tasks are grouped together. Because the M-form and the U-form
organizations assign tasks differently, the communication problems they face are different.
In our model, a simple trade-off emerges between better coordination and less economies of scale in
the M-form compared to the U-form. In the self-contained units of the M-form, local managers can more
easily solve the coordination problem by making good use of local information, but then the advantages
of specialization are not fully appropriated and there is duplication of local coordination. In the U-form
organization, coordination of specialized units is centralized by top managers so that economies of scale are
obtained, but the coordination problem is harder to solve, as the top managers have to rely on imperfect
information about attribute shocks transmitted by local managers. Obviously, the M-form is better than
the U-form in promoting innovation or reform if the quality of communication is low and the value of scale
economies is not high.
A less obvious, but more important, result is that the M-form organization is able to promote innovation
or reform through experimentation, that is, it can experiment an innovation or reform program in some
part of the organization first before implementing it in the entire organization. Experimentation gives an
option value of waiting when the blueprint has uncertain outcomes, which reduces the cost of learning
about the quality of the blueprint. But the fundamental reason why the M-form is capable of carrying out
experimentation is its organizational form: each unit is self contained and coordination is carried out by local
managers. In contrast, in the U-form, the benefits of experimentation cannot be reaped because coordination
is centralized.
Therefore, in addition to the common two alternatives of “no change” and “full scale change,” the M-form
organization has an additional alternative of “change with experimentation.” In this sense, the M-form is a
more flexible organizational form, which can promote more innovation or reform. In contrast, the U-form is
more rigid, and if a change occurs, it happens in a comprehensive way. This rigidity tends to be deleterious
for innovation or reform. The flexibility of the M-form can lead to a higher propensity to innovation or
reform, an important dynamic advantage compared to the U-form.
We use the example of agricultural reforms to illustrate the relevance of our theory in understanding
the reform experiences of China and the Soviet Union in the 1980s as well as Russia in the 1990s. There
is a striking difference between the organization of the Soviet planning administration on one hand, and
that of the Chinese planning administration, on the other hand (Qian and Xu, 1993). The Soviet economy
was organized into many specialized or functional ministries (e.g., Ministry of Cereal and Grain Production,
Ministry of Tractors and Farm Machinery, Ministry of Fertilizer Production, etc.). This corresponds to a
3

U-form organization (also known as “branch organization”). In contrast, the Chinese economy has been
organized mainly on a geographical basis. This corresponds to an M-form organization (also known as
“regional organization”). According to our theory, the Chinese economy with its M-form structure is prone
to reform via regional experimentation. On the other hand, when reform comes in the Soviet U-form
economy, it is comprehensive and coordinated from the center, and thus more difficult to do. While the
contrast between “big-bang” approach in Eastern Europe and Russia and the “experimental” approach in
China has been well recognized in the literature (e.g., McMillan and Naughton, 1992; Dewatripont and
Roland, 1997; Sachs and Woo, 2000), our paper goes one step further to investigate the deeper reasons of
how the pre-reform organizational differences have led different countries to pursue different strategies. It
also accounts for the numerous coordination failures of comprehensive reforms in the Soviet Union.
The notion of M-form and U-form organizations was pioneered by the influential works of Chandler and
Williamson. Chandler (1962, 1977) documented important cases of some large American corporations that
replaced the U-form corporate form by the M-form in the first half of the 20th century. According to Chan-
dler, serious problems arose under the U-form between functional departments, such as production and sales,
when the firm introduced new products or adopted innovations. In the case of Du Pont, before 1921 whenever
a new chemical was developed such as explosives and paints, coordination difficulties resulted in too many
mistakes, which convinced du Pont to reorganize the firm into an M-form with multi-divisions by products.
Similarly, before 1925, Sears, the largest mail-order firm in the U.S., was organized as a U-form corporation
with the headquarters in Chicago and departments responsible for specialized functions nationwide, such as
procurement, sales, and distribution. When Sears expanded into many new territories and became involved
in new businesses, its coordination problems became severe. In 1939 Sears was reorganized into the M-form
with multi-functional and autonomous territorial divisions. Later, Williamson (1975, 1985) theorized that
the overload problem of the headquarters was the main problem with the U-form corporation. He argued
that, with daily operations being decentralized to self-contained divisions, the M-form corporations reduce
the work overload at the headquarters and create time for top managers to engage in strategic planning.
Following Chandler and Williamson, some formal studies on the M-form and the U-form organizations
have been undertaken. Aghion and Tirole (1995) analyzed how M-form and U-form organizations generate
and solve the overload problem. Maskin, Qian, and Xu (2000) provide an analysis of incentive problems
in M-form and U-form organizations. They have demonstrated that different organizational forms give rise
to different information about managers’ performance. They therefore differ according to how incentives
encourage good performance. In order to focus on the coordination problem, our paper assumes away the
4

incentive problem and takes the team theoretical approach.1 Our paper is also related to the management
science literature that distinguishes between product-focused and process-focused corporations analyzed as
the result of minimization of coordination costs in unstable environments (see, for example, Athey and
Schmutzler, 1994).
The rest of the paper is organized as follows. Section 2 introduces the modelling of task coordination
as attribute matching. Section 3 explores the basic thesis on the advantage of the M-form in carrying out
experimentation in a model of 2 regions and 2 functions. Section 4 generalizes the model to n regions and m
functions. Section 5 derives conditions under which the M-form and the U-form are optimal organizational
forms. Section 6 discusses at length an empirical application of the theory to economic reforms in China
and the Soviet Union (and later Russia) in the 1980s and the 1990s. Section 7 concludes by illustrating other
possible applications.
2 Modelling Task Coordination as Attribute Matching
For the ease of exposition we first consider an organization with two regions “A” and “B” and two functions
“1” and “2.” The model allows for other interpretations such as “A” and “B” as two products and “1” and
“2” as two processes. In the subsequent analysis, we will only use the term of region, which corresponds
directly to our China and the Soviet Union example. Later in this paper we will consider the case with
n regions and m functions. In the two by two case, there are a total of four tasks to be coordinated:
1A, 2A, 1B, and 2B, where task ir concerns function i in region r.
We assume an infinite time horizon. In each period, there is a flow of ideas for innovation or reform
that have the potential to improve the output of the organization (without changing the structure of the
organization itself). Suppose that prior to any reform, the existing technology generates payoffs of R2 in
every period in region A and in region B respectively. With the discount factor δ, the net present value of
status quo (i.e., no reform) payoffs for the entire organization is given by R1−δ . One successful reform will
raise the payoff from each region by R2 in every period from the time the reform is introduced. That is, with
a total of i successful reforms in the past in both regions, the net present value of payoffs will be (1+i)R1−δ .
1The team theory literature includes, among others, Marschak and Radner (1972) on the economic theory of teams, Weitzman
(1974) on coordination using price and quantity, Crémer (1980) and Aoki (1986) on the optimal partition of workshops inside
an organization, Bolton and Dewatripont (1994) on the firm as a communication network, Garicano (2000) on the organization
of knowledge in production, in addition to the works of Milgrom and Roberts cited above.
5

The model assumes that only one reform can be carried out in each period, but there is no limit on the total
number of reforms to be carried out, that is, reforms can raise payoffs without bound.
A reform faces two potential problems. The first problem concerns the quality of its “blueprint.” A
blueprint for reform has an uncertain outcome: it turns out to be “good” with probability p and “bad” with
probability 1 − p. We assume that blueprints that are available over time are stochastically independent.
Furthermore, if a blueprint turns out to be good, then it will apply equally well to two regions. A good
blueprint, together with correct coordination in implementation (to be discussed below), raises the payoff
from each region permanently by R2 as described above. But a bad blueprint always reduces the payoff
from each region by R2 in every period from the time the reform is introduced. To ensure that a reform is
worthwhile in expected terms, we require
Assumption 1 p > 12 .
A successful reform not only requires a good blueprint but also good implementation. At the heart of
implementation is what we called “task coordination.” Imagine that all reform programs are so designed
that all attributes are matched perfectly ex ante in the blueprints. However, in implementing a program,
“attribute shocks” occur which are not taken care of in the blueprints. Attributes must then be mutually
adjusted to observed attribute shocks (Milgrom and Roberts, 1990, 1992). Attribute shocks can be more
severe or more frequent if many of the attribute changes are not specified in a blueprint, which is quite likely
with reforms. In our model, “attribute matching” will take place (and only take place) between tasks 1A
and 2A within region A and between tasks 1B and 2B within region B. We call attribute matching during
the reform implementation task coordination. Because there is a flow of reform blueprints arriving over
time, task coordination is an on-going activity.
Although obtaining a blueprint is assumed to be costless, implementing it is not. We assume that task
coordination requires a one time setup cost, which is normalized to C for two managers (and thus C2 for each
manager). This cost can be interpreted as a training cost, that is, to implement a reform blueprint managers
need to be trained on how to match attributes. The following assumption ensures that the payoff increase
from a good blueprint and good implementation is worth the setup cost:
Assumption 2 R(1−δ) > C.
Unlike blueprints, good coordination (i.e., successful attribute matching) in one region cannot be “copied”
to another region, because of the differences in local conditions. For example, the same reform program which
6

reallocates land to household farmers may induce farmers to change to different crops in different regions,
which creates different attribute matching problems. Therefore, if a blueprint tried in one region is found
to be good and coordination is successful, then the same blueprint can be used elsewhere, but separate
coordination is still needed in order to adjust attributes to local conditions before a successful outcome can
be achieved.
In our model, it is possible that the manager who coordinates is not the manager who collects information
about attribute shocks. In such a case, the coordinating manager relies on the message sent by the manager
collecting information. The probability of each message being correct is λ. With λ ≤ 1, information
transmission is generally imperfect. Imperfect information transmission may arise from the fact that two
managers have different idiosyncratic knowledge and different interpretations of the same message. They
may speak different languages; for example, engineering language differs from marketing language. Moreover,
their communication may be restricted to short messages (such as messages carried by phone calls, faxes,
memos, meetings, etc.), which may be subject to ambiguous interpretations. Such noises in information
transmission are assumed to be independent across tasks as well as over time.
We define U-form and M-form organizations as follows. A U-form organization is set up along “functional
lines.” Two middle managers — manager 1 and manager 2 are responsible for collecting information about
attribute shocks, the former for tasks 1A and 1B and the latter for tasks 2A and 2B. Because the two tasks
that need attribute matching are not assigned to the same middle manager, the two middle managers need
to send the information to the top manager, who, after receiving the information from the two managers,
matches attributes between tasks 1A and 2A and between 1B and 2B. This type of organization can be
represented by Figure 1.
An M-form organization is set up along “regional lines.” Middle manager A is responsible for collecting
information about shocks in tasks 1A and 2A, and Middle manager B is responsible for collecting information
about shocks in tasks 1B and 2B. Because the two tasks which require attribute matching are assigned
to the same manager, the middle managers can match attributes locally by themselves. The top manager’s
job is just to provide reform blueprints and to decide the reform strategy. This type of organization can be
represented by Figure 2.
7
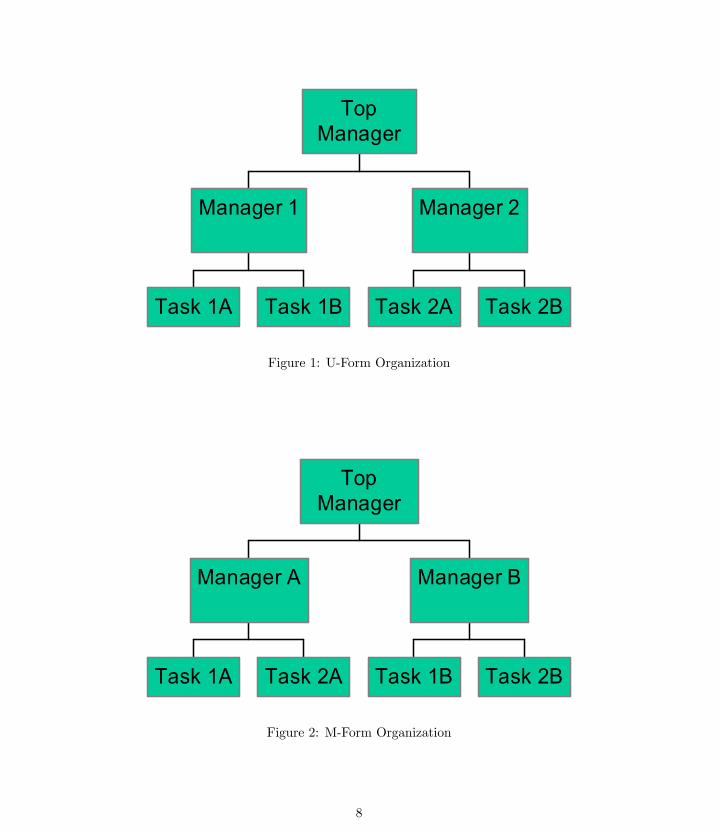
Task 1A Task 1B
Manager 1
Task 2A Task 2B
Manager 2
TopManager
Figure 1: U-Form Organization
Task 1A Task 2A
Manager A
Task 1B Task 2B
Manager B
TopManager
Figure 2: M-Form Organization
8

Example. Coordinating agriculture reform in the centrally planned economy
In this example, we regard the national economy as an organization. Suppose agricultural reform is
aimed at replacing collective farming by household farming. Possible blueprints for such a reform involve
types of contracts, methods of transfer of land, etc. There is blueprint uncertainty, which could be due
to the uncertainty about farmers’ tolerance of risks and their skills. Although the purpose of the reform
is to improve efficiency by providing incentives to household farmers, farmers’ incentives alone may not be
sufficient to make the reform successful because coordination of reform is important. For instance, when
farmers change crops or products, attributes related to physical infrastructure requirements must be matched.
That is, in addition to blueprint quality, a successful agricultural reform also requires successful attribute
matching among complementary reform tasks. What are these tasks? To illustrate our point, we focus
on the following two tasks: harvesting and transport/storage (in Section 6 we give more detailed real life
examples from Chinese and Russian agricultural reforms). So task 1A in our model would be harvesting in
region A and task 2A would be transport/storage in region A.
Although anticipating changes of crops or products, reform blueprint designers do not know what crops
will be changed and how will they be changed ex ante so that attribute matching is left to the implemen-
tation stage. Changing crops, such as changing production from grain to vegetables, fruits, or fishes has
important implications for transport/storage. Grains, vegetables, fruits, and fish are harvested at different
times. They have different physical and biological properties. Some are more sensitive to temperature, or
more fragile mechanically, or have special requirements (e.g. live fish requires water and oxigen in trans-
port/storage); some come out in large quantity in a short period of time; and others have to be delivered very
quickly. Attributes to be matched between harvesting and transport/storage are then in terms of timing,
location, technical specifications of harvesting and transport/storage, quantity harvested and capacities of
transport/storage, etc.
If an economy is organized as a U-form, then the two specialized ministries are responsible for harvesting
and transport/storage respectively, and a central authority such as Gosplan is responsible for matching the
attributes between the two types of tasks. Information on attribute shocks then has to be transmitted
from the two ministries to the central authority. If an economy is organized as an M-form, the two regional
governments are each responsible for matching the attributes between the two types of tasks within their
own region, and information on attribute shocks is only used locally.
9

3 M-form vs. U-form
We start with a comparison of the M-form and the U-form under the following reform strategy: always start
a reform program in both units of the organization in each period. We call this strategy “full scale reform”
or “reform without experimentation.”
Consider first the M-form. Because each unit manager is responsible for attribute matching, perfect
coordination can always be achieved. However, whenever a new reform program is introduced, setup cost
C must be incurred because two managers are involved in coordination.
We define stage i as the stage at which a total of i reform programs have been successfully implemented
before. Therefore, at stage i, the current period status quo (i.e., no reform) payoff for the two regions is
given by (i+ 1)R. Let a new reform program be implemented in each period and let Vi be the net present
value of future payoffs at stage i. Then Vi can be defined recursively as follows (with δ being the discount
factor):
Vi = −C + p[(i+ 2)R+ δVi+1] + (1− p) [iR+ δVi].
Let a = 11−(1−p)δ . We have
Vi = a[−C + p (i+ 2)R+ (1− p) iR+ pδVi+1]
= −aC + 2paR+ aRi+ apδVi+1.
From the above recursive formula, we calculate
Vo = −aC∞Xi=0
(apδ)i+ 2paR
∞Xi=0
(apδ)i+ aR
∞Xi=0
i (apδ)i,
where Vo is finite because
apδ =pδ
1− (1− p) δ< 1
for all δ < 1.
Using formulaeP∞
i=1 ixi = x
(x−1)2 andP∞
i=0 xi = 1
1−x , and the fact thata
1−apδ =11−δ , we obtain
Vo = − aC
1− apδ+
2pRa
1− apδ+
Rpδa2
(1− apδ)2
= − C
1− δ+2pR
1− δ+
Rpδ
(1− δ)2
= − C
1− δ+
pR
1− δ
µ2 +
δ
(1− δ)
10

Therefore, under the M-form, the net present value at stage 0 is
VMFo = − C
1− δ+
pR
1− δ
µ2 +
δ
(1− δ)
¶.
Under the U-form, the top manager is responsible for coordinating the four tasks. He receives four
messages through noisy communication, each corresponding to one of the four tasks. To simplify the analysis,
we assume that all signals for each function are perfectly correlated so that it is sufficient for a manager
to communicate only one signal. When the program is bad, the reform fails, and a new program will
be tried in the next period. If the program is good, there are two possibilities due to the assumption of
perfect correlation of signals: with probability λ2, coordination is successful for both regions A and B; with
probability¡1− λ2
¢, coordination fails, which gives the same outcome as a bad program.
Because only the top manager matches attributes, whenever a reform is introduced, a setup cost C2 is
paid under the U-form instead of C under the M-form. Therefore, we obtain the recursive formula for Vi
under the U-form:
Vi = −C2+ p{λ2[(i+ 2)R+ δVi+1] +
¡1− λ2
¢(iR+ δVi)}+ (1− p) (iR+ δVi) .
It is easy to see that the net present value under the U-form is similar to that under the M-form with C2
replacing C and λ2p replacing p. Thus under U-form, the net present value at stage 0 is
V UFo = − C
2(1− δ)+
pλ2R
1− δ
µ2 +
δ
(1− δ)
¶.
Comparing the M-form and the U-form, we obtain in a straightforward way
Proposition 1 Under full scale reform, The M-form has a higher net present value than the U-form when
the setup cost C is low or the communication quality λ is low, and vice versa.
Proposition 1 formulates the basic tradeoff between coordination and scale economies in implementing
reforms under the M-form and the U-form. The U-form has an advantage in scale economies because the
top manager is responsible for coordination in the entire organization. The organization thus saves on
setup costs but the U-form has disadvantages in coordination because local information is communicated
imperfectly from the local managers to the top manager. In contrast, the M-form has better coordination
because managers can make better use of local information for coordination purposes, but it suffers from
disadvantages in scale economies: it suffers from duplication of the setup costs because two local managers
are responsible for attribute matching instead of one top manager.
11

Next we consider an alternative reform strategy under the M-form: start a reform program in one of the
two units first and extend it to another unit in the next period if it is a success. We call this strategy “reform
with experimentation.” Again let Vi be the net present value of future payoffs at stage i. In stage i, let
a new reform program start in unit A whereas the status quo is maintained in unit B. We call unit A the
experimenting unit. The setup cost in the current period is C/2 because only unit A’s manager coordinates.
There are now two possibilities. If the program is good, the current period payoff is (i+2)R2 in unit A and
(i+1)R2 in unit B. In the next period, the previous successful reform program can be used in unit B after a
setup cost C/2 is paid (because unit B’s manager needs to match attributes according to local conditions)
and unit A will try a new reform program. If the program is bad, the current period payoff is iR2 in the
experimenting unit A and is (i+1)R2 in the non-experimenting unit B. In the next period, a new experiment
in unit A will take place. We thus calculate Vi as follows:
Vi = −C2+ p
½(i+ 2)R
2+(i+ 1)R
2− δ
C
2+ δVi+1
¾+ (1− p)
½iR
2+(i+ 1)R
2+ δVi
¾,
or
Vi = − (1 + pδ)C
2+ p
µ3
2R+ iR+ δVi+1
¶+ (1− p)
µR
2+ iR+ δVi
¶= − (1 + pδ)
C
2+ (i+ 1)R+
R
2(2p− 1) + pδVi+1 + (1− p) δVi
= a
µ− (1 + pδ)
C
2+ (i+ 1)R+
R
2(2p− 1)
¶+ apδVi+1.
From the above recursive formula, we calculate
Vo = a
µ− (1 + pδ)
C
2+
R
2(2p− 1)
¶ ∞Xi=0
(apδ)i+ aR
∞Xi=0
(i+ 1) (apδ)i
=1
1− δ
µ− (1 + pδ)
C
2+
R
2(2p− 1)
¶+
ÃpδR
(1− δ)2+
R
1− δ
!
=− (1 + pδ)C
2(1− δ)+
R
1− δ
µp+
1
2+
pδ
1− δ
¶=− (1 + pδ)C
2(1− δ)+
R
1− δ
µ1
2+
p
1− δ
¶.
Therefore, under M-form with experimentation, the net present value at stage 0 is
VMEo = −(1 + pδ)C
2(1− δ)+
R
1− δ
µ1
2+
p
1− δ
¶.
Proposition 2 The difference in net present value between the M-form with experimentation and the M-form
12

without experimentation is given by
VMEo − VMF
o =1
1− δ
µ(1− pδ)
C
2− (p− 1
2)R
¶.
The relative advantage of the M-form with experimentation over the M-form without experimentation de-
creases with p and increases with C.
The first term (1−pδ)C2(1−δ) indicates the option value of waiting to learn about the quality of the blueprint
before sinking C in the other unit of organization. This option value of waiting increases as p decreases,
i.e. as there is greater uncertainty about the value of the blueprint. Therefore, experimentation can save on
setup costs because of the option value of early reversal of a bad blueprint (Dewatripont and Roland, 1995).
The second term − (p− 12 )R
1−δ (which is negative by Assumption 1) shows the cost of delaying reform in the
other unit under experimentation. This cost decreases as p decreases. Overall, the comparative advantage of
experimentation increases as p decreases. Therefore, there is a trade-off between the option value of waiting
and the cost of delaying reform in the entire organization.
When p = 1,
VMEo − VMF
o =C
2− R
2(1− δ)
which is negative by Assumption 2. Therefore, there is no advantage of doing experimentation if the
blueprints are known to be good.
Under the M-form organization, there are three alternatives: no reform, reform without experimentation,
and reform with experimentation. The reform strategy is preferred to status quo if and only if VMFo > R
1−δor VME
o > R1−δ . Therefore, the overall M-form payoffs are given by
VMo = max
½R
1− δ, VME
o , VMFo
¾= max
½R
1− δ,−(1 + pδ)C
2(1− δ)+
R
1− δ
µ1
2+
p
1− δ
¶,− C
1− δ+
pR
1− δ
µ2 +
δ
(1− δ)
¶¾.
It is easy to calculate that∂
∂pVMFo =
R
1− δ(2 +
δ
1− δ)
and∂
∂pVMEo =
1
1− δ(
R
1− δ− δC
2).
We thus have ∂∂pV
MFo > ∂
∂pVMEo . By Assumption 2, we must also have ∂
∂pVMEo > 0. Therefore we can
define p∗ such that VMFo = VME
o , from which we solve for p∗ = C+RCδ+2R . We also define p
MF such that VMFo
13

10.8750.750.6250.5
250
200
150
100
50
x
y
x
y
Status quo
VoME
VoMF
p
Vo
pME pMF p*
Figure 3: M-form: full scale reform (VMF0 ) vs. experimentation (VME
0 )
= R1−δ and pME such that VME
o = R1−δ , where
R1−δ is the net present value of the status quo (no reform).
With these notations, we have the following:
Proposition 3 Comparing the M-form with and without experimentation:
(1) the M-form with experimentation dominates the M-form without experimentation if and only if p < p∗;
and
(2) the M-form with experimentation dominates the status quo while the M-form without experimentation
does not if and only if p ∈ ¡pME , pMF¢, where pME < pMF < p∗.
Proof Straightforward calculation solves for pME and pMF and gives pME < pMF . Then ∂∂pV
MFo >
∂∂pV
MEo > 0 implies pMF < p∗.
Figure 3 shows an example with C = 40, δ = 0.6, R = 40. With these parameter values, we have pME =
0.45 < pMF = 0.57 < p∗ = 0.77.
A similar experimentation strategy is not feasible under the U-form. Indeed, the U-form organization
does not benefit from experimentation because of the complications involved in coordinating activities. First
14
of all, since the setup costs are bourne at the center and not in the units, they will still have to be incurred
at the center with or without experimentation. Moreover, there is no additional benefit in coordination but
only complications arising.2
Therefore, under a U-form organization, there are only two alternatives: no reform or full scale reform.
The overall U-form payoffs are given by
V Uo = max
½R
1− δ, V UF
o
¾= max
½R
1− δ,− C
2(1− δ)+
pλ2R
1− δ
µ2 +
δ
(1− δ)
¶¾.
Because∂
∂pV UFo =
λ2R
1− δ(2 +
δ
1− δ),
we can define pUF such that V UFo = R
1−δ . We obtain:
Proposition 4 Comparing the U-form with the M-Form:
(1) the U-form is better for carrying out reforms and yields a higher net present value when the quality
of communication λ is high;
(2) the M-form is better for carrying out reforms when the quality of communication λ is low; and the
M-form with experimentation yields a higher net present value than either the U-form or the M-form without
experimentation if in addition the uncertainty of reform blueprint p < p∗.
Proof (1) Consider λ = 1 and p = 12 . We have
V UFo = − C
2(1− δ)+
R
2(1− δ)
µ2 +
δ
(1− δ)
¶> − C
1− δ+
R
2(1− δ)
µ2 +
δ
(1− δ)
¶= VMF
o
2To illustrate this in an easy way, think of changes in computer software where task 1 represents change in the operating
system and task 2 change in a word processor. Experimentation under U-form in this case means, for example, first changing
the operating system (from DOS to windows 95), and then changing the word processor (from WordPerfect 5.1 to WordPerfect
8). In this example, partial innovation involves first matching the attributes of the old word processor with the new operating
system (via a solution like the ”DOS prompt”) and then matching the attributes of the new operating system with the new
word processor. In terms of difficulty of coordination, one gains nothing from this partial innovation and one might just as well
directly introduce both changes.
15

and
V UFo = − C
2(1− δ)+
R
2(1− δ)
µ2 +
δ
(1− δ)
¶> −
¡1 + 1
2δ¢C
2(1− δ)+
R
2(1− δ)
µ1 +
1
1− δ
¶= VME
o .
Because∂
∂pV UFo =
∂
∂pVMFo >
∂
∂pVMEo ,
then for all p > 12 , V
UFo is larger than either VMF
o or VMEo . This also holds for λ large enough.
(2) Note that at p = 0,
VMFo = − C
1− δ
< − C
2(1− δ)= V UF
o
< − C
2(1− δ)+
R
2(1− δ)= VME
o ,
and V UFo , VMF
o and VMEo all have constant slopes in p. As λ falls, the slope of V UF
o becomes smaller than
the slope of VMFo first and then than that of VME
o . As λ falls, pUF > pME , then the M-form promotes
more reform. The proof is completed by using Proposition 3.
When the quality of communication is high, coordination is easy, then the U-form benefits strongly from
its advantage in scale economies. When the quality of communication is low, coordination becomes harder
under the U-form, but is still easy under the M-form. If furthermore the quality of the reform blueprint is
more uncertain, under the M-form, experimentation will be optimal. This shows an important advantage of
the M-form compared to the U-form: the flexibility to experiment. Although the U-form has an advantage
of scale economy to avoid the duplication of setup costs, it does not have the flexibility of carrying out
experiments in only part of the organization. The fundamental reason why the M-form has that flexibility is
precisely its organizational duplication: each region is self contained and coordination is carried out locally
by more than one manager. While economists traditionally tend to emphasize the importance of scale
economies and specialization for efficiency, there is the other side of the coin: the requirements for task
coordination impose a limit to scale economy and specialization.
Figure 4 shows the previous example with C = 40, δ = 0.6, R = 40 again. Notice that the payoffs under
the M-form are independent of λ but the payoffs under the U-form increase with λ. At λ2 = 0.8, the
16

10.8750.750.6250.5
250
200
150
100
50
x
y
x
y
p
Vo
Status quo
VoUF (λ1)
VoUF (λ2)
VoMF
VoME
p1 p2
Figure 4: M-form vs. U-form
M-form under both strategies dominates the U-form. At λ1 = 0.89, the M-form dominates the U-form due
to latter’s flexibility: when p is high, i.e. p > p2 although V UFo > VME
o , the M-form with full scale reform
dominates the U-form (VMFo > V UF
o ); when p is low, i.e. p < p1 although V UFo > VMF
o , the M-form with
experimentation dominates the U-form (VMEo > V UF
o ). When λ is sufficiently close to one, then the U-form
dominates the M-form regardless of latter’s strategies. This point is obvious thus we do not show it in the
figure.
4 Generalization
We now generalize the above model to n regions and m functions. We normalize the setup cost of imple-
menting reforms under the M-form to C and that under the U-form to Cn . The status quo payoff of the
entire organization is R1−δ (or equivalently
Rn(1−δ) in each region).
Consider the M-form first. The organization has n units along regional lines. Within each region, a
middle level manager is responsible for coordinating m tasks within the region and perfect coordination is
17

always achieved. Let α be the fraction of experimenting regions where α ∈ £ 1n , 1¤. In particular, α = 1
means a full scale reform, and 1n ≤ α ≤ n−1
n means a reform with experimentation in a fraction α of regions.
The net present value of payoffs in stage i under the M-form is the following:
Vi = −αC + p {(i+ 1)R+ αR− δ (1− α)C + δVi+1}+ (1− p) {(i+ 1)R− αR+ δVi} .
Recall that a = 11−(1−p)δ . We then obtain the following recursive formula as follows:
VMαo = a[− (α+ pδ (1− α))C + αR (2p− 1)]
∞Xi=0
(apδ)i + aR∞Xi=0
(i+ 1) (apδ)i .
Therefore, the net present value at stage 0 under the M-form with experimentation in a fraction α of regions
is given by
VMαo = −α+ (1− α) pδ
1− δC +
R
1− δ
µα (2p− 1) + 1 + pδ
1− δ
¶.
Note that VMαo is linear in α, and
∂
∂αVMαo = −1− pδ
1− δC +
R
1− δ(2p− 1) .
Therefore, we have the following result, which is parallel to Proposition 3:
Proposition 5 Let p∗ = C+RCδ+2R . Under Assumption 2, p
∗ < 1. Moreover,
(1) If p > p∗, it is optimal for the M-form not to do experiments.
(2) If p < p∗, it is optimal for the M-form to experiment in one region.
Proof : Obvious.
From Proposition 5, the net present values of reform under the M-form with optimal strategies α corre-
sponding p are
VMαo =
− C1−δ +
pR1−δ
³2 + δ
1−δ´, α = 1, p ≥ p∗
− C1−δ (
1+(n−1)pδn ) + R
1−δ³2p+n−1
n + pδ1−δ
´, α = 1
n , p < p∗.
When p > p∗, the optimal α = 1, a change in n has no effect on VMαo . However, when p < p∗, the optimal
α = 1n , and we have
∂VMαo
∂n=
1
(1− δ)n2(R+ C − p (Cδ + 2R)) > 0.
This demonstrates a size advantage of doing experimentation under the M-form. As long as experimentation
is efficient (p < p∗), the more regions an economy has the higher the value of experimentation will be.
18

Under the U-form, the organization has m units along functional lines. Within each unit, a middle level
manager is responsible for collecting information about attribute shocks and sending a message to the top
manager. The top manager receives correct information with probability λm and coordinates m tasks for
all n regions. For the U-form organization, the recursive formula for the net present value of payoffs in stage
i is the following:
V UFo = −C
n+ p{λm[(i+ 2)R+ δVi+1] + (1− λm) (iR+ δVi)}+ (1− p) (iR+ δVi) .
Again, the net present value under the U-form is obtained by replacing C with Cn and p with λmp in
VMFo . Thus, under the U-form, the net present value at stage 0 is
V UFo = − C
n(1− δ)+
pλmR
1− δ
µ2 +
δ
(1− δ)
¶.
From this expression we can see easily that an increase in n will increases V UFo due to the economy of scale
advantage of the U-form, and this result is independent of the value of p and λ. Moreover, with Assumption
1 (i.e., p > 12), we have
∂
∂nV UFo >
∂
∂nVMαo .
This means that when the number of regions increases, the marginal impact from scale economies under the
U-form outweighs the marginal impact of the size advantage of experimentation under the M-form.
Finally, when m increases, the U-form suffers from an disadvantage in coordinating attribute matching:
∂
∂mV UFo = (lnλ)λm
pR
1− δ
µ2 +
δ
(1− δ)
¶< 0.
We summarize the above results in the following proposition.
Proposition 6 (1) The U-form has a larger positive effect from the increase in the number of regions than
the M-form ( ∂∂nV
UFo > ∂
∂nVMαo ≥ 0).
(2) The U-form also has a larger negative effect from the increase in the the number of funcitons than
the M-form ( ∂∂mV UF
o < ∂∂mVMα
o = 0).
In the reform application of the model, it is conceivable that an agricultural reform that involves giving
more decision rights to household farmers may increase the number of functions m, which might give ad-
vantage to the M-form. In the business firm application of the model, some implications of these results
are the following. If the growth of a company involves a major increase in the number of products leaving
19

the number of functions to be coordinated unchanged, then the U-form should have the advantage. On
the other hand, if the growth of business of a company involves an increase of the number of functions to
be coordinated, the M-form will have the advantage. Particularly, when companies are growing at a time
when technologies become more developed, more functions are to be coordinated within the company so m
becomes larger, as compared to the earlier stage of a company when m was small. These results may shed
light on the evolution of organizational forms of companies when businesses grow: companies tend to change
from an U-form at the early stage to an M-form at the later stage.
5 Conditions for the Optimality of M-Form and U-Form
The above discussion focuses on two organizational forms: the M-form and the U-form. In theory, many
other organizational forms are possible. In this section, we provide a set of conditions under which the
M-form and the U-form dominate other organizational forms so that our focus on these two forms can be
justified. We restrict our attention to the case of two regions and two functions only, but the underlying
principle is general.
Figure 5 illustrates possible types of organizational forms in the case of two regions and two functions.
Figures 5(a) and 5(b) are the U-form and the M-form respectively. Figure 5(c) is the flat organizational
form in which all coordination is done by one manager. Figures 5(d) and 5(e) are skewed organizational
forms where one middle management coordinates two or three tasks and the center coordinates the residual
task(s). Figure 5(f) is a symmetric form but represents a different partition of tasks than the M-form or
U-form. Figure 5(g) is a stand alone organizational form without middle managers. Other alternatives not
present in Figure 5 are cases where one manager is responsible for one task only. With more than two regions
and two tasks there are more possibilities but the two by two case serves as a good illustration.
We assume that in the economy there are the following distinct types of knowledge: knowledge on
functions and kowledge on regions related to identifying/describing attribute shocks; and knowledge on
blueprints related to strategic decisions (selection of blueprints). We further assume that each manager can
aquire only one type of knowledge. This is because the capacity of human beings to aquire knowledge is
limited and the character of knowledge is specialized. Formally, we make the following assumption about
the knowledge of a manager:
Assumption K A manager’s knowledge is limited to one of the following:
20

(K1) functions for any given region;
(K2) regions for any given function;
(K3) blueprints.
An example of (K1) is knowledge about functions of harvesting or transporting within a mountain region;
An example of (K2) is knowledge about a mountain region and a river region for the function of transporting.
Moreover, we suppose that as long as information on attribute shocks is known coordinating-task per se does
not rely on knowledge (K1), (K2) and (K3).
We first demonstrate that both the M-form and U-form satisfy Assumption K. Under the M-form, the
top manager engages in strategic decision which requires knowledge (K3). Each of the two middle managers
engages in collecting attribute shock information and coordinates tasks accordingly in his own region. The
information collection and task coordination within a region require knowledge (K1). Therefore, Assumption
K is satisfied. Under the U-form, each of the two middle managers is responsible for one of the two functions
respectively; and each of them collects information on attribute shocks associated with that function in
the two regions requiring knowledge (K2); and transmits the information to the top manager. The top
manager then coordinates, which does not rely on knowledge (K1) or (K2). Moreover, the top manager
takes up strategic decisions requiring knowledge (K3). Again, Assumption K is satisfied. In both of these
organizational forms, the number of managers hired for the entire organization is 3.
Because any organization requires all three types of knowledges to run, Assumption K rules out any
organizational form employing fewer than 3 managers. Organizational forms (c), (d), (e) and (g) all employ
1 or 2 managers and thus violate Assumption K.
Among all organizational forms employing 3 managers the M-form and the U-form organizations are the
only ones that satisfy Assumption K. In the organizational form (f) in Figure 5, one manager is responsible
for tasks 1A and 2B, and the other for tasks 1B and 2A. This would imply that each of them must have
both knowledge (K1) and (K2), a violation of Assumption K.
Therefore, all the organizational forms satisfying Assumption K other than the M-form and the U-form
must hire more than 3 managers. If we assume that hiring additional managers entails additional costs,
then an organizational form that employs more than 3 managers does not have a cost advantage over an
organizational form that employs only 3 managers. When this cost is sufficiently high, it rules out an
organizational form such as for example 4 managers each responsible for collecting information on one region
and one function only and an additional manager for strategic decisions.
21

Figure 5: General Organizational Forms.
22

To conclude, under Assumption K and assuming costly managers, the M-form and the U-form are the
only optimal organizational forms. A more complete analysis of the optimality of different organizational
forms deriving from primitive assumptions is beyond the scope of this paper but is an important avenue for
further research.
6 An Application: Agricultural Reform in China and the Soviet
Union
Organizational forms of government in centrally planned economies can have a substantial impact on reform
strategies and outcomes. The Chinese reform process is often characterized as gradual and experimental
in contrast to that in the Soviet Union and Central and Eastern Europe. Less noticed is the fact that
various reform experiments were introduced in the Soviet Union in the 1980s but failed. Those failures have
discredited the experimental approach which was abandoned during the later transition. Our theory opens
new perspectives on understanding how the differences in organizational forms in the Soviet Union and China
might have affected their coordination capabilities which in turn have led to different reform paths.
Institutional Background of Central Planning in China and the Soviet Union. Before the reform, both
China and the Soviet Union were centrally planned economies. The organization of the Soviet economy was
the classical textbook case of central planning (Gregory and Stuart, 1989; Kornai, 1992). The Gosplan, the
central planning bureau, supervised dozens of ministries, each specializing in one industry. At the same time,
the degree of industrial concentration by region was very high. This organization made central coordination
essential. Indeed, in the late 1970s, the Gosplan was responsible for about 12 million products (Nove, 1983).
This corresponds to a U-form organization.
China started its central planning system in 1953 following the Soviet model. However, in 1958 and 1970,
twice before the current reform, China drastically changed its planning system into one mainly based on
regions, not industries. Most state-owned enterprises were under the supervision of regional governments
of provinces, cities and counties. Typically, the production of each region was diversified and relatively
self-contained (Granick, 1990; Qian and Xu, 1993). With regional governments taking major responsibilities
for coordinating tasks across industries, the central government’s role in coordination was greatly reduced
compared to that in the Soviet Union. In the 1970s, the State Planning Commission at the central government
level was responsible for no more than 1,000 products. This corresponds to an M-form organization.
23

We use agricultural reform in China and the Soviet Union (later Russia) to illustrate how organizational
forms of governments may affect reform strategies and outcomes. We will demonstrate that the success
of China’s agricultural reform is closely related to the roles of regional governments in solving various
coordination problems. In contrast, agricultural reform in the Soviet Union throughout the 1980s and even
that in Russia in the 1990s suffered from major coordination problems, and many of these coordination
failures can be attributed to the U-form structure inherited from the Soviet system.
Agricultural Reform. Agricultural reforms in both countries were aimed at replacing collective farming
by household farming. In terms of our model, there are many possible blueprints for such a reform. A reform
blueprint may include several dimensions: (1) the type and duration of contracts; (2) the method of transfer
of land such as through sale and free distribution; and (3) the form of division of land concerning plot size
and location. A reform blueprint entails uncertainty. For instance, along the dimension of contract type,
the use rights of land may be partly delegated to households for a short time period, or they may be leased
to households for a longer period of time. Alternatively, ownership of land may be transferred to households
altogether. These different types of contracts have different incentive effects on households but also have
different risk-bearing implications. Leasing contracts entail weaker incentives but do not impose big risks on
households. While full ownership transfer gives first best incentives, it also imposes the bigger risks. As the
government is not fully aware of the exact tradeoff between incentives and risk-bearing ability of households
(which in turn depend on other institutions in place), there is uncertainty about the effects of each type of
contract. Blueprint uncertainty thus relates to the uncertainty about farmers’ preferences and to the effects
of existing risk-sharing arrangements.
In addition to a good blueprint, successful reform requires good coordination, which means attribute
matching among complementary tasks. These tasks may involve, for instance, the establishment of physical
infrastructure (water, transport, roads, canals, telecommunication, electricity, storage), informational in-
frastructure (technical support, information about markets), legal infrastructure (securing ownership titles,
methods for conflict resolution), and credit and savings institutions. Below we will detail attribute matching
and coordination (or its failure) in agricultural reform in China and the Soviet Union (and later Russia)
respectively.
Attribute Matching in Agricultural Reform in China. Household farming allows households to choose new
crops or products for profits. Indeed, in China, there have been huge shifts in the composition of agricultural
production since the reform. For example, the total national output of aquatic products increased from 4.6
million tons in 1978 to 41.2 million tons in 1999. Correspondingly, the share of fishery in total agriculture
24

output increased from 1.4% to 10.3%. In the following, we use the specific example of Xinhui county in
Guangdong Province to illustrate how regional governments solve the coordination problems in the fishery
sector.3
When farmers choose to shift from grain production to fish farming, the physical and informational
infrastructure requirements must be adapted. Attribute matching may occur in the following dimensions:
(1) Conditions required for raising fish or fishing may be in conflict with requirements for water transport
and irrigation of grain fields in terms of quality, quantity, location and timing of using water;
(2) Fish species may be region specific; moreover, selections of fish species and grain species are different
in different areas;
(3) Transport and storage means required for harvesting fish differ from those for harvesting grain; and
(4) Disease control is different for fish and plants.
In a developed market economy, some aspects of these coordinations are taken care of by the market,
and some by vertical integration. Government’s role is nevertheless still often desirable, as for example in
infrastructure investment. However, in transition economies, there are a greater number of missing markets
at the beginning of the reform. Under China’s M-form structure, Xinhui County government has had the
responsibility of coordinating activities in agriculture, industry, transportation, commerce, and R&D within
the county. It has successfully made attribute matching in the growing fishery sector during the reform,
which ensured a smooth transition to household farming along all four dimensions listed above:
First, a key factor in the growth of aquatic industry is the increase of the aquatic production area. Total
aquatic production area can be increased by using rivers, ponds, and reservoirs. The coordination role of
local government is important here. Attributes to be matched in order to increase the aquatic production
area include timing, origination/destination/route, quality/quantity of water transmission to match demands
in aquatic production, irrigation and transport. If too much water is diverted from a river into fishing ponds
at a wrong time, the water level of the river may decrease too much, making transport difficult or leaving
too little water for irrigation of rice fields. Water sharing for the purpose of irrigation and aquatic ponds has
been coordinated by the county government. Part of the coordination is done by building new reservoirs to
ensure regular water supply. It would be much more difficult to coordinate transport, irrigation, and aquatic
activities if these were controlled by different specialized ministries separately.
3 Information on Xinhui County is from Annals of Xinhui County (1995, 1997) by Xinhui Xianzhi Editorial Committee. For
a general account of fishery sector reform nationwide, see Xia (1998), which provides examples from many other counties such
as Shunde county in Guangdong province and Rongcheng county in Shandong province.
25

Second, the selection of species best suitable for the county is also important. Some species fit better than
others to a particular region’s weather, water quality, water plants, plankton etc. The county government’s
Aquatic Bureau took the initiative in coordinating technological changes in aquatic production, such as
helping select aquatic species best suitable for the county and giving technical support to aquatic farmers.
For example, in 1979 the Aquatic Bureau helped to coordinate an enlargement of production of fingerling
and fry. By 1985, the area of fish ponds for growing fingerling and fry increased by 65.8% compared with
1976; and the output of fingerling and fry increased by 130% over the same time period.
Third, the supply of fish feed and cold storage for harvested fish are other important factors that affect
aquatic production. There are important attribute matching problems involved in fish feed supply (and
similarly in cold storage services). When a new species of fish is introduced or whenever there is substantial
change in weather conditions, requirements for fish feed (or for storage) must be adjusted accordingly, which
in turn requires adjustments in raw materials used by fish feed plants. When markets were not yet well
developed to take care of these problems, the county government played again an important coordination
role. In 1979 the county government built a cold storage plant — the Xinhui County Yamen Cold Storage
Plant, which has provided ice, cold storage and processing (e.g. quick frozen) for aquatic industry in the
county. In 1983 and 1984, jointly with some township governments the county government built two fish
feed plants (Tangxia Fish Feed Plant and Hetang State-Township Joint Fish Feed Plant).
Fourth, disease control, in particular prevention of contagious fish diseases, is another critical factor and
often requires an emergency response. Diseases may indeed spread via different waterways at a consider-
able speed. Disease control requires coordination between aquatic production, supply of drugs/disinfectants,
transport, and irrigation, R&D for the region and solutions specific to the local fish species. Controlling
aquatic diseases is an emergency matter, requiring quick actions to specify drugs/disinfectants and the cor-
responding methods of using them, so time is of overriding importance. This is similar to dispatching an
ambulance to meet particular requests in a medical emergency (Milgrom and Roberts, 1992). In this situa-
tion, markets may not be able to coordinate in time. The capacity of county government in coordinating all
affected sectors is then critical for implementing disease control measures. In Xinhui, the Disease Prevention
and Vaccination Department under the County Aquatic Bureau has played such a coordination role, taking
into account various ecological problems. The Department provided fish immunization services and other
medicines for fishes, for example, in 1985 it provided vaccination for 4.3 million Buffalo fish which increased
substantially the survival rate of these fish.
As a result of the coordination role of local government, Xinhui aquatic production increased rapidly
26

since the reform. Total aquatic production in Xinhui in 1985 increased by 2.3 times over that of 1978. The
success of Chinese local governments like Xinhui illustrates the strong capacity of the M-form structure in
coordinating attribute matching. The local government has a good knowledge of local conditions and can
respond efficiently given its authority in making attribute matching at the local level.
Attribute Matching in Agricultural Reform in the Soviet Union. Under the Soviet system, farming
was subordinated to many specialized ministries. In the 1980s, tasks related to agro-food industry were
divided between 11 ministries: (1) Agriculture; (2) Trade; (3) Cereal and Grain Production; (4) Fruit and
Vegetable Farming; (5) Machine Building for Animal Husbandry and Feed Production; (6) Tractors and Farm
Machinery; (7) Land Reclamation and Water Resources; (8) Meat and Dairy Industry; (9) Food Industry;
(10) Rural Construction; and (11) Fertilizer Production (Wegren, 1998, p. 62). Tractors were provided
centrally by the so-called MTS stations. The tasks of providing inputs to the farmers, of managing their
operations, storage, processing, transport, road infrastructure were all allocated to separate agencies over
which collective farms had no control. Warehouses and processing plants were more likely to be located
hundreds of kilometers away from farms (van Atta, 1993a). Within this organizational structure, any change
in grain production had to involve at least seven ministries: Ministries of Agriculture, Trade, Cereal and
Grain Production, Tractors and Farm Machinery, Food Industry, Rural Construction, and Fertilizer. Any
farm (private or collective) that changed crops from grain to vegetable production would have had to deal
with these ministries plus other two ministries: Land Reclamation and Water Resources, and Fruit and
Vegetable Farming. Regional governments did not have the authority to solve the coordination problems.
In March 1989, the Central Committee of the Soviet Communist Party decided under Gorbachev’s im-
pulsion to launch a reform in agriculture whereby farmers could lease land with long term contracts up to 50
years. This may seem similar to the Chinese agricultural reform. However, this reform in the Soviet Union
was carried out under the U-form organization of the economy. Leasing provides incentives to the farmers,
but coordination continued to be done by various ministries in Moscow. Serious coordination problems
arose not just at the production stage, but also at the distribution stage. In fact, by the end of the 1980s
there was a consensus among experts of Soviet agriculture that the biggest problem in agriculture was at
the distribution stage, not the production stage, precisely because of the coordination problems (Wädekin,
1992).
The distribution stage involves activities of harvesting, transportation, storage, and processing. The
production unit harvests the output and stores it into temporary storage. The spoilable nature of output
makes the length and condition of storage particularly critical. The transport unit then moves the output
27

from temporary storage to permanent storage or to processing facilities directly. The permanent storage
unit must be able to store the output for a longer time with great care, otherwise grain will rot. Attributes
related to distribution are harvest time, harvest location, harvest quantity, weather, temporary storage
capacity, transport vehicle capability, etc.
Attribute matching may occur in the following dimensions, and the failure of any one of them would have
severe consequences:
(1) Between production units and transport or permanent storage: given transport capacity and urgency
priorities, sufficient transport facilities must be dispatched to the most urgent production units at the right
time and to right location, otherwise harvested output will rot;
(2) Between permanent storage units and processing units: failure to transport inventories to processing
units in the right order can still cause rotting even in the permanent storage unit.
In the Soviet Union, the activities of harvesting, storage, transport, process were under the supervision of
separate ministries and their interactions were coordinated at the center. Therefore farmers were dependent
on different ministries and there continued to be substantial waste at the storage, transport and processing
stages. With the failures in coordination between production units, transport and storage, in Russia for
example, about a quarter of total grain products (an average of 49 million tons of grain in 1986-1990) was
wasted in temporary storage and in permanent storage; 30-40% of potatoes were lost to rot in storage
places. It was reported that of the 40% loss in potatoes and vegetables, 1/3 was lost directly in transport
and storage, 20% due to coordination failure, such as waiting for transport etc., which in turn resulted from
coordination problems in other sectors, such as the lack of gas or oil, or spare parts (Wädekin, 1992). This
clearly illustrates the lower coordination capability of the U-form and accords with our theoretical model.
Attribute Matching in Agricultural Reform in Russia. After the collapse of the Soviet Union, central
planning was abandoned and reformers pushed for radical plans for private farming. However, the problems
inherited from the U-form structure continued to cause trouble for reforms aimed at establishing household
farms. Even though the ministries associated with central planning were abolished, implementation of reform
still required coordination between physical, informational, and legal infrastructures, land transfer schemes,
and credit and savings solutions. These coordination problems needed to be solved in the context of private
farming. Private ownership of land would not have many effects if farmers did not have access to storage
facilities or without a good road system to be able to transport their harvest. Private farmers also needed
access to water, electricity and telephone service. They needed scientific and technical advice on what to
grow and how. They also needed access to market infrastructure, which includes access to credit to purchase
28

inputs but also competitive upstream and downstream markets for the purchase of inputs and the sale of
their output. All the attributes of farming still needed to be matched but the attributes of reform such as the
provision of credit and access to market infrastructure also needed to be matched. The role of government
in putting together these complementary attributes for private farming was important as there were no
preexisting markets and government efforts were necessary to encourage the development of markets for
land, for credit, for inputs, outputs and farming equipment.
Several ministries were therefore involved in coordination of agricultural reform, including ministries
of (1) Agriculture; (2) Ownership Relations; (3) Industry, Science and Technology; (4) Communications;
(5) Transport; (6) Commerce and Economic Development; (7) Antitrust and Support of Entrepreneurship.
Even within the Ministry of Agriculture, 18 different departments were involved among which are Animal
Husbandry, Plant Growing, Water Supply, Food Processing, Chemical Supplies and Plant Protection, In-
teractions between Regions, and Ownership Relations. Given the U-form organization and geographically
dispersed production infrastructures, major coordination failures occurred under Yeltsin’s reform plans.
First, the U-form structure made it difficult to coordinate land privatization with the provision of adequate
infrastructure such as roads, electricity, etc.. The lack of infrastructure may causes more serious problems
for private farmers than for collective farms. This is because collective farms operate on a much larger scale
and have less diverse production. A survey in Kostroma oblast done in mid-1991 by Wegren, one of the
best known experts of Russian agriculture, found that only 15% of private farms were located less than one
kilometer away from a telephone, 47% between 2 kilometers and 6 kilometers and 29% were located more
than 7 kilometers from a phone. By January 1995, over a half of private farms had no running water, 20%
had no electricity, 40% had no normal access roads and only 10% had animal sheds (Wegren, p. 172). All
experts of Russian agriculture have pointed to the overall deficient infrastructure as a major cause of the
failure of reforms. Storage capacity inherited from the Soviet system has remained inadequate, the poor road
system has not only not been overhauled but has strongly declined in the 1990s due to strong contraction of
infrastructure investment (Wegren, p. 128). Infrastructure investment should actually have increased given
the previous imbalances if private farming was to be encouraged. These failures in physical infrastructure
were such that “in some regions, the cost of shipping agricultural commodities between regions exceeds the
producer prices” (Liefert-Swinnen, p.13).
Second, there was a failure to provide private farmers with basic public services since providing these
involved the responsibility of different ministries. In general, the Russian privatization program did not
provide private farmers alternative access to dwellings, schools, and all other public services such as medical
29

care, day care, that were typically provided by the collective farm system. If a peasant became a private
farmer, he would lose access to all those services.
Third, the reform program failed to provide a system of market information (where to buy and sell and
at what price) and more simply to provide competitive markets both for farming inputs and for farm output.
In the absence of competitive input and output markets, private farmers face monopolies when purchasing
inputs and monopsonies when selling their output. This substantially reduces the profit opportunities for
private farmers who face high input prices and low output prices.
Fourth, private farmers faced very poor legal protections, such as in issues related to property rights, in
enforcement of contracts, etc.. The spoilable nature of agricultural output makes it particularly prone to
holdup by organized crime and corrupt officials.
Overall, experts on Russian reform agree that coordination failures were quite massive.4 These massive
coordination problems are one of the reasons that farmers were not very enthusiastic to engage in private
farming. Without proper solutions to the coordination problems and the requisite attribute matching be-
tween land, labor, physical and market infrastructure, Russian private farmers would have to work under
very primitive conditions. Wegren cites an article about how coordination problems hamper privatization in
agriculture in Moscow oblast: once becoming private farmers “they immediately encountered massive prob-
lems — no machinery, nowhere to obtain gas, nowhere to sell produce, and so on. People saw this and did not
want to follow their example.” A survey by the World Bank in 1994 showed that 92% of collectively-owned
4 It would be wrong to state that there were coordination failures at all levels of agricultural reform. There were for example
some successes with credit to private farmers. Special efforts were indeed made between 1992 and 1994 to provide preferential
credit to private farmers (at a subsidized interest rate of 25% as opposed to 170% for collective farms). The reason for the
need for preferential credit was actually related to the failure to create competitive markets upstream and downstream for
farmers who faced therefore increasing upstream prices and decreasing downstream prices, the famous ”scissor’s problem”.
This effort to provide preferential credit was however discontinued in 1994 due to the high cost for the federal budget. On
the positive side, one can also cite the experiment of farm privatization in Nizhni Novgorod with the help of the International
Finance Corporation. ”It was introduced in conditions common to past Soviet economic experiments: special resources were
made available for the experimental farms, advantages that were not available to non participants in the model. Nizhni farm
privatization occurred as a result of significant Western and state intervention in order to create favorable conditions and the
IFC spent millions of dollars in an effort to help several farms in Nizhegorodskaya oblast privatize (Wegren, p. 103)”. Obviously,
given the scarcity of resources and of coordination capacity, it was impossible to generalize the results of such an experiment.
This ironically reminds of the fate of previous experiments under Russian planning under the U-form organization such as the
failure of the Stakhanovite movement in the 1930s. The positive experiment of Nizhni Novgorod however also highlights the
importance of coordination in reform.
30
or state-owned farm employees did not want to become private farmers (Brooks et al. 1994). A 1994 world
bank sponsored survey in agriculture found that in two thirds of state farms, only less than 10 people (3
families) left (Wegren, 1998, p. 83). Wehrheim et al. (2000) argue that underdeveloped institutions and
infrastructure are the main problem explaining the dismal results of reform of Russian agriculture. The evi-
dence tends to show that despite radical market and incentive reforms, the coordination problems of Russian
farming and in particular the post-harvest waste have been increasing in the nineties. (Laird, 1997).
Obviously, coordination problems are not the only reason for the dismal results in private farming reform
in Russia. One can argue that the destruction of private farming in the thirties under Stalin killed the farming
spirit in Russia and that this cultural change in the countryside can explain the lack of taste of Russian
farmers for risk-taking. This is quite possible but does not contradict our analysis. Maybe the blueprint
of agricultural reform was inadequate and another blueprint imposing less risks on farmers such as leasing
arrangements should have been more emphasized. However, even in that case, similar coordination problems
would have been encountered which would in all likelihood have strongly hampered such an alternative
reform blueprint.
The contrast between Chinese and Russian agricultural reform is quite stark and illustrates the effect of
organizational forms on the coordination of reform. The Chinese M-form with local government coordinating
the various complementary aspects of agricultural reform allowed for flexible and swift coordination as local
governments had good local knowledge and had authority over all aspects of reform. In contrast, the U-form
of government that the Russian government inherited from the Soviet period did not do better in solving
coordination problems in agricultural reform than it did at coordinating agricultural production under central
planning.
7 Concluding Remarks
In this paper we introduced a method of modelling task coordination inside an organization as attribute
matching. Using this method, we developed a theoretical analysis of organizational forms in order to under-
stand the performance features of the M-form and U-form organizations. Although we used the economic
reforms in China and the Soviet Union (and Russia) in the 1980s and 1990s as the empirical illustration, our
theory has other applications as well. In addition to the application to the U-form and M-form corporations
described in the introduction, we mention here briefly its relevance to organizational forms of government.
Two organizational forms of government have received much attention: the unitary state and the federal
31

state. France and Japan, among others, have a unitary state, and their governments are mainly organized
along functional lines where specialized ministries concentrate most powers, leaving regional governments
with relatively little authority. This corresponds to the U-form organization in our framework. In contrast,
the organizational form of the U.S. government is a primary example of federalism, where the fifty states have
the constitutional rights and responsibilities for coordinating government activities inside their jurisdictions.
This corresponds to the M-form organization.
One of the main predictions of our theory is about experimentation in the M-form organization. It has
been perceived for a long time that the American federal system has facilitated experimenting innovative
policies. It was argued in 1888 that “federalism enables people to try experiments which could not safely be
tried in a large centralized country” (Bryce, 1901). A few decades later, the American Supreme Court Justice,
Louis Brandeis, had a famous characterization of American federalism as the “laboratory of the states.” By
laboratories, he meant that the states could experiment with new solutions to social and economic problems.
Those that worked could be applied nationally; those that failed could be discarded. He said in 1932, it is
one of the happy incidents of the federal system that a single courageous state may “serve as a laboratory;
and try novel societal and economic experiments without risk to the rest of the country” (Osborne, 1988).
Indeed, many changes of government policies in the U.S. were initiated by some states, such as New York,
Massachusetts, and California. And these experiments were later imitated by other states or by the federal
government.
One example concerns state government’s policy experiments prior to the New Deal policy of the federal
government in the 1930s. Facing the challenges and risks associated with the rapid industrialization of the
American economy in the early 20th century, a few states initiated innovative policies such as unemployment
compensation schemes, massive public education programs, and schemes related to deposit insurance and
social security. Most of those programs were complementary to each other and state government coordination
was critical to the implementation. Later, many of the successful ones were institutionalized at the federal
level. In fact, a large number of Roosevelt’s New Deal policies were inspired or precisely copied from those
successful state level experiments. Roosevelt acknowledged that “practically all the things we’ve done [in
the New Deal] in the federal government are like things Al Smith did as Governor of New York.” (Osborne,
1988).
Another example involves state government’s policy experiments to deal with the challenges associated
with the replacement of the traditional industries by high tech businesses in the last two decades of the 20th
century. Starting the late 1970s, a sequence of new policies such as reform of public education systems,
32

creating public venture capital funds, setting up programs to match local academia and business to advance
technological innovation began as “experiments” in the states of Massachusetts and California. With the
help of the federal government, successful policies were learned by the Midwest and later spread out to the
rest of the country. For instance, subsidized community college was rare before the mid-1970s. However,
following the successful models of Massachusetts and California it has become a standard public education
institution in most states.
Finally, we would like to indicate one avenue for further research, that is, the change of the organizational
form itself. In the paper, we have treated the organizational forms as given and compared their static and
dynamic properties. But we have not formally analyzed the ”life cycle” of organizations such as the gradual
shift from the U-form to the M-form in business organizations documented by Chandler. Although the
comparative statics results from Section 4 may partly shed light on this issue by showing that an increase
in the number of functions and complexity of products may give an advantage to the M-form despite the
economies of scale of the U-form, more work is needed to understand the dynamics of organizational change.
In our view, the overload problem emphasized by Williamson may be highly complementary to the task
coordination problem analysed here; thus a more complete model should incorporate both of these aspects.
Such organizational dynamics becomes even more complex in government organizations as compared to
business organizations since political economy issues play a role on top of efficiency. Thus, for example, the
reasons for why the Soviet Union did not manage to change from the U-form to the M-form organization
are in part due to politics. In fact, such a change actually occurred under Khrushchev in the late 1950s and
early 1960s but the latter was deposed and the U-form organization was reinstated afterwards. Therefore,
understanding the reasons for change (or its absence) of organizational forms of government will have to
incorporate political economy considerations.
33

References
[1] Aghion, Philippe and Jean Tirole. “Some Implications of Growth for Organizational Form and Owner-
ship Structure.” European Economic Review, April 1995, 39(3-4), pp. 440-55.
[2] Aoki, Masahiko. “Horizontal vs. Vertical Information Structure of the Firm.” American Economic Re-
view. December 1986, pp. 971-83.
[3] Athey, Susan, and Armin Schmutzler. “Product and Process Flexibility in an Innovative Environment.”
RAND Journal of Economics, 1995, 26(4), pp. 557-74.
[4] Becker, Gary, and Kevin Murphy. “The Division of Labor, Coordination Costs, and Knowledge.” Quar-
terly Journal of Economics, November 1992, 107(4), pp. 1137-1160.
[5] Bolton, Patrick, and Mathias Dewatripont. “Firms as Communication Network.” Quarterly Journal of
Economics, November 1994, 109(4), pp. 809-839.
[6] Brooks, Karen, Elmira Krylatykh, Zvi Lerman, Aleksandr Petrikov and Vasilii Uzun. “Arigultural
Reform in Russia: A view from the Farm Level” World Bank Discussion Paper Number 327, 1996.
[7] Bryce, James. The American Commonwealth, London: Macmillan (first published in 1888), 1901.
[8] Butterfield, John. “Devolution in Decision-Making and Organizational Change in Soviet Agriculture,”
in W. Moskoff (ed.), Perestroika in the Countryside. Sharpe, 1990, pp. 19-46.
[9] Chandler, Alfred Jr. Strategy and Structure. New York: Doubleday & Company, Inc., 1962.
[10] Chandler, Alfred Jr. The Visible Hand: The Managerial Revolution in American Business. Cambridge:
Belknap Press of Harvard University Press, 1977.
[11] Crémer, Jacques. “A Partial Theory of the Optimal Organization of Bureaucracy.” Bell Journal of
Economics, 1980, 11, pp. 683-693.
[12] Dewatripont, Mathias, and Gérard Roland. “The Design of Reform Packages under Uncertainty.” Amer-
ican Economic Review, December 1995, 85(5), pp. 1207-23.
[13] Garicano, Luis. “Hierarchies and the Organization of Knowledge in Production.” Journal of Political
Economy, 2000, 108(5), pp. 874-904.
34

[14] Granick, David. Chinese State Enterprises: A Regional Property Rights Analysis. Chicago: Chicago
University Press, 1990.
[15] Gregory, Paul, and Robert Stuart. Comparative Economic Systems, third edition. Boston: Houghton
Mifflin, 1989.
[16] Hayek, Friedrich. “The Use of Knowledge in Society.” American Economic Review, September 1945,
35(4), pp. 519-30.
[17] Kornai, Janos. The Socialist System. Princeton University Press and Oxford University Press, 1992.
[18] Laird, Roy. “Kolkhozy, the Russian Achilles Heel: Failed Agrarian Reform.” Europe-Asia Studies, May
1997, 49(3), pp. 469-478.
[19] Liefert, William and Johan Swinnen. “Changes in Agricultural Markets in Transition Economies”,
United States Department of Agriculture, Agricultural Economic Report Number 806, 2002.
[20] March, James, and Herbert Simon. Organizations, 2nd edition, 1993.
[21] Marschak, Jacob, and Roy Radner. Economic Theory of Teams. Yale University Press, 1972.
[22] Maskin, Eric, Yingyi Qian, and Chenggang Xu. “Incentives, Information, and Organizational Form.”
Review of Economic Studies, April 2000, 67(2), pp. 359-78.
[23] McMillan, John, and Barry Naughton. “How to Reform a Planned Economy: Lessons from China.”
Oxford Review of Economic Policy, 8(1). Spring 1992, pp. 130-43.
[24] Milgrom, Paul, and John Roberts. “The Economics of Modern Manufacturing: Products, Technology
and Organization.” American Economic Review, June 1990, 80(3), pp. 511-28.
[25] Milgrom, Paul, and John Roberts. Economics, Organization, and Management. Prentice Hall, 1992.
[26] Nove, Alec. The Soviet Economic System, second edition. Boston: Allen & Unwin. 1980.
[27] National Statistical Bureau. Statistical Yearbook of China, Beijing: China Statistical Publishing House,
various years.
[28] Osborne, David. Laboratories of Democracy. Boston: Harvard Business School Press, 1988.
35

[29] Qian, Yingyi, and Chenggang Xu. “Why China’s Economic Reform Differ: The M-form Hierarchy and
Entry/Expansion of the Non-state Sector.” Economics of Transition, June 1993, 1(2), pp. 135-170.
[30] Sachs, Jeffrey, and Wing T. Woo. “Understanding China’s Economic Performance.” Journal of Policy
Reform, 2000, 4(1), pp. 1-50.
[31] Van Atta, Don. “Russian Agriculture between Plan and Market,” in van Atta (ed.), The Farmer Threat,
Westview Press, Boulder Colorado, 1993a, pp. 9-24.
[32] Van Atta, Don. “The Return of Individual Farming in Russia,” in van Atta (ed.), The Farmer Threat,
Westview Press, Boulder Colorado, 1993b, pp. 71-95.
[33] Wädekin, Karl-Eugen. “Verlustminderung als zentrale Aufgabe der Nahrungswirtschaft in Russland und
der GUS (SNG). Osteuropa, November 1992, pp. 938-950.
[34] Wegren, Stephen. Agriculture and the State in Soviet and Post-Soviet Russia, University of Pittsburgh
Press, Pittsburgh 1998.
[35] Weitzman, Martin. “Price vs. Quantities.” Review of Economic Studies, 1974, 41(4), pp. 477-491.
[36] Williamson, Oliver. Markets and Hierarchies, New York: Free Press, 1975.
[37] Williamson, Oliver. The Economic Institutions of Capitalism, New York: Free Press, 1985.
[38] Xia, Ying. “Integrated Management in Chinese Fishery: Some Models,” in Xigang Zhu et al. (ed.),
Annual Report on Economic and Technological Development in Agriculture, Beijing: China Agriculture
Press, 1988.
[39] Xinhui Xianzhi Editorial Committee, Xinhui Xianzhi (Annals of Xinhui County:
http://www.xinhuinet.gov.cn/Xhsz/sz/xhsz.htm), 1995.
[40] Xinhui Xianzhi Editorial Committee, Xinhui Xianzhi Xubian (Annals of Xinhui County — Continuation:
http://www.xinhuinet.gov.cn/Xhsz/szxp/SZXP.htm), 1997.
36


![from one to another of various tasks. I - RVUSA.com3 v Capable of or adapted for turning easily from one to another of various tasks. versatile [ver sa tile] I Combining or coordinating](https://img.pdfslide.us/doc/110x75/611cbe552580095b1343aa66/from-one-to-another-of-various-tasks-i-rvusacom-3-v-capable-of-or-adapted-for.jpg)