Embed Size (px)
Citation preview
- 1 -
- when you need to be sure...
Conductivity
Theory and Practice
- 2 -
Preface
The importance of conductivity
Conductivity measurement is an extremely widespread and usefulmethod, especially for quality control purposes.
Surveillance of feedwater purity, control of drinking water and processwater quality, estimation of the total number of ions in a solution or directmeasurement of components in process solutions can all be performedusing conductivity measurements.
The high reliability, sensitivity and relatively low cost of conductivityinstrumentation makes it a potential primary parameter of any good mon-itoring program. Some applications are measured in units of resistivity,the inverse of conductivity. Other applications require the measurementof total dissolved solids (TDS), which is related to conductivity by a fac-tor dependent upon the level and type of ions present.
Conductivity measurements cover a wide range of solution conductivityfrom pure water at less than 1x10⁻⁷ S/cm to values of greater than1 S/cm for concentrated solutions.
In general, the measurement of conductivity is a rapid and inexpensiveway of determining the ionic strength of a solution. However, it is a non-specific technique, unable to distinguish between different types of ions,giving instead a reading that is proportional to the combined effect of allthe ions present.
This booklet
The subject of this booklet is the measurement of conductivity, i.e. theability of an aqueous solution to carry an electrical current. Reliable andaccurate measurements depend on a number of factors: the concentra-tion and mobility of ions, presence of organic alcohols and sugars, va-lence of ions, temperature, etc.
The scope of this booklet is to discuss the theoretical aspects ofconductivity, the factors that influence the reliability of the measurement,and the techniques. Sections covering the applications, rules for reliablemeasurements and frequently asked questions have been included tomake this a comprehensive review of the importance of conductivitymeasurements.
- 3 -
Contents
Theory of conductivity ..................................................... 5What is conductivity? .............................................................................. 5
How is conductivity measured? ............................................................. 5
What is a conductive solution? .............................................................. 6
Definition of terms ............................................................................. 7The conductivity meter ......................................................................... 10
Conductivity cells ........................................................... 11
2-pole cell ....................................................................................... 113-pole cell ............................................................................................. 11
4-pole cell ............................................................................................. 12
Platinised cells ..................................................................................... 13
Flow-through cell .................................................................................. 13
Select the right conductivity cell ..................................................... 142-pole or 4-pole cell? ........................................................................... 14
Conductivity cells and measuring range ............................................. 15
What influences the measurement? ............................. 16Polarisation ........................................................................................... 16
Contamination of electrode surfaces ................................................... 18
Geometry related errors - field effects .................................................. 18
Frequency change ............................................................................... 18
Cable resistance .................................................................................. 19
Cable capacitance ............................................................................... 19
Measuring conductivity ................................................. 20
Determination of the cell constant ................................................... 20
Conductivity measurements ............................................................ 21Low conductivity measurements (pure water) ..................................... 21
High conductivity measurements ......................................................... 22
Temperature effect .......................................................................... 22Linear temperature correction ............................................................. 23
Non-linear temperature correction ....................................................... 24
- 4 -
Measurement techniques ................................................................ 25Contacting conductivity ........................................................................ 25
Toroidal "Inductive" conductivity .......................................................... 25
Rules for reliable measurements ..................................................... 26
Recommendations for maintenance and storage ............................. 28
Applications of conductivity measurements ............... 29
Conductivity measurements ............................................................ 29
Resistivity measurements ............................................................... 29
TDS measurements ........................................................................ 30What is TDS and how is it measured? ................................................. 30
Determination of the TDS Factor .......................................................... 30
Calculating the sample TDS ................................................................ 31
Concentration measurements .......................................................... 32Determination of the concentration coefficients .................................. 33
Determination of the sample concentration ......................................... 34
Limitations of the concentration method .............................................. 34
Salinity measurements ................................................................... 36Determination of the sample salinity .................................................... 36
Build the system to suit your needs ............................. 37
Pure water conductivity measurements ........................................... 40Dedicated USP offer ............................................................................ 40
Dedicated EP offer ............................................................................... 40
FAQs ................................................................................ 41
Conductivity tables ........................................................ 44
- 5 -
Theory of conductivity
What is conductivity?
Conductivity is the ability of a solution, a metal or a gas - in brief allmaterials - to pass an electric current. In solutions the current is carriedby cations and anions whereas in metals it is carried by electrons.
How well a solution conducts electricity depends on a number of factors:
• Concentration
• Mobility of ions
• Valence of ions
• Temperature
All substances possess some degree of conductivity. In aqueous solu-tions the level of ionic strength varies from the low conductivity of ultrapure water to the high conductivity of concentrated chemical samples.
How is conductivity measured?
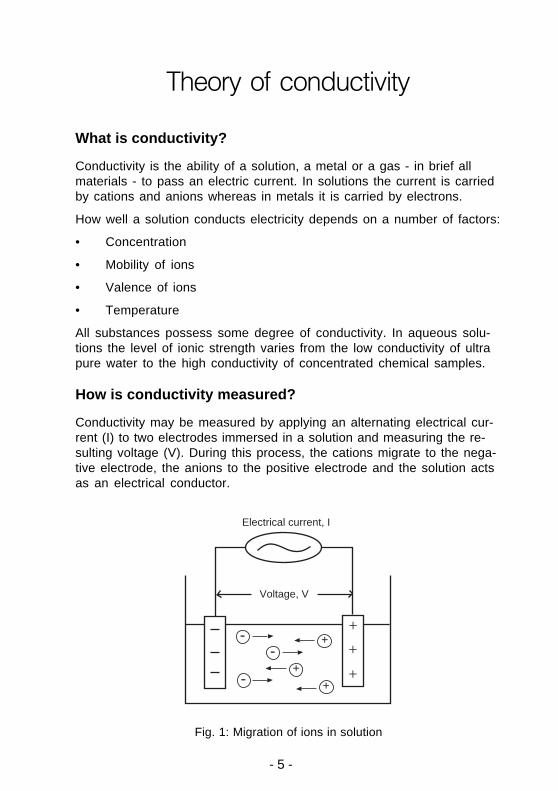
Conductivity may be measured by applying an alternating electrical cur-rent (I) to two electrodes immersed in a solution and measuring the re-sulting voltage (V). During this process, the cations migrate to the nega-tive electrode, the anions to the positive electrode and the solution actsas an electrical conductor.
+
+
+
Electrical current, I
--
-
+
++
Voltage, V
Fig. 1: Migration of ions in solution
- 6 -
What is a conductive solution?
Conductivity is typically measured in aqueous solutions of electrolytes.Electrolytes are substances containing ions, i.e. solutions of ionic saltsor of compounds that ionise in solution. The ions formed in solution areresponsible for carrying the electric current. Electrolytes include acids,bases and salts and can be either strong or weak. Most conductivesolutions measured are aqueous solutions, as water has the capabilityof stabilising the ions formed by a process called solvation.
Strong electrolytes
Strong electrolytes are substances that are fully ionised in solution. As aresult, the concentration of ions in solution is proportional to the concen-tration of the electrolyte added. They include ionic solids and strongacids, for example HCl.
Solutions of strong electrolytes conduct electricity because the positiveand negative ions can migrate largely independently under the influenceof an electric field.
Weak electrolytes
Weak electrolytes are substances that are not fully ionised in solution.For example, acetic acid partially dissociates into acetate ions andhydrogen ions, so that an acetic acid solution contains both moleculesand ions. A solution of a weak electrolyte can conduct electricity, butusually not as well as a strong electrolyte because there are fewer ionsto carry the charge from one electrode to the other.
- 7 -
Definition of terms
Resistance
The resistance of the solution (R) can be calculated using Ohm’s law(V = R x I).
R = V/I
where:
V = voltage (volts)
I = current (amperes)
R = resistance of the solution (ohms)
Conductance
Conductance (G) is defined as the reciprocal of the electrical resistance(R) of a solution between two electrodes.
G = 1/R (S)
The conductivity meter in fact measures the conductance, and displaysthe reading converted into conductivity.
Cell constant
This is the ratio of the distance (d) between the electrodes to the area(a) of the electrodes.
K = d/a
K = cell constant (cm-1)a = effective area of the electrodes (cm2)d = distance between the electrodes (cm)
Conductivity
Electricity is the flow of electrons. This indicates that ions in solution willconduct electricity. Conductivity is the ability of a solution to pass cur-rent. The conductivity reading of a sample will change with temperature.
κ = G • Kκ = conductivity (S/cm)G = conductance (S), where G = 1/R
K = cell constant (cm-1)
- 8 -
Resistivity
This is the reciprocal of the conductivity value and is measured inohm•cm. It is generally limited to the measurement of ultrapure water,the conductivity of which is very low.
Calibration
Determination of the cell constant required to convert conductance read-ings into conductivity results.
Standard solution
A solution of known conductivity that is used to calibrate theconductivity measuring chain.
Reference temperature
Conductivity readings are often referenced to a specific temperature,typically 20°C or 25°C, for comparative purposes.
Automatic temperature correction
Algorithms for automatic conversion of sample conductivity to a refer-ence temperature.
Cable correction
The cable correction takes into account the cable resistance and thecable capacitance.
Gm = measured conductance (siemens)
Gs = solution conductance (siemens)
Rc = cable resistance (Ω)
• Cable resistance
A cable has a given length, therefore a given resistance. It induceserror on the result when the resistance of the solution is low, i.e. athigh conductivity.
The cable resistance only influences measurements with 2 or 3-pole cells. For the 4-pole cells the cable resistance has no influ-ence, so if during programming of the conductivity meter a value isdemanded, enter zero.
Gs
1 + (Rc • Gs)Gm =
- 9 -
• Cable capacitance
A cable of a given length has a given capacity. The cable capaci-tance influences low conductance measurements (below4 µS). Entering a value of cable capacitance in the conductivitymeter allows this influence to be corrected.
Note: a cable capacitance below 350 pF will have no influence onmeasurements performed using Radiometer Analytical conductivitymeters.
Total Dissolved Solids (TDS)
This is the measure of the total concentration of ionic species of a sam-ple. Its magnitude is relative to the standard solution used to calibratethe meter.
TDS factor
Conductivity readings are converted to TDS readings by multiplicationwith a known mathematical factor. The factor depends on the referencematerial used to prepare the standard.
Salinity
Salinity is a measurement without unit corresponding to the weight ofdissolved salts in seawater.
- 10 -
The conductivity meter
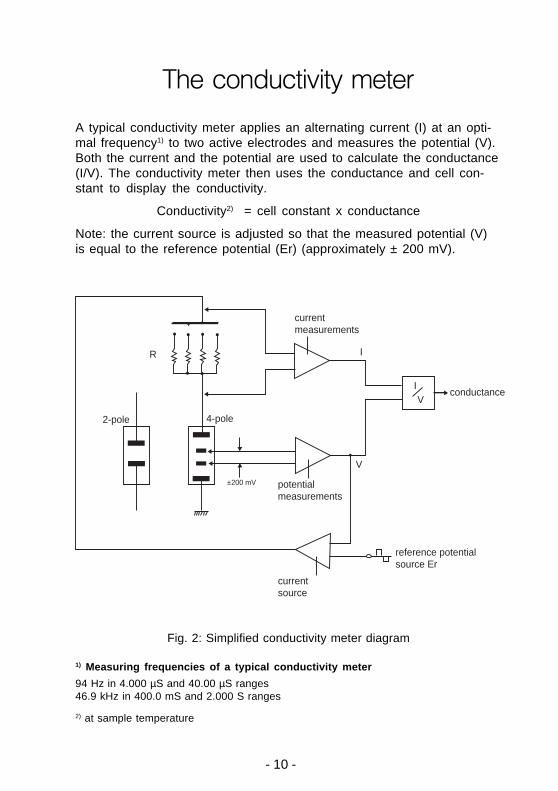
A typical conductivity meter applies an alternating current (I) at an opti-mal frequency1) to two active electrodes and measures the potential (V).Both the current and the potential are used to calculate the conductance(I/V). The conductivity meter then uses the conductance and cell con-stant to display the conductivity.
Conductivity2) = cell constant x conductance
Note: the current source is adjusted so that the measured potential (V)is equal to the reference potential (Er) (approximately ± 200 mV).
2-pole 4-pole
IV
conductance
potential measurements
current measurements
currentsource
reference potentialsource Er
V
R
±200 mV
I
Fig. 2: Simplified conductivity meter diagram
1) Measuring frequencies of a typical conductivity meter
94 Hz in 4.000 µS and 40.00 µS ranges46.9 kHz in 400.0 mS and 2.000 S ranges
2) at sample temperature
- 11 -
Conductivity cells
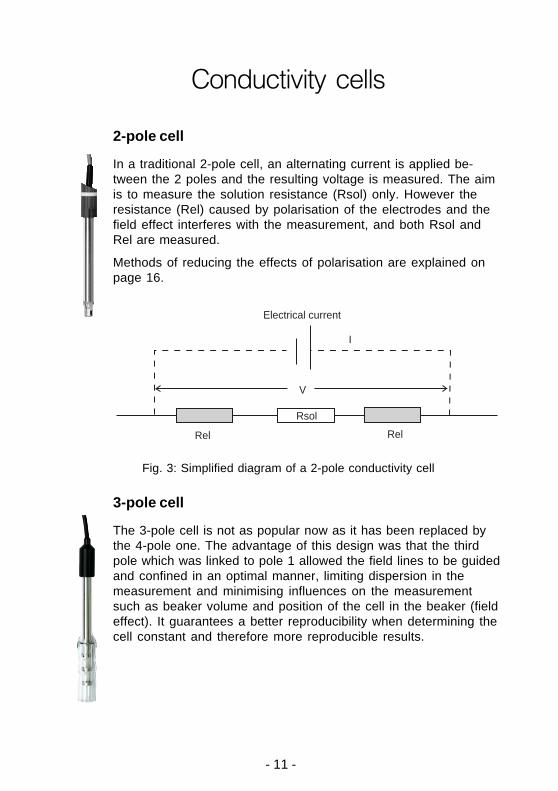
2-pole cell
In a traditional 2-pole cell, an alternating current is applied be-tween the 2 poles and the resulting voltage is measured. The aimis to measure the solution resistance (Rsol) only. However theresistance (Rel) caused by polarisation of the electrodes and thefield effect interferes with the measurement, and both Rsol andRel are measured.
Methods of reducing the effects of polarisation are explained onpage 16.
Rel Rel
Electrical current
V
Rsol
I
Fig. 3: Simplified diagram of a 2-pole conductivity cell
3-pole cell
The 3-pole cell is not as popular now as it has been replaced bythe 4-pole one. The advantage of this design was that the thirdpole which was linked to pole 1 allowed the field lines to be guidedand confined in an optimal manner, limiting dispersion in themeasurement and minimising influences on the measurementsuch as beaker volume and position of the cell in the beaker (fieldeffect). It guarantees a better reproducibility when determining thecell constant and therefore more reproducible results.
- 12 -
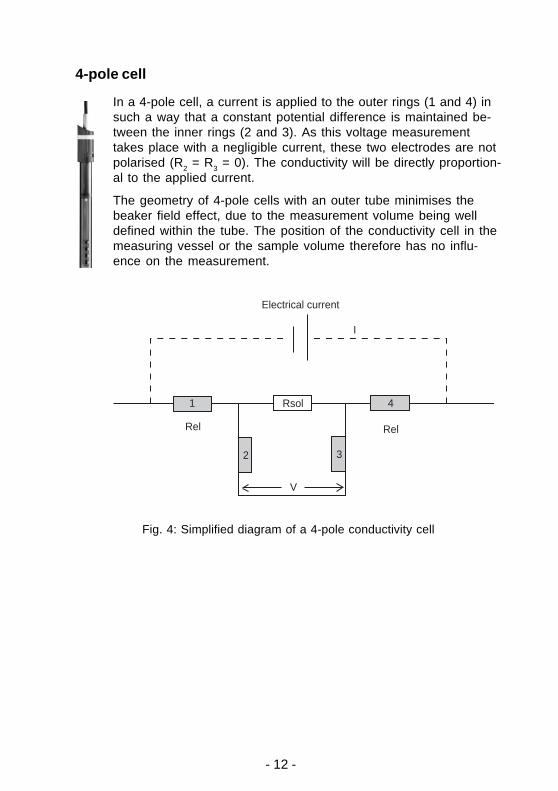
4-pole cell
In a 4-pole cell, a current is applied to the outer rings (1 and 4) insuch a way that a constant potential difference is maintained be-tween the inner rings (2 and 3). As this voltage measurementtakes place with a negligible current, these two electrodes are notpolarised (R2 = R3 = 0). The conductivity will be directly proportion-al to the applied current.
The geometry of 4-pole cells with an outer tube minimises thebeaker field effect, due to the measurement volume being welldefined within the tube. The position of the conductivity cell in themeasuring vessel or the sample volume therefore has no influ-ence on the measurement.
Rel Rel
V
1
2
Rsol
3
4
Electrical current
I
Fig. 4: Simplified diagram of a 4-pole conductivity cell
- 13 -
Platinised cells
Covering the cell poles (plates or rings) with a layer of platinum black isanother way to minimise polarisation effects and avoid error on themeasurement. The surface of the pole is increased, the current densityis decreased, therefore the polarisation effect is less.
Consequently, the cell constant is linear over 2-3 decades towards thehigher conductivity range.
The platinum black must not be damaged or scratched, as this will modi-fy the surface of the poles and therefore the cell constant.
However, one minor disadvantage of platinised cells is that the cell con-stant tends to drift faster than the constant of non-platinised cells.
It is advisable to use platinised cells only in non-viscous samples, with-out suspensions and to perform frequent calibrations.
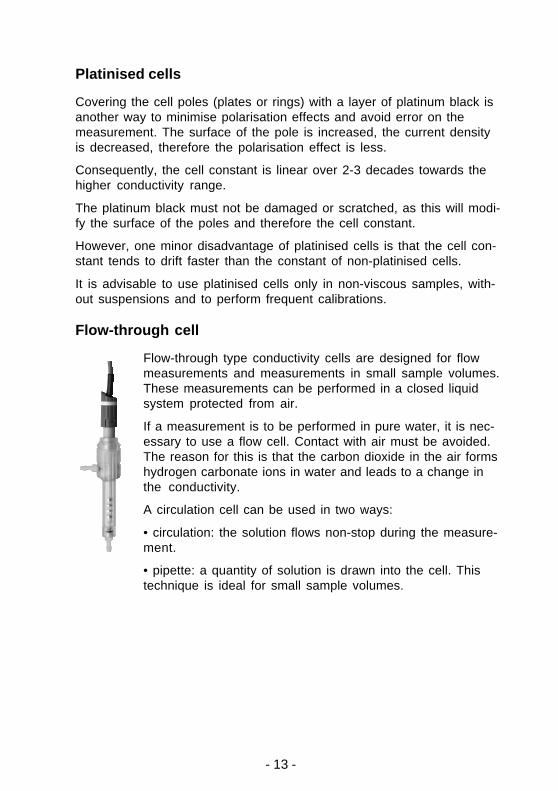
Flow-through cell
Flow-through type conductivity cells are designed for flowmeasurements and measurements in small sample volumes.These measurements can be performed in a closed liquidsystem protected from air.
If a measurement is to be performed in pure water, it is nec-essary to use a flow cell. Contact with air must be avoided.The reason for this is that the carbon dioxide in the air formshydrogen carbonate ions in water and leads to a change inthe conductivity.
A circulation cell can be used in two ways:
• circulation: the solution flows non-stop during the measure-ment.
• pipette: a quantity of solution is drawn into the cell. Thistechnique is ideal for small sample volumes.
- 14 -
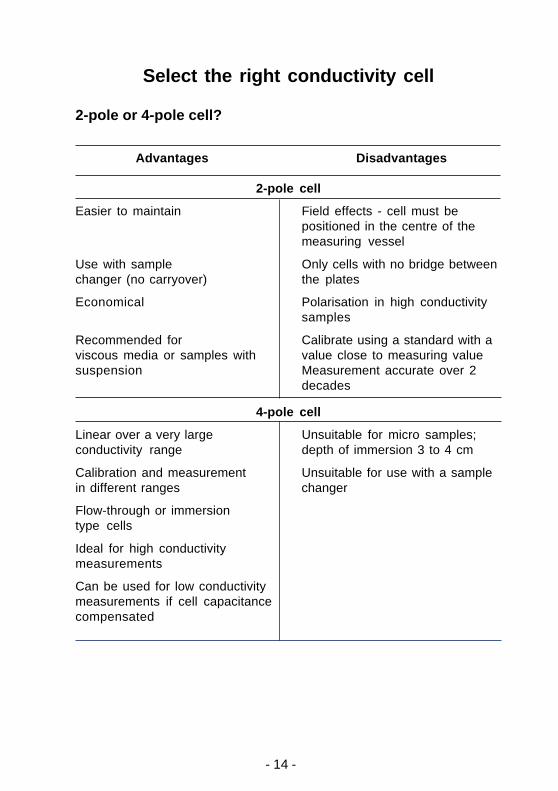
Select the right conductivity cell
2-pole or 4-pole cell?
Advantages Disadvantages
2-pole cell
Easier to maintain Field effects - cell must bepositioned in the centre of themeasuring vessel
Use with sample Only cells with no bridge betweenchanger (no carryover) the plates
Economical Polarisation in high conductivitysamples
Recommended for Calibrate using a standard with aviscous media or samples with value close to measuring valuesuspension Measurement accurate over 2
decades
4-pole cell
Linear over a very large Unsuitable for micro samples;conductivity range depth of immersion 3 to 4 cm
Calibration and measurement Unsuitable for use with a samplein different ranges changer
Flow-through or immersiontype cells
Ideal for high conductivitymeasurements
Can be used for low conductivitymeasurements if cell capacitancecompensated
- 15 -
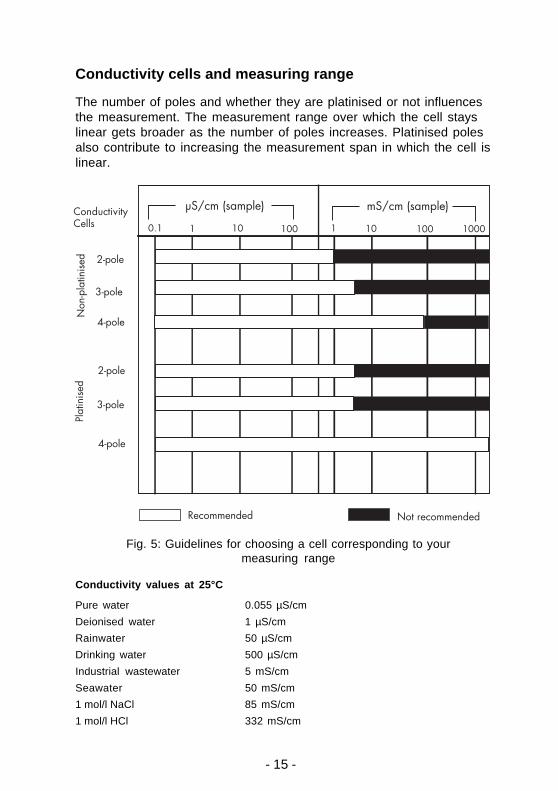
Conductivity cells and measuring range
The number of poles and whether they are platinised or not influencesthe measurement. The measurement range over which the cell stayslinear gets broader as the number of poles increases. Platinised polesalso contribute to increasing the measurement span in which the cell islinear.
Conductivity Cells 0.1
Recommended
2-pole
3-pole
4-pole
Non
-pla
tinis
ed
2-pole
3-pole
4-pole
Plat
inis
ed
1 10 100
µS/cm (sample)
1 10 100 1000
mS/cm (sample)
Not recommended
Conductivity values at 25°C
Pure water 0.055 µS/cm
Deionised water 1 µS/cm
Rainwater 50 µS/cm
Drinking water 500 µS/cm
Industrial wastewater 5 mS/cm
Seawater 50 mS/cm
1 mol/l NaCl 85 mS/cm
1 mol/l HCl 332 mS/cm
Fig. 5: Guidelines for choosing a cell corresponding to yourmeasuring range
- 16 -
What influences the measurement?
The accuracy of conductivity measurements can be influenced by thefollowing factors:
• Polarisation
• Contamination
• Geometry
• Cable resistance
• Cable capacitance
• Frequency change
• Temperature
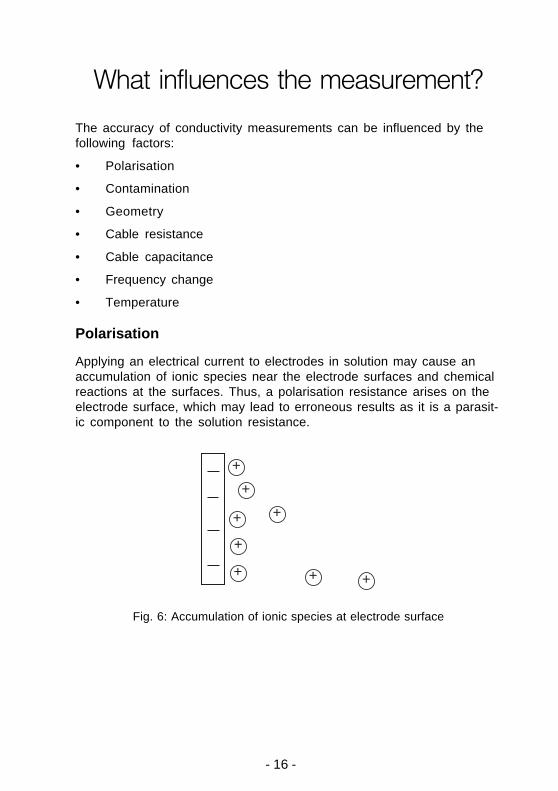
Polarisation
Applying an electrical current to electrodes in solution may cause anaccumulation of ionic species near the electrode surfaces and chemicalreactions at the surfaces. Thus, a polarisation resistance arises on theelectrode surface, which may lead to erroneous results as it is a parasit-ic component to the solution resistance.
+
+
+
+
+
+
+ +
Fig. 6: Accumulation of ionic species at electrode surface
- 17 -
Preventing polarisation
Polarisation effects can be reduced or prevented by:
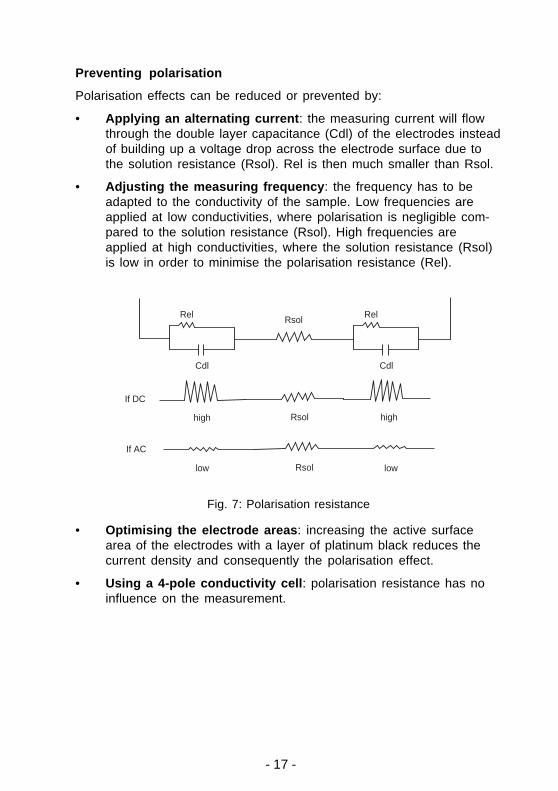
• Applying an alternating current: the measuring current will flowthrough the double layer capacitance (Cdl) of the electrodes insteadof building up a voltage drop across the electrode surface due tothe solution resistance (Rsol). Rel is then much smaller than Rsol.
• Adjusting the measuring frequency: the frequency has to beadapted to the conductivity of the sample. Low frequencies areapplied at low conductivities, where polarisation is negligible com-pared to the solution resistance (Rsol). High frequencies areapplied at high conductivities, where the solution resistance (Rsol)is low in order to minimise the polarisation resistance (Rel).
Rel
Cdl
Rel
Cdl
Rsol
If DC
high Rsol high
If AC
low Rsol low
Fig. 7: Polarisation resistance
• Optimising the electrode areas: increasing the active surfacearea of the electrodes with a layer of platinum black reduces thecurrent density and consequently the polarisation effect.
• Using a 4-pole conductivity cell: polarisation resistance has noinfluence on the measurement.
- 18 -
Contamination of electrode surfaces
Deposits on the electrode surface of a 2-pole cell have a similar effect topolarisation errors, i.e. the conductivity reading is lower than usual.These effects can also be prevented with a 4-pole conductivity cell.
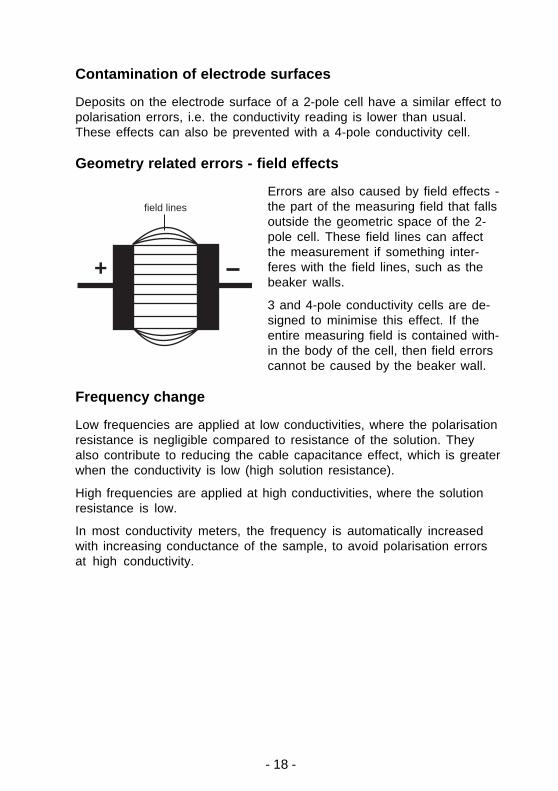
Geometry related errors - field effects
Errors are also caused by field effects -the part of the measuring field that fallsoutside the geometric space of the 2-pole cell. These field lines can affectthe measurement if something inter-feres with the field lines, such as thebeaker walls.
3 and 4-pole conductivity cells are de-signed to minimise this effect. If theentire measuring field is contained with-in the body of the cell, then field errorscannot be caused by the beaker wall.
Frequency change
Low frequencies are applied at low conductivities, where the polarisationresistance is negligible compared to resistance of the solution. Theyalso contribute to reducing the cable capacitance effect, which is greaterwhen the conductivity is low (high solution resistance).
High frequencies are applied at high conductivities, where the solutionresistance is low.
In most conductivity meters, the frequency is automatically increasedwith increasing conductance of the sample, to avoid polarisation errorsat high conductivity.
+
field lines
- 19 -
Cable resistance
A cable has a given length, therefore a given resistance. The cableresistance induces error on the result and must be taken into account.
Compensate the cable resistance when:
• solution resistance is low (below 50 Ω), i.e. for high conductivitymeasurements,
• performing measurements using 2 or 3-pole cells,
The cable resistance of a cell is normally specified by the manufacturer.
Note: for 4-pole cells the cable resistance has no influence if during pro-gramming of the conductivity meter, a value is demanded, enter zero.
Cable capacitance
A shielded cable of a given length has a given capacity. When themeasured conductance is low (below 4 µS), the cable capacitance is notnegligible and must be taken into account.
Compensate the cable capacitance when:
• using a 4-pole cell,
• measuring low conductivities,
• the cable capacitance of the conductivity cell is greater than350 pF,
The cable capacity is normally specified by the manufacturer.
- 20 -
Measuring conductivity
Determination of the cell constant
Calibration is important because the result is the correct value of thecell constant in your working conditions.
The cell constant is a factor that is used to convert the measuredconductance to conductivity (see "Definition of terms").
Conductivity* (S•cm-1) = cell constant (cm-1) x conductance (S)
It is determined by the geometry of the cell, but in practical terms canonly be measured using a standard of known conductivity, for exampleKCl 0.01 D solution.
The cell constant changes with time. Some modifications can occur dueto contamination or due to physical-chemical modification in case ofplatinised cells. It is therefore recommended to calibrate the cell at leastonce a week. However, if you use a platinised cell, it is advisable toperform a daily conductivity measurement in a standard. If the resultobtained is in accordance with the theoretical value, continue yourmeasurements. If not, your cell needs to be cleaned (if non-platinised)or replatinised (if platinised).
For high-precision measurements, it is necessary to determine the cellconstant by performing a calibration measurement on a standard ther-mostated at the desired temperature.
Note: for 2-pole cells, the standard used for the calibration must have aconductivity value as close as possible to the conductivity of the sam-ple to measure.
When using a 2-pole cell, the choice of the cell constant value varieswith the linear measurement range of the cell selected. Typically, a cellwith K = 0.1 cm-1 is chosen for pure water measurements while, for envi-ronmental water and industrial solutions a cell with K of 0.4 to 1 cm-1 isused. Cells with up to K = 10 cm-1 are best for very high conductivitysamples.
In the case of a 4-pole cell, the cell constant value is generally includedin the range 0.5 to 1.5 cm-1.
- 21 -
Conductivity measurements
Conductivity measurements can only be performed after calibration, asthe cell constant value is used to calculate the conductivity.
Low conductivity measurements (pure water)
One of the main applications of low conductivity measurements ischecking the quality of pure water. Pharmaceutical laboratories areobliged to respect regulations laid down by national pharmacopoeias, forexample the 5th supplement of the United States Pharmacopoeia (USP)lays down rules for checking the quality of pure water or fully deionisedwater used for the production of injection products.
Principle of pure water measurements
According to USP
The conductivity partly depends on the pH, the temperature and theamount of atmospheric carbon dioxide, which has been dissolved in thewater to form ions (intrinsic conductivity). The conductivity also dependson the chloride, sodium and ammonium ions considered as water impuri-ties (extraneous conductivity). The conductivity (intrinsic and extrane-ous) of the water is measured and compared to values listed in a tableto evaluate if the studied water is suitable or not for use in pharmaceuti-cal applications. If the sample fails Stage 1, additional tests have to beperformed (Stages 2 and 3) in order to determine if the excessive con-ductivity value is due to intrinsic factors or extraneous ions. The mainrequirement is that the cell constant be known with an uncertainty betterthan ±2%.
According to the European Pharmacopoeia
The cell consists of two parallel platinum plates at a defined distance. Itis confined within a glass jacket with two pipe connectors enablingmeasurement in flow mode. This cell is calibrated using a conductivitystandard of 26.6 µS/cm at 20°C, which is traceable to NIST1). All meas-urements are made with a precision conductivity meter using AC currentat a low frequency.
1) NIST = National Institute of Standards and Technology
Refer to page 36 for details of Radiometer Analytical's dedicated USP and EP offers.
- 22 -
High conductivity measurements
High conductivity measurements are performed when samples are watersolutions, highly concentrated in dissociated species, i.e. salts, acidsand bases. The conductivity method is used to control the concentrationof pure or mixed solutions. For example, the conductivity method is pre-ferred to pH measurements in production plants of concentrated acids orbases.
Temperature effect
Conductivity measurements are temperature dependent, if the tempera-ture increases, conductivity increases. For example the conductivitymeasured in a 0.01 D KCl solution at 20°C is 1.273 mS/cm whereas, at25°C, it is 1.409 mS/cm.
The concept of reference temperature was introduced to allow the com-parison of conductivity results obtained at different temperature. Thereference temperature is usually 20°C or 25°C. The conductivity metermeasures the actual conductivity and temperature and then converts itto the reference temperature using a temperature correction function anddisplays the conductivity at the reference temperature.
It is mandatory to always associate the temperature together with a con-ductivity result. If no temperature correction is applied, the conductivityis the value taken at measurement temperature.
For temperature correction different options can be selected:
• Linear function
• Non-linear function for natural waters according to ISO/DIN7888.
• No correction
To perform correct conductivity measurements, it is recommended touse a temperature sensor or a conductivity cell with built-in temperaturesensor.
For high accuracy measurement, it is necessary to thermostat samples,so that the same temperature is used for the calibration and measure-ment.
- 23 -
Linear temperature correction
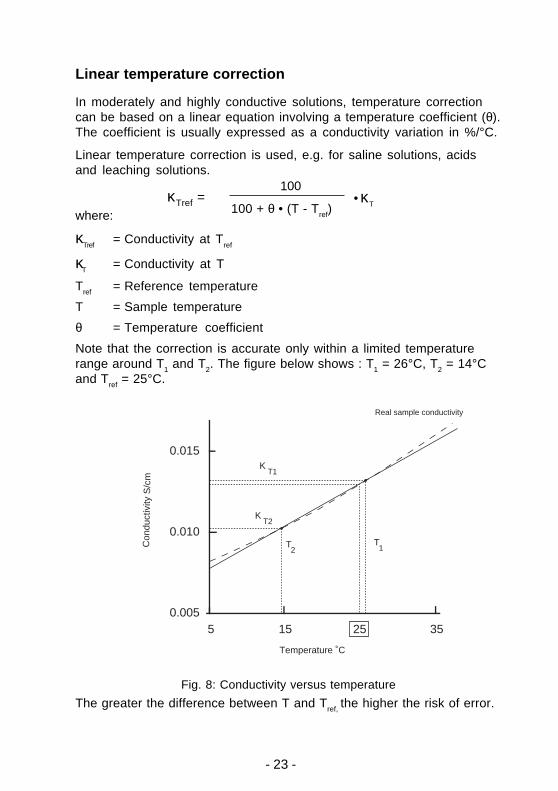
In moderately and highly conductive solutions, temperature correctioncan be based on a linear equation involving a temperature coefficient (θ).The coefficient is usually expressed as a conductivity variation in %/°C.
Linear temperature correction is used, e.g. for saline solutions, acidsand leaching solutions.
where:
κTref
= Conductivity at Tref
κT = Conductivity at T
Tref = Reference temperature
T = Sample temperature
θ = Temperature coefficient
Note that the correction is accurate only within a limited temperaturerange around T1 and T2. The figure below shows : T1 = 26°C, T2 = 14°Cand Tref = 25°C.
Fig. 8: Conductivity versus temperature
The greater the difference between T and Tref, the higher the risk of error.
κTref =100
100 + θ • (T - Tref)• κT
0.005
0.010
0.015
Con
duct
ivity
S/c
m
Temperature ˚C
5 15 25 35
Real sample conductivity
T2
T1
ΚT1
ΚT2
- 24 -
Determination of the temperature coefficient (θθθθθ)
By measuring the conductivity of a sample at temperature T1
close to Tref
and another temperature T2, you can calculate the tempera-
ture coefficient by using the following equation:
T2 should be selected as a typical sample temperature andshould be approximately 10°C different from T1.
The temperature coefficients of the following electrolytes generally fallinto the ranges shown below:
Acids: 1.0 - 1.6%/°C
Bases: 1.8 - 2.2%/°C
Salts: 2.2 - 3.0%/°C
Drinking water: 2.0%/°C
Ultrapure water: 5.2%/°C
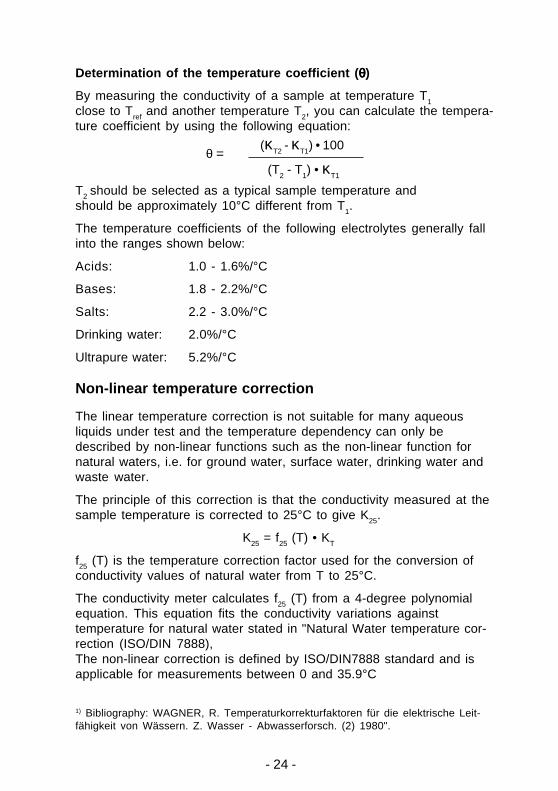
Non-linear temperature correction
The linear temperature correction is not suitable for many aqueousliquids under test and the temperature dependency can only bedescribed by non-linear functions such as the non-linear function fornatural waters, i.e. for ground water, surface water, drinking water andwaste water.
The principle of this correction is that the conductivity measured at thesample temperature is corrected to 25°C to give K25.
K25 = f25 (T) • KT
f25 (T) is the temperature correction factor used for the conversion ofconductivity values of natural water from T to 25°C.
The conductivity meter calculates f25 (T) from a 4-degree polynomialequation. This equation fits the conductivity variations againsttemperature for natural water stated in "Natural Water temperature cor-rection (ISO/DIN 7888),The non-linear correction is defined by ISO/DIN7888 standard and isapplicable for measurements between 0 and 35.9°C
θ =(κ
T2 - κ
T1) • 100
(T2 - T
1) • κ
T1
1) Bibliography: WAGNER, R. Temperaturkorrekturfaktoren für die elektrische Leit-fähigkeit von Wässern. Z. Wasser - Abwasserforsch. (2) 1980".
- 25 -
Measurement techniques
Contacting conductivity
Contacting conductivity uses a cell with two metal or graphite electrodesin contact with the electrolyte solution. An AC current is applied to theelectrodes by the conductivity meter, and the resulting AC voltage.
This technique can measure down to pure water conductivity. Its maindrawback is that the cell is susceptible to coating and corrosion, whichdrastically decreases the reading. In strongly conductive solutions therecan also be polarisation effects, which result in non-linearity of measure-ments.
Toroidal "Inductive" conductivity
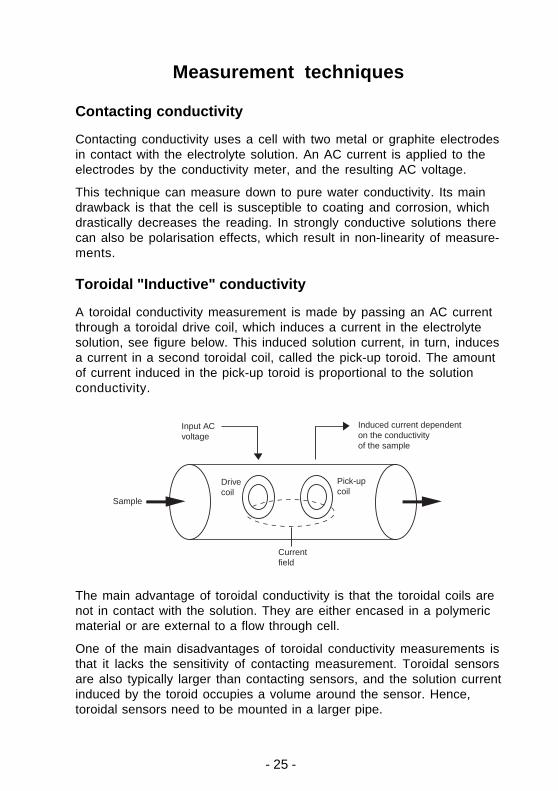
A toroidal conductivity measurement is made by passing an AC currentthrough a toroidal drive coil, which induces a current in the electrolytesolution, see figure below. This induced solution current, in turn, inducesa current in a second toroidal coil, called the pick-up toroid. The amountof current induced in the pick-up toroid is proportional to the solutionconductivity.
Sample
Input AC voltage
Drive coil
Pick-up coil
Induced current dependent on the conductivity of the sample
Current field
The main advantage of toroidal conductivity is that the toroidal coils arenot in contact with the solution. They are either encased in a polymericmaterial or are external to a flow through cell.
One of the main disadvantages of toroidal conductivity measurements isthat it lacks the sensitivity of contacting measurement. Toroidal sensorsare also typically larger than contacting sensors, and the solution currentinduced by the toroid occupies a volume around the sensor. Hence,toroidal sensors need to be mounted in a larger pipe.
- 26 -
Rules for reliable measurements
Reliable measurement results can be obtained when you follow thesesimple rules:
Calibrate frequently
The cell constant value is an important factor of conductivity measure-ments. You must be sure of the cell constant value before startingmeasurements.
It is impossible to recommend a given calibration interval for conduc-tivity cells as the interval will depend on the application, the samplesand the operating conditions in use.
It is recommended to check the cell constant regularly especially whenusing a platinised cell, due to increased risk of contamination or physi-cal-chemical modification of the platinum layer.
Temperature and stirring conditions
It is recommended to thermostat if you want accurate measurements.
The temperature and stirring conditions during the calibration must be asclose as possible to the conditions used during the measurement.
Note: for conductivity measurements the conductivity reading can beexpressed at the measuring temperature or at a reference temperatureusing a temperature correction factor.
Position of conductivity cell
Make sure that all the poles of the conductivity cell are completely cov-ered by the sample. Always position a 2-pole cell in the centre of themeasuring vessel.
Low conductivity measurements
• use a flow-through cell, to avoid atmospheric contamination fromcarbon dioxide,
• use cells with low cell constant, 1 cm-1 or lower,
• use non-platinised cells for easier cleaning and faster response,
• make sure that your instrument is able to apply an appropriatemeasuring frequency.
- 27 -
High conductivity measurements
• Use platinised cells to avoid polarisation errors, preferably 4-polecells.
• Use cells with a high cell constant (1 cm-1) or higher if possible.
• Do not dilute samples in order to bring them into measuring range.Conductivity is not proportional to concentration at high levels.
• Make sure that your instrument is able to apply an appropriatemeasuring frequency.
Traceability
Using one of Radiometer Analytical's Demal range of certified conductiv-ity standards to calibrate your measuring chain guarantees that yourconductivity measurements are traceable to NIST. OurCofrac accredited laboratory produces pH and conductivity standardswith certificates of traceability and conformity.
Metrology
To comply with ISO 9001 and ISO 17025 requirements, our MetrologyDepartment can supply calibration and verification certificates.
1) NIST = National Institute of Standards and Technology
- 28 -
Recommendations formaintenance and storage
Make sure that your cell is clean
Between measurements, rinse the cell with deionised water. If the cellhas been exposed to a solvent immiscible with water, clean it with asolvent miscible with water e.g. ethanol or acetone and rinse carefullywith water.
In the event of deposits on the cell, dip the cell in RENOVO•N, NormalCleaning Solution for approximately 1 hour. Rinse thoroughly with dis-tilled water after cleaning.
Store the conductivity cell carefully
Before storing the cell, rinse it carefully in deionised water.
• Short-term storage: in deionised water.
• Long-term storage: in deionised water or store dry.
After long-term storage, condition the cell for 8 hours in deionised water,before use.
Handle platinised cells carefully
Do not touch the black platinum layer of the platinised cells.
To rinse the platinised cells, it is recommended to dip the cell severaltimes in a beaker of demineralised water.
Be careful when rinsing platinised cells using deionised water from awater bottle. The force of water could remove some of the platinum layerand consequently modify the cell constant.
- 29 -
Applications of conductivitymeasurements
Conductivity measurements
Measuring conductivity simply detects the presence of ions in solutionand is therefore a non-specific measurements. Conductivity applicationsencompass for instance monitoring of water purity, drinking water andprocess water quality. It is also a rapid and inexpensive way of deter-mining the ionic strength of a solution.
The conductivity κ is calculated using the conductance G and the cellconstant K:
κ = G • K (S/cm)
Resistivity measurements
Resistivity measurements are used as a reliable indicator of ionic waterquality, especially for ultrapure water (UPW) and more generally when aresistivity value is preferred to a conductivity value, for example whenchecking for water contamination in organic solvents.
The resistivity of a solution is calculated on the basis of theconductance G compensated for the cable resistance, cablecapacitance and cell constant of the conductivity cell used. Theresistivity ρ is calculated as follows:
ρ =1κ
Ω•cm-1
- 30 -
TDS measurements
TDS measurements in the pulp and paper industry measure accuratelyand easily the total organic and inorganic dissolved solids in water.
What is TDS and how is it measured?
The TDS (Total Dissolved Solids) corresponds to the total weight ofcations, anions and the undissociated dissolved species in one litre ofwater.
The standard method1) to determine TDS is to evaporate a measuredsample of water to dryness at 180°C, under strict laboratory conditions,and carefully weigh the amount of dry solids remaining. The precision ofthe standard method depends on the nature of the dissolved species.
The TDS method in a typical conductivity meter offers a quicker andeasier way of determining TDS by measuring the conductivity, then us-ing a conversion factor to give TDS readings.
Determination of the TDS Factor
Perform a calibration using a standard of known TDS, (STD). The TDSfactor is calculated as follows:
TDS(STD) is expressed in mg/l.
κ18(STD) = conductivity of the standard corrected to 18°C (in µS/cm).The conductivity of the standard measured is corrected to 18°C usingthe corresponding temperature correction table.
1) Standard methods for the examination of water and wastewaters, 18th Edition 1992(Editors: Arnold E. Greenberg, Leonore S. Clesceri, Andrew D. Eaton), part 2540Cpage 2-55.
TDS (STD)TDS factor =
κ18
(STD)
- 31 -
For "normal" water, the TDS factor calculated should be within 0.50to 0.70.
The TDS factor calculated by the conductivity meter also provides infor-mation about the qualitative ionic composition of the water sample. If theTDS factor is out of the 0.55 to 0.7 range, the TDS calibration should beconsidered as suspect and must be repeated. If a TDS factor below 0.55is confirmed, the sample probably contains a significant concentration ofa constituent that cannot be measured (e.g. ammonia or nitrite). A TDSfactor above 0.8 may indicate the presence of a large amount of poorlydissociated calcium and sulphate ions.
Calculating the sample TDS
The sample conductivity is measured at the sample temperature (0 to99°C) and corrected to 18°C. The sample TDS, TDS (SMP), is calculat-ed from the sample conductivity corrected at 18°C, k
18 (SMP):
TDS (SMP) (in mg/l) = TDS factor • κ18 (SMP).
TDS values between 4 and 20000 mg/l can be displayed.
Note: to obtain the most accurate measurements, it is recommended toperform the standard and sample measurements at the sametemperature.
Such TDS measurements are accurate as long as the composition ofthe samples varies only slightly.
- 32 -
Concentration measurements
Since the charge of the ions in solution facilitates the conductance ofelectrical current, the conductivity of a solution is highly (but not totally)proportional to its ion concentration. As conductivity is a non-specifictechnique, concentration calculation using conductivity measurements isvalid for samples containing only the species of interest.
The first step to measuring concentration is to know the conductivity ofthe solution as a function of the concentration of the specie of interest.This data can come from published conductivity vs. concentrationcurves for electrolytes, or from laboratory measurements.
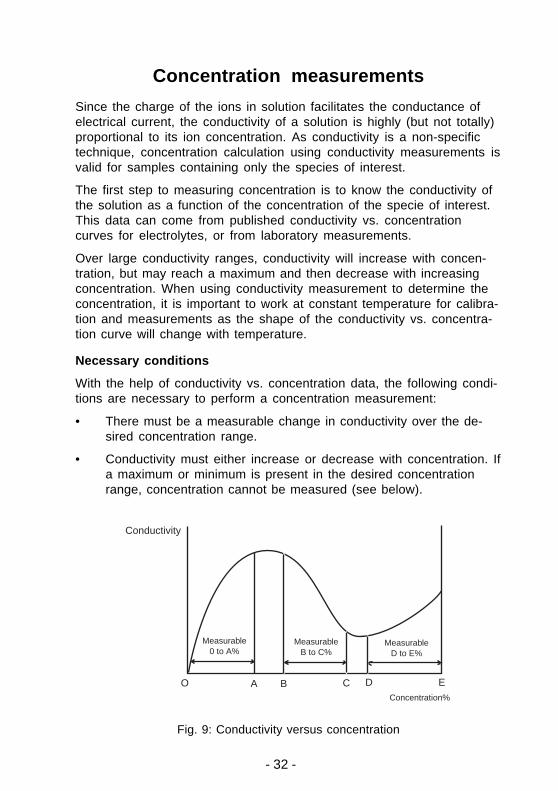
Over large conductivity ranges, conductivity will increase with concen-tration, but may reach a maximum and then decrease with increasingconcentration. When using conductivity measurement to determine theconcentration, it is important to work at constant temperature for calibra-tion and measurements as the shape of the conductivity vs. concentra-tion curve will change with temperature.
Necessary conditions
With the help of conductivity vs. concentration data, the following condi-tions are necessary to perform a concentration measurement:
• There must be a measurable change in conductivity over the de-sired concentration range.
• Conductivity must either increase or decrease with concentration. Ifa maximum or minimum is present in the desired concentrationrange, concentration cannot be measured (see below).
Conductivity
O A B C D E
Measurable0 to A%
MeasurableB to C%
MeasurableD to E%
Concentration%
Fig. 9: Conductivity versus concentration
- 33 -
To calculate a sample concentration, the conductivity meter must becalibrated against 1 to 3 standards of known concentration. At the end ofthe calibration, a formula expressing the concentration as a function ofthe conductivity measured is determined. The sample concentration iscalculated from the sample conductivity measured and the coefficientsobtained during calibration.
Determination of the concentration coefficients
A calibration using 1 to 3 standards of known concentration is per-formed.
For each standard:
• The conductivity of the standard is measured at the standard'stemperature.
• The conductivity of the standard is corrected to a reference temper-ature Tref (linear correction or natural water correction as for a con-ductivity measurement).
At the end of the calibration, the conductivity meter calculates and dis-plays the A
0, A
1 and A
2 coefficients of the following equation:
C = A0 + A1 • κTref + A2 • (κTref )2
C = concentration
κTref = conductivity corrected to the Tref reference temperature.
If:
1-point calibration, A1 is calculated, A0 and A2 are equal to 0.
2-points calibration, A0 and A
1 are calculated, A
2 = 0.
Note: all the measurements of the standards must be performed at thesame temperature. To obtain the most accurate measurements, it isrecommended to thermostat the standards and the samples at thereference temperature Tref.
- 34 -
Determination of the sample concentration
The conductivity of the sample is measured at the sample's temperaturethen corrected to a reference temperature Tref to give κTref (linear correc-tion or "Natural water" correction as for a conductivity measurement).
The sample concentration CSMP
is then calculated using the followingequation:
CSMP = A0 + A1 • κTref + A2 • (κTref )2
A0 , A
1 and A
2 are the coefficients determined during method calibration.
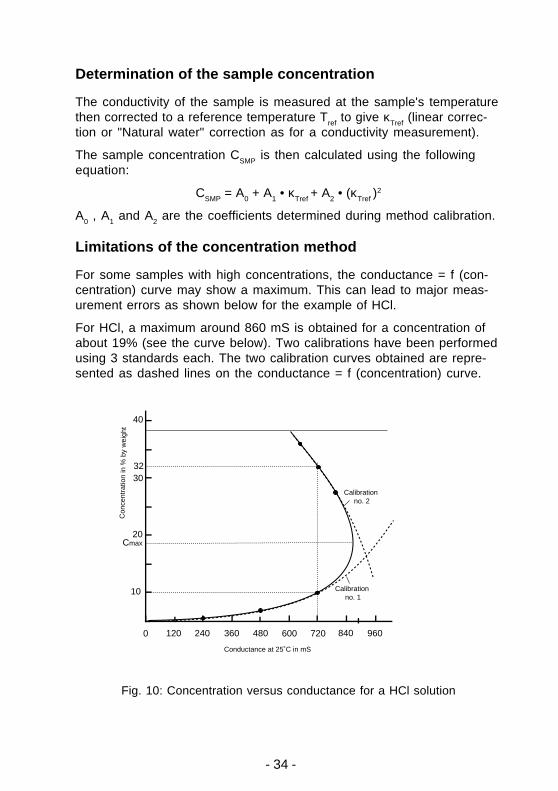
Limitations of the concentration method
For some samples with high concentrations, the conductance = f (con-centration) curve may show a maximum. This can lead to major meas-urement errors as shown below for the example of HCl.
For HCl, a maximum around 860 mS is obtained for a concentration ofabout 19% (see the curve below). Two calibrations have been performedusing 3 standards each. The two calibration curves obtained are repre-sented as dashed lines on the conductance = f (concentration) curve.
10
Con
cent
ratio
n in
% b
y w
eigh
t
Conductance at 25˚C in mS
0 480120 240 360 600 720
40
30
20
960840
Cmax
Calibration no. 1
Calibration no. 2
32
Fig. 10: Concentration versus conductance for a HCl solution
- 35 -
When performing measurements on a 32% HCl sample using calibrationno. 1, the conductivity meter measures a conductance of 720 mS andfinds a concentration of 10% instead of 32%. The correct result (32%)is obtained if sample measurements are performed using calibrationno. 2.
Recommendations:
To obtain accurate measurements in concentrated samples, some pre-cautions must be taken:
1. For the sample analysed, you must know if the conductance =f (concentration) curve shows a maximum for the conductance. Ifit is the case, the concentration value C
max must be known.
2. A calibration on 3 standards must be performed with the followingrecommendation: the 3 standard concentrations must be greater orless than the Cmax value.
3. Make sure that the change in conductivity is only due to the spe-cie of interest. As conductivity is a non-selective measurement,conductivity change due to any other species would lead to misin-terpretation of the concentration results.
- 36 -
Salinity measurements
Salinity is a measurement without unit corresponding to the weight ofdissolved salts in seawater.
The salinity is calculated from an empirical relationship between theconductivity and the salinity of a seawater sample. OceanographicTables and Standards endorsed by UNESCO/SCOR/ICES/IAPSO areused for the calculation.
Salinity measurements are performed with no direct temperature correc-tion. The calculation is valid for salinity values in the range 2 to 42 at asample temperature of -2 to +35°C.
Determination of the sample salinity
Calibration
The calibration is carried out using a standard seawater solutionκ15 (STD) (salinity = 35, conductivity equals 42.896 mS/cm at 15°C).
The conductivity of the sample is measured at the sample temperatureT. The conductivity of standard seawater κT (STD) is calculated from thefollowing equation:
κT (STD) = f (T) • κ15 (STD)
The conversion factor f (T) is calculated from a 4-degree polynomialformula.
Salinity of the sample
At the sample temperature T, the sample conductivity measured isκT (SMP). Salinity is calculated from the equation below combined with a5-degree polynomial formula:
R = κT (SMP) / κT (STD)
- 37 -
Build the system to suit your needs
Radiometer Analytical SAS offers complete conductivity measuring sys-tems comprising, conductivity meters, cells, temperature sensors andconductivity standards to ensure you obtain accurate and reproduciblemeasurements every time.
Choose the right conductivity meter
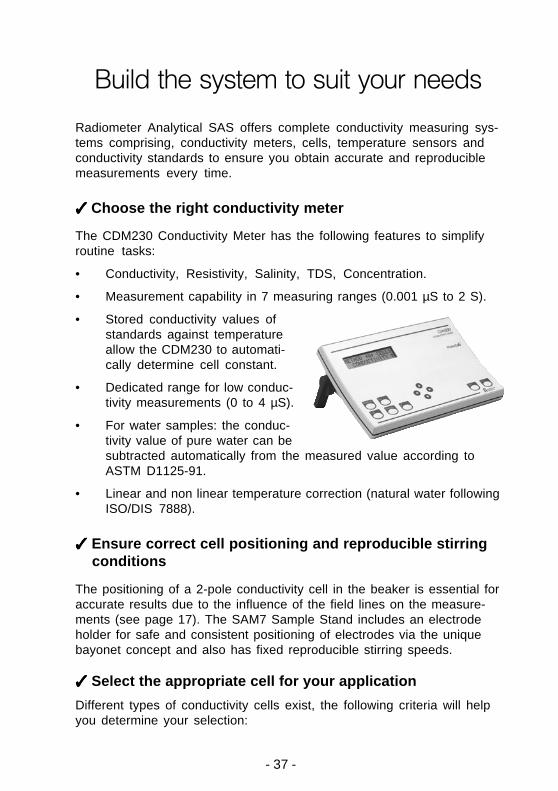
The CDM230 Conductivity Meter has the following features to simplifyroutine tasks:
• Conductivity, Resistivity, Salinity, TDS, Concentration.
• Measurement capability in 7 measuring ranges (0.001 µS to 2 S).
• Stored conductivity values ofstandards against temperatureallow the CDM230 to automati-cally determine cell constant.
• Dedicated range for low conduc-tivity measurements (0 to 4 µS).
• For water samples: the conduc-tivity value of pure water can besubtracted automatically from the measured value according toASTM D1125-91.
• Linear and non linear temperature correction (natural water followingISO/DIS 7888).
Ensure correct cell positioning and reproducible stirring conditions
The positioning of a 2-pole conductivity cell in the beaker is essential foraccurate results due to the influence of the field lines on the measure-ments (see page 17). The SAM7 Sample Stand includes an electrodeholder for safe and consistent positioning of electrodes via the uniquebayonet concept and also has fixed reproducible stirring speeds.
Select the appropriate cell for your application
Different types of conductivity cells exist, the following criteria will helpyou determine your selection:
- 38 -
• Measuring range (high or low conductivity): a 4-pole cell covers awide measurement range whereas a platinised cell is recommendedfor high conductivity measurements. Order the 4-pole CDC565 withepoxy body (part no. E61M003) or the 2-pole platinised cell withbuilt-in temperature sensor, CDC641T (part no. B15B001). TheCDC566T (part no. E61M010) also has an epoxy body together witha temperature sensor.
• Sample type and sample volume: a flow-through cell, CDC511T(part no. E61M009), is recommended for measurements in purewater as it protects the sample from carbon dioxide in air. Thepipette version of this cell can be used for small sample volumes.
Use certified conductivity standards
No conductivity measurement can be more precise than the standardsused for the calibration. To ensure optimum accuracy time after time,calibrate your system with solutions that are fully traceable to nationalstandards.
Two types of conductivity standards exist, certified or economical. Ifyour laboratory is involved in an accreditation, certification or qualityprocedure, it is recommended to use certified standards. The range ofcertified conductivity standards prepared by Radiometer Analytical isfully traceable to SI units via Standard Reference Materials manufac-tured by NIST1). The first three standards in the table below are manu-factured and calibrated according to the internationally recognised Demalscale laid down by the OIML2) (Recommendation No. 56).
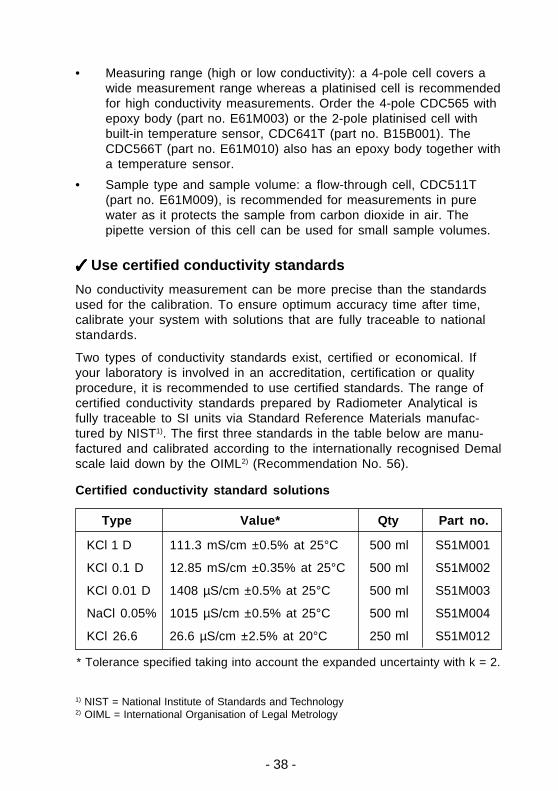
Certified conductivity standard solutions
Type Value* Qty Part no.
KCl 1 D 111.3 mS/cm ±0.5% at 25°C 500 ml S51M001
KCl 0.1 D 12.85 mS/cm ±0.35% at 25°C 500 ml S51M002
KCl 0.01 D 1408 µS/cm ±0.5% at 25°C 500 ml S51M003
NaCl 0.05% 1015 µS/cm ±0.5% at 25°C 500 ml S51M004
KCl 26.6 26.6 µS/cm ±2.5% at 20°C 250 ml S51M012
* Tolerance specified taking into account the expanded uncertainty with k = 2.
1) NIST = National Institute of Standards and Technology2) OIML = International Organisation of Legal Metrology
- 39 -
All of our certified standard solutions come in sealed containers guaran-teeing conductivity values for a full two years (KCl 26.6 comes in aglass bottle with a guaranteed shelf life of 1 year). All standards are de-livered with a Cofrac Verification Certificate and a Certificate of Conform-ity and Traceability drawn up according to ISO Guide 31.
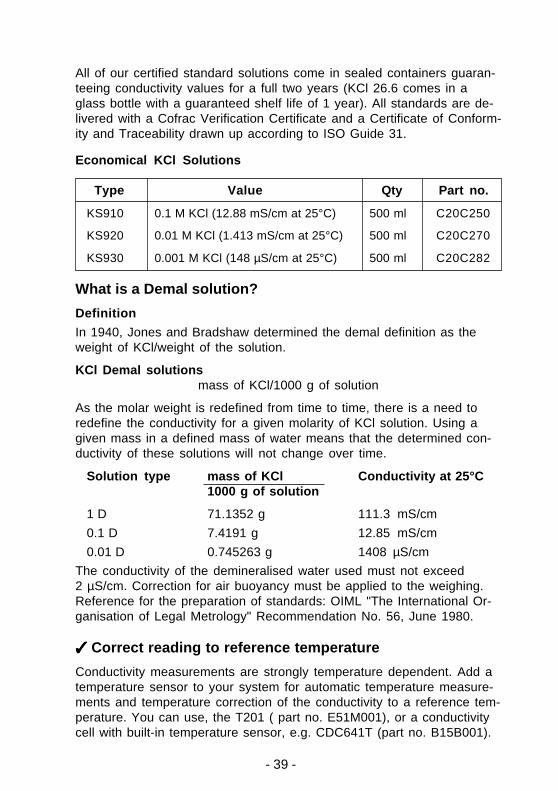
Economical KCl Solutions
Type Value Qty Part no.
KS910 0.1 M KCl (12.88 mS/cm at 25°C) 500 ml C20C250
KS920 0.01 M KCl (1.413 mS/cm at 25°C) 500 ml C20C270
KS930 0.001 M KCl (148 µS/cm at 25°C) 500 ml C20C282
What is a Demal solution?
Definition
In 1940, Jones and Bradshaw determined the demal definition as theweight of KCl/weight of the solution.
KCl Demal solutionsmass of KCl/1000 g of solution
As the molar weight is redefined from time to time, there is a need toredefine the conductivity for a given molarity of KCl solution. Using agiven mass in a defined mass of water means that the determined con-ductivity of these solutions will not change over time.
Solution type mass of KCl Conductivity at 25°C1000 g of solution
1 D 71.1352 g 111.3 mS/cm
0.1 D 7.4191 g 12.85 mS/cm
0.01 D 0.745263 g 1408 µS/cm
The conductivity of the demineralised water used must not exceed2 µS/cm. Correction for air buoyancy must be applied to the weighing.Reference for the preparation of standards: OIML "The International Or-ganisation of Legal Metrology" Recommendation No. 56, June 1980.
Correct reading to reference temperature
Conductivity measurements are strongly temperature dependent. Add atemperature sensor to your system for automatic temperature measure-ments and temperature correction of the conductivity to a reference tem-perature. You can use, the T201 ( part no. E51M001), or a conductivitycell with built-in temperature sensor, e.g. CDC641T (part no. B15B001).
- 40 -
Pure water conductivity measurements
Dedicated USP offer
Radiometer Analytical has created a complete conductivity package forpure water measurements complying with USP standard requirementsincluding, in addition to the CDM230 Conductivity Meter:
• CDC511T, 4-pole flow-through cell with built-in temperature sensor.
• Calibration certificate stating the cell constant value within ±2%.
• Certified calibration standard KCl 0.01D, 1408 µS/cm at 25°C.
• Epoxy tube for the cell for stage 2 measurements.
• pH meter and pH electrode with calibration certificates, forstage 3 measurements.
Refer to the article "Conductivity measurements on pure water accordingto the recommendations of the US Pharmacopoeia".
Dedicated EP offer
Radiometer Analytical has created an application kit for waterconductivity by the European Pharmacopeia, including:
• CDC641T 2-pole cell with built-in temperature sensor.
• Flow-through cell adapter.
• Certified conductivity standard, 26.6 µS at 20°C.
Refer to the application note "Pure water conductivity measurements,according to the European Pharmacopoeia".
To comply with ASTM D1125-91
Conductivity samples at or below 1.0 µS/cm may require the deductionof the contribution of pure water conductivity, which may be consideredas a blank. This occurs because the conductivity of pure water is a largefraction of the overall sample conductivity.
The CDM230 Conductivity Meter calculates the theoretical conductivityof pure water at the sample temperature using a 4-degree polynomialequation given by ASTM D1125-91 and applicable between 0 and 100°C.The CDM230 then subtracts the conductivity of pure water (0.055 µS/cmat 25°C) from the conductivity measured and displays the difference.
Visit our MeterLab® Resource Centre at www.radiometer-analytical.com
to consult the above articles and find out more about our products.
- 41 -
FAQs
My conductivity readings appear to be incorrect. What could bewrong?
When calibrating or taking conductivity measurements, the conductivitycell has to be totally submerged. If not, calibration or reading will beaffected. If incorrectly calibrated, all subsequent readings will be out ofspecification.
Do not immerse the air escape hole of 4-pole cells.
How often do platinum cells need to be replatinised?
Some platinum electrodes are coated with platinum black during manu-facture. This coating is extremely important to cell operation, especiallyin solutions of high conductivity. Electrodes are platinised to avoid errorsdue to polarisation leading to inaccurate readings.
Cells should be inspected periodically and after each cleaning. If theplatinum black coating appears to be wearing or flaking off the electrode,the cell should be replatinised or replaced. It is recommended to havethe cell replatinised approximately every six months, contact your Radi-ometer Analytical representative for details.
Can conductivity be measured in non-aqueous solutions?
Many substances possess some dissociative properties. Generally or-ganic compounds (such as benzene, alcohols, and petroleum products)have very low conductivities. We recommend using a non platinisedglass cell. The CDM230 Conductivity Meter offers a 1 nS/cm resolutionon the 4 µS range.
What is the guarantee of traceability as indicated on the certificatesupplied with each bottle of certified conductivity standard?
Each bottle comes with its two certificates.
The verification certificate states accreditation by Cofrac and thereforeguarantees that the product is a CRM (certified reference material) fullytraceable to a primary standard.
The conformity certificate is drawn up according to ISO Guide 31 andgives full traceability information as well as the composition and prepara-tion of the standard and recommendations for storage and use.
- 42 -
What is the confidence level of Radiometer Analytical conductivitystandards?
The certified value of Radiometer Analytical’s certified conductivitystandards is given with an expanded uncertainty to guarantee a confi-dence level of 95%. It is printed on the bottle and mentioned on the cer-tificates.
What is the shelf life of the certified conductivity standards?
Radiometer Analytical’s range of Demal certified conductivity standards(1 D, 0.1 D and 0.01 D) are delivered in airtight tins to protect them fromevaporation and microbiological growth. This guarantees the toleranceon their nominal values for two years from the date of production. Thisguarantee also applies to the 0.05% NaCl standard.
Note: Once opened use within 3 months.
How can the cell constant accuracy required by the USP beobtained?
USP states that the cell constant must be known with an uncertaintywhich is better than ± 2%.
The cell constant is a factor that is used to convert the measured con-ductance to conductivity. It is determined by the geometry of the cell,but in, practical terms, can only be measured using a standard of knownconductivity value. The expanded uncertainty of the cell constant resultsfrom the contribution of uncertainties from all variables that are used inthe determination of that constant. The prime source of uncertainty isthe uncertainty of the conductivity standard solution. In other words, acell constant can never be more accurate than the standard used forcalibration.
Taking into account all other contributions to the cell constant uncertain-ty (and using rules from GUM1)) the uncertainty of the standard solutionhas to be less than ±1%, to be able to determine a cell constant to with-in ±2%.
1)GUM: Guide to the expression of uncertainty
- 43 -
Which conductivity standard can I use to ensure that the cell con-stant can be determined to within ± 2%?
Radiometer Analytical produces a KCl 0.01D conductivity standardwhich has a certified conductivity value of 1409 µS/cm ± 0.5% at 25°C,traceable to internationally recognised Standard Reference Material(SRM) from the National Institute of Standards and Technology (NIST).This means that there is a 95% confidence level for the true value of theconductivity standard to be 1409 µS/cm ± 7 µS/cm at 25°C. For such alow uncertainty contribution, the uncertainty associated to the cell con-stant determination can be reduced to less than 1%.
This cannot be achieved using lower conductivity standards as theirrelative uncertainty increases greatly for low conductivity values.
Must I calibrate my cell with a standard whose value is close to thatof the samples?
• Yes, if the cell is a 2-pole one, as its behaviour, due to polarisa-tion, is not linear over the whole conductivity range (see EuropeanPharmacopeia)
• Not necessary when using a 4-pole cell as its geometry preventspolarisation influence on the measurements (refer to indications ofUSP).
- 44 -
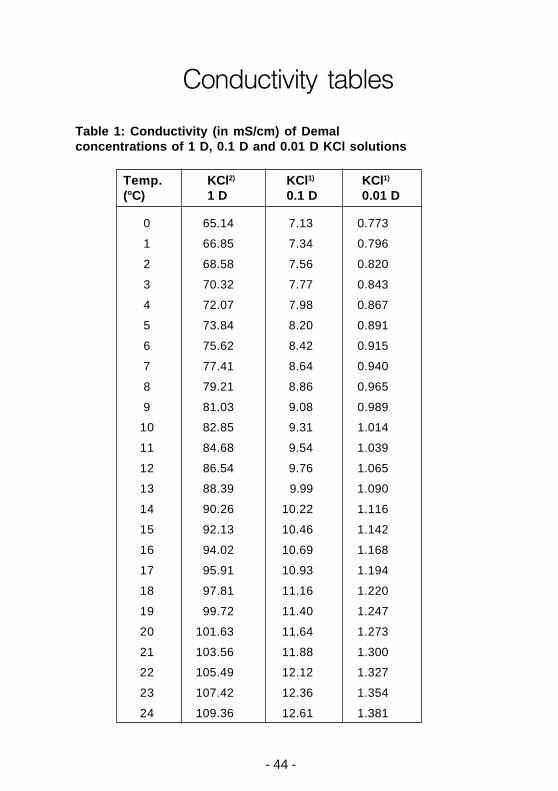
Conductivity tables
Table 1: Conductivity (in mS/cm) of Demalconcentrations of 1 D, 0.1 D and 0.01 D KCl solutions
Temp. KCl2) KCl1) KCl1)
(°C) 1 D 0.1 D 0.01 D
0 65.14 7.13 0.773
1 66.85 7.34 0.796
2 68.58 7.56 0.820
3 70.32 7.77 0.843
4 72.07 7.98 0.867
5 73.84 8.20 0.891
6 75.62 8.42 0.915
7 77.41 8.64 0.940
8 79.21 8.86 0.965
9 81.03 9.08 0.989
10 82.85 9.31 1.014
11 84.68 9.54 1.039
12 86.54 9.76 1.065
13 88.39 9.99 1.090
14 90.26 10.22 1.116
15 92.13 10.46 1.142
16 94.02 10.69 1.168
17 95.91 10.93 1.194
18 97.81 11.16 1.220
19 99.72 11.40 1.247
20 101.63 11.64 1.273
21 103.56 11.88 1.300
22 105.49 12.12 1.327
23 107.42 12.36 1.354
24 109.36 12.61 1.381
- 45 -
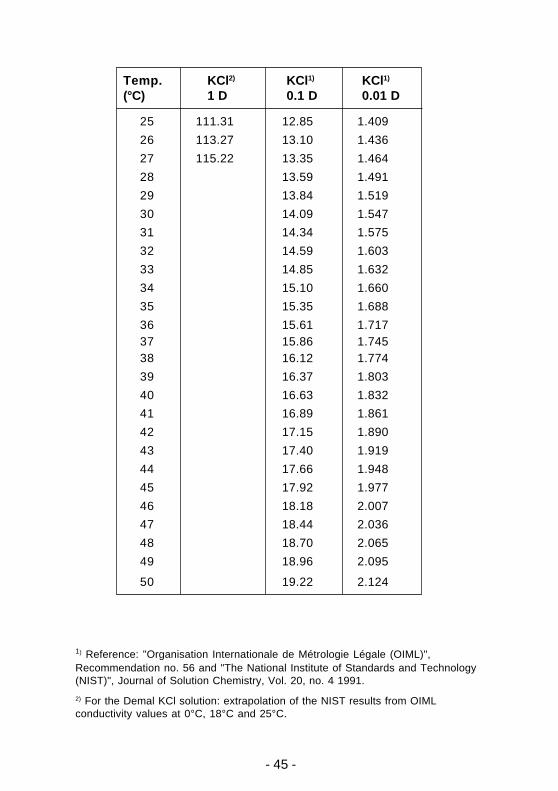
Temp. KCl2) KCl1) KCl1)
(°C) 1 D 0.1 D 0.01 D
25 111.31 12.85 1.409
26 113.27 13.10 1.436
27 115.22 13.35 1.464
28 13.59 1.491
29 13.84 1.519
30 14.09 1.547
31 14.34 1.575
32 14.59 1.603
33 14.85 1.632
34 15.10 1.660
35 15.35 1.688
36 15.61 1.71737 15.86 1.74538 16.12 1.774
39 16.37 1.803
40 16.63 1.832
41 16.89 1.861
42 17.15 1.890
43 17.40 1.919
44 17.66 1.948
45 17.92 1.977
46 18.18 2.007
47 18.44 2.036
48 18.70 2.065
49 18.96 2.095
50 19.22 2.124
1) Reference: "Organisation Internationale de Métrologie Légale (OIML)",Recommendation no. 56 and "The National Institute of Standards and Technology(NIST)", Journal of Solution Chemistry, Vol. 20, no. 4 1991.
2) For the Demal KCl solution: extrapolation of the NIST results from OIMLconductivity values at 0°C, 18°C and 25°C.
- 46 -
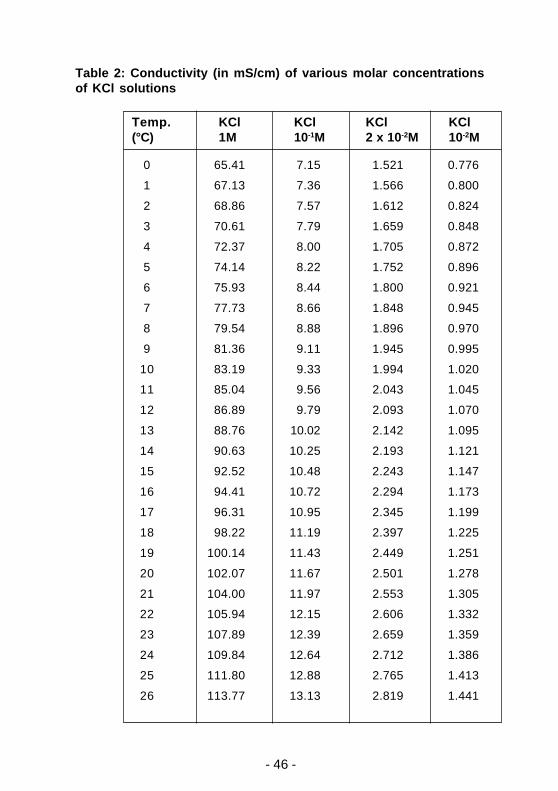
Table 2: Conductivity (in mS/cm) of various molar concentrationsof KCl solutions
Temp. KCl KCl KCl KCl(°C) 1M 10-1M 2 x 10⁻²M 10-2M
0 65.41 7.15 1.521 0.776
1 67.13 7.36 1.566 0.800
2 68.86 7.57 1.612 0.824
3 70.61 7.79 1.659 0.848
4 72.37 8.00 1.705 0.872
5 74.14 8.22 1.752 0.896
6 75.93 8.44 1.800 0.921
7 77.73 8.66 1.848 0.945
8 79.54 8.88 1.896 0.970
9 81.36 9.11 1.945 0.995
10 83.19 9.33 1.994 1.020
11 85.04 9.56 2.043 1.045
12 86.89 9.79 2.093 1.070
13 88.76 10.02 2.142 1.095
14 90.63 10.25 2.193 1.121
15 92.52 10.48 2.243 1.147
16 94.41 10.72 2.294 1.173
17 96.31 10.95 2.345 1.199
18 98.22 11.19 2.397 1.225
19 100.14 11.43 2.449 1.251
20 102.07 11.67 2.501 1.278
21 104.00 11.97 2.553 1.305
22 105.94 12.15 2.606 1.332
23 107.89 12.39 2.659 1.359
24 109.84 12.64 2.712 1.386
25 111.80 12.88 2.765 1.413
26 113.77 13.13 2.819 1.441
- 47 -
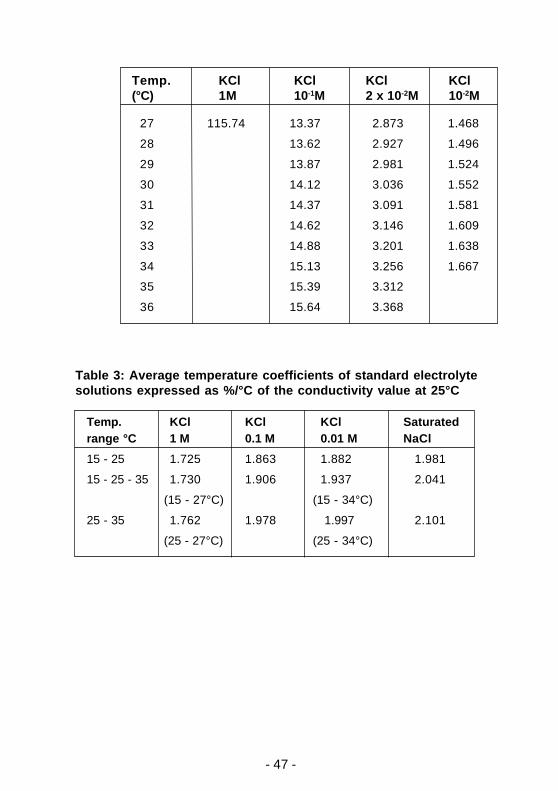
Temp. KCl KCl KCl KCl(°C) 1M 10-1M 2 x 10⁻²M 10-2M
27 115.74 13.37 2.873 1.468
28 13.62 2.927 1.496
29 13.87 2.981 1.524
30 14.12 3.036 1.552
31 14.37 3.091 1.581
32 14.62 3.146 1.609
33 14.88 3.201 1.638
34 15.13 3.256 1.667
35 15.39 3.312
36 15.64 3.368
Table 3: Average temperature coefficients of standard electrolytesolutions expressed as %/°C of the conductivity value at 25°C
Temp. KCl KCl KCl Saturatedrange °C 1 M 0.1 M 0.01 M NaCl
15 - 25 1.725 1.863 1.882 1.981
15 - 25 - 35 1.730 1.906 1.937 2.041
(15 - 27°C) (15 - 34°C)
25 - 35 1.762 1.978 1.997 2.101
(25 - 27°C) (25 - 34°C)
- 48 -
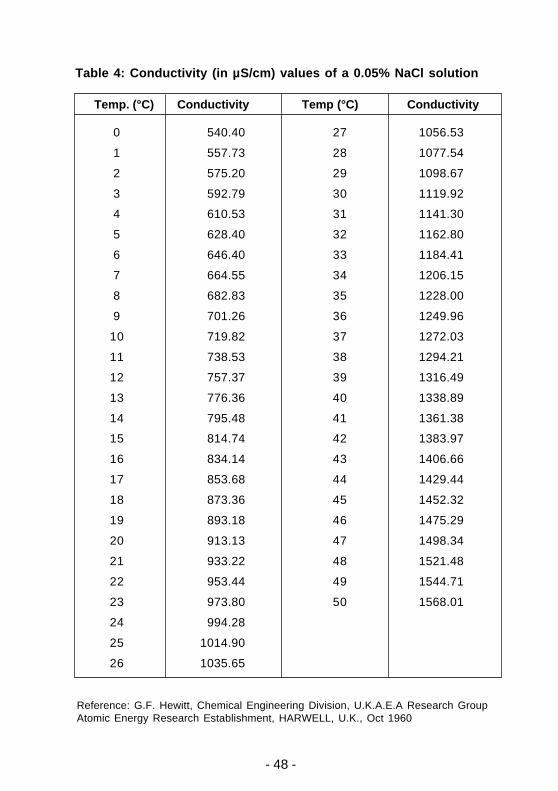
Table 4: Conductivity (in µS/cm) values of a 0.05% NaCl solution
Temp. (°C) Conductivity Temp (°C) Conductivity
0 540.40 27 1056.53
1 557.73 28 1077.54
2 575.20 29 1098.67
3 592.79 30 1119.92
4 610.53 31 1141.30
5 628.40 32 1162.80
6 646.40 33 1184.41
7 664.55 34 1206.15
8 682.83 35 1228.00
9 701.26 36 1249.96
10 719.82 37 1272.03
11 738.53 38 1294.21
12 757.37 39 1316.49
13 776.36 40 1338.89
14 795.48 41 1361.38
15 814.74 42 1383.97
16 834.14 43 1406.66
17 853.68 44 1429.44
18 873.36 45 1452.32
19 893.18 46 1475.29
20 913.13 47 1498.34
21 933.22 48 1521.48
22 953.44 49 1544.71
23 973.80 50 1568.01
24 994.28
25 1014.90
26 1035.65
Reference: G.F. Hewitt, Chemical Engineering Division, U.K.A.E.A Research GroupAtomic Energy Research Establishment, HARWELL, U.K., Oct 1960

- 49 -
Notes
MeterLab® is a registered trademark of Radiometer Analytical SAS
- 50 -
D61
M00
2 •
Prin
ted
by R
adio
met
er A
naly
tical
SA
S •
Fra
nce
• 20
04-0
5BA
ll rig
hts
rese
rved