Embed Size (px)
Citation preview
Combined DTI/HARDI visualization
V. Prckovska1, T. H.J.M. Peeters1, M. van Almsick1, A. Vilanova1, and B. ter Haar Romeny1 1Biomedical Engineering, Eindhoven University of Technology, Eindhoven, Netherlands
INTRODUCTION: High angular resolution diffusion imaging (HARDI) is a diffusion weighted MRI technique that overcomes a decisive limitation of its predecessor, diffusion tensor imaging (DTI). It can capture composite nerve fiber structure in a single voxel. On the other hand, HARDI raises several issues: complex modeling of the data, non-intuitive and computationally demanding visualization, inability to interactively explore and transform the data, etc. To overcome these drawbacks, we present a novel, multi-field visualization framework that adopts the benefits of both DTI and HARDI. By applying a classification scheme based on HARDI anisotropy measures, the most suitable model per imaging voxel is automatically chosen. This classification allows simplification of the data in areas with single fiber bundle coherence. To accomplish fast and interactive visualization for both HARDI and DTI modalities, we exploit the capabilities of modern GPUs for glyph rendering and adopt DTI fiber tracking in suitable regions. The resulting framework allows user-friendly data exploration of fused HARDI and DTI data. Many incorporated features like sharpening, normalization, maxima enhancement and different types of color coding of the HARDI glyphs, simplify the data and enhance its features. METHODS: For rendering tensor glyphs, we use GPU-based ray casting of ellipsoids. Calculating the bounding box, ray-glyph intersections and glyph-normals is trivial due to the analytical equation for the ellipsoids. Ray casting of HARDI glyphs is more challenging than ray casting of simple ellipsoids, because there is no analytical solution for the intersection of a ray with the HARDI function which consists of a linear combination of spherical harmonics. We adhere to the work of Peeters et al.[1] to resolve this issue. We perform a classification based on HARDI anisotropy measures[2], where an upper and lower threshold for crossing areas is given for measures such as General Anisotropy (GA) and Generalized Fractional Anisotropy (GFA). This effectively classifies each voxel in one of three compartments: isotropic/noise, crossing/HARDI and linear/Gaussian. To facilitate this classification we offer an algorithm for semi-automatic threshold tuning. The user chooses a HARDI anisotropy measure M for classification, and regions of positive (i.e., the areas where crossings are expected) P and negative (i.e., linear areas) seed points N for the classification. Our algorithm then determines the distributions Mp and Mn of M in the voxels of P and N. The lower threshold is set to the minimum value of Mp (i.e., between isotropic and crossing). If Mp and Mn have no overlap, then the upper threshold is set to the maximum value of Mp. If Mp and Mn (partially) overlap, then the upper threshold is set to the average of the medians of Mp and Mn. Fig. 1. illustrates the pipeline of our fused visualization. Initially, an input of tensors and SH coefficients that represent different HARDI functions needs to be computed. This can be done from the same DW-MRI data used for estimating the tensors. The pink rectangles represent transformations on the data and the blue rounded-rectangles different data volumes. The small red circles represent user interaction (by selection seeding regions for example), and the small green circles the output of fiber tracking as seed points. The flow of the pipeline is captured by directed arrows, where dashed lines represent optional scenarios. On the data classified as linear, a fiber tracking algorithm can be applied. Then this data can be visualized with simple line rendering, or represented by tensor glyphs. On the other hand, the data classified as crossings can be represented by HARDI functions calculated from 4th order SH. However, showing only fibers, or only glyphs can result in unreliable visualization in the first case, or complex and overwhelming, in the second case. Glyphs can only convey local information. Representing the data partially by fibers helps in providing global context. Due to this fact, we propose to fuse the DTI and HARDI visualization techniques in a unified framework by using the voxel classification for model selection. This way, we represent the data by combining tensor glyphs and HARDI glyphs. There is also a
possibility to combine streamline fibers and HARDI glyphs. Our framework supports different color coding of the glyphs by RGB (Fig. 2a), type of anisotropy (Fig. 2b, Fig. 3a) and enhancing maxima (Fig. 3b). RESULTS: In Fig. 2a we show the traditional method of geometry glyph based visualization. In Fig. 2b we present the combined tensor-HARDI glyph visualization. The ellipsoids, compared to HARDI linear glyphs, are better at conveying the information about their principal direction. This can be observed in the area of corpus callosum which classified as linear. The HARDI glyphs are color coded by the type of anisotropy, where yellow states high anisotropy, and dark blue low anisotropy. The glyphs, with high anisotropy, can depending on the threshold tuning, change into linear tensor glyphs. It is interesting to observe the glyphs that are colored by dark blue. Even though, due to the min-max normalization, they appear as crossings, the color coding clearly shows that they belong to the grey matter or the ventricles, since crossings should not be observed above and below the corpus callosum. In Fig. 2c the tensor information is furthermore simplified by showing mainly fibers. The remaining area, classified as non-Gaussian, is represented by HARDI glyphs. This kind of representation is more intuitive to grasp compared to the pure glyphs visualization, as in the case of Fig. 2a. The performance measurements of the proposed framework are faster in rendering by an order of magnitude compared to geometry based HARDI glyph visualization as in Fig. 2a. CONCLUSION: We presented a novel, interactive framework
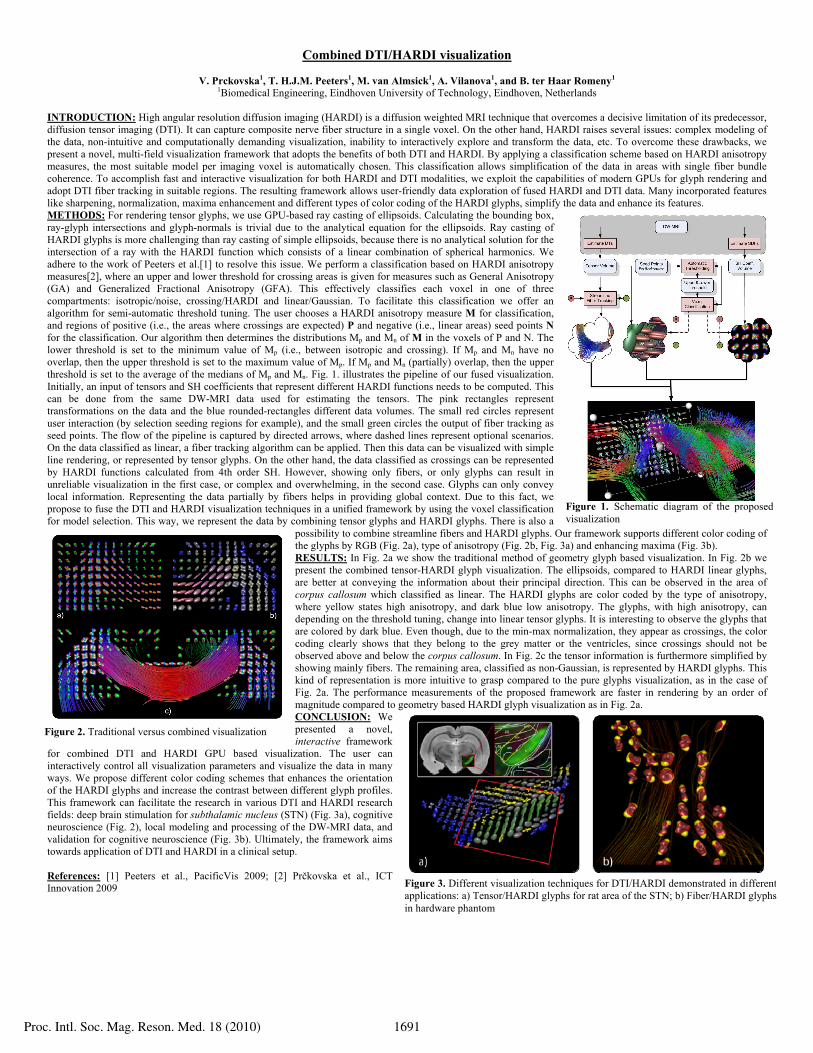
for combined DTI and HARDI GPU based visualization. The user can interactively control all visualization parameters and visualize the data in many ways. We propose different color coding schemes that enhances the orientation of the HARDI glyphs and increase the contrast between different glyph profiles. This framework can facilitate the research in various DTI and HARDI research fields: deep brain stimulation for subthalamic nucleus (STN) (Fig. 3a), cognitive neuroscience (Fig. 2), local modeling and processing of the DW-MRI data, and validation for cognitive neuroscience (Fig. 3b). Ultimately, the framework aims towards application of DTI and HARDI in a clinical setup. References: [1] Peeters et al., PacificVis 2009; [2] Prčkovska et al., ICT Innovation 2009
Figure 2. Traditional versus combined visualization
Figure 1. Schematic diagram of the proposed visualization
Figure 3. Different visualization techniques for DTI/HARDI demonstrated in different applications: a) Tensor/HARDI glyphs for rat area of the STN; b) Fiber/HARDI glyphs in hardware phantom
Proc. Intl. Soc. Mag. Reson. Med. 18 (2010) 1691