Embed Size (px)
Citation preview
Research Report
Centrifugal training, chemical thinning and crop loading to optimise the value of Jazz™
July 2010
Prepared by:
Jack Hughes
Fruition Horticulture Hastings
And
Greg Dryden, Ulf Kerer Fruition Horticulture
Nelson
For
Enza Turners & Growers
Contents Summary 1 Background 4 Part 1. Centrifugal training and chemical thinning 7 Experimental Design 7 Results
Hawkes Bay 9 Nelson 13
Discussion 17 Part 2. Value curve 18 Experimental Design 18 Results
Hawkes Bay 19 Nelson 25
Discussion 31 Part 3. Seasonal growth curve s 32
1
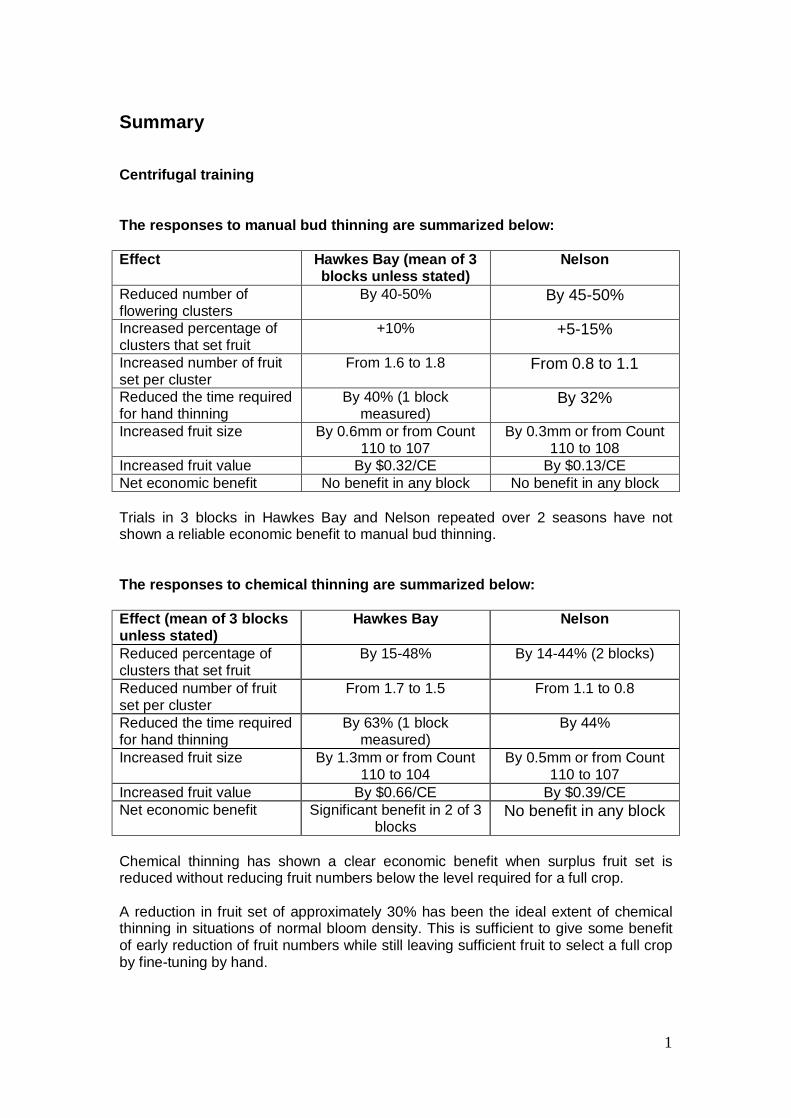
Summary Centrifugal training The responses to manual bud thinning are summarized below: Effect Hawkes Bay (mean of 3
blocks unless stated) Nelson
Reduced number of flowering clusters
By 40-50% By 45-50%
Increased percentage of clusters that set fruit
+10% +5-15%
Increased number of fruit set per cluster
From 1.6 to 1.8 From 0.8 to 1.1
Reduced the time required for hand thinning
By 40% (1 block measured)
By 32%
Increased fruit size By 0.6mm or from Count 110 to 107
By 0.3mm or from Count 110 to 108
Increased fruit value By $0.32/CE By $0.13/CE Net economic benefit No benefit in any block No benefit in any block Trials in 3 blocks in Hawkes Bay and Nelson repeated over 2 seasons have not shown a reliable economic benefit to manual bud thinning. The responses to chemical thinning are summarized below: Effect (mean of 3 blocks unless stated)
Hawkes Bay Nelson
Reduced percentage of clusters that set fruit
By 15-48% By 14-44% (2 blocks)
Reduced number of fruit set per cluster
From 1.7 to 1.5 From 1.1 to 0.8
Reduced the time required for hand thinning
By 63% (1 block measured)
By 44%
Increased fruit size By 1.3mm or from Count 110 to 104
By 0.5mm or from Count 110 to 107
Increased fruit value By $0.66/CE By $0.39/CE Net economic benefit Significant benefit in 2 of 3
blocks No benefit in any block
Chemical thinning has shown a clear economic benefit when surplus fruit set is reduced without reducing fruit numbers below the level required for a full crop. A reduction in fruit set of approximately 30% has been the ideal extent of chemical thinning in situations of normal bloom density. This is sufficient to give some benefit of early reduction of fruit numbers while still leaving sufficient fruit to select a full crop by fine-tuning by hand.
2
A 30% reduction in fruit set can be achieved with a number of products which can all of produce adequate responses. Results from different products used over recent years can be summarized as follows:
• ATS – usually gives some useful thinning response but tends to underthin in dry conditions and over thin in wet
• Ethrel – has usually thinned effectively. Some instances of overthinning during warm temperatures have been observed elsewhere.
• ANA – has thinned effectively each time it has been used in Hawkes Bay trials.
• BA – has thinned fruitlets effectively following high initial set at bloom. Value Curve Two season’s experiments in Hawkes Bay and Nelson has shown that the crop load of Jazz can be increased to moderately high levels before the yield of large sizes (60-90) greatly diminishes or small counts (135-180) greatly increases. The yield of medium counts (100-120) increased over the crop load levels where average size was Count 110-115. Orchard return nett of picking and packing was maximised at moderately high crop loads using the $29.50-21.50 price range. Hawkes Bay trial results show that full canopy blocks of M9 planted at 1740-1905 trees/ha can maximise return at crop loads of 300-350 fruit per tree. Nelson results suggest full canopy blocks of M9 planted at 2,800 trees/ha can maximise return at crop loads of about 210 fruit per tree. At these crop loads which allow for some safety with return bloom, an average size of approximately Count 110 is expected. This equates to a measure of 40 fruit per cubic metre of canopy which is a useful guide for developing plantings. The orchard gate return is only one perspective and the effect of increasing volumes to the market needs to be considered. Economic analysis of crop management strategies where smaller sizes are withheld from export sale may be worth considering to consider whether alternative strategies may increase the entire pool return. Seasonal Growth Curves Fruit measurement of the various crop load trees has been used to develop Jazz seasonal growth curves. These show small differences in fruit size in November can become large differences at harvest. It is difficult to thin based solely on size until mid January. The fruit growth curves are freely available to the industry for use as a management tool. Users would be able to easily track their own data in either a printable pdf file or a spreadsheet model format.. Users will be able to select which size counts they wish to display and add data for their own blocks to track progress and assess any need for size thinning.
3
Suggestions for next year No further work on centrifugal training is proposed as results are satisfactorily conclusive. Equally, chemical thinning knowledge is considered satisfactory and ongoing work may not be a priority at this stage. Validation of the seasonal growth and value curve results are suggested. This would entail monitoring fruit growth and final size distribution of crop loads in each region. Economic analysis of alternative crop management strategies is also worth pursuing. The current trial has investigated the maximum economic benefit to the individual grower based on various crop loads and using current pricing. Economic analysis of the combined value of Jazz to all growers and ENZA should be investigated should a majority of growers increase crop loads to the levels suggested in this trial.
4
Background The main objectives of this project are to find ways to:
1. maximise the production of large fruit and 2. determine what level of crop load maximises the value of the crop for the.
Chemical and manual bud thinning The first objective is centred around rapid reduction of excessive fruit set with chemical thinners and manual bud removal (centrifugal training). Both methods seek a positive fruit size response with early removal of inferior sites. Hawkes Bay In the 2008-9 Hawkes Bay Bay trials, the combination of bud and chemical thinning treatments was only successful in one instance (Powdrell), but significantly so. Another block (Mission) gave a successful chemical thinning result but no financial benefit to bud thinning. At Coldstream, a nil result occurred because bloom density varied among the treatments and masked any differences established by bud or chemical thinning treatments. We observed that fruit set was influenced by bloom density, regardless of whether it occured naturally or as a result of manual bud removal.. As bloom density reduced, the percentage of clusters setting fruit and number of fruit per cluster increased. We concluded that chemical and manual bud thinning appeared likely to be more effective (and necessary) when bloom density was high. Conversely, if bloom density was low or variable, neither manual bud thinning or chemical thinning was justifiable because neither were likely to be effective. We learned that the timing and technique were important for successful manual bud thinning. Timing was best delayed to a single and substantial treatment at ‘popcorn’ stage. The main priority for bud removal was the area near the end of 1 year shoots where auxiliary clusters are dense and tend to set at higher levels. In 2008-9 we found that well executed bud thinning decreased the number of flowering clusters and could result in increased fruit size. But where bud thinning was not aggressive enough or bloom was variable, no benefit occurred. Chemical thinning improved fruit size by early reduction of surplus fruit set but different practices gave different results. The Ethrel then ANA programme used at Mission gave the best result. Ethrel 460 mls/ha applied to the whole tree followed by ANA 120 mls/ha to the tops significantly reduced set while still leaving sufficient surplus numbers for fine tuning by hand. At Coldstream, a lower rate Ethrel then ANA programme (Ethrel 300 mls/ha to top half followed by, ANA 54 mls/ha applied to the top third) in a block of variable bloom density did not measurably thin at all. At Powdrell, ATS (3x) was ineffective over a relatively cool, dry bloom period. Aheavy initial set was then well thinned with BA 4 L/ha + Carbaryl 3 L/ha although the
5
delayed timing of the fruitlet thinner response incurred a cost in terms of fruit size and reduced return bloom. Nelson In 2008-09 the Easton M9 trees were the most consistent set of trees and chemical thinning and bud thinning both significantly reduced crop load in the early part of the season. This was especially the case on 1 yr wood where bud thinning reduced fruitlets (pre hand thin) on 1yr wood by 64%. This led a great portion of fruit being carried on terminal sites and to larger fruit for both bud thinning and chemical thinning treatments. The greatest fruit size was achieved where both bud thinning and chemical thinning was done. All blocks were commercially hand thinned to doubles on terminals and singles spaced elsewhere. This led to some over thinning on blocks where bud thinning had also been done. The significantly reduced crop load at Easton M9 led to lower returns per hectare compared with the non bud thinning treatments. However, the returns were higher on chemical thinned treatments compared with non chemically thinned treatments. The Easton 202 trees were more variable in their flower due to high crop loads the previous year. However, buds were reduced 20% by bud thinning and with an increased fruitset led to only slightly reduced crop loads compared to non bud thinned treatments. There were no significant differences in fruit size with chemical thinned or bud thinned treatments although there was a trend for larger fruit with both bud thinned and chemical thinned treatment. The Cederman M9 were the largest and most variable trees of any in Nelson but differences between the bud thinned treatments were still achieved in bud numbers by wood type. The greatest difference was an 80% reduction in 1 yr buds by bud thinning. In 2008-09 we found that there were no differences in crop load due to chemical thinning and there was no significant difference in fruit size at harvest between any treatments although there was a trend for larger fruit with both bud thinned and chemical thinned treatment. This block was severely over thinned by hand with crop load pre hand thinning averaging 27 fruitlets per TCA, while afterwards the average was 6.8 fruit/TCA. Due to the variability in this block it was replaced with an adjacent Jazz block, Moss M9 for the 2009-10 trial. For the 2009-10 trial work, manual bud thinning using the modified technique is given a full commercial test, while the chemical thinning programmes are those chosen by each grower. Crop load effects on fruit value In a first season of trial work in 2008-9, a wide range of crop loads was set by hand thinning on three blocks of 4-5 year old trees in Nelson and three of 7-8 year old trees in Hawkes Bay. In Hawkes Bay, results showed that crop load could be increased to moderately high levels before the yield of large sizes greatly diminished and small counts greatly

6
increased. The Nelson results were similar and even suggested that crop loads on young trees can be increased with less effect on fruit size than with older trees. When prices of $40 -19 for large to small sizes and picking and packing costs were applied, results suggested that value to Jazz stakeholders was maximised at higher yields and smaller average size than may have been expected ie in moderate to high crop loads where average count size range was 109-116. The trial was repeated to validate results in a second growing season and incorporate changes in the size/price matrix.
7
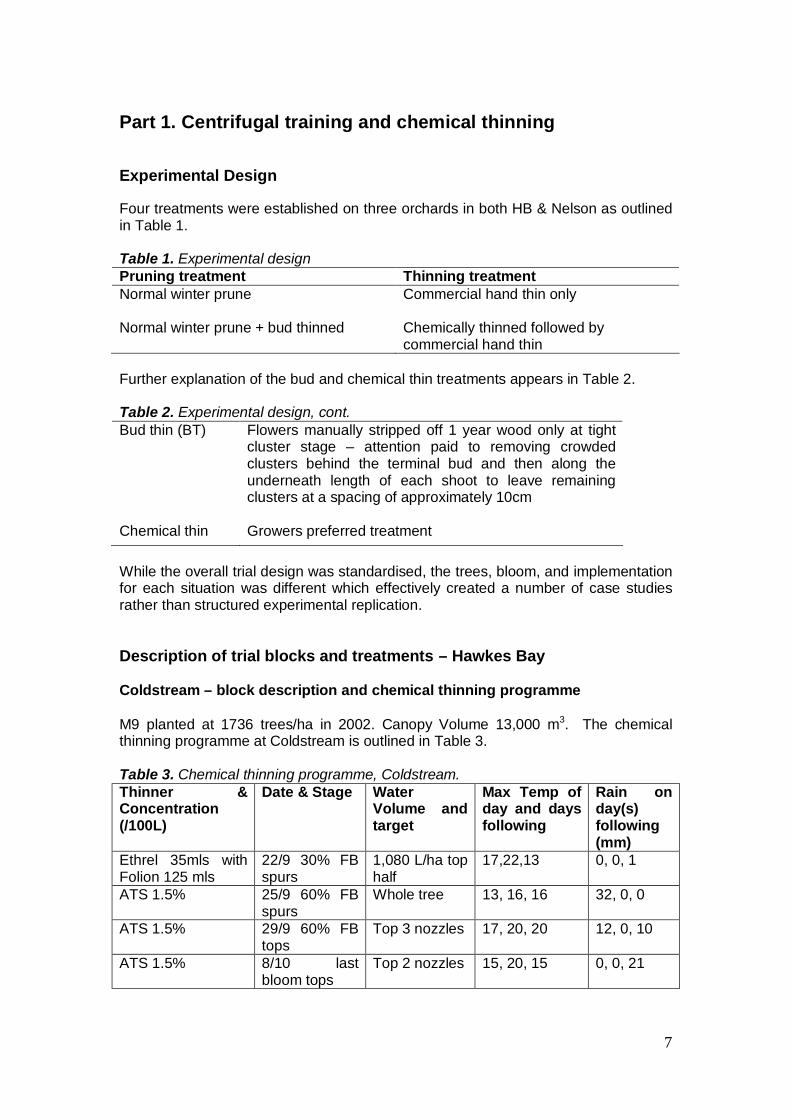
Part 1. Centrifugal training and chemical thinning Experimental Design Four treatments were established on three orchards in both HB & Nelson as outlined in Table 1. Table 1. Experimental design Pruning treatment Thinning treatment Normal winter prune Commercial hand thin only
Normal winter prune + bud thinned Chemically thinned followed by
commercial hand thin Further explanation of the bud and chemical thin treatments appears in Table 2. Table 2. Experimental design, cont. Bud thin (BT) Flowers manually stripped off 1 year wood only at tight
cluster stage – attention paid to removing crowded clusters behind the terminal bud and then along the underneath length of each shoot to leave remaining clusters at a spacing of approximately 10cm
Chemical thin Growers preferred treatment While the overall trial design was standardised, the trees, bloom, and implementation for each situation was different which effectively created a number of case studies rather than structured experimental replication. Description of trial blocks and treatments – Hawkes Bay Coldstream – block description and chemical thinning programme M9 planted at 1736 trees/ha in 2002. Canopy Volume 13,000 m3. The chemical thinning programme at Coldstream is outlined in Table 3. Table 3. Chemical thinning programme, Coldstream. Thinner & Concentration (/100L)
Date & Stage Water Volume and target
Max Temp of day and days following
Rain on day(s) following (mm)
Ethrel 35mls with Folion 125 mls
22/9 30% FB spurs
1,080 L/ha top half
17,22,13 0, 0, 1
ATS 1.5% 25/9 60% FB spurs
Whole tree 13, 16, 16 32, 0, 0
ATS 1.5% 29/9 60% FB tops
Top 3 nozzles 17, 20, 20 12, 0, 10
ATS 1.5% 8/10 last bloom tops
Top 2 nozzles 15, 20, 15 0, 0, 21
8
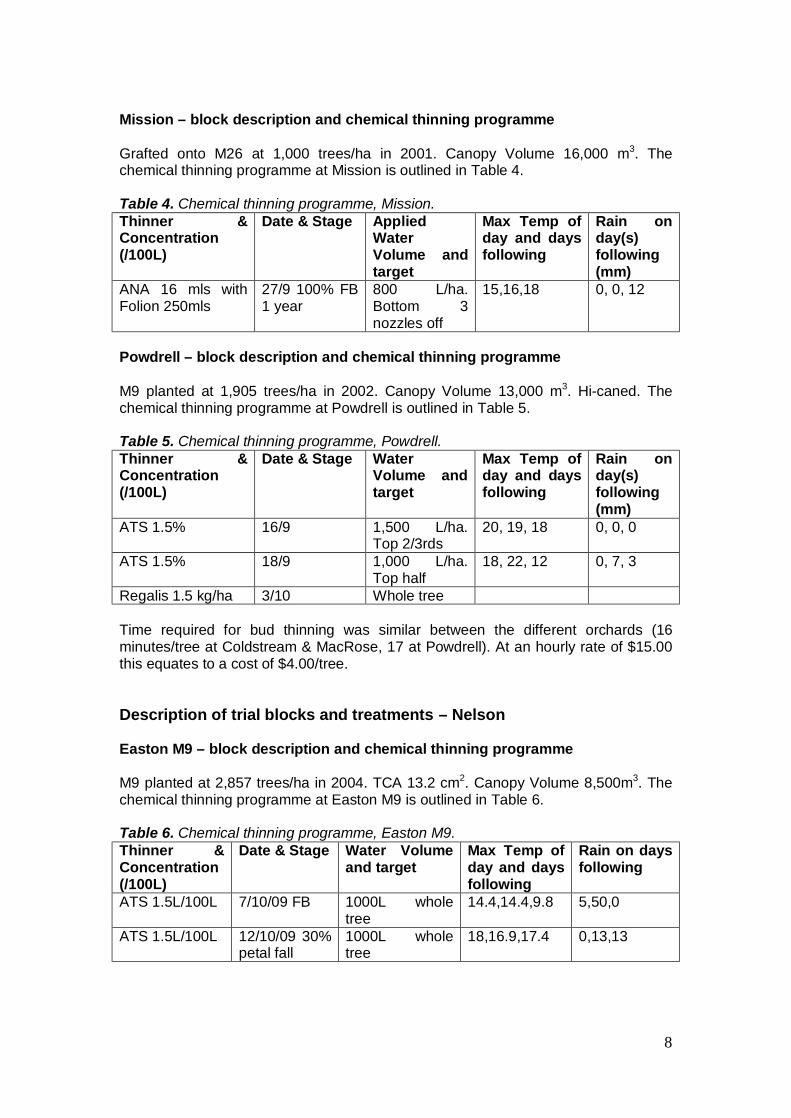
Mission – block description and chemical thinning programme Grafted onto M26 at 1,000 trees/ha in 2001. Canopy Volume 16,000 m3. The chemical thinning programme at Mission is outlined in Table 4. Table 4. Chemical thinning programme, Mission. Thinner & Concentration (/100L)
Date & Stage Applied Water Volume and target
Max Temp of day and days following
Rain on day(s) following (mm)
ANA 16 mls with Folion 250mls
27/9 100% FB 1 year
800 L/ha. Bottom 3 nozzles off
15,16,18 0, 0, 12
Powdrell – block description and chemical thinning programme M9 planted at 1,905 trees/ha in 2002. Canopy Volume 13,000 m3. Hi-caned. The chemical thinning programme at Powdrell is outlined in Table 5. Table 5. Chemical thinning programme, Powdrell. Thinner & Concentration (/100L)
Date & Stage Water Volume and target
Max Temp of day and days following
Rain on day(s) following (mm)
ATS 1.5% 16/9
1,500 L/ha. Top 2/3rds
20, 19, 18 0, 0, 0
ATS 1.5% 18/9
1,000 L/ha. Top half
18, 22, 12 0, 7, 3
Regalis 1.5 kg/ha 3/10 Whole tree Time required for bud thinning was similar between the different orchards (16 minutes/tree at Coldstream & MacRose, 17 at Powdrell). At an hourly rate of $15.00 this equates to a cost of $4.00/tree. Description of trial blocks and treatments – Nelson Easton M9 – block description and chemical thinning programme M9 planted at 2,857 trees/ha in 2004. TCA 13.2 cm2. Canopy Volume 8,500m3. The chemical thinning programme at Easton M9 is outlined in Table 6. Table 6. Chemical thinning programme, Easton M9. Thinner & Concentration (/100L)
Date & Stage Water Volume and target
Max Temp of day and days following
Rain on days following
ATS 1.5L/100L 7/10/09 FB 1000L whole tree
14.4,14.4,9.8 5,50,0
ATS 1.5L/100L 12/10/09 30% petal fall
1000L whole tree
18,16.9,17.4 0,13,13
9
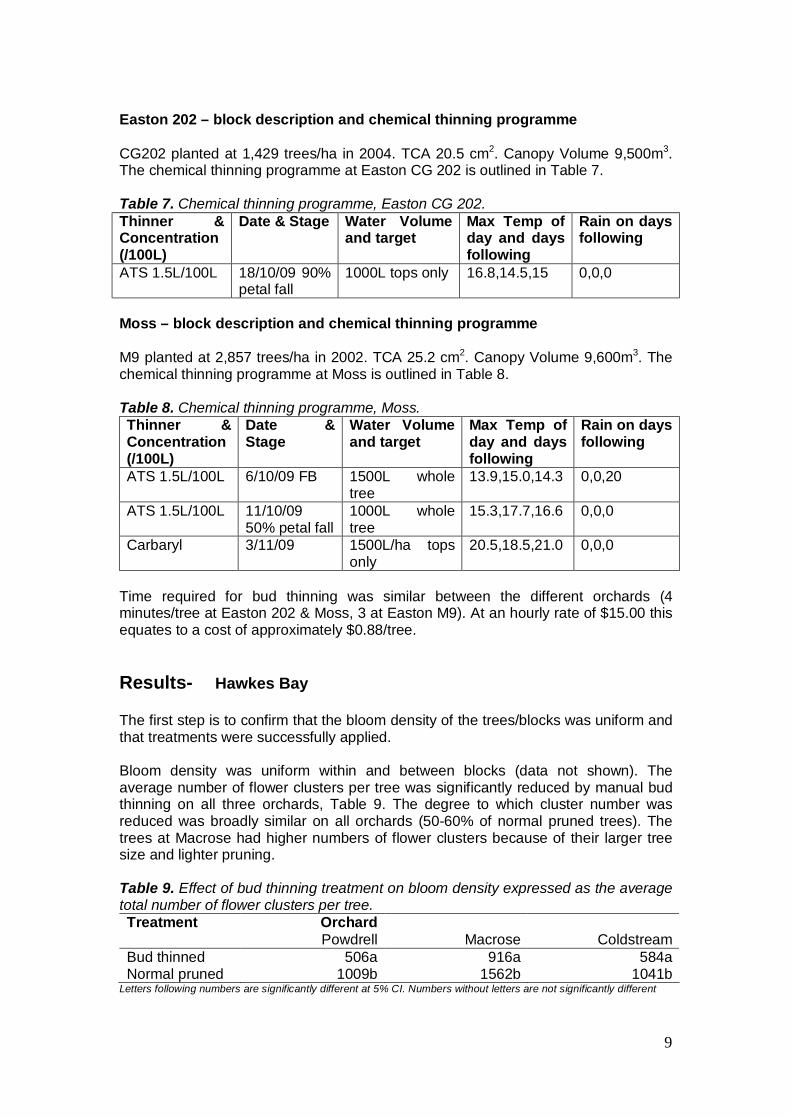
Easton 202 – block description and chemical thinning programme CG202 planted at 1,429 trees/ha in 2004. TCA 20.5 cm2. Canopy Volume 9,500m3. The chemical thinning programme at Easton CG 202 is outlined in Table 7. Table 7. Chemical thinning programme, Easton CG 202. Thinner & Concentration (/100L)
Date & Stage Water Volume and target
Max Temp of day and days following
Rain on days following
ATS 1.5L/100L 18/10/09 90% petal fall
1000L tops only 16.8,14.5,15 0,0,0
Moss – block description and chemical thinning programme M9 planted at 2,857 trees/ha in 2002. TCA 25.2 cm2. Canopy Volume 9,600m3. The chemical thinning programme at Moss is outlined in Table 8. Table 8. Chemical thinning programme, Moss. Thinner & Concentration (/100L)
Date & Stage
Water Volume and target
Max Temp of day and days following
Rain on days following
ATS 1.5L/100L 6/10/09 FB 1500L whole tree
13.9,15.0,14.3 0,0,20
ATS 1.5L/100L 11/10/09 50% petal fall
1000L whole tree
15.3,17.7,16.6 0,0,0
Carbaryl 3/11/09 1500L/ha tops only
20.5,18.5,21.0 0,0,0
Time required for bud thinning was similar between the different orchards (4 minutes/tree at Easton 202 & Moss, 3 at Easton M9). At an hourly rate of $15.00 this equates to a cost of approximately $0.88/tree. Results- Hawkes Bay The first step is to confirm that the bloom density of the trees/blocks was uniform and that treatments were successfully applied. Bloom density was uniform within and between blocks (data not shown). The average number of flower clusters per tree was significantly reduced by manual bud thinning on all three orchards, Table 9. The degree to which cluster number was reduced was broadly similar on all orchards (50-60% of normal pruned trees). The trees at Macrose had higher numbers of flower clusters because of their larger tree size and lighter pruning. Table 9. Effect of bud thinning treatment on bloom density expressed as the average total number of flower clusters per tree. Treatment Orchard Powdrell Macrose Coldstream Bud thinned 506a 916a 584a Normal pruned 1009b 1562b 1041b
Letters following numbers are significantly different at 5% CI. Numbers without letters are not significantly different
10
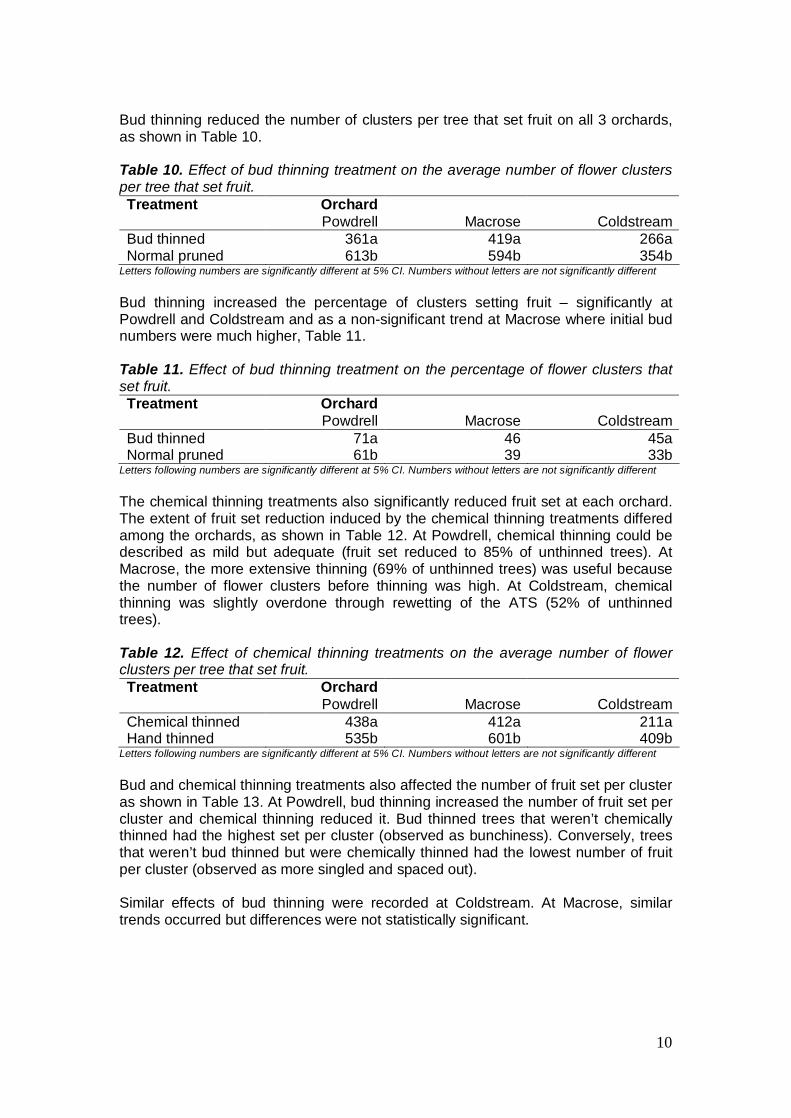
Bud thinning reduced the number of clusters per tree that set fruit on all 3 orchards, as shown in Table 10. Table 10. Effect of bud thinning treatment on the average number of flower clusters per tree that set fruit. Treatment Orchard Powdrell Macrose Coldstream Bud thinned 361a 419a 266a Normal pruned 613b 594b 354b
Letters following numbers are significantly different at 5% CI. Numbers without letters are not significantly different Bud thinning increased the percentage of clusters setting fruit – significantly at Powdrell and Coldstream and as a non-significant trend at Macrose where initial bud numbers were much higher, Table 11. Table 11. Effect of bud thinning treatment on the percentage of flower clusters that set fruit. Treatment Orchard Powdrell Macrose Coldstream Bud thinned 71a 46 45a Normal pruned 61b 39 33b
Letters following numbers are significantly different at 5% CI. Numbers without letters are not significantly different The chemical thinning treatments also significantly reduced fruit set at each orchard. The extent of fruit set reduction induced by the chemical thinning treatments differed among the orchards, as shown in Table 12. At Powdrell, chemical thinning could be described as mild but adequate (fruit set reduced to 85% of unthinned trees). At Macrose, the more extensive thinning (69% of unthinned trees) was useful because the number of flower clusters before thinning was high. At Coldstream, chemical thinning was slightly overdone through rewetting of the ATS (52% of unthinned trees). Table 12. Effect of chemical thinning treatments on the average number of flower clusters per tree that set fruit. Treatment Orchard Powdrell Macrose Coldstream Chemical thinned 438a 412a 211a Hand thinned 535b 601b 409b
Letters following numbers are significantly different at 5% CI. Numbers without letters are not significantly different Bud and chemical thinning treatments also affected the number of fruit set per cluster as shown in Table 13. At Powdrell, bud thinning increased the number of fruit set per cluster and chemical thinning reduced it. Bud thinned trees that weren’t chemically thinned had the highest set per cluster (observed as bunchiness). Conversely, trees that weren’t bud thinned but were chemically thinned had the lowest number of fruit per cluster (observed as more singled and spaced out). Similar effects of bud thinning were recorded at Coldstream. At Macrose, similar trends occurred but differences were not statistically significant.
11
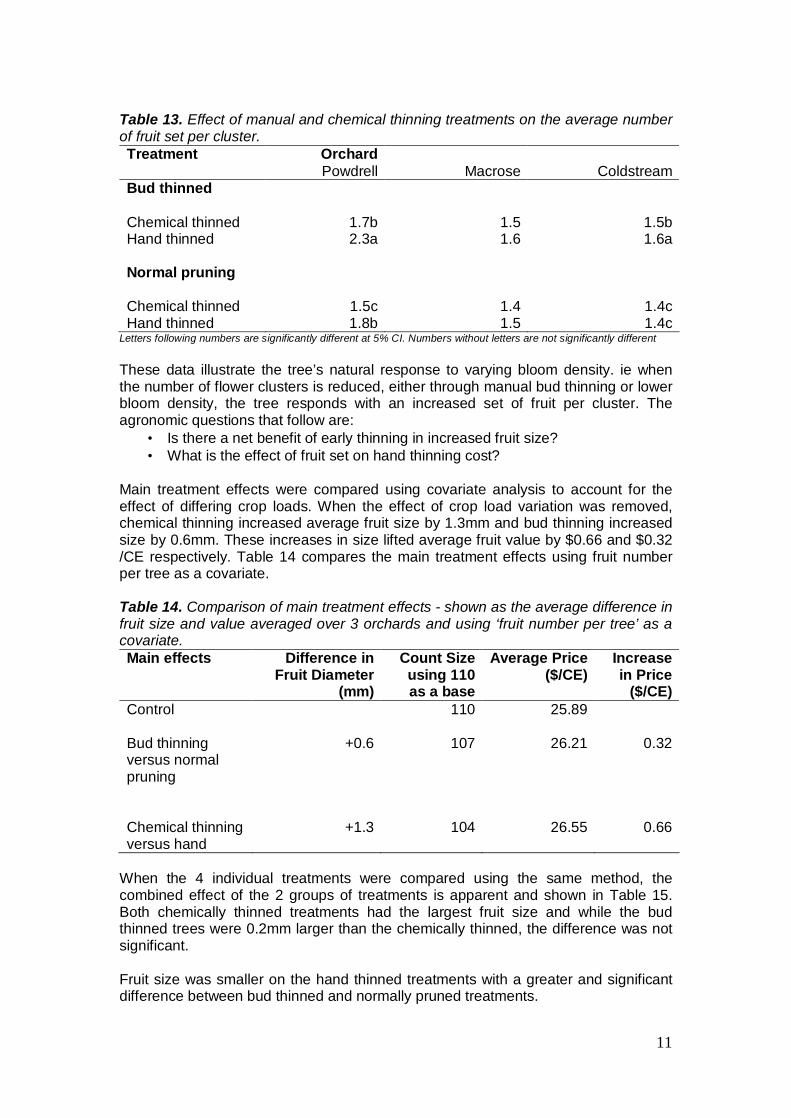
Table 13. Effect of manual and chemical thinning treatments on the average number of fruit set per cluster. Treatment Orchard Powdrell Macrose Coldstream Bud thinned Chemical thinned Hand thinned Normal pruning Chemical thinned
1.7b 2.3a
1.5c
1.5 1.6
1.4
1.5b 1.6a
1.4c
Hand thinned 1.8b 1.5 1.4c Letters following numbers are significantly different at 5% CI. Numbers without letters are not significantly different These data illustrate the tree’s natural response to varying bloom density. ie when the number of flower clusters is reduced, either through manual bud thinning or lower bloom density, the tree responds with an increased set of fruit per cluster. The agronomic questions that follow are:
• Is there a net benefit of early thinning in increased fruit size? • What is the effect of fruit set on hand thinning cost?
Main treatment effects were compared using covariate analysis to account for the effect of differing crop loads. When the effect of crop load variation was removed, chemical thinning increased average fruit size by 1.3mm and bud thinning increased size by 0.6mm. These increases in size lifted average fruit value by $0.66 and $0.32 /CE respectively. Table 14 compares the main treatment effects using fruit number per tree as a covariate. Table 14. Comparison of main treatment effects - shown as the average difference in fruit size and value averaged over 3 orchards and using ‘fruit number per tree’ as a covariate. Main effects Difference in
Fruit Diameter (mm)
Count Size using 110 as a base
Average Price ($/CE)
Increase in Price
($/CE) Control 110 25.89 Bud thinning versus normal pruning
+0.6 107 26.21 0.32
Chemical thinning versus hand
+1.3
104
26.55
0.66
When the 4 individual treatments were compared using the same method, the combined effect of the 2 groups of treatments is apparent and shown in Table 15. Both chemically thinned treatments had the largest fruit size and while the bud thinned trees were 0.2mm larger than the chemically thinned, the difference was not significant. Fruit size was smaller on the hand thinned treatments with a greater and significant difference between bud thinned and normally pruned treatments.
12
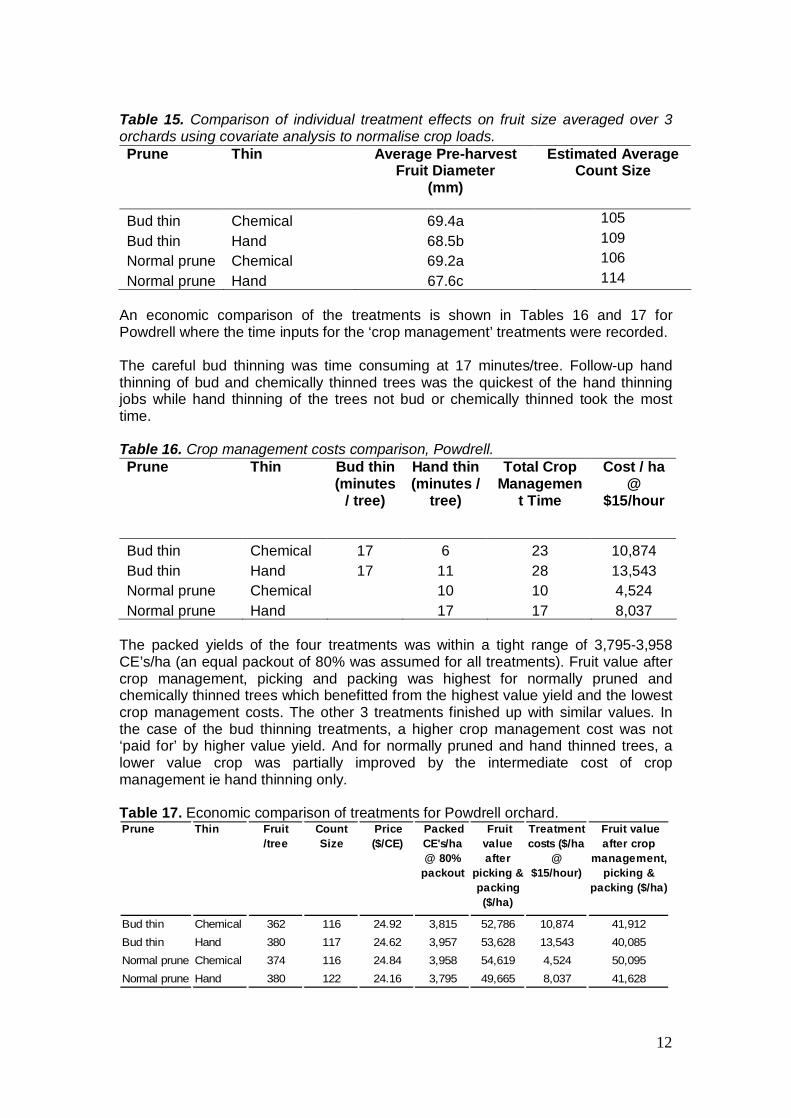
Table 15. Comparison of individual treatment effects on fruit size averaged over 3 orchards using covariate analysis to normalise crop loads. Prune Thin Average Pre-harvest
Fruit Diameter (mm)
Estimated Average Count Size
Bud thin Chemical 69.4a 105 Bud thin Hand 68.5b 109 Normal prune Chemical 69.2a 106 Normal prune Hand 67.6c 114
An economic comparison of the treatments is shown in Tables 16 and 17 for Powdrell where the time inputs for the ‘crop management’ treatments were recorded. The careful bud thinning was time consuming at 17 minutes/tree. Follow-up hand thinning of bud and chemically thinned trees was the quickest of the hand thinning jobs while hand thinning of the trees not bud or chemically thinned took the most time. Table 16. Crop management costs comparison, Powdrell. Prune Thin Bud thin
(minutes / tree)
Hand thin (minutes /
tree)
Total Crop Managemen
t Time
Cost / ha @
$15/hour
Bud thin Chemical 17 6 23 10,874 Bud thin Hand 17 11 28 13,543 Normal prune Chemical 10 10 4,524 Normal prune Hand 17 17 8,037
The packed yields of the four treatments was within a tight range of 3,795-3,958 CE’s/ha (an equal packout of 80% was assumed for all treatments). Fruit value after crop management, picking and packing was highest for normally pruned and chemically thinned trees which benefitted from the highest value yield and the lowest crop management costs. The other 3 treatments finished up with similar values. In the case of the bud thinning treatments, a higher crop management cost was not ‘paid for’ by higher value yield. And for normally pruned and hand thinned trees, a lower value crop was partially improved by the intermediate cost of crop management ie hand thinning only. Table 17. Economic comparison of treatments for Powdrell orchard. Prune Thin Fruit
/treeCount Size
Price ($/CE)
Packed CE's/ha @ 80%
packout
Fruit value after
picking & packing ($/ha)
Treatment costs ($/ha
@ $15/hour)
Fruit value after crop
management, picking &
packing ($/ha)
Bud thin Chemical 362 116 24.92 3,815 52,786 10,874 41,912Bud thin Hand 380 117 24.62 3,957 53,628 13,543 40,085Normal prune Chemical 374 116 24.84 3,958 54,619 4,524 50,095Normal prune Hand 380 122 24.16 3,795 49,665 8,037 41,628
13
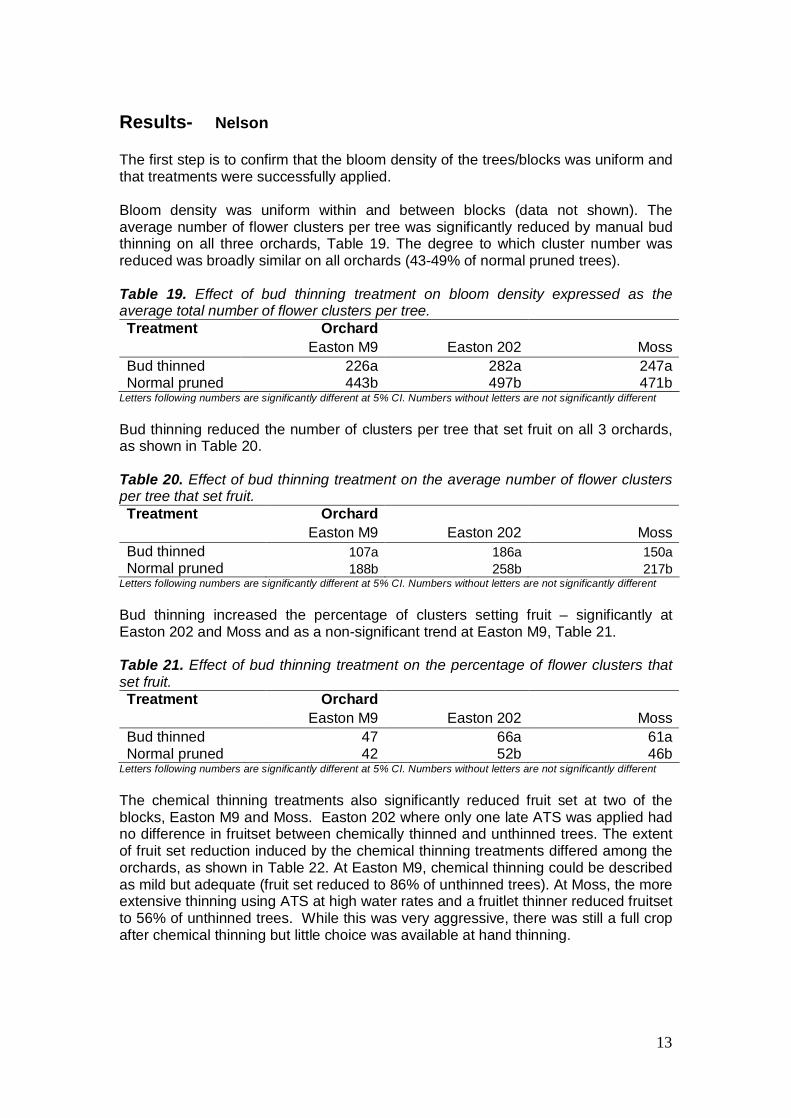
Results- Nelson The first step is to confirm that the bloom density of the trees/blocks was uniform and that treatments were successfully applied. Bloom density was uniform within and between blocks (data not shown). The average number of flower clusters per tree was significantly reduced by manual bud thinning on all three orchards, Table 19. The degree to which cluster number was reduced was broadly similar on all orchards (43-49% of normal pruned trees). Table 19. Effect of bud thinning treatment on bloom density expressed as the average total number of flower clusters per tree. Treatment Orchard Easton M9 Easton 202 Moss Bud thinned 226a 282a 247a Normal pruned 443b 497b 471b
Letters following numbers are significantly different at 5% CI. Numbers without letters are not significantly different Bud thinning reduced the number of clusters per tree that set fruit on all 3 orchards, as shown in Table 20. Table 20. Effect of bud thinning treatment on the average number of flower clusters per tree that set fruit. Treatment Orchard Easton M9 Easton 202 Moss Bud thinned 107a 186a 150a Normal pruned 188b 258b 217b
Letters following numbers are significantly different at 5% CI. Numbers without letters are not significantly different Bud thinning increased the percentage of clusters setting fruit – significantly at Easton 202 and Moss and as a non-significant trend at Easton M9, Table 21. Table 21. Effect of bud thinning treatment on the percentage of flower clusters that set fruit. Treatment Orchard Easton M9 Easton 202 Moss Bud thinned 47 66a 61a Normal pruned 42 52b 46b
Letters following numbers are significantly different at 5% CI. Numbers without letters are not significantly different The chemical thinning treatments also significantly reduced fruit set at two of the blocks, Easton M9 and Moss. Easton 202 where only one late ATS was applied had no difference in fruitset between chemically thinned and unthinned trees. The extent of fruit set reduction induced by the chemical thinning treatments differed among the orchards, as shown in Table 22. At Easton M9, chemical thinning could be described as mild but adequate (fruit set reduced to 86% of unthinned trees). At Moss, the more extensive thinning using ATS at high water rates and a fruitlet thinner reduced fruitset to 56% of unthinned trees. While this was very aggressive, there was still a full crop after chemical thinning but little choice was available at hand thinning.
14
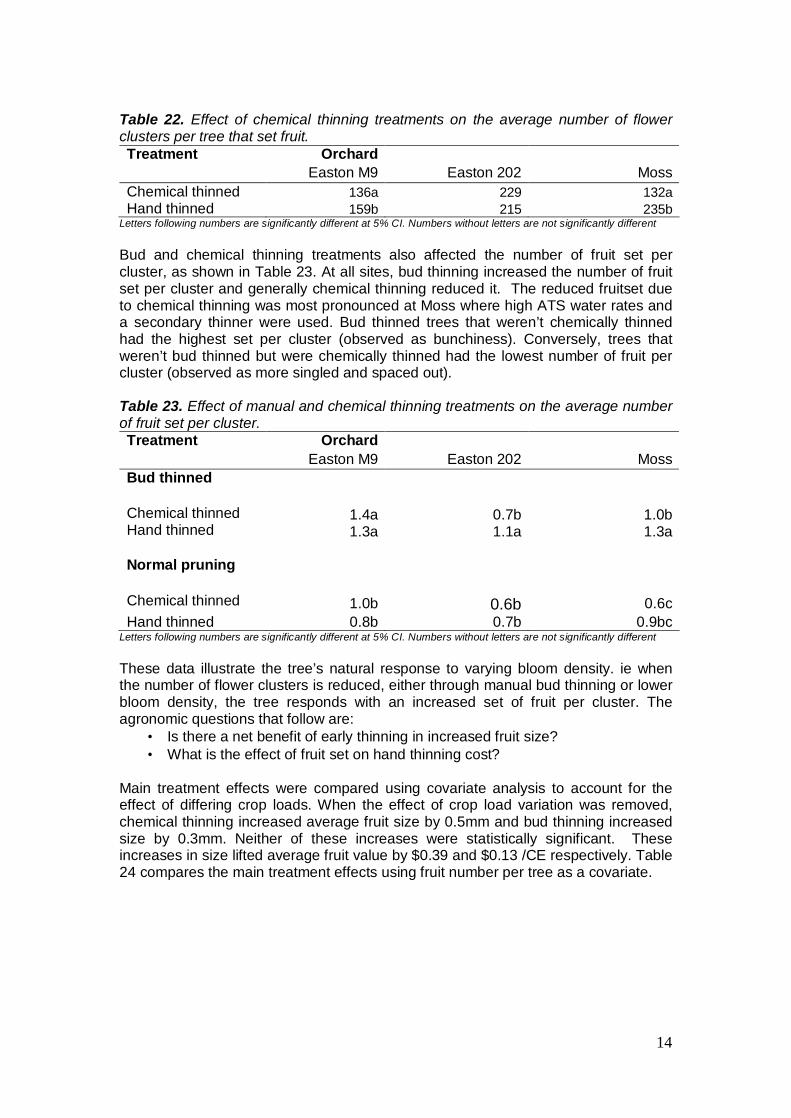
Table 22. Effect of chemical thinning treatments on the average number of flower clusters per tree that set fruit. Treatment Orchard Easton M9 Easton 202 Moss Chemical thinned 136a 229 132a Hand thinned 159b 215 235b
Letters following numbers are significantly different at 5% CI. Numbers without letters are not significantly different Bud and chemical thinning treatments also affected the number of fruit set per cluster, as shown in Table 23. At all sites, bud thinning increased the number of fruit set per cluster and generally chemical thinning reduced it. The reduced fruitset due to chemical thinning was most pronounced at Moss where high ATS water rates and a secondary thinner were used. Bud thinned trees that weren’t chemically thinned had the highest set per cluster (observed as bunchiness). Conversely, trees that weren’t bud thinned but were chemically thinned had the lowest number of fruit per cluster (observed as more singled and spaced out). Table 23. Effect of manual and chemical thinning treatments on the average number of fruit set per cluster. Treatment Orchard Easton M9 Easton 202 Moss Bud thinned Chemical thinned Hand thinned Normal pruning Chemical thinned
1.4a 1.3a
1.0b
0.7b 1.1a
0.6b
1.0b 1.3a
0.6c
Hand thinned 0.8b 0.7b 0.9bc Letters following numbers are significantly different at 5% CI. Numbers without letters are not significantly different These data illustrate the tree’s natural response to varying bloom density. ie when the number of flower clusters is reduced, either through manual bud thinning or lower bloom density, the tree responds with an increased set of fruit per cluster. The agronomic questions that follow are:
• Is there a net benefit of early thinning in increased fruit size? • What is the effect of fruit set on hand thinning cost?
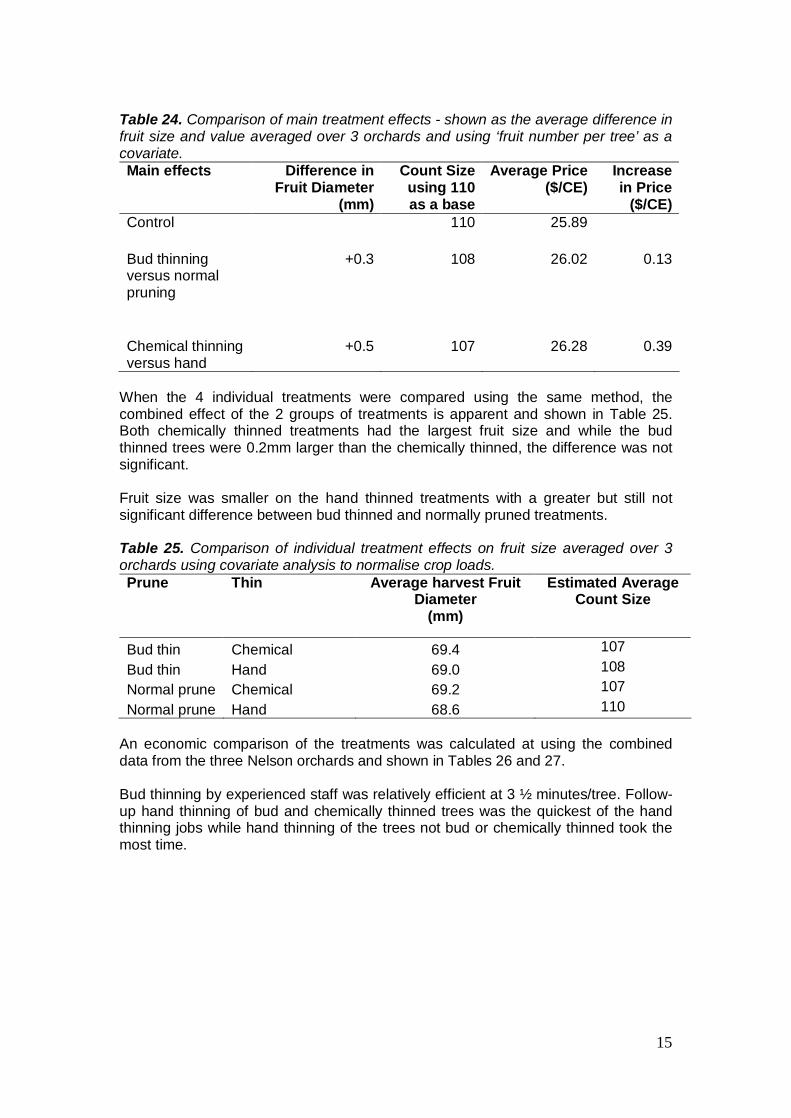
Main treatment effects were compared using covariate analysis to account for the effect of differing crop loads. When the effect of crop load variation was removed, chemical thinning increased average fruit size by 0.5mm and bud thinning increased size by 0.3mm. Neither of these increases were statistically significant. These increases in size lifted average fruit value by $0.39 and $0.13 /CE respectively. Table 24 compares the main treatment effects using fruit number per tree as a covariate.
15
Table 24. Comparison of main treatment effects - shown as the average difference in fruit size and value averaged over 3 orchards and using ‘fruit number per tree’ as a covariate. Main effects Difference in
Fruit Diameter (mm)
Count Size using 110 as a base
Average Price ($/CE)
Increase in Price
($/CE) Control 110 25.89 Bud thinning versus normal pruning
+0.3 108 26.02 0.13
Chemical thinning versus hand
+0.5
107
26.28
0.39
When the 4 individual treatments were compared using the same method, the combined effect of the 2 groups of treatments is apparent and shown in Table 25. Both chemically thinned treatments had the largest fruit size and while the bud thinned trees were 0.2mm larger than the chemically thinned, the difference was not significant. Fruit size was smaller on the hand thinned treatments with a greater but still not significant difference between bud thinned and normally pruned treatments. Table 25. Comparison of individual treatment effects on fruit size averaged over 3 orchards using covariate analysis to normalise crop loads. Prune Thin Average harvest Fruit
Diameter (mm)
Estimated Average Count Size
Bud thin Chemical 69.4 107 Bud thin Hand 69.0 108 Normal prune Chemical 69.2 107 Normal prune Hand 68.6 110
An economic comparison of the treatments was calculated at using the combined data from the three Nelson orchards and shown in Tables 26 and 27. Bud thinning by experienced staff was relatively efficient at 3 ½ minutes/tree. Follow-up hand thinning of bud and chemically thinned trees was the quickest of the hand thinning jobs while hand thinning of the trees not bud or chemically thinned took the most time.
16
Table 26. Crop management costs comparison, Nelson. Prune Thin Bud thin
(minutes / tree)
Hand thin minutes /
tree)
Total Crop Management
Time
Cost / ha @
$15/hour
Bud thin Chemical 3.5 2.3 5.8 $3,107 Bud thin Hand 3.5 5.1 8.6 $4,607 Normal prune Chemical 4.2 4.2 $2,250 Normal prune Hand 6.6 6.6 $3,536
Fruit value after crop management, picking and packing was highest for normally pruned and hand thinned trees. This is due to this treatment having the highest yield. Table 27. Economic comparison of treatments for Nelson orchards. Prune Thin Fruit
/tree Count Size
Price ($/CE)
Packed CE's/ha @ 85%
packout
Fruit value after
picking & packing ($/ha)
Treatment costs ($/ha
@ $15/hour)
Fruit value after crop
management, picking &
packing ($/ha)
Bud thin Chemical 114 107 26.14 1,719 $27,192 $3,107 $24,085Bud thin Hand 139 108 26.43 2,141 $34,481 $4,607 $29,874Normal prune Chemical 158 107 25.9 2,356 $36,696 $2,250 $34,446Normal prune Hand 171 110 25.98 2,599 $40,673 $3,536 $37,138 Table 28 shows all three Nelson orchards were affected to varying extents by post hand thinning fruit drop. At hand thinning crop loads were set at either 8 or 10 fruit per TCA depending on block. Fruit numbers were confirmed by a November fruit count. Fruit counts just prior to harvest revealed some blocks were affected by a post hand thinning fruit drop. Blocks that had received chemical thinning treatments showed the greatest post thinning fruit drop, especially Moss where a fruitlet thinner was used and Easton 202 where a late bloom thinner was applied. Table 28. Post thin fruit drop. Prune Thin Nov fruit
count Mar fruit
count Post thin fruit
drop Bud thin Chemical 183 114 70 Bud thin Hand 163 139 23 Normal prune Chemical 197 158 39 Normal prune Hand 175 171 4
17
Discussion The manual bud thinning treatments have not delivered a significant economic benefit in the 2009-10 experiments in either region. While bud thinning increased fruit size, there was not a ‘return’ on the cost of carrying out the bud thinning task. The increased fruit size through bud thinning and chemical thinning was a significant difference in Hawkes Bay and a non significant trend in Nelson. The treatment blocks in Nelson experienced a post hand thinning fruit drop and this was greatest on the chemical thinned blocks. This resulted in lower than targeted yields on the bud thinned blocks. The increased ‘bunchiness’ of fruit set in both regions, which is a response to the reduced number of flower clusters and greater fruit set, is an issue with bud thinning although follow-up chemical thinning of bud thinned trees mostly overcomes this effect. Chemical thinning has shown a clear economic benefit when surplus fruit set is reduced without reducing fruit numbers below the level required for a full crop. A reduction in fruit set of approximately 30% has been the ideal extent of chemical thinning in situations of normal bloom density. This is sufficient to give some benefit of early reduction of fruit numbers while still leaving sufficient fruit to select a full crop by fine-tuning by hand. A 30% reduction in fruit set can be achieved with a number of products which can all produce adequate responses. Results from different products used over recent years can be summarized as follows:
• ATS – usually gives some useful thinning response but tends to underthin in dry conditions and over thin in wet
• Ethrel – has usually thinned effectively. Some instances of overthinning during warm temperatures have been observed elsewhere.
• ANA – has thinned effectively each time it has been used in trials. • BA – has thinned fruitlets effectively following high initial set at bloom but
ongoing fruit drop can further delay hand thinning. The next section of this report explores the economic benefit of various crop load and fruit size combinations.
18
Part 2. Value curve A 2008-9 experiment where a wide range of crop loads was established by hand thinning trees immediately upon completion of fruitlet drop was repeated in 2009-10. The objective of this work is to quantify the effect of crop load on fruit size of Jazz. Experimental Design On 3 orchards, 10 representative trees what had not been chemically thinned were selected and 2 trees each were hand thinned to the 5 regimes outlined in Table 29. Table 29. Hand thinning regimes for various crop loads. Crop Load Description Very light Only singles on best sites with very wide (20-25cm) spacing. No
axillaries Light Singles on best sites with wide (10-15cm) spacing. No axillaries Moderate Doubles on best sites otherwise singled & spaced at 10cm. Axillaries
included Heavy Doubles on all sites otherwise (incl axillaries) spaced 5-10cm.
Axillaries included Very heavy Doubles on all sites at 5cm spacing. Axillaries included
‘Best’ sites were defined as fruit borne on spurs and terminals with bourse shoot growth of at least 10 cm (fist width). On the ‘very light’ cropping trees fruit was only carried in singles on the best sites. As loads increased, fruit number per cluster was increased to doubles, spacing reduced and axillaries (fruit on 1 year wood) included. Fruit number was counted on all 30 trees in late January. Fruit diameters were measured on 25 systematically selected fruit/tree at fortnightly intervals from the completion of fruit drop (4-8 December) until immediately before harvest. Diameters were converted to weights with an allowance for fruit growth during harvest and apportioned into count sizes. Fruit value (for both season’s data) was then calculated using the price schedule shown in Table 30. Table 30. Jazz pricing.
Count Size Band Price ($NZ/CE)
60-90 29.50 100-120 25.30 135-180 21.50
Variable harvest ($42/bin), packing (HB $58/bin, NN $65) and packaging and FAS costs ($5.40/CE) were deducted. In Hawkes Bay a pickout of 80% and packout of 80% across the entire crop load range was assumed, for Nelson a pickout of 90% and packout of 85% was used.
19
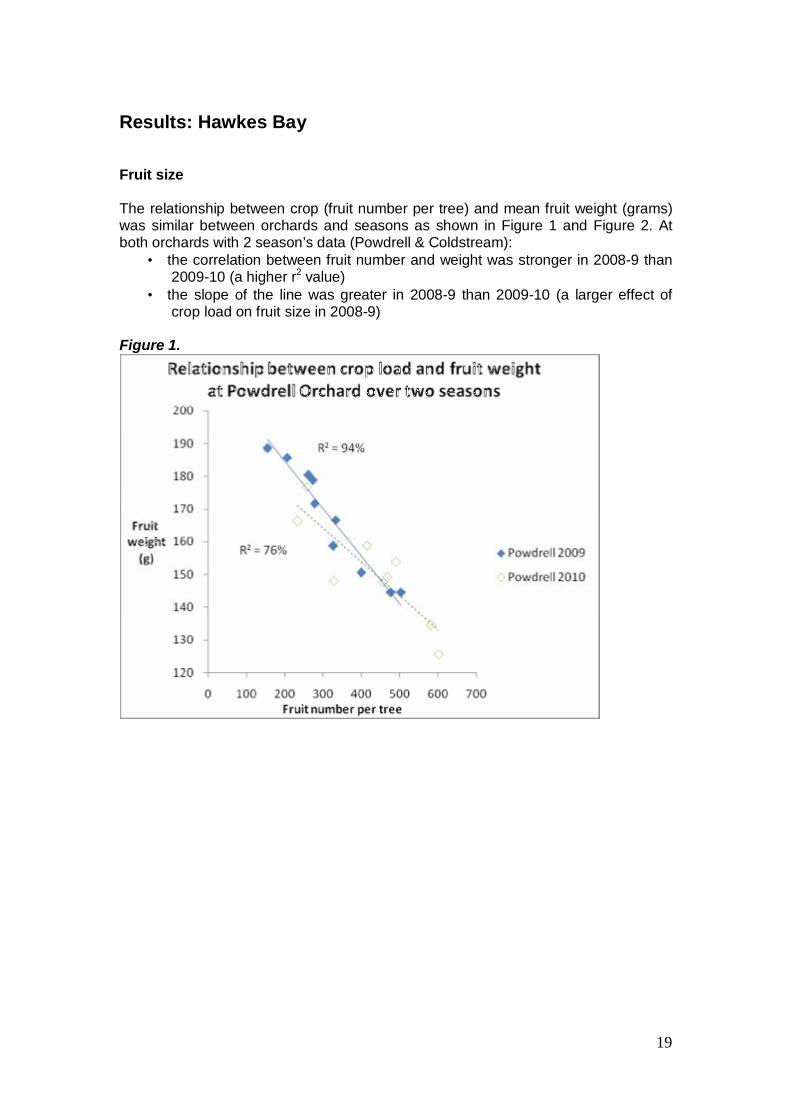
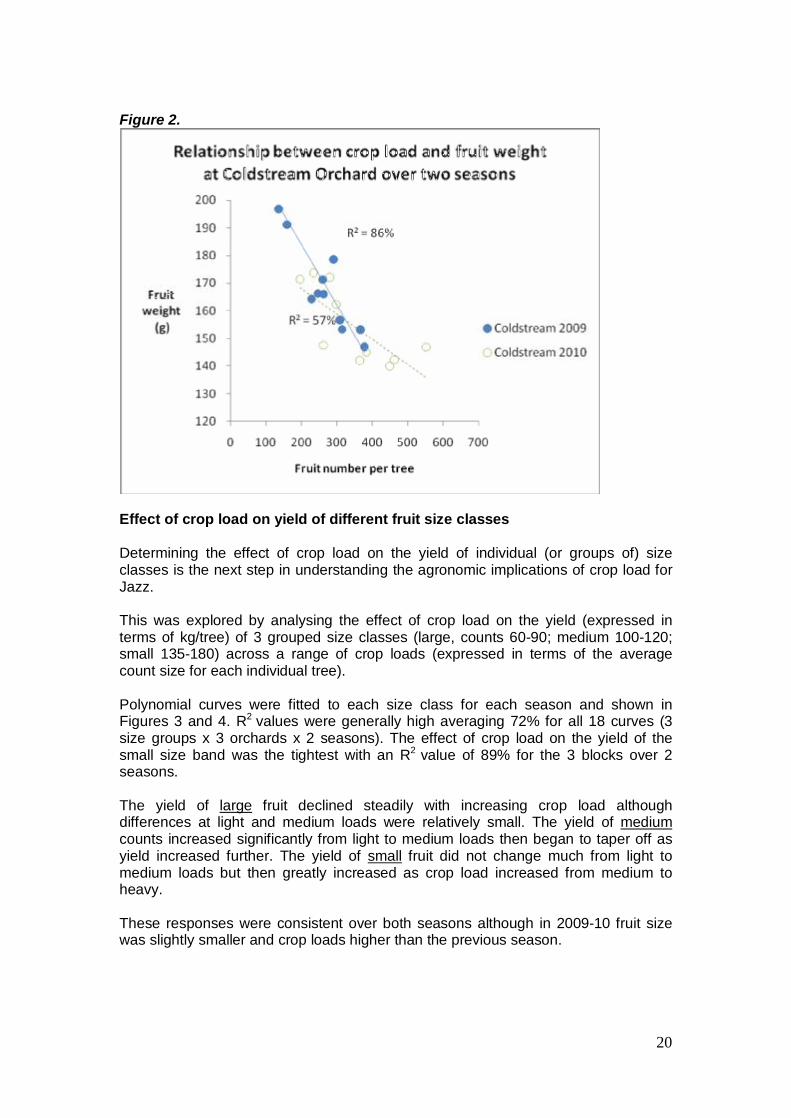
Results: Hawkes Bay Fruit size The relationship between crop (fruit number per tree) and mean fruit weight (grams) was similar between orchards and seasons as shown in Figure 1 and Figure 2. At both orchards with 2 season’s data (Powdrell & Coldstream):
• the correlation between fruit number and weight was stronger in 2008-9 than 2009-10 (a higher r2 value)
• the slope of the line was greater in 2008-9 than 2009-10 (a larger effect of crop load on fruit size in 2008-9)
Figure 1.
20
Figure 2.
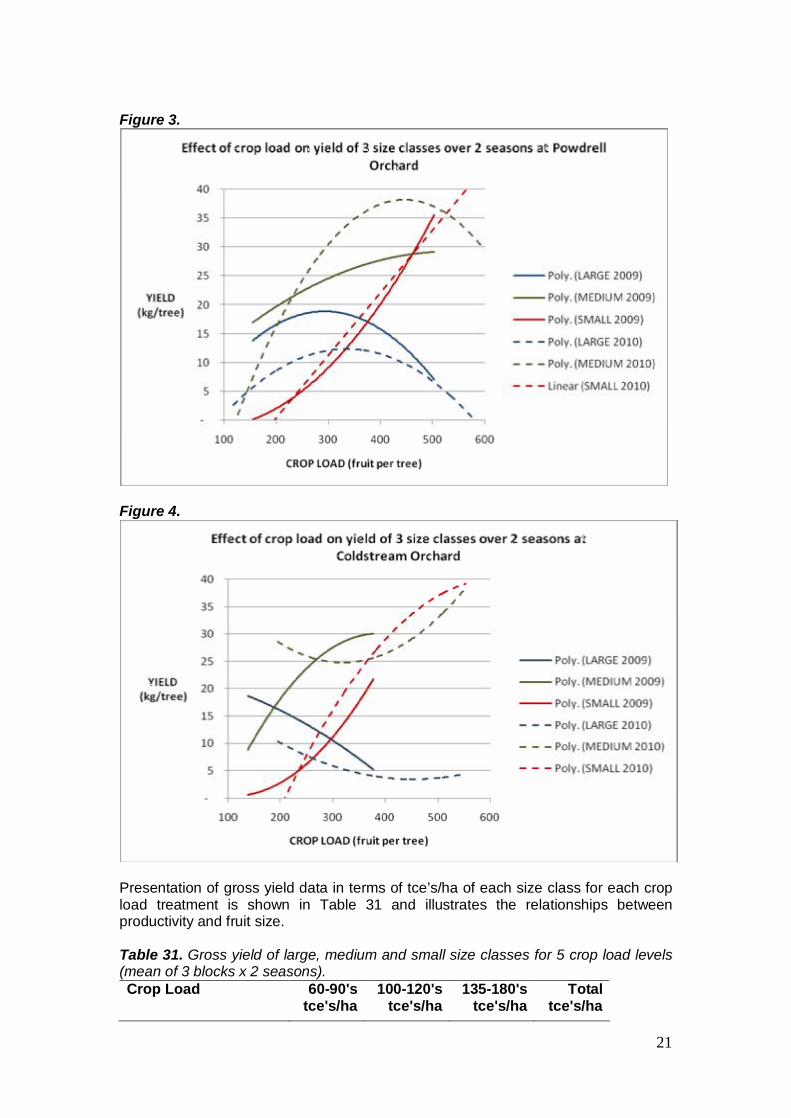
Effect of crop load on yield of different fruit size classes Determining the effect of crop load on the yield of individual (or groups of) size classes is the next step in understanding the agronomic implications of crop load for Jazz. This was explored by analysing the effect of crop load on the yield (expressed in terms of kg/tree) of 3 grouped size classes (large, counts 60-90; medium 100-120; small 135-180) across a range of crop loads (expressed in terms of the average count size for each individual tree). Polynomial curves were fitted to each size class for each season and shown in Figures 3 and 4. R2 values were generally high averaging 72% for all 18 curves (3 size groups x 3 orchards x 2 seasons). The effect of crop load on the yield of the small size band was the tightest with an R2 value of 89% for the 3 blocks over 2 seasons. The yield of large fruit declined steadily with increasing crop load although differences at light and medium loads were relatively small. The yield of medium counts increased significantly from light to medium loads then began to taper off as yield increased further. The yield of small fruit did not change much from light to medium loads but then greatly increased as crop load increased from medium to heavy. These responses were consistent over both seasons although in 2009-10 fruit size was slightly smaller and crop loads higher than the previous season.
21
Figure 3.
Figure 4.
Presentation of gross yield data in terms of tce’s/ha of each size class for each crop load treatment is shown in Table 31 and illustrates the relationships between productivity and fruit size. Table 31. Gross yield of large, medium and small size classes for 5 crop load levels (mean of 3 blocks x 2 seasons). Crop Load 60-90's
tce's/ha 100-120's
tce's/ha 135-180's
tce's/ha Total
tce's/ha
22
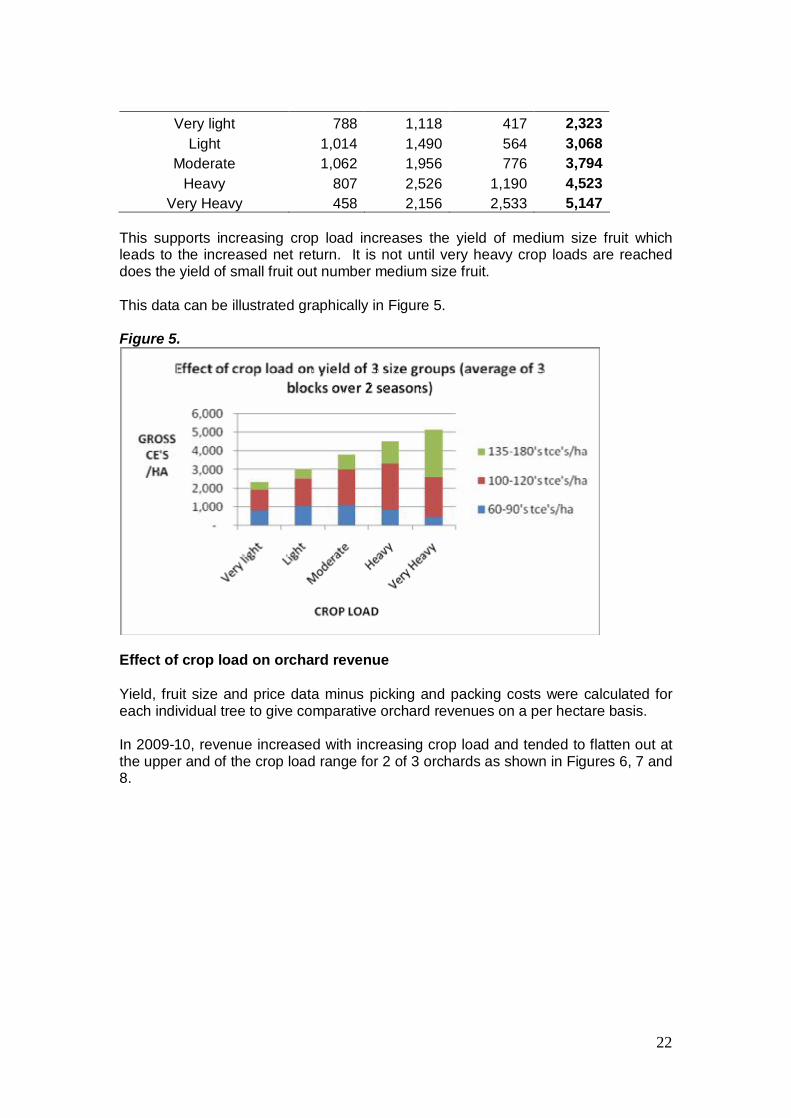
Very light 788 1,118 417 2,323 Light 1,014 1,490 564 3,068
Moderate 1,062 1,956 776 3,794 Heavy 807 2,526 1,190 4,523
Very Heavy 458 2,156 2,533 5,147 This supports increasing crop load increases the yield of medium size fruit which leads to the increased net return. It is not until very heavy crop loads are reached does the yield of small fruit out number medium size fruit. This data can be illustrated graphically in Figure 5. Figure 5.
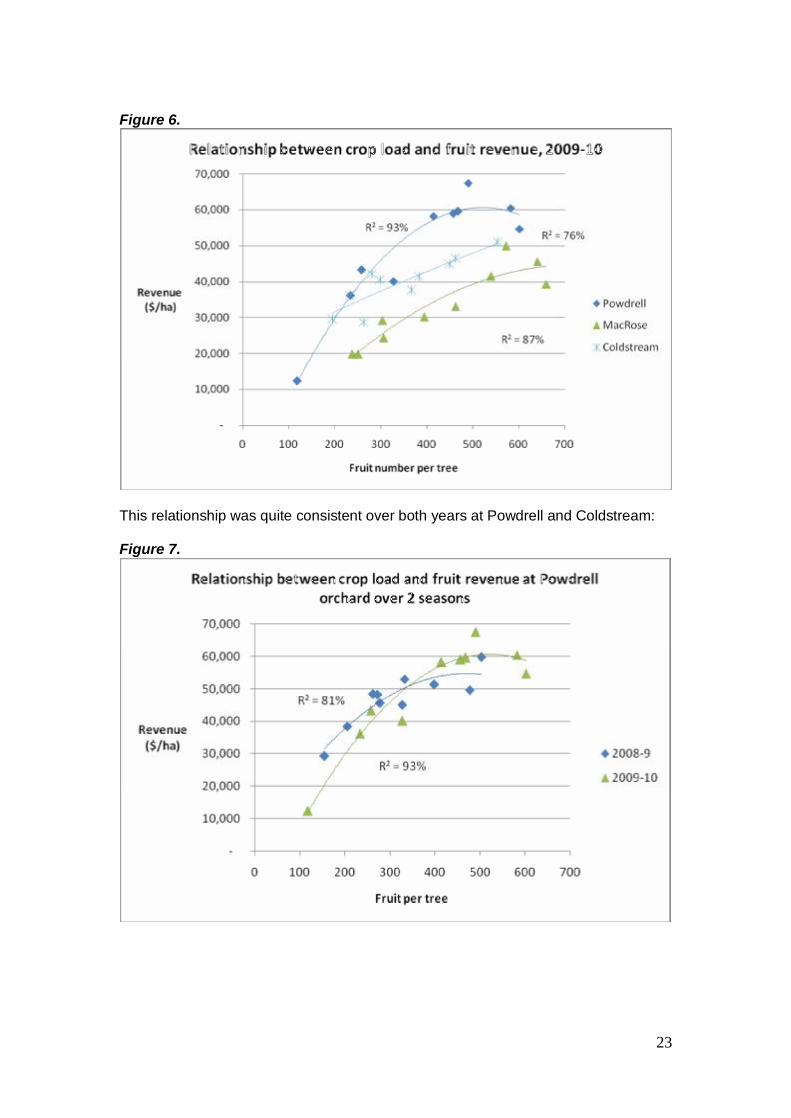
Effect of crop load on orchard revenue Yield, fruit size and price data minus picking and packing costs were calculated for each individual tree to give comparative orchard revenues on a per hectare basis. In 2009-10, revenue increased with increasing crop load and tended to flatten out at the upper and of the crop load range for 2 of 3 orchards as shown in Figures 6, 7 and 8.
23
Figure 6.
This relationship was quite consistent over both years at Powdrell and Coldstream: Figure 7.
24
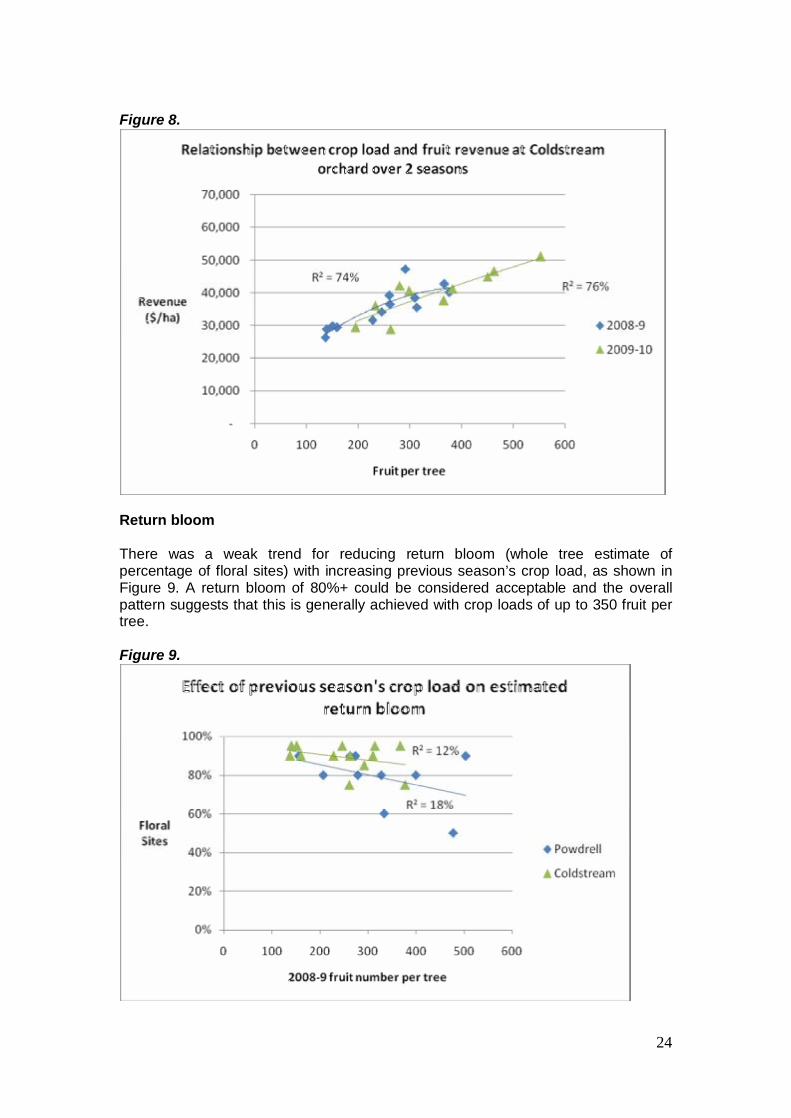
Figure 8.
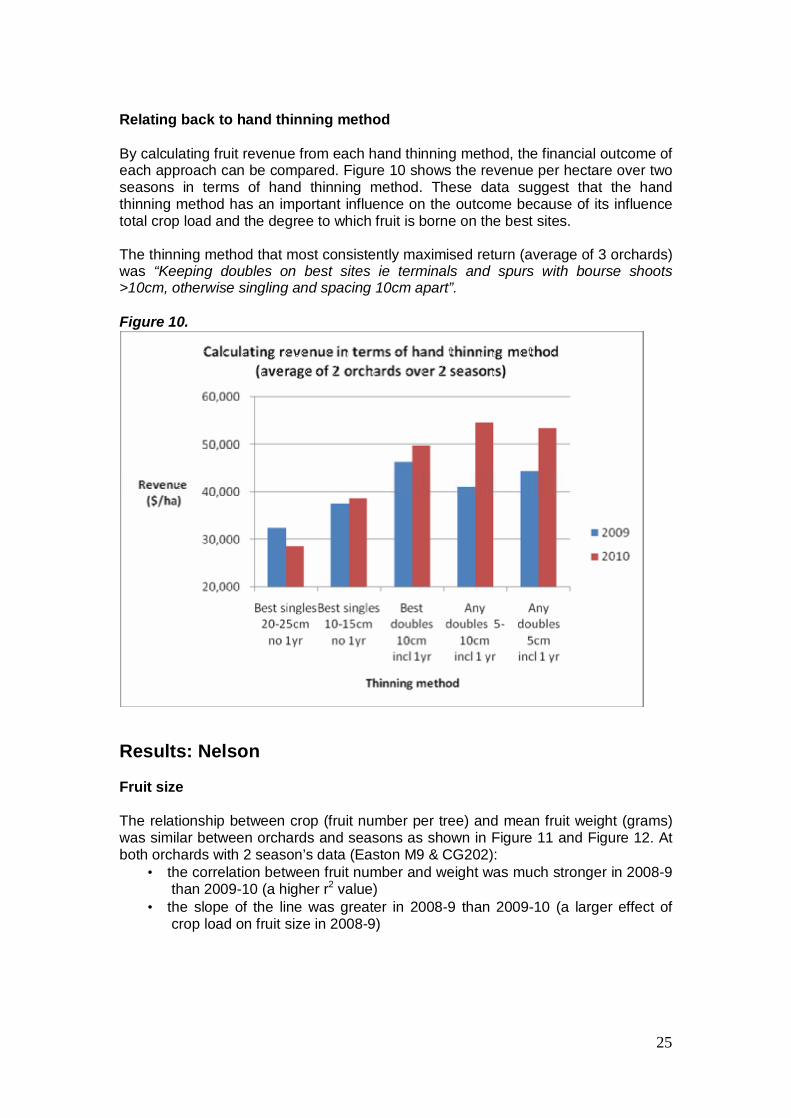
Return bloom There was a weak trend for reducing return bloom (whole tree estimate of percentage of floral sites) with increasing previous season’s crop load, as shown in Figure 9. A return bloom of 80%+ could be considered acceptable and the overall pattern suggests that this is generally achieved with crop loads of up to 350 fruit per tree. Figure 9.
25
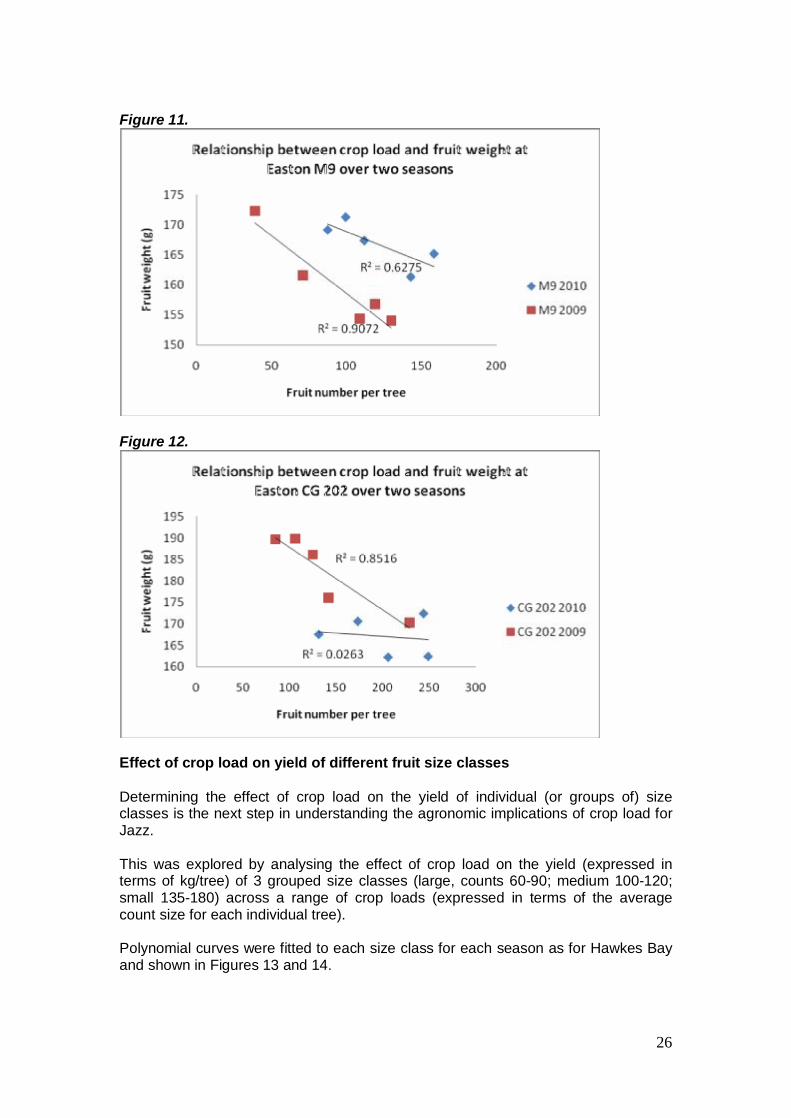
Relating back to hand thinning method By calculating fruit revenue from each hand thinning method, the financial outcome of each approach can be compared. Figure 10 shows the revenue per hectare over two seasons in terms of hand thinning method. These data suggest that the hand thinning method has an important influence on the outcome because of its influence total crop load and the degree to which fruit is borne on the best sites. The thinning method that most consistently maximised return (average of 3 orchards) was “Keeping doubles on best sites ie terminals and spurs with bourse shoots >10cm, otherwise singling and spacing 10cm apart”. Figure 10.
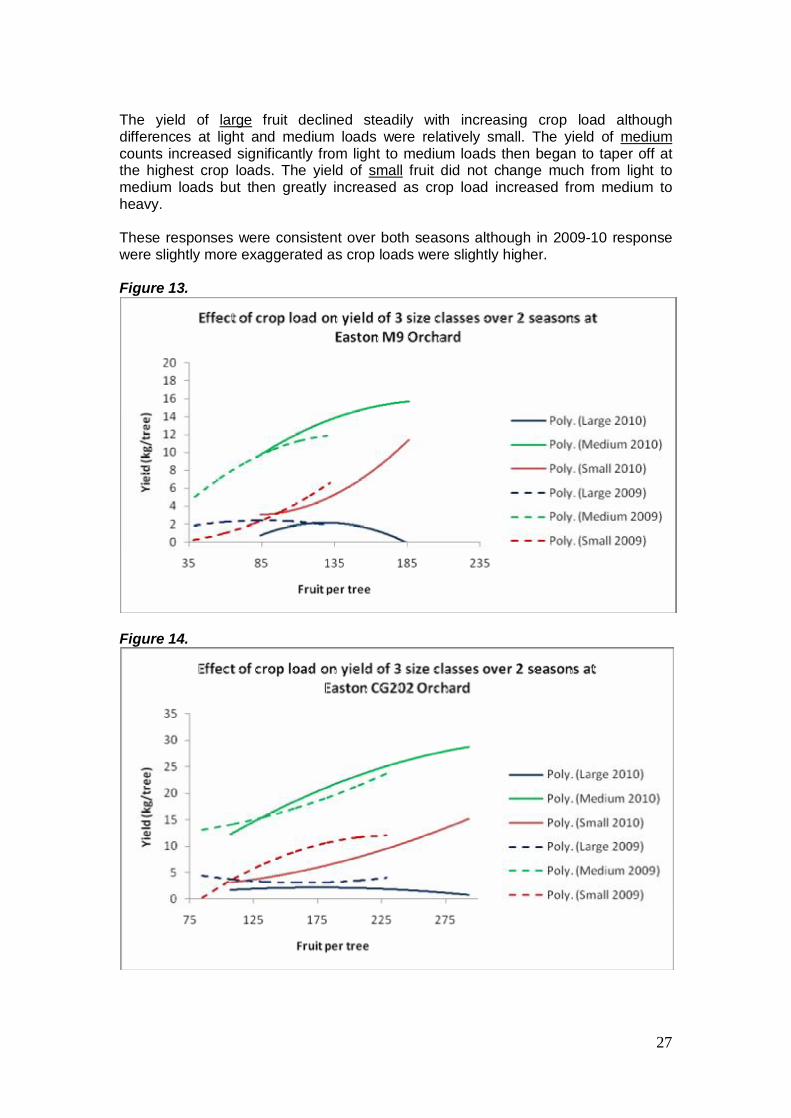
Results: Nelson Fruit size The relationship between crop (fruit number per tree) and mean fruit weight (grams) was similar between orchards and seasons as shown in Figure 11 and Figure 12. At both orchards with 2 season’s data (Easton M9 & CG202):
• the correlation between fruit number and weight was much stronger in 2008-9 than 2009-10 (a higher r2 value)
• the slope of the line was greater in 2008-9 than 2009-10 (a larger effect of crop load on fruit size in 2008-9)
26
Figure 11.
Figure 12.
Effect of crop load on yield of different fruit size classes Determining the effect of crop load on the yield of individual (or groups of) size classes is the next step in understanding the agronomic implications of crop load for Jazz. This was explored by analysing the effect of crop load on the yield (expressed in terms of kg/tree) of 3 grouped size classes (large, counts 60-90; medium 100-120; small 135-180) across a range of crop loads (expressed in terms of the average count size for each individual tree). Polynomial curves were fitted to each size class for each season as for Hawkes Bay and shown in Figures 13 and 14.
27
The yield of large fruit declined steadily with increasing crop load although differences at light and medium loads were relatively small. The yield of medium counts increased significantly from light to medium loads then began to taper off at the highest crop loads. The yield of small fruit did not change much from light to medium loads but then greatly increased as crop load increased from medium to heavy. These responses were consistent over both seasons although in 2009-10 response were slightly more exaggerated as crop loads were slightly higher. Figure 13.
Figure 14.
28
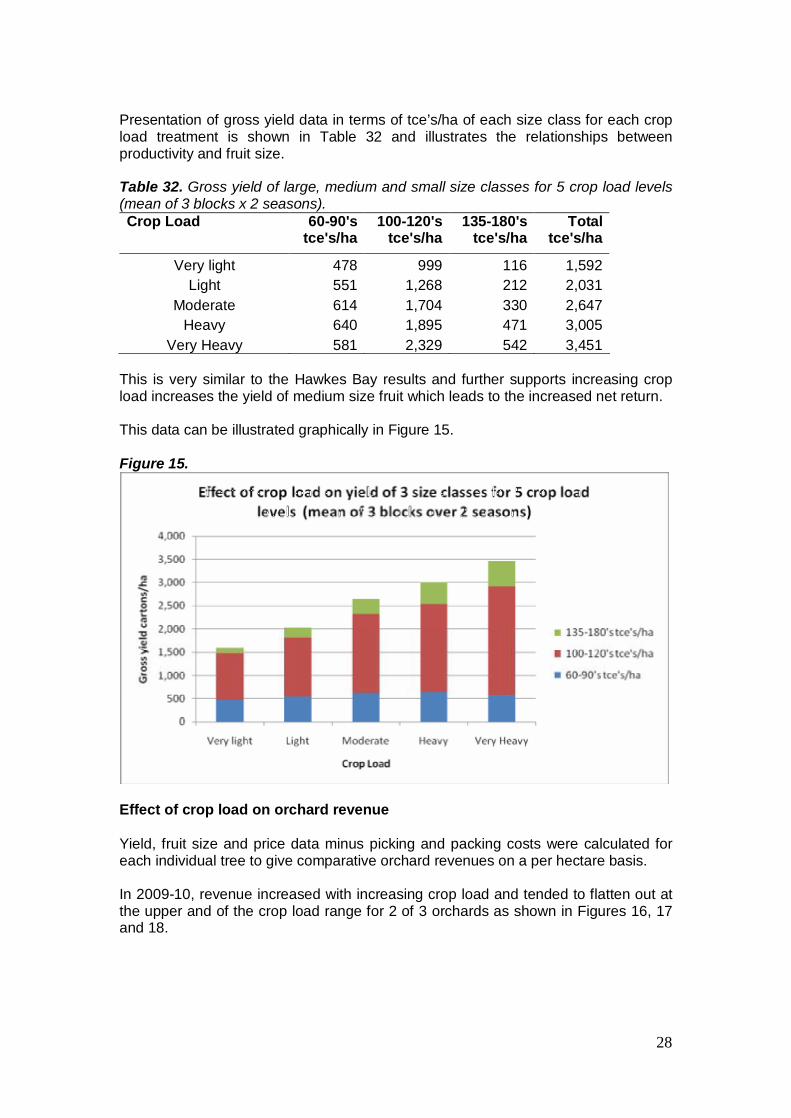
Presentation of gross yield data in terms of tce’s/ha of each size class for each crop load treatment is shown in Table 32 and illustrates the relationships between productivity and fruit size. Table 32. Gross yield of large, medium and small size classes for 5 crop load levels (mean of 3 blocks x 2 seasons). Crop Load 60-90's
tce's/ha 100-120's
tce's/ha 135-180's
tce's/ha Total
tce's/ha
Very light 478 999 116 1,592 Light 551 1,268 212 2,031
Moderate 614 1,704 330 2,647 Heavy 640 1,895 471 3,005
Very Heavy 581 2,329 542 3,451 This is very similar to the Hawkes Bay results and further supports increasing crop load increases the yield of medium size fruit which leads to the increased net return. This data can be illustrated graphically in Figure 15. Figure 15.
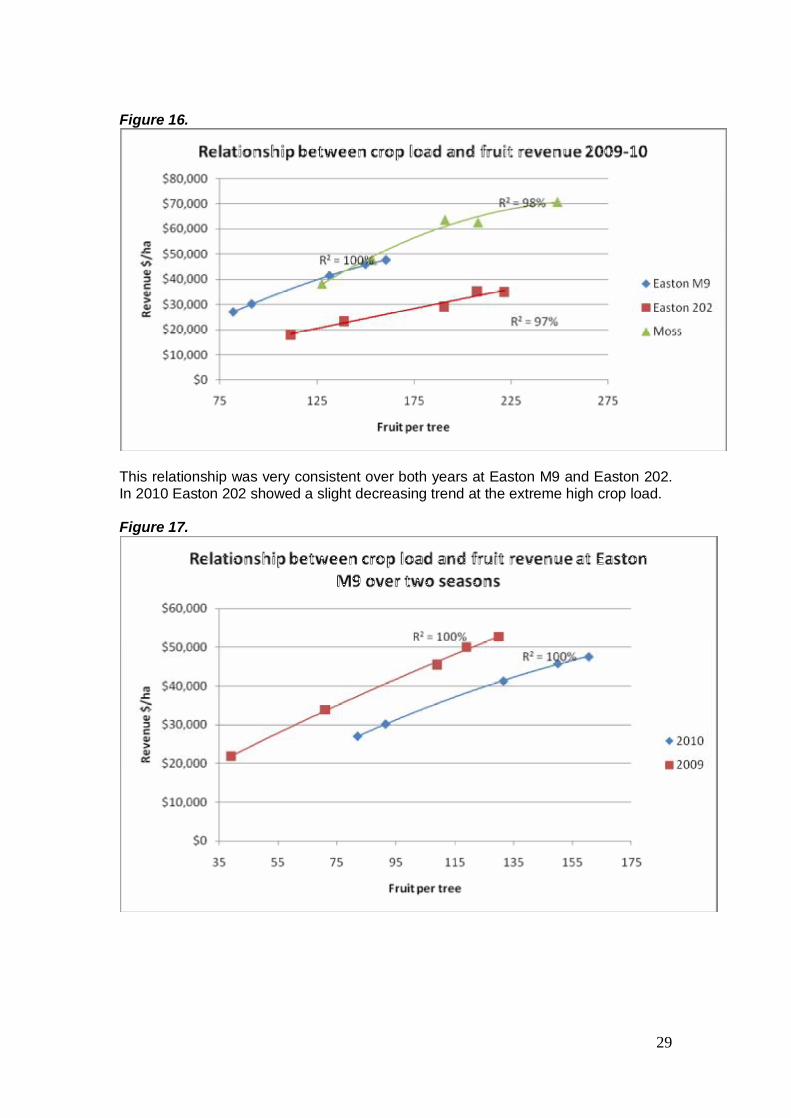
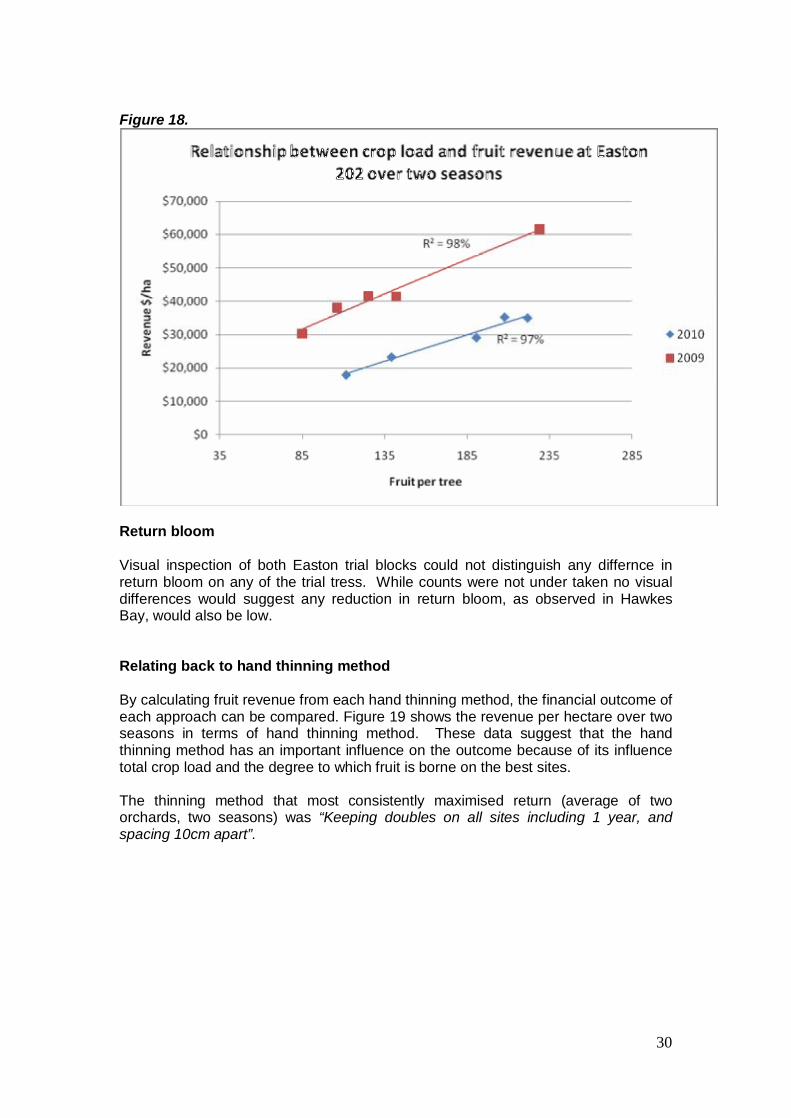
Effect of crop load on orchard revenue Yield, fruit size and price data minus picking and packing costs were calculated for each individual tree to give comparative orchard revenues on a per hectare basis. In 2009-10, revenue increased with increasing crop load and tended to flatten out at the upper and of the crop load range for 2 of 3 orchards as shown in Figures 16, 17 and 18.
29
Figure 16.
This relationship was very consistent over both years at Easton M9 and Easton 202. In 2010 Easton 202 showed a slight decreasing trend at the extreme high crop load. Figure 17.
30
Figure 18.
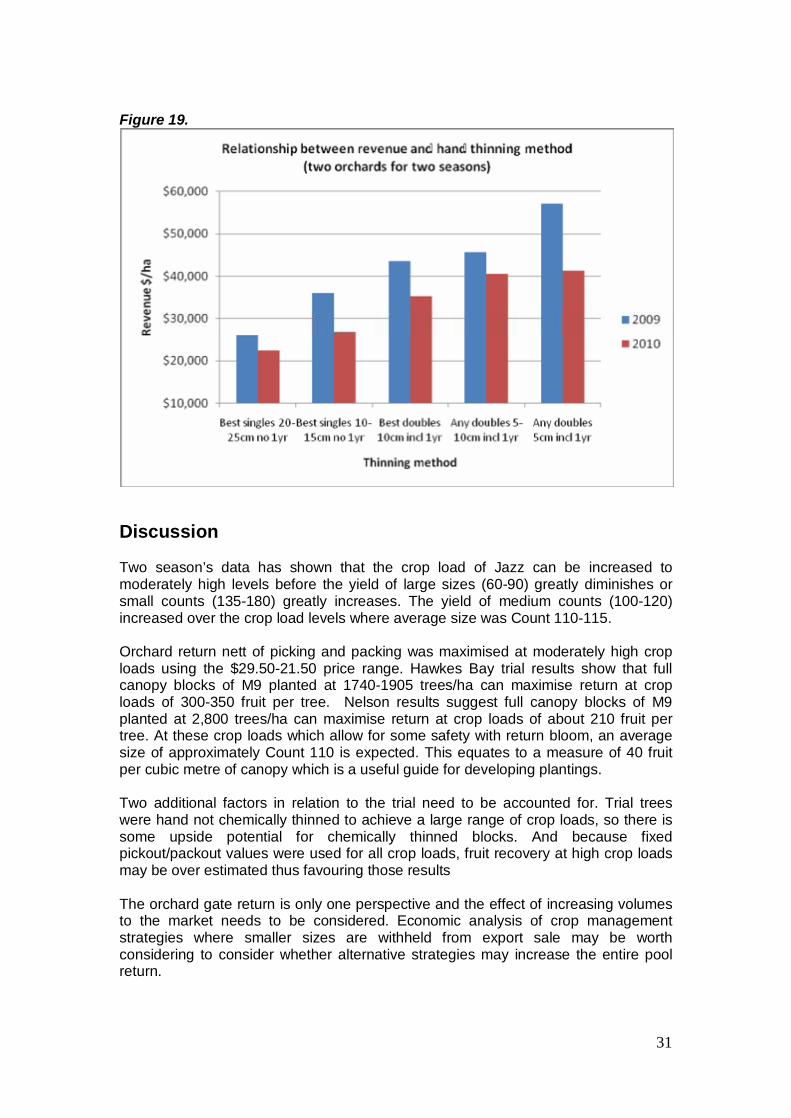
Return bloom Visual inspection of both Easton trial blocks could not distinguish any differnce in return bloom on any of the trial tress. While counts were not under taken no visual differences would suggest any reduction in return bloom, as observed in Hawkes Bay, would also be low. Relating back to hand thinning method By calculating fruit revenue from each hand thinning method, the financial outcome of each approach can be compared. Figure 19 shows the revenue per hectare over two seasons in terms of hand thinning method. These data suggest that the hand thinning method has an important influence on the outcome because of its influence total crop load and the degree to which fruit is borne on the best sites. The thinning method that most consistently maximised return (average of two orchards, two seasons) was “Keeping doubles on all sites including 1 year, and spacing 10cm apart”.
31
Figure 19.
Discussion Two season’s data has shown that the crop load of Jazz can be increased to moderately high levels before the yield of large sizes (60-90) greatly diminishes or small counts (135-180) greatly increases. The yield of medium counts (100-120) increased over the crop load levels where average size was Count 110-115. Orchard return nett of picking and packing was maximised at moderately high crop loads using the $29.50-21.50 price range. Hawkes Bay trial results show that full canopy blocks of M9 planted at 1740-1905 trees/ha can maximise return at crop loads of 300-350 fruit per tree. Nelson results suggest full canopy blocks of M9 planted at 2,800 trees/ha can maximise return at crop loads of about 210 fruit per tree. At these crop loads which allow for some safety with return bloom, an average size of approximately Count 110 is expected. This equates to a measure of 40 fruit per cubic metre of canopy which is a useful guide for developing plantings. Two additional factors in relation to the trial need to be accounted for. Trial trees were hand not chemically thinned to achieve a large range of crop loads, so there is some upside potential for chemically thinned blocks. And because fixed pickout/packout values were used for all crop loads, fruit recovery at high crop loads may be over estimated thus favouring those results The orchard gate return is only one perspective and the effect of increasing volumes to the market needs to be considered. Economic analysis of crop management strategies where smaller sizes are withheld from export sale may be worth considering to consider whether alternative strategies may increase the entire pool return.
32
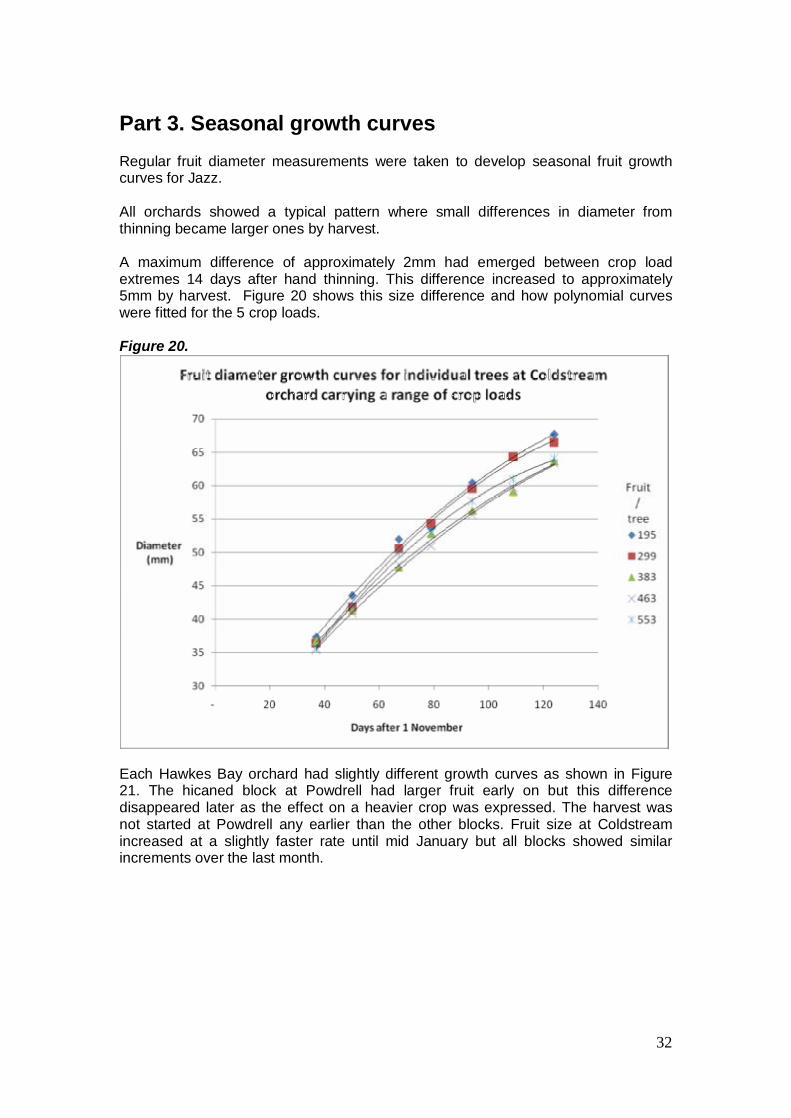
Part 3. Seasonal growth curves Regular fruit diameter measurements were taken to develop seasonal fruit growth curves for Jazz. All orchards showed a typical pattern where small differences in diameter from thinning became larger ones by harvest. A maximum difference of approximately 2mm had emerged between crop load extremes 14 days after hand thinning. This difference increased to approximately 5mm by harvest. Figure 20 shows this size difference and how polynomial curves were fitted for the 5 crop loads. Figure 20.
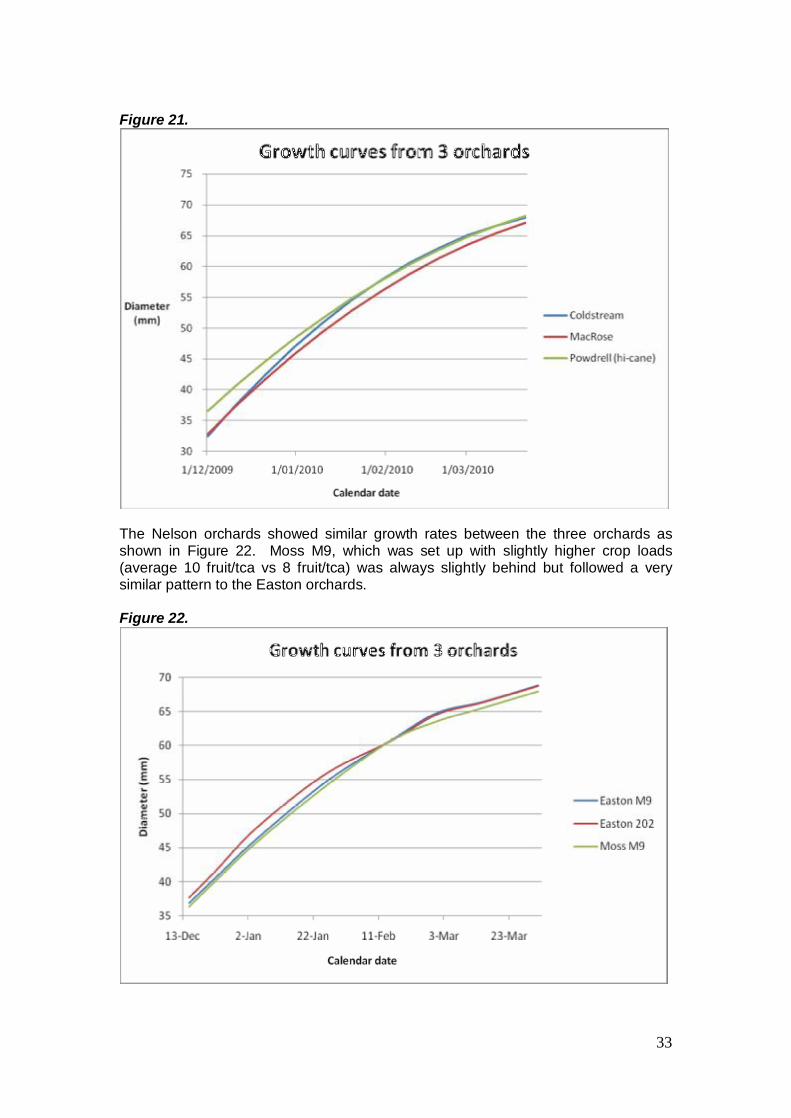
Each Hawkes Bay orchard had slightly different growth curves as shown in Figure 21. The hicaned block at Powdrell had larger fruit early on but this difference disappeared later as the effect on a heavier crop was expressed. The harvest was not started at Powdrell any earlier than the other blocks. Fruit size at Coldstream increased at a slightly faster rate until mid January but all blocks showed similar increments over the last month.
33
Figure 21.
The Nelson orchards showed similar growth rates between the three orchards as shown in Figure 22. Moss M9, which was set up with slightly higher crop loads (average 10 fruit/tca vs 8 fruit/tca) was always slightly behind but followed a very similar pattern to the Easton orchards. Figure 22.
34
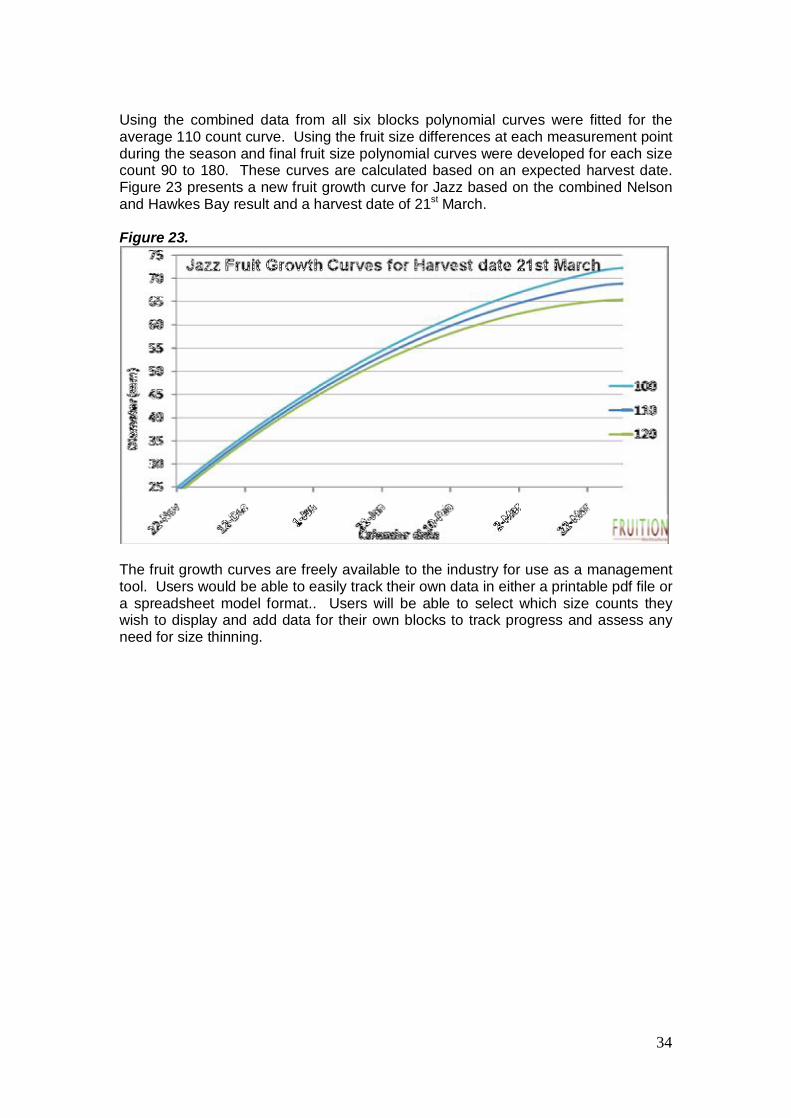
Using the combined data from all six blocks polynomial curves were fitted for the average 110 count curve. Using the fruit size differences at each measurement point during the season and final fruit size polynomial curves were developed for each size count 90 to 180. These curves are calculated based on an expected harvest date. Figure 23 presents a new fruit growth curve for Jazz based on the combined Nelson and Hawkes Bay result and a harvest date of 21st March. Figure 23.
The fruit growth curves are freely available to the industry for use as a management tool. Users would be able to easily track their own data in either a printable pdf file or a spreadsheet model format.. Users will be able to select which size counts they wish to display and add data for their own blocks to track progress and assess any need for size thinning.