Embed Size (px)
Citation preview

1
BASIC STATISTICS ABOUT HOME CARE Updated 2010
Prepared by: The National Association for Home Care & Hospice 228 Seventh Street, SE • Washington, DC 20003
202.547.7424 • http://www.nahc.org • E-mail: [email protected] Home care is a diverse and dynamic service industry that began in US in the 1880’s. Approximately 12 million individuals1 currently receive care from more than 33,000 providers2 (for causes including acute illness, long-term health conditions, permanent disability, or terminal illness). In 2009, annual expenditures for home health care were projected to be $72.2 billion.3 HOME CARE PROVIDERS “Home care organizations” include home health care agencies, home care aide organization, and hospices. Some of these organizations are Medicare certified, which allows providers to bill Medicare for reimbursement. Agencies that are not Medicare certified cannot be reimbursed through Medicare.
1 This estimate comes from a June 2008 NAHC study of cost report information to determine the number of home health and in-home hospice patients served, and a private survey of NAHC members to obtain an estimate of private duty patients served. 2 This number is a combination of Medicare certified home health agencies, Medicare certified hospices, and an estimate of non-Medicare agencies providing care in the home. 3 Centers for Medicare & Medicaid Services, Office of the Actuary (March 2010).
Medicare-certified Agencies While home care agencies have been providing services to Americans for more than a century, Medicare’s 1965 enactment accelerated the industry’s growth by covering home health care services for the elderly. Services were then extended to certain disabled Americans in 1973. Between 1967 and 1985, Medicare-certified agencies grew more than three-fold (1,753 to 5,983); however, in the mid-1980s, Medicare-certified home health care agencies reached a plateau (approximately 5,900) due to Medicare administrative burden and unreliable payments. This led to a 1987 lawsuit brought against the then-Health Care Financing Administration (HCFA) by US Representatives Harley Staggers (D-WV) and Claude Pepper (D-FL), consumer groups, and the National Association for Home Care (NAHC). The successful lawsuit gave NAHC the opportunity to participate in rewriting Medicare coverage policies, which significantly increased Medicare’s annual home care outlays, and the number of agencies rose to over 10,000. Prior to clarifications in coverage, public health agencies dominated the ranks of certified entities. After that, the number of hospital-based and freestanding proprietary agencies grew faster than any other types of organizations. Currently, more than 62
2
percent of agencies are freestanding proprietary agencies 12 percent are hospital-based. Table 1 (see Appendix A) shows the changes over time in types of agencies participating in Medicare. By the end of 2001, the number of Medicare-certified home health agencies declined to 6,861. NAHC believes the 30.4 percent decline in agencies between 1997 and 2001 can be attributed to changes in Medicare home health coverage and reimbursement enacted as part of the Balanced Budget Act of 1997 (BBA) (P.L. 105-33). With the advent of the home health prospective payment system (PPS) in 2000, financial stability returned, and the number of agencies rebounded to 10,581 by the end of 2009, for the first time surpassing the number of agencies in 1997. Medicare-certified Hospices Medicare added hospice benefits in October 1983, 10 years after the first hospice opened in the US. Hospices provide palliative care and social, emotional, and spiritual support services to terminally ill patients and their families. The number of Medicare-certified hospices has grown from 31 in 1984 to 3,407 as of December 31, 2009. Non-Medicare-certified Agencies Because of variation in licensing and oversight among states, it is difficult to assess the number of non-certified agencies. Non-certified home care agencies, home care aide organizations, and hospices that remain outside of Medicare do so for a variety of reasons. For example, some do not provide the breadth of services that Medicare requires, such as home health aide organizations that do not provide skilled nursing care.
HOME CARE EXPENDITURES AND UTILIZATION The Centers for Medicare & Medicaid Services (CMS) projects that total national expenditures for health care in 2009 were $2.5 trillion (17.3 percent of the gross domestic product—the result of a combined 5.7 percent growth in health spending and a decline in gross domestic product of 1.1 percent). Health spending by public payers is projected to have grown 8.7 percent in 2009, in contrast to 3.0 percent growth in spending for private payers. A main element driving public payer acceleration is anticipated growth in Medicaid enrollment (6.5 percent) and spending (9.9 percent) as a result of increasing unemployment due to the recession. Private insurance enrollment was anticipated to decline 1.2 percent, slowing the growth in private payer spending in 2009. Despite expected economic growth in 2010, private health spending growth is projected to further slow—to 2.8 percent, related to reduced enrollment in private health insurance as a result of a continuing high rate of unemployment and an expiration of subsidies for coverage provided through the Consolidated Omnibus Budget Reconciliation Act (COBRA). Public spending is projected to grow more slowly as well—5.2 percent in 2010, much of which can be attributed to a deceleration in Medicare spending growth to 1.5 percent, from 8.1 percent in 2009.4 Figure 1 provides projected 2009 national expenditures for personal health care by type. Of the more than $2 trillion attributed to personal health care spending in 2009, only a small fraction (approximately 4 percent) was spent on freestanding home care. (Hospital-
4 Truffer, Christopher, et al. “Health Spending Projections Through 2019: The Recession’s Impact Continues,” Health Affairs): March 2010.

3
based home care is included with hospital expenditures.) Total home care spending is difficult to estimate due to limitations of data sources. The Centers for Medicare & Medicaid Services (CMS) estimated total spending for home care to be $65 billion in 2008.5 These estimates do not include spending for home care services that are unavailable in the national health accounts data; for example, payments made by consumers directly to independent providers. Medicare Home Health Medicare is the largest single payer of home health care services. In 2009, Medicare spending accounted for approximately 41 percent of home health expenditures. (See Figure 2. Note: Medicare expenditures for home health include expenditures for hospice and home health care.) Other public funding sources for home health include Medicaid, the Older Americans Act, Title XX Social Services Block Grants, the Veterans’ Administration, and Civilian Health and Medical Program of the Uniformed Services (CHAMPUS). While Medicare pays the largest share for home health care, combined federal-state Medicaid outlays for in-home services (including personal care services that Medicare does not pay for) are actually greater. However, Medicaid is projected to become the largest payer of such services by 2010, following nearly a decade of double-digit growth associated with shifting preferences away from institutional care toward home and community-based settings. While Medicaid spending growth for home health is expected to slow as the shift toward home-based care continues at a lesser pace, it is still expected to remain
5 Centers for Medicare & Medicaid Services (CMS) online data, published March 2010.
strong, averaging 11.4 percent per year over the projection period.6 As recently as 1997, home health spending was 9 percent of Medicare’s benefit payments. Growth in the Medicare home health benefit between 1990 and 1996 can be attributed to specific legislative expansions of the benefit, court decisions, and to myriad socio-demographic trends that fostered growth in the program from the beginning. The percent of spending, however, has declined since 1997. In 2009, the home health benefit accounted for 4.2 percent of total Medicare spending ($434 billion). Nearly 37 percent was spent for hospital care, 14 percent for physician services, and nearly three percent for hospice care (See Figure 3). Between 1998 and 2000, Medicare home health spending fell from $14 billion to $9.2 billion (-34 percent) through the BBA. The BBA’s interim payment system (IPS) introduced a per-beneficiary limit designed to limit growth in home health expenditures by excluding a two-year inflation adjustment. Finally, agency payments under the IPS were restricted to the lowest of the agency’s actual costs, the per-visit cost limits, or per-beneficiary cost limits. The Lewin Group, a health care consulting firm, estimated that 90 percent of agencies had costs that exceeded BBA limits by an average of 32 percent without changing practice patterns.7 The Medicare Payment Advisory Commission (MedPAC) calculated a total reduction of 1.3 million beneficiaries between 1997 and 2001. Visits per client and per client reimbursement had also declined since 1996. Two studies conducted by researchers at The George Washington University identified beneficiary 6 Sisko, Andrea, C. Truffer, S. Smith, S. Keehan, et al. “Health Spending Projections Through 2018: Recession Effects Add Uncertainty To The Outlook,” Health Affairs (Web Exclusive): February 24, 2009. 7 The Lewin Group, “An Impact Analysis for Home Health Agencies of the Medicare Home Health Interim Payment System of the 1997 Balanced Budget Act.” Washington, DC: National Association for Home Care (August 11, 1999).

4
access problems resulting from the BBA.8,9 Additional studies from MedPAC and the Government Accountability Office (GAO) also suggest that access is a growing problem for patients who require intensive services.10 In June 2003, MedPAC issued a report, indicating that skilled nursing facility (SNF) care is now substituting for home health care for some patients, most likely at a much higher cost to Medicare.11 In June 2007, MedPAC issued another report, indicating that 78 percent of beneficiaries had no problems accessing home health services in 2004, up from 74 percent in 2001, while 12 percent had a small problem and 11 percent had a big problem in 2004, in contrast to 13 and 12 percent, respectively, in 2001. Table 2 shows changes in utilization and expenditures in the Medicare home health benefit that have occurred since 1996. An estimated 3.6 million Medicare enrollees received fee-for-service home health services in 1997, twice the number of recipients in 1990. Between 1996 and 2001, utilization of Medicare home health services decreased from 3,599,700 to 2,402,500, a 33 percent
8 Smith, B.M., K.A. Maloy, and D.J. Hawkins, “An Examination of Medicare Home Health Services: A Descriptive Study of the Effects of the Balanced Budget Act Interim Payment System on Access to and Quality of Care,” Washington, DC: George Washington University Center for Health Services Research & Policy. (September 1999) 9 Smith, B.M., Maloy, K.A., and Hawkins, D.J., “An Examination of Medicare Home Health Services: A Descriptive Study of the Effects of The Balanced Budget Act Interim Payment System on Hospital Discharge Planning,” Washington, DC: George Washington University Center for Health Services Research & Policy. (January 2000). 10 Abt Associates, Inc. Survey of Home Health Agencies, No. 99-2. Cambridge (MA): Author. Report to the Medicare Payment Advisory Commission under contract. (September 1999), and General Accounting Office. Medicare Home Health Agencies: Closures Continue, With Little Evidence Beneficiary Access Is Impaired. No. HEHS-99-120. Washington: Author. (May 1999). 11 Medicare Payment Advisory Commission, Report to the Congress: Variation and Innovation in Medicare (June 2003).
drop. By 2008, utilization had risen to 3,171,600, a 32 percent recovery.12 Medicare Home Health Prospective Payment The BBA mandated that CMS develop a PPS (implemented October 1, 2000) for Medicare home health, which set a national payment rate and enticed providers to deliver more efficient care.13 The findings of a final evaluation of CMS’ episode-based PPS demonstration identified a reduction in overall episode costs, which was accompanied by an increase in per-visit costs when agencies were paid prospectively based on an episode of care. This is due in large part to fewer visits over which to budget fixed costs.14 The home health PPS relies on a 153-category case-mix adjuster (80 previous to 2008) to set payment rates based on patient characteristics including clinical severity, functional status, and the need for rehabilitative therapy services. The case-mix adjusted payment rate is similar to the Medicare SNF and inpatient hospital prospective payment systems. Like its counterparts, the home health PPS also includes payments that partially reimburse for unexpectedly high outliers, and adjusts payments for geographically through an area wage index. However, a major difference among the systems is the unit of payment. SNFs are paid by the day while the home health PPS pays by the 60-day episode.
12 Centers for Medicare & Medicaid Services, Office of Information Services: Data from the Medicare Data Extract System; data development by the Office of Research, Development, and Information. (March 2010) 13 “Medicare Program; Prospective Payment System for Home Health Agencies; Final Rule,” Federal Register, vol. 65, no. 128, July 3, 2000. Pp. 41128-41214. 14 Cheh V., “The Final Evaluation Report on the National Home Health Prospective Payment Demonstration: Agencies Reduce Visits While Preserving Quality,” Princeton, NJ: Mathematica Policy Research, Inc. (April 30, 2001).

5
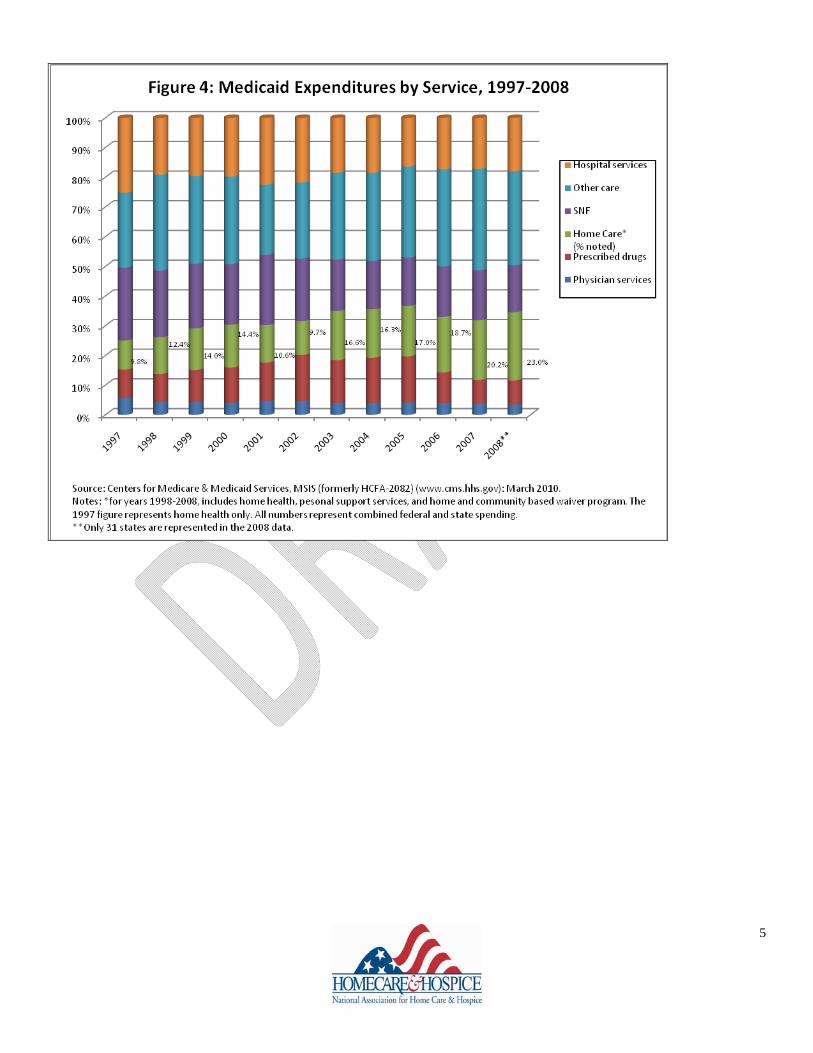
Medicaid Home Care Medicaid payments for home care are divided into three main categories: the mandatory traditional home health benefit, and two optional programs, the personal care option and home and community-based waivers. Together, these three home care service categories represent a relatively small but growing portion of total Medicaid payments. Figure 4 shows that approximately 34 percent ($94 billion) of the $276 billion in Medicaid benefit payments in fiscal year 2007 (FY2007) were for hospital care and institutional services. Home care services comprised 20.2 percent of the payments. Hospice is an optional Medicaid service that is currently offered by 48 states; payments for hospice services in FY2006 were estimated at $1.6 billion. Table 3 shows the growth in Medicaid home care outlays since FY1995. Expenditures increased to $24.3 million in FY2000, decreased to $16.7 million (a loss of 31.5 percent) in FY2001, and rebounded to $55.9 million in FY2007. Changes in the reporting of Medicaid expenditures make it difficult to pinpoint the source of the decrease and why there appears to be a dramatic increase, although states have recently begun to place a greater emphasis on providing care at home in lieu of institutions. Managed Care Health care services in the United States are increasingly financed through managed care organizations. Managed care organizations, including health maintenance organizations (HMOs), typically finance health care services through a negotiated, prepaid rate to health care providers. A fully capitated contract specifies a lump sum payment per enrollee to cover all care provided through the plan, but
there are many variations of capitation. In contrast, traditional health insurance, commonly termed fee-for-service, pays providers based on the number of services delivered generally with fewer limitations on which providers would be paid. Managed care is most prevalent in the employer-based health insurance market. Ninety-one percent of workers with health insurance received health insurance through a managed care plan in 2009.15 Managed care enrollment has increased among Medicaid enrollees as states seek federal waivers to convert their Medicaid programs to managed care programs. By December 31, 2008, 69.82 percent of all Medicaid beneficiaries were enrolled in managed care.16 While Medicare managed care enrollment has only slowly increased, financial incentives created by the Medicare Modernization Act (MMA) has led to an increasing number of beneficiaries enrolling in Medicare Advantage (MA) plans. As of February 2010, 25.2 percent of Medicare beneficiaries were enrolled in MA.17 The increasingly competitive health care market has created incentives for home care agencies to enter managed care provider networks. However, little is known about the extent to which home care agencies have entered into managed care arrangements. A preliminary (and somewhat dated) study conducted for HCFA (now CMS). The authors found that managed care clients utilized less home health resources, compared to fee-for-service clients, but also had less favorable outcomes on average. This suggests the need for further research on the relationship
15 Claxton, G., et al. “Job-Based Health Insurance: Costs Climb At a Moderate Pace,” Health Affairs: (Web Exclusive), w1002, 15 September, 2009. 16 Centers for Medicare & Medicaid Services, “Medicaid Managed Care Enrollment as of December 31, 2008,” http://www.cms.hhs.gov/MedicaidDataSourcesGenInfo/downloads/08Dec31f.pdf (January 2010). 17 Centers for Medicare & Medicaid Services online, http://www.cms.hhs.gov/MCRAdvPartDEnrolData/. (March 2010)..

6
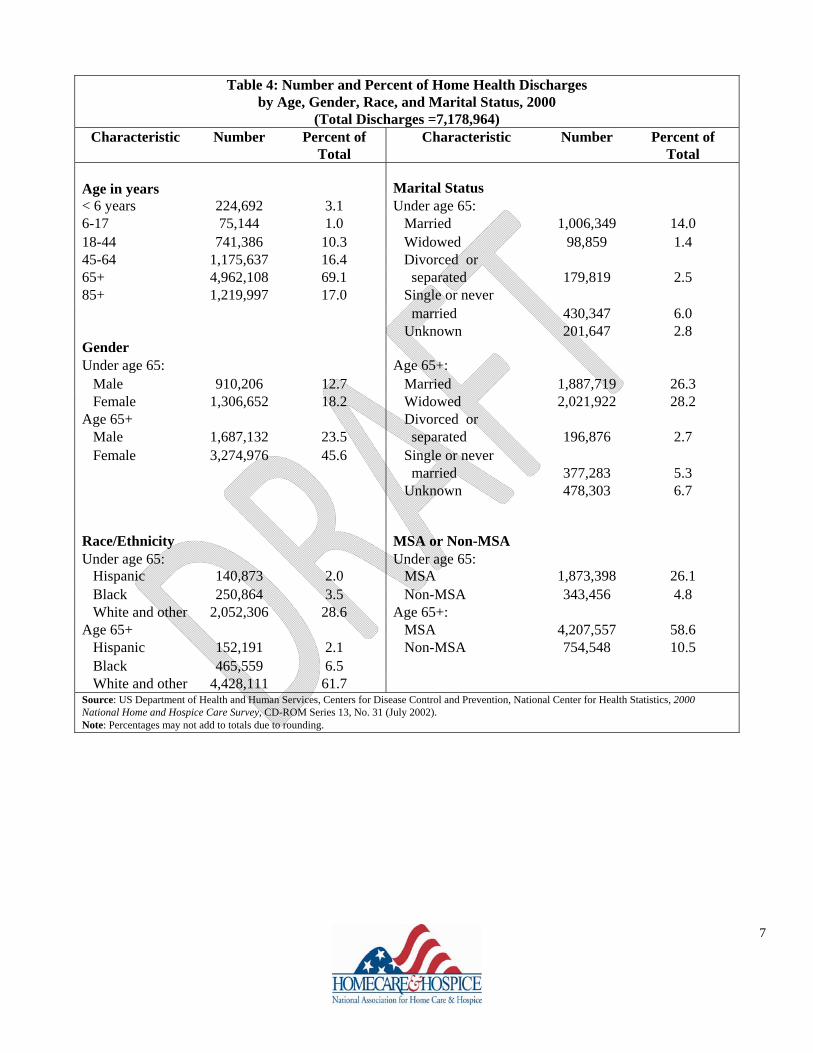
between managed care and home care patient outcomes.18 HOME CARE RECIPIENTS The 2000 Home and Hospice Care Survey findings indicate that 7.2 million individuals received formal home care services in 2000, a decrease of 5.8 percent from 1998.19 (Table 4) This figure represents roughly 2.5 percent of the US population. Of these recipients, 69 percent were over age 65 and approximately 64 percent were women. Much of this reduction can be attributed to a reduction in patients receiving home health benefits under Medicare. Table 5 shows that 25.5 percent of 2008 Medicare home health patients had conditions related to diseases of the circulatory system as their principal diagnosis. People with heart disease, including congestive heart failure, made up approximately half of this group. Endocrine, nutritional, and metabolic diseases and immunity disorders (predominantly diabetes mellitus), diseases of the musculoskeletal system and connective tissue, and symptoms, signs, and ill-defined conditions were also frequent principal diagnoses for Medicare home health patients. Many hospital patients are discharged to home care services for continued rehabilitative care. As hospital stays shortened beginning in the early 1980s, the percentage of Medicare patients discharged to home health care increased from 9.1 percent in 1981 to 17.9 percent in 1985. MedPAC estimated that an average of 16.0 percent of Medicare hospital 18 Shaughnessy P.W., R.E. Schlenker, D.F. Hittle, et al., A Study of Home Health Care Quality and Cost Under Capitated and Fee-For-Service Payment Systems, Vol. 1: Summary (Denver: Center for Health Policy Research 1994). 19 US Department of Health and Human Services, Centers for Disease Control and Prevention, National Center for Health Statistics, 2000 National Home and Hospice Care Survey, CD-ROM Series 13, No. 31. July 2002.
patients used home health care following discharge in 2006.20 In a June 2008 Data Report, MedPAC estimated that 16.0 percent of Medicare patients discharged from acute care hospitals used home health care. 21 In the June 2008 report, home health was also estimated as the “most common second post acute care setting used,” following SNF (29.3 percent), inpatient rehabilitation (56.8 percent), and hospice (2.4 percent). Table 6 shows the percentage of Medicare beneficiaries discharged from an acute care hospital to home health care by selected DRGs. Medicare’s hospital inpatient PPS pays hospitals a predetermined amount per hospital discharge. The DRG classification system assigns patients to over 500 groups, distinguishing cases with similar clinical problems that are expected to require similar amounts of hospital resources. The DRG-based payment for each discharge includes separately determined amounts for operating and capital costs.22 A study performed by the Department of Health and Human Services, Office of Inspector General found that 38 percent of Medicare beneficiaries who began use of home health care in the year 2000 came directly from the community. These patients had no prior hospitalizations (48 percent) or nursing home stays (14 percent) within 15 days of receiving home health care.23 Table 7 shows the top five diagnoses for Medicare community home health beneficiaries. Diagnosis is indicated by International Classification of Diseases coding system (ICD-9). CAREGIVERS 20 Medicare Payment Advisory Commission, A Data Book: Healthcare Spending and the Medicare program (June 2008). 21 Medicare Payment Advisory Commission, A Data Book: Healthcare Spending and the Medicare program (June 2008). 22 Medicare Payment Advisory Commission, Report to the Congress: New Approaches in Medicare (June 2004). 23 Department of Health and Human Services, Office of Inspector General, Home Health Community Beneficiaries 2001, October 2001, #OEI-02-01-00070.

7
The 2009 Caregiving in the U.S. survey, sponsored by the National Alliance for Caregiving and AARP, documented the prevalence of caregiving in the US. The study found that more than one in three US households (an estimated 48.9 million caregivers over age 18) are informal caregivers for a person older than age 18, with an additional 16.8 million caring for children or both children and adults, for a total of 65.7 million individual caregivers. This report also showed that 63 percent of caregivers are married and/or living with a partner, and two-thirds (66 percent) are women. One third (34 percent) care for two or more people, with 86 percent providing care to a relative—more than one-third caring for a parent and one in seven (14 percent) caring for their own child. Twenty-five percent have completed some college education, with an additional 43 percent having graduated from college. The typical caregiver is a 48 year old woman who provides more than 20 hours of care each week.24 Formal Caregivers Formal caregivers include professionals and paraprofessionals who are compensated to provide in-home health care and personal care services. BLS and CMS provide data on these employees; however, agency definitions and methods of counting formal caregivers differ. BLS provides an occupational classification for “home health care services,” which excludes hospital-based and public agency workers. Its method of counting is “number of employees.” CMS limits its statistics to employees of certified home health agencies. Furthermore, its survey presents data on aggregated full-time equivalents (FTEs).
24 National Alliance for Caregiving and AARP. “ Caregiving in the U.S.,” November 2009 (www.aarp.org).
As shown in Table 8, BLS estimated that 958,000 persons were employed in home health care agencies in 2008, with the exclusions described above. For both BLS and CMS, the largest numbers of employees/FTEs are home care aides and RNs. CMS recorded 290,439 FTEs employed in Medicare-certified agencies as of December 2008. Figure 5 shows calendar year home care services employment for 1996 to 2009 based on BLS annual statistics. From 1993 to 2008, home care employment grew an average 5.4 percent annually (510,000 to 961,400). Between 1997 and 1999, total home care employment declined by more than 10 percent. By the end of 2009, it had regained approximately 63 percent from the low point in 1999. Productivity Since 1996, NAHC has worked with the Hospital and Healthcare Compensation Service (HCS) to conduct an annual survey of compensation in the home care and hospice industry. Employee productivity data are now collected in this survey. Productivity in home care is typically based on the average number of visits provided per day. Table 9 shows data from the Homecare Salary & Benefits Report 2009-2010. Compensation
Summary home care and hospice compensation results for the above-mentioned 2009 to 2010 HCS survey are shown in Tables 10 and 11. To reduce the likelihood that outliers skew results, compensation is reported for the median salary, rather than mean salary. The survey includes data from agencies with revenues up to $15 million. HCS publishes a separate report for agencies and chain organizations with revenues in excess of $15 million (The Multi-Facility Corporate
8
Compensation Report; for more information, visit www.hhcsinc.com). COST EFFECTIVENESS Home care is a cost-effective service for individuals recuperating from a hospital stay and for those who, because of a functional or cognitive disability, are unable to take care of themselves. Table 12 compares the average Medicare charges on a per day basis for hospital and SNF to the average Medicare charge for a home health visit. The following section lists some examples of the cost-effectiveness of home care. However, it should be noted that cost-effectiveness is not the only rationale for home care. Home care reinforces and supplements care provided by family members and friends and maintains the recipient’s dignity and independence, qualities that can be lost even in the best institutions. Home care also allows patients to take an active role in their care.25 Home Health Care vs. SNF and Inpatient Rehabilitation Facility Care One study by the RAND Corporation for MedPAC found that home health benefit ranks highest regarding outcomes and cost-effectiveness for patients who have undergone hip or knee replacement. The study compares care delivered in the home health setting with SNFs and inpatient rehabilitation facility (IRF) care. RAND determined that 35 percent of the knee and hip replacement patients studied were discharged from an acute care hospital to home for either home health rehabilitation, outpatient therapy, or no formal continuing care. The remainder of the patients was split evenly in discharge to IRF or SNF care. To
25 Sheldon P. and M. Bender. “High-Technology in Home Care.” Community Health Nursing and Home Health Nursing, no. 3 (1994): 507-519.
measure health outcomes, RAND examined mortality rates and whether patients were institutionalized 120 days after being discharged from acute care. The study found that patients who received SNF or IRF care were more likely to be institutionalized than patients discharged to home. RAND considered post-acute care payments and total episode payments, including the cost of the initial hospitalization for joint replacement provided to patients discharged to home. The costs studied did not include Medicare Part B payments to physicians. Several studies have compared inpatient care to home care costs for a specific group of patients. An analysis of studies that investigated the use of home care as a cost-effective substitute for acute care services found a statistically significant relationship between home health use and reduced use of inpatient hospital care.26 The cost savings data for six studies of home care cost-effectiveness are summarized in Table 13. The information has been aggregated at a monthly level for purposes of comparison.
Psychiatric Care An in-home crisis intervention program developed for psychiatric patients in Connecticut was effective in reducing hospital admissions, lengths of stay, and readmissions. A two-year analysis of more than 600 patients showed that 80.7 percent of patients referred for hospital care could be treated at home instead. When inpatient admissions were necessary, the average length of stay was reduced from 11.97 days to 7.48 days by adding elements of the in-home care program. Patients who received home care services were also less likely to be readmitted for hospital care (11.8 percent of home care 26 Hughes S.L., A. Ulasevich, F.M. Weaver, et al. “Impact of Home Care on Hospital Days: A Meta Analysis,” Health Services Research no. 4 (1997): 415-532.

9
patients were readmitted compared to 45.9 percent of patients who did not receive home care services).27 Patients with COPD An innovative home care program for patients with chronic obstructive pulmonary disease (COPD) that was tested in Connecticut found significant cost savings by providing more comprehensive home care services to COPD patients who previously required frequent hospitalizations. Monthly costs for hospitalizations, emergency room visits and home care fell from $2,836 per patient before the intervention to $2,508 per patient--a net savings of $328 per patient per month.28 Terminally Ill Veterans A home care program for terminally ill veterans reduced hospital per capita costs by $971. In the six-month study, patients receiving home care used 5.9 fewer hospital days than those in the control group. No differences were found in patient survival, activities of daily living, cognitive functioning, or morale. However, patient and caregiver satisfaction with care was significantly better among the patients receiving home care.29 Patients with Congestive Heart Failure The impact of intensive home care monitoring on the morbidity rates of elderly patients with congestive heart failure was the focus of 27 Pigott H.E. and L. Trott. “Translating Research into Practice: The Implementation of an In-home Crisis Intervention Triage and Treatment Service in the Private Sector,” American Journal of Health Quality no. 3 (1993): 138-144. 28 Haggerty M.C., R. Stockdale-Woolley, and S. Nair. “Respi-Care: An Innovative Home Care Program for the Patient with Chronic Obstructive Pulmonary Disease,” Chest no. 3 (1991): 607-612. 29 Hughes S.L., J. Cummings, F. Weaver, L. Manheim, B. Braun, and K. Conrad. “A Randomized Trial of the Cost Effectiveness of VA Hospital-based Home Care for the Terminally Ill,” Health Services Research no. 6 (1992): 801-817.
another study. The study found that with intensive home care surveillance, the total hospitalization rate dropped from 3.2 admissions per year to 1.2 admissions per year and the length of stay decreased from 26 days per year to six days per year. Cardiovascular admissions declined from 2.9 admissions per year to 0.8 admissions per year and length of stay decreased from 23 days per year to four days per year. An in-home program also resulted in significant functional status improvement in elderly patients with congestive heart failure.30
30 Kornowski R., D. Zeeli, M. Averbuch, and A. Finkelstein, et al. (Tel Aviv, Israel). “Intensive Homecare Surveillance Prevents Hospitalization and Improved Morbidity Rates Among Elderly Patients with Severe Congestive Heart Failure,” American Heart Journal no. 4 (1995): 762-766.

1
APPENDIX A: Tables and Figures
Table 1: Number of Medicare-certified Home Care Agencies, by Auspice, for Selected Years, 1967-2009
FREESTANDING AGENCIES FACILITY-BASED AGENCIES Year VNA COMB PUB PROP PNP OTH HOSP REHAB SNF TOTAL 1967 549 93 939 0 0 39 133 0 0 1,753 1980 515 63 1,260 186 484 40 359 8 9 2,924 1990 474 47 985 1,884 710 0 1,486 8 101 5,695 1996 576 34 1,177 4,658 695 58 2,634 4 191 10,027 1997 553 33 1,149 5,024 715 65 2.698 3 204 10,444 1998 460 35 968 3,414 610 69 2,356 2 166 8,080 1999 452 35 918 3,192 621 65 2,300 1 163 7,747 2000 436 31 909 2,863 560 56 2,151 1 150 7,152 2001 425 23 867 2,835 543 68 1,976 1 123 6,861 2002 430 27 850 3,027 563 79 1,907 1 119 7,007 2003 439 27 888 3,402 546 74 1,776 0 113 7,265 2004 446 36 932 3,832 558 69 1,695 1 110 7,679 2005 461 36 1,043 4,321 566 74 1,618 2 103 8,224 2006 459 29 1,132 4,919 562 85 1,547 2 103 8,838 2007 475 31 NA NA NA NA 1,503 2 99 9,284 2008 489 37 1,273 5,849 559 92 1,425 1 99 9,824 2009 516 36 1,392 6,585 598 98 1,311 1 97 10,581
Source: Centers for Medicare & Medicaid Services (CMS), Center for Information Systems, Health Standards and Quality Bureau, (2009 data obtained in January 2010). VNA: Visiting Nurse Associations are freestanding, voluntary, nonprofit organizations governed by a board of directors and usually financed by tax-deductible contributions as well as by earnings. COMB: Combination agencies are combined government and voluntary agencies. These agencies are sometimes included with counts for VNAs. PUB: Public agencies are government agencies operated by a state, county, city, or other unit of local government having a major responsibility for preventing disease and for community health education. PROP: Proprietary agencies are freestanding, for-profit home care agencies. PNP: Private not-for-profit agencies are freestanding and privately developed, governed, and owned nonprofit home care agencies. These agencies were not counted separately prior to 1980.
OTH: Other freestanding agencies that do not fit one of the categories for freestanding agencies listed above. HOSP: Hospital-based agencies are operating units or departments of a hospital. Agencies that have working arrangements with a hospital, or perhaps are even owned by a hospital but operated as separate entities, are classified as freestanding agencies under one of the categories listed above. REHAB: refers to agencies based in rehabilitation facilities. SNF: Refers to agencies based in skilled nursing facilities.

2

3

4
Table 2: Medicare Fee-for-Service Home Health Outlays, Visits, Clients, Payment/Client, and Visits/Client, 1996-2008
Year
Outlays ($million)
Visits (1000s)
Clients (1000s)
Payment/Client
Visits/Client
1996 16,789 264,553 3,598 4,666 74 1997 16,723 257,751 3,554 4,705 73 1998 10,446 154,992 3,062 3,412 51 1999 7,908 112,748 2,735 2,892 41 2000 7,352 90,730 2,497 2,945 36 2001 8,637 73,698 2,439 3,541 30 2002 9,635 78,055 2,724 3,538 29 2003 10,149 82,517 2,888 3,524 29 2004 11,500 88,872 2,840 4,050 31 2005 12,885 95,534 3,228 3,991 30 2006 14,050 103,981 3,302 4,254 32 2007 15,677 114,199 3,383 4,635 34 2008 17,115 121,026 3,466 4,938 35
Sources: Centers for Medicare & Medicaid Services. HCIS home health data, 1994-1998 (December 2000). HCIS home health data, 1999 & 2000 (September 2001). HCIS home health data, 2001 (December 2002). HCIS home health data, 2002 (October 2003). HCIS home health data, 2003 (October 2004). HCIS home health data, 2004 (October 2005). HCIS home health data, 2005 (October 2006). HCIS home health data, 2006 (October 2007). HCIS home health data, 2007 (March 2009). HCIS home health data, 2008 (June 2010).
5

6
Table 3: Medicaid Home Care Expenditures and Recipients, 1995-2008
Fiscal Year
Vendor Payments ($millions)
Recipients (1000s)
1995 9,406 1,639 1996 10,583 1,633 1997 12,237 1,861 1998 17,600 4,800 1999 21,500 4,882 20001 24,300 5,544 2001 16,655 6,776 2002 19,288 7,775 2003 38,715 8,125 2004 37,241 8,377 2005 46,618 9,076 2006 50,310 9,112 2007 55,882 8,890 20082 44,915 6,039
Source: Centers for Medicare & Medicaid Services, MSIS (formerly HCFA-2082). (www.cms.gov). (2001 & 2002 data obtained February 2005). (2003 & 2004 data obtained July 2007). (2005-2008 data obtained March 2010). Notes: 1Hawaii did not report for FY 2000. Their FY 1999 data are used in this table. 2Data for 2008 is incomplete, only 31 states reported. Figures include expenditures for home health and personal support services. Figures for 1999 through 2008 also include home and community-based waiver program.
7
Table 4: Number and Percent of Home Health Discharges by Age, Gender, Race, and Marital Status, 2000
(Total Discharges =7,178,964) Characteristic Number Percent of
Total Characteristic Number Percent of
Total
Age in years
Marital Status
< 6 years 224,692 3.1 Under age 65: 6-17 75,144 1.0 Married 1,006,349 14.0 18-44 741,386 10.3 Widowed 98,859 1.4 45-64 1,175,637 16.4 Divorced or 65+ 4,962,108 69.1 separated 179,819 2.5 85+ 1,219,997 17.0 Single or never married 430,347 6.0
Gender Unknown 201,647 2.8
Under age 65: Age 65+: Male 910,206 12.7 Married 1,887,719 26.3 Female 1,306,652 18.2 Widowed 2,021,922 28.2 Age 65+ Divorced or Male 1,687,132 23.5 separated 196,876 2.7 Female 3,274,976 45.6 Single or never married 377,283 5.3
Unknown 478,303 6.7
Race/Ethnicity
MSA or Non-MSA
Under age 65: Under age 65: Hispanic 140,873 2.0 MSA 1,873,398 26.1 Black 250,864 3.5 Non-MSA 343,456 4.8 White and other 2,052,306 28.6 Age 65+: Age 65+ MSA 4,207,557 58.6 Hispanic 152,191 2.1 Non-MSA 754,548 10.5 Black 465,559 6.5 White and other 4,428,111 61.7 Source: US Department of Health and Human Services, Centers for Disease Control and Prevention, National Center for Health Statistics, 2000 National Home and Hospice Care Survey, CD-ROM Series 13, No. 31 (July 2002). Note: Percentages may not add to totals due to rounding.

8
Table 5: Medicare Home Health Utilization by Principal Diagnosis, Calendar Year 2008
Principal ICD-9-CM Diagnosis1
Principal ICD-9-CM Codes
Patients (1,000’s)
Percent
Infectious and Parasitic Diseases 001-139 20 0.6 Neoplasms 140-239 110 3.5 Malignant Neoplasm of Trachea, Bronchus, and Lung 162 22 0.7 Endocrine, Nutritional, and Metabolic Diseases and Immunity Disorders
240-279 372 11.7
Diabetes Mellitus 250 341 10.8 Diseases of the Blood and Blood Forming Organs 280-289 60 1.9 Mental Disorders 290-319 68 2.1 Diseases of the Nervous System and Sense Organs 320-389 152 4.8 Diseases of the Circulatory System 390-459 809 25.5 Essential Hypertension 401 223 7.0 Heart Disease 402, 410-411,
413-414, 427-428 398 12.6
Diseases of the Respiratory System 460-519 271 8.6 Pneumonia, Organism Unspecified 486 59 1.9 Diseases of the Digestive System 520-579 74 2.3 Diseases of the Genitourinary System 580-629 82 2.6 Diseases of the Skin and Subcutaneous Tissue 680-709 196 6.2 Diseases of the Musculoskeletal System and Connective Tissue
710-739 399 12.6
Osteoarthritis and Allied Disorders 715 93 2.9 Symptoms, Signs, and Ill-Defined Conditions 780-799 262 8.3 Injury and Poisoning 800-999 208 6.6 Supplementary Classification V01-V82 1,088 34.3 Total, All Diagnoses2 --- 3,172 100.0 Total Leading Diagnoses3 --- 1,813 57.2 1ICD-9-CM is International Classification of Diseases, 9th Revision, Clinical Modification (Volume 1). Only the first-listed or principal diagnosis has been used. 2Includes invalid codes not listed separately. 3Specific leading diagnostic categories were selected for presentation because of frequency of occurrences or because of special interest. Source: Centers for Medicare & Medicaid Services, Office of Information Services: Data from the Medicare Data Extract System; data development by the Office of Research, Development, and Information. Health Care Financing Review: Medicare and Medicaid Statistical Supplement. 2009.

9
Table 6: Proportion of Medicare Beneficiaries Discharged to Home Health Care for the 10 Most Common Diagnosis Related Groups (DRGs), 2000-2004
Initial Hospital DRG
2000
2001
2002
2003
2004
% Change 2000-2004
DRG 462- Rehabilitation 7.4% 7.9% 8.1% 8.6% 8.7% 17.6 DRG 209- Major Joint and Limb Reattachment Procedures of Lower Extremity
7.0 7.3 7.6 7.9 8.2 17.1
DRG 127- Heart Failure and Shock 6.1 6.0 5.7 5.6 5.6 -8.2 DRG 089- Simple Pneumonia and Pleurisy 4.3 3.7 4.1 3.8 4.2 -2.3 DRG 088- Chronic Obstructive Pulmonary Disease 3.4 3.1 3.1 2.9 3.1 -8.8 DRG 148- Major Small and Large Bowel Procedures 2.1 2.0 2.0 2.0 1.9 -9.5 DRG 014- Intracranial Hemorrhage or Cerebral Infarction 3.1 3.1 3.0 2.4 1.9 -38.7 DRG 296- Nutrition/Miscellaneous Metabolic Disorders 1.7 1.7 1.9 1.9 1.7 0 DRG 107- Coronary Bypass With Cardiac Catheterization 2.0 2.0 1.8 1.8 1.5 -25.0 DRG 121- Circulatory Disorders with Acute Myocardial Infarction and Major Complication
1.6 1.6 1.5 1.4 1.4 -12.5
Source: Department of Health and Human Services, Office of Inspector General. Medicare Beneficiary Access to Home Health Agencies: 2004. #OEI-02-04-00260. July 2006. OIG analysis of CMS’s National Claims History File, 2005 Note that the year starts with April 1 of the prior year and ends with March 31 of that year.
Table 7: Ranking of Highest Volume Diagnoses for “Community Beneficiaries” by Year, 1997-2000
Percent (rank)
Primary ICD9 Diagnosis 1997 1998 1999 2000 250- Diabetes 8.6 (1) 7.6 (1) 6.9 (1) 6.2 (1) 401- Essential hypertension 7.7 (2) 6.2 (2) 5.5 (3) 5.3 (3) 428- Heart failure 5.3 (3) 5.0 (3) 4.7 (4) 4.6 (4) 707- Chronic ulcer of the skin 3.6 (4) 4.6 (4) 5.7 (2) 5.6 (2) 715- Osteoarthritis 3.2 (5) 3.3 (5) 3.2 (5) 3.6 (5) Source: Department of Health and Human Services, Office of Inspector General. Medicare Home Health Care Community Beneficiaries 2001, #OEI-02-01-00070. October 2001.

10
Table 8: Number of Home Health Care Workers, (2008) and Medicare-certified Agency FTEs (2009)
Type of Employee
Total Number of Home Health
Employees1
Number of Medicare
Home Health FTEs2
RNs 132,400 92,113 LPNs 62,100 44,646 Physical Therapy Staff 22,700 26,823 Home Care Aides 324,400 65,146 Occupational Therapists 6,500 8,215 Social Workers 16,200 5,077 Other 393,700 78,420 Totals 958,000 290,439 Sources: 1 U.S. Department of Labor, Bureau of Labor Statistics, National Industry-Occupational Employment Matrix, data for 2008. Excludes hospital-based and public agencies. Home Health Aides, Personal and Home Care Aides, and Personal Care and Service Workers are included in the Home Care Aides category of the BLS data. (February 2010) 2 Unpublished data on FTEs in Medicare-certified home health agencies for calendar year (CY) 2009 from the Centers for Medicare & Medicaid Services HCFA Center for Information Systems, Health Standards and Quality Bureau. (February 2010).

11

12
Table 9: Home Health Care Visit Staff Productivity (Actual Visits Performed)
Staff Type
Productivity (per 8 Hours)
RN 4.96 LPN/LVN 5.90 Home Care Aide 5.17 Physical Therapist 5.39 Occupational Therapist 5.30 Social Worker 3.48 Source: National Association for Home Care & Hospice, Hospital & Healthcare Compensation Service. Homecare Salary & Benefits Report 2009-2010. October 2009.
Table 10: Average Compensation of Home Health Agency Executives, October 2009
Salary Range by Percentile
Median (25th, 75th) Executive Director/CEO $125,080 (98,640, 179,900) Chief Operating Officer/ Program Director
83,000 (74,187, 100,000)
Top Level Financial Executive 99,951 (81,500, 124,000) Director of Clinical Services 75,000 (67,777, 84,534) Director of Social Work and Counseling
62,600 (55,200, 70,224)
Quality Improvement/ Utilization Review Manager
66,895 (57,047, 78,000)
Source: National Association for Home Care & Hospice, Hospital & Healthcare Compensation Service. Homecare Salary & Benefits Report 2009-2010. October 2009.

13
Table 12: Comparison of Hospital, SNF, and Home Health Medicare Charges, 2005-20091 2005 2006 2007 2008 2009 Hospital (per day) $4,999 $5,475 $5,895 $6,196 $6,200 SNF (per day) 504 519 558 590 622 Home health (per visit) 125 129 130 134 135 Sources: The hospital Medicare charge data for 2005-2007 are from the Annual Statistical Supplement, 2008, to the Social Security Bulletin, Social Security Administration online (www.ssa.gov). SNF data for 2005 are from the Annual Statistical Supplement, 2007, to the Social Security Bulletin, Social Security Administration online (www.ssa.gov). Home health information 2005 data are from the Health Care Financing Review, Statistical Supplement, Centers for Medicare & Medicaid Services, 2006. Home health information 2006 data are from the Health Care Financing Review, Statistical Supplement, Centers for Medicare & Medicaid Services, 2007. Home health information 2007 data are from the Health Care Financing Review, Statistical Supplement, Centers for Medicare & Medicaid Services, 2008.Home health information 2008 data are from the Health Care Financing Review, Statistical Supplement, Centers for Medicare & Medicaid Services, 2009. Note: 1Hospital data for 2008 and 2009 were updated using the Bureau of Labor Statistics’ (BLS) Producer Price Index (PPI) for General medical and surgical hospitals by payor types, Medicare patients. Skilled nursing facility data for 2006, 2007, 2008 and 2009 were updated using BLS’ PPI for Nursing care facilities, Public payors. Home health data for 2009 were updated using the BLS’ PPI for Home health care services, Medicare payors. (www.bls.gov).
Table 11: Average Compensation of Home Health Agency Caregivers, October 2009
Per-Hour Rates by Percentile Per-Visit Rates by Percentile
25th Median 75th 25th Median 75th
Registered Nurse $25.64 $27.79 $31.09 $31.75 $35.13 $40.00
LPN/LVN 17.97 19.81 22.47 20.74 23.38 26.55 Occupational Therapist 31.00 34.13 36.52 53.88 58.50 62.00
Physical Therapist 34.49 37.22 40.37 56.05 60.00 65.00
Respiratory Therapist 21.88 23.44 24.96 55.00 75.00 82.50
Speech/Language Pathologist 30.41 33.65 38.57 55.00 59.92 65.00 Medical Social Worker 20.78 23.48 26.56 45.00 51.50 60.00
Home Care Aide III 10.98 12.11 13.38 12.25 13.75 15.50 Source: National Association for Home Care & Hospice, Hospital & Healthcare Compensation Service. Homecare Salary & Benefits Report 2009-2010. October 2009.

14
Table 13: Cost of Inpatient Care (Per Patient per Month) Compared to Home Care, Selected Conditions
Conditions
Hospital Costs
Home Care Costs
Dollar Savings
Low birth weight1 $26,190 $330 $25,860 Ventilator-dependent adults2 21,570 7,050 14,520 Oxygen-dependent children3 12,090 5,250 6,840 Chemotherapy for children with cancer4 68,870 55,950 13,920 Congestive heart failure in the elderly5 1,758 1,605 153 Intravenous antibiotic therapy for cellulitis, Osteomyelitis, others6
12,510 4,650 7,860
Sources: 1Casiro, O.G., McKenzie, M.E., McFayden, L., Shapiro, C., Seshia M.M.K., MacDonald, N., Moffat, M., and Cheang, M.S. “Earlier Discharge with Community-based Intervention for Low Birth Weight Infants: A Randomized Trial.” Pediatrics 92, no. 1 (1993): 128-134. 2Bach, J.R., Intinola, P., Alba, A.S., and Holland, I.E. “The Ventilator-assisted Individual: Cost Analysis of Institutionalization vs. Rehabilitation and In-home Management.” Chest 101, no. 1 (1992): 26-30. 3Field, A.I., Rosenblatt, A., Pollack, M.M., and Kaufman, J. “Home Care Cost-Effectiveness for Respiratory Technology-dependent Children.” American Journal of Diseases of Children 145 (1991): 729-733. 4Close, P., Burkey, E., Kazak, A., Danz, P., and Lange, B. “A Prospective Controlled Evaluation of Home Chemotherapy for Children with Cancer.” Pediatrics 95, no. 6 (1995): 896-900. (Note: The study found that the daily charges for chemotherapy were $2,329±$627 in the hospital and $1,865±$833 at home. These charges were multiplied by 30 days reflecting the above per-patient per-month costs.) 5Rich, M.W., Beckham, V., Wittenberg, C., Leven, C., Freedland, K., and Carney, R.M. “A Multidisciplinary Intervention to Prevent the Readmission of Elderly Patients with Congestive Heart Failure.” The New England Journal of Medicine 333, no. 18 (1995): 1190-1195. 6William, D.N., et al. “Safety, Efficacy, and Cost Savings in an Outpatient Intravenous Antibiotic Program.” Clinical Therapy 15 (1993): 169-179, cited in Williams, D., “Reducing Costs and Hospital Stay for Pneumonia with Home Intravenous Cefotaxime Treatment: Results with a Computerized Ambulatory Drug Delivery System.” The American Journal of Medicine 97, no. 2A (1994): 50-55. (Note: The estimated hospital cost/day/patient is $417 and the estimated savings/day/patient is $262. These costs were multiplied by 30 days, reflecting the above per-patient per-month costs.)