Embed Size (px)
Citation preview

ADSORPTION CHARACTERISTICS OF COALS WITH SPECIAL
REFERENCE TO THE GETHING FORMATION,
NORTHEAST BRITISH COLUMBIA
By Barry Ryan and Bob Lane
KEYWORDS: Coalbed methane, Adsorption, GethingFormation, petrography, coal ash.
INTRODUCTION
There are two major coal-bearing formations in thePeace River Coalfield in northeastern British Columbia,The Gates and the Gething. The younger Gates Formationhosts to the two major coal mines that have operated in thearea; therefore there is some coalbed methane (CBM) in-formation available for the formation. In contrast there isvery little CBM information available for the olderGething Formation. This paper presents some coal ad-sorption data for the Gething Formation.
The two major coal-bearing formations in northeastBritish Columbia (Figure 1) outcrop extensively through-out the Peace River coalfield. The Gates Formation isseparated from the older Gething Formation by the ma-rine Moosebar Formation. Coal seams of economic inter-est in the Gates Formation and Gething formations occurin the southern and the northern parts of the coalfield re-spectively, which roughly coincides with the north andsouth of Mount Spieker (Figure 2).
THE GETHING FORMATION
The Gething Formation, which is late Jurassic toearly Cretaceous, overlies the Cadomin Formation (Table1). Therefore it is slightly younger than the Mist Moun-tain Formation, which underlies the Cadomin in thesoutheast British Columbia coalfields. The type sectionfor the Formation is in the Peace River Canyon where it is550 metres thick (Gibson, 1985). It thins to the south andat the Saxon property at the southern end of the coalfieldis only 7 metres thick. In the area around the Sukunkaproperty (Figure 2) the upper and lower coal-bearing partof the Gething is separated by a marine tongue (Duff andGilchrist, 1981 and Legun, 1986) and economic coalseams are found in the upper and lower non-marine sec-tions. The extent of the upper Gething coal-bearing zoneis limited to the Sukunka River, Mt. Spieker area, but ithas been suggested that there are other marine tongues inthe Gething that wedge out to the south (Broatch, 1987).Leckie and Kalkreuth (1990) have suggested that LowerCretaceous coals formed in a strand plain environmentthat was distant and protected from the shoreline and
storm/tidal inundations. The Formation extends at depthto the east into the Western Canadian Sedimentary Basin,where it hosts a number of gas plays. The Formation hasbeen extensively explored, from Mount Spieker in thesouth to Williston Lake in the north (Figure 2), for its po-tential to host surface and underground coal mines as doc-umented by numerous coal assessment reports from theMinistry of Energy and Mines.
There has been very limited mining in the GethingFormation despite the fact that it hosts the first coal to bediscovered in British Columbia by Mackenzie in 1793.More recently the Pine Valley Coal Corporation has ob-tained permits for a mine in the Willow Creek area lo-cated 40 kilometres west of Chetwynd (Figure 2). To datethey have mined, screened and sold about 70 000 tonnesof coal probably to be used for pulverized coal injection(PCI) and hope to expand into full-scale production soon.
For this study a number of samples were collected inthe summer of 2001from a single seam in the Pine ValleyCoal test pit representing a range of petrographic compo-sition. The adsorption characteristics of these seven sam-
Geological Fieldwork 2001, Paper 2002-1 83
TABLE 1GENERALIZED LOWER CRETACEOUS
STRATIGRAPHY, PINE RIVER AREA
metres
CRUISER FORMATION
marine s hale 115
GOODRICH FORMATION
fine grained s ands tone and s hale 350
HASLAR FORMATION
marine s hale 260
BOULDER CREEK FORMATION
s ands tone and conglomerates 150
HULCROSS FORMATION
grey marine s hale 100
GATES FORMATION
non marine s ands tones and coal s eams 110
MOOSEBAR FORMATION
marine s hale 250
GETHING FORMATION
non marine s ediments and coal
500
CADOMIN FORMATION
conglomerates 150
BU
LL
HE
AD
GR
OU
PF
OR
TS
TJO
HN
GR
OU
P
Jura
ssic
tolo
wer
Cre
tace
ous
.

84 British Columbia Geological Survey
Moberly
Moberly
Ck
Williston
L.
Moberly L.
Pin
e
River
Sukunka
R
Murr
ay
R
Murr
ay
R
Parsnip
Parsnip
River
River
Imperial
Fla
tbed
R
L
Wapiti
Wapiti Ck
Sukunka
KinuseoCk
Ck
LArctic
Monkman
L
R
Lakes
Blue
Gwillim L.
DawsonCreek
Bri
tis
hC
olu
mb
ia
Alb
ert
a
Farrell Creek
HudsonHope
SunriseValley
Chetwynd
Tumbler Ridge
Anzac
Gates Formation
Gething Formation
50 km
Railroad
N
Figure 1. Gething and Gates formations outcrop pattern northeastern British Columbia.

ples were measured and attempts made to correlate the re-sults with various coal parameters.
PETROGRAPHY
Ryan (1997) has summarized the coal quality and pe-trography of the Gething Formation. Coal from the For-mation is characterized by variable reactives content andlow wash ash values. Reactive maceral contents canrange from approximately 80% to less than 50%. Thisvariation can explain some of the range of free swellingindex (FSI) values seen in exploration coal quality data,but it does not explain the washing characteristics of thecoal. The coal samples from Willow Creek have a highcontent of collodetrinte, which contains fragments ofnon-structured inert macerals such as macrinite andinertodetrinite. Structured macerals, such as semifusiniteand fusinite are less common. Some of the collotelinitecould be classified as semifusinite depending on thereflectance cut off. There is a lot of pseudo vitrinite(Photo 1), characterized by small lenses shaped holes,present in some samples. It may be evidence of partialdesiccation of partially coalified material. In this tempo-rary dry environment in the coal swamp any forest fireswould char partially rotten vegetation, which having lostits cell structure would become macrinite rather thansemifusinite after coalification.
The limited amount of structured inert macerals(semifusinite and fusinite) restricts the amount of dis-persed mineral matter, which often fills cell lumen inthese macerals. There also are few bands of carbonaceousshale in the samples, composed of finely dispersed ashand vitrinite particles, in the coal. These two factors prob-ably explain the low raw ash and very low wash ash con-centrations of seams in the formation. Wash-ash contentsof Gething coals are consistently lower than those ofGates or Mist Mountain coals.
Preliminary observations of the 7 samples collectedfrom the Willow Creek property indicate that samplescontain a lot of particles made up of more than onemaceral. Groundmasses of collodetrinite contain frag-ments of macrinite, collotelinite and occasionallysemifusinite (Photo 2). There is little dispersed mineralmatter in collodetrinite. In fact most of the finely dis-persed mineral matter is associated with telinite orgelovitrinite (Photo 3). Generally compared to coals fromthe Mist Mountain Formation there is less fusinite andsemifusinite and consequently less preserved cell struc-ture
The generation of collodetrinite and macrinite oftenindicates a prolonged period of humification and destruc-tion of biomass, which is accompanied by a concentra-tion, in the remaining biomass, of the inherent mineralmatter derived from the original vegetation. This finelydispersed mineral matter may affect the adsorption char-acteristics of the coal. The amount of inherent mineralmatter in vegetation varies but can be as much as 8%(Renton et al., 1979). It contains high concentrations ofbase oxides, which may be partially lost duringcoalification. It is estimated that from 1.5% to 2.5% of themineral matter in bituminous coals may be derived fromthe original vegetation. The relationship of the amount of
Geological Fieldwork 2001, Paper 2002-1 85
Figure 2. Location of coal mines and deposits in northeastern Brit-ish Columbia.
Photo 1. Psuedo vitrinite in Gething coal showing elliptical cavi-ties. Width of photo approximately 0.2 mm.

biomass destroyed to the volume percent of inherent min-eral matter in the remaining coal indicates that very highamounts of biomass must be destroyed to produce signifi-cant increases in the volume of inherent mineral matter.
Many post Carboniferous coals are enriched ininertinite with respect to Carboniferous coals. One possi-ble explanation (Taylor et al., 1989) is that the highinertinite content of Permian Gondwana coals is causedby a cool climate with wet summers and dry cold winters,during which the coal swamp dried out and inertinite de-veloped. This environment might produce a fine layeringof lithotypes similar to varves seen in clays. Possibly thecool climate and lack of ground covering vegetation alsoallowed dust to blow into the swamp which would explainthe high contents of dispersed mineral matter found insome of these coals. Hunt and Smyth (1989) suggest thatAustralian Permian coals with high inertinite, and low ashcontents formed in cratonic basins in fresh water mires,with low subsidence rates, allowing for extensive oxida-tion. Lamberson et al. (1991) emphasize the importanceof fires in forming inertinite in Gates coals. There is noobvious explanation for the variable and sometimes highcontent of inertinite in Gething coals. Gething coalswamps may have experienced more episodes of dryingand a greater frequency of forest fires than Gates swamps.
RANK
Karst and White (1979) Kalkreuth and McMechan(1988) and Kalkreuth et al. (1989) have all discussed coalrank in the Gething Formation. Rank varies from semi an-thracite to high-volatile bituminous. Along the outcropbelt in the foothills the rank is high, in places reaching
semi anthracite. To the north and east it decreases tohigh-volatile bituminous. There is some evidence thatoutcrops at the western outcrop edge of the formationhave lower ranks. Rank was established prior to deforma-tion and variations are related to changes in the thicknessof the Gething plus post Gething sedimentary package.Ref Leckie, 1983).
The rank at Willow Creek, where the samples werecollected ranges from medium to low-volatile bitumi-nous. The rank of 7 seam, which is in the lower part of thesection is low-volatile bituminous (WC001-6 Rmax =1.70% and WC001-4 Rmax=1.73%). Some of the sam-ples have pseudo vitrinite and using this maceral to mea-sure Rmax produced a value that was 0.02% high.
WILLOW CREEK SAMPLE DATA
SAMPLE COLLECTION
Samples were collected from the Pine Valley Coaltest pit in the Willow Creek property located on the southside of the Pine River about 40 kilometres west ofChetwynd (Figure 2). In this area the Gething Formationhas 8 coal seams ranging in thickness from 1 to over 5metres and numbered downwards from the top of the for-mation. Samples were collected from seam 7-0 and seam7-2 (Figure 3). A mudstone parting (30 cm thick), whichseparates seam 7-0 from 7-2, was used as a referenceplane for sample location. Two samples (WC001-1 andWC001-2) representing a total of 2.74 metres were col-lected above the parting and a third sample representing0.7 metres of 7-2 seam was collected adjacent to and be-low the mudstone parting. The base of seam 7-2, which is1.1 metres thick, was not exposed. Four grab samples, 2 ofbright and 2 of dull coal, were taken from seam 7-0.
Total apparent thickness of 7-0 seam, based on a den-sity log from a nearby hole, is about 3.6 metres; 2 metresof buff-coloured sandstone immediately overlies 7-0
86 British Columbia Geological Survey
Photo 2. Groundmass of collodetrinite containing fragments ofmacrinite, collotelinite and semifusinite. . Width of photo approxi-mately 0.2 mm.
Photo 3. Finely dispersed dark mineral matter associated withtelinite. Width of photo approximately 0.2 mm.
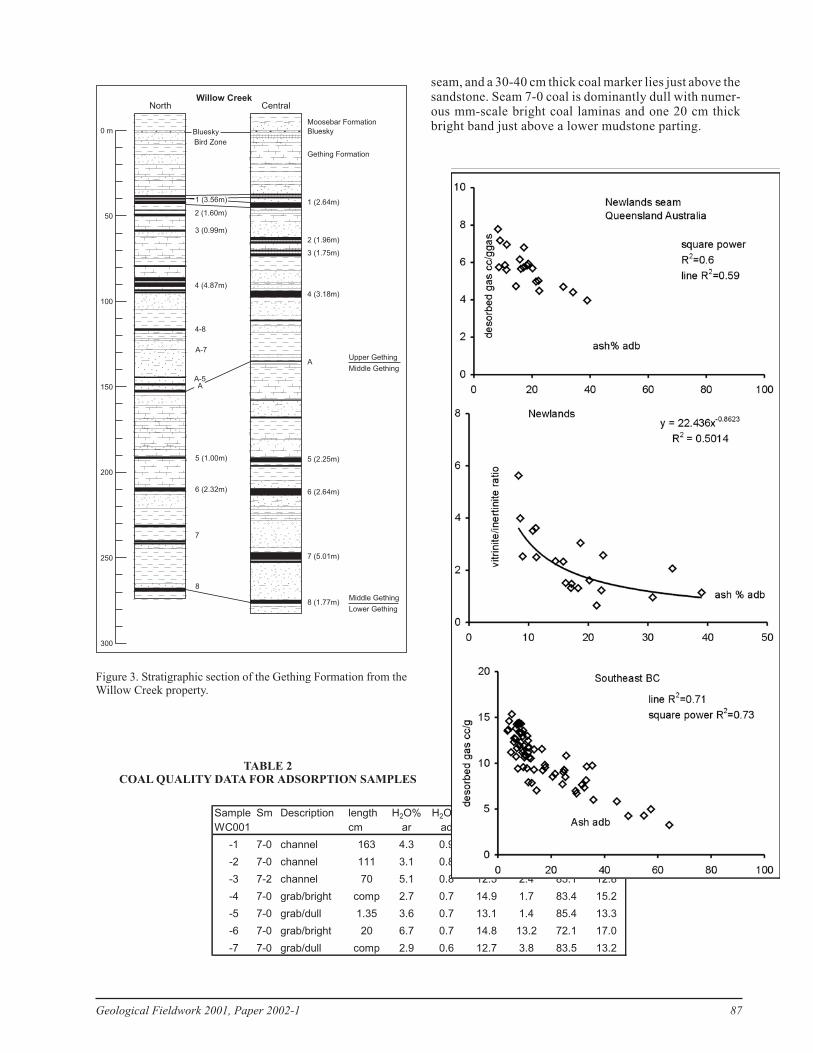
seam, and a 30-40 cm thick coal marker lies just above thesandstone. Seam 7-0 coal is dominantly dull with numer-ous mm-scale bright coal laminas and one 20 cm thickbright band just above a lower mudstone parting.
Geological Fieldwork 2001, Paper 2002-1 87
0 m
50
100
150
200
250
300
Bluesky
Bird Zone
North CentralWillow Creek
Moosebar Formation
Bluesky
Gething Formation
1 (2.64m)
2 (1.96m)
3 (1.75m)
4 (3.18m)
6 (2.64m)
7 (5.01m)
8 (1.77m)
5 (2.25m)
AUpper Gething
Middle Gething
Middle Gething
Lower Gething
1 (3.56m)
2 (1.60m)
3 (0.99m)
4 (4.87m)
4-8
A-7
A-5
5 (1.00m)
6 (2.32m)
7
8
A
Figure 3. Stratigraphic section of the Gething Formation from theWillow Creek property.
TABLE 2COAL QUALITY DATA FOR ADSORPTION SAMPLES
Sample Sm Description length H2O% H2O% VM% Ash% FC% VM%
WC001 cm ar ad dry dry dry daf
-1 7-0 channel 163 4.3 0.9 12.7 1.8 85.5 13.0
-2 7-0 channel 111 3.1 0.8 12.4 12.7 74.9 14.2
-3 7-2 channel 70 5.1 0.8 12.5 2.4 85.1 12.8
-4 7-0 grab/bright comp 2.7 0.7 14.9 1.7 83.4 15.2
-5 7-0 grab/dull 1.35 3.6 0.7 13.1 1.4 85.4 13.3
-6 7-0 grab/bright 20 6.7 0.7 14.8 13.2 72.1 17.0
-7 7-0 grab/dull comp 2.9 0.6 12.7 3.8 83.5 13.2

COAL QUALITY AND PETROGRAPHYOF SAMPLES
Proximate analyses were performed on all samples ofseam 7-0 and 7-2 (Table 2). With the exception of twosamples, ash contents are very low (Table 2) and VM dafconcentrations indicate a rank of low-volatile bitumi-
nous, which is supported by 2 Rmax determinations ofWC001-6 = 1.7% and WC001-4 = 1.73%.
The petrography of the samples (Table 3) indicates awide range in total reactives contents from 48% to 81% ofsample. Some of the samples contain a lot of pseudovitrinite (Photo 1), the reflectance of which was checkedand found to be similar to, or slightly higher than, that ofcollodetrinite. As previously discussed semifusinite andfusinite with good cell structure makes up less of the inertmaterial than in coals from many other formations.
Coal petrography tends to be a somewhat subjectiveprocess that is hard to standardize. For this reason, ran-dom reflectance histograms were constructed for eachsample to see if they might provide a better estimate ofvariations of petrography as defined only by reflectance.The histograms are produced using a computerized scan-ning process in which maceral fragments are scanned forrandom reflectance under the microscope. The computeris able to extract measurements of minerals or measure-ments influenced by edge effects from the data. For mostsamples clear vitrinite and inertinite peaks can be inter-preted from the original distr ibut ion of randomreflectance data (Figure 4). The data (Table 4) indicatethat there is a very wide range of total vitrinite contents asrecognized by random reflectance (8% to 94% on a dry
88 British Columbia Geological Survey
TABLE 3PETROGRAPHY FOR SAMPLES 300 POINT COUNT
VOLUME PERCENTS
sam
ple
telin
ite
collo
telin
ite
collo
detr
inite
vitro
detr
inite
liptinite
tota
lre
actives
sem
ifusin
ite
fusin
ite
inert
odetr
inite
macrinite
mic
rinite
tota
lin
ert
s
min
era
lm
att
er
weig
ht
ash%
WC001-1 1 21 39 1 0 62 12 3 11 5 3 33 5 8.3
WC001-2 0 20 39 2 0 61 10 2 9 6 2 28 10 16.3
WC001-3 8 5 32 1 0 47 23 2 6 19 0 51 2 4.0
WC001-4 27 1 48 0 0 76 7 0 4 9 1 22 1 2.3
WC001-5 4 17 36 0 1 58 23 2 4 9 2 40 2 4.0
WC001-6 24 21 34 1 0 81 1 1 1 0 2 6 13 20.5
WC001-7 2 7 44 0 0 53 14 0 9 20 2 44 3 4.5
TABLE 4SUMMARY OF RANDOM REFLECTANCE DATA
0
0.2
0.4
0.6
0.8
1
1.2
1.4
1.6
1 1.25 1.5 1.75 2 2.25 2.5
random reflectance%
frequency
%
Vitrinite 38.2% with mean random reflectance of
1.55% calculated Romax 1.66%
Inertinite 61.8% at a reactive maceral boundary of
1.55%
reactive semifusinite 0.07% inert inertinite 61.73%
total inerts (with 5% mineral matter 81.3%)
actual
data
modified vitrinite
curve
modified inerts
curve
Figure 4. Histogram of random reflectances for sample WC001-4.
Sam
ple
WC
001-
calc
ula
ted
Rm
ax%
vitrinite
%
random
reflecta
nce
reactive
sem
ifusin
ite
% macera
lboundary
reflecta
nce
inert
inert
inite
%
mean
random
reflecta
nce
inert
inite
1 1.67 8.0 1.56 41.7 1.82 50.3 1.82
2 1.66 38.2 1.55 0.1 1.55 61.7 1.84
3 1.66 14.8 1.55 17.3 1.80 67.9 1.88
4 1.65 54.8 1.54 4.8 1.70 40.4 1.54
5 1.67 18.8 1.56 28.6 1.74 52.6 1.80
6 1.65 93.7 1.54 0.8 1.54 5.5 1.65
7 1.67 12.6 1.56 10.7 1.76 76.7 1.90

mineral matter free basis, dmmfb) and that Rmax values
calculated from random reflectance (1.65%-1.67%) are
some what lower than Rmax values measured on samples
WC001-4 and WC001-6.
Acomparison of total vitrinite by random reflectance
histograms versus microscope examinations (Figure 5)
provides a good correlation though the best-fit line does
not go through the origin because microscope identifica-
tion has tended to identify more vitrinite in the low
vitrinite samples. The reason appears to be that the low
vitrinite samples contain more reactive semifusinite as
identified by reflectance profile and this material is iden-
tified as telinite during microscope petrography. The
vitrinite macerals have a higher volatile content than the
inert macerals and both methods of identifying vitrinite
contents produce data that correlate well with VM daf
(Figure 5). This means that once the quality of a coal seam
is understood, VM daf gives a good and very cheap esti-
mate of reactivity and can be used to correlate with ad-
sorption characteristics.
ADSORPTION DATA
Adsorption isotherms were measured at 25ºC, whichprobably corresponds to crustal temperatures at a depthof about 1000 metres. This means that using Langmuirvolumes (Vl) and Langmuir pressures (Pl) to calculateadsorption at shallower depths will under estimate ad-
Geological Fieldwork 2001, Paper 2002-1 89
0
20
40
60
80
100
0 20 40 60 80 100
vitrinite by reflectance histogram volume %
vitrinite
by
petr
ogra
phy
volu
me
%
0
20
40
60
80
100
12 14 16 18
Volatile matter % daf
vitrinite
by
reflecta
cne
his
togra
m
volu
me
%
Figure 5. Total reactives by petrography and random reflectancehistograms.
TABLE 5SUMMARY OF ADSORPTION DATA
isotherms at 25º C
ash% H2O% Vl cc/g Vlcc/g Pl
sample ad equil ar daf Mpa
WC001-1 1.3 5.0 30.2 32.3 2.08
WC001-2 15.6 2.6 24.0 29.4 2.44
WC001-3 2.0 6.2 30.8 33.5 2.57
WC001-4 1.6 3.4 37.1 39.0 3.25
WC001-5 1.1 5.0 33.4 35.6 2.73
WC001-6 13.7 3.6 25.0 30.2 3.63
WC001-7 2.6 3.8 32.5 34.7 3.27
Vl Langmuir volume Pl Langmuir pressure.
Figure 7. Total reactives versus langmuir volume dmmf basis;
filled data points have high ash contents.
Figure 6. Comparison of Gething coal desorption curves to thecurve predicted by the Ryan Equation for a reflectance of 1.7%.

sorption capacity and if the depths are greater than 1000metres adsorption capacity will be over estimated. Ad-sorption results (Table 5) indicate that in general termsthe samples have high adsorption capacities (Figure 6).This is not surprising and is in agreement with the highrank, though based on the Eddy et al., (1982) curves andthe equation derived from Ryan (1992), they are some-what higher than the norm. It should be noted that theRyan Equation was set up to model the Eddy curves and atthe same time to be somewhat conservative.
Langmuir volumes (Vl) of the samples do not have aclear relationship to petrography based on a plot of Vldmmf concentrations versus total vitrinite by random
reflectance histogram (volume percent basis) (Figure 7).The two samples that have distinctly higher ash contentsare highlighted (Figure 7) and if these 2 samples are re-moved from the data set, then there is a moderate correla-tion between total vitrinite and adsorption contents. Theadsorpt ion versus vi t r in i te content (by randomreflectance histogram) relationship is more diffuse if re-active semifusinite is added to vitrinite, implying that re-active semifusinite is not acting as a vitrinite maceral interms of its adsorption ability. The fact that there is a mod-erately good relationship between adsorption andvitrinite content as defined by random histograms indi-cates that in this data set the structure of maceral sub typesmay not play a major part in influencing adsorption abil-ity. It has been suggested that collodetrinite may have ahigher adsorption capacity than telinite and collotelinite(Gurba, 2001).
There is nothing obviously anomalous about the twohigh ash samples in terms of their petrography or VM dafcontents. If there had been a problem with equilibratingthe samples back to equilibrium moisture the Vl valueswould generally increase. It is possible that the low Vlvalues are caused by ash acting as a more than a simpledilutent.
The Langmuir pressure (Pl) is independent of ashcontent and may be a better indicator of the effect of pe-trography on adsorption characteristics. It is dependenton rank, generally decreasing as rank increases (Figure 8)(Olszewski, 1992). Olszewski data were obtained on drycoal and indicate that dry coals of equivalent rank have in-creased adsorption capacities and reduced Langmuirpressures. There is no obvious relationship between Pland petrography in this study (Figure 8). If the two highash samples are removed, then there is weak positive cor-relation of Pl with total reactives, which would imply thatthe effect of increased reactives is similar to a decrease inrank. Part of the reason for the weak or absent correlationof Pl to petrography may be the high rank of the samples.The physical properties of macerals, including porosity,tend to converge at higher ranks.
Moisture content, below equilibrium moisture, has aprofound influence on adsorption capacity. Joubert(1974) investigated the effect of moisture on the adsorp-tive capacity of coals of different ranks and found that itincreased as the moisture decreased below equilibriummoisture. The equilibrium moisture of individualmacerals varies and vitrinite of low to medium rank hashigher equilibrium moistures than inertinite. There is nocorrelation of equilibrium moisture with petrography inthis study. However for many British Columbian coals,air-dried and equilibrium moisture correlate positivelywith vitrinite content and negatively with ash content.This means that, at constant rank, equilibrium moisturemay be an indicator of adsorption ability. It appears thatiso-rank coals from different basins are characterized bydifferent average equilibrium moisture contents. In factthere is a rough trend for data suites with lower equilib-rium moisture to contain more gas (Bustin and Clarkson,1998). It is not clear if changes in equilibrium moisture
90 British Columbia Geological Survey
Figure 8. Plot of VM daf versus Langmuir pressure data fromOlszewski (1992), and this study.

content for different suites are related to variations in the
vitrinite sub-types, the history of the coal or the original
vegetation source. Equilibrium moisture varies by rank
and maceral content going through a minimum at the
boundary between high and medium-volatile bitumi-
nous. Above this rank the difference in equilibrium mois-
ture contents of the various macerals is less pronounced.
It is also probably pressure dependent. In coal seams that
are pressured by free gas, it is possible that moisture con-
tents of coals are below equilibrium moisture. This would
increase the coals ability to adsorb gas and would make it
look over saturated, based on desorption data, depth and
rank. Just as water movement has been used to explain un-
der saturated coals, free gas movement in seams might re-
move water and increase the adsorption capacity and gascontent of seams.
DISCUSSION
EFFECT OF TEMPERATURE AND PRESSURE ON
ADSORPTION CAPACITY AND POTENTIAL GAS
CONTENT
This paper discusses adsorption ability, but it is theactual volume of adsorbed gas that is available for recov-ery that is important. It is revealing to construct a sche-matic plot (Figure 9) outlining the tract of coal on a down-ward coalification curve with a number of upwardbranches representing uplift tracts for coals, which haveattained different ranks. The plot does not attempt to ex-actly reproduce temperatures, depths and adsorptioncharacteristics of coals of different ranks, though num-bers are probably within a moderate margin of error. BothKim (1977) and Olszewski (1992) have developed empir-ical equations predicting gas contents at varying coalranks and temperatures. However, they were using dataderived from dry coals tested over a temperature range of0 to 50 degrees. The equations are therefore probably notreliable at the higher temperatures at which bituminouscoals form. As vegetation is progressively buried, rank,pressure and temperature all increase. Initially adsorp-tion capacity also increases, but eventually increasingtemperature causes it to decrease. Over a temperaturerange of 20 to 65ºC Levy et al. (1997) found that adsorp-
tion decreased by 0.12 cc/g per � C. During most of theirburial tract coals are producing CH4 in excess of their ad-sorption capacity and the excess is expelled into the sur-rounding rocks. Upon uplift, rank is fixed and tempera-ture and pressure decrease. At depths considerablygreater than those equivalent to Pl, adsorption capacity isgenerally not pressure dependent and adsorption capacityincreases as temperature decreases. It is only at depthsequivalent to about Pl x 2 that the effect of decreasingpressure becomes dominant and adsorption capacity de-creases with uplift. This means that most coals must scav-enge CH4 during uplift in order to achieve saturation. Theplot (Figure 9) indicates that higher rank coals probablyhave to scavenge large amounts of CH4 during uplift ifthey are to achieve saturation at shallow depths. There-fore one should not be surprised that many coals are eitherunder saturated or contain biogenic CH4 . In fact, based onthe importance of biogenic CH4, which may provide theonly viable way of re-saturating coals during uplift, theremight well be a negative correlation of degree of satura-tion with depth in some coalfields.
Coal generates much more gas during coalificationthan it can adsorb and the excess is expelled into the sur-rounding rocks. If it is contained in these rocks at depththen the rocks become gas saturated rather than water sat-urated. It is possible to estimate the amount of gascharged into surrounding rocks. This has been done byMeissner (1984) and by the authors. Estimates need totake account of the effect of increasing temperature and
Geological Fieldwork 2001, Paper 2002-1 91
Figure 9. Schematic plot of rank versus adsorption as coalis buried and uplifted.
its effect on the adsorption ability of the coal. As an ap-proximate calculation, a coal buried such that its rankreaches 1.5% Rmax will generate enough excess gas tosaturate about 5 times its volume of surrounding rock,based on a porosity of 4%. During uplift to 500 metres thegas will expand to fill over 40 times the coal volume. Ifcoals are buried to greater depths, reach higher ranks, andgenerate more excess gas, then the volumes of surround-ing rock that they can saturate are even larger. These cal-culations require estimates of a number of relationshipsincluding, the amount of gas generated by coal duringcoalification, the effect of temperature on adsorption,temperature gradients, and a relationship between rankand temperature. Obviously only order of magnitude esti-mates can be made of the effect of coal gas on the sur-rounding stratigraphy. Oh the other hand if the stratigra-phy is gas saturated it is probable that the coal will remainsaturated, in terms of adsorption, during uplift. Also it ispossible that gas saturation could lead to a reduction in themoisture content of the coal below equilibrium moisture,producing apparent adsorption over saturation whencompared to an isotherm run at equilibrium moisture.
RELATIONSHIP BETWEEN COAL COMPOSITION
AND ADSORPTION CAPACITY
Different macerals have different adsorption capaci-ties and generate different amounts of gas. Vitrinite gen-erates much more gas during coalification than inertinite,but based on the work of Ettinger et al. (1967) may havelower adsorption capacities at high temperatures in condi-tions where moisture has less influence on adsorption. Inbanded coals, at high temperatures, inertinite may retainmore gas than vitrinite. On uplift a banded or inertiniterich coal would have to scavenge less methane to achievesaturation. Coals in which inertinite has similar adsorp-tion capacities to vitrinite may have a better chance of be-ing saturated during uplift.
There are a number of papers in the literature thatstudy the influence of coal composition on the adsorptionability of coal. Early literature generally dealt with coalsdried below equilibrium moisture and is therefore diffi-cult to compare to more recent data. Some of the earlierpapers include the work of Ettinger et al. (1966). Theyfound distinct differences in the adsorption capacity ofvitrinite-rich versus inertinite-rich coals. Both types ofcoals exhibit a minimum adsorption capacity at a rank ofabout Rmax=0.8%. The minimum increased in intensitywith increasing pressure and temperature. Levine (1993)suggests that hydrocarbons generated at about this rankblock micro pores and reduce adsorption capacity, espe-cially that of vitrinite, but not necessarily that ofinertinite. Ettinger et al. (1966) indicated that inertiniterich coals had higher adsorption capacities than thevitrinite rich coals. They do not indicate the moisture con-tents of samples analyzed and they may have been belowequilibrium moisture. The samples studied by Ettingergenerally had low ash contents (less than 10%), which isimportant because it tends to remove the added confusionof ash as a variable when interpreting the results. Based on
their results, for coals of medium or low-volatile rank theratio of adsorptive capacities inertinite/ vitrinite was 1.5to 2 at high pressures. The ratio decreased at low pres-sures, but remained greater than 1. Ettinger et al. also statethat the rate of desorption was faster from inertinite thanfrom vitrinite. Levy et al. (1997) found that where as theadsorption capacity of coals at equilibrium moisture con-tents increased moderately consistently with rank thesame was not true for coals dried below equilibrium mois-ture.
Ulery (1988), studying coals from Pennsylvania,found that desorbed gas content was related to vitrinitereflectance and not maceral content. Gas contents werealso influenced by local geological factors such as roof li-thology and local folding. Most of his samples containedover 75% vitrinite on a mineral matter-free basis so that itis difficult to use his database of 88 samples to test for anymaceral influence on gas content, especially because ofthe wide range in mean maximum reflectance values(Rmax 0.6% to 1.1%) which strongly influence gas con-tent.
Faiz and Cook, (1992) found that depth of cover hadan overriding effect on gas content but that inertinite richcoals of Permian age from southern part of the SydneyCoalfield in Australia tended to contain more gas thanvitrinite rich coals. They studied samples collected fromthe Bulli, Cape Horn and Wongawilli seams with ranksranging from 1.1% to 1.5%. Within this range and for awide range of ash contents they derived the following re-lationship:
m3/tonne gas = -19.4 + 0.0383 x depth(m) + .0292 xinerts% - 0.153 x MM + 7.63x Rmax% (R2=0.65).
A review of earlier literature does not indicate a clearmaceral control on adsorption capacity or desorbed gascontent, possibly because researchers were analyzingcoals below equilibrium moisture. More recent literaturetends to indicate that vitrinite has a greater adsorption ca-pacity than inertinite. Levine and Johnson (1993) foundthat over a range of ranks, vitrinite-rich coals from theBowen Basin, Australia had higher adsorption capacitiesthan inertinite-rich coals. The data were not collected atequilibrium moisture and moisture probably suppressesthe adsorption of vitrinite more than inertinite.
Lamberson and Bustin (1993), studied coals from theGates Formation in northeast British Columbia and foundthat adsorption capacity correlated with the amount ofvitrinite in the ash-free samples of medium-volatile bitu-minous coals ranging in rank from 1.02% to 1.14% Rmax.Variations in vitrinite content caused greater variation inadsorption capacity than a wide range of rank. Based ontheir plot of gas versus vitrinite %, on a dry mineral mat-ter-free basis (dmmfb), gas concentrations of 0.25 cc/gper 1% vitrinite and 0.1 cc/g per 1% inertinite can be de-rived. The equivalent values for the Gething samples are0.45 cc/g for 1% vitrinite and 0.32 c/g for 1% inertinite.They also report adsorption values for CO2 , which havesimilar relationships to maceral content as CH4. This is in-teresting because an argument can be made that inertinitemay preferentially adsorb CO2 where as vitrinite prefer-
92 British Columbia Geological Survey

entially adsorb CH4. This is because CH4 may volume fillthe smaller micro pores in vitrinite, where as CO2 maylayer fill the larger meso pores in inertinite.
The maceral influence on adsorption varies with in-creasing pressure. Bustin et al. (1995) studied the Bulliand Wongawilli coals from the Sydney Basin and foundthat the maceral control of adsorbed gas for these coalswas less apparent than for the Gates coals studied byLamberson and Bustin (1993). Bustin et al. looked at thecorrelation of differential adsorbed gas volume withmaceral content at different pressures and found that atlow pressure there was a correlation of differential ad-sorbed gas volume with vitrinite content but at higherpressures the correlation was with inertinite content. Thecross-over was at about 2.5 MPa (or about 250 metres).
The data from Bustin et al. (1995) plotted in terms oftotal adsorbed gas at different pressures (Figure 10) em-phasizes the lack of maceral influence on adsorption forcoals from the Bulli seam. A similar analysis is applied tothe Gething and Lamberson and Bustin (1993) data sets(Figure 10). As pressure increases the positive correla-tion factor for vitrinite versus adsorbed gas content im-proves for the Gething and Gates data suites and the dif-ference in adsorption abilities of the end membermacerals increases. The correlation factors are very de-pendent on the slope of the line and are not reliable for flatlines. The plot is a bit miss leading because the data doesnot reflect the effect of increased temperature with in-creased pressure in that the data were acquired at a con-stant temperature of 25ºC. The Gething data set comesfrom 5 samples so that not a lot of confidence can beplaced in the conclusions.
Bustin and Clarkson (1998) indicated that me-dium-volatile Permian coals from Australia have higheradsorption capacities than Gates Formation coals of simi-lar rank from northeast British Columbia. It is apparentfrom Figure 10 that the reason may be that, though thevitrinite from the 2 coals has similar adsorption capaci-ties, inertinite in Australian coals has a higher adsorptioncapacity than inertinite in Gates coals. This differencemay also be apparent in the rheology of the two coals.Australian coking coals tend to have higher Gieslerfluidities and FSI values than British Columbian cokingcoals of similar rank and petrography.
If the type of plot in Figure 10 is valid, then it is possi-ble to pick a depth and therefore a pressure line and pre-dict the adsorption capacity of a coal by sliding along theline to the correct vitrinite percentage. Changes in themaceral influence on adsorption capacity with depthopens the possibility, that depending on depth, coals ofhigh vitrinite or high inertinite content may be better ex-ploration targets. Inertinite is stronger than vitrinite, dif-fuses gas better (Beamish and Crosdale, 1993) and mayretain permeability at depth better, however it wouldprobably under go less matrix shrinkage as gas is pro-duced. Vitrinite on the other hand may have better cleatpermeability but may tend to loose gas (Bustin and Clark-son, 1998) and be under saturated.
EFFECT OF MINERAL MATTER ON ADSORPTION
CAPACITY
Most of the authors mentioned, used maceral contentversus adsorption or desorbed gas content plots to sup-port their arguments. Data were corrected either to anash-free basis or a mineral matter free basis. Although
Geological Fieldwork 2001, Paper 2002-1 93
Gething Formation data
5
10
15
20
25
30
35
40
0 20 40 60 80 100
1 MPa .03
20 MPa 0.910 MPa 0.8
7 MPa 0.75 MPa 0.4
3 MPa .07
2 MPa .001
30 MPa 0.9
vitrinite %
Vcc/g
at
diffe
rent
pre
ssure
s
Number after MPa is R2
Gates Formation data
0
5
10
15
20
25
0 20 40 60 80 100
1 MPa 0.3
20 MPa 0.7
10 MPa 0.7
7 MPa 0.6
5 MPa 0.6
3 MPa 0.5
2 MPa 0.5
30 MPa 0.7
vitrinite %
Vcc/g
at
diffe
rent
pre
ssure
s
Number after MPa is R2
Bulli seam Australia data
0
5
10
15
20
25
0 20 40 60 80 100 120
1 MPa 0.2
20 MPa 0.010 MPa 0.0
7 MPa 0.6
5 MPa 0.1
3 MPa 0.2
2 MPa 0.2
30 MPa 0.0
vitrinite %
Vcc/g
at
diffe
rent
pre
ssure
s
Number after MPa is R2
Figure 10. Effect of increasing pressure on vitrinite and inertiniteadsorption with R2 correlation factors for lines. Data from thisstudy, Lamberson and Bustin, (1993) and Bustin et al. (1995).

94 British Columbia Geological Survey
Figure 11. Tertiary plot of vitrinite, inertinite and mineral matter in volume percents. Posted numbers are gas contents. Data from this study,
Dawson and Clow (1992), Lamberson and Bustin (1993), Bustin et al. (1995) and walker et al. (2001).

most data indicate that mineral matter acts simply as adilutent, this may not always the case. It is possible that insome cases a component of the mineral matter may have anegative adsorption capacity. This may be the case for thetwo samples in this study. Even if this is rare, a useful wayof avoiding any confusion about the effect of mineralmatter is to plot data into triangular plots. This removesany uncertainty generated by correcting for ash or min-eral matter. It is also probably best to use mineral mattervolumes determined by microscope work, if available, asthey may better estimate the volume of mineral matterthat acts as a dilutent.
A number of data suites are re plotted into triangularplots (Figure 11). The plot contains medium-volatilecoals from northeast British Columbia (Lamberson andBustin, 1993), southeast British Columbia (Dawson andClow, 1992), Australia (Bustin et al, 1995 and Walker etal., 2001) and low-volatile Gething coals from this study.There is a trend for adsorption to decrease as mineral mat-ter content increases and to increase as vitrinite contentincreases. Though there also appears to be a tendency foradsorption capacity to be a maximum for a low mineralmatter samples that contain a mixture of a lot of vitriniteand some inertinite. The relationship between gas capaci-ties per unit volume of vitrinite versus inertinite should beapparent by looking at data that plots along a single min-eral matter concentration line. An adsorption maximumat a specific vitrinite/inertinite ratio rather than at a 100%vitrinite content may indicate that collotelinite, whichpredominates in mixed maceral coals, may contain moregas than telinite, which predominates in high reactivecoals. This is counter to the results from the reflectancehistogram data, which seems to indicate that adsorptio isdependent on total vitrinite content only.
It is interesting to consider the effect of mineral mat-ter in a little more detail. It is probably important to differ-entiate between dispersed mineral matter, which may notact strictly as a dilutent and the discreet crystalline min-eral matter, which on a weight or volume basis probablyacts only as a dilutent. Therefore attempting to correctdata for the effects of mineral matter may be difficult. Dryash-free corrections will under estimate the weight ofmineral matter while mineral matter free corrections suchas the Parr equation may over correct the data in terms ofthe dilutent effect of the mineral matter. It is then impor-tant to consider whether dispersed mineral matter directlyinfluences adsorption characteristics of coal by effec-tively having a negative adsorption capacity. This is simi-lar to the argument made by Thomas and Dam Berger(1976) and Levine (1993) who suggest hydrocarbonsgenerated in the high-volatile bituminous coal block mi-cro pores and reduce adsorption capacity.
It is difficult to determine the proportion of total min-eral matter that is dispersed in coal. Generally it is in therange of 2% and comes in part from the original vegeta-tion (equivalent to the ash left after burning clean wood)and in part from salts in solution in the inherent water oradsorbed onto the coal. The amount of dispersed mineralmatter decreases as rank increases because some is dis-
pelled with the inherent water and some leaves the or-
ganic matrix and crystallizes as discreet mineral phases.
Ward et al. (2001) used low temperature aching and de-
tailed analysis of RED traces to identify the proportion of
oxides present in crystalline minerals and the proportion
present in amorphous form. They were working with Late
Permian seams from the Gloucester Basin in Australia. In
low rank coals some Ca, Mg, Na, K and Fe may be dis-
persed in the coal matrix and some may be in solution. In
Geological Fieldwork 2001, Paper 2002-1 95
Figure 12. Ash versus gas content plots for southeast British Co-lumbia. Data (Dawson, 1993) and Walker et al. (2001) ash versusgas content and from Walker et al. (2001) ash% dab versusvitrinite/inertinite ratio.

either case these elements may be able to block micropores acting to decrease the adsorption ability of the coal.
The dispersed mineral matter probably has the sameweight as the resultant ash because it is represented bydispersed elements rather than formed minerals that maycontain loose CO or OH, which is lost during aching.There does not need to be a miff type correction for thismaterial and as the amount increases in coal there mightbe a decrease in gas content of more than would be ex-pected based on a weight dilutent effect. At increased ashconcentrations represented by the addition of crystallinemineral matter gas contents will decrease based on thedilutent effect of the additional mineral matter. Thiswould imply a 2 stage desorbed gas versus ash plot con-sisting of a line with steep negative slope at low ash and aline with negative slope representing the dilutent effect ofash at higher ash concentrations.
There are a number of data sets that illustrate a pro-gressive decrease in gas contents as ash increases. Theyusually predict an ash content of less than 100% at zeroash content indicating that mineral matter has a greaterweight than the resultant ash, usually by 5% to 20%. How-ever these plots often steeper at low ash contents (Figure12) (data from Dawson, 1993 and Walker et al., 2001) anda single line does not provide the best fit to the data. Thiscould indicate a negative adsorption effect of dispersedash or that samples with low ash concentrations have in-creased vitrinite/inertinite ratios. In some cases the effectis related to petrography as is possibly the case with thedesorption data from New lands coals from Queens landAustralia (Walker et al., 2001). The desorbed gas versusash indicates a two-slope trend (Figure 12) and at low ashconcentrations the reactives/inerts ratio increases. Inthese cases the two-component line can be taken as moreevidence that vitrinite often contains more gas than theinertinite.
There is limited evidence, that in some data suites,ash has a negat ive adsorpt ion effect . Some me-dium-volatile Mist Mountain Formation coals fromsoutheast British Columbia (Dawson and Clow, 1992)range in rank from 1.14% to 1.2% Rmax. The four sam-ples are generally enriched in inertinite and have a limitedrange of vitrinite/inertinite ratios of 1.05 to 1.52, whichare not correlated with ash content. The gas contents cor-rected for ash using the Parr Equation are correlated withash content implying that the ash may be negatively af-fecting the gas more than would be expected if it were act-ing as a dilutent. This is similar to the effect seen by Faizand Cook whose equation implies that ash has a negativeadsorptive capacity of about 0.45 cc/g per 1% ash. Inher-ent ash contents are probably higher in vitrinite thatinertinite, which generally has mineral matter filling cellsbut in which dispersed mineral matter was probably ex-pelled during charring.
It is possible that some trace elements can be used toestimate dispersed mineral matter. A trace element corre-lation matrix for the seven Gething samples in this studyshows that a number of trace metals correlate negatively
with Vl miff and positively with ash. This could implythat they have a direct effect on the adsorption ability ofcoal. Organic sculpture might also indicate if non-coal el-ements effect the desorption ability of coal. Unfortu-nately IMP-MS does not measure organic S and concen-trations detected are very low.
CONCLUSIONS
Seven adsorption isotherms of Gething Formationcoal have high adsorption capacities. The samples have arank of 1.7% Rmax and come from a single seam in themid part of the formation. The data therefore cannot beapplied to the formation as a whole, especially consider-ing the wide variation in rank. However it is encouragingthat, based on their rank, the samples have, expected orhigher than expected adsorption capacities. The adsorp-tion capacity of the five samples with low ash concentra-tions correlates moderately well with vitrinite content.This is similar to, though not as strong as, the correlationseen between vitrinite and adsorption capacity for theGates Formation (Lamberson and Bustin, 1993) but betterthan that seen for some samples from the Bulli seam(Bustin et al., 1995).
Vitrinite measured by conventional petrography andby random reflectance histograms correlate and both cor-relate with adsorption capacity, as does VM daf. Of thethree measures, VM daf is by far the easiest to obtain. Aplot of MV daf versus adsorption capacity is probably thefastest and easiest way to check for a maceral control onadsorption capacity.
The adsorption capacity of two of the samples seemsto be strongly affected by ash content. It is possible that, insome data sets, finely dispersed ash originating from theoriginal vegetation may inhibit adsorption. Based on theexpectation that vitrinite adsorbs better than inertinite, anumber of data sets imply either an increase in thevitrinite/inertinite ratio at low ash or an ash effect. Thisash effect would be greater than the dilution effect of theash based on its mass or volume.
The adsorption capacities of vitrinite and inertinitechange independently as pressure increases and vary be-tween coal seams and fields. Vitrinite/indefinite adsorp-tion ratio is high in Gates coals and increases at high pres-sure. The ratio is lower for Gething coals but behavessimilarly. The ratio is close to 1 for coals from the Bulliseam in the Sydney Basin in Australia and does not varymuch with change in pressure.
ACKNOWLEDGEMENTS
R.B.M. Earth Science Consultants (Marc Bustin)provided the isotherms. Pearson and Associates Inc pro-vided the random reflectance histograms. Acme labs us-ing ICP-MS performed the trace element analyses. JohnPrice and the carbonization research group at CAN METprovided the two reflectance measurements.
96 British Columbia Geological Survey
REFERENCES
Beamish, BIB., and Crosdale, P.J. (1993): Characterizing themethane sorption behavior of banded coals in the Bowen Ba-sin Australia; Proceedings of the International CoalbedMethane Symposium 1993, pages 145-150.
Broatch, J. C. (1986): A Summary of the results of a palynologicalinvestigation of the British Columbia’s northeast coalfield;Paper 1988-1 pages 451-457.
Bustin, R.M., Clarkson, C. and Levy, J. (1995): Coalbed methaneadsorption of coals of the Bulli and Wongawilli seams south-ern Sydney Basin: Effects of maceral composition; 29
th
Newcastle Symposium on Advances in study of the SydneyBasin.
Bustin, R.M. and Clarkson, C.R. (1998): Geological controls oncoalbed methane reservoir capacity and gas content; Inter-national Journal of Coal Geology, Volume 38, pages 3-26.
Diessel, C.F.K. (1992): Coal bearing depositional systems;Springer-Verlag
Dawson, F.M. and Clow, J.T. (1992): Coalbed methane researchElk Valley Coalfield; Canadian Coal and Coalbed MethaneGeoscience Forum, Parkesville, British Columbia February1992, pages 57-72.
Dawson, F.M. (1993): Fording Joint Venture Project, GeologicalSurvey of Canada, Summary Report.
Duff, P, Mc, L and Gilchrist, R.D. (1981): Correlation of LowerCretaceous coal measures, Peace River Coalfield BritishColumbia; Paper 1981-3.
Eddy, G.E., Rightmire, C.T. and Byren, C.W. (1982): Relationshipof methane content of coal rank and depth: theoretical vs. ob-served; Proceedings of the Society of Petroleum Engineers,Department of the Interior, Unconventional Gas RecoverySymposium, Pittsburgh, Pennsylvania, SPE/DOE 10800,pages 117-122.
Ettinger, I., Eremin, B., Zimakov, B. and Yanovskaya, M. (1966):Natural factors influencing coal sorption properties1-petrography and the sorption properties of coals; Fuel,Volume 45 pages 267-274.
Faiz. M.M. and Cook, A.C. (1991): Influence of coal type, rankand depth on the gas retention capacity of coals in the South-ern Coalfield N.S.W. Gas in Australian Coals, GeologicalSociety of Australia, Symposium Proceedings 2, pages19-29.
Gibson, D.W. (1985): Stratigraphy and sedimentology of theLower Cretaceous Gething Formation, Carbon Creek CoalBasin , northeastern British Columbia; Geological Survey ofCanada, Paper 80-12.
Gurba, L.W., and Weber, C.R. (2001): The relevance of coal pe-trology to coalbed methane evaluation, using the GloucesterBasin Australia as a model; International Coalbed MethaneSymposium 2001, Proceedings, May 14-18, 2001, pages371-382.
Hunt, J.W. and Smyth, M. (1989): Origin of inertinite-rich coals ofAustralian cratonic basins; International Journal of CoalGeology, Volume 11, pages 23-44.
Joubert, J.I., Grein, C.T. and Beinstock, D. (1973): Sorption ofmethane in moist coal; Fuel, Volume 52, pages 181-185.
Kalkreuth, W. and McMechan, M. (1988): Burial history and ther-mal maturation, Rocky Mountains foothills and forelandeast central British Columbia and adjacent Alberta; Bulletin,American Association of Petroleum Geologists, Volume 72,pages 1395-1410.
Kalkreuth, W., Langenberg, W. and McMechan, M. (1989): Re-gional coalification pattern of Lower Cretaceous coal bear-ing strata, Rocky Mountain Foothills and Foreland, Canada -Implications for future exploration; International Journal ofCoal Geology, Volume 13, pages 261-302.
Karst, R. and White, G.V. (1979): Coal rank distribution within theBluesky-Gething stratigraphic horizon of Northeast B.C.;Ministry of Energy Mines and Petroleum Geology, Paper80-1, pages 103-107.
Kim, A.G. (1977): Estimating methane content of bituminouscoalbeds from adsorption data; U.S. Bureau of Mines, Re-port of Investigations 8245.
Lamberson, M.N., Bustin, R.M., and Kalkreuth, W.D. (1991):Lithotype maceral composition and variation as correlatedwith paleo-wetland environments; Gates Formation north-eastern British Columbia, Canada; International Journal ofCoal Geology, Volme18, pages 87-124.
Lamberson, M.N. and Bustin, R.M. (1993): Coalbed methanecharacteristics of the Gates Formation coals, northeasternBritish Columbia: effect of maceral composition; AmericanAssociation of Petroleum Geologists Bulletin Volume 77,pages 2062-2076.
Leckie, D.A. (1983): Sedimentology of the Moosbar and GatesFormations (Lower Cretaceous); Ph.D Thesis, McMasterUniversity.
Leckie, D.A. and Kalkreuth, W. (1990): Formation of coals onwave -dominated strand plains; International Journal ofCoal Geology, Volume 16, pages 161-162.
Legun. A. (1986): Relation of Gething Formation coal measures tomarine paleo shorelines, (93P,93I); BC Ministry of Energy,Mines and Petroleum Resources, Paper 1987-1, pages369-372.
Levine, J.R. (1993): Coalification: the evolution of coal as sourcerock and reservoir rock for oil and gas; Chapter 3, AmericanAssociation of Petroleum Geologists; Studies in GeologySeries, Number 38, pages 39-77.
Levine, J.R., and Johnson, P. (1993): High pressure microbalancesorption studies; Proceedings of the International CoalbedMethane Symposium, 1993, pages 187-196.
Levy, J.H., Day, S.J., and Killingley, J.S. (1997): Methane capaci-ties of Bowen Basin coals related to coal properties; Fuel,Volume 76, pages 813-819.
Meissener, F.F. (1984): Cretaceous and Lower Tertiary Coals assources for gas accumulations in the Rocky Mountain area;in, Hydrocarbon Source Rocks of the Greater Rocky Moun-tain Region, Woodward J., Meissener F.F. and Clayton, J.L.,Editors, Rocky Mountain Association of Geologists, 1984Symposium, pages 401-431.
Olszewski, A.J. (1992): Development of formation evaluationtechnology for coalbed methane development; QuarterlyReview of Methane from Coal Seams Technology; Volume 9,Number 2, January 1992, pages 32-34.
Renton, J.J., Blaine, C.C., Stanton, R., and Dulong, F. (1979):Compositional relationships of plants and peats from mod-ern peat swamps in support of the chemical coal model; Car-boniferous Coal Guide, Department of Geology andGeography West Virginia University; pages 57-102.
Ryan, BD (1992): An equation for estimation of maximumcoalbed-methane resource potential; BC Ministry of Energy,Mines and Petroleum Resources, Geological Fieldwork1991, Paper 1992-1, pages 393-396.
Ryan, BD (1997): Coal quality variations in the Gething Forma-tion northeastern British Columbia; BC Ministry of Energy,Mines and Petroleum Resources, Geological Fieldwork1996, Paper 1997-1, pages 373-397.
Taylor, G.H., Liu, S.Y. and Diessel, C.F.K. (1989): Thecold-climate origin of inertinite-rich Gondwana Coals; In-ternational Journal of Coal Geology; Volume 11, pages1-22.
Thomas, J. and Damberger, H.H. (1976): Internal surface areamoisture content and porosity of Illinois coals variationswith coal rank; Illinois State Geological Surve, Circular 193.
Geological Fieldwork 2001, Paper 2002-1 97

Ulery, J.P. (1988): Geologic factors influencing the gas content ofcoalbeds in southwestern Pennsylvania; United States De-partment of the Interior, Bureau of Mines, Report RI 9195.
Walker, R., Glikson, M. and Mastalerz, M. (2001): Relations be-tween coal petrology and gas content in upper Newlands
Seam central Queensland, Australia; International Journalof Coal Geology, volume 46, pages 83-92.
Ward, C.R., Taylor, J.C., Matulis, C.E. and Dale, L.S. (2001):Quantification of mineral matter in Argonne Premium coalsusing interactive Rietveld-based X-ray diffraction; Interna-tional Journal of Coal Geology, volume 46, pages 67-82.
98 British Columbia Geological Survey

Geological Fieldwork 2001, Paper 2002-1 99


![Thermodynamic Characteristics of Adsorption-Desorption of … · 2014. 9. 24. · Isosteric heat of adsorption, also called differential heat of adsorption [8], is the heat released](https://img.pdfslide.us/doc/110x75/5fdda0ab739fe83967704de4/thermodynamic-characteristics-of-adsorption-desorption-of-2014-9-24-isosteric.jpg)


![[12]. the Dinamic Adsorption Characteristics of Phenol by Granular Actived Carbon](https://img.pdfslide.us/doc/110x75/577d26bc1a28ab4e1ea2091e/12-the-dinamic-adsorption-characteristics-of-phenol-by-granular-actived.jpg)