Embed Size (px)
Citation preview
A gene with major phenotypic effects as a target forselection vs. homogenizing gene flow
JOOST A. M. RAEYMAEKERS,*† NELLIE KONIJNENDIJK,* MAARTEN H. D. LARMUSEAU,*‡§BART HELLEMANS,* LUC DE MEESTER¶ and FILIP A. M. VOLCKAERT*
*Laboratory of Biodiversity and Evolutionary Genomics, University of Leuven, Ch. Deberiotstraat 32, Leuven B-3000, Belgium,
†Zoological Institute, University of Basel, Vesalgasse 1, Basel CH-4051, Switzerland, ‡Laboratory of Forensic Genetics and
Molecular Archaeology, Department of Forensic Medicine, UZ Leuven, Kapucijnenvoer 33, Leuven B-3000, Belgium,
§Department of Imaging and Pathology, University of Leuven, Campus Gasthuisberg, Herestraat 49, Leuven B-3000, Belgium,
¶Laboratory of Aquatic Ecology, Evolution and Conservation, University of Leuven, Ch. Deberiotstraat 32, Leuven B-3000,
Belgium
Abstract
Genes with major phenotypic effects facilitate quantifying the contribution of genetic
vs. plastic effects to adaptive divergence. A classical example is Ectodysplasin (Eda),the major gene controlling lateral plate phenotype in three-spined stickleback. Com-
pletely plated marine stickleback populations evolved repeatedly towards low-plated
freshwater populations, representing a prime example of parallel evolution by natural
selection. However, many populations remain polymorphic for lateral plate number.
Possible explanations for this polymorphism include relaxation of selection, disruptive
selection or a balance between divergent selection and gene flow. We investigated 15
polymorphic stickleback populations from brackish and freshwater habitats in coastal
North-western Europe. At each site, we tracked changes in allele frequency at the Edagene between subadults in fall, adults in spring and juveniles in summer. Eda geno-
types were also compared for body size and reproductive investment. We observed a
fitness advantage for the Eda allele for the low morph in freshwater and for the allele
for the complete morph in brackish water. Despite these results, the differentiation at
the Eda gene was poorly correlated with habitat characteristics. Neutral population
structure was the best predictor of spatial variation in lateral plate number, suggestive
of a substantial effect of gene flow. A meta-analysis revealed that the signature of
selection at Eda was weak compared to similar studies in stickleback. We conclude
that a balance between divergent selection and gene flow can maintain stickleback
populations polymorphic for lateral plate number and that ecologically relevant genes
may not always contribute much to local adaptation, even when targeted by selection.
Keywords: dispersal, fitness, migration, polymorphism, reproduction, threespine
Received 28 July 2013; revision received 20 October 2013; accepted 28 October 2013
Introduction
Both selective processes, such as natural selection, and
selectively neutral processes, such as random gene flow
and genetic drift, shape natural diversity (Kimura 1983;
Endler 1986; Schluter 2000; Edelaar & Bolnick 2012).
Divergent selection is thought to enhance adaptive
divergence between populations from different environ-
ments, while high gene flow is expected to have a con-
straining effect on this differentiation. Hence, adaptive
divergence proceeds as a function of the balance
between both forces. This has been suggested by theo-
retical work (Levene 1953; Endler 1977; Slatkin 1985;
Garc�ıa-Ramos & Kirkpatrick 1997; Hendry et al. 2001)
as well as empirical studies (reviewed in Rasanen &
Hendry 2008; Pinho & Hey 2010). Most of these studies
have been focusing on adaptive divergence at theCorrespondence: Joost Raeymaekers, Fax: +32 16 32 45 75;
E-mail: [email protected]
© 2013 John Wiley & Sons Ltd
Molecular Ecology (2014) 23, 162–181 doi: 10.1111/mec.12582
phenotypic level, because selection acts on phenotypes
regardless of their genetic basis. However, the evolution-
ary response to selection is determined by the underly-
ing genetic architecture of the phenotype, as well as by
the strength of gene flow which can counteract frequency
changes for the genes that matter for the phenotype
(Lenormand 2002). The genetic level thus enhances our
understanding of adaptive divergence. It makes it feasi-
ble to assess the contribution to adaptive divergence of
selection favouring one allele over another, as well as the
homogenizing effect of gene flow.
Including the genetic level in studies of adaptive
divergence may be accomplished by a combination of
field studies describing patterns of adaptive divergence,
genomic studies pinpointing to the genetic basis of the
traits involved and experiments identifying the fitness
consequences arising from the phenotypic effects of
specific alleles in a simplified ecological context. Con-
siderable progress in each aspect has been made in the
study of the evolution of lateral armour plates in three-
spined sticklebacks (Gasterosteus aculeatus L., Gastero-
steidae, Teleostei; reviewed in Barrett 2010). Lateral
plate number represents an important ecological trait
with a relatively simple genetic basis. Plate variation
has been shown to be controlled by Ectodysplasin (Eda),
a major effect gene, along with several minor effect genes
(Colosimo et al. 2005). Two alleles, EdaC and EdaL,
account for complete and low plate number, respectively.
Completely plated, ancestral sticklebacks inhabit marine
and estuarine habitats throughout the Northern Hemi-
sphere. Multiple freshwater populations, characterized
by reduced plate number, have evolved postglacially
in parallel in a relatively short period of 10 000–
16 000 years (Bell 2001; Raeymaekers et al. 2005). Plate
variation has been attributed to a number of abiotic and
biotic conditions, including large-scale climatic effects,
salinity and calcium levels, variation in water flow and
predation pressure (Barrett 2010).
A number of field experiments have started to
explore the fitness consequences of allelic variation at
Eda, pinpointing to some of the functional mechanisms
responsible for the evolution of reduced armour in
freshwater populations (Barrett et al. 2008, 2009; Mar-
chinko 2009; Zeller et al. 2012a). For instance, there is
evidence that in freshwater, sticklebacks carrying the
EdaL allele have a growth advantage leading to higher
survival rates and reproductive output (Barrett et al.
2008). This hypothesis was inspired by evidence for dif-
ferences in length growth between plate morphs (Mar-
chinko & Schluter 2007). Barrett et al. (2008) initiated
their experiment by introducing adult marine stickle-
backs heterozygous at the Eda locus to four freshwater
ponds. These fish produced juveniles of which length
growth and Eda allele and genotype frequencies were
tracked year round. After one generation, they observed
a net increase in the EdaL frequency. From a set of well-
documented introductions of completely plated stickle-
back in freshwater ponds and lakes, it is known that
populations can evolve low plate number in less than
twenty years, which is less than or equal to 20 genera-
tions (Kristjansson et al. 2002; Bell et al. 2004; Le Rouzic
et al. 2011; Bell & Aguirre 2013). This implies that the
fitness advantage of the EdaL allele in freshwater may
be considerable.
Despite these results, selection on the Eda locus and
the number of lateral plates in nature seems variable
and more complex than in semi-natural ponds or iso-
lated lakes. For instance, Zeller et al. (2012b) observed
disruptive rather than divergent selection at the Eda
locus in a freshwater stream, while no evidence for
selection on Eda was found in a nearby freshwater
pond. In addition, stickleback habitats such as the open
sea, estuaries, lagoons, streams and lakes are often well
connected. Although there is sometimes evidence for
reproductive isolation even between adjacent marine
and freshwater populations (Hagen 1967; Jones et al.
2006; Bell et al. 2010), high gene flow between such
environments might occur as well, weakening the
response to selection (Baumgartner & Bell 1984; Bell
2001; McKinnon & Rundle 2002; Hendry et al. 2009).
Clearly, it is important to understand the effect of vari-
ety in selection conditions and gene flow on lateral
plate divergence. In fact, although the reduction in
body armour in freshwater populations compared to
marine populations is very common across the stickle-
back’s distribution range, it is not the only pattern
observed. Several freshwater populations remain com-
pletely plated or evolve only weak armour reduction
(Hagen & Gilbertson 1972; Hagen & Moodie 1982;
Baumgartner & Bell 1984; Banbura 1994; Klepaker 1995;
Bell 2001; McCairns & Bernatchez 2008, 2012; Berner
et al. 2010; Lucek et al. 2010; Leinonen et al. 2012; Moser
et al. 2012), or might even show reverse evolution for
plate number (Kitano et al. 2008). Likewise, marine and
estuarine populations may be highly variable in plate
number as well (Banbura 1994; Klepaker 1996;
Raeymaekers et al. 2007). Overall, there is a bias in the
literature towards several prominent studies on stickle-
back investigating sharp contrast divergence between
completely plated marine and low-plated resident
freshwater populations (e.g. Cresko et al. 2004; Colosimo
et al. 2005; Barrett et al. 2008; Schluter & Conte 2009;
Jones et al. 2012), mostly from Northern Europe and the
Pacific Coast of North America, while vast regions in
Western and Central Europe and the Atlantic Coast of
North America show weaker contrasts (e.g. M€unzing
1963; Hagen & Moodie 1982; Raeymaekers et al. 2007;
McCairns & Bernatchez 2008; Lucek et al. 2010).
© 2013 John Wiley & Sons Ltd
EDA AS A TARGET FOR SELECTION VS. GENE FLOW 163
In this study, we aim to explore the effects of varia-
tion in selection conditions and gene flow on the
dynamics of the Eda locus in natural stickleback popula-
tions. An excellent system in this respect can be found
in the estuaries and coastal lowlands of North-western
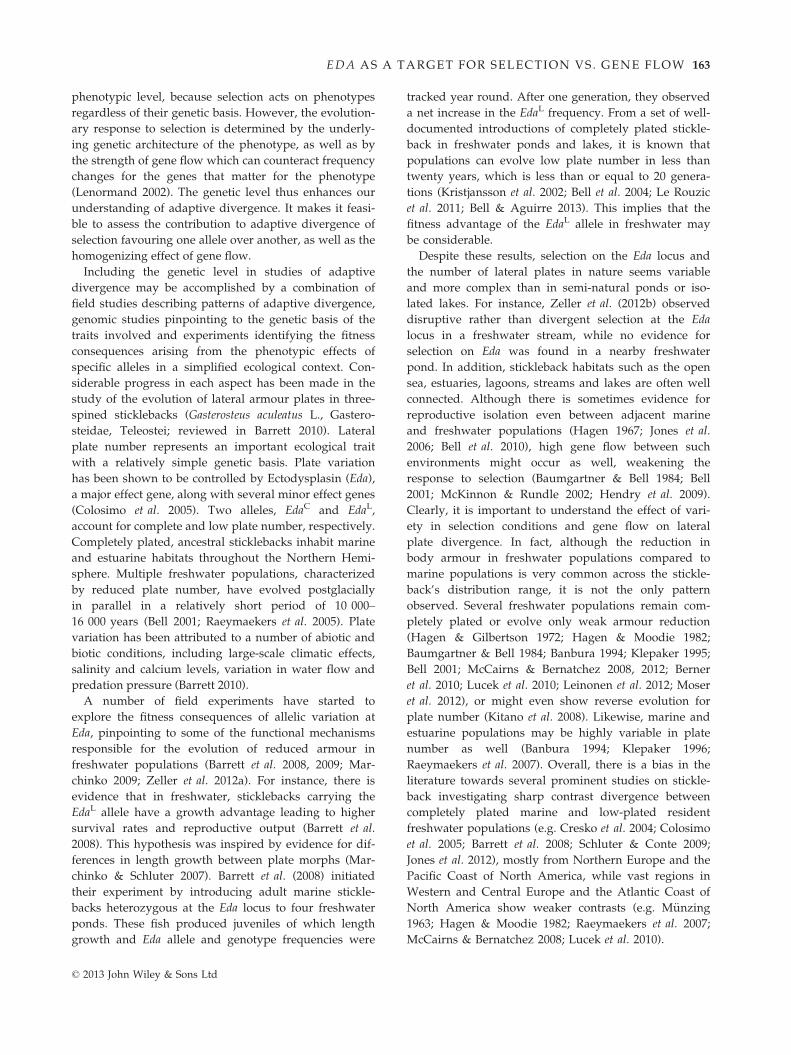
Europe (Fig. 1; Heuts 1947; Raeymaekers et al. 2005,
2007, 2012). Populations in this area are all polymorphic
for plate number. We here start from the observation
that these populations occur in freshwater as well as
brackish water. A number of mechanisms, including
L02
L01
L03
L08
L09
L10
L05
L06
U01
L11/L12
L13
North SeaScheldt estuary
L P C
L P C
L P C
L P CL P C
L P C
L P C
L P C
L P C
L P CL P C
L P C
L07
L04 U02
L04 L07 U02L P CL P C L P C
(a)
(b)
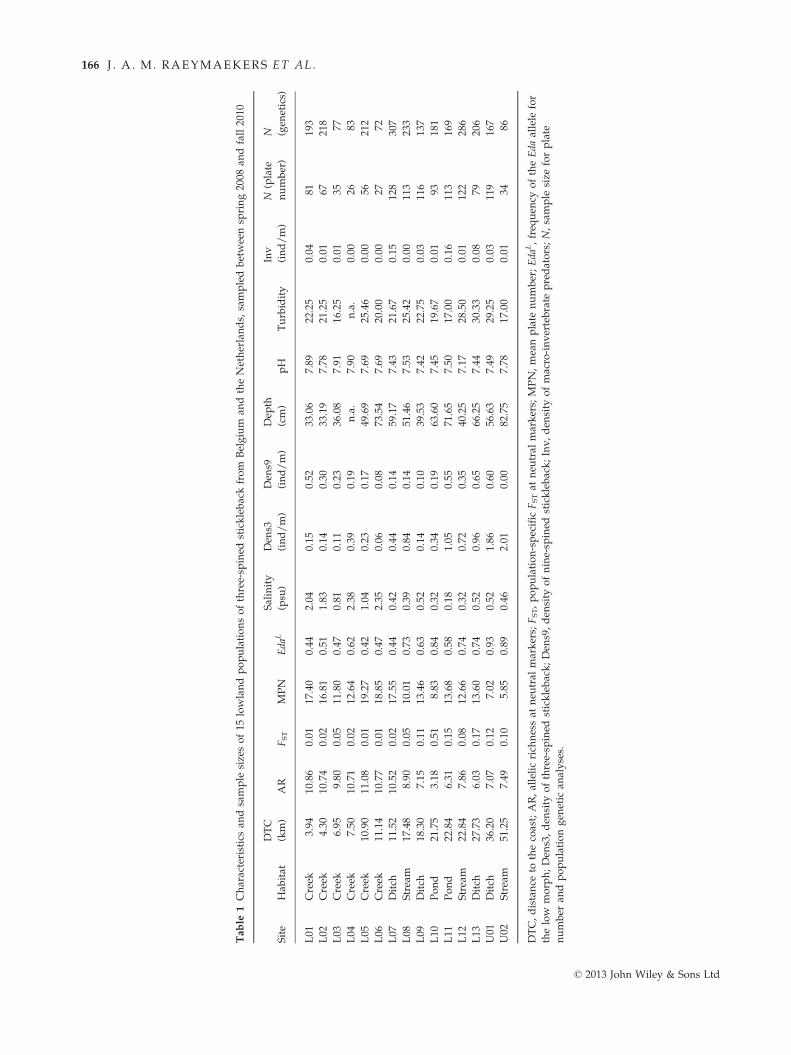
Fig. 1 (a) Locations and characteristics of 15 polymorphic stickleback populations from the Belgian-Dutch lowlands, investigated
between spring 2008 and fall 2010. The bar charts show the relative plate morph frequencies in every site (L, low-plated individuals;
P, partially plated individuals; C, completely plated individuals). The proportion of homozygotes for the EdaL allele (LL), heterozyg-
otes (CL) and homozygotes for the EdaC allele (CC) is shaded in light grey, dark grey and black, respectively. (b) Individual factors
map (left) and variable factors map (right) of a principal component analysis on habitat characteristics of the 15 sampling sites. Vari-
ables labelled in black (full arrows) were used to calculate the principal components; variables in blue (dotted arrows) were included
as supplementary variables. Dens3: density of three-spined stickleback. Dens9: density of nine-spined stickleback. Eda: frequency of
the Eda allele for the low morph. MPN: mean plate number. Invertebrates: density of macro-invertebrate predators. DTC, distance to
the coast. AR, allelic richness at neutral markers. Population codes as in Table 1.
© 2013 John Wiley & Sons Ltd
164 J . A . M. RAEYMAEKERS ET AL.
time since divergence, genetic constraints, balancing
selection (including overdominance and negative fre-
quency dependent selection), relaxation of selection,
environmental heterogeneity and a balance between
divergent selection and gene flow, may explain why
populations remain polymorphic for ecologically rele-
vant traits (Endler 1973, 1977; Forsman & Shine 1995;
Joron et al. 1999; Merilaita 2001; Brooks 2002; Hoekstra
et al. 2004; Larmuseau et al. 2010). Here, we hypothesize
that a balance between divergent selection and gene
flow maintains the polymorphism for plate number.
Indeed, divergent selection pressures may be present
(e.g. related to salinity), but adaptive divergence may
be hampered by subadaptive or maladaptive gene flow.
Considerable gene flow among local stickleback popula-
tions seems likely, because part of the study area is well
connected through a dense network of water bodies
(Fig. 1). Moreover, some populations might be anadro-
mous, facilitating gene flow upon spawning migrations
between brackish and freshwater in spring (Tudorache
et al. 2007). The combined effect of divergent selection
vs. homogenizing gene flow might as well shape phe-
notypic distributions at the landscape level (Endler
1973, 1977; Bell & Richkind 1981; Bell 1982; Baumgart-
ner 1986; Moore et al. 2007).
To test the selection – gene flow scenario, we selected
15 polymorphic populations from a range of brackish
and freshwater habitats and investigated the dynamics
of the Eda gene from spring 2008 until fall 2010. We
first tested for environment-fitness correlations (indica-
tive for selection; Endler 1986) by comparing popula-
tions from different salinities for changes in Eda allele
frequencies between life stages and by comparing Eda
genotypes for body size, reproductive investment and
reproductive success. We then quantified gene flow
between all populations using microsatellite markers.
The strength of selection on the Eda gene relative to the
strength of gene flow was compared with standard tests
for genomic signatures of selection. Finally, we per-
formed a meta-analysis to compare the relative contri-
bution of divergent selection vs. gene flow to variation
in plate number and allelic variation at the Eda gene
across various spatial scales.
Material and methods
Study area
Three-spined sticklebacks from the coastal lowlands of
Belgium and the Netherlands are either anadromous or
landlocked and live in ponds, ditches, small streams,
estuaries or polder creeks (Wootton 1976; Raeymaekers
et al. 2005, 2007). The area contains diked brackish and
freshwater habitats of Holocene origin with varying
connectivity to adjacent estuaries and the open sea.
Habitats are usually shallow (<1.5 m). The water cur-
rent is slow to stagnant. Three-spined and nine-spined
sticklebacks (Pungitius pungitius L.) dominate the fish
community. The three-spined stickleback populations
contain varying percentages of the three plate morphs
as defined by Ziuganov (1983), that is the low-plated
morph (10 or fewer plates), the partially plated morph
(11–20 plates) and the completely plated morph (more
than 20 plates). Populations that are 100% low plated
do occur outside the study area, in rivers and streams
further inland (Raeymaekers et al. 2008, 2009).
Field sampling and morphology
We selected 15 sites, including six brackish creeks, two
freshwater ponds, four freshwater ditches and three
freshwater streams (Table 1; Fig. 1). Each of the sites
was visited twice in spring, twice in summer and twice
in fall (spring 2008, fall 2008, spring 2009, summer 2009,
summer 2010 and fall 2010). Droughts in the summer of
2010 and inundations in the fall of 2010 prohibited sam-
pling some of the sites. Fieldwork started with monitor-
ing the water for temperature (°C), pH, conductivity
(lS/cm; for analyses converted to salinity in psu) and
oxygen (mg/L) using a Hach field-monitoring unit
(Hach, Loveland, Co, USA). An index for the turbidity
of the water was obtained with a Sneller tube. The
water depth was calculated as the median depth (cm)
of five equidistant points along a stretch of 100 m of
the water body. A single person (JAMR) then sampled
three-spined and nine-spined sticklebacks by progres-
sively dipnetting along the same stretch of 100 m with
approximately one dip per metre, each time using the
same hand net. This method enabled us to estimate the
density of three-spined and nine-spined sticklebacks as
the number of individuals per metre. While fishing, the
total density of macro-invertebrate predators of stickle-
back was determined as well by counting all backswim-
mers (Notonecta glauca), dragonfly larvae (Anax sp. and
Aeschna sp.) and great diving beetles (Dytiscus marginal-
is). Sticklebacks were immediately anaesthetized and
flash frozen in dry ice after capture. In spring 2009, an
additional sampling was performed to search for preda-
tory fishes such as perch, eel and pike. We here used
electrofishing in freshwater and a seine net in brackish
water. The sticklebacks captured on this occasion were
excluded from all analyses.
In the laboratory, the sticklebacks were thawed on
ice, measured (standard length (SL); �0.1 cm), weighed
(�0.01 g), photographed and fin-clipped. Spring-caught
samples were assessed visually for any external signs of
reproductive investment. Reproductive males were
identified based on the characteristic red coloration of
© 2013 John Wiley & Sons Ltd
EDA AS A TARGET FOR SELECTION VS. GENE FLOW 165
Table
1Characteristicsan
dsample
sizesof15
lowlandpopulationsofthree-sp
ined
sticklebackfrom
Belgium
andtheNetherlands,
sampledbetweensp
ring2008
andfall2010
Site
Hab
itat
DTC
(km)
AR
FST
MPN
Eda
L
Salinity
(psu
)
Den
s3
(ind/m)
Den
s9
(ind/m)
Dep
th
(cm)
pH
Turbidity
Inv
(ind/m)
N(plate
number)
N (gen
etics)
L01
Creek
3.94
10.86
0.01
17.40
0.44
2.04
0.15
0.52
33.06
7.89
�22.25
0.04
81193
L02
Creek
4.30
10.74
0.02
16.81
0.51
1.83
0.14
0.30
33.19
7.78
�21.25
0.01
67218
L03
Creek
6.95
9.80
0.05
11.80
0.47
0.81
0.11
0.23
36.08
7.91
�16.25
0.01
3577
L04
Creek
7.50
10.71
0.02
12.64
0.62
2.38
0.39
0.19
n.a.
7.90
n.a.
0.00
2683
L05
Creek
10.90
11.08
0.01
19.27
0.42
1.04
0.23
0.17
49.69
7.69
�25.46
0.00
56212
L06
Creek
11.14
10.77
0.01
18.85
0.47
2.35
0.06
0.08
73.54
7.69
�20.00
0.00
2772
L07
Ditch
11.52
10.52
0.02
17.55
0.44
0.42
0.44
0.14
59.17
7.43
�21.67
0.15
128
307
L08
Stream
17.48
8.90
0.05
10.01
0.73
0.39
0.84
0.14
51.46
7.53
�25.42
0.00
113
233
L09
Ditch
18.30
7.15
0.11
13.46
0.63
0.52
0.14
0.10
39.53
7.42
�22.75
0.03
116
137
L10
Pond
21.75
3.18
0.51
8.83
0.84
0.32
0.34
0.19
63.60
7.45
�19.67
0.01
93181
L11
Pond
22.84
6.31
0.15
13.68
0.58
0.18
1.05
0.55
71.65
7.50
�17.00
0.16
113
169
L12
Stream
22.84
7.86
0.08
12.66
0.74
0.32
0.72
0.35
40.25
7.17
�28.50
0.01
122
286
L13
Ditch
27.73
6.03
0.17
13.60
0.74
0.52
0.96
0.65
66.25
7.44
�30.33
0.08
79206
U01
Ditch
36.20
7.07
0.12
7.02
0.93
0.52
1.86
0.60
56.63
7.49
�29.25
0.03
119
167
U02
Stream
51.25
7.49
0.10
5.85
0.89
0.46
2.01
0.00
82.75
7.78
�17.00
0.01
3486
DTC,distance
tothecoast;AR,allelicrich
nessat
neu
tral
markers;
FST,population-specificFSTat
neu
tral
markers;
MPN,meanplate
number;Eda
L,freq
uen
cyoftheEda
allele
for
thelow
morph;Den
s3,den
sity
ofthree-sp
ined
stickleback;Den
s9,den
sity
ofnine-sp
ined
stickleback;Inv,den
sity
ofmacro-invertebrate
predators;N,sample
size
forplate
number
andpopulationgen
etic
analyses.
© 2013 John Wiley & Sons Ltd
166 J . A . M. RAEYMAEKERS ET AL.
the throat, while reproductive females were identified
based on the development of eggs. Individuals smaller
than 25 mm SL were preserved in 100% ethanol, while
larger individuals were stored on a 4% formalin solu-
tion. After 2 months, a subsample of the formalin-
stored fish was rinsed with water for 72 h, bleached for
4 h (1% KOH bleach solution) and stained with alizarin
red S to facilitate plate counts and plate morph registra-
tion (Taylor & Van Dyke 1985). After staining, the num-
ber of lateral plates on the left side was determined.
Based on this number, specimens were categorized as
low-plated, partially plated or completely plated, as
defined above. The presence of a keel, a small modifica-
tion of the caudal lateral plates, was noted, but not
included in the plate count.
DNA extraction and genotyping
Genomic DNA was extracted from fin clips using the
Nucleospin 96 Tissue DNA Extraction kit (Macherey-
Nagel) according the manufacturer’s protocol. Allelic
variation was assessed at 15 microsatellite loci and one
locus (STN380) linked to the Eda gene (Peichel et al.
2001; Colosimo et al. 2005; M€akinen et al. 2008) divided
over 2 multiplex reactions. Multiplex 1 contained loci
Gaest66, STN26, STN30, STN130, STN173, STN174,
STN185, STN196 and STN380, while multiplex 2 con-
tained loci Gaest4, STN3, STN23, STN52, STN61,
STN148 and STN219. All loci were amplified with the
Qiagen� Multiplex PCR Kit (Qiagen, Venlo, the Nether-
lands). The 10 lL PCR cocktail contained 1–100 ng
genomic DNA, 0.05 lM (STN26, STN130, STN173),
0.1 lM (Gaest66, STN3, STN30, STN174, STN185, STN196
and STN219) or 0.2 lM (Gaest4, STN23, STN52, STN61,
STN148 and STN380) forward and reverse primer,
1 9 Qiagen multiplex PCR master mix (3 mM MgCl2)
and RNase-free water. The reaction consisted of an
initial activation step of 15 min at 95 °C, followed by 26
cycles of 30 s at 95 °C, 90 s at 53 °C and 60 s at 72 °C.A final elongation step of 30 min at 60 °C was per-
formed. PCR products were visualized on an ABI3130
Avant Genetic analyzer (Applied Biosystems, Foster
City, CA, USA). Allele sizes were determined by means
of an internal GeneScan 500-LIZ size standard, and
genotypes were obtained using GENEMAPPER 4.0 (Applied
Biosystems). Genotypes were checked for scoring errors
using MICRO-CHECKER 2.3 (van Oosterhout et al. 2004).
Data analysis
Analyses aimed at describing (i) habitat characteristics,
(ii) population genetic structure and (iii) the variation in
lateral plate number and at the Eda gene. We also inves-
tigated (iv) signatures of selection on plate number and
the Eda gene within populations, and (v) the gene flow–
selection balance for plate number and Eda at the land-
scape level. Total sample sizes for plate number and
population genetic analysis are provided in Table 1. A
schematic overview of the analyses together with sam-
ple sizes per Eda genotype per season is provided in
Table S1 (Supporting information). Unless mentioned
otherwise, analyses were performed in R (R Core Team
2012).
Habitat structure. Habitat characteristics included salin-
ity, pH, water depth, the density of nine-spined stickle-
back, the density of macro-invertebrate predators and
turbidity. We first investigated the temporal stability of
the biotic and abiotic environment across sites over the
entire period (2008–2010). We then performed a princi-
pal component analysis on mean values of each of these
variables. The first and second principal components
were plotted to detect clusters of sites with similar habi-
tat characteristics and to investigate how habitats
change with distance to the coast (DTC, measured as
the crow flies).
Population genetic structure. First, genetic diversity was
calculated as the observed heterozygosity (HO) and as
allelic richness (AR; i.e. the number of alleles standard-
ized for sample size and averaged over loci), as imple-
mented in the HIERFSTAT package in R. These metrics
were used to test whether or not genetic diversity
declines with distance to the coast. Temporal replicates
(2008–2010; overview in Table S1, Supporting informa-
tion) were pooled by site for this purpose. Second, over-
all and pairwise population differentiation was
quantified with the ADEGENET package in R using the
standardized allelic variance FST. Pairwise FST values
were used to visualize population structure with a two-
dimensional classical multidimensional scaling (CMDS)
plot with the function cmdscale in R. This was first car-
ried out without pooling the temporal replicates to eval-
uate the temporal stability of the population structure.
Then, all temporal replicates were pooled, allowing for
a spatial assessment of population structure. To investi-
gate the temporal stability and spatial structure in more
detail, we also performed a test for isolation by distance
and a hierarchical analysis of molecular variance (AM-
OVA) in ARLEQUIN 3.0 (Excoffier et al. 2005) by partition-
ing the genetic variability into a within-site (FSC) and
between-site (FCT) component. Third, for comparison,
we also assessed population structure with a Bayesian
Markov chain Monte Carlo (MCMC) assignment
method based on multilocus genotypes, implemented in
STRUCTURE 2.3.3. (Pritchard et al. 2000). The most likely
structure was calculated assuming admixture and
correlated allele frequencies. Each run, considering
© 2013 John Wiley & Sons Ltd
EDA AS A TARGET FOR SELECTION VS. GENE FLOW 167
population structure according to a specific number of
groups (1 ≤ K ≤ 15), consisted of three chains of 105
MCMC replicates, initiated by 104 burn-in steps. Finally,
to quantify migration in the study area, we used a
Bayesian clustering method to identify first-generation
migrants, implemented in GENECLASS 2.0 (Piry et al.
2004). For each individual, the probability was calcu-
lated to belong to the pool of microsatellite-based mul-
tilocus genotypes from the site where it was captured.
Probability computation was based on Monte Carlo
resampling with 103 simulated individuals (Rannala &
Mountain 1997), and significance was evaluated at the
5% level.
Lateral plate number, Eda allele frequencies and migra-
tion. First, we investigated the distribution of plate
number and the Eda allele frequencies at every site. Sec-
ond, an ANOVA was used to analyse the occurrence of
the EdaL allele (scored as 0, 1 or 2 alleles per individ-
ual). Factors in this model included site as a fixed factor
and season nested in site as a random factor. Third, cor-
relations between distance to the coast, average plate
number and the EdaL frequency were tested. Finally, for
each site, we investigated the association between plate
number and Eda on the one hand and migration on the
other hand by (i) comparing the probability of migra-
tion (see above) among Eda genotypes; (ii) testing the
correlation between the probability of migration and
plate number; and (iii) comparing plate number
between putative migrants and residents.
Signatures of selection within populations. Stickleback is a
short-lived species, and the generation time of the
investigated populations is presumably annual. There-
fore, most individuals within a given season can be
assigned to a specific life stage. Spring samples mostly
contain adults of 1 year old. Summer samples mostly
contain juveniles while adults become scarce, and sam-
ples in fall almost exclusively contain subadults. Life
stage-specific Eda allele frequencies hence can be quan-
tified, and local shifts in these frequencies might be
indicative for an episode of local selection at the Eda
gene. If so, it is expected that such shifts are correlated
with the local environment. To test this expectation, we
tested the correlation between habitat characteristics
and the difference in EdaL frequency between (i) juve-
niles captured in summer vs. adults captured in the
preceding spring; (ii) subadults captured in fall vs. juve-
niles captured in the preceding summer; and (iii) adults
captured in spring vs. subadults captured in the preced-
ing fall. Because these metrics reflect a life stage-specific
differential fitness advantage at the Eda gene in terms
of (i) reproductive output, (ii) juvenile survival and (iii)
subadult overwinter survival, we further refer to these
indices as DEda[reproductive output], DEda[juvenile sur-
vival] and DEda[overwinter survival], respectively. For
each of these indices, positive values suggest a fitness
advantage for the EdaL allele, while negative values
suggest a fitness advantage for the EdaC allele. Pearson
correlations between each index and the aforemen-
tioned habitat characteristics (mean values of the two
subsequent seasons) were calculated and tested for sig-
nificance. Distance to the coast was included as well, to
account for any unmeasured factor correlated with a
declining influence of the coastal environment. Explana-
tory variables with significant or nearly significant
effects were included in multiple regressions. Model fit
was compared based on the AICC criterion for small
sample size. Because DEda[reproductive output], DEda[juvenile survival] and DEda[overwinter survival] might
not exclusively reflect differential reproductive output
or mortality, but can also be influenced by migration,
all computations were done with and without first-
generation migrants (see above).
To test for additional indications for selection at the
Eda gene, we calculated for each site the index DEda[reproductive investment], that is the difference in EdaL
frequency between individuals that did and did not vis-
ibly invested in reproduction (see above). We expected
this index to correlate with DEda[reproductive output],
as a shift in EdaL frequency from one generation (adults
in spring) to the next (juveniles in summer) should
already be visible in the fraction of adults investing in
reproduction. Furthermore, we also compared the three
Eda genotypes for differences in body size at the juve-
nile (summer), subadult (fall) and adult (spring) stage,
to test for a potential growth advantage associated with
the Eda gene. For juveniles, this test result might as well
reflect an age advantage arising from faster maturation
of the parents. This analysis was performed with gen-
eral linear models (one per life stage) with standard
length as the dependent variable and site, Eda genotype
and the site by Eda genotype interaction as independent
variables. For adults in spring, sex was also included in
the model. Sampling year was included as a random
block factor.
Selection vs. gene flow. Four methods (I-IV) were used to
quantify the relative contribution of selection and gene
flow to the differentiation in plate number and at the
Eda gene. (I) Outlier detection tests implemented in LOS-
ITAN (Antao et al. 2008) and BAYESCAN (Foll & Gaggiotti
2008) were used to evaluate whether the global FST at
the Eda locus classified as a non-neutral outlier (indica-
tive of selection) as compared to the microsatellite
markers. A false discovery rate of 0.05 was applied for
both methods. (II) Likewise, a FST –PST approach (Raey-
maekers et al. 2007; Leinonen et al. 2008) was used to
© 2013 John Wiley & Sons Ltd
168 J . A . M. RAEYMAEKERS ET AL.
investigate whether the global differentiation in plate
number (PST[plates]) exceeded the global neutral genetic
differentiation as quantified with microsatellite markers.
(III) Correlation analysis and multiple regressions were
used to explain the interpopulation variation in average
plate number and the EdaL frequency. Explanatory
variables included the aforementioned habitat character-
istics (mean values over the entire period). Population-
specific FST (as calculated in GESTE; Foll & Gaggiotti
2006) and allelic richness were included as well, to eval-
uate whether phenotypic variation (plate number) and
the underlying genetic variation (Eda) are associated
with neutral genetic processes. As above, explanatory
variables with significant or nearly significant simple
effects were included in multiple regressions, of which
the model fit was compared based on the AICC criterion
for small sample size. (IV) Simple and partial Mantel
tests on population pairs were used to identify the
determinants of pairwise differentiation at the Eda locus
(FST[Eda]), as well as pairwise differentiation in plate
number (PST[plates]). Explanatory variables included
pairwise differentiation (FST) at neutral markers as well
as pairwise Euclidean distances based on habitat char-
acteristics. For each of these analyses (I–IV), one popu-
lation (L10) was excluded as its extremely low genetic
diversity suggested that it might have been introduced
or gone through a recent bottleneck, and hence, might
be not in selection–migration–drift balance with the
surrounding populations.
Meta-analysis
A meta-analysis of the relative strength of selection tar-
geting the Eda locus vs. homogenizing gene flow was
performed to compare our results on the lowland popu-
lations with five other studies (Raeymaekers et al. 2007;
M€akinen et al. 2008; Van Dongen et al. 2009; DeFaveri
et al. 2011; DeFaveri & Meril€a 2013). These studies were
performed on natural populations of three-spined stick-
lebacks sampled across various spatial scales (Table 2).
Populations were either selected along a salinity cline,
or chosen from a set of discrete habitats with different
salinities (Table 2). All data sets included plate number
(except for the study by DeFaveri et al. 2011), neutral
genetic markers and markers linked to the Eda gene
(STN365, STN380 or STN381). On one occasion, only
plate number and neutral genetic data have been pub-
lished (Van Dongen et al. 2009), but Eda genotypes of
the same populations were available.
Each data set was analysed in parallel with the low-
land data set according to analyses I to IV, as outlined
above. The results of analysis I (outlier tests with LOSITAN
and BAYESCAN) and analysis II (FST–PST comparisons) were
summarized across studies with a linear regression
analysis regressing global values for FST[Eda] and
PST[plates] on global values for neutral FST. Analysis III
consisted of testing correlations between neutral genetic
diversity on the one hand and average plate number and
the EdaL frequency on the other hand. For analysis IV,
correlations between pairwise differentiation at neutral
genetic markers (pairwise FST), pairwise differentiation
at the Eda locus (pairwise FST[Eda]) and pairwise
differentiation in plate number were computed. For two
data sets that also contained detailed salinity data (i.e.
the current study and the Baltic Sea study by DeFaveri &
Meril€a 2013), correlations with salinity were calculated as
well.
Results
Habitat structure
Abiotic and biotic characteristics, averaged over the per-
iod 2008–2010, are presented in Table 1. Overall, sites
differed significantly in salinity (F14,26 = 8.50; P
< 0.0001), pH (F14,26 = 3.97; P = 0.0012) and water depth
(F13,25 = 8.19; P < 0.0001). Local fluctuations in environ-
mental conditions were small (in particular for salinity)
or could be attributed to seasonal effects (such as rain-
fall) affecting the entire region. Salinity ranged between
0.18 and 2.38 psu and declined with distance from the
coast (R = �0.59; P = 0.0201). Values for pH were corre-
lated with salinity (R = 0.69; P = 0.0043). Other habitat
characteristics did not significantly correlate with salin-
ity, and only water depth was significantly correlated
with distance to the coast as well (R = 0.66; P = 0.0104).
Six sites had brackish water (L01–L06; equivalent of
conductivity values >1000 lS/cm) and clustered along
the first axis of a principal component analysis (Fig. 1).
The remaining sites had freshwater (conductivity values
<1000 lS/cm). These sites had more heterogeneous PC
values, reflecting either a high density of macro-inverte-
brate predators (L07, L11), a high density of nine-spined
sticklebacks (L12, L13, U01) or a high turbidity (U02).
Predatory fishes included eel (Anguilla anguilla L.;
observed occasionally at L08 and L12) and perch (Perca
fluviatilis L.; common at L06).
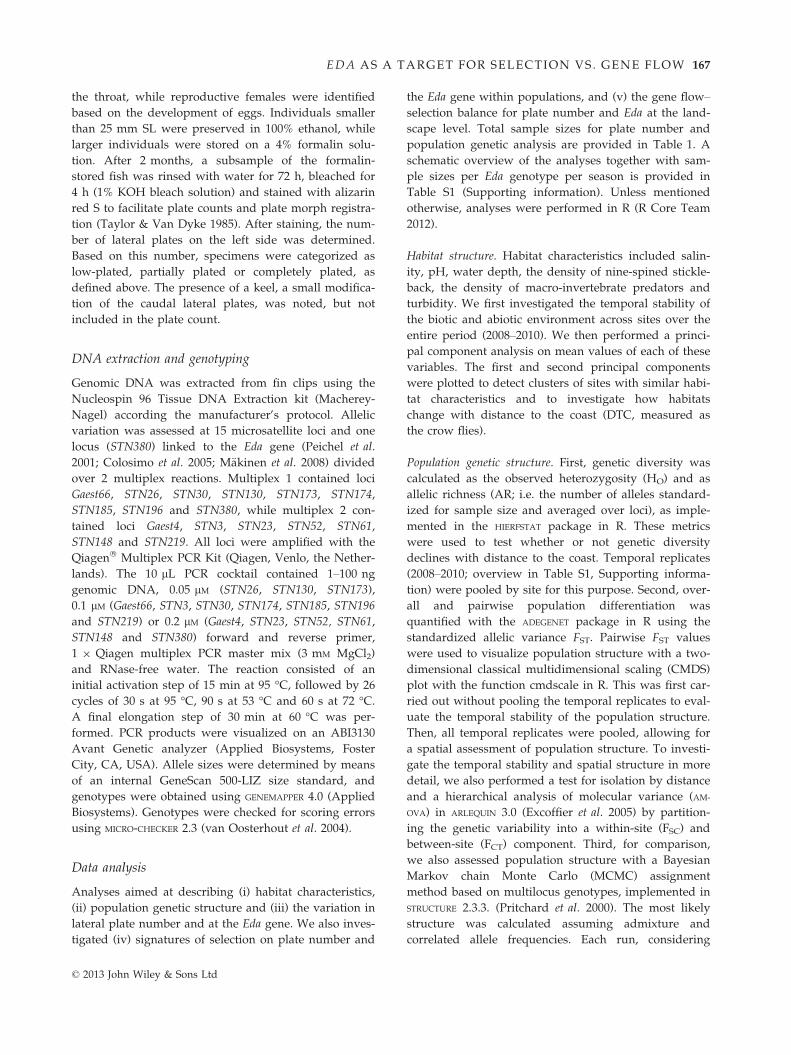
Population genetic structure
Genetic diversity, quantified as allelic richness, declined
with distance from the coast (R = �0.75; P = 0.0021;
Fig. 2). AMOVA revealed significant genetic structure
among sites (FCT = 0.046; P < 0.0001) and, albeit much
weaker, among temporal replicates within sites
(FSC = 0.003; P < 0.0001; Fig. S1, Supporting informa-
tion). A CMDS plot based on pairwise FST revealed
clustering of the sites near the coast, including those
© 2013 John Wiley & Sons Ltd
EDA AS A TARGET FOR SELECTION VS. GENE FLOW 169
Tab
le2
Summaryofsixstudiesassessingthedivergen
cein
lateralplate
number
andtheEda
locu
sin
naturalsticklebackpopulations.
Populationsweresampledacross
various
spatialscales,an
deither
selected
alongasalinitycline,
orch
osenfrom
asetofdiscretehab
itatswithdifferentsalinities
Study
(Npop/N
ind)
Spatial
scale
Salinity
(ran
ge)
Lateral
plates
Neu
tral
markers
Eda-linked
markers
RPearson
RMantel
Referen
ces
MPN
(ran
ge)
PST
Type
(NLOC)
HO
(ran
ge)
FST(95%
CI)
Marker
HO
[Eda]
FST[Eda]
AR
vs.
MPN
AR
vs.
Eda
L
FSTvs.
FST[Eda]
FSTvs.
PST
FST[Eda]
vs.
PST
Lowlands
(14/
2320)
78km
Fresh
-brackish
(discrete)
5.85
–19.26
0.15
lsats
(15)
0.62
–0.75
0.046
(0.041
–0.052)
STN
380
0.478
0.115**/
NS
0.62*
�0.72**
0.42**
0.28
°0.83***
Curren
t
study
Baltic
(14/
480)
~1000km
Fresh
-salt
(clinal)
14.61–25
0.22
lsats
(20)
0.66
–0.74
0.006
(0.004
–0.009)
STN
381
0.367
0.101***/**
0.25NS
�0.22NS
0.32°
0.16
NS
0.85***
DeF
averi
&Meril€ a
(2013)
LU2002
(8/400)
~200
km
Fresh
-brackish
(discrete)
4.97
–19.58
0.41
lsats
(15)
0.63
–0.78
0.096
(0.079
–0.111)
STN
381
0.277
0.382**/**
0.75*
�0.83*
0.07
NS
0.05
NS
0.93*
Raeymaekers
etal.(2007)
LU2004
(15/
747)
~300
km
Fresh
-brackish
(discrete)
4.98–1
9.23
0.37
lsats
(15)
0.61
–0.82
0.083
(0.073
–0.095)
STN
380
0.338
0.351***/***
0.79***
�0.87***
�0.04N
S0.02
NS
0.89***
Barrett
etal.(2009),
Van
Dongen
etal.(2009)
STN
381
0.362
0.406***/***
�0.83***
�0.07N
S0.91***
Europe
(7/168)
Continen
tal
Fresh
-salt
(discrete)
4.27–3
2.54
0.62
lsats
(102)
0.52
–0.74
0.166
(0.154
–0.178)
STN
365
0.64
0.653***/***
0.27
NS
—0.08
NS
0.36
NS
0.71**
M€ ak
inen
etal.(2008)
STN
380
0.607
0.685***/***
—0.14
NS
0.71**
STN
381
0.553
0.856***/***
�0.06NS
0.15
NS
0.71**
Global
(12/
288)
Global
Fresh
-salt
(discrete)
——
lsats
(23)
0.60
—0.84
0.149
(0.123
–0.178)
STN
365
0.67
0.405***/***
——
0.13
NS
——
DeF
averi
etal.(2011)
NPOP,number
ofpopulations;
NIN
D,number
ofindividuals;
MPN,meanplate
number;PST,proportionofam
ong-populationphen
otypic
variance;N
LOC,number
ofloci;H
Oan
d
HO[Eda],av
erag
eobserved
heterozy
gosity
atneu
tral
markersan
dtheEda
locu
s;FSTan
dFST[Eda],stan
dardized
allelicvariance
atneu
tral
markersan
dat
theEda
locu
s;AR,
allelicrich
nessat
neu
tral
markers;
Eda
L,freq
uen
cyoftheEda
allele
forthelow
morph,,RPearson,Pearsoncorrelation;RMantel,Man
telcorrelationam
ongpairw
isemetrics
of
differentiation.
P-values
(NSP>0.10;°P
<0.10;*P
<0.05;**P<0.01;***P
<0.001)
areprovided
forRPearsonan
dRMantel,as
wellas
forFST[Eda](before
thedash:test
withLOSITAN;afterthedash:
test
withBAYESCAN).
© 2013 John Wiley & Sons Ltd
170 J . A . M. RAEYMAEKERS ET AL.
that were geographically distant (Fig. 2). Accordingly,
the test for isolation by distance was not significant
(geographical distance vs. neutral pairwise FST:
R = 0.11; P = 0.29). Bayesian analysis with STRUCTURE
suggested an optimal structure with seven clusters: two
mixing ‘coastal’ clusters containing individuals from
populations L01 to L07, a cluster containing populations
L08, L11 and L12, a cluster containing populations U01
and U02, and three clusters containing a single popula-
tion (L09, L10, L13). The analyses of first-generation
migrants revealed that the probability of migration did
not correlate with distance to the coast (R = �0.28;
P = 0.31) or salinity (R = 0.24; P = 0.38).
Lateral plate number, Eda allele frequencies andmigration
All sites were polymorphic for plate number (Fig. 1a).
In line with previous studies (Raeymaekers et al. 2007;
Lucek et al. 2012), the contingency between plate morph
(completely plated – partially plated – low-plated) and
indel-based Eda genotype (CC: homozygous for EdaC;
CL: heterozygous; LL: homozygous for EdaL) was good,
albeit not perfect (Fig. 1a; see Lucek et al. (2012) for
potential causes). Differences in the EdaL frequency
between sites as well as fluctuations between seasons
are shown in Fig. S2 (Supporting information). ANOVA
revealed that the occurrence of the EdaL allele (0, 1 or 2
times per individual) varied significantly between sites
(F14,2515 = 28.73, P < 0.0001), as well as between seasons
within sites (F50,2515 = 1.62, P = 0.004). At the landscape
level, we observed that average plate number declined
with distance from the coast (R = �0.75; P = 0.0013;
Fig. 2), whereas the EdaL frequency increased (R = 0.83;
P = 0.0001; Fig. 2). The analysis of first-generation
migrants across and within sites identified no associa-
tion between Eda genotype and the probability of
migration, no correlation between the probability of
migration and plate number, and no difference in plate
number between putative residents and migrants
(results not shown).
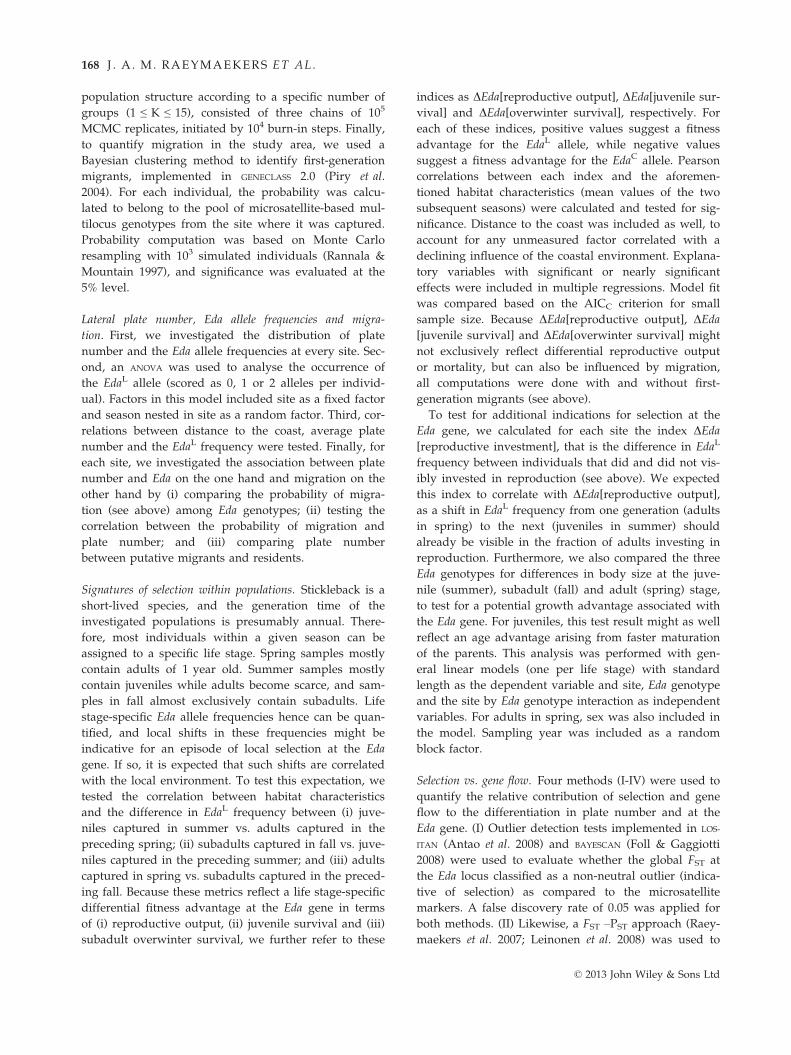
Signatures of selection within populations
DEda[reproductive output], quantifying the difference in
EdaL frequency between juveniles captured in summer
and the corresponding adults captured in the preceding
spring, mostly indicated a higher EdaL frequency in
juveniles than in adults in freshwater and a lower EdaL
frequency in juveniles than in adults in brackish (and
−0.02 −0.01 0.00 0.01
–0.0
2−0
.01
0.00
0.01
Dimension1
Dim
ensi
on2
(a)
L04
L09
L05L08
L11
L12
L07
U01
L06L01
L02
L13
L03
U02
10 20 30 40 50
67
89
1011
R = −0.75; P = 0.0021
Distance to coast (km)A
llelic
rich
ness
L04
L09
L05
L08
L11
L12
L07
U01
L06L01L02
L13
L03
U02
(b)
10 20 30 40 50
68
1012
1416
18
Distance to coast (km)
R = −0.75; P = 0.0013
Mea
n pl
ate
num
ber
L04
L10
L09
L05
L08
L11
L12
L07
U01
L06
L01L02
L13
L03
U02
(c)
10 20 30 40 50
0.4
0.5
0.6
0.7
0.8
0.9
R = 0.83; P = 0.0001
Distance to coast (km)
Eda
L fre
quen
cy
L04
L10
L09
L05
L08
L11
L12
L07
U01
L06L01
L02
L13
L03
U02
(d)
Fig. 2 (a) Classical multidimensional sca-
ling plot of neutral population genetic
structure based on pairwise FST. Correla-
tion between distance to the coast and
(b) allelic richness at neutral markers, (c)
the average number of lateral plates and
(d) the EdaL frequency. Population codes
as in Table 1. Population L10 is excluded
from plots a and b.
© 2013 John Wiley & Sons Ltd
EDA AS A TARGET FOR SELECTION VS. GENE FLOW 171
more alkaline) water. As a result, this index was nega-
tively correlated with salinity (R = �0.61; P = 0.0269;
Fig. 3) and pH (R = �0.56; P = 0.0471). Multiple regres-
sion followed by AICc-based model selection failed to
determine whether either salinity or pH was the best
predictor of DEda[reproductive output] (i.e. DAICC < 2).
DEda[reproductive output] was also positively corre-
lated with DEda[reproductive investment], that is the
difference in EdaL frequency in spring between individ-
uals that did and did not visibly invested in reproduc-
tion (R = 0.63; P = 0.0208; Fig. 3). This suggests that the
shift in EdaL frequency from one generation to the next
was indeed caused by differential investment in repro-
duction in spring. Neither DEda[reproductive output]
nor DEda[reproductive investment] were correlated with
distance to the coast (Fig. 3) or any other habitat charac-
teristic.
DEda[juvenile survival], quantifying the difference in
EdaL frequency between subadults in fall and juveniles
in the preceding summer, did not correlate with any
habitat characteristic or geographical variable. DEda[overwinter survival], quantifying the difference in EdaL
frequency between adults in spring and subadults in
the preceding fall, was positively correlated with pH
(R = 0.61; P = 0.0456; Fig. 3), but negatively correlated
with distance to the coast (R = �0.64; P = 0.0333;
Fig. 3). Multiple regression followed by AICc-based
model selection failed to determine whether either dis-
tance to the coast or pH was the best predictor of this
index (i.e. DAICC < 2).
In summary, shifts in EdaL frequencies between
adults in spring and juveniles in the subsequent sum-
mer were negatively correlated with salinity and pH
and positively correlated with differential reproductive
investment. Shifts in EdaL frequencies between subad-
ults in fall and adults in the subsequent spring were
positively correlated with pH (and were hence in the
opposite direction), but were also correlated with
distance to the coast. All of the above results were con-
firmed when the analyses were repeated without
first-generation migrants (results not shown). Further-
more, we did neither observe significant effects of Eda
genotype, nor an Eda genotype by site interaction effect
when comparing body size at the juvenile (summer),
subadult (fall) or adult stage (spring; Fig. S3, Supporting
information).
0.5 1.0 1.5 2.0 2.5
−0.2
0−0
.10
0.00
0.10
R = −0.61; P = 0.0269
Salinity (psu)
ΔEda
[repr
oduc
tive
outp
ut]
(a)
−0.3 −0.2 −0.1 0.0 0.1 0.2 0.3
−0.2
0−0
.10
0.00
0.10
R = 0.63; P = 0.0208
ΔEda[reproductive investment]
ΔEda
[repr
oduc
tive
outp
ut]
(b)
10 20 30 40 50
−0.2
0−0
.10
0.00
0.10
R = 0.44; P = 0.129
Distance to coast (km)
ΔEda
[repr
oduc
tive
outp
ut]
(c)
0.5 1.0 1.5 2.0 2.5−0.1
0−0
.05
0.00
0.05
0.10
R = 44; P = 0.18
Salinity (psu)
ΔEda
[ove
rwin
ter s
urvi
val]
(d)
7.0 7.2 7.4 7.6 7.8−0.1
0−0
.05
0.00
0.05
0.10
R = 0.61; P = 0.0456
pH
ΔEda
[ove
rwin
ter s
urvi
val]
(e)
10 20 30 40 50−0.1
0−0
.05
0.00
0.05
0.10
R = −0.64; P = 0.0333
Distance to coast (km)
ΔEda
[ove
rwin
ter s
urvi
val]
(f)
Fig. 3 Correlations between habitat characteristics, distance to the coast, DEda[reproductive output], DEda[reproductive investment]
and DEda[overwinter survival]. DEda[reproductive output] is the difference in EdaL frequency between juveniles captured in summer
and the corresponding adults captured in the preceding spring. DEda[reproductive investment] is the difference in EdaL frequency in
spring between individuals that did and did not visibly invest in reproduction. DEda[overwinter survival] is the difference in EdaL
frequency between adults captured in spring vs. subadults captured in the preceding fall. (a) Salinity vs. DEda[reproductive output];
(b) DEda[reproductive investment] vs. DEda[reproductive output]; (c) Distance to the coast vs. DEda[reproductive output]; (d) Salinity
vs. DEda[overwinter survival]; (e) pH vs. DEda[overwinter survival]; (f) Distance to the coast vs. DEda[overwinter survival].
© 2013 John Wiley & Sons Ltd
172 J . A . M. RAEYMAEKERS ET AL.
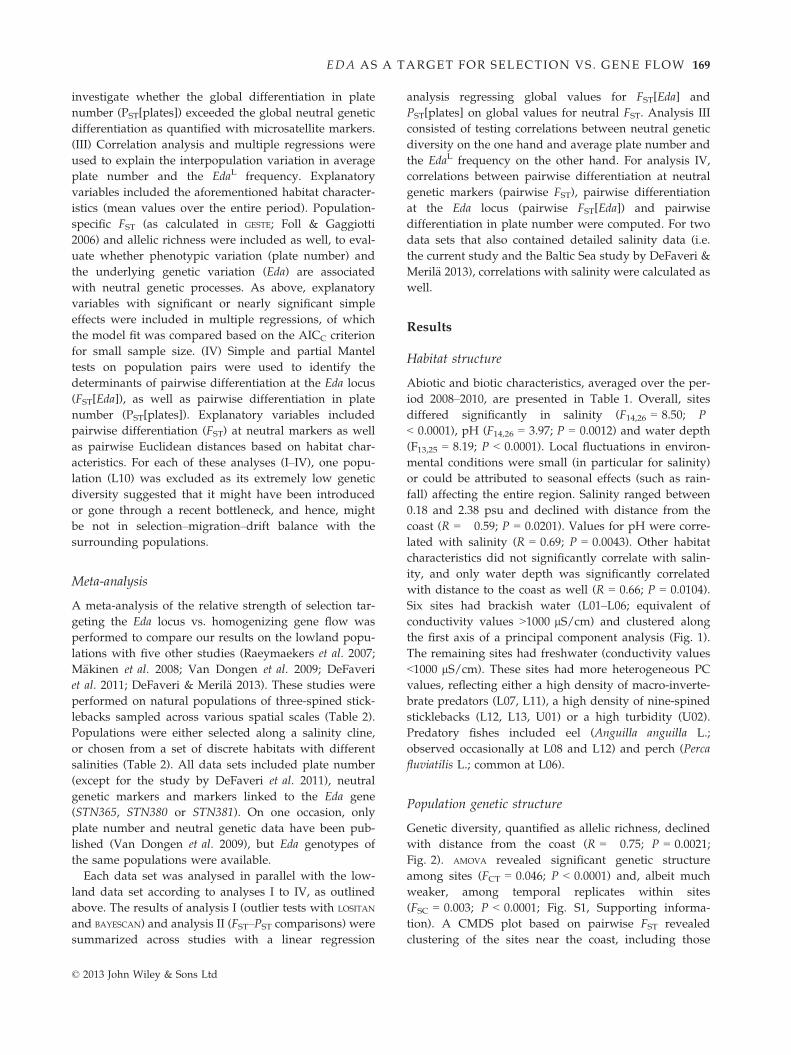
Selection vs. gene flow
While the LOSITAN analysis classified the Eda-linked
marker STN380 as a locus putatively under divergent
selection (FST[Eda] = 0.115; P = 0.008), BAYESCAN did not
(P = 0.9642). The global PST value (PST = 0.15) exceeded
neutral FST(FST = 0.046, 95% CI = 0.042–0.052), suggest-
ing a contribution of divergent selection to phenotypic
differentiation.
Among all habitat characteristics, only salinity was
marginally correlated with EdaL frequency and mean
plate number. The EdaL frequency decreased with salin-
ity (R = �0.50, P = 0.0549, Fig. 4a), while mean plate
number increased with salinity (R = 0.52, P = 0.0484,
Fig. 4b). However, in both cases, the correlation with
allelic richness was stronger (EdaL frequency:
R = �0.72, P = 0.0035, Fig. 4c; mean plate number:
R = 0.62, P = 0.0190, Fig. 4d), as was the correlations
with population-specific FST: (R = 0.65, P = 0.0126;
mean plate number: R = �0.54, P = 0.0459). Multiple
regressions followed by AICc-based model selection
confirmed that AR and FST were better predictors of the
Eda allele frequency than salinity (i.e. all DAICC > 2;
results not shown). This was also the case for plate
number, except for FST vs. salinity, showing about equal
effects (i.e. DAICC < 2).
A similar pattern emerged from the analysis of pair-
wise FST[Eda] and pairwise PST for plate number.
Pairwise FST[Eda] was not correlated with pairwise dif-
ferential salinity (R = 0.003, P = 0.43; Fig. 4e), but signif-
icantly increased with neutral pairwise FST (R = 0.42;
P = 0.009; Fig. 4g). Likewise, pairwise PST for plate
number did not increase with pairwise differential
salinity (R = 0.079, P = 0.27; Fig. 4f), but was marginally
correlated with neutral pairwise FST (R = 0.28;
P = 0.064; Fig. 4h). Partial Mantel tests revealed that the
increase in pairwise FST[Eda] with neutral pairwise FSTremained significant after correction for any habitat
characteristic (results not shown). Figure 4G, H shows
that PST for plate number and FST[Eda] remained low in
the face of high gene flow (neutral FST < 0.02; this
included all population pairs from site L01 to L07).
Meta-analysis
The LOSITAN and BAYESCAN outlier analyses always clas-
sified the Eda-linked markers as loci putatively under
divergent selection, except for the lowland data set (i.e.
the current study) for the analysis with BAYESCAN
(Table 2; Fig. S4, Supporting information). Overall PST
for plate number always significantly exceeded the
0.5 1.0 1.5 2.0
0.4
0.5
0.6
0.7
0.8
0.9
R = −0.50; P = 0.0549
Salinity (psu)0.5 1.0 1.5 2.0
68
1012
1416
18
R = 0.52; P = 0.0484
Salinity (psu)
Mea
n pl
ate
num
ber
0.0 0.5 1.0 1.5 2.0
0.0
0.1
0.2
0.3
0.4
R = 0.003; P = 0.43
Differential salinity0.0 0.5 1.0 1.5 2.0
0.0
0.1
0.2
0.3
0.4
0.5
0.6
R = 0.079; P = 0.27
Differential salinity
6 7 8 9 10 11
0.4
0.5
0.6
0.7
0.8
0.9
R = −0.72; P = 0.0035
Allelic richness6 7 8 9 10 11
68
1012
1416
18
R = 0.62; P = 0.0190
Allelic richness
Mea
n pl
ate
num
ber
0.02 0.04 0.06 0.08 0.10
0.0
0.1
0.2
0.3
0.4
R = 0.42; P = 0.009
Neutral FST Neutral FST
0.02 0.04 0.06 0.08 0.10
0.0
0.1
0.2
0.3
0.4
0.5
0.6
R = 0.28; P = 0.064
Eda
L fre
quen
cyE
daL
frequ
ency
F ST[E
da]
F ST[E
da]
PS
T[pl
ates
]P
ST[
plat
es]
(a) (b)
(c) (d)
(e)
(g) (h)
(f)
Fig. 4 Associations between neutral genetic diversity, salinity, the Eda locus and plate number in polymorphic stickleback popula-
tions from the Belgian-Dutch lowlands. (a) EdaL frequency vs. salinity. (b) Mean plate number vs. salinity. (c) EdaL frequency vs. alle-
lic richness at neutral markers. (d) Mean plate number vs. allelic richness at neutral markers. (e) Pairwise FST[Eda] vs. pairwise
differential salinity. (f) Pairwise PST for lateral plate number vs. pairwise differential salinity. (g) Pairwise FST[Eda] vs. neutral
pairwise FST. (h) Pairwise PST for lateral plate number vs. neutral pairwise FST.
© 2013 John Wiley & Sons Ltd
EDA AS A TARGET FOR SELECTION VS. GENE FLOW 173
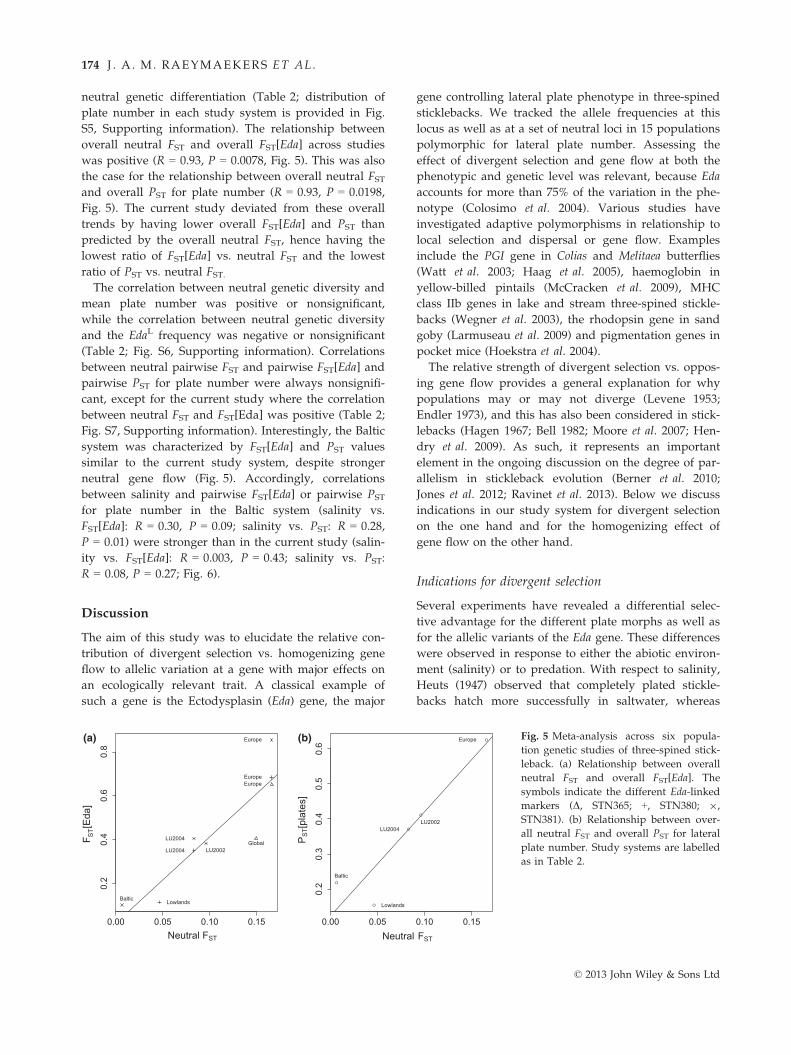
neutral genetic differentiation (Table 2; distribution of
plate number in each study system is provided in Fig.
S5, Supporting information). The relationship between
overall neutral FST and overall FST[Eda] across studies
was positive (R = 0.93, P = 0.0078, Fig. 5). This was also
the case for the relationship between overall neutral FSTand overall PST for plate number (R = 0.93, P = 0.0198,
Fig. 5). The current study deviated from these overall
trends by having lower overall FST[Eda] and PST than
predicted by the overall neutral FST, hence having the
lowest ratio of FST[Eda] vs. neutral FST and the lowest
ratio of PST vs. neutral FST.The correlation between neutral genetic diversity and
mean plate number was positive or nonsignificant,
while the correlation between neutral genetic diversity
and the EdaL frequency was negative or nonsignificant
(Table 2; Fig. S6, Supporting information). Correlations
between neutral pairwise FST and pairwise FST[Eda] and
pairwise PST for plate number were always nonsignifi-
cant, except for the current study where the correlation
between neutral FST and FST[Eda] was positive (Table 2;
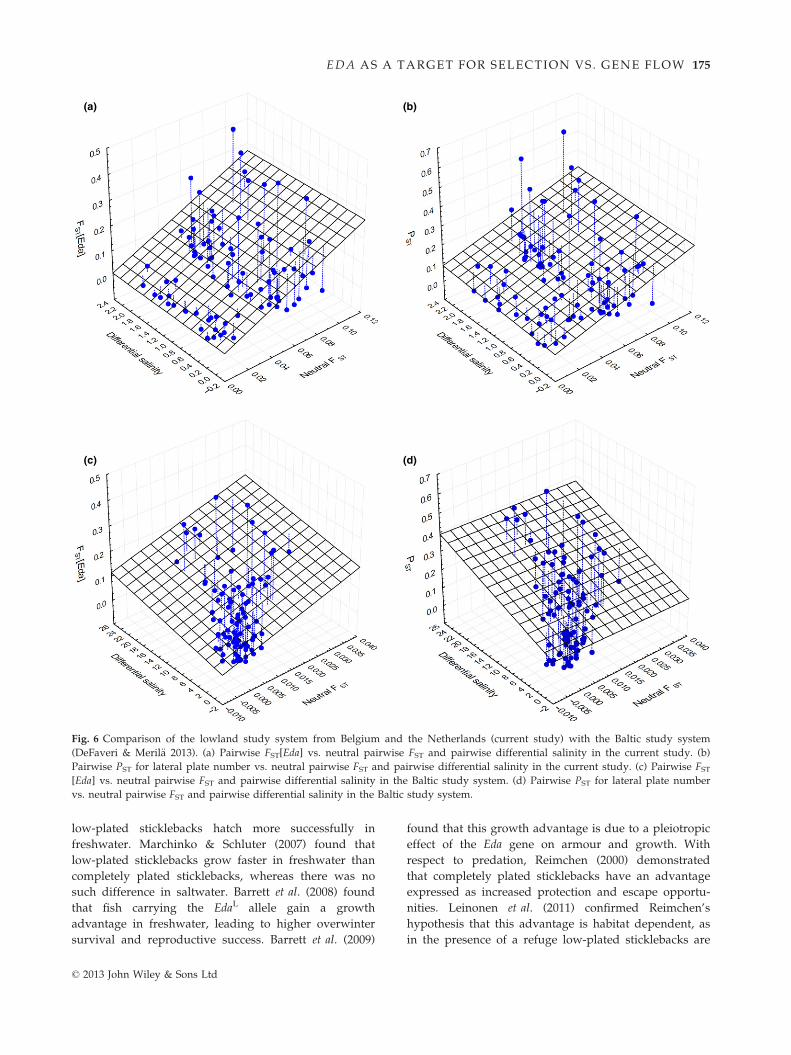
Fig. S7, Supporting information). Interestingly, the Baltic
system was characterized by FST[Eda] and PST values
similar to the current study system, despite stronger
neutral gene flow (Fig. 5). Accordingly, correlations
between salinity and pairwise FST[Eda] or pairwise PST
for plate number in the Baltic system (salinity vs.
FST[Eda]: R = 0.30, P = 0.09; salinity vs. PST: R = 0.28,
P = 0.01) were stronger than in the current study (salin-
ity vs. FST[Eda]: R = 0.003, P = 0.43; salinity vs. PST:
R = 0.08, P = 0.27; Fig. 6).
Discussion
The aim of this study was to elucidate the relative con-
tribution of divergent selection vs. homogenizing gene
flow to allelic variation at a gene with major effects on
an ecologically relevant trait. A classical example of
such a gene is the Ectodysplasin (Eda) gene, the major
gene controlling lateral plate phenotype in three-spined
sticklebacks. We tracked the allele frequencies at this
locus as well as at a set of neutral loci in 15 populations
polymorphic for lateral plate number. Assessing the
effect of divergent selection and gene flow at both the
phenotypic and genetic level was relevant, because Eda
accounts for more than 75% of the variation in the phe-
notype (Colosimo et al. 2004). Various studies have
investigated adaptive polymorphisms in relationship to
local selection and dispersal or gene flow. Examples
include the PGI gene in Colias and Melitaea butterflies
(Watt et al. 2003; Haag et al. 2005), haemoglobin in
yellow-billed pintails (McCracken et al. 2009), MHC
class IIb genes in lake and stream three-spined stickle-
backs (Wegner et al. 2003), the rhodopsin gene in sand
goby (Larmuseau et al. 2009) and pigmentation genes in
pocket mice (Hoekstra et al. 2004).
The relative strength of divergent selection vs. oppos-
ing gene flow provides a general explanation for why
populations may or may not diverge (Levene 1953;
Endler 1973), and this has also been considered in stick-
lebacks (Hagen 1967; Bell 1982; Moore et al. 2007; Hen-
dry et al. 2009). As such, it represents an important
element in the ongoing discussion on the degree of par-
allelism in stickleback evolution (Berner et al. 2010;
Jones et al. 2012; Ravinet et al. 2013). Below we discuss
indications in our study system for divergent selection
on the one hand and for the homogenizing effect of
gene flow on the other hand.
Indications for divergent selection
Several experiments have revealed a differential selec-
tive advantage for the different plate morphs as well as
for the allelic variants of the Eda gene. These differences
were observed in response to either the abiotic environ-
ment (salinity) or to predation. With respect to salinity,
Heuts (1947) observed that completely plated stickle-
backs hatch more successfully in saltwater, whereas
0.00 0.05 0.10 0.15
0.2
0.4
0.6
0.8
Neutral FST
F ST[E
da]
(a)
LowlandsBaltic
LU2002LU2004
LU2004
EuropeEurope
Europe
Global
0.00 0.05 0.10 0.15
0.2
0.3
0.4
0.5
0.6
Neutral FST
PS
T[pl
ates
]
(b)
Lowlands
Baltic
LU2002LU2004
Europe Fig. 5 Meta-analysis across six popula-
tion genetic studies of three-spined stick-
leback. (a) Relationship between overall
neutral FST and overall FST[Eda]. The
symbols indicate the different Eda-linked
markers (D, STN365; +, STN380; 9,
STN381). (b) Relationship between over-
all neutral FST and overall PST for lateral
plate number. Study systems are labelled
as in Table 2.
© 2013 John Wiley & Sons Ltd
174 J . A . M. RAEYMAEKERS ET AL.
low-plated sticklebacks hatch more successfully in
freshwater. Marchinko & Schluter (2007) found that
low-plated sticklebacks grow faster in freshwater than
completely plated sticklebacks, whereas there was no
such difference in saltwater. Barrett et al. (2008) found
that fish carrying the EdaL allele gain a growth
advantage in freshwater, leading to higher overwinter
survival and reproductive success. Barrett et al. (2009)
found that this growth advantage is due to a pleiotropic
effect of the Eda gene on armour and growth. With
respect to predation, Reimchen (2000) demonstrated
that completely plated sticklebacks have an advantage
expressed as increased protection and escape opportu-
nities. Leinonen et al. (2011) confirmed Reimchen’s
hypothesis that this advantage is habitat dependent, as
in the presence of a refuge low-plated sticklebacks are
(a) (b)
(c) (d)
Fig. 6 Comparison of the lowland study system from Belgium and the Netherlands (current study) with the Baltic study system
(DeFaveri & Meril€a 2013). (a) Pairwise FST[Eda] vs. neutral pairwise FST and pairwise differential salinity in the current study. (b)
Pairwise PST for lateral plate number vs. neutral pairwise FST and pairwise differential salinity in the current study. (c) Pairwise FST[Eda] vs. neutral pairwise FST and pairwise differential salinity in the Baltic study system. (d) Pairwise PST for lateral plate number
vs. neutral pairwise FST and pairwise differential salinity in the Baltic study system.
© 2013 John Wiley & Sons Ltd
EDA AS A TARGET FOR SELECTION VS. GENE FLOW 175
more probably to escape from predatory fish than com-
pletely plated sticklebacks. Finally, Marchinko (2009)
observed increased survival for individuals carrying the
EdaL allele in response to macro-invertebrate predation,
whereas Zeller et al. (2012a) did not.
In this study, a differential selective advantage at the
Eda gene was suggested when comparing subsequent
generations. The Eda allele frequencies of juveniles in
summer vs. representatives of the parental generation
in the preceding spring showed a shift towards lower
plate number in freshwater and a shift towards higher
plate number in brackish (and more alkine) water.
This shift from one generation to the next was signifi-
cantly correlated with the differences in Eda allele fre-
quency between adults who visibly invested in
reproduction vs. adults that did not. Therefore, this pat-
tern is probably indicative for greater (or earlier) repro-
ductive success of individuals carrying the EdaL allele
in freshwater (i.e. similar to findings in Barrett et al.
2008) and of individuals carrying the EdaC allele in
brackish water. However, we cannot attribute these dif-
ferences in reproductive success to a growth advantage,
as we did not observe significant differences in body
size between the Eda genotypes at any life stage. We
also cannot confirm a role for predation, as neither Eda
allele frequencies nor changes in Eda allele frequencies
were correlated with the density of macro-invertebrate
predators.
Indications for the homogenizing effect of gene flow
Despite the indications for divergent selection in
response to salinity levels from one generation to the
next, salinity was only marginally correlated with the
variation at the Eda locus and variation in plate number
in our field survey. Likewise, pairwise differentiation at
the Eda gene and pairwise PST for plate number did not
correlate with pairwise differential salinity. The main
reason for this lack of correlation was that the popula-
tions at some of the brackish sites still included a
considerable fraction of low-plated individuals (e.g. L04),
while populations at some of the freshwater sites still
included a considerable fraction of completely plated
individuals (e.g. L07). Relatively weak correlations
between plate number and salinity or conductivity have
been reported in other studies (Hagen & Gilbertson 1972;
DeFaveri & Meril€a 2013). While this suggests that salinity
might not be the main selective agent for plate number,
we did not observe strong correlations with other envi-
ronmental cues either. Admittedly, our environmental
assessment was not exhaustive, and other factors influ-
encing the selective advantage of Eda genotypes have
been proposed, such as calcium concentrations (Giles
1983).
Remarkably, however, variation in plate number and
allelic variation at the Eda locus was strongly correlated
with neutral population structure. Neutral genetic
diversity outperformed salinity as a predictor of Eda
allele frequency and mean plate number. Pairwise
differentiation at the Eda locus increased with pairwise
neutral FST and remained low in contrasts between pop-
ulations characterized by low FST values, indicating
substantial gene flow. There are two potential explana-
tions for these correlations. First, adaptive divergence at
the Eda locus due to a strong environmental cue might
constrain gene flow between divergent populations (i.e.
isolation by adaptation; Funk et al. 2011). If so, we
clearly failed to document such environmental cue.
However, if present, it would probably be correlated
with distance to the coast (indicative for the declining
influence of the coastal environment), which was also a
strong predictor of plate number and Eda allele fre-
quency. Second, high gene flow might constrain adap-
tive divergence by homogenizing allele frequencies at
the Eda locus. This possibility seems more likely. It is
known that some completely plated stickleback popula-
tions are anadromous, performing spawning migrations
from coastal to freshwater habitats after a substantial
raise in water temperature in spring (Wootton 1976).
Such behaviour has also been reported in our study
area (Tudorache et al. 2007). At least part of our
freshwater populations might hence be exposed to high
levels of gene flow from such anadromous populations,
counteracting selection by a new influx of maladaptive
or subadaptive alleles. Another indication that dispersal
and gene flow are substantial in the lowlands is the fast
recolonization of ditches and streams after summer
droughts (personal observation).
The adaptive significance of variation in lateral plate
phenotypes has received much attention since the
observation that lateral plates might be targeted by
selection (Hagen & Gilbertson 1973). In contrast, the
possibility of gene flow counteracting selection on lat-
eral plate phenotypes has been rarely tested. In a study
of clinal variation for the number of lateral plates
within the low-plated morph across a stream gradient,
Bell & Richkind (1981) concluded that gene flow must
counter selection. Likewise, Baumgartner (1986) demon-
strated that both selection and gene flow shape the dis-
tribution of plate morphs in two adjacent streams. Since
the discovery of the major effect of the Eda gene on
plate number (Colosimo et al. 2005), studies still focus
on the role of selection, but genomic studies testing for
signatures of selection at the Eda gene typically account
for genome-wide differentiation, which is partially
reflecting gene flow (e.g. M€akinen et al. 2008; DeFaveri
et al. 2011; DeFaveri & Meril€a 2013). A meta-analysis on
six such studies provided further support for the
© 2013 John Wiley & Sons Ltd
176 J . A . M. RAEYMAEKERS ET AL.
homogenizing effect of gene flow in our study system.
First, compared to the other stickleback systems, the
signature of selection at Eda in this study was weak.
Second, the lowland system was the only system where
pairwise neutral FST correlated significantly with
FST[Eda]. Comparison with the Baltic system (DeFaveri
& Meril€a 2013) revealed that divergence at the Eda locus
is possible even in the face of stronger gene flow than
in our study. The difference is probably due to a
broader range of salinities or correlated environmental
effects in the Baltic (saltwater to freshwater) than in this
study (brackish to freshwater).
Limitations and alternative explanations
Anadromous migration by completely plated individu-
als provides a straightforward explanation for the per-
sistence of individuals carrying the EdaC allele in
freshwater despite counteracting selection. However,
one limitation of our study is that we did not find
direct indications for migration load. Although this
might be due to the lack of power to quantify migration
using molecular markers, it is possible that anadromous
populations are uncommon or only occur locally. Alter-
natively, it might be that anadromous and resident
freshwater populations interbreed infrequently (Hagen
1967; Jones et al. 2006; Bell et al. 2010) and hence that
substantial gene flow is only realized over several gen-
erations. The persistence of individuals carrying the
EdaL allele in brackish water despite counteracting
selection suggests that gene flow is also important in
the opposite direction. Gene flow from freshwater to
resident brackish water and marine stickleback might
again be facilitated by anadromous populations. Such
introgression contributes to the retention of freshwater-
adapted alleles in marine populations, which facilitates
the evolutionary response to directional selection after
freshwater colonization. This process is referred to as
‘allelic recycling’ (Schluter & Conte 2009; Bell & Aguirre
2013).
Alternative explanations of why populations might
remain polymorphic for plate number include time
since divergence, genetic constraints, relaxation of selec-
tion, environmental heterogeneity and balancing selec-
tion. Time since divergence explained the decline in
plate number in Norwegian lakes which underwent
isolation through gradual uplifting from sea level after
deglaciation (Klepaker 1995). The position of the coast-
line in our study area has been shifting since the Holo-
cene, and the current transgression was stabilized only
500 years ago as a result of human activities. Therefore,
some of our study sites certainly escaped earlier from
marine influence than others. Nevertheless, it is likely
that all study sites have been interconnected for most of
the time and therefore never experienced long periods
of isolation. Moreover, it is known that completely
plated populations can evolve towards almost 100%
low platedness in less than two decades (Bell & Aguirre
2013).
Genetic constraints on the Eda gene making the gene
less susceptible for selection than elsewhere, including
different epistatic or pleiotropic fitness effects, are unli-
kely, given that monomorphic low-plated and mono-
morphic completely plated populations do occur
further inland (Heuts 1947; Raeymaekers et al. 2008,
2009) and further north in the North Sea (Jones et al.
2006), respectively. Relaxation of selection is also an
unlikely explanation for the maintenance of plate num-
ber polymorphism, given the indications for differential
selective advantages at the Eda gene (see above). An
important contribution of environmental heterogeneity
is also unlikely as we found that habitat characteristics,
in particular salinity, differed between sites and were
relatively stable during the course of the study.
One possibility we cannot rule out at this stage is bal-
ancing selection. For instance, Barrett et al. (2008)
observed indications for opposing selection at the Eda
gene during different life stages, suggesting either that
the Eda gene affects additional traits undergoing selec-
tion, or that linked loci are also affecting fitness. Geno-
mic studies have pointed out that the Eda gene is
contained within a large block of genes in ancient and
stable linkage, increasing the potential for pleiotropic
effects (Colosimo et al. 2005; Albert et al. 2008; Jones
et al. 2012). For the current study, the shifts from fall to
spring (i.e. DEda[overwinter survival]) were opposite to
those from spring to summer (i.e. DEda[reproductiveoutput]; Fig. 3), and this might in principle reflect
opposing selection rather than a migration–selection
balance. Nevertheless, such complex selection condi-
tions are unlikely to generate the observed pattern of
plate number declining with distance from the coast
and its strong correlation with neutral genetic diversity.
Conclusion and implications
Our findings suggest that polymorphism and geograph-
ical variation for lateral plate number in the lowland
stickleback populations from North-western Europe are
maintained through a combination of divergent selec-
tion targeting the Eda gene and homogenizing gene
flow. As a result, these populations were characterized
by the lowest ratio of FST at the Eda gene vs. neutral FSTin comparison with other stickleback systems, investi-
gated across similar environmental gradients.
It has been hypothesized that the parallel evolution
of freshwater phenotypes across the stickleback’s
distribution range is facilitated by standing variation in
© 2013 John Wiley & Sons Ltd
EDA AS A TARGET FOR SELECTION VS. GENE FLOW 177
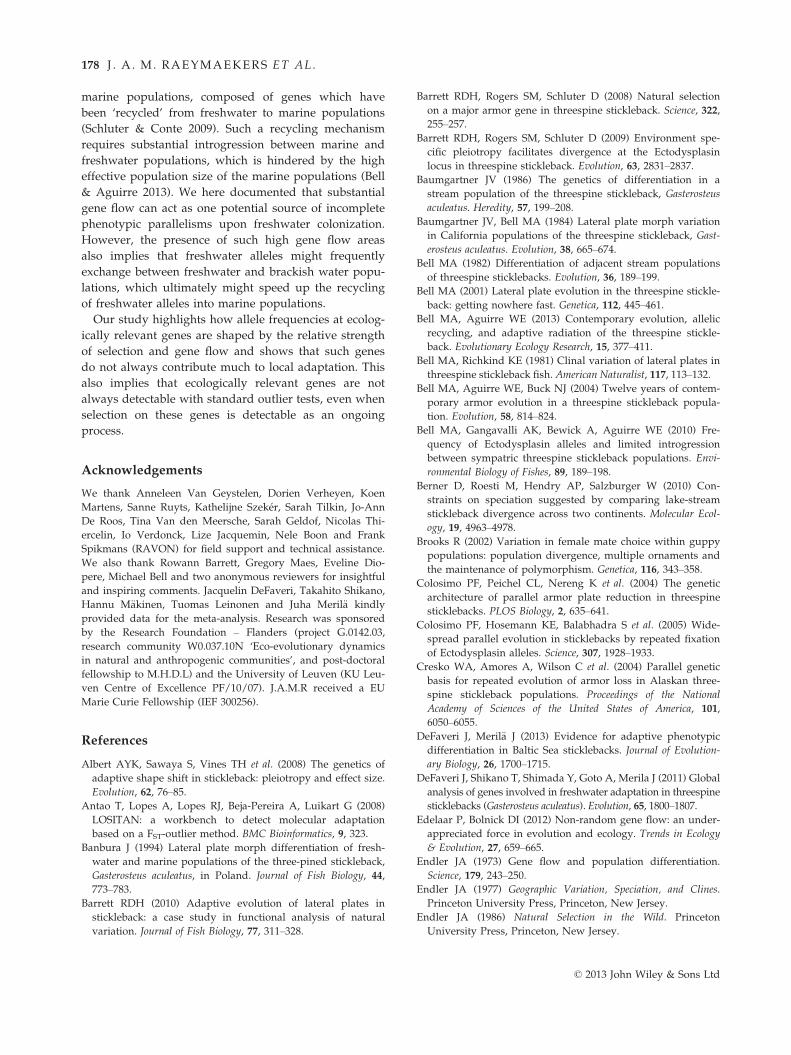
marine populations, composed of genes which have
been ‘recycled’ from freshwater to marine populations
(Schluter & Conte 2009). Such a recycling mechanism
requires substantial introgression between marine and
freshwater populations, which is hindered by the high
effective population size of the marine populations (Bell
& Aguirre 2013). We here documented that substantial
gene flow can act as one potential source of incomplete
phenotypic parallelisms upon freshwater colonization.
However, the presence of such high gene flow areas
also implies that freshwater alleles might frequently
exchange between freshwater and brackish water popu-
lations, which ultimately might speed up the recycling
of freshwater alleles into marine populations.
Our study highlights how allele frequencies at ecolog-
ically relevant genes are shaped by the relative strength
of selection and gene flow and shows that such genes
do not always contribute much to local adaptation. This
also implies that ecologically relevant genes are not
always detectable with standard outlier tests, even when
selection on these genes is detectable as an ongoing
process.
Acknowledgements
We thank Anneleen Van Geystelen, Dorien Verheyen, Koen
Martens, Sanne Ruyts, Kathelijne Szek�er, Sarah Tilkin, Jo-Ann
De Roos, Tina Van den Meersche, Sarah Geldof, Nicolas Thi-
ercelin, Io Verdonck, Lize Jacquemin, Nele Boon and Frank
Spikmans (RAVON) for field support and technical assistance.
We also thank Rowann Barrett, Gregory Maes, Eveline Dio-
pere, Michael Bell and two anonymous reviewers for insightful
and inspiring comments. Jacquelin DeFaveri, Takahito Shikano,
Hannu M€akinen, Tuomas Leinonen and Juha Meril€a kindly
provided data for the meta-analysis. Research was sponsored
by the Research Foundation – Flanders (project G.0142.03,
research community W0.037.10N ‘Eco-evolutionary dynamics
in natural and anthropogenic communities’, and post-doctoral
fellowship to M.H.D.L) and the University of Leuven (KU Leu-
ven Centre of Excellence PF/10/07). J.A.M.R received a EU
Marie Curie Fellowship (IEF 300256).
References
Albert AYK, Sawaya S, Vines TH et al. (2008) The genetics of
adaptive shape shift in stickleback: pleiotropy and effect size.
Evolution, 62, 76–85.Antao T, Lopes A, Lopes RJ, Beja-Pereira A, Luikart G (2008)
LOSITAN: a workbench to detect molecular adaptation
based on a FST-outlier method. BMC Bioinformatics, 9, 323.
Banbura J (1994) Lateral plate morph differentiation of fresh-
water and marine populations of the three-pined stickleback,
Gasterosteus aculeatus, in Poland. Journal of Fish Biology, 44,
773–783.
Barrett RDH (2010) Adaptive evolution of lateral plates in
stickleback: a case study in functional analysis of natural
variation. Journal of Fish Biology, 77, 311–328.
Barrett RDH, Rogers SM, Schluter D (2008) Natural selection
on a major armor gene in threespine stickleback. Science, 322,
255–257.
Barrett RDH, Rogers SM, Schluter D (2009) Environment spe-
cific pleiotropy facilitates divergence at the Ectodysplasin
locus in threespine stickleback. Evolution, 63, 2831–2837.Baumgartner JV (1986) The genetics of differentiation in a
stream population of the threespine stickleback, Gasterosteus
aculeatus. Heredity, 57, 199–208.
Baumgartner JV, Bell MA (1984) Lateral plate morph variation
in California populations of the threespine stickleback, Gast-
erosteus aculeatus. Evolution, 38, 665–674.Bell MA (1982) Differentiation of adjacent stream populations
of threespine sticklebacks. Evolution, 36, 189–199.Bell MA (2001) Lateral plate evolution in the threespine stickle-
back: getting nowhere fast. Genetica, 112, 445–461.Bell MA, Aguirre WE (2013) Contemporary evolution, allelic
recycling, and adaptive radiation of the threespine stickle-
back. Evolutionary Ecology Research, 15, 377–411.
Bell MA, Richkind KE (1981) Clinal variation of lateral plates in
threespine stickleback fish. American Naturalist, 117, 113–132.
Bell MA, Aguirre WE, Buck NJ (2004) Twelve years of contem-
porary armor evolution in a threespine stickleback popula-
tion. Evolution, 58, 814–824.Bell MA, Gangavalli AK, Bewick A, Aguirre WE (2010) Fre-
quency of Ectodysplasin alleles and limited introgression
between sympatric threespine stickleback populations. Envi-
ronmental Biology of Fishes, 89, 189–198.
Berner D, Roesti M, Hendry AP, Salzburger W (2010) Con-
straints on speciation suggested by comparing lake-stream
stickleback divergence across two continents. Molecular Ecol-
ogy, 19, 4963–4978.
Brooks R (2002) Variation in female mate choice within guppy
populations: population divergence, multiple ornaments and
the maintenance of polymorphism. Genetica, 116, 343–358.Colosimo PF, Peichel CL, Nereng K et al. (2004) The genetic
architecture of parallel armor plate reduction in threespine
sticklebacks. PLOS Biology, 2, 635–641.
Colosimo PF, Hosemann KE, Balabhadra S et al. (2005) Wide-
spread parallel evolution in sticklebacks by repeated fixation
of Ectodysplasin alleles. Science, 307, 1928–1933.Cresko WA, Amores A, Wilson C et al. (2004) Parallel genetic
basis for repeated evolution of armor loss in Alaskan three-
spine stickleback populations. Proceedings of the National
Academy of Sciences of the United States of America, 101,
6050–6055.
DeFaveri J, Meril€a J (2013) Evidence for adaptive phenotypic
differentiation in Baltic Sea sticklebacks. Journal of Evolution-
ary Biology, 26, 1700–1715.DeFaveri J, Shikano T, Shimada Y, Goto A, Merila J (2011) Global
analysis of genes involved in freshwater adaptation in threespine
sticklebacks (Gasterosteus aculeatus). Evolution, 65, 1800–1807.
Edelaar P, Bolnick DI (2012) Non-random gene flow: an under-
appreciated force in evolution and ecology. Trends in Ecology
& Evolution, 27, 659–665.Endler JA (1973) Gene flow and population differentiation.
Science, 179, 243–250.Endler JA (1977) Geographic Variation, Speciation, and Clines.
Princeton University Press, Princeton, New Jersey.
Endler JA (1986) Natural Selection in the Wild. Princeton
University Press, Princeton, New Jersey.
© 2013 John Wiley & Sons Ltd
178 J . A . M. RAEYMAEKERS ET AL.
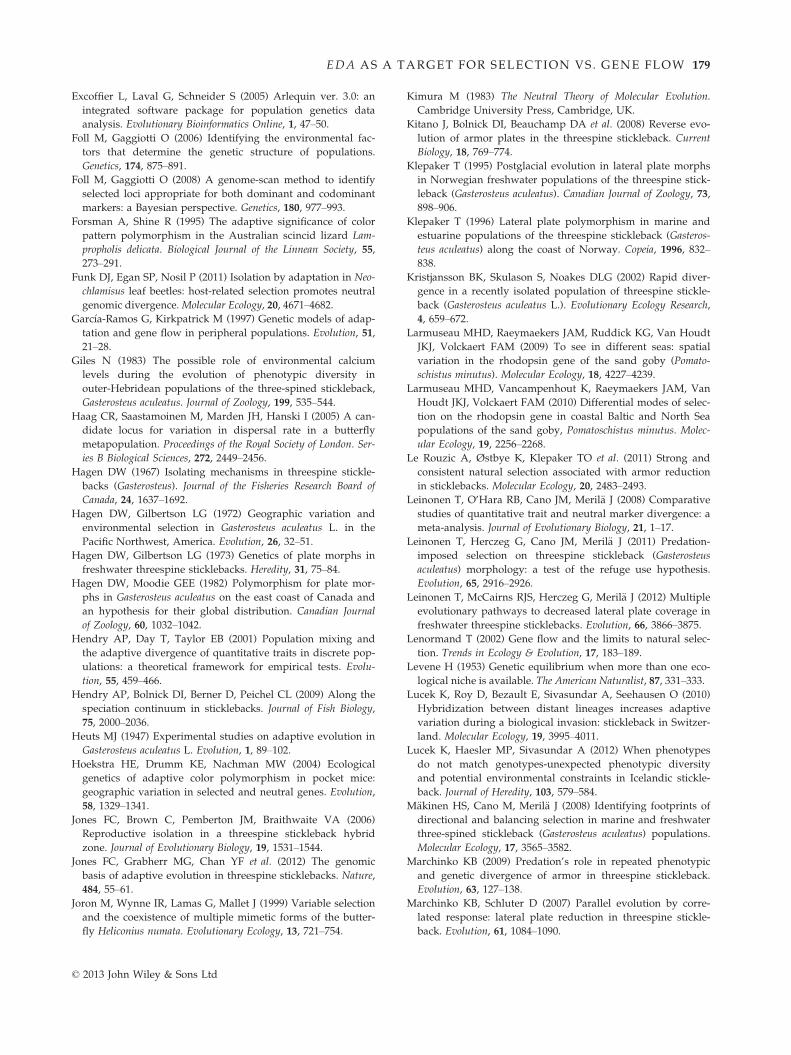
Excoffier L, Laval G, Schneider S (2005) Arlequin ver. 3.0: an
integrated software package for population genetics data
analysis. Evolutionary Bioinformatics Online, 1, 47–50.
Foll M, Gaggiotti O (2006) Identifying the environmental fac-
tors that determine the genetic structure of populations.
Genetics, 174, 875–891.Foll M, Gaggiotti O (2008) A genome-scan method to identify
selected loci appropriate for both dominant and codominant
markers: a Bayesian perspective. Genetics, 180, 977–993.
Forsman A, Shine R (1995) The adaptive significance of color
pattern polymorphism in the Australian scincid lizard Lam-
propholis delicata. Biological Journal of the Linnean Society, 55,
273–291.
Funk DJ, Egan SP, Nosil P (2011) Isolation by adaptation in Neo-
chlamisus leaf beetles: host-related selection promotes neutral
genomic divergence. Molecular Ecology, 20, 4671–4682.Garc�ıa-Ramos G, Kirkpatrick M (1997) Genetic models of adap-
tation and gene flow in peripheral populations. Evolution, 51,
21–28.
Giles N (1983) The possible role of environmental calcium
levels during the evolution of phenotypic diversity in
outer-Hebridean populations of the three-spined stickleback,
Gasterosteus aculeatus. Journal of Zoology, 199, 535–544.
Haag CR, Saastamoinen M, Marden JH, Hanski I (2005) A can-
didate locus for variation in dispersal rate in a butterfly
metapopulation. Proceedings of the Royal Society of London. Ser-
ies B Biological Sciences, 272, 2449–2456.
Hagen DW (1967) Isolating mechanisms in threespine stickle-
backs (Gasterosteus). Journal of the Fisheries Research Board of
Canada, 24, 1637–1692.
Hagen DW, Gilbertson LG (1972) Geographic variation and
environmental selection in Gasterosteus aculeatus L. in the
Pacific Northwest, America. Evolution, 26, 32–51.Hagen DW, Gilbertson LG (1973) Genetics of plate morphs in
freshwater threespine sticklebacks. Heredity, 31, 75–84.Hagen DW, Moodie GEE (1982) Polymorphism for plate mor-
phs in Gasterosteus aculeatus on the east coast of Canada and
an hypothesis for their global distribution. Canadian Journal
of Zoology, 60, 1032–1042.Hendry AP, Day T, Taylor EB (2001) Population mixing and
the adaptive divergence of quantitative traits in discrete pop-
ulations: a theoretical framework for empirical tests. Evolu-
tion, 55, 459–466.Hendry AP, Bolnick DI, Berner D, Peichel CL (2009) Along the
speciation continuum in sticklebacks. Journal of Fish Biology,
75, 2000–2036.
Heuts MJ (1947) Experimental studies on adaptive evolution in
Gasterosteus aculeatus L. Evolution, 1, 89–102.
Hoekstra HE, Drumm KE, Nachman MW (2004) Ecological
genetics of adaptive color polymorphism in pocket mice:
geographic variation in selected and neutral genes. Evolution,
58, 1329–1341.
Jones FC, Brown C, Pemberton JM, Braithwaite VA (2006)
Reproductive isolation in a threespine stickleback hybrid
zone. Journal of Evolutionary Biology, 19, 1531–1544.Jones FC, Grabherr MG, Chan YF et al. (2012) The genomic
basis of adaptive evolution in threespine sticklebacks. Nature,
484, 55–61.
Joron M, Wynne IR, Lamas G, Mallet J (1999) Variable selection
and the coexistence of multiple mimetic forms of the butter-
fly Heliconius numata. Evolutionary Ecology, 13, 721–754.
Kimura M (1983) The Neutral Theory of Molecular Evolution.
Cambridge University Press, Cambridge, UK.
Kitano J, Bolnick DI, Beauchamp DA et al. (2008) Reverse evo-
lution of armor plates in the threespine stickleback. Current
Biology, 18, 769–774.
Klepaker T (1995) Postglacial evolution in lateral plate morphs
in Norwegian freshwater populations of the threespine stick-
leback (Gasterosteus aculeatus). Canadian Journal of Zoology, 73,
898–906.
Klepaker T (1996) Lateral plate polymorphism in marine and
estuarine populations of the threespine stickleback (Gasteros-
teus aculeatus) along the coast of Norway. Copeia, 1996, 832–838.
Kristjansson BK, Skulason S, Noakes DLG (2002) Rapid diver-
gence in a recently isolated population of threespine stickle-
back (Gasterosteus aculeatus L.). Evolutionary Ecology Research,
4, 659–672.
Larmuseau MHD, Raeymaekers JAM, Ruddick KG, Van Houdt
JKJ, Volckaert FAM (2009) To see in different seas: spatial
variation in the rhodopsin gene of the sand goby (Pomato-
schistus minutus). Molecular Ecology, 18, 4227–4239.
Larmuseau MHD, Vancampenhout K, Raeymaekers JAM, Van
Houdt JKJ, Volckaert FAM (2010) Differential modes of selec-
tion on the rhodopsin gene in coastal Baltic and North Sea
populations of the sand goby, Pomatoschistus minutus. Molec-
ular Ecology, 19, 2256–2268.Le Rouzic A, Østbye K, Klepaker TO et al. (2011) Strong and
consistent natural selection associated with armor reduction
in sticklebacks. Molecular Ecology, 20, 2483–2493.Leinonen T, O’Hara RB, Cano JM, Meril€a J (2008) Comparative
studies of quantitative trait and neutral marker divergence: a
meta-analysis. Journal of Evolutionary Biology, 21, 1–17.
Leinonen T, Herczeg G, Cano JM, Meril€a J (2011) Predation-
imposed selection on threespine stickleback (Gasterosteus
aculeatus) morphology: a test of the refuge use hypothesis.
Evolution, 65, 2916–2926.
Leinonen T, McCairns RJS, Herczeg G, Meril€a J (2012) Multiple
evolutionary pathways to decreased lateral plate coverage in
freshwater threespine sticklebacks. Evolution, 66, 3866–3875.Lenormand T (2002) Gene flow and the limits to natural selec-
tion. Trends in Ecology & Evolution, 17, 183–189.Levene H (1953) Genetic equilibrium when more than one eco-
logical niche is available. The American Naturalist, 87, 331–333.Lucek K, Roy D, Bezault E, Sivasundar A, Seehausen O (2010)
Hybridization between distant lineages increases adaptive
variation during a biological invasion: stickleback in Switzer-
land. Molecular Ecology, 19, 3995–4011.Lucek K, Haesler MP, Sivasundar A (2012) When phenotypes
do not match genotypes-unexpected phenotypic diversity
and potential environmental constraints in Icelandic stickle-
back. Journal of Heredity, 103, 579–584.M€akinen HS, Cano M, Meril€a J (2008) Identifying footprints of
directional and balancing selection in marine and freshwater
three-spined stickleback (Gasterosteus aculeatus) populations.
Molecular Ecology, 17, 3565–3582.Marchinko KB (2009) Predation’s role in repeated phenotypic
and genetic divergence of armor in threespine stickleback.
Evolution, 63, 127–138.
Marchinko KB, Schluter D (2007) Parallel evolution by corre-
lated response: lateral plate reduction in threespine stickle-
back. Evolution, 61, 1084–1090.
© 2013 John Wiley & Sons Ltd
EDA AS A TARGET FOR SELECTION VS. GENE FLOW 179
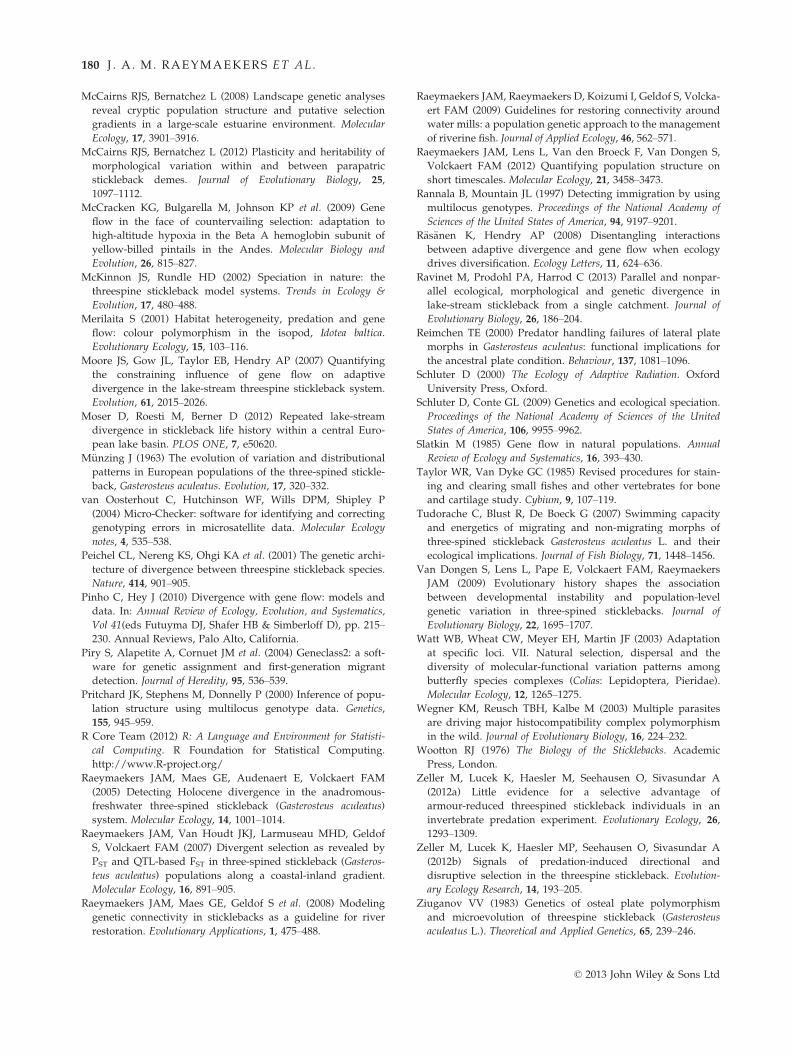
McCairns RJS, Bernatchez L (2008) Landscape genetic analyses
reveal cryptic population structure and putative selection
gradients in a large-scale estuarine environment. Molecular
Ecology, 17, 3901–3916.McCairns RJS, Bernatchez L (2012) Plasticity and heritability of
morphological variation within and between parapatric
stickleback demes. Journal of Evolutionary Biology, 25,
1097–1112.McCracken KG, Bulgarella M, Johnson KP et al. (2009) Gene
flow in the face of countervailing selection: adaptation to
high-altitude hypoxia in the Beta A hemoglobin subunit of
yellow-billed pintails in the Andes. Molecular Biology and
Evolution, 26, 815–827.
McKinnon JS, Rundle HD (2002) Speciation in nature: the
threespine stickleback model systems. Trends in Ecology &
Evolution, 17, 480–488.Merilaita S (2001) Habitat heterogeneity, predation and gene
flow: colour polymorphism in the isopod, Idotea baltica.
Evolutionary Ecology, 15, 103–116.
Moore JS, Gow JL, Taylor EB, Hendry AP (2007) Quantifying
the constraining influence of gene flow on adaptive
divergence in the lake-stream threespine stickleback system.
Evolution, 61, 2015–2026.
Moser D, Roesti M, Berner D (2012) Repeated lake-stream
divergence in stickleback life history within a central Euro-
pean lake basin. PLOS ONE, 7, e50620.
M€unzing J (1963) The evolution of variation and distributional
patterns in European populations of the three-spined stickle-
back, Gasterosteus aculeatus. Evolution, 17, 320–332.van Oosterhout C, Hutchinson WF, Wills DPM, Shipley P
(2004) Micro-Checker: software for identifying and correcting
genotyping errors in microsatellite data. Molecular Ecology
notes, 4, 535–538.Peichel CL, Nereng KS, Ohgi KA et al. (2001) The genetic archi-
tecture of divergence between threespine stickleback species.
Nature, 414, 901–905.
Pinho C, Hey J (2010) Divergence with gene flow: models and
data. In: Annual Review of Ecology, Evolution, and Systematics,
Vol 41(eds Futuyma DJ, Shafer HB & Simberloff D), pp. 215–230. Annual Reviews, Palo Alto, California.
Piry S, Alapetite A, Cornuet JM et al. (2004) Geneclass2: a soft-
ware for genetic assignment and first-generation migrant
detection. Journal of Heredity, 95, 536–539.Pritchard JK, Stephens M, Donnelly P (2000) Inference of popu-
lation structure using multilocus genotype data. Genetics,
155, 945–959.
R Core Team (2012) R: A Language and Environment for Statisti-
cal Computing. R Foundation for Statistical Computing.
http://www.R-project.org/
Raeymaekers JAM, Maes GE, Audenaert E, Volckaert FAM
(2005) Detecting Holocene divergence in the anadromous-
freshwater three-spined stickleback (Gasterosteus aculeatus)
system. Molecular Ecology, 14, 1001–1014.Raeymaekers JAM, Van Houdt JKJ, Larmuseau MHD, Geldof
S, Volckaert FAM (2007) Divergent selection as revealed by
PST and QTL-based FST in three-spined stickleback (Gasteros-
teus aculeatus) populations along a coastal-inland gradient.
Molecular Ecology, 16, 891–905.
Raeymaekers JAM, Maes GE, Geldof S et al. (2008) Modeling
genetic connectivity in sticklebacks as a guideline for river
restoration. Evolutionary Applications, 1, 475–488.
Raeymaekers JAM, Raeymaekers D, Koizumi I, Geldof S, Volcka-
ert FAM (2009) Guidelines for restoring connectivity around
water mills: a population genetic approach to the management
of riverine fish. Journal of Applied Ecology, 46, 562–571.Raeymaekers JAM, Lens L, Van den Broeck F, Van Dongen S,
Volckaert FAM (2012) Quantifying population structure on
short timescales. Molecular Ecology, 21, 3458–3473.
Rannala B, Mountain JL (1997) Detecting immigration by using
multilocus genotypes. Proceedings of the National Academy of
Sciences of the United States of America, 94, 9197–9201.R€as€anen K, Hendry AP (2008) Disentangling interactions
between adaptive divergence and gene flow when ecology
drives diversification. Ecology Letters, 11, 624–636.
Ravinet M, Prodohl PA, Harrod C (2013) Parallel and nonpar-
allel ecological, morphological and genetic divergence in
lake-stream stickleback from a single catchment. Journal of
Evolutionary Biology, 26, 186–204.
Reimchen TE (2000) Predator handling failures of lateral plate
morphs in Gasterosteus aculeatus: functional implications for
the ancestral plate condition. Behaviour, 137, 1081–1096.Schluter D (2000) The Ecology of Adaptive Radiation. Oxford
University Press, Oxford.
Schluter D, Conte GL (2009) Genetics and ecological speciation.
Proceedings of the National Academy of Sciences of the United
States of America, 106, 9955–9962.
Slatkin M (1985) Gene flow in natural populations. Annual
Review of Ecology and Systematics, 16, 393–430.
Taylor WR, Van Dyke GC (1985) Revised procedures for stain-
ing and clearing small fishes and other vertebrates for bone
and cartilage study. Cybium, 9, 107–119.
Tudorache C, Blust R, De Boeck G (2007) Swimming capacity
and energetics of migrating and non-migrating morphs of
three-spined stickleback Gasterosteus aculeatus L. and their
ecological implications. Journal of Fish Biology, 71, 1448–1456.
Van Dongen S, Lens L, Pape E, Volckaert FAM, Raeymaekers
JAM (2009) Evolutionary history shapes the association
between developmental instability and population-level
genetic variation in three-spined sticklebacks. Journal of
Evolutionary Biology, 22, 1695–1707.Watt WB, Wheat CW, Meyer EH, Martin JF (2003) Adaptation
at specific loci. VII. Natural selection, dispersal and the
diversity of molecular-functional variation patterns among
butterfly species complexes (Colias: Lepidoptera, Pieridae).
Molecular Ecology, 12, 1265–1275.
Wegner KM, Reusch TBH, Kalbe M (2003) Multiple parasites
are driving major histocompatibility complex polymorphism
in the wild. Journal of Evolutionary Biology, 16, 224–232.Wootton RJ (1976) The Biology of the Sticklebacks. Academic
Press, London.
Zeller M, Lucek K, Haesler M, Seehausen O, Sivasundar A
(2012a) Little evidence for a selective advantage of
armour-reduced threespined stickleback individuals in an
invertebrate predation experiment. Evolutionary Ecology, 26,
1293–1309.
Zeller M, Lucek K, Haesler MP, Seehausen O, Sivasundar A
(2012b) Signals of predation-induced directional and
disruptive selection in the threespine stickleback. Evolution-
ary Ecology Research, 14, 193–205.
Ziuganov VV (1983) Genetics of osteal plate polymorphism
and microevolution of threespine stickleback (Gasterosteus
aculeatus L.). Theoretical and Applied Genetics, 65, 239–246.
© 2013 John Wiley & Sons Ltd
180 J . A . M. RAEYMAEKERS ET AL.
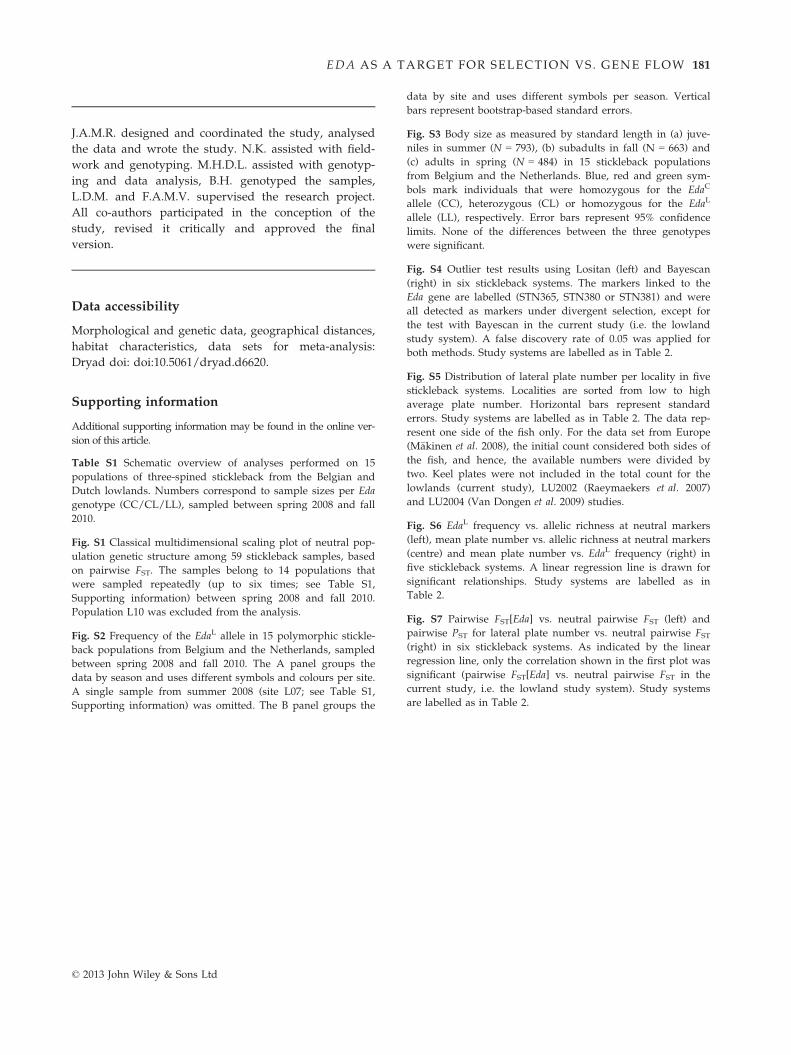
J.A.M.R. designed and coordinated the study, analysed
the data and wrote the study. N.K. assisted with field-
work and genotyping. M.H.D.L. assisted with genotyp-
ing and data analysis, B.H. genotyped the samples,
L.D.M. and F.A.M.V. supervised the research project.
All co-authors participated in the conception of the
study, revised it critically and approved the final
version.
Data accessibility
Morphological and genetic data, geographical distances,
habitat characteristics, data sets for meta-analysis:
Dryad doi: doi:10.5061/dryad.d6620.
Supporting information
Additional supporting information may be found in the online ver-
sion of this article.
Table S1 Schematic overview of analyses performed on 15
populations of three-spined stickleback from the Belgian and
Dutch lowlands. Numbers correspond to sample sizes per Eda
genotype (CC/CL/LL), sampled between spring 2008 and fall
2010.
Fig. S1 Classical multidimensional scaling plot of neutral pop-
ulation genetic structure among 59 stickleback samples, based
on pairwise FST. The samples belong to 14 populations that
were sampled repeatedly (up to six times; see Table S1,
Supporting information) between spring 2008 and fall 2010.
Population L10 was excluded from the analysis.
Fig. S2 Frequency of the EdaL allele in 15 polymorphic stickle-
back populations from Belgium and the Netherlands, sampled
between spring 2008 and fall 2010. The A panel groups the
data by season and uses different symbols and colours per site.
A single sample from summer 2008 (site L07; see Table S1,
Supporting information) was omitted. The B panel groups the
data by site and uses different symbols per season. Vertical
bars represent bootstrap-based standard errors.
Fig. S3 Body size as measured by standard length in (a) juve-
niles in summer (N = 793), (b) subadults in fall (N = 663) and
(c) adults in spring (N = 484) in 15 stickleback populations
from Belgium and the Netherlands. Blue, red and green sym-
bols mark individuals that were homozygous for the EdaC
allele (CC), heterozygous (CL) or homozygous for the EdaL
allele (LL), respectively. Error bars represent 95% confidence
limits. None of the differences between the three genotypes
were significant.
Fig. S4 Outlier test results using Lositan (left) and Bayescan
(right) in six stickleback systems. The markers linked to the
Eda gene are labelled (STN365, STN380 or STN381) and were
all detected as markers under divergent selection, except for
the test with Bayescan in the current study (i.e. the lowland
study system). A false discovery rate of 0.05 was applied for
both methods. Study systems are labelled as in Table 2.
Fig. S5 Distribution of lateral plate number per locality in five
stickleback systems. Localities are sorted from low to high
average plate number. Horizontal bars represent standard
errors. Study systems are labelled as in Table 2. The data rep-
resent one side of the fish only. For the data set from Europe
(M€akinen et al. 2008), the initial count considered both sides of
the fish, and hence, the available numbers were divided by
two. Keel plates were not included in the total count for the
lowlands (current study), LU2002 (Raeymaekers et al. 2007)
and LU2004 (Van Dongen et al. 2009) studies.
Fig. S6 EdaL frequency vs. allelic richness at neutral markers
(left), mean plate number vs. allelic richness at neutral markers
(centre) and mean plate number vs. EdaL frequency (right) in
five stickleback systems. A linear regression line is drawn for
significant relationships. Study systems are labelled as in
Table 2.
Fig. S7 Pairwise FST[Eda] vs. neutral pairwise FST (left) and
pairwise PST for lateral plate number vs. neutral pairwise FST(right) in six stickleback systems. As indicated by the linear
regression line, only the correlation shown in the first plot was
significant (pairwise FST[Eda] vs. neutral pairwise FST in the
current study, i.e. the lowland study system). Study systems
are labelled as in Table 2.
© 2013 John Wiley & Sons Ltd
EDA AS A TARGET FOR SELECTION VS. GENE FLOW 181