Embed Size (px)
Citation preview
Song et al. Proteome Science 2014, 12:5http://www.proteomesci.com/content/12/1/5
RESEARCH Open Access
Plasma protein profiling of Mild CognitiveImpairment and Alzheimer’s disease using iTRAQquantitative proteomicsFei Song1, Anne Poljak2,3*, Nicole A Kochan1,4, Mark Raftery2, Henry Brodaty4, George A Smythe3
and Perminder S Sachdev1,4
Abstract
Background: With the promise of disease modifying treatments, there is a need for more specific diagnosis andprognosis of Alzheimer’s disease (AD) and mild cognitive impairment (MCI). Plasma biomarkers are likely to beutilised to increase diagnostic accuracy and specificity of AD and cognitive decline.
Methods: Isobaric tags (iTRAQ) and proteomic methods were used to identify potential plasma biomarkers of MCIand AD. Relative protein expression level changes were quantified in plasma of 411 cognitively normal subjects,19 AD patients and 261 MCI patients. Plasma was pooled into 4 groups including normal control, AD, amnesticsingle and multiple domain MCI (aMCI), and nonamnestic single and multiple domain MCI (nMCI). Western-blottingwas used to validate iTRAQ data. Integrated function and protein interactions were explored using WEB basedbioinformatics tools (DAVID v6.7 and STRING v9.0).
Results: In at least two iTRAQ replicate experiments, 30 proteins were significantly dysregulated in MCI andAD plasma, relative to controls. These proteins included ApoA1, ApoB100, complement C3, C4b-bindingprotein, afamin, vitamin D-binding protein precursor, isoform 1 of Gelsolin actin regulator, Ig mμ chain C region(IGHM), histidine-rich glycoprotein and fibrinogen β and γ chains. Western-blotting confirmed that afamin wasdecreased and IGHM was increased in MCI and AD groups. Bioinformatics results indicated that these dysregulatedproteins represented a diversity of biological processes, including acute inflammatory response, cholesterol transportand blood coagulation.
Conclusion: These findings demonstrate that expression level changes in multiple proteins are observed in MCI andAD plasma. Some of these, such as afamin and IGHM, may be candidate biomarkers for AD and the predementiacondition of MCI.
Keywords: Biomarkers, Isobaric tags for relative and absolute quantitation (iTRAQ), Plasma, Mild Cognitive Impairment,Alzheimer’s disease, Proteomics
IntroductionAlzheimer’s disease (AD) is the most common causeof dementia and approximately one in eight people over65 years old are at risk. AD is an age-related andinsidious-onset neurodegenerative disease [1]. Mild cog-nitive impairment (MCI) is proposed to be a phase of
* Correspondence: [email protected] Mass Spectrometry Facility, University of New South Wales,Sydney, Australia3School of Medical Sciences, University of New South Wales, Sydney, AustraliaFull list of author information is available at the end of the article
© 2014 Song et al.; licensee BioMed Central LCommons Attribution License (http://creativecreproduction in any medium, provided the or
cognitive decline intermediate between normal healthand dementia [2]. MCI patients may progress to AD,vascular disease and other kinds of dementia. The diag-nosis of MCI and AD depends on a combination of clin-ical and neuropsychological tests, with no easy andeffective diagnostic methods for use in the early stagesof cognitive impairment. Early diagnosis may supportmeasures to prevent disease progression from MCI to AD,and benefit the development of effective treatments. Sev-eral previous studies have focused on this field and re-ported some proteins as potential AD plasma biomarkers
td. This is an open access article distributed under the terms of the Creativeommons.org/licenses/by/2.0), which permits unrestricted use, distribution, andiginal work is properly cited.
Song et al. Proteome Science 2014, 12:5 Page 2 of 13http://www.proteomesci.com/content/12/1/5
[3-5] and some literature review papers have also beenpublished [6,7]. A few studies have chosen panels of spe-cific proteins for analysis in the context of AD biomarkers[8,9], however few studies have applied discovery-basedproteomics methods to the plasma of MCI subjects toidentify biomarkers of the pre-dementia stage of AD.Obtaining plasma is less invasive than other techniques
such as lumbar puncture, and plasma is a body fluid widelyaccepted for use in clinical testing. It reflects the full com-plexity of body proteins in health and disease, containingbiomarkers relevant for prediction, diagnosis or furtherinvestigation into the cause and effects of neurologicaldisorders. Despite the ease in obtaining plasma, a majorchallenge associated with its analysis is its high com-plexity. The relatively high abundance of proteins likeserum albumin and immunoglobulins, which togetherconstitute more than 85% of the total protein content,masks the lower abundant proteins which may be po-tential biomarkers. To overcome this problem, the highabundance proteins must first be removed with the useof affinity depletion columns [10,11].Our objective was to examine the alteration in global
expression of proteins in the plasma of MCI and AD sub-jects in comparison with cognitively normal subjects. TheiTRAQ approach was utilised to analyse immunodepletedplasma samples from amnestic single and multiple do-main MCI (aMCI), nonamnestic single and multiple do-main MCI (nMCI), AD and cognitively normal subjectsto reveal candidate biomarkers. Pooled plasma from thevarious groups was assayed and the iTRAQ experimentsrepeated three times (three biological replicates), and runtwice (two technical replicates) by two dimensional liquidchromatography (2D LC) tandem mass spectrometry (MS/MS). It was expected that studying plasma proteins inMCI and AD subjects using a discovery-based proteomicsmethod might identify potential new protein biomarkersfor neurodegenerative disease, and provide a screeningtool for identifying specific proteins to study in more de-tail, as we have already begun to do [12].
Experimental proceduresEthics statement and consentEthics committee approval was obtained from theUniversity of New South Wales (UNSW) and the SouthEast Sydney Area Health Service (SESAHS) ethics commit-tees, and is in compliance with the Helsinki Declaration.Written informed consent was obtained from patients and,in the case of AD subjects, additionally from a significantfamily member.
Subjects and samplesPlasma samples of aMCI (n = 147), nMCI (n = 114) andcognitively normal subjects (n = 411) were collected fromthe Wave 1 (baseline) of the Sydney Memory and Ageing
Study (MAS) (n = 1073), a population based longitudinalstudy of non-demented older adults [13]. Plasma samplesfrom AD patients (n = 19), who were volunteers for a drugtrial of a cholinesterase inhibitor, were collected at theMemory Clinic of the Department of Old Age Psychiatry ofthe Prince of Wales Hospital. Patients met the NINCDS-ADRDA (National Institute of Neurological and Communi-cative Diseases and Stroke/Alzheimer’s Disease and RelatedDisorders Association) criteria [14] for clinically determinedprobable mild or moderate AD. Samples from all studygroups were collected using the same protocol. Fastingplasma samples containing EDTA were aliquoted (100 μl)into polypropylene tubes, stored at −80°C, and only thawedimmediately before assay.
Clinical evaluationThe diagnosis of MCI used for this study was based oninternational consensus criteria [15] as follows: (a) com-plaint of decline in memory or other cognitive functionwhich may be self- or informant-reported; (b) cognitiveimpairment on objective testing, i.e. not normal for ageas determined by performance on at least one test mea-sure 1.5 SDs or more below published normative values(or comparable standardised score compared to age and/or education-matched samples); (c) participants did nothave a pre-existing diagnosis of dementia on entry to thestudy, had an adjusted mini–mental state examination(MMSE) score of ≥24 and did not meet DSM-IV (AmericanPsychiatric Association Diagnostic and Statistical Manual,4th Edition) criteria [16] for possible or probable dementia;(d) essentially normal function or minimal impairment inIADLs defined by a total average score <3.0 on the inform-ant rated B-ADL [17].Two MCI subtypes [18] are defined according to the
following cognitive impairment profiles: amnestic singleand multiple domain (only memory domain impairedand memory plus at least one non-memory domain im-paired), non-amnestic single and multiple domain (onenon-memory domain impaired and more than one non-memory domain impaired). The criterion for impaireddomain was met if at least one of the measures from thedomain was impaired, with a score 1.5 SD below norma-tive data. The full list of domains, tests used for measuringeach domain, and the sources of normative data used todetermine impairment is presented in a previously pub-lished paper [13].
Sample preparation and immunodepletionIndividual plasma samples were pooled into four groupsaccording to the diagnosis (Table 1), comprising cognitivelynormal, aMCI, nMCI and AD. Three aliquots (150 μl) ofpooled plasma from each group were immunodepleted ineach of three 5-plex iTRAQ experiments.
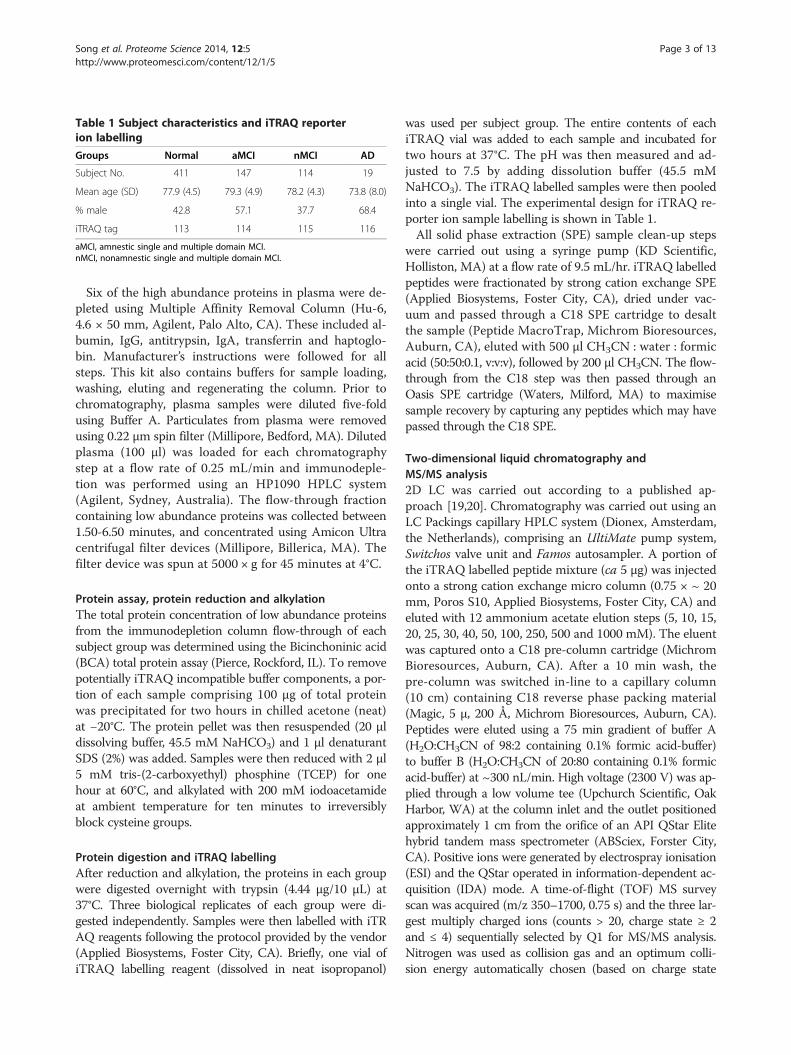
Table 1 Subject characteristics and iTRAQ reporterion labelling
Groups Normal aMCI nMCI AD
Subject No. 411 147 114 19
Mean age (SD) 77.9 (4.5) 79.3 (4.9) 78.2 (4.3) 73.8 (8.0)
% male 42.8 57.1 37.7 68.4
iTRAQ tag 113 114 115 116
aMCI, amnestic single and multiple domain MCI.nMCI, nonamnestic single and multiple domain MCI.
Song et al. Proteome Science 2014, 12:5 Page 3 of 13http://www.proteomesci.com/content/12/1/5
Six of the high abundance proteins in plasma were de-pleted using Multiple Affinity Removal Column (Hu-6,4.6 × 50 mm, Agilent, Palo Alto, CA). These included al-bumin, IgG, antitrypsin, IgA, transferrin and haptoglo-bin. Manufacturer’s instructions were followed for allsteps. This kit also contains buffers for sample loading,washing, eluting and regenerating the column. Prior tochromatography, plasma samples were diluted five-foldusing Buffer A. Particulates from plasma were removedusing 0.22 μm spin filter (Millipore, Bedford, MA). Dilutedplasma (100 μl) was loaded for each chromatographystep at a flow rate of 0.25 mL/min and immunodeple-tion was performed using an HP1090 HPLC system(Agilent, Sydney, Australia). The flow-through fractioncontaining low abundance proteins was collected between1.50-6.50 minutes, and concentrated using Amicon Ultracentrifugal filter devices (Millipore, Billerica, MA). Thefilter device was spun at 5000 × g for 45 minutes at 4°C.
Protein assay, protein reduction and alkylationThe total protein concentration of low abundance proteinsfrom the immunodepletion column flow-through of eachsubject group was determined using the Bicinchoninic acid(BCA) total protein assay (Pierce, Rockford, IL). To removepotentially iTRAQ incompatible buffer components, a por-tion of each sample comprising 100 μg of total proteinwas precipitated for two hours in chilled acetone (neat)at −20°C. The protein pellet was then resuspended (20 μldissolving buffer, 45.5 mM NaHCO3) and 1 μl denaturantSDS (2%) was added. Samples were then reduced with 2 μl5 mM tris-(2-carboxyethyl) phosphine (TCEP) for onehour at 60°C, and alkylated with 200 mM iodoacetamideat ambient temperature for ten minutes to irreversiblyblock cysteine groups.
Protein digestion and iTRAQ labellingAfter reduction and alkylation, the proteins in each groupwere digested overnight with trypsin (4.44 μg/10 μL) at37°C. Three biological replicates of each group were di-gested independently. Samples were then labelled with iTRAQ reagents following the protocol provided by the vendor(Applied Biosystems, Foster City, CA). Briefly, one vial ofiTRAQ labelling reagent (dissolved in neat isopropanol)
was used per subject group. The entire contents of eachiTRAQ vial was added to each sample and incubated fortwo hours at 37°C. The pH was then measured and ad-justed to 7.5 by adding dissolution buffer (45.5 mMNaHCO3). The iTRAQ labelled samples were then pooledinto a single vial. The experimental design for iTRAQ re-porter ion sample labelling is shown in Table 1.All solid phase extraction (SPE) sample clean-up steps
were carried out using a syringe pump (KD Scientific,Holliston, MA) at a flow rate of 9.5 mL/hr. iTRAQ labelledpeptides were fractionated by strong cation exchange SPE(Applied Biosystems, Foster City, CA), dried under vac-uum and passed through a C18 SPE cartridge to desaltthe sample (Peptide MacroTrap, Michrom Bioresources,Auburn, CA), eluted with 500 μl CH3CN : water : formicacid (50:50:0.1, v:v:v), followed by 200 μl CH3CN. The flow-through from the C18 step was then passed through anOasis SPE cartridge (Waters, Milford, MA) to maximisesample recovery by capturing any peptides which may havepassed through the C18 SPE.
Two-dimensional liquid chromatography andMS/MS analysis2D LC was carried out according to a published ap-proach [19,20]. Chromatography was carried out using anLC Packings capillary HPLC system (Dionex, Amsterdam,the Netherlands), comprising an UltiMate pump system,Switchos valve unit and Famos autosampler. A portion ofthe iTRAQ labelled peptide mixture (ca 5 μg) was injectedonto a strong cation exchange micro column (0.75 × ~ 20mm, Poros S10, Applied Biosystems, Foster City, CA) andeluted with 12 ammonium acetate elution steps (5, 10, 15,20, 25, 30, 40, 50, 100, 250, 500 and 1000 mM). The eluentwas captured onto a C18 pre-column cartridge (MichromBioresources, Auburn, CA). After a 10 min wash, thepre-column was switched in-line to a capillary column(10 cm) containing C18 reverse phase packing material(Magic, 5 μ, 200 Å, Michrom Bioresources, Auburn, CA).Peptides were eluted using a 75 min gradient of buffer A(H2O:CH3CN of 98:2 containing 0.1% formic acid-buffer)to buffer B (H2O:CH3CN of 20:80 containing 0.1% formicacid-buffer) at ~300 nL/min. High voltage (2300 V) was ap-plied through a low volume tee (Upchurch Scientific, OakHarbor, WA) at the column inlet and the outlet positionedapproximately 1 cm from the orifice of an API QStar Elitehybrid tandem mass spectrometer (ABSciex, Forster City,CA). Positive ions were generated by electrospray ionisation(ESI) and the QStar operated in information-dependent ac-quisition (IDA) mode. A time-of-flight (TOF) MS surveyscan was acquired (m/z 350–1700, 0.75 s) and the three lar-gest multiply charged ions (counts > 20, charge state ≥ 2and ≤ 4) sequentially selected by Q1 for MS/MS analysis.Nitrogen was used as collision gas and an optimum colli-sion energy automatically chosen (based on charge state
Song et al. Proteome Science 2014, 12:5 Page 4 of 13http://www.proteomesci.com/content/12/1/5
and mass). Tandem mass spectra were accumulated for upto 2.5 s (m/z 65–2000).
Database searching, statistical analysis and bioinformaticsProtein identification and quantitation were performedusing the MS/MS data (WIFF files) and the Paragon al-gorithm as implemented in Protein Pilot v2.0.1 software(Applied Biosystems/MDS Sciex, Foster City, CA). Thedatabase used was ipi. HUMAN. v 3.58. fasta [20]. Iden-tification of proteins was only accepted with a Protein-Pilot Unused Score of ≥1.3 (greater than 95% confidenceinterval). The Paragon method uses the miscleavage fac-tor to calculate the probability of missed cleavages. Mostcommonly 1 or 2 missed cleavages are allowed. The Pro-teinPilot Biological Modifications option was selected tosearch for variable post-translational modifications (PTMs).This includes a list of >220 PTMs to include in the search.The modifications use the HUPO-PSI modification nomen-clature. The only fixed modification used was iodoaceta-mide alkylation of cysteine residues. Mass tolerances wereca 50 ppm for the precursor and 0.2 Da for the fragmention masses. Autobias correction was used to correct for sys-tematic bias in sample pooling. Only proteins identified inall three iTRAQ experiments were further analysed. Quan-titative data were exported into Excel (Microsoft, Bellevue,WA) for further analysis.Integrated function and protein interactions were ex-
plored using Web-based bioinformatics tools: Databasefor Annotation, Visualisation and Integrated Discovery(DAVID v6.7) [21,22] and Search Tool for the Retrievalof Interacting Genes/Proteins (STRING v9) [23]. DAVIDbioinformatics resources consist of an integrated bio-logical knowledgebase and analytic tools aimed at sys-tematically extracting biological meaning from large gene/protein lists. STRING is a meta-resource that aggregatesmost of the available information on protein-protein as-sociations, scores and weights, and augments it withpredicted interactions, as well as results of automaticliterature-mining searches. The full set of dysregulatedproteins in MCI and AD from iTRAQ results was en-tered into DAVID for functional analysis and STRINGfor the analysis of protein interaction. The backgroundset for DAVID analysis was the full homosapiens gen-ome (default set in DAVID).
Western blot analysisHigh abundance protein-depleted plasma samples wereelectrophoretically separated on a 1D NuPAGE 4-12%gradient gel (Invitrogen, Carlsbad, CA), with equal amountsof total protein (15 μg) loaded in each lane. Prestainedmarkers were loaded in one lane to indicate approximatemolecular weight. The gel was electroblotted (10 V, 80 mA,2 hr) onto a nitrocellulose membrane in semidry transferbuffer (50 mM Tris HCl, 40 mM glycine, 1.3 mM SDS, 20%
methanol, pH 9.2). Once the transfer was complete, thenitrocellulose membrane was incubated in skim milk pow-der solution (10% in 10 mM tris/HCl pH 7.5 containing0.9% NaCl) containing the primary antibody. Immuno-blotting was carried out with antibodies against afamin(0.86 μg/ml, Abcam, Cambridge, UK) and Ig mμ chainC region (Immunoglobulin heavy constant mu, IGHM)(1:200 dilution, Abnova Coporation, Taibei, Taiwan), fol-lowed by a secondary antibody (1:100,000 anti-rabbitIgG and anti-mouse IgG, respectively) (Pierce, Rockford,IL). Chemiluminescence blots were developed with 1:1solution of Super Signal West Femto Luminol/Enhancerand Stable Peroxide buffer (Pierce, Rockford, IL) and usingthe manufacturer’s instructions. Chemiluminescence filmswere scanned using a KODAK Gel Logic 100 Imaging Sys-tem (Sydney, Australia). Western blot images were thenquantified using Labscan v3.00 software (Amersham Bio-science, UK).
ResultsiTRAQ analysis of plasma proteins from aMCI, nMCI, ADand cognitively normal subjects to detect differentialprotein expressionPlasma protein expression profiles in MCI and AD wereanalysed by comparing the results of three biological repli-cates of the 5-plex iTRAQ experiment. Proteins identifiedin the three iTRAQ replicates and their reporter ion ratiosrelative to the control sample (reporter ion 113) are pre-sented in Additional file 1: Table S1, Additional file 2:Table S2 and Additional file 3: Table S3. Protein Pilot v2.0identified and quantified a total of 93, 107 and 96 proteinsin the first, second and third biological replicates, respect-ively. The results of three iTRAQ replicates are sum-marised in Table 2.In total, 145 unique proteins were identified, with a mini-
mum unused score of ≥1.3 (which indicates a >95% confi-dence in correct sequence identification). A subset of 30significantly dysregulated proteins (Table 3) were selectedfor further analysis using bioinformatics tools, the selectioncriteria being: 1) significant iTRAQ ratio alteration for aparticular protein (p value ≤ 0.05) in at least one MCI sub-type or AD group, and 2) consistent trends of significantalteration in at least two iTRAQ replicates. Thirty proteinsmet the criteria, and Table 3 shows the iTRAQ results ofthese proteins. Most ratios of dysregulated proteins werebetween 0.75 and 1.25. A substantial proportion (26.7%) ofthese proteins belonged to the apolipoprotein family. Pro-tein level False Discovery Rate (FDR) analysis was carriedout using ProteinPilot v4. The number of proteins detectedat 5% FDR range from 93 to 111. Corresponding Protein-Pilot confidence at 5% FDR ranges from 96.9% to 99.1%.Corresponding unused ProtScore at 5% FDR ranges from1.51 to 2.04.
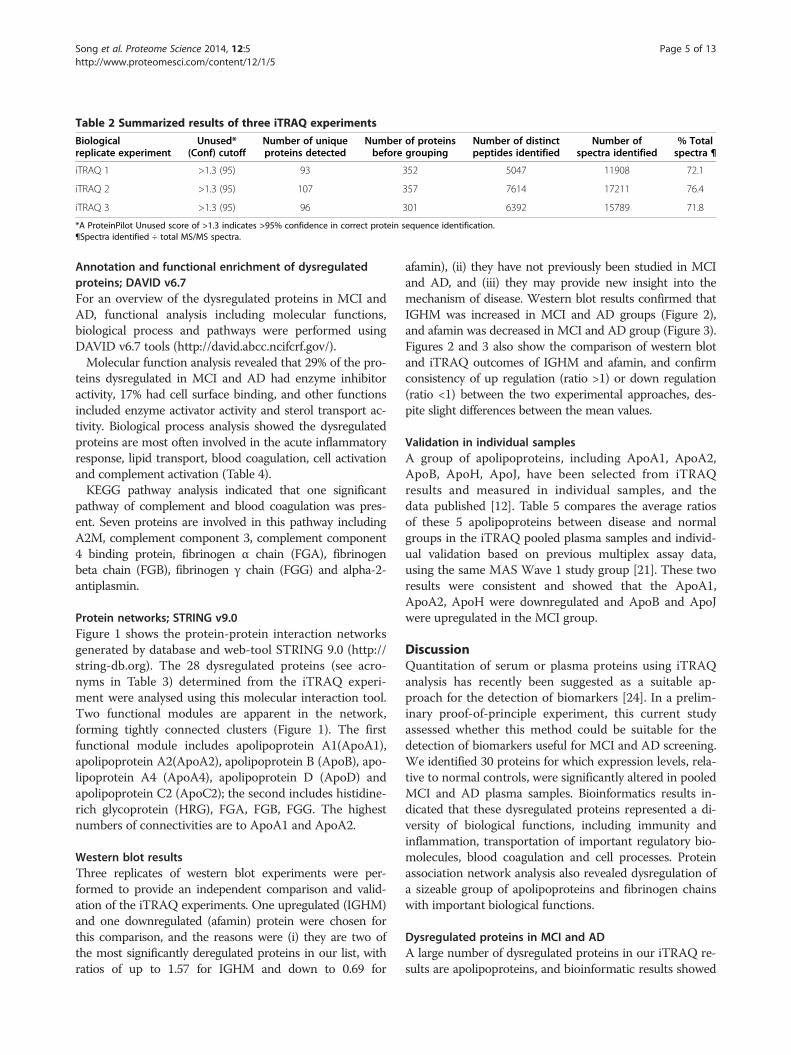
Table 2 Summarized results of three iTRAQ experiments
Biologicalreplicate experiment
Unused*(Conf) cutoff
Number of uniqueproteins detected
Number of proteinsbefore grouping
Number of distinctpeptides identified
Number ofspectra identified
% Totalspectra ¶
iTRAQ 1 >1.3 (95) 93 352 5047 11908 72.1
iTRAQ 2 >1.3 (95) 107 357 7614 17211 76.4
iTRAQ 3 >1.3 (95) 96 301 6392 15789 71.8
*A ProteinPilot Unused score of >1.3 indicates >95% confidence in correct protein sequence identification.¶Spectra identified ÷ total MS/MS spectra.
Song et al. Proteome Science 2014, 12:5 Page 5 of 13http://www.proteomesci.com/content/12/1/5
Annotation and functional enrichment of dysregulatedproteins; DAVID v6.7For an overview of the dysregulated proteins in MCI andAD, functional analysis including molecular functions,biological process and pathways were performed usingDAVID v6.7 tools (http://david.abcc.ncifcrf.gov/).Molecular function analysis revealed that 29% of the pro-
teins dysregulated in MCI and AD had enzyme inhibitoractivity, 17% had cell surface binding, and other functionsincluded enzyme activator activity and sterol transport ac-tivity. Biological process analysis showed the dysregulatedproteins are most often involved in the acute inflammatoryresponse, lipid transport, blood coagulation, cell activationand complement activation (Table 4).KEGG pathway analysis indicated that one significant
pathway of complement and blood coagulation was pres-ent. Seven proteins are involved in this pathway includingA2M, complement component 3, complement component4 binding protein, fibrinogen α chain (FGA), fibrinogenbeta chain (FGB), fibrinogen γ chain (FGG) and alpha-2-antiplasmin.
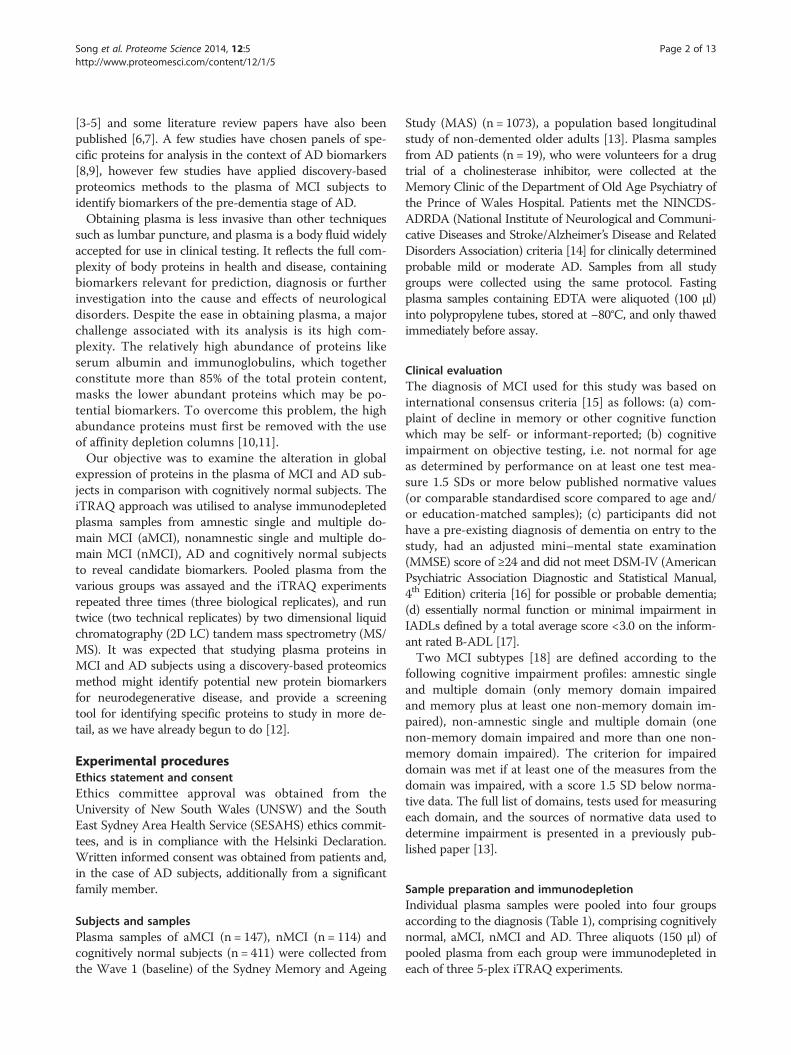
Protein networks; STRING v9.0Figure 1 shows the protein-protein interaction networksgenerated by database and web-tool STRING 9.0 (http://string-db.org). The 28 dysregulated proteins (see acro-nyms in Table 3) determined from the iTRAQ experi-ment were analysed using this molecular interaction tool.Two functional modules are apparent in the network,forming tightly connected clusters (Figure 1). The firstfunctional module includes apolipoprotein A1(ApoA1),apolipoprotein A2(ApoA2), apolipoprotein B (ApoB), apo-lipoprotein A4 (ApoA4), apolipoprotein D (ApoD) andapolipoprotein C2 (ApoC2); the second includes histidine-rich glycoprotein (HRG), FGA, FGB, FGG. The highestnumbers of connectivities are to ApoA1 and ApoA2.
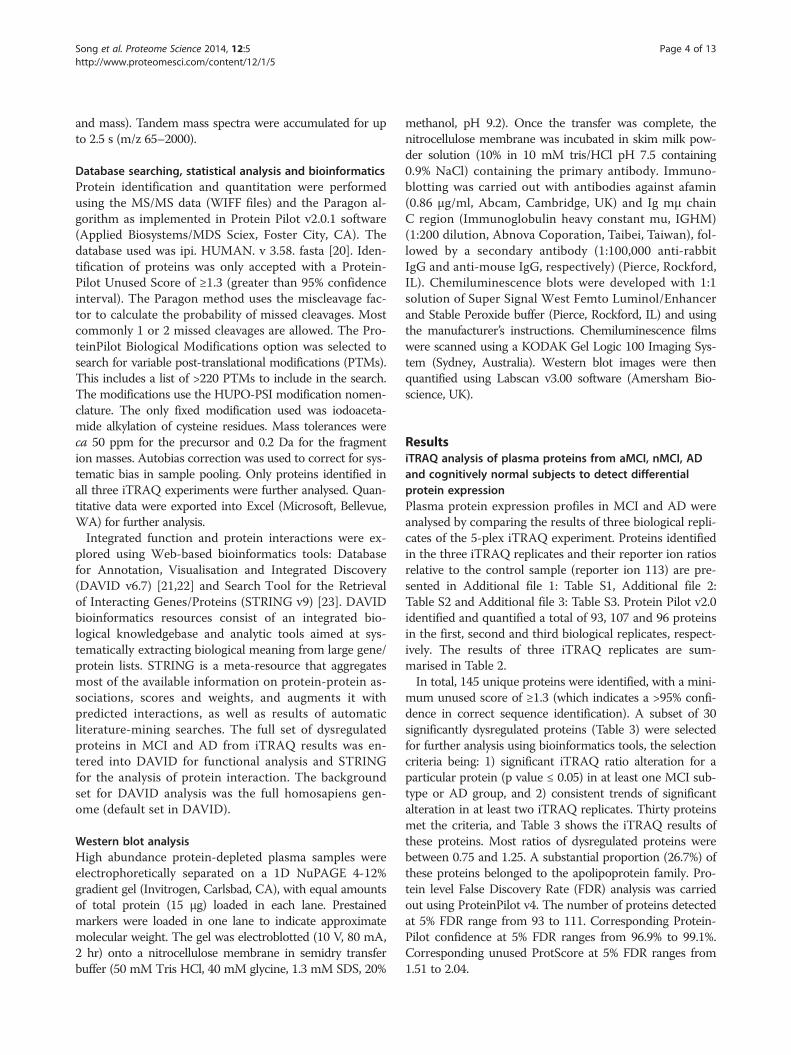
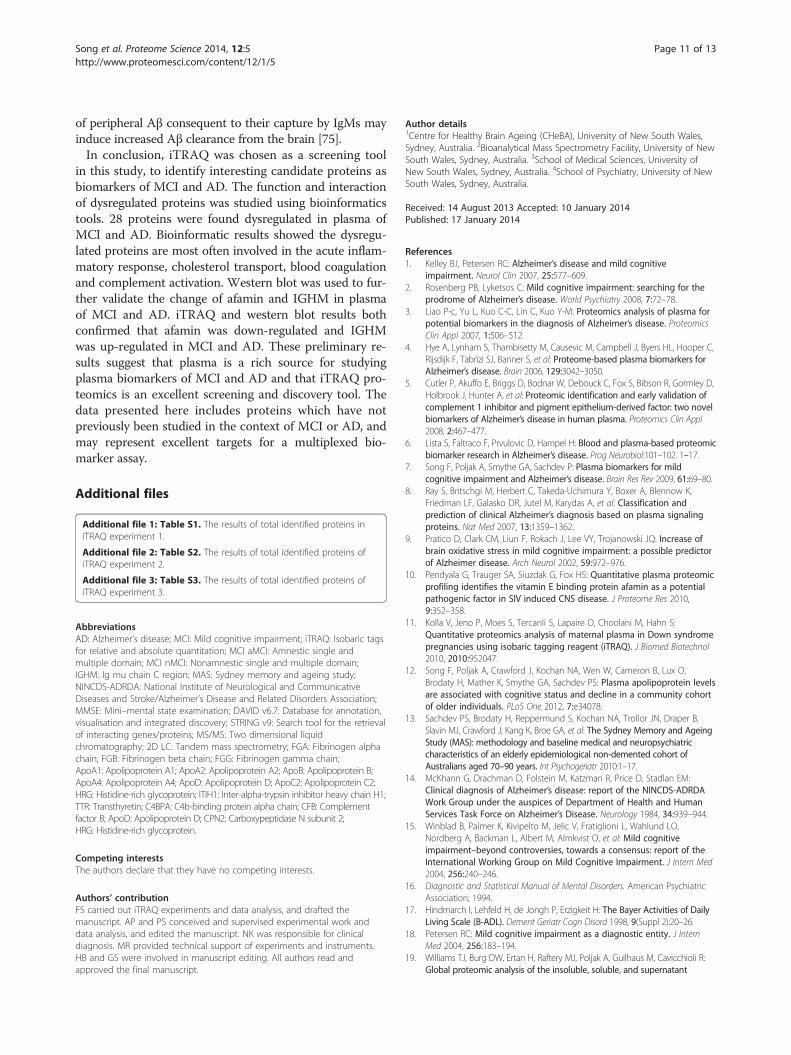
Western blot resultsThree replicates of western blot experiments were per-formed to provide an independent comparison and valid-ation of the iTRAQ experiments. One upregulated (IGHM)and one downregulated (afamin) protein were chosen forthis comparison, and the reasons were (i) they are two ofthe most significantly deregulated proteins in our list, withratios of up to 1.57 for IGHM and down to 0.69 for
afamin), (ii) they have not previously been studied in MCIand AD, and (iii) they may provide new insight into themechanism of disease. Western blot results confirmed thatIGHM was increased in MCI and AD groups (Figure 2),and afamin was decreased in MCI and AD group (Figure 3).Figures 2 and 3 also show the comparison of western blotand iTRAQ outcomes of IGHM and afamin, and confirmconsistency of up regulation (ratio >1) or down regulation(ratio <1) between the two experimental approaches, des-pite slight differences between the mean values.
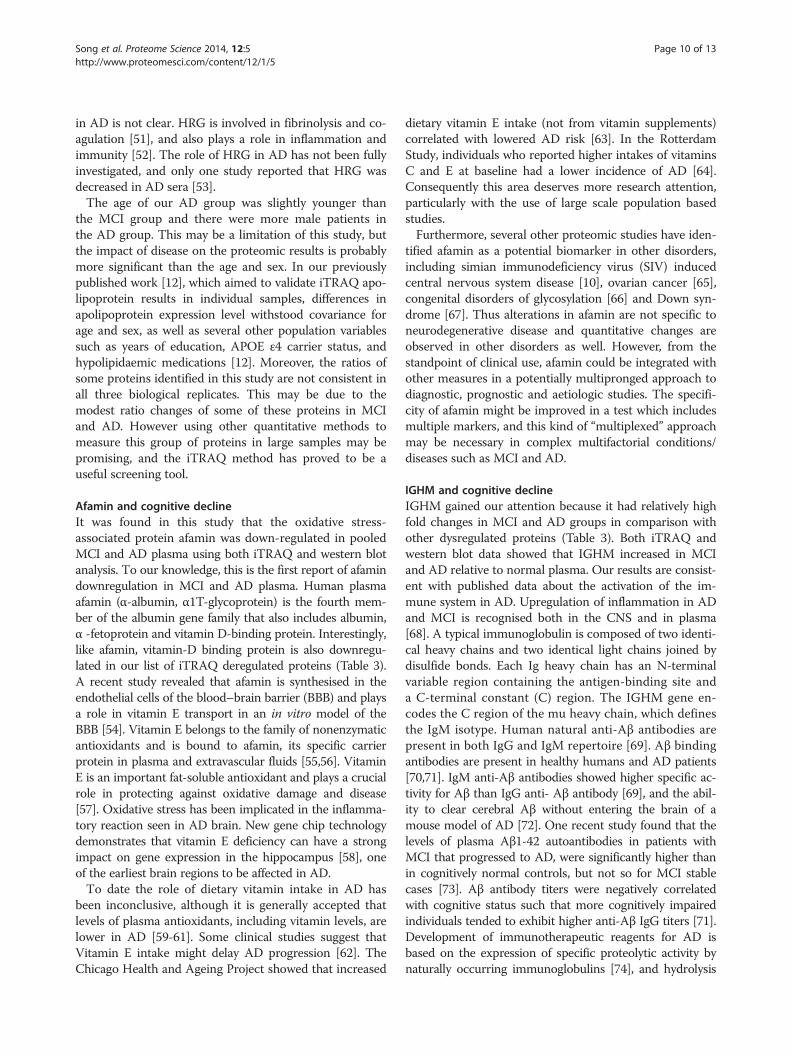
Validation in individual samplesA group of apolipoproteins, including ApoA1, ApoA2,ApoB, ApoH, ApoJ, have been selected from iTRAQresults and measured in individual samples, and thedata published [12]. Table 5 compares the average ratiosof these 5 apolipoproteins between disease and normalgroups in the iTRAQ pooled plasma samples and individ-ual validation based on previous multiplex assay data,using the same MAS Wave 1 study group [21]. These tworesults were consistent and showed that the ApoA1,ApoA2, ApoH were downregulated and ApoB and ApoJwere upregulated in the MCI group.
DiscussionQuantitation of serum or plasma proteins using iTRAQanalysis has recently been suggested as a suitable ap-proach for the detection of biomarkers [24]. In a prelim-inary proof-of-principle experiment, this current studyassessed whether this method could be suitable for thedetection of biomarkers useful for MCI and AD screening.We identified 30 proteins for which expression levels, rela-tive to normal controls, were significantly altered in pooledMCI and AD plasma samples. Bioinformatics results in-dicated that these dysregulated proteins represented a di-versity of biological functions, including immunity andinflammation, transportation of important regulatory bio-molecules, blood coagulation and cell processes. Proteinassociation network analysis also revealed dysregulation ofa sizeable group of apolipoproteins and fibrinogen chainswith important biological functions.
Dysregulated proteins in MCI and ADA large number of dysregulated proteins in our iTRAQ re-sults are apolipoproteins, and bioinformatic results showed
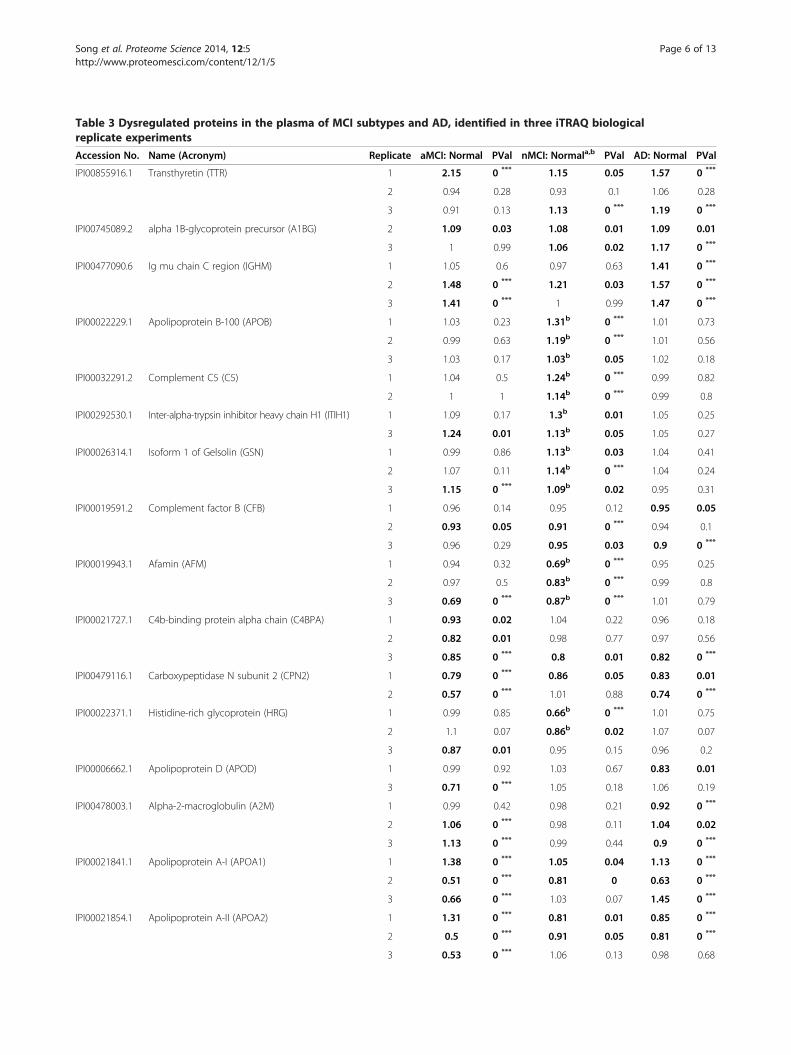
Table 3 Dysregulated proteins in the plasma of MCI subtypes and AD, identified in three iTRAQ biologicalreplicate experiments
Accession No. Name (Acronym) Replicate aMCI: Normal PVal nMCI: Normala,b PVal AD: Normal PVal
IPI00855916.1 Transthyretin (TTR) 1 2.15 0 *** 1.15 0.05 1.57 0 ***
2 0.94 0.28 0.93 0.1 1.06 0.28
3 0.91 0.13 1.13 0 *** 1.19 0 ***
IPI00745089.2 alpha 1B-glycoprotein precursor (A1BG) 2 1.09 0.03 1.08 0.01 1.09 0.01
3 1 0.99 1.06 0.02 1.17 0 ***
IPI00477090.6 Ig mu chain C region (IGHM) 1 1.05 0.6 0.97 0.63 1.41 0 ***
2 1.48 0 *** 1.21 0.03 1.57 0 ***
3 1.41 0 *** 1 0.99 1.47 0 ***
IPI00022229.1 Apolipoprotein B-100 (APOB) 1 1.03 0.23 1.31b 0 *** 1.01 0.73
2 0.99 0.63 1.19b 0 *** 1.01 0.56
3 1.03 0.17 1.03b 0.05 1.02 0.18
IPI00032291.2 Complement C5 (C5) 1 1.04 0.5 1.24b 0 *** 0.99 0.82
2 1 1 1.14b 0 *** 0.99 0.8
IPI00292530.1 Inter-alpha-trypsin inhibitor heavy chain H1 (ITIH1) 1 1.09 0.17 1.3b 0.01 1.05 0.25
3 1.24 0.01 1.13b 0.05 1.05 0.27
IPI00026314.1 Isoform 1 of Gelsolin (GSN) 1 0.99 0.86 1.13b 0.03 1.04 0.41
2 1.07 0.11 1.14b 0 *** 1.04 0.24
3 1.15 0 *** 1.09b 0.02 0.95 0.31
IPI00019591.2 Complement factor B (CFB) 1 0.96 0.14 0.95 0.12 0.95 0.05
2 0.93 0.05 0.91 0 *** 0.94 0.1
3 0.96 0.29 0.95 0.03 0.9 0 ***
IPI00019943.1 Afamin (AFM) 1 0.94 0.32 0.69b 0 *** 0.95 0.25
2 0.97 0.5 0.83b 0 *** 0.99 0.8
3 0.69 0 *** 0.87b 0 *** 1.01 0.79
IPI00021727.1 C4b-binding protein alpha chain (C4BPA) 1 0.93 0.02 1.04 0.22 0.96 0.18
2 0.82 0.01 0.98 0.77 0.97 0.56
3 0.85 0 *** 0.8 0.01 0.82 0 ***
IPI00479116.1 Carboxypeptidase N subunit 2 (CPN2) 1 0.79 0 *** 0.86 0.05 0.83 0.01
2 0.57 0 *** 1.01 0.88 0.74 0 ***
IPI00022371.1 Histidine-rich glycoprotein (HRG) 1 0.99 0.85 0.66b 0 *** 1.01 0.75
2 1.1 0.07 0.86b 0.02 1.07 0.07
3 0.87 0.01 0.95 0.15 0.96 0.2
IPI00006662.1 Apolipoprotein D (APOD) 1 0.99 0.92 1.03 0.67 0.83 0.01
3 0.71 0 *** 1.05 0.18 1.06 0.19
IPI00478003.1 Alpha-2-macroglobulin (A2M) 1 0.99 0.42 0.98 0.21 0.92 0 ***
2 1.06 0 *** 0.98 0.11 1.04 0.02
3 1.13 0 *** 0.99 0.44 0.9 0 ***
IPI00021841.1 Apolipoprotein A-I (APOA1) 1 1.38 0 *** 1.05 0.04 1.13 0 ***
2 0.51 0 *** 0.81 0 0.63 0 ***
3 0.66 0 *** 1.03 0.07 1.45 0 ***
IPI00021854.1 Apolipoprotein A-II (APOA2) 1 1.31 0 *** 0.81 0.01 0.85 0 ***
2 0.5 0 *** 0.91 0.05 0.81 0 ***
3 0.53 0 *** 1.06 0.13 0.98 0.68
Song et al. Proteome Science 2014, 12:5 Page 6 of 13http://www.proteomesci.com/content/12/1/5
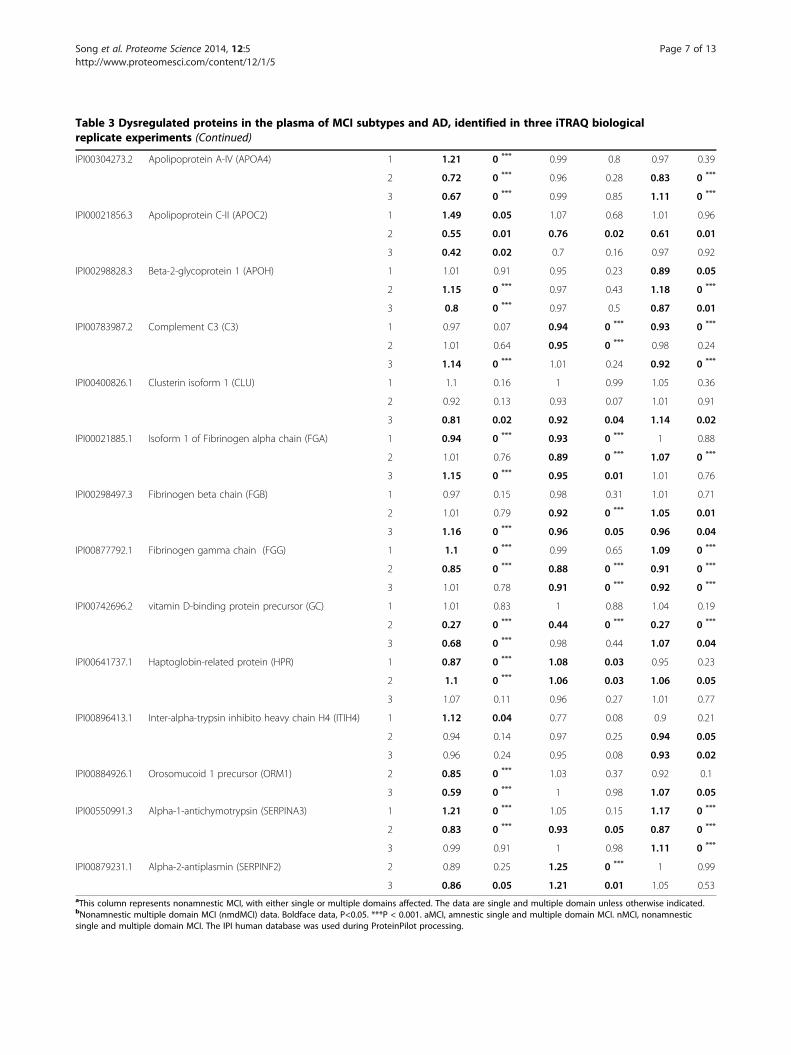
Table 3 Dysregulated proteins in the plasma of MCI subtypes and AD, identified in three iTRAQ biologicalreplicate experiments (Continued)
IPI00304273.2 Apolipoprotein A-IV (APOA4) 1 1.21 0 *** 0.99 0.8 0.97 0.39
2 0.72 0 *** 0.96 0.28 0.83 0 ***
3 0.67 0 *** 0.99 0.85 1.11 0 ***
IPI00021856.3 Apolipoprotein C-II (APOC2) 1 1.49 0.05 1.07 0.68 1.01 0.96
2 0.55 0.01 0.76 0.02 0.61 0.01
3 0.42 0.02 0.7 0.16 0.97 0.92
IPI00298828.3 Beta-2-glycoprotein 1 (APOH) 1 1.01 0.91 0.95 0.23 0.89 0.05
2 1.15 0 *** 0.97 0.43 1.18 0 ***
3 0.8 0 *** 0.97 0.5 0.87 0.01
IPI00783987.2 Complement C3 (C3) 1 0.97 0.07 0.94 0 *** 0.93 0 ***
2 1.01 0.64 0.95 0 *** 0.98 0.24
3 1.14 0 *** 1.01 0.24 0.92 0 ***
IPI00400826.1 Clusterin isoform 1 (CLU) 1 1.1 0.16 1 0.99 1.05 0.36
2 0.92 0.13 0.93 0.07 1.01 0.91
3 0.81 0.02 0.92 0.04 1.14 0.02
IPI00021885.1 Isoform 1 of Fibrinogen alpha chain (FGA) 1 0.94 0 *** 0.93 0 *** 1 0.88
2 1.01 0.76 0.89 0 *** 1.07 0 ***
3 1.15 0 *** 0.95 0.01 1.01 0.76
IPI00298497.3 Fibrinogen beta chain (FGB) 1 0.97 0.15 0.98 0.31 1.01 0.71
2 1.01 0.79 0.92 0 *** 1.05 0.01
3 1.16 0 *** 0.96 0.05 0.96 0.04
IPI00877792.1 Fibrinogen gamma chain (FGG) 1 1.1 0 *** 0.99 0.65 1.09 0 ***
2 0.85 0 *** 0.88 0 *** 0.91 0 ***
3 1.01 0.78 0.91 0 *** 0.92 0 ***
IPI00742696.2 vitamin D-binding protein precursor (GC) 1 1.01 0.83 1 0.88 1.04 0.19
2 0.27 0 *** 0.44 0 *** 0.27 0 ***
3 0.68 0 *** 0.98 0.44 1.07 0.04
IPI00641737.1 Haptoglobin-related protein (HPR) 1 0.87 0 *** 1.08 0.03 0.95 0.23
2 1.1 0 *** 1.06 0.03 1.06 0.05
3 1.07 0.11 0.96 0.27 1.01 0.77
IPI00896413.1 Inter-alpha-trypsin inhibito heavy chain H4 (ITIH4) 1 1.12 0.04 0.77 0.08 0.9 0.21
2 0.94 0.14 0.97 0.25 0.94 0.05
3 0.96 0.24 0.95 0.08 0.93 0.02
IPI00884926.1 Orosomucoid 1 precursor (ORM1) 2 0.85 0 *** 1.03 0.37 0.92 0.1
3 0.59 0 *** 1 0.98 1.07 0.05
IPI00550991.3 Alpha-1-antichymotrypsin (SERPINA3) 1 1.21 0 *** 1.05 0.15 1.17 0 ***
2 0.83 0 *** 0.93 0.05 0.87 0 ***
3 0.99 0.91 1 0.98 1.11 0 ***
IPI00879231.1 Alpha-2-antiplasmin (SERPINF2) 2 0.89 0.25 1.25 0 *** 1 0.99
3 0.86 0.05 1.21 0.01 1.05 0.53aThis column represents nonamnestic MCI, with either single or multiple domains affected. The data are single and multiple domain unless otherwise indicated.bNonamnestic multiple domain MCI (nmdMCI) data. Boldface data, P<0.05. ***P < 0.001. aMCI, amnestic single and multiple domain MCI. nMCI, nonamnesticsingle and multiple domain MCI. The IPI human database was used during ProteinPilot processing.
Song et al. Proteome Science 2014, 12:5 Page 7 of 13http://www.proteomesci.com/content/12/1/5
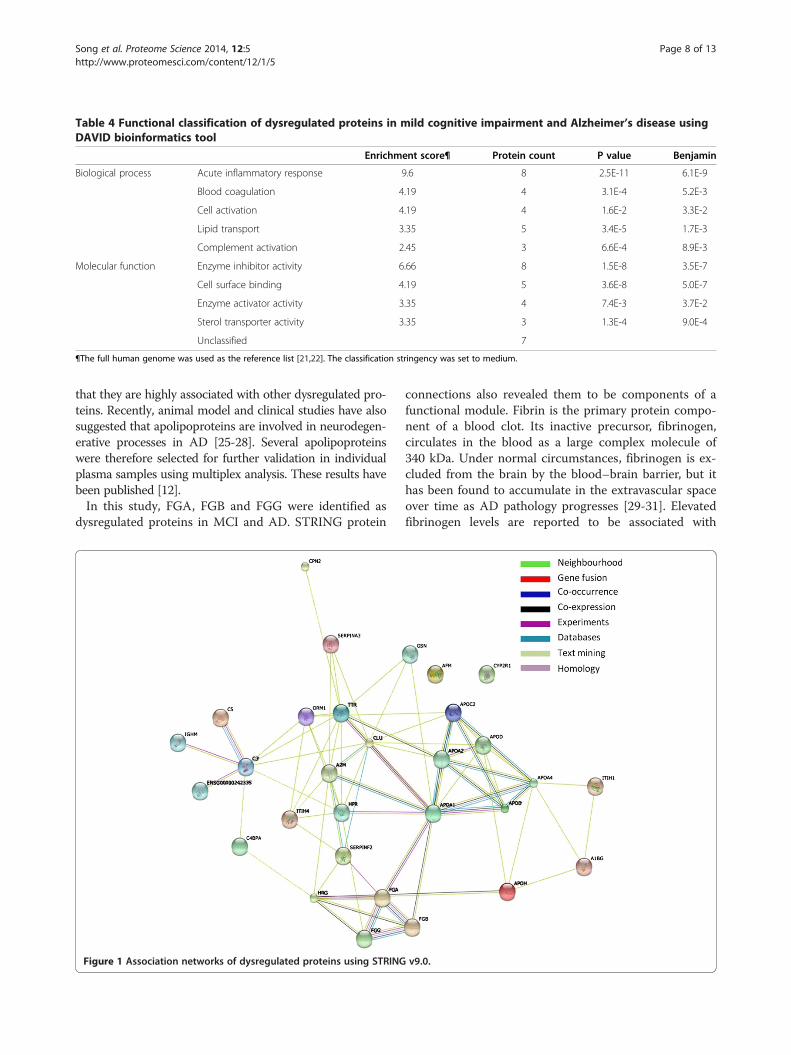
Table 4 Functional classification of dysregulated proteins in mild cognitive impairment and Alzheimer’s disease usingDAVID bioinformatics tool
Enrichment score¶ Protein count P value Benjamin
Biological process Acute inflammatory response 9.6 8 2.5E-11 6.1E-9
Blood coagulation 4.19 4 3.1E-4 5.2E-3
Cell activation 4.19 4 1.6E-2 3.3E-2
Lipid transport 3.35 5 3.4E-5 1.7E-3
Complement activation 2.45 3 6.6E-4 8.9E-3
Molecular function Enzyme inhibitor activity 6.66 8 1.5E-8 3.5E-7
Cell surface binding 4.19 5 3.6E-8 5.0E-7
Enzyme activator activity 3.35 4 7.4E-3 3.7E-2
Sterol transporter activity 3.35 3 1.3E-4 9.0E-4
Unclassified 7
¶The full human genome was used as the reference list [21,22]. The classification stringency was set to medium.
Song et al. Proteome Science 2014, 12:5 Page 8 of 13http://www.proteomesci.com/content/12/1/5
that they are highly associated with other dysregulated pro-teins. Recently, animal model and clinical studies have alsosuggested that apolipoproteins are involved in neurodegen-erative processes in AD [25-28]. Several apolipoproteinswere therefore selected for further validation in individualplasma samples using multiplex analysis. These results havebeen published [12].In this study, FGA, FGB and FGG were identified as
dysregulated proteins in MCI and AD. STRING protein
Figure 1 Association networks of dysregulated proteins using STRING
connections also revealed them to be components of afunctional module. Fibrin is the primary protein compo-nent of a blood clot. Its inactive precursor, fibrinogen,circulates in the blood as a large complex molecule of340 kDa. Under normal circumstances, fibrinogen is ex-cluded from the brain by the blood–brain barrier, but ithas been found to accumulate in the extravascular spaceover time as AD pathology progresses [29-31]. Elevatedfibrinogen levels are reported to be associated with
v9.0.
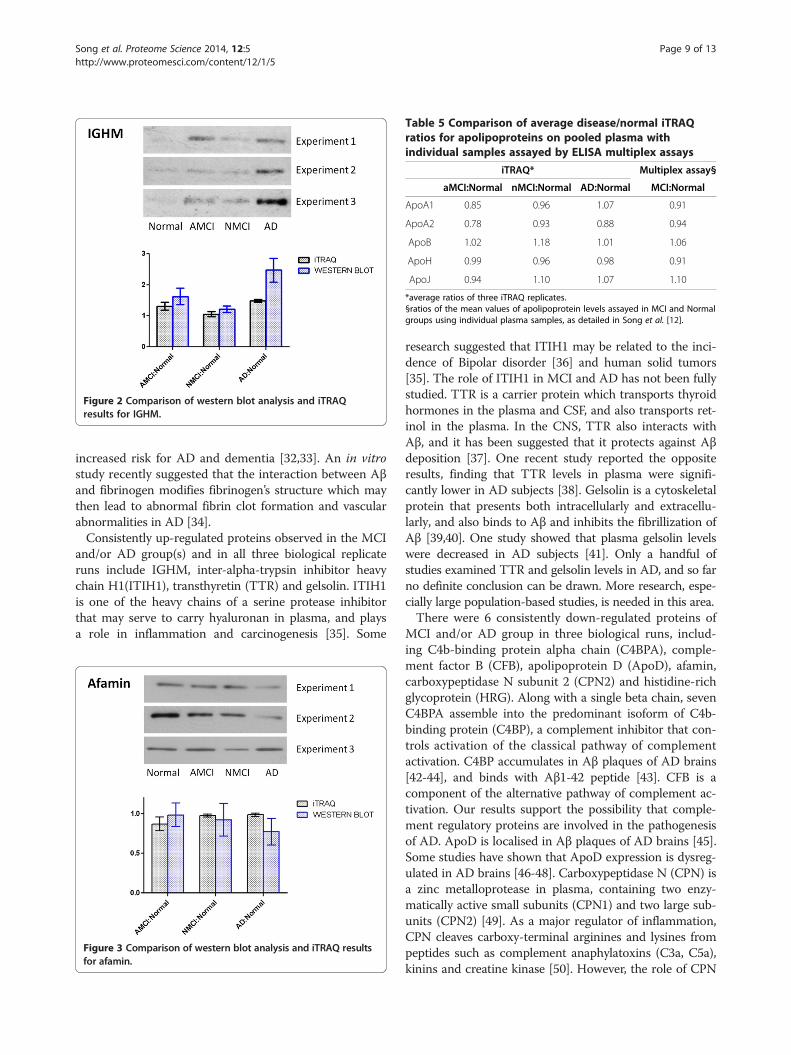
Figure 2 Comparison of western blot analysis and iTRAQresults for IGHM.
Table 5 Comparison of average disease/normal iTRAQratios for apolipoproteins on pooled plasma withindividual samples assayed by ELISA multiplex assays
iTRAQ* Multiplex assay§
aMCI:Normal nMCI:Normal AD:Normal MCI:Normal
ApoA1 0.85 0.96 1.07 0.91
ApoA2 0.78 0.93 0.88 0.94
ApoB 1.02 1.18 1.01 1.06
ApoH 0.99 0.96 0.98 0.91
ApoJ 0.94 1.10 1.07 1.10
*average ratios of three iTRAQ replicates.§ratios of the mean values of apolipoprotein levels assayed in MCI and Normalgroups using individual plasma samples, as detailed in Song et al. [12].
Song et al. Proteome Science 2014, 12:5 Page 9 of 13http://www.proteomesci.com/content/12/1/5
increased risk for AD and dementia [32,33]. An in vitrostudy recently suggested that the interaction between Aβand fibrinogen modifies fibrinogen’s structure which maythen lead to abnormal fibrin clot formation and vascularabnormalities in AD [34].Consistently up-regulated proteins observed in the MCI
and/or AD group(s) and in all three biological replicateruns include IGHM, inter-alpha-trypsin inhibitor heavychain H1(ITIH1), transthyretin (TTR) and gelsolin. ITIH1is one of the heavy chains of a serine protease inhibitorthat may serve to carry hyaluronan in plasma, and playsa role in inflammation and carcinogenesis [35]. Some
Figure 3 Comparison of western blot analysis and iTRAQ resultsfor afamin.
research suggested that ITIH1 may be related to the inci-dence of Bipolar disorder [36] and human solid tumors[35]. The role of ITIH1 in MCI and AD has not been fullystudied. TTR is a carrier protein which transports thyroidhormones in the plasma and CSF, and also transports ret-inol in the plasma. In the CNS, TTR also interacts withAβ, and it has been suggested that it protects against Aβdeposition [37]. One recent study reported the oppositeresults, finding that TTR levels in plasma were signifi-cantly lower in AD subjects [38]. Gelsolin is a cytoskeletalprotein that presents both intracellularly and extracellu-larly, and also binds to Aβ and inhibits the fibrillization ofAβ [39,40]. One study showed that plasma gelsolin levelswere decreased in AD subjects [41]. Only a handful ofstudies examined TTR and gelsolin levels in AD, and so farno definite conclusion can be drawn. More research, espe-cially large population-based studies, is needed in this area.There were 6 consistently down-regulated proteins of
MCI and/or AD group in three biological runs, includ-ing C4b-binding protein alpha chain (C4BPA), comple-ment factor B (CFB), apolipoprotein D (ApoD), afamin,carboxypeptidase N subunit 2 (CPN2) and histidine-richglycoprotein (HRG). Along with a single beta chain, sevenC4BPA assemble into the predominant isoform of C4b-binding protein (C4BP), a complement inhibitor that con-trols activation of the classical pathway of complementactivation. C4BP accumulates in Aβ plaques of AD brains[42-44], and binds with Aβ1-42 peptide [43]. CFB is acomponent of the alternative pathway of complement ac-tivation. Our results support the possibility that comple-ment regulatory proteins are involved in the pathogenesisof AD. ApoD is localised in Aβ plaques of AD brains [45].Some studies have shown that ApoD expression is dysreg-ulated in AD brains [46-48]. Carboxypeptidase N (CPN) isa zinc metalloprotease in plasma, containing two enzy-matically active small subunits (CPN1) and two large sub-units (CPN2) [49]. As a major regulator of inflammation,CPN cleaves carboxy-terminal arginines and lysines frompeptides such as complement anaphylatoxins (C3a, C5a),kinins and creatine kinase [50]. However, the role of CPN
Song et al. Proteome Science 2014, 12:5 Page 10 of 13http://www.proteomesci.com/content/12/1/5
in AD is not clear. HRG is involved in fibrinolysis and co-agulation [51], and also plays a role in inflammation andimmunity [52]. The role of HRG in AD has not been fullyinvestigated, and only one study reported that HRG wasdecreased in AD sera [53].The age of our AD group was slightly younger than
the MCI group and there were more male patients inthe AD group. This may be a limitation of this study, butthe impact of disease on the proteomic results is probablymore significant than the age and sex. In our previouslypublished work [12], which aimed to validate iTRAQ apo-lipoprotein results in individual samples, differences inapolipoprotein expression level withstood covariance forage and sex, as well as several other population variablessuch as years of education, APOE ε4 carrier status, andhypolipidaemic medications [12]. Moreover, the ratios ofsome proteins identified in this study are not consistent inall three biological replicates. This may be due to themodest ratio changes of some of these proteins in MCIand AD. However using other quantitative methods tomeasure this group of proteins in large samples may bepromising, and the iTRAQ method has proved to be auseful screening tool.
Afamin and cognitive declineIt was found in this study that the oxidative stress-associated protein afamin was down-regulated in pooledMCI and AD plasma using both iTRAQ and western blotanalysis. To our knowledge, this is the first report of afamindownregulation in MCI and AD plasma. Human plasmaafamin (α-albumin, α1T-glycoprotein) is the fourth mem-ber of the albumin gene family that also includes albumin,α -fetoprotein and vitamin D-binding protein. Interestingly,like afamin, vitamin-D binding protein is also downregu-lated in our list of iTRAQ deregulated proteins (Table 3).A recent study revealed that afamin is synthesised in theendothelial cells of the blood–brain barrier (BBB) and playsa role in vitamin E transport in an in vitro model of theBBB [54]. Vitamin E belongs to the family of nonenzymaticantioxidants and is bound to afamin, its specific carrierprotein in plasma and extravascular fluids [55,56]. VitaminE is an important fat-soluble antioxidant and plays a crucialrole in protecting against oxidative damage and disease[57]. Oxidative stress has been implicated in the inflamma-tory reaction seen in AD brain. New gene chip technologydemonstrates that vitamin E deficiency can have a strongimpact on gene expression in the hippocampus [58], oneof the earliest brain regions to be affected in AD.To date the role of dietary vitamin intake in AD has
been inconclusive, although it is generally accepted thatlevels of plasma antioxidants, including vitamin levels, arelower in AD [59-61]. Some clinical studies suggest thatVitamin E intake might delay AD progression [62]. TheChicago Health and Ageing Project showed that increased
dietary vitamin E intake (not from vitamin supplements)correlated with lowered AD risk [63]. In the RotterdamStudy, individuals who reported higher intakes of vitaminsC and E at baseline had a lower incidence of AD [64].Consequently this area deserves more research attention,particularly with the use of large scale population basedstudies.Furthermore, several other proteomic studies have iden-
tified afamin as a potential biomarker in other disorders,including simian immunodeficiency virus (SIV) inducedcentral nervous system disease [10], ovarian cancer [65],congenital disorders of glycosylation [66] and Down syn-drome [67]. Thus alterations in afamin are not specific toneurodegenerative disease and quantitative changes areobserved in other disorders as well. However, from thestandpoint of clinical use, afamin could be integrated withother measures in a potentially multipronged approach todiagnostic, prognostic and aetiologic studies. The specifi-city of afamin might be improved in a test which includesmultiple markers, and this kind of “multiplexed” approachmay be necessary in complex multifactorial conditions/diseases such as MCI and AD.
IGHM and cognitive declineIGHM gained our attention because it had relatively highfold changes in MCI and AD groups in comparison withother dysregulated proteins (Table 3). Both iTRAQ andwestern blot data showed that IGHM increased in MCIand AD relative to normal plasma. Our results are consist-ent with published data about the activation of the im-mune system in AD. Upregulation of inflammation in ADand MCI is recognised both in the CNS and in plasma[68]. A typical immunoglobulin is composed of two identi-cal heavy chains and two identical light chains joined bydisulfide bonds. Each Ig heavy chain has an N-terminalvariable region containing the antigen-binding site anda C-terminal constant (C) region. The IGHM gene en-codes the C region of the mu heavy chain, which definesthe IgM isotype. Human natural anti-Aβ antibodies arepresent in both IgG and IgM repertoire [69]. Aβ bindingantibodies are present in healthy humans and AD patients[70,71]. IgM anti-Aβ antibodies showed higher specific ac-tivity for Aβ than IgG anti- Aβ antibody [69], and the abil-ity to clear cerebral Aβ without entering the brain of amouse model of AD [72]. One recent study found that thelevels of plasma Aβ1-42 autoantibodies in patients withMCI that progressed to AD, were significantly higher thanin cognitively normal controls, but not so for MCI stablecases [73]. Aβ antibody titers were negatively correlatedwith cognitive status such that more cognitively impairedindividuals tended to exhibit higher anti-Aβ IgG titers [71].Development of immunotherapeutic reagents for AD isbased on the expression of specific proteolytic activity bynaturally occurring immunoglobulins [74], and hydrolysis
Song et al. Proteome Science 2014, 12:5 Page 11 of 13http://www.proteomesci.com/content/12/1/5
of peripheral Aβ consequent to their capture by IgMs mayinduce increased Aβ clearance from the brain [75].In conclusion, iTRAQ was chosen as a screening tool
in this study, to identify interesting candidate proteins asbiomarkers of MCI and AD. The function and interactionof dysregulated proteins was studied using bioinformaticstools. 28 proteins were found dysregulated in plasma ofMCI and AD. Bioinformatic results showed the dysregu-lated proteins are most often involved in the acute inflam-matory response, cholesterol transport, blood coagulationand complement activation. Western blot was used to fur-ther validate the change of afamin and IGHM in plasmaof MCI and AD. iTRAQ and western blot results bothconfirmed that afamin was down-regulated and IGHMwas up-regulated in MCI and AD. These preliminary re-sults suggest that plasma is a rich source for studyingplasma biomarkers of MCI and AD and that iTRAQ pro-teomics is an excellent screening and discovery tool. Thedata presented here includes proteins which have notpreviously been studied in the context of MCI or AD, andmay represent excellent targets for a multiplexed bio-marker assay.
Additional files
Additional file 1: Table S1. The results of total identified proteins iniTRAQ experiment 1.
Additional file 2: Table S2. The results of total identified proteins ofiTRAQ experiment 2.
Additional file 3: Table S3. The results of total identified proteins ofiTRAQ experiment 3.
AbbreviationsAD: Alzheimer’s disease; MCI: Mild cognitive impairment; iTRAQ: Isobaric tagsfor relative and absolute quantitation; MCI aMCI: Amnestic single andmultiple domain; MCI nMCI: Nonamnestic single and multiple domain;IGHM: Ig mu chain C region; MAS: Sydney memory and ageing study;NINCDS-ADRDA: National Institute of Neurological and CommunicativeDiseases and Stroke/Alzheimer’s Disease and Related Disorders Association;MMSE: Mini–mental state examination; DAVID v6.7: Database for annotation,visualisation and integrated discovery; STRING v9: Search tool for the retrievalof interacting genes/proteins; MS/MS: Two dimensional liquidchromatography; 2D LC: Tandem mass spectrometry; FGA: Fibrinogen alphachain; FGB: Fibrinogen beta chain; FGG: Fibrinogen gamma chain;ApoA1: Apolipoprotein A1; ApoA2: Apolipoprotein A2; ApoB: Apolipoprotein B;ApoA4: Apolipoprotein A4; ApoD: Apolipoprotein D; ApoC2: Apolipoprotein C2;HRG: Histidine-rich glycoprotein; ITIH1: Inter-alpha-trypsin inhibitor heavy chain H1;TTR: Transthyretin; C4BPA: C4b-binding protein alpha chain; CFB: Complementfactor B; ApoD: Apolipoprotein D; CPN2: Carboxypeptidase N subunit 2;HRG: Histidine-rich glycoprotein.
Competing interestsThe authors declare that they have no competing interests.
Authors’ contributionFS carried out iTRAQ experiments and data analysis, and drafted themanuscript. AP and PS conceived and supervised experimental work anddata analysis, and edited the manuscript. NK was responsible for clinicaldiagnosis. MR provided technical support of experiments and instruments.HB and GS were involved in manuscript editing. All authors read andapproved the final manuscript.
Author details1Centre for Healthy Brain Ageing (CHeBA), University of New South Wales,Sydney, Australia. 2Bioanalytical Mass Spectrometry Facility, University of NewSouth Wales, Sydney, Australia. 3School of Medical Sciences, University ofNew South Wales, Sydney, Australia. 4School of Psychiatry, University of NewSouth Wales, Sydney, Australia.
Received: 14 August 2013 Accepted: 10 January 2014Published: 17 January 2014
References1. Kelley BJ, Petersen RC: Alzheimer’s disease and mild cognitive
impairment. Neurol Clin 2007, 25:577–609.2. Rosenberg PB, Lyketsos C: Mild cognitive impairment: searching for the
prodrome of Alzheimer’s disease. World Psychiatry 2008, 7:72–78.3. Liao P-c, Yu L, Kuo C-C, Lin C, Kuo Y-M: Proteomics analysis of plasma for
potential biomarkers in the diagnosis of Alzheimer’s disease. ProteomicsClin Appl 2007, 1:506–512.
4. Hye A, Lynham S, Thambisetty M, Causevic M, Campbell J, Byers HL, Hooper C,Rijsdijk F, Tabrizi SJ, Banner S, et al: Proteome-based plasma biomarkers forAlzheimer’s disease. Brain 2006, 129:3042–3050.
5. Cutler P, Akuffo E, Briggs D, Bodnar W, Debouck C, Fox S, Bibson R, Gormley D,Holbrook J, Hunter A, et al: Proteomic identification and early validation ofcomplement 1 inhibitor and pigment epithelium-derived factor: two novelbiomarkers of Alzheimer’s disease in human plasma. Proteomics Clin Appl2008, 2:467–477.
6. Lista S, Faltraco F, Prvulovic D, Hampel H: Blood and plasma-based proteomicbiomarker research in Alzheimer’s disease. Prog Neurobiol:101–102. 1–17.
7. Song F, Poljak A, Smythe GA, Sachdev P: Plasma biomarkers for mildcognitive impairment and Alzheimer’s disease. Brain Res Rev 2009, 61:69–80.
8. Ray S, Britschgi M, Herbert C, Takeda-Uchimura Y, Boxer A, Blennow K,Friedman LF, Galasko DR, Jutel M, Karydas A, et al: Classification andprediction of clinical Alzheimer’s diagnosis based on plasma signalingproteins. Nat Med 2007, 13:1359–1362.
9. Pratico D, Clark CM, Liun F, Rokach J, Lee VY, Trojanowski JQ: Increase ofbrain oxidative stress in mild cognitive impairment: a possible predictorof Alzheimer disease. Arch Neurol 2002, 59:972–976.
10. Pendyala G, Trauger SA, Siuzdak G, Fox HS: Quantitative plasma proteomicprofiling identifies the vitamin E binding protein afamin as a potentialpathogenic factor in SIV induced CNS disease. J Proteome Res 2010,9:352–358.
11. Kolla V, Jeno P, Moes S, Tercanli S, Lapaire O, Choolani M, Hahn S:Quantitative proteomics analysis of maternal plasma in Down syndromepregnancies using isobaric tagging reagent (iTRAQ). J Biomed Biotechnol2010, 2010:952047.
12. Song F, Poljak A, Crawford J, Kochan NA, Wen W, Cameron B, Lux O,Brodaty H, Mather K, Smythe GA, Sachdev PS: Plasma apolipoprotein levelsare associated with cognitive status and decline in a community cohortof older individuals. PLoS One 2012, 7:e34078.
13. Sachdev PS, Brodaty H, Reppermund S, Kochan NA, Trollor JN, Draper B,Slavin MJ, Crawford J, Kang K, Broe GA, et al: The Sydney Memory and AgeingStudy (MAS): methodology and baseline medical and neuropsychiatriccharacteristics of an elderly epidemiological non-demented cohort ofAustralians aged 70–90 years. Int Psychogeriatr 2010:1–17.
14. McKhann G, Drachman D, Folstein M, Katzman R, Price D, Stadlan EM:Clinical diagnosis of Alzheimer’s disease: report of the NINCDS-ADRDAWork Group under the auspices of Department of Health and HumanServices Task Force on Alzheimer’s Disease. Neurology 1984, 34:939–944.
15. Winblad B, Palmer K, Kivipelto M, Jelic V, Fratiglioni L, Wahlund LO,Nordberg A, Backman L, Albert M, Almkvist O, et al: Mild cognitiveimpairment–beyond controversies, towards a consensus: report of theInternational Working Group on Mild Cognitive Impairment. J Intern Med2004, 256:240–246.
16. Diagnostic and Statistical Manual of Mental Disorders. American PsychiatricAssociation; 1994.
17. Hindmarch I, Lehfeld H, de Jongh P, Erzigkeit H: The Bayer Activities of DailyLiving Scale (B-ADL). Dement Geriatr Cogn Disord 1998, 9(Suppl 2):20–26.
18. Petersen RC: Mild cognitive impairment as a diagnostic entity. J InternMed 2004, 256:183–194.
19. Williams TJ, Burg DW, Ertan H, Raftery MJ, Poljak A, Guilhaus M, Cavicchioli R:Global proteomic analysis of the insoluble, soluble, and supernatant
Song et al. Proteome Science 2014, 12:5 Page 12 of 13http://www.proteomesci.com/content/12/1/5
fractions of the psychrophilic archaeon Methanococcoides burtonii. Part II:the effect of different methylated growth substrates. J Proteome Res 2010,9:653–663.
20. Lim YA, Rhein V, Baysang G, Meier F, Poljak A, Raftery MJ, Guilhaus M, Ittner LM,Eckert A, Gotz J: Abeta and human amylin share a common toxicitypathway via mitochondrial dysfunction. Proteomics 2010, 10:1621–1633.
21. Huang D, Sherman B, Lempicki R: Systematic and integrative analysis oflarge gene lists using DAVID Bioinformatics Resources. Nature Protoc2009, 4:44–57.
22. Huang D, Sherman B, Lempicki R: Bioinformatics enrichment tools:pathstoward the comprehensive functional analysis of large gene lists.Nucleic Acids Res 2009, 37:1–13.
23. Jensen LJ, Kuhn M, Stark M, Chaffron S, Creevey C, Muller J, Doerks T, Julien P,Roth A, Simonovic M, et al: STRING 8–a global view on proteins and theirfunctional interactions in 630 organisms. Nucleic Acids Res 2009, 37:D412–D416.
24. Song X, Bandow J, Sherman J, Baker JD, Brown PW, McDowell MT, Molloy MP:iTRAQ experimental design for plasma biomarker discovery. J Proteome Res2008, 7:2952–2958.
25. Lewis TL, Cao D, Lu H, Mans RA, Su YR, Jungbauer L, Linton MF, Fazio S,LaDu MJ, Li L: Overexpression of human apolipoprotein A-I preservescognitive function and attenuates neuroinflammation and cerebralamyloid angiopathy in a mouse model of Alzheimer disease. J Biol Chem2010, 285:36958–36968.
26. Kawano M, Kawakami M, Otsuka M, Yashima H, Yaginuma T, Ueki A: Markeddecrease of plasma apolipoprotein AI and AII in Japanese patients withlate-onset non-familial Alzheimer’s disease. Clin Chim Acta 1995,239:209–211.
27. Takechi R, Galloway S, Pallebage-Gamarallage MM, Wellington CL, Johnsen RD,Dhaliwal SS, Mamo JC: Differential effects of dietary fatty acids on the cerebraldistribution of plasma-derived apo B lipoproteins with amyloid-beta. Br J Nutr2010, 103:652–662.
28. Harold D, Abraham R, Hollingworth P, Sims R, Gerrish A, Hamshere ML,Pahwa JS, Moskvina V, Dowzell K, Williams A, et al: Genome-wideassociation study identifies variants at CLU and PICALM associated withAlzheimer’s disease. Nat Genet 2009, 41:1088–1093.
29. Paul J, Strickland S, Melchor JP: Fibrin deposition acceleratesneurovascular damage and neuroinflammation in mouse models ofAlzheimer’s disease. J Exp Med 2007, 204:1999–2008.
30. Fiala M, Liu QN, Sayre J, Pop V, Brahmandam V, Graves MC, Vinters HV:Cyclooxygenase-2-positive macrophages infiltrate the Alzheimer’sdisease brain and damage the blood–brain barrier. Eur J Clin Invest 2002,32:360–371.
31. Ryu JK, McLarnon JG: A leaky blood–brain barrier, fibrinogen infiltrationand microglial reactivity in inflamed Alzheimer’s disease brain. J Cell Mol Med2009, 13:2911–2925.
32. van Oijen M, Witteman JC, Hofman A, Koudstaal PJ, Breteler MM:Fibrinogen is associated with an increased risk of Alzheimer disease andvascular dementia. Stroke 2005, 36:2637–2641.
33. Xu G, Zhang H, Zhang S, Fan X, Liu X: Plasma fibrinogen is associatedwith cognitive decline and risk for dementia in patients with mildcognitive impairment. Int J Clin Pract 2008, 62:1070–1075.
34. Ahn HJ, Zamolodchikov D, Cortes-Canteli M, Norris EH, Glickman JF,Strickland S: Alzheimer’s disease peptide beta-amyloid interacts withfibrinogen and induces its oligomerization. Proc Natl Acad Sci USA 2010,107:21812–21817.
35. Hamm A, Veeck J, Bektas N, Wild PJ, Hartmann A, Heindrichs U, Kristiansen G,Werbowetski-Ogilvie T, Del Maestro R, Knuechel R, Dahl E: Frequent expressionloss of Inter-alpha-trypsin inhibitor heavy chain (ITIH) genes in multiplehuman solid tumors: a systematic expression analysis. BMC Cancer 2008, 8:25.
36. Scott LJ, Muglia P, Kong XQ, Guan W, Flickinger M, Upmanyu R, Tozzi F,Li JZ, Burmeister M, Absher D, et al: Genome-wide association andmeta-analysis of bipolar disorder in individuals of European ancestry.Proc Natl Acad Sci U S A 2009, 106:7501–7506.
37. Li X, Buxbaum JN: Transthyretin and the brain re-visited: is neuronalsynthesis of transthyretin protective in Alzheimer’s disease? MolNeurodegener 2011, 6:79.
38. Velayudhan L, Killick R, Hye A, Kinsey A, Guentert A, Lynham S, Ward M,Leung R, Lourdusamy A, To AW, et al: Plasma transthyretin as a candidatemarker for Alzheimer’s disease. J Alzheimers Dis 2012, 28:369–375.
39. Carro E: Gelsolin as therapeutic target in Alzheimer’s disease. Expert OpinTher Targets 2010, 14:585–592.
40. Chauhan V, Ji L, Chauhan A: Anti-amyloidogenic, anti-oxidant andanti-apoptotic role of gelsolin in Alzheimer’s disease. Biogerontology 2008,9:381–389.
41. Guntert A, Campbell J, Saleem M, O’Brien DP, Thompson AJ, Byers HL,Ward MA, Lovestone S: Plasma gelsolin is decreased and correlates withrate of decline in Alzheimer’s disease. J Alzheimers Dis 2010, 21:585–596.
42. Kalaria RN, Kroon SN: Complement inhibitor C4-binding protein inamyloid deposits containing serum amyloid P in Alzheimer’s disease.Biochem Biophys Res Commun 1992, 186:461–466.
43. Trouw LA, Nielsen HM, Minthon L, Londos E, Landberg G, Veerhuis R,Janciauskiene S, Blom AM: C4b-binding protein in Alzheimer’s disease:binding to Abeta1-42 and to dead cells. Mol Immunol 2008, 45:3649–3660.
44. Zhan SS, Kamphorst W, Van Nostrand WE, Eikelenboom P: Distribution ofneuronal growth-promoting factors and cytoskeletal proteins in alteredneurites in Alzheimer’s disease and non-demented elderly. Acta Neuropathol1995, 89:356–362.
45. Desai PP, Ikonomovic MD, Abrahamson EE, Hamilton RL, Isanski BA, Hope CE,Klunk WE, DeKosky ST, Kamboh MI: Apolipoprotein D is a component ofcompact but not diffuse amyloid-beta plaques in Alzheimer’s diseasetemporal cortex. Neurobiol Dis 2005, 20:574–582.
46. Ordonez C, Navarro A, Perez C, Martinez E, del Valle E, Tolivia J: Genderdifferences in apolipoprotein D expression during aging and inAlzheimer disease. Neurobiol Aging 2012, 33:433. e411-420.
47. Wakasaya Y, Kawarabayashi T, Watanabe M, Yamamoto-Watanabe Y,Takamura A, Kurata T, Murakami T, Abe K, Yamada K, Wakabayashi K, et al:Factors responsible for neurofibrillary tangles and neuronal cell losses intauopathy. J Neurosci Res 2011, 89:576–584.
48. Thomas EA, Laws SM, Sutcliffe JG, Harper C, Dean B, McClean C, Masters C,Lautenschlager N, Gandy SE, Martins RN: Apolipoprotein D levels areelevated in prefrontal cortex of subjects with Alzheimer’s disease: norelation to apolipoprotein E expression or genotype. Biol Psychiatry 2003,54:136–141.
49. Skidgel RA, Erdos EG: Structure and function of human plasmacarboxypeptidase N, the anaphylatoxin inactivator. Int Immunopharmacol2007, 7:1888–1899.
50. Matthews KW, Mueller-Ortiz SL, Wetsel RA: Carboxypeptidase N: a pleiotropicregulator of inflammation. Mol Immunol 2004, 40:785–793.
51. Nordqvist S, Karehed K, Stavreus-Evers A, Akerud H: Histidine-rich glycoproteinpolymorphism and pregnancy outcome: a pilot study. Reprod Biomed Online2011, 23:213–219.
52. Vu TT, Stafford AR, Leslie BA, Kim PY, Fredenburgh JC, Weitz JI:Histidine-rich glycoprotein binds fibrin(ogen) with high affinity andcompetes with thrombin for binding to the gamma’-chain. J Biol Chem2011, 286:30314–30323.
53. Zhang R, Barker L, Pinchev D, Marshall J, Rasamoelisolo M, Smith C, Kupchak P,Kireeva I, Ingratta L, Jackowski G: Mining biomarkers in human sera usingproteomic tools. Proteomics 2004, 4:244–256.
54. Kratzer I, Bernhart E, Wintersperger A, Hammer A, Waltl S, Malle E, Sperk G,Wietzorrek G, Dieplinger H, Sattler W: Afamin is synthesized by cerebrovascularendothelial cells and mediates alpha-tocopherol transport across an in vitromodel of the blood–brain barrier. J Neurochem 2009, 108:707–718.
55. Voegele AF, Jerkovic L, Wellenzohn B, Eller P, Kronenberg F, Liedl KR,Dieplinger H: Characterization of the vitamin E-binding properties ofhuman plasma afamin. Biochemistry 2002, 41:14532–14538.
56. Jerkovic L, Voegele AF, Chwatal S, Kronenberg F, Radcliffe CM, Wormald MR,Lobentanz EM, Ezeh B, Eller P, Dejori N, et al: Afamin is a novel humanvitamin E-binding glycoprotein characterization and in vitro expression.J Proteome Res 2005, 4:889–899.
57. Sacheck JM, Blumberg JB: Role of vitamin E and oxidative stress inexercise. Nutrition 2001, 17:809–814.
58. Rota C, Rimbach G, Minihane AM, Stoecklin E, Barella L: Dietary vitamin Emodulates differential gene expression in the rat hippocampus:potential implications for its neuroprotective properties. Nutr Neurosci2005, 8:21–29.
59. Langan RC, Zawistoski KJ: Update on vitamin B12 deficiency. Am FamPhysician 2011, 83:1425–1430.
60. Pogge E: Vitamin D and Alzheimer’s disease: is there a link? Consult Pharm2010, 25:440–450.
61. Devore EE, Grodstein F, van Rooij FJ, Hofman A, Stampfer MJ, Witteman JC,Breteler MM: Dietary antioxidants and long-term risk of dementia.Arch Neurol 2010, 67:819–825.
Song et al. Proteome Science 2014, 12:5 Page 13 of 13http://www.proteomesci.com/content/12/1/5
62. Sano M, Ernesto C, Thomas RG, Klauber MR, Schafer K, Grundman M,Woodbury P, Growdon J, Cotman CW, Pfeiffer E, et al: A controlled trial ofselegiline, alpha-tocopherol, or both as treatment for Alzheimer’s disease. TheAlzheimer’s Disease Cooperative Study. N Engl J Med 1997, 336:1216–1222.
63. Morris MC, Evans DA, Bienias JL, Tangney CC, Bennett DA, Aggarwal N,Wilson RS, Scherr PA: Dietary intake of antioxidant nutrients and the riskof incident Alzheimer disease in a biracial community study. JAMA 2002,287:3230–3237.
64. Engelhart MJ, Geerlings MI, Ruitenberg A, van Swieten JC, Hofman A,Witteman JC, Breteler MM: Dietary intake of antioxidants and risk ofAlzheimer disease. JAMA 2002, 287:3223–3229.
65. Jackson D, Craven RA, Hutson RC, Graze I, Lueth P, Tonge RP, Hartley JL,Nickson JA, Rayner SJ, Johnston C, et al: Proteomic profiling identifiesafamin as a potential biomarker for ovarian cancer. Clin Cancer Res 2007,13:7370–7379.
66. Richard E, Vega AI, Perez B, Roche C, Velazquez R, Ugarte M, Perez-Cerda C:Congenital disorder of glycosylation Ia: new differentially expressedproteins identified by 2-DE. Biochem Biophys Res Commun 2009,379:267–271.
67. Kolialexi A, Tsangaris GT, Papantoniou N, Anagnostopoulos AK, Vougas K,Bagiokos V, Antsaklis A, Mavrou A: Application of proteomics for theidentification of differentially expressed protein markers for Downsyndrome in maternal plasma. Prenat Diagn 2008, 28:691–698.
68. Holmes C, Butchart J: Systemic inflammation and Alzheimer’s disease.Biochem Soc Trans 2011, 39:898–901.
69. Szabo P, Relkin N, Weksler ME: Natural human antibodies to amyloid betapeptide. Autoimmun Rev 2008, 7:415–420.
70. Weksler ME, Relkin N, Turkenich R, LaRusse S, Zhou L, Szabo P: Patients withAlzheimer disease have lower levels of serum anti-amyloid peptideantibodies than healthy elderly individuals. Exp Gerontol 2002, 37:943–948.
71. Mruthinti S, Buccafusco JJ, Hill WD, Waller JL, Jackson TW, Zamrini EY,Schade RF: Autoimmunity in Alzheimer’s disease: increased levels ofcirculating IgGs binding Abeta and RAGE peptides. Neurobiol Aging 2004,25:1023–1032.
72. Sigurdsson EM, Knudsen E, Asuni A, Fitzer-Attas C, Sage D, Quartermain D,Goni F, Frangione B, Wisniewski T: An attenuated immune response issufficient to enhance cognition in an Alzheimer’s disease mouse modelimmunized with amyloid-beta derivatives. J Neurosci 2004, 24:6277–6282.
73. Storace D, Cammarata S, Borghi R, Sanguineti R, Giliberto L, Piccini A, Pollero V,Novello C, Caltagirone C, Smith MA, et al: Elevation of {beta}-amyloid 1–42autoantibodies in the blood of amnestic patients with mild cognitiveimpairment. Arch Neurol 2010, 67:867–872.
74. Paul S, Nishiyama Y, Planque S, Karle S, Taguchi H, Hanson C, Weksler ME:Antibodies as defensive enzymes. Springer Semin Immunopathol 2005,26:485–503.
75. Taguchi H, Planque S, Nishiyama Y, Szabo P, Weksler ME, Friedland RP, Paul S:Catalytic antibodies to amyloid beta peptide in defense against Alzheimerdisease. Autoimmun Rev 2008, 7:391–397.
doi:10.1186/1477-5956-12-5Cite this article as: Song et al.: Plasma protein profiling of MildCognitive Impairment and Alzheimer’s disease using iTRAQ quantitativeproteomics. Proteome Science 2014 12:5.
Submit your next manuscript to BioMed Centraland take full advantage of:
• Convenient online submission
• Thorough peer review
• No space constraints or color figure charges
• Immediate publication on acceptance
• Inclusion in PubMed, CAS, Scopus and Google Scholar
• Research which is freely available for redistribution
Submit your manuscript at www.biomedcentral.com/submit