Embed Size (px)
Citation preview
ANNUAL REPORT 2012-13 1
Chairman’s Message 2
Vice Chairman’s Message 3
Corporate Information 4
Products and Services 6
Directors’ Report 7
Management Discussion & Analysis 13
Corporate Governance Report 19
Standalone Financial Statements
Auditors’ Report 30
Balance Sheet 34
Statement of Profit and Loss 35
Cash Flow Statement 36
Notes to Financial Statements 38
Consolidated Financial Statements
Auditors’ Report 76
Consolidated Balance Sheet 78
Consolidated Statement of Profit and Loss 79
Consolidated Cash Flow Statement 80
Notes to Consolidated Financial Statements 82
CONTENTS Page No.
ANNUAL REPORT 2012-132
Chairman’s Message
Dear Shareholders,
The past year was one of the most challenging years for your company in recent times. The national economy continued its downward spiral, posting a GDP growth of 5% in FY12-13, a decadal low. Political uncertainties and absence of a favorable investment environment resulted in slowing down capital expenditure. The slow pace of reforms have adversely affected infrastructure investments, especially in the power sector, which Tecpro Systems substantially depends on. The power sector has been plagued with many problems including environment clearances, fuel linkages and land acquisition leading to non finalisation of new orders.
We believe that inspite of challenges, the Indian Infrastructure sector continues to be the key driver of India’s economic progress. India needs large investment in infrastructure to make its economy competitive, the government has stepped up the pace of reforms and the economy will gradually recover from here. The government has approved a mechanism to allow power companies to pass on the burden of expensive imported coal to electricity consumers. The decision taken by the Cabinet Committee on Economic Affairs (CCEA) will benefit 78,000 MW capacity power plants and improve the pace of order inflows.
The financial restructuring of state electricity distribution companies and subsequent raising of tariff would help attract private sector investment in power distribution companies.The CCEA has approved doubling the price of domestically produced natural gas. This action will help foreign investors in the energy sector as the local prices shall move closer to global market levels. Cabinet Committee on Investment (CCI) has cleared 13 power projects, freeing up stalled investment of around Rs 33,000 crore.
Even in such challenging times, your company continued to strive for orders on the back of its leadership position and strong execution track record in material handling space. Our focus for the coming year would be on sustainable growth through efficient order execution across all segments. We will also look to diversify our order book both geographically, as well as by developing new segment of our EPC business. Improving working capital is another priority for FY14.
I would like to thank you for the faith that you have reposed on your Company, and I urge you to continue to do so. With the experience gained from tough times, supported by the belief of its employees, customers and partners, your company will stay on course and resume its growth trajectory.
Yours sincerely,
Sd/-Ajay Kumar BishnoiChairman & Managing Director
ANNUAL REPORT 2012-13 3
Dear Shareholders,
The financial year 2012-13 has been one of the toughest years for the Indian economy as well as global markets. Higher current account deficits, persistent inflation & slower growth plagued the Indian economy, while globally, slower turnaround of the US economy, uncertainties in European markets & China’s under performance, eroded investors’ interest. India’s infrastructure and power sector continued to face policy paralysis leading to slower moving projects and deferred investment cycle.
Despite the various issues at the industry level, which led to delay in finalization of projects, we added orders to the tune of Rs. 2,550 crore in FY13 compared to Rs. 2,150 crore booked in the last fiscal year. Our order book position as of 31 March, 2013 stood at about Rs. 4,179 crore. During the last year, we strengthened our position in the material and ash handling space by extending our offering to the international markets. We won 3 projects across Vietnam, Indonesia and Central America. These wins reinforce superiority of Tecpro’s business model built on strong manufacturing, design and engineering capabilities. In the Waste Heat Recovery space, we have successfully demonstrated our capabilities and moved beyond cement to steel sector. Most of our orders continued to be repeat orders which is testament to the trust our clients put in us.
The revenues for FY13 stand at Rs. 2,610 crore representing a growth of 3.2% as compared to Rs. 2,530 crore during FY12. High interest and finance charge, due to elongated working capital, impacted our profitability.Consequently, PAT for FY13 stood at Rs. 28.9 crore as compared to Rs. 124.9 crore recorded during FY12.
In coming times, we would continue to focus on maintaining our leadership position in core areas as well as extending offerings in newer areas. At the start of this current year, we made a significant collaboration with Mitsubishi Heavy Industries Mechatronics Systems Ltd. of Japan for manufacturing and marketing of Electrostatic Precipitator in the Indian market.
Though the outlook looks dim in today’s economic limbo and political uncertainties, the demand for infrastructure is greater than ever before. The Government has stepped up efforts to revive the power sector, which are expected to fast-track implementation of projects, leading to increasing order inflows. We expect order inflows to pick up from NTPC and State Electricity Boards.
Lastly, I would like to thank all our investors, employees, bankers and lenders for their consistent support and commitment. I would also like to convey my sincere appreciation to our esteemed customers for their confidence in us. With your support, we are confident of managing these challenging times.
Yours sincerely,
Sd/-Amul GabraniVice Chairman & Managing Director
Vice Chairman’s Message
ANNUAL REPORT 2012-134
BOARD OF DIRECTORSAjay Kumar Bishnoi, Chairman & Managing Director
Amul Gabrani, Vice Chairman & Managing Director
Amar Banerjee, Whole-time Director
Arvind Kumar Bishnoi, Whole-time Director
Aditya Gabrani, Whole-time Director
Suresh Kumar Goenka
Brij Bhushan Kathuria
Satvinder Jeet Singh Sodhi
Anunay Kumar
Sakti Kumar BanerjeeNarayanan Krishnan
Jatinder Pal Singh
BANKERS
State Bank of India
Bank of India
ICICI Bank Ltd.
IDBI Bank Limited
DBS Bank Limited
Standard Chartered Bank
Axis Bank Limited
Vijaya Bank
IndusInd Bank Ltd.
Allahabad Bank
SHARE TRANSFER AGENTLink Intime India Pvt. Ltd.
44, Community Centre, 2nd Floor
Naraina Industrial Area, Phase-I
Near PVR Naraina
New Delhi-110028
SUBSIDIARY COMPANIES
COMPANY SECRETARY & COMPLIANCE OFFICER Pankaj Tandon
STATUTORY AUDITORS
B S R & Co., Chartered Accountants
Building No. 10
8th Floor, Tower B
DLF City, Phase – II
Gurgaon – 122 002
Haryana, India
COST AUDITORS
N.K. Jain And Associates
Cost Accountants
2-D, OCS Apartments
Mayur Vihar, Phase-I
Delhi-110091
CORPORATE INFORMATION
ANNUAL REPORT 2012-13 5
Technical Collaborators
Registered Office106, Vishwadeep Tower,Plot No. 4, District Centre, Janakpuri, New Delhi -110058, IndiaTel: + 91 11 45038735Fax: + 91 11 45038734Website: www.tecprosystems.comEmail: [email protected]
Head Office Tecpro Towers, Plot No. 11-A175th Cross Road, SIPCOT IT ParkSiruseri-603103, Chennai, IndiaTel: +91 44 37474747Fax: +91 44 37443011Email: [email protected]
Corporate OfficeTecpro House, 78, Sector 34, National Highway-8,Gurgaon-122004, Haryana, IndiaTel: +91 124 4880100Fax: +91 124 4880110Email: [email protected]
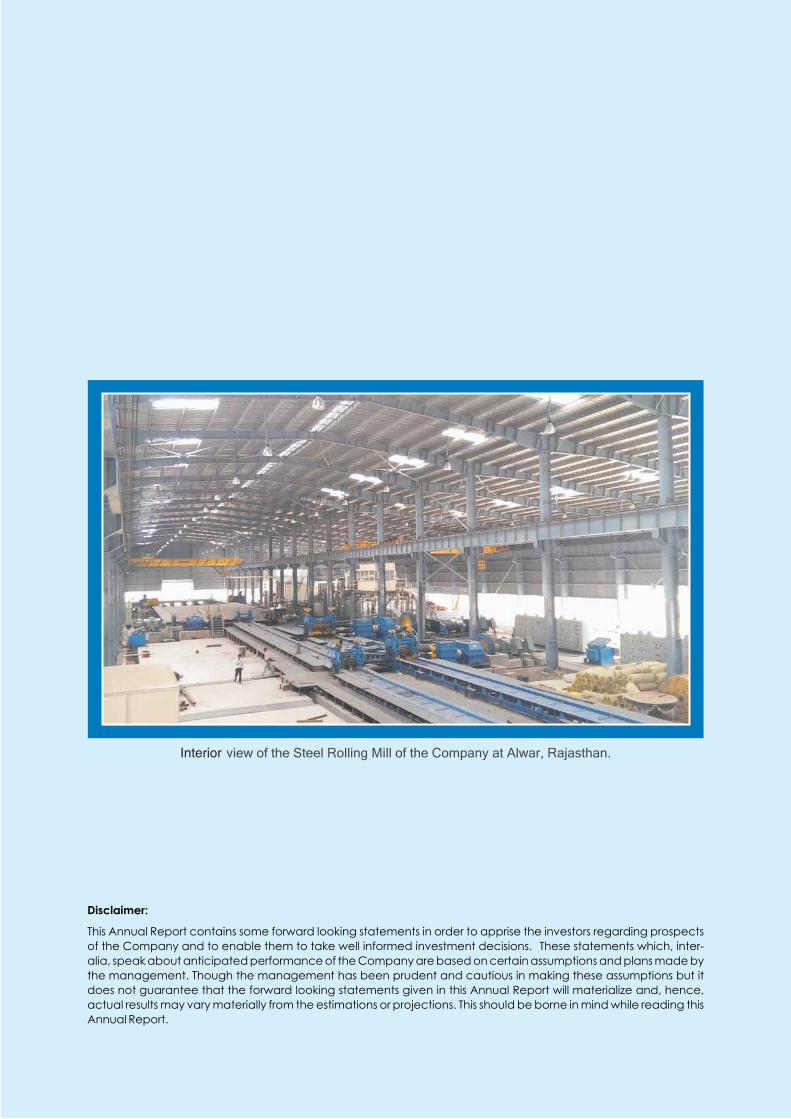
Factories1. SP-496-497, RIICO Industrial Area, Bhiwadi, Distt. Alwar, Rajasthan
2. Plot No. 2-4, 25-27, Sector 7, HSIDC Growth Centre, Bawal, Distt. Rewari, Haryana
3. Plot No. E-928, RIICO Industrial Area, Bhiwadi, Rajasthan
4. Plot No. A-98, RIICO Industrial Area, Bhiwadi, Rajasthan
5. 203 & 203(A), Matsya Industrial Area, Alwar, Rajasthan
ANNUAL REPORT 2012-136
PRODUCTS AND SERVICES
Manufacturing facilities in HarYana:
BawalMain Products:• Crushers
• Screens
• Stackers and reclaimers
• Feeders
• Fabricated Structures
Manufacturing facilities in rajastHan: 1. BhiwadiPlant - iMain Products:
• Pulleys
• Idler rollers
• Structures
• Conveyor Systems
Plant – iiMain Products:Castings of following materials:
• Plain Carbon Steel
• Low Alloy Steel
• Austenitic High Manganese Steel
• Grey Cast Iron
• Alloy Cast Iron
Plant – iii (ashtech division)Main Products:
• Scrapper Conveyors
• Buffer Hoppers
• Airlock Vessels
• Vent Filters
• Feed Gates
• Rotary Unloaders
• Clincker Grinders
• Paddle Feeders
• Rotary Feeders
2. alwar (Steel rolling Mill)Main Products:
• Angles
• Channels
• Beams
Besides the design and engineering services being provided from various offices across India, the Company manufactures the following products:
ANNUAL REPORT 2012-13 7
Directors’ Report
Dear Members,
Your Directors have immense pleasure in presenting the Twenty Third Annual Report together with the Audited Accounts for the financial year ended on 31 March, 2013.
1. FINANCIAL HIGHLIGHTS The Financial Results for the year under report are summarized as under:
FINANCIAL RESULTS
2012-13(Rs. in Lac)
2011-12(Rs. in Lac)
Net Sales and other Income 2,61,874.99 2,54,122.23
Gross Operating Profit 36,383.65 40,492.31
Less: Interest & Bank Charges 30,127.12 19,677.99
Profit before depreciation and amortization expenses and tax 6,256.53 20,814.32
Less: Depreciation and amortization expenses 1,981.96 1,349.27
Profit before tax 4,274.57 19,465.05
Less: Tax expense
- Current year tax 1,480.62 6,639.03
- Income tax for earlier years 122.95 63.66
- Deferred Tax charge/ (credit) (214.65) 269.36
Profit after tax 2,885.65 12,493.00
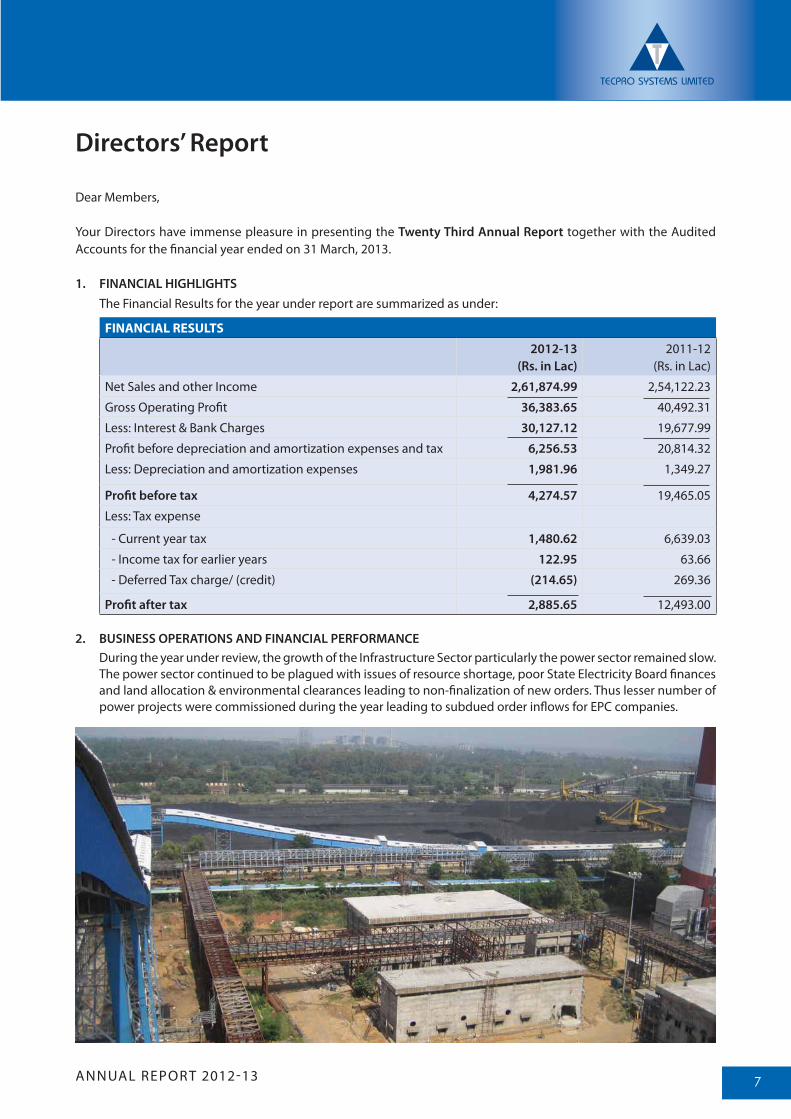
2. BUSINESS OPERATIONS AND FINANCIAL PERFORMANCE During the year under review, the growth of the Infrastructure Sector particularly the power sector remained slow.
The power sector continued to be plagued with issues of resource shortage, poor State Electricity Board finances and land allocation & environmental clearances leading to non-finalization of new orders. Thus lesser number of power projects were commissioned during the year leading to subdued order inflows for EPC companies.
ANNUAL REPORT 2012-138
In such challenging times, your Company continued to strive for orders on the back of its leadership position and strong track record in the material handling space. In the financial year 2012-13, your company improved its order inflow by 19% to Rs. 2,550 crore compared to Rs. 2,150 crore in the previous year. Most of the orders continued to be repeat orders which is testament to the trust our clients put in us. Further, diversification of the business in International market has been a significant step for your Company as a major boost came from export markets wherein your Company secured orders to the tune of Rs. 500 crore. The Company continues to look to diversify its offerings in Material Handling, Ash Handling, BoP, Waste Heat Recovery and Solar Power Projects.
However, as power remains the cornerstone of the country’s growth, the government has initiated several reforms during the year, which would change the pace of progress for the power sector going forward and revive the investment cycle. The macroeconomic indicators have also started looking up and we see a positive year ahead.
On the financial front, your Company achieved a turnover of Rs. 2,610.45 crore in the financial year 2012-13 as compared to Rs. 2,529.66 crore in the financial year 2011-12 and the profit after tax for financial year 2012-13 is Rs. 28.86 crore in comparison to Rs. 124.93 crore during the financial year 2011-12. The profitability of your Company has been impacted due to various factors including exceptionally high finance cost.
3. DIVIDEND In order to conserve the resources of the Company, your Board of Directors do not recommend any dividend for
the financial year under review.
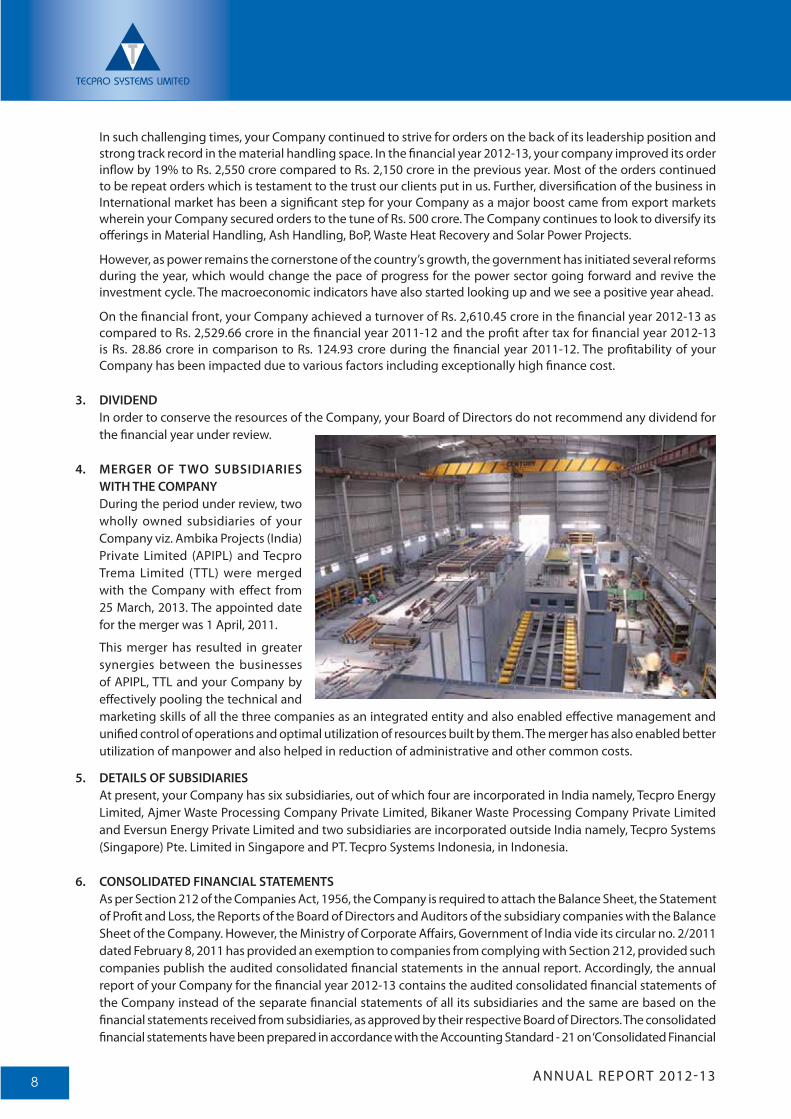
4. MERGER OF TWO SUBSIDIARIES WITH THE COMPANY
During the period under review, two wholly owned subsidiaries of your Company viz. Ambika Projects (India) Private Limited (APIPL) and Tecpro Trema Limited (TTL) were merged with the Company with effect from 25 March, 2013. The appointed date for the merger was 1 April, 2011.
This merger has resulted in greater synergies between the businesses of APIPL, TTL and your Company by effectively pooling the technical and marketing skills of all the three companies as an integrated entity and also enabled effective management and unified control of operations and optimal utilization of resources built by them. The merger has also enabled better utilization of manpower and also helped in reduction of administrative and other common costs.
5. DETAILS OF SUBSIDIARIES At present, your Company has six subsidiaries, out of which four are incorporated in India namely, Tecpro Energy
Limited, Ajmer Waste Processing Company Private Limited, Bikaner Waste Processing Company Private Limited and Eversun Energy Private Limited and two subsidiaries are incorporated outside India namely, Tecpro Systems (Singapore) Pte. Limited in Singapore and PT. Tecpro Systems Indonesia, in Indonesia.
6. CONSOLIDATED FINANCIAL STATEMENTS As per Section 212 of the Companies Act, 1956, the Company is required to attach the Balance Sheet, the Statement
of Profit and Loss, the Reports of the Board of Directors and Auditors of the subsidiary companies with the Balance Sheet of the Company. However, the Ministry of Corporate Affairs, Government of India vide its circular no. 2/2011 dated February 8, 2011 has provided an exemption to companies from complying with Section 212, provided such companies publish the audited consolidated financial statements in the annual report. Accordingly, the annual report of your Company for the financial year 2012-13 contains the audited consolidated financial statements of the Company instead of the separate financial statements of all its subsidiaries and the same are based on the financial statements received from subsidiaries, as approved by their respective Board of Directors. The consolidated financial statements have been prepared in accordance with the Accounting Standard - 21 on ‘Consolidated Financial
ANNUAL REPORT 2012-13 9
Statements’ notified under Section 211 (3C) of the Companies Act, 1956 read with the Companies (Accounting Standards) Rules, 2006, as applicable.
Further, the Company hereby undertakes that the audited financial statements and related information of subsidiaries of your Company will be made available to the shareholders of the Company and the shareholders of subsidiary companies, upon request at any point of time. The financial statements of the subsidiary companies shall be available for inspection during business hours at our head office, the registered office of the Company and also at the registered offices of the respective subsidiaries.
7. MANAGEMENT DISCUSSION AND ANALYSIS STATEMENT Management Discussion and Analysis Statement is annexed to this Report.
8. CORPORATE GOVERNANCE REPORT The Corporate Governance Report pursuant to Clause 49 of the Listing Agreement is annexed to this Report.
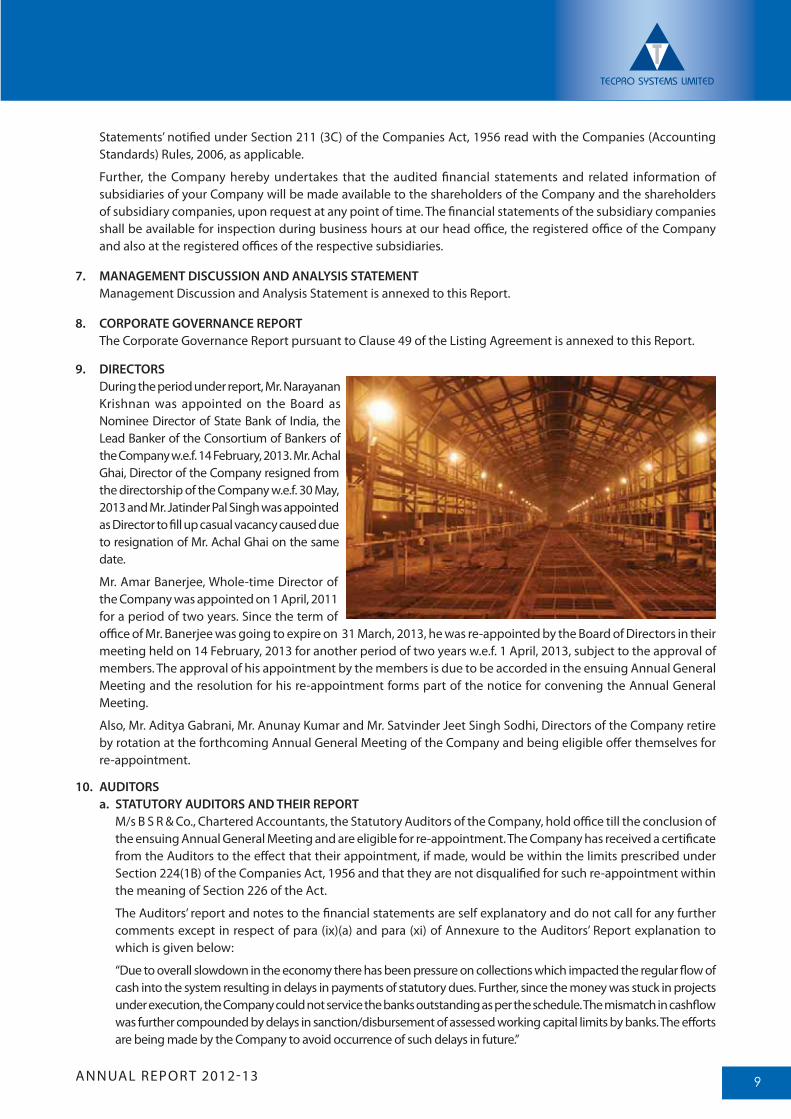
9. DIRECTORS During the period under report, Mr. Narayanan
Krishnan was appointed on the Board as Nominee Director of State Bank of India, the Lead Banker of the Consortium of Bankers of the Company w.e.f. 14 February, 2013. Mr. Achal Ghai, Director of the Company resigned from the directorship of the Company w.e.f. 30 May, 2013 and Mr. Jatinder Pal Singh was appointed as Director to fill up casual vacancy caused due to resignation of Mr. Achal Ghai on the same date.
Mr. Amar Banerjee, Whole-time Director of the Company was appointed on 1 April, 2011 for a period of two years. Since the term of office of Mr. Banerjee was going to expire on 31 March, 2013, he was re-appointed by the Board of Directors in their meeting held on 14 February, 2013 for another period of two years w.e.f. 1 April, 2013, subject to the approval of members. The approval of his appointment by the members is due to be accorded in the ensuing Annual General Meeting and the resolution for his re-appointment forms part of the notice for convening the Annual General Meeting.
Also, Mr. Aditya Gabrani, Mr. Anunay Kumar and Mr. Satvinder Jeet Singh Sodhi, Directors of the Company retire by rotation at the forthcoming Annual General Meeting of the Company and being eligible offer themselves for re-appointment.
10. AUDITORSa. STATUTORY AUDITORS AND THEIR REPORT M/s B S R & Co., Chartered Accountants, the Statutory Auditors of the Company, hold office till the conclusion of
the ensuing Annual General Meeting and are eligible for re-appointment. The Company has received a certificate from the Auditors to the effect that their appointment, if made, would be within the limits prescribed under Section 224(1B) of the Companies Act, 1956 and that they are not disqualified for such re-appointment within the meaning of Section 226 of the Act.
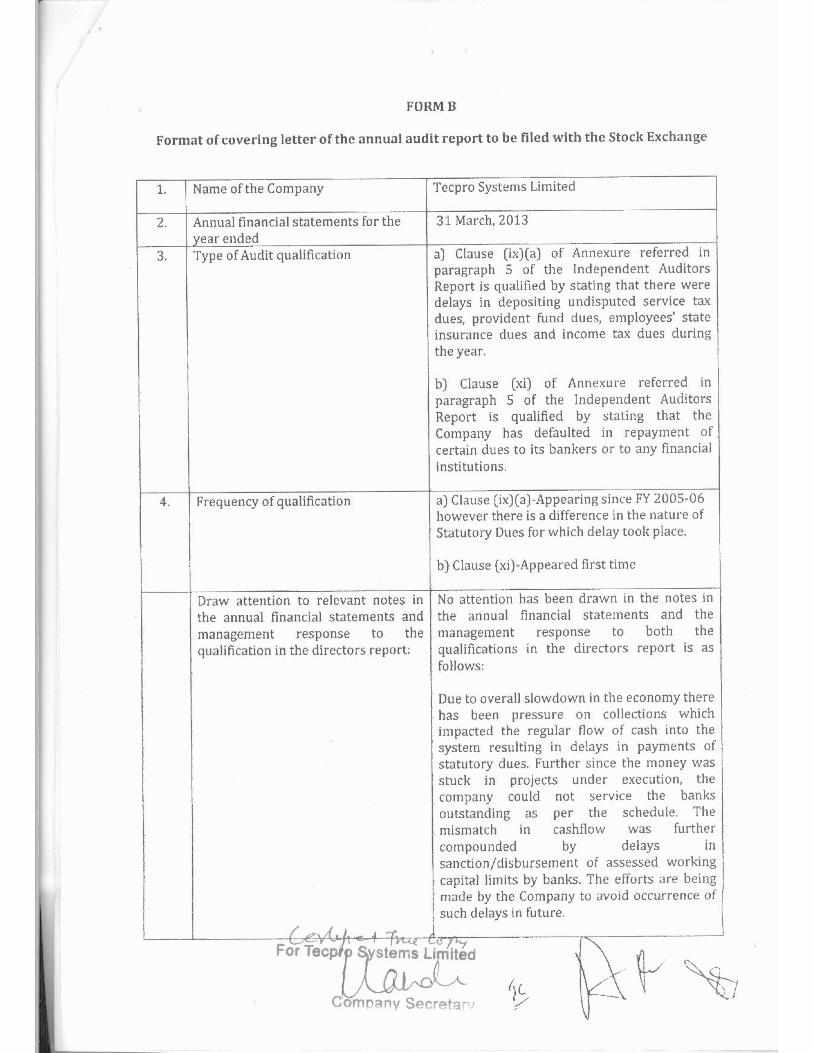
The Auditors’ report and notes to the financial statements are self explanatory and do not call for any further comments except in respect of para (ix)(a) and para (xi) of Annexure to the Auditors’ Report explanation to which is given below:
“Due to overall slowdown in the economy there has been pressure on collections which impacted the regular flow of cash into the system resulting in delays in payments of statutory dues. Further, since the money was stuck in projects under execution, the Company could not service the banks outstanding as per the schedule. The mismatch in cashflow was further compounded by delays in sanction/disbursement of assessed working capital limits by banks. The efforts are being made by the Company to avoid occurrence of such delays in future.”
ANNUAL REPORT 2012-1310
b. COST AUDITORS Pursuant to the order no. F. No. 52/26/CAB-2010 dated January 24, 2012 of Ministry of Corporate Affairs, the
Company has been covered under the Companies (Cost Accounting Records) Rules, 2011 under the Industry-Engineering Machinery (incl. electrical & electronic products) under the Chapter heading 84 & 85 of the Central Excise Tariff Act, 1985 and accordingly as per the aforementioned order, the Company is required to get the cost accounting records of the Company audited by a Cost Auditor for the financial year 2012-13 onwards.
In view of the above, M/s N. K. Jain And Associates, Cost Accountants were appointed as the Cost Auditors of the Company for the financial year 2012-13. The last date for filing of the Cost Audit Report for the financial year 2012-13 is 27 September, 2013 and the same will be filed within the prescribed time.
11. DIRECTORS’ RESPONSIBILITY STATEMENT Pursuant to the requirement under Section 217 (2AA) of the Companies Act, 1956, with respect to the Directors’
Responsibility Statement, it is hereby confirmed:
(i) that in the preparation of the annual accounts for the financial year ended 31 March, 2013, the applicable accounting standards had been followed along with proper explanation relating to material departures;
(ii) that the directors had selected such accounting policies and applied them consistently and made judgments and estimates that were reasonable and prudent so as to give a true and fair view of the state of affairs of the Company for the financial year ended 31 March, 2013 and of the profit or loss of the Company for that period;
(iii) that the directors had taken proper and sufficient care for the maintenance of adequate accounting records in accordance with the provisions of the Companies Act, 1956 for safeguarding the assets of the Company and for preventing and detecting frauds and other irregularities;
(iv) that the directors had prepared the annual accounts for the financial year ended 31 March, 2013 on a going concern basis.
12. FIXED DEPOSITS The Company has not invited/accepted any Fixed Deposits during the year, as such, no amount of principal or
interest on fixed deposits was outstanding on the date of the Balance Sheet.
13. CONSERVATION OF ENERGY, TECHNOLOGY ABSORPTION AND FOREIGN EXCHANGE EARNINGS AND OUTGO Pursuant to Section 217(1)(e) of the Companies Act, 1956 read with the Companies (Disclosure of Particulars in
the Report of Board of Directors) Rules, 1988, particulars of energy conservation, technology absorption, foreign exchange earnings and outgo are annexed as Annexure-A and form part of the Directors’ Report.
ANNUAL REPORT 2012-13 11
14. HUMAN RESOURCES The professionally qualified and experienced employees of the Company helped it during the period under review
to render efficient services to its clients and also maintained its project execution track record. The Company believes that the quality of services delivered by its employees is among the best in the industry and helps the Company in getting new orders and executing the projects in hand. The Company regularly provides opportunities to its employees to enhance their skills and knowledge both through external and internal training sessions at regular intervals. It believes in maintaining cordial and harmonious industrial relations.
15. PARTICULARS OF EMPLOYEES In terms of the provisions of Section 217(2A) of the Companies Act, 1956 read with the Companies (Particulars of
Employees) Rules, 1975 as amended from time to time, the names and other particulars of employees are set out in the annexure to the Directors’ Report. In terms of Section 219(1)(b)(iv) of the Act, the report and accounts are being sent to the shareholders excluding the aforesaid annexure. Any shareholder interested in obtaining copy of the same may write to the Company Secretary at the registered office of the Company.
ACKNOWLEDGEMENT We thank our bankers, financial institutions for their continued support during the year. We also thank the Government of various countries, the Government of India, State Governments and concerned Government Authorities/Departments for their co-operation. We appreciate and value the support of our collaborators, customers, vendors and investors. We place on record our appreciation for the contribution made by every member of the Tecpro family.
For and on behalf of the Board of Tecpro Systems Limited
Sd/- Sd/-Place : Gurgaon Ajay Kumar Bishnoi Amul GabraniDate : 14 August, 2013 Chairman & Managing Director Vice Chairman & Managing Director
ANNUAL REPORT 2012-1312
Annexure–A
Information in accordance with the Companies (Disclosure of Particulars in the Report of Board of Directors) Rules,
1988, and forming part of the Directors’ Report for the year ended 31 March, 2013
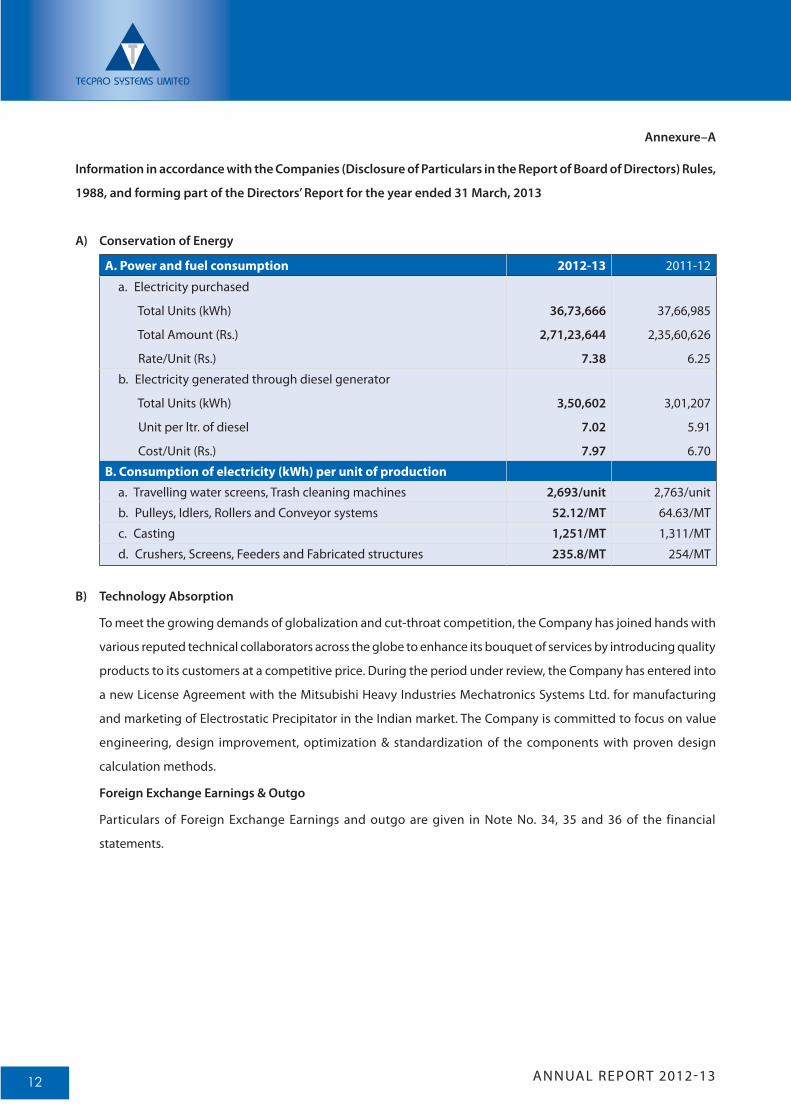
A) Conservation of Energy
A. Power and fuel consumption 2012-13 2011-12
a. Electricity purchased
Total Units (kWh)
Total Amount (Rs.)
Rate/Unit (Rs.)
36,73,666
2,71,23,644
7.38
37,66,985
2,35,60,626
6.25
b. Electricity generated through diesel generator
Total Units (kWh)
Unit per ltr. of diesel
Cost/Unit (Rs.)
3,50,602
7.02
7.97
3,01,207
5.91
6.70
B. Consumption of electricity (kWh) per unit of production
a. Travelling water screens, Trash cleaning machines 2,693/unit 2,763/unit
b. Pulleys, Idlers, Rollers and Conveyor systems 52.12/MT 64.63/MT
c. Casting 1,251/MT 1,311/MT
d. Crushers, Screens, Feeders and Fabricated structures 235.8/MT 254/MT
B) Technology Absorption
To meet the growing demands of globalization and cut-throat competition, the Company has joined hands with
various reputed technical collaborators across the globe to enhance its bouquet of services by introducing quality
products to its customers at a competitive price. During the period under review, the Company has entered into
a new License Agreement with the Mitsubishi Heavy Industries Mechatronics Systems Ltd. for manufacturing
and marketing of Electrostatic Precipitator in the Indian market. The Company is committed to focus on value
engineering, design improvement, optimization & standardization of the components with proven design
calculation methods.
Foreign Exchange Earnings & Outgo
Particulars of Foreign Exchange Earnings and outgo are given in Note No. 34, 35 and 36 of the financial
statements.
ANNUAL REPORT 2012-13 13
MANAGEMENT DISCUSSION & ANALYSIS
1. Economy Overview
Improvement in macro indicators towards the end of the last fiscal implies the Indian economy is well-poised for a recovery in the current year. Several positives were observed during the year including easing of price inflation, exports acceleration and falling crude oil prices. Although Gross Domestic Product (GDP) growth dipped during the period, it is expected to bottomed out and move up from here as economic reforms and initiatives take shape. International Monetary Fund (IMF) expects the country’s GDP to improve to 5.7% in calendar year 2013 itself and further to 6.2% a year after.
Inflation back in the comfort zone The year 2012-13 saw significant easing of inflationary pressures, giving enough headroom for policy rate cuts
to accelerate investment and stimulate economic growth. The Reserve Bank of India has cut policy rates 4 times since the beginning of the easing cycle in April 2012 cumulatively, the repo rate has been reduced by 1.25% since April 2012. The current fiscal started with positive news flow as headline inflation fell to 4.9% in April’13, within the RBI’s comfort zone of 4-5% for the first time in almost three-and-a-half years. Significant softening has been seen across commodity groups including food, manufacturing items and service sector. These trends are expected to receive a further boost from declining global commodity prices. Overall, inflation concerns in the economy have receded substantially. With a return of price stability, likelihood of interest rate cuts and the mid-quarter review of monetary policy, investment cycle is likely to improve.
Index of Industrial Production (IIP) firms up
The downturn in the level of industrial activity has also stabilized. IIP for March 2013 expanded at 2.5% on Year on Year basis. Thus implied industrial output expanded for the third consecutive month in fourth quarter of FY13 as against third quarter of FY13, when two out of three months experienced contractions. Improvement is being seen across segments such as manufacturing, mining and electricity. As we move into FY14, gradual monetary easing and slower pace of fiscal consolidation is expected to support growth and, if monsoons are normal, better agri-prospects will also aid industrial output.
Supported by government reforms to improve investment India needs a strong uptick in investments to return to the high growth cycle. The Government has accordingly
announced a series of reforms across sectors: faster clearances for infrastructure projects under Cabinet Committee on Investments; liberalization of FDI across various sectors; guidelines for granting banking licenses to the private sector; reduction in withholding tax on overseas borrowings by domestic companies, etc.
As these positives and reforms pan out, a gradual recovery is on the cards in FY14.
2. Sector Overview
Infrastructure tops government agenda Infrastructure remains at the forefront of the country’s economic development. The Government has envisaged
$1trillion of infrastructure spending in the 12th Five year Plan (2012-2017), half of which is expected to come from the private sector. To achieve this, the Government is pushing for incentives and reforms to attract more investment, both from domestic investors and foreign investors. In the Union Budget 2013, the Finance Minister
ANNUAL REPORT 2012-1314
announced that the Government will be encouraging Infrastructure Debt Funds (IDFs) to raise resources and provide long-term low-cost debt for infrastructure projects through take-out finance and credit enhancement. Four IDFs have already been registered with SEBI, of which two were launched in February 2013. The Finance Minister also announced that India Infrastructure Finance Corporation Limited will, in partnership with the Asian Development Bank, offer credit enhancement to infrastructure companies wishing to tap the bond market for long term funds. The Budget includes provision for offering tax-free bonds to raise Rs. 500 bn for financing infrastructure projects. The Government is proposing modifications in the investment norms for pension and provident funds to channelize their large cash inflows into the infrastructure sector.
As the Government continues to provide the much needed boost to the infrastructure sector with reforms and initiatives, the investment cycle is expected to pick up, leading to faster implementation of projects across sectors like power and roads. This could also revive demand from related core sectors like steel and cement.
Powered by reforms To address the issues grappling the power sector – fuel shortage (coal & gas), poor financial health of State Electricity
Boards (SEBs), land acquisition problems, delay in environmental and forest clearances – the Government has stepped up its efforts with a host of policy initiatives.
To tackle the issue of coal shortage, it is proposing to change the National Coal Distribution Policy (NCDP). Coal India Ltd (CIL) will supply 65-80%, in line with the current fuel supply agreement (FSA conditions). At present, the current NCDP mandates CIL to meet full requirements. This move is likely to allow the generation companies (GENCOS) to meet the shortfall in CIL supplies through imports and pass on the additional cost burden to buyers under the ‘change in law’ provision.
The Government has approved the package for restructuring of debt of state electricity distribution companies (DISCOMs). Fifty percent of DISCOMs’ short-term debt as on 31 March, 2012 will be taken over by the respective State Government. The remaining 50% will be restructured with a 3-year principal moratorium. The restructuring of DISCOM loans entails increase in power tariff which would lead to decline in their annual losses. So far 18 states, consuming about 9 2 % o f p o we r, h ave effected tariff hikes of 3%-37% in FY13. The increase in tariff would help attract private sector investment in power distribution companies.
To address gas supply concerns, the Rangarajan Committee has recommended doubling of domestic gas prices from US$4.2/mBtu to ~US$8.0/mBtu. A move that will incentivise upstream investments in exploration and production given the backdrop of dwindling gas output from the Krishna Godavari Basin.
The formation of the Cabinet Committee on Investments (CCI) is also a move to expedite the clearance process for infrastructure projects. This has already started bearing results, as the Government recently cleared the Rs. 120 bn worth North Karanpura Power Project of NTPC that was stranded for more than a decade. CCI is currently working on implementation of 26 power projects involving cumulative investment of Rs. 1,000 bn.
ANNUAL REPORT 2012-13 15
Improving finances of SEBs & thereby of power GENCOS and faster execution of projects bodes well for growth of EPC and Balance of Plant (BoP) service providers in the country. This, coupled with moderating inflation and lower interest rates, will help revive the capital expenditure cycle and improve the pace of order inflows.
Demand growth to fuel cement industry The cement sector, which witnessed 5% growth in FY13, is set for a recovery driven by strong growth in rural
housing and pick-up of investments in roads and railways. Housing constitutes two-thirds of Indian cement demand, with rural housing accounting for 40% of total demand. Demand from rural housing is being driven by Government-supported schemes like Indira Awas Yojna and rising rural income. Construction activity in the road sector is also expected to recover with the NHAI taking several steps to revive stuck projects like delinking environmental and forest clearance, floating new tenders on EPC mode rather than BOT and easing financing norms for the sector. Railways’ capex is also growing, supported by dedicated freight corridor awards.
The sector is expected to see strong volume growth as a result of increase in demand from construction and infrastructure projects ahead of the national elections to be held next year. Interest rate cuts will also be a positive for the sector which could revive home sales and construction.
The Government has announced a slew of measures in the Union Budget 2013-14 to provide a fillip to infrastructure and housing demand such as additional interest deduction of up to Rs. 1 lakh on housing loans, enhancement in provisions under Rural Housing Fund and improving funding of infrastructure projects. These measures announced in the Budget augur well for long term demand outlook for the cement industry.
Steel industry’s outlook improves The Indian steel industry is expected to witness improved performance in CY13-14 after a dismal 2012. World Steel
Association (WSA) expects steel demand in India to sharply improve from a tepid 2.5% in 2012 to 5.9% in 2013 and then to 7.0% in 2014. This would be primarily driven by government’s commitment to infrastructure spending, monetary easing measures and favorable FDI policy. The Indian Government’s support to infrastructure development in both rural and urban India has been creating a significant demand for steel. In addition, a revival in the prospects of automobile and real estate companies should be positive short-to-medium triggers to watch out for.
In the last year’s budget, the Government had lowered basic customs duty on plant and machinery for setting up of iron ore pellet plants or iron ore beneficiation plants from 7.5% to 2.5% to discourage exports of raw ore. Though there were no direct incentives this year, the budget’s focus on increasing demand for core sectors would augur well for the domestic steel industry. The budget attempts to boost demand for core sectors such as steel, cement and construction by providing an investment allowance on capital expenditure and additional interest deduction to first time homeowners. The 15% investment allowance to manufacturing companies investing in excess of Rs.100 crore over the next two years may potentially enhance the viability of investments by improving the internal rate of return for such projects. The proposal to allow first time homeowners, availing home loan of less than Rs. 25 lakh, an incremental deduction for Rs. 100,000 of interest has an impact of reducing effective interest rate by 75bps to 100bps on the home loan.
3. Corporate Overview
Tecpro started as a material handling company in 2001 and has become a prominent player in bulk material handling, ash handling and EPC/BoP for power plants. The Company designs, engineers, manufactures, sells, commissions and services a range of material handling and ash handling systems and equipment for the core
ANNUAL REPORT 2012-1316
infrastructure and related sectors like power, steel, cement and other industries. Over the years, the Company has ventured into various complementary businesses across different divisions of the power sector with a vision to build an integrated business serving the sector - waste heat recovery systems, water systems, solar EPC systems and pollution control equipment. The outstanding order book position of the Company as on 31 March, 2013 was about Rs. 4,200 crore and, after that, it has further bagged orders worth about Rs. 250 crores. The Company received orders worth Rs. 2,552 crore during the financial year 2012-13, mostly from the material handling and ash handling segments.
4. Review of Business Operations
FY13 continued to be a challenging year for the power sector. Tecpro derives majority of its revenue from power segment and was thus affected by issues afflicting the sector which saw slower execution of power projects and thus lower orders being tendered. Issues of coal linkages, land acquisition and fund constraints resulted in non-finalization of new projects. In such challenging times, Tecpro has continued to leverage its leadership position and strong execution track record in the material and coal handling space, having successfully secured orders worth Rs. 2,552 crore in FY13. This includes Rs. 198 crore BoP order from the Rajasthan Rajya Vidyut Utpadan Nigam Limited. The order backlog as on 31 March, 2013 stood at Rs. 4,200 crore which provides good revenue visibility for the next couple of years.
This has been a landmark year for Tecpro, where it extended its offerings to international markets. The Company has won 3 international orders this year, including Rs. 209 crore order for coal handling system from Bukit Asam in Indonesia and Rs. 180 crore order for coal, limestone and ash handling system from Hyundai Rotem Company, Korea {through its subsidiary viz. Tecpro Systems (Singapore) Pte. Ltd.}. The third international order is for Rs. 95.7 crore coal handling order from SK Engineering and Construction, South Korea for Paco Power Plant in Panama, increasing Tecpro’s global presence across diversified geographies like Vietnam, Indonesia and Central America.
Over the years, Tecpro has diversified across sectors (power, steel, cement) and segments (coal, ash, waste heat recovery (WHR), water, solar) which will help the Company in hedging sector-specific risks. For WHR segment, after tapping cement sector (orders from UltraTech, Grasim, Dalmia, etc.), Tecpro is eyeing the steel sector and has already received its first WHR order in Steel Sector from Steel Authority of India Limited worth Rs. 23 crore.
In May 2013, Tecpro entered into an exclusive 5-year license agreement with Mitsubishi Heavy Industries Mechatronics Systems Ltd. of Japan for manufacturing and marketing of Electrostatic Precipitator (ESP) in the Indian market. This would further increase the Company’s portfolio of services for India’s core sectors, through technology tie-ups with global leaders. In view of stringent pollution control norms, there will be a strong demand for ESPs in India as there is an increased focus on environmental conservation. This is the next important milestone in our strategy to diversify our offerings within the overall gamut of serving the needs of India’s core sector. The market for air pollution control equipment is in growing stage and is anticipated to grow at a CAGR of 14.2% from 2012 to 2017.
Tecpro has developed strong in-house expertise to manufacture equipments used for coal handling and ash handling plants with four manufacturing facilities. Moreover, the highly experienced design team spread across the country helps in providing better, economical and timely services to our clients which in turn results in improved efficiency for the Company. The market leadership of the Company is bolstered by technical tie-ups with global companies which are leaders in material and ash handling solutions. This helps in reducing R&D costs and time to market new technologies. Last year, the Company tied up with Nanjing Triumph Kaineng Environment & Energy Co. Ltd of China for Turbine & Generator components for WHR projects and with Advanced Conveyor Technologies Inc. USA for design and engineering of overland conveyor systems. Such partnerships have helped in creating entry barriers through enhanced service offerings.
During the year under review, the Company has received several prestigious orders, a few of which are mentioned below:
� Order from Kanti Bijlee Utpadan Nigam Ltd, a subsidiary of NTPC, worth Rs. 267.3 crore, for the supply of coal handling plant package for Muzaffarpur Thermal Power Project, Stage II.
� Order from Bukit Asam of Indonesia worth Rs. 209 crore for coal handling facility and overland conveyors at Tanjung Enim, Sumatra, Indonesia.
ANNUAL REPORT 2012-13 17
� BoP order worth Rs. 198 crore from the Rajasthan Rajya Vidyut Utpadan Nigam Limited for 1X160 MW gas based combined cycle power project Stage-IV in Jaisalmer, Rajasthan.
� Order from Hyundai Rotem Company, Korea worth Rs. 179.9 crore for supply of coal, limestone and ash handling system for 2X500 MW Mong Doung 1 Thermal Power Plant Project through its Singapore based subsidiary.
� Order from Meja Urja Nigam Private Limited worth Rs. 162 crore for 2X660 MW Ash handling system package.
� Order from Abhijeet Projects Limited worth Rs. 155 crore for supply of coal handling plant package for Phase-I of 2X660 MW Super Critical Thermal Power Project in Banka district of Bihar.
� Order from Damodar Valley Corporation worth Rs. 146.6 crore for (1X500 MW) coal handling plant package for Bokaro Thermal Power Station ‘A’.
� Order from NTPC Limited worth Rs. 141.9 crore for the supply of Ash handling system & Ash water recirculation package for 2X660 MW Sholapur Super Thermal Power Project.
The Company has stepped up efforts for improving the cash conversion cycle through the timely execution of current projects and better negotiation of payment terms with clients. Out of the total order book, about Rs. 1,000 crore are LC backed, including export orders which are 100% LC backed. Moreover, the macro environment is set to improve as Government has announced various power sector reforms including SEBs restructuring package, increase in tariffs, reforms to address issues of coal shortage, etc. As these start panning out, there would be decline in losses for SEBs and improvement in payment cycles.
Established leadership position, diversifying business mix and increasing technical abilities will ensure continued strong growth and healthy margins for the Company. Tecpro believes that it is well-positioned to thrive as macro and sector environment turns positive.
5. Financial Review
During the year under review, Tecpro recorded revenue of Rs. 2,610.5 crore, a 3.2% growth over the last year. EBITDA stood at Rs. 355.5 crore. On the strength of its execution track record and ability to successfully market its services to existing and new clients, Tecpro has been able to show positive growth even during the challenging times.
In terms of segments, material handling contributed 63.2% to revenues in FY13, followed by Balance of Plant 27.6% and ash handling 9.2% .
6. Strengths, Opportunities & Threats
Strengths
control equipment etc.
Opportunities
control equipment - driven by the regulations & growing demand and waste heat recovery - driven by move towards cleaner energy sources
Threats
7. Outlook
The Indian economy is expected to recover gradually in 2013-14. On the policy front, Government has taken several measures to kickstart the investment cycle from financial restructuring of SEBs to fuel price hikes to setting up a Cabinet Committee on Investment for fast-tracking mega projects. As the reforms announced by the Government take effect, there will be revival in the industrial cycle followed with traction in greenfield and mega projects.
ANNUAL REPORT 2012-1318
In order to address the persistent power deficit in the country, the Government plans to add 76 GW of power capacity, implying a BoP opportunity worth ~Rs. 1.4 trillion. As the sector issues get addressed, increased commissioning of power projects would see orders picking up.
We believe Tecpro is now at the forefront to avail of these opportunities. The Company would continue to consolidate its leadership position in the material and ash handling space as well as look at diverse sources of revenue in the EPC space. The JV with Mitsubishi for ESP is an important milestone in the Company’s diversification strategy . Air pollution has today become an issue of global magnitude and Tecpro is committed to contribute in tackling the issue by manufacturing & supply of the quality air pollution control equipment. In the new financial year, your Company has bagged a significant solar EPC project through its wholly owned subsidiary, Eversun Energy Private Limited. The EPC order is for 5 MW Solar Photovoltaic (SPV) power plant of NTPC at Faridabad, Haryana. The project will showcase the Company’s project management capabilities in the grid scale power plants.
Going forward, Tecpro is committed to sustain its financial performance and strengthen its position in the businesses it operates in.
8. Risks and concerns
Tecpro, like any other business entity, is subject to certain risks which are associated with the nature of its business. Some of the risks are at the macro level and others are at the Company level. At macro level, slower projects execution in sectors including power, cement and steel, impacts the Company. Further, volatility in cost of input materials such as steel, cement etc. and increase in rate of interest impacts profitability and margins. However, the Company has a policy of keeping a constant check on these factors and proactively taking steps to mitigate the risks that can impact its financials. At the Company level, the major challenge is to hire and retain skilled manpower which is key to our success. In today’s world, where technology is changing constantly, it is critical to have professionally qualified and experienced manpower which can meet the challenges of growing competition.
9. Audit & Internal Control System
The Company has in place organised and effective internal control systems. The internal audit program is undertaken at regular intervals to ensure the correctness, accuracy, authenticity and reliability of the accounting and financial transactions. There are stringent systems in place to ensure that the assets and property of the Company are properly utilized in the interest of the Company. The Internal Control Systems and Internal Auditors’ Reports are reviewed by the Audit Committee so as to ensure transparency and proper compliances.
10. Human resources
As of 31 March, 2013, the employee count for the Company stood at 1,540. The Company plans to retain the present level of the manpower during the year realizing the importance of technical and functional expertise to service its projects and operating assets. Quality & safety are given high priority. The management team comprises industry veterans, and their experience and relationships have enabled the Company to enhance its operating capabilities, improve quality of its services and facilitate access to its clients.
ANNUAL REPORT 2012-13 19
ANNEXURE TO THE DIRECTORS’ REPORT
CORPORATE GOVERNANCE REPORT FOR THE YEAR 2012-13The Company’s policies on the Corporate Governance and compliance report on specific areas wherever applicable for the financial year ended 31 March, 2013 are given hereunder:-
I. The Company’s Philosophy on Corporate Governance The key to Corporate Governance for any organization is transparency. It results in winning the trust and confidence
of all the stakeholders. The Company is committed to ensure highest possible transparency in its business operations. The Company believes that it helps in maintaining the highest level of accountability and integrity leading to ultimate goal of the management and the stakeholders i.e. growth of the Company.
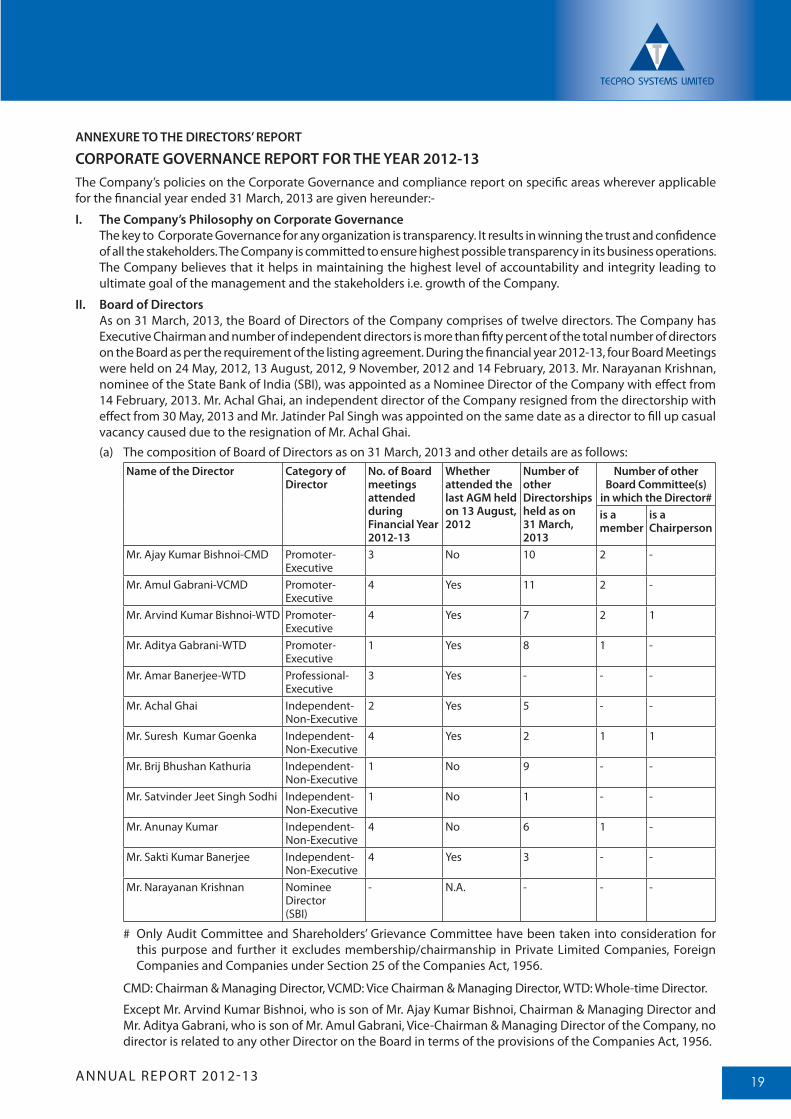
II. Board of Directors As on 31 March, 2013, the Board of Directors of the Company comprises of twelve directors. The Company has
Executive Chairman and number of independent directors is more than fifty percent of the total number of directors on the Board as per the requirement of the listing agreement. During the financial year 2012-13, four Board Meetings were held on 24 May, 2012, 13 August, 2012, 9 November, 2012 and 14 February, 2013. Mr. Narayanan Krishnan, nominee of the State Bank of India (SBI), was appointed as a Nominee Director of the Company with effect from 14 February, 2013. Mr. Achal Ghai, an independent director of the Company resigned from the directorship with effect from 30 May, 2013 and Mr. Jatinder Pal Singh was appointed on the same date as a director to fill up casual vacancy caused due to the resignation of Mr. Achal Ghai.(a) The composition of Board of Directors as on 31 March, 2013 and other details are as follows:
Name of the Director Category of Director
No. of Board meetings attended during Financial Year 2012-13
Whether attended the last AGM held on 13 August, 2012
Number of other Directorships held as on 31 March, 2013
Number of other Board Committee(s)
in which the Director#is a member
is a Chairperson
Mr. Ajay Kumar Bishnoi-CMD Promoter-Executive
3 No 10 2 -
Mr. Amul Gabrani-VCMD Promoter-Executive
4 Yes 11 2 -
Mr. Arvind Kumar Bishnoi-WTD Promoter-Executive
4 Yes 7 2 1
Mr. Aditya Gabrani-WTD Promoter-Executive
1 Yes 8 1 -
Mr. Amar Banerjee-WTD Professional-Executive
3 Yes - - -
Mr. Achal Ghai Independent-Non-Executive
2 Yes 5 - -
Mr. Suresh Kumar Goenka Independent-Non-Executive
4 Yes 2 1 1
Mr. Brij Bhushan Kathuria Independent-Non-Executive
1 No 9 - -
Mr. Satvinder Jeet Singh Sodhi Independent-Non-Executive
1 No 1 - -
Mr. Anunay Kumar Independent-Non-Executive
4 No 6 1 -
Mr. Sakti Kumar Banerjee Independent-Non-Executive
4 Yes 3 - -
Mr. Narayanan Krishnan Nominee Director (SBI)
- N.A. - - -
# Only Audit Committee and Shareholders’ Grievance Committee have been taken into consideration for this purpose and further it excludes membership/chairmanship in Private Limited Companies, Foreign Companies and Companies under Section 25 of the Companies Act, 1956.
CMD: Chairman & Managing Director, VCMD: Vice Chairman & Managing Director, WTD: Whole-time Director.
Except Mr. Arvind Kumar Bishnoi, who is son of Mr. Ajay Kumar Bishnoi, Chairman & Managing Director and Mr. Aditya Gabrani, who is son of Mr. Amul Gabrani, Vice-Chairman & Managing Director of the Company, no director is related to any other Director on the Board in terms of the provisions of the Companies Act, 1956.
ANNUAL REPORT 2012-1320
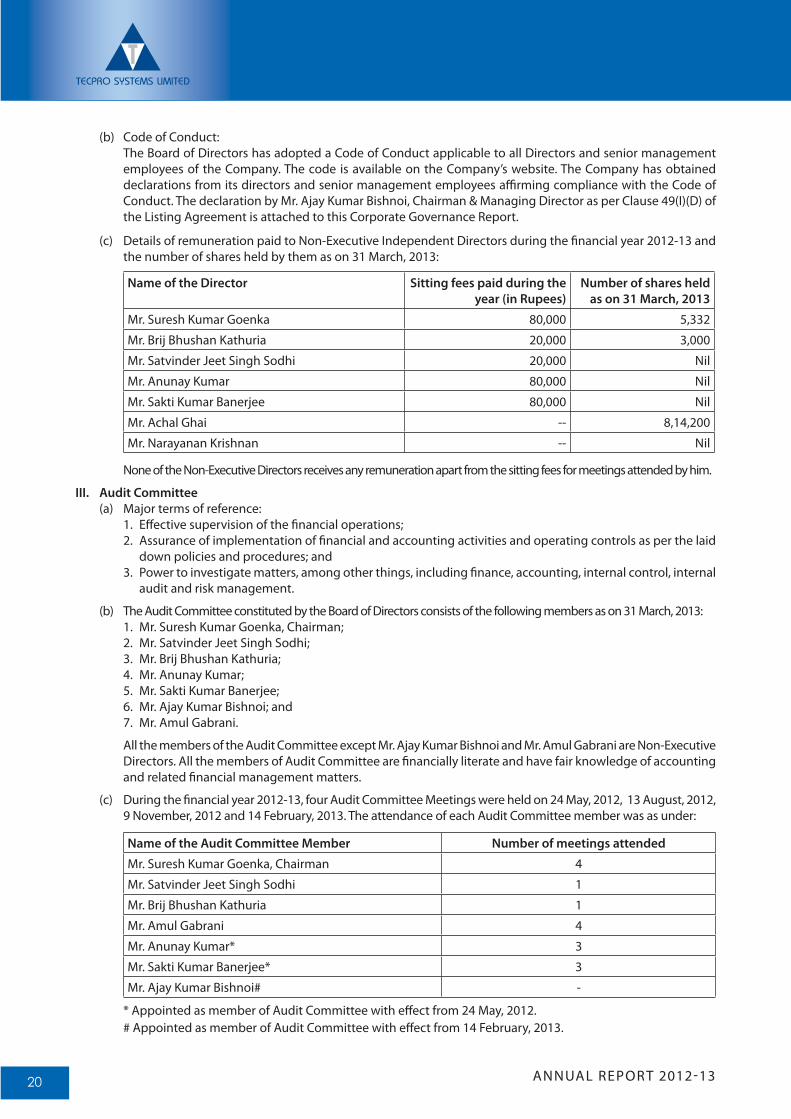
(b) Code of Conduct: The Board of Directors has adopted a Code of Conduct applicable to all Directors and senior management
employees of the Company. The code is available on the Company’s website. The Company has obtained declarations from its directors and senior management employees affirming compliance with the Code of Conduct. The declaration by Mr. Ajay Kumar Bishnoi, Chairman & Managing Director as per Clause 49(I)(D) of the Listing Agreement is attached to this Corporate Governance Report.
(c) Details of remuneration paid to Non-Executive Independent Directors during the financial year 2012-13 and the number of shares held by them as on 31 March, 2013:
Name of the Director Sitting fees paid during the year (in Rupees)
Number of shares held as on 31 March, 2013
Mr. Suresh Kumar Goenka 80,000 5,332
Mr. Brij Bhushan Kathuria 20,000 3,000
Mr. Satvinder Jeet Singh Sodhi 20,000 Nil
Mr. Anunay Kumar 80,000 Nil
Mr. Sakti Kumar Banerjee 80,000 Nil
Mr. Achal Ghai -- 8,14,200
Mr. Narayanan Krishnan -- Nil
None of the Non-Executive Directors receives any remuneration apart from the sitting fees for meetings attended by him.
III. Audit Committee(a) Major terms of reference:
1. Effective supervision of the financial operations; 2. Assurance of implementation of financial and accounting activities and operating controls as per the laid
down policies and procedures; and 3. Power to investigate matters, among other things, including finance, accounting, internal control, internal
audit and risk management.
(b) The Audit Committee constituted by the Board of Directors consists of the following members as on 31 March, 2013: 1. Mr. Suresh Kumar Goenka, Chairman;2. Mr. Satvinder Jeet Singh Sodhi;3. Mr. Brij Bhushan Kathuria; 4. Mr. Anunay Kumar; 5. Mr. Sakti Kumar Banerjee; 6. Mr. Ajay Kumar Bishnoi; and7. Mr. Amul Gabrani.
All the members of the Audit Committee except Mr. Ajay Kumar Bishnoi and Mr. Amul Gabrani are Non-Executive Directors. All the members of Audit Committee are financially literate and have fair knowledge of accounting and related financial management matters.
(c) During the financial year 2012-13, four Audit Committee Meetings were held on 24 May, 2012, 13 August, 2012, 9 November, 2012 and 14 February, 2013. The attendance of each Audit Committee member was as under:
Name of the Audit Committee Member Number of meetings attended
Mr. Suresh Kumar Goenka, Chairman 4
Mr. Satvinder Jeet Singh Sodhi 1
Mr. Brij Bhushan Kathuria 1
Mr. Amul Gabrani 4
Mr. Anunay Kumar* 3
Mr. Sakti Kumar Banerjee* 3
Mr. Ajay Kumar Bishnoi# -
* Appointed as member of Audit Committee with effect from 24 May, 2012. # Appointed as member of Audit Committee with effect from 14 February, 2013.
ANNUAL REPORT 2012-13 21
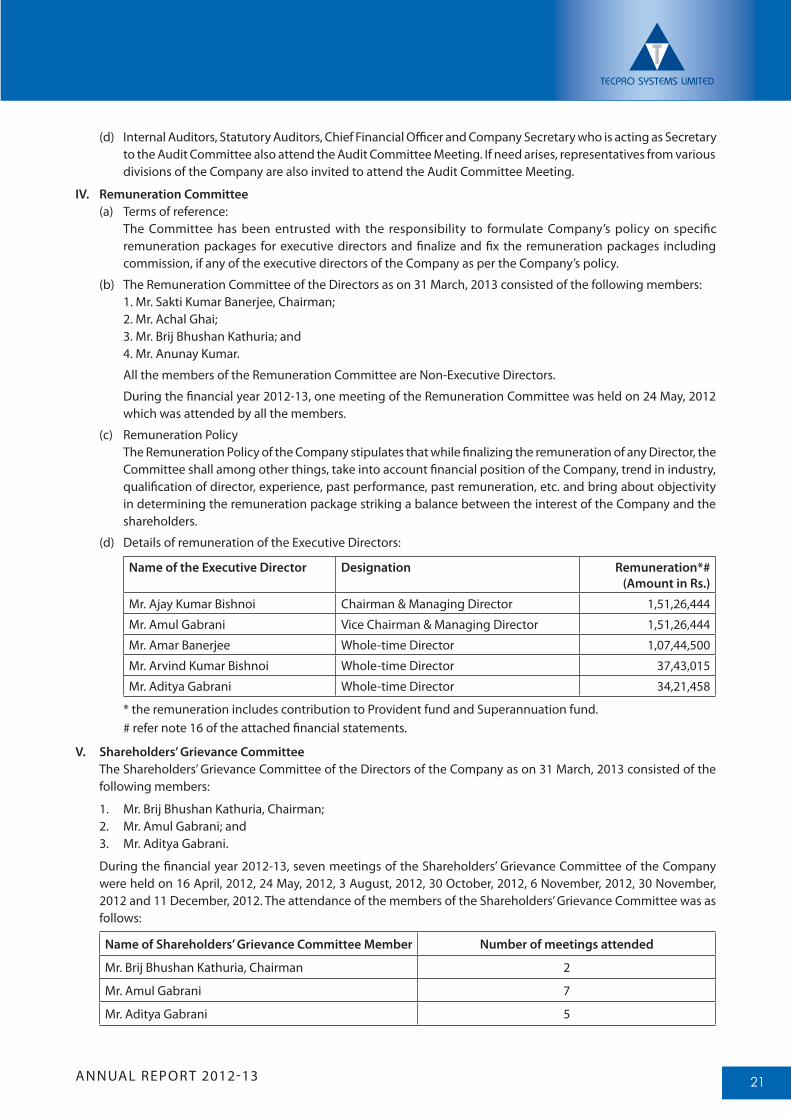
(d) Internal Auditors, Statutory Auditors, Chief Financial Officer and Company Secretary who is acting as Secretary to the Audit Committee also attend the Audit Committee Meeting. If need arises, representatives from various divisions of the Company are also invited to attend the Audit Committee Meeting.
IV. Remuneration Committee(a) Terms of reference: The Committee has been entrusted with the responsibility to formulate Company’s policy on specific
remuneration packages for executive directors and finalize and fix the remuneration packages including commission, if any of the executive directors of the Company as per the Company’s policy.
(b) The Remuneration Committee of the Directors as on 31 March, 2013 consisted of the following members: 1. Mr. Sakti Kumar Banerjee, Chairman; 2. Mr. Achal Ghai; 3. Mr. Brij Bhushan Kathuria; and 4. Mr. Anunay Kumar.
All the members of the Remuneration Committee are Non-Executive Directors.
During the financial year 2012-13, one meeting of the Remuneration Committee was held on 24 May, 2012 which was attended by all the members.
(c) Remuneration Policy The Remuneration Policy of the Company stipulates that while finalizing the remuneration of any Director, the
Committee shall among other things, take into account financial position of the Company, trend in industry, qualification of director, experience, past performance, past remuneration, etc. and bring about objectivity in determining the remuneration package striking a balance between the interest of the Company and the shareholders.
(d) Details of remuneration of the Executive Directors:
Name of the Executive Director Designation Remuneration*# (Amount in Rs.)
Mr. Ajay Kumar Bishnoi Chairman & Managing Director 1,51,26,444
Mr. Amul Gabrani Vice Chairman & Managing Director 1,51,26,444
Mr. Amar Banerjee Whole-time Director 1,07,44,500
Mr. Arvind Kumar Bishnoi Whole-time Director 37,43,015
Mr. Aditya Gabrani Whole-time Director 34,21,458
* the remuneration includes contribution to Provident fund and Superannuation fund. # refer note 16 of the attached financial statements.
V. Shareholders’ Grievance Committee The Shareholders’ Grievance Committee of the Directors of the Company as on 31 March, 2013 consisted of the
following members:
1. Mr. Brij Bhushan Kathuria, Chairman; 2. Mr. Amul Gabrani; and 3. Mr. Aditya Gabrani.
During the financial year 2012-13, seven meetings of the Shareholders’ Grievance Committee of the Company were held on 16 April, 2012, 24 May, 2012, 3 August, 2012, 30 October, 2012, 6 November, 2012, 30 November, 2012 and 11 December, 2012. The attendance of the members of the Shareholders’ Grievance Committee was as follows:
Name of Shareholders’ Grievance Committee Member Number of meetings attended
Mr. Brij Bhushan Kathuria, Chairman 2
Mr. Amul Gabrani 7
Mr. Aditya Gabrani 5
ANNUAL REPORT 2012-1322
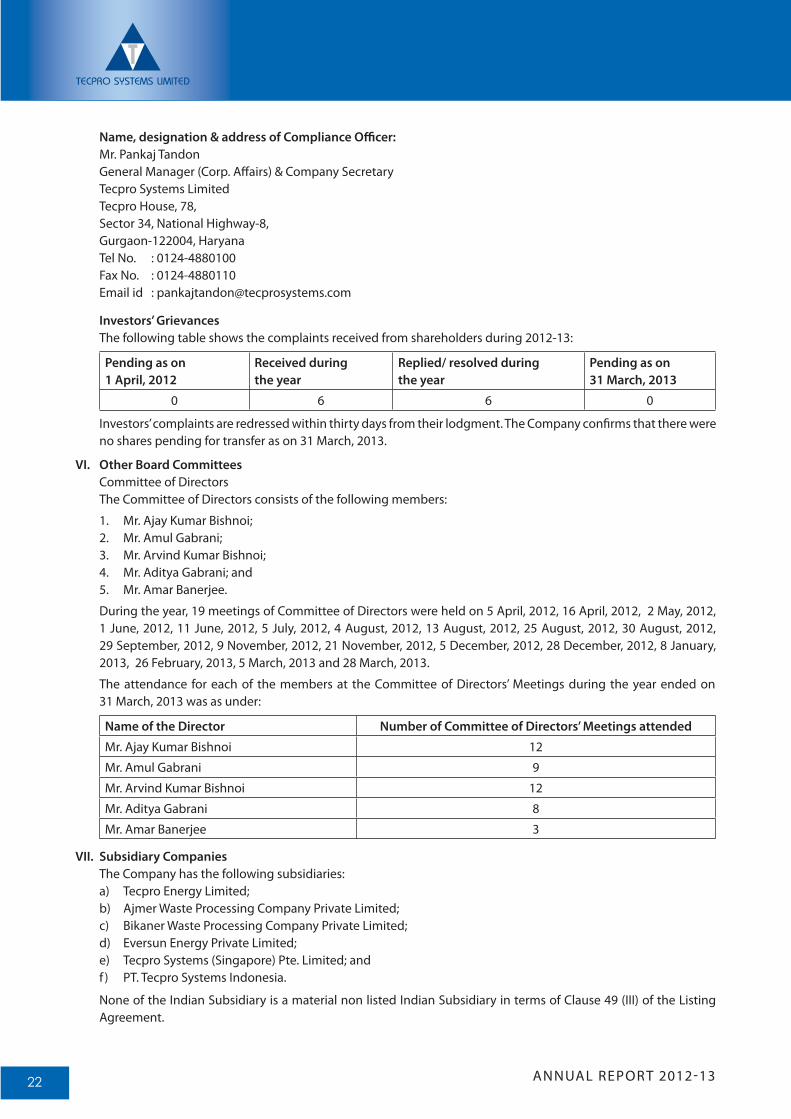
Name, designation & address of Compliance Officer: Mr. Pankaj Tandon General Manager (Corp. Affairs) & Company Secretary Tecpro Systems Limited Tecpro House, 78, Sector 34, National Highway-8, Gurgaon-122004, Haryana Tel No. : 0124-4880100 Fax No. : 0124-4880110 Email id : [email protected]
Investors’ Grievances The following table shows the complaints received from shareholders during 2012-13:
Pending as on 1 April, 2012
Received during the year
Replied/ resolved duringthe year
Pending as on 31 March, 2013
0 6 6 0
Investors’ complaints are redressed within thirty days from their lodgment. The Company confirms that there were no shares pending for transfer as on 31 March, 2013.
VI. Other Board Committees Committee of Directors The Committee of Directors consists of the following members:
1. Mr. Ajay Kumar Bishnoi; 2. Mr. Amul Gabrani; 3. Mr. Arvind Kumar Bishnoi; 4. Mr. Aditya Gabrani; and 5. Mr. Amar Banerjee.
During the year, 19 meetings of Committee of Directors were held on 5 April, 2012, 16 April, 2012, 2 May, 2012, 1 June, 2012, 11 June, 2012, 5 July, 2012, 4 August, 2012, 13 August, 2012, 25 August, 2012, 30 August, 2012, 29 September, 2012, 9 November, 2012, 21 November, 2012, 5 December, 2012, 28 December, 2012, 8 January, 2013, 26 February, 2013, 5 March, 2013 and 28 March, 2013.
The attendance for each of the members at the Committee of Directors’ Meetings during the year ended on 31 March, 2013 was as under:
Name of the Director Number of Committee of Directors’ Meetings attended
Mr. Ajay Kumar Bishnoi 12
Mr. Amul Gabrani 9
Mr. Arvind Kumar Bishnoi 12
Mr. Aditya Gabrani 8
Mr. Amar Banerjee 3
VII. Subsidiary Companies The Company has the following subsidiaries: a) Tecpro Energy Limited; b) Ajmer Waste Processing Company Private Limited; c) Bikaner Waste Processing Company Private Limited; d) Eversun Energy Private Limited;
e) Tecpro Systems (Singapore) Pte. Limited; andf) PT. Tecpro Systems Indonesia.
None of the Indian Subsidiary is a material non listed Indian Subsidiary in terms of Clause 49 (III) of the Listing Agreement.
ANNUAL REPORT 2012-13 23
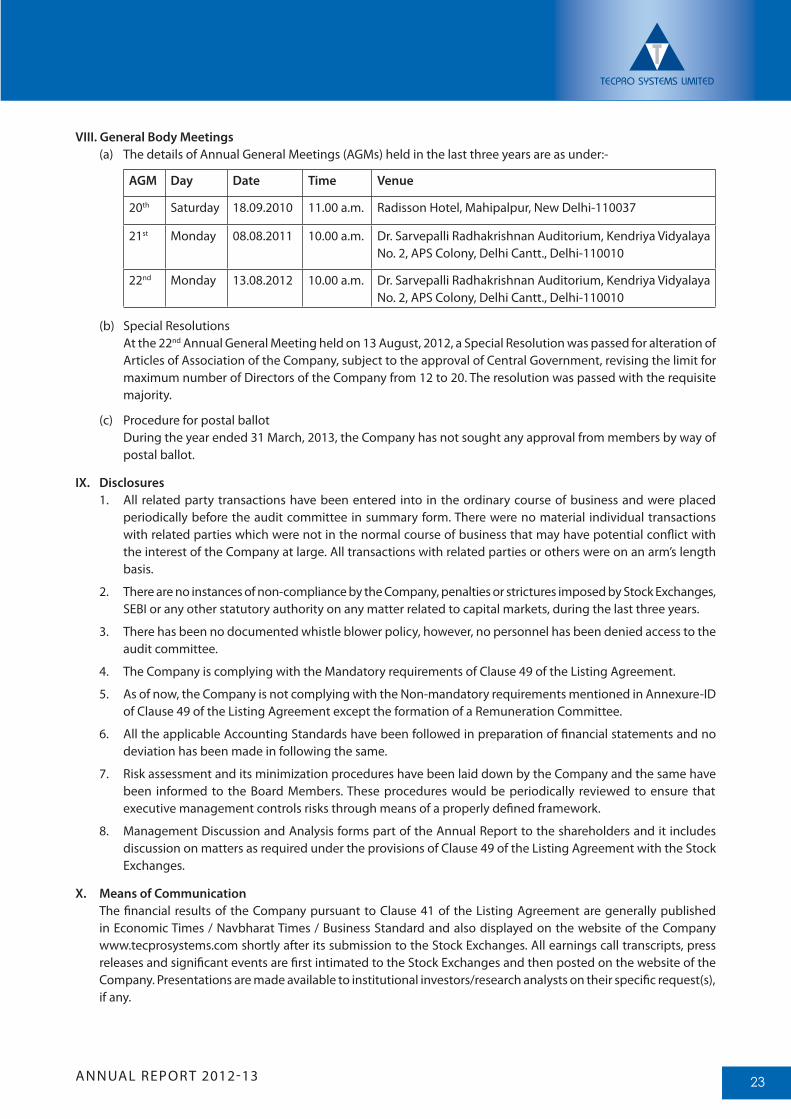
VIII. General Body Meetings(a) The details of Annual General Meetings (AGMs) held in the last three years are as under:-
AGM Day Date Time Venue
20th Saturday 18.09.2010 11.00 a.m. Radisson Hotel, Mahipalpur, New Delhi-110037
21st Monday 08.08.2011 10.00 a.m. Dr. Sarvepalli Radhakrishnan Auditorium, Kendriya Vidyalaya No. 2, APS Colony, Delhi Cantt., Delhi-110010
22nd Monday 13.08.2012 10.00 a.m. Dr. Sarvepalli Radhakrishnan Auditorium, Kendriya Vidyalaya No. 2, APS Colony, Delhi Cantt., Delhi-110010
(b) Special Resolutions At the 22nd Annual General Meeting held on 13 August, 2012, a Special Resolution was passed for alteration of
Articles of Association of the Company, subject to the approval of Central Government, revising the limit for maximum number of Directors of the Company from 12 to 20. The resolution was passed with the requisite majority.
(c) Procedure for postal ballot During the year ended 31 March, 2013, the Company has not sought any approval from members by way of
postal ballot.
IX. Disclosures1. All related party transactions have been entered into in the ordinary course of business and were placed
periodically before the audit committee in summary form. There were no material individual transactions with related parties which were not in the normal course of business that may have potential conflict with the interest of the Company at large. All transactions with related parties or others were on an arm’s length basis.
2. There are no instances of non-compliance by the Company, penalties or strictures imposed by Stock Exchanges, SEBI or any other statutory authority on any matter related to capital markets, during the last three years.
3. There has been no documented whistle blower policy, however, no personnel has been denied access to the audit committee.
4. The Company is complying with the Mandatory requirements of Clause 49 of the Listing Agreement.
5. As of now, the Company is not complying with the Non-mandatory requirements mentioned in Annexure-ID of Clause 49 of the Listing Agreement except the formation of a Remuneration Committee.
6. All the applicable Accounting Standards have been followed in preparation of financial statements and no deviation has been made in following the same.
7. Risk assessment and its minimization procedures have been laid down by the Company and the same have been informed to the Board Members. These procedures would be periodically reviewed to ensure that executive management controls risks through means of a properly defined framework.
8. Management Discussion and Analysis forms part of the Annual Report to the shareholders and it includes discussion on matters as required under the provisions of Clause 49 of the Listing Agreement with the Stock Exchanges.
X. Means of Communication The financial results of the Company pursuant to Clause 41 of the Listing Agreement are generally published
in Economic Times / Navbharat Times / Business Standard and also displayed on the website of the Company www.tecprosystems.com shortly after its submission to the Stock Exchanges. All earnings call transcripts, press releases and significant events are first intimated to the Stock Exchanges and then posted on the website of the Company. Presentations are made available to institutional investors/research analysts on their specific request(s), if any.
ANNUAL REPORT 2012-1324
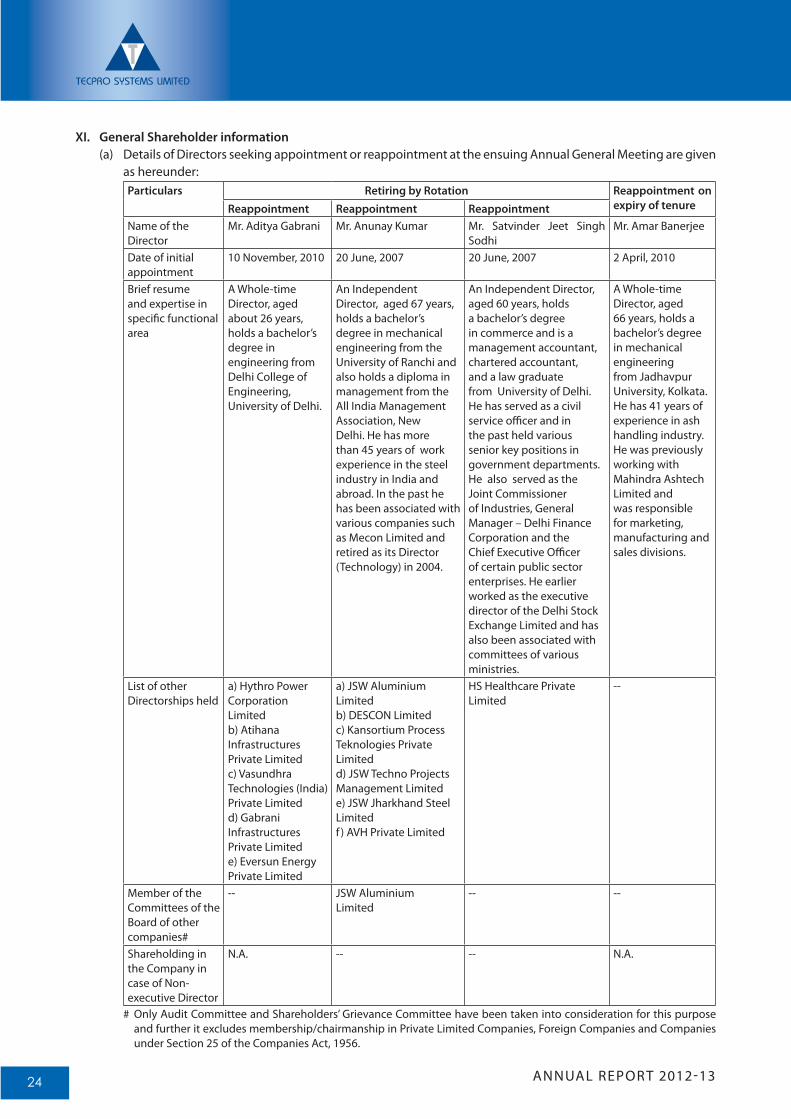
XI. General Shareholder information(a) Details of Directors seeking appointment or reappointment at the ensuing Annual General Meeting are given
as hereunder:Particulars Retiring by Rotation Reappointment on
expiry of tenureReappointment Reappointment ReappointmentName of theDirector
Mr. Aditya Gabrani Mr. Anunay Kumar Mr. Satvinder Jeet Singh Sodhi
Mr. Amar Banerjee
Date of initial appointment
10 November, 2010 20 June, 2007 20 June, 2007 2 April, 2010
Brief resume and expertise in specific functional area
A Whole-time Director, aged about 26 years, holds a bachelor’s degree in engineering from Delhi College of Engineering, University of Delhi.
An Independent Director, aged 67 years, holds a bachelor’s degree in mechanical engineering from the University of Ranchi and also holds a diploma in management from the All India Management Association, New Delhi. He has more than 45 years of work experience in the steel industry in India and abroad. In the past he has been associated with various companies such as Mecon Limited and retired as its Director (Technology) in 2004.
An Independent Director, aged 60 years, holds a bachelor’s degree in commerce and is a management accountant, chartered accountant, and a law graduate from University of Delhi. He has served as a civil service officer and in the past held various senior key positions in government departments. He also served as the Joint Commissioner of Industries, General Manager – Delhi Finance Corporation and the Chief Executive Officer of certain public sector enterprises. He earlier worked as the executive director of the Delhi Stock Exchange Limited and has also been associated with committees of various ministries.
A Whole-time Director, aged 66 years, holds a bachelor’s degree in mechanical engineering from Jadhavpur University, Kolkata. He has 41 years of experience in ash handling industry. He was previously working with Mahindra Ashtech Limited and was responsible for marketing, manufacturing and sales divisions.
List of other Directorships held
a) Hythro Power Corporation Limited b) Atihana Infrastructures Private Limited c) Vasundhra Technologies (India) Private Limited d) Gabrani Infrastructures Private Limitede) Eversun Energy Private Limited
a) JSW Aluminium Limitedb) DESCON Limitedc) Kansortium Process Teknologies Private Limitedd) JSW Techno Projects Management Limitede) JSW Jharkhand Steel Limitedf ) AVH Private Limited
HS Healthcare Private Limited
--
Member of the Committees of the Board of other companies#
-- JSW Aluminium Limited
-- --
Shareholding in the Company in case of Non-executive Director
N.A. -- -- N.A.
# Only Audit Committee and Shareholders’ Grievance Committee have been taken into consideration for this purpose and further it excludes membership/chairmanship in Private Limited Companies, Foreign Companies and Companies under Section 25 of the Companies Act, 1956.
ANNUAL REPORT 2012-13 25
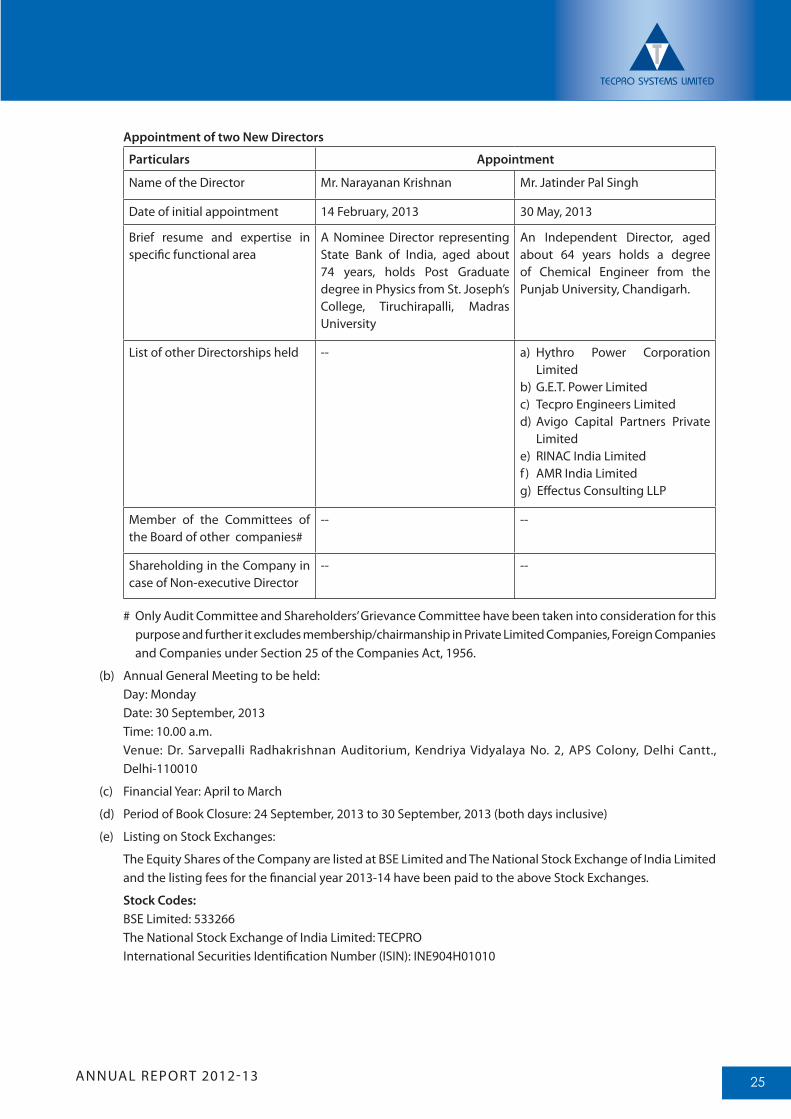
Appointment of two New Directors
Particulars Appointment
Name of the Director Mr. Narayanan Krishnan Mr. Jatinder Pal Singh
Date of initial appointment 14 February, 2013 30 May, 2013
Brief resume and expertise in specific functional area
A Nominee Director representing State Bank of India, aged about 74 years, holds Post Graduate degree in Physics from St. Joseph’s College, Tiruchirapalli, Madras University
An Independent Director, aged about 64 years holds a degree of Chemical Engineer from the Punjab University, Chandigarh.
List of other Directorships held -- a) Hythro Power Corporation Limited
b) G.E.T. Power Limitedc) Tecpro Engineers Limitedd) Avigo Capital Partners Private
Limitede) RINAC India Limitedf ) AMR India Limitedg) Effectus Consulting LLP
Member of the Committees of the Board of other companies#
-- --
Shareholding in the Company in case of Non-executive Director
-- --
# Only Audit Committee and Shareholders’ Grievance Committee have been taken into consideration for this purpose and further it excludes membership/chairmanship in Private Limited Companies, Foreign Companies and Companies under Section 25 of the Companies Act, 1956.
(b) Annual General Meeting to be held: Day: Monday Date: 30 September, 2013 Time: 10.00 a.m. Venue: Dr. Sarvepalli Radhakrishnan Auditorium, Kendriya Vidyalaya No. 2, APS Colony, Delhi Cantt.,
Delhi-110010
(c) Financial Year: April to March
(d) Period of Book Closure: 24 September, 2013 to 30 September, 2013 (both days inclusive)
(e) Listing on Stock Exchanges:
The Equity Shares of the Company are listed at BSE Limited and The National Stock Exchange of India Limited and the listing fees for the financial year 2013-14 have been paid to the above Stock Exchanges.
Stock Codes: BSE Limited: 533266 The National Stock Exchange of India Limited: TECPRO International Securities Identification Number (ISIN): INE904H01010
ANNUAL REPORT 2012-1326
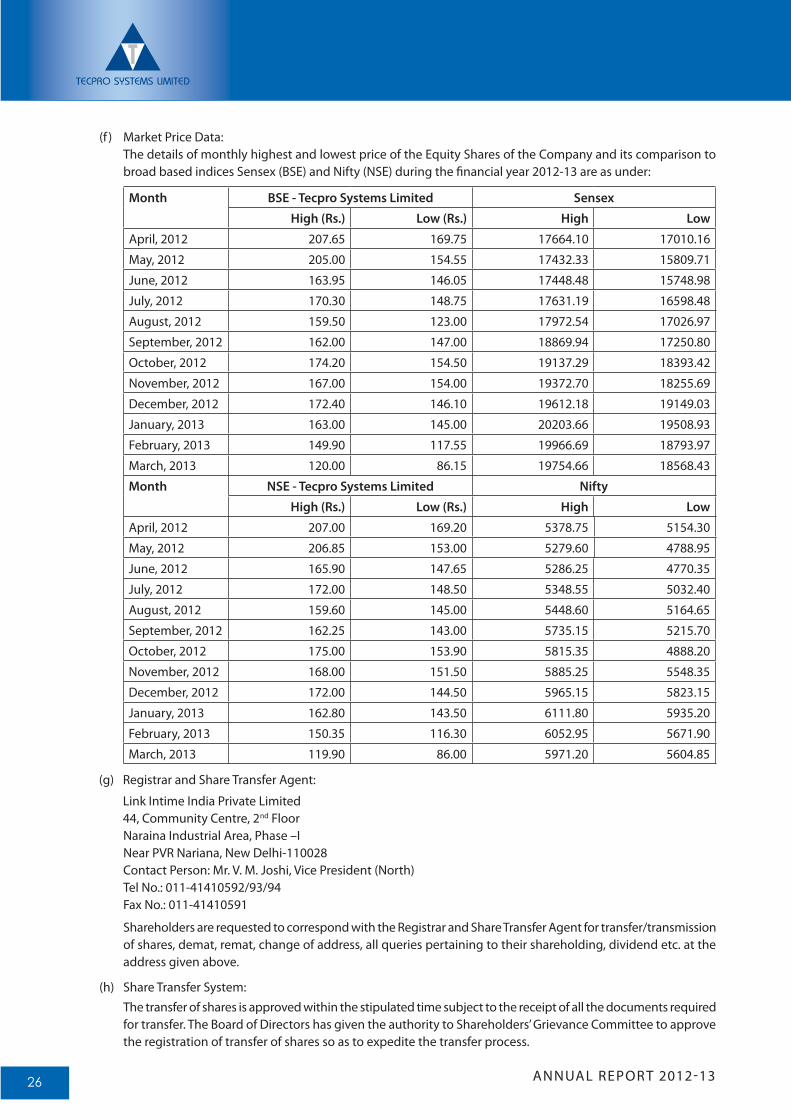
(f ) Market Price Data: The details of monthly highest and lowest price of the Equity Shares of the Company and its comparison to
broad based indices Sensex (BSE) and Nifty (NSE) during the financial year 2012-13 are as under:
Month BSE - Tecpro Systems Limited Sensex
High (Rs.) Low (Rs.) High Low
April, 2012 207.65 169.75 17664.10 17010.16
May, 2012 205.00 154.55 17432.33 15809.71
June, 2012 163.95 146.05 17448.48 15748.98
July, 2012 170.30 148.75 17631.19 16598.48
August, 2012 159.50 123.00 17972.54 17026.97
September, 2012 162.00 147.00 18869.94 17250.80
October, 2012 174.20 154.50 19137.29 18393.42
November, 2012 167.00 154.00 19372.70 18255.69
December, 2012 172.40 146.10 19612.18 19149.03
January, 2013 163.00 145.00 20203.66 19508.93
February, 2013 149.90 117.55 19966.69 18793.97
March, 2013 120.00 86.15 19754.66 18568.43
Month NSE - Tecpro Systems Limited Nifty
High (Rs.) Low (Rs.) High Low
April, 2012 207.00 169.20 5378.75 5154.30
May, 2012 206.85 153.00 5279.60 4788.95
June, 2012 165.90 147.65 5286.25 4770.35
July, 2012 172.00 148.50 5348.55 5032.40
August, 2012 159.60 145.00 5448.60 5164.65
September, 2012 162.25 143.00 5735.15 5215.70
October, 2012 175.00 153.90 5815.35 4888.20
November, 2012 168.00 151.50 5885.25 5548.35
December, 2012 172.00 144.50 5965.15 5823.15
January, 2013 162.80 143.50 6111.80 5935.20
February, 2013 150.35 116.30 6052.95 5671.90
March, 2013 119.90 86.00 5971.20 5604.85
(g) Registrar and Share Transfer Agent:
Link Intime India Private Limited 44, Community Centre, 2nd Floor Naraina Industrial Area, Phase –I Near PVR Nariana, New Delhi-110028 Contact Person: Mr. V. M. Joshi, Vice President (North) Tel No.: 011-41410592/93/94 Fax No.: 011-41410591
Shareholders are requested to correspond with the Registrar and Share Transfer Agent for transfer/transmission of shares, demat, remat, change of address, all queries pertaining to their shareholding, dividend etc. at the address given above.
(h) Share Transfer System: The transfer of shares is approved within the stipulated time subject to the receipt of all the documents required
for transfer. The Board of Directors has given the authority to Shareholders’ Grievance Committee to approve the registration of transfer of shares so as to expedite the transfer process.
ANNUAL REPORT 2012-13 27
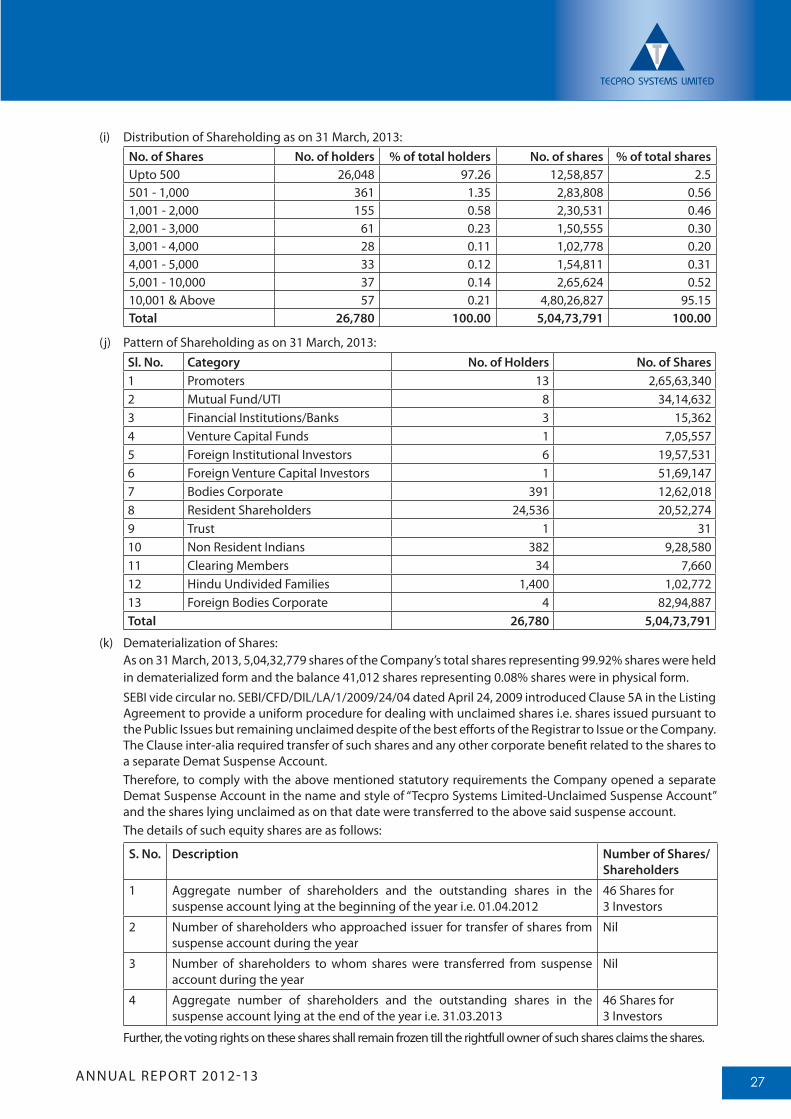
(i) Distribution of Shareholding as on 31 March, 2013:No. of Shares No. of holders % of total holders No. of shares % of total sharesUpto 500 26,048 97.26 12,58,857 2.5501 - 1,000 361 1.35 2,83,808 0.561,001 - 2,000 155 0.58 2,30,531 0.462,001 - 3,000 61 0.23 1,50,555 0.303,001 - 4,000 28 0.11 1,02,778 0.204,001 - 5,000 33 0.12 1,54,811 0.315,001 - 10,000 37 0.14 2,65,624 0.5210,001 & Above 57 0.21 4,80,26,827 95.15Total 26,780 100.00 5,04,73,791 100.00
(j) Pattern of Shareholding as on 31 March, 2013:Sl. No. Category No. of Holders No. of Shares1 Promoters 13 2,65,63,3402 Mutual Fund/UTI 8 34,14,6323 Financial Institutions/Banks 3 15,3624 Venture Capital Funds 1 7,05,5575 Foreign Institutional Investors 6 19,57,5316 Foreign Venture Capital Investors 1 51,69,1477 Bodies Corporate 391 12,62,0188 Resident Shareholders 24,536 20,52,2749 Trust 1 3110 Non Resident Indians 382 9,28,58011 Clearing Members 34 7,66012 Hindu Undivided Families 1,400 1,02,77213 Foreign Bodies Corporate 4 82,94,887Total 26,780 5,04,73,791
(k) Dematerialization of Shares: As on 31 March, 2013, 5,04,32,779 shares of the Company’s total shares representing 99.92% shares were held
in dematerialized form and the balance 41,012 shares representing 0.08% shares were in physical form. SEBI vide circular no. SEBI/CFD/DIL/LA/1/2009/24/04 dated April 24, 2009 introduced Clause 5A in the Listing
Agreement to provide a uniform procedure for dealing with unclaimed shares i.e. shares issued pursuant to the Public Issues but remaining unclaimed despite of the best efforts of the Registrar to Issue or the Company. The Clause inter-alia required transfer of such shares and any other corporate benefit related to the shares to a separate Demat Suspense Account.
Therefore, to comply with the above mentioned statutory requirements the Company opened a separate Demat Suspense Account in the name and style of “Tecpro Systems Limited-Unclaimed Suspense Account” and the shares lying unclaimed as on that date were transferred to the above said suspense account.
The details of such equity shares are as follows:
S. No. Description Number of Shares/Shareholders
1 Aggregate number of shareholders and the outstanding shares in the suspense account lying at the beginning of the year i.e. 01.04.2012
46 Shares for 3 Investors
2 Number of shareholders who approached issuer for transfer of shares from suspense account during the year
Nil
3 Number of shareholders to whom shares were transferred from suspense account during the year
Nil
4 Aggregate number of shareholders and the outstanding shares in the suspense account lying at the end of the year i.e. 31.03.2013
46 Shares for 3 Investors
Further, the voting rights on these shares shall remain frozen till the rightfull owner of such shares claims the shares.
ANNUAL REPORT 2012-1328
(l) Plant Locations: The Company has its manufacturing units at the following locations: 1. Plot No. 2, 3, 4, 25, 26 and 27, Sector-7, HSIDC Growth Center, Bawal, Haryana; 2. SP-496-497, RIICO, Bhiwadi, Rajasthan; 3. E-928, RIICO Industrial Area, Bhiwadi, Rajasthan; and 4. A-98, RIICO Industrial Area, Bhiwadi, Rajasthan. The Company has set up one more manufacturing facility at 203 & 203(A), Matsya Industrial Area, Alwar,
Rajasthan at which commercial operations are yet to begin. Besides the manufacturing activities at the above locations, the Company’s project execution activities are undertaken at the location of the clients.
(m) Address of Correspondence: Registered Office: 106, Vishwadeep Tower, Plot No. 4, District Centre, Janakpuri, New Delhi-110058 Corporate Office: Tecpro House, 78, Sector 34, National Highway – 8, Gurgaon-122004, Haryana
XII. CEO/CFO Certification Mr. Ajay Kumar Bishnoi, Chairman & Managing Director and Mr. Kulbhushan Arora, Chief Financial Officer have
certified to the Board that:
(a) They have reviewed financial statements and the cash flow statement for the year and that to the best of their knowledge and belief:
(i) these statements do not contain any materially untrue statement or omit any material fact or contain statements that might be misleading; and
(ii) these statements together present a true and fair view of the company’s affairs and are in compliance with existing accounting standards, applicable laws and regulations.
(b) There are, to the best of their knowledge and belief, no transactions entered into by the Company during the year which are fraudulent, illegal or violative of the Company’s code of conduct.
(c) They accept responsibility for establishing and maintaining internal controls for financial reporting and that they have evaluated the effectiveness of the internal control systems of the Company pertaining to financial reporting and have not come across any deficiencies in the design or operation of such internal control systems for the financial year ended 31 March, 2013.
(d) They have indicated to the auditors and the Audit Committee that there had not been :
(i) any significant changes in internal control over financial reporting during the financial year ended 31 March, 2013;
(ii) any significant changes in accounting policies during the financial year ended 31 March, 2013; and
(iii) any instances of significant fraud of which they have become aware and the involvement therein, if any, of the management or an employee having a significant role in the Company’s internal control system over financial reporting.
A certificate with respect to the above was placed before the Board Meeting on 30 May, 2013.
Compliance CertificateCompliance Certificate for Corporate Governance from Auditors of the Company is given as Annexure to this report.
DECLARATION BY CEO UNDER CLAUSE 49(1)(D)(ii) OF THE LISTING AGREEMENTI hereby confirm that all Board Members and Senior Management Personnel have affirmed compliance with the Code of Conduct for Directors and Senior Management, as approved by the Board, for the year ended 31 March, 2013.
Sd/-Place : Chennai Ajay Kumar BishnoiDate : 30 May, 2013 Chairman & Managing Director
ANNUAL REPORT 2012-13 29
AUDITOR’S CERTIFICATE ON COMPLIANCE WITH THE CONDITIONS OF CORPORATE GOVERNANCE UNDER CLAUSE 49 OF THE LISTING AGREEMENT
To the Members ofTecpro Systems Limited
We have examined the compliance of conditions of Corporate Governance by Tecpro Systems Limited (“the Company”) for the year ended 31 March, 2013 as stipulated in Clause 49 of the Listing Agreement of the Company with Stock Exchanges in India.
The compliance of conditions of Corporate Governance is the responsibility of the management. Our examination was limited to procedures and implementation thereof, adopted by the Company for ensuring the compliance of the conditions of Corporate Governance. It is neither an audit nor an expression of opinion on the financial statements of the Company.
In our opinion and to the best of our information and according to the explanations given to us, we certify that the Company has complied with the conditions of Corporate Governance as stipulated in the above mentioned Listing Agreement.
We state that such compliance is neither an assurance as to future viability of the Company nor efficiency or effectiveness with which the management has conducted the affairs of the Company.
For B S R & Co.Chartered Accountants
Firm Registration No.: 101248W
Sd/-Jiten Chopra
Place : Gurgaon PartnerDate : 14 August, 2013 Membership No. 092894
ANNUAL REPORT 2012-1330
Independent Auditors’ Report To the Members ofTecpro Systems Limited
1. Report on the Financial Statements We have audited the accompanying financial
statements of Tecpro Systems Limited (“the Company”), which comprise the Balance Sheet as at 31 March 2013 and the Statement of Profit and Loss and the Cash Flow Statement for the year then ended, and a summary of significant accounting policies and other explanatory information.
2. Management’s Responsibility for the Financial Statements
Management is responsible for the preparation of these financial statements that give a true and fair view of the financial position, financial performance and cash flows of the Company in accordance with the Accounting Standards referred to in sub-section (3C) of section 211 of the Companies Act, 1956 (“the Act”). This responsibility includes the design, implementation and maintenance of internal controls relevant to the preparation and presentation of the financial statements that give a true and fair view and are free from material misstatement, whether due to fraud or error.
3. Auditors’ Responsibility Our responsibility is to express an opinion on
these financial statements based on our audit. We conducted our audit in accordance with the Standards on Auditing issued by the Institute of Chartered Accountants of India. Those Standards require that we comply with ethical requirements and plan and perform the audit to obtain reasonable assurance about whether the financial statements are free from material misstatement.
An audit involves performing procedures to obtain audit evidence about the amounts and disclosures in the financial statements. The procedures selected depend on the auditor’s judgment, including the assessment of the risks of material misstatement of the financial statements, whether due to fraud or error. In making those risk assessments, the auditor considers internal controls relevant to the Company’s preparation and fair presentation of the financial statements in order to design audit procedures that are appropriate in the circumstances. An audit also includes evaluating the appropriateness of accounting policies used and the reasonableness of the accounting estimates made by management, as well as evaluating the overall presentation of the financial statements.
We believe that the audit evidence we have obtained is sufficient and appropriate to provide a basis for our audit opinion.
4. Opinion In our opinion and to the best of our information
and according to the explanations given to us, the financial statements give the information required by the Act in the manner so required and give a true and fair view in conformity with the accounting principles generally accepted in India: (a) in the case of the Balance Sheet, of the state of
affairs of the Company as at 31 March 2013; (b) in the case of the Statement of Profit and Loss, of
the profit for the year ended on that date; and (c) in the case of the Cash Flow Statement, of the
cash flows for the year ended on that date.
5. Report on Other Legal and Regulatory Requirements (i) As required by the Companies (Auditor’s Report)
Order, 2003 (“the Order”), issued by the Central Government of India in terms of sub-section (4A) of section 227 of the Act, we give in the Annexure a statement on the matters specified in paragraphs 4 and 5 of the Order.
(ii) As required by section 227(3) of the Act, we report that:a. we have obtained all the information and
explanations which to the best of our knowledge and belief were necessary for the purpose of our audit;
b. in our opinion proper books of account as required by law have been kept by the Company so far as appears from our examination of those books;
c. the Balance Sheet, Statement of Profit and Loss and Cash Flow Statement dealt with by this report are in agreement with the books of account;
d. in our opinion, the Balance Sheet, Statement of Profit and Loss and Cash Flow Statement comply with the Accounting Standards referred to in sub section (3C) of section 211 of the Companies Act, 1956; and
e. on the basis of written representations received from the directors as on 31 March 2013, and taken on record by the Board of Directors, none of the directors is disqualified as on 31 March 2013 from being appointed as a director in terms of clause (g) of sub-section (1) of section 274 of the Companies Act, 1956.
For B S R & Co. Chartered Accountants
Firm registration number: 101248W
Sd/-Jiten Chopra
Place: Gurgaon PartnerDate: 30 May 2013 Membership No.: 092894
ANNUAL REPORT 2012-13 31
Annexure referred to in paragraph 5 of the Independent Auditors’ Report to the Members of Tecpro Systems Limited on the accounts for the year ended 31 March, 2013.(i) (a) The Company has maintained proper records
showing full particulars, including quantitative details and situation of its fixed assets.
(b) According to the information and explanations given to us, the Company has physically verified its fixed assets during the year. In our opinion, this periodicity of physical verification is reasonable having regard to the size of the Company and the nature of its assets. As informed to us no material discrepancies were noticed on such verification.
(c) The fixed assets disposed off during the year were not substantial, and therefore, do not affect the going concern assumption.
(ii) (a) Inventories, except goods-in-transit and stocks lying with third parties, have been physically verified by the management during the year. In our opinion, the frequency of such verification is reasonable. For stocks lying with third parties, confirmations have been obtained.
(b) In our opinion, the procedures for the physical verification of inventories and of seeking confirmation for stocks lying with third parties and project sites followed by the management are reasonable and adequate in relation to the size of the Company and the nature of its business.
(c) In our opinion, the Company is maintaining proper records of inventory. As informed to us, the discrepancies noticed on verification between the physical stocks and the book records were not material and have been properly dealt with in the books of accounts.
(iii) According to the information and explanations given to us, the Company has neither granted nor taken any loans, secured or unsecured, to or from companies, firms or other parties covered in the register maintained under section 301 of the Companies Act, 1956. Accordingly, paras 4 (iii) (b) to (g) of the Order are not applicable.
(iv) In our opinion and according to the information and explanations given to us and having regard to the explanation that purchases of certain items of inventories and fixed assets are for the Company’s specialised requirements and similarly goods sold and services rendered are for the specialised requirements of the buyers and suitable alternative sources are not available to obtain comparable quotations, there is an adequate internal control system commensurate with the size of the Company and the nature of its business with regard to purchase of inventories and fixed assets and with regard to the sale of goods and services. Further, on the basis of our examination and according to the
information and explanations given to us, we have neither come across nor have been informed of any instances of major weaknesses in the aforesaid internal control system.
(v) (a) In our opinion and according to the information and explanations given to us, the particulars of contracts or arrangements referred to in section 301 of the Companies Act, 1956 have been entered in the register required to be maintained under that section.
(b) In our opinion, and according to the information and explanations given to us, the transactions made in pursuance of contracts and arrangements referred to in (a) above and exceeding the value of Rs. 5 lakh with any party during the year have been made at prices which are reasonable having regard to the prevailing market prices at the relevant time except for (i) sale of certain goods which are for the specialised requirements of the buyer and for which suitable alternative sources are not available to obtain comparable quotations and (ii) purchases of certain goods and services which are for the specialised requirements of the Company and for which suitable alternative sources are not available to obtain comparable quotations. However, on the basis of information and explanations provided, the same appear reasonable.
(vi) The Company has not accepted any deposits from the public during the year.
(vii) In our opinion, the Company has an internal audit system commensurate with the size and nature of its business.
(viii) We have broadly reviewed the books of account maintained by the Company in respect of products where, pursuant to the rules made by the Central Government, the maintenance of cost records has been prescribed under section 209(1)(d) of the Companies Act, 1956 and are of the opinion that, prima facie, the prescribed accounts and records have been made and maintained. However, we have not made a detailed examination of such records with a view to determine whether they are accurate or complete.
(ix) (a) According to the information and explanations given to us and on the basis of our examination of the records of the Company, amounts deducted / accrued in the books of account in respect of undisputed statutory dues including Provident Fund, Employees’ State Insurance, Income-tax, Sales tax, Wealth tax, Service tax, Customs duty, Excise duty, Cess and other material statutory dues have generally been regularly deposited during the year by the Company with the appropriate authorities, however, there were delays in depositing undisputed service tax dues, provident fund dues, employees’ state insurance dues and income tax dues during the year. As
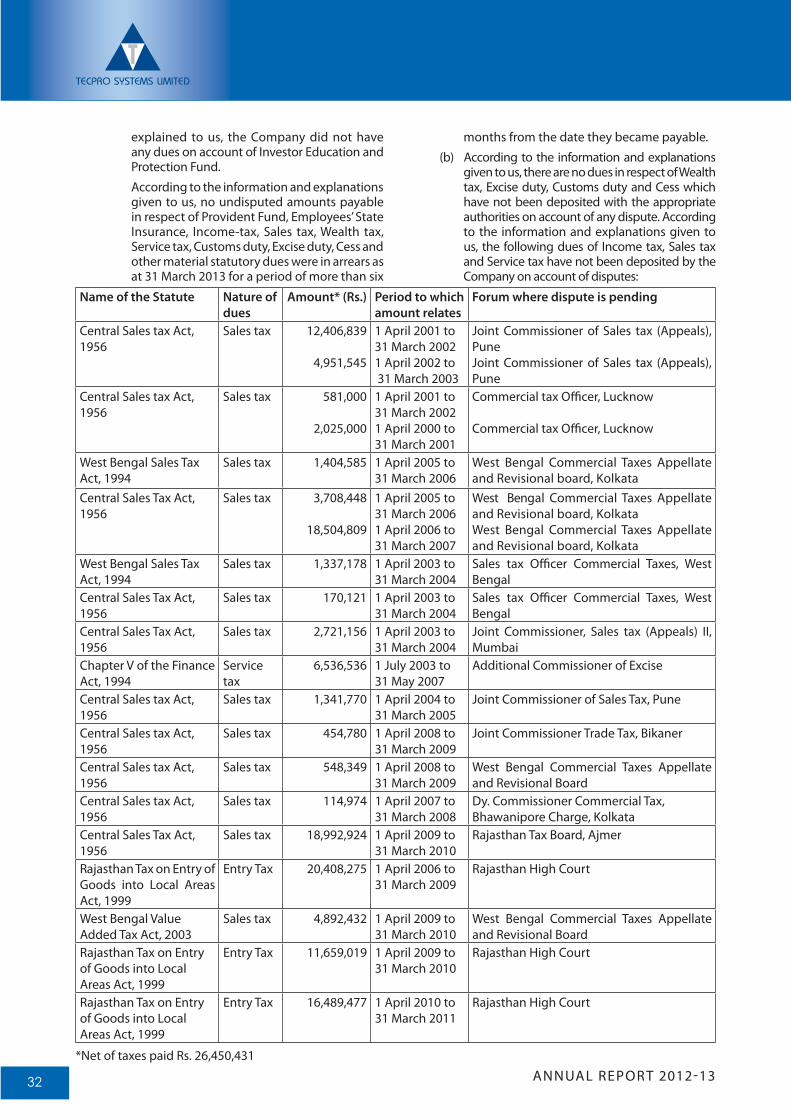
ANNUAL REPORT 2012-1332
explained to us, the Company did not have any dues on account of Investor Education and Protection Fund.
According to the information and explanations given to us, no undisputed amounts payable in respect of Provident Fund, Employees’ State Insurance, Income-tax, Sales tax, Wealth tax, Service tax, Customs duty, Excise duty, Cess and other material statutory dues were in arrears as at 31 March 2013 for a period of more than six
months from the date they became payable.
(b) According to the information and explanations given to us, there are no dues in respect of Wealth tax, Excise duty, Customs duty and Cess which have not been deposited with the appropriate authorities on account of any dispute. According to the information and explanations given to us, the following dues of Income tax, Sales tax and Service tax have not been deposited by the Company on account of disputes:
Name of the Statute Nature of dues
Amount* (Rs.) Period to which amount relates
Forum where dispute is pending
Central Sales tax Act, 1956
Sales tax 12,406,839
4,951,545
1 April 2001 to 31 March 20021 April 2002 to 31 March 2003
Joint Commissioner of Sales tax (Appeals), PuneJoint Commissioner of Sales tax (Appeals), Pune
Central Sales tax Act, 1956
Sales tax 581,000
2,025,000
1 April 2001 to 31 March 20021 April 2000 to 31 March 2001
Commercial tax Officer, Lucknow
Commercial tax Officer, Lucknow
West Bengal Sales Tax Act, 1994
Sales tax 1,404,585 1 April 2005 to 31 March 2006
West Bengal Commercial Taxes Appellate and Revisional board, Kolkata
Central Sales Tax Act, 1956
Sales tax 3,708,448
18,504,809
1 April 2005 to 31 March 20061 April 2006 to 31 March 2007
West Bengal Commercial Taxes Appellate and Revisional board, KolkataWest Bengal Commercial Taxes Appellate and Revisional board, Kolkata
West Bengal Sales Tax Act, 1994
Sales tax 1,337,178 1 April 2003 to 31 March 2004
Sales tax Officer Commercial Taxes, West Bengal
Central Sales Tax Act, 1956
Sales tax 170,121 1 April 2003 to 31 March 2004
Sales tax Officer Commercial Taxes, West Bengal
Central Sales Tax Act, 1956
Sales tax 2,721,156 1 April 2003 to 31 March 2004
Joint Commissioner, Sales tax (Appeals) II, Mumbai
Chapter V of the Finance Act, 1994
Service tax
6,536,536 1 July 2003 to 31 May 2007
Additional Commissioner of Excise
Central Sales tax Act, 1956
Sales tax 1,341,770 1 April 2004 to 31 March 2005
Joint Commissioner of Sales Tax, Pune
Central Sales tax Act, 1956
Sales tax 454,780 1 April 2008 to 31 March 2009
Joint Commissioner Trade Tax, Bikaner
Central Sales tax Act, 1956
Sales tax 548,349 1 April 2008 to 31 March 2009
West Bengal Commercial Taxes Appellate and Revisional Board
Central Sales tax Act, 1956
Sales tax 114,974 1 April 2007 to 31 March 2008
Dy. Commissioner Commercial Tax, Bhawanipore Charge, Kolkata
Central Sales Tax Act, 1956
Sales tax 18,992,924 1 April 2009 to 31 March 2010
Rajasthan Tax Board, Ajmer
Rajasthan Tax on Entry of Goods into Local Areas Act, 1999
Entry Tax 20,408,275 1 April 2006 to31 March 2009
Rajasthan High Court
West Bengal Value Added Tax Act, 2003
Sales tax 4,892,432 1 April 2009 to 31 March 2010
West Bengal Commercial Taxes Appellate and Revisional Board
Rajasthan Tax on Entry of Goods into Local Areas Act, 1999
Entry Tax 11,659,019 1 April 2009 to 31 March 2010
Rajasthan High Court
Rajasthan Tax on Entry of Goods into Local Areas Act, 1999
Entry Tax 16,489,477 1 April 2010 to 31 March 2011
Rajasthan High Court
*Net of taxes paid Rs. 26,450,431
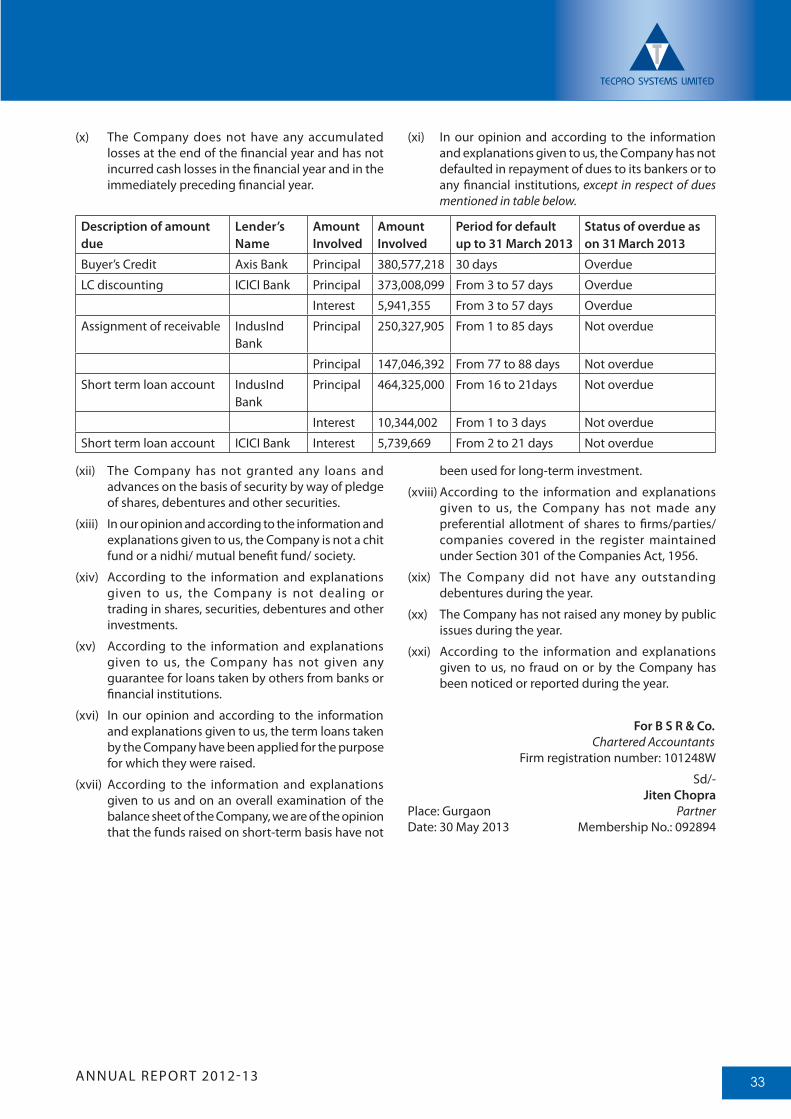
ANNUAL REPORT 2012-13 33
(x) The Company does not have any accumulated losses at the end of the financial year and has not incurred cash losses in the financial year and in the immediately preceding financial year.
(xii) The Company has not granted any loans and advances on the basis of security by way of pledge of shares, debentures and other securities.
(xiii) In our opinion and according to the information and explanations given to us, the Company is not a chit fund or a nidhi/ mutual benefit fund/ society.
(xiv) According to the information and explanations given to us, the Company is not dealing or trading in shares, securities, debentures and other investments.
(xv) According to the information and explanations given to us, the Company has not given any guarantee for loans taken by others from banks or financial institutions.
(xvi) In our opinion and according to the information and explanations given to us, the term loans taken by the Company have been applied for the purpose for which they were raised.
(xvii) According to the information and explanations given to us and on an overall examination of the balance sheet of the Company, we are of the opinion that the funds raised on short-term basis have not
(xi) In our opinion and according to the information and explanations given to us, the Company has not defaulted in repayment of dues to its bankers or to any financial institutions, except in respect of dues mentioned in table below.
Description of amount due
Lender’s Name
Amount Involved
Amount Involved
Period for default up to 31 March 2013
Status of overdue as on 31 March 2013
Buyer’s Credit Axis Bank Principal 380,577,218 30 days Overdue
LC discounting ICICI Bank Principal 373,008,099 From 3 to 57 days Overdue
Interest 5,941,355 From 3 to 57 days Overdue
Assignment of receivable IndusInd Bank
Principal 250,327,905 From 1 to 85 days Not overdue
Principal 147,046,392 From 77 to 88 days Not overdue
Short term loan account IndusInd Bank
Principal 464,325,000 From 16 to 21days Not overdue
Interest 10,344,002 From 1 to 3 days Not overdue
Short term loan account ICICI Bank Interest 5,739,669 From 2 to 21 days Not overdue
been used for long-term investment.
(xviii) According to the information and explanations given to us, the Company has not made any preferential allotment of shares to firms/parties/companies covered in the register maintained under Section 301 of the Companies Act, 1956.
(xix) The Company did not have any outstanding debentures during the year.
(xx) The Company has not raised any money by public issues during the year.
(xxi) According to the information and explanations given to us, no fraud on or by the Company has been noticed or reported during the year.
For B S R & Co. Chartered Accountants
Firm registration number: 101248W
Sd/-Jiten Chopra
Place: Gurgaon PartnerDate: 30 May 2013 Membership No.: 092894
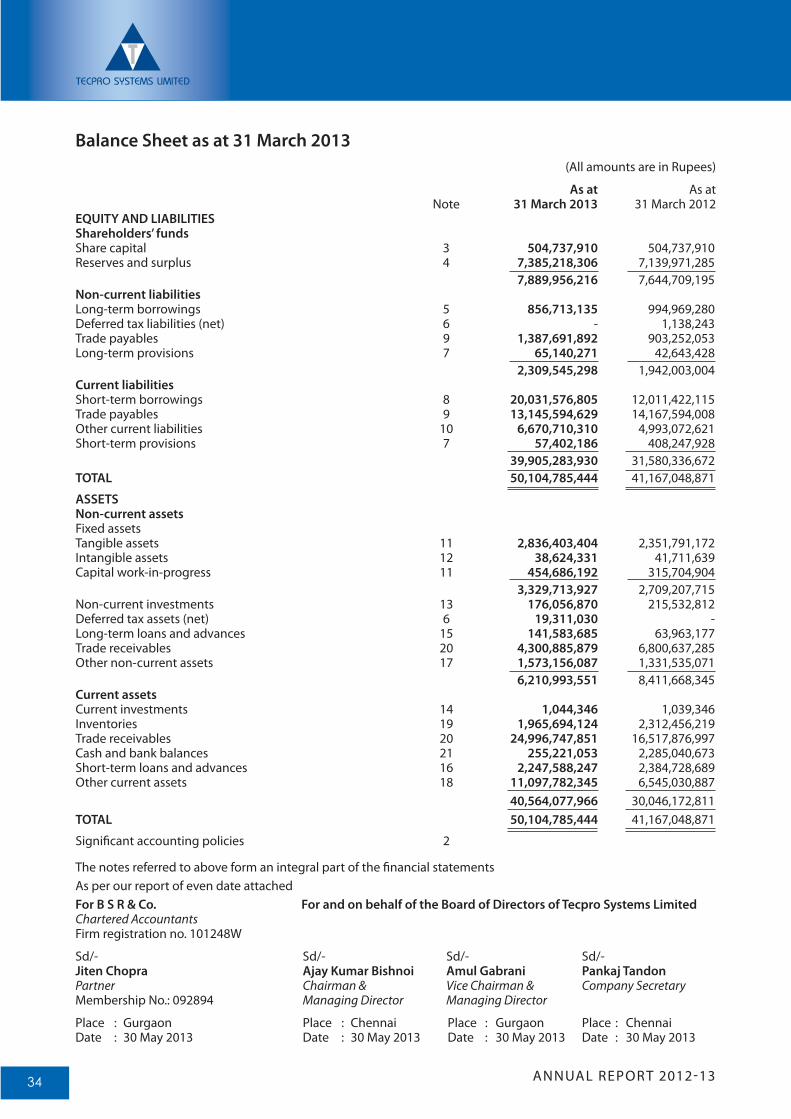
ANNUAL REPORT 2012-1334
(All amounts are in Rupees)
As at As at Note 31 March 2013 31 March 2012EQUITY AND LIABILITIESShareholders’ fundsShare capital 3 504,737,910 504,737,910 Reserves and surplus 4 7,385,218,306 7,139,971,285 7,889,956,216 7,644,709,195Non-current liabilitiesLong-term borrowings 5 856,713,135 994,969,280Deferred tax liabilities (net) 6 - 1,138,243Trade payables 9 1,387,691,892 903,252,053Long-term provisions 7 65,140,271 42,643,428 2,309,545,298 1,942,003,004 Current liabilitiesShort-term borrowings 8 20,031,576,805 12,011,422,115Trade payables 9 13,145,594,629 14,167,594,008Other current liabilities 10 6,670,710,310 4,993,072,621Short-term provisions 7 57,402,186 408,247,928 39,905,283,930 31,580,336,672TOTAL 50,104,785,444 41,167,048,871
ASSETSNon-current assetsFixed assetsTangible assets 11 2,836,403,404 2,351,791,172Intangible assets 12 38,624,331 41,711,639 Capital work-in-progress 11 454,686,192 315,704,904 3,329,713,927 2,709,207,715 Non-current investments 13 176,056,870 215,532,812 Deferred tax assets (net) 6 19,311,030 - Long-term loans and advances 15 141,583,685 63,963,177Trade receivables 20 4,300,885,879 6,800,637,285 Other non-current assets 17 1,573,156,087 1,331,535,071 6,210,993,551 8,411,668,345Current assetsCurrent investments 14 1,044,346 1,039,346 Inventories 19 1,965,694,124 2,312,456,219 Trade receivables 20 24,996,747,851 16,517,876,997Cash and bank balances 21 255,221,053 2,285,040,673 Short-term loans and advances 16 2,247,588,247 2,384,728,689 Other current assets 18 11,097,782,345 6,545,030,887 40,564,077,966 30,046,172,811TOTAL 50,104,785,444 41,167,048,871
Significant accounting policies 2
Balance Sheet as at 31 March 2013
The notes referred to above form an integral part of the financial statementsAs per our report of even date attachedFor B S R & Co. For and on behalf of the Board of Directors of Tecpro Systems Limited Chartered Accountants Firm registration no. 101248W
Sd/- Sd/- Sd/- Sd/- Jiten Chopra Ajay Kumar Bishnoi Amul Gabrani Pankaj Tandon Partner Chairman & Vice Chairman & Company Secretary Membership No.: 092894 Managing Director Managing Director
Place : Gurgaon Place : Chennai Place : Gurgaon Place : Chennai Date : 30 May 2013 Date : 30 May 2013 Date : 30 May 2013 Date : 30 May 2013
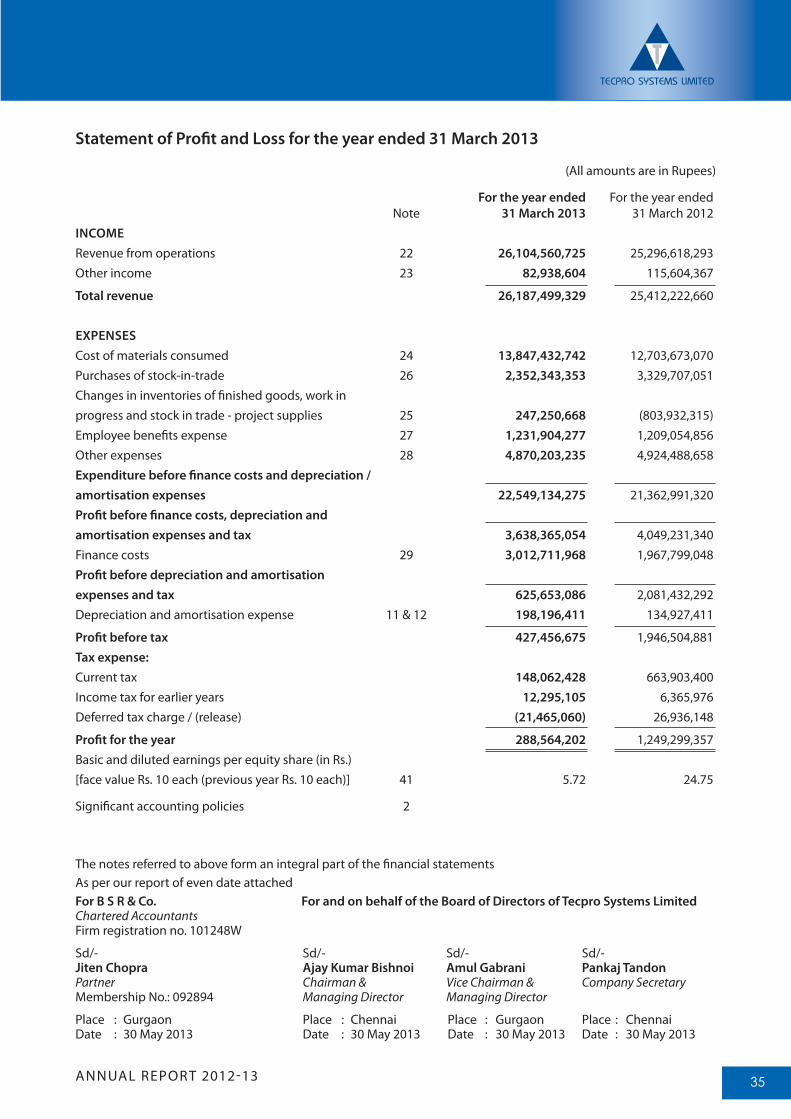
ANNUAL REPORT 2012-13 35
The notes referred to above form an integral part of the financial statementsAs per our report of even date attachedFor B S R & Co. For and on behalf of the Board of Directors of Tecpro Systems Limited Chartered Accountants Firm registration no. 101248W
Sd/- Sd/- Sd/- Sd/- Jiten Chopra Ajay Kumar Bishnoi Amul Gabrani Pankaj Tandon Partner Chairman & Vice Chairman & Company Secretary Membership No.: 092894 Managing Director Managing Director
Place : Gurgaon Place : Chennai Place : Gurgaon Place : Chennai Date : 30 May 2013 Date : 30 May 2013 Date : 30 May 2013 Date : 30 May 2013
(All amounts are in Rupees)
For the year ended For the year ended Note 31 March 2013 31 March 2012INCOMERevenue from operations 22 26,104,560,725 25,296,618,293 Other income 23 82,938,604 115,604,367
Total revenue 26,187,499,329 25,412,222,660
EXPENSESCost of materials consumed 24 13,847,432,742 12,703,673,070Purchases of stock-in-trade 26 2,352,343,353 3,329,707,051 Changes in inventories of finished goods, work in progress and stock in trade - project supplies 25 247,250,668 (803,932,315)Employee benefits expense 27 1,231,904,277 1,209,054,856 Other expenses 28 4,870,203,235 4,924,488,658Expenditure before finance costs and depreciation / amortisation expenses 22,549,134,275 21,362,991,320 Profit before finance costs, depreciation and amortisation expenses and tax 3,638,365,054 4,049,231,340Finance costs 29 3,012,711,968 1,967,799,048Profit before depreciation and amortisation expenses and tax 625,653,086 2,081,432,292Depreciation and amortisation expense 11 & 12 198,196,411 134,927,411
Profit before tax 427,456,675 1,946,504,881Tax expense:Current tax 148,062,428 663,903,400 Income tax for earlier years 12,295,105 6,365,976 Deferred tax charge / (release) (21,465,060) 26,936,148
Profit for the year 288,564,202 1,249,299,357Basic and diluted earnings per equity share (in Rs.)[face value Rs. 10 each (previous year Rs. 10 each)] 41 5.72 24.75
Significant accounting policies 2
Statement of Profit and Loss for the year ended 31 March 2013
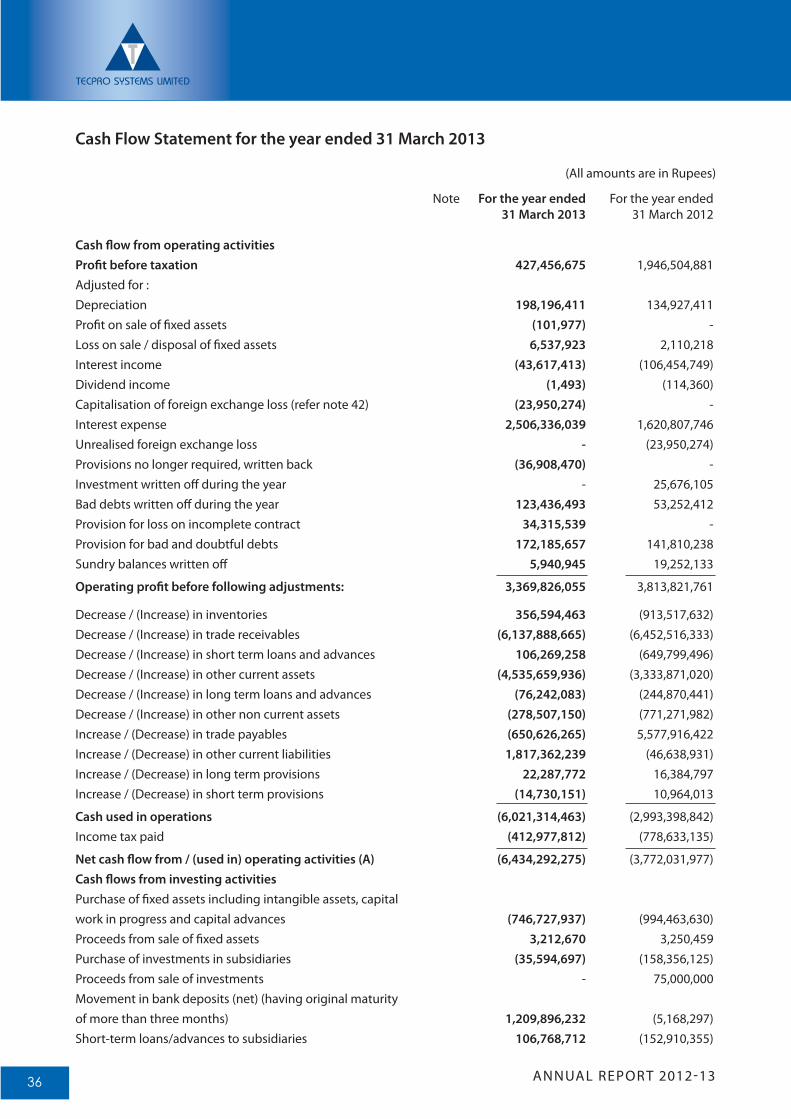
ANNUAL REPORT 2012-1336
Cash Flow Statement for the year ended 31 March 2013
(All amounts are in Rupees)
Note For the year ended For the year ended 31 March 2013 31 March 2012
Cash flow from operating activitiesProfit before taxation 427,456,675 1,946,504,881 Adjusted for :Depreciation 198,196,411 134,927,411 Profit on sale of fixed assets (101,977) - Loss on sale / disposal of fixed assets 6,537,923 2,110,218 Interest income (43,617,413) (106,454,749)Dividend income (1,493) (114,360)Capitalisation of foreign exchange loss (refer note 42) (23,950,274) - Interest expense 2,506,336,039 1,620,807,746 Unrealised foreign exchange loss - (23,950,274)Provisions no longer required, written back (36,908,470) - Investment written off during the year - 25,676,105 Bad debts written off during the year 123,436,493 53,252,412 Provision for loss on incomplete contract 34,315,539 - Provision for bad and doubtful debts 172,185,657 141,810,238Sundry balances written off 5,940,945 19,252,133
Operating profit before following adjustments: 3,369,826,055 3,813,821,761
Decrease / (Increase) in inventories 356,594,463 (913,517,632)Decrease / (Increase) in trade receivables (6,137,888,665) (6,452,516,333)Decrease / (Increase) in short term loans and advances 106,269,258 (649,799,496)Decrease / (Increase) in other current assets (4,535,659,936) (3,333,871,020)Decrease / (Increase) in long term loans and advances (76,242,083) (244,870,441)Decrease / (Increase) in other non current assets (278,507,150) (771,271,982)Increase / (Decrease) in trade payables (650,626,265) 5,577,916,422 Increase / (Decrease) in other current liabilities 1,817,362,239 (46,638,931)Increase / (Decrease) in long term provisions 22,287,772 16,384,797 Increase / (Decrease) in short term provisions (14,730,151) 10,964,013
Cash used in operations (6,021,314,463) (2,993,398,842)Income tax paid (412,977,812) (778,633,135)
Net cash flow from / (used in) operating activities (A) (6,434,292,275) (3,772,031,977)Cash flows from investing activitiesPurchase of fixed assets including intangible assets, capital work in progress and capital advances (746,727,937) (994,463,630)Proceeds from sale of fixed assets 3,212,670 3,250,459 Purchase of investments in subsidiaries (35,594,697) (158,356,125)Proceeds from sale of investments - 75,000,000 Movement in bank deposits (net) (having original maturity of more than three months) 1,209,896,232 (5,168,297)Short-term loans/advances to subsidiaries 106,768,712 (152,910,355)
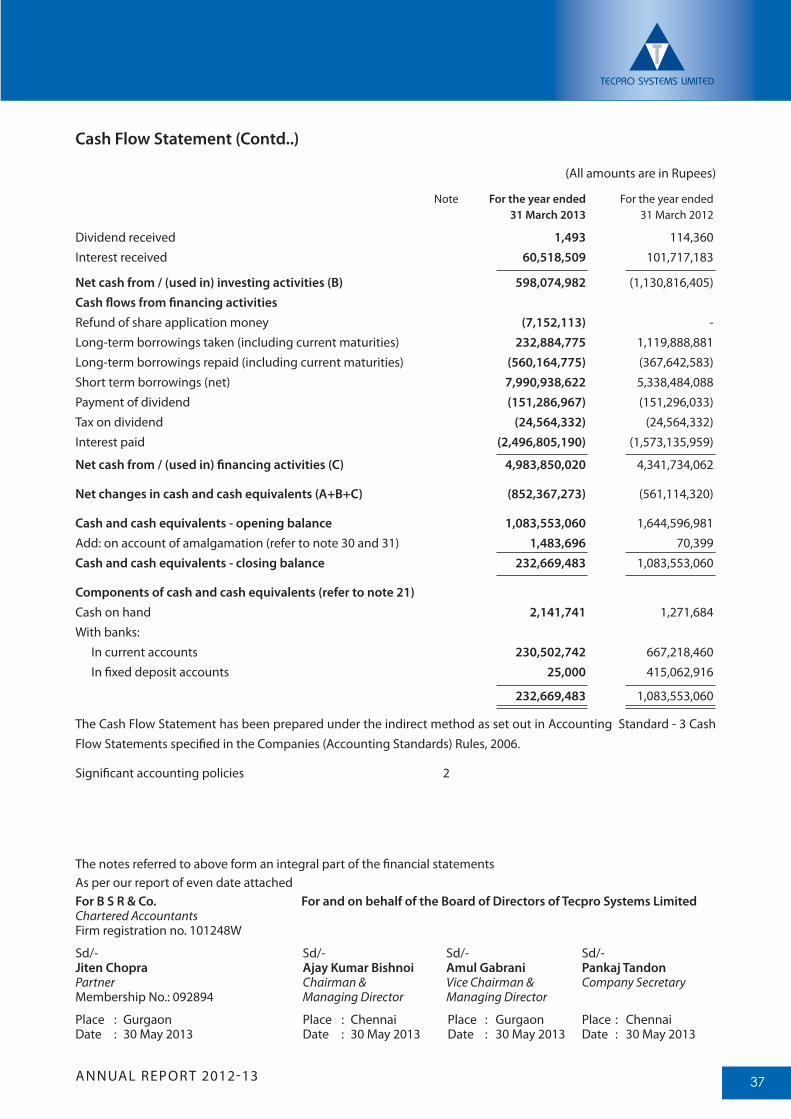
ANNUAL REPORT 2012-13 37
Dividend received 1,493 114,360 Interest received 60,518,509 101,717,183
Net cash from / (used in) investing activities (B) 598,074,982 (1,130,816,405)Cash flows from financing activitiesRefund of share application money (7,152,113) - Long-term borrowings taken (including current maturities) 232,884,775 1,119,888,881Long-term borrowings repaid (including current maturities) (560,164,775) (367,642,583)Short term borrowings (net) 7,990,938,622 5,338,484,088 Payment of dividend (151,286,967) (151,296,033)Tax on dividend (24,564,332) (24,564,332)Interest paid (2,496,805,190) (1,573,135,959)
Net cash from / (used in) financing activities (C) 4,983,850,020 4,341,734,062
Net changes in cash and cash equivalents (A+B+C) (852,367,273) (561,114,320)
Cash and cash equivalents - opening balance 1,083,553,060 1,644,596,981 Add: on account of amalgamation (refer to note 30 and 31) 1,483,696 70,399Cash and cash equivalents - closing balance 232,669,483 1,083,553,060
Components of cash and cash equivalents (refer to note 21)Cash on hand 2,141,741 1,271,684 With banks: In current accounts 230,502,742 667,218,460 In fixed deposit accounts 25,000 415,062,916
232,669,483 1,083,553,060
The Cash Flow Statement has been prepared under the indirect method as set out in Accounting Standard - 3 Cash Flow Statements specified in the Companies (Accounting Standards) Rules, 2006.
Significant accounting policies 2
Cash Flow Statement (Contd..)
(All amounts are in Rupees)
Note For the year ended For the year ended 31 March 2013 31 March 2012
The notes referred to above form an integral part of the financial statementsAs per our report of even date attachedFor B S R & Co. For and on behalf of the Board of Directors of Tecpro Systems Limited Chartered Accountants Firm registration no. 101248W
Sd/- Sd/- Sd/- Sd/- Jiten Chopra Ajay Kumar Bishnoi Amul Gabrani Pankaj Tandon Partner Chairman & Vice Chairman & Company Secretary Membership No.: 092894 Managing Director Managing Director
Place : Gurgaon Place : Chennai Place : Gurgaon Place : Chennai Date : 30 May 2013 Date : 30 May 2013 Date : 30 May 2013 Date : 30 May 2013
ANNUAL REPORT 2012-1338
Notes to financial statements for the year ended 31 March 2013
1. Company overview Tecpro Systems Limited is an engineering company primarily engaged in designing, engineering, manufacturing,
supply, installation and erection of material handling systems, power plants including balance of plant packages in power sector.
2. Significant Accounting Policies2.1 Basis of preparation of financial statements The financial statements are prepared on accrual basis under the historical cost convention, modified to
include revaluation of certain assets, in accordance with applicable Accounting Standards (AS) specified in the Companies (Accounting Standards) Rules, 2006 issued by the Central Government, the relevant provisions of the Companies Act, 1956 and other accounting principles generally accepted in India, to the extent applicable.
2.2 Use of estimates The preparation of financial statements in conformity with generally accepted accounting principles
requires the management to make judgements, estimates and assumptions that affect the applicability of accounting policies and reported amounts of assets, liabilities, income and expenses and the disclosure of contingent liabilities on the date of the financial statements. Actual results could differ from those estimates. Any revision to accounting estimates is recognised prospectively in current and future years.
2.3 Current and non-current classification All assets and liabilities are classified into current and non-current. Assets An asset is classified as current when it satisfies any of the following criteria:
(a) it is expected to be realised in, or is intended for sale or consumption in, the company’s normal operating cycle;
(b) it is held primarily for the purpose of being traded;(c) it is expected to be realised within 12 months after the reporting date; or(d) it is cash or cash equivalent unless it is restricted from being exchanged or used to settle a liability for
at least 12 months after the reporting date.
Current assets include the current portion of non-current financial assets. All other assets are classified as non-current.
Liabilities A liability is classified as current when it satisfies any of the following criteria:
(a) it is expected to be settled in the company’s normal operating cycle;(b) it is held primarily for the purpose of being traded;(c) it is due to be settled within 12 months after the reporting date; or(d) the company does not have an unconditional right to defer settlement of the liability for at least 12
months after the reporting date. Terms of a liability that could, at the option of the counterparty, result in its settlement by the issue of equity instruments do not affect its classification.
Current liabilities include current portion of non-current financial liabilities. All other liabilities are classified as non-current.
Operating cycle Operating cycle is the time between the acquisition of assets for processing and their realisation in cash
or cash equivalents. The Company has multiple operating cycles determined on the basis of the distinguishing features and
characteristics of various categories of contracts. However, assets/liabilities so disclosed as current on the basis of the relevant operating cycle but having a longer period of life than 12 months after the reporting period are also shown separately (Also refer note 38).
ANNUAL REPORT 2012-13 39
Notes to financial statements for the year ended 31 March 2013
2.4 Revenue recognition Revenue from sale of goods is recognised on transfer of all significant risks and rewards of ownership in
the goods to the customer.
Revenue from services is recognised on rendering of services to customers.
Interest income is recognised using the time proportion method, based on underlying interest rates.
Revenue from long-term construction contracts in accordance with Accounting Standard - 7 on “Construction Contracts” is recognized using the percentage of completion method. Percentage of completion method is determined as a proportion of cost incurred to date to the total estimated contract cost or completion of a physical portion of the contract work depending on the nature of contract whichever is appropriate. Where the total cost of the contract, based on technical and other estimates, is expected to exceed the corresponding contract value, such excess is provided during the year.
Duty drawback available under prevalent scheme is accrued in the year when the right to receive credit as per the terms of scheme are established and these are accounted to the extent there is no significant uncertainty about the measurability and ultimate utilisation of such duty credit.
2.5 Tangible fixed assets and capital work-in-progress Tangible fixed assets, including capital work in progress are stated at cost of acquisition or construction
less accumulated depreciation. Cost comprises the purchase price, including import duties and other non-refundable taxes or levies and any directly attributable costs of bringing the asset to its working condition for the intended use. Tangible fixed assets under construction are disclosed as Capital work-in-progress.
Exchange differences arising in respect of translation / settlement of long term foreign currency borrowings attributable to the acquisition of a depreciable asset are also included in the cost of the asset.
2.6 Intangible assets Intangible assets comprising computer software and technical know-how are stated at cost, including
taxes, less accumulated amortisation. Computer software is amortised on a straight line basis over three years. Technical know-how is amortised on a straight line basis over its estimated useful life, the period over which the Company expects to derive economic benefits from the use of the technical know-how.
Goodwill that arises on an amalgamation or on acquisition of a business is presented as an intangible asset.
Goodwill arising from amalgamation is measured at cost less accumulated amortisation and any accumulated impairment loss. Such goodwill is amortised over its estimated useful life or five years whichever is shorter.
2.7 Borrowing Cost Financing costs relating to borrowed funds attributable to construction or acquisition of qualifying assets
for the period up to the completion of construction or acquisition of such assets are included in the cost of the assets. All borrowing costs are charged to Statement of Profit and Loss.
2.8 Impairment The carrying values of assets are reviewed at each reporting date to determine whether there any indication
of impairment. If such indication exists, the amount recoverable towards such asset is estimated. An impairment loss is recognised whenever the carrying amount of an asset or its cash generating unit exceeds its recoverable amount. Impairment losses are recognised in the Statement of Profit and Loss. An impairment loss is reversed if there has been a change in the estimates used to determine the recoverable amount. An impairment loss is reversed only to the extent that the asset’s carrying amount does not exceed the carrying amount that would have been determined net of depreciation or amortisation, if no impairment loss has been recognised.
ANNUAL REPORT 2012-1340
2.9 Depreciation Depreciation is provided on a pro-rata basis under the straight line method. The rates of depreciation
prescribed in Schedule XIV to the Companies Act, 1956 are considered as the minimum rates. If the management’s estimate of the useful life of a fixed asset at the time of acquisition of the asset or of the remaining useful life on a subsequent review is shorter than that envisaged in the aforesaid schedule, depreciation is provided at a higher rate based on the management’s estimate of the useful life/remaining useful life. Rates of depreciation (where different from the rates prescribed in Schedule XIV to the Companies Act, 1956) have been derived on the basis of the following estimated useful lives:
Estimated useful life (in years)
Plant and machinery 20
Office equipments 6
Furniture and fixtures 5
Vehicles 2-10
Temporary sheds at project sites (to coincide with the project period)* 1-5
Patterns 3
Shuttering and scaffolding ** 4
Office building * 28.44
Computers 6
Computer software 3
Technical know-how 5
Goodwill 5
* included in buildings in note 11 to the financial statements. ** included in plant and machinery in note 11 to the financial statements. Leasehold land is amortised on straight line basis over the period of the lease. Leasehold improvements
are depreciated over the period of lease or the useful life of the underlying asset, whichever is less. Depreciation on additions is being provided on a pro-rata basis from the date of such additions. Similarly,
depreciation on assets sold/disposed off during the year is being provided up to the date on which such assets are sold/disposed off.
Assets costing individually Rs. 5,000 or less are depreciated fully in the year of purchase. 2.10 Inventories Inventories are valued at the lower of cost and net realisable value. Cost includes all applicable costs incurred
in bringing goods to their present location and condition, determined on a first in first out basis. In determining the cost of inventories, fixed production overheads are allocated on the basis of normal
capacity of production facilities. Contract work in progress includes contract costs that relate to future activity on the long term construction
contract, such as costs of materials that have been delivered to a contract site or set aside for use in a contract but not yet installed, used or applied during contract performance and excludes the materials which have been made specially for such contracts.
2.11 Foreign currency transactions Foreign currency transactions are recorded at the exchange rate prevailing on the date of the respective
transactions. Monetary foreign currency assets and liabilities remaining unsettled at the balance sheet date are translated at exchange rates prevailing on that date. All exchange differences other than in relation to acquisition of fixed assets and other long term foreign currency monetary liabilities are dealt with in the Statement of Profit and Loss.
In accordance with Accounting Standard 11, “Accounting for the effects of changes in foreign exchange
Notes to financial statements for the year ended 31 March 2013
ANNUAL REPORT 2012-13 41
Notes to financial statements for the year ended 31 March 2013
rates”, exchange differences arising in respect of long term foreign currency monetary items:
are depreciated over the balance life of asset.
Currency Monetary Item Translation Difference Account (FCMITDA) and amortized over the balance period of such liability.
The premium or discount that arises on entering into a forward exchange contract for hedging underlying assets and liabilities is measured by the difference between the exchange rate at the date of inception of the forward exchange contract and the forward rate specified in the contract and is amortised as expense or income over life of the contract. Exchange difference on forward exchange contract is the difference between:
(a) the foreign currency amount of the contract translated at the exchange rate at the reporting date, or the settlement date where the transaction is settled during the reporting period, and;
(b) the same foreign currency amount translated at the latter of the date of inception of the forward exchange contract and the last reporting date.
These exchange differences are recognised in the Statement of Profit and Loss in the reporting period in which the exchange rates change.
2.12 Provisions and contingencies A provision is created when there is a present obligation as a result of a past event that entails a probable
outflow of resources and a reliable estimate can be made of the amount of the obligation. Disclosure of a contingent liability is made when there is a possible but not probable obligation or a present obligation that may, but probably will not, entail an outflow of resources. When there is an obligation in respect of which the likelihood of outflow of resources is remote, no provision or disclosure is made.
Onerous contract A Contract is considered as onerous when the expected economic benefits to be derived by the Company
from the contract are lower than the unavoidable cost of meeting its obligation under the contract. The provision for an onerous contract is measured at the lower of the expected cost of terminating the contract and the expected net cost of continuing with the contract.
2.13 Taxation Income-tax expense comprises current tax (i.e. amount of tax for the year determined in accordance with
the income-tax law) and deferred tax charge or credit (reflecting the tax effects of timing differences between accounting income and taxable income for the year). The deferred tax charge or credit and the corresponding deferred tax liabilities and assets are recognised using the tax rates that have been enacted or substantively enacted by the Balance Sheet date. Deferred tax assets are recognised only to the extent there is reasonable certainty that the assets can be realised in future; however, where there is unabsorbed depreciation or carried forward losses under taxation laws, deferred tax assets are recognised only if there is a virtual certainty of realisation of such assets. Deferred tax assets are reviewed as at each balance sheet date and are written down or written up to reflect the amount that is reasonably/virtually certain (as the case may be) to be realised.
2.14 Employee benefits1. All employee benefits payable/available within twelve months of rendering the service are classified
as short-term employee benefits. Benefits such as salaries, wages and bonus etc., are recognised in the Statement of Profit and Loss in the year in which the employee renders the related service.
2. Provident fund is a defined contribution scheme. Contributions payable to the provident fund are charged to the Statement of Profit and Loss.
3. Superannuation fund is a defined contribution scheme. The Company contributes to schemes
ANNUAL REPORT 2012-1342
Notes to financial statements for the year ended 31 March 2013
administered by the Life Insurance Corporation of India (‘LIC’) to discharge its superannuation liabilities. The Company’s contribution paid/payable under the scheme is recognised as an expense in the Statement of Profit and Loss during the period in which the employee renders the related service.
4. Gratuity costs are defined benefits plans. The present value of obligations under such defined benefit plan is determined based on actuarial valuation carried out by an independent actuary using the Projected Unit Credit Method, which recognises each period of service as giving rise to additional unit of employee benefit entitlement and measure each unit separately to build up the final obligation.
The obligation is measured at the present value of estimated future cash flows. The discount rates used for determining the present value of obligation under defined benefit plans, is based on the market yields on Government securities as at the balance sheet date, having maturity periods approximating to the terms of related obligations.
Annual contributions are made to the employee’s gratuity fund, established with the LIC based on an actuarial valuation carried out by the LIC as at 31 March each year. The fair value of plan assets is reduced from the gross obligation under the defined benefit plans, to recognise the obligation on net basis. Actuarial gains and losses are recognised immediately in the Statement of Profit and Loss. Gains or losses on the curtailment or settlement of any defined benefit plan are recognised when the curtailment or settlement occurs.
5. Benefits under the Company’s leave encashment scheme constitute other long term employee benefits. The obligation in respect of leave encashment is provided on the basis on actuarial valuation carried out by an independent actuary using the Projected Unit Credit Method, which recognises each period of service as giving rise to additional unit of employee benefit entitlement and measure each unit separately to build up the final obligation.
The obligation is measured at the present value of estimated future cash flows. The discount rates used for determining the present value of obligation under defined benefit plans, is based on the market yields on Government securities as at the balance sheet date, having maturity periods approximating to the terms of related obligations.
Annual contributions are made to the employee’s leave encashment fund, established with the LIC based on an actuarial valuation carried out by the LIC as at 31 March each year. The fair value of plan assets is reduced from the gross obligation, to recognise the obligation on net basis. Actuarial gains and losses are recognised immediately in the Statement of Profit and Loss.
2.15 Investments Long term investments are valued at cost. Any decline other than temporary, in the value of long-term
investments, is adjusted in the carrying value of such investments. Diminution, if any, is determined individually for each long-term investment. Current investments are valued at the lower of cost and fair value of individual scrips.
2.16 Earnings per share Basic earnings per share are computed by dividing the net profit/(loss) for the year attributable to the equity
shareholders with the weighted average number of equity shares outstanding during the year. Diluted earnings per share are computed using the weighted average number of equity and dilutive potential equity shares outstanding during the year, except where the results would be anti-dilutive.
2.17 Leases Lease arrangements where the risks and rewards incidental to ownership of an asset substantially vest
with the lessor are classified as operating leases. Lease rents under operating leases are recognized in the Statement of Profit and Loss on a straight line basis over the lease term.
2.18 Events occurring after the balance sheet date Adjustment to assets and liabilities are made for events occurring after the balance sheet date that provide
additional information materially affecting the determination of the amount of assets and liabilities relating to condition existing at the balance sheet date.
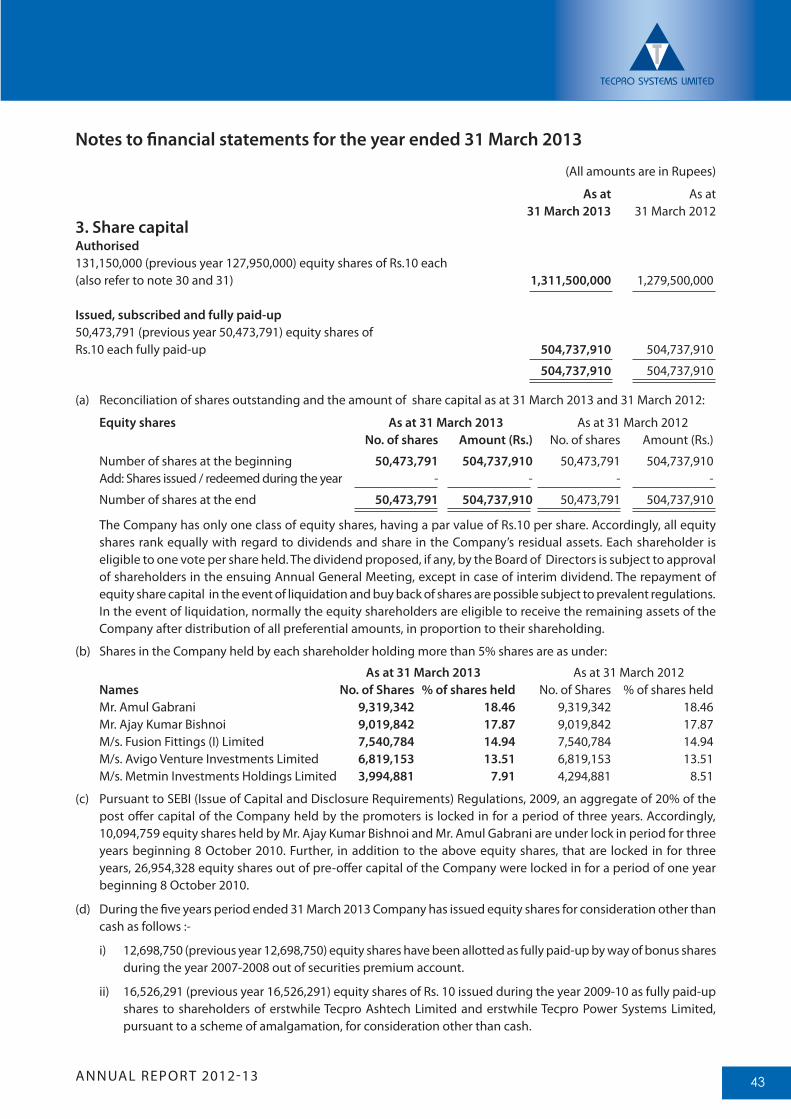
ANNUAL REPORT 2012-13 43
(All amounts are in Rupees)
As at As at 31 March 2013 31 March 20123. Share capitalAuthorised 131,150,000 (previous year 127,950,000) equity shares of Rs.10 each (also refer to note 30 and 31) 1,311,500,000 1,279,500,000
Issued, subscribed and fully paid-up50,473,791 (previous year 50,473,791) equity shares of Rs.10 each fully paid-up 504,737,910 504,737,910
504,737,910 504,737,910
(a) Reconciliation of shares outstanding and the amount of share capital as at 31 March 2013 and 31 March 2012:
Equity shares As at 31 March 2013 As at 31 March 2012 No. of shares Amount (Rs.) No. of shares Amount (Rs.)
Number of shares at the beginning 50,473,791 504,737,910 50,473,791 504,737,910 Add: Shares issued / redeemed during the year - - - -
Number of shares at the end 50,473,791 504,737,910 50,473,791 504,737,910
The Company has only one class of equity shares, having a par value of Rs.10 per share. Accordingly, all equity shares rank equally with regard to dividends and share in the Company’s residual assets. Each shareholder is eligible to one vote per share held. The dividend proposed, if any, by the Board of Directors is subject to approval of shareholders in the ensuing Annual General Meeting, except in case of interim dividend. The repayment of equity share capital in the event of liquidation and buy back of shares are possible subject to prevalent regulations. In the event of liquidation, normally the equity shareholders are eligible to receive the remaining assets of the Company after distribution of all preferential amounts, in proportion to their shareholding.
(b) Shares in the Company held by each shareholder holding more than 5% shares are as under:
As at 31 March 2013 As at 31 March 2012 Names No. of Shares % of shares held No. of Shares % of shares held Mr. Amul Gabrani 9,319,342 18.46 9,319,342 18.46 Mr. Ajay Kumar Bishnoi 9,019,842 17.87 9,019,842 17.87 M/s. Fusion Fittings (I) Limited 7,540,784 14.94 7,540,784 14.94 M/s. Avigo Venture Investments Limited 6,819,153 13.51 6,819,153 13.51 M/s. Metmin Investments Holdings Limited 3,994,881 7.91 4,294,881 8.51
(c) Pursuant to SEBI (Issue of Capital and Disclosure Requirements) Regulations, 2009, an aggregate of 20% of the post offer capital of the Company held by the promoters is locked in for a period of three years. Accordingly, 10,094,759 equity shares held by Mr. Ajay Kumar Bishnoi and Mr. Amul Gabrani are under lock in period for three years beginning 8 October 2010. Further, in addition to the above equity shares, that are locked in for three years, 26,954,328 equity shares out of pre-offer capital of the Company were locked in for a period of one year beginning 8 October 2010.
(d) During the five years period ended 31 March 2013 Company has issued equity shares for consideration other than cash as follows :-
i) 12,698,750 (previous year 12,698,750) equity shares have been allotted as fully paid-up by way of bonus shares during the year 2007-2008 out of securities premium account.
ii) 16,526,291 (previous year 16,526,291) equity shares of Rs. 10 issued during the year 2009-10 as fully paid-up shares to shareholders of erstwhile Tecpro Ashtech Limited and erstwhile Tecpro Power Systems Limited, pursuant to a scheme of amalgamation, for consideration other than cash.
Notes to financial statements for the year ended 31 March 2013
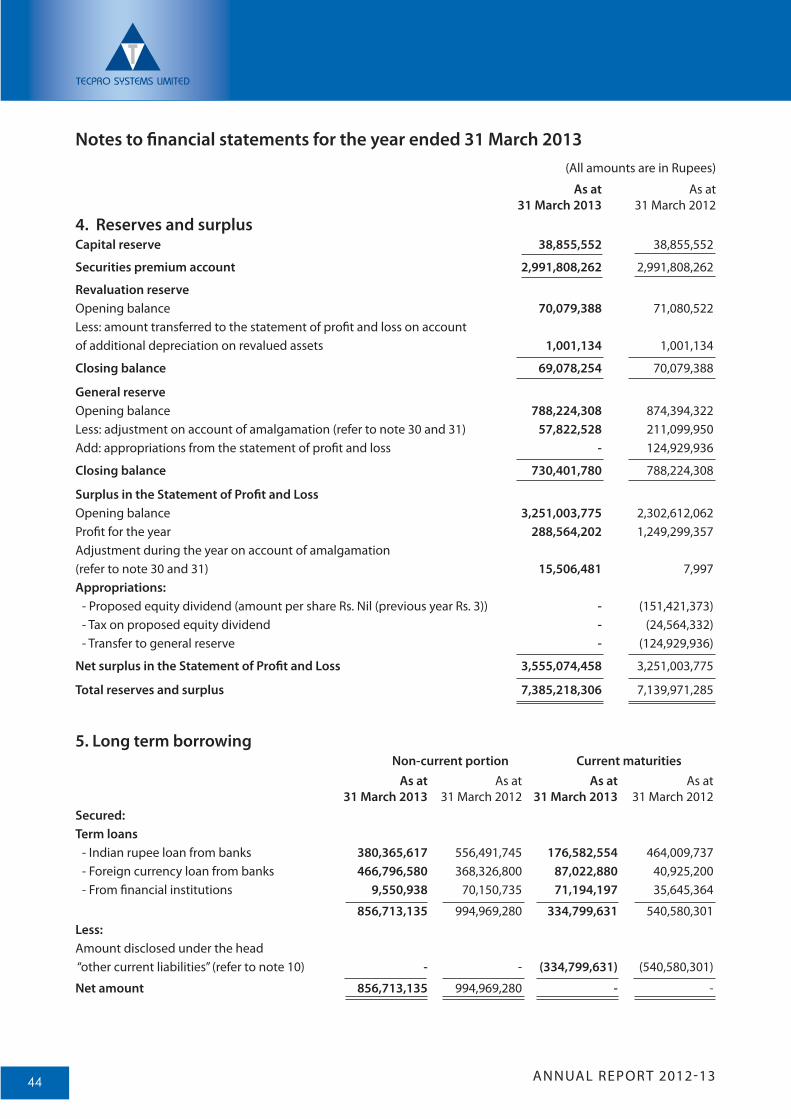
ANNUAL REPORT 2012-1344
(All amounts are in Rupees)
As at As at 31 March 2013 31 March 2012
4. Reserves and surplusCapital reserve 38,855,552 38,855,552
Securities premium account 2,991,808,262 2,991,808,262
Revaluation reserve Opening balance 70,079,388 71,080,522Less: amount transferred to the statement of profit and loss on account of additional depreciation on revalued assets 1,001,134 1,001,134
Closing balance 69,078,254 70,079,388
General reserveOpening balance 788,224,308 874,394,322 Less: adjustment on account of amalgamation (refer to note 30 and 31) 57,822,528 211,099,950 Add: appropriations from the statement of profit and loss - 124,929,936
Closing balance 730,401,780 788,224,308
Surplus in the Statement of Profit and Loss Opening balance 3,251,003,775 2,302,612,062 Profit for the year 288,564,202 1,249,299,357 Adjustment during the year on account of amalgamation (refer to note 30 and 31) 15,506,481 7,997Appropriations: - Proposed equity dividend (amount per share Rs. Nil (previous year Rs. 3)) - (151,421,373) - Tax on proposed equity dividend - (24,564,332) - Transfer to general reserve - (124,929,936)
Net surplus in the Statement of Profit and Loss 3,555,074,458 3,251,003,775
Total reserves and surplus 7,385,218,306 7,139,971,285
Notes to financial statements for the year ended 31 March 2013
5. Long term borrowing Non-current portion Current maturities As at As at As at As at 31 March 2013 31 March 2012 31 March 2013 31 March 2012Secured:Term loans - Indian rupee loan from banks 380,365,617 556,491,745 176,582,554 464,009,737 - Foreign currency loan from banks 466,796,580 368,326,800 87,022,880 40,925,200 - From financial institutions 9,550,938 70,150,735 71,194,197 35,645,364
856,713,135 994,969,280 334,799,631 540,580,301 Less:Amount disclosed under the head “other current liabilities” (refer to note 10) - - (334,799,631) (540,580,301)
Net amount 856,713,135 994,969,280 - -
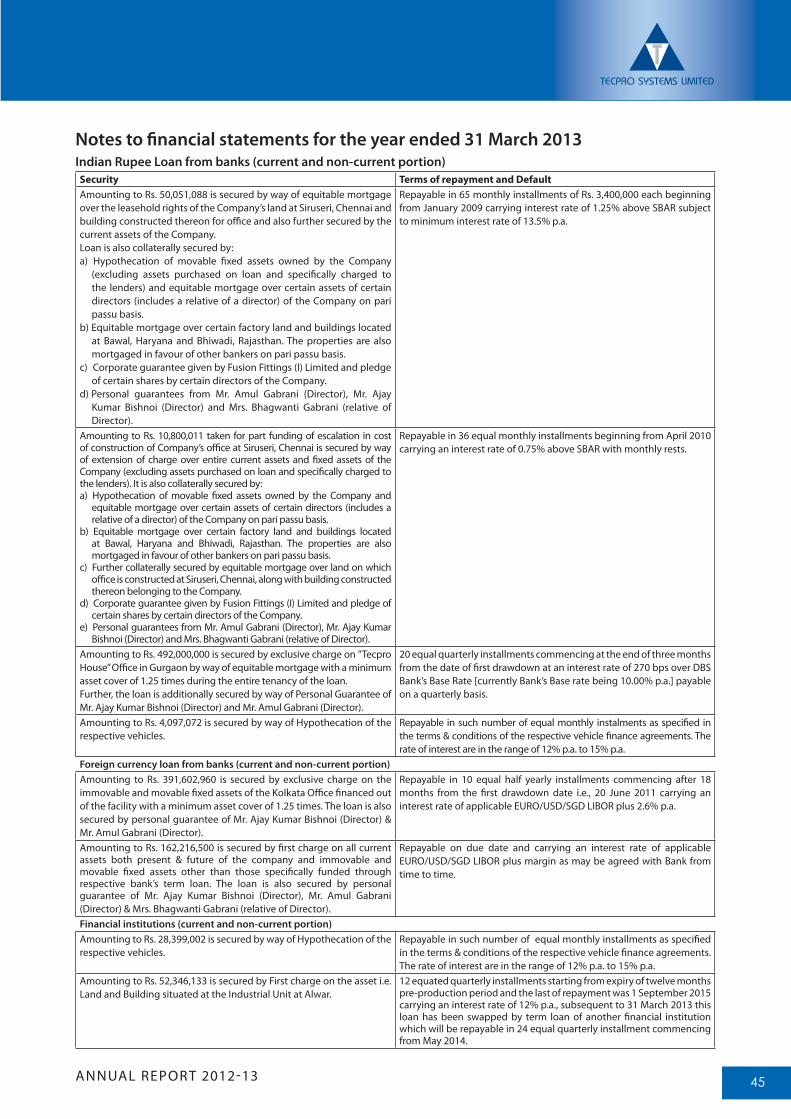
ANNUAL REPORT 2012-13 45
Notes to financial statements for the year ended 31 March 2013Indian Rupee Loan from banks (current and non-current portion)
Security Terms of repayment and Default Amounting to Rs. 50,051,088 is secured by way of equitable mortgage over the leasehold rights of the Company’s land at Siruseri, Chennai and building constructed thereon for office and also further secured by the current assets of the Company.Loan is also collaterally secured by:a) Hypothecation of movable fixed assets owned by the Company
(excluding assets purchased on loan and specifically charged to the lenders) and equitable mortgage over certain assets of certain directors (includes a relative of a director) of the Company on pari passu basis.
b) Equitable mortgage over certain factory land and buildings located at Bawal, Haryana and Bhiwadi, Rajasthan. The properties are also mortgaged in favour of other bankers on pari passu basis.
c) Corporate guarantee given by Fusion Fittings (I) Limited and pledge of certain shares by certain directors of the Company.
d) Personal guarantees from Mr. Amul Gabrani (Director), Mr. Ajay Kumar Bishnoi (Director) and Mrs. Bhagwanti Gabrani (relative of Director).
Repayable in 65 monthly installments of Rs. 3,400,000 each beginning from January 2009 carrying interest rate of 1.25% above SBAR subject to minimum interest rate of 13.5% p.a.
Amounting to Rs. 10,800,011 taken for part funding of escalation in cost of construction of Company’s office at Siruseri, Chennai is secured by way of extension of charge over entire current assets and fixed assets of the Company (excluding assets purchased on loan and specifically charged to the lenders). It is also collaterally secured by:a) Hypothecation of movable fixed assets owned by the Company and
equitable mortgage over certain assets of certain directors (includes a relative of a director) of the Company on pari passu basis.
b) Equitable mortgage over certain factory land and buildings located at Bawal, Haryana and Bhiwadi, Rajasthan. The properties are also mortgaged in favour of other bankers on pari passu basis.
c) Further collaterally secured by equitable mortgage over land on which office is constructed at Siruseri, Chennai, along with building constructed thereon belonging to the Company.
d) Corporate guarantee given by Fusion Fittings (I) Limited and pledge of certain shares by certain directors of the Company.
e) Personal guarantees from Mr. Amul Gabrani (Director), Mr. Ajay Kumar Bishnoi (Director) and Mrs. Bhagwanti Gabrani (relative of Director).
Repayable in 36 equal monthly installments beginning from April 2010 carrying an interest rate of 0.75% above SBAR with monthly rests.
Amounting to Rs. 492,000,000 is secured by exclusive charge on ”Tecpro House” Office in Gurgaon by way of equitable mortgage with a minimum asset cover of 1.25 times during the entire tenancy of the loan. Further, the loan is additionally secured by way of Personal Guarantee of Mr. Ajay Kumar Bishnoi (Director) and Mr. Amul Gabrani (Director).
20 equal quarterly installments commencing at the end of three months from the date of first drawdown at an interest rate of 270 bps over DBS Bank’s Base Rate [currently Bank’s Base rate being 10.00% p.a.] payable on a quarterly basis.
Amounting to Rs. 4,097,072 is secured by way of Hypothecation of the respective vehicles.
Repayable in such number of equal monthly instalments as specified in the terms & conditions of the respective vehicle finance agreements. The rate of interest are in the range of 12% p.a. to 15% p.a.
Foreign currency loan from banks (current and non-current portion)Amounting to Rs. 391,602,960 is secured by exclusive charge on the immovable and movable fixed assets of the Kolkata Office financed out of the facility with a minimum asset cover of 1.25 times. The loan is also secured by personal guarantee of Mr. Ajay Kumar Bishnoi (Director) & Mr. Amul Gabrani (Director).
Repayable in 10 equal half yearly installments commencing after 18 months from the first drawdown date i.e., 20 June 2011 carrying an interest rate of applicable EURO/USD/SGD LIBOR plus 2.6% p.a.
Amounting to Rs. 162,216,500 is secured by first charge on all current assets both present & future of the company and immovable and movable fixed assets other than those specifically funded through respective bank’s term loan. The loan is also secured by personal guarantee of Mr. Ajay Kumar Bishnoi (Director), Mr. Amul Gabrani (Director) & Mrs. Bhagwanti Gabrani (relative of Director).
Repayable on due date and carrying an interest rate of applicable EURO/USD/SGD LIBOR plus margin as may be agreed with Bank from time to time.
Financial institutions (current and non-current portion) Amounting to Rs. 28,399,002 is secured by way of Hypothecation of the respective vehicles.
Repayable in such number of equal monthly installments as specified in the terms & conditions of the respective vehicle finance agreements. The rate of interest are in the range of 12% p.a. to 15% p.a.
Amounting to Rs. 52,346,133 is secured by First charge on the asset i.e. Land and Building situated at the Industrial Unit at Alwar.
12 equated quarterly installments starting from expiry of twelve months pre-production period and the last of repayment was 1 September 2015 carrying an interest rate of 12% p.a., subsequent to 31 March 2013 this loan has been swapped by term loan of another financial institution which will be repayable in 24 equal quarterly installment commencing from May 2014.
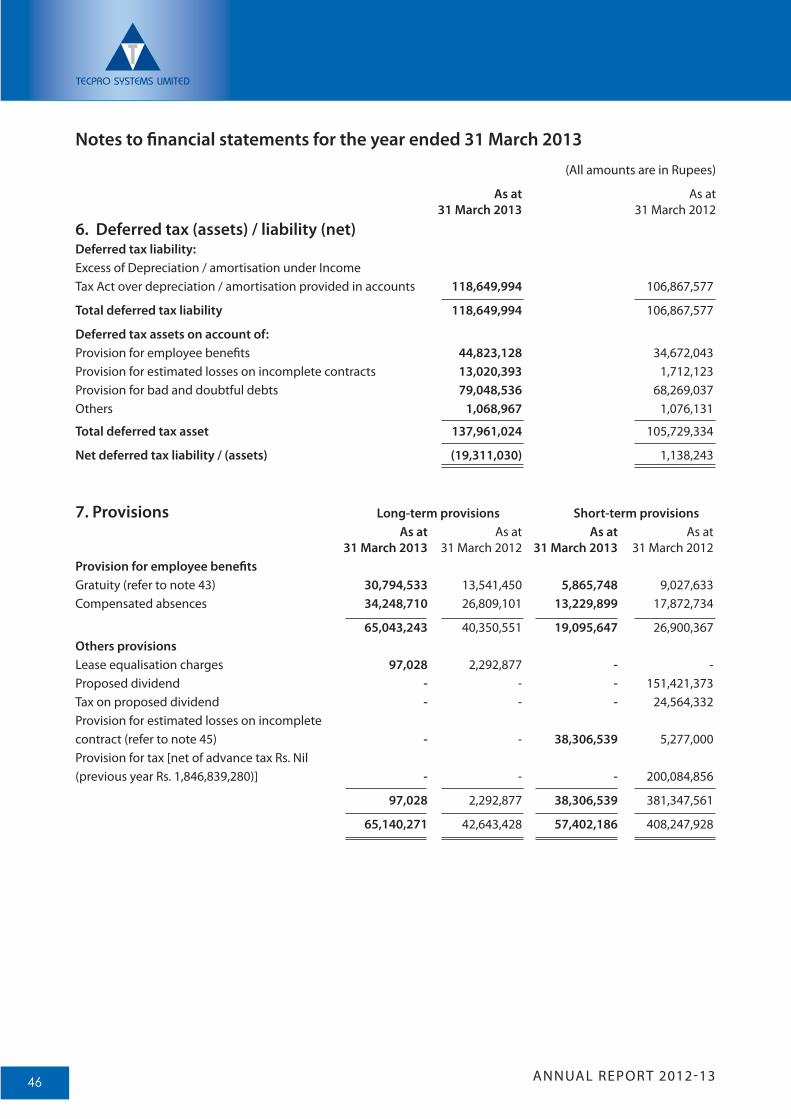
ANNUAL REPORT 2012-1346
Notes to financial statements for the year ended 31 March 2013
(All amounts are in Rupees)
As at As at 31 March 2013 31 March 2012
6. Deferred tax (assets) / liability (net)Deferred tax liability:Excess of Depreciation / amortisation under Income Tax Act over depreciation / amortisation provided in accounts 118,649,994 106,867,577
Total deferred tax liability 118,649,994 106,867,577
Deferred tax assets on account of:Provision for employee benefits 44,823,128 34,672,043Provision for estimated losses on incomplete contracts 13,020,393 1,712,123Provision for bad and doubtful debts 79,048,536 68,269,037Others 1,068,967 1,076,131
Total deferred tax asset 137,961,024 105,729,334
Net deferred tax liability / (assets) (19,311,030) 1,138,243
7. Provisions Long-term provisions Short-term provisions As at As at As at As at 31 March 2013 31 March 2012 31 March 2013 31 March 2012Provision for employee benefitsGratuity (refer to note 43) 30,794,533 13,541,450 5,865,748 9,027,633 Compensated absences 34,248,710 26,809,101 13,229,899 17,872,734
65,043,243 40,350,551 19,095,647 26,900,367 Others provisionsLease equalisation charges 97,028 2,292,877 - - Proposed dividend - - - 151,421,373 Tax on proposed dividend - - - 24,564,332Provision for estimated losses on incomplete contract (refer to note 45) - - 38,306,539 5,277,000 Provision for tax [net of advance tax Rs. Nil (previous year Rs. 1,846,839,280)] - - - 200,084,856
97,028 2,292,877 38,306,539 381,347,561
65,140,271 42,643,428 57,402,186 408,247,928
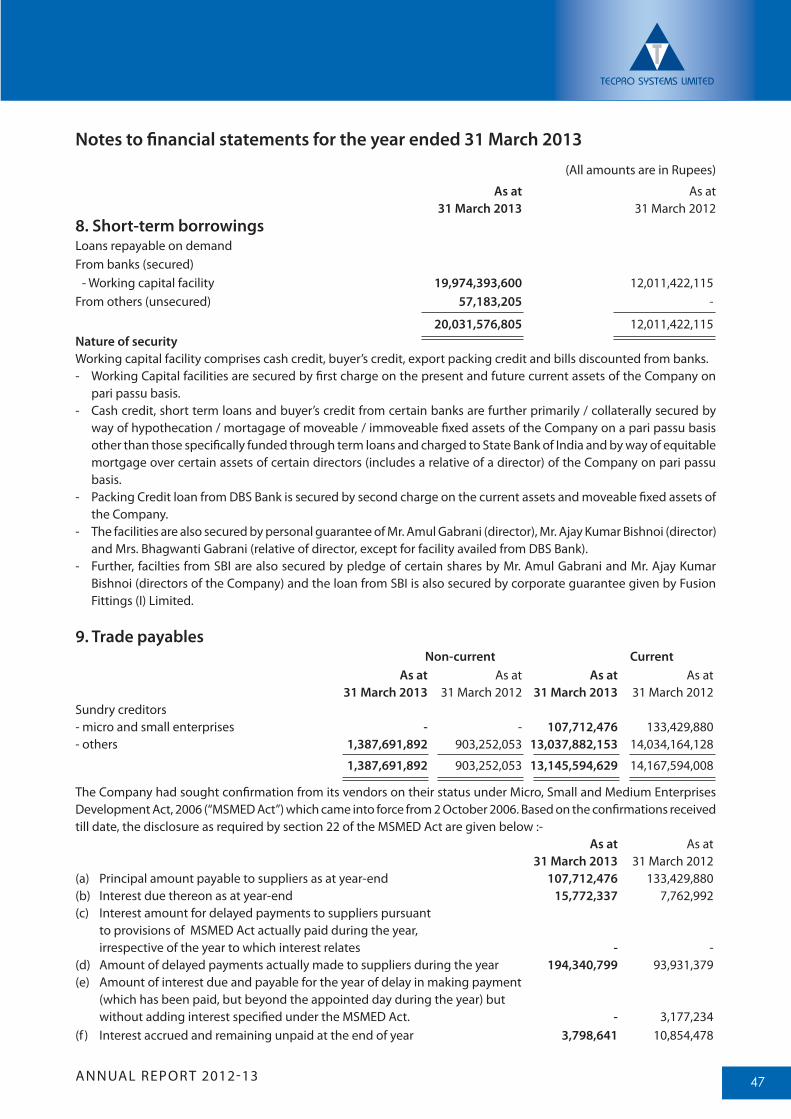
ANNUAL REPORT 2012-13 47
Notes to financial statements for the year ended 31 March 2013
(All amounts are in Rupees)
As at As at 31 March 2013 31 March 20128. Short-term borrowingsLoans repayable on demand From banks (secured) - Working capital facility 19,974,393,600 12,011,422,115 From others (unsecured) 57,183,205 -
20,031,576,805 12,011,422,115 Nature of securityWorking capital facility comprises cash credit, buyer’s credit, export packing credit and bills discounted from banks. - Working Capital facilities are secured by first charge on the present and future current assets of the Company on
pari passu basis. - Cash credit, short term loans and buyer’s credit from certain banks are further primarily / collaterally secured by
way of hypothecation / mortagage of moveable / immoveable fixed assets of the Company on a pari passu basis other than those specifically funded through term loans and charged to State Bank of India and by way of equitable mortgage over certain assets of certain directors (includes a relative of a director) of the Company on pari passu basis.
- Packing Credit loan from DBS Bank is secured by second charge on the current assets and moveable fixed assets of the Company.
- The facilities are also secured by personal guarantee of Mr. Amul Gabrani (director), Mr. Ajay Kumar Bishnoi (director) and Mrs. Bhagwanti Gabrani (relative of director, except for facility availed from DBS Bank).
- Further, facilties from SBI are also secured by pledge of certain shares by Mr. Amul Gabrani and Mr. Ajay Kumar Bishnoi (directors of the Company) and the loan from SBI is also secured by corporate guarantee given by Fusion Fittings (I) Limited.
9. Trade payables Non-current Current As at As at As at As at 31 March 2013 31 March 2012 31 March 2013 31 March 2012 Sundry creditors- micro and small enterprises - - 107,712,476 133,429,880 - others 1,387,691,892 903,252,053 13,037,882,153 14,034,164,128
1,387,691,892 903,252,053 13,145,594,629 14,167,594,008
The Company had sought confirmation from its vendors on their status under Micro, Small and Medium Enterprises Development Act, 2006 (“MSMED Act”) which came into force from 2 October 2006. Based on the confirmations received till date, the disclosure as required by section 22 of the MSMED Act are given below :- As at As at 31 March 2013 31 March 2012(a) Principal amount payable to suppliers as at year-end 107,712,476 133,429,880(b) Interest due thereon as at year-end 15,772,337 7,762,992 (c) Interest amount for delayed payments to suppliers pursuant to provisions of MSMED Act actually paid during the year, irrespective of the year to which interest relates - - (d) Amount of delayed payments actually made to suppliers during the year 194,340,799 93,931,379 (e) Amount of interest due and payable for the year of delay in making payment (which has been paid, but beyond the appointed day during the year) but without adding interest specified under the MSMED Act. - 3,177,234(f ) Interest accrued and remaining unpaid at the end of year 3,798,641 10,854,478
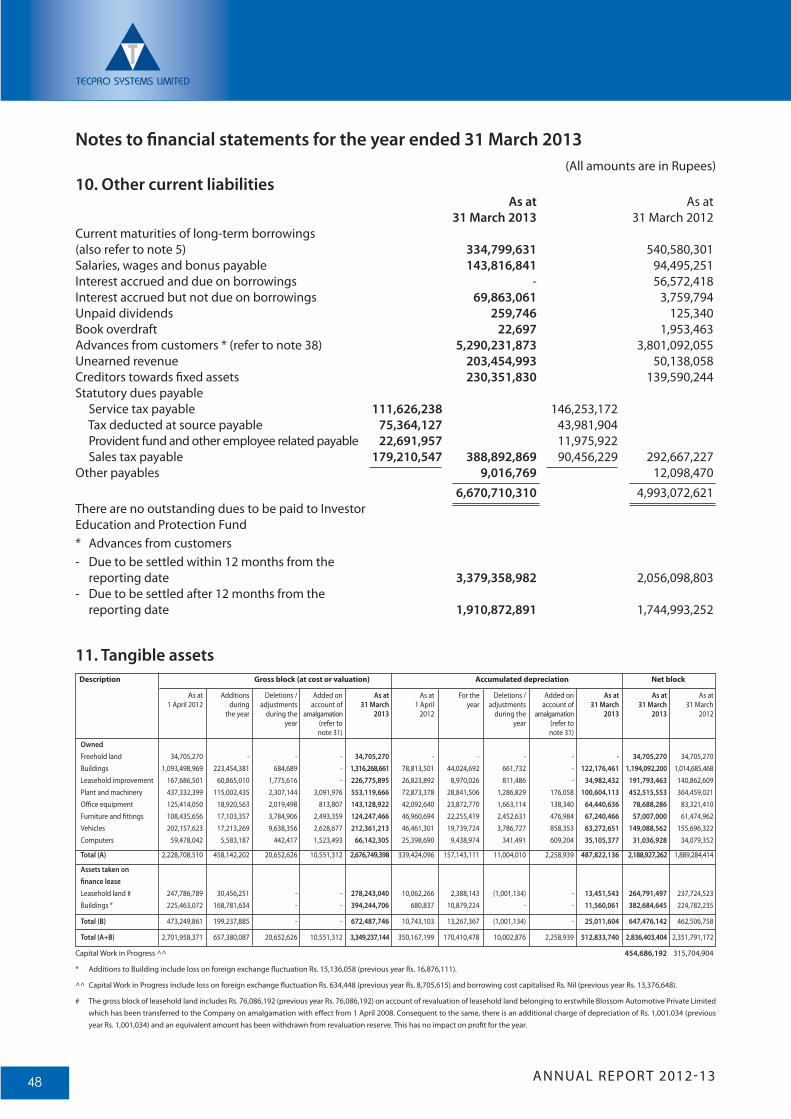
ANNUAL REPORT 2012-1348
Notes to financial statements for the year ended 31 March 2013
10. Other current liabilities As at As at 31 March 2013 31 March 2012Current maturities of long-term borrowings (also refer to note 5) 334,799,631 540,580,301Salaries, wages and bonus payable 143,816,841 94,495,251Interest accrued and due on borrowings - 56,572,418Interest accrued but not due on borrowings 69,863,061 3,759,794 Unpaid dividends 259,746 125,340Book overdraft 22,697 1,953,463 Advances from customers * (refer to note 38) 5,290,231,873 3,801,092,055 Unearned revenue 203,454,993 50,138,058 Creditors towards fixed assets 230,351,830 139,590,244 Statutory dues payable Service tax payable 111,626,238 146,253,172 Tax deducted at source payable 75,364,127 43,981,904 Provident fund and other employee related payable 22,691,957 11,975,922 Sales tax payable 179,210,547 388,892,869 90,456,229 292,667,227 Other payables 9,016,769 12,098,470 6,670,710,310 4,993,072,621 There are no outstanding dues to be paid to Investor Education and Protection Fund* Advances from customers- Due to be settled within 12 months from the reporting date 3,379,358,982 2,056,098,803- Due to be settled after 12 months from the reporting date 1,910,872,891 1,744,993,252
11. Tangible assetsDescription Gross block (at cost or valuation) Accumulated depreciation Net block
As at Additions Deletions / Added on As at As at For the Deletions / Added on As at As at As at 1 April 2012 during adjustments account of 31 March 1 April year adjustments account of 31 March 31 March 31 March the year during the amalgamation 2013 2012 during the amalgamation 2013 2013 2012 year (refer to year (refer to note 31) note 31)
OwnedFreehold land 34,705,270 - - - 34,705,270 - - - - - 34,705,270 34,705,270 Buildings 1,093,498,969 223,454,381 684,689 - 1,316,268,661 78,813,501 44,024,692 661,732 - 122,176,461 1,194,092,200 1,014,685,468 Leasehold improvement 167,686,501 60,865,010 1,775,616 - 226,775,895 26,823,892 8,970,026 811,486 - 34,982,432 191,793,463 140,862,609Plant and machinery 437,332,399 115,002,435 2,307,144 3,091,976 553,119,666 72,873,378 28,841,506 1,286,829 176,058 100,604,113 452,515,553 364,459,021Office equipment 125,414,050 18,920,563 2,019,498 813,807 143,128,922 42,092,640 23,872,770 1,663,114 138,340 64,440,636 78,688,286 83,321,410 Furniture and fittings 108,435,656 17,103,357 3,784,906 2,493,359 124,247,466 46,960,694 22,255,419 2,452,631 476,984 67,240,466 57,007,000 61,474,962 Vehicles 202,157,623 17,213,269 9,638,356 2,628,677 212,361,213 46,461,301 19,739,724 3,786,727 858,353 63,272,651 149,088,562 155,696,322Computers 59,478,042 5,583,187 442,417 1,523,493 66,142,305 25,398,690 9,438,974 341,491 609,204 35,105,377 31,036,928 34,079,352
Total (A) 2,228,708,510 458,142,202 20,652,626 10,551,312 2,676,749,398 339,424,096 157,143,111 11,004,010 2,258,939 487,822,136 2,188,927,262 1,889,284,414
Assets taken on finance leaseLeasehold land # 247,786,789 30,456,251 - - 278,243,040 10,062,266 2,388,143 (1,001,134) - 13,451,543 264,791,497 237,724,523Buildings * 225,463,072 168,781,634 - - 394,244,706 680,837 10,879,224 - - 11,560,061 382,684,645 224,782,235
Total (B) 473,249,861 199,237,885 - - 672,487,746 10,743,103 13,267,367 (1,001,134) - 25,011,604 647,476,142 462,506,758
Total (A+B) 2,701,958,371 657,380,087 20,652,626 10,551,312 3,349,237,144 350,167,199 170,410,478 10,002,876 2,258,939 512,833,740 2,836,403,404 2,351,791,172
Capital Work in Progress ^^ 454,686,192 315,704,904
* Additions to Building include loss on foreign exchange fluctuation Rs. 15,136,058 (previous year Rs. 16,876,111).
^^ Capital Work in Progress include loss on foreign exchange fluctuation Rs. 634,448 (previous year Rs. 8,705,615) and borrowing cost capitalised Rs. Nil (previous year Rs. 13,376,648).
# The gross block of leasehold land includes Rs. 76,086,192 (previous year Rs. 76,086,192) on account of revaluation of leasehold land belonging to erstwhile Blossom Automotive Private Limited which has been transferred to the Company on amalgamation with effect from 1 April 2008. Consequent to the same, there is an additional charge of depreciation of Rs. 1,001,034 (previous year Rs. 1,001,034) and an equivalent amount has been withdrawn from revaluation reserve. This has no impact on profit for the year.
(All amounts are in Rupees)
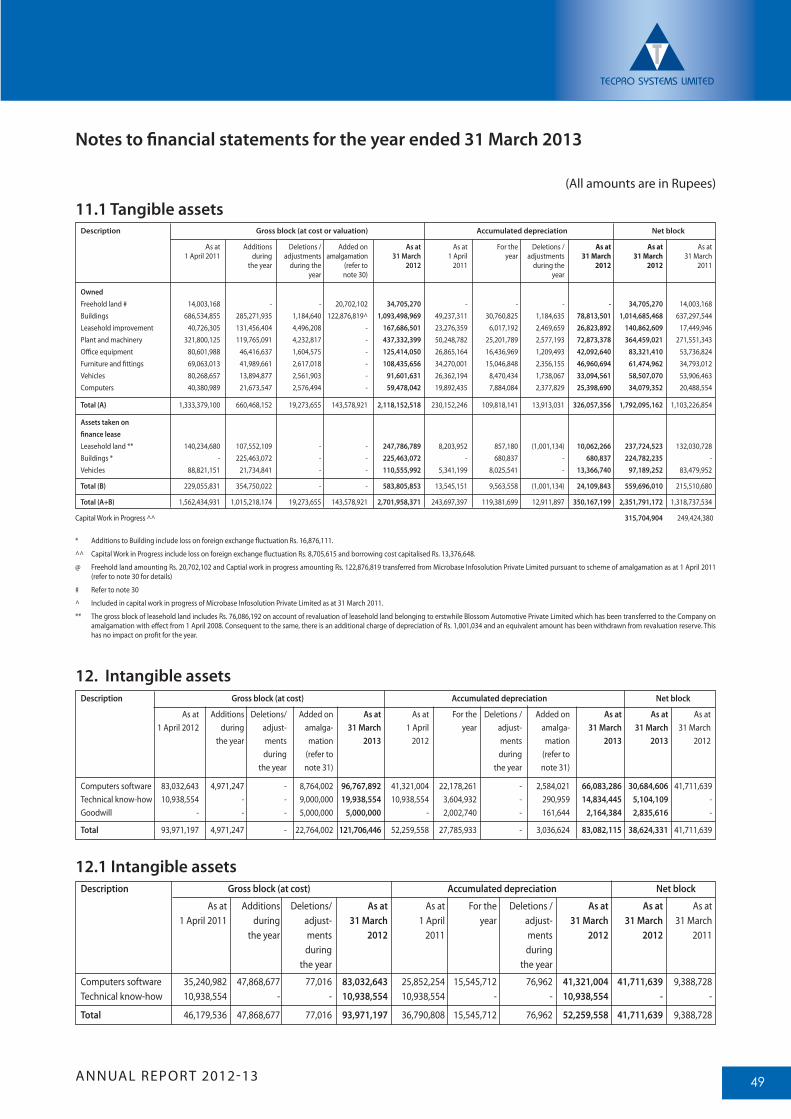
ANNUAL REPORT 2012-13 49
(All amounts are in Rupees)
12. Intangible assetsDescription Gross block (at cost) Accumulated depreciation Net block
As at Additions Deletions/ Added on As at As at For the Deletions / Added on As at As at As at 1 April 2012 during adjust- amalga- 31 March 1 April year adjust- amalga- 31 March 31 March 31 March the year ments mation 2013 2012 ments mation 2013 2013 2012 during (refer to during (refer to the year note 31) the year note 31)
Computers software 83,032,643 4,971,247 - 8,764,002 96,767,892 41,321,004 22,178,261 - 2,584,021 66,083,286 30,684,606 41,711,639 Technical know-how 10,938,554 - - 9,000,000 19,938,554 10,938,554 3,604,932 - 290,959 14,834,445 5,104,109 - Goodwill - - - 5,000,000 5,000,000 - 2,002,740 - 161,644 2,164,384 2,835,616 -
Total 93,971,197 4,971,247 - 22,764,002 121,706,446 52,259,558 27,785,933 - 3,036,624 83,082,115 38,624,331 41,711,639
Notes to financial statements for the year ended 31 March 2013
11.1 Tangible assetsDescription Gross block (at cost or valuation) Accumulated depreciation Net block
As at Additions Deletions / Added on As at As at For the Deletions / As at As at As at 1 April 2011 during adjustments amalgamation 31 March 1 April year adjustments 31 March 31 March 31 March the year during the (refer to 2012 2011 during the 2012 2012 2011 year note 30) year
OwnedFreehold land # 14,003,168 - - 20,702,102 34,705,270 - - - - 34,705,270 14,003,168Buildings 686,534,855 285,271,935 1,184,640 122,876,819^ 1,093,498,969 49,237,311 30,760,825 1,184,635 78,813,501 1,014,685,468 637,297,544Leasehold improvement 40,726,305 131,456,404 4,496,208 - 167,686,501 23,276,359 6,017,192 2,469,659 26,823,892 140,862,609 17,449,946 Plant and machinery 321,800,125 119,765,091 4,232,817 - 437,332,399 50,248,782 25,201,789 2,577,193 72,873,378 364,459,021 271,551,343Office equipment 80,601,988 46,416,637 1,604,575 - 125,414,050 26,865,164 16,436,969 1,209,493 42,092,640 83,321,410 53,736,824 Furniture and fittings 69,063,013 41,989,661 2,617,018 - 108,435,656 34,270,001 15,046,848 2,356,155 46,960,694 61,474,962 34,793,012 Vehicles 80,268,657 13,894,877 2,561,903 - 91,601,631 26,362,194 8,470,434 1,738,067 33,094,561 58,507,070 53,906,463 Computers 40,380,989 21,673,547 2,576,494 - 59,478,042 19,892,435 7,884,084 2,377,829 25,398,690 34,079,352 20,488,554
Total (A) 1,333,379,100 660,468,152 19,273,655 143,578,921 2,118,152,518 230,152,246 109,818,141 13,913,031 326,057,356 1,792,095,162 1,103,226,854
Assets taken on finance leaseLeasehold land ** 140,234,680 107,552,109 - - 247,786,789 8,203,952 857,180 (1,001,134) 10,062,266 237,724,523 132,030,728Buildings * - 225,463,072 - - 225,463,072 - 680,837 - 680,837 224,782,235 - Vehicles 88,821,151 21,734,841 - - 110,555,992 5,341,199 8,025,541 - 13,366,740 97,189,252 83,479,952
Total (B) 229,055,831 354,750,022 - - 583,805,853 13,545,151 9,563,558 (1,001,134) 24,109,843 559,696,010 215,510,680
Total (A+B) 1,562,434,931 1,015,218,174 19,273,655 143,578,921 2,701,958,371 243,697,397 119,381,699 12,911,897 350,167,199 2,351,791,172 1,318,737,534
Capital Work in Progress ^^ 315,704,904 249,424,380
* Additions to Building include loss on foreign exchange fluctuation Rs. 16,876,111.
^^ Capital Work in Progress include loss on foreign exchange fluctuation Rs. 8,705,615 and borrowing cost capitalised Rs. 13,376,648.
@ Freehold land amounting Rs. 20,702,102 and Captial work in progress amounting Rs. 122,876,819 transferred from Microbase Infosolution Private Limited pursuant to scheme of amalgamation as at 1 April 2011 (refer to note 30 for details)
# Refer to note 30
^ Included in capital work in progress of Microbase Infosolution Private Limited as at 31 March 2011.
** The gross block of leasehold land includes Rs. 76,086,192 on account of revaluation of leasehold land belonging to erstwhile Blossom Automotive Private Limited which has been transferred to the Company on amalgamation with effect from 1 April 2008. Consequent to the same, there is an additional charge of depreciation of Rs. 1,001,034 and an equivalent amount has been withdrawn from revaluation reserve. This has no impact on profit for the year.
12.1 Intangible assetsDescription Gross block (at cost) Accumulated depreciation Net block
As at Additions Deletions/ As at As at For the Deletions / As at As at As at 1 April 2011 during adjust- 31 March 1 April year adjust- 31 March 31 March 31 March the year ments 2012 2011 ments 2012 2012 2011 during during the year the year
Computers software 35,240,982 47,868,677 77,016 83,032,643 25,852,254 15,545,712 76,962 41,321,004 41,711,639 9,388,728 Technical know-how 10,938,554 - - 10,938,554 10,938,554 - - 10,938,554 - -
Total 46,179,536 47,868,677 77,016 93,971,197 36,790,808 15,545,712 76,962 52,259,558 41,711,639 9,388,728
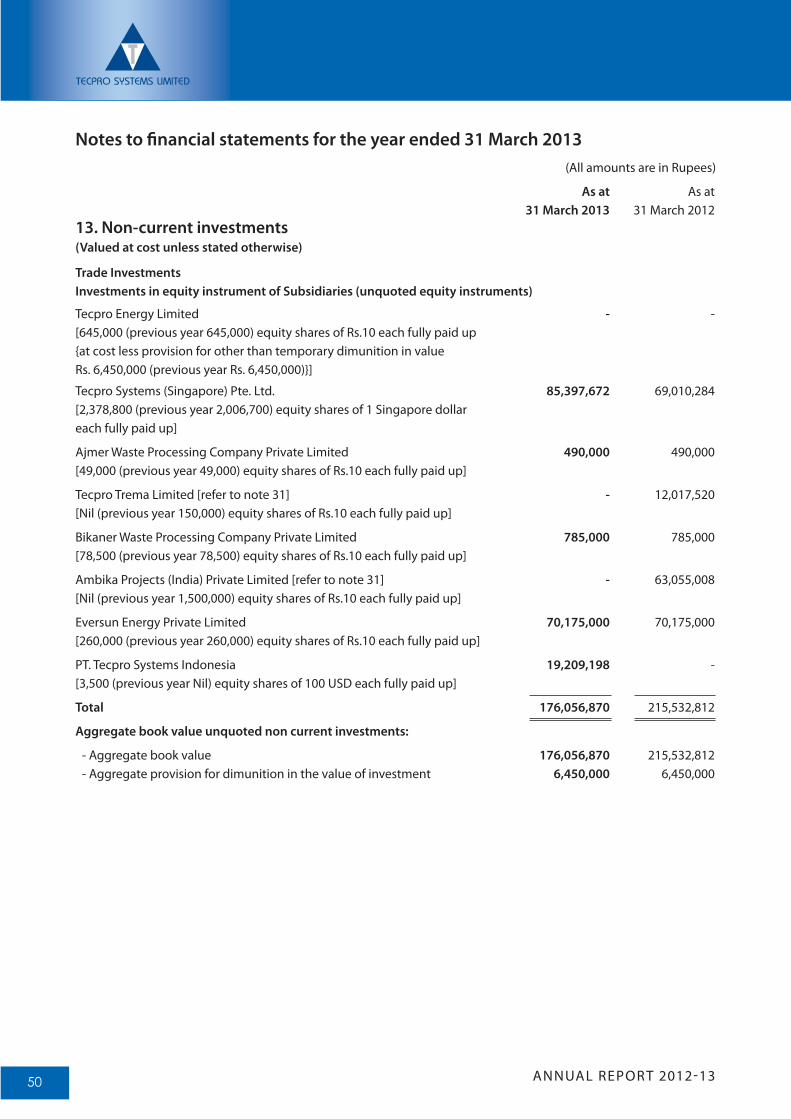
ANNUAL REPORT 2012-1350
Notes to financial statements for the year ended 31 March 2013 (All amounts are in Rupees)
As at As at 31 March 2013 31 March 201213. Non-current investments(Valued at cost unless stated otherwise)
Trade Investments Investments in equity instrument of Subsidiaries (unquoted equity instruments)
Tecpro Energy Limited - - [645,000 (previous year 645,000) equity shares of Rs.10 each fully paid up {at cost less provision for other than temporary dimunition in value Rs. 6,450,000 (previous year Rs. 6,450,000)}]
Tecpro Systems (Singapore) Pte. Ltd. 85,397,672 69,010,284 [2,378,800 (previous year 2,006,700) equity shares of 1 Singapore dollareach fully paid up]
Ajmer Waste Processing Company Private Limited 490,000 490,000 [49,000 (previous year 49,000) equity shares of Rs.10 each fully paid up]
Tecpro Trema Limited [refer to note 31] - 12,017,520[Nil (previous year 150,000) equity shares of Rs.10 each fully paid up]
Bikaner Waste Processing Company Private Limited 785,000 785,000[78,500 (previous year 78,500) equity shares of Rs.10 each fully paid up]
Ambika Projects (India) Private Limited [refer to note 31] - 63,055,008 [Nil (previous year 1,500,000) equity shares of Rs.10 each fully paid up]
Eversun Energy Private Limited 70,175,000 70,175,000[260,000 (previous year 260,000) equity shares of Rs.10 each fully paid up]
PT. Tecpro Systems Indonesia 19,209,198 - [3,500 (previous year Nil) equity shares of 100 USD each fully paid up]
Total 176,056,870 215,532,812
Aggregate book value unquoted non current investments:
- Aggregate book value 176,056,870 215,532,812 - Aggregate provision for dimunition in the value of investment 6,450,000 6,450,000
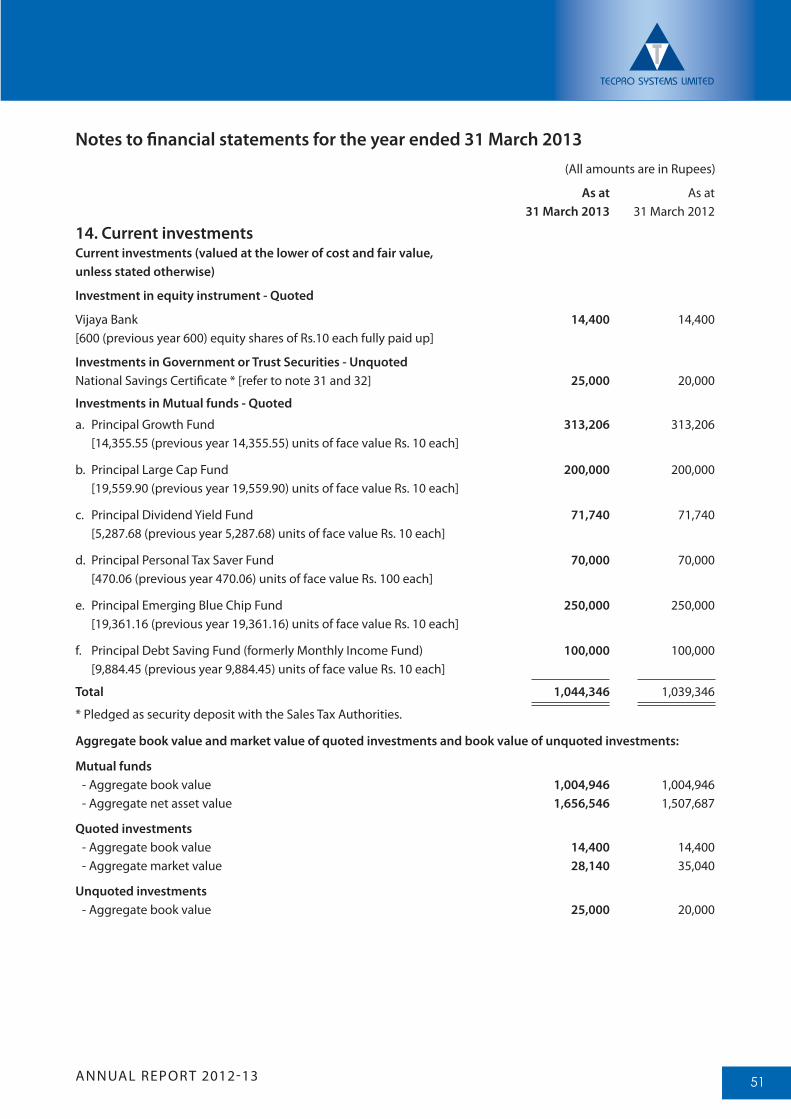
ANNUAL REPORT 2012-13 51
Notes to financial statements for the year ended 31 March 2013(All amounts are in Rupees)
As at As at 31 March 2013 31 March 2012
14. Current investmentsCurrent investments (valued at the lower of cost and fair value, unless stated otherwise)
Investment in equity instrument - Quoted
Vijaya Bank 14,400 14,400[600 (previous year 600) equity shares of Rs.10 each fully paid up]
Investments in Government or Trust Securities - UnquotedNational Savings Certificate * [refer to note 31 and 32] 25,000 20,000
Investments in Mutual funds - Quoted
a. Principal Growth Fund 313,206 313,206 [14,355.55 (previous year 14,355.55) units of face value Rs. 10 each]
b. Principal Large Cap Fund 200,000 200,000 [19,559.90 (previous year 19,559.90) units of face value Rs. 10 each]
c. Principal Dividend Yield Fund 71,740 71,740 [5,287.68 (previous year 5,287.68) units of face value Rs. 10 each]
d. Principal Personal Tax Saver Fund 70,000 70,000 [470.06 (previous year 470.06) units of face value Rs. 100 each]
e. Principal Emerging Blue Chip Fund 250,000 250,000 [19,361.16 (previous year 19,361.16) units of face value Rs. 10 each]
f. Principal Debt Saving Fund (formerly Monthly Income Fund) 100,000 100,000 [9,884.45 (previous year 9,884.45) units of face value Rs. 10 each]
Total 1,044,346 1,039,346
* Pledged as security deposit with the Sales Tax Authorities.
Aggregate book value and market value of quoted investments and book value of unquoted investments:
Mutual funds - Aggregate book value 1,004,946 1,004,946 - Aggregate net asset value 1,656,546 1,507,687
Quoted investments - Aggregate book value 14,400 14,400 - Aggregate market value 28,140 35,040
Unquoted investments - Aggregate book value 25,000 20,000
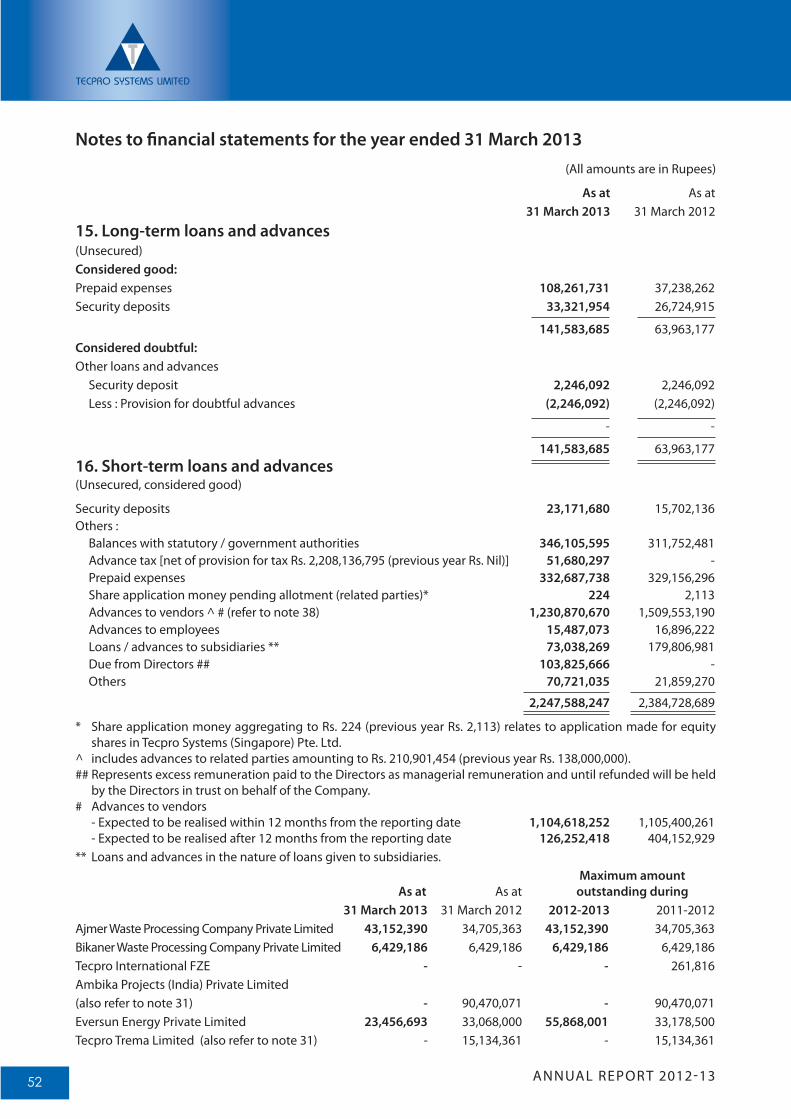
ANNUAL REPORT 2012-1352
Notes to financial statements for the year ended 31 March 2013(All amounts are in Rupees)
As at As at 31 March 2013 31 March 2012
15. Long-term loans and advances (Unsecured) Considered good: Prepaid expenses 108,261,731 37,238,262 Security deposits 33,321,954 26,724,915
141,583,685 63,963,177 Considered doubtful: Other loans and advances Security deposit 2,246,092 2,246,092 Less : Provision for doubtful advances (2,246,092) (2,246,092)
- -
141,583,685 63,963,17716. Short-term loans and advances (Unsecured, considered good)
Security deposits 23,171,680 15,702,136Others :
Balances with statutory / government authorities 346,105,595 311,752,481Advance tax [net of provision for tax Rs. 2,208,136,795 (previous year Rs. Nil)] 51,680,297 - Prepaid expenses 332,687,738 329,156,296 Share application money pending allotment (related parties)* 224 2,113 Advances to vendors ^ # (refer to note 38) 1,230,870,670 1,509,553,190 Advances to employees 15,487,073 16,896,222Loans / advances to subsidiaries ** 73,038,269 179,806,981Due from Directors ## 103,825,666 - Others 70,721,035 21,859,270
2,247,588,247 2,384,728,689
* Share application money aggregating to Rs. 224 (previous year Rs. 2,113) relates to application made for equity shares in Tecpro Systems (Singapore) Pte. Ltd.
^ includes advances to related parties amounting to Rs. 210,901,454 (previous year Rs. 138,000,000).## Represents excess remuneration paid to the Directors as managerial remuneration and until refunded will be held
by the Directors in trust on behalf of the Company.# Advances to vendors - Expected to be realised within 12 months from the reporting date 1,104,618,252 1,105,400,261 - Expected to be realised after 12 months from the reporting date 126,252,418 404,152,929** Loans and advances in the nature of loans given to subsidiaries. Maximum amount As at As at outstanding during 31 March 2013 31 March 2012 2012-2013 2011-2012Ajmer Waste Processing Company Private Limited 43,152,390 34,705,363 43,152,390 34,705,363Bikaner Waste Processing Company Private Limited 6,429,186 6,429,186 6,429,186 6,429,186Tecpro International FZE - - - 261,816Ambika Projects (India) Private Limited (also refer to note 31) - 90,470,071 - 90,470,071 Eversun Energy Private Limited 23,456,693 33,068,000 55,868,001 33,178,500 Tecpro Trema Limited (also refer to note 31) - 15,134,361 - 15,134,361
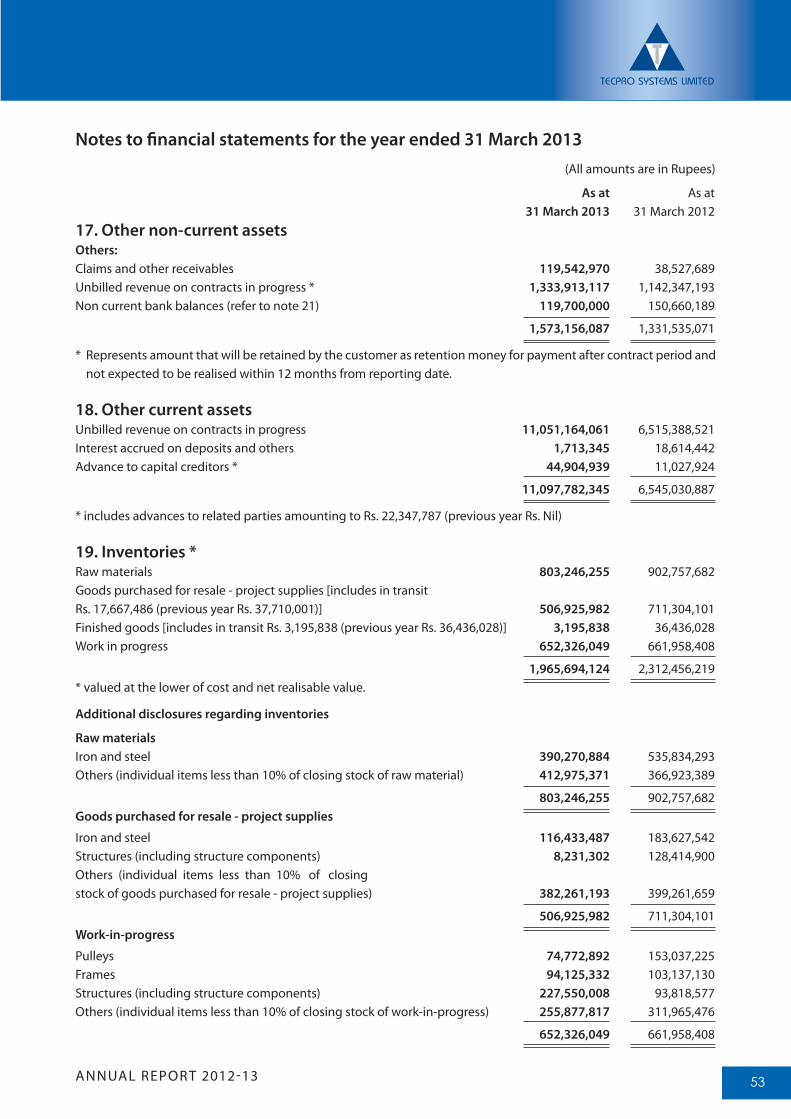
ANNUAL REPORT 2012-13 53
17. Other non-current assets Others: Claims and other receivables 119,542,970 38,527,689 Unbilled revenue on contracts in progress * 1,333,913,117 1,142,347,193Non current bank balances (refer to note 21) 119,700,000 150,660,189
1,573,156,087 1,331,535,071
* Represents amount that will be retained by the customer as retention money for payment after contract period and not expected to be realised within 12 months from reporting date.
18. Other current assetsUnbilled revenue on contracts in progress 11,051,164,061 6,515,388,521Interest accrued on deposits and others 1,713,345 18,614,442Advance to capital creditors * 44,904,939 11,027,924
11,097,782,345 6,545,030,887
* includes advances to related parties amounting to Rs. 22,347,787 (previous year Rs. Nil)
19. Inventories *Raw materials 803,246,255 902,757,682Goods purchased for resale - project supplies [includes in transit Rs. 17,667,486 (previous year Rs. 37,710,001)] 506,925,982 711,304,101Finished goods [includes in transit Rs. 3,195,838 (previous year Rs. 36,436,028)] 3,195,838 36,436,028Work in progress 652,326,049 661,958,408
1,965,694,124 2,312,456,219* valued at the lower of cost and net realisable value.
Additional disclosures regarding inventories
Raw materials Iron and steel 390,270,884 535,834,293Others (individual items less than 10% of closing stock of raw material) 412,975,371 366,923,389
803,246,255 902,757,682Goods purchased for resale - project supplies
Iron and steel 116,433,487 183,627,542Structures (including structure components) 8,231,302 128,414,900Others (individual items less than 10% of closing stock of goods purchased for resale - project supplies) 382,261,193 399,261,659
506,925,982 711,304,101Work-in-progress
Pulleys 74,772,892 153,037,225Frames 94,125,332 103,137,130 Structures (including structure components) 227,550,008 93,818,577Others (individual items less than 10% of closing stock of work-in-progress) 255,877,817 311,965,476
652,326,049 661,958,408
Notes to financial statements for the year ended 31 March 2013(All amounts are in Rupees)
As at As at 31 March 2013 31 March 2012
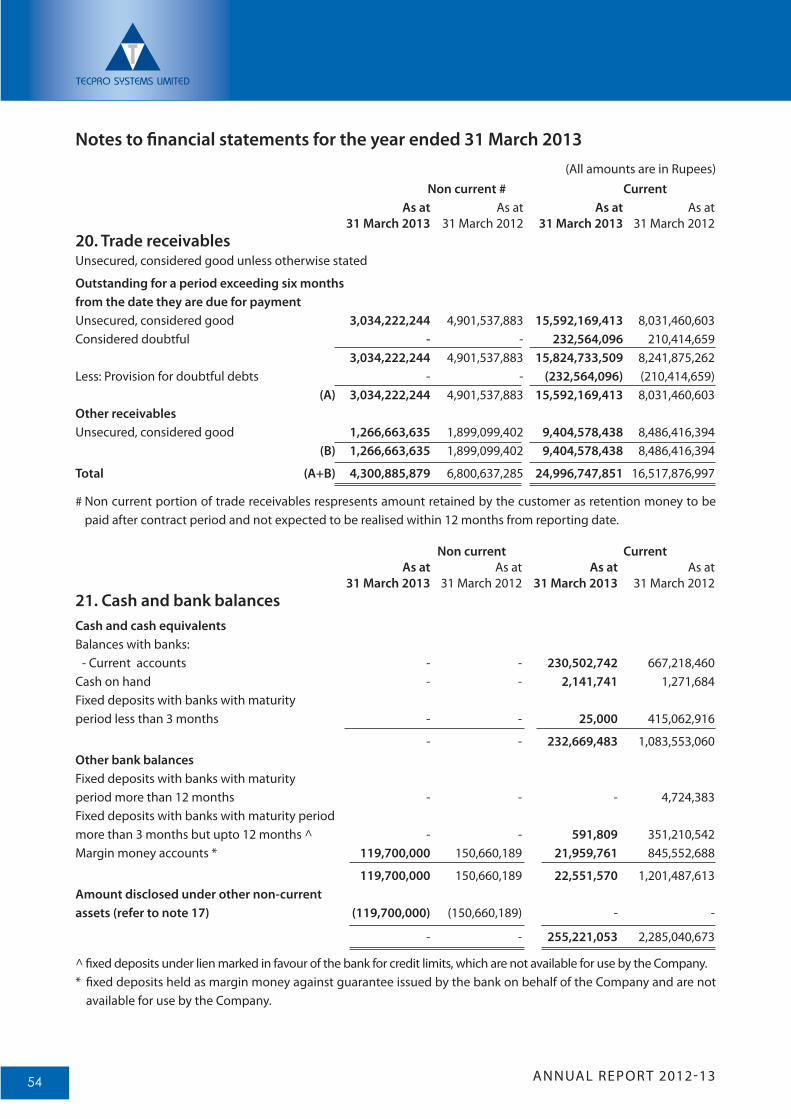
ANNUAL REPORT 2012-1354
Non current # Current As at As at As at As at 31 March 2013 31 March 2012 31 March 2013 31 March 2012 20. Trade receivablesUnsecured, considered good unless otherwise stated
Outstanding for a period exceeding six months from the date they are due for paymentUnsecured, considered good 3,034,222,244 4,901,537,883 15,592,169,413 8,031,460,603 Considered doubtful - - 232,564,096 210,414,659 3,034,222,244 4,901,537,883 15,824,733,509 8,241,875,262 Less: Provision for doubtful debts - - (232,564,096) (210,414,659) (A) 3,034,222,244 4,901,537,883 15,592,169,413 8,031,460,603Other receivablesUnsecured, considered good 1,266,663,635 1,899,099,402 9,404,578,438 8,486,416,394 (B) 1,266,663,635 1,899,099,402 9,404,578,438 8,486,416,394
Total (A+B) 4,300,885,879 6,800,637,285 24,996,747,851 16,517,876,997
# Non current portion of trade receivables respresents amount retained by the customer as retention money to be paid after contract period and not expected to be realised within 12 months from reporting date.
Non current Current As at As at As at As at 31 March 2013 31 March 2012 31 March 2013 31 March 2012 21. Cash and bank balances Cash and cash equivalentsBalances with banks: - Current accounts - - 230,502,742 667,218,460 Cash on hand - - 2,141,741 1,271,684Fixed deposits with banks with maturity period less than 3 months - - 25,000 415,062,916
- - 232,669,483 1,083,553,060 Other bank balancesFixed deposits with banks with maturity period more than 12 months - - - 4,724,383Fixed deposits with banks with maturity period more than 3 months but upto 12 months ^ - - 591,809 351,210,542 Margin money accounts * 119,700,000 150,660,189 21,959,761 845,552,688
119,700,000 150,660,189 22,551,570 1,201,487,613Amount disclosed under other non-current assets (refer to note 17) (119,700,000) (150,660,189) - -
- - 255,221,053 2,285,040,673
^ fixed deposits under lien marked in favour of the bank for credit limits, which are not available for use by the Company.* fixed deposits held as margin money against guarantee issued by the bank on behalf of the Company and are not
available for use by the Company.
Notes to financial statements for the year ended 31 March 2013(All amounts are in Rupees)
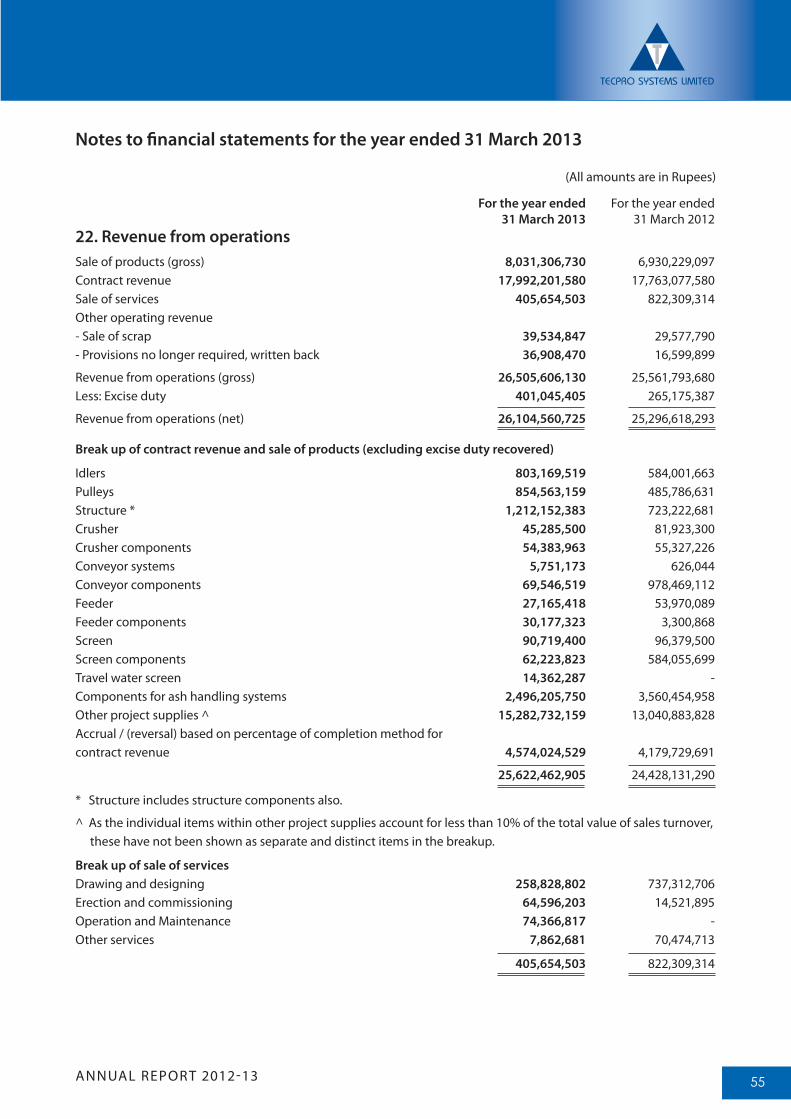
ANNUAL REPORT 2012-13 55
Notes to financial statements for the year ended 31 March 2013
(All amounts are in Rupees)
For the year ended For the year ended 31 March 2013 31 March 201222. Revenue from operationsSale of products (gross) 8,031,306,730 6,930,229,097Contract revenue 17,992,201,580 17,763,077,580Sale of services 405,654,503 822,309,314Other operating revenue- Sale of scrap 39,534,847 29,577,790 - Provisions no longer required, written back 36,908,470 16,599,899
Revenue from operations (gross) 26,505,606,130 25,561,793,680 Less: Excise duty 401,045,405 265,175,387
Revenue from operations (net) 26,104,560,725 25,296,618,293
Break up of contract revenue and sale of products (excluding excise duty recovered)
Idlers 803,169,519 584,001,663Pulleys 854,563,159 485,786,631 Structure * 1,212,152,383 723,222,681 Crusher 45,285,500 81,923,300 Crusher components 54,383,963 55,327,226 Conveyor systems 5,751,173 626,044 Conveyor components 69,546,519 978,469,112Feeder 27,165,418 53,970,089 Feeder components 30,177,323 3,300,868Screen 90,719,400 96,379,500 Screen components 62,223,823 584,055,699Travel water screen 14,362,287 -Components for ash handling systems 2,496,205,750 3,560,454,958 Other project supplies ^ 15,282,732,159 13,040,883,828 Accrual / (reversal) based on percentage of completion method for contract revenue 4,574,024,529 4,179,729,691
25,622,462,905 24,428,131,290
* Structure includes structure components also.
^ As the individual items within other project supplies account for less than 10% of the total value of sales turnover, these have not been shown as separate and distinct items in the breakup.
Break up of sale of servicesDrawing and designing 258,828,802 737,312,706 Erection and commissioning 64,596,203 14,521,895Operation and Maintenance 74,366,817 - Other services 7,862,681 70,474,713
405,654,503 822,309,314
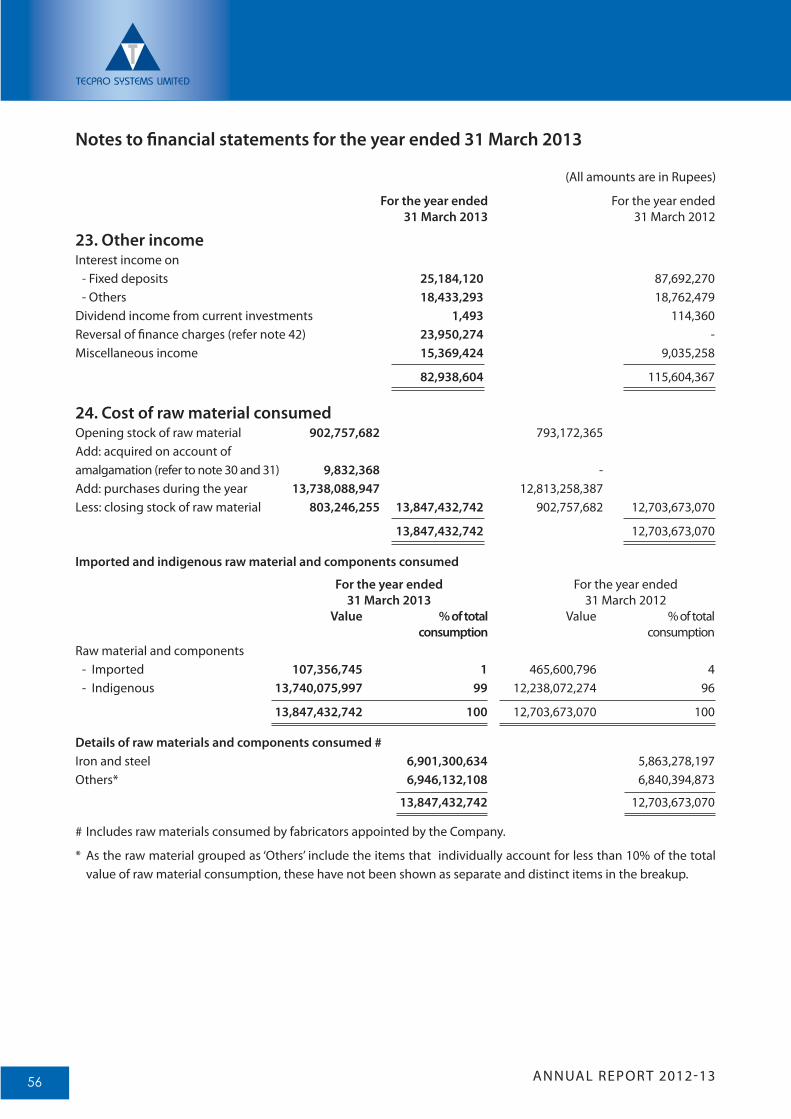
ANNUAL REPORT 2012-1356
Notes to financial statements for the year ended 31 March 2013
(All amounts are in Rupees)
For the year ended For the year ended 31 March 2013 31 March 2012
23. Other incomeInterest income on - Fixed deposits 25,184,120 87,692,270 - Others 18,433,293 18,762,479 Dividend income from current investments 1,493 114,360 Reversal of finance charges (refer note 42) 23,950,274 - Miscellaneous income 15,369,424 9,035,258
82,938,604 115,604,367
24. Cost of raw material consumedOpening stock of raw material 902,757,682 793,172,365Add: acquired on account of amalgamation (refer to note 30 and 31) 9,832,368 - Add: purchases during the year 13,738,088,947 12,813,258,387 Less: closing stock of raw material 803,246,255 13,847,432,742 902,757,682 12,703,673,070
13,847,432,742 12,703,673,070
Imported and indigenous raw material and components consumed
For the year ended For the year ended 31 March 2013 31 March 2012 Value % of total Value % of total consumption consumption Raw material and components - Imported 107,356,745 1 465,600,796 4 - Indigenous 13,740,075,997 99 12,238,072,274 96
13,847,432,742 100 12,703,673,070 100
Details of raw materials and components consumed #Iron and steel 6,901,300,634 5,863,278,197 Others* 6,946,132,108 6,840,394,873
13,847,432,742 12,703,673,070
# Includes raw materials consumed by fabricators appointed by the Company.
* As the raw material grouped as ‘Others’ include the items that individually account for less than 10% of the total value of raw material consumption, these have not been shown as separate and distinct items in the breakup.
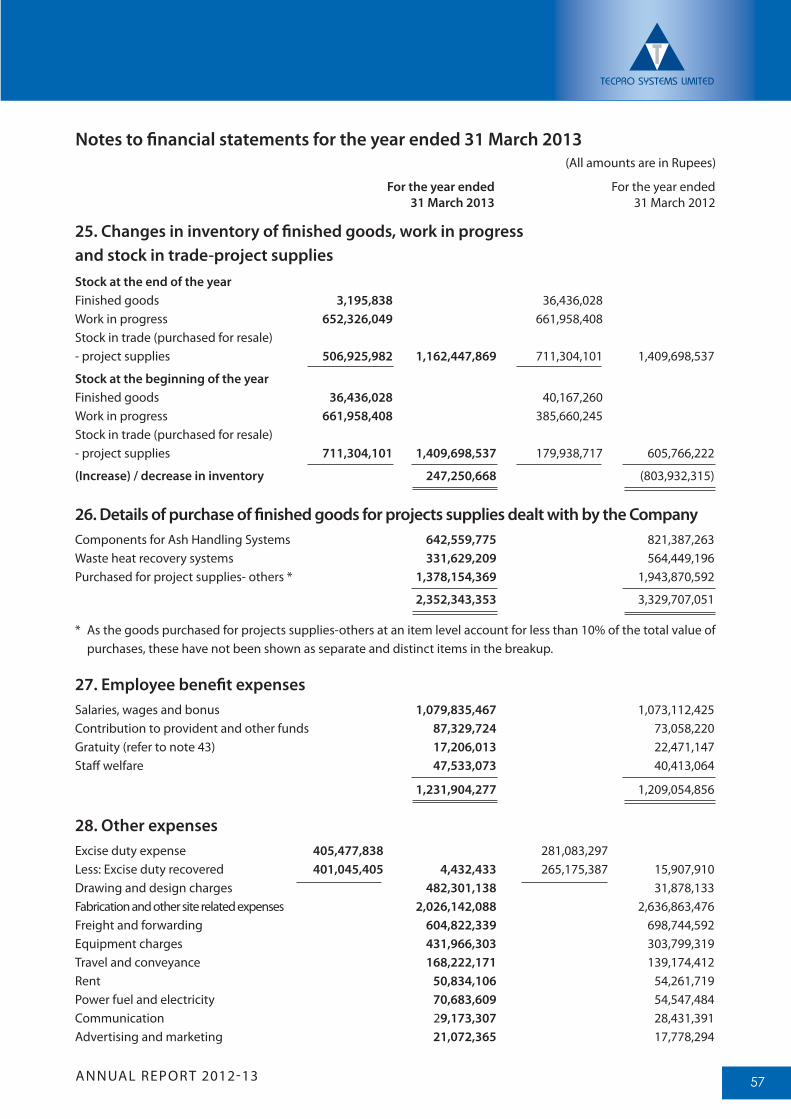
ANNUAL REPORT 2012-13 57
25. Changes in inventory of finished goods, work in progress and stock in trade-project suppliesStock at the end of the yearFinished goods 3,195,838 36,436,028Work in progress 652,326,049 661,958,408 Stock in trade (purchased for resale) - project supplies 506,925,982 1,162,447,869 711,304,101 1,409,698,537
Stock at the beginning of the yearFinished goods 36,436,028 40,167,260Work in progress 661,958,408 385,660,245Stock in trade (purchased for resale) - project supplies 711,304,101 1,409,698,537 179,938,717 605,766,222
(Increase) / decrease in inventory 247,250,668 (803,932,315)
26. Details of purchase of finished goods for projects supplies dealt with by the CompanyComponents for Ash Handling Systems 642,559,775 821,387,263Waste heat recovery systems 331,629,209 564,449,196 Purchased for project supplies- others * 1,378,154,369 1,943,870,592
2,352,343,353 3,329,707,051
* As the goods purchased for projects supplies-others at an item level account for less than 10% of the total value of purchases, these have not been shown as separate and distinct items in the breakup.
27. Employee benefit expensesSalaries, wages and bonus 1,079,835,467 1,073,112,425 Contribution to provident and other funds 87,329,724 73,058,220Gratuity (refer to note 43) 17,206,013 22,471,147Staff welfare 47,533,073 40,413,064
1,231,904,277 1,209,054,856
28. Other expensesExcise duty expense 405,477,838 281,083,297Less: Excise duty recovered 401,045,405 4,432,433 265,175,387 15,907,910 Drawing and design charges 482,301,138 31,878,133Fabrication and other site related expenses 2,026,142,088 2,636,863,476 Freight and forwarding 604,822,339 698,744,592Equipment charges 431,966,303 303,799,319Travel and conveyance 168,222,171 139,174,412 Rent 50,834,106 54,261,719 Power fuel and electricity 70,683,609 54,547,484 Communication 29,173,307 28,431,391Advertising and marketing 21,072,365 17,778,294
Notes to financial statements for the year ended 31 March 2013(All amounts are in Rupees)
For the year ended For the year ended 31 March 2013 31 March 2012
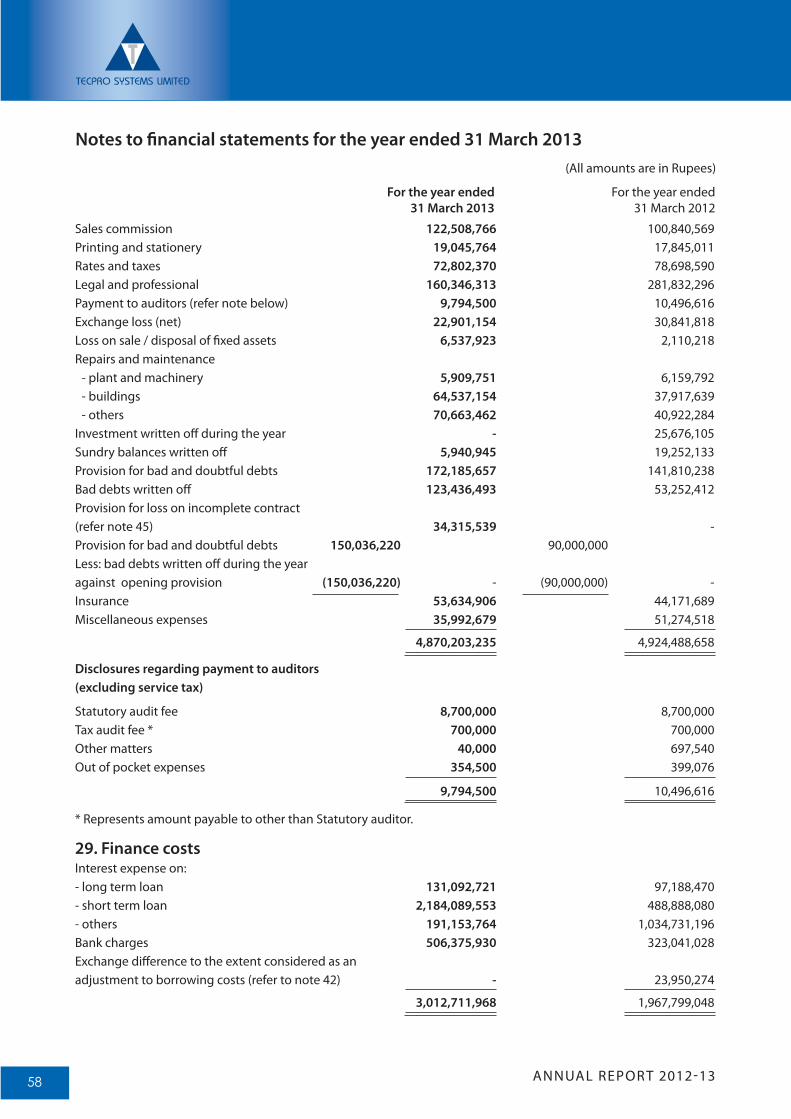
ANNUAL REPORT 2012-1358
Notes to financial statements for the year ended 31 March 2013(All amounts are in Rupees)
For the year ended For the year ended 31 March 2013 31 March 2012
Sales commission 122,508,766 100,840,569 Printing and stationery 19,045,764 17,845,011 Rates and taxes 72,802,370 78,698,590 Legal and professional 160,346,313 281,832,296 Payment to auditors (refer note below) 9,794,500 10,496,616 Exchange loss (net) 22,901,154 30,841,818 Loss on sale / disposal of fixed assets 6,537,923 2,110,218 Repairs and maintenance - plant and machinery 5,909,751 6,159,792 - buildings 64,537,154 37,917,639 - others 70,663,462 40,922,284Investment written off during the year - 25,676,105 Sundry balances written off 5,940,945 19,252,133 Provision for bad and doubtful debts 172,185,657 141,810,238 Bad debts written off 123,436,493 53,252,412 Provision for loss on incomplete contract (refer note 45) 34,315,539 - Provision for bad and doubtful debts 150,036,220 90,000,000 Less: bad debts written off during the year against opening provision (150,036,220) - (90,000,000) - Insurance 53,634,906 44,171,689 Miscellaneous expenses 35,992,679 51,274,518
4,870,203,235 4,924,488,658
Disclosures regarding payment to auditors (excluding service tax)
Statutory audit fee 8,700,000 8,700,000Tax audit fee * 700,000 700,000 Other matters 40,000 697,540 Out of pocket expenses 354,500 399,076
9,794,500 10,496,616
* Represents amount payable to other than Statutory auditor.
29. Finance costsInterest expense on:- long term loan 131,092,721 97,188,470- short term loan 2,184,089,553 488,888,080- others 191,153,764 1,034,731,196 Bank charges 506,375,930 323,041,028 Exchange difference to the extent considered as an adjustment to borrowing costs (refer to note 42) - 23,950,274
3,012,711,968 1,967,799,048
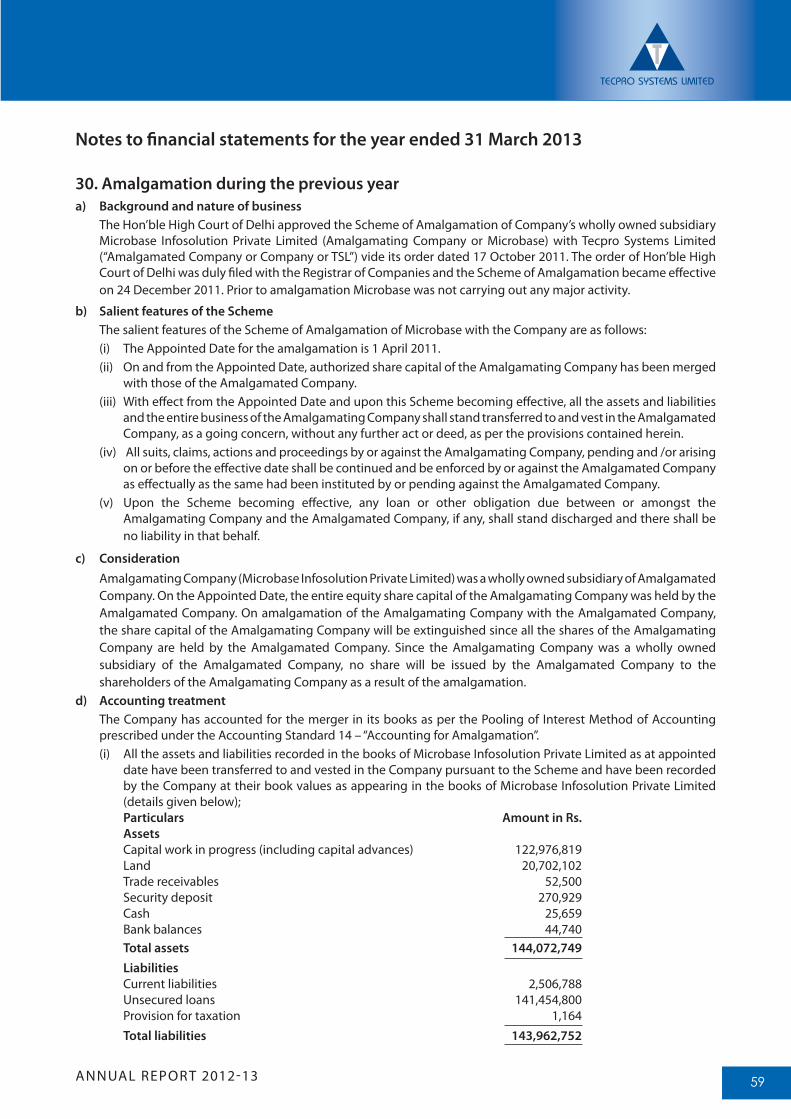
ANNUAL REPORT 2012-13 59
Notes to financial statements for the year ended 31 March 2013
30. Amalgamation during the previous year a) Background and nature of business The Hon’ble High Court of Delhi approved the Scheme of Amalgamation of Company’s wholly owned subsidiary
Microbase Infosolution Private Limited (Amalgamating Company or Microbase) with Tecpro Systems Limited (“Amalgamated Company or Company or TSL”) vide its order dated 17 October 2011. The order of Hon’ble High Court of Delhi was duly filed with the Registrar of Companies and the Scheme of Amalgamation became effective on 24 December 2011. Prior to amalgamation Microbase was not carrying out any major activity.
b) Salient features of the Scheme The salient features of the Scheme of Amalgamation of Microbase with the Company are as follows:
(i) The Appointed Date for the amalgamation is 1 April 2011. (ii) On and from the Appointed Date, authorized share capital of the Amalgamating Company has been merged
with those of the Amalgamated Company.(iii) With effect from the Appointed Date and upon this Scheme becoming effective, all the assets and liabilities
and the entire business of the Amalgamating Company shall stand transferred to and vest in the Amalgamated Company, as a going concern, without any further act or deed, as per the provisions contained herein.
(iv) All suits, claims, actions and proceedings by or against the Amalgamating Company, pending and /or arising on or before the effective date shall be continued and be enforced by or against the Amalgamated Company as effectually as the same had been instituted by or pending against the Amalgamated Company.
(v) Upon the Scheme becoming effective, any loan or other obligation due between or amongst the Amalgamating Company and the Amalgamated Company, if any, shall stand discharged and there shall be no liability in that behalf.
c) Consideration Amalgamating Company (Microbase Infosolution Private Limited) was a wholly owned subsidiary of Amalgamated
Company. On the Appointed Date, the entire equity share capital of the Amalgamating Company was held by the Amalgamated Company. On amalgamation of the Amalgamating Company with the Amalgamated Company, the share capital of the Amalgamating Company will be extinguished since all the shares of the Amalgamating Company are held by the Amalgamated Company. Since the Amalgamating Company was a wholly owned subsidiary of the Amalgamated Company, no share will be issued by the Amalgamated Company to the shareholders of the Amalgamating Company as a result of the amalgamation.
d) Accounting treatment The Company has accounted for the merger in its books as per the Pooling of Interest Method of Accounting
prescribed under the Accounting Standard 14 – “Accounting for Amalgamation”.(i) All the assets and liabilities recorded in the books of Microbase Infosolution Private Limited as at appointed
date have been transferred to and vested in the Company pursuant to the Scheme and have been recorded by the Company at their book values as appearing in the books of Microbase Infosolution Private Limited (details given below);
Particulars Amount in Rs. Assets Capital work in progress (including capital advances) 122,976,819 Land 20,702,102 Trade receivables 52,500 Security deposit 270,929 Cash 25,659 Bank balances 44,740 Total assets 144,072,749 Liabilities Current liabilities 2,506,788 Unsecured loans 141,454,800 Provision for taxation 1,164 Total liabilities 143,962,752
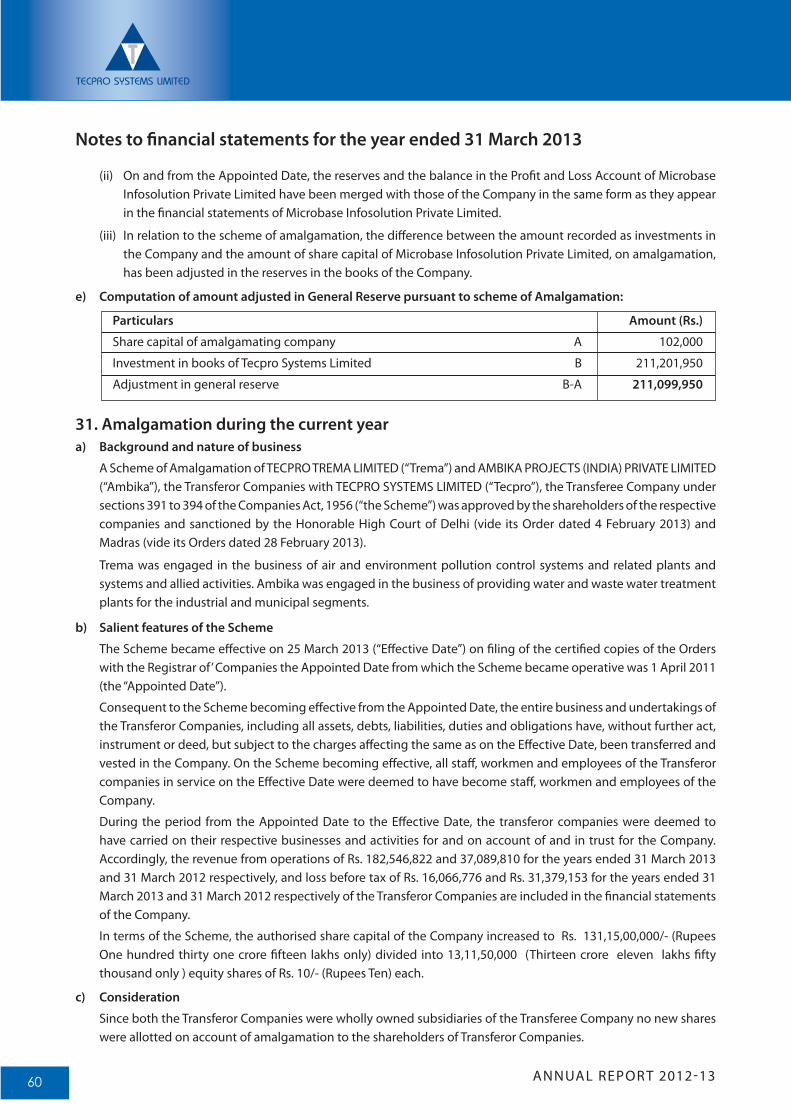
ANNUAL REPORT 2012-1360
(ii) On and from the Appointed Date, the reserves and the balance in the Profit and Loss Account of Microbase Infosolution Private Limited have been merged with those of the Company in the same form as they appear in the financial statements of Microbase Infosolution Private Limited.
(iii) In relation to the scheme of amalgamation, the difference between the amount recorded as investments in the Company and the amount of share capital of Microbase Infosolution Private Limited, on amalgamation, has been adjusted in the reserves in the books of the Company.
e) Computation of amount adjusted in General Reserve pursuant to scheme of Amalgamation:
Particulars Amount (Rs.)
Share capital of amalgamating company A 102,000
Investment in books of Tecpro Systems Limited B 211,201,950
Adjustment in general reserve B-A 211,099,950
31. Amalgamation during the current yeara) Background and nature of business
A Scheme of Amalgamation of TECPRO TREMA LIMITED (“Trema”) and AMBIKA PROJECTS (INDIA) PRIVATE LIMITED (“Ambika”), the Transferor Companies with TECPRO SYSTEMS LIMITED (“Tecpro”), the Transferee Company under sections 391 to 394 of the Companies Act, 1956 (“the Scheme”) was approved by the shareholders of the respective companies and sanctioned by the Honorable High Court of Delhi (vide its Order dated 4 February 2013) and Madras (vide its Orders dated 28 February 2013).
Trema was engaged in the business of air and environment pollution control systems and related plants and systems and allied activities. Ambika was engaged in the business of providing water and waste water treatment plants for the industrial and municipal segments.
b) Salient features of the Scheme
The Scheme became effective on 25 March 2013 (“Effective Date”) on filing of the certified copies of the Orders with the Registrar of’ Companies the Appointed Date from which the Scheme became operative was 1 April 2011 (the “Appointed Date”).
Consequent to the Scheme becoming effective from the Appointed Date, the entire business and undertakings of the Transferor Companies, including all assets, debts, liabilities, duties and obligations have, without further act, instrument or deed, but subject to the charges affecting the same as on the Effective Date, been transferred and vested in the Company. On the Scheme becoming effective, all staff, workmen and employees of the Transferor companies in service on the Effective Date were deemed to have become staff, workmen and employees of the Company.
During the period from the Appointed Date to the Effective Date, the transferor companies were deemed to have carried on their respective businesses and activities for and on account of and in trust for the Company. Accordingly, the revenue from operations of Rs. 182,546,822 and 37,089,810 for the years ended 31 March 2013 and 31 March 2012 respectively, and loss before tax of Rs. 16,066,776 and Rs. 31,379,153 for the years ended 31 March 2013 and 31 March 2012 respectively of the Transferor Companies are included in the financial statements of the Company.
In terms of the Scheme, the authorised share capital of the Company increased to Rs. 131,15,00,000/- (Rupees One hundred thirty one crore fifteen lakhs only) divided into 13,11,50,000 (Thirteen crore eleven lakhs fifty thousand only ) equity shares of Rs. 10/- (Rupees Ten) each.
c) Consideration
Since both the Transferor Companies were wholly owned subsidiaries of the Transferee Company no new shares were allotted on account of amalgamation to the shareholders of Transferor Companies.
Notes to financial statements for the year ended 31 March 2013
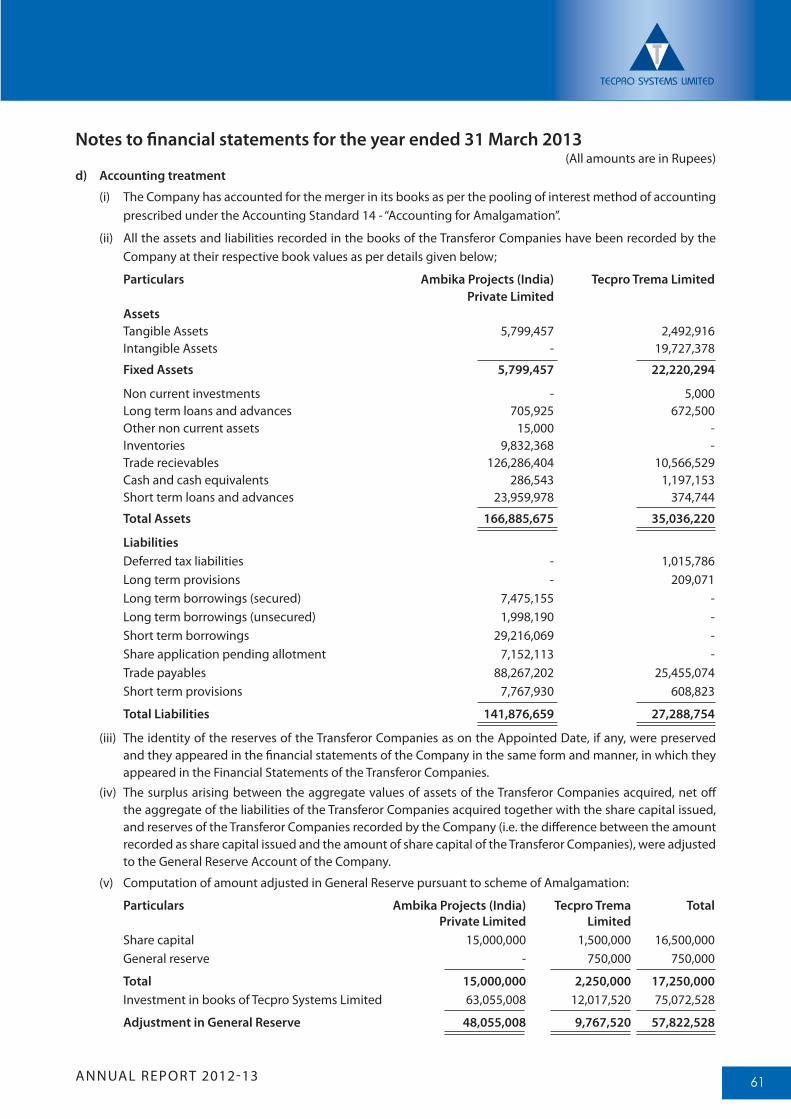
ANNUAL REPORT 2012-13 61
d) Accounting treatment
(i) The Company has accounted for the merger in its books as per the pooling of interest method of accounting prescribed under the Accounting Standard 14 - “Accounting for Amalgamation”.
(ii) All the assets and liabilities recorded in the books of the Transferor Companies have been recorded by the Company at their respective book values as per details given below;
Particulars Ambika Projects (India) Tecpro Trema Limited Private Limited Assets Tangible Assets 5,799,457 2,492,916 Intangible Assets - 19,727,378
Fixed Assets 5,799,457 22,220,294
Non current investments - 5,000 Long term loans and advances 705,925 672,500 Other non current assets 15,000 - Inventories 9,832,368 - Trade recievables 126,286,404 10,566,529 Cash and cash equivalents 286,543 1,197,153 Short term loans and advances 23,959,978 374,744
Total Assets 166,885,675 35,036,220
Liabilities Deferred tax liabilities - 1,015,786 Long term provisions - 209,071 Long term borrowings (secured) 7,475,155 - Long term borrowings (unsecured) 1,998,190 - Short term borrowings 29,216,069 - Share application pending allotment 7,152,113 - Trade payables 88,267,202 25,455,074 Short term provisions 7,767,930 608,823
Total Liabilities 141,876,659 27,288,754
(iii) The identity of the reserves of the Transferor Companies as on the Appointed Date, if any, were preserved and they appeared in the financial statements of the Company in the same form and manner, in which they appeared in the Financial Statements of the Transferor Companies.
(iv) The surplus arising between the aggregate values of assets of the Transferor Companies acquired, net off the aggregate of the liabilities of the Transferor Companies acquired together with the share capital issued, and reserves of the Transferor Companies recorded by the Company (i.e. the difference between the amount recorded as share capital issued and the amount of share capital of the Transferor Companies), were adjusted to the General Reserve Account of the Company.
(v) Computation of amount adjusted in General Reserve pursuant to scheme of Amalgamation:
Particulars Ambika Projects (India) Tecpro Trema Total Private Limited Limited
Share capital 15,000,000 1,500,000 16,500,000 General reserve - 750,000 750,000
Total 15,000,000 2,250,000 17,250,000 Investment in books of Tecpro Systems Limited 63,055,008 12,017,520 75,072,528
Adjustment in General Reserve 48,055,008 9,767,520 57,822,528
Notes to financial statements for the year ended 31 March 2013(All amounts are in Rupees)
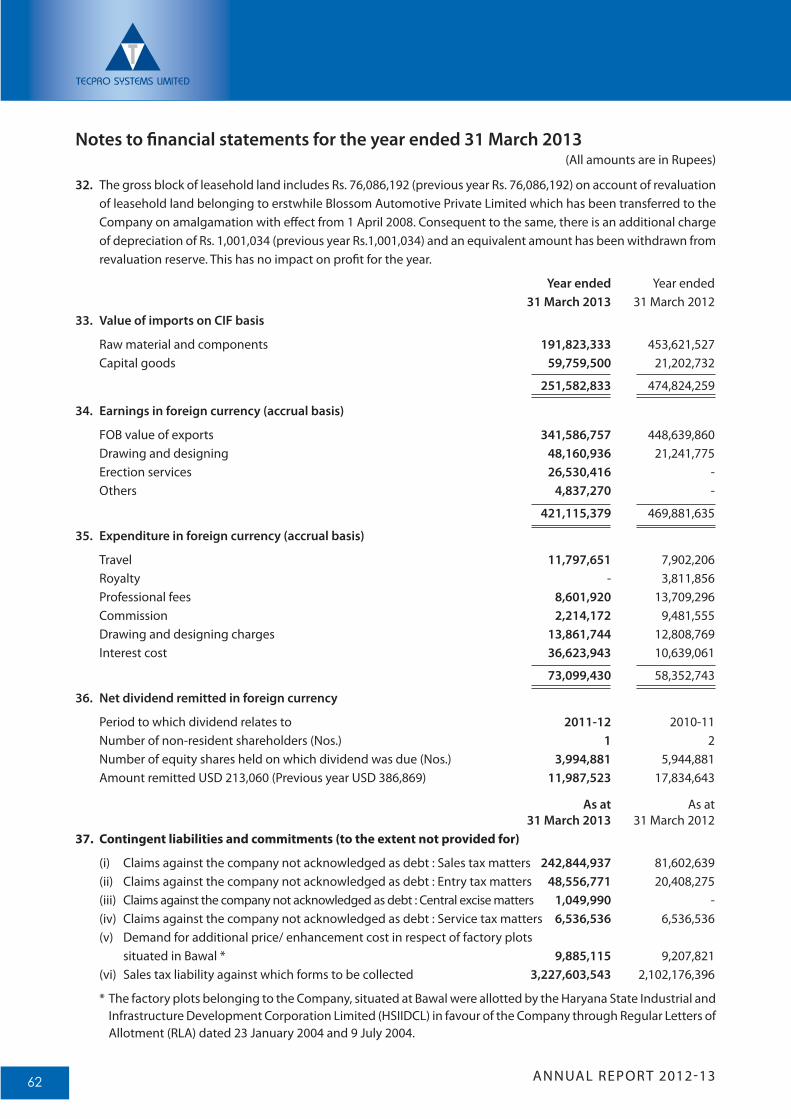
ANNUAL REPORT 2012-1362
32. The gross block of leasehold land includes Rs. 76,086,192 (previous year Rs. 76,086,192) on account of revaluation of leasehold land belonging to erstwhile Blossom Automotive Private Limited which has been transferred to the Company on amalgamation with effect from 1 April 2008. Consequent to the same, there is an additional charge of depreciation of Rs. 1,001,034 (previous year Rs.1,001,034) and an equivalent amount has been withdrawn from revaluation reserve. This has no impact on profit for the year.
Year ended Year ended 31 March 2013 31 March 201233. Value of imports on CIF basis
Raw material and components 191,823,333 453,621,527 Capital goods 59,759,500 21,202,732
251,582,833 474,824,259
34. Earnings in foreign currency (accrual basis)
FOB value of exports 341,586,757 448,639,860 Drawing and designing 48,160,936 21,241,775 Erection services 26,530,416 - Others 4,837,270 -
421,115,379 469,881,635
35. Expenditure in foreign currency (accrual basis)
Travel 11,797,651 7,902,206 Royalty - 3,811,856 Professional fees 8,601,920 13,709,296 Commission 2,214,172 9,481,555 Drawing and designing charges 13,861,744 12,808,769 Interest cost 36,623,943 10,639,061
73,099,430 58,352,743
36. Net dividend remitted in foreign currency
Period to which dividend relates to 2011-12 2010-11 Number of non-resident shareholders (Nos.) 1 2 Number of equity shares held on which dividend was due (Nos.) 3,994,881 5,944,881 Amount remitted USD 213,060 (Previous year USD 386,869) 11,987,523 17,834,643
As at As at 31 March 2013 31 March 2012 37. Contingent liabilities and commitments (to the extent not provided for)
(i) Claims against the company not acknowledged as debt : Sales tax matters 242,844,937 81,602,639 (ii) Claims against the company not acknowledged as debt : Entry tax matters 48,556,771 20,408,275(iii) Claims against the company not acknowledged as debt : Central excise matters 1,049,990 - (iv) Claims against the company not acknowledged as debt : Service tax matters 6,536,536 6,536,536 (v) Demand for additional price/ enhancement cost in respect of factory plots situated in Bawal * 9,885,115 9,207,821(vi) Sales tax liability against which forms to be collected 3,227,603,543 2,102,176,396
* The factory plots belonging to the Company, situated at Bawal were allotted by the Haryana State Industrial and Infrastructure Development Corporation Limited (HSIIDCL) in favour of the Company through Regular Letters of Allotment (RLA) dated 23 January 2004 and 9 July 2004.
Notes to financial statements for the year ended 31 March 2013(All amounts are in Rupees)
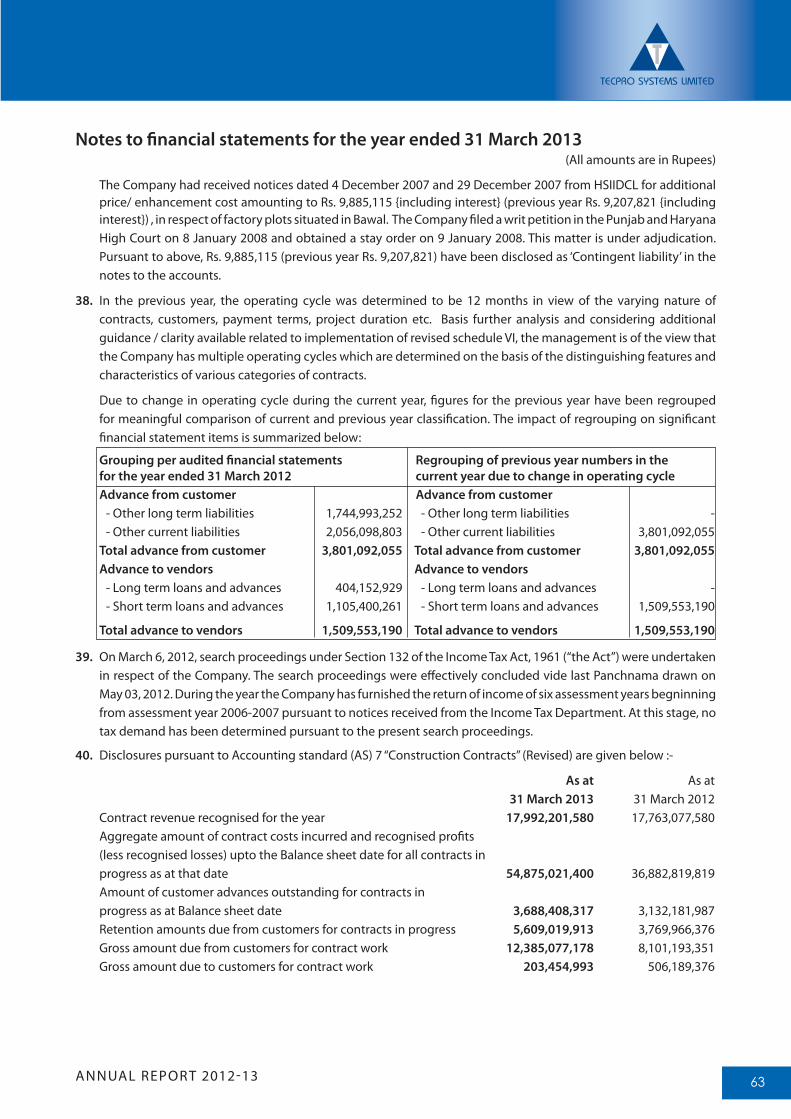
ANNUAL REPORT 2012-13 63
The Company had received notices dated 4 December 2007 and 29 December 2007 from HSIIDCL for additional price/ enhancement cost amounting to Rs. 9,885,115 {including interest} (previous year Rs. 9,207,821 {including interest}) , in respect of factory plots situated in Bawal. The Company filed a writ petition in the Punjab and Haryana High Court on 8 January 2008 and obtained a stay order on 9 January 2008. This matter is under adjudication. Pursuant to above, Rs. 9,885,115 (previous year Rs. 9,207,821) have been disclosed as ‘Contingent liability’ in the notes to the accounts.
38. In the previous year, the operating cycle was determined to be 12 months in view of the varying nature of contracts, customers, payment terms, project duration etc. Basis further analysis and considering additional guidance / clarity available related to implementation of revised schedule VI, the management is of the view that the Company has multiple operating cycles which are determined on the basis of the distinguishing features and characteristics of various categories of contracts.
Due to change in operating cycle during the current year, figures for the previous year have been regrouped for meaningful comparison of current and previous year classification. The impact of regrouping on significant financial statement items is summarized below:
Grouping per audited financial statements Regrouping of previous year numbers in thefor the year ended 31 March 2012 current year due to change in operating cycleAdvance from customer Advance from customer - Other long term liabilities 1,744,993,252 - Other long term liabilities - - Other current liabilities 2,056,098,803 - Other current liabilities 3,801,092,055 Total advance from customer 3,801,092,055 Total advance from customer 3,801,092,055Advance to vendors Advance to vendors - Long term loans and advances 404,152,929 - Long term loans and advances - - Short term loans and advances 1,105,400,261 - Short term loans and advances 1,509,553,190
Total advance to vendors 1,509,553,190 Total advance to vendors 1,509,553,190
39. On March 6, 2012, search proceedings under Section 132 of the Income Tax Act, 1961 (“the Act”) were undertaken in respect of the Company. The search proceedings were effectively concluded vide last Panchnama drawn on May 03, 2012. During the year the Company has furnished the return of income of six assessment years begninning from assessment year 2006-2007 pursuant to notices received from the Income Tax Department. At this stage, no tax demand has been determined pursuant to the present search proceedings.
40. Disclosures pursuant to Accounting standard (AS) 7 “Construction Contracts” (Revised) are given below :-
As at As at 31 March 2013 31 March 2012 Contract revenue recognised for the year 17,992,201,580 17,763,077,580 Aggregate amount of contract costs incurred and recognised profits (less recognised losses) upto the Balance sheet date for all contracts in progress as at that date 54,875,021,400 36,882,819,819 Amount of customer advances outstanding for contracts in progress as at Balance sheet date 3,688,408,317 3,132,181,987 Retention amounts due from customers for contracts in progress 5,609,019,913 3,769,966,376 Gross amount due from customers for contract work 12,385,077,178 8,101,193,351 Gross amount due to customers for contract work 203,454,993 506,189,376
Notes to financial statements for the year ended 31 March 2013(All amounts are in Rupees)
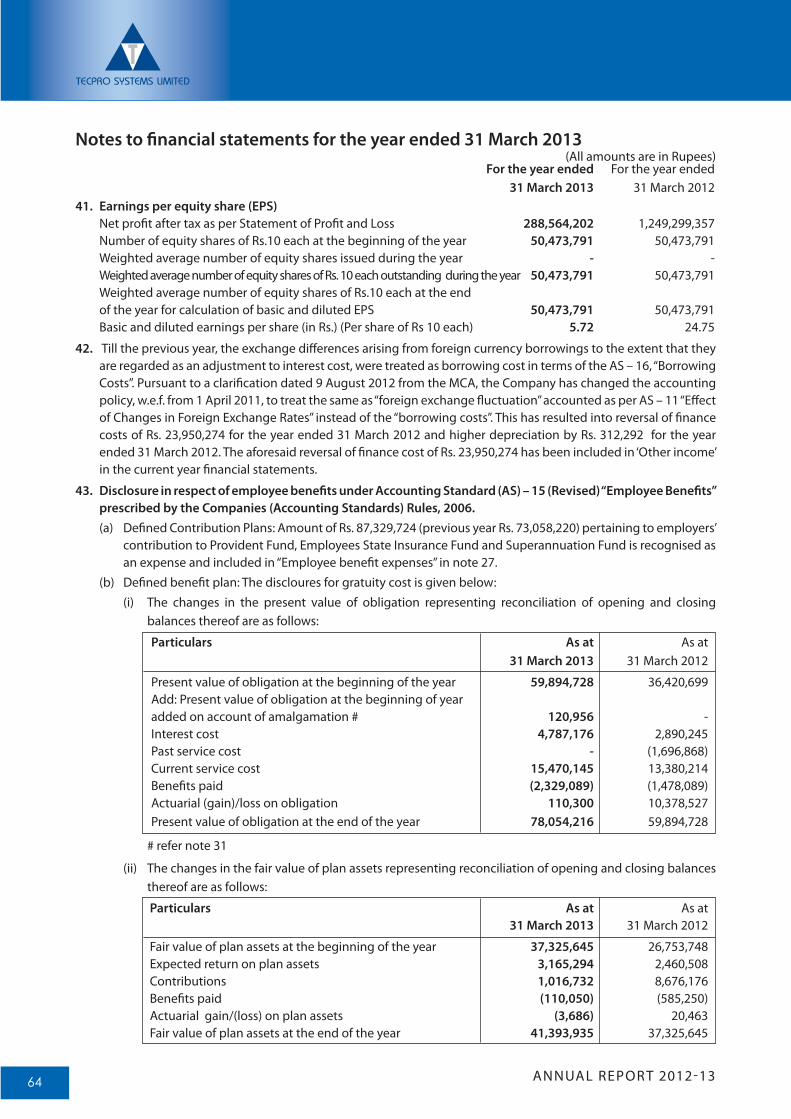
ANNUAL REPORT 2012-1364
For the year ended For the year ended 31 March 2013 31 March 201241. Earnings per equity share (EPS) Net profit after tax as per Statement of Profit and Loss 288,564,202 1,249,299,357 Number of equity shares of Rs.10 each at the beginning of the year 50,473,791 50,473,791 Weighted average number of equity shares issued during the year - - Weighted average number of equity shares of Rs. 10 each outstanding during the year 50,473,791 50,473,791 Weighted average number of equity shares of Rs.10 each at the end of the year for calculation of basic and diluted EPS 50,473,791 50,473,791 Basic and diluted earnings per share (in Rs.) (Per share of Rs 10 each) 5.72 24.75
42. Till the previous year, the exchange differences arising from foreign currency borrowings to the extent that they are regarded as an adjustment to interest cost, were treated as borrowing cost in terms of the AS – 16, “Borrowing Costs”. Pursuant to a clarification dated 9 August 2012 from the MCA, the Company has changed the accounting policy, w.e.f. from 1 April 2011, to treat the same as “foreign exchange fluctuation” accounted as per AS – 11 “Effect of Changes in Foreign Exchange Rates” instead of the “borrowing costs”. This has resulted into reversal of finance costs of Rs. 23,950,274 for the year ended 31 March 2012 and higher depreciation by Rs. 312,292 for the year ended 31 March 2012. The aforesaid reversal of finance cost of Rs. 23,950,274 has been included in ‘Other income’ in the current year financial statements.
43. Disclosure in respect of employee benefits under Accounting Standard (AS) – 15 (Revised) “Employee Benefits” prescribed by the Companies (Accounting Standards) Rules, 2006.(a) Defined Contribution Plans: Amount of Rs. 87,329,724 (previous year Rs. 73,058,220) pertaining to employers’
contribution to Provident Fund, Employees State Insurance Fund and Superannuation Fund is recognised as an expense and included in “Employee benefit expenses” in note 27.
(b) Defined benefit plan: The discloures for gratuity cost is given below:(i) The changes in the present value of obligation representing reconciliation of opening and closing
balances thereof are as follows:
Particulars As at As at 31 March 2013 31 March 2012
Present value of obligation at the beginning of the year 59,894,728 36,420,699 Add: Present value of obligation at the beginning of year added on account of amalgamation # 120,956 - Interest cost 4,787,176 2,890,245 Past service cost - (1,696,868) Current service cost 15,470,145 13,380,214 Benefits paid (2,329,089) (1,478,089) Actuarial (gain)/loss on obligation 110,300 10,378,527 Present value of obligation at the end of the year 78,054,216 59,894,728
# refer note 31
(ii) The changes in the fair value of plan assets representing reconciliation of opening and closing balances thereof are as follows:
Particulars As at As at 31 March 2013 31 March 2012
Fair value of plan assets at the beginning of the year 37,325,645 26,753,748 Expected return on plan assets 3,165,294 2,460,508 Contributions 1,016,732 8,676,176 Benefits paid (110,050) (585,250) Actuarial gain/(loss) on plan assets (3,686) 20,463 Fair value of plan assets at the end of the year 41,393,935 37,325,645
Notes to financial statements for the year ended 31 March 2013(All amounts are in Rupees)
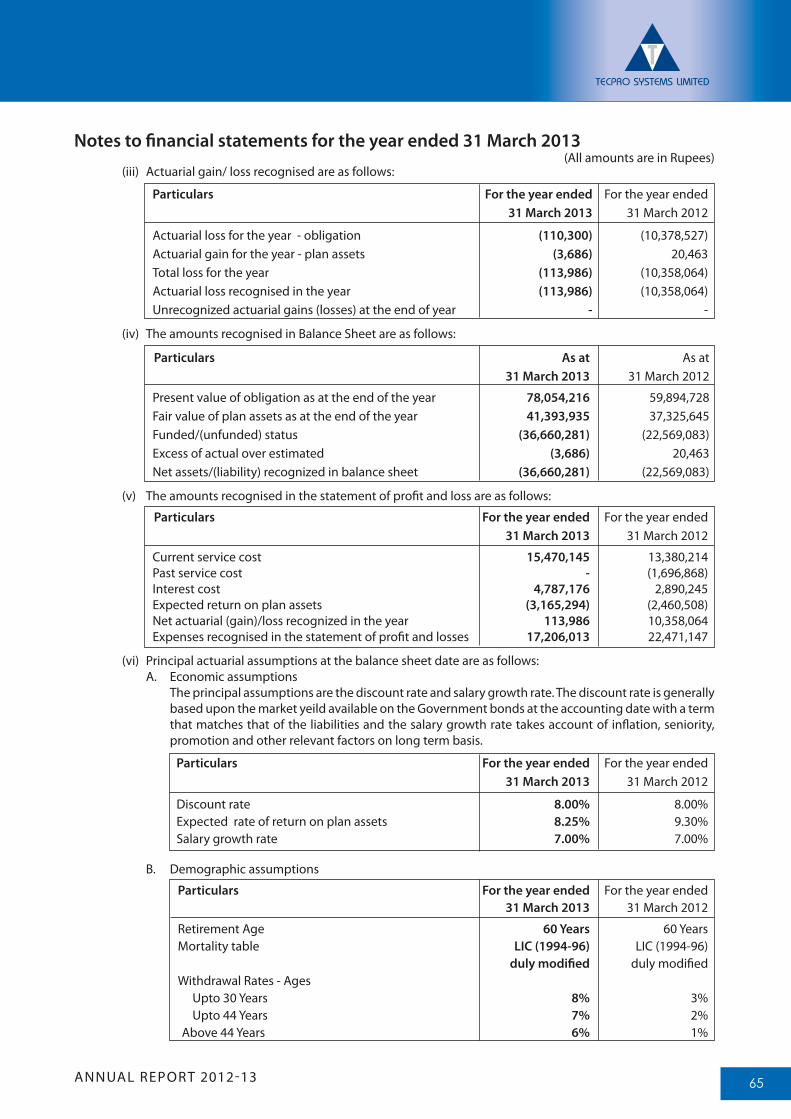
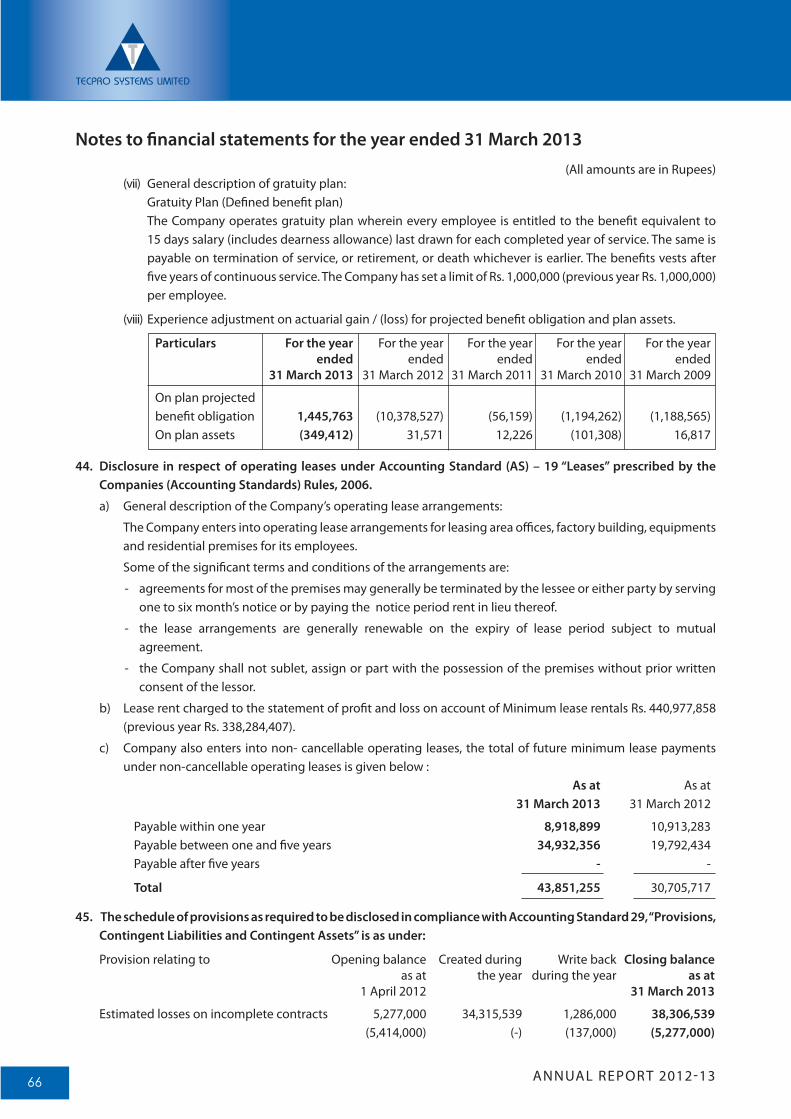
ANNUAL REPORT 2012-1366
(vii) General description of gratuity plan: Gratuity Plan (Defined benefit plan) The Company operates gratuity plan wherein every employee is entitled to the benefit equivalent to
15 days salary (includes dearness allowance) last drawn for each completed year of service. The same is payable on termination of service, or retirement, or death whichever is earlier. The benefits vests after five years of continuous service. The Company has set a limit of Rs. 1,000,000 (previous year Rs. 1,000,000) per employee.
(viii) Experience adjustment on actuarial gain / (loss) for projected benefit obligation and plan assets.
Particulars For the year For the year For the year For the year For the year ended ended ended ended ended 31 March 2013 31 March 2012 31 March 2011 31 March 2010 31 March 2009
On plan projected benefit obligation 1,445,763 (10,378,527) (56,159) (1,194,262) (1,188,565) On plan assets (349,412) 31,571 12,226 (101,308) 16,817
44. Disclosure in respect of operating leases under Accounting Standard (AS) – 19 “Leases” prescribed by the Companies (Accounting Standards) Rules, 2006.
a) General description of the Company’s operating lease arrangements:
The Company enters into operating lease arrangements for leasing area offices, factory building, equipments and residential premises for its employees.
Some of the significant terms and conditions of the arrangements are:
- agreements for most of the premises may generally be terminated by the lessee or either party by serving one to six month’s notice or by paying the notice period rent in lieu thereof.
- the lease arrangements are generally renewable on the expiry of lease period subject to mutual agreement.
- the Company shall not sublet, assign or part with the possession of the premises without prior written consent of the lessor.
b) Lease rent charged to the statement of profit and loss on account of Minimum lease rentals Rs. 440,977,858 (previous year Rs. 338,284,407).
c) Company also enters into non- cancellable operating leases, the total of future minimum lease payments under non-cancellable operating leases is given below :
As at As at 31 March 2013 31 March 2012
Payable within one year 8,918,899 10,913,283 Payable between one and five years 34,932,356 19,792,434 Payable after five years - -
Total 43,851,255 30,705,717
45. The schedule of provisions as required to be disclosed in compliance with Accounting Standard 29, “Provisions, Contingent Liabilities and Contingent Assets” is as under:
Provision relating to Opening balance Created during Write back Closing balance as at the year during the year as at 1 April 2012 31 March 2013
Estimated losses on incomplete contracts 5,277,000 34,315,539 1,286,000 38,306,539 (5,414,000) (-) (137,000) (5,277,000)
Notes to financial statements for the year ended 31 March 2013(All amounts are in Rupees)
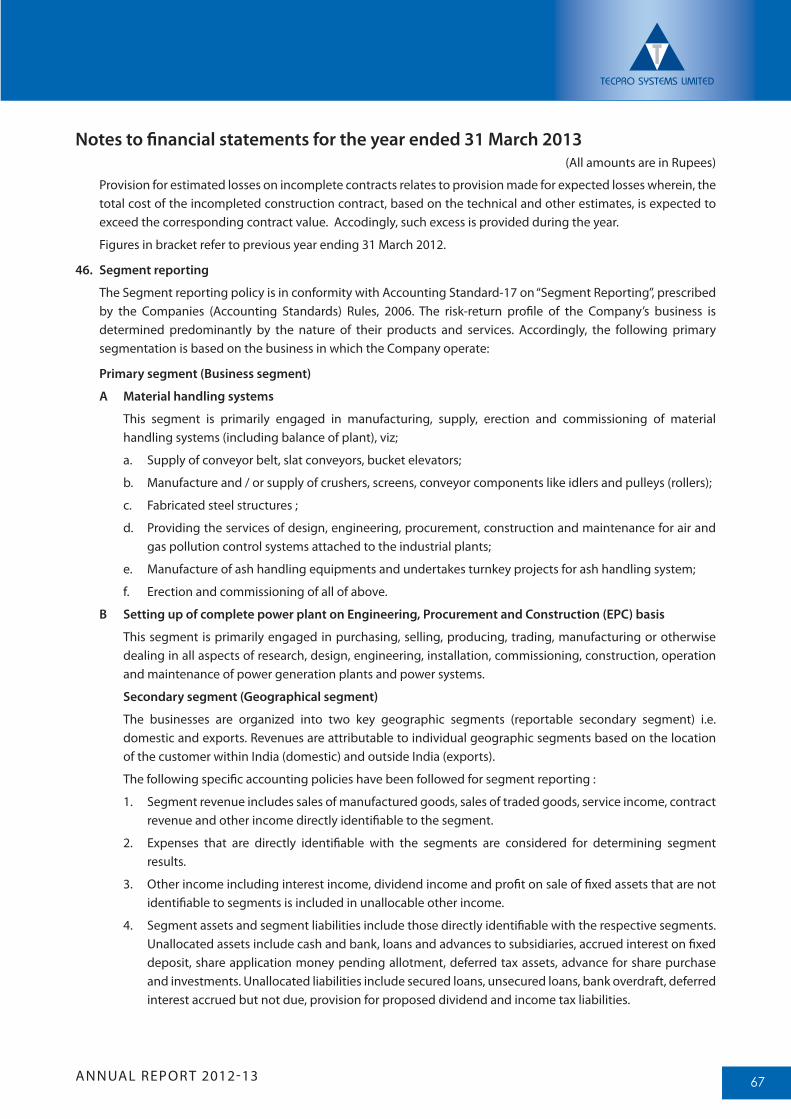
ANNUAL REPORT 2012-13 67
Provision for estimated losses on incomplete contracts relates to provision made for expected losses wherein, the total cost of the incompleted construction contract, based on the technical and other estimates, is expected to exceed the corresponding contract value. Accodingly, such excess is provided during the year.
Figures in bracket refer to previous year ending 31 March 2012.
46. Segment reporting
The Segment reporting policy is in conformity with Accounting Standard-17 on “Segment Reporting”, prescribed by the Companies (Accounting Standards) Rules, 2006. The risk-return profile of the Company’s business is determined predominantly by the nature of their products and services. Accordingly, the following primary segmentation is based on the business in which the Company operate:
Primary segment (Business segment)
A Material handling systems
This segment is primarily engaged in manufacturing, supply, erection and commissioning of material handling systems (including balance of plant), viz;
a. Supply of conveyor belt, slat conveyors, bucket elevators;
b. Manufacture and / or supply of crushers, screens, conveyor components like idlers and pulleys (rollers);
c. Fabricated steel structures ;
d. Providing the services of design, engineering, procurement, construction and maintenance for air and gas pollution control systems attached to the industrial plants;
e. Manufacture of ash handling equipments and undertakes turnkey projects for ash handling system;
f. Erection and commissioning of all of above.
B Setting up of complete power plant on Engineering, Procurement and Construction (EPC) basis
This segment is primarily engaged in purchasing, selling, producing, trading, manufacturing or otherwise dealing in all aspects of research, design, engineering, installation, commissioning, construction, operation and maintenance of power generation plants and power systems.
Secondary segment (Geographical segment)
The businesses are organized into two key geographic segments (reportable secondary segment) i.e. domestic and exports. Revenues are attributable to individual geographic segments based on the location of the customer within India (domestic) and outside India (exports).
The following specific accounting policies have been followed for segment reporting :
1. Segment revenue includes sales of manufactured goods, sales of traded goods, service income, contract revenue and other income directly identifiable to the segment.
2. Expenses that are directly identifiable with the segments are considered for determining segment results.
3. Other income including interest income, dividend income and profit on sale of fixed assets that are not identifiable to segments is included in unallocable other income.
4. Segment assets and segment liabilities include those directly identifiable with the respective segments. Unallocated assets include cash and bank, loans and advances to subsidiaries, accrued interest on fixed deposit, share application money pending allotment, deferred tax assets, advance for share purchase and investments. Unallocated liabilities include secured loans, unsecured loans, bank overdraft, deferred interest accrued but not due, provision for proposed dividend and income tax liabilities.
Notes to financial statements for the year ended 31 March 2013(All amounts are in Rupees)
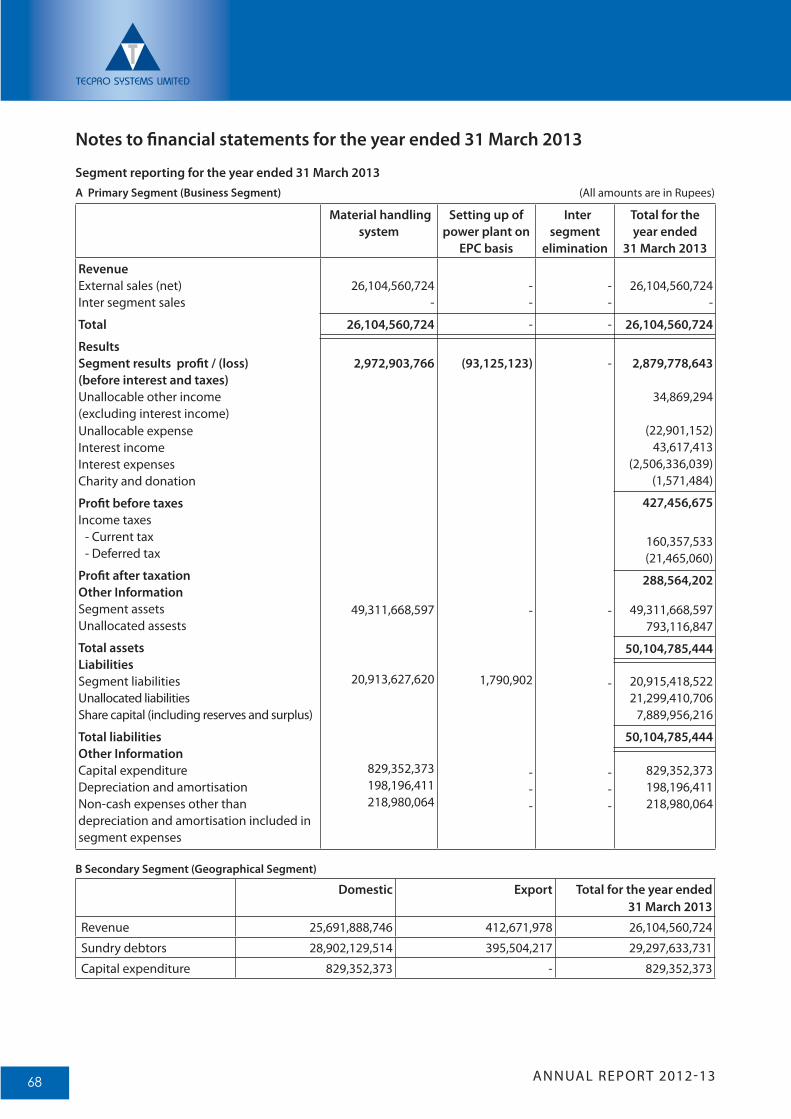
ANNUAL REPORT 2012-1368
Material handling system
Setting up of power plant on
EPC basis
Inter segment
elimination
Total for the year ended
31 March 2013
Revenue External sales (net) Inter segment sales
Total
Results Segment results profit / (loss) (before interest and taxes)Unallocable other income (excluding interest income)Unallocable expense Interest incomeInterest expensesCharity and donation
Profit before taxesIncome taxes - Current tax - Deferred tax
Profit after taxation Other InformationSegment assetsUnallocated assests
Total assetsLiabilitiesSegment liabilities Unallocated liabilitiesShare capital (including reserves and surplus)
Total liabilitiesOther Information Capital expenditureDepreciation and amortisationNon-cash expenses other than depreciation and amortisation included in segment expenses
26,104,560,724-
26,104,560,724
2,972,903,766
49,311,668,597
20,913,627,620
829,352,373 198,196,411 218,980,064
- -
-
(93,125,123)
-
1,790,902
- - -
--
-
-
-
-
---
26,104,560,724-
26,104,560,724
2,879,778,643
34,869,294
(22,901,152)43,617,413
(2,506,336,039) (1,571,484)
427,456,675
160,357,533
(21,465,060)
288,564,202
49,311,668,597 793,116,847
50,104,785,444
20,915,418,522 21,299,410,706
7,889,956,216
50,104,785,444
829,352,373 198,196,411 218,980,064
B Secondary Segment (Geographical Segment)
Domestic Export Total for the year ended 31 March 2013
Revenue 25,691,888,746 412,671,978 26,104,560,724
Sundry debtors 28,902,129,514 395,504,217 29,297,633,731
Capital expenditure 829,352,373 - 829,352,373
Segment reporting for the year ended 31 March 2013
A Primary Segment (Business Segment) (All amounts are in Rupees)
Notes to financial statements for the year ended 31 March 2013
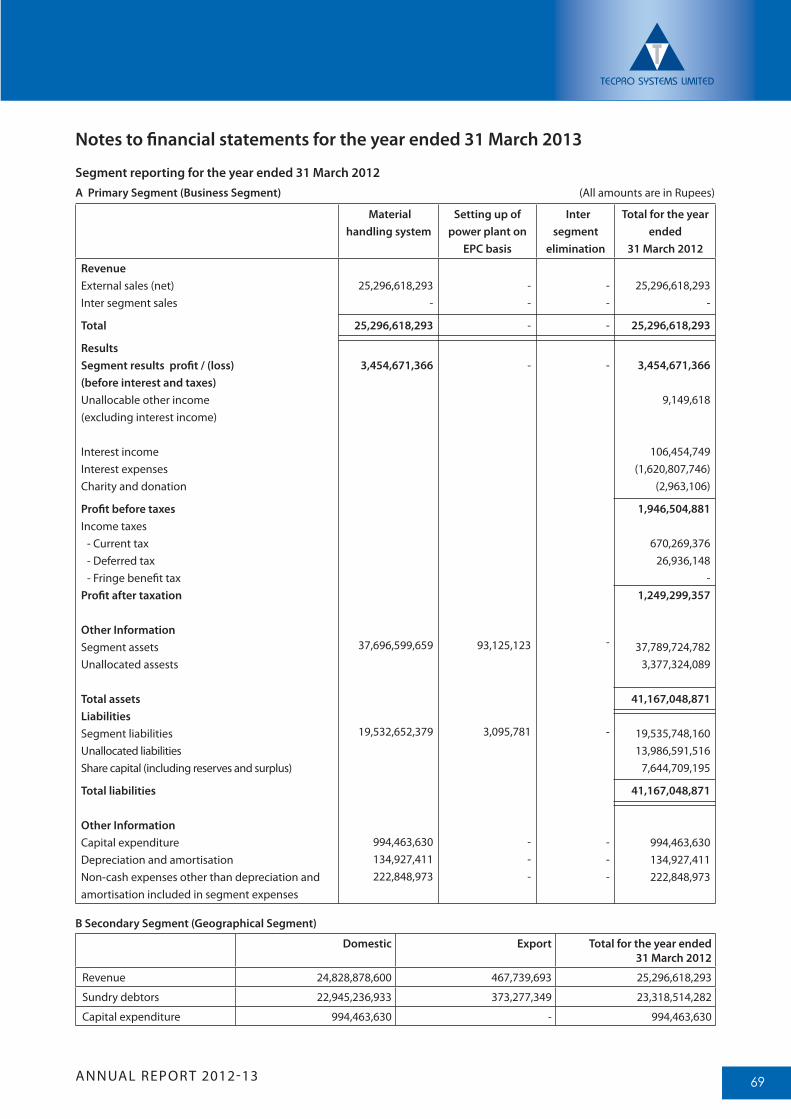
ANNUAL REPORT 2012-13 69
Material handling system
Setting up of power plant on
EPC basis
Inter segment
elimination
Total for the year ended
31 March 2012
Revenue External sales (net) Inter segment sales
Total
Results Segment results profit / (loss) (before interest and taxes)Unallocable other income (excluding interest income)
Interest incomeInterest expensesCharity and donation
Profit before taxesIncome taxes - Current tax - Deferred tax - Fringe benefit taxProfit after taxation
Other InformationSegment assetsUnallocated assests
Total assetsLiabilitiesSegment liabilities Unallocated liabilitiesShare capital (including reserves and surplus)
Total liabilities
Other Information Capital expenditureDepreciation and amortisationNon-cash expenses other than depreciation and amortisation included in segment expenses
25,296,618,293-
25,296,618,293
3,454,671,366
37,696,599,659
19,532,652,379
994,463,630 134,927,411 222,848,973
- -
-
-
93,125,123
3,095,781
- - -
--
-
-
-
-
---
25,296,618,293-
25,296,618,293
3,454,671,366
9,149,618
106,454,749 (1,620,807,746)
(2,963,106)
1,946,504,881
670,269,376 26,936,148
- 1,249,299,357
37,789,724,782 3,377,324,089
41,167,048,871
19,535,748,160 13,986,591,516
7,644,709,195
41,167,048,871
994,463,630 134,927,411 222,848,973
B Secondary Segment (Geographical Segment)
Domestic Export Total for the year ended 31 March 2012
Revenue 24,828,878,600 467,739,693 25,296,618,293
Sundry debtors 22,945,236,933 373,277,349 23,318,514,282
Capital expenditure 994,463,630 - 994,463,630
Segment reporting for the year ended 31 March 2012
A Primary Segment (Business Segment) (All amounts are in Rupees)
Notes to financial statements for the year ended 31 March 2013
ANNUAL REPORT 2012-1370
Notes to financial statements for the year ended 31 March 2013
47. Related party disclosuresa) Related party and nature of relationship where control exists. Subsidiary Tecpro Energy Limited Tecpro International FZE (up to 11 January 2012) Tecpro Trema Limited (refer note 31) Ajmer Waste Processing Company Private Limited Tecpro Systems (Singapore) Pte. Ltd. Bikaner Waste Processing Company Private Limited Ambika Projects (India) Private Limited (refer note 31) Eversun Energy Private Limited (w.e.f. 24 Febuary 2012) PT. Tecpro Systems Indonesia (w.e.f. 6 January 2012)
Related party and nature of the related party relationship with whom transactions have taken place during the year Subsidiaries Tecpro Energy Limited Tecpro International FZE (up to 11 January 2012) Tecpro Trema Limited (refer note 31) Ajmer Waste Processing Company Private Limited Tecpro Systems (Singapore) Pte. Ltd. Bikaner Waste Processing Company Private Limited Ambika Projects (India) Private Limited (refer note 31) Eversun Energy Private Limited (w.e.f. 24 Febuary 2012) PT. Tecpro Systems Indonesia (w.e.f. 6 January 2012)
Key management personnel Ajay Kumar Bishnoi Amul Gabrani Arvind Kumar Bishnoi Aditya Gabrani Amar Banerjee
Relatives of key management personnel Bhagwanti Gabrani Amita Bishnoi Goldie Gabrani Rashmi Singh Enterprises over which key management Tecpro Energy Limited* personnel exercise significant influence Tecpro Trema Limited (refer note 31)* Tecpro International FZE (up to 11 January 2012)* Tecpro Systems (Singapore) Pte. Ltd.* Ambika Projects (India) Private Limited (refer note 31)* Eversun Energy Private Limited (w.e.f. 24 Febuary 2012)* PT. Tecpro Systems Indonesia (w.e.f. 6 January 2012)* Tecpro Engineers Limited T&H Education Private Limited Hythro Power Corporation Limited Tecpro Stones Private Limited Fusion Fittings (I) Limited Shriram Cement Limited Tecpro Infra-Projects Limited G.E.T. Power Limited HIQ Power Associates Private Limited (w.e.f. 27 April 2011) Avadh Transformers Private Limited
* Transactions with these enterprises have been disclosed under subsidiaries
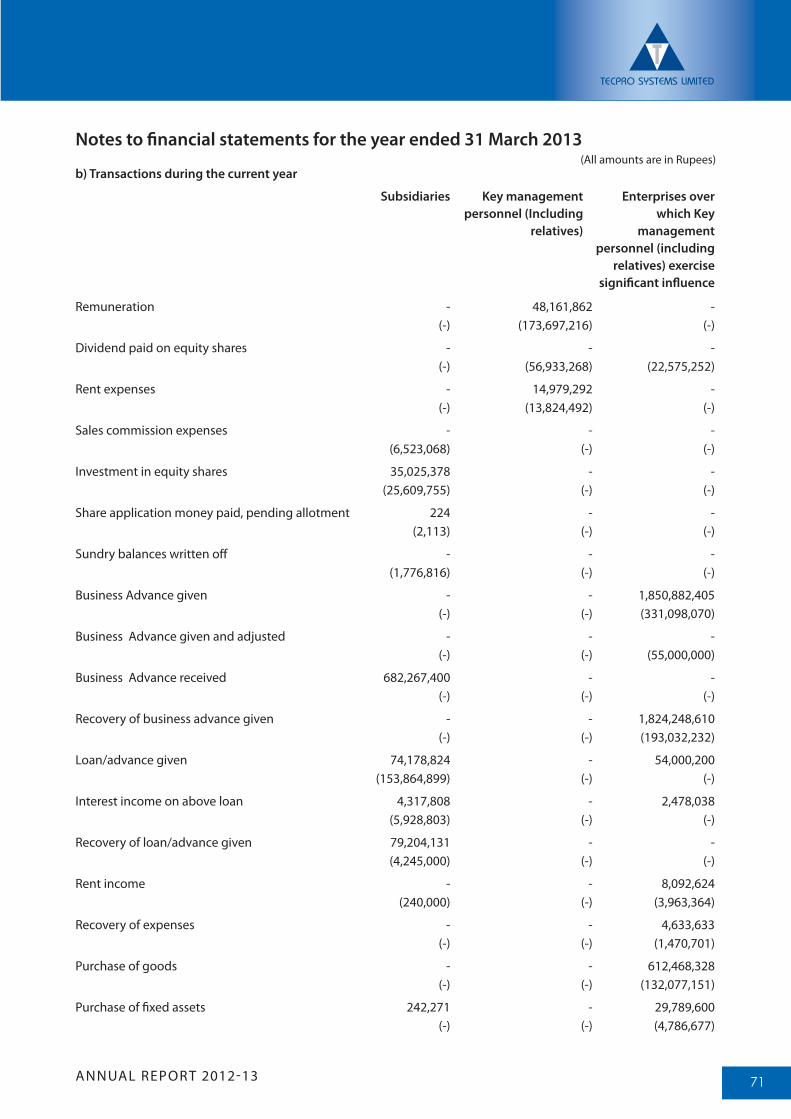
ANNUAL REPORT 2012-13 71
Notes to financial statements for the year ended 31 March 2013
b) Transactions during the current year
Subsidiaries Key management Enterprises over personnel (Including which Key relatives) management personnel (including relatives) exercise significant influence
Remuneration - 48,161,862 - (-) (173,697,216) (-)
Dividend paid on equity shares - - - (-) (56,933,268) (22,575,252)
Rent expenses - 14,979,292 - (-) (13,824,492) (-)
Sales commission expenses - - - (6,523,068) (-) (-)
Investment in equity shares 35,025,378 - - (25,609,755) (-) (-)
Share application money paid, pending allotment 224 - - (2,113) (-) (-)
Sundry balances written off - - - (1,776,816) (-) (-)
Business Advance given - - 1,850,882,405 (-) (-) (331,098,070)
Business Advance given and adjusted - - - (-) (-) (55,000,000)
Business Advance received 682,267,400 - - (-) (-) (-)
Recovery of business advance given - - 1,824,248,610 (-) (-) (193,032,232)
Loan/advance given 74,178,824 - 54,000,200 (153,864,899) (-) (-)
Interest income on above loan 4,317,808 - 2,478,038 (5,928,803) (-) (-)
Recovery of loan/advance given 79,204,131 - - (4,245,000) (-) (-)
Rent income - - 8,092,624 (240,000) (-) (3,963,364)
Recovery of expenses - - 4,633,633 (-) (-) (1,470,701)
Purchase of goods - - 612,468,328 (-) (-) (132,077,151)
Purchase of fixed assets 242,271 - 29,789,600 (-) (-) (4,786,677)
(All amounts are in Rupees)
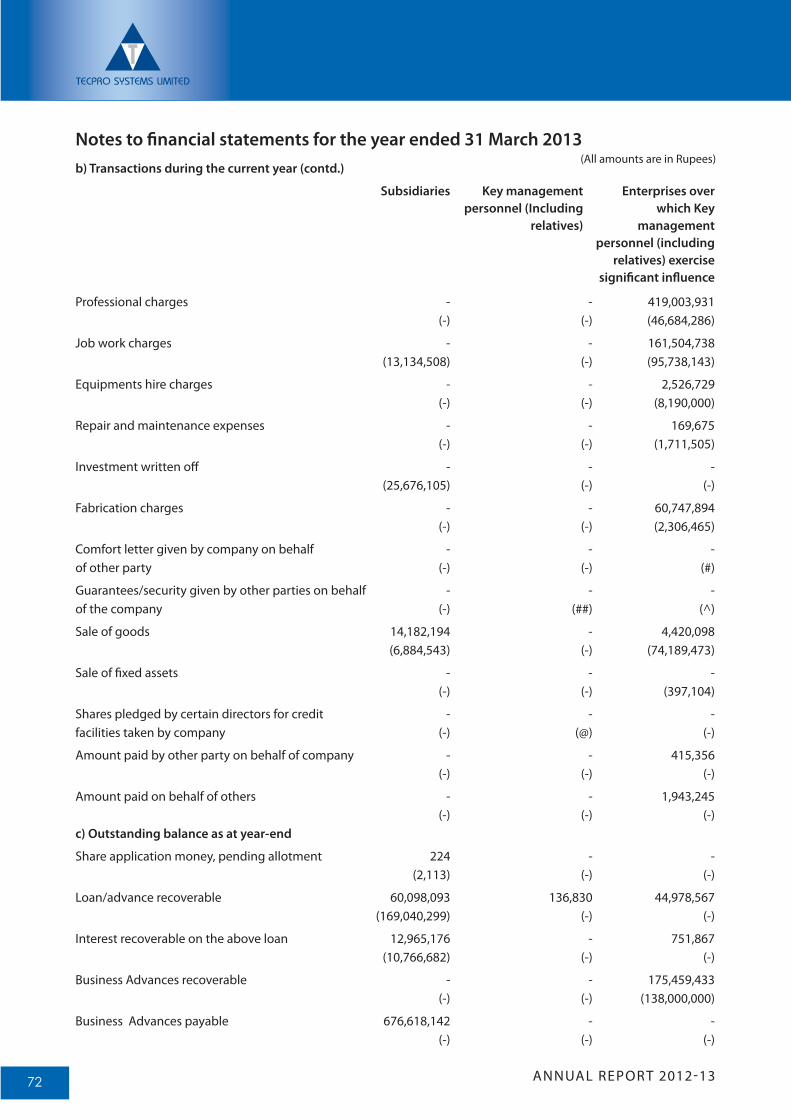
ANNUAL REPORT 2012-1372
Notes to financial statements for the year ended 31 March 2013
Professional charges - - 419,003,931 (-) (-) (46,684,286)
Job work charges - - 161,504,738 (13,134,508) (-) (95,738,143)
Equipments hire charges - - 2,526,729 (-) (-) (8,190,000)
Repair and maintenance expenses - - 169,675 (-) (-) (1,711,505)
Investment written off - - - (25,676,105) (-) (-)
Fabrication charges - - 60,747,894 (-) (-) (2,306,465)
Comfort letter given by company on behalf - - - of other party (-) (-) (#)
Guarantees/security given by other parties on behalf - - - of the company (-) (##) (^)
Sale of goods 14,182,194 - 4,420,098 (6,884,543) (-) (74,189,473)
Sale of fixed assets - - - (-) (-) (397,104)
Shares pledged by certain directors for credit - - -facilities taken by company (-) (@) (-)
Amount paid by other party on behalf of company - - 415,356 (-) (-) (-)
Amount paid on behalf of others - - 1,943,245 (-) (-) (-)c) Outstanding balance as at year-end
Share application money, pending allotment 224 - - (2,113) (-) (-)
Loan/advance recoverable 60,098,093 136,830 44,978,567 (169,040,299) (-) (-)
Interest recoverable on the above loan 12,965,176 - 751,867 (10,766,682) (-) (-)
Business Advances recoverable - - 175,459,433 (-) (-) (138,000,000)
Business Advances payable 676,618,142 - - (-) (-) (-)
b) Transactions during the current year (contd.)
Subsidiaries Key management Enterprises over personnel (Including which Key relatives) management personnel (including relatives) exercise significant influence
(All amounts are in Rupees)
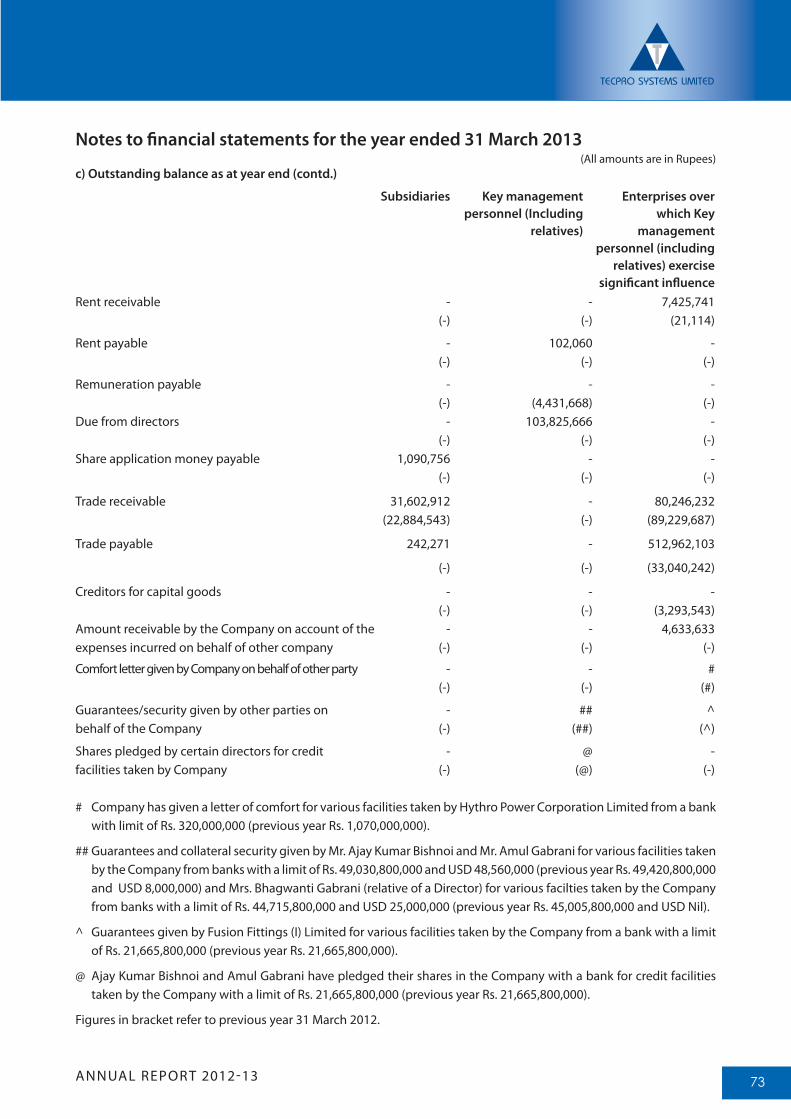
ANNUAL REPORT 2012-13 73
Rent receivable - - 7,425,741 (-) (-) (21,114)
Rent payable - 102,060 - (-) (-) (-)
Remuneration payable - - - (-) (4,431,668) (-)Due from directors - 103,825,666 - (-) (-) (-) Share application money payable 1,090,756 - - (-) (-) (-)
Trade receivable 31,602,912 - 80,246,232 (22,884,543) (-) (89,229,687)
Trade payable 242,271 - 512,962,103
(-) (-) (33,040,242)
Creditors for capital goods - - - (-) (-) (3,293,543)Amount receivable by the Company on account of the - - 4,633,633 expenses incurred on behalf of other company (-) (-) (-)
Comfort letter given by Company on behalf of other party - - # (-) (-) (#)
Guarantees/security given by other parties on - ## ^behalf of the Company (-) (##) (^)
Shares pledged by certain directors for credit - @ - facilities taken by Company (-) (@) (-) # Company has given a letter of comfort for various facilities taken by Hythro Power Corporation Limited from a bank
with limit of Rs. 320,000,000 (previous year Rs. 1,070,000,000).
## Guarantees and collateral security given by Mr. Ajay Kumar Bishnoi and Mr. Amul Gabrani for various facilities taken by the Company from banks with a limit of Rs. 49,030,800,000 and USD 48,560,000 (previous year Rs. 49,420,800,000 and USD 8,000,000) and Mrs. Bhagwanti Gabrani (relative of a Director) for various facilties taken by the Company from banks with a limit of Rs. 44,715,800,000 and USD 25,000,000 (previous year Rs. 45,005,800,000 and USD Nil).
^ Guarantees given by Fusion Fittings (I) Limited for various facilities taken by the Company from a bank with a limit of Rs. 21,665,800,000 (previous year Rs. 21,665,800,000).
@ Ajay Kumar Bishnoi and Amul Gabrani have pledged their shares in the Company with a bank for credit facilities taken by the Company with a limit of Rs. 21,665,800,000 (previous year Rs. 21,665,800,000).
Figures in bracket refer to previous year 31 March 2012.
Notes to financial statements for the year ended 31 March 2013
c) Outstanding balance as at year end (contd.)
Subsidiaries Key management Enterprises over personnel (Including which Key relatives) management personnel (including relatives) exercise significant influence
(All amounts are in Rupees)
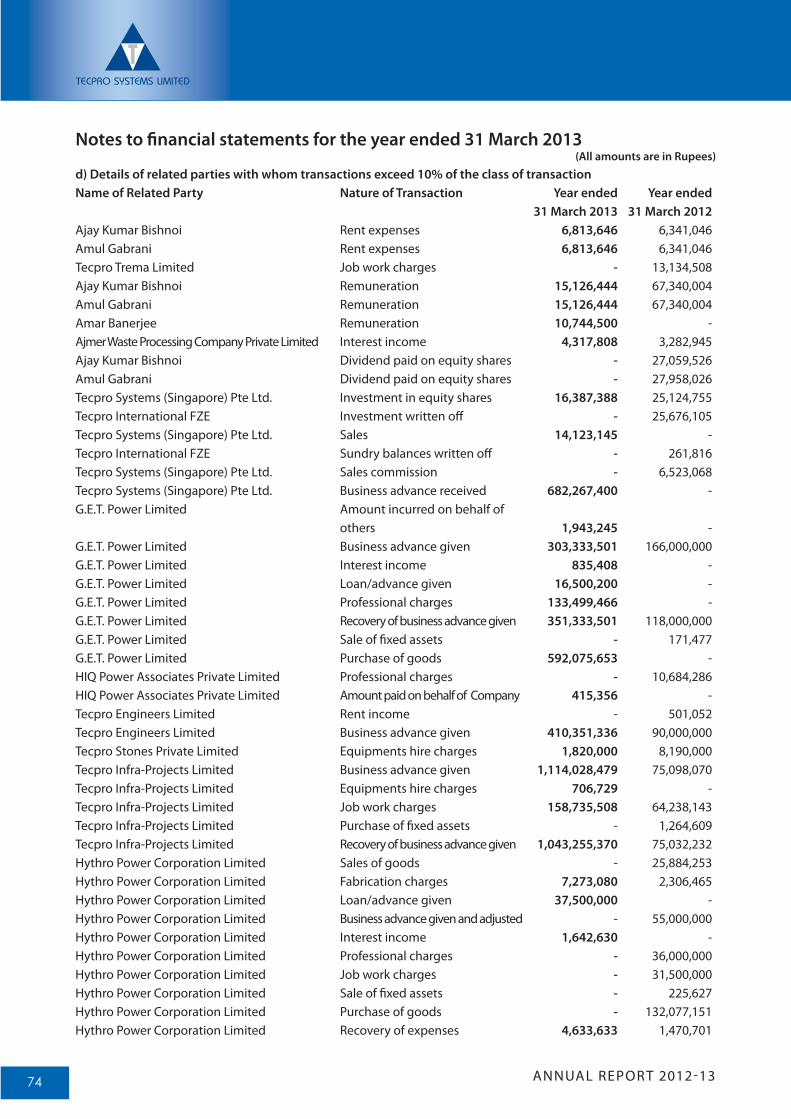
ANNUAL REPORT 2012-1374
Notes to financial statements for the year ended 31 March 2013
d) Details of related parties with whom transactions exceed 10% of the class of transaction Name of Related Party Nature of Transaction Year ended Year ended 31 March 2013 31 March 2012Ajay Kumar Bishnoi Rent expenses 6,813,646 6,341,046 Amul Gabrani Rent expenses 6,813,646 6,341,046 Tecpro Trema Limited Job work charges - 13,134,508 Ajay Kumar Bishnoi Remuneration 15,126,444 67,340,004 Amul Gabrani Remuneration 15,126,444 67,340,004 Amar Banerjee Remuneration 10,744,500 -Ajmer Waste Processing Company Private Limited Interest income 4,317,808 3,282,945 Ajay Kumar Bishnoi Dividend paid on equity shares - 27,059,526 Amul Gabrani Dividend paid on equity shares - 27,958,026 Tecpro Systems (Singapore) Pte Ltd. Investment in equity shares 16,387,388 25,124,755 Tecpro International FZE Investment written off - 25,676,105 Tecpro Systems (Singapore) Pte Ltd. Sales 14,123,145 -Tecpro International FZE Sundry balances written off - 261,816Tecpro Systems (Singapore) Pte Ltd. Sales commission - 6,523,068Tecpro Systems (Singapore) Pte Ltd. Business advance received 682,267,400 - G.E.T. Power Limited Amount incurred on behalf of others 1,943,245 -G.E.T. Power Limited Business advance given 303,333,501 166,000,000G.E.T. Power Limited Interest income 835,408 - G.E.T. Power Limited Loan/advance given 16,500,200 -G.E.T. Power Limited Professional charges 133,499,466 - G.E.T. Power Limited Recovery of business advance given 351,333,501 118,000,000 G.E.T. Power Limited Sale of fixed assets - 171,477 G.E.T. Power Limited Purchase of goods 592,075,653 -HIQ Power Associates Private Limited Professional charges - 10,684,286HIQ Power Associates Private Limited Amount paid on behalf of Company 415,356 - Tecpro Engineers Limited Rent income - 501,052Tecpro Engineers Limited Business advance given 410,351,336 90,000,000 Tecpro Stones Private Limited Equipments hire charges 1,820,000 8,190,000Tecpro Infra-Projects Limited Business advance given 1,114,028,479 75,098,070Tecpro Infra-Projects Limited Equipments hire charges 706,729 - Tecpro Infra-Projects Limited Job work charges 158,735,508 64,238,143Tecpro Infra-Projects Limited Purchase of fixed assets - 1,264,609 Tecpro Infra-Projects Limited Recovery of business advance given 1,043,255,370 75,032,232 Hythro Power Corporation Limited Sales of goods - 25,884,253Hythro Power Corporation Limited Fabrication charges 7,273,080 2,306,465Hythro Power Corporation Limited Loan/advance given 37,500,000 - Hythro Power Corporation Limited Business advance given and adjusted - 55,000,000 Hythro Power Corporation Limited Interest income 1,642,630 - Hythro Power Corporation Limited Professional charges - 36,000,000Hythro Power Corporation Limited Job work charges - 31,500,000Hythro Power Corporation Limited Sale of fixed assets - 225,627Hythro Power Corporation Limited Purchase of goods - 132,077,151Hythro Power Corporation Limited Recovery of expenses 4,633,633 1,470,701
(All amounts are in Rupees)
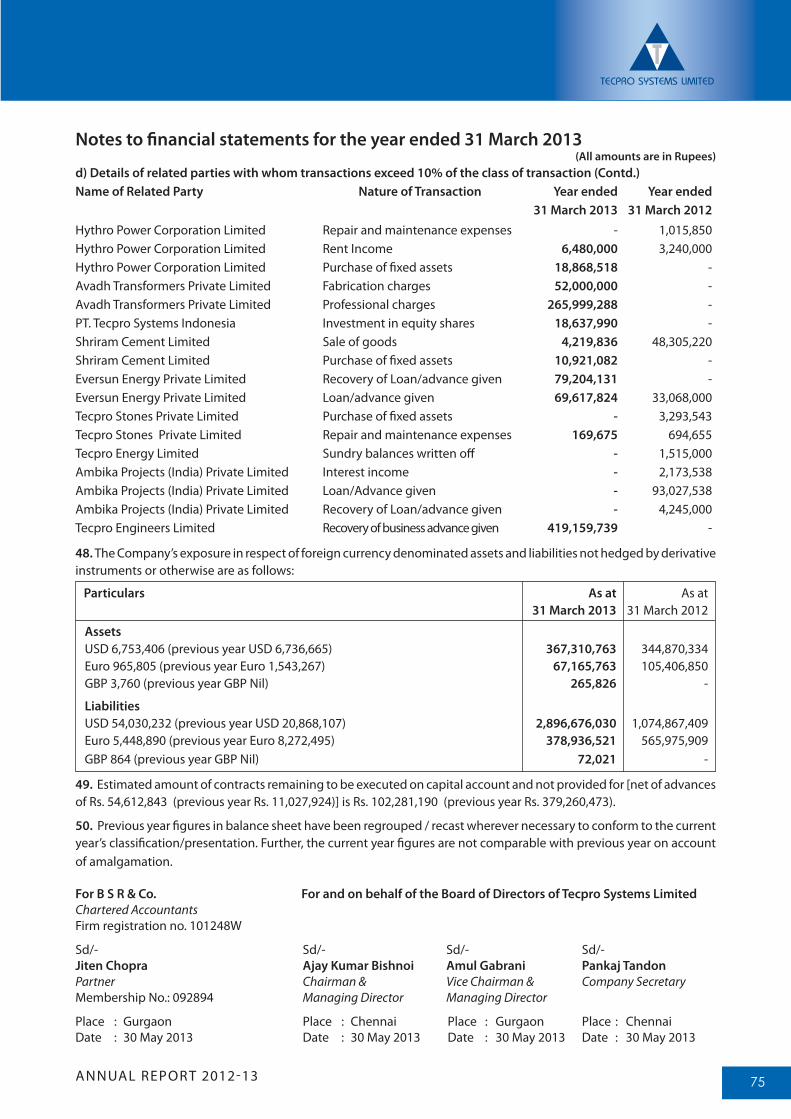
ANNUAL REPORT 2012-13 75
Hythro Power Corporation Limited Repair and maintenance expenses - 1,015,850Hythro Power Corporation Limited Rent Income 6,480,000 3,240,000 Hythro Power Corporation Limited Purchase of fixed assets 18,868,518 -Avadh Transformers Private Limited Fabrication charges 52,000,000 -Avadh Transformers Private Limited Professional charges 265,999,288 - PT. Tecpro Systems Indonesia Investment in equity shares 18,637,990 - Shriram Cement Limited Sale of goods 4,219,836 48,305,220Shriram Cement Limited Purchase of fixed assets 10,921,082 - Eversun Energy Private Limited Recovery of Loan/advance given 79,204,131 -Eversun Energy Private Limited Loan/advance given 69,617,824 33,068,000Tecpro Stones Private Limited Purchase of fixed assets - 3,293,543 Tecpro Stones Private Limited Repair and maintenance expenses 169,675 694,655 Tecpro Energy Limited Sundry balances written off - 1,515,000Ambika Projects (India) Private Limited Interest income - 2,173,538Ambika Projects (India) Private Limited Loan/Advance given - 93,027,538 Ambika Projects (India) Private Limited Recovery of Loan/advance given - 4,245,000Tecpro Engineers Limited Recovery of business advance given 419,159,739 -
48. The Company’s exposure in respect of foreign currency denominated assets and liabilities not hedged by derivative instruments or otherwise are as follows:
Particulars As at As at 31 March 2013 31 March 2012
Assets USD 6,753,406 (previous year USD 6,736,665) 367,310,763 344,870,334 Euro 965,805 (previous year Euro 1,543,267) 67,165,763 105,406,850GBP 3,760 (previous year GBP Nil) 265,826 -
Liabilities USD 54,030,232 (previous year USD 20,868,107) 2,896,676,030 1,074,867,409Euro 5,448,890 (previous year Euro 8,272,495) 378,936,521 565,975,909GBP 864 (previous year GBP Nil) 72,021 -
49. Estimated amount of contracts remaining to be executed on capital account and not provided for [net of advances of Rs. 54,612,843 (previous year Rs. 11,027,924)] is Rs. 102,281,190 (previous year Rs. 379,260,473).
50. Previous year figures in balance sheet have been regrouped / recast wherever necessary to conform to the current year’s classification/presentation. Further, the current year figures are not comparable with previous year on account of amalgamation.
Notes to financial statements for the year ended 31 March 2013
d) Details of related parties with whom transactions exceed 10% of the class of transaction (Contd.)Name of Related Party Nature of Transaction Year ended Year ended 31 March 2013 31 March 2012
For B S R & Co. For and on behalf of the Board of Directors of Tecpro Systems Limited Chartered Accountants Firm registration no. 101248W
Sd/- Sd/- Sd/- Sd/- Jiten Chopra Ajay Kumar Bishnoi Amul Gabrani Pankaj Tandon Partner Chairman & Vice Chairman & Company Secretary Membership No.: 092894 Managing Director Managing Director
Place : Gurgaon Place : Chennai Place : Gurgaon Place : Chennai Date : 30 May 2013 Date : 30 May 2013 Date : 30 May 2013 Date : 30 May 2013
(All amounts are in Rupees)
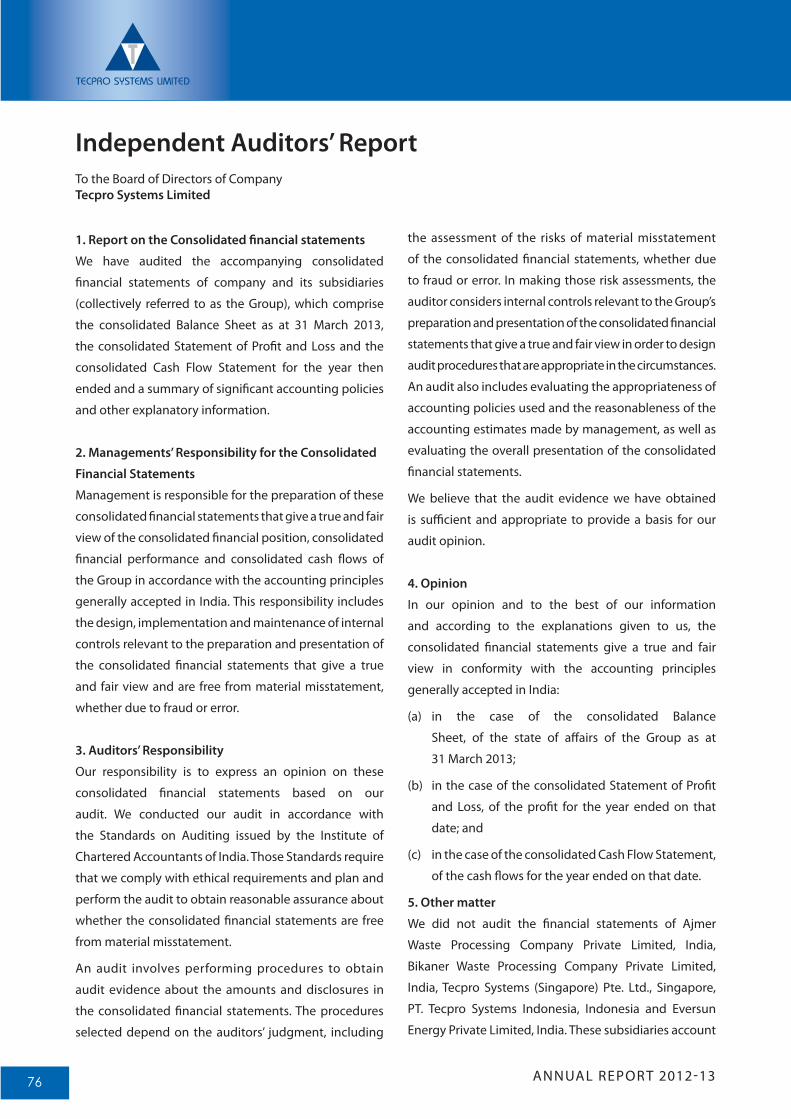
ANNUAL REPORT 2012-1376
Independent Auditors’ Report To the Board of Directors of Company Tecpro Systems Limited
1. Report on the Consolidated financial statements
We have audited the accompanying consolidated
financial statements of company and its subsidiaries
(collectively referred to as the Group), which comprise
the consolidated Balance Sheet as at 31 March 2013,
the consolidated Statement of Profit and Loss and the
consolidated Cash Flow Statement for the year then
ended and a summary of significant accounting policies
and other explanatory information.
2. Managements’ Responsibility for the Consolidated
Financial Statements
Management is responsible for the preparation of these
consolidated financial statements that give a true and fair
view of the consolidated financial position, consolidated
financial performance and consolidated cash flows of
the Group in accordance with the accounting principles
generally accepted in India. This responsibility includes
the design, implementation and maintenance of internal
controls relevant to the preparation and presentation of
the consolidated financial statements that give a true
and fair view and are free from material misstatement,
whether due to fraud or error.
3. Auditors’ Responsibility
Our responsibility is to express an opinion on these
consolidated financial statements based on our
audit. We conducted our audit in accordance with
the Standards on Auditing issued by the Institute of
Chartered Accountants of India. Those Standards require
that we comply with ethical requirements and plan and
perform the audit to obtain reasonable assurance about
whether the consolidated financial statements are free
from material misstatement.
An audit involves performing procedures to obtain
audit evidence about the amounts and disclosures in
the consolidated financial statements. The procedures
selected depend on the auditors’ judgment, including
the assessment of the risks of material misstatement
of the consolidated financial statements, whether due
to fraud or error. In making those risk assessments, the
auditor considers internal controls relevant to the Group’s
preparation and presentation of the consolidated financial
statements that give a true and fair view in order to design
audit procedures that are appropriate in the circumstances.
An audit also includes evaluating the appropriateness of
accounting policies used and the reasonableness of the
accounting estimates made by management, as well as
evaluating the overall presentation of the consolidated
financial statements.
We believe that the audit evidence we have obtained
is sufficient and appropriate to provide a basis for our
audit opinion.
4. Opinion
In our opinion and to the best of our information
and according to the explanations given to us, the
consolidated financial statements give a true and fair
view in conformity with the accounting principles
generally accepted in India:
(a) in the case of the consolidated Balance
Sheet, of the state of affairs of the Group as at
31 March 2013;
(b) in the case of the consolidated Statement of Profit
and Loss, of the profit for the year ended on that
date; and
(c) in the case of the consolidated Cash Flow Statement,
of the cash flows for the year ended on that date.
5. Other matter
We did not audit the financial statements of Ajmer
Waste Processing Company Private Limited, India,
Bikaner Waste Processing Company Private Limited,
India, Tecpro Systems (Singapore) Pte. Ltd., Singapore,
PT. Tecpro Systems Indonesia, Indonesia and Eversun
Energy Private Limited, India. These subsidiaries account
ANNUAL REPORT 2012-13 77
for 0.34% of total assets, 0.24% of total income and 6.58%
of net cash flows used in operating activities, as shown
in these consolidated financial statements. Of the above,
the financial statements of Tecpro Systems (Singapore)
Pte. Ltd., Singapore and PT. Tecpro Systems Indonesia,
Indonesia which are audited as per the generally
accepted accounting principles (GAAP) of the respective
countries by another auditor, have been converted into
Indian GAAP. These financial statements have been
audited by other auditors whose reports have been
furnished to us by the management and our opinion is
based solely on the reports of the other auditors. Our
opinion is not qualified in respect of this matter.
For B S R & Co. Chartered Accountants Firm registration number: 101248W
Sd/- Jiten ChopraPlace: Gurgaon PartnerDate: 30 May 2013 Membership No.: 092894
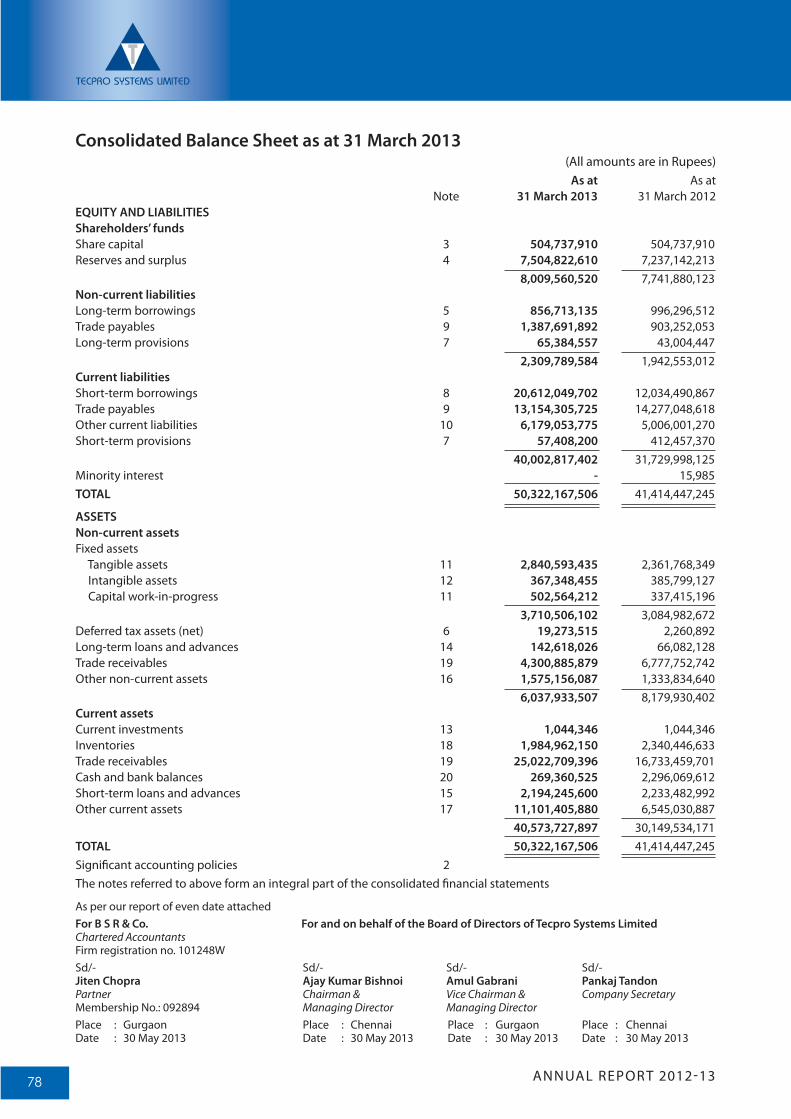
ANNUAL REPORT 2012-1378
(All amounts are in Rupees) As at As at Note 31 March 2013 31 March 2012EQUITY AND LIABILITIESShareholders’ fundsShare capital 3 504,737,910 504,737,910 Reserves and surplus 4 7,504,822,610 7,237,142,213 8,009,560,520 7,741,880,123 Non-current liabilitiesLong-term borrowings 5 856,713,135 996,296,512 Trade payables 9 1,387,691,892 903,252,053Long-term provisions 7 65,384,557 43,004,447 2,309,789,584 1,942,553,012 Current liabilitiesShort-term borrowings 8 20,612,049,702 12,034,490,867 Trade payables 9 13,154,305,725 14,277,048,618 Other current liabilities 10 6,179,053,775 5,006,001,270Short-term provisions 7 57,408,200 412,457,370 40,002,817,402 31,729,998,125 Minority interest - 15,985 TOTAL 50,322,167,506 41,414,447,245
ASSETSNon-current assetsFixed assets Tangible assets 11 2,840,593,435 2,361,768,349 Intangible assets 12 367,348,455 385,799,127 Capital work-in-progress 11 502,564,212 337,415,196 3,710,506,102 3,084,982,672 Deferred tax assets (net) 6 19,273,515 2,260,892Long-term loans and advances 14 142,618,026 66,082,128 Trade receivables 19 4,300,885,879 6,777,752,742Other non-current assets 16 1,575,156,087 1,333,834,640 6,037,933,507 8,179,930,402 Current assetsCurrent investments 13 1,044,346 1,044,346Inventories 18 1,984,962,150 2,340,446,633 Trade receivables 19 25,022,709,396 16,733,459,701 Cash and bank balances 20 269,360,525 2,296,069,612Short-term loans and advances 15 2,194,245,600 2,233,482,992Other current assets 17 11,101,405,880 6,545,030,887 40,573,727,897 30,149,534,171 TOTAL 50,322,167,506 41,414,447,245 Significant accounting policies 2The notes referred to above form an integral part of the consolidated financial statements
Consolidated Balance Sheet as at 31 March 2013
As per our report of even date attachedFor B S R & Co. For and on behalf of the Board of Directors of Tecpro Systems Limited Chartered Accountants Firm registration no. 101248W Sd/- Sd/- Sd/- Sd/- Jiten Chopra Ajay Kumar Bishnoi Amul Gabrani Pankaj Tandon Partner Chairman & Vice Chairman & Company Secretary Membership No.: 092894 Managing Director Managing Director Place : Gurgaon Place : Chennai Place : Gurgaon Place : Chennai Date : 30 May 2013 Date : 30 May 2013 Date : 30 May 2013 Date : 30 May 2013
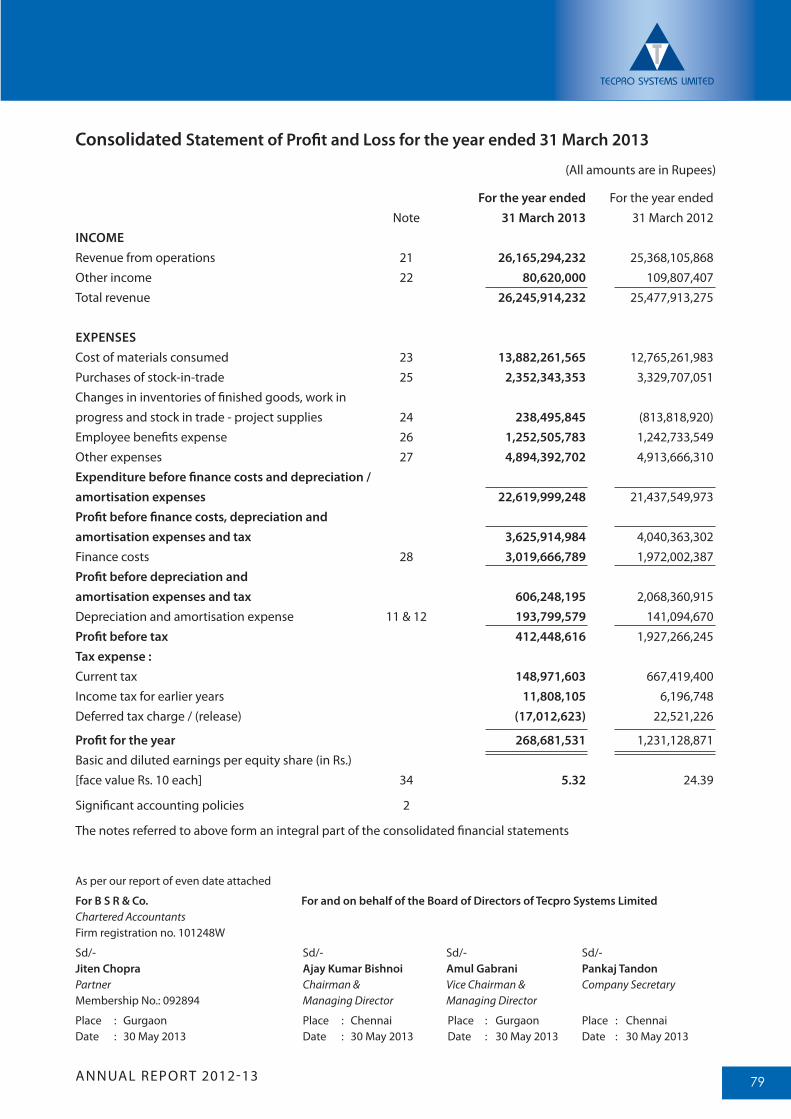
ANNUAL REPORT 2012-13 79
(All amounts are in Rupees)
For the year ended For the year ended Note 31 March 2013 31 March 2012INCOMERevenue from operations 21 26,165,294,232 25,368,105,868 Other income 22 80,620,000 109,807,407Total revenue 26,245,914,232 25,477,913,275
EXPENSESCost of materials consumed 23 13,882,261,565 12,765,261,983 Purchases of stock-in-trade 25 2,352,343,353 3,329,707,051 Changes in inventories of finished goods, work in progress and stock in trade - project supplies 24 238,495,845 (813,818,920)Employee benefits expense 26 1,252,505,783 1,242,733,549 Other expenses 27 4,894,392,702 4,913,666,310 Expenditure before finance costs and depreciation / amortisation expenses 22,619,999,248 21,437,549,973Profit before finance costs, depreciation and amortisation expenses and tax 3,625,914,984 4,040,363,302Finance costs 28 3,019,666,789 1,972,002,387 Profit before depreciation and amortisation expenses and tax 606,248,195 2,068,360,915Depreciation and amortisation expense 11 & 12 193,799,579 141,094,670 Profit before tax 412,448,616 1,927,266,245 Tax expense :Current tax 148,971,603 667,419,400 Income tax for earlier years 11,808,105 6,196,748Deferred tax charge / (release) (17,012,623) 22,521,226
Profit for the year 268,681,531 1,231,128,871 Basic and diluted earnings per equity share (in Rs.) [face value Rs. 10 each] 34 5.32 24.39
Significant accounting policies 2
The notes referred to above form an integral part of the consolidated financial statements
Consolidated Statement of Profit and Loss for the year ended 31 March 2013
As per our report of even date attached
For B S R & Co. For and on behalf of the Board of Directors of Tecpro Systems Limited Chartered Accountants Firm registration no. 101248W
Sd/- Sd/- Sd/- Sd/- Jiten Chopra Ajay Kumar Bishnoi Amul Gabrani Pankaj Tandon Partner Chairman & Vice Chairman & Company Secretary Membership No.: 092894 Managing Director Managing Director
Place : Gurgaon Place : Chennai Place : Gurgaon Place : Chennai Date : 30 May 2013 Date : 30 May 2013 Date : 30 May 2013 Date : 30 May 2013
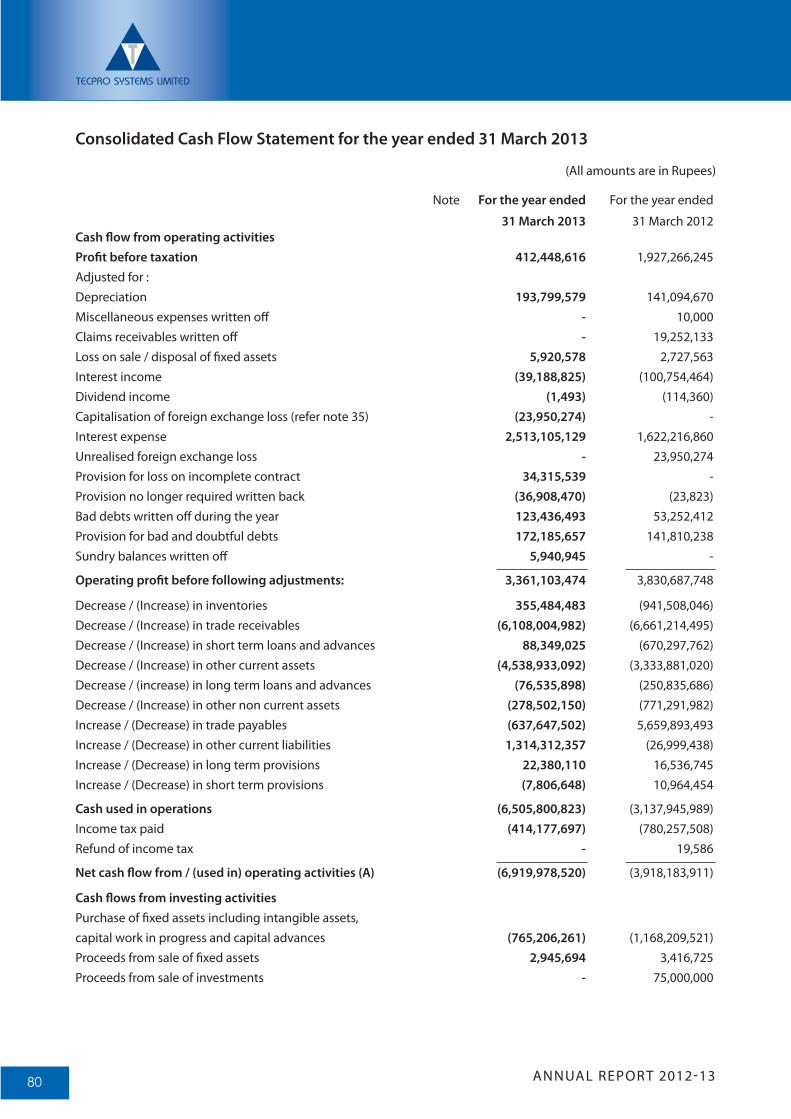
ANNUAL REPORT 2012-1380
Consolidated Cash Flow Statement for the year ended 31 March 2013
Cash flow from operating activitiesProfit before taxation 412,448,616 1,927,266,245Adjusted for :Depreciation 193,799,579 141,094,670 Miscellaneous expenses written off - 10,000 Claims receivables written off - 19,252,133Loss on sale / disposal of fixed assets 5,920,578 2,727,563Interest income (39,188,825) (100,754,464)Dividend income (1,493) (114,360)Capitalisation of foreign exchange loss (refer note 35) (23,950,274) - Interest expense 2,513,105,129 1,622,216,860 Unrealised foreign exchange loss - 23,950,274 Provision for loss on incomplete contract 34,315,539 - Provision no longer required written back (36,908,470) (23,823)Bad debts written off during the year 123,436,493 53,252,412 Provision for bad and doubtful debts 172,185,657 141,810,238Sundry balances written off 5,940,945 -
Operating profit before following adjustments: 3,361,103,474 3,830,687,748
Decrease / (Increase) in inventories 355,484,483 (941,508,046)Decrease / (Increase) in trade receivables (6,108,004,982) (6,661,214,495)Decrease / (Increase) in short term loans and advances 88,349,025 (670,297,762)Decrease / (Increase) in other current assets (4,538,933,092) (3,333,881,020)Decrease / (increase) in long term loans and advances (76,535,898) (250,835,686)Decrease / (Increase) in other non current assets (278,502,150) (771,291,982)Increase / (Decrease) in trade payables (637,647,502) 5,659,893,493Increase / (Decrease) in other current liabilities 1,314,312,357 (26,999,438)Increase / (Decrease) in long term provisions 22,380,110 16,536,745 Increase / (Decrease) in short term provisions (7,806,648) 10,964,454
Cash used in operations (6,505,800,823) (3,137,945,989)Income tax paid (414,177,697) (780,257,508)Refund of income tax - 19,586
Net cash flow from / (used in) operating activities (A) (6,919,978,520) (3,918,183,911)
Cash flows from investing activitiesPurchase of fixed assets including intangible assets, capital work in progress and capital advances (765,206,261) (1,168,209,521)Proceeds from sale of fixed assets 2,945,694 3,416,725Proceeds from sale of investments - 75,000,000
(All amounts are in Rupees)
Note For the year ended For the year ended
31 March 2013 31 March 2012
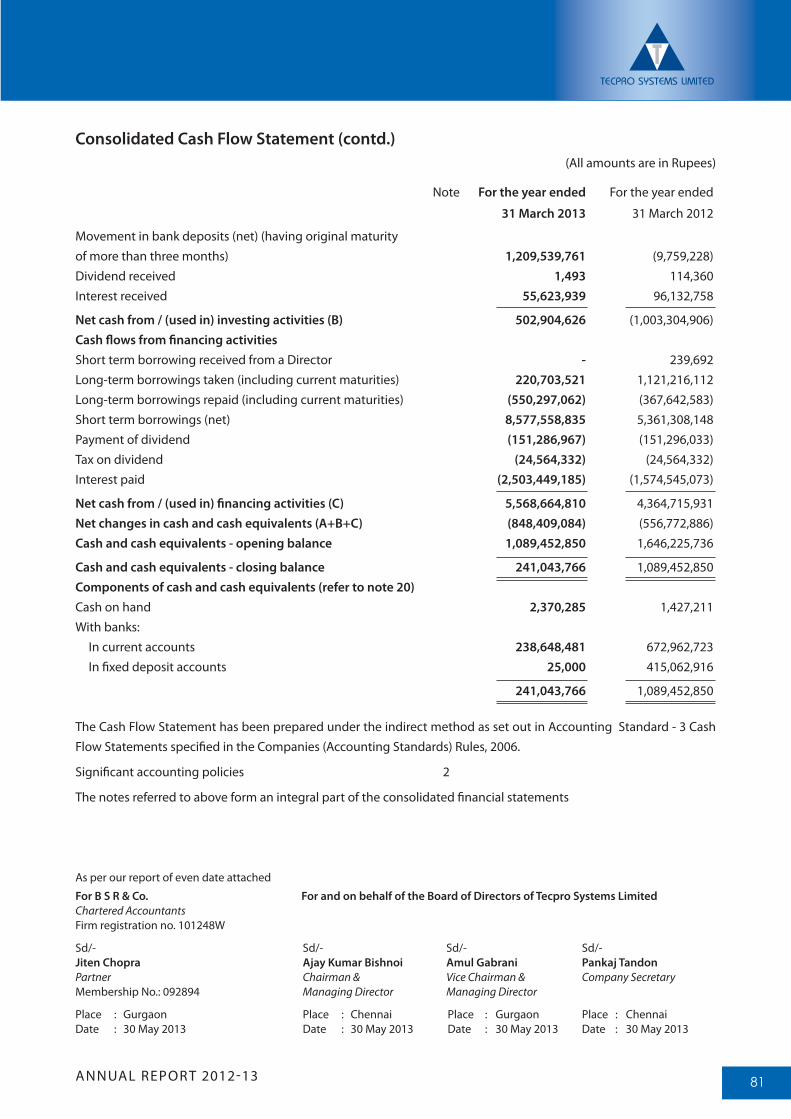
ANNUAL REPORT 2012-13 81
Movement in bank deposits (net) (having original maturity of more than three months) 1,209,539,761 (9,759,228)Dividend received 1,493 114,360 Interest received 55,623,939 96,132,758
Net cash from / (used in) investing activities (B) 502,904,626 (1,003,304,906)Cash flows from financing activitiesShort term borrowing received from a Director - 239,692Long-term borrowings taken (including current maturities) 220,703,521 1,121,216,112Long-term borrowings repaid (including current maturities) (550,297,062) (367,642,583)Short term borrowings (net) 8,577,558,835 5,361,308,148 Payment of dividend (151,286,967) (151,296,033)Tax on dividend (24,564,332) (24,564,332)Interest paid (2,503,449,185) (1,574,545,073)
Net cash from / (used in) financing activities (C) 5,568,664,810 4,364,715,931Net changes in cash and cash equivalents (A+B+C) (848,409,084) (556,772,886)Cash and cash equivalents - opening balance 1,089,452,850 1,646,225,736
Cash and cash equivalents - closing balance 241,043,766 1,089,452,850 Components of cash and cash equivalents (refer to note 20)Cash on hand 2,370,285 1,427,211 With banks: In current accounts 238,648,481 672,962,723 In fixed deposit accounts 25,000 415,062,916
241,043,766 1,089,452,850
The Cash Flow Statement has been prepared under the indirect method as set out in Accounting Standard - 3 Cash Flow Statements specified in the Companies (Accounting Standards) Rules, 2006.
Significant accounting policies 2
The notes referred to above form an integral part of the consolidated financial statements
(All amounts are in Rupees)
Note For the year ended For the year ended
31 March 2013 31 March 2012
Consolidated Cash Flow Statement (contd.)
As per our report of even date attached
For B S R & Co. For and on behalf of the Board of Directors of Tecpro Systems Limited Chartered Accountants Firm registration no. 101248W
Sd/- Sd/- Sd/- Sd/- Jiten Chopra Ajay Kumar Bishnoi Amul Gabrani Pankaj Tandon Partner Chairman & Vice Chairman & Company Secretary Membership No.: 092894 Managing Director Managing Director
Place : Gurgaon Place : Chennai Place : Gurgaon Place : Chennai Date : 30 May 2013 Date : 30 May 2013 Date : 30 May 2013 Date : 30 May 2013
ANNUAL REPORT 2012-1382
1. Principles of ConsolidationThe consolidated financial information is prepared in accordance with the principles and procedures prescribed by Accounting Standard 21-“Consolidated Financial Statements” (‘AS-21’) prescribed by the Companies (Accounting Standards) Rules, 2006, for the purposes of preparation and presentation of consolidated financial statements.
The financial statements of the Company and its subsidiaries have been combined on a line-by-line basis by adding together the book values of like items of assets, liabilities, income and expenses after eliminating intra-group balances and transactions resulting in unrealised profits in full. Unrealised losses resulting from intra-group transactions have also been eliminated unless cost cannot be recovered in full. The amounts shown in respect of accumulated reserves comprise the amount of the relevant reserves as per the balance sheet of the Company and its share in the post acquisition reserves of its subsidiaries. Goodwill arising on consolidation represents the excess of cost of investments to the Company over the Company’s portion of equity of the respective subsidiaries, at the date on which investment in the subsidiary is made. The losses applicable to minority that exceeds the minority interest in the equity of the subsidiaries have been adjusted in the majority interest.
These consolidated financial statements relate to Tecpro Systems Limited, the parent company and its subsidiaries (hereinafter collectively referred as “the Group”), which are as follows:
Name of the Company % Shareholding Country of incorporation
Tecpro Energy Limited 98.02 India
Tecpro Trema Limited* 100.00 India
Tecpro International FZE @ 100.00 Dubai
Ajmer Waste Processing Company Private Limited 49.00 India
Tecpro Systems (Singapore) Pte. Limited 100.00 Singapore
Bikaner Waste Processing Company Private Limited 100.00 India
Microbase Infosolution Private Limited @@ 100.00 India
Ambika Projects (India) Private Limited* 100.00 India
Eversun Energy Private Limited** 100.00 India
PT. Tecpro Systems Indonesia # 100.00 Indonesia
* Tecpro Trema Limited and Ambika Projects (India) Private Limited has been merged with the Company from appointed date of 1 April 2011 through a scheme of amalgamation approved by Honorable High Court of Delhi (vide its Order dated 4 February 2013) and Madras (vide its Orders dated 28 February 2013).
@ Tecpro International FZE has been dissolved as on 11 January 2012 .@@ Microbase Infosolution Private Limited has been merged with the Company from appointed date of 1 April 2011
through a scheme of amalgamation approved by Hon’ble High Court of Delhi effective from 24 December 2011.** Acquired on 24 February 2012.# Share purchased on 27 April 2012.
2. Significant Accounting Policies2.1 Basis of preparation of financial statements The financial statements are prepared on accrual basis under the historical cost convention, modified to include
revaluation of certain assets, in accordance with applicable Accounting Standards (AS) specified in the Companies (Accounting Standards) Rules, 2006 and presentational requirements of the Companies Act, 1956.
2.2 Use of estimates The preparation of financial statements in conformity with generally accepted accounting principles requires the
management to make judgements, estimates and assumptions that affect the reported amounts of assets and liabilities, the disclosure of contingent liabilities on the date of the financial statements and the reported amounts of revenue and expenses during the reporting year. Actual results could differ from those estimates. Any revision to accounting estimates is recognised prospectively in current and future years.
Notes to consolidated financial statements for the year ended 31 March 2013
ANNUAL REPORT 2012-13 83
2.3 Current and non-current classification All assets and liabilities are classified into current and non-current.
Assets An asset is classified as current when it satisfies any of the following criteria:
(a) it is expected to be realised in, or is intended for sale or consumption in, the company’s normal operating cycle;
(b) it is held primarily for the purpose of being traded;
(c) it is expected to be realised within 12 months after the reporting date; or
(d) it is cash or cash equivalent unless it is restricted from being exchanged or used to settle a liability for at least 12 months after the reporting date.
Current assets include the current portion of non-current financial assets. All other assets are classified as non-current.
Liabilities A liability is classified as current when it satisfies any of the following criteria:
(a) it is expected to be settled in the company’s normal operating cycle;
(b) it is held primarily for the purpose of being traded;
(c) it is due to be settled within 12 months after the reporting date; or
(d) the company does not have an unconditional right to defer settlement of the liability for at least 12 months after the reporting date. Terms of a liability that could, at the option of the counterparty, result in its settlement by the issue of equity instruments do not affect its classification.
Current liabilities include current portion of non-current financial liabilities. All other liabilities are classified as non-current.
Operating cycle Operating cycle is the time between the acquisition of assets for processing and their realisation in cash or cash
equivalents. The Company has multiple operating cycles determined on the basis of the distinguishing features and
characteristics of various categories of contracts. However, assets/liabilities so disclosed as current on the basis of the relevant operating cycle but having a longer period of life than 12 months after the reporting period are also shown separately (Also refer note 31).
2.4 Revenue recognition Revenue from sale of goods is recognised on transfer of all significant risks and rewards of ownership in the goods
to the customer. Revenue from services is recognised on rendering of services to customers. Interest income is recognised using the time proportion method, based on underlying interest rates. Revenue from long-term construction contracts in accordance with Accounting Standard-7 on “Construction
Contracts” is recognized using the percentage of completion method. Percentage of completion method is determined as a proportion of cost incurred to date to the total estimated contract cost or completion of a physical portion of the contract work depending on the nature of contract whichever is appropriate. Where the total cost of the contract, based on technical and other estimates, is expected to exceed the corresponding contract value, such excess is provided during the year.
Duty drawback available under prevalent scheme is accrued in the year when the right to receive credit as per the terms of scheme are established and these are accounted to the extent there is no significant uncertainty about the measurability and ultimate utilization of such duty credit.
2.5 Tangible fixed assets and capital work-in-progress Fixed assets, including capital work in progress are stated at cost of acquisition or construction less accumulated
depreciation. Cost comprises the purchase price and any directly attributable costs of bringing the asset to its working condition for the intended use. Tangible fixed assets under construction are disclosed as Capital work-in-progress.
Notes to consolidated financial statements for the year ended 31 March 2013
ANNUAL REPORT 2012-1384
2.6 Intangible assets Intangible assets comprising computer software and technical know-how are stated at cost, including taxes, less
accumulated amortisation. Computer software is amortised on a straight line basis over three years. Technical know-how is amortised on a straight line basis over its estimated useful life, the period over which the Company expects to derive economic benefits from the use of the technical know-how.
These are amortised over their estimated useful lives on a straight-line basis, commencing from the date the assets is available to the entities for its use. The management estimates the useful lives for the various intangible assets as follows:
Estimated useful life (in years)
Computer software 3-5Technical know how 5Goodwill (except goodwill arising on consolidation) 5
Goodwill reflects the excess of cost of acquisition over the book value of net assets acquired on the date of acquisition. Goodwill arising on consolidation is tested for impairment on an annual basis.
2.7 Borrowing cost Financing costs relating to borrowed funds attributable to construction or acquisition of qualifying assets for the
period up to the completion of construction or acquisition of such assets are included in the cost of the assets. All borrowing costs are charged to Consolidated Statement of Profit and Loss.
2.8 Impairment The carrying values of assets are reviewed at each reporting date to determine whether there is any indication
of impairment. If such indication exists, the amount recoverable towards such asset is estimated. An impairment loss is recognised whenever the carrying amount of an asset or its cash generating unit exceeds its recoverable amount. Impairment losses are recognised in the Consolidated Statement of Profit and Loss. An impairment loss is reversed if there has been a change in the estimates used to determine the recoverable amount. An impairment loss is reversed only to the extent that the asset’s carrying amount does not exceed the carrying amount that would have been determined net of depreciation or amortisation, if no impairment loss has been recognised.
2.9 Depreciation Depreciation is provided on a pro-rata basis under the straight line method. The rates of depreciation prescribed in
Schedule XIV to the Companies Act, 1956 are considered as the minimum rates. If the management’s estimate of the useful life of a fixed asset at the time of acquisition of the asset or of the remaining useful life on a subsequent review is shorter than that envisaged in the aforesaid schedule, depreciation is provided at a higher rate based on the management’s estimate of the useful life/remaining useful life. Rates of depreciation (where different from the rates prescribed in Schedule XIV to the Companies Act, 1956) have been derived on the basis of the following estimated useful lives:
Estimated useful life(in years)
Plant and machinery 20Office equipments 6Furniture and fixtures 5Vehicles 2-10Temporary sheds at project sites (to coincide with the project period)* 1-5Patterns 3Shuttering and scaffolding** 4Office building* 28.44Computers 6Computer software 3Technical know-how 5Goodwill 5
* included in buildings in note 11 to the financial statements ** included in plant and machinery in note 11 to the financial statements
Notes to consolidated financial statements for the year ended 31 March 2013
ANNUAL REPORT 2012-13 85
Leasehold land is amortised on straight line basis over the period of the lease. Leasehold improvements are depreciated over the period of lease or the useful life of the underlying asset, whichever is less.
The revalued cost of land, revalued on the date of acquisition has been considered as the carrying cost for the purposes of computing amortization of such asset.
Computers of Tecpro Systems (Singapore) Pte. Limited, subsidiary of the Company, are depreciated at 33.33% per annum under the straight line method.
Plant and machinery of Tecpro Trema Limited, subsidiary of the Company, are depreciated at 20% per annum under the straight line method.
The rates of depreciation used reflect the useful lives of assets.
Depreciation on additions is being provided on a pro rata basis from the date of such additions. Similarly, depreciation on assets sold/disposed off during the year/period is being provided up to the date on which such assets are sold/disposed off.
Assets costing individually Rs. 5,000 or less are depreciated fully in the year of purchase.
2.10 Inventories Inventories are valued at the lower of cost and net realisable value. Cost includes all applicable costs incurred in
bringing goods to their present location and condition, determined on a first in first out basis.
In determining the cost of inventories, fixed production overheads are allocated on the basis of normal capacity of production facilities.
Contract work in progress includes contract costs that relate to future activity on the long term construction contract, such as costs of materials that have been delivered to a contract site or set aside for use in a contract but not yet installed, used or applied during contract performance and excludes the materials which have been made specifically for such contracts.
2.11 Foreign currency transactions Foreign currency transactions are recorded at the exchange rate prevailing on the date of the respective transactions.
Monetary foreign currency assets and liabilities remaining unsettled at the balance sheet date are translated at exchange rates prevailing on that date. All exchange differences other than in relation to acquisition of fixed assets and other long term foreign currency monetary liabilities are dealt with in the Consolidated Statement of Profit and Loss.
In accordance with Accounting Standard 11, “Accounting for the effects of changes in foreign exchange rates”, exchange differences arising in respect of long term foreign currency monetary items:
depreciated over the balance life of asset.
Currency Monetary Item Translation Difference Account (FCMITDA) and amortized over the balance period of such liability.
The premium or discount that arises on entering into a forward exchange contract for hedging underlying assets and liabilities is measured by the difference between the exchange rate at the date of inception of the forward exchange contract and the forward rate specified in the contract and is amortised as expense or income over life of the contract. Exchange difference on forward exchange contract is the difference between:
(a) the foreign currency amount of the contract translated at the exchange rate at the reporting date, or the settlement date where the transaction is settled during the reporting period, and;
(b) the same foreign currency amount translated at the latter of the date of inception of the forward exchange contract and the last reporting date.
These exchange differences are recognised in the Consolidated Statement of Profit and Loss in the reporting period in which the exchange rates change.
Notes to consolidated financial statements for the year ended 31 March 2013
ANNUAL REPORT 2012-1386
Translation of foreign operations:
For translating the financial statements of foreign branches, these are classified into ‘integral’ and ‘non-integral’ foreign operations.
Integral foreign operations are those which carry on their business as if they were an extension of the Company’s operations. Other foreign operations are classified as non-integral.
The financial statements of an integral foreign operation are translated into Indian rupees as if the transactions of the foreign operation were those of the Company itself.
In the case of a non-integral foreign operation, the assets and liabilities, both monetary and non-monetary, are translated at the closing exchange rate and income and expense items are translated at exchange rates at the dates of the transactions. The resulting exchange differences are accumulated in ‘foreign currency translation reserve’. On the disposal of a non-integral foreign operation, the cumulative amount of foreign currency translation reserve which relates to that operation is recognised as income or as expense.
2.12 Provisions and contingencies A provision is created when there is a present obligation as a result of a past event that entails a probable outflow
of resources and a reliable estimate can be made of the amount of the obligation. Disclosure of a contingent liability is made when there is a possible but not probable obligation or a present obligation that may, but probably will not, entail an outflow of resources. When there is an obligation in respect of which the likelihood of outflow of resources is remote, no provision or disclosure is made.
2.13 Taxation Income-tax expense comprises current tax (i.e. amount of tax for the year determined in accordance with the
income-tax laws) and deferred tax charge or credit (reflecting the tax effects of timing differences between accounting income and taxable income for the period). Income tax expense in Consolidated Statement of Profit and Loss is the aggregate of the amounts of tax expenses appearing in the separate financial statements of the Company and its subsidiaries.
The deferred tax charge or credit and the corresponding deferred tax liabilities and assets are recognised using the tax rates that have been enacted or substantively enacted by the Balance Sheet date. Deferred tax assets are recognised only to the extent there is reasonable certainty that the assets can be realised in future; however, where there is unabsorbed depreciation or carried forward losses under taxation laws, deferred tax assets are recognised only if there is a virtual certainty of realisation of such assets. Deferred tax assets are reviewed as at each Balance Sheet date and are written down or written up to reflect the amount that is reasonably / virtually certain (as the case may be) to be realised.
Tecpro International FZE, a subsidiary of the Company has been incorporated in a tax free zone in United Arab Emirates. Hence, no tax liability to be provided in the books.
2.14 Employee benefits1. All employee benefits payable/available within twelve months of rendering the service are classified
as short-term employee benefits. Benefits such as salaries, wages and bonus etc., are recognised in the Consolidated Statement of Profit and Loss in the year in which the employee renders the related service.
2. Provident fund is a defined contribution scheme. Contributions payable to the provident fund are charged to the Consolidated Statement of Profit and Loss.
3. Superannuation fund is a defined contribution scheme. The Company contributes to schemes administered by the Life Insurance Corporation of India (‘LIC’) to discharge its superannuation liabilities. The Company’s contribution paid/payable under the scheme is recognised as an expense in the Consolidated Statement of Profit and Loss during the year in which the employee renders the related service.
Notes to consolidated financial statements for the year ended 31 March 2013
ANNUAL REPORT 2012-13 87
4. Gratuity costs are defined benefits plans. The present value of obligations under such defined benefit plan is determined based on actuarial valuation carried out by an independent actuary using the Projected Unit Credit Method, which recognises each period of service as giving rise to additional unit of employee benefit entitlement and measure each unit separately to build up the final obligation.
The obligation is measured at the present value of estimated future cash flows. The discount rates used for determining the present value of obligation under defined benefit plans, is based on the market yields on Government securities as at the balance sheet date, having maturity periods approximating to the terms of related obligations.
Annual contributions are made to the employee’s gratuity fund, established with the LIC based on an actuarial valuation carried out by the LIC as at 31 March each year.
The fair value of plan assets is reduced from the gross obligation under the defined benefit plans, to recognise the obligation on net basis. Actuarial gains and losses are recognised immediately in the Consolidated Statement of Profit and Loss. Gains or losses on the curtailment or settlement of any defined benefit plan are recognised when the curtailment or settlement occurs.
5. Benefits under the Company’s leave encashment scheme constitute other long term employee benefits. The obligation in respect of leave encashment is provided on the basis on actuarial valuation carried out by an independent actuary using the Projected Unit Credit Method, which recognises each period of service as giving rise to additional unit of employee benefit entitlement and measure each unit separately to build up the final obligation.
The obligation is measured at the present value of estimated future cash flows. The discount rates used for determining the present value of obligation under defined benefit plans, is based on the market yields on Government securities as at the balance sheet date, having maturity periods approximating to the terms of related obligations.
Annual contributions are made to the employee’s leave encashment fund, established with the LIC based on an actuarial valuation carried out by the LIC as at 31 March each year. The fair value of plan assets is reduced from the gross obligation, to recognize the obligation on net basis. Actuarial gains and losses are recognised immediately in the Consolidated Statement of Profit and Loss.
2.15 Investments Long term investments are valued at cost. Any decline other than temporary, in the value of long-term investments,
is adjusted in the carrying value of such investments. Diminution, if any, is determined individually for each long-term investment. Current investments are valued at the lower of cost and fair value of individual scrip’s.
2.16 Earnings per share Basic earnings per share are computed by dividing the net profit/(loss) for the year/period attributable to the
equity shareholders with the weighted average number of equity shares outstanding during the year/period. Diluted earnings per share are computed using the weighted average number of equity and dilutive potential equity shares outstanding during the year/period, except where the results would be anti-dilutive.
2.17 Leases Lease arrangements where the risks and rewards incidental to ownership of an asset substantially vest with the
lessor are recognized as operating leases. Lease rents under operating leases are recognized in the Consolidated Statement of Profit and Loss on a straight line basis over the lease term.
2.18 Events occurring after the balance sheet date Adjustment to assets and liabilities are made for events occurring after the balance sheet date that provide
additional information materially affecting the determination of the amount of assets and liabilities relating to condition existing at the balance sheet date.
Notes to consolidated financial statements for the year ended 31 March 2013
ANNUAL REPORT 2012-1388
(All amounts are in Rupees) As at As at 31 March 2013 31 March 20123. Share capitalAuthorised 131,150,000 (previous year 127,950,000) equity shares of Rs.10 each 1,311,500,000 1,279,500,000
Issued, subscribed and fully paid-up50,473,791 (previous year 50,473,791) equity shares of Rs.10 each fully paid-up 504,737,910 504,737,910
504,737,910 504,737,910
(a) Reconciliation of shares outstanding and the amount of share capital as at 31 March 2013 and 31 March 2012:
Equity shares As at 31 March 2013 As at 31 March 2012 No. of shares Amount (Rs.) No. of shares Amount (Rs.)
Number of shares at the beginning 50,473,791 504,737,910 50,473,791 504,737,910 Add: Shares issued / redeemed during the year - - - -
Number of shares at the end 50,473,791 504,737,910 50,473,791 504,737,910
The Company has only one class of equity shares, having a par value of Rs.10 per share. Accordingly, all equity shares rank equally with regard to dividends and share in the Company’s residual assets. Each shareholder is eligible to one vote per share held. The dividend proposed, if any, by the Board of Directors is subject to approval of shareholders in the ensuing Annual General Meeting, except in case of interim dividend. The repayment of equity share capital in the event of liquidation and buy back of shares are possible subject to prevalent regulations. In the event of liquidation, normally the equity shareholders are eligible to receive the remaining assets of the Company after distribution of all preferential amounts, in proportion to their shareholding.
(b) Shares in the Company held by each shareholder holding more than 5% shares are as under:
As at 31 March 2013 As at 31 March 2012 Names No. of shares % of shares held No. of shares % of shares held
Mr. Amul Gabrani 9,319,342 18.46 9,319,342 18.46 Mr. Ajay Kumar Bishnoi 9,019,842 17.87 9,019,842 17.87 M/s. Fusion Fittings (I) Limited 7,540,784 14.94 7,540,784 14.94 M/s. Avigo Venture Investments Limited 6,819,153 13.51 6,819,153 13.51 M/s. Metmin Investments Holdings Limited 3,994,881 7.91 4,294,881 8.51
(c) Pursuant to SEBI (Issue of Capital and Disclosure Requirements) Regulations, 2009, an aggregate of 20% of the post offer capital of the Company held by the promoters is locked in for a period of three years. Accordingly, 10,094,759 equity shares held by Mr. Ajay Kumar Bishnoi and Mr. Amul Gabrani are under lock in period for three years beginning 8 October 2010. Further, in addition to the above equity shares, that are locked in for three years, 26,954,328 equity shares out of pre-offer capital of the Company were locked in for a period of one year beginning 8 October 2010.
(d) During the five years period ended 31 March 2013 Company has issued equity shares for consideration other than cash as follows :-
i) 12,698,750 (previous year 12,698,750) equity shares have been allotted as fully paid up by way of bonus shares during the year 2007-2008 out of securities premium account.
ii) 16,526,291 (previous year 16,526,291) equity shares of Rs. 10 issued during the year 2009-10 as fully paid-up shares to shareholders of erstwhile Tecpro Ashtech Limited and erstwhile Tecpro Power Systems Limited, pursuant to a scheme of amalgamation, for consideration other than cash.
Notes to consolidated financial statements for the year ended 31 March 2013
ANNUAL REPORT 2012-13 89
(All amounts are in Rupees)
As at As at 31 March 2013 31 March 20124. Reserves and surplusCapital reserve 38,855,552 38,855,552
Securities premium account 2,991,808,262 2,991,808,262
Revaluation reserve Opening balance 70,079,388 71,080,522Less: amount transferred to the statement of profit and loss on account of additional depreciation on revalued assets 1,001,134 1,001,134
Closing balance 69,078,254 70,079,388 General reserveOpening balance 1,000,324,258 874,394,322 Add: appropriations from the statement of profit and loss - 125,929,936
Closing balance 1,000,324,258 1,000,324,258 Surplus in the Statement of Profit and Loss Opening balance 3,136,074,753 2,206,861,523 Profit for the year 268,681,531 1,231,128,871Appropriations:
- Proposed equity dividend (amount per share Rs. Nil (previous year Rs. 3)) - (151,421,373)- Tax on proposed equity dividend - (24,564,332)- Transferred to general reserve - (125,929,936)
Net surplus in the Statement of Profit and Loss 3,404,756,284 3,136,074,753
Total reserves and surplus 7,504,822,610 7,237,142,213 5. Long term borrowing Non-current portion Current maturities
As at As at As at As at 31 March 2013 31 March 2012 31 March 2013 31 March 2012Secured:Term loans
- Indian rupee loan from banks 380,365,617 557,131,913 176,582,554 464,009,737- Foreign currency loan from banks 466,796,580 368,326,800 87,022,880 40,925,200- From financial institutions 9,550,938 70,837,799 71,194,197 35,645,364
856,713,135 996,296,512 334,799,631 540,580,301 Less:Amount disclosed under the head “other current liabilities” (refer to note 10) - - (334,799,631) (540,580,301)
Net amount 856,713,135 996,296,512 - -
Notes to consolidated financial statements for the year ended 31 March 2013
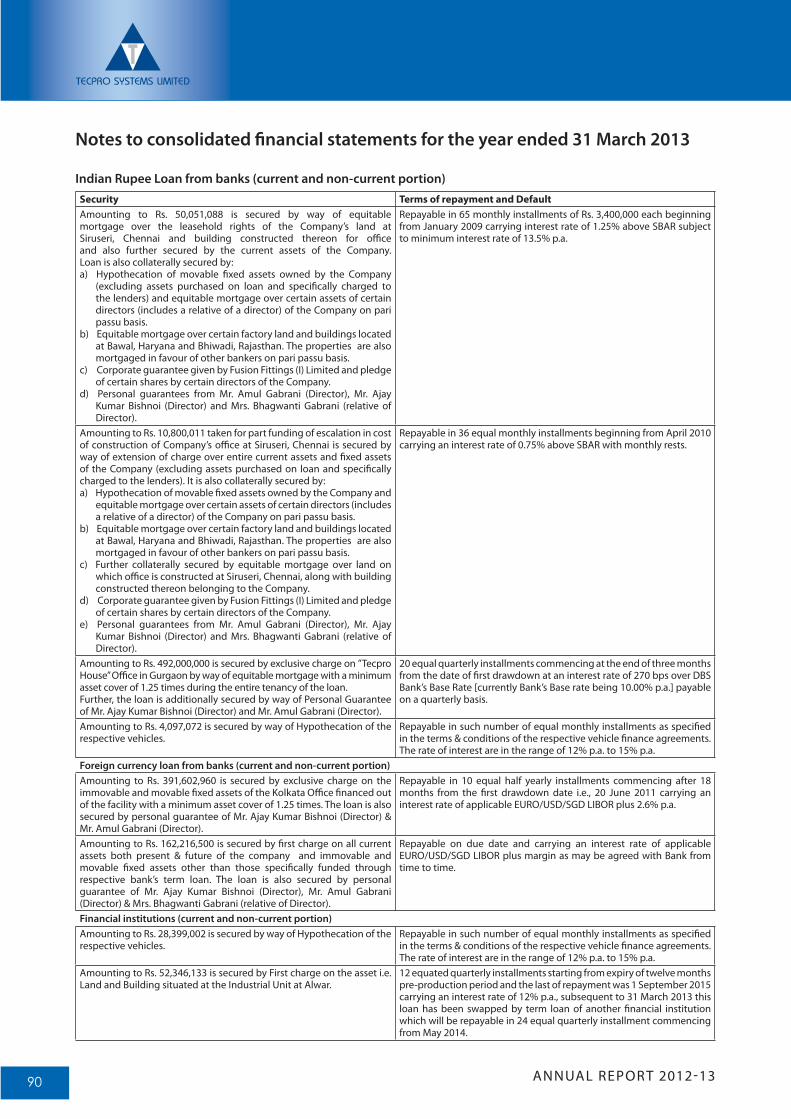
ANNUAL REPORT 2012-1390
Security Terms of repayment and Default Amounting to Rs. 50,051,088 is secured by way of equitable mortgage over the leasehold rights of the Company’s land at Siruseri, Chennai and building constructed thereon for office and also further secured by the current assets of the Company. Loan is also collaterally secured by:a) Hypothecation of movable fixed assets owned by the Company
(excluding assets purchased on loan and specifically charged to the lenders) and equitable mortgage over certain assets of certain directors (includes a relative of a director) of the Company on pari passu basis.
b) Equitable mortgage over certain factory land and buildings located at Bawal, Haryana and Bhiwadi, Rajasthan. The properties are also mortgaged in favour of other bankers on pari passu basis.
c) Corporate guarantee given by Fusion Fittings (I) Limited and pledge of certain shares by certain directors of the Company.
d) Personal guarantees from Mr. Amul Gabrani (Director), Mr. Ajay Kumar Bishnoi (Director) and Mrs. Bhagwanti Gabrani (relative of Director).
Repayable in 65 monthly installments of Rs. 3,400,000 each beginning from January 2009 carrying interest rate of 1.25% above SBAR subject to minimum interest rate of 13.5% p.a.
Amounting to Rs. 10,800,011 taken for part funding of escalation in cost of construction of Company’s office at Siruseri, Chennai is secured by way of extension of charge over entire current assets and fixed assets of the Company (excluding assets purchased on loan and specifically charged to the lenders). It is also collaterally secured by:a) Hypothecation of movable fixed assets owned by the Company and
equitable mortgage over certain assets of certain directors (includes a relative of a director) of the Company on pari passu basis.
b) Equitable mortgage over certain factory land and buildings located at Bawal, Haryana and Bhiwadi, Rajasthan. The properties are also mortgaged in favour of other bankers on pari passu basis.
c) Further collaterally secured by equitable mortgage over land on which office is constructed at Siruseri, Chennai, along with building constructed thereon belonging to the Company.
d) Corporate guarantee given by Fusion Fittings (I) Limited and pledge of certain shares by certain directors of the Company.
e) Personal guarantees from Mr. Amul Gabrani (Director), Mr. Ajay Kumar Bishnoi (Director) and Mrs. Bhagwanti Gabrani (relative of Director).
Repayable in 36 equal monthly installments beginning from April 2010 carrying an interest rate of 0.75% above SBAR with monthly rests.
Amounting to Rs. 492,000,000 is secured by exclusive charge on ”Tecpro House” Office in Gurgaon by way of equitable mortgage with a minimum asset cover of 1.25 times during the entire tenancy of the loan. Further, the loan is additionally secured by way of Personal Guarantee of Mr. Ajay Kumar Bishnoi (Director) and Mr. Amul Gabrani (Director).
20 equal quarterly installments commencing at the end of three months from the date of first drawdown at an interest rate of 270 bps over DBS Bank’s Base Rate [currently Bank’s Base rate being 10.00% p.a.] payable on a quarterly basis.
Amounting to Rs. 4,097,072 is secured by way of Hypothecation of the respective vehicles.
Repayable in such number of equal monthly installments as specified in the terms & conditions of the respective vehicle finance agreements. The rate of interest are in the range of 12% p.a. to 15% p.a.
Foreign currency loan from banks (current and non-current portion)Amounting to Rs. 391,602,960 is secured by exclusive charge on the immovable and movable fixed assets of the Kolkata Office financed out of the facility with a minimum asset cover of 1.25 times. The loan is also secured by personal guarantee of Mr. Ajay Kumar Bishnoi (Director) & Mr. Amul Gabrani (Director).
Repayable in 10 equal half yearly installments commencing after 18 months from the first drawdown date i.e., 20 June 2011 carrying an interest rate of applicable EURO/USD/SGD LIBOR plus 2.6% p.a.
Amounting to Rs. 162,216,500 is secured by first charge on all current assets both present & future of the company and immovable and movable fixed assets other than those specifically funded through respective bank’s term loan. The loan is also secured by personal guarantee of Mr. Ajay Kumar Bishnoi (Director), Mr. Amul Gabrani (Director) & Mrs. Bhagwanti Gabrani (relative of Director).
Repayable on due date and carrying an interest rate of applicable EURO/USD/SGD LIBOR plus margin as may be agreed with Bank from time to time.
Financial institutions (current and non-current portion) Amounting to Rs. 28,399,002 is secured by way of Hypothecation of the respective vehicles.
Repayable in such number of equal monthly installments as specified in the terms & conditions of the respective vehicle finance agreements. The rate of interest are in the range of 12% p.a. to 15% p.a.
Amounting to Rs. 52,346,133 is secured by First charge on the asset i.e. Land and Building situated at the Industrial Unit at Alwar.
12 equated quarterly installments starting from expiry of twelve months pre-production period and the last of repayment was 1 September 2015 carrying an interest rate of 12% p.a., subsequent to 31 March 2013 this loan has been swapped by term loan of another financial institution which will be repayable in 24 equal quarterly installment commencing from May 2014.
Notes to consolidated financial statements for the year ended 31 March 2013
Indian Rupee Loan from banks (current and non-current portion)
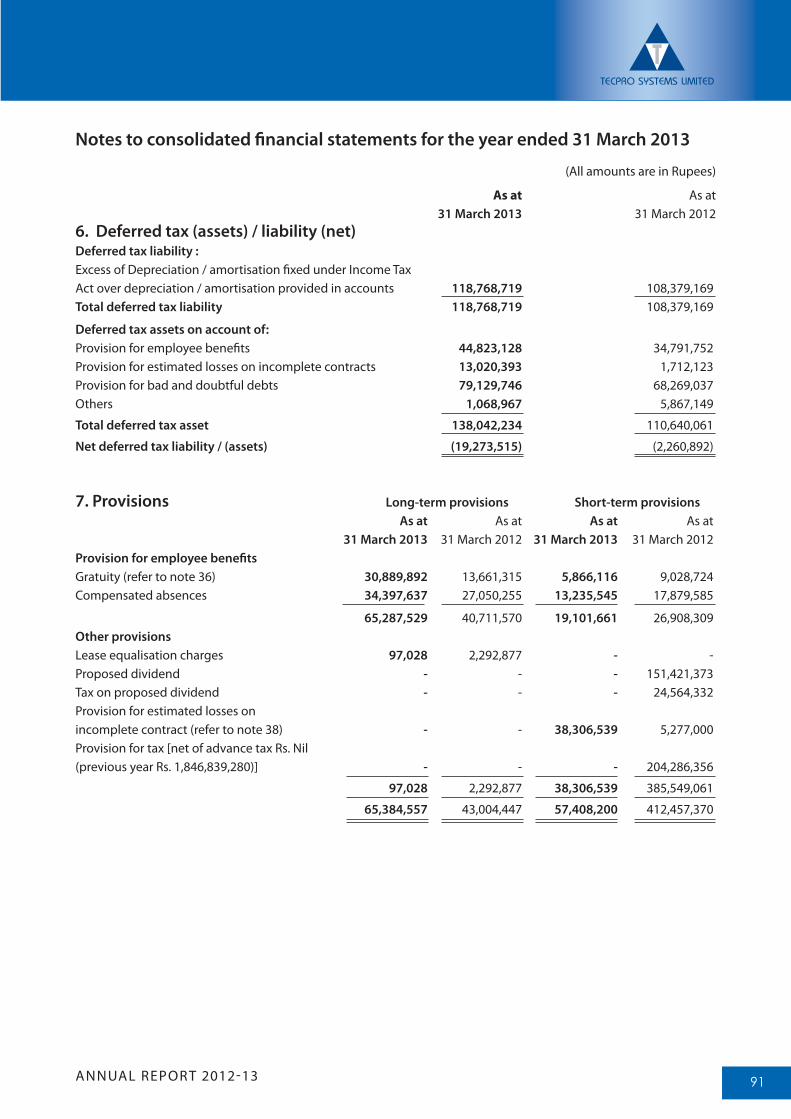
ANNUAL REPORT 2012-13 91
(All amounts are in Rupees)
As at As at 31 March 2013 31 March 20126. Deferred tax (assets) / liability (net)Deferred tax liability :Excess of Depreciation / amortisation fixed under Income Tax Act over depreciation / amortisation provided in accounts 118,768,719 108,379,169Total deferred tax liability 118,768,719 108,379,169
Deferred tax assets on account of:Provision for employee benefits 44,823,128 34,791,752 Provision for estimated losses on incomplete contracts 13,020,393 1,712,123 Provision for bad and doubtful debts 79,129,746 68,269,037 Others 1,068,967 5,867,149
Total deferred tax asset 138,042,234 110,640,061
Net deferred tax liability / (assets) (19,273,515) (2,260,892) 7. Provisions Long-term provisions Short-term provisions As at As at As at As at 31 March 2013 31 March 2012 31 March 2013 31 March 2012Provision for employee benefitsGratuity (refer to note 36) 30,889,892 13,661,315 5,866,116 9,028,724Compensated absences 34,397,637 27,050,255 13,235,545 17,879,585
65,287,529 40,711,570 19,101,661 26,908,309Other provisionsLease equalisation charges 97,028 2,292,877 - - Proposed dividend - - - 151,421,373Tax on proposed dividend - - - 24,564,332 Provision for estimated losses on incomplete contract (refer to note 38) - - 38,306,539 5,277,000 Provision for tax [net of advance tax Rs. Nil (previous year Rs. 1,846,839,280)] - - - 204,286,356
97,028 2,292,877 38,306,539 385,549,061
65,384,557 43,004,447 57,408,200 412,457,370
Notes to consolidated financial statements for the year ended 31 March 2013
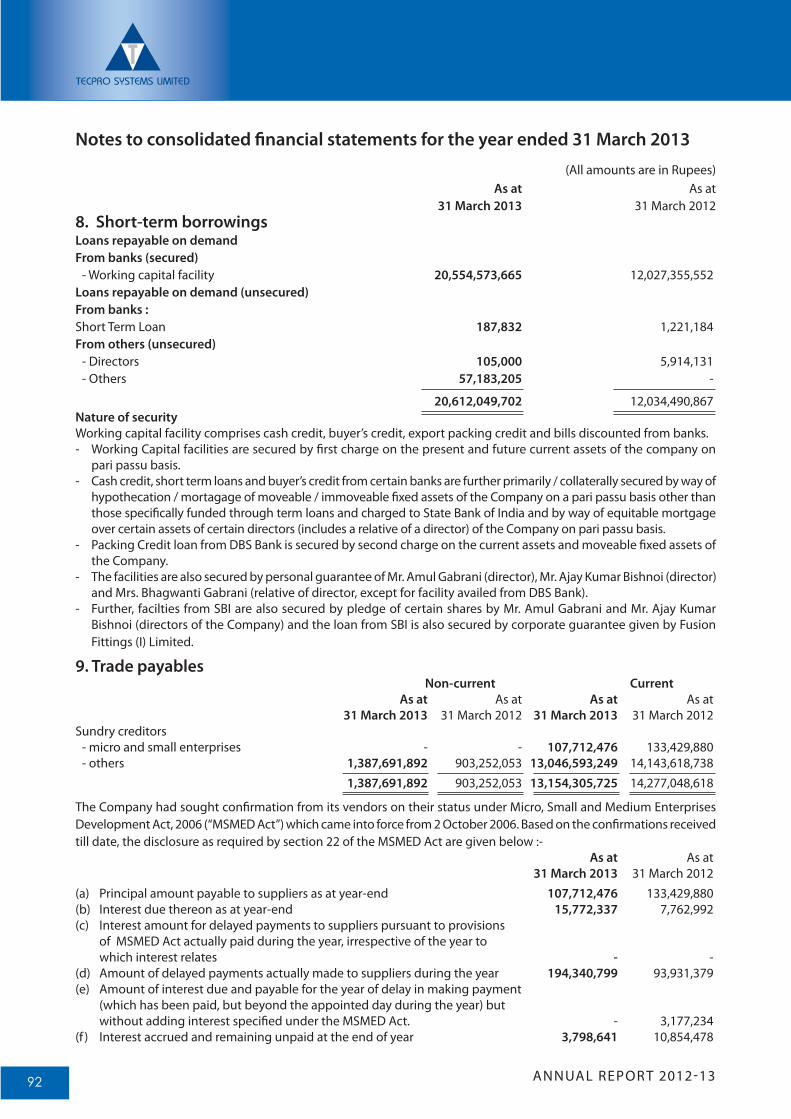
ANNUAL REPORT 2012-1392
(All amounts are in Rupees) As at As at 31 March 2013 31 March 20128. Short-term borrowingsLoans repayable on demand From banks (secured) - Working capital facility 20,554,573,665 12,027,355,552 Loans repayable on demand (unsecured)From banks :Short Term Loan 187,832 1,221,184From others (unsecured) - Directors 105,000 5,914,131 - Others 57,183,205 -
20,612,049,702 12,034,490,867 Nature of securityWorking capital facility comprises cash credit, buyer’s credit, export packing credit and bills discounted from banks. - Working Capital facilities are secured by first charge on the present and future current assets of the company on
pari passu basis. - Cash credit, short term loans and buyer’s credit from certain banks are further primarily / collaterally secured by way of
hypothecation / mortagage of moveable / immoveable fixed assets of the Company on a pari passu basis other than those specifically funded through term loans and charged to State Bank of India and by way of equitable mortgage over certain assets of certain directors (includes a relative of a director) of the Company on pari passu basis.
- Packing Credit loan from DBS Bank is secured by second charge on the current assets and moveable fixed assets of the Company.
- The facilities are also secured by personal guarantee of Mr. Amul Gabrani (director), Mr. Ajay Kumar Bishnoi (director) and Mrs. Bhagwanti Gabrani (relative of director, except for facility availed from DBS Bank).
- Further, facilties from SBI are also secured by pledge of certain shares by Mr. Amul Gabrani and Mr. Ajay Kumar Bishnoi (directors of the Company) and the loan from SBI is also secured by corporate guarantee given by Fusion Fittings (I) Limited.
9. Trade payables Non-current Current As at As at As at As at 31 March 2013 31 March 2012 31 March 2013 31 March 2012 Sundry creditors - micro and small enterprises - - 107,712,476 133,429,880 - others 1,387,691,892 903,252,053 13,046,593,249 14,143,618,738 1,387,691,892 903,252,053 13,154,305,725 14,277,048,618
The Company had sought confirmation from its vendors on their status under Micro, Small and Medium Enterprises Development Act, 2006 (“MSMED Act”) which came into force from 2 October 2006. Based on the confirmations received till date, the disclosure as required by section 22 of the MSMED Act are given below :- As at As at 31 March 2013 31 March 2012(a) Principal amount payable to suppliers as at year-end 107,712,476 133,429,880(b) Interest due thereon as at year-end 15,772,337 7,762,992 (c) Interest amount for delayed payments to suppliers pursuant to provisions of MSMED Act actually paid during the year, irrespective of the year to which interest relates - - (d) Amount of delayed payments actually made to suppliers during the year 194,340,799 93,931,379(e) Amount of interest due and payable for the year of delay in making payment (which has been paid, but beyond the appointed day during the year) but without adding interest specified under the MSMED Act. - 3,177,234(f ) Interest accrued and remaining unpaid at the end of year 3,798,641 10,854,478
Notes to consolidated financial statements for the year ended 31 March 2013
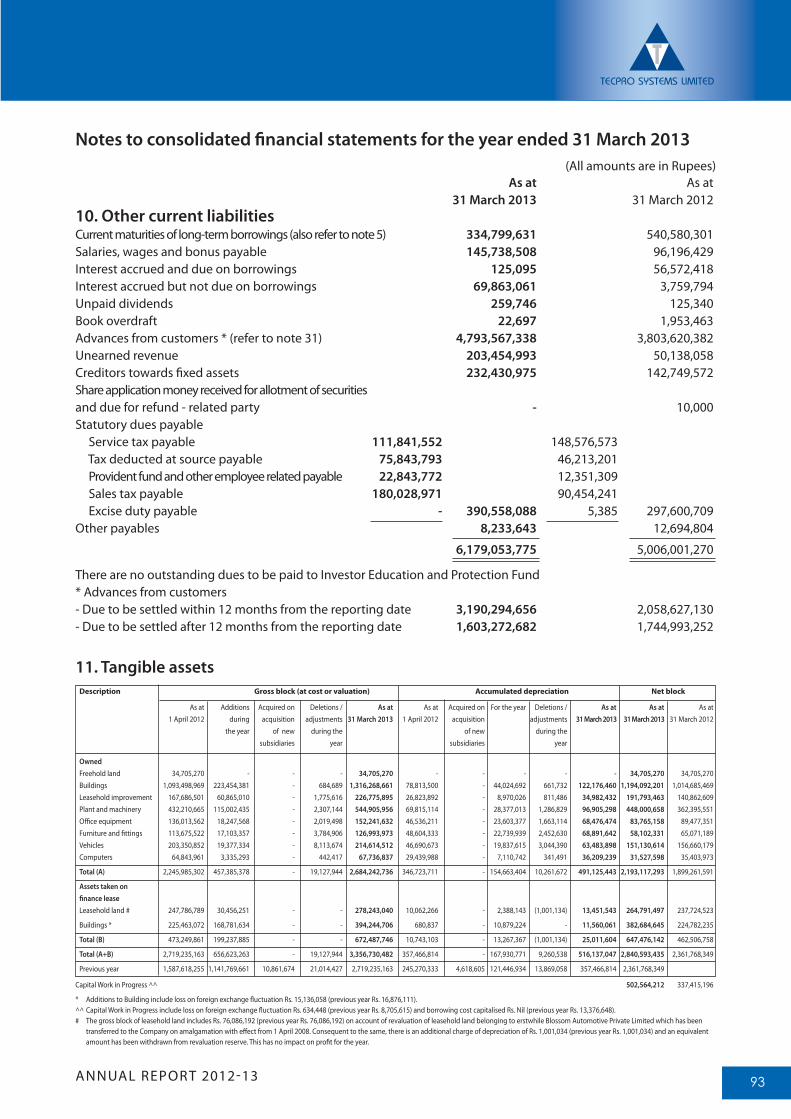
ANNUAL REPORT 2012-13 93
As at As at 31 March 2013 31 March 201210. Other current liabilitiesCurrent maturities of long-term borrowings (also refer to note 5) 334,799,631 540,580,301Salaries, wages and bonus payable 145,738,508 96,196,429Interest accrued and due on borrowings 125,095 56,572,418 Interest accrued but not due on borrowings 69,863,061 3,759,794Unpaid dividends 259,746 125,340Book overdraft 22,697 1,953,463 Advances from customers * (refer to note 31) 4,793,567,338 3,803,620,382Unearned revenue 203,454,993 50,138,058 Creditors towards fixed assets 232,430,975 142,749,572Share application money received for allotment of securities and due for refund - related party - 10,000Statutory dues payable Service tax payable 111,841,552 148,576,573 Tax deducted at source payable 75,843,793 46,213,201 Provident fund and other employee related payable 22,843,772 12,351,309 Sales tax payable 180,028,971 90,454,241 Excise duty payable - 390,558,088 5,385 297,600,709Other payables 8,233,643 12,694,804
6,179,053,775 5,006,001,270
There are no outstanding dues to be paid to Investor Education and Protection Fund* Advances from customers- Due to be settled within 12 months from the reporting date 3,190,294,656 2,058,627,130- Due to be settled after 12 months from the reporting date 1,603,272,682 1,744,993,252
11. Tangible assetsDescription Gross block (at cost or valuation) Accumulated depreciation Net block
As at Additions Acquired on Deletions / As at As at Acquired on For the year Deletions / As at As at As at 1 April 2012 during acquisition adjustments 31 March 2013 1 April 2012 acquisition adjustments 31 March 2013 31 March 2013 31 March 2012 the year of new during the of new during the subsidiaries year subsidiaries year
OwnedFreehold land 34,705,270 - - - 34,705,270 - - - - - 34,705,270 34,705,270 Buildings 1,093,498,969 223,454,381 - 684,689 1,316,268,661 78,813,500 - 44,024,692 661,732 122,176,460 1,194,092,201 1,014,685,469 Leasehold improvement 167,686,501 60,865,010 - 1,775,616 226,775,895 26,823,892 - 8,970,026 811,486 34,982,432 191,793,463 140,862,609Plant and machinery 432,210,665 115,002,435 - 2,307,144 544,905,956 69,815,114 - 28,377,013 1,286,829 96,905,298 448,000,658 362,395,551Office equipment 136,013,562 18,247,568 - 2,019,498 152,241,632 46,536,211 - 23,603,377 1,663,114 68,476,474 83,765,158 89,477,351Furniture and fittings 113,675,522 17,103,357 - 3,784,906 126,993,973 48,604,333 - 22,739,939 2,452,630 68,891,642 58,102,331 65,071,189 Vehicles 203,350,852 19,377,334 - 8,113,674 214,614,512 46,690,673 - 19,837,615 3,044,390 63,483,898 151,130,614 156,660,179Computers 64,843,961 3,335,293 - 442,417 67,736,837 29,439,988 - 7,110,742 341,491 36,209,239 31,527,598 35,403,973
Total (A) 2,245,985,302 457,385,378 - 19,127,944 2,684,242,736 346,723,711 - 154,663,404 10,261,672 491,125,443 2,193,117,293 1,899,261,591
Assets taken on finance leaseLeasehold land # 247,786,789 30,456,251 - - 278,243,040 10,062,266 - 2,388,143 (1,001,134) 13,451,543 264,791,497 237,724,523
Buildings * 225,463,072 168,781,634 - - 394,244,706 680,837 - 10,879,224 - 11,560,061 382,684,645 224,782,235
Total (B) 473,249,861 199,237,885 - - 672,487,746 10,743,103 - 13,267,367 (1,001,134) 25,011,604 647,476,142 462,506,758
Total (A+B) 2,719,235,163 656,623,263 - 19,127,944 3,356,730,482 357,466,814 - 167,930,771 9,260,538 516,137,047 2,840,593,435 2,361,768,349
Previous year 1,587,618,255 1,141,769,661 10,861,674 21,014,427 2,719,235,163 245,270,333 4,618,605 121,446,934 13,869,058 357,466,814 2,361,768,349
Capital Work in Progress ^^ 502,564,212 337,415,196
* Additions to Building include loss on foreign exchange fluctuation Rs. 15,136,058 (previous year Rs. 16,876,111). ^^ Capital Work in Progress include loss on foreign exchange fluctuation Rs. 634,448 (previous year Rs. 8,705,615) and borrowing cost capitalised Rs. Nil (previous year Rs. 13,376,648).# The gross block of leasehold land includes Rs. 76,086,192 (previous year Rs. 76,086,192) on account of revaluation of leasehold land belonging to erstwhile Blossom Automotive Private Limited which has been
transferred to the Company on amalgamation with effect from 1 April 2008. Consequent to the same, there is an additional charge of depreciation of Rs. 1,001,034 (previous year Rs. 1,001,034) and an equivalent amount has been withdrawn from revaluation reserve. This has no impact on profit for the year.
(All amounts are in Rupees)
Notes to consolidated financial statements for the year ended 31 March 2013
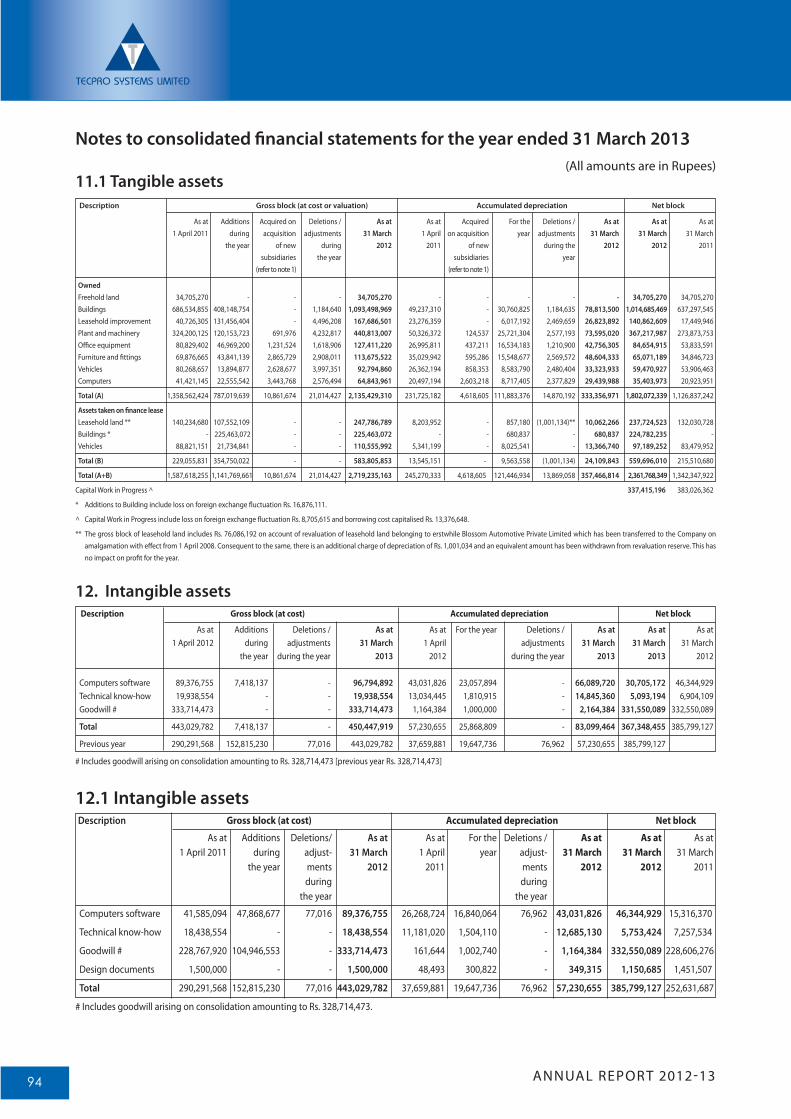
ANNUAL REPORT 2012-1394
(All amounts are in Rupees)
12. Intangible assetsDescription Gross block (at cost) Accumulated depreciation Net block
As at Additions Deletions / As at As at For the year Deletions / As at As at As at 1 April 2012 during adjustments 31 March 1 April adjustments 31 March 31 March 31 March the year during the year 2013 2012 during the year 2013 2013 2012
Computers software 89,376,755 7,418,137 - 96,794,892 43,031,826 23,057,894 - 66,089,720 30,705,172 46,344,929 Technical know-how 19,938,554 - - 19,938,554 13,034,445 1,810,915 - 14,845,360 5,093,194 6,904,109 Goodwill # 333,714,473 - - 333,714,473 1,164,384 1,000,000 - 2,164,384 331,550,089 332,550,089
Total 443,029,782 7,418,137 - 450,447,919 57,230,655 25,868,809 - 83,099,464 367,348,455 385,799,127
Previous year 290,291,568 152,815,230 77,016 443,029,782 37,659,881 19,647,736 76,962 57,230,655 385,799,127
# Includes goodwill arising on consolidation amounting to Rs. 328,714,473 [previous year Rs. 328,714,473]
11.1 Tangible assetsDescription Gross block (at cost or valuation) Accumulated depreciation Net block
As at Additions Acquired on Deletions / As at As at Acquired For the Deletions / As at As at As at 1 April 2011 during acquisition adjustments 31 March 1 April on acquisition year adjustments 31 March 31 March 31 March the year of new during 2012 2011 of new during the 2012 2012 2011 subsidiaries the year subsidiaries year (refer to note 1) (refer to note 1)
OwnedFreehold land 34,705,270 - - - 34,705,270 - - - - - 34,705,270 34,705,270Buildings 686,534,855 408,148,754 - 1,184,640 1,093,498,969 49,237,310 - 30,760,825 1,184,635 78,813,500 1,014,685,469 637,297,545Leasehold improvement 40,726,305 131,456,404 - 4,496,208 167,686,501 23,276,359 - 6,017,192 2,469,659 26,823,892 140,862,609 17,449,946Plant and machinery 324,200,125 120,153,723 691,976 4,232,817 440,813,007 50,326,372 124,537 25,721,304 2,577,193 73,595,020 367,217,987 273,873,753Office equipment 80,829,402 46,969,200 1,231,524 1,618,906 127,411,220 26,995,811 437,211 16,534,183 1,210,900 42,756,305 84,654,915 53,833,591 Furniture and fittings 69,876,665 43,841,139 2,865,729 2,908,011 113,675,522 35,029,942 595,286 15,548,677 2,569,572 48,604,333 65,071,189 34,846,723Vehicles 80,268,657 13,894,877 2,628,677 3,997,351 92,794,860 26,362,194 858,353 8,583,790 2,480,404 33,323,933 59,470,927 53,906,463Computers 41,421,145 22,555,542 3,443,768 2,576,494 64,843,961 20,497,194 2,603,218 8,717,405 2,377,829 29,439,988 35,403,973 20,923,951
Total (A) 1,358,562,424 787,019,639 10,861,674 21,014,427 2,135,429,310 231,725,182 4,618,605 111,883,376 14,870,192 333,356,971 1,802,072,339 1,126,837,242
Assets taken on finance leaseLeasehold land ** 140,234,680 107,552,109 - - 247,786,789 8,203,952 - 857,180 (1,001,134)** 10,062,266 237,724,523 132,030,728Buildings * - 225,463,072 - - 225,463,072 - - 680,837 - 680,837 224,782,235 - Vehicles 88,821,151 21,734,841 - - 110,555,992 5,341,199 - 8,025,541 - 13,366,740 97,189,252 83,479,952
Total (B) 229,055,831 354,750,022 - - 583,805,853 13,545,151 - 9,563,558 (1,001,134) 24,109,843 559,696,010 215,510,680
Total (A+B) 1,587,618,255 1,141,769,661 10,861,674 21,014,427 2,719,235,163 245,270,333 4,618,605 121,446,934 13,869,058 357,466,814 2,361,768,349 1,342,347,922
Capital Work in Progress ^ 337,415,196 383,026,362
* Additions to Building include loss on foreign exchange fluctuation Rs. 16,876,111.
^ Capital Work in Progress include loss on foreign exchange fluctuation Rs. 8,705,615 and borrowing cost capitalised Rs. 13,376,648.
** The gross block of leasehold land includes Rs. 76,086,192 on account of revaluation of leasehold land belonging to erstwhile Blossom Automotive Private Limited which has been transferred to the Company on amalgamation with effect from 1 April 2008. Consequent to the same, there is an additional charge of depreciation of Rs. 1,001,034 and an equivalent amount has been withdrawn from revaluation reserve. This has no impact on profit for the year.
12.1 Intangible assetsDescription Gross block (at cost) Accumulated depreciation Net block
As at Additions Deletions/ As at As at For the Deletions / As at As at As at 1 April 2011 during adjust- 31 March 1 April year adjust- 31 March 31 March 31 March the year ments 2012 2011 ments 2012 2012 2011 during during the year the year
Computers software 41,585,094 47,868,677 77,016 89,376,755 26,268,724 16,840,064 76,962 43,031,826 46,344,929 15,316,370
Technical know-how 18,438,554 - - 18,438,554 11,181,020 1,504,110 - 12,685,130 5,753,424 7,257,534
Goodwill # 228,767,920 104,946,553 - 333,714,473 161,644 1,002,740 - 1,164,384 332,550,089 228,606,276
Design documents 1,500,000 - - 1,500,000 48,493 300,822 - 349,315 1,150,685 1,451,507
Total 290,291,568 152,815,230 77,016 443,029,782 37,659,881 19,647,736 76,962 57,230,655 385,799,127 252,631,687
# Includes goodwill arising on consolidation amounting to Rs. 328,714,473.
Notes to consolidated financial statements for the year ended 31 March 2013
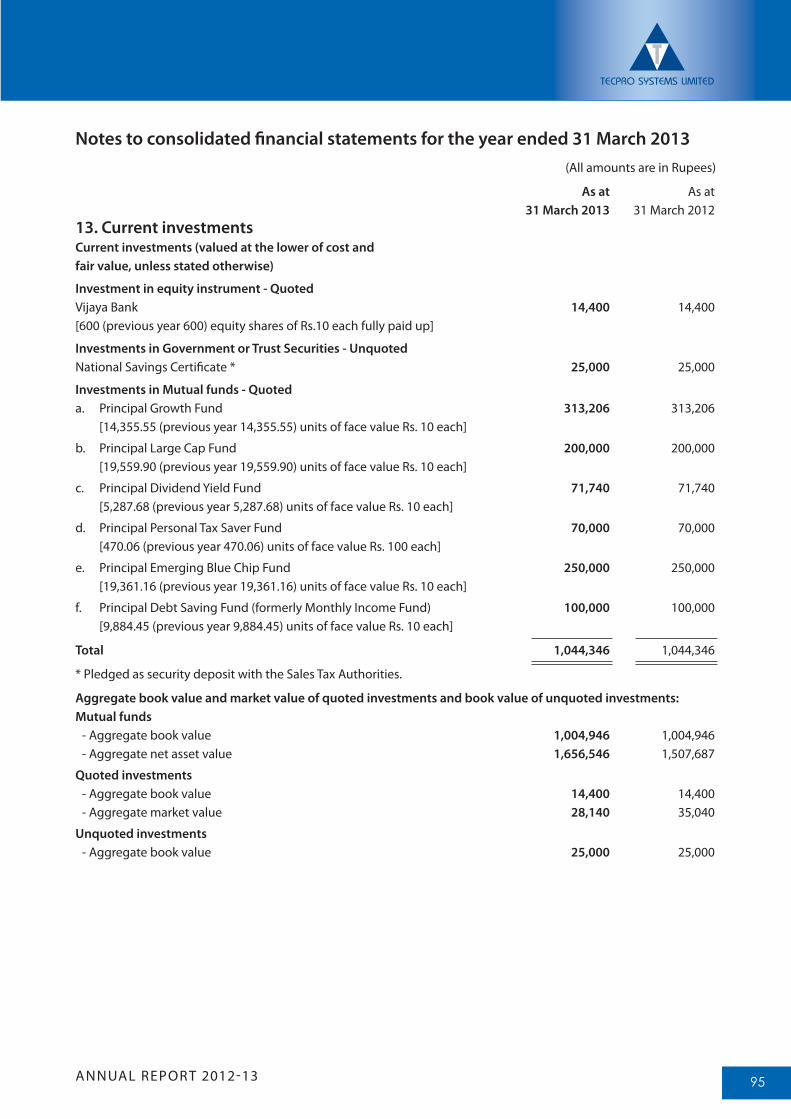
ANNUAL REPORT 2012-13 95
(All amounts are in Rupees)
As at As at 31 March 2013 31 March 201213. Current investmentsCurrent investments (valued at the lower of cost and fair value, unless stated otherwise)
Investment in equity instrument - QuotedVijaya Bank 14,400 14,400 [600 (previous year 600) equity shares of Rs.10 each fully paid up]
Investments in Government or Trust Securities - UnquotedNational Savings Certificate * 25,000 25,000
Investments in Mutual funds - Quoteda. Principal Growth Fund 313,206 313,206 [14,355.55 (previous year 14,355.55) units of face value Rs. 10 each]
b. Principal Large Cap Fund 200,000 200,000 [19,559.90 (previous year 19,559.90) units of face value Rs. 10 each]
c. Principal Dividend Yield Fund 71,740 71,740 [5,287.68 (previous year 5,287.68) units of face value Rs. 10 each]
d. Principal Personal Tax Saver Fund 70,000 70,000 [470.06 (previous year 470.06) units of face value Rs. 100 each]
e. Principal Emerging Blue Chip Fund 250,000 250,000 [19,361.16 (previous year 19,361.16) units of face value Rs. 10 each]
f. Principal Debt Saving Fund (formerly Monthly Income Fund) 100,000 100,000 [9,884.45 (previous year 9,884.45) units of face value Rs. 10 each]
Total 1,044,346 1,044,346
* Pledged as security deposit with the Sales Tax Authorities.
Aggregate book value and market value of quoted investments and book value of unquoted investments:Mutual funds - Aggregate book value 1,004,946 1,004,946 - Aggregate net asset value 1,656,546 1,507,687
Quoted investments - Aggregate book value 14,400 14,400 - Aggregate market value 28,140 35,040
Unquoted investments - Aggregate book value 25,000 25,000
Notes to consolidated financial statements for the year ended 31 March 2013
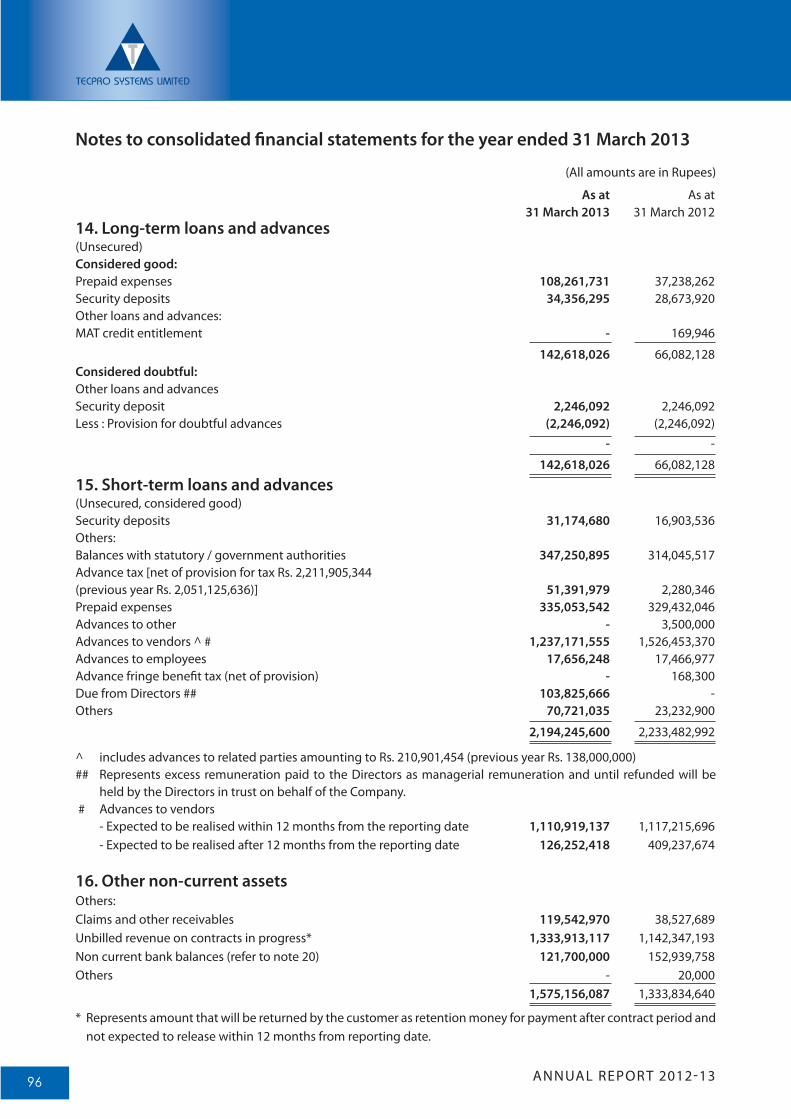
ANNUAL REPORT 2012-1396
(All amounts are in Rupees)
As at As at 31 March 2013 31 March 201214. Long-term loans and advances(Unsecured)Considered good:Prepaid expenses 108,261,731 37,238,262 Security deposits 34,356,295 28,673,920 Other loans and advances:MAT credit entitlement - 169,946
142,618,026 66,082,128 Considered doubtful:Other loans and advancesSecurity deposit 2,246,092 2,246,092 Less : Provision for doubtful advances (2,246,092) (2,246,092) - -
142,618,026 66,082,128
15. Short-term loans and advances(Unsecured, considered good)Security deposits 31,174,680 16,903,536Others:Balances with statutory / government authorities 347,250,895 314,045,517 Advance tax [net of provision for tax Rs. 2,211,905,344 (previous year Rs. 2,051,125,636)] 51,391,979 2,280,346 Prepaid expenses 335,053,542 329,432,046 Advances to other - 3,500,000 Advances to vendors ^ # 1,237,171,555 1,526,453,370 Advances to employees 17,656,248 17,466,977Advance fringe benefit tax (net of provision) - 168,300 Due from Directors ## 103,825,666 - Others 70,721,035 23,232,900
2,194,245,600 2,233,482,992
^ includes advances to related parties amounting to Rs. 210,901,454 (previous year Rs. 138,000,000)## Represents excess remuneration paid to the Directors as managerial remuneration and until refunded will be
held by the Directors in trust on behalf of the Company. # Advances to vendors - Expected to be realised within 12 months from the reporting date 1,110,919,137 1,117,215,696 - Expected to be realised after 12 months from the reporting date 126,252,418 409,237,674
16. Other non-current assetsOthers:Claims and other receivables 119,542,970 38,527,689Unbilled revenue on contracts in progress* 1,333,913,117 1,142,347,193Non current bank balances (refer to note 20) 121,700,000 152,939,758 Others - 20,000 1,575,156,087 1,333,834,640
* Represents amount that will be returned by the customer as retention money for payment after contract period and not expected to release within 12 months from reporting date.
Notes to consolidated financial statements for the year ended 31 March 2013
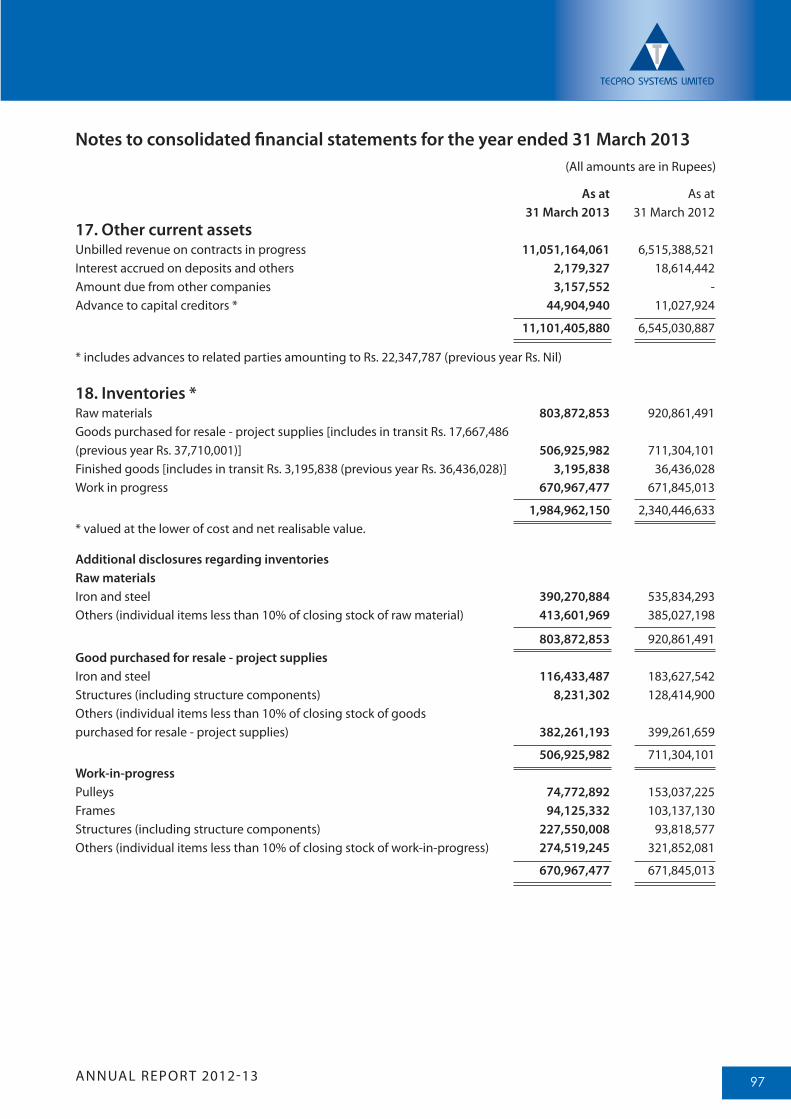
ANNUAL REPORT 2012-13 97
As at As at 31 March 2013 31 March 2012 17. Other current assetsUnbilled revenue on contracts in progress 11,051,164,061 6,515,388,521 Interest accrued on deposits and others 2,179,327 18,614,442Amount due from other companies 3,157,552 - Advance to capital creditors * 44,904,940 11,027,924
11,101,405,880 6,545,030,887
* includes advances to related parties amounting to Rs. 22,347,787 (previous year Rs. Nil)
18. Inventories *Raw materials 803,872,853 920,861,491Goods purchased for resale - project supplies [includes in transit Rs. 17,667,486 (previous year Rs. 37,710,001)] 506,925,982 711,304,101Finished goods [includes in transit Rs. 3,195,838 (previous year Rs. 36,436,028)] 3,195,838 36,436,028Work in progress 670,967,477 671,845,013
1,984,962,150 2,340,446,633 * valued at the lower of cost and net realisable value.
Additional disclosures regarding inventoriesRaw materialsIron and steel 390,270,884 535,834,293 Others (individual items less than 10% of closing stock of raw material) 413,601,969 385,027,198
803,872,853 920,861,491 Good purchased for resale - project suppliesIron and steel 116,433,487 183,627,542Structures (including structure components) 8,231,302 128,414,900Others (individual items less than 10% of closing stock of goods purchased for resale - project supplies) 382,261,193 399,261,659
506,925,982 711,304,101Work-in-progressPulleys 74,772,892 153,037,225 Frames 94,125,332 103,137,130Structures (including structure components) 227,550,008 93,818,577Others (individual items less than 10% of closing stock of work-in-progress) 274,519,245 321,852,081
670,967,477 671,845,013
Notes to consolidated financial statements for the year ended 31 March 2013 (All amounts are in Rupees)
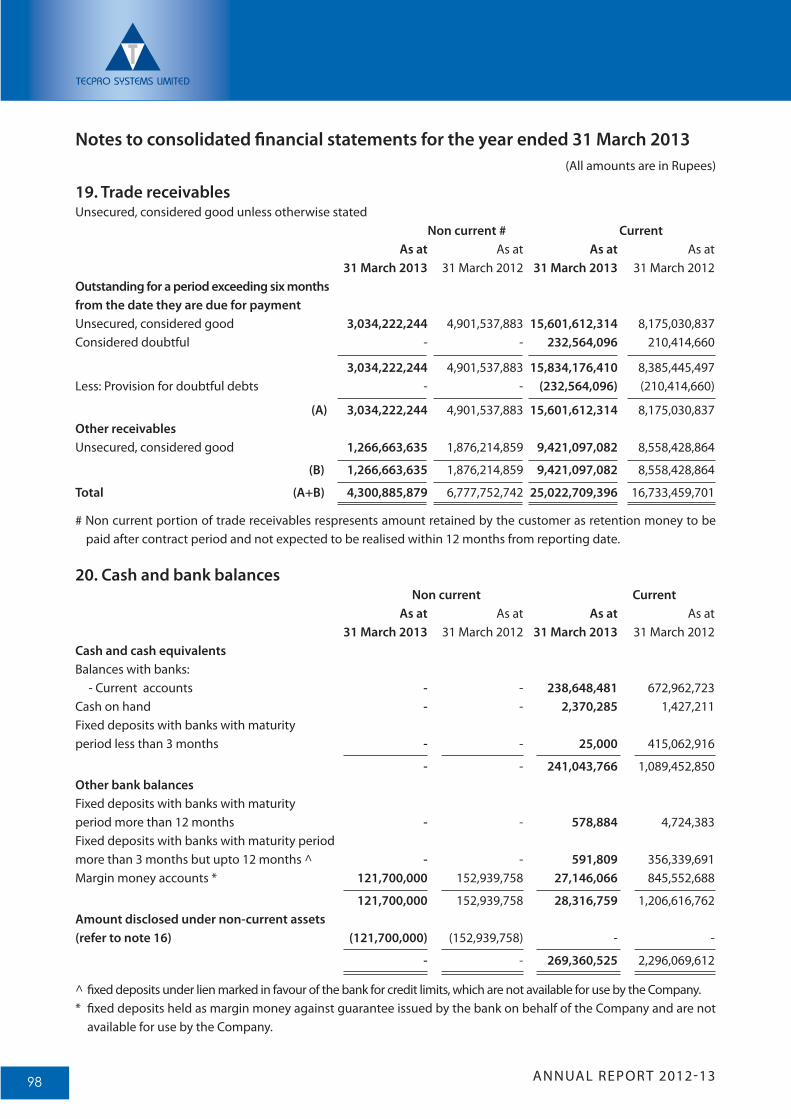
ANNUAL REPORT 2012-1398
19. Trade receivablesUnsecured, considered good unless otherwise stated Non current # Current As at As at As at As at 31 March 2013 31 March 2012 31 March 2013 31 March 2012 Outstanding for a period exceeding six months from the date they are due for paymentUnsecured, considered good 3,034,222,244 4,901,537,883 15,601,612,314 8,175,030,837 Considered doubtful - - 232,564,096 210,414,660
3,034,222,244 4,901,537,883 15,834,176,410 8,385,445,497 Less: Provision for doubtful debts - - (232,564,096) (210,414,660)
(A) 3,034,222,244 4,901,537,883 15,601,612,314 8,175,030,837 Other receivablesUnsecured, considered good 1,266,663,635 1,876,214,859 9,421,097,082 8,558,428,864
(B) 1,266,663,635 1,876,214,859 9,421,097,082 8,558,428,864
Total (A+B) 4,300,885,879 6,777,752,742 25,022,709,396 16,733,459,701
# Non current portion of trade receivables respresents amount retained by the customer as retention money to be paid after contract period and not expected to be realised within 12 months from reporting date.
20. Cash and bank balances Non current Current As at As at As at As at 31 March 2013 31 March 2012 31 March 2013 31 March 2012 Cash and cash equivalentsBalances with banks: - Current accounts - - 238,648,481 672,962,723 Cash on hand - - 2,370,285 1,427,211 Fixed deposits with banks with maturity period less than 3 months - - 25,000 415,062,916
- - 241,043,766 1,089,452,850 Other bank balancesFixed deposits with banks with maturity period more than 12 months - - 578,884 4,724,383 Fixed deposits with banks with maturity period more than 3 months but upto 12 months ^ - - 591,809 356,339,691Margin money accounts * 121,700,000 152,939,758 27,146,066 845,552,688
121,700,000 152,939,758 28,316,759 1,206,616,762 Amount disclosed under non-current assets (refer to note 16) (121,700,000) (152,939,758) - -
- - 269,360,525 2,296,069,612
^ fixed deposits under lien marked in favour of the bank for credit limits, which are not available for use by the Company.* fixed deposits held as margin money against guarantee issued by the bank on behalf of the Company and are not
available for use by the Company.
(All amounts are in Rupees)
Notes to consolidated financial statements for the year ended 31 March 2013
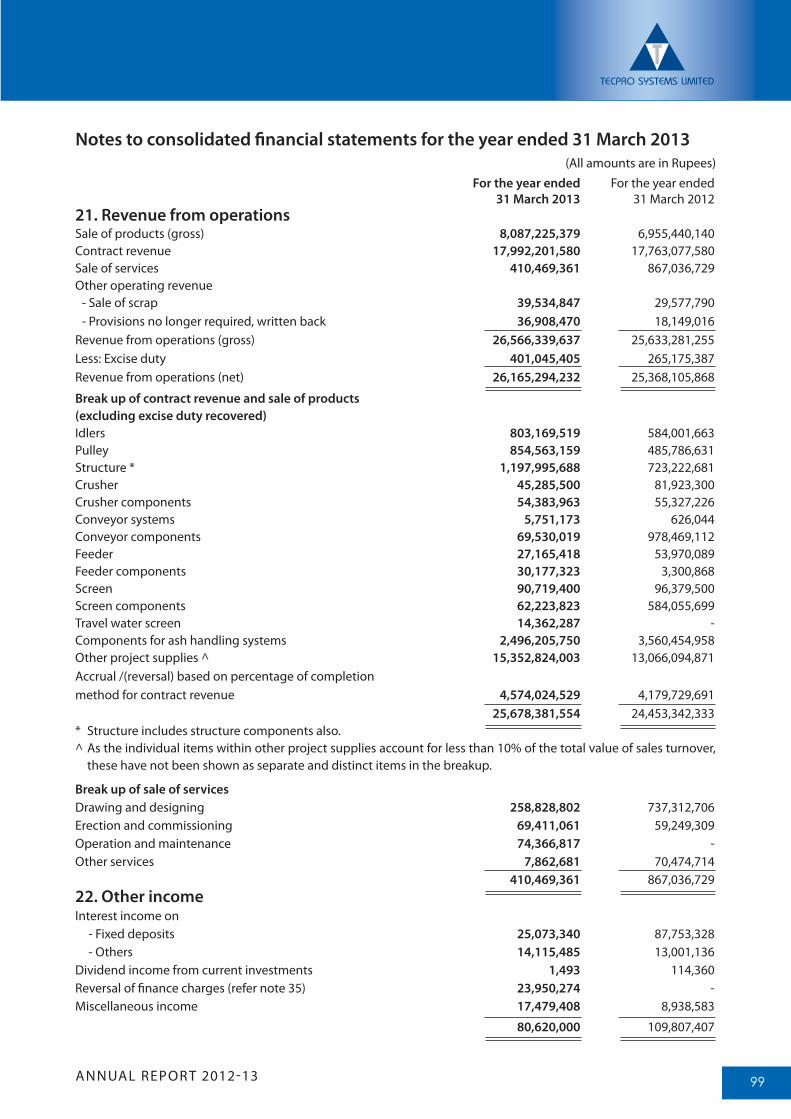
ANNUAL REPORT 2012-13 99
For the year ended For the year ended 31 March 2013 31 March 201221. Revenue from operations Sale of products (gross) 8,087,225,379 6,955,440,140 Contract revenue 17,992,201,580 17,763,077,580 Sale of services 410,469,361 867,036,729 Other operating revenue - Sale of scrap 39,534,847 29,577,790 - Provisions no longer required, written back 36,908,470 18,149,016 Revenue from operations (gross) 26,566,339,637 25,633,281,255 Less: Excise duty 401,045,405 265,175,387 Revenue from operations (net) 26,165,294,232 25,368,105,868
Break up of contract revenue and sale of products (excluding excise duty recovered)Idlers 803,169,519 584,001,663 Pulley 854,563,159 485,786,631Structure * 1,197,995,688 723,222,681 Crusher 45,285,500 81,923,300Crusher components 54,383,963 55,327,226Conveyor systems 5,751,173 626,044 Conveyor components 69,530,019 978,469,112Feeder 27,165,418 53,970,089 Feeder components 30,177,323 3,300,868 Screen 90,719,400 96,379,500 Screen components 62,223,823 584,055,699 Travel water screen 14,362,287 -Components for ash handling systems 2,496,205,750 3,560,454,958Other project supplies ^ 15,352,824,003 13,066,094,871 Accrual /(reversal) based on percentage of completion method for contract revenue 4,574,024,529 4,179,729,691 25,678,381,554 24,453,342,333* Structure includes structure components also.^ As the individual items within other project supplies account for less than 10% of the total value of sales turnover,
these have not been shown as separate and distinct items in the breakup.
Break up of sale of servicesDrawing and designing 258,828,802 737,312,706 Erection and commissioning 69,411,061 59,249,309 Operation and maintenance 74,366,817 - Other services 7,862,681 70,474,714 410,469,361 867,036,729 22. Other incomeInterest income on - Fixed deposits 25,073,340 87,753,328 - Others 14,115,485 13,001,136 Dividend income from current investments 1,493 114,360Reversal of finance charges (refer note 35) 23,950,274 - Miscellaneous income 17,479,408 8,938,583
80,620,000 109,807,407
(All amounts are in Rupees)
Notes to consolidated financial statements for the year ended 31 March 2013
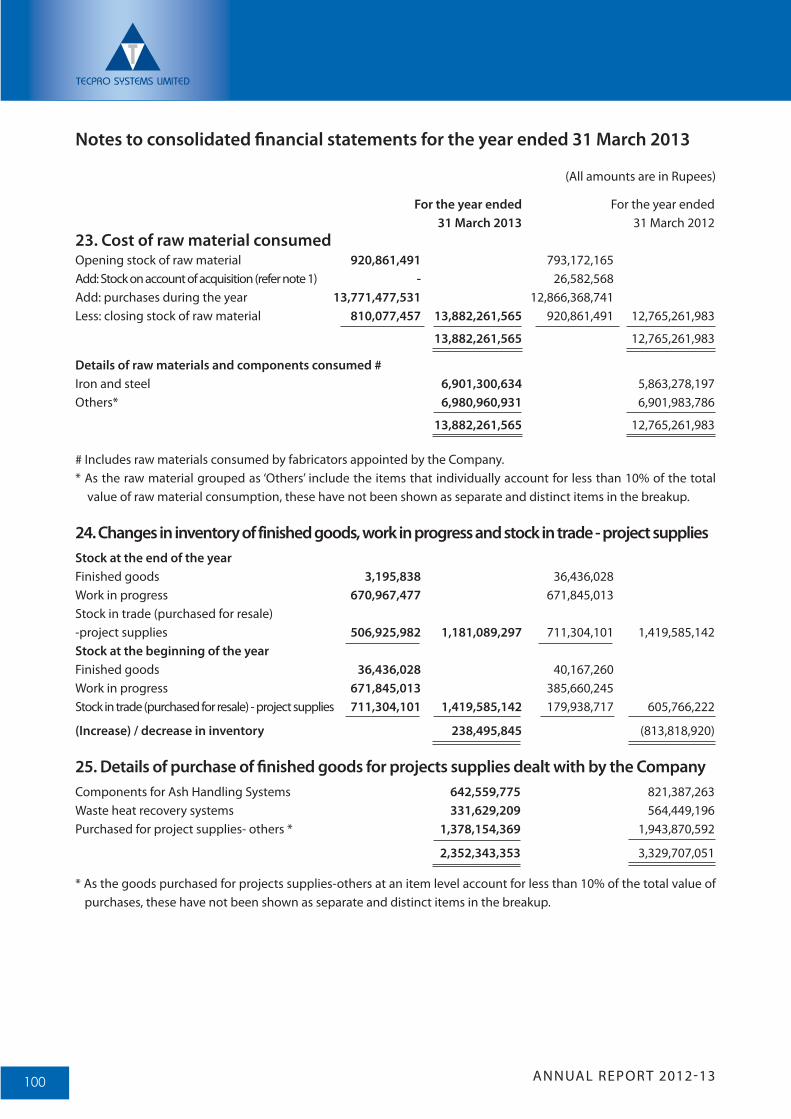
ANNUAL REPORT 2012-13100
(All amounts are in Rupees)
For the year ended For the year ended 31 March 2013 31 March 2012 23. Cost of raw material consumedOpening stock of raw material 920,861,491 793,172,165Add: Stock on account of acquisition (refer note 1) - 26,582,568 Add: purchases during the year 13,771,477,531 12,866,368,741 Less: closing stock of raw material 810,077,457 13,882,261,565 920,861,491 12,765,261,983
13,882,261,565 12,765,261,983
Details of raw materials and components consumed # Iron and steel 6,901,300,634 5,863,278,197 Others* 6,980,960,931 6,901,983,786
13,882,261,565 12,765,261,983
# Includes raw materials consumed by fabricators appointed by the Company.* As the raw material grouped as ‘Others’ include the items that individually account for less than 10% of the total
value of raw material consumption, these have not been shown as separate and distinct items in the breakup.
24. Changes in inventory of finished goods, work in progress and stock in trade - project suppliesStock at the end of the yearFinished goods 3,195,838 36,436,028 Work in progress 670,967,477 671,845,013Stock in trade (purchased for resale) -project supplies 506,925,982 1,181,089,297 711,304,101 1,419,585,142Stock at the beginning of the yearFinished goods 36,436,028 40,167,260Work in progress 671,845,013 385,660,245 Stock in trade (purchased for resale) - project supplies 711,304,101 1,419,585,142 179,938,717 605,766,222
(Increase) / decrease in inventory 238,495,845 (813,818,920)
25. Details of purchase of finished goods for projects supplies dealt with by the CompanyComponents for Ash Handling Systems 642,559,775 821,387,263 Waste heat recovery systems 331,629,209 564,449,196Purchased for project supplies- others * 1,378,154,369 1,943,870,592
2,352,343,353 3,329,707,051
* As the goods purchased for projects supplies-others at an item level account for less than 10% of the total value of purchases, these have not been shown as separate and distinct items in the breakup.
Notes to consolidated financial statements for the year ended 31 March 2013
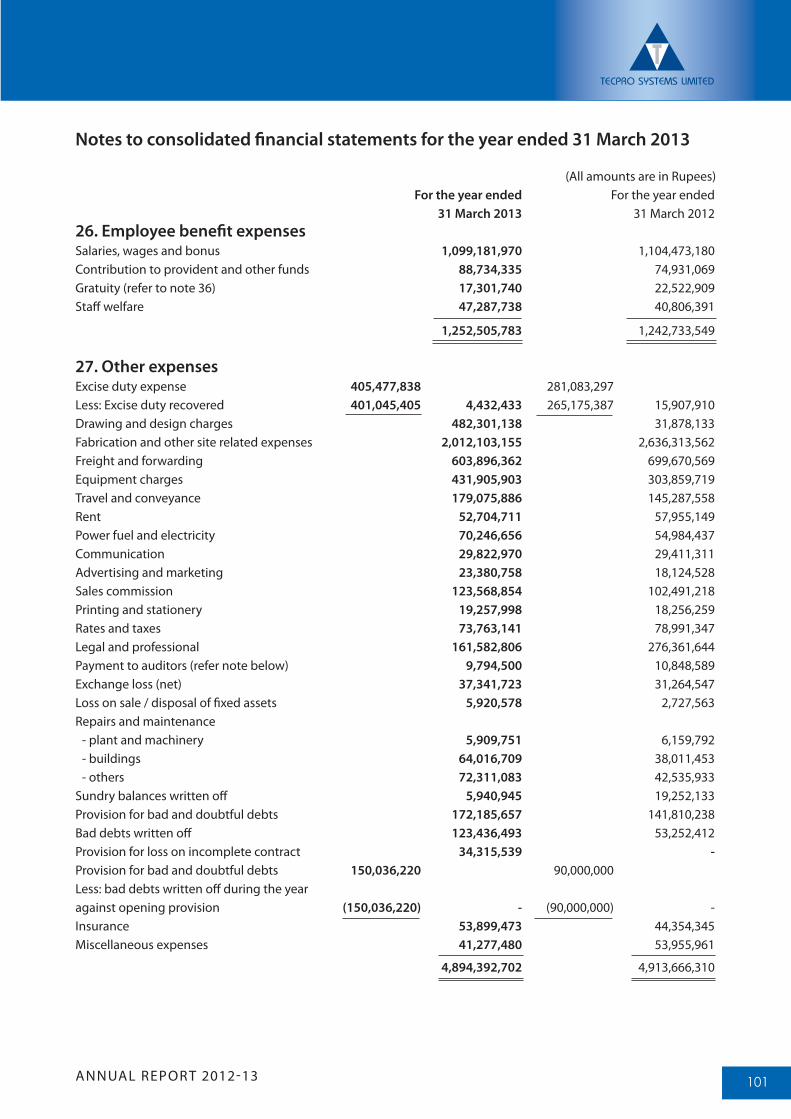
ANNUAL REPORT 2012-13 101
(All amounts are in Rupees) For the year ended For the year ended 31 March 2013 31 March 2012 26. Employee benefit expensesSalaries, wages and bonus 1,099,181,970 1,104,473,180 Contribution to provident and other funds 88,734,335 74,931,069 Gratuity (refer to note 36) 17,301,740 22,522,909 Staff welfare 47,287,738 40,806,391
1,252,505,783 1,242,733,549
27. Other expensesExcise duty expense 405,477,838 281,083,297 Less: Excise duty recovered 401,045,405 4,432,433 265,175,387 15,907,910Drawing and design charges 482,301,138 31,878,133Fabrication and other site related expenses 2,012,103,155 2,636,313,562 Freight and forwarding 603,896,362 699,670,569 Equipment charges 431,905,903 303,859,719 Travel and conveyance 179,075,886 145,287,558 Rent 52,704,711 57,955,149 Power fuel and electricity 70,246,656 54,984,437 Communication 29,822,970 29,411,311Advertising and marketing 23,380,758 18,124,528Sales commission 123,568,854 102,491,218Printing and stationery 19,257,998 18,256,259 Rates and taxes 73,763,141 78,991,347Legal and professional 161,582,806 276,361,644 Payment to auditors (refer note below) 9,794,500 10,848,589Exchange loss (net) 37,341,723 31,264,547Loss on sale / disposal of fixed assets 5,920,578 2,727,563 Repairs and maintenance - plant and machinery 5,909,751 6,159,792 - buildings 64,016,709 38,011,453 - others 72,311,083 42,535,933 Sundry balances written off 5,940,945 19,252,133 Provision for bad and doubtful debts 172,185,657 141,810,238 Bad debts written off 123,436,493 53,252,412 Provision for loss on incomplete contract 34,315,539 -Provision for bad and doubtful debts 150,036,220 90,000,000Less: bad debts written off during the year against opening provision (150,036,220) - (90,000,000) -Insurance 53,899,473 44,354,345Miscellaneous expenses 41,277,480 53,955,961
4,894,392,702 4,913,666,310
Notes to consolidated financial statements for the year ended 31 March 2013
ANNUAL REPORT 2012-13102
Disclosures regarding payment to auditors (excluding service tax)Statutory audit fee 8,989,542 9,009,544 Tax audit fee * 730,000 730,000Other matters 40,000 697,540 Out of pocket expenses 354,500 411,505
10,114,042 10,848,589* Represents amount payable to other than Statutory auditor.
28. Finance costsInterest expense on: - long term loan 131,092,721 97,188,470 - short term loan 2,194,310,579 488,888,080 - others 187,701,829 1,036,140,309Bank charges 506,561,660 325,835,254 Exchange difference to the extent considered as an adjustment to borrowing costs (refer to note 35) - 23,950,274
3,019,666,789 1,972,002,387
29. The gross block of leasehold land includes Rs. 76,086,192 (previous year Rs. 76,086,192) on account of revaluation of leasehold land belonging to erstwhile Blossom Automotive Private Limited which has been transferred to the Company on amalgamation with effect from 1 April 2008. Consequent to the same, there is an additional charge of depreciation of Rs. 1,001,034 (previous year Rs.1,001,034) and an equivalent amount has been withdrawn from revaluation reserve. This has no impact on profit for the year.
30. Contingent liabilities and commitments (to the extent not provided for) As at As at 31 March 2013 31 March 2012
(i) Claims against the company not acknowledged as debt: Sales tax matters 242,844,937 81,602,639 (ii) Claims against the company not acknowledged as debt: Entry tax matters 48,556,771 20,408,275(iii) Claims against the company not acknowledged as debt: Central excise matters 1,049,990 - (iv) Claims against the company not acknowledged as debt: Service tax matters 6,536,536 6,536,536(v) Demand for additional price/ enhancement cost in respect of factory plots situated in Bawal * 9,885,115 9,207,821(vi) Sales tax liability against which forms to be collected 3,227,603,543 2,102,176,396
*The factory plots belonging to the Company, situated at Bawal were allotted by the Haryana State Industrial and Infrastructure Development Corporation Limited (HSIIDCL) in favour of the Company through Regular Letters of Allotment (RLA) dated 23 January 2004 and 9 July 2004.
The Company had received notices dated 4 December 2007 and 29 December 2007 from HSIIDCL for additional price/ enhancement cost amounting to Rs. 9,885,115 {including interest} (previous year Rs. 9,207,821 {including interest}), in respect of factory plots situated in Bawal. The Company filed a writ petition in the Punjab and Haryana High Court on 8 January 2008 and obtained a stay order on 9 January 2008. This matter is under adjudication. Pursuant to above, Rs. 9,885,115 (previous year Rs. 9,207,821) have been disclosed as ‘Contingent liability’ in the notes to the accounts.
(All amounts are in Rupees)
For the year ended For the year ended 31 March 2013 31 March 2012
Notes to consolidated financial statements for the year ended 31 March 2013
ANNUAL REPORT 2012-13 103
(All amounts are in Rupees)
31. In the previous year, the operating cycle was determined to be 12 months in view of the varying nature of contracts, customers, payment terms, project duration etc. Basis further analysis and considering additional guidance / clarity available related to implementation of revised schedule VI, the management is of the view that the Company has multiple operating cycles which are determined on the basis of the distinguishing features and characteristics of various categories of contracts.
Due to change in operating cycle during the current year, figures for the previous year have been regrouped for meaningful comparison of current and previous year classification. The impact of regrouping on significant financial statement items is summarized below:
Grouping per audited financial statements Regrouping of previous year numbers in the for the year ended 31 March 2012 current year due to change in operating cycle
Advance from customer Advance from customer
- Other long term liabilities 1,744,993,252 - Other long term liabilities - - Other current liabilities 2,056,098,803 - Other current liabilities 3,801,092,055Total advance from customer 3,801,092,055 Total advance from customer 3,801,092,055 Advance to vendors Advance to vendors - Long term loans and advances 404,152,929 - Long term loans and advances - - Short term loans and advances 1,105,400,261 - Short term loans and advances 1,509,553,190 Total advance to vendors 1,509,553,190 Total advance to vendors 1,509,553,190
32. On March 6, 2012, search proceedings under Section 132 of the Income Tax Act, 1961 (“the Act”) were undertaken in respect of the Company. The search proceedings were effectively concluded vide last Panchnama drawn on May 03, 2012. During the year the Company has furnished the return of income of six assessment years beginning from assessment year 2006-2007 pursuant to notices received from the Income Tax Department. At this stage, no tax demand has been determined pursuant to the present search proceedings.
33. Disclosures pursuant to Accounting Standard (AS) 7 “Construction Contracts” (Revised) are given below:- As at As at 31 March 2013 31 March 2012
Contract revenue recognised for the year 17,992,201,580 17,763,077,580Aggregate amount of contract costs incurred and recognised profits (less recognised losses) upto the Balance sheet date for all contracts in progress as at that date. 54,875,021,400 36,882,819,819Amount of customer advances outstanding for contracts in progress as at Balance sheet date 3,688,408,317 3,132,181,987Retention amounts due from customers for contracts in progress 5,609,019,913 3,769,966,376Gross amount due from customers for contract work 12,385,077,178 8,101,193,351Gross amount due to customers for contract work 203,454,993 506,189,376
34. Earnings per equity share (EPS) For the year ended For the year ended 31 March 2013 31 March 2012
Net profit after tax as per Statement of Profit and Loss 268,681,531 1,231,128,871Number of equity shares of Rs.10 each at the beginning of the year 50,473,791 50,473,791 Weighted average number of equity shares issued during the year - - Weighted average number of equity shares of Rs. 10 each outstanding during the year 50,473,791 50,473,791 Weighted average number of equity shares of Rs.10 each at the end of the year for calculation of basic and diluted EPS 50,473,791 50,473,791Basic and diluted earnings per share (in Rs.) (Per share of Rs. 10 each) 5.32 24.39
Notes to consolidated financial statements for the year ended 31 March 2013
ANNUAL REPORT 2012-13104
35. Till the previous year, the exchange differences arising from foreign currency borrowings to the extent that they are regarded as an adjustment to interest cost, were treated as borrowing cost in terms of the AS – 16, “Borrowing Costs”. Pursuant to a clarification dated 9 August 2012 from the MCA, the Company has changed the accounting policy, w.e.f. from 1 April 2011, to treat the same as “foreign exchange fluctuation” accounted as per AS – 11 “Effect of Changes in Foreign Exchange Rates” instead of the “borrowing costs”. This has resulted into reversal of finance costs of Rs. 23,950,274 for the year ended 31 March 2012 and higher depreciation by Rs. 312,292 for the year ended 31 March 2012. The aforesaid reversal of finance cost of Rs. 23,950,274 has been included in ‘Other income’ in the current year financial statements.
36. Disclosure in respect of employee benefits under Accounting Standard (AS) – 15 (Revised) “Employee Benefits” prescribed by the Companies (Accounting Standards) Rules, 2006.
(a) Defined Contribution Plans: Amount of Rs. 88,734,335 (previous year Rs. 74,931,069) pertaining to employers’ contribution to Provident Fund, Employees State Insurance Fund and Superannuation Fund is recognised as an expense and included in “Employee benefit expenses” in note 26.
(b) Defined benefit plan: The disclosures for gratuity cost is given below:
(i) The changes in the present value of obligation representing reconciliation of opening and closing balances thereof are as follows:
Particulars As at As at 31 March 2013 31 March 2012
Present value of obligation at the beginning of the year 60,015,684 36,489,893 Add: Present value of obligation at the beginning of year added on account of amalgamation 120,956 - Interest cost 4,787,176 2,895,781 Past service cost - (1,696,868) Current service cost 15,565,872 13,429,431 Benefits paid (2,329,089) (1,478,089) Actuarial (gain)/loss on obligation 110,300 10,375,536 Present value of obligation at the end of the year 78,270,899 60,015,684
(ii) The changes in the fair value of plan assets representing reconciliation of opening and closing balances thereof are as follows:
Particulars As at As at 31 March 2013 31 March 2012
Fair value of plan assets at the beginning of the year 37,325,645 26,753,748 Expected return on plan assets 3,165,294 2,460,508 Contributions 1,016,732 8,676,176 Benefits paid (110,050) (585,250) Actuarial gain/(loss) on plan assets (3,686) 20,463 Fair value of plan assets at the end of the year 41,393,935 37,325,645
(iii) Actuarial gain/ loss recognised are as follows:
Particulars For the year ended For the year ended 31 March 2013 31 March 2012
Actuarial loss for the year - obligation (110,300) (10,375,536) Actuarial gain for the year - plan assets (3,686) 20,463 Total loss for the year (113,986) (10,355,073) Actuarial loss recognised in the year (113,986) (10,355,073) Unrecognized actuarial gains/(losses) at the end of year - -
(All amounts are in Rupees)
Notes to consolidated financial statements for the year ended 31 March 2013
ANNUAL REPORT 2012-13 105
(iv) The amounts recognised in Balance Sheet are as follows:
Particulars As at As at 31 March 2013 31 March 2012
Present value of obligation as at the end of the year 78,270,899 60,015,684 Fair value of plan assets as at the end of the year 41,393,935 37,325,645 Funded/(unfunded) status (36,876,964) (22,690,039) Excess of actual over estimated (3,686) 20,463 Net assets/(liability) recognized in balance sheet (36,876,964) (22,690,039)
(v) The amounts recognised in the statement of profit and loss are as follows:
Particulars For the year ended For the year ended 31 March 2013 31 March 2012
Current service cost 15,565,872 13,429,431 Past service cost - (1,696,868) Interest cost 4,787,176 2,895,781 Expected return on plan assets (3,165,294) (2,460,508) Net actuarial (gain)/loss recognized in the year 113,986 10,355,073 Expenses recognised in the statement of profit and losses 17,301,740 22,522,909
(vi) Principal actuarial assumptions at the balance sheet date are as follows:A. Economic assumptions The principal assumptions are the discount rate and salary growth rate. The discount rate is generally
based upon the market yield available on the Government bonds at the accounting date with a term that matches that of the liabilities and the salary growth rate takes account of inflation, seniority, promotion and other relevant factors on long term basis.
Particulars For the year ended For the year ended 31 March 2013 31 March 2012
Discount rate 8.00% 8.00% Expected rate of return on plan assets 8.25% 9.30% Salary growth rate 7.00% 7.00%
B. Demographic assumptions
Particulars For the year ended For the year ended 31 March 2013 31 March 2012
Retirement Age 60 Years 60 Years Mortality table LIC (1994-96) LIC (1994-96) duly modified duly modified
Withdrawal Rates - Ages Upto 30 Years 8% 3%
Upto 44 Years 7% 2% Above 44 Years 6% 1%
(All amounts are in Rupees)
Notes to consolidated financial statements for the year ended 31 March 2013
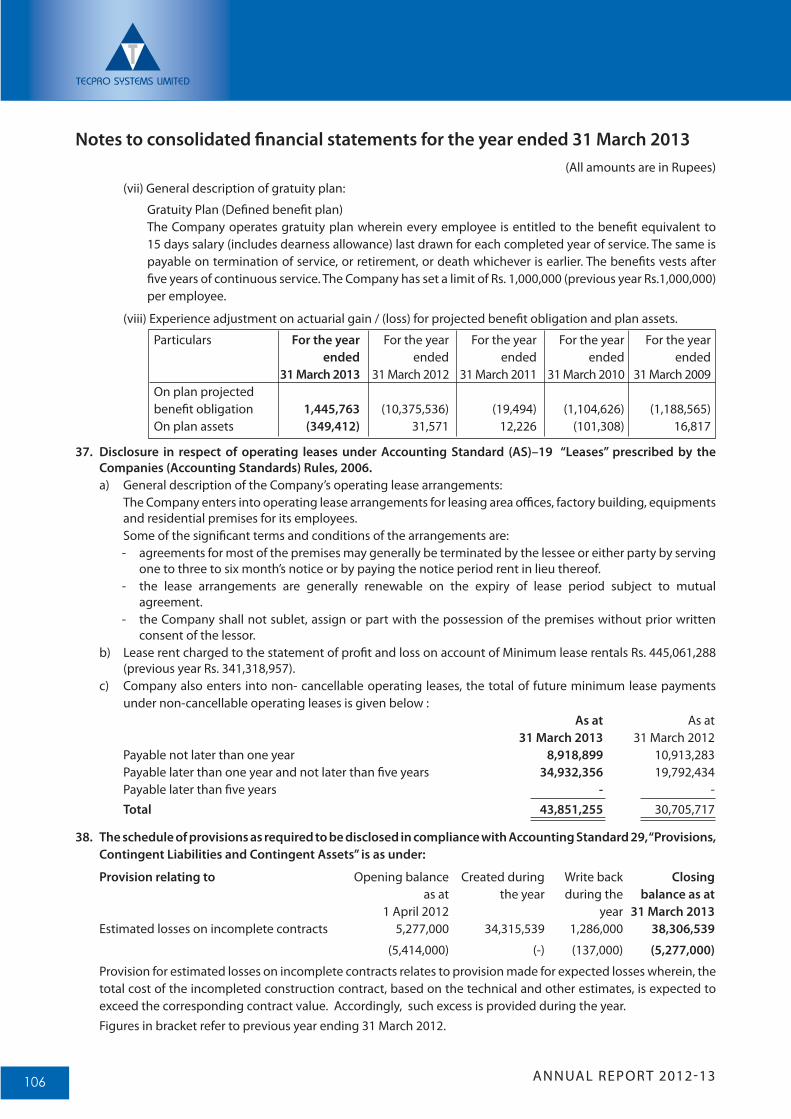
ANNUAL REPORT 2012-13106
(vii) General description of gratuity plan:
Gratuity Plan (Defined benefit plan) The Company operates gratuity plan wherein every employee is entitled to the benefit equivalent to
15 days salary (includes dearness allowance) last drawn for each completed year of service. The same is payable on termination of service, or retirement, or death whichever is earlier. The benefits vests after five years of continuous service. The Company has set a limit of Rs. 1,000,000 (previous year Rs.1,000,000) per employee.
(viii) Experience adjustment on actuarial gain / (loss) for projected benefit obligation and plan assets.
Particulars For the year For the year For the year For the year For the year ended ended ended ended ended 31 March 2013 31 March 2012 31 March 2011 31 March 2010 31 March 2009 On plan projected benefit obligation 1,445,763 (10,375,536) (19,494) (1,104,626) (1,188,565) On plan assets (349,412) 31,571 12,226 (101,308) 16,817
37. Disclosure in respect of operating leases under Accounting Standard (AS)–19 “Leases” prescribed by the Companies (Accounting Standards) Rules, 2006.a) General description of the Company’s operating lease arrangements: The Company enters into operating lease arrangements for leasing area offices, factory building, equipments
and residential premises for its employees. Some of the significant terms and conditions of the arrangements are:
- agreements for most of the premises may generally be terminated by the lessee or either party by serving one to three to six month’s notice or by paying the notice period rent in lieu thereof.
- the lease arrangements are generally renewable on the expiry of lease period subject to mutual agreement.
- the Company shall not sublet, assign or part with the possession of the premises without prior written consent of the lessor.
b) Lease rent charged to the statement of profit and loss on account of Minimum lease rentals Rs. 445,061,288 (previous year Rs. 341,318,957).
c) Company also enters into non- cancellable operating leases, the total of future minimum lease payments under non-cancellable operating leases is given below :
As at As at 31 March 2013 31 March 2012
Payable not later than one year 8,918,899 10,913,283 Payable later than one year and not later than five years 34,932,356 19,792,434 Payable later than five years - - Total 43,851,255 30,705,717
38. The schedule of provisions as required to be disclosed in compliance with Accounting Standard 29, “Provisions, Contingent Liabilities and Contingent Assets” is as under:
Provision relating to Opening balance Created during Write back Closing as at the year during the balance as at 1 April 2012 year 31 March 2013Estimated losses on incomplete contracts 5,277,000 34,315,539 1,286,000 38,306,539
(5,414,000) (-) (137,000) (5,277,000)
Provision for estimated losses on incomplete contracts relates to provision made for expected losses wherein, the total cost of the incompleted construction contract, based on the technical and other estimates, is expected to exceed the corresponding contract value. Accordingly, such excess is provided during the year.Figures in bracket refer to previous year ending 31 March 2012.
(All amounts are in Rupees)
Notes to consolidated financial statements for the year ended 31 March 2013
ANNUAL REPORT 2012-13 107
39. Segment reporting
The Segment reporting policy is in conformity with Accounting Standard-17 on “Segment Reporting”, prescribed by the Companies (Accounting standards) Rules, 2006.
The risk-return profile of the Company’s (including its subsidiaries) business is determined predominantly by the nature of their products and services. Accordingly, the primary segmentation is based on the business segments (reportable primary segment) in which the Company and its subsidiaries operate.
The businesses are organized into two key geographic segments (reportable secondary segment) i.e. domestic and exports. Revenues are attributable to individual geographic segments based on the location of the customer within India (domestic) and outside India (exports).
The following specific accounting policies have been followed for segment reporting:-
1 Segment revenue includes net sales (sale of manufactured goods and traded goods), service income and contract revenue directly identifiable to the segment. Segment results includes amounts directly identifiable to each of the segments and which can be allocated on a reasonable basis. Unallocable income includes interest income and other income that are not identifiable to the segments. Unallocable expenditure includes corporate expenditure which is not identifiable to any of the segments.
2 Segment assets and segment liabilities include those directly identifiable with the respective segments. Unallocated assets include cash and bank, loans and advances to subsidiaries, accured interest on fixed deposits, share application money pending allotment, deferred tax assets, advance for share purchase and investments. Unallocated liabilities include secured loans, unsecured loans, bank overdraft, interest accured but not due, provision for proposed dividend and income tax liabilities.
Primary segment (Business segment) The Company and its subsidiaries operate in 4 primary business segments:-
A Material handling systems This segment is primarily engaged in manufacturing, supply, erection and commissioning of material
handling systems (including balance of plant) , viz;a. Supply of conveyor belt, slat conveyors, bucket elevators;b. Manufacture and / or supply of crushers, screens, conveyor components like idlers and pulleys
(rollers);c. Fabricated steel structures ;d. Providing the services of design, engineering, procurement, construction and maintenance for air
and gas pollution control systems attached to the industrial plants;e. Manufacture of ash handling equipments and undertakes turnkey projects for ash handling
system;f. Erection and commissioning of all of the above.
B Setting up of complete power plant on Engineering, Procurement and Construction (EPC) basis This segment is primarily engaged in purchasing, selling, producing, trading, manufacturing or otherwise
dealing in all aspects of research, design, engineering, installation, commissioning, construction, operation and maintenance of power generation plants and power systems.
C Power generation and distribution This segment is primarily engaged in generation, production, manufacturing, transmission, supply and
distribution of electric power to different categories of consumers. This segment has not yet commenced its commercial operations.
D Waste processing This segment is primarily engaged in manufacturing Refused Derived Fuel (RDF) from municipal solid
waste supplied by Ajmer Municipal Council and Bikaner Municipal Council. This segment has not yet commenced its commercial operations.
Secondary segment (Geographical segment)
The businesses are organized into two key geographic segments (reportable secondary segment) i.e. domestic and exports. Revenues are attributable to individual geographic segments based on the location of the customer within India (domestic) and outside India (exports).
(All amounts are in Rupees)
Notes to consolidated financial statements for the year ended 31 March 2013
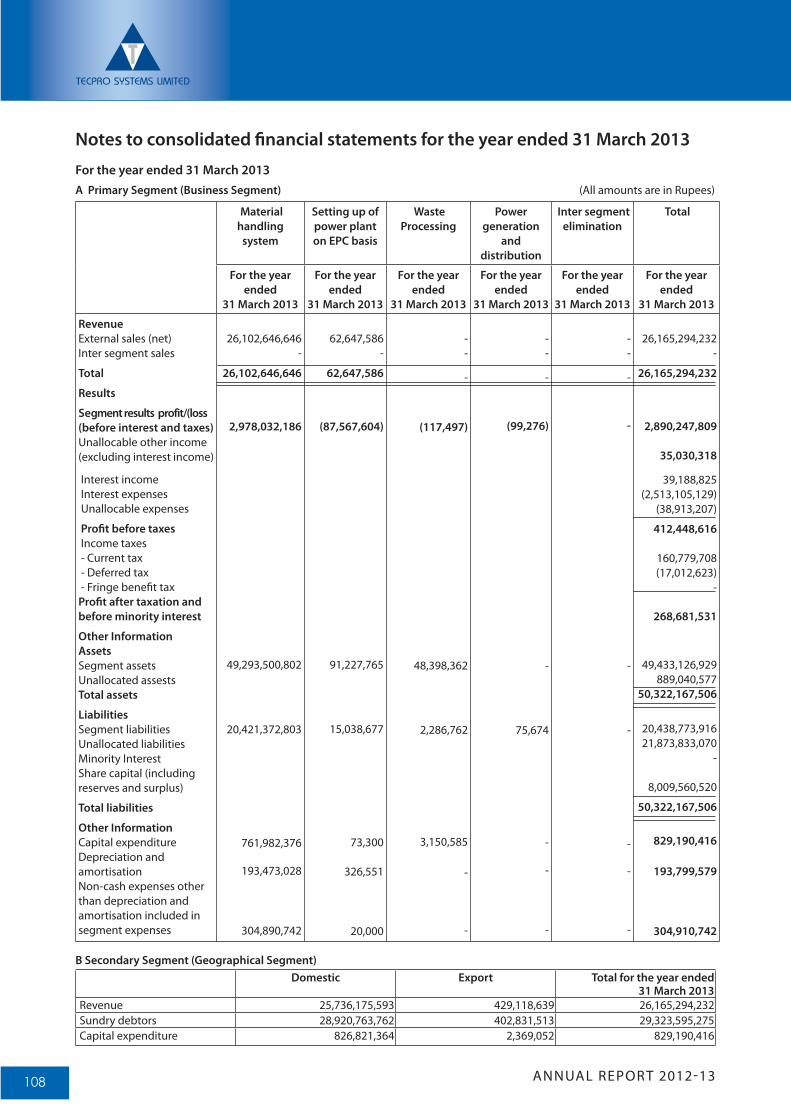
ANNUAL REPORT 2012-13108
Material handling
system
Setting up of power plant on EPC basis
Waste Processing
Power generation
and distribution
Inter segment elimination
Total
For the year ended
31 March 2013
For the year ended
31 March 2013
For the year ended
31 March 2013
For the year ended
31 March 2013
For the year ended
31 March 2013
For the year ended
31 March 2013
Revenue External sales (net) Inter segment sales
Total
Results
Segment results profit/(loss (before interest and taxes) Unallocable other income (excluding interest income)
Interest income Interest expenses Unallocable expenses
Profit before taxes Income taxes - Current tax - Deferred tax - Fringe benefit tax Profit after taxation and before minority interest
Other Information Assets Segment assets Unallocated assests Total assets
Liabilities Segment liabilities Unallocated liabilities Minority Interest Share capital (including reserves and surplus)
Total liabilities
Other Information Capital expenditure Depreciation and amortisation Non-cash expenses other than depreciation and amortisation included in segment expenses
26,102,646,646 -
26,102,646,646
2,978,032,186
49,293,500,802
20,421,372,803
761,982,376
193,473,028
304,890,742
62,647,586 -
62,647,586
(87,567,604)
91,227,765
15,038,677
73,300
326,551
20,000
- -
-
(117,497)
48,398,362
2,286,762
3,150,585
-
-
- -
-
(99,276)
-
75,674
-
-
-
- -
-
-
-
-
-
-
-
26,165,294,232 -
26,165,294,232
2,890,247,809
35,030,318
39,188,825 (2,513,105,129)
(38,913,207)
412,448,616
160,779,708 (17,012,623)
-
268,681,531
49,433,126,929 889,040,577
50,322,167,506
20,438,773,916 21,873,833,070
-
8,009,560,520
50,322,167,506
829,190,416
193,799,579
304,910,742
B Secondary Segment (Geographical Segment)Domestic Export Total for the year ended
31 March 2013 Revenue 25,736,175,593 429,118,639 26,165,294,232 Sundry debtors 28,920,763,762 402,831,513 29,323,595,275 Capital expenditure 826,821,364 2,369,052 829,190,416
For the year ended 31 March 2013
A Primary Segment (Business Segment) (All amounts are in Rupees)
Notes to consolidated financial statements for the year ended 31 March 2013
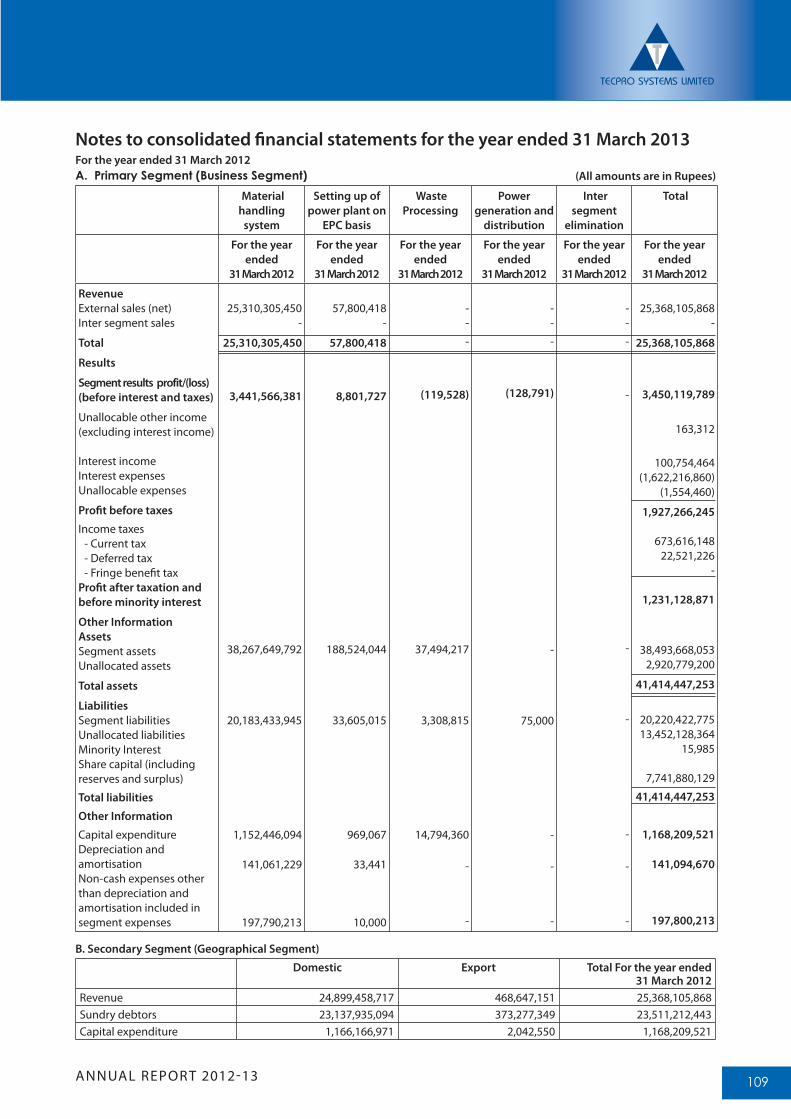
ANNUAL REPORT 2012-13 109
(All amounts are in Rupees)
Material handling
system
Setting up of power plant on
EPC basis
Waste Processing
Power generation and
distribution
Inter segment
elimination
Total
For the year ended
31 March 2012
For the year ended
31 March 2012
For the year ended
31 March 2012
For the year ended
31 March 2012
For the year ended
31 March 2012
For the year ended
31 March 2012
Revenue External sales (net) Inter segment sales
Total
Results
Segment results profit/(loss) (before interest and taxes)
Unallocable other income (excluding interest income)
Interest income Interest expenses Unallocable expenses
Profit before taxes
Income taxes - Current tax - Deferred tax - Fringe benefit tax Profit after taxation and before minority interest
Other Information Assets Segment assets Unallocated assets
Total assets
Liabilities Segment liabilities Unallocated liabilities Minority Interest Share capital (including reserves and surplus)
Total liabilities
Other Information
Capital expenditure Depreciation and amortisation Non-cash expenses other than depreciation and amortisation included in segment expenses
25,310,305,450 -
25,310,305,450
3,441,566,381
38,267,649,792
20,183,433,945
1,152,446,094
141,061,229
197,790,213
57,800,418 -
57,800,418
8,801,727
188,524,044
33,605,015
969,067
33,441
10,000
- -
-
(119,528)
37,494,217
3,308,815
14,794,360
-
-
- -
-
(128,791)
-
75,000
-
-
-
- -
-
-
-
-
-
-
-
25,368,105,868 -
25,368,105,868
3,450,119,789
163,312
100,754,464 (1,622,216,860)
(1,554,460)
1,927,266,245
673,616,148 22,521,226
-
1,231,128,871
38,493,668,053 2,920,779,200
41,414,447,253
20,220,422,775 13,452,128,364
15,985
7,741,880,129
41,414,447,253
1,168,209,521
141,094,670
197,800,213
B. Secondary Segment (Geographical Segment)
Domestic Export Total For the year ended 31 March 2012
Revenue 24,899,458,717 468,647,151 25,368,105,868Sundry debtors 23,137,935,094 373,277,349 23,511,212,443Capital expenditure 1,166,166,971 2,042,550 1,168,209,521
A. Primary Segment (Business Segment) For the year ended 31 March 2012
Notes to consolidated financial statements for the year ended 31 March 2013
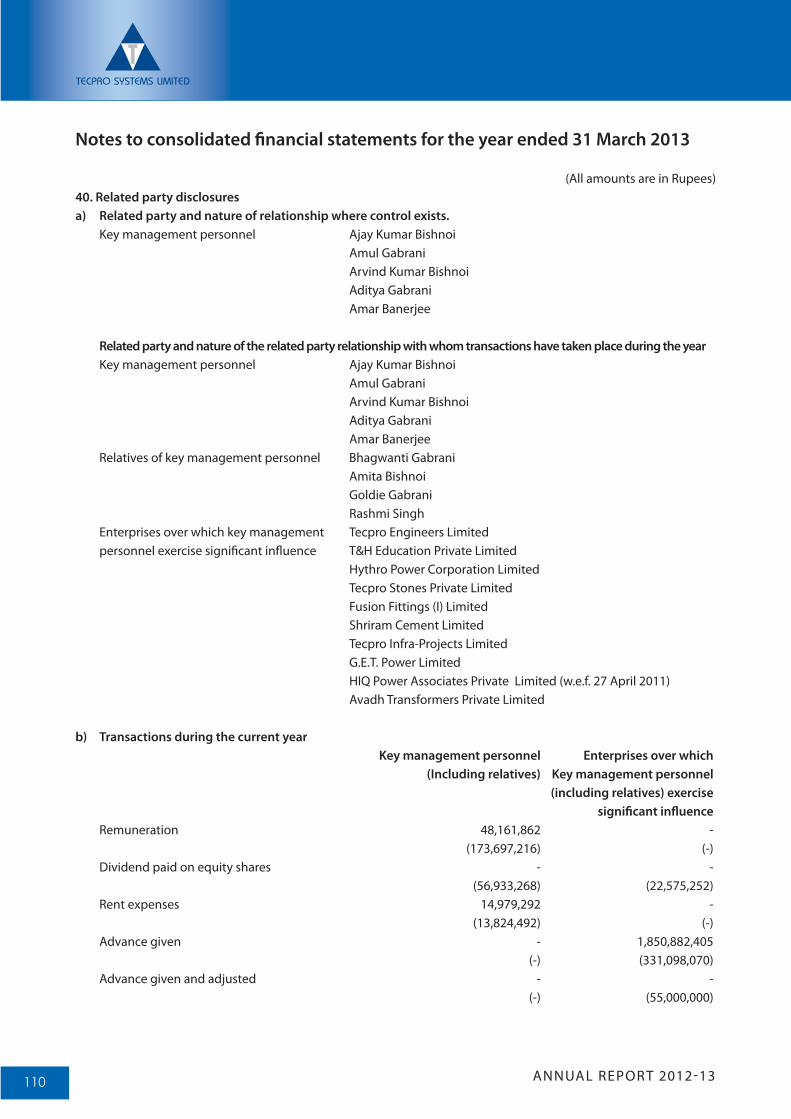
ANNUAL REPORT 2012-13110
(All amounts are in Rupees)40. Related party disclosuresa) Related party and nature of relationship where control exists. Key management personnel Ajay Kumar Bishnoi Amul Gabrani Arvind Kumar Bishnoi Aditya Gabrani Amar Banerjee
Related party and nature of the related party relationship with whom transactions have taken place during the year Key management personnel Ajay Kumar Bishnoi Amul Gabrani Arvind Kumar Bishnoi Aditya Gabrani Amar Banerjee Relatives of key management personnel Bhagwanti Gabrani Amita Bishnoi Goldie Gabrani Rashmi Singh Enterprises over which key management Tecpro Engineers Limited personnel exercise significant influence T&H Education Private Limited Hythro Power Corporation Limited Tecpro Stones Private Limited Fusion Fittings (I) Limited Shriram Cement Limited Tecpro Infra-Projects Limited G.E.T. Power Limited HIQ Power Associates Private Limited (w.e.f. 27 April 2011) Avadh Transformers Private Limited
b) Transactions during the current year Key management personnel Enterprises over which (Including relatives) Key management personnel (including relatives) exercise significant influence Remuneration 48,161,862 - (173,697,216) (-) Dividend paid on equity shares - - (56,933,268) (22,575,252) Rent expenses 14,979,292 - (13,824,492) (-) Advance given - 1,850,882,405 (-) (331,098,070) Advance given and adjusted - - (-) (55,000,000)
Notes to consolidated financial statements for the year ended 31 March 2013
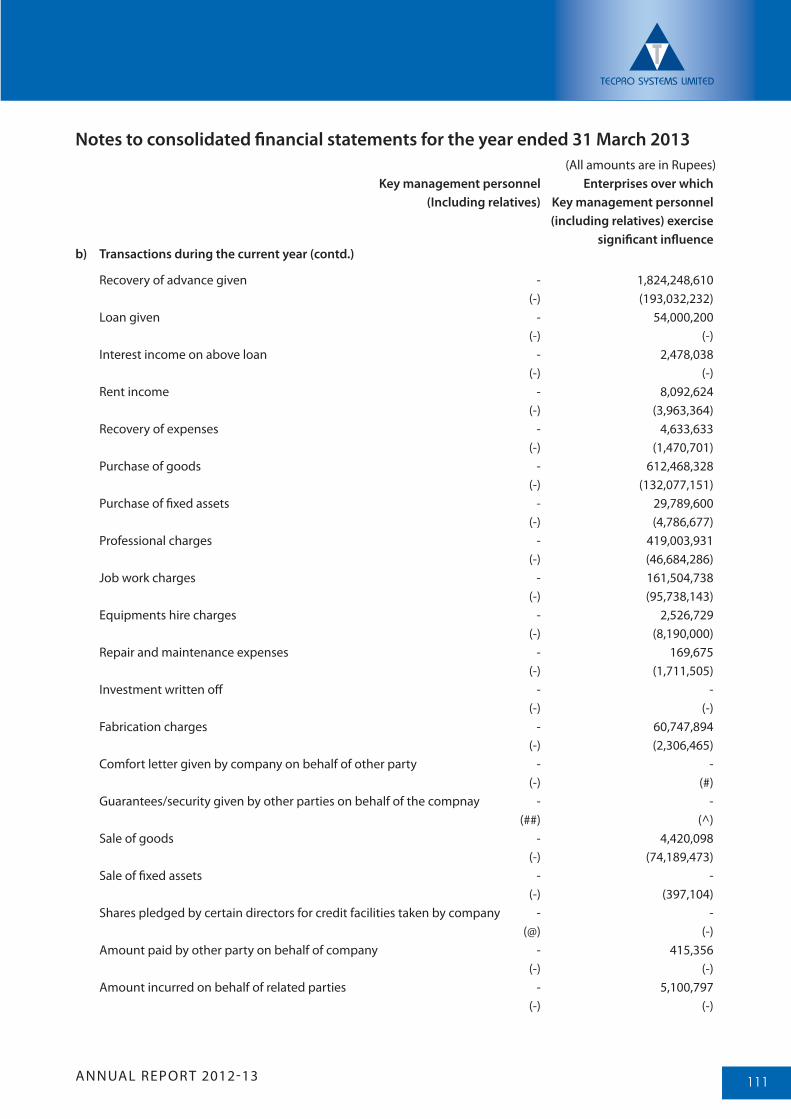
ANNUAL REPORT 2012-13 111
Recovery of advance given - 1,824,248,610 (-) (193,032,232) Loan given - 54,000,200 (-) (-) Interest income on above loan - 2,478,038 (-) (-) Rent income - 8,092,624 (-) (3,963,364) Recovery of expenses - 4,633,633 (-) (1,470,701) Purchase of goods - 612,468,328 (-) (132,077,151) Purchase of fixed assets - 29,789,600 (-) (4,786,677) Professional charges - 419,003,931 (-) (46,684,286) Job work charges - 161,504,738 (-) (95,738,143) Equipments hire charges - 2,526,729 (-) (8,190,000) Repair and maintenance expenses - 169,675 (-) (1,711,505) Investment written off - - (-) (-) Fabrication charges - 60,747,894 (-) (2,306,465) Comfort letter given by company on behalf of other party - - (-) (#) Guarantees/security given by other parties on behalf of the compnay - - (##) (^) Sale of goods - 4,420,098 (-) (74,189,473) Sale of fixed assets - - (-) (397,104) Shares pledged by certain directors for credit facilities taken by company - - (@) (-) Amount paid by other party on behalf of company - 415,356 (-) (-) Amount incurred on behalf of related parties - 5,100,797 (-) (-)
(All amounts are in Rupees) Key management personnel Enterprises over which (Including relatives) Key management personnel (including relatives) exercise significant influence
Notes to consolidated financial statements for the year ended 31 March 2013
b) Transactions during the current year (contd.)
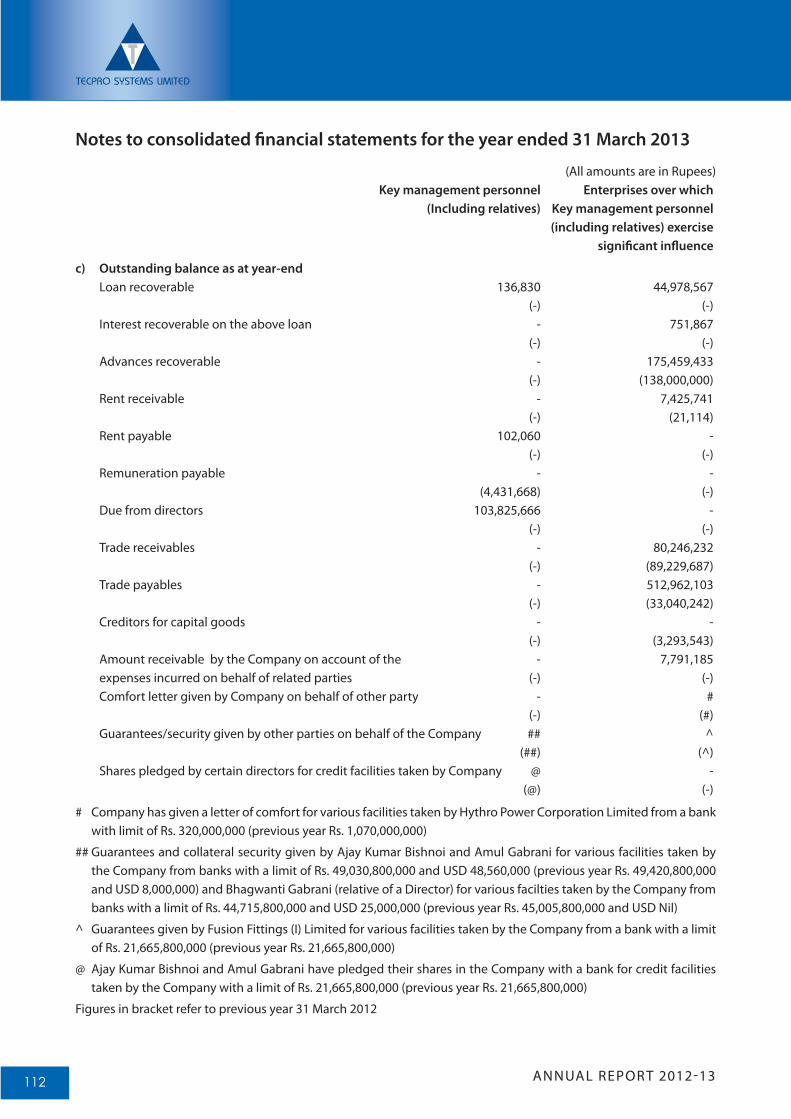
ANNUAL REPORT 2012-13112
c) Outstanding balance as at year-end Loan recoverable 136,830 44,978,567 (-) (-) Interest recoverable on the above loan - 751,867 (-) (-) Advances recoverable - 175,459,433 (-) (138,000,000) Rent receivable - 7,425,741 (-) (21,114) Rent payable 102,060 - (-) (-) Remuneration payable - - (4,431,668) (-) Due from directors 103,825,666 - (-) (-) Trade receivables - 80,246,232 (-) (89,229,687) Trade payables - 512,962,103 (-) (33,040,242) Creditors for capital goods - - (-) (3,293,543) Amount receivable by the Company on account of the - 7,791,185 expenses incurred on behalf of related parties (-) (-) Comfort letter given by Company on behalf of other party - # (-) (#) Guarantees/security given by other parties on behalf of the Company ## ^ (##) (^) Shares pledged by certain directors for credit facilities taken by Company @ - (@) (-)
# Company has given a letter of comfort for various facilities taken by Hythro Power Corporation Limited from a bank with limit of Rs. 320,000,000 (previous year Rs. 1,070,000,000)
## Guarantees and collateral security given by Ajay Kumar Bishnoi and Amul Gabrani for various facilities taken by the Company from banks with a limit of Rs. 49,030,800,000 and USD 48,560,000 (previous year Rs. 49,420,800,000 and USD 8,000,000) and Bhagwanti Gabrani (relative of a Director) for various facilties taken by the Company from banks with a limit of Rs. 44,715,800,000 and USD 25,000,000 (previous year Rs. 45,005,800,000 and USD Nil)
^ Guarantees given by Fusion Fittings (I) Limited for various facilities taken by the Company from a bank with a limit of Rs. 21,665,800,000 (previous year Rs. 21,665,800,000)
@ Ajay Kumar Bishnoi and Amul Gabrani have pledged their shares in the Company with a bank for credit facilities taken by the Company with a limit of Rs. 21,665,800,000 (previous year Rs. 21,665,800,000)
Figures in bracket refer to previous year 31 March 2012
(All amounts are in Rupees) Key management personnel Enterprises over which (Including relatives) Key management personnel (including relatives) exercise significant influence
Notes to consolidated financial statements for the year ended 31 March 2013
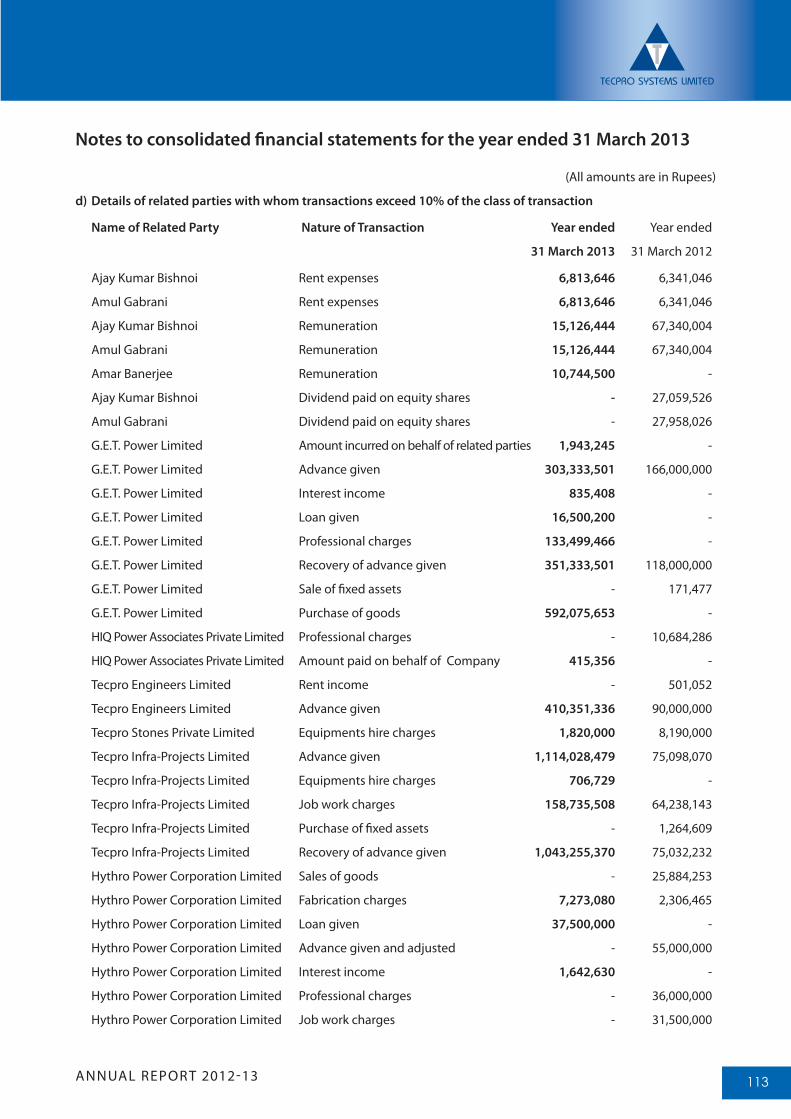
ANNUAL REPORT 2012-13 113
(All amounts are in Rupees)
d) Details of related parties with whom transactions exceed 10% of the class of transaction
Name of Related Party Nature of Transaction Year ended Year ended
31 March 2013 31 March 2012
Ajay Kumar Bishnoi Rent expenses 6,813,646 6,341,046
Amul Gabrani Rent expenses 6,813,646 6,341,046
Ajay Kumar Bishnoi Remuneration 15,126,444 67,340,004
Amul Gabrani Remuneration 15,126,444 67,340,004
Amar Banerjee Remuneration 10,744,500 -
Ajay Kumar Bishnoi Dividend paid on equity shares - 27,059,526
Amul Gabrani Dividend paid on equity shares - 27,958,026
G.E.T. Power Limited Amount incurred on behalf of related parties 1,943,245 -
G.E.T. Power Limited Advance given 303,333,501 166,000,000
G.E.T. Power Limited Interest income 835,408 -
G.E.T. Power Limited Loan given 16,500,200 -
G.E.T. Power Limited Professional charges 133,499,466 -
G.E.T. Power Limited Recovery of advance given 351,333,501 118,000,000
G.E.T. Power Limited Sale of fixed assets - 171,477
G.E.T. Power Limited Purchase of goods 592,075,653 -
HIQ Power Associates Private Limited Professional charges - 10,684,286
HIQ Power Associates Private Limited Amount paid on behalf of Company 415,356 -
Tecpro Engineers Limited Rent income - 501,052
Tecpro Engineers Limited Advance given 410,351,336 90,000,000
Tecpro Stones Private Limited Equipments hire charges 1,820,000 8,190,000
Tecpro Infra-Projects Limited Advance given 1,114,028,479 75,098,070
Tecpro Infra-Projects Limited Equipments hire charges 706,729 -
Tecpro Infra-Projects Limited Job work charges 158,735,508 64,238,143
Tecpro Infra-Projects Limited Purchase of fixed assets - 1,264,609
Tecpro Infra-Projects Limited Recovery of advance given 1,043,255,370 75,032,232
Hythro Power Corporation Limited Sales of goods - 25,884,253
Hythro Power Corporation Limited Fabrication charges 7,273,080 2,306,465
Hythro Power Corporation Limited Loan given 37,500,000 -
Hythro Power Corporation Limited Advance given and adjusted - 55,000,000
Hythro Power Corporation Limited Interest income 1,642,630 -
Hythro Power Corporation Limited Professional charges - 36,000,000
Hythro Power Corporation Limited Job work charges - 31,500,000
Notes to consolidated financial statements for the year ended 31 March 2013
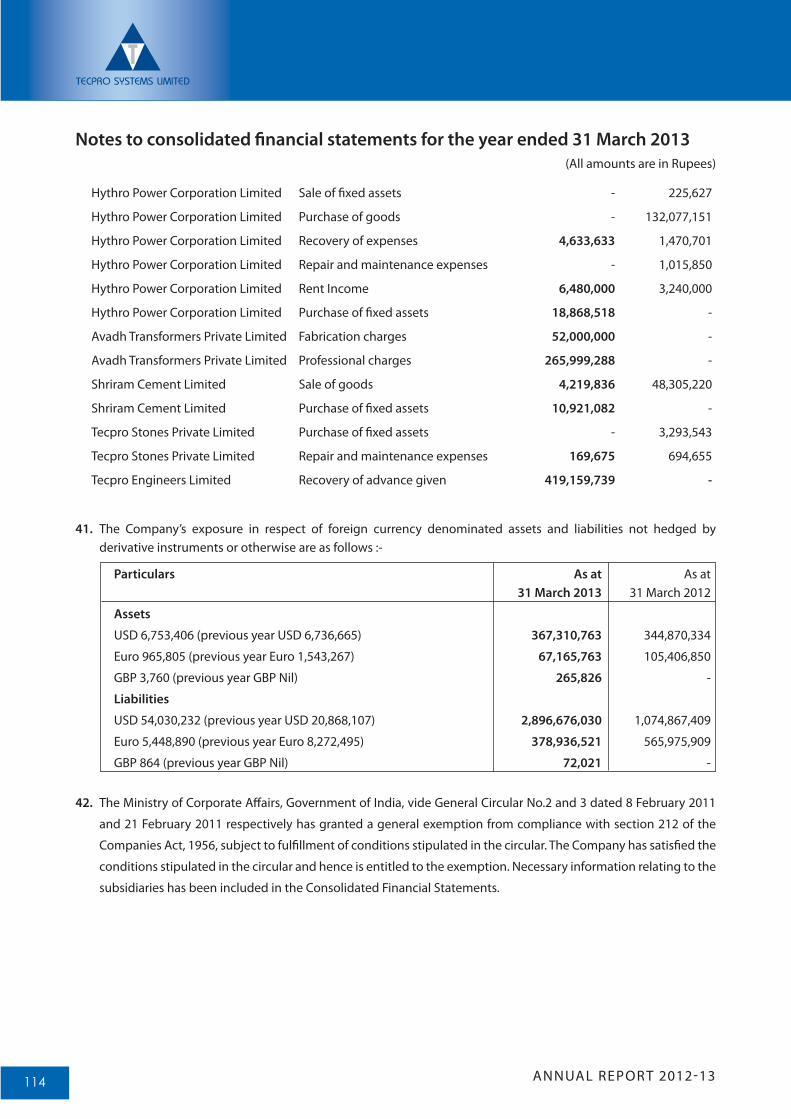
ANNUAL REPORT 2012-13114
41. The Company’s exposure in respect of foreign currency denominated assets and liabilities not hedged by derivative instruments or otherwise are as follows :-
Particulars As at As at 31 March 2013 31 March 2012
Assets
USD 6,753,406 (previous year USD 6,736,665) 367,310,763 344,870,334
Euro 965,805 (previous year Euro 1,543,267) 67,165,763 105,406,850
GBP 3,760 (previous year GBP Nil) 265,826 -
Liabilities
USD 54,030,232 (previous year USD 20,868,107) 2,896,676,030 1,074,867,409
Euro 5,448,890 (previous year Euro 8,272,495) 378,936,521 565,975,909
GBP 864 (previous year GBP Nil) 72,021 -
42. The Ministry of Corporate Affairs, Government of India, vide General Circular No.2 and 3 dated 8 February 2011
and 21 February 2011 respectively has granted a general exemption from compliance with section 212 of the
Companies Act, 1956, subject to fulfillment of conditions stipulated in the circular. The Company has satisfied the
conditions stipulated in the circular and hence is entitled to the exemption. Necessary information relating to the
subsidiaries has been included in the Consolidated Financial Statements.
Notes to consolidated financial statements for the year ended 31 March 2013
Hythro Power Corporation Limited Sale of fixed assets - 225,627
Hythro Power Corporation Limited Purchase of goods - 132,077,151
Hythro Power Corporation Limited Recovery of expenses 4,633,633 1,470,701
Hythro Power Corporation Limited Repair and maintenance expenses - 1,015,850
Hythro Power Corporation Limited Rent Income 6,480,000 3,240,000
Hythro Power Corporation Limited Purchase of fixed assets 18,868,518 -
Avadh Transformers Private Limited Fabrication charges 52,000,000 -
Avadh Transformers Private Limited Professional charges 265,999,288 -
Shriram Cement Limited Sale of goods 4,219,836 48,305,220
Shriram Cement Limited Purchase of fixed assets 10,921,082 -
Tecpro Stones Private Limited Purchase of fixed assets - 3,293,543
Tecpro Stones Private Limited Repair and maintenance expenses 169,675 694,655
Tecpro Engineers Limited Recovery of advance given 419,159,739 -
(All amounts are in Rupees)
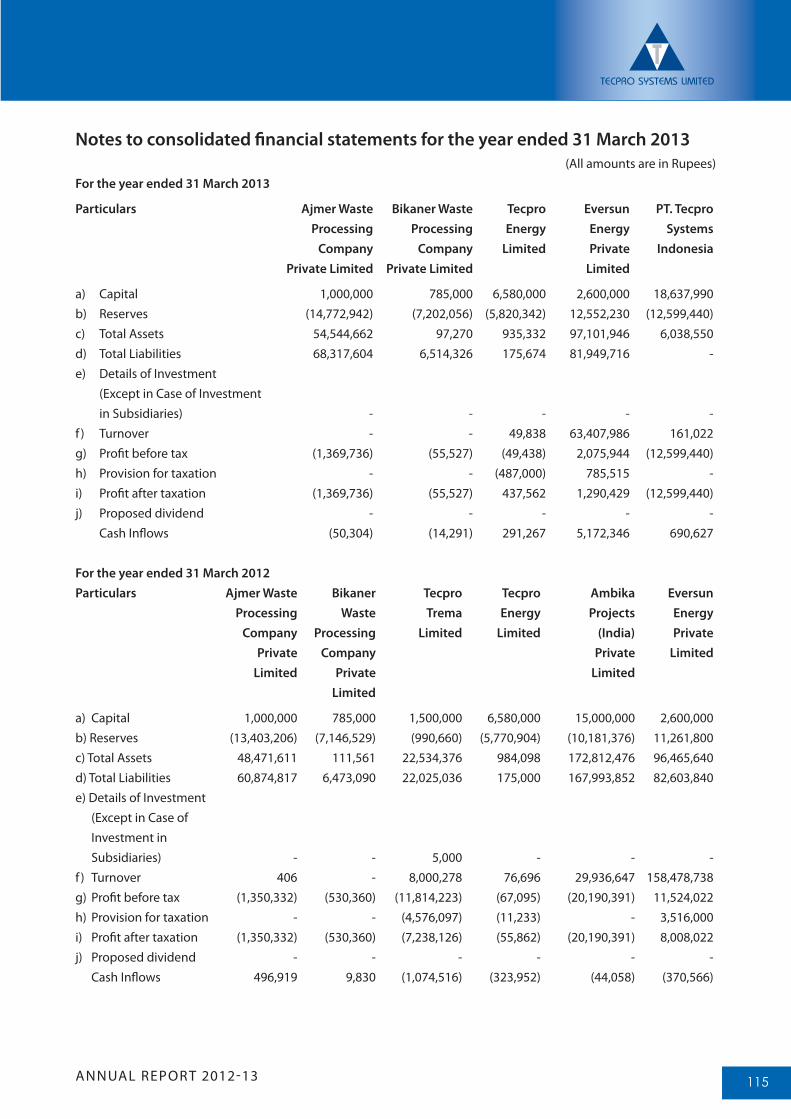
ANNUAL REPORT 2012-13 115
Notes to consolidated financial statements for the year ended 31 March 2013
For the year ended 31 March 2013
Particulars Ajmer Waste Bikaner Waste Tecpro Eversun PT. Tecpro Processing Processing Energy Energy Systems Company Company Limited Private Indonesia Private Limited Private Limited Limited
a) Capital 1,000,000 785,000 6,580,000 2,600,000 18,637,990b) Reserves (14,772,942) (7,202,056) (5,820,342) 12,552,230 (12,599,440)c) Total Assets 54,544,662 97,270 935,332 97,101,946 6,038,550 d) Total Liabilities 68,317,604 6,514,326 175,674 81,949,716 - e) Details of Investment (Except in Case of Investment in Subsidiaries) - - - - - f ) Turnover - - 49,838 63,407,986 161,022 g) Profit before tax (1,369,736) (55,527) (49,438) 2,075,944 (12,599,440)h) Provision for taxation - - (487,000) 785,515 - i) Profit after taxation (1,369,736) (55,527) 437,562 1,290,429 (12,599,440)j) Proposed dividend - - - - - Cash Inflows (50,304) (14,291) 291,267 5,172,346 690,627
For the year ended 31 March 2012Particulars Ajmer Waste Bikaner Tecpro Tecpro Ambika Eversun Processing Waste Trema Energy Projects Energy Company Processing Limited Limited (India) Private Private Company Private Limited Limited Private Limited Limited
a) Capital 1,000,000 785,000 1,500,000 6,580,000 15,000,000 2,600,000b) Reserves (13,403,206) (7,146,529) (990,660) (5,770,904) (10,181,376) 11,261,800c) Total Assets 48,471,611 111,561 22,534,376 984,098 172,812,476 96,465,640 d) Total Liabilities 60,874,817 6,473,090 22,025,036 175,000 167,993,852 82,603,840e) Details of Investment (Except in Case of Investment in Subsidiaries) - - 5,000 - - - f ) Turnover 406 - 8,000,278 76,696 29,936,647 158,478,738g) Profit before tax (1,350,332) (530,360) (11,814,223) (67,095) (20,190,391) 11,524,022 h) Provision for taxation - - (4,576,097) (11,233) - 3,516,000 i) Profit after taxation (1,350,332) (530,360) (7,238,126) (55,862) (20,190,391) 8,008,022j) Proposed dividend - - - - - - Cash Inflows 496,919 9,830 (1,074,516) (323,952) (44,058) (370,566)
(All amounts are in Rupees)
ANNUAL REPORT 2012-13116
43. Estimated amount of contracts remaining to be executed on capital account and not provided for [net of advances
of Rs. 54,612,843 (previous year Rs. 11,027,924)] is Rs. 103,216,300 (previous year Rs. 381,365,647).
44. Previous year figures in balance sheet have been regrouped / recast wherever necessary to conform to the current
year’s classification/presentation.
For B S R & Co. For and on behalf of the Board of Directors of Tecpro Systems Limited
Chartered Accountants
Registration no. 101248W
Sd/- Sd/- Sd/- Sd/-
Jiten Chopra Ajay Kumar Bishnoi Amul Gabrani Pankaj Tandon
Partner Chairman & Vice Chairman & Company Secretary
Membership No.: 092894 Managing Director Managing Director
Place : Gurgaon Place : Chennai Place : Gurgaon Place : Chennai
Date : 30 May 2013 Date : 30 May 2013 Date : 30 May 2013 Date : 30 May 2013
Notes to consolidated financial statements for the year ended 31 March 2013

Tecpro Systems LimitedRegd. Office: 106, Vishwadeep Tower, Plot No. 4, District Centre,
Janakpuri, New Delhi-110058
NOTICE
Notice is hereby given that the Twenty Third Annual General Meeting of the Members of Tecpro Systems Limited will be held on Monday, the 30th day of September, 2013 at Dr. Sarvepalli Radhakrishnan Auditorium, Kendriya Vidyalaya No. 2, APS Colony, Delhi Cantt., Delhi-110010 at 10:00 a.m. to transact the following businesses:
ORDINARY BUSINESS:1. To receive, consider and adopt the Audited Balance Sheet as at 31 March, 2013, the Statement of Profit
and Loss for the year ended on that date and the Reports of the Directors and Auditors thereon.
2. To appoint a director in place of Mr. Adtiya Gabrani, who retires by rotation and being eligible, offers himself for re-appointment.
3. To appoint a director in place of Mr. Anunay Kumar, who retires by rotation and being eligible, offers himself for re-appointment.
4. To appoint a director in place of Mr. Satvinder Jeet Singh Sodhi, who retires by rotation and being eligible, offers himself for re-appointment.
5. To re-appoint M/s B S R & Co., Chartered Accountants, as Statutory Auditors of the Company, to hold office from the conclusion of this meeting until the conclusion of the next Annual General Meeting and to fix their remuneration.
SPECIAL BUSINESS:To consider and if thought fit, to pass with or without modification(s), the following resolutions as Ordinary Resolutions:
6. To re-appoint Mr. Amar Banarjee, as a Whole-time Director. “RESOLVED THAT pursuant to the provisions of Sections 198, 269, 309 and 310 read with Schedule XIII
and other applicable provisions, if any, of the Companies Act, 1956, provisions of the Listing Agreement or any statutory modification or re-enactment thereof and as recommended by the Remuneration Committee of the Company, Mr. Amar Banarjee be and is hereby re-appointed as a Whole-time Director of the Company liable to retire by rotation for a period of 2 years with effect from 1 April, 2013 at the following remuneration:
Part I - Basic Salary: Basic Salary Rs. 5,12,000 per month on the scale of Rs. 5,12,000 – 25,600 – 5,37,600. Part II - Perquisites:
a) House rent allowance - 40% of the Basic Salary.
b) Medical reimbursement of actual expenses limited to one month Basic Salary per year.
c) Company maintained Car for official use.
d) Telephone at residence and mobile for official use.
e) Leave Travel Allowance as per Company’s Policy.
f) Contribution to Provident Fund, Superannuation or Annuity Fund and Gratuity as per rules of the Company.
RESOLVED FURTHER THAT the remuneration payable to Mr. Amar Banarjee, Whole-time Director shall be subject to the overall ceiling laid down in Schedule XIII of the Companies Act, 1956.
RESOLVED FURTHER THAT subject to such approvals as may be required, the above remuneration be paid as minimum remuneration to Mr. Amar Banarjee, Whole-time Director in the event of absence or inadequacy of profit in any year during the tenure of his appointment.”
7. Alteration of the Capital Clause of the Memorandum of Association of the Company.
“RESOLVED THAT pursuant to the provisions of Section 94, 95 & other applicable provisions, if any, of the Companies Act, 1956, the existing Authorized Share Capital of the Company be and is hereby re-classified in the following manner:
“5,00,00,000 Equity Shares of Rs. 10 each amounting to Rs. 50,00,00,000 (Rupees Fifty Crore Only), out of the entire equity share capital, stand cancelled and 50,00,000 Preference Shares of Rs. 100 each amounting to Rs. 50,00,00,000 (Rupees Fifty Crore Only) be created within the present Authorized Share Capital of the Company.”
RESOLVED FURTHER THAT Clause V of the Memorandum of Association of the Company be and is hereby substituted by the following:
“V. The Authorized Share Capital of the Company is Rs. 1,31,15,00,000 (Rupees One Hundred Thirty One Crore Fifteen Lakh Only) divided into 8,11,50,000 (Eight Crore Eleven Lakh Fifty Thousand) Equity Shares of Rs. 10 (Rupees Ten Only) each amounting to Rs. 81,15,00,000 (Rupees Eighty One Crore Fifteen Lakh Only) and 50,00,000 (Fifty Lakh) Preference Shares of Rs. 100 (Rupees One Hundred Only) each amounting to Rs. 50,00,00,000 (Rupees Fifty Crore Only).”
RESOLVED FURTHER THAT Mr. Amul Gabrani, Vice Chairman & Managing Director and Mr. Pankaj Tandon, General Manager (Corp. Affairs) & Company Secretary of the Company be and are hereby severally authorized to do all such acts, deeds and things as may be required to give effect to the above including but not limited to filing of necessary form with the Registrar of Companies.”
By order of the Board of Directors ofTecpro Systems Limited
Sd/-Date : 14 August, 2013 Pankaj Tandon Place: Gurgaon General Manager (Corp. Affairs) & Company Secretary
EXPLANATORY STATEMENT PURSUANT TO SECTION 173 OF THE COMPANIES ACT, 1956
Item No. 6:Mr. Amar Banerjee, aged about 66 years, was appointed on the Board of the Company on 2 April, 2010 as a Whole-time Director of the Company for a period of 1 year and subsequently reappointed for a further period of two years. Mr. Banerjee has been looking after the Ashtech Division of the Company. Considering his qualification, expertise in the ash handling activities, contribution in the Ashtech Division of the Company and the volume of activities in ash handling business, the Board of Directors of your Company in their meeting held on 14 February, 2013, reappointed Mr. Banerjee for a further period of 2 years w.e.f. 1 April, 2013 and authorized the Remuneration Committee of the Company to fix his remuneration which thereafter fixed his remuneration in its meeting held on 30 May, 2013.
In terms of Section 269 read with Schedule XIII to the Companies Act, 1956, the appointment/re-appointment of a Whole time Director is required to be approved by the members of the Company in their general meeting, therefore, the resolution is placed before you to be passed by way of an ordinary resolution.
The explanatory statement together with the accompanying notice is, and may be treated as an abstract of terms of appointment and memorandum of interest in respect of appointment of Mr. Amar Banerjee under Section 302 of the Companies Act, 1956.
Your Directors commend this resolution for your approval as an Ordinary Resolution.
None of the Directors except Mr. Amar Banerjee himself is interested in the resolution.
Item No. 7:
The Board of Directors in their meeting held on 30 May, 2013 has considered raising of funds through issuance of Preference Shares in order to meet working capital requirements.
Further, in order to issue Preference Shares, the existing Authorized Share Capital of the Company has to be re-classified so as to include the Preference Share Capital. The present Authorized Share Capital of the Company includes 13,11,50,000 Equity Shares of Rs. 10 each amounting to Rs. 1,31,15,00,000 (Rupees One Hundred Thirty One Crore Fifteen Lakh Only). The Board of your Company in their meeting held on 30 May, 2013 has decided to reclassify the Capital Clause of the Memorandum of Association of the Company by canceling the unissued 5,00,00,000 Equity Shares of Rs. 10 each amounting to Rs. 50,00,00,000 (Rupees Fifty Crore Only) and creating 50,00,000 Preference Shares of Rs. 100 each amounting to Rs. 50,00,00,000 (Rupees Fifty Crore Only) so that Preference Shares may be issued as and when required.
Pursuant to the provisions of sections 94 and 95 of the Companies Act, 1956 (“the Act”) and other applicable provisions of the Act, the Capital Clause of the Memorandum of Association of the Company can be reclassified with the approval of the members of the Company by way of passing of an ordinary resolution.
Your Directors commend this resolution for your approval as an Ordinary Resolution.
None of the Directors of the Company is interested in the resolution.By order of the Board of Directors of
Tecpro Systems Limited
Sd/-Date : 14 August, 2013 Pankaj Tandon Place: Gurgaon General Manager (Corp. Affairs) & Company Secretary Notes:
1. A MEMBER ENTITLED TO ATTEND AND VOTE AT THE MEETING IS ENTITLED TO APPOINT A PROXY TO ATTEND AND VOTE INSTEAD OF HIMSELF AND THE PROXY NEED NOT BE A MEMBER OF THE COMPANY. SUCH PROXIES SHOULD BE DEPOSITED WITH THE REGISTERED OFFICE OF THE COMPANY AT LEAST 48 HOURS BEFORE THE COMMENCEMENT OF THE MEETING.
2. A blank proxy form is enclosed for the use by members.
3. The Register of Directors’ Shareholding maintained under section 307 of the Companies Act, 1956 will be available for inspection by the members at the meeting.
4. Members/Proxies should bring the Attendance Slip sent herewith duly filled in for attending the Annual General Meeting.
5. Please check the Pin-code in the address slip pasted on the envelope and advise correction, if any, therein. Also please do indicate the Pin Code Number of your delivery Post Office while notifying change in your address to the Company.
6. Requests for transfer of Equity Shares in case of shares held in physical form and related correspondence should be addressed to the RTA of the Company, Link Intime India Pvt. Ltd. at 44, Community Centre, 2nd Floor, Naraina Industrial Area, Phase-I, Near PVR Nariana, New Delhi - 110028.
7. All the relevant documents as mentioned in the notice including Memorandum and Articles of Association are available for inspection by the shareholders during office hours at the registered office of the Company on any working day during the business hours upto the date of the meeting.
8. Nomination: In terms of Section 109A of the Companies Act, 1956, individual shareholders holding shares in the Company in physical form either singly or jointly may nominate an individual to whom all the rights in the shares on the Company vest in the event of death of the sole/ all joint shareholders, if any.
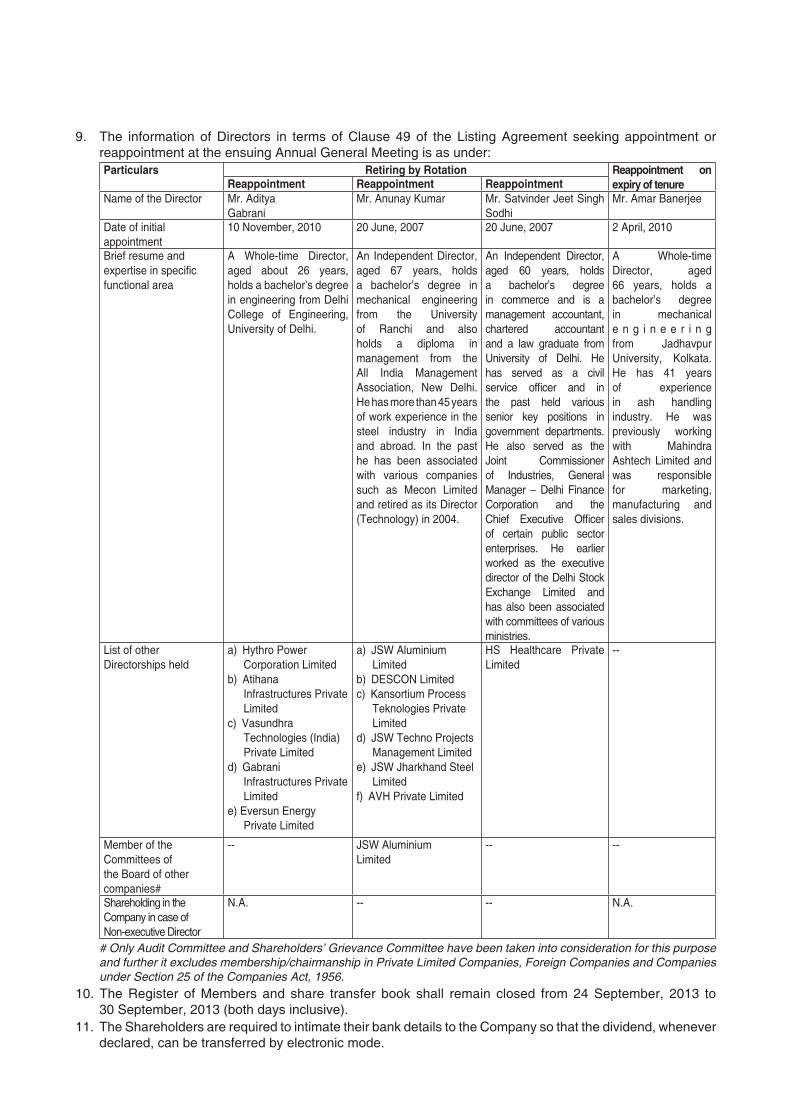
9. The information of Directors in terms of Clause 49 of the Listing Agreement seeking appointment or reappointment at the ensuing Annual General Meeting is as under:Particulars Retiring by Rotation Reappointment on
expiry of tenureReappointment Reappointment ReappointmentName of the Director Mr. Aditya
GabraniMr. Anunay Kumar Mr. Satvinder Jeet Singh
SodhiMr. Amar Banerjee
Date of initial appointment
10 November, 2010 20 June, 2007 20 June, 2007 2 April, 2010
Brief resume and expertise in specific functional area
A Whole-time Director, aged about 26 years, holds a bachelor’s degree in engineering from Delhi College of Engineering, University of Delhi.
An Independent Director, aged 67 years, holds a bachelor’s degree in mechanical engineering from the University of Ranchi and also holds a diploma in management from the All India Management Association, New Delhi. He has more than 45 years of work experience in the steel industry in India and abroad. In the past he has been associated with various companies such as Mecon Limited and retired as its Director (Technology) in 2004.
An Independent Director, aged 60 years, holds a bachelor’s degree in commerce and is a management accountant, chartered accountant and a law graduate from University of Delhi. He has served as a civil service officer and in the past held various senior key positions in government departments. He also served as the Joint Commissioner of Industries, General Manager – Delhi Finance Corporation and the Chief Executive Officer of certain public sector enterprises. He earlier worked as the executive director of the Delhi Stock Exchange Limited and has also been associated with committees of various ministries.
A Whole-time Director, aged 66 years, holds a bachelor’s degree in mechanical e n g i n e e r i n g from Jadhavpur University, Kolkata. He has 41 years of experience in ash handling industry. He was previously working with Mahindra Ashtech Limited and was responsible for marketing, manufacturing and sales divisions.
List of other Directorships held
a) Hythro Power Corporation Limited
b) Atihana Infrastructures Private Limited
c) Vasundhra Technologies (India) Private Limited
d) Gabrani Infrastructures Private Limited
e) Eversun Energy Private Limited
a) JSW Aluminium Limited
b) DESCON Limitedc) Kansortium Process
Teknologies Private Limited
d) JSW Techno Projects Management Limited
e) JSW Jharkhand Steel Limited
f) AVH Private Limited
HS Healthcare Private Limited
--
Member of the Committees of the Board of other companies#
-- JSW Aluminium Limited
-- --
Shareholding in the Company in case of Non-executive Director
N.A. -- -- N.A.
# Only Audit Committee and Shareholders’ Grievance Committee have been taken into consideration for this purpose and further it excludes membership/chairmanship in Private Limited Companies, Foreign Companies and Companies under Section 25 of the Companies Act, 1956.
10. The Register of Members and share transfer book shall remain closed from 24 September, 2013 to 30 September, 2013 (both days inclusive).
11. The Shareholders are required to intimate their bank details to the Company so that the dividend, whenever declared, can be transferred by electronic mode.
Signature of Member/ProxyNotes :1. Members/ Proxies are requested to produce the attendance slip duly signed for admission to the meeting
hall.2. Members are requested to bring their copy of the Annual Report.3. Eatables, Briefcases and Hand Bags will not be allowed to be carried inside the meeting hall.
ATTENDANCE SLIP
Registered Folio/DP Id & Client Id No.: ....................................................No. of shares held :........................
Name(s) of the Member(s)/Proxy : .................................................. ...............................................................
I hereby record my presence at the Twenty Third Annual General Meeting of Tecpro Systems Limited held on Monday, the 30th day of September, 2013 at 10:00 A.M. at Dr. Sarvepalli Radhakrishnan Auditorium, Kendriya Vidyalaya No. 2, APS Colony, Delhi Cantt., Delhi 110010.
PROXY FORM
I/We ........................................................................................ r/o ..................................................................
..............................................................being a member/members of M/s Tecpro Systems Limited, hereby
appoint...............................................r/o.............................................................................................................
or failing him..............................................r/o.......................................................................................as my/our
Proxy to vote for me/us on my/our behalf at the Twenty Third Annual General Meeting of the Company to be
held on Monday, the 30th day of September, 2013 at 10:00 A. M. at Dr. Sarvepalli Radhakrishnan Auditorium,
Kendriya Vidyalaya No. 2, APS Colony, Delhi Cantt., Delhi 110010, and at any adjournment thereof.
Signed this ............................................... day of ...............................2013
Signatures ...............................................................................................
Folio/DP Id & Client Id No........................................................................
Note :1. The form should be signed across the revenue stamp as per specimen signatures registered with the
Company.2. If it is intended to appoint a proxy, the form of proxy should be completed and deposited at the Registered
Office of the Company at least 48 hours before the commencement of the meeting.
Affix Re 1/-Revenue
Stamphere
Tecpro Systems LimitedRegd. Office: 106, Vishwadeep Tower, Plot No. 4, District Centre, Janakpuri, New Delhi-110058
Tecpro Systems LimitedRegd. Office: 106, Vishwadeep Tower, Plot No. 4, District Centre, Janakpuri, New Delhi-110058