Embed Size (px)
Citation preview

s.1
Modeling Data Related to Health Care in the U.S.Paul A. WestDepartment of Mathematics, Engineering, and Computer Science
Objectives This activity will raise students’ awareness of economic concerns related to the U.S. health care system on the eve of health care reform, and reinforce students’ knowledge of linear functions.
Students will read an article entitled “Health Care Facts:Costs”thatdocumentspastandprojected(rising)health care costs. This article sheds light on the com-plex nature of national health care spending and the economic burden health care costs can place on Ameri-can households, small businesses and the American economy as a whole. Accompanying data and graphs for years 2000–2007 will show trends related to the general health of Americans and to the sale of prescrip-tion drugs. Students will model this data using linear regression models in Excel, generate linear equations, and make predictions.
ReflectionIn light of the current health care reform debate (2010–2011), this assignment is timely and relevant. Clearly, good and affordable health care is a necessity for every household. In prior classes, students have reflected on the need to understand health care issues as they relate to voting and to their own lives.
Students will start by identifying healthcare issues within their own households and families, thus building motivation to learn data analysis techniques using Excel. In order to foster discus-sion during the data analysis, it is best to place students in groups. Each group should have at least one student proficient in Excel.
Activity OverviewThis project should be assigned about 4–5 weeks into the semester, after linear equations have been covered. Give students about two weeks to complete the project, preferably working in groups(2–3students/group).
Week4,Period1:AfterLesson9(ApplicationsofLinearFunctions),distributeanddiscussthereading“HealthCareFacts:Costs.”Encouragestudentstodofurtherresearchonthetopiconline.
Week5,Period1:Consultwithstudentsontheirprojectsandreviewnumericalresults.
Week5,Period2:Studentsdiscusstheirprojects,includingwrittenreflectionsbasedontheiranalyses, with the instructor. The final assignment is due the following week.
Math Topic Application of linear equations
Purpose Review of math topic
When to Introduce Week 4–5
Activity Time Frame One class discussion period. Due in 2 weeks
MAT115 Supplement

s.2 LaGuardia Community College/CUNY – Project Quantum Leap
Modeling Data Related to Health Care in the U.S.
Materials and Resources• Handout
• Reading:NationalCoalitiononHealthCare.(2009,September).Health care facts: Costs. RetrievedJanuary28,2011fromhttp://nchc.org/sites/default/files/resources/Fact%20Sheet%20-%20Cost.pdf
• TheNationalHealthInterviewSurvey(NHIS),CDC.(2009,March)Family core component of the 1997–2008 NHIS.RetrievedJanuary28,2011,fromhttp://www.cdc.gov/nchs/data/nhis/earlyrelease/200709_11.pdf
• NationalAssociationofChainDrugStores,Alexandria,VA,NACDS Foundation Chain Phar-macy Industry Profile, 2008(copyright);<http://www.nacds.org>.Retailprescriptiondrugsales:1995to2008.RetrievedJanuary28,2011,fromHttp://www.census.gov/compendia/statab/2010/tables/10s0153.pdf.
s.3
Modeling Data Related to Health Care in the U.S.
Handout West | College Algebra and Trigonometry – Business and Finance (MAT115)
Analysis:
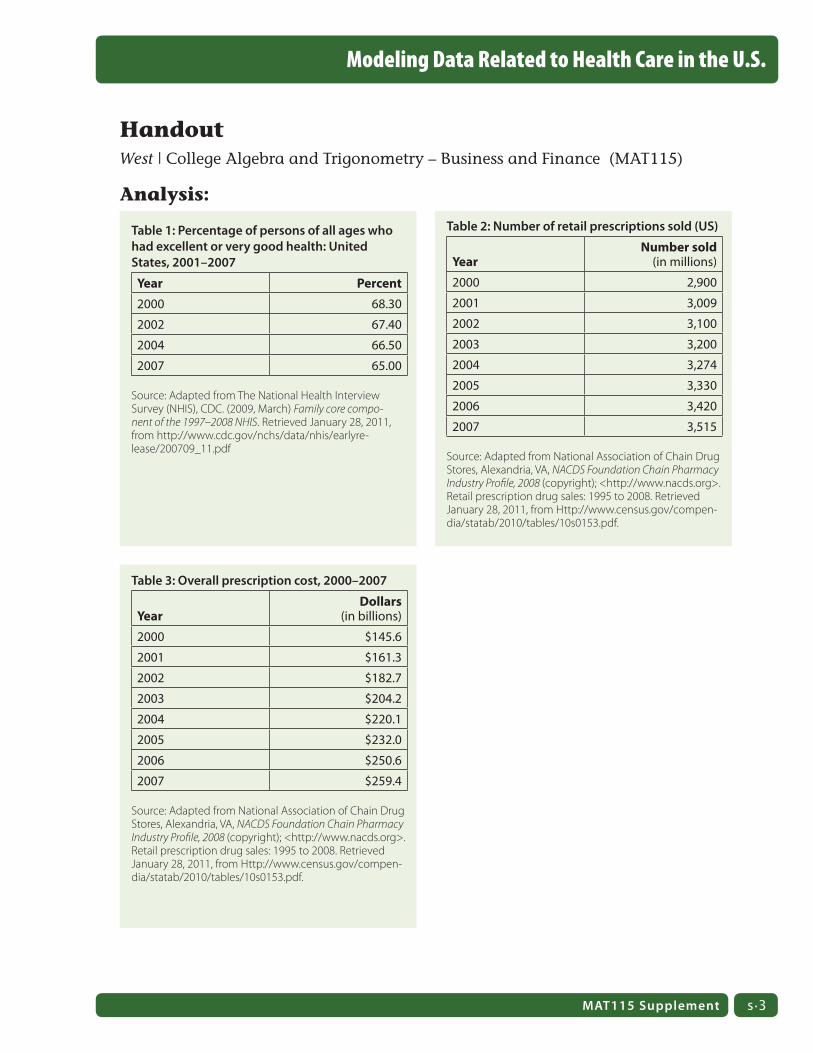
Table 1: Percentage of persons of all ages who had excellent or very good health: United States, 2001–2007
Year Percent
2000 68.30
2002 67.40
2004 66.50
2007 65.00
Source: Adapted from The National Health Interview Survey (NHIS), CDC. (2009, March) Family core compo-nent of the 1997–2008 NHIS. Retrieved January 28, 2011, from http://www.cdc.gov/nchs/data/nhis/earlyre-lease/200709_11.pdf
Table 2: Number of retail prescriptions sold (US)
Year
Number sold (in millions)
2000 2,900
2001 3,009
2002 3,100
2003 3,200
2004 3,274
2005 3,330
2006 3,420
2007 3,515
Source: Adapted from National Association of Chain Drug Stores, Alexandria, VA, NACDS Foundation Chain Pharmacy Industry Profile, 2008 (copyright); <http://www.nacds.org>. Retail prescription drug sales: 1995 to 2008. Retrieved January 28, 2011, from Http://www.census.gov/compen-dia/statab/2010/tables/10s0153.pdf.
Table 3: Overall prescription cost, 2000–2007
Year
Dollars (in billions)
2000 $145.6
2001 $161.3
2002 $182.7
2003 $204.2
2004 $220.1
2005 $232.0
2006 $250.6
2007 $259.4
Source: Adapted from National Association of Chain Drug Stores, Alexandria, VA, NACDS Foundation Chain Pharmacy Industry Profile, 2008 (copyright); <http://www.nacds.org>. Retail prescription drug sales: 1995 to 2008. Retrieved January 28, 2011, from Http://www.census.gov/compen-dia/statab/2010/tables/10s0153.pdf.
MAT115 Supplement
s.4 LaGuardia Community College/CUNY – Project Quantum Leap
Modeling Data Related to Health Care in the U.S.
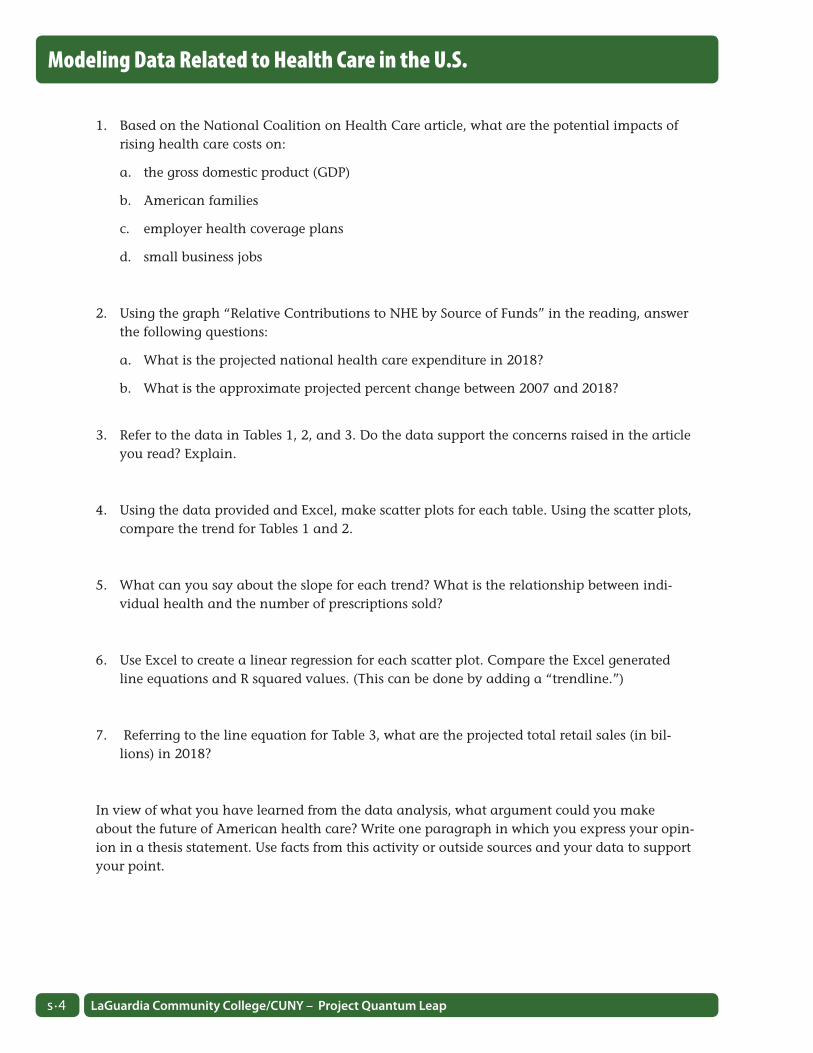
1. Based on the National Coalition on Health Care article, what are the potential impacts of risinghealthcarecostson:
a. the gross domestic product (GDP)
b. American families
c. employer health coverage plans
d. small business jobs
2. Using the graph “Relative Contributions to NHE by Source of Funds” in the reading, answer thefollowingquestions:
a. What is the projected national health care expenditure in 2018?
b. What is the approximate projected percent change between 2007 and 2018?
3. Refer to the data in Tables 1, 2, and 3. Do the data support the concerns raised in the article you read? Explain.
4. Using the data provided and Excel, make scatter plots for each table. Using the scatter plots, compare the trend for Tables 1 and 2.
5. What can you say about the slope for each trend? What is the relationship between indi-vidual health and the number of prescriptions sold?
6. Use Excel to create a linear regression for each scatter plot. Compare the Excel generated line equations and R squared values. (This can be done by adding a “trendline.”)
7. Referring to the line equation for Table 3, what are the projected total retail sales (in bil-lions) in 2018?
In view of what you have learned from the data analysis, what argument could you make about the future of American health care? Write one paragraph in which you express your opin-ion in a thesis statement. Use facts from this activity or outside sources and your data to support your point.

s.5
Modeling Data Related to Health Care in the U.S.
Reading: Health Care Facts: Costs West | College Algebra and Trigonometry – Business and Finance (MAT115)
Source:TheNationalHealthInterviewSurvey(NHIS),CDC.(2009,March)Family core component of the 1997–2008 NHIS.RetrievedJanuary28,2011,fromhttp://www.cdc.gov/nchs/data/nhis/earlyrelease/200709_11.pdf
Health care spending continues to rise at a rapid rate forcing businesses to cut back on health insurance coverage and forcing many families to cut back on basic necessities such as food and electricity and, in some cases, shelters and homes.
Experts agree that our health care system is riddled with inefficiencies, excessive administrative expenses, inflated prices, poor management and inappropriate care, waste and fraud. These problems increase the cost of medical care associated with government health programs like Medicare and Medicaid, and health insurance for employers and workers and affect the security of families.
national Health Care Spending• NationalhealthexpendituresareexpectedtoincreasefasterthanthegrowthinGDP:
between 2008 and 2018, the average increase in national health expenditures is expected to be 6.2 percent per year, while the GDP is expected to increase only 4.1 percent per year.
• Injustthreeyears,theMedicareandMedicaidprogramswillaccountfor50percentofallnational health spending.
• Medicare’sHospitalInsurance(HI)TrustFundisexpectedtopayoutmoreinhospitalben-efits and other expenditures this year than it receives in taxes and other dedicated revenues. In addition, the Medicare Supplementary Medical Insurance (SMI) Trust Fund that pays for physician services and the prescription drug benefit will continue to require general revenue financing and charges on beneficiaries that will grow substantially faster than the economy and beneficiary incomes over time.
Relative Contributions to NHE by Source of Funds, 1999 to 2018 (in billions)
Note: First projected year is 2008
Source: Centers for Medicare and Medicaid Services, Office of the Actuary, National Health Statistics Group, athttp://www.cms.hhs.gov/NationalHealthExpendData/03_NationalHealthAccountsProjected.asp# TopOfPage (see Project-ed; NHE Historical andprojections, 1965–2018, file nhe65–18.zip).
Other Private
Medicaid
Projected
$0
$500
$1,000
$1,500
$2,000
$2,500
$3,000
$3,500
$4,000
$4,500
$5,000
2000 2001 2002 2003 2004 2005 2006 2007 2008 2009 2010 2011 2012 2013 2014 2015 2016 2017 20181999
Private Health Insurance
Other Public
Medicare
Out of Pocket
MAT115 Supplement
s.6 LaGuardia Community College/CUNY – Project Quantum Leap
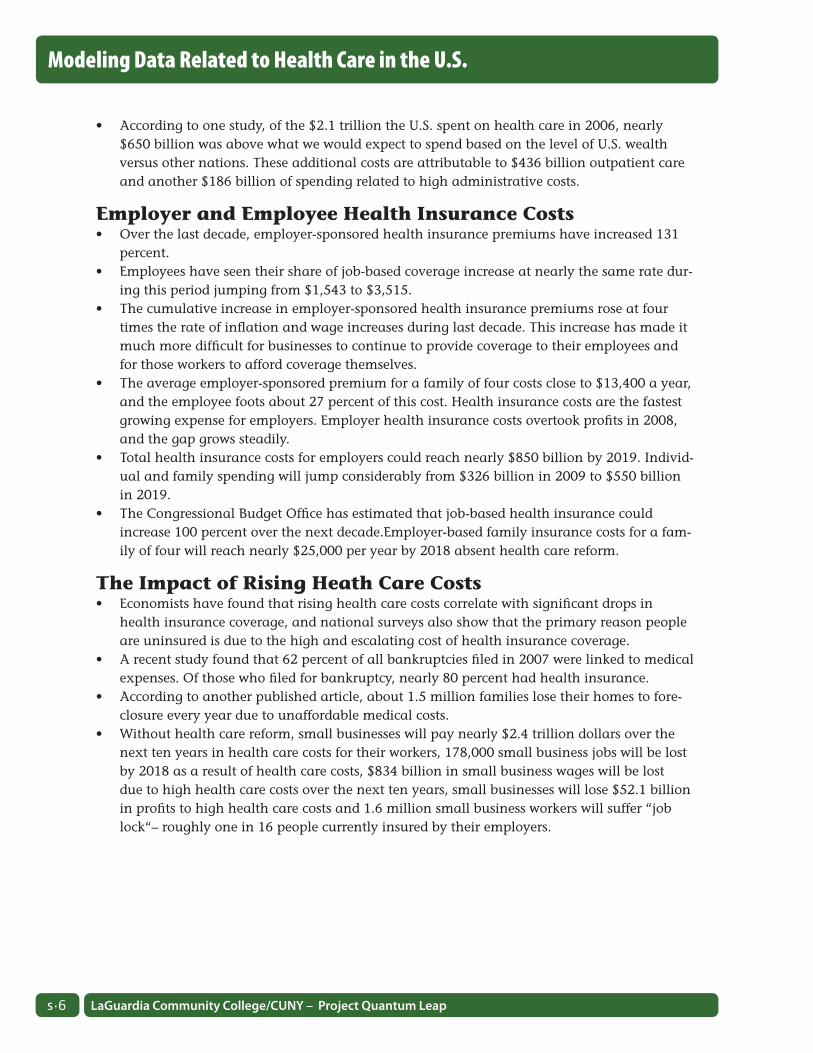
• Accordingtoonestudy,ofthe$2.1trilliontheU.S.spentonhealthcarein2006,nearly$650 billion was above what we would expect to spend based on the level of U.S. wealth versus other nations. These additional costs are attributable to $436 billion outpatient care and another $186 billion of spending related to high administrative costs.
Employer and Employee Health Insurance Costs • Overthelastdecade,employer-sponsoredhealthinsurancepremiumshaveincreased131
percent. • Employeeshaveseentheirshareofjob-basedcoverageincreaseatnearlythesameratedur-
ing this period jumping from $1,543 to $3,515. • Thecumulativeincreaseinemployer-sponsoredhealthinsurancepremiumsroseatfour
times the rate of inflation and wage increases during last decade. This increase has made it much more difficult for businesses to continue to provide coverage to their employees and for those workers to afford coverage themselves.
• Theaverageemployer-sponsoredpremiumforafamilyoffourcostscloseto$13,400ayear,and the employee foots about 27 percent of this cost. Health insurance costs are the fastest growing expense for employers. Employer health insurance costs overtook profits in 2008, and the gap grows steadily.
• Totalhealthinsurancecostsforemployerscouldreachnearly$850billionby2019.Individ-ual and family spending will jump considerably from $326 billion in 2009 to $550 billion in 2019.
• TheCongressionalBudgetOfficehasestimatedthatjob-basedhealthinsurancecouldincrease 100 percent over the next decade.Employer-based family insurance costs for a fam-ily of four will reach nearly $25,000 per year by 2018 absent health care reform.
The Impact of Rising Heath Care Costs• Economistshavefoundthatrisinghealthcarecostscorrelatewithsignificantdropsin
health insurance coverage, and national surveys also show that the primary reason people are uninsured is due to the high and escalating cost of health insurance coverage.
• Arecentstudyfoundthat62percentofallbankruptciesfiledin2007werelinkedtomedicalexpenses. Of those who filed for bankruptcy, nearly 80 percent had health insurance.
• Accordingtoanotherpublishedarticle,about1.5millionfamilieslosetheirhomestofore-closure every year due to unaffordable medical costs.
• Withouthealthcarereform,smallbusinesseswillpaynearly$2.4trilliondollarsoverthenext ten years in health care costs for their workers, 178,000 small business jobs will be lost by 2018 as a result of health care costs, $834 billion in small business wages will be lost due to high health care costs over the next ten years, small businesses will lose $52.1 billion in profits to high health care costs and 1.6 million small business workers will suffer “job lock“– roughly one in 16 people currently insured by their employers.
Modeling Data Related to Health Care in the U.S.

s.7
Modeling Data Related to Health Care in the U.S.
References1. Siska,A,etal,HealthSpendingProjectionsThrough2018:RecessionEffectsAddUncertainty
to The Outlook. Health Affairs,March/April2009;28(2):w346–w357.
2. A Summary of the 2009 Annual Reports, Social Security and Medicare Boards of Trustees, 2009.
3. McKinsey&Company,AccountingfortheCostofU.S.HealthCare–ANewLookonWhyAmericans Spend More. McKinsey & Company, 2007
4. The Henry J. Kaiser Family Foundation. Employee Health Benefits: 2009 Annual Survey. Sep-tember 2009.
5. McKinsey and Company. The McKinsey Quarterly Chart Focus Newsletter, “Will Health Benefit Costs Eclipse Profits,” September, 2004 and updated by Eric Jensen, Senior Fellow, McKinsey and Company at National Coalition on Health Care Forum on National Health Care Reform and Its Potential Impacts on New York, May 27, 2009.
6. HealthReform:TheCostofFailure.TheRobertWoodJohnsonFoundation,May2009.
7. Congressional Budget Office, “Taxes and Health Insurance,” February 29, 2008.
8. The Henry J. Kaiser Family Foundation. The Uninsured: A Primer, Key Facts About Americans without Health Insurance. 2009. April 2009.
9. Himmelstein,D,E.,etal,“MedicalBankruptcyintheUnitedStates,2007:ResultsofaNational Study. American Journal of Medicine, May 2009.
10.Robertson,C.T.,etal.“GetSick,GetOut:TheMedicalCausesofHomeMortgageForeclo-sures,” Health Matrix, 2008.
11. The Economic Impact of Healthcare Reform on Small Business, Small Business Majority, June 2009.
MAT115 Supplement


s.9
Commodity Prices: Who Controls the Price of Food?Reem Jaafar and Yelena BaishanskiDepartment of Mathematics, Engineering, and Computer Science
Objectives The primary objective of this project is to help students understand the concept of commodities and the impact of commodity prices on the quality of life in various nations around the world. This is also a lesson on fitting data points and extracting various quantities from linear, quadratic, and exponential models. Linear functions are encountered from Lesson 2 to Lesson 13 in the syllabus of College Algebra and Trigonom-etry(MAT115);quadraticfunctionsareencounteredin Lessons 20 to 25, and exponential functions are encountered in Lessons 31 and 32. This lesson can be introduced any time after the linear and quadratic functions are covered.
Through this activity, students are expected to achieve thefollowing:• Readnewsarticlesaboutcommoditiesandfood
prices;• Understandthefactorsthatdeterminethepricesoffoodandhowthepricesoffoodcan
affecttherestoftheworld;• Thinkcriticallyaboutwhoreallybenefitsfromhighcommodityprices;• PlotasetofdatainExcelandfitthepointstoalinearfunction.Findtheslopeandequa-
tion of the linear function and use these to predict or estimate other data points. Plot a set of data in Excel, fit the points to a quadratic function, and use the quadratic function to estimateorpredictotherdatapoints;and,
• Forextracredit,studentscanplotasetofdatainExcelandfitthepointstoanexponentialfunction
ReflectionThis challenging project introduces students to the concept of “commodities.” Students inves-tigate how commodity futures are traded, studying price fluctuations of various commodities over the last two decades. They examine the graphs of various commodity prices over time, and extract information and patterns from the graphs.
They also read about the factors influencing food prices, as well as the real but unspoken social consequences of spikes in food prices. Through a series of guided questions, students must think critically and draw conclusions as to who benefits from legislation or economic activity affecting food prices. Finally, students must formulate a well-supported argument as to whether commod-ity trading should be subject to public monitoring or regulation.
Math Topic Graphing linear equations, equation of a straight line, applications of linear and quadratic functions
Purpose Review, synthesis, reflection and analysis
When to Introduce Any time after Lesson 20
Activity Time Frame Two weeks
MAT115 Supplement

s.10 LaGuardia Community College/CUNY – Project Quantum Leap
Commodity Prices
You will need to spend time in the lab to help students with this activity. • First,ifyouhaven’tintroducedfittingusingExcel,dosothroughthisactivity.• Werecommendthatyoubrieflyexplaintheconceptofrateofchangeandaveragerateof
change, and perhaps review percent increase and decrease, before tackling Question 5. • Theactivityreliesongettingdatafromonlinesites.Thesitesarealltrustworthy,butyou
willhavetoshowthestudentshowtocopyonerowofdataintoeachExceltable;thestu-dents can then obtain and table the remaining data on their own. Time permitting, have students complete the table in the lab so that you can monitor for comprehension and accuracy.
• Beforestudentsdothereading,discussthecontentofthearticlestoseewhatstudentsalready know about commodities and to ensure better comprehension.
To synthesize project activities, we recommend some class discussion upon completion of Ques-tions 1–8. You may then use Question 9 to heighten students’ awareness of their own learning, and to encourage and guide students’ reflections on their ePortfolios.
When surveyed, some students complained that the project was a bit long and time consuming. To reduce the workload, you can make Reading #2 (Question 4) optional, and assign it for extra credit. It is also important that you allocate two lab hours to go over the project with the stu-dents. In the first lab hour, you can initiate a class discussion around Question #2 and explain Question #5 about percentage increase and how to predict future prices based on that. In the second lab hour, guide students through Questions 6 and 7 which involve graphing with Excel. As mentioned earlier, feel free to select from Questions 6, 7 or 7d.
Activity OverviewIn this project, students will engage in inquiry-based learning, collecting data about commodi-ties and food commodity trading. They will also read two articles about the practices and dev-astating effects of food speculation, and do two exercises on function fitting using commodity prices. Three problems are provided (one for linear, one for quadratic and one for exponential). As the instructor, you will decide how many and which problems to assign. This lends flexibility to the project, as it can be introduced either after Lesson 12 (linear fitting), Lesson 24 (quadratic fitting) or Lesson 32 (exponential fitting).
• Havestudentsconsultthetwogivenwebsites(http://www.investorwords.com,andhttp://www.indexmundi.com/commodities),tolearnwhatcommoditiesare.
• BeforemovingontoReading#1,havestudentsanswerQuestions1and2.Question2isadiscussion activity that will help to prepare students, in terms of vocabulary and concepts, for the readings and tasks that follow.
• HavestudentsreadReading#1:“Foodspeculation:‘Peoplediefromhungerwhilebanksmake a killing on food’” by John Vidal, The Guardian.Thisarticlecanbefoundathttp://www.guardian.co.uk/global-development/2011/jan/23/food-speculation-banks-hunger-pov-erty. Have students answer Question 3 in writing so that you can check their understanding, and see that they can compare and add information to their evolving understanding of the deregulation of food commodities trading after they have done Reading #2.
s.11
Commodity Prices
MAT115 Supplement
• HavestudentsreadReading#2:“RampantSpeculationInflatedFoodPriceBubble”by Stephen Leahy, IPS News.Thearticlecanbefoundathttp://ipsnews.net/news.asp?idnews=54274
• HavestudentsanswerQuestions4to7.TheiranswerstoQuestion4willdemonstratetheirunderstandingoftheconceptsdiscussedinthearticle;Questions5–7,includingtheOptional Extra Credit Question 7d., will demonstrate their ability to apply their mathemati-cal skills.
• Theessaywritingtaskwillrequirestudentstomarshalevidencefromthetworeadingsandthe mathematics in support of their opinions about the deregulation of food commodities trading. They should post this essay on their ePortfolios.
• Finally,theePortfolioreflectionwillpromptstudentstothinkabouttheirownlevelofpoliti-cal engagement, their own learning, and the ultimate usefulness of this project.
Materials and Resources• Handout:Studentsarealsoexpectedtoretrieveinformationfromonlinesitessuchas:
IndexMundi, “a data portal that gathers facts and statistics from multiple sources and turns themintoeasytousevisuals”(http://www.indexmundi.com/commodities),andInvestor-Words.com, a site that provides definitions, videos and other information related to invest-ing(http://www.investorwords.com).
• Reading#1:Vidal,John.(2011,January23).“Foodspeculation:‘Peoplediefromhungerwhile banks make a killing on food.’” The Guardian.RetrievedMarch2nd2011fromhttp://www.guardian.co.uk/global-development/2011/jan/23/food-speculation-banks-hunger-pov-erty
• Reading#2:Leahy,S.RampantSpeculationInflatedFoodPriceBubble.IPS News.net. RetrievedMarch2,2011fromhttp://ipsnews.net/news.asp?idnews=54274

s.12 LaGuardia Community College/CUNY – Project Quantum Leap
Commodity Prices
Handout: What Are Commodities? R. Jaafar and Y. Baishanski | College Algebra and Trigonometry – Business and Finance (MAT115)
Objectives• Tounderstandthedefinitionofcommodities• Tolearnaboutthefactorsthataffectcommodityprices• Tounderstandhowprocessesinvolvingcommoditiescaninfluencethelivesofpeople
around the world• Todeterminerelationshipsbetweenvariouscommodityprices• Tolearnhowtofitdata,extractvariousquantities,andunderstandcharts
Questions1. a. Paraphrase in writing the definition of “commodity” as shown at
http://www.investorwords.com.
b. Listthevariouscategoriesofcommoditiesdisplayedathttp://www.indexmundi.com/commodities.
2. Group/ClassDiscussiona. What does “speculation” mean? How is it different from “investment”?
b. What does “deregulation of global commodity markets” mean? Why do you think the U.S. would deregulate food commodity trading?
c. What do the following words mean? – staples– hoarding– subsidise (Br.) (subsidize, Am.)– sub-prime mortgage crisis– pension fund – hedge fund
3. AnswerthefollowingquestionsaboutReading#1,“Foodspeculation:‘Peoplediefromhun-gerwhilebanksmakeakillingonfood.’”inwriting:
a. What is hedging? Give an example.
b. What is “deregulation of global commodity markets”? Why do you think the U.S. deregulated food commodity trading?
c. How do experts at the UN explain the rise in food prices?
d. What theory does the author believe is behind the rise in food prices?
e. How did the speculation in food prices begin?
f. Why did the price of chocolate peak recently?

s.13
Commodity Prices
MAT115 Supplement
4. AnswerthefollowingquestionsaboutReading#2:“Rampantspeculationinflatedfoodpricebubble.”
a. What is the meaning of “bubble” in this reading?
b. The article illustrates “speculation on speculation” by examining how Farmer Brown’s wheat futures contract can now be sold and resold, itself becoming a commodity. Can you foresee any potential problem(s) caused by such increasing speculation?
c. Why did the U.S. deregulate food commodity trading? What was the result?
d. Why did food commodity speculation become a “hot ticket” in 2008?
e. After spikes in the price of food in 2008 caused deadly famine and riots around the world, the UN cited rising food prices as a top threat to global security. Why did food prices spike again in 2010?
f. Why did multinational grain companies in the business of exporting wheat want Russia to ban wheat exports in 2010?
g. According to GRAIN research, why weren’t wheat exporters penalized for cancelling their export contracts with Egypt, Bangladesh, and other countries?
5. The following three graphs illustrate the 15-year price fluctuations in wheat, natural gas andpoultry,respectively.Usethegraphstoanswerthequestionsbelow:
15-Year Price Fluctuation in Wheat U.S. dollars per metric ton
Source: IndexMundi.com. (n.d.) Wheat Daily Price. Retrieved March 2, 2011 from http://www.indexmundi.com/commodities/?commodity=wheat&months=180
Feb ‘9697.05
Feb ‘10Feb ‘07 Feb ‘08 Feb ‘09Feb ‘06Feb ‘05Feb ’04Feb ‘03Feb ‘02Feb ‘01Feb ‘00Feb ‘99Feb ‘97
461.71
352.31
388.78
425.24
315.84
297.38
242.91
206.45
169.98
133.52

s.14 LaGuardia Community College/CUNY – Project Quantum Leap
Commodity Prices
a. Based on the graphs, which of the three commodities would you say is the most vola-tile? Which commodity would you say has experienced the greatest increase in volatil-ity? Explain.
15-Year Price Fluctuation in Natural Gas U.S. dollars per thousand cubic meters of gas
Source: IndexMundi.com. (n.d.) Natural Gas Monthly Price - US Dollars per thousand cubic meters of gas. Retrieved March 2, 2011 from http://www.indexmundi.com/commodities/?commodity=natural-gas&months=1800
Feb ‘9658.88
Feb ‘10Feb ‘07 Feb ‘08 Feb ‘09Feb ‘06Feb ‘05Feb ’04Feb ‘03Feb ‘02Feb ‘01Feb ‘00Feb ‘99Feb ‘97
515.36
378.42
424.07
469.71
332.77
287.12
241.47
195.83
150.18
104.53
15-Year Price Fluctuation in Poultry U.S. cents per pound
Source: IndexMundi.com. (n.d.) Poultry (chicken) Daily Price. Retrieved March 2, 2011 from http://www.indexmundi.com/commodities/?commodity=chicken&months=180
Feb ‘9652.36
Feb ‘10Feb ‘07 Feb ‘08 Feb ‘09Feb ‘06Feb ‘05Feb ’04Feb ‘03Feb ‘02Feb ‘01Feb ‘00Feb ‘99Feb ‘97
92.99
80.80
84.86
88.93
76.74
72.68
68.61
64.55
60.49
56.43

s.15
Commodity Prices
MAT115 Supplement
b. Estimate the price per pound of poultry (rounding to nearest cent) in February of 1996 and 2011 respectively. What was the average yearly rate of change in the price of poul-try over this 15-year period? Based on this rate of change, how much will a pound of poultry cost in February 2012?
c. John argues that natural gas prices should not be subject to regulation because they are relatively stable:thepriceperthousandcubicmetersonlyincreasedfromapproximately$140 fifteen years ago to $160 today. Compute the corresponding percent increase in price. Does the graph support his claim?
d. Judy argues that natural gas prices are at least as volatile as those of wheat, and thus that both natural gas and wheat prices should be subject to regulation. She says wheat prices went from a low of approximately $160 per metric ton to a high of approxi-mately $440 over the last five years. Compute the corresponding percent increase in price.
e. ClassDiscussion:What’syourpositionontheregulationofcommodities?Doyouagreewith John or Judy? Are commodity prices stable or volatile? Should they be monitored and regulated by an independent body? Find information from these graphs or others athttp://www.indexmundi.com/commoditiestosupportyourpointofview.Takenotes.You will need these notes again for Exercise 8.
6. Exercise with Excel: Linear Fit The following table shows the average monthly price of cocoa beans, in U.S. dollars per metric ton, between March 2009 and December 2009.
Average monthly price of cocoa beansU.S. dollars per metric ton
Mar 2009 2,493.98
Apr 2009 2,541.70
May 2009 2,554.60
Jun 2009 2,699.61
Jul 2009 2,805.48
Aug 2009 2,956.66
Sep 2009 3,149.51
Oct 2009 3,372.50
Nov 2009 3,379.33
Dec 2009 3,517.54
Source: IndexMundi.com. (n.d.) Cocoa Beans Monthly Price – US Dollars per Metric Ton. Retrieved March 2, 2011 from http://www.indexmundi.com/commodities/?commodity=cocoa-beans&months=180
s.16 LaGuardia Community College/CUNY – Project Quantum Leap
Commodity Prices
a. Using Excel and starting with March 2009 as month #0, graph the price of cocoa beans asafunctionofthenumberofeachmonth(March2009=0,April2009=1,etc.).
b. Fit the data to a linear function. Write the equation that the data fits to. Find the slope.
c. If the trend had continued, what would the price of cocoa beans have been in February 2010?
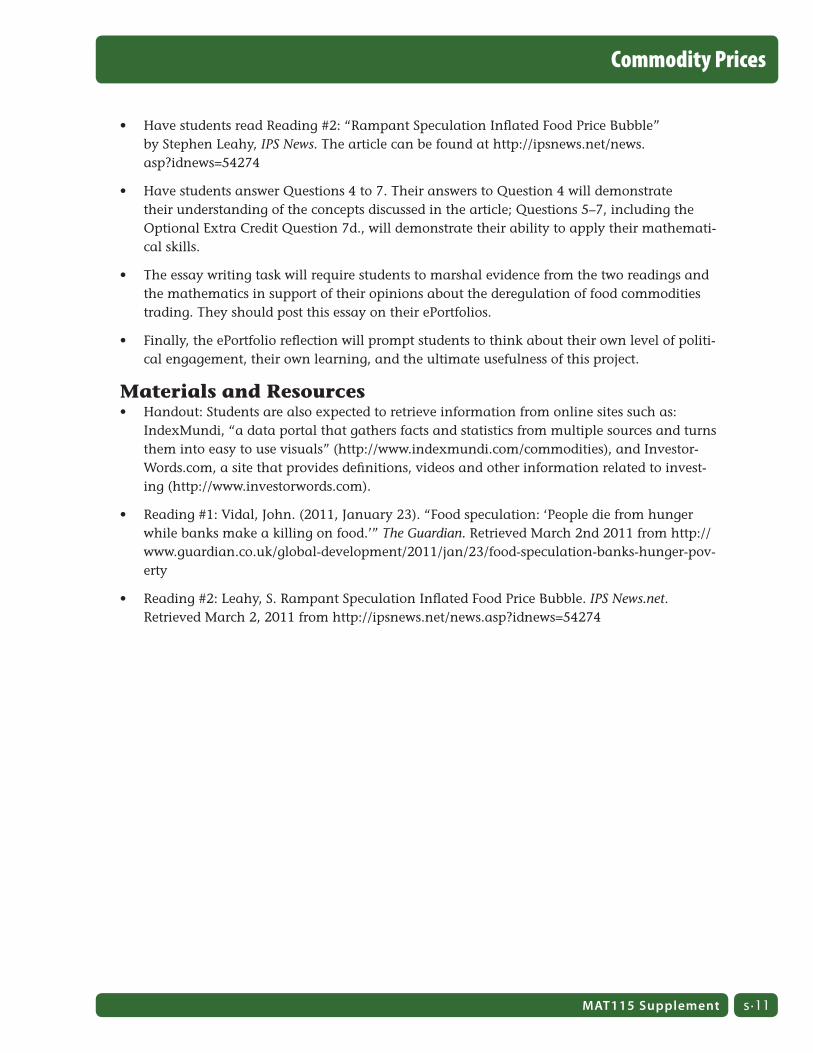
Exercise with Excel: Quadratic Fit The following table shows the average monthly price of coconut oil, in U.S. dollars per met-ric ton, between August 2009 and January 2011.
a) Using Excel and starting with August 2009 as month #0, graph the price of coconut oil asafunctionofthenumberofeachmonth(August2009=0,September2009=1,etc.)
b) Fit the data to a quadratic function (on Excel, use polynomial of order 2). Write the resulting equation.
c) If the trend had continued, what would the price of coconut oil have been in July 2011?
Average monthly price of coconut oilU.S. dollars per metric ton
Aug 2009 747.00
Sep 2009 701.00
Oct 2009 706.00
Nov 2009 729.00
Dec 2009 768.00
Jan 2010 784.00
Feb 2010 798.00
Mar 2010 921.00
Apr 2010 939.00
May 2010 932.00
Jun 2010 993.00
Jul 2010 1,031.00
Aug 2010 1,170.00
Sep 2010 1,275.00
Oct 2010 1,412.00
Nov 2010 1,521.30
Dec 2010 1,715.00
Jan 2011 2,063.00
Source: IndexMundi.com. (n.d.) Coconut Oil Monthly Price – US Dollars per Metric Ton. Retrieved March 2, 2011 from http://www.indexmundi.com/commodities/?commodity=coconut-oil&months=180

s.17
Commodity Prices
MAT115 Supplement
7d. Extra Credit. Exponential fit Commodities are traded daily, their prices changing by milliseconds, just like the prices ofstocksinthestockmarket.Commoditiesfallintoseveralcategories:energy,beverages,cereals, fruits, meat, sugar, vegetable oils, etc. Commodities include many food categories, prompting debate as to whether the prices of commodities should be allowed to fluctuate without control. When the prices of such commodities as wheat or sugar increase dramati-cally, many in developing countries are left without access to food. The following table shows the average monthly price of cocoa beans, in U.S. dollars per metric ton, between June 2001 and October 2002.
a. Using Excel and starting with June 2001 as month #0, graph the price of cocoa beans as afunctionofthenumberofeachmonth(June2001=0,July2001=1,etc.)
b. Fit the data to an exponential function. Write the resulting equation.
c. If the trend had continued, what would the price of cocoa beans have been in February 2003?
Average monthly price of cocoa beansU.S. dollars per metric ton
Jun 2001 973.29
Jul 2001 965.32
Aug 2001 1,032.48
Sep 2001 1,026.20
Oct 2001 1,084.86
Nov 2001 1,231.55
Dec 2001 1,337.43
Jan 2002 1,385.93
Feb 2002 1,490.39
Mar 2002 1,592.03
Apr 2002 1,568.15
May 2002 1,604.70
Jun 2002 1,656.46
Jul 2002 1,872.00
Aug 2002 1,959.27
Sep 2002 2,167.41
Oct 2002 2,201.50
Source: IndexMundi.com. (n.d.) Cocoa Beans Monthly Price – US Dollars per Metric Ton. Retrieved March 2, 2011 from http://www.indexmundi.com/commodities/?commodity=cocoa-beans&months=180

s.18 LaGuardia Community College/CUNY – Project Quantum Leap
Commodity Prices
7. Writing Task: This project has shown you the results of the deregulation of food commodities trading. Do you think the trading of food commodities should be monitored and regulated by an inde-pendent agency, or do you think deregulation is preferable? Write an essay expressing your opinion. To strengthen your argument, refer to the ideas exchanged during the class discus-sion (see Question 5e), to the readings, and to the graphs in Exercise 4 or other graphs at http://www.indexmundi.com/commodities.Supportyourpointofviewwithspecificdetails.
8. ePortfolio Reflection
a. Has this activity affected your social concerns, political awareness or engagement in any way? If so, how? Will your own behavior be affected by this class activity? If so, how?
b. Before you graphed the tabled data in questions 6 and 7, what would you have pre-dicted as future prices of coconut oil and cocoa beans?
c. What do you see in the graphs that you didn’t see in the tabled data in questions 6 and 7?
d. Why do you suppose this project asked you to identify equations of graphs? Why is it useful to recognize equations from a given graph?
e. Why might it be useful to do the reverse—to be able to graph a given equation?
s.19
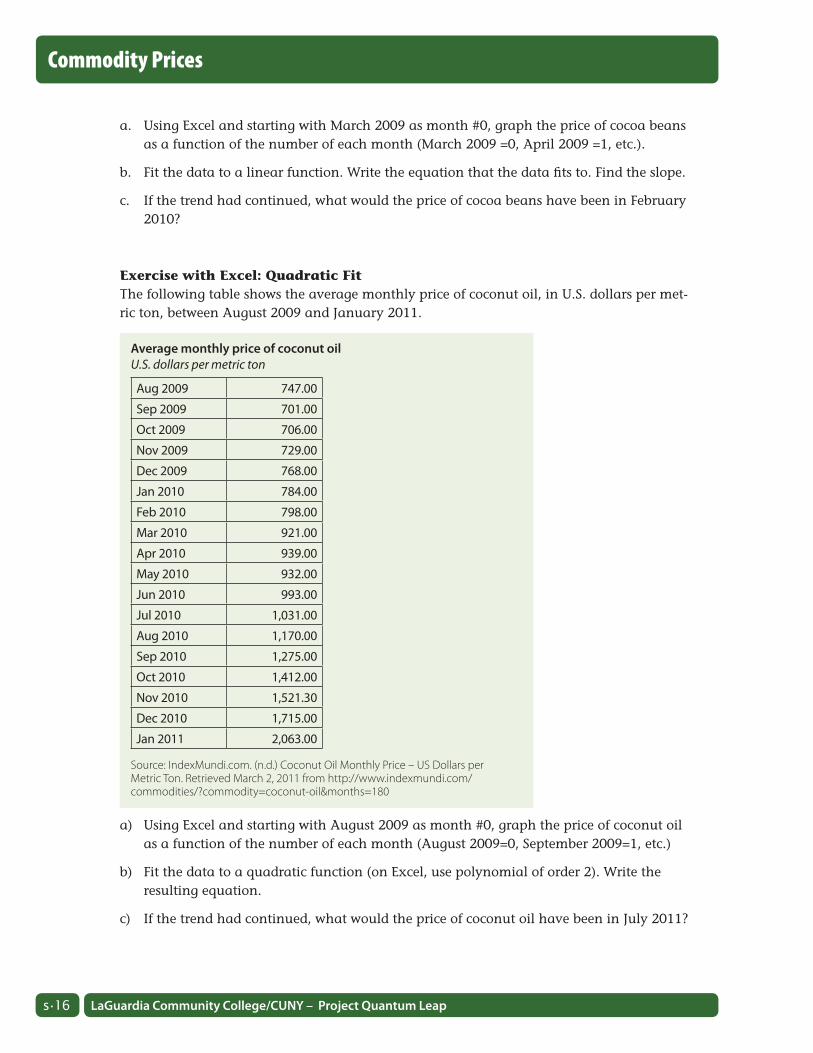
Reading #1: Food Speculation: “People die from hunger while banks make a killing on food” R. Jaafar and Y. Baishanski | College Algebra and Trigonometry – Business and Finance (MAT115)
Source:JohnVidal(2011,January23rd).FoodSpeculation:‘Peoplediefromhungerwhilebanksmake a killing on food’. Guardian.RetrievedMarch2nd2011fromhttp://www.guardian.co.uk/global-development/2011/jan/23/food-speculation-banks-hunger-poverty
It’s not just bad harvests and climate change – it’s also speculators that are behind record prices. And it’s the planet’s poorest who pay
Just under three years ago, people in the village of Gumbi in western Malawi went unexpectedly hungry. Not like Europeans do if they miss a meal or two, but that deep, gnawing hunger that prevents sleep and dulls the senses when there has been no food for weeks.
Oddly, there had been no drought, the usual cause of malnutrition and hunger in southern Africa, and there was plenty of food in the markets. For no obvious reason the price of staple foods such as maize and rice nearly doubled in a few months.
Unusually, too, there was no evidence that the local merchants were hoarding food. It was the same story in 100 other developing countries. There were food riots in more than 20 countries and govern-ments had to ban food exports and subsidise staples heavily.
The explanation offered by the UN and food experts was that a “perfect storm” of natural and human factors had combined to hyper-inflate prices. US farmers, UN agencies said, had taken millions of acres of land out of production to grow biofuels for vehicles, oil and fertiliser prices had risen steeply, the Chinese were shifting to meat-eating from a vegetarian diet, and climate-change linked droughts
Illustration: Katie Edwards
Commodity Prices
MAT115 Supplement

s.20 LaGuardia Community College/CUNY – Project Quantum Leap
Commodity Prices
were affecting major crop-growing areas. The UN said that an extra 75m people became malnourished because of the price rises.
But a new theory is emerging among traders and economists. The same banks, hedge funds and financiers whose speculation on the global money markets caused the sub-prime mortgage crisis are thought to be causing food prices to yo-yo and inflate. The charge against them is that by taking advantage of the deregulation of global commodity markets they are making billions from speculating on food and causing misery around the world.
As food prices soar again to beyond 2008 levels, it becomes clear that everyone is now being affected. Food prices are now rising by up to 10% a year in Britain and Europe. What is more, says the UN, prices can be expected to rise at least 40% in the next decade.
There has always been modest, even welcome, speculation in food prices and it traditionally worked like this. Farmer X protected himself against climatic or other risks by “hedging”, or agreeing to sell his crop in advance of the harvest to Trader Y. This guaranteed him a price, and allowed him to plan ahead and invest further, and it allowed Trader Y to profit, too. In a bad year, Farmer X got a good return but in a good year Trader Y did better.
When this process of “hedging” was tightly regulated, it worked well enough. The price of real food on the real world market was still set by the real forces of supply and demand.
But all that changed in the mid-1990s. Then, following heavy lobbying by banks, hedge funds and free market politicians in the US and Britain, the regulations on commodity markets were steadily abolished. Contracts to buy and sell foods were turned into “derivatives” that could be bought and sold among traders who had nothing to do with agriculture. In effect a new, unreal market in “food speculation” was born. Cocoa, fruit juices, sugar, staples, meat and coffee are all now global com-modities, along with oil, gold and metals. Then in 2006 came the US sub-prime disaster and banks and traders stampeded to move billions of dollars in pension funds and equities into safe commodities, and especially foods.
“We first became aware of this [food speculation] in 2006. It didn’t seem like a big factor then. But in 2007/8 it really spiked up,” said Mike Masters, fund
manager at Masters Capital Management, who testi-fied to the US Senate in 2008 that speculation was driving up global food prices. “When you looked at the flows there was strong evidence. I know a lot of traders and they confirmed what was happening. Most of the business is now speculation – I would say 70-80%.”
Masters says the markets are now heavily dis-torted by investment banks: “Let’s say news comes about bad crops and rain somewhere. Normally the price would rise about $1 [a bushel]. [But] when you have a 70-80% speculative market it goes up $2-3 to account for the extra costs. It adds to the volatility. It will end badly as all Wall Street fads do. It’s going to blow up.”
The speculative food market is truly vast, agrees Hilda Ochoa-Brillembourg, president of the Strate-gic Investment Group in New York. She estimates speculative demand for commodity futures has increased since 2008 by 40-80% in agricultural futures.
But the speculation is not just in staple foods. Last year, London hedge fund Armajaro bought 240,000 tonnes, or more than 7%, of the world’s stocks of cocoa beans, helping to drive chocolate to its highest price in 33 years. Meanwhile, the price of coffee shot up 20% in just three days as a direct result of hedge funds betting on the price of coffee falling.
Olivier de Schutter, UN rapporteur on the right to food, is in no doubt that speculators are behind the surging prices. “Prices of wheat, maize and rice have increased very significantly but this is not linked to low stock levels or harvests, but rather to traders reacting to information and speculating on the markets,” he says.
“People die from hunger while the banks make a killing from betting on food,” says Deborah Doane, director of the World Development Movement in London.
The UN Food and Agriculture Organisation remains diplomatically non-committal,saying, in June, that: “Apart from actual changes in supply and demand of some commodities, the upward swing might also have been amplified by specula-tion in organised future markets.”
The UN is backed by Ann Berg, one of the world’s most experienced futures traders. She argues that differentiating between commodities futures

s.21
Commodity Prices
MAT115 Supplement
markets and commodity-related investments in agriculture is impossible.
“There is no way of knowing exactly [what is happening]. We had the housing bubble and the credit default. The commodities market is another lucrative playing field [where] traders take a fee. It’s a sensitive issue. [Some] countries buy direct from the markets. As a friend of mine says: ‘What for a poor man is a crust, for a rich man is a securitised asset class.’”

s.22 LaGuardia Community College/CUNY – Project Quantum Leap
Reading #2: Rampant Speculation Inflated Food Price Bubble R. Jaafar and Y. Baishanski | College Algebra and Trigonometry – Business and Finance (MAT115)
Source:Leahy,S.(2011,January28th).Rampantspeculationinflatedfoodpricebubble.IPS. RetrievedMarch2,2011fromhttp://ipsnews.net/news.asp?idnews=54274
UXBRIDGE, Canada, Jan 28, 2011 (IPS) – Bil-lions of dollars are being made by investors in a speculative “food bubble” that’s created record food prices, starving millions and destabilising countries, experts now conclude.
Wall Street investment firms and banks, along with their kin in London and Europe, were respon-sible for the technology dot-com bubble, the stock market bubble, and the recent U.S. and UK housing bubbles. They extracted enormous profits and their bonuses before the inevitable collapse of each.
Now they’ve turned to basic commodities. The result? At a time when there has been no significant change in the global food supply or in food demand, the average cost of buying food shot up 32 percent from June to December 2010, according to the U.N. Food and Agriculture Organisation (FAO).
Nothing but price speculation can explain wheat prices jumping 70 percent from June to December last year when global wheat stocks were stable, experts say.
“There is no food shortage in the world. Food is simply priced out of the reach of the world’s poor-est people,” said Robert Fox of Oxfam Canada in reference to the estimated one billion people who go hungry.
“Hunger is not a food production problem. It is an income problem,” Fox told IPS.
The conditions that created the 2007-08 price hike and food riots have not changed, he said. It is no surprise to see record-high food prices and riots again in Egypt, Algeria, Jordan and elsewhere.
Weather used to be the big determinant of food prices, but not anymore. Trillions of dollars have been pumped into food commodities markets in the last few years thanks to deregulation of commodi-ties trading in the U.S., reports Olivier De Schutter, the United Nations Special Rapporteur on the Right to Food.
In an analysis of the food price crisis of 2007-08,
De Schutter documents how the U.S. government passed legislation in 2000 deregulating the food commodity markets and for the first time permitted speculation on speculation.
Here’s how it used to work. In January, Farmer Brown would sign a contract to sell his 2011 future crop to a grain trader like industry giant Cargill for 100 dollars a tonne. In the fall, Cargill would then sell Farmer Brown’s grain at whatever price they could get to a bakery or feedlot company for cattle. These “futures” contracts insulated both the farmer and the grain trader from wild price fluctuations.
Now, after the passage of the U.S. Commodity Futures Modernisation Act in 2000, Cargill could sell Farmer’s Brown “futures” contract to an invest-ment bank on Wall Street for 120 dollars a tonne, who could in turn sell it to a European investment company for 150 dollars a tonne and then sell it to a U.S. public pension fund for 175 dollars a tonne and so on. Add in some complex financial instruments like ‘derivatives’, ‘index funds’, ‘hedges’, and ‘swaps’, and food become part of yet another highly-profit-able speculative bubble.
A deeply-flawed global financial system was largely responsible for the 2007–08 food crisis, concluded De Schutter in a September 2010 briefing note.
“Speculators increasingly entered the market in order to profit from short-term changes in price,” wrote agricultural economist Jayati Ghosh, in a more recent analysis of the 2007-08 food price spike.
With the pending implosion of “the U.S. housing finance market, large investors, especially institu-tional investors such as hedge funds and pension funds and even banks, searched for other avenues of investment to find new sources of profit,” said Ghosh, a professor at Jawaharlal Nehru University in New Delhi in the Journal of Agrarian Change.
Food commodity speculation became the “hot ticket” and unregulated trading zoomed from 0.77
Commodity Prices

s.23
Commodity Prices
MAT115 Supplement
trillion dollars in 2002 to seven trillion dollars in 2007. Food prices shot upwards until the speculators took their profits in the first half of 2008 to cover their losses in the U.S. housing and other markets, she concluded. By the fall of 2008 prices stabilised but remained substantially higher than they were before the speculative bubble.
“At the end of December 2008, the FAO esti-mated that 33 countries were experiencing severe or moderate food crises, with conditions in at least 17 countries worse compared to October 2008,” Ghosh said.
And 2008 was a year of record grain production internationally.
Now there is a new and bigger food price bubble that began midway through 2010. It’s no surprise since nothing was done to change the conditions, Ghosh wrote. Regulations that could prevent or at least limit such speculative financial activity are not in place. The 2010–11 food price bubble is blamed on last summer’s Russian drought and increased consumption by India and China. However, FAO figures clearly show grain consumption by those lat-ter two countries has actually fallen, mainly because many simply can’t afford to buy as much grain, Ghosh told IPS in an email interview. In India, there has also been “diet shifts to more vegetables and dairy products”, she said.
The Russian drought simply sparked this latest speculative bubble. Russia did lose 33 percent of its wheat harvest, but it had plenty of wheat stocks on
hand to make up the difference. Instead of using those stocks, the Russian government was per-suaded by multinational grain companies to ban wheat exports.
That enabled those companies to break their low-price export contracts with Egypt, Bangladesh and other countries and sell their grain on the inflated domestic wheat market, says Devlin Kuyek of GRAIN, a small international non-profit organisa-tion that works to support small farmers.
“Big companies now control much of the Russian agriculture,” Kuyek said in an interview.
GRAIN has documented how foreign and local investors have set up huge, vertically integrated “agro-holdings”, particularly in the southern grain belt where they now control 40–50 percent of total grain production.
Russia is a major wheat exporter and Swiss-owned Glencore exports most of Russia’s wheat. However, GRAIN research reveals that Glencore lobbied to get an export ban allowing the company to cancel its low-price contracts without penalty.
To ease the ‘sting’ of the ban, Russia also prom-ised one billion dollars in low-interest loans and subsidies for grain producers.
“Countries like Egypt really got screwed and the grain traders made a killing,” Kuyek said.


s.25
Should You Take Out That Loan? A Lesson on Interest Rates and DebtReem JaafarDepartment of Mathematics, Engineering, and Computer Science
Objectives The purpose of this project is to help students under-standtheconceptofinterestrates;thatis,howinterestaccumulates over time, and the variables on which interest rates depend. This is also a lesson on linear modeling, fitting data points, and extracting various quantities from the linear model. Linear functions are encountered from Lessons 2 through 13 in the College Algebra and Trigonometry (MAT115) syllabus.
Throughthisactivity,studentsareexpectedto:• Readarticlesaboutcarloansandunderstandthe
componentsofaloan;• Readarticlesaboutstudentloansandunderstand
the long-term ramifications of the accumulation of hugedebt;
• Understandthebureaucracybehindstudentloansand engage in reflective writing on how the indus-trycanbefixed;
• PlotasetofdatainExcel,fitthepointstoalinearfunction,findtheslopeandwritetheequationofalinearfunction;and,
• Extractvariousquantitiesfromasetofdatafittoastraightline.
ReflectionTheaveragecreditcarddebtperhouseholdis:$15,788.
(Woolsey, B. and Schulz, M. (2011). Credit card statistics, industry facts, debt statistics. Credit-Cards.com CreditCards.com.RetrievedSept.4,2011fromhttp://www.creditcards.com/credit-card-news/credit-card-industry-facts-personal-debt-statistics-1276.php#ixzz1DIrEsXln.)
It is critical that students understand the impact of debt on their personal and financial lives. Students will enjoy learning about debt when the topic is presented through engaging, real life examples. To build student motivation for the project, you may want to begin by asking who among them owns a car and whether those students were aware of and understood the financ-ing options available to them when they purchased the car.
In Part II on student loans, Activities 8, 9 and 10 are self-explanatory, but they work best if you initiate a class discussion about student loans beforehand. For an exciting way to start the activ-ity, follow the directions in Step 1 and ask students to interpret the title of Reading #2, predict what it’s about, and discuss their opinions in general. After they have finished Reading #2, they can re-discuss their opinions based on the specific stories of the two couples.
Math Topic Graphing linear equations, equation of a straight line, applications of linear functions
Purpose Review, synthesis, reflection, and analysis
When to Introduce Anytime after lesson 18 (around week 5)
Activity Time Frame Two–three weeks
MAT115 Supplement

s.26 LaGuardia Community College/CUNY – Project Quantum Leap
Interest Rates and Debt
Students respond well to the content of this project. They may, however, complain about its length. It is therefore best to allow them an extra week to complete and submit their work. This project should help students read, analyze information and think critically. I also hope they will retain a few facts from their reading that will help them extend their understanding of the rela-tionship between interest rates and credit card debt, and encourage them to engage in sound financial behavior.
Activity OverviewThis project can be introduced at any time after Lesson 18, or around week 5. Since the project has two parts (Part I, related to car loans, Part II, to student loans), you should spend about two lab hours on the activity.
The activity relies on getting data from online sites. The sites are trustworthy but students ini-tially need to be shown how to copy and paste one row of data into each table. Time permitting, have students complete the table while in the lab to make sure they are on the right track.
During the first lab hour, guide students through Questions 1 to 5. Have them choose their dream cars. To fill in the various tables of Questions 4 and 5, students use an online calculator to estimate their payments. This helps them see the effect of interest rates on their monthly pay-ments. Once they realize that the total amount paid to the bank far exceeds the amount bor-rowed, students will also see the benefits of increasing their monthly payments, even by modest amounts.
In the next lab hour, wrap up the section on car loans. Have students complete question 6, in which they will use Excel to plot several data points related to the problem of financing a car.
You may need to spend about 15 minutes during the lab hour showing the students how to plot data in Excel. In Question 7, give students guidelines as to what you expect them to write in their letter to a friend planning to buy a car.
In Part II, students read several articles on student loans which reveal some alarming facts about the student loan industry. They answer questions about the articles and complete reflec-tive writing activities for each article.
It is preferable to have students upload the entire project into their ePortfolios, but if time is lack-ing, have them at least upload the writing task in Activity 10.
Materials and Resources:• Handout#1
• Handout#2
• Reading#1:PageDeaton,J.(2008,Aug15).Howtofinanceacarandgetacarloan.U.S. News and World Report.RetrievedFeb.14,2011fromhttp://usnews.rankingsandreviews.com/cars-trucks/How-to-Finance-a-Car
• Reading#2:Lieber,R.(2010,September3).Howdebtcandestroyabuddingrelationship.New York Times.RetrievedFebruary14,2011fromhttp://www.nytimes.com/2010/09/04/your-money/04money.html

s.27
Interest Rates and Debt
MAT115 Supplement
• Reading#3:Collins,G.(2009,May27).When Sallie Met Barack. New York Times. Retrieved Feb.14,2011fromhttp://www.nytimes.com/2009/05/28/opinion/28collins.html
• StudentsarealsoexpectedtogetsomeinformationfromonlinesitessuchasEdmunds.com,awebsitewithinformationabouttheautomotiveindustryandcarprices(http://www.Edmunds.com)andBankrate.com(http://www.bankrate.com).

s.28 LaGuardia Community College/CUNY – Project Quantum Leap
Interest Rates and Debt
Handout #1: Financing the American Dream or Living a Financial nightmare? R. Jaafar | College Algebra and Trigonometry – Business and Finance (MAT115)
ObjectivesThishandoutisbasedonReading#1:“Howtofinanceacarandgetacarloan,”byJamiePageDeaton, published in U.S. News and World Report.Thearticlecanbefoundathttp://usnews.rank-ingsandreviews.com/cars-trucks/How-to-Finance-a-Car/
ByreadingthisarticleandansweringQuestions1–7,youwilllearn:• basicfactsaboutfinancingandsecuringloans;
• howinterestratescanaffectmonthlypaymentsonloans;and,
• howmonthlypaymentsdependonthetermoftheloanandontheinterestrate.
Questions1. Go to www.edmunds.com
Search the car inventory and choose the car of your dreams. Write down the MSRP (Manu-facturer Suggested Retail Price) of your chosen car, and briefly explain why you chose this particular car.
2. Discussion:Whatisacarloan?Whatdoyoualreadyknowabouttheconditionsofcarloans?
3. Write your answers to the following questions regarding Reading #1. Then discuss your answers as a class.
a. When you pay back a loan, what does each of your payments include?
b. What does “loan term” mean?
c. When you take out a loan to buy a car, who owns the car? When do you take ownership of the car?
d. What happens if you miss a loan payment?
e. Does everyone get the same interest rate? What factors determine your interest rate?
f. What can you do to guard against dealer tricks?

s.29
4. $$ Your Financing Options $$ In this section, you will have to go online to determine the interest rate that applies when you finance your car. Let’s say you are unable to make a down payment on the car and you have to finance the full amount. • GettheMSRPofyourcar.• Gotohttp://www.bankrate.comandclickontheAutolink.• Clickon“FindanAutoLoanRate”andselectthepurchaseoption.• Selectyourcityandstate.• Ignorethelenderlistunderthesearchresultsandclickinsteadonthe“Calculator”
button. • Atthispointyouwillhavethe“AutoCalculator”onthescreen.
UsetheCalculatortodetermineyourmonthlypayment,basedona10%interestrate,for terms of 60 months (5years), 48 months (4 years), 36 months (3 years), 24 months (2 years), or 12 months (1 year). Fill in Table 1 below.
a. Compare the cost of financing the vehicle over 3 years (36 months) and over 5 years (60 months). How much money would you save in interest if you were to finance the vehicle over 3 years?
b. Mr. Smith just got his bonus and decided to pay for his car outright (in cash). How much money will he save in interest by paying outright as opposed to financing his car over 5 years?
Interest Rates and Debt
MAT115 Supplement
Table 1: Monthly payments and interest payments based on 10% interest rate for various loan terms
Monthly payment (at 10% interest rate)
Total interest paid by end of loan term
Total payment by end of loan term = MSRP +Total interest paid
60 months
48 months
36 months
24 months
12 months

s.30 LaGuardia Community College/CUNY – Project Quantum Leap
Interest Rates and Debt
5. A Lower Interest Rate As you know from your reading of the U.S. News and World Report article (Reading #1), the interest rate on a loan depends on your credit score. Suppose a friend of yours has a higher creditscoreandendsupgettinga6%interestrateonthecarthatyouwanttopurchase.Howmuchlesswouldyourfriendpayeachmonthat6%thanyouwouldpayat10%?Answer by filling in Table 2 below.
6. Exercise with Excel Suppose you decide to buy a new car for $30,000. Since you have no money for a down payment, you decide to take out a loan for the full amount, even though you know this will costyouextraininterestpayments.Unfortunately,theinterestrateisprettyhigh,at10%.Thedealeroffersseveralfinancingoptionsthroughalocalbank:financingthecarovera12-month, 24-month, 36-month, 48-month and 60-month period.
The table below shows the total interest you will have paid by the end of your loan’s term.
a. Using Excel, make a scatter plot of the total interest paid versus the term of the loan. Find the linear function that represents the total interest paid as a function of the term of the loan.
b. Assuming you financed the car, how much would you have paid in interest 30 months after purchasing the car? If the dealer were to offer you financing over 7 years, what would be the total interest paid after 7 years?
Table 2: Monthly Savings at 6% interest rate and various loan terms
Monthly payment at 6% interest rate
Monthly payment at 10% interest rate
Monthly savings
60 month
48 month
36 month
24 month
12 month
Total Interest Paid (in USD) by Term’s End
Term of Loan (# of months) Total Interest Paid by Term’s End (in USD)
12 months $ 1,649.72
24 months $3,224.35
36 months $4,848.56
48 months $6,522.12
60 months $8,244.68
Source: http://www.bankrate.com

s.31
Interest Rates and Debt
MAT115 Supplement
7) Your friend John is planning to finance a car. He is unsure about his budget, but thinks he can afford a $15,000 car. He has only $2,000 to put down and he earns about $1,500 a month after taxes. John contacts you for advice. What advice would you give him? Please write a 100–200 word letter to John, advising him on how much he should spend on a car, what interest rate he should try to get and how much he can afford in monthly payments.

s.32 LaGuardia Community College/CUNY – Project Quantum Leap
Interest Rates and Debt
Handout #2: Dreams of an Education R. Jaafar | College Algebra and Trigonometry – Business and Finance (MAT115)
IntroductionAs many of you well know, it is common for students to borrow money to finance their educa-tion. Many students borrow huge amounts of money and then struggle to repay their loans after graduation. One crucial reality is that you cannot default on a student loan. Student loans must be paid back, no matter what. In this part of the project, you will learn about the consequences of debt due to student loans.
DirectionsStep 1ClassDiscussion:Reading#2isentitled“Howdebtcandestroyabuddingrelationship.”(Lieber, R. (2010, September 3). How debt can destroy a budding relationship. New York Times. RetrievedFebruary14,2011fromhttp://www.nytimes.com/2010/09/04/your-money/04money.html)
What does this title mean? Predict what you think this article is about.
Step 2 Now read Reading #2 and answer the questions below in writing.
a. How much did Alison think she owed on her student loan and how much did the debt turn out to be? Why do you think her debt turned out to be higher than she thought?
b. Was Alison’s fiancé justified in his reaction to her debt?
c. How much does Ms. Tidwell owe on her student loan? What are her chances of repaying it?
d. Do you think that Mr. Kogler should still marry Ms. Tidwell?
e. Are these two stories about student loan debt different? How?
f. WritingTask:DoyouthinkthattheastronomicalcostofeducationintheUnitedStatesishaving a negative effect on marriage? Write a 200-word essay and use the examples pro-vided in Reading #2 to support your argument.
Step 3 Reading #3. “When Sallie Met Barack,” a New York TimesarticlebyGailCollins.http://www.nytimes.com/2009/05/28/opinion/28collins.html?adxnnl=1&adxnnlx=1313772044-//u5u65XUbA0XLSBhfsuYg,orhttp://www.nytimes.com/2009/05/28/opinion/28collins.html
After reading the article, answer the questions below in writing.
a Why is it almost impossible for students to work their way through college today?
b. What was the total amount borrowed in private student loans in 2008?
c. What happened to Travis and Stephanie Gay?
d. Name one deceptive marketing practice used by student loan providers

s.33
Interest Rates and Debt
MAT115 Supplement
Step 4GroupWorkandClassDiscussion:Workwithyourgrouptodecidewhattheauthor’sattitude is toward the way the federally guaranteed student loan system works. How do you know? Find examples in the reading that reveal Gail Collins’ opinion. Then share your ideas with the class.
Step 5 ePortfolio Writing Task. Write a well-organized essay that clearly states your opinion of the federally guaranteed student loan system. What do you personally think about the way the student loan system operates? Give examples to support your opinion. Your examples should addressthethreequestionslistedbelow:
a. Why doesn’t the government lend money to students directly through the federally guaran-teed loan system? What does “Sallie Mae” refers to?
b. Who benefits from this federally guaranteed student loan system? Who pays for it in the end?
c. Why is Senator Nelson of Nebraska against a change in the student loan system?
Youmayconcludeyouressaybyaddressingthisquestion:Ifyouhadthepowertochangethestudent loan system, what would you do?

s.34 LaGuardia Community College/CUNY – Project Quantum Leap
Interest Rates and Debt
Reading #1: How to Finance a Car and Get a Car Loan R. Jaafar | College Algebra and Trigonometry – Business and Finance (MAT115)
Source:PageDeaton,J.(2008,Aug15).Howtofinanceacarandgetacarloan.U.S. News and World Report.RetrievedFeb.14,2011fromhttp://usnews.rankingsandreviews.com/cars-trucks/How-to-Finance-a-Car
Let’s be honest: most people aren’t thinking about buying a new car now. The Great Recession has put new cars out of most people’s minds. But, if you really need a new car, you can get some great dis-counts and incentives. With the credit market still tight, the problem most people have is getting the financing to take advantage of the deals available.
Car financing is tricky even when the credit mar-ket is good. Now that the credit market is tight, it’s back to basics for buyers and lenders. Check out the car financing basics covered below to make sure you get the best car loan for your next vehicle.
The Basics of Car LoansGetting a car loan simply means borrowing money to pay for it. Borrowing money probably isn’t new to you -- everyone’s bummed $10 from friends. When you borrow from a lender, the amount you bor-row is called the loan principle. Though the basic idea behind borrowing money for a car is the same, when it comes time to pay the loan back, things get a little complicated.
Unless your friends don’t like you much, they’re not going to charge you interest on money you bor-row. But professional lenders will. A bank isn’t your friend and doesn’t lend money out of the goodness of its heart. It needs a financial incentive. That’s what interest provides for the lender: a financial incentive to lend money.
When you take out a loan for a car, it’ll come with an interest rate -- a certain percentage of a loan that you must pay back in addition to the original loan amount. So, if you borrow $20,000 for a car at a 5 percent interest rate, you’re going to end up paying the bank $21,000 over the life of the loan -- that’s the principle, plus the interest.
The Car Loan TermThe life of the loan, or loan term, simply refers to the amount of time you have to pay the lender back. If you sign up for a five-year term, in five years you’ll pay the money back and will own the car free and
clear. What the loan term doesn’t mean is that five years from now you’ll have to come up with all of the money. The vast majority of auto loans are repaid in monthly installments. You send the lender a set amount each month and slowly pay off the loan.
Most people think that when you finance a car, the finance company lends you the money and the car is yours. That’s a simple way of looking at it. In reality, however, the lender is buying the car and letting you use it. The lender technically owns the car, though you agree to be responsible for it. In fact, you won’t have the title to the car until you make your last loan payment. Miss loan payments and the lender repossess the car. Each payment you make buys you a little more of the car, but you don’t fully own it until the loan is paid off.
Now that you know the basics, you’re probably wondering how people can screw up financing a car. Believe it or not, there are plenty of ways.
Your Credit ScoreAll interest rates are not created equal. Some people get charged more interest, and some get charged less. Obviously, you want to get charged less. The interest rate lenders charge is based largely on your credit score -- a number that’s assigned to you based on how much other debt you have and how good you’ve been about paying bills on time. Lenders use the score to assess how likely you are to pay them back. If your score is low, they’ll think you’re not likely to repay the auto loan and charge you more money to cover that risk.
Young people often have lower credit scores than older people, even if they’ve been good about stay-ing out of debt and paying their bills. That’s because young people don’t have long credit histories, which makes it difficult for lenders to tell how much of a risk they are. As a result, people without long credit histories can be charged higher interest rates too.
You should know what your credit score is and

s.35
Interest Rates and Debt
MAT115 Supplement
do your best to make sure it’s high. For a small fee, you can get it through Equifax, Experian or Tran-sUnion. If your score is not as high as you’d like, paying off old bills (like credit card debt) and paying all bills on time (the full balance, not just the mini-mum due) for six to nine months should bring your score up and interest rate down.
Apply, Apply, ApplyYou wouldn’t just apply to one job or one college, so you shouldn’t apply to just one lender for a car loan. Contact your bank, local credit unions and other lenders to find out what they’re offering. You’ll have to fill out loan applications, which will ask for your employment history, income, expenses and debts. Do not be tempted to exaggerate your income or misstate your expenses. Everything you fill out on a loan application will be verified and lying will get you into serious trouble. The lender will pull your credit history and credit score and make you a loan offer based on that information.
Take some time to go over all the offers. Don’t just look at the interest rates -- avoid offers that charge you a lot of fees. Also, watch out for loans that have a prepayment penalty; that’s a charge that you’ll owe if you pay the loan off early. Paying the loan off early may not be something you’ll be able to do, but if your long-lost Aunt Maybel dies and leaves you a fortune, paying it off could save you a lot of money -- and you don’t want to pay extra to do it.
Don’t be Dejected about Getting RejectedDon’t feel too badly if your loan application is rejected. It’s probably a good thing. A rejected loan application means the lender didn’t think you’d be able to pay the money back. As hard as that is, that lender just saved you from getting into debt over your head. Try finding a less expensive car to buy, or saving up more money.
Show Up with FinancingMost car buyers assume that the car dealership always has the best financing deals. That’s not always the case. While you should certainly con-sider the loan the dealership offers, it’s a good idea to have an approved loan application from a bank or credit union when you go to the dealership. That way, you’ll know if the dealer is offering you a good financing deal, and you’ll have an alternative if they’re not.
Having financing all ready also means you’ll be protected from some dealer tricks. Some dealers will give you a great price on a car, but will charge you a higher interest rate on the loan, which will cost you more money in the long run. With financing in hand, you can focus on the price of the car.

s.36 LaGuardia Community College/CUNY – Project Quantum Leap
Reading #2: How Debt Can Destroy a Budding Relationship R. Jaafar | College Algebra and Trigonometry – Business and Finance (MAT115)
Source:LieberR.(2010,September3rd).HowDebtCanDestroyaBuddingRelationship.RetrievedFebruary14th,2011fromhttp://www.nytimes.com/2010/09/04/your-money/04money.htm
Nobody likes unpleasant surprises, but when Alli-son Brooke Eastman’s fiancé found out four months ago just how high her student loan debt was, he had a particularly strong reaction: he broke off the engagement within three days.
Ms. Eastman said she had told him early on in their relationship that she had over $100,000 of debt. But, she said, even she didn’t know what the true balance was; like a car buyer who focuses on only the monthly payment, she wrote 12 checks a year for about $1,100 each, the minimum possible. She didn’t focus on the bottom line, she said, because it was so profoundly depressing.
But as the couple got closer to their wedding day, she took out all the paperwork and it became clear that her total debt was actually about $170,000. “He accused me of lying,” said Ms. Eastman, 31, a San Francisco X-ray technician and part-time photogra-pher who had run up much of the balance studying for a bachelor’s degree in photography. “But if I was lying, I was lying to myself, not to him. I didn’t really want to know the full amount.”
At a time when even people with no graduate degrees, like Ms. Eastman, often end up six figures in the hole and people getting married for the second time have loads of debt from their earlier lives, it should come as no surprise that debt can bust up engagements. Even when couples disclose their debt in detail, it poses a series of challenges.
When, exactly, are you supposed to reveal a debt of this size during the courtship? Earlier than you’d disclose, say, a chronic illness?
Even if disclosure doesn’t render you unmar-riageable, tricky questions linger. If one person brings a huge debt to a relationship, who is ulti-mately responsible for making good on the obliga-tion? And if it’s $170,000, isn’t the more solvent partner going to resent that debt over time no matter how early the disclosure comes? After all, it will profoundly affect every financial decision, from
buying a home to how many children to have. These were the questions that weighed on Kerrie
Tidwell. A third-year student at the Medical College of Georgia and an aspiring emergency room doctor, she doesn’t worry so much about her ability to pay back her loans.
Ms. Tidwell, 26, is involved in a serious relation-ship with Stefan Kogler, an architect who is a native of Austria and living in Vienna. To Europeans, who often pay little or nothing toward their university studies, the idea of going deeply into debt to get educated is, well, foreign.
Ms. Tidwell feels no guilt about the $250,000 in debt she will probably run up, including some from a master’s degree program she completed in Lon-don, where she and Mr. Kogler met. “I didn’t acquire it because I go out and shop a lot,” she said. “It’s because I’m doing something that I’ll love for the rest of my life.”
Still, if she and Mr. Kogler are going to move in together and get engaged, she wants their financial arrangements to be clear and fair. But how do you define fair when you’re bringing a quarter of a mil-lion dollars in debt to a relationship?
Mr. Kogler, 30, said he’s not so worried about it. “In the long run, it will equal out,” he said. “In the short run, you have to support each other, and I will support her as much as I can.”
His stoicism is admirable. It’s all the more so, given that if he moves to the United States perma-nently, he’ll probably lose the chance to run his family’s business in Austria. Supporting Ms. Tidwell as she begins to pay back her loans also means he doesn’t have the freedom to, say, make a career change that involves a big pay cut. “I know he has his own dreams, and they will require money,” Ms. Tidwell said. “Will my debt take away from that?”
Lisa J. B. Peterson, a financial planner with Lantern Financial in Boston, specializes in counsel-ing young couples and has heard this story before.
Interest Rates and Debt

s.37
About half the people she sees are both bringing significant debt to the relationship, and about a quarter of the others have one person who has a pile of student loans.
When I told her about Ms. Tidwell and Mr. Kogler, one of her first suggestions was for them to make sure that Mr. Kogler did not have to make all the compromises when they prepared a joint house-hold budget. “They can make some kind of sacrifice so that a goal of his is achieved, too,” she said.
Then there’s the question of how to plan for the unknowns. “What would happen if I got hurt and couldn’t practice or got sued for malpractice?” Ms. Tidwell asked.
While insurance (which is itself expensive, alas) can reduce this anxiety, it can’t cover the desire to stay home with children. Ms. Tidwell is resolute about having children and working full time, but Sheila G. Riesel, a matrimonial lawyer and partner with Blank Rome in Manhattan, said Ms. Tidwell ought to consider potential extreme circumstances as well. “It could happen that she wants to be a stay-at-home spouse for a while. What if she has triplets?” Ms. Riesel asked. “All of this is worthy of discussion.”
The problem is, most couples never get this far in the premarriage money talks. One advantage to prenuptial agreements is that they force the issue, even if it does turn the talks into a negotiation. “At least half the time, people are shocked at what the other person’s attitude is,” said Susan Reach Winters, a matrimonial lawyer with Budd Larner in Short Hills, N.J. “You ask how they’d handle it if someone wanted to stay home after having a baby, and at the same time they give completely different answers.”
Legally, it is likely that any leftover debt that Ms. Tidwell brought to a marriage would remain hers alone after a divorce. But Ms. Reach Winters said that if she were representing someone like Ms. Tidwell’s boyfriend in a divorce, she would argue that he deserved a sort of refund for everything he paid toward household expenses even if Ms. Tidwell were making the loan payments out of her salary alone. Whether a state’s laws back up this argument may be beside the point; any lawyer can use it as a battering ram in settlement negotiations.
Ms. Riesel also said couples needed to be wary of states like New York, where an advanced degree acquired during the marriage, and the earning power it brings, are treated as assets to be divided.
While Ms. Tidwell seems resolute about cordon-ing off her debt and paying it off with money she alone earns, she and anyone like her probably ought to codify that intent in a legal agreement, even at the point they decide to move in with someone. And this only gets more complicated (and the agree-ments more crucial) in second marriages, where people may come to the relationship with assets, sole responsibility for a mortgage and a couple of college tuitions. Better to write it all down, no mat-ter how clear the laws may be in your state.
In some ways, Mr. Kogler has it easy. There aren’t a lot of unemployed doctors. So he and Ms. Tidwell should be able to pay back her loans (albeit over 20 or 30 years) as long as they live relatively modestly. He might feel differently if he were dating a law-yer with similar debt but less certain prospects, or an X-ray technician who would really like to be a photographer.
Still, all of this raises the question: At what point do you have a moral obligation to disclose your indebtedness during courtship? On the eighth date? When you get to third base? In your eHarmony online dating profile?
“It’s a sliding scale,” said Ms. Riesel, the Man-hattan lawyer. “It depends on the person and the nature of the relationship.” Ms. Winters, the Short Hills divorce lawyer, said it might depend on your definition of a serious relationship. “But I wouldn’t wait until you were signing leases for apartments or picking out engagement rings.”
Ms. Eastman in San Francisco says she knows that now. “What would I have done differently, besides bringing a copy of my credit report on the first date?” she said, with a rueful chuckle. “I would have been more responsible.”
And while she hasn’t dated anyone seriously enough in recent months to get to the point of disclosure, she says it’s probably necessary by the eighth or 10th date. “I know that now,” she said. “But it had never occurred to me that this is something that might end up being a deal-breaker.”
Interest Rates and Debt
MAT115 Supplement

s.38 LaGuardia Community College/CUNY – Project Quantum Leap
Reading #3: When Sallie Met Barack R. Jaafar | College Algebra and Trigonometry – Business and Finance (MAT115)
Source:Collins,G.(2009,May27).WhenSallieMetBarack.RetrievedFebruary14,2011fromhttp://www.nytimes.com/2009/05/28/opinion/28collins.html
There are so many things I don’t understand in this world. Why can’t we do something about North Korea? Why are all the bees dying? How did I miss knowing about “Jon & Kate Plus Eight” until last week?
None of these things, however, are nearly as con-fusing as student loans.
There was a time when kids whose parents couldn’t afford to pay for college just worked their way through. But the price has gone up so fast — more than twice as fast as inflation over the last two decades — that it’s not an option any more, unless the student in question is planning to be a sopho-more through 2020, or is exploring the possibility of part-time employment in armed robbery.
Students borrowed $19 billion in private loans last year, from a bewildering array of options. (Does anybody find it strange that Congress is patting itself on the back for passing a law that protects col-lege students from being offered credit cards, while they’re encouraged to commit themselves to tens of thousands of dollars in education debt?)
Some of the regular private lenders charge as much as 15 percent, although thanks to their dedication to the cause of learning, they are still protected from having their claims wiped away by a bankruptcy court.
Others sound as if they’re nearly free, except when they aren’t. This week, Jonathan Glater of The Times reported the story of Travis and Stephanie Gay, a couple in Kentucky who had borrowed about $100,000 to become special education teachers, under the impression that they could pay their loans off in five years via a special state forgiveness pro-gram for people who worked in low-salary service professions. Right after they got married last sum-mer, the Gays got a letter from the state agency that ran the program saying that due to tough economic times, it was canceling most of their assistance and good luck with that debt.
And then, there’s the epicenter of the college loan strangeness, the federally guaranteed loans. This is a
system that goes something like this:We the taxpayers pay the banks to make loans to
students.We the taxpayers then guarantee the loans so the
banks won’t lose money if the students don’t pay.We the taxpayers then buy back the loans from
the banks so they can make more loans to students, for which we will then pay them more rewards.
Are you with me so far? Wait, I see a hand wav-ing back there. What’s that, sir? You want to know why the government doesn’t just lend the money out itself? Excellent question!
The White House estimates that it could save about $94 billion over 10 years if it cut out all the middlemen. And it has the basis of a system in place, since the Department of Education already makes a lot of direct loans to students.
How many people out there think that there’s going to be some reason that this turns out to be extremely controversial? Can I see a show of hands?
“Senator Nelson is for the system as it is now,” said a spokesman for Ben Nelson, Democrat of Nebraska. If you are a big fan of Senate stalemates, you will remember Nelson, the star of such past triumphs as The Stimulus Is Too Big.
A great part of Nelson’s resistance has to do with the fact that Nelnet, a big student loan provider, has its headquarters in his state. Last year, after an inves-tigation by the New York attorney general, Andrew Cuomo, Nelnet was one of several student lenders that agreed to a settlement in which it paid a fine and promised to abandon alleged deceptive market-ing practices and inducements such as offering free iPods to students who signed on the dotted line.
President Obama’s proposal would allow the private companies to continue servicing the loans, protecting thousands of office jobs. However, they would no longer get the loan origination tasks, which involve the world of high finance and high pay. Stunningly, this turns out to be the part of the business that is most popular. (The chief executive of Sallie Mae, the giant in this line of work, made $4.6
Interest Rates and Debt

s.39
million last year. The vice chairman made more than $13.2 million plus the use of a private jet.)
State agencies like the Kentucky Higher Educa-tion Student Loan Corporation, star of the Gay family debacle, also make federally guaranteed loans and they don’t want to get out of the busi-ness. They like giving state residents money. They also enjoy using their profits to finance worthy enterprises — like loan forgiveness programs that run out of cash. Or, in the case of the Pennsylvania Higher Education Assistance Education Agency, spending $185,000 to send the board and staff to the Greenbrier resort in West Virginia for golf and spa treatments.
It’s time for reform. The system is a mess. Possi-bly not as much of a mess as North Korea, but right up there with the dead bees and Jon and Kate.
Interest Rates and Debt
MAT115 Supplement