Embed Size (px)
Citation preview
PDF hosted at the Radboud Repository of the Radboud University
Nijmegen
The following full text is a preprint version which may differ from the publisher's version.
For additional information about this publication click this link.
http://hdl.handle.net/2066/75704
Please be advised that this information was generated on 2017-12-06 and may be subject to
change.
arX
iv:0
803.
3653
v1
[astr
o-ph
] 26
Mar
2008
The Directional Dependence of Apertures, Limits and Sensitivity of the Lunar Cherenkov Technique to a UHE Neutrino Flux
C.W. James1, R.J. Protheroe2 Department of Physics, The University of Adelaide, Adelaide, SA 5005, Australia
AbstractWe use computer simulations to obtain the directional-dependence of the lunar Cherenkov
technique for ultra-high energy (UHE) neutrino detection. We calculate the instantaneous effective area of past lunar Cherenkov experiments at Parkes, Goldstone (GLUE), and Kalyazin, as a function of neutrino arrival direction, finding that the potential sensitivity to a point source of UHE neutrinos for these experiments was as much as thirty times that to an isotropic flux, depending on the beam pointing-position and incident neutrino energy. Convolving our results with the known lunar positions during the Parkes and Goldstone experiments allows us to calculate an exposure map, and hence the directional-dependence of the combined limit imposed by these experiments. In the 1021—1023 eV range, we find parts of the sky where the GLUE limit likely still dominates, and areas where none of the limits from either Parkes, GLUE, or experiments such as ANITA or FORTE are likely to be significant. Hence a large anisotropic flux of UHE neutrinos from these regions is not yet excluded.
We also determine the directional dependence of the aperture of future planned experiments with ATCA, ASKAP and the SKA to a UHE neutrino flux, and calculate the potential annual exposure to astronomical objects as a function of angular distance from the lunar trajectory through celestial coordinates. We find that the potential exposure of all experiments at 1020 eV and below, integrated over a calendar year, is flat out to ~ 25° from the lunar trajectory and then drops off rapidly. The region of greater sensitivity includes much of the Supergalactic Plane, including M87 and Cen A, as well as the Galactic Centre. At higher energies this high-sensitivity region becomes broader, and we find that the potential exposure of the SKA at 1021 eV and above is almost uniform over celestial coordinates.
Keywords: UHE neutrino detection, coherent radio emission, lunar Cherenkov technique, UHE neutrino flux limits
1 Introduction
In many respects, neutrinos are the perfect astronomical messengers. Since they interact rarely, any flux of neutrinos will reach us almost unattenuated over cosmological distances. Also, being uncharged, the paths of neutrinos will not be perturbed in cosmic magnetic fields, and their arrival directions will allow source identification. In particular, observations of ultra-high
1 Corresponding author,[email protected]@physics.adelaide.edu.au
1
energy (UHE) neutrinos are expected to help resolve the origin of the UHE cosmic rays (CR), through measurements of both the UHE neutrino energy spectrum and arrival directions, see e.g. refs. [1, 2]. Cosmogenic UHE neutrinos are predicted to arise from the interactions of the highest energy cosmic rays with background photon fields. Such interactions with photons of the cosmic microwave background radiation (CMBR) were predicted by Greisen [3] and by Zatsepin & Kuzmin [4] to cause a cut-off at ~ 1020 eV in the spectrum, the “GZK cut-off”. UHE CR have been observed with energies above 1020 eV [5, 6, 7, 8], and measurements of the UHE CR spectrum by the Pierre Auger Observatory are consistent with the GZK cut-off [9]. Therefore, a flux of “GZK neutrinos” is almost guaranteed. Also, many models of UHE CR production, such as the decay of super-massive dark matter particles or topological defects, predict a flux of UHE neutrinos, and limits on such a flux have already been used to rule out Z-burst scenarios [10, 11] of UHE CR production.
The lunar Cherenkov technique is a method to detect UHE particles (both cosmic rays and neutrinos) with ground-based radio telescopes via the coherent Cherenkov radiation emitted upon their interaction in the outer layers of the Moon [12]. The simulated sensitivity of the technique is such that most models of the UHE neutrino flux are expected to be readily detectable with the next generation of radio-telescopes [13], in particular the Square Kilometre Array (SKA) [14], while past experiments at Parkes [15, 16], Goldstone [10], and Kalyazin[17] have already placed significant limits on the UHE neutrino flux. However, the dependence of such limits on particle arrival direction has yet to be determined, despite the potential for using the arrival directions of UHE neutrinos to point back to the source(s) of UHE cosmic rays. In this paper, we use results of simulations to analyse the directional properties of the lunar Cherenkov technique with respect to UHE neutrino detection.
In Section 2, we introduce the lunar Cherenkov technique, and explain why we expect a strong directional dependence in sensitivity to UHE particles. We calculate the instantaneous sensitivity of previous experiments at Parkes, Goldstone, and Kalyazin in Section 3.1, including the potential sensitivity to a point source. Using data on the dates of observations at Parkes and Goldstone, in Section 3.2 we calculate model-independent limits from these experiments as a function of celestial coordinates. In Section 4 we present our calculations of the directionally- dependent sensitivity of likely future observations with the Australia Telescope Compact Array (ATCA), Australian SKA Pathfinder (ASKAP), and the SKA, relative to potential sources of UHE neutrinos. Our simulation method was described fully in our previous paper [13] where we re-evaluated limits from past lunar Cherenkov experiments, and calculated the sensitivity of future experiments, to an isotropic flux of UHE neutrinos. We refer readers to this work for a discussion of our method.
2 Lunar Cherenkov ObservationsG. A. Askaryan [18] first noted an effect — the “Askaryan effect” — by which high-energy particles may be detected remotely. Upon interacting in a dense material, high energy particles will produce a cascade of secondary particles, which will develop a negative charge excess by
2
in-flight annihilation of positrons and entrainment of electrons from the surrounding material. At wavelengths larger than the apparent dimensions of the shower as viewed by an observer, Cherenkov radiation emitted by particles travelling faster than the speed of light in that medium will add coherently. For a dense dielectric medium (e.g. ice), this coherence condition typically corresponds to frequencies of order of a few GHz or less at the Cherenkov angle OC = cos-1(1/n) (n the refractive index), with the peak frequency reducing further from OC. Since the emitted power in the coherent regime scales approximately with the square of both frequency and primary particle energy, the resulting pulse of radiation from the highest-energy particles rapidly becomes very strong, so that if the interaction medium is transparent to radio waves, the emitted pulse can readily escape the medium and be detected at large distances. The Askaryan effect has now been experimentally confirmed in sand [19], salt [20], and ice [21], with measurements of the radiated spectrum agreeing with theoretical predictions (e.g. ref. [22]).
Another medium in which to observe the Askaryan effect is the lunar regolith, a sandy layer of ejecta covering the Moon to a depth of ~10 m. The regolith is known to have a low radiofrequency attenuation, and it is likely that the sub-regolith layers exhibit a similar property. As first proposed by Dagkesamanskii and Zheleznykh [12], and attempted by Hankins, Ekers & O’Sullivan [15] using the Parkes radio telescope, observing the Moon with ground-based radiotelescopes should allow the detection of the coherent Cherenkov radiation from sufficiently high-energy particle interactions in the outer lunar layers. The lunar Cherenkov technique, as it is known, has subsequently been attempted at Goldstone (GLUE) [10] and Kalyazin [17], although the limits on an isotropic flux of UHE neutrinos from these experiments have since been superseded by ANITA-lite, the forerunner of the ANITA experiment, which aimed to detect the Askaryan effect in the Antarctic ice sheet. However, simulation results of lunar Cherenkov observations with the next generation of radio-telescopes, such as ASKAP [23], LOFAR (the Low-Frequency Array) [24], and the SKA [13], are very promising. These instruments are expected to provide a dramatic increase in the sensitivity of the technique, allowing the detection (or elimination) of UHE neutrino fluxes from most models of UHE CR production. In the meantime, the technique is currently being developed experimentally by both the LUNASKA collaboration (our project), utilising ATCA, and the NuMoon project, with the Westerbork Synthesis Radio Telescope (WSRT) [24], and it has also been the subject of several theoretical and Monte Carlo studies [25, 26, 27, 28] together with our own recent work [13, 16].
The probability of a lunar Cherenkov experiment detecting a given particle incident on the Moon is expected to be highly dependent upon the particle’s arrival direction, due to a combination of the opacity of the Moon to both UHE neutrinos and cosmic rays, and the Cherenkov beam geometry — at low frequencies the Cherenkov cone is rather thick, but becomes thin at high frequencies. For the GLUE experiment, Gorham et al. [27] found that “upcoming” interactions (where the direction of the primary just before interaction is towards the local surface) are effectively ruled out, since these require the particle to have penetrated through a large fraction of the lunar bulk. Thus interactions are restricted to “down-going” (for both CR and neutrinos) and “Moon-skimming” events (neutrinos only), respectively where the primary interacts travelling into the Moon, and where the primary interacts travelling nearly parallel to the surface, having penetrated only a small portion of the lunar limb. Fig. 1 illustrates such interaction
3
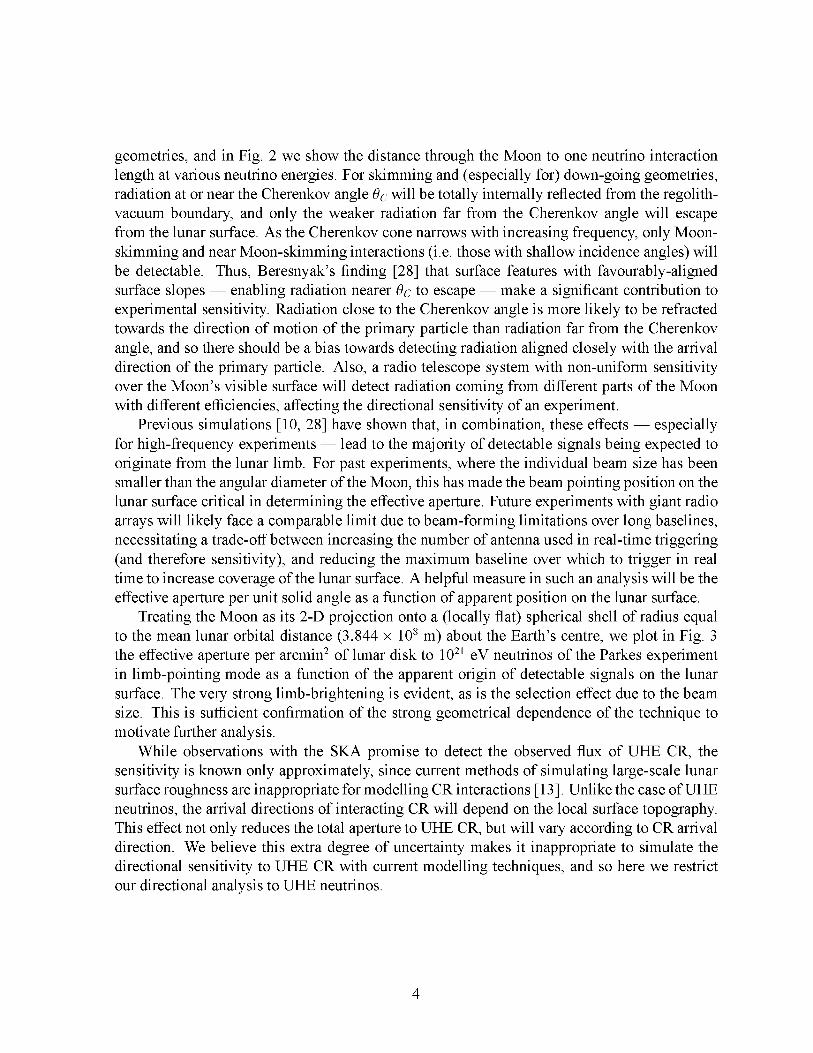
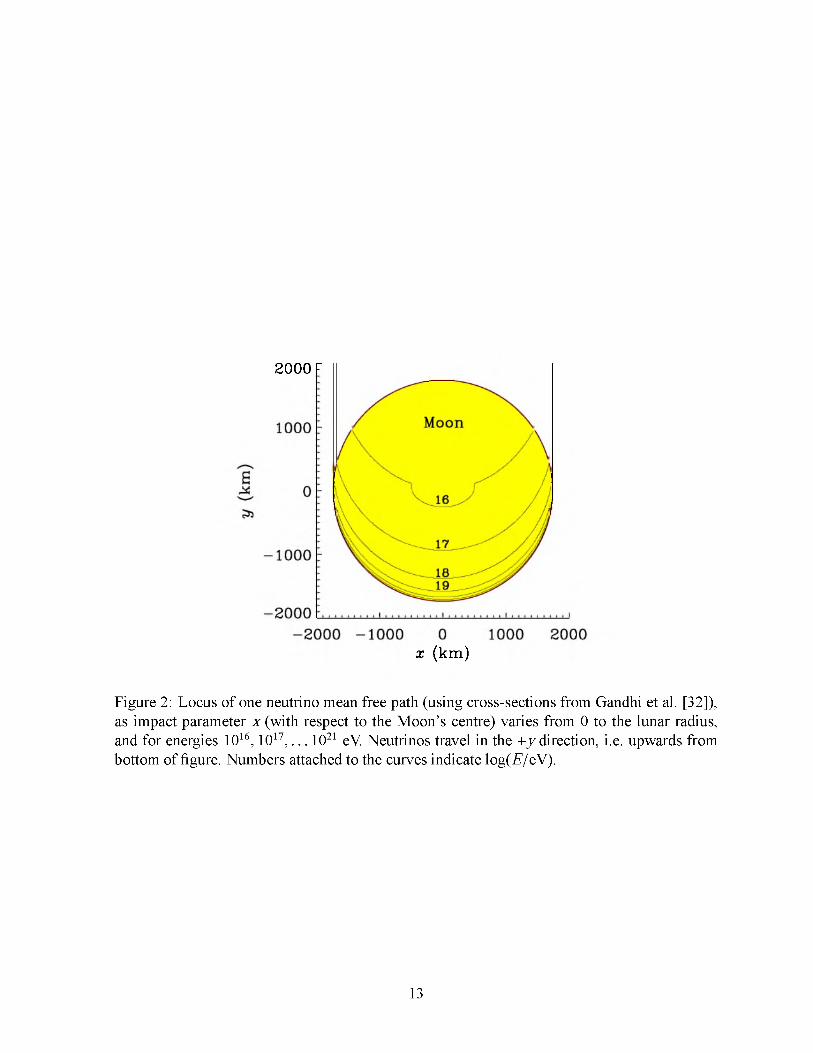
geometries, and in Fig. 2 we show the distance through the Moon to one neutrino interaction length at various neutrino energies. For skimming and (especially for) down-going geometries, radiation at or near the Cherenkov angle OC will be totally internally reflected from the regolith- vacuum boundary, and only the weaker radiation far from the Cherenkov angle will escape from the lunar surface. As the Cherenkov cone narrows with increasing frequency, only Moon- skimming and near Moon-skimming interactions (i.e. those with shallow incidence angles) will be detectable. Thus, Beresnyak’s finding [28] that surface features with favourably-aligned surface slopes — enabling radiation nearer OC to escape — make a significant contribution to experimental sensitivity. Radiation close to the Cherenkov angle is more likely to be refracted towards the direction of motion of the primary particle than radiation far from the Cherenkov angle, and so there should be a bias towards detecting radiation aligned closely with the arrival direction of the primary particle. Also, a radio telescope system with non-uniform sensitivity over the Moon’s visible surface will detect radiation coming from different parts of the Moon with different efficiencies, affecting the directional sensitivity of an experiment.
Previous simulations [10, 28] have shown that, in combination, these effects — especially for high-frequency experiments — lead to the majority of detectable signals being expected to originate from the lunar limb. For past experiments, where the individual beam size has been smaller than the angular diameter of the Moon, this has made the beam pointing position on the lunar surface critical in determining the effective aperture. Future experiments with giant radio arrays will likely face a comparable limit due to beam-forming limitations over long baselines, necessitating a trade-off between increasing the number of antenna used in real-time triggering (and therefore sensitivity), and reducing the maximum baseline over which to trigger in real time to increase coverage of the lunar surface. A helpful measure in such an analysis will be the effective aperture per unit solid angle as a function of apparent position on the lunar surface.
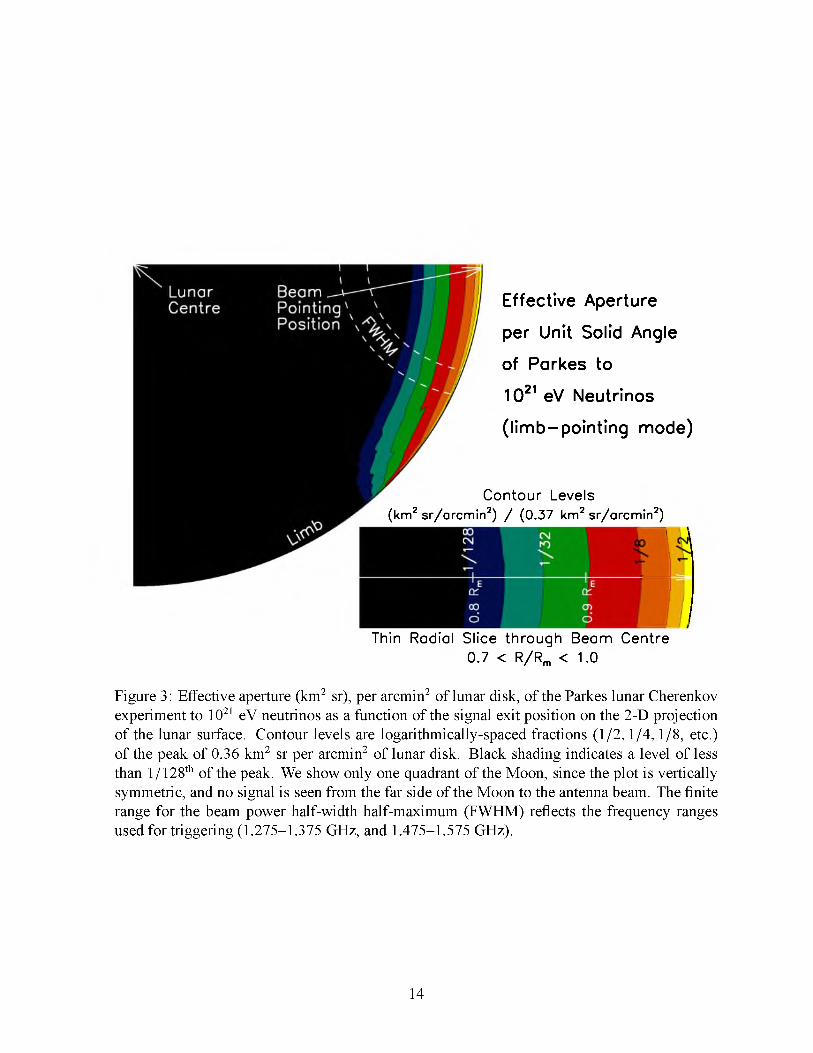
Treating the Moon as its 2-D projection onto a (locally flat) spherical shell of radius equal to the mean lunar orbital distance (3.844 x 10⁸ m) about the Earth’s centre, we plot in Fig. 3 the effective aperture per arcmin2 of lunar disk to 1021 eV neutrinos of the Parkes experiment in limb-pointing mode as a function of the apparent origin of detectable signals on the lunar surface. The very strong limb-brightening is evident, as is the selection effect due to the beam size. This is sufficient confirmation of the strong geometrical dependence of the technique to motivate further analysis.
While observations with the SKA promise to detect the observed flux of UHE CR, the sensitivity is known only approximately, since current methods of simulating large-scale lunar surface roughness are inappropriate for modelling CR interactions [13]. Unlike the case of UHE neutrinos, the arrival directions of interacting CR will depend on the local surface topography. This effect not only reduces the total aperture to UHE CR, but will vary according to CR arrival direction. We believe this extra degree of uncertainty makes it inappropriate to simulate the directional sensitivity to UHE CR with current modelling techniques, and so here we restrict our directional analysis to UHE neutrinos.
4
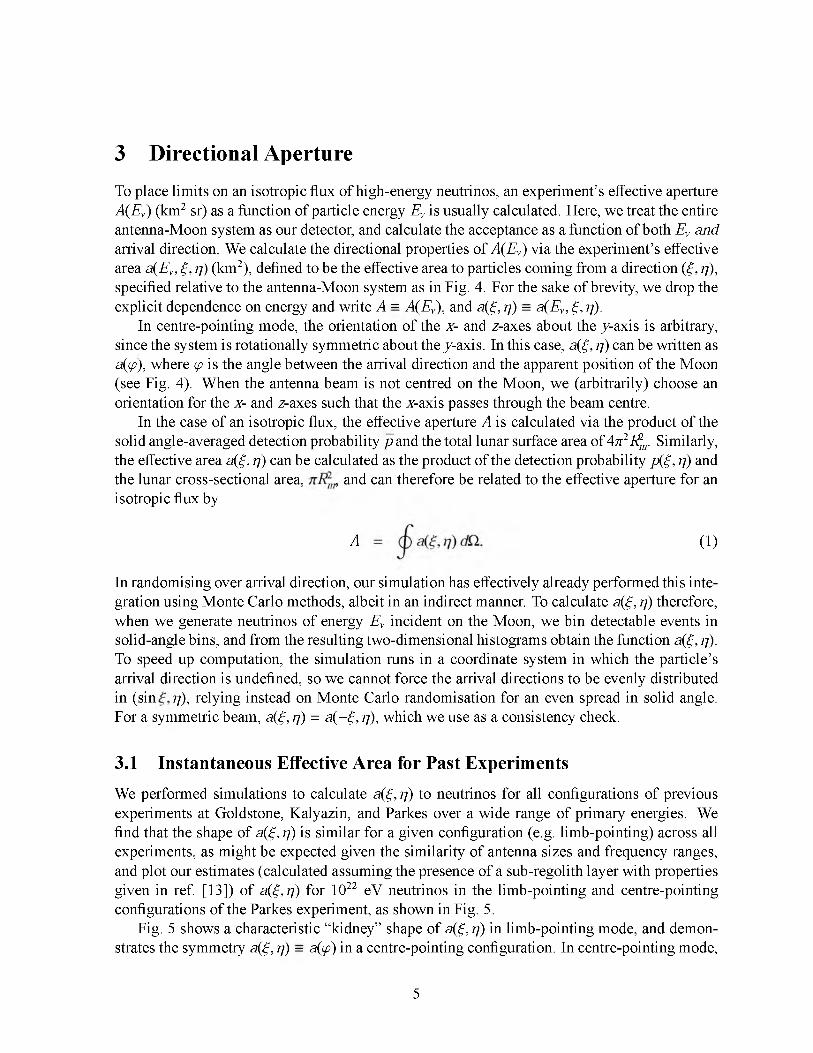
3 Directional ApertureTo place limits on an isotropic flux of high-energy neutrinos, an experiment’s effective aperture A(EV) (km2 sr) as a function of particle energy EV is usually calculated. Here, we treat the entire antenna-Moon system as our detector, and calculate the acceptance as a function of both EV and arrival direction. We calculate the directional properties of A(EV) via the experiment’s effective area a(EV, Ç, n) (km2), defined to be the effective area to particles coming from a direction (^, n), specified relative to the antenna-Moon system as in Fig. 4. For the sake of brevity, we drop the explicit dependence on energy and write A = A(EV), and a(^, n) = a(EV, Ç, n).
In centre-pointing mode, the orientation of the x- and z-axes about the j-axis is arbitrary, since the system is rotationally symmetric about the j-axis. In this case, a(£, n) can be written as a(tp), where <p is the angle between the arrival direction and the apparent position of the Moon (see Fig. 4). When the antenna beam is not centred on the Moon, we (arbitrarily) choose an orientation for the x- and z-axes such that the x-axis passes through the beam centre.
In the case of an isotropic flux, the effective aperture A is calculated via the product of the solid angle-averaged detection probability p and the total lunar surface area of 4n2Rm. Similarly, the effective area a(^, n) can be calculated as the product of the detection probability p(^, n) and the lunar cross-sectional area, , and can therefore be related to the effective aperture for an isotropic flux by
In randomising over arrival direction, our simulation has effectively already performed this integration using Monte Carlo methods, albeit in an indirect manner. To calculate a(^, n) therefore, when we generate neutrinos of energy EV incident on the Moon, we bin detectable events in solid-angle bins, and from the resulting two-dimensional histograms obtain the function a(^, n). To speed up computation, the simulation runs in a coordinate system in which the particle’s arrival direction is undefined, so we cannot force the arrival directions to be evenly distributed in (sin n), relying instead on Monte Carlo randomisation for an even spread in solid angle. For a symmetric beam, a(£, n) = a(-£, n), which we use as a consistency check.
3.1 Instantaneous Effective Area for Past ExperimentsWe performed simulations to calculate a(^, n) to neutrinos for all configurations of previous experiments at Goldstone, Kalyazin, and Parkes over a wide range of primary energies. We find that the shape of a(^, n) is similar for a given configuration (e.g. limb-pointing) across all experiments, as might be expected given the similarity of antenna sizes and frequency ranges, and plot our estimates (calculated assuming the presence of a sub-regolith layer with properties given in ref. [13]) of a(£,n) for 1022 eV neutrinos in the limb-pointing and centre-pointing configurations of the Parkes experiment, as shown in Fig. 5.
Fig. 5 shows a characteristic “kidney” shape of a(^, n) in limb-pointing mode, and demonstrates the symmetry a(^, n) = a(^) in a centre-pointing configuration. In centre-pointing mode,
A (1)
5
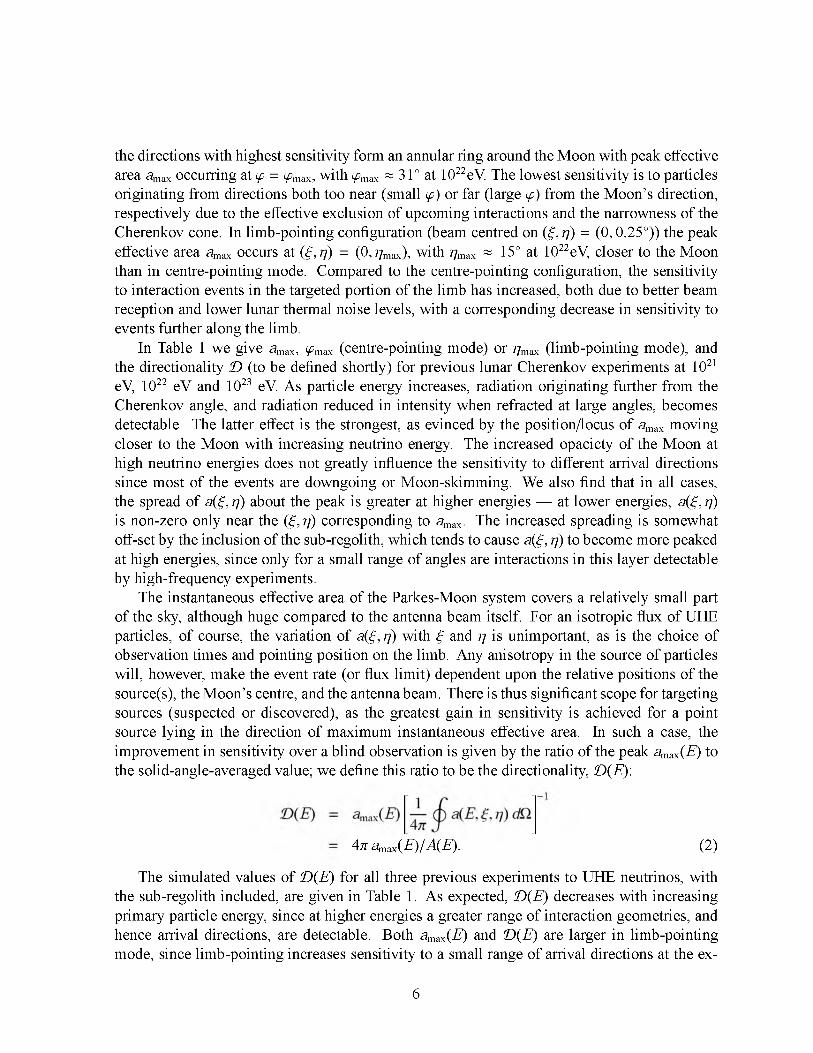
the directions with highest sensitivity form an annular ring around the Moon with peak effective area amax occurring at <p = <max, with <max « 31° at 1022eV. The lowest sensitivity is to particles originating from directions both too near (small <p) or far (large <p) from the Moon’s direction, respectively due to the effective exclusion of upcoming interactions and the narrowness of the
effective area amax occurs at (£, n) = (0, nmax), with nmax « 15° at 1022eV, closer to the Moon than in centre-pointing mode. Compared to the centre-pointing configuration, the sensitivity to interaction events in the targeted portion of the limb has increased, both due to better beam reception and lower lunar thermal noise levels, with a corresponding decrease in sensitivity to events further along the limb.
In Table 1 we give amax, <max (centre-pointing mode) or nmax (limb-pointing mode), and the directionality D (to be defined shortly) for previous lunar Cherenkov experiments at 1021 eV, 1022 eV and 1023 eV. As particle energy increases, radiation originating further from the Cherenkov angle, and radiation reduced in intensity when refracted at large angles, becomes detectable. The latter effect is the strongest, as evinced by the position/locus of amax moving closer to the Moon with increasing neutrino energy. The increased opacicty of the Moon at high neutrino energies does not greatly influence the sensitivity to different arrival directions since most of the events are downgoing or Moon-skimming. We also find that in all cases, the spread of a(£, n) about the peak is greater at higher energies — at lower energies, a(£, n) is non-zero only near the (£, n) corresponding to amax. The increased spreading is somewhat off-set by the inclusion of the sub-regolith, which tends to cause a(£, n) to become more peaked at high energies, since only for a small range of angles are interactions in this layer detectable by high-frequency experiments.
The instantaneous effective area of the Parkes-Moon system covers a relatively small part of the sky, although huge compared to the antenna beam itself. For an isotropic flux of UHE particles, of course, the variation of a(£, n) with £ and n is unimportant, as is the choice of observation times and pointing position on the limb. Any anisotropy in the source of particles will, however, make the event rate (or flux limit) dependent upon the relative positions of the source(s), the Moon’s centre, and the antenna beam. There is thus significant scope for targeting sources (suspected or discovered), as the greatest gain in sensitivity is achieved for a point source lying in the direction of maximum instantaneous effective area. In such a case, the improvement in sensitivity over a blind observation is given by the ratio of the peak amax(E) to the solid-angle-averaged value; we define this ratio to be the directionality, D(E ):
The simulated values of D(E) for all three previous experiments to UHE neutrinos, with the sub-regolith included, are given in Table 1. As expected, D(E) decreases with increasing primary particle energy, since at higher energies a greater range of interaction geometries, and hence arrival directions, are detectable. Both amax(E) and D(E) are larger in limb-pointing mode, since limb-pointing increases sensitivity to a small range of arrival directions at the ex-
Cherenkov cone. In limb-pointing configuration (beam centred on (£, n) = (0,0.25°)) the peak
4n amax(E) /A(E). (2)
6
pense of the majority. The high values obtained for D(E), ranging from 7 to 28, indicate that the limits set from these experiments are likely to be highly anisotropic, depending strongly upon the observation times and pointing positions of the antenna beam(s). Future experiments should aim to choose parameters such as beam-pointing position and observing schedule so that the peak sensitivity will be in the direction of suspected (or, hopefully by then, discovered) sources.
3.2 Directional Limits from Parkes and GLUEIn the case of the Parkes experiment, almost all the limit arises from just two hours spent pointing at the limb of the Moon spread over two consecutive days - unfortunately most of the observation time was in centre-pointing mode for which the peak effective area amax was negligible (see Table 1). Since the sensitivity is a function of the Moon’s position, which changes by approximately 13° per day, the limit from the Parkes experiment will be concentrated in a small patch of sky. Subsequent experiments at Goldstone and Kalyazin spread observations over a longer period of time, and are thus expected to produce a more evenly distributed limit, although even a uniform spread of observations over the lunar cycle will produce an anisotropic limit due to the constraints of the Moon’s orbit.
For an isotropic flux I(E) (particles cm-2 s-1 sr-1 GeV-1), the expected event rate N is givenby
Nobs — i)bs ƒ A(E)I(E)dE. (3)
Hence, the usual method to place a limit on I(E) is to calculate the “model-independent” limit 4n(E) as per [29], i.e.
E k J E ) = Sup obs A(E)]-1 (4)
where s^, (= 2.3 for a non-observation) reflects the 10% confidence level for a Poisson distribution. For an anisotropic flux I(E, a, ô), the expected event rate will be
Noobs //■»1 /"»2n
dE J d(sin Ö) J da I(E, a, ô) S (E ,a,ô), (5)
where the experimental exposure S is the effective area a in terms of celestial-coordinates (a, ô) integrated over the observation time, i.e.
S (E, a, ô) = Í dta(E,a,ö, t). (6)obs
The time-dependence of a(E, a, ô, t) comes from (a, ô) being a time-dependent function of (£, n)— in which a(E, n) is fixed — due to the motion of the Moon. Comparing Eqn. 5 with Eqn. 3, the directionally-dependent limit Flim(E, a, ô) analogous to Ilim(E) should be calculated as in Eqn. 7, below,
EFlimE, a, ô) = Sup[S (E ,a,ô)]-1 . (7)
7
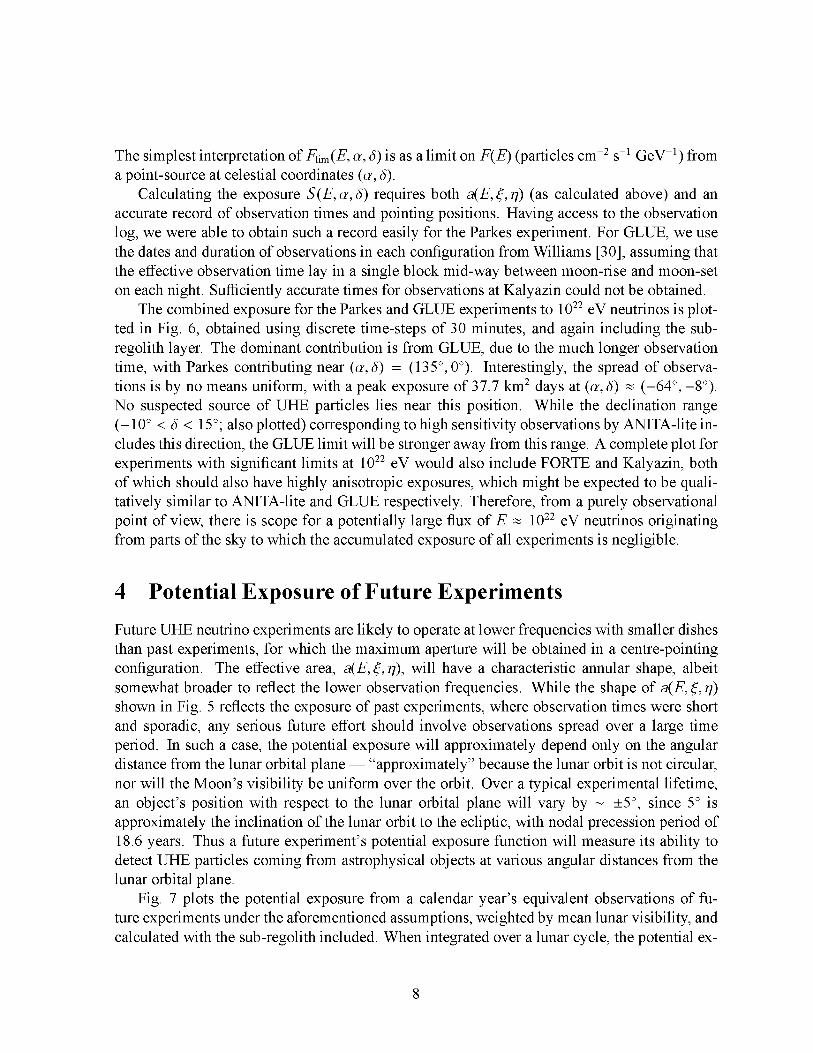
The simplest interpretation of Flim(E, a, ô) is as a limit on F(E) (particles cm-2 s-1 GeV-1) from a point-source at celestial coordinates (a, ô).
Calculating the exposure S (E, a, ô) requires both a(E,£, n) (as calculated above) and an accurate record of observation times and pointing positions. Having access to the observation log, we were able to obtain such a record easily for the Parkes experiment. For GLUE, we use the dates and duration of observations in each configuration from Williams [30], assuming that the effective observation time lay in a single block mid-way between moon-rise and moon-set on each night. Sufficiently accurate times for observations at Kalyazin could not be obtained.
The combined exposure for the Parkes and GLUE experiments to 1022 eV neutrinos is plotted in Fig. 6, obtained using discrete time-steps of 30 minutes, and again including the sub- regolith layer. The dominant contribution is from GLUE, due to the much longer observation time, with Parkes contributing near (a, ô) = (135°, 0°). Interestingly, the spread of observations is by no means uniform, with a peak exposure of 37.7 km2 days at (a, ô) « (-64°, -8°). No suspected source of UHE particles lies near this position. While the declination range (-10° < ô < 15°; also plotted) corresponding to high sensitivity observations by ANITA-lite includes this direction, the GLUE limit will be stronger away from this range. A complete plot for experiments with significant limits at 1022 eV would also include FORTE and Kalyazin, both of which should also have highly anisotropic exposures, which might be expected to be qualitatively similar to ANITA-lite and GLUE respectively. Therefore, from a purely observational point of view, there is scope for a potentially large flux of E « 1022 eV neutrinos originating from parts of the sky to which the accumulated exposure of all experiments is negligible.
4 Potential Exposure of Future Experiments
Future UHE neutrino experiments are likely to operate at lower frequencies with smaller dishes than past experiments, for which the maximum aperture will be obtained in a centre-pointing configuration. The effective area, a(E,£, n), will have a characteristic annular shape, albeit somewhat broader to reflect the lower observation frequencies. While the shape of a(E,£, n) shown in Fig. 5 reflects the exposure of past experiments, where observation times were short and sporadic, any serious future effort should involve observations spread over a large time period. In such a case, the potential exposure will approximately depend only on the angular distance from the lunar orbital plane — “approximately” because the lunar orbit is not circular, nor will the Moon’s visibility be uniform over the orbit. Over a typical experimental lifetime, an object’s position with respect to the lunar orbital plane will vary by ~ ±5°, since 5° is approximately the inclination of the lunar orbit to the ecliptic, with nodal precession period of 18.6 years. Thus a future experiment’s potential exposure function will measure its ability to detect UHE particles coming from astrophysical objects at various angular distances from the lunar orbital plane.
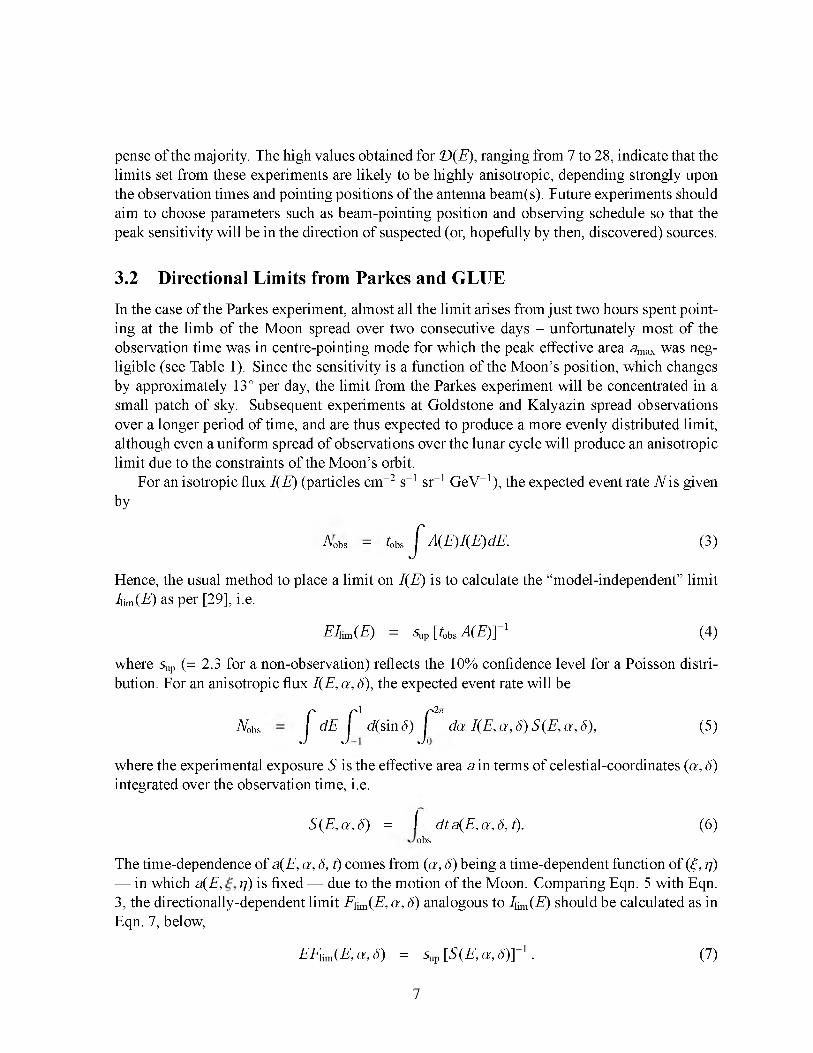
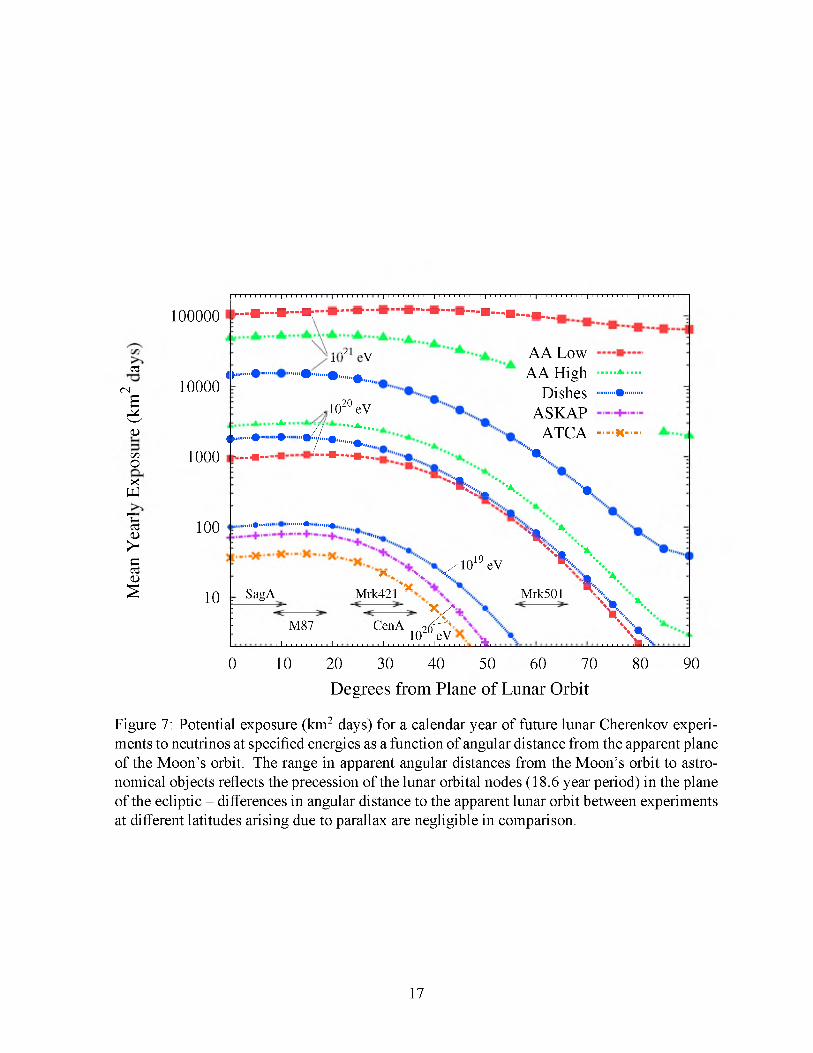
Fig. 7 plots the potential exposure from a calendar year’s equivalent observations of future experiments under the aforementioned assumptions, weighted by mean lunar visibility, and calculated with the sub-regolith included. When integrated over a lunar cycle, the potential ex-
8
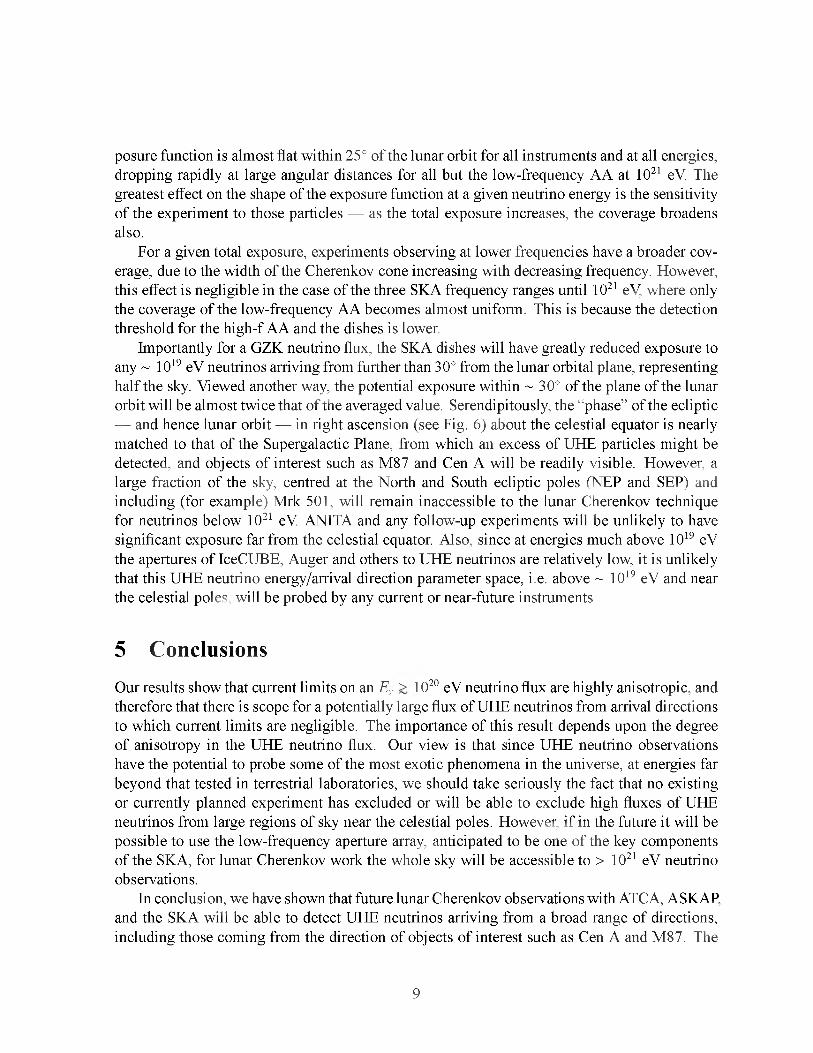
posure function is almost flat within 25° of the lunar orbit for all instruments and at all energies, dropping rapidly at large angular distances for all but the low-frequency AA at 1021 eV. The greatest effect on the shape of the exposure function at a given neutrino energy is the sensitivity of the experiment to those particles — as the total exposure increases, the coverage broadens also.
For a given total exposure, experiments observing at lower frequencies have a broader coverage, due to the width of the Cherenkov cone increasing with decreasing frequency. However, this effect is negligible in the case of the three SKA frequency ranges until 1021 eV, where only the coverage of the low-frequency AA becomes almost uniform. This is because the detection threshold for the high-f AA and the dishes is lower.
Importantly for a GZK neutrino flux, the SKA dishes will have greatly reduced exposure to any ~ 1019 eV neutrinos arriving from further than 30° from the lunar orbital plane, representing half the sky. Viewed another way, the potential exposure within ~ 30° of the plane of the lunar orbit will be almost twice that of the averaged value. Serendipitously, the “phase” of the ecliptic— and hence lunar orbit — in right ascension (see Fig. 6) about the celestial equator is nearly matched to that of the Supergalactic Plane, from which an excess of UHE particles might be detected, and objects of interest such as M87 and Cen A will be readily visible. However, a large fraction of the sky, centred at the North and South ecliptic poles (NEP and SEP) and including (for example) Mrk 501, will remain inaccessible to the lunar Cherenkov technique for neutrinos below 1021 eV. ANITA and any follow-up experiments will be unlikely to have significant exposure far from the celestial equator. Also, since at energies much above 1019 eV the apertures of IceCUBE, Auger and others to UHE neutrinos are relatively low, it is unlikely that this UHE neutrino energy/arrival direction parameter space, i.e. above ~ 1019 eV and near the celestial poles, will be probed by any current or near-future instruments.
5 Conclusions
Our results show that current limits on an Ev > 1020 eV neutrino flux are highly anisotropic, and therefore that there is scope for a potentially large flux of UHE neutrinos from arrival directions to which current limits are negligible. The importance of this result depends upon the degree of anisotropy in the UHE neutrino flux. Our view is that since UHE neutrino observations have the potential to probe some of the most exotic phenomena in the universe, at energies far beyond that tested in terrestrial laboratories, we should take seriously the fact that no existing or currently planned experiment has excluded or will be able to exclude high fluxes of UHE neutrinos from large regions of sky near the celestial poles. However, if in the future it will be possible to use the low-frequency aperture array, anticipated to be one of the key components of the SKA, for lunar Cherenkov work the whole sky will be accessible to > 1021 eV neutrino observations.
In conclusion, we have shown that future lunar Cherenkov observations with ATCA, ASKAP, and the SKA will be able to detect UHE neutrinos arriving from a broad range of directions, including those coming from the direction of objects of interest such as Cen A and M87. The
9
exposure near the lunar orbit is high, and disproportionately strong limits (event rates) on potential (discovered) sources could be placed via a careful choice of observation time. Experiments such as ANITA view declinations -10° < ô < 15° whereas lunar Cherenkov experiments typically view a band within ~ 30° of the plane of the lunar orbit, or an even broader band becoming almost isotropic at low frequencies at 1021 eV and above. Thus the lunar Cherenkov technique complements others in that it covers significant parts of the sky inaccessible to experiments such as ANITA. It also offers the possibility of very large effective apertures over a wide range of energies above ~ 1019 eV depending on frequency band.
Acknowledgments
We thank J. Alvarez-Muñiz for his numerous suggestions and helpful advice. This research was supported under the Australian Research Council’s Discovery Project funding scheme (project number DP0559991).
References
[1] R.J. Protheroe, Astropart.Phys. 21 (2004) 415.
[2] H. Falcke, P. Gorham, R.J. Protheroe, New Astron.Rev. 48 (2004) 1487.
[3] K. Greisen, PRL 16 (1966) 748.
[4] G.T. Zatsepin, V.A. Kuzmin, JETP Lett. 4 (1966) 78.
[5] M. Takeda et al., Astropart.Phys. 19 (2003) 447.
[6] D.J. Bird et al., ApJ 441 (1995) 144.
[7] B.M. Connolly, S.Y. BenZvi, C.B. Finley, A.C. O’Neill, S. Westerhoff, Phys.Rev. D74 (2006) 043001.
[8] T. Abu-Zayyad et al., Astropart.Phys. 23 (2005) 157.
[9] T. Yamamoto (for the Auger Collaboration), arXiv:0707.2638v1 [astro-ph] (2007).
[10] PW. Gorham et al., PRL 93 (2004) 041101.
[11] S.W. Barwick et al., PRL 96 (2006) 171101.
[12] R.D. Dagkesamanskii, I. M. Zheleznykh, Sov.Phys. JETP Let. 50 (1989) 233.
[13] C.W. James, R.J. Protheroe, Submitted to Astropart. Phys., arXiv:0802.3562 [astro-ph] (2008)
[14] www.skatelescope.org
[15] T.H. Hankins, R.D. Ekers, J.D. O’Sullivan, MNRAS 283 (1996) 1027.
10
[16] C.W. James, R.M. Crocker, R.D. Ekers, T.H. Hankins, J.D. O’Sullivan, R.J. Protheroe, MNRAS 379 (2007) 3.
[17] A.R. Beresnyak, R.D. Dagkesamanskii, I.M. Zheleznykh, A.V. Kovalenko, V.V. Oreshko, Astronomy Reports 49 (2005) 127.
[18] G.A. Askaryan, Sov.Phys.JETP, 14 (1962) 441; 48 (1965) 988.
[19] D. Saltzberg et al., PRL 86 (2001) 2802.
[20] PW. Gorham et al., Phys.Rev. D72 (2005) 023002.
[21] PW. Gorham et al., PRL 99 (2007) 171101.
[22] J. Alvarez-Mumz et al., Phys.Rev. D 68 (2003) 043001.
[23] S. Johnston et al., PASA 24 (2007) 174. See also www.atnf.csiro.au/projects/askap/
[24] O. Scholten et al., Astropart.Phys. 26 (2006) 219.
[25] E. Zas, F. Halzen, T. Stanev, Phys.Rev. D 45 (1992) 362.
[26] J. Alvarez-Mumz, E. Zas, AIP Conf.Proc. 579 (2001) 128.
[27] P.W. Gorham, K.M. Liewer, C.J. Naudet, D.P. Saltzberg, D.R. Williams, presented at RADHEP 2000, arXiv:astro-ph/0102435 (2001).
[28] A.R. Beresnyak, arXiv:astro-ph/0310295v2 (2004).
[29] N.G. Lehtinen, P.W. Gorham, Phys.Rev. D 69 (2004) 013008.
[30] D.R. Williams, The Askaryan Effect and Detection of Extremely High Energy Neutrinos in the Lunar Regolith and Salt, Dissertation, University of California (2004).
[31] P. Miocinovic et al., arXiv:astro-ph/0503304v1 (2005).
[32] R. Gandhi, C. Quigg, M.H. Reno, I. Sarcevic, Phys. Rev. D, 58 (1998) 093009
11
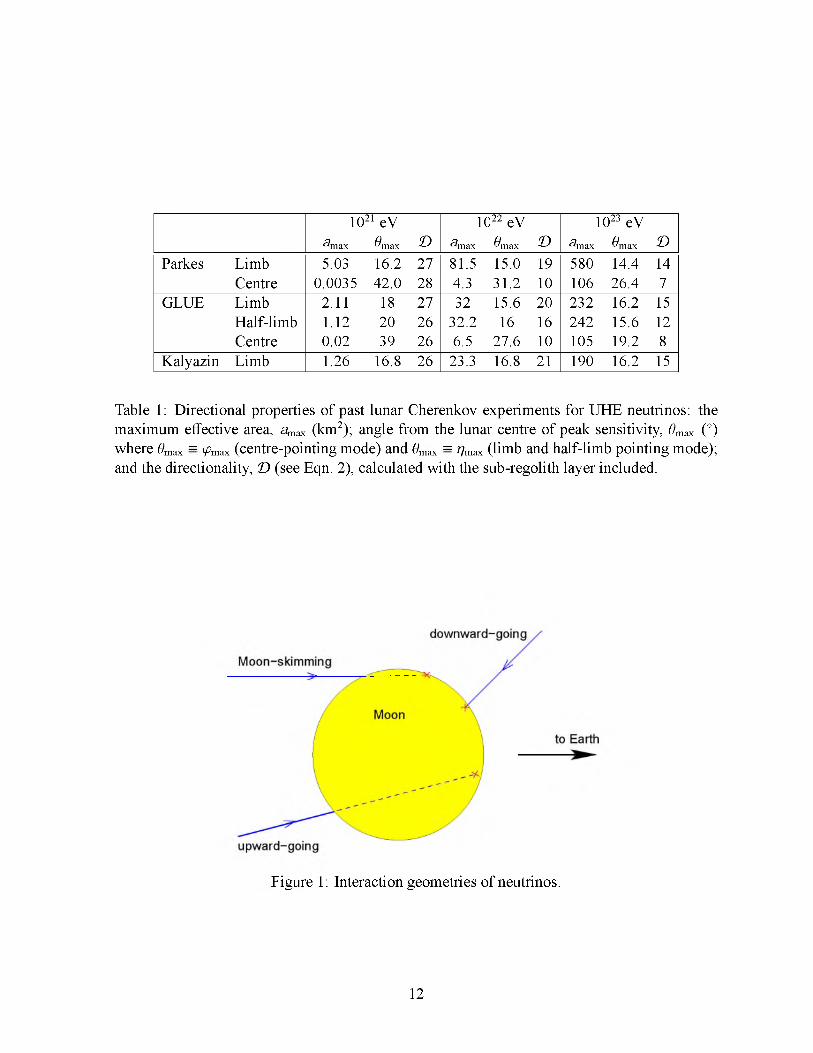
1021 eV 1022 eV 1023 eV^mas in ax D max max D in ax max D
Parkes Limb 5.03 16.2 27 81.5 15.0 19 580 14.4 14Centre 0.0035 42.0 28 4.3 31.2 10 106 26.4 7
GLUE Limb 2.11 18 27 32 15.6 20 232 16.2 15Half-limb 1.12 20 26 32.2 16 16 242 15.6 12Centre 0.02 39 26 6.5 27.6 10 105 19.2 8
Kalyazin Limb 1.26 16.8 26 23.3 16.8 21 190 16.2 15
Table 1: Directional properties of past lunar Cherenkov experiments for UHE neutrinos: the maximum effective area, amax (km2); angle from the lunar centre of peak sensitivity, 0max (°) where 0max = ^max (centre-pointing mode) and 0max = nmax (limb and half-limb pointing mode); and the directionality, D (see Eqn. 2), calculated with the sub-regolith layer included.
Figure 1: Interaction geometries of neutrinos.
12
2000 F
x (km )
Figure 2: Locus of one neutrino mean free path (using cross-sections from Gandhi et al. [32]), as impact parameter x (with respect to the Moon’s centre) varies from 0 to the lunar radius, and for energies 1016,1017, . . . 1021 eV. Neutrinos travel in the +y direction, i.e. upwards from bottom of figure. Numbers attached to the curves indicate log(£/eV).
13
Effective Aperture
per Unît Solid Angle
of Parkes to
1021 eV Neutrinos
(lim b-pointing mode)
Contour Levels (km2 sr/arcmin2) / (0.37 km2 sr/arcmin2)
Thin Radial Slice through Beam Centre 0.7 < R/Rm < 1.0
Figure 3: Effective aperture (km2 sr), per arcmin2 of lunar disk, of the Parkes lunar Cherenkov experiment to 1021 eV neutrinos as a function of the signal exit position on the 2-D projection of the lunar surface. Contour levels are logarithmically-spaced fractions (1/2,1/4,1/8, etc.) of the peak of 0.36 km2 sr per arcmin2 of lunar disk. Black shading indicates a level of less than 1 /128th of the peak. We show only one quadrant of the Moon, since the plot is vertically symmetric, and no signal is seen from the far side of the Moon to the antenna beam. The finite range for the beam power half-width half-maximum (FWHM) reflects the frequency ranges used for triggering (1.275-1.375 GHz, and 1.475-1.575 GHz).
14
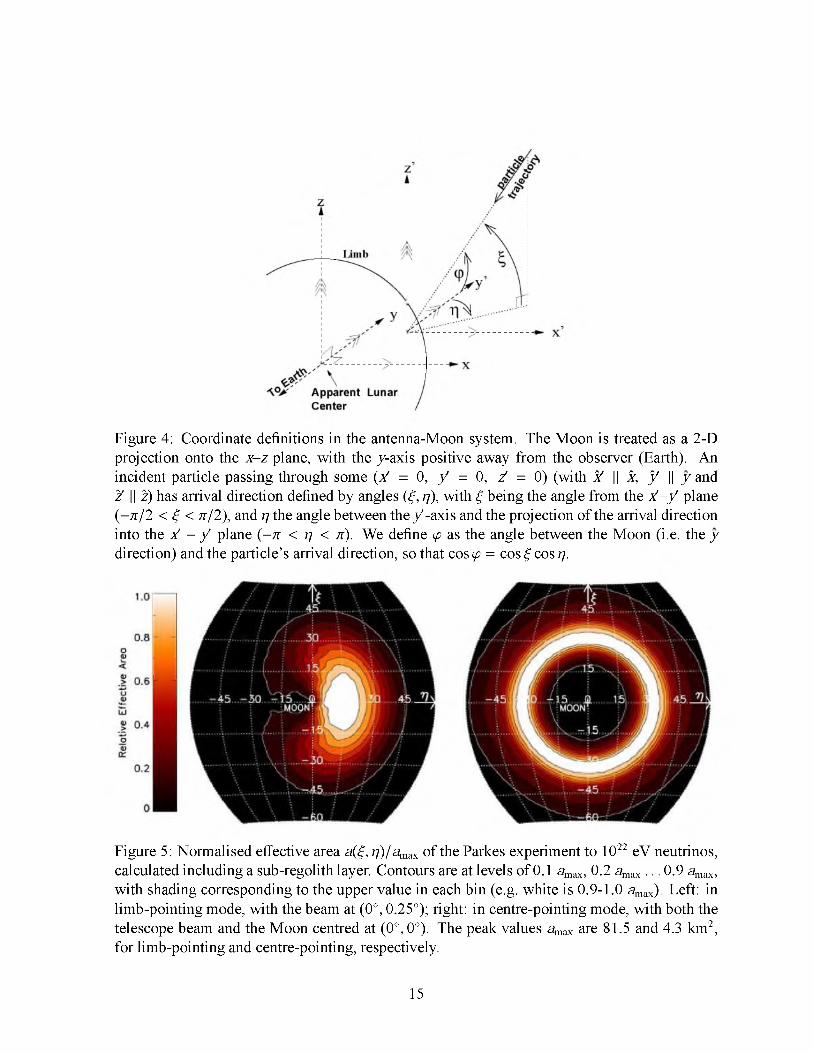
Figure 4: Coordinate definitions in the antenna-Moon system. The Moon is treated as a 2-D projection onto the x-z plane, with the y-axis positive away from the observer (Earth). An incident particle passing through some (x = 0, / = 0, Z = 0) (with X y X, y y y and Z' \| Z) has arrival direction defined by angles (£, n), with £ being the angle from the x'-y' plane (-n /2 < £ < n/2), and n the angle between the /-ax is and the projection of the arrival direction into the x - y plane ( -n < n < n). We define <p as the angle between the Moon (i.e. the y direction) and the particle’s arrival direction, so that cos <p = cos £ cos n.
Figure 5: Normalised effective area a(£, n)/amax of the Parkes experiment to 1022 eV neutrinos, calculated including a sub-regolith layer. Contours are at levels of 0.1 amax, 0.2 amax ... 0.9 amax, with shading corresponding to the upper value in each bin (e.g. white is 0.9-1.0 amax). Left: in limb-pointing mode, with the beam at (0°, 0.25°); right: in centre-pointing mode, with both the telescope beam and the Moon centred at (0°, 0°). The peak values amax are 81.5 and 4.3 km2, for limb-pointing and centre-pointing, respectively.
15
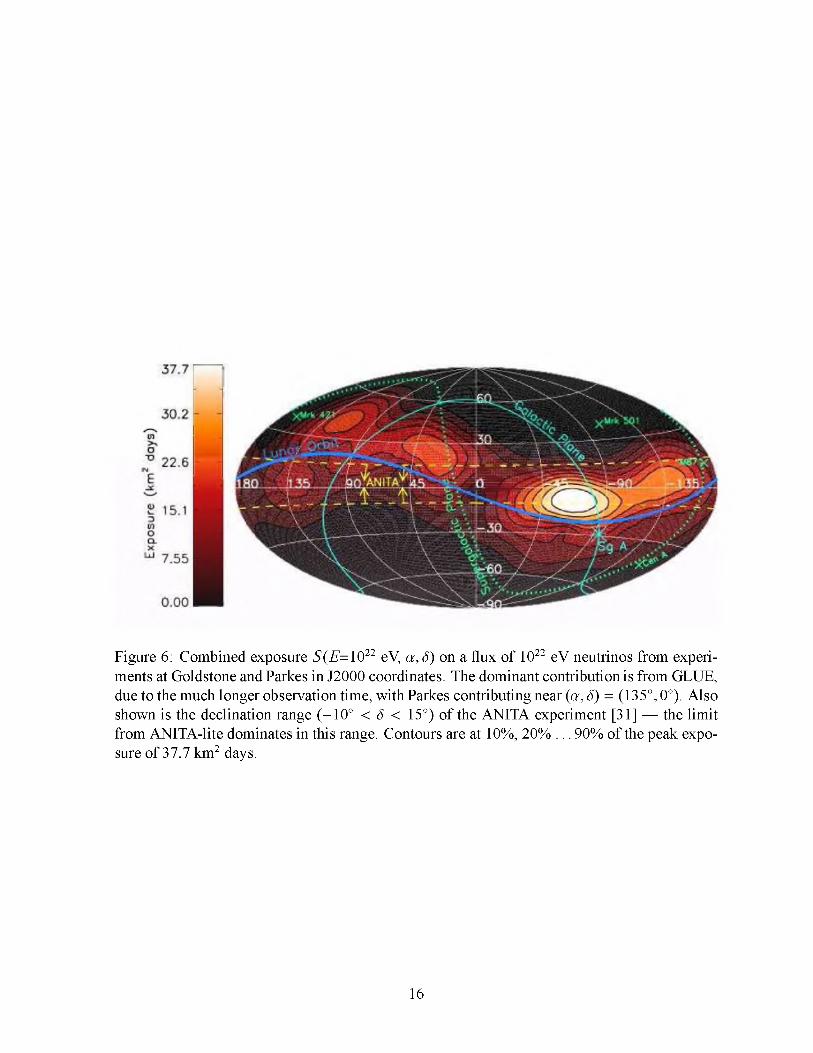
Figure 6: Combined exposure S (E=1022 eV, a, 5) on a flux of 1022 eV neutrinos from experiments at Goldstone and Parkes in J2000 coordinates. The dominant contribution is from GLUE, due to the much longer observation time, with Parkes contributing near (a, 5) = (135°, 0°). Also shown is the declination range (-10° < 5 < 15°) of the ANITA experiment [31] — the limit from ANITA-lite dominates in this range. Contours are at 10%, 20% ... 90% of the peak exposure of 37.7 km2 days.
16
I I I I I I I I I I I I I I I I I I I I I I I I I I I I I I I I I I I I I I I I I I I I I I I I I I I I I I I I I I I I I I I I I I I I I I I I I I I I I I I I I I I I I I I I I I
cd
<Na
&(U
vioX
W
Thc3(U
>HÖcd0)s
100000
10000
1000
0 1 e V<►.... •■■■ ■■■•.....• ....• .......
■ iA> ■
J 0 2° eV - . . a . . .
o .....•■■■ . . . . . . .- • f - ........ .......
1 I É 1 ■ — ■ — a--.
100
10
AA LowAA High ....■*■■■■■
Dishes ....• ....ASKAP
ATCA - - x —'”'X
^ X V..•... ........ ...... ..
...'% *•
19/ 1 0 19 eV » . V '<
SagA
M87................
* VMrk421
/CenA 102°eV........ I.............■!......... LJ-Ai
Mrk501
x \O
\
0 10 20 30 40 50 60 70 Degrees from Plane of Lunar Orbit
80 90
Figure 7: Potential exposure (km2 days) for a calendar year of future lunar Cherenkov experiments to neutrinos at specified energies as a function of angular distance from the apparent plane of the Moon’s orbit. The range in apparent angular distances from the Moon’s orbit to astronomical objects reflects the precession of the lunar orbital nodes (18.6 year period) in the plane of the ecliptic - differences in angular distance to the apparent lunar orbit between experiments at different latitudes arising due to parallax are negligible in comparison.
17