Embed Size (px)
Citation preview

Fused Acoustic Emission and Vibration Techniques for Health Monitoring of Wind Turbine
Gearboxes and Bearings
D. J. Lekou CRES
F. Mouzakis CRES
A. A. Anastasopoulos Envirocoustics S.A.
D. Kourousis Envirocoustics S.A.
Abstract:
The high variability of turbulent wind together with a variety of transient events result in a complex loading pattern for the gearbox of the wind turbine, complicating the diagnostics process. The relatively slow speed of the WT sets an additional limitation in early fault diagnostics by means of the traditionally used vibration monitoring method. Acoustic Emission has been proven suitable for health monitoring and damage identification at early stages on rolling bearings, gearboxes, drive couplings and rotating machinery in general. Therefore, in order to enhance condition diagnosis of rotating machinery on wind turbines, a multi-sensing technology is applied and assessed herein. Keywords: Acoustic Emission, wind turbine gearbox, condition monitoring
1 Introduction
Early detection of mechanical failure in gearboxes and drive train components is a key safety and economical issue in the Wind Turbine (WT) industry. Vibration based methods are applied for the condition monitoring of these WT components, along with other methods such as oil analysis, debris and/or temperature monitoring. These methods, which have been undoubtedly proven to be efficient, have had limited success in early stage detection of damages such as gear tooth fatigue cracks. This means that employment of such methods usually provides information of faults already developed and at a stage when the potential damage in the turbine could be of a large scale.
The main advantage of the high - frequency Acoustic Emission (AE) method is its capability to detect early pitting, cracking or other potential defects much earlier than the
classic vibration method. This is achieved with the employment of resonant-type, high-frequency transducers and suitable acquisition systems which offer enhanced sensitivity in detection of active defects even at noisy environments. Additionally, AE offers the advantage of recording both time-driven acoustic parameters which can be used for trending analysis as well as, under proper conditions, transient signals generated by active failure. Finally, the real-time acquisition of discrete AE waveform features and real-time analysis capabilities, has led towards the development of condition monitoring systems based on AE, for critical structures and processes. In this respect, in recent years, the use of AE as a condition monitoring method for bearings and gearboxes in general is constantly increasing.
Aiming to solve the limitations of traditional monitoring techniques of WT gearboxes and rotating parts (i.e. bearings), the use of AE techniques as a tool for diagnostics condition monitoring and fault diagnostics of the WT gearboxes is demonstrated in the present work.
More specifically, condition monitoring measurements, based primarily on AE, are analyzed by state of the art signal processing algorithms (which may include pattern recognition techniques) as to their potentials in damage stage identification of the component. For the application of AE Methodology, data were collected through use of various (AE) sensors on a WT during operation, either continuously or periodically. In parallel, vibration data and data from complementary sensing devices (e.g. power output and rotating speed) were acquired, thus, enhancing AE and vibration information and enabling definition of a more elaborate health monitoring methodology. Baseline data were collected to define the optimum monitoring scheme for the various machine operational

states. Signal processing and in-depth evaluation of the baseline data was performed, based on advanced analysis software for condition evaluation, setting the basis of the methodology for the condition monitoring system of WT gearboxes. Additionally, the use of monitored periodic statistics of AE data was investigated as an indicator of damage presence and damage severity in an operating, dynamic, WT system.
2 Drive-Train Components
The behaviour of almost all elements on the wind turbine during operation is interconnected and connected to the input of the stochastic wind. A malfunctioning component might keep functioning, but affecting the function of a different interconnected element of the turbine. In other cases the components could all be under an acceptable condition (on a single element by element check) but could result in malfunctioning as an integrated system. The current work focuses on the drive-train of the wind turbine; however, other elements of the WT should be monitored in parallel to arrive at a concrete conclusion on condition of the elements of concern. The drive-train of a modern wind turbine comprises a variety of subassemblies, which require monitoring during operation of the wind turbine, in order to turn to a condition-based maintenance and repair scheme, from the corrective and preventive maintenance scheme usually followed nowadays. According to [1], which largely follows [2], the priorities for monitoring are the drive train with its bearings and the gear-teething, including, as a minimum, monitoring of following sub-assemblies:
• Main bearing • Main gearbox (specifically for planet-
helical gears, the ring gear, the sun pinion shaft and the output gear shall be monitored)
• Generator • Nacelle with tower
In this work, the components making up the drive train assembly are considered to be the low speed shaft, the gearbox and the high speed shaft, along with their respective bearings. Most of the bearings used in the wind turbines are roller bearings [3]; therefore the application in the current work will concentrate on this type of bearings.
A review of the failures in the drive-train elements operating in wind turbines along with the underlying causes can be found in [4] and [3]. These include ring and roller cracks, wearing, spalling, brinelling as well as fluting in roller bearings; tooth cracking, micro-pitting, abrasion and spalling for gear elements; and cracks and imbalances in shafts. Monitoring methods for the early detection of these failures will be the discussed in the following section.
3 CMS for wind turbine Drive-Train
During the last ten years a number of research projects focused on the study, development and integration of condition monitoring systems (CMS) in the wind turbine system, as a means to pass from a corrective and preventive maintenance scheme to a more sophisticated condition-based maintenance scheme. These include the recently concluded CONMOW [5] a successor of WT-Omega project [6], as well as OffshoreM&R [3] and CleverFarm [7], with the last two focusing more on issues related to the integration of already developed condition monitoring systems for specific subcomponents of the wind turbine (especially for the gearbox and bearing of concern in the current work) to the wind turbine system, rather than the development of the condition monitoring system for a specific component. OffshoreM&R focused more on standardisation aspects, while CleverFarm concentrated on integration software issues of the condition monitoring systems on the wind turbine SCADA. Finally, research is on-going within UPWIND project [8] on the subject of new condition monitoring approached for the next generation of wind turbines.
Currently a number of different monitoring systems are available for the condition monitoring of the various sub-components of a wind turbine and specifically of the wind turbine drive-train. These have been recently extensively reviewed in [9] covering in general the wind turbine system and in [4], focusing on the drive-train system. As already mentioned vibration analysis is the most implemented method for the condition monitoring of the drive-train elements of the WT, followed by oil analysis, debris, temperature monitoring and in some cases visual inspections, including

bore scope applications. These are then fused with the critical operating parameters monitored on the WT, such as rotational speed, oil temperatures and pressures, etc., forming part of the WT controller parameters, as indicated for ensuring safely operation within design limits. A discussion of the various CMSs on their applicability to monitor the various components of the WT drive-train, as well as the advantages and disadvantages of each method is presented in [4], while a more general discussion can be found in [10].
Vibration analysis as a method for condition monitoring of gearboxes and bearing has been developed in the past for applications on rotating machines other than the wind turbines. However, since both the application and the analysis of the monitored data are quite sophisticated the methods, they are usually slightly adopted for the wind turbine sector if necessary [5] and executed by specialized suppliers, who also perform the maintenance of the components [9]. The current work is concentrated on the application of the acoustic emission method, enhanced by vibration monitoring. Nevertheless, since there is a thin line separating these two methods, which is sometimes blurred, due to the fact that the vibration analysis sector is populated with proprietary tools and trademark analysis techniques [4], a short discussion will be presented on the underlying concepts, in an attempt to classify it, focusing on their application on monitoring elements of the WT drive-train components.
From [10] the division of the frequency spectrum into three ranges is adopted, namely:
• Low frequency: 0 – 20 kHz • Medium frequency: 20 – 100 kHz • High frequency: >>100 kHz
Condition monitoring systems focusing on the low frequency range encompass the monitoring of the total oscillatory motion of the component, through measurement of acceleration, velocity or displacement. These systems, even if they are enhanced with sophisticated analysis techniques can only be used for identification of rotor imbalances and extended damages [4], [10]. Overall vibration level and Fast – Fourier - Transform (FFT) Spectrum analysis fall into this category.
Condition monitoring systems taking into consideration the medium frequency range rely on the detection of waves generated within the structure and propagated through the structure to the surface at the speed of sound, instead of the motion of the structure itself [4], [10]. The technology and accompanying analysis techniques for these condition monitoring systems are referred to as High frequency enveloping (HFE), “shock-pulse”, “stress wave”, “spike energy” and “acceleration enveloping”, with the name in brackets being trade-names [4], [10]. These are traditionally used for the identification of faults in gears and bearings, so much throughout the industry, as well as specifically for the wind turbine industry [10], [4].
Systems incorporating methods monitoring on the high frequency range, rely on the detection of acoustic emission events. Acoustic emission refers to the generation of transient elastic waves during the rapid release of energy from localised sources within a material [11], (see Figure 1). The method is gaining wider attention for the identification of problems in bearings and gearboxes in general, due its capability of capturing defects earlier than the other methods and identifying lubrication problems [10], [4]. Latest developments in the application of acoustic emission technology for condition monitoring of rotating machines in general have been reviewed in [12].
Figure 1 Acoustic Emission schematic overview
In the literature, comparison between the vibration and acoustic emission methods with respect to their sensitivity in detecting early bearing or gearbox problems is comprehensive for test cases with seeded faults in laboratory conditions. For example regarding roller bearings monitoring the applicability of acoustic emission method can

be found in [13], [14] and [15], while regarding gears comparisons can be found e.g. in [16] and [17].
In [18] a combination of vibration and acoustic emission monitoring was used for the identification of cracks in drive-train elements of aircrafts. Specifically for the application of the methodology in wind turbines, in [5] and [6] the acoustic emission is mentioned as an option, however, both research projects utilized condition monitoring schemes developed and applied through specialized companies and results and documentation is not provided in detail.
3.1 Acoustic Emission features An AE event is defined as “a local material change that gives rise to AE” (see e.g. [11] and [19]). The electrical signal obtained by detection of one or more acoustic emission events by an AE sensor (typically piezoelectric) is called the AE signal (see Figure 1). There are two main strategies in acquiring and treating this signal, which depend mainly on the type of emission expected for each application, i.e. continuous or burst type. Continuous type of emission is expected when the monitored sources of emission are continuous in time, such as friction of continuously moving parts, leaks of fluids under pressure, or very fast (or repeatedly) occurring such as yielding of metals etc. The convenient way to quantify such type of emission is through periodical sampling and monitoring of features of the continuous signal such as:
• the Root Mean Square (RMS) of the signal defined as:
( )∫=T
RMS dttVT
V0
21 (1)
• the Average Signal Level (ASL) which is the amplitude of the corresponding rectified sinusoidal voltage that would result in the same power as the power of the continuously measured voltage (from the AE sensors) for a time period Τ,
• the Absolute Energy which is the actual signal energy over a period of time (T).
In this respect, the above features are referred to as “Time-Driven Data”.
Burst type of emission is expected when the monitored sources of emission are non-
repeatable and occurring discretely, well separated in the time domain from one another, such as local catastrophic yielding, crack growth, cavitation, corrosion spalling, etc. In such cases, the commonly preferred way to process the signal is hit-based processing. If the signal exceeds a predetermined threshold (a voltage defined by the user), then it causes a system channel to accumulate data. Any AE signal that has exceeded the threshold for a particular channel is called an AE hit. Since one AE event might be recorded by more than one channel, it can result in more than one AE hits.
A digital description of the hit is generated by real-time measurement of its characteristics. Typical AE systems, such as the PCI-2 board based system of Physical Acoustic Corporation (PAC) used in the present work, measure and store, in real time, an abundance of hit characteristics (a.k.a. descriptors), the most common of which are (see Figure 2):
• AMPLITUDE: The peak voltage of the AE hit. It is useful as a measure of intensity, as a key to detectability (attenuation) and to characterize failure.
• ENERGY: The area between the hit’s voltage curve and the time axis. This feature serves as measure of activity.
• COUNTS: The number of times that the voltage has exceeded the threshold. This feature serves also as measure of activity.
• DURATION: The time period between the first and the last threshold crossings. This feature is useful for signal qualification and noise rejection.
• RISE TIME: The time period between the first threshold crossing and the peak voltage. This feature is useful for signal qualification and noise rejection.
• COUNTS TO PEAK: The number of counts that occurred within the rise time. This feature is useful for signal qualification and spectral information.
• AVERAGE SIGNAL LEVEL (ASL): The amplitude of the corresponding rectified sinusoidal voltage that would result in the same power as the power of the continuously measured voltage (from the AE sensors) for a time period Τ defined by the user. The ASL is also indicative of the level of continuous emission, or the level of background noise, if no emission is present, however, it may also be calculated on a hit basis.
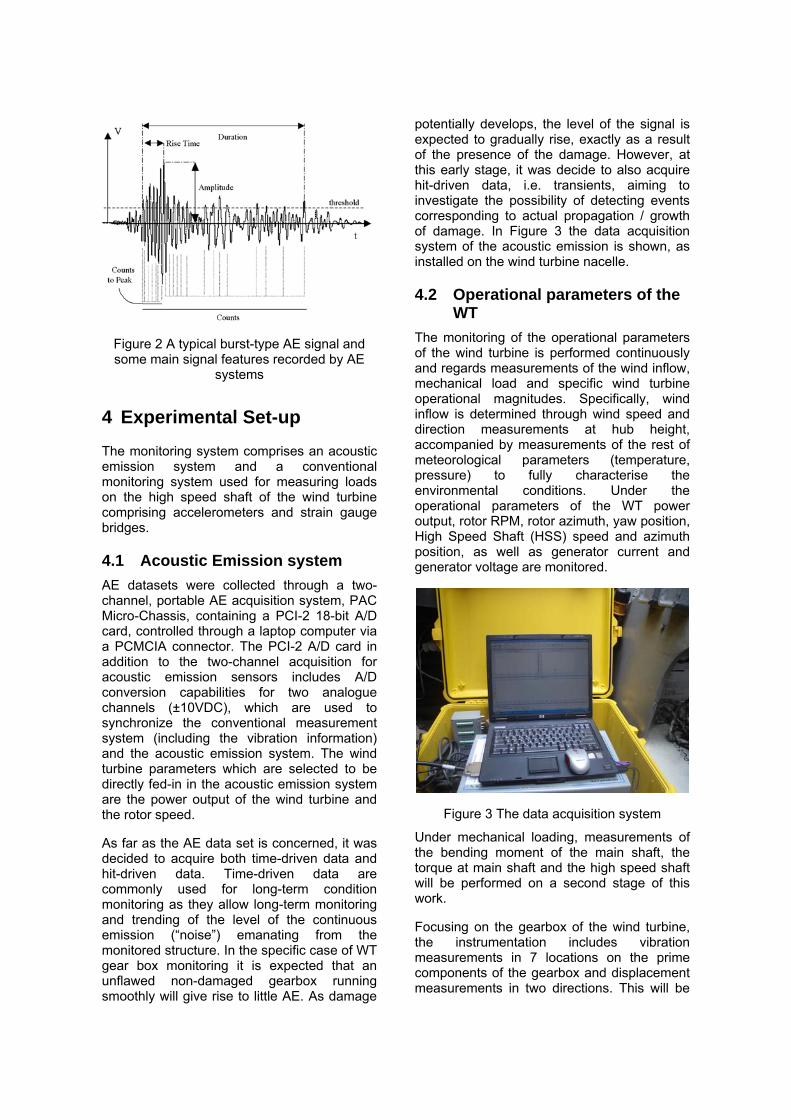
Figure 2 A typical burst-type AE signal and some main signal features recorded by AE
systems
4 Experimental Set-up
The monitoring system comprises an acoustic emission system and a conventional monitoring system used for measuring loads on the high speed shaft of the wind turbine comprising accelerometers and strain gauge bridges.
4.1 Acoustic Emission system AE datasets were collected through a two-channel, portable AE acquisition system, PAC Micro-Chassis, containing a PCI-2 18-bit A/D card, controlled through a laptop computer via a PCMCIA connector. The PCI-2 A/D card in addition to the two-channel acquisition for acoustic emission sensors includes A/D conversion capabilities for two analogue channels (±10VDC), which are used to synchronize the conventional measurement system (including the vibration information) and the acoustic emission system. The wind turbine parameters which are selected to be directly fed-in in the acoustic emission system are the power output of the wind turbine and the rotor speed.
As far as the AE data set is concerned, it was decided to acquire both time-driven data and hit-driven data. Time-driven data are commonly used for long-term condition monitoring as they allow long-term monitoring and trending of the level of the continuous emission (“noise”) emanating from the monitored structure. In the specific case of WT gear box monitoring it is expected that an unflawed non-damaged gearbox running smoothly will give rise to little AE. As damage
potentially develops, the level of the signal is expected to gradually rise, exactly as a result of the presence of the damage. However, at this early stage, it was decide to also acquire hit-driven data, i.e. transients, aiming to investigate the possibility of detecting events corresponding to actual propagation / growth of damage. In Figure 3 the data acquisition system of the acoustic emission is shown, as installed on the wind turbine nacelle.
4.2 Operational parameters of the WT
The monitoring of the operational parameters of the wind turbine is performed continuously and regards measurements of the wind inflow, mechanical load and specific wind turbine operational magnitudes. Specifically, wind inflow is determined through wind speed and direction measurements at hub height, accompanied by measurements of the rest of meteorological parameters (temperature, pressure) to fully characterise the environmental conditions. Under the operational parameters of the WT power output, rotor RPM, rotor azimuth, yaw position, High Speed Shaft (HSS) speed and azimuth position, as well as generator current and generator voltage are monitored.
Figure 3 The data acquisition system
Under mechanical loading, measurements of the bending moment of the main shaft, the torque at main shaft and the high speed shaft will be performed on a second stage of this work.
Focusing on the gearbox of the wind turbine, the instrumentation includes vibration measurements in 7 locations on the prime components of the gearbox and displacement measurements in two directions. This will be

performed in order to facilitate comparisons with classic vibration based condition monitoring systems. On the other hand these extensive parameters measurements will serve as a base to optimise the number and positions of necessary parameters that should be measured in a combined condition monitoring system (vibration plus acoustic emission).
In Figure 4 the placement of the acceleration and the AE sensor is presented on the HSS side of the gearbox. The acceleration sensor is placed on the upper part of the intermediate shaft (just below the HSS, which is not seen in the picture), while the acoustic emission sensor is placed on the lower part of the gearbox on the same side.
Figure 4 View of the HSS side (lower part) of the gearbox.
5 Discussion and Indicative Results
The monitoring scheme was applied on a 750kW constant speed stall wind turbine, equipped with two generators. As a first step various configurations were tested in order to finalize the selection and location of sensors. In the final setup an R30a, 300 kHz resonant PAC sensor with an operating range of 100 –400 kHz was installed below the High Speed Shaft (HSS) on the gearbox (AE Sensor #1), while on the side of the Low Speed Shaft (LSS) of the gearbox, just below the LSS a PICO type PAC wideband AE sensor with an operating frequency of 200 – 750 kHz has
been installed (AE Sensor #2). Good sensor mounting was verified by means of simulated sources (lead breaks) [20] while the machine was stopped. Additionally, a wave propagation and attenuation study was performed on the gearbox to assess good coverage of the structure by the mounted sensors.
Figure 5 presents a typical waveform and its corresponding FFT of a lead-break source close to sensor #1.
Data were acquired during operation of the wind turbine to capture the whole range of operational conditions, including wind turbine transients, such as starts and stops at low and high wind speeds, as well as switching from one generator to the other, which should be regarded as a transient specific for the operation of the monitored wind turbine. The captured datasets were classified as baseline data, since these will be used in order to distinguish between background noise and (high frequency) acoustic emission of deterioration of a structural element in the system.
An example waveform from a burst AE signal acquired by sensor #1 during operation of the WT at low wind speed and its corresponding FFT is presented in Figure 6. Comparison between the waveforms of Figures 5 and 6 shows that the simulated AE source reveals a sharper burst-type pattern, characteristic of failure-like signals, whereas the signal acquired during operation is smoother, more of a frictional type signal. Corresponding FFT of the simulated source reveals sensor resonances, while the one of the signal acquired during operation does not exhibit significant distinct peaks. Note the different y-axes scaling between the graphs of Figure 5 and Figure 6. The monitoring performed serves as a basis for the development of a condition monitoring technique applicable to elements of the drive-train of the wind turbine, with emphasis on the WT gearbox. In this respect, and as a first step, it is crucial to identify whether the recorded AE features correlate with the wind turbine operational conditions (which is expected), as well as to quantify to what degree this correlation exists. It is clear that the increase of the AE level which is anticipated as a result of the existence of damage should be distinguished over the expected fluctuation of the signal related to operation.

Figure 5 Waveform and respective FFT magnitude of a lead-break burst signal near AE sensor #1
Figure 6 Waveform and respective FFT magnitude of a burst AE signal during operation from sensor #1

Figure 7 History graphs of Time-driven ASL, Absolute energy values and WT power output
Figure 7 presents example history graphs of Time-Driven Data for both sensors. Top part exhibits the AE signal ASL values, middle part shows the Absolute Energy values, while the bottom part presents the instantaneous power output of the WT. Based on the Figure graphs, in general, the recorded AE Time-Driven Features seem to vary in accordance with the wind turbine operational conditions.
8
12
16
20
24
28
32
36
40
44
48
52
56
In further assessing the features of AE that indicate a clear relation to the wind turbine operational conditions, for example in Figure 8 the ASL level of the AE sensor #1 is shown versus the wind speed. The same feature is also plotted in Figure 9, this time from hits captured from the sensor #2.
0 4 8 12 16 20
SL
(cha
nnel
1)
A
2Wind Speed (m/s)
4 Figure 8 ASL level with respect to wind speed from AE sensor #1.

8
12
16
20
24
28
32
36
40
44
48
52
56
ASL
(cha
nnel
2)
0 4 8 12 16 20 Wind Speed (m/s)
Figure 9 ASL level with respect to wind speed from AE sensor #2.
6 Conclusions
Having recognized that in order to arrive at a condition monitoring scheme, not only footprint of the normal operational range of the wind turbine should be captured, but also footprints of failure modes, within the scopes of the present work, a series of baseline AE measurements have been conducted during normal operation of a wind turbine. The base AE levels (ASL, Absolute Energy, etc.) have been established. Measurements were various days long, so time-driven and transient signals were recorded for a wide range of conditions. Analysis showed that there is correlation between the recorded AE levels and the operational conditions of the WT. It can be postulated that these results may serve as the basis for trending analysis, whereby future measurements are compared with the “healthy” signature acquired herein and any deviation from the healthy behavior may signify suspect damage. Furthermore, within the present work, the upper limit for a footprint of failure-related transient AE has been simulated and captured. Its characteristics seem to differentiate from the ones of transient signals recorded during operation of an undamaged WT. This part of the analysis may serve as the basis if one wants to minimize false alarms on the one-hand but also to be able to arrive at a preventive condition monitoring system and not just a monitoring
system that can locate failure, when failure has already developed in a serious condition of a subcomponent. Footprints of real failure modes can be captured in cases where the failure is induced on the subcomponent itself, however, this may either be a costly procedure (introducing failed components on an operating wind turbine gearbox); or extremely time consuming, since the subcomponent should be operated normally up to its failure (if it happens, when it happens). A way out could be simulation of failure events, by introducing a pulser generator on the wind turbine gearbox, simulating developed cracks in the gearbox and implementing the methodology to identify the simulated defects. This will be investigated as an extension to the present work.
On the other hand, it is also recognized that identifying an abnormality indicating defect on an element of the drive-train of the wind turbine, is not enough. A clear interconnection of the remaining life of the component after the identification of the defect should be established, so that maintenance methodologies for the wind turbines can be enhanced. This however, in the wind energy sector with wind turbines operating under stochastic conditions, can only be achieved with experimental data backing up theoretical analysis estimations, in order to expand the available knowledge to make prognoses on how the failures will develop.
Acknowledgements
This work has been partially supported by the European Regional Development Fund -ERDF and the Greek Secretariat for Research and Development through its subprogram AKMON for capacity building, funded through the 3rd Community Support Framework. Also, part of the work was performed within the frame of the EC co-funded project PROTEST (Grant Agreement no.: 212825).
References
[1]. Germanischer Lloyd, Rules and Guidelines, IV: Industrial Services; 4: Guideline for the certification of condition monitoring systems for wind turbines, Edition 2007

[2]. Allianz Zentrum fuer Technik GmbH, Anforderungen an Condition Monitoring Systeme fuer Windenergieanlagen, Report No. 03.01.068, 2003
[3]. ISET, Advanced maintenance and repair for Offshore wind farms using fault prediction and condition monitoring techniques (OffshoreM&R), Final report NNE5/2001/710, 2005
[4]. Walford, C. and Roberts, D., Condition monitoring of wind turbines: Technology Overview, Seeded-Fault Testing and cost-benefit analysis, EPRI Report No. 1010419, 2006
[5]. Wiggelinkhuizen, E. J., Rademakers, L. W. M. M., Verbruggen, T. W., Watson, S. J., Xiang, J., Giebel, G., Norton, E. J., Tipluica, M. C., Christensen, A. J. and Becker, E., CONMOW Final report, ECN-C--07-044, 2007
[6]. Verbruggen, T. W., Wind Turbine operation and maintenance based on Condition Monitoring; WT-Ω, Final Report, ECN-C--03-047, 2003
[7]. Giebel, G., Juhl, A., Hansen, K. G., Giebhardt, J., Pahlke, T., Waldl, H.-P., Rebbeck, M., Brady, O., Ruffle, R., Donovan, M. H. and Bjerge, C., CleverFarm – A SuperSCADA system for wind farms, Risoe-R-1444(EN), 2004
[8]. Giebhardt, J., State of the Art report on Condition Monitoring for Wind turbines, UPWIND WP7 report, 2004
[9]. Hameed, Z., Hong, Y. S., Cho, Y. M., Ahn, S. H. and Song, C. K., “Condition monitoring and fault detection of wind turbines and related algorithms: A review”, Renewable and Sustainable Energy Reviews, 2009, 13, 1-39
[10]. Rao, B. K. N., Handbook of condition monitoring, Elsevier Science Ltd., 1996
[11]. ASTM Standard E1316, 2005, “Standard Terminology for Nondestructive Examinations”, ASTM International
[12]. Mba, D. and Rao, R. B. K. N., “Development of acoustic emission technology for condition monitoring and diagnosis of rotating machines; bearings, pumps, gearboxes, engines and rotating structures”, The Shock & Vibration Digest, 2006, 3(1), 3-16
[13]. Tandon, N. and Nakra, B. C. “Comparison of vibration and acoustic measurement techniques for the condition monitoring of rolling element bearings”, Tribology International, 1992, 25(3), 205-212
[14]. Shiroishi, J., Li, Y., Liang, S., Kurfess, T. and Danyluk, S., “Bearing condition diagnostics via vibration and acoustic emission measurements”, Mechanical Systems and Signal Processing, 1997, 11(5), 693-705
[15]. Al-Ghamd, A. M., Mba, D., “A comparative experimental study on the use of acoustic emission and vibration analysis for bearing defect identification and estimation of defect size”, Mechanical Systems and Signal Processing, 2006, 20, 1537-1571
[16]. Eftkharnejad, B. and Mba, D., “Seeded fault detection on helical gears with acoustic emission”, Applied Acoustics, 2008, doi: 10.1016/j.apacoust.2008.07.06
[17]. Tan, C. K. and Mba, D, “Limitation of acoustic emission for identifying seeded defects in gearboxes”, Journal of Non destructive Evaluation, 2005, 24(1), 11-28
[18]. Godínez-Azcuaga, V. F., Ozevina, D., Finlaysona, R. D., Anastasopoulos, A., and Tsimogiannis, A., “Integrated Acoustic Emission/Vibration Sensor for Detecting Damage in Aircraft Drive Train Components”, Nondestructive Characterization for Composite Materials, Aerospace Engineering, Civil Infrastructure, and Homeland Security 2007. Wu, H. Felix; Diaz, Aaron A.; Shull, Peter J.. Eds, Proc. of the SPIE, Vol. 6531, pp. 65310C (2007)
[19]. Pollock, A. A., “Acoustic Emission Inspection”, Metals Handbook, Ninth Edition, Volume 17, ASM International, 1989, pp. 278-294
[20]. ASTM Standard E976, 2005, “Standard Guide for Determining the Reproducibility of Acoustic Emission Sensor Response” ASTM International.