Embed Size (px)
Citation preview
WORK ING PAPER SER I E SNO 1328 / APR I L 2011
by Puriya Abbassiand Tobias Linzert
THE EFFECTIVENESS OF MONETARY POLICY IN STEERING MONEY MARKET RATES DURING THE RECENT FINANCIAL CRISIS
WORKING PAPER SER IESNO 1328 / APR I L 2011
THE EFFECTIVENESS OF MONETARY
POLICY IN STEERING MONEY
MARKET RATES DURING THE
RECENT FINANCIAL CRISIS 1
by Puriya Abbassi 2 and Tobias Linzert 3
1 Financial support from the Deutsche Forschungsgemeinschaft (DFG) through CRC 649 “Economic Risk” is gratefully acknowledged. The research
for this paper was partly conducted while Puriya Abbassi was guest researcher at the CRC 649 “Economic Risk” at the Humboldt-Universität
Berlin and at the Monetary Policy Division of the ECB. We thank Jens Eisenschmidt and Sandra Schmidt for their comments and discussions.
2 Gutenberg-Universität Mainz, Saarstrasse 21, D-55128 Mainz, Germany; e-mail: [email protected]
3 European Central Bank, Kaiserstrasse 29, D-60311 Frankfurt am Main, Germany;
email: [email protected]
This paper can be downloaded without charge from http://www.ecb.europa.eu or from the Social Science Research Network electronic library at http://ssrn.com/abstract_id=1802352.
NOTE: This Working Paper should not be reported as representing the views of the European Central Bank (ECB). The views expressed are those of the authors
and do not necessarily reflect those of the ECB.In 2011 all ECB
publicationsfeature a motif
taken fromthe €100 banknote.

© European Central Bank, 2011
AddressKaiserstrasse 2960311 Frankfurt am Main, Germany
Postal addressPostfach 16 03 1960066 Frankfurt am Main, Germany
Telephone+49 69 1344 0
Internethttp://www.ecb.europa.eu
Fax+49 69 1344 6000
All rights reserved.
Any reproduction, publication and reprint in the form of a different publication, whether printed or produced electronically, in whole or in part, is permitted only with the explicit written authorisation of the ECB or the authors.
Information on all of the papers published in the ECB Working Paper Series can be found on the ECB’s website, http://www.ecb.europa.eu/pub/scientific/wps/date/html/index.en.html
ISSN 1725-2806 (online)
3ECB
Working Paper Series No 1328April 2011
Abstract 4
Non-technical summary 5
1 Introduction 7
2 Monetary policy and the euro money market during the fi nancial crisis 9
3 Transmission mechanism of monetary policy 11
3.1 Modelling the Euribor dynamics 11
3.2 Variables 13
3.3 Data 16
4 The effectiveness of monetary policy: empirical results 17
4.1 Before the crisis 17
4.2 During the crisis 19
5 Conclusion 21
References 23
Figures and tables 26
CONTENTS

4ECBWorking Paper Series No 1328April 2011
Abstract
Therecent financial crisisdeeply affected themoney market yield curveand thus, potentially,
the proper functioning of the interest rate channel of monetary policy transmission. There-
fore, weanalyzetheeffectivenessof monetary policy in steering euroareamoney market rates
using two measures: first, the predictability of money market rates on the basis of monetary
policy expectations, and second the impact of extraordinary central bank measureson money
market rates. We find that market expectations about monetary policy are less relevant for
money market ratesup to 12 monthsafter August 2007 compared to the pre-crisisperiod. At
the same time, our results indicate that the ECB’s net increase in outstanding open market
operationsas of October 2008 accounts for at least a 100 basis point decline in Euribor rates.
These findingsshow that central bankshave effective tools at hand to conduct monetary pol-
icy in timesof crises.
Keywords: Monetary transmission mechanism; Financial Crisis; Monetary policy implemen-
tation; European Central Bank; Money market
JEL classification: E43, E52, E58
5ECB
Working Paper Series No 1328April 2011
Non-technical Summary
Thefinancial crisisstarting in August 2007 hasdeeply affected financial marketsaround theworld.
In particular, money marketscontracted substantially leading to severedisruptions in banks’ short-
term funding. Interest rates in the unsecured segment of the money market rose to unprecedented
levels reflecting banks’ re-assessment of borrower’s creditworthiness and their willingness and
capacity to lend. And, hence, leading to a tightening of credit standards for both businesses and
households. These developments have called into question whether monetary policy can effec-
tively steer short term money market rates in such an environment.
In this paper we investigate the effectiveness of the ECB’smonetary policy in steering money
market rates during the recent financial crisis based on two aspects. First, we explore whether
markets’ interest rateexpectations areadequately reflected in theshape of themoney market yield
curve. Given the bank-centered structure of the euro area financial system, this relationship is
crucial since interest rates, in particular the unsecured money market rates (Euribor), determine
short-term bank loans and deposit rates which in turn affect financing conditions for households
and businesses. Second, we analyze the extent to which the ECB’s crisis related (non-standard)
monetary policy measures have been effective in reducing money market rates.
To that aim, we focus on the daily dynamics of the three-month, six-month and twelve-month
Euribor during the period March 2004 through June 2009. Along the lines of the expectation hy-
pothesis, westudy the interaction of monetary policy and the term structure before and during the
recent financial crisis. For the period before August 2007, wefind that Euribor rates up to twelve
months were significantly in line with market’s expectations. According to our results, an ex-
pected policy rate change of 25 basis points causes thecontemporaneous three-month, six-month,
and twelve-month Euribor to rise by 17, 19 and 23 basis points, respectively. After the outbreak
of thecrisis, however, our resultsdiffer from thoseobtained for thepre-crisis period in two impor-
tant aspects. First, the yield curve reflects monetary policy intentions less clearly. An anticipated
policy ratechangeof 25 basispoints isnow accompanied by acontemporaneous increase in three-
month, six-month, and twelve-month Euribor rates by roughly 3 basis points. This implies that
during thecrisis themanagement of market’sexpectations becamerather difficult. Thischallenges
the proper functioning of the interest rate channel and thus the effectiveness of monetary policy.
Second, the Euribor rates became highly persistent. Therefore, a lasting impact of shocks may
have impeded the transparency of policy signals and the central bank’s impact on money market
rates. At the same time, our results suggest that the use of the crisis-related (non-standard) mone-

6ECBWorking Paper Series No 1328April 2011
tary policy measuresby theECB hascontributed to adecline in money market rates. In particular,
the net increase of outstanding volumes associated with open market operations shows to account
for a reduction in Euribor rates by more than 100 basis points.

7ECB
Working Paper Series No 1328April 2011
1 Introduction
Thefinancial crisis starting in August 2007 deeply affected financial marketsaround theworld. In
particular, money markets contracted substantially leading to severe disruptions in banks’ short-
term funding. Unsecured money market rates rose to unprecedented levels reflecting banks’ re-
assessment of borrower’s creditworthiness and their willingness and capacity to lend. And, hence,
leading to a tightening of credit standards for both businesses and households, see European Cen-
tral Bank (2007b). These developments have called into question whether monetary policy can
effectively steer short term money market rates in such an environment. This paper investigates
the effectiveness of monetary policy with regard to the steering of money market rates during the
recent financial crisis using two measures: first, the predictability of money market rates on the
basisof monetary policy expectations reflecting thestandard channel of monetary policy transmis-
sion. And second, the impact of theECB’scrisis-related (non-standard) monetary policy measures
on money market rates.
The euro area financial system has a bank-centered structure and as such, unsecured money
market rates determine short-term bank loans and deposit rates and thereby financing conditions
for households and businesses. The euro interbank offered rate (Euribor), in that respect, is the
standard reference rate for theunsecured money market and serves as the benchmark for the pric-
ing of fixed-income securities throughout the economy. Moreover, short-term retail bank interest
rates are priced in relation to the Euribor, and mortgage rates are often even indexed to it, see
de Bondt et al. (2005), Sorensen and Werner (2006). Therefore, the prevailing Euribor rates ap-
pear to significantly influence the effectiveness of monetary policy and the functioning of the
transmission mechanism in the euro area.
According to the expectation hypothesis, the current structure of Euribor rates should contain
an implicit path of theexpected futureshort term interest rate, i.e. thepolicy rateset by thecentral
bank, seee.g. Campbell and Shiller (1991), and Rudebusch (1995). Thispath reflectshow interest
rates will evolve over time and will change if new information about the economic outlook and
monetary policy necessitate a revision of the path. Hence, for an effective monetary policy, it is
therefore crucial that interest rate expectations are in line with the central bank policy intentions
and are correctly reflected in the shape of the yield curve.
Since the beginning of the recent financial crisis, however, Euribor rates at various horizons
rose substantially and remained at elevated levels putting the clarity with which monetary policy
intentions are reflected in the shape of the yield curve at risk. To revive conditions in the money
8ECBWorking Paper Series No 1328April 2011
market, the ECB, like many other central banks, mainly reacted by increasing significantly the
liquidity provision to the banking sector via its open market operations. More precisely, until Oc-
tober 2008 theECB rearranged itsallotment pattern in itsmain refinancing operations (MROs) and
extended its liquidity provision in sizeand frequency through supplementary longer term refinanc-
ing operations (LTROs), albeit overall liquidity provision waskept more or less unchanged. After
October 2008, theECB’sbalancesheet grew considerably in sizedueto anumber of extraordinary
measures including a fixed rate unlimited liquidity provision, a further broadening of refinancing
horizons and the establishment of a foreign currency funding facility, notably in U.S. dollars. If
these non-standard monetary policy measures were effective, they should lower the tensions in
money markets and contribute to a reduction of the marginal cost of funding bank loans, i.e. the
Euribor rates.
Following the rationale of the expectation hypothesis, we employ a model of the Euribor to
assess (i) its predictability on the basis of market’s monetary policy expectations at the three-
month, six-month and twelve-month horizon and (ii) the effectiveness of ECB’s crisis-related
(non-standard) monetary policy measures. Overall, our results indicate that during the recent
crisis, monetary policy has been largely effective. Before the financial crisis, Euribor rates up to
12 months were significantly in line with market’s expectations. Since the outbreak of the crisis,
however, theyield curvereflectsmonetary policy intentions lessclearly. In addition, wefind ahigh
persistence in Euribor rates that may have blurred the transparency of monetary policy further. In
contrast, the ECB’s crisis-related (non-standard) monetary policy measures were highly effective
in reducing Euribor rates. In fact, according to our estimates the significant increase in the net
volume of outstanding open market operations asof October 2008 caused Euribor rates to decline
for more than 100 basis points.
The empirical literature has analyzed the transmission of monetary policy in the euro area
through various lenses. Most papers have focused on the effectiveness and relative importance
of different transmission channels over the cycle, see e.g. Chatelain et al. (2003), Ehrmann et al.
(2003), Peersman and Smets (2003)), whereas other contributions have studied the asymmetric
functioning of channels during upswings and downswings, see e.g. Bean et al. (2003), Ehrmann
and Worms (2004), Eickmeier et al. (2006). However, the effectiveness of monetary policy dur-
ing significant crises, and especially during the recent financial crisis has not been sufficiently
investigated yet.
Our paper isclosely related to earlier work by Bernoth and von Hagen (2004) who analyze the
efficiency of the three-month Euribor for the period before 2004. Following Rudebusch (1995),
9ECB
Working Paper Series No 1328April 2011
Rudebusch (1998) and Taylor (2001) we use interest rate expectations to assess the predictability
of monetary policy from an ex-post perspective. This paper also relates to recent work by the
Bank of England (2007), McAndrews et al. (2008), Taylor and Williams (2009), among others,
that discusses the risk premia components of elevated unsecured funding market rates after mid
2007. While Taylor and Williams (2009) associate the rise in risk premia predominantly to credit
risk factors, the common view acknowledges the existence of both credit and liquidity concerns.
However, when measuring these risk components (almost) all empirical studies implicitly assume
orthogonality among their risk proxies and decompose the premia into a credit risk and non-
credit risk part.1 We argue that this approach is inaccurate as the risk measures are shown to be
highly correlated and apartial regression-type decomposition of risk components yields to biased
estimators. Since imperfect multicollinearity tends to produce higher standard errors and thus
small t-values, this might even explain why e.g. Taylor and Williams (2009) find no significant
evidence for liquidity risk in their results.
The remainder of the paper is organized as follows. Thenext section provides an overview of
recent developments in the euro money market and in the Eurosystem’s monetary policy regime.
In particular, it intends to clarify our definition of an effective monetary policy. Section 3 presents
our empirical model and discusses thevariables that might determinethedynamic of Euribor rates.
In section 4, wepresent our empirical results. In section 5, wewill conclude.
2 Monetary Policy and the Euro Money Market during the
Financial Crisis
There are different channels that are viewed to be essential for the effectiveness of monetary pol-
icy.2 A key feature to many of these mechanisms is that the entire expected path of interest rates
plays a crucial role in influencing the cost of lending to households and companies. Thus, an-
ticipated monetary policy is priced into the yield curve and affects in turn the level of economic
activity and pricestability. Therefore, anchoring expectations enhances theeffectiveness of mone-
tary policy in facilitating thetransmission process, seeWoodford (2003). Consequently, thecentral
1The only exception, to our knowledge, is Schwarz (2010) who uses the high frequency data from thee-MID database to derive two orthogonal risk measures. However, this approach implicitly assumes thatthe risk premia in Euribor rates may be completely assigned to liquidity and credit risk. However, it doesnot control for volatility effects of future expected overnight rates as well as market liquidity.
2For a detailed discussion of these transmission channels see e.g. Mishkin (1995) and Bean et al. (2003).Boivin et al. (2010) review the core channels of policy transmission and provide new insights on how thetransmission mechanism might have evolved in recent decades.

10ECBWorking Paper Series No 1328April 2011
bank’s degree of predictability of its actions is important for economic agents.
In the euro area, the overnight indexed swap (OIS) is the main instrument used by market
participants to take speculative positions on expected central bank actions. In general, European
money market rates followed expected short term rates very closely. In fact, in an environment
with sufficient liquidity and no market dislocations the interest rate of term bank deposits ought
to bear aclose relationship with the expectation of the compounded overnight rates over the same
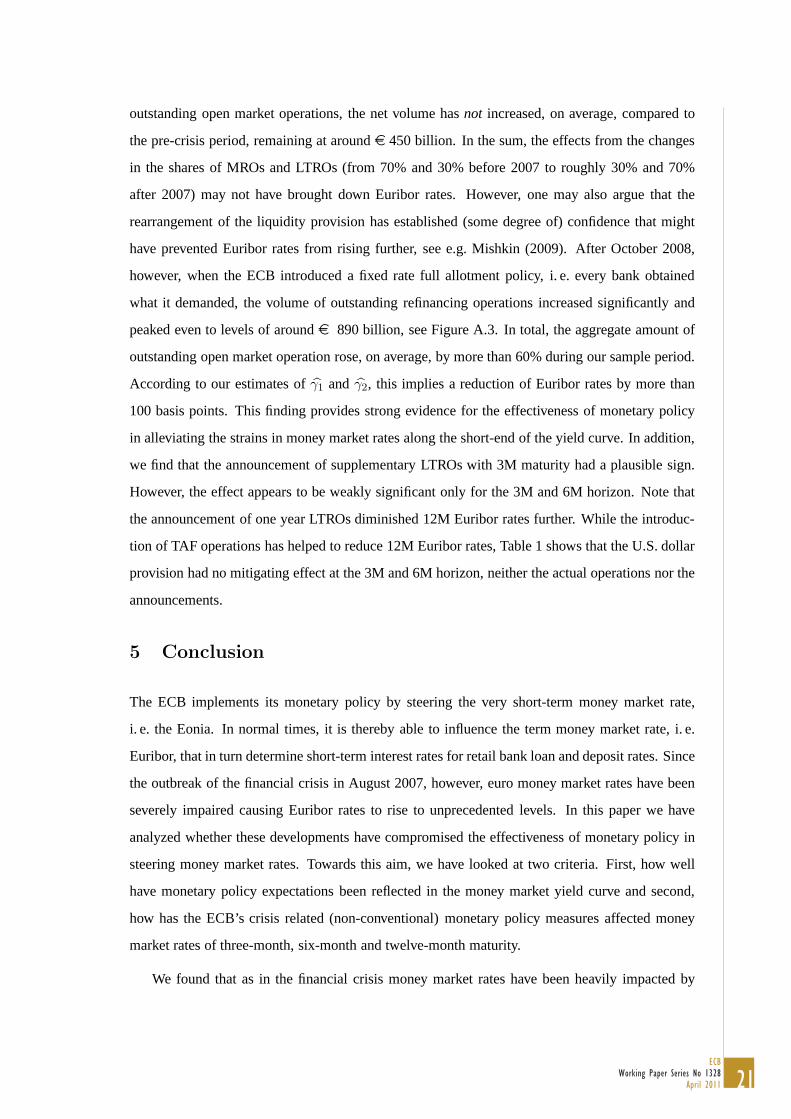
horizon, as implied by the expectation hypothesis. For instance, the three-month (3M) euro inter-
bank offered rate (Euribor) has evolved in a close range to the respective 3M European OIS with
an average spread of around 8 basis points in the period before August 2007, see Figure A.1.3
Since the OIS is tied to the European overnight rate (Eonia), this spread stems from a premium
that banks pay when they borrow funds for a pre-determined period relative to the expected cost
that arises from repeatedly rolling over funding in theovernight market.4
In mid 2007 tensions surrounding assets backed by U.S. sub-prime mortgages started to spill
over into money markets around the world, leading to shortages of liquidity in money markets.
In the euro area, this resulted in an increased demand for liquidity. Combined with heightened
uncertainty, it caused (longer-term) money market rates in the unsecured segment increasingly to
dry up. In particular, the spread between the Euribor and the OIS rates at all maturities widened
significantly suggesting that money market rates along the short end of the yield curve were di-
verging from their risk free counterparts, see Figure A.1. In order to re-stabilize conditions in the
money market, the European Central Bank (ECB) responded to the increased liquidity demand
by changing itsallotment pattern in itsmain refinancing operations (MROs) and extending its liq-
uidity provision in size and frequency through supplementary longer term refinancing operations
(LTROs). More specifically, the ECB started to allot significant excess liquidity at the beginning
of the maintenance period which was then gradually reabsorbed over the remaining weeks of the
period by reducing the allotment above the benchmark. This allowed counterparties to meet their
3Since money market transactions are carried out on a bilateral basis, they are notoriously hard toobtain. Therefore, established reference rates such as the Euribor serve as the best (available) proxy foractual transactions in the unsecured segment of the money market. See also www.euribor.org for furtherdetails. Alternatively, one may use the Italian electronic trading platform e-Mid that accounts for 17 %of all transactions in the shortest-maturity segment of the unsecured European money market. However,since trades are executed in full transparency this platform will rather be used by ”good” banks. Thus,data collected from e-Mid should not vary much, in particular in times of crises, from the Euribor rateswhich themselves are based on a panel of prime banks with the highest credit standards in the euro area.Please refer to Angelini et al. (2009) for an illustration of both data sources.
4More explicitly, the two arbitrage legs are: make a loan of e X for (say) three months and then fundthe loan by borrowing e X each day in the Eonia market and, finally, hedge the interest rate risk bypurchasing an OIS contract, see Gorton and Metrick (2009).
11ECB
Working Paper Series No 1328April 2011
strong preferences of ” frontloading” liquidity at an early stage in the maintenance period. On
average, banks still continued to have a liquidity surplus close to zero at the end of each period
as before August 2007, see e.g. European Central Bank (2010). Additionally, to address the in-
creased liquidity demand in foreign currency theECB established adollar liquidity providing term
auction facility (TAF) through aswap with the USFederal Reserve Bank (Fed).
During the second half of 2008, when Lehman Brothers filed for bankruptcy, banks became
even morereluctant to engage in interbank money market trading and correspondingly relied upon
the use of ECB’s refinancing operations, see e.g. Cassola et al. (2009). The tensions in the euro
areamoney market intensified and Euribor ratesdiverged even further from their OIScounterparts,
seeFigure A.1. On October 15, 2008 theECB responded to theexacerbated crisis by anumber of
extraordinary measures. Morespecifically, theECB switched from thevariable rate tender format
to a fixed rate full allotment policy in order to satisfy the full liquidity demand of the banking
sector. Furthermore, the liquidity provision was extended to refinancing operations with six and
twelvemonthsof maturity. This increase in thenet volume of outstanding open market operations
caused ECB’s balance sheet to grow substantially, see Figure A.3. The ECB took more explicit
steps to lower the cost of unsecured term borrowing and reduced its policy rates by 325 basis
points from 4.25% in October 2008 to 1.00% in May 2009. The provision of liquidity at the
policy rate and the commitment to continue these non-standard monetary policy measures for a
clearly defined period could be interpreted as strong signals to keep rates low as long as needed.5
3 Transmission Mechanism of Monetary Policy
3.1 Modelling the Euribor Dynamics
The (weak) form of the expectation hypothesis of the term structure states, from a theoretical
perspective, the equality between current longer-term rates and the average expected overnight
rate plus a constant maturity specific risk premium, see e.g. Litterman et al. (1991) and Hamilton
and Kim(2002).6 Weusethisrationale toapply thefollowing model inorder tostudy thedynamics
of theEuribor rate (R):
5In fact, once policy rates approach levels closer to zero these measures are crucial in shaping themarket’s expectations about the future monetary policy stance, see e.g. Mishkin (2007).
6We consider the weak form of the expectation hypothesis to be the relevant form. The strong viewwithout a premia conflicts with the fact that yield curves normally slope up which would imply thatshort-term rates are expected to trend upwards indefinitely.

12ECBWorking Paper Series No 1328April 2011
∆Rt(k) = α(1
k
∑k−1
j=0Et∆rt+1+j) + β′Φt(k)
+ γ′CBt + δ′Xt +∑5
j=1ϕj∆Rt−j(k) + ǫt (1)
where ∆ denotes the first-difference operator. Our model is expressed in first differences in
order to avoid potential issues of non-stationarity that wediscuss in the Appendix. α captures the
relationship between thecurrent longer-term rateof duration k and theaverageexpected overnight
rate over the same horizon, 1k
∑k−1j=0 Et∆rt+1+j .7 The expectation hypothesis requires a theoret-
ical one-to-one relationship for it to hold, i. e. α = 1. We do not, however, seek to perform a
restricted model where we impose the expectation hypothesis on our estimation. In fact, in order
to investigate whether the link between Euribor rates and market’s monetary policy expectations
haschanged during thecrisis, weneed to estimateα. In general, acoefficient estimate of (statisti-
cally) less than one need not to point to a failure of the hypothesis, see Kuttner (2001). Heargues
that changes in current longer-term rates on the day of a policy rate change announcement reflect
changes in the average expected overnight rates over the duration of the contract. Therefore, the
impact of a one-day surprise should be less than one-for-one, see Demiralp (2008) for empirical
evidence on the 3M Treasury Bill rate. Furthermore, Demiralp and Jorda (2004) show that many
one-day policy steps have to do with the timing of the action rather than with their ultimate size.
In normal times, the common approach in the expectation hypothesis literature is to treat
the (risk) premium as a time-invariant term that is only of negligible amount. Hence, in a first-
difference representation, it is then assumed to bezero. In afinancial crisis, as recently witnessed,
the premium may not only be significant in size but may also change substantially from one day
to another. To avoid the problem of omitted variable bias, wehave therefore included avector, Φ,
that comprises the various dimensions of risk: (i) (funding and market) liquidity risk, (ii) coun-
terparty risk and (iii) market risk.8 CB is a vector of measures related to ECB’s crisis-related
(non-standard) monetary policy measures undertaken to mitigate the strains in the money market.
We use this variable to investigate whether these measures managed to decrease Euribor rates.9
7For long-term interest rates beyond the 10 year horizon, the Jensen’s inequality term arises becausea log of an expectation does not equal the expectation of a log. At our maturities, however, this term israther negligible and hence needs no consideration in our analysis.
8Among the bank-specific variables, it is useful to distinguish between the compensation for the riskof default and a premium related to the demand for funds, which depends upon the ease of funding byborrowing (funding liquidity). Market-wide conditions include the uncertainty about the path of expectedovernight rates, which is reflected in a term premium, the ease of trading (market liquidity), and factorsrelated to the fixing process and the microstructure of the market.
9Note, however, that this procedure is not sufficient to identify the causal effects of central bank actions.

13ECB
Working Paper Series No 1328April 2011
X reflects a vector of dummies controlling for calendar effects in the data.10 Along the lines of
Hassler and Nautz (2008) and Busch and Nautz (2010), controllability of money market rates re-
quires sufficiently low persistence in longer-term money market rates. If money market rates are
too persistent the lasting impact of shocks can impede the transparency of policy signals and the
central bank’s monetary policy influence on money market rates along theyield curve. Hence, we
measure the persistence in Euribor rates by∑5
j=1 ϕj .11
3.2 Variables
3.2.1 Market’s Expectation
In the euro area, the OIS market constitutes the most important derivative market. In general, it
serves as the main platform to manage short-term interest risk exposures and covers roughly 40%
of the overall OTC derivatives market, see e.g. European Central Bank (2007a). There are two
parties that are involved in a OIS contract out of which one commits to pay a fixed rate (swap
rate) and one paying a variable rate (average Eonia over the maturity of the swap). TheOISt(k)
ratecan be interpreted as theaverageshort-term rate that themarket expects to prevail for thenext
k days. Hence, OIS rates are a natural proxy for the average expected overnight rate, such that
∆OISt(k) ≈1k
∑k−1j=0 Et∆rt+1+j.12 Changes in the OIS rate would, thus, suggest revisions in
expectations of future overnight rates over the course of the correspondingly dated Euribor rate.
In other terms, for an effective monetary policy, α should be significant and positively signed in
order for OIS rates to help to explain Euribor rates.13
3.2.2 Risk Measures
During the recent financial crisis, there have been different forms of risk at play: liquidity risk
(Eisenschmidt and Tapking (2009)), credit risk (Taylor and Williams(2009)), and thecombination
of liquidity and credit risk (Brunnermeier (2009), Brunnermeier and Pedersen (2009), Christensen
et al. (2009), Schwarz (2010), McAndrews et al. (2008)). In the attempt to derive an accurate
measure for each of theadditive formsof risk, the following two approaches havebeen suggested.
Rather, it measures interest rate movements immediately after central bank actions.10For instance, liquidity pressures in money markets may arise due to end-of-year window dressing of
balance sheets by financial institutions.11Since we use daily observations, a lag order of five days seems reasonable. This is also suggested by
the AIC information criteria.12Refer to Carpenter and Demiralp (2009) for a similar approach applied to the U.S. market.13Since March 2008, the announcement of OIS rates has changed from 4:30 p.m. CET to 11 a.m. CET.
In line with the fixing of the Euribor, the definition of ∆OISt(k) is adjusted accordingly.

14ECBWorking Paper Series No 1328April 2011
On the one hand, one may assume that the risk component in Euribor rates are fully explained
by (funding) liquidity and by a credit part. But this approach bears the problem associated with
omitted variable bias since volatility effects of future expected overnight rates as well as market
liquidity, in general, are completely ignored. To circumvent this, one may use on the other hand
a two step approach following the logic of the partitioned regression analysis. This would enable
a decomposition of risk premia into e.g. a credit and non-credit part. Such an approach implic-
itly assumes orthogonality between the risk factors. But as Brunnermeier and Pedersen (2009)
and Brunnermeier (2009) argue, these risk factors mutually affect and even reinforce each other.
Therefore, (at least) one of the estimated coefficients of the risk variables will be biased. This
is a consequence of misleadingly allocating the joint variation of the risk measures to one of the
decomposed risk elements. We will therefore suggest the following variables in order to avoid
these issues and capture the major risk parts in Euribor rates.
The (five-year, BBB rated) yield spread between financial corporate and government bonds
will serve as our credit risk proxy. Bonds, in general, are debt securities generating identical cash
flowsinall statesof theworld. Corporatebondsareissued by companiesasaway of raising money
to invest in their business. They have nominal value which is the amount that will be returned to
the investor on a stated future date (the redemption date). This pays a (usually) fixed interest rate
each year. Government bonds arebacked by the full faith and credit of thefiscal authority. Hence,
afinancial corporatebond normally bearsadefault risk and hencecarrieshigher interest rates than
agovernment bond. Thespread is therefore anatural proxy for credit risk.14 Higher values of this
variable should lead to an increase in Euribor rates.
Asour liquidity risk proxy, wewill usethespread between theratefor fully collateralized loans
(Eurepo GC) in the money market and the risk-free OIS rate. Repurchase agreements between
banks backed by government (guaranteed) bonds and bills are a form of secured lending.15 In
contrast to aswap agreement, in acollateralized transaction liquidity changes hands and therefore
the lending party requires a liquidity premium that depends upon the duration of the loan. Thus,
the Eurepo-OISspread, or the expectations-adjusted Eurepo rate, can be considered as a reliable
liquidity risk proxy.16 And a rise in the spread should put an upward pressure of Euribor rates.
14We may use CDS spreads instead as commonly applied. However, it is not clear whether CDS spreadsreflect a faire probability of default. For instance, in 2008 hedge funds in Iceland engaged in CDS contractsto speculated on sovereign and corporate default.
15Loans at the Eurepo have strict requirements on the type and quality of the collateral. For a list ofeligible collateral, see http://www.eurepo.org
16We are aware of the fact that concerns about the delivery or return of the collateral may be priced inEurepo rates. Furthermore, in a strict sense OIS rates are not risk-free as one of the involved parties may

15ECB
Working Paper Series No 1328April 2011
We use the Chicago Board Options Exchange Volatility Index (VIX) in order to account for
implied future volatility in the stock market. VIX is a weighted average of implied volatilities
of a wide range of Standard and Poor’s 500 index (put and call) options. It reflects market’s
expectation of volatility over the next 30 days period and is often referred to as the ” investor fear
gauge”. In addition, since the VIX captures (expected) adverse price changes of market valued
assets, it thereby reflects (at least indirectly) changes in market liquidity as well. As presented in
Brunnermeier and Pedersen (2009), when funding liquidity dries up in an environment of market
stress, margins will be recalled and that in turn will affect asset prices as they will drop due to
fire sales. As a result, market liquidity will dry up too. High values of VIX point to a greater
uncertainty in the stock market that should put an upward pressure on Euribor rates.
3.2.3 Central Bank Measures
As part of its weekly financial statement, the ECB announces its net lending associated with its
monetary policy operations to credit institutions. The outstanding volumes of both the MROs
and all LTROs are therefore a natural variable representing the size of the ECB’s liquidity provi-
sion. While the ECB’s open market operations do not have a direct impact on money and credit
aggregates, they may have affected monetary developments indirectly through their impact on
short-term money market rates and the pass-through of these rates to bank lending and deposit
rates. Such indirect effects, which work through the opportunity cost of holding money and the
cost of external financing, reflect demand by households and firms for money and bank credit. In
general, more liquidity supply should affect interest rates.
In pre-crisis times, MROs should not affect Euribor rates since the ECB’s liquidity manage-
ment is performed so as to allow banks to fulfill their reserve requirements during the reserve
maintenance period which is usually 4 to 5 weeks. LTROs should have no impact on the Euri-
bor before August 2007 whatsoever since these operations were conducted as variable rate tender
without a minimum bid rate. Hence, the ECB acted as a price taker and pre-announced the liq-
uidity amount that it deemed appropriate to allot. Alternatively, one may argue that MROs and
LTROs aimed to satisfy neutral conditions before August 2007 while after mid 2007, MROs and
LTROsbecame apolicy instrument to steer interest rates.
In any case, if the wide range of crisis-related (non-standard) monetary policy measures un-
default and the remaining party is subject to the differential in the fixed and overnight components of theswap.

16ECBWorking Paper Series No 1328April 2011
dertaken by theECB asof August 2007 wereeffective in lowering thestrains in themoney market,
we would expect a reduction in Euribor rates through the increase in net volume of outstanding
open market operations. To examine theeffect of theUSdollar liquidity provision through aswap
with theU.S. Fed, wedefineadummy variable as follows.17 Theindicator denoted by DTAF = 1
on aday of any term auction facility (TAF) operation and zero on other days.
Furthermore, we control for the announcement effect of each operation since news releases
can change prices themselves. Regular MROs and LTROs are announced in an annual indicative
calendar three months before the year for which it is valid. Therefore, we will only consider
announcement effects related to supplementary refinancing operations (sLTRO) during the crisis
period. Hence, DansLTRO = 1 for all days on which a sLTRO was announced and zero otherwise.
In the same vein, we define DanTAF = 1 for all announcement days of TAF operations and zero
otherwise.18 If the undertaken measures have been effective in reducing elevated money market
rates, the expected signs of thecoefficients are negative.
3.3 Data
Weusedaily data from March 2004 to June2009 to estimateequation (1) for the3M, 6M and 12M
Euribor. Prior to March 2004, banks had difficulties to assess the ECB’s allotment policy. Banks
had to carry out complex still not accurate calculations in order to determine ECB’s benchmark
allotment. This uncertainty about ECB’s behavior caused uncertainty regarding money market
ratesand thusthepricing of risk premiaalong theyield curve, seee.g. Jardet and Fol (2007). From
March 2004 onwards, the ECB facilitated counterparties’ anticipation of its liquidity allotment in
theMROsby publishing itscalculation of thebenchmark allotment.19 Toensurethat our dynamics
in Euribor rates arenot affected by bank’s uncertainty about ECB’sallotment stance, wewill start
17Taylor and Williams (2009) and McAndrews et al. (2008) apply a similar technique for the federalfunds and U.S. Libor market. Note that for this analysis, modeling our equation of the Euribor in firstdifferences is the most appropriate approach. A level representation would implicitly assume that the(liquidity) risk premium that might fall on a day of ECB’s operation will revert to the previous levelimmediately after the operation. However, if the liquidity premium remains at the lower level over manydays after an operation, the estimated coefficient of the event cannot be interpreted as a central bank effectand it would likely appear insignificant.
18On February 1, 2008 the ECB announced that it would not participate in the February US dollarliquidity providing operations. Therefore, we define Dan
TAF = −1 for that special date since this announce-ment might have reduced the anticipated supply of liquidity in the TAFs and thereby might have put anupward pressure on money market rates.
19The benchmark allotment is the allotment normally required to establish balanced conditions in theshort-term money market, given the ECB’s complete liquidity forecast. Balanced liquidity conditionsshould normally result in an overnight rate close to the policy rate. The benchmark allotment constitutesa baseline for the ECB when making its actual allotment decision, see European Central Bank (2004).
17ECB
Working Paper Series No 1328April 2011
our sample with the first maintenance period after ECB’s operational framework revision on 10
March, 2004.
In order to account for thechanges in risk premiaand in thedemand and supply of liquidity, we
allow money market rates to respond differently to itsdeterminants after August 2007. Therefore,
we explore the Euribor dynamics for the crisis and pre-crisis sample separately. In fact, splitting
our sample on August 9, 2007 is also implied by structural breakpoint tests, see Section D in the
Appendix. This leaves us with 802 and 424 observation for the period 10 March 2004 - 8 August
2007 (pre-crisis) and 9 August 2007 - 30 June 2009 (crisis), respectively. Table1 summarizes the
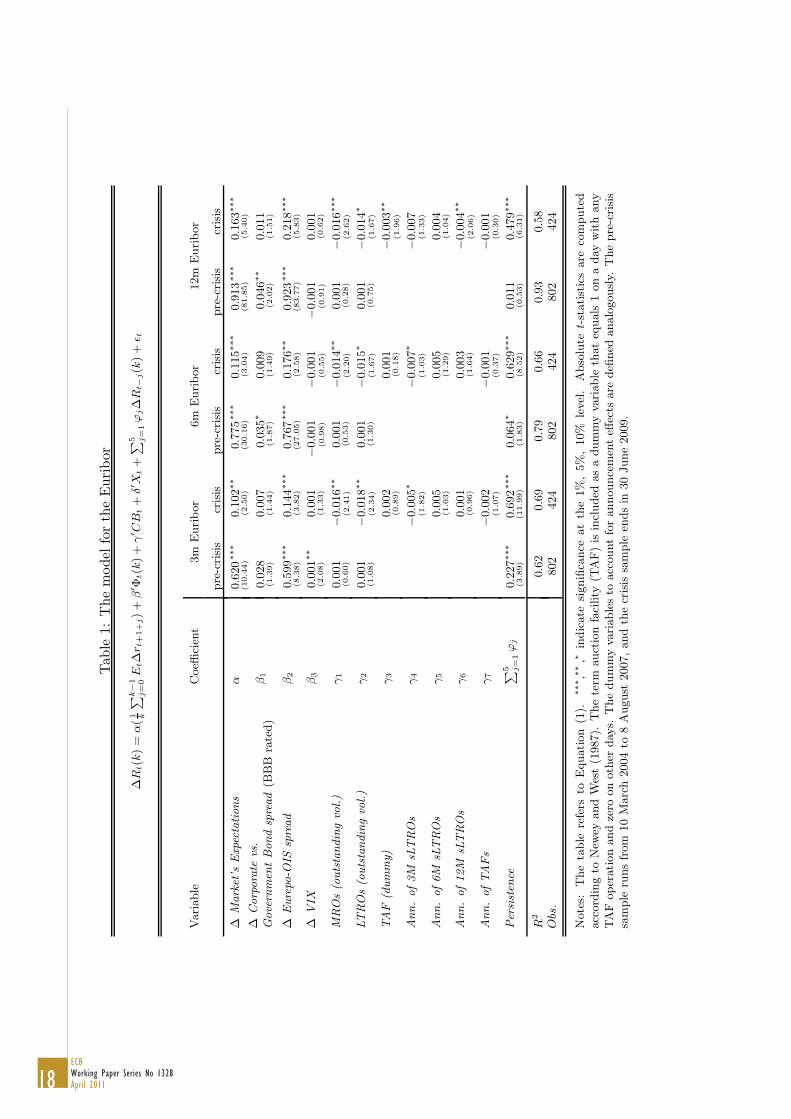
estimation results for our model of the 3M, 6M and 12M Euribor.
4 The Effectiveness of Monetary Policy: Empirical Results
4.1 Before the Crisis
For all our maturities, α is plausibly signed and highly significant. This suggests that, all other
thingsbeing equal, an expected changein thepolicy rateproducesashift in theyield curve, at least
at theshort end. If marketsexpect short-term rates to rise in thenear future, there isaproportional
increase in Euribor rates. According to our results, an expected policy rate change of 25 basis
points will cause the 3M, 6M and 12M Euribor rate to rise immediately by 17, 19 and 23 basis
points, respectively.20 This result strongly supports the relevance of market’s monetary policy
expectations for longer-term money market rates.
Our results also show that risk premia determine euro unsecured money market rates in a sig-
nificant way. Both credit risk and liquidity risk considerations increase with maturity. In absolute
terms, themajor component of therisk premia in Euribor ratescan beassigned to (funding) liquid-
ity risk. Changes in the expectation-adjusted GC Eurepo rate by 10 basis points will be followed
by upward movements in the 3M, 6M and 12M Euribor rate by roughly 6, 8, and 9 basis points,
respectively.21
20Note that we relaxed the the assumption of the constant premia. Hence, the expectation hypothesisno longer attributes all changes in the yield curve solely to changes in expected short rates.
21The Wald test of parameter equality (not reported) cannot reject the null hypothesis H0 : α = β2.Since ∆Eurepo = ∆OIS +∆(Eurepo− OIS), equation (1) is a re-parametrization of the representationwhich includes both the relationships between market expectations and Euribor rates and the secured vs.unsecured money market rates, i. e. ∆OIS and ∆Eurepo. This close connection has been reported byTaylor and Williams (2009) for U.S. equivalents.
18ECBWorking Paper Series No 1328April 2011
Tab
le1:
Themodel
fortheEuribor
∆R
t(k)=
α(1 k
∑
k−1
j=0E
t∆rt+1+j)+
β′Φ
t(k)+
γ′CB
t+
δ′X
t+
∑
5 j=1ϕ
j∆R
t−j(k)+
ǫ t
Variable
Coeffi
cien
t3m
Euribor
6m
Euribor
12m
Euribor
pre-crisis
crisis
pre-crisis
crisis
pre-crisis
crisis
∆Market’s
Expectations
α0.620
(10.44)
∗∗∗
0.102
(2.50)
∗∗
0.775
(30.16)
∗∗∗
0.115
(3.04)
∗∗∗
0.913
(81.85)
∗∗∗
0.163
(5.40)
∗∗∗
∆Corporate
vs.
Govern
men
tBondspread(B
BB
rated)
β1
0.028
(1.39)
0.007
(1.44)
0.035
(1.87)
∗0.009
(1.49)
0.046
(2.02)
∗∗
0.011
(1.51)
∆Eurepo-O
ISspread
β2
0.599
(8.38)
∗∗∗
0.144
(3.82)
∗∗∗
0.767
(27.05)
∗∗∗
0.176
(2.58)
∗∗
0.923
(83.77)
∗∗∗
0.218
(5.83)
∗∗∗
∆VIX
β3
0.001
(2.08)
∗∗
0.001
(1.33)
−0.001
(0.98)
−0.001
(0.55)
−0.001
(0.91)
0.001
(0.62)
MROs(outstandingvol.)
γ1
0.001
(0.60)
−0.016
(2.41)
∗∗
0.001
(0.53)
−0.014
(2.20)
∗∗
0.001
(0.28)
−0.016
(2.62)
∗∗∗
LTROs(outstandingvol.)
γ2
0.001
(1.08)
−0.018
(2.34)
∗∗
0.001
(1.30)
−0.015
(1.67)
∗0.001
(0.75)
−0.014
(1.67)
∗
TAF
(dummy)
γ3
0.002
(0.89)
0.001
(0.18)
−0.003
(1.96)
∗∗
Ann.of3M
sLTROs
γ4
−0.005
(1.82)
∗−0.007
(1.03)
∗−0.007
(1.33)
Ann.of6M
sLTROs
γ5
0.005
(1.03)
0.005
(1.29)
0.004
(1.04)
Ann.of12M
sLTROs
γ6
0.001
(0.96)
0.003
(1.64)
−0.004
(2.06)
∗∗
Ann.ofTAFs
γ7
−0.002
(1.07)
−0.001
(0.37)
−0.001
(0.30)
Persisten
ce∑
5 j=1ϕ
j0.227
(3.89)
∗∗∗
0.692
(11.99)
∗∗∗
0.064
(1.83)
∗0.629
(8.52)
∗∗∗
0.011
(0.53)
0.479
(6.31)
∗∗∗
R2
0.62
0.69
0.79
0.66
0.93
0.58
Obs.
802
424
802
424
802
424
Notes:
Thetable
refers
toEquation
(1).
∗∗∗,∗
∗,∗
indicate
significance
atthe1%,5%,10%
level.
Absolute
t-statisticsare
computed
accordingto
New
eyandWest(1987).
Theterm
auctionfacility
(TAF)is
included
asadummyva
riable
thateq
uals
1onaday
withany
TAFoperationandzero
onother
day
s.Thedummyva
riablesto
accountforannouncemen
teff
ects
are
defi
ned
analogously.
Thepre-crisis
sample
runsfrom
10March2004to
8August
2007,andthecrisis
sample
endsin
30June2009.

19ECB
Working Paper Series No 1328April 2011
Given thehigh correlation (0.47) between theyield spread of corporate and government bonds
and theVIX, our respectivedataset provides little information about what happensto Euribor rates
when credit risk concerns are low but VIX is high, or vice versa. In fact, the weak power to reject
the null of non-significance is very likely to be due to the issue associated with imperfect multi-
collinearity: high correlation between the regressors leads to large variance of the OLS estimator
that in turn causes small t-values.22 The F-tests of joint significance (see B.1 in the Appendix)
show clearly that there isasignificant joint impact stemming from theserisk measures. This result
supports our approach to include a set of risk variables into our estimation that otherwise would
suffer from the problem of omitted variable bias. However, our OLS estimators remain unbiased
and the overall fit isnot affected.
In line with our hypotheses, there is no particular effect from the Eurosystem’s open market
operations on money markets during tranquil times. This is intuitive since the liquidity amount to
beallotted in ECB’sLTROshasalwaysbeen pre-announced. The low persistence in Euribor rates
before mid 2007 highlight the ECB’sstable control over longer-term money market rates.
4.2 During the Crisis
For theperiod after theonset of thefinancial crisis, wepresent our empirical resultsof theEuribor
equation in thesecond column of each maturity horizon in Table1. At first sight, the results differ
from those obtained for the pre-crisis period in two important aspects.
First, according to the large and significant estimates of ϕj Euribor rates became severely
persistent. In fact, we observe a threefold increase in persistence for the 3M rates, a 10-fold
increase for 6M rates, and a 45-fold rise in 12M rates. Second, the predictability of Euribor rates
on the basis of market expectations of future overnight rates has diminished quite significantly.
An anticipated policy rate change of 25 basis points is now accompanied by a contemporaneous
increaseof the3M, 6M, and 12M Euribor rateby roughly 3 basispoints. In addition to theseshort-
term effects, our estimates also suggest a change in the long-run dynamics during the period after
mid 2007. For instance, while the long-term effects of market’s expectations on the 3M, 6M, and
12M Euribor before thecrisisamounted to 0.80, 0.83, and 0.92, respectively, thecoefficientswere
22To see this effect we consider the variance of β1 in a multiple regression setup with two regressors (X1
and X2) for the simple case of a homoskedastic error. In large samples, the sampling distribution of β1 is
N(β1, σ2β1
), where σ2β1
= 1n
(
11−ρ2
X1,X2
)
σ2
u
σ2
X1
. The variance of β1 is inversely proportional to 1 − ρ2X1,X2,
where ρ2X1,X2is the correlation between X1 and X2.

20ECBWorking Paper Series No 1328April 2011
roughly 0.33, 0.30, and 0.31, respectively, after August 2007.23 Hence, thehigher persistence and
the related more lasting impact of shocks may have contributed to the increase in the marginal
cost of funding bank loans in the interbank market. Moreover, this greater persistency in money
market rates also implies that it is more difficult for monetary policy signals to be transmitted
through money market rates along the yield curve viaconventional channels of monetary policy.
Following Table B.1, during the crisis liquidity risk and credit risk concerns have become
severely correlated. This stylized fact is consistent with the general view that liquidity and credit
risk cannot be separated as both measures mutually affect each other, see e.g. Sarkar (2009) and
the references therein. Hence, it remains difficult to interpret the coefficients β1, β2, and β3.
The F-statistic, however, implies that there is a significant join impact stemming from the risk
measures.
Table 2: Wald tests on parameter equality
H0 : D = 0 3m Euribor 6m Euribor 12m Euribor
∆ Market’s ExpectationsD : αprecrisis
− αcrisis =0.518(0.0000)
0.660(0.0000)
0.750(0.0000)
CB measures (outstanding vol.)D : γprecrisis
1 − γcrisis1 =
0.017(0.0068)
0.015(0.0185)
0.017(0.0070)
D : γprecrisis2 − γcrisis
2 =0.019(0.0137)
0.016(0.0710)
0.015(0.0803)
D : (γ1 + γ2)precrisis
− (γ1 + γ2)crisis =
0.018(0.0044)
0.015(0.0151)
0.016(0.0096)
PersistenceD :
∑5j=1 ϕ
precrisisj −
∑5j=1 ϕ
crisisj =
−0.465(0.0000)
−0.565(0.0000)
−0.468(0.0000)
Notes: Wald statistics refer to the estimated coefficients in Table1. p-values arepresented in parentheses.
Probably reflecting the decreasing ability to manage expectations properly, the estimated rep-
resentation of theEuribor rates indicates agrowing importanceof the refinancing volumesallotted
in the MROs and LTROs. However, we cannot reject the null hypothesis H0 : γ1 = γ2, see Ta-
ble 2. Hence, the ECB’s liquidity provision may only lower Euribor rates when the net volume
of outstanding open market operations changes significantly. Recall that until October 2008, even
though the ECB rearranged the pattern and shares of MROs and LTROs in the total volume of
23The fact that there is a difference between short-term and long-term coefficients is a result of ourspecification which includes lagged endogenous variables. To illustrate this, let us consider our model inthe following general representation: yt = c+
∑p
j=1 ϕjyt−j + θ′Xt + ǫt, where ǫt is an iid shock and Xt avector of exogenous variables. Supposing that E(yt) and E(Xt) are constant over time, our model can be
rewritten as E(yt) =c
1−∑p
j=1ϕj
+
(
θ
1−∑p
j=1ϕj
)
′
E(Xt) where the long-run relationship between y and X
is thus given by θ
1−∑p
j=1ϕj
.
21ECB
Working Paper Series No 1328April 2011
outstanding open market operations, the net volume has not increased, on average, compared to
the pre-crisis period, remaining at around e 450 billion. In the sum, the effects from the changes
in the shares of MROs and LTROs (from 70% and 30% before 2007 to roughly 30% and 70%
after 2007) may not have brought down Euribor rates. However, one may also argue that the
rearrangement of the liquidity provision has established (some degree of) confidence that might
have prevented Euribor rates from rising further, see e.g. Mishkin (2009). After October 2008,
however, when the ECB introduced a fixed rate full allotment policy, i. e. every bank obtained
what it demanded, the volume of outstanding refinancing operations increased significantly and
peaked even to levels of around e 890 billion, see Figure A.3. In total, the aggregate amount of
outstanding open market operation rose, on average, by more than 60% during our sample period.
According to our estimates of γ1 and γ2, this implies a reduction of Euribor rates by more than
100 basis points. This finding provides strong evidence for the effectiveness of monetary policy
in alleviating the strains in money market rates along theshort-end of theyield curve. In addition,
we find that the announcement of supplementary LTROs with 3M maturity had a plausible sign.
However, the effect appears to be weakly significant only for the 3M and 6M horizon. Note that
the announcement of one year LTROsdiminished 12M Euribor rates further. While the introduc-
tion of TAF operations hashelped to reduce 12M Euribor rates, Table1 shows that theU.S. dollar
provision had no mitigating effect at the3M and 6M horizon, neither theactual operations nor the
announcements.
5 Conclusion
The ECB implements its monetary policy by steering the very short-term money market rate,
i. e. the Eonia. In normal times, it is thereby able to influence the term money market rate, i. e.
Euribor, that in turn determineshort-term interest rates for retail bank loan and deposit rates. Since
the outbreak of the financial crisis in August 2007, however, euro money market rates have been
severely impaired causing Euribor rates to rise to unprecedented levels. In this paper we have
analyzed whether these developments have compromised the effectiveness of monetary policy in
steering money market rates. Towards this aim, we have looked at two criteria. First, how well
have monetary policy expectations been reflected in the money market yield curve and second,
how has the ECB’s crisis related (non-conventional) monetary policy measures affected money
market rates of three-month, six-month and twelve-month maturity.
We found that as in the financial crisis money market rates have been heavily impacted by

22ECBWorking Paper Series No 1328April 2011
risk concerns, the ability of the central bank to steer money market rates via standard channels
of monetary policy transmission was weakened. We show that the reflection of monetary policy
expectations in Euribor rates has declined substantially. At the same time, however, our results
indicate that the ECB’scrisis-related (non-standard) monetary policy measures have proven to be
effective in reducing money market rates.
We conclude that part of the loss in the effectiveness of monetary policy during the financial
crisis via the traditional interest rate channel was compensated by the effective use of liquidity
operations affecting money market rates beyond the daily maturity. In fact, before the crisis mon-
etary policy operations were neutral with respect to the monetary policy stance, i.e. they did not
affect money market rates at longer term maturities. During the financial crisis, however, the sig-
nificant expansion of the central bank balance sheet and the conduct of fixed rate tenders with full
allotment have exerted a significant influence on the dynamics of money market rates at three-
month, six-month, and twelve-month maturities. In particular, our results indicate that the ECB’s
net increase in outstanding open market operations as of October 2008 accounts for at least a 100
basis point decline in Euribor rates. Therefore, overall, our results clearly show that central banks
indeed have adequate tools at their disposal to conduct effective monetary policy, also in times of
crises.
23ECB
Working Paper Series No 1328April 2011
References
Angelini, P., A. Nobili and M.C. Picillo (2009): The interbank market after August 2007: whathas changed, and why?, Economic Working Papers No. 731, Bank of Italy.
Bank of England (2007): An Indicative Decomposition of Libor Spreads, Quarterly Bulletin No.Q4.
Bean, C., J.D. Larsen and K. Nikolov (2003): Financial Frictions and the Monetary TransmissionMechanism: Theory, Evidence and Policy Implications, in: I. Angeloni, A. Kashyap, andB. Mojon (Eds.), Monetary Policy Transmission in the Euro Area, Cambridge, UK: CambridgeUniversity Press, pp. 107–130.
Bernoth, K. and J. von Hagen (2004): The Euribor Futures Market: Efficiency and the Impact ofECB Policy Announcements, International Finance, 7(1), 1–24.
Boivin, J., M.T. Kiley and F.S. Mishkin (2010): How Has the Monetary Transmission Mecha-nism Evolved Over Time?, NBER Working Papers No. 15879, National Bureau of EconomicResearch, Inc.
Brunnermeier, M.K. (2009): Deciphering theLiquidity and Credit Crunch 2007-2008, Journal ofEconomic Perspectives, 23(1), 77–100.
Brunnermeier, M.K. and L.H. Pedersen (2009): Market Liquidity and Funding Liquidity, Reviewof Financial Studies, 22(6), 2201–2238.
Busch, U. and D. Nautz (2010): Controllability and Persistence of Money Market Ratesalong theYield Curve: Evidence from theEuro Area, German Economic Review, 11(3), 367–380.
Campbell, J.Y. and R.J. Shiller (1991): Yield Spreadsand Interest RateMovements: A Bird’sEyeView, Review of Economic Studies, 58(3), 495–514.
Carpenter, S. and S. Demiralp (2009): Money and the Transmission of Monetary Policy,TUSYAD-KocUniversity Economic Research Forum Working PapersNo. 0906, TUSIAD-KocUniversity Economic Research Forum.
Cassola, N., A. Hortacsu and J. Kastl (2009): The2007 SubprimeMarket CrisisThrough theLensof European Central Bank Auctions for Short-Term Funds, Working Paper No. 15158, NationalBureau of Economic Research.
Chatelain, J.B., A. Generale, I. Hernando, P. Vermeulen and U.V. Kalckreuth (2003): New Find-ings on Firm Investment and Monetary Policy Transmission in the Euro Area, Oxford Review
of Economic Policy, 19(1), 73–83.
Christensen, J.H.E., J.A. Lopez and G.D. Rudebusch (2009): Do central bank liquidity facilitiesaffect interbank lending rates?, Working Paper Series No. 2009-13, Federal Reserve Bank ofSan Francisco.
de Bondt, G., B. Mojon and N. Valla (2005): Term Structure and theSluggishness of Retail BankInterest Rates in Euro AreaCountries, Working Paper Series No. 518, European Central Bank.
Demiralp, S. (2008): Monetary policy surprises and the expectations hypothesis at the short endof theyield curve, Economics Letters, 101(1), 1–3.

24ECBWorking Paper Series No 1328April 2011
Demiralp, S. and O. Jorda (2004): The Response of Term Rates to Fed Announcements, Journalof Money, Credit and Banking, 36(3), 387–405.
Ehrmann, M., L. Gambacorta, J. Martinez-PagEs, P. Sevestre and A. Worms (2003): The Effectsof Monetary Policy in the Euro Area, Oxford Review of Economic Policy, 19(1), 58–72.
Ehrmann, M. and A. Worms(2004): Bank Networksand Monetary Policy Transmission, Journal
of theEuropean Economic Association, 2(6), 1148–1171.
Eickmeier, S., B. Hofmann and A. Worms (2006): Macroeconomic Fluctuations and Bank Lend-ing: Evidence for Germany and the Euro Area, Discussion Paper Series 1: Economic StudiesNo. 2006,34, Deutsche Bundesbank, Research Centre.
Eisenschmidt, J. and J. Tapking (2009): Liquidity risk premia in unsecured interbank moneymarkets, Working Paper Series No. 1025, European Central Bank.
European Central Bank (2004): Publication of theBenchmark Allotment in theMain RefinancingOperations, Monthly Bulletin, April.
European Central Bank (2007a): Euro Money Market Study 2006.
European Central Bank (2007b): Evidence of the Impact of Recent Financial Market Tensions,as revealed by Bank Lending Surveys in Major Industrialised Economies, Monthly Bulletin,December.
European Central Bank (2010): The ECB’s Monetary Policy Stance During the Financial Crisis,Monthly Bulletin, January.
Gorton, G.B. and A. Metrick (2009): Securitized Banking and the Run on Repo, NBER WorkingPapers No. 15223, National Bureau of Economic Research, Inc.
Hamilton, J.D. and D.H. Kim (2002): A Reexamination of thePredictability of Economic ActivityUsing the Yield Spread, Journal of Money, Credit and Banking, 34(2), 340–360.
Hassler, U. and D. Nautz (2008): On the Persistence of the Eonia Spread, Economics Letters,101(3), 184–187.
Jardet, C. and G.L. Fol (2007): Euro money market interest rates dynamics and volatility: Howthey respond to recent changes in the operational framework, Documents de Travail No. 167,Banque deFrance.
Kuttner, K.N. (2001): Monetary Policy Surprisesand Interest Rates: Evidencefrom theFed FundsFutures Market, Journal of Monetary Economics, 47(3), 523–544.
Litterman, R.B., J. Scheinkman and L. Weiss (1991): Volatility and the Yield Curve, Journal of
Fixed Income, 1(1), 49–53.
McAndrews, J., A. Sarkar and Z. Wang (2008, July): The Effect of the Term Auction Facility onthe London Inter-Bank Offered Rate, Federal Reserve Bank of New York Staff Reports (335).
Mishkin, F.S. (1995): Symposium on the Monetary Transmission Mechanism, Journal of Eco-nomic Perspectives, 9(4), 3–10.

25ECB
Working Paper Series No 1328April 2011
Mishkin, F.S. (2007): Inflation Dynamics, International Finance, 10(3), 317–334.
Mishkin, F.S. (2009): IsMonetary Policy Effectiveduring Financial Crises?, American EconomicReview, 99(2), 573–77.
Newey, W.K. and K.D. West (1987): A Simple, Positive Semi-Definite, Heteroskedasticity andAutocorrelation Consistent Covariance Matrix, Econometrica, 55(3), 703–708.
Peersman, G. and F. Smets (2003): The Monetary Transmission Mechanism in the Euro Area:More Evidence from VAR Analysis, in: I. Angeloni, A. Kashyap, and B. Mojon (Eds.), Mon-etary Policy Transmission in the Euro Area, Cambridge, UK: Cambridge University Press, pp.36–55.
Rudebusch, G.D. (1995): Federal Reserve Interest RateTargeting, Rational Expectations, and theTerm Structure, Journal of Monetary Economics, 35, 245–274.
Rudebusch, G.D. (1998): Monetary Policy and theTerm Structureof Interest Rates: An Overviewof SomeRecent Research, in: I. Angeloni and R. Rovelli (Eds.), Monetary Policy and theTermStructure of Interest Rates, New York, USA: St. Martin’s Press, pp. 263–271.
Sarkar, A. (2009): Liquidity Risk, Credit Risk, and theFederal Reserve’s Responses to theCrisis,Financial Markets and Portfolio Management, 23(4), 335–348.
Schwarz, K. (2010): Mind theGap: Disentangling Credit and Liquidity in Risk Spreads, WorkingPaper Series, Wharton School, University of Pennsylvania.
Sorensen, C.K. and T. Werner (2006): Bank Interest RatePass-Through in theEuro Area: aCrossCountry Comparison, Working Paper Series No. 580, European Central Bank.
Taylor, A.M. (2001): Potential Pitfalls for the Purchasing-Power-Parity Puzzle? Sampling andSpecification Biases in Mean-Reversion Tests of the Law of One Price, Econometrica, 69(2),473–498.
Taylor, J.B. and J.C. Williams (2009): A Black Swan in the Money Market, American EconomicJournal: Macroeconomics, 1(1), 58–83.
Woodford, M. (2003): Interest and Prices, princeton university press, princeton, n.j. Edition.
26ECBWorking Paper Series No 1328April 2011
A Figures
Figure A.1: The 3M, 6M, and 12M Euribor-OIS Spread
Notes: The shaded area refers to the period after August 9, 2007 and the dashedvertical line refers to the Lehman bankruptcy on September 15, 2008.
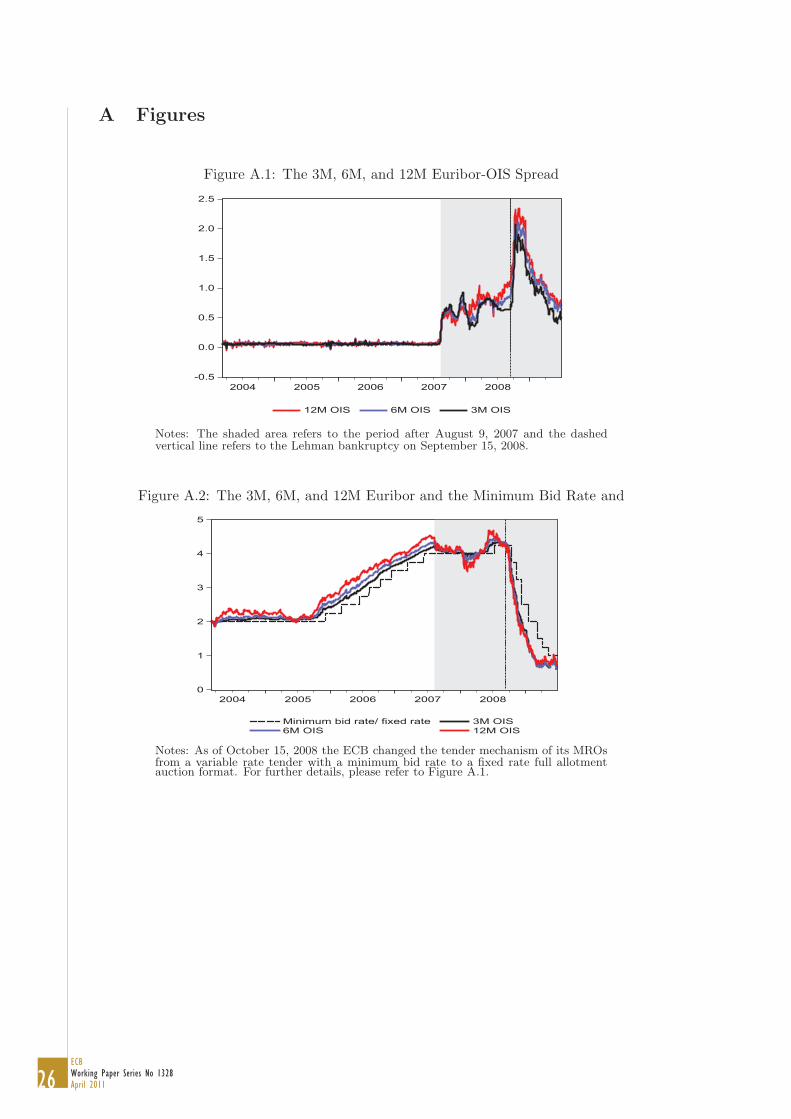
Figure A.2: The 3M, 6M, and 12M Euribor and the Minimum Bid Rate and
Notes: As of October 15, 2008 the ECB changed the tender mechanism of its MROsfrom a variable rate tender with a minimum bid rate to a fixed rate full allotmentauction format. For further details, please refer to Figure A.1.

27ECB
Working Paper Series No 1328April 2011
Figure A.3: The Outstanding Volumes related to MROs and LTROs (in billion euros)
Notes: Prior to August 2007, the average outstanding volume associated with re-financing operations amounted to e 450 billions. This changed drastically in theperiod after the Lehman bankruptcy. In the period from mid 2007 until June 2009,the outstanding volume inclined to e 890 billions. For further details, please refer toFigure A.1.
Figure A.4: The 3M Eurepo-OIS Spread, 5Y Bond Yield Spread and VIX
Notes: For details, please refer to Figure A.1

28ECBWorking Paper Series No 1328April 2011
Tab
leA.1:TheEuribor
dynam
icsbeforean
dafterOctob
er2008
ΔR
t(k)=
α(1 k
∑ k−1
j=0E
tΔrt+1+j)+
β′Φ
t(k)+
γ′CB
t+
δ′X
t+
∑ 5 j=1ϕ
jΔR
t−j(k)+
ε t
Variable
Coeffi
cien
t3m
Euribor
6m
Euribor
12m
Euribor
untilOct
2008
after
Oct
2008
untilOct
2008
after
Oct
2008
untilOct
2008
after
Oct
2008
ΔMarket’s
Expectations
α0.112
(2.15)
∗∗
0.142
(3.32)
∗∗∗
0.161
(4.49)
∗∗∗
0.107
(4.56)
∗∗∗
0.237
(9.32)
∗∗∗
0.112
(5.83)
∗∗∗
ΔCorporate
vs.
Govern
men
tBondspread(B
BB
rated)
β1
0.041
(2.29)
∗∗
0.002
(0.33)
0.058
(3.15)
∗∗∗
−0.002
(0.45)
0.075
(3.07)
∗∗∗
−0.001
(0.08)
ΔEurepo-O
ISspread
β2
0.196
(3.10)
∗∗∗
0.131
(4.17)
∗∗∗
0.217
(4.92)
∗∗∗
0.187
(3.45)
∗∗∗
0.260
(9.36)
∗∗∗
0.138
(4.36)
∗∗∗
ΔVIX
β3
0.001
(0.74)
0.001
(1.32)
−0.001
(0.64)
−0.001
(1.53)
−0.001
(0.58)
−0.001
(1.55)
MROs(outstandingvol.)
γ1
−0.017
(2.13)
∗∗
−0.017
(1.97)
∗∗
−0.009
(1.84)
∗∗
−0.019
(2.32)
∗∗
−0.008
(1.99)
∗∗
−0.023
(2.87)
∗∗∗
LTROs(outstandingvol.)
γ2
−0.024
(2.70)
∗∗∗
−0.016
(2.28)
∗∗
−0.012
(1.89)
∗∗
−0.022
(1.87)
∗−0.007
(1.73)
∗−0.025
(2.21)
∗∗
TAF
(dummy)
γ3
−0.002
(0.90)
0.001
(0.19)
−0.001
(0.28)
−0.001
(0.18)
−0.004
(1.08)
∗∗
−0.002
(0.72)
Ann.of3M
sLTROs
γ4
−0.002
(0.74)
0.008
(0.69)
−0.006
(1.05)
0.018
(1.52)
−0.006
(1.00)
0.016
(1.33)
Ann.of6M
sLTROs
γ5
0.013
(1.40)
−0.008
(0.71)
0.004
(0.37)
−0.010
(0.97)
0.003
(0.31)
−0.008
(0.72)
Ann.of12M
sLTROs
γ6
0.001
(0.58)
0.010
(0.94)
0.002
(0.13)
0.001
(0.32
−0.004
(0.23)
0.001
(0.56
Ann.ofTAFs
γ7
0.003
(0.83)
0.001
(0.31)
0.002
(0.47)
−0.002
(0.58)
0.001
(0.27)
−0.002
(0.64)
Persisten
ce∑ 5 j
=1ϕ
j0.662
(6.85)
∗∗∗
0.676
(9.71)
∗∗∗
0.516
(6.59)
∗∗∗
0.677
(8.15)
∗∗∗
0.285
(4.04)
∗∗∗
0.638
(7.57)
∗∗∗
R2
0.58
0.81
0.61
0.74
0.48
0.72
Obs.
274
150
274
150
274
150
Notes:
Theaim
ofthis
table
isto
show
thatourresultsfortheperiodafter
August
2007are
notdriven
bythestructuralch
angein
ECB’s
tender
procedure
as
ofOctober
2008.Thetable
refers
toEquation(1).
Thefirstcolumnforeach
interest
rate
refers
totheperiodfrom
9August
2007to
14October
2008,while
thesecondcolumncoversthesample
asofOctober
152008untilJune302009.Forfurther
details,
please
referto
Table
1
29ECB
Working Paper Series No 1328April 2011
B Correlation Analysis
Table B.1: Correlation Analysis among Risk Measures
Pre-crisis Crisis
Corporate vs. VIX Corporate vs. VIX
Government Bond Government Bond
3-Month Eurepo-OIS −0.19(0.00)
0.06(0.10)
0.52(0.00)
0.64(0.00)
6-Month Eurepo-OIS −0.05(0.14)
0.04(0.29)
0.75(0.00)
0.58(0.00)
12-Month Eurepo-OIS −0.07(0.03)
0.02(0.58)
0.66(0.00)
0.56(0.00)
VIX 0.47(0.00)
−− 0.61(0.00)
−−
Notes: The pre-crisis sample runs from 10 March 2004 to 8 August 2007, and the crisissample ends in 30 June 2009. p-values are presented in parentheses.
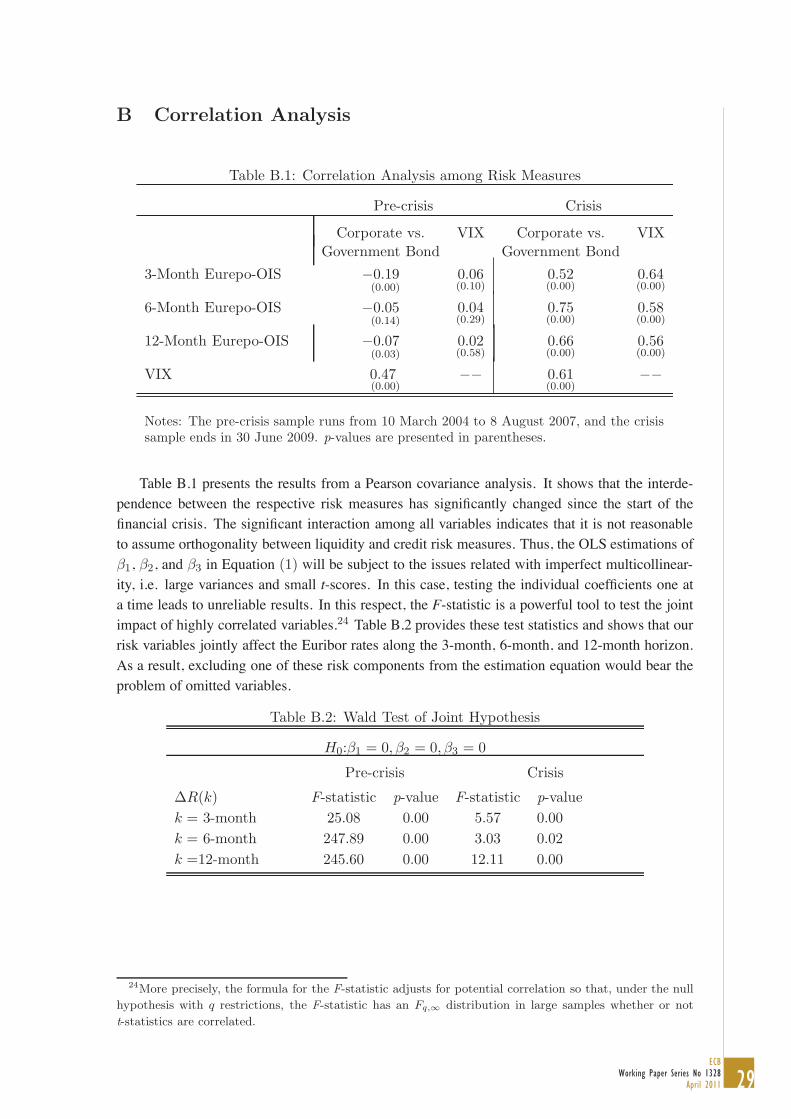
Table B.1 presents the results from a Pearson covariance analysis. It shows that the interde-pendence between the respective risk measures has significantly changed since the start of thefinancial crisis. The significant interaction among all variables indicates that it is not reasonableto assume orthogonality between liquidity and credit risk measures. Thus, the OLS estimations ofβ1, β2, and β3 in Equation (1) will be subject to the issues related with imperfect multicollinear-ity, i.e. large variances and small t-scores. In this case, testing the individual coefficients one ata time leads to unreliable results. In this respect, the F-statistic is a powerful tool to test the jointimpact of highly correlated variables.24 Table B.2 provides these test statistics and shows that ourrisk variables jointly affect the Euribor rates along the 3-month, 6-month, and 12-month horizon.As a result, excluding one of these risk components from the estimation equation would bear theproblem of omitted variables.
Table B.2: Wald Test of Joint Hypothesis
H0:β1 = 0, β2 = 0, β3 = 0
Pre-crisis Crisis
ΔR(k) F-statistic p-value F-statistic p-value
k = 3-month 25.08 0.00 5.57 0.00
k = 6-month 247.89 0.00 3.03 0.02
k =12-month 245.60 0.00 12.11 0.00
24More precisely, the formula for the F-statistic adjusts for potential correlation so that, under the null
hypothesis with q restrictions, the F-statistic has an Fq,∞ distribution in large samples whether or not
t-statistics are correlated.

30ECBWorking Paper Series No 1328April 2011
C Unit Root Tests
This annex provides results regarding the co-integration properties of the data. Therefore, weperform unit root tests on the Euribor and OIS rates for which the Augmented Dickey-Fuller t-statistics are presented in Table C.1. For both the pre-crisis and crisis period, the Euribor and OISrates of all considered maturities have a unit root, i. e. are I(1), and should thus be treated asnon-stationary variables. To avoid the issues associated with non-stationarity, the Euribor and OISrates should be expressed in first differences.
Table C.1: Unit-Root Tests
Variable ADF Test Variable ADF Test
Pre-crisis Crisis Pre-crisis Crisis
R(3) -0.89 -1.24 ΔR(3) -24.34∗∗∗ -5.89∗∗∗
R(6) -1.15 -0.98 ΔR(6) -26.59∗∗∗ -7.35∗∗∗
R(12) -1.11 -0.74 ΔR(12) -28.33∗∗∗ -8.63∗∗∗
OIS(3) -1.29 -1.23 ΔOIS(3) -30.76∗∗∗ -6.87∗∗∗
OIS(6) -1.22 -0.90 ΔOIS(6) -31.58∗∗∗ -19.56∗∗∗
OIS(12) -1.21 -0.94 ΔOIS(12) -29.02∗∗∗ -21.50∗∗∗
Notes: ∗∗∗ denote the significance at 1 % critical value. The t-statistic ofthe Augmented Dickey-Fuller (ADF) tests refer to the following test equationwith a constant, a linear trend and the lag length according to the SchwarzInformation Criterion. However, all results are robust against variation of thelag length or the deterministics in the equation.

31ECB
Working Paper Series No 1328April 2011
D Structural Break Test
This section uses structural break tests to investigate whether the period after August 9, 2007significantly changed the dynamics of Euribor rates. To that aim, the Chow breakpoint test isapplied to the equation of the Euribor, compare equation (1):
ΔRt(k) = α(1
k
∑k−1
j=0EtΔrt+1+j) + β′Φt(k)
+ γ′CBt + δ′Xt +∑5
j=1ϕjΔRt−j(k) + εt (2)
We divide our sample from March 10, 2004 to June 30, 2009 into two subsamples and testwhether there has been a break in all the equation parameters α, β, γ and ϕj as of August 9, 2007.The Chow breakpoint test compares the sum of squared residuals obtained by fitting equation (2)to the entire sample with the sum of squared residuals obtained when separate equations are fitto each subsample. We report three test statistics for the Chow breakpoint test. The F-statisticis based on the comparison of the restricted and unrestricted sum of squared residuals. The loglikelihood ratio statistic is based on the comparison of the restricted and unrestricted maximum ofthe (Gaussian) log likelihood function. The Wald statistic is computed from a standard Wald testof the restriction that the coefficients on the equation parameters are the same in all subsamples.While the F-statistic has an exact finite sample F-distribution, the LR and Wald test statistic haveboth an asymptotic χ2 distribution with k degrees of freedom, where k is the number of parametersin the equation.
H0: No break at specified breakpoint
Statistic Euribor
3-Month 6-Month 12-Month
F (08/09/2007) 14.90(0.0000)
36.60(0.0000)
78.89(0.0000)
LR 183.61(0.0000)
382.52(0.0000)
714.04(0.0000)
Wald 130.25(0.0000)
268.97(0.0000)
372.23(0.0000)
Notes: Specified break date and p-values in parenthesis. Subsamples: March10, 2004 to August 8, 2007 and August 9, 2007 to June 30, 2009 for the dailyEuribor of three-month, six-month, and twelve-month horizon.
The results confirm that the dynamics of Euribor rates have significantly changed since mid2007. For all maturities, the test statistics strongly reject the null hypothesis of no structural changeas of August 9, 2007.

WORK ING PAPER SER I E SNO 1313 / MARCH 2011
by Cristian Badarinzaand Emil Margaritov
NEWS AND POLICY FORESIGHT IN A MACRO-FINANCE MODEL OF THE US