Embed Size (px)
Citation preview

Goldman Sachs FundsSICAVAnnual Report
Audited Financial Statements
AssetManagement
R.C.S. Luxembourg B41 751
1120
Page
Directors and Other Information 1
Investment Adviser’s Report 3
Audit Report (in relation to International Standards on Auditing) 7
Report of Independent Auditors (in relation to US Generally Accepted Auditing Standards) 10
Statement of Assets and Liabilities 12
Statement of Operations 19
Statement of Changes in Shareholders’ Equity 26
Statistical Information 33
Notes to the Financial Statements 55
Schedule of Investments 117
GOLDMAN SACHS FUNDS—EQUITY PORTFOLIOS
Goldman Sachs Funds—Global and Regional Equity Portfolios
Goldman Sachs Funds—Asia Equity Portfolio 117
Goldman Sachs Funds—China Opportunity Equity Portfolio 119
Goldman Sachs Funds—Emerging Markets Equity ESG Portfolio 121
Goldman Sachs Funds—Emerging Markets Equity Portfolio 123
Goldman Sachs Funds—Global Environmental Impact Equity Portfolio 125
Goldman Sachs Funds—Global Equity Income Portfolio 127
Goldman Sachs Funds—Global Equity Partners ESG Portfolio 129
Goldman Sachs Funds—Global Equity Partners Portfolio 130
Goldman Sachs Funds—Global Future Health Care Equity Portfolio 132
Goldman Sachs Funds—Global Future Technology Leaders Equity Portfolio 133
Goldman Sachs Funds—Global Millennials Equity Portfolio 135
Goldman Sachs Funds—India Equity Portfolio 136
Goldman Sachs Funds—Japan Equity Partners Portfolio 138
Goldman Sachs Funds—Japan Equity Portfolio 139
Goldman Sachs Funds—US Equity Portfolio 141
Goldman Sachs Funds—US Focused Growth Equity Portfolio 143
Goldman Sachs Funds—US Smaller Cap Equity Portfolio 144
Goldman Sachs Funds—US Technology Opportunities Equity Portfolio 147
Goldman Sachs Funds—Sector Equity Portfolios
Goldman Sachs Funds—Global Infrastructure Equity Portfolio 148
Goldman Sachs Funds—Global Real Estate Equity Portfolio 150
Goldman Sachs Funds—North America Energy & Energy Infrastructure Equity Portfolio 152
Goldman Sachs Funds—Global and Regional CORE® Equity Portfolios
Goldman Sachs Funds—Emerging Markets CORE® Equity Portfolio 153
Goldman Sachs Funds—Europe CORE® Equity Portfolio 157
Goldman Sachs Funds—Global CORE® Equity Portfolio 160
Goldman Sachs Funds—Global Small Cap CORE® Equity Portfolio 164
Goldman Sachs Funds—US CORE® Equity Portfolio 169
Goldman Sachs Funds—US Small Cap CORE® Equity Portfolio 171
Goldman Sachs FundsTable of Contents

GOLDMAN SACHS FUNDS—FIXED INCOME PORTFOLIOS
Goldman Sachs Funds—Asia High Yield Bond Portfolio 175
Goldman Sachs Funds—Emerging Markets Corporate Bond Portfolio 179
Goldman Sachs Funds—Emerging Markets Debt Blend Portfolio 191
Goldman Sachs Funds—Emerging Markets Debt Local Portfolio 212
Goldman Sachs Funds—Emerging Markets Debt Portfolio 224
Goldman Sachs Funds—Emerging Markets Short Duration Bond Portfolio 243
Goldman Sachs Funds—Euro Short Duration Bond Plus Portfolio 248
Goldman Sachs Funds—Europe High Yield Bond Portfolio 257
Goldman Sachs Funds—Global Credit Portfolio (Hedged) 265
Goldman Sachs Funds—Global ESG Enhanced Income Bond Portfolio 282
Goldman Sachs Funds—Global Fixed Income Portfolio 289
Goldman Sachs Funds—Global Fixed Income Portfolio (Hedged) 306
Goldman Sachs Funds—Global High Yield Portfolio 326
Goldman Sachs Funds—Global Sovereign Bond Portfolio 341
Goldman Sachs Funds—Short Duration Opportunistic Corporate Bond Portfolio 352
Goldman Sachs Funds—Sterling Credit Portfolio 359
Goldman Sachs Funds—US Dollar Short Duration Bond Portfolio 367
Goldman Sachs Funds—US Fixed Income Portfolio 375
Goldman Sachs Funds—US Mortgage Backed Securities Portfolio 389
GOLDMAN SACHS FUNDS—FLEXIBLE PORTFOLIOS
Goldman Sachs Funds—Emerging Markets Multi-Asset Portfolio 403
Goldman Sachs Funds—Global Multi-Asset Balanced Portfolio 412
Goldman Sachs Funds—Global Multi-Asset Conservative Portfolio 415
Goldman Sachs Funds—Global Multi-Asset Growth Portfolio 418
Goldman Sachs Funds—Global Multi-Asset Income Portfolio 421
Goldman Sachs Funds—US Real Estate Balanced Portfolio 432
GOLDMAN SACHS FUNDS—SPECIALIST PORTFOLIOS
Goldman Sachs Funds—Emerging Markets Total Return Bond Portfolio 437
Goldman Sachs Funds—Global Absolute Return Portfolio 449
Goldman Sachs Funds—Global Fixed Income Plus Portfolio (Hedged) 465
Goldman Sachs Funds—Global Strategic Income Bond Portfolio 489
Goldman Sachs Funds—Global Strategic Macro Bond Portfolio 509
Goldman Sachs Funds—Strategic Absolute Return Bond I Portfolio 519
Goldman Sachs Funds—Strategic Absolute Return Bond II Portfolio 537
GOLDMAN SACHS FUNDS—GLOBAL MANAGER STRATEGIES PORTFOLIOS
Goldman Sachs Funds—Multi-Manager Dynamic World Equity Portfolio 552
GOLDMAN SACHS FUNDS—SELECT PORTFOLIOS
Goldman Sachs Funds—Global Corporate Portfolio (Hedged) 555
GOLDMAN SACHS FUNDS—ALTERNATIVE PORTFOLIOS
Goldman Sachs Funds—Absolute Return Tracker Portfolio 569
Goldman Sachs Funds—Alternative Trend Portfolio 594
Goldman Sachs FundsTable of Contents

APPENDICIES
Appendix I— Advisory Fees Rates, Expense Caps and Total Net Expense Ratios (Unaudited) 598
Appendix II—Portfolio and Share Class Launches, Closures and Mergers (Unaudited) 616
Appendix III—Shareholder Concentration (Unaudited) 621
Appendix IV—Calculation Method Used for Global Exposure (Unaudited) 627
Appendix V—Management Company Annual Report Disclosures (Unaudited) 631
Appendix VI—Securities Financing Transactions Regulation (“SFTR”) Disclosures (Unaudited) 633
Additional Information (Unaudited) 644
Goldman Sachs FundsTable of Contents

GOLDMAN SACHS FUNDS SICAVSociété d’Investissement à Capital VariableAn undertaking for collective investment organised under the laws ofthe Grand Duchy of Luxembourg
Board of DirectorsMs. Grainne Alexander (IRE)1
Mr. Frank Ennis (IRE)1
Mr. Glenn Thorpe (UK/AUS)2
Ms. Katherine Uniacke (US)2
Mr. Jonathan Beinner (US)2,3
Management CompanyGoldman Sachs Asset Management Fund Services Limited4
47-49 St. Stephen’s GreenDublin 2Ireland
AuditorPricewaterhouseCoopers, Société Coopérative2, rue Gerhard MercatorB.P. 1443L-1014 LuxembourgGrand Duchy of Luxembourg
Depositary, Domiciliary Agent, Administrator, Listing Agentand Luxembourg Paying AgentState Street Bank International GmbH, Luxembourg Branch49, avenue J.F. KennedyL-1855 LuxembourgGrand Duchy of Luxembourg
DistributorGoldman Sachs Asset Management Fund Services Limited4
47-49 St. Stephen’s GreenDublin 2Ireland
Investment AdviserGoldman Sachs Asset Management International4
Plumtree Court25 Shoe LaneLondon, EC4A 4AUUnited Kingdom
Investment Sub-Advisers5Goldman Sachs Asset Management, L.P.4
200 West Street10282 New YorkUnited States of America
Goldman Sachs Asset Management (Hong Kong) Ltd.4
68th Floor Cheung Kong Center2 Queen’s Road CentralHong Kong
Goldman Sachs Asset Management (Singapore) Pte. Ltd.4
1 Raffles Link#07-01 South LobbySingapore 039393
Goldman Sachs Asset Management Co., Ltd.4
Roppongi Hills Mori Tower10-1 Roppongi 6-chomeMinato-Ku, Tokyo 106-6147, Japan
Goldman Sachs Hedge Fund Strategies, LLC4
1 New York Plaza10004 New YorkUnited States of America
Goldman Sachs International4
Plumtree Court25 Shoe LaneLondon, EC4A 4AUUnited Kingdom
GS Investment Strategies, LLC4
200 West Street10282 New YorkUnited States of America
Legal AdviserArendt & Medernach S.A.41A, avenue J.F. KennedyL-2082 LuxembourgGrand Duchy of Luxembourg
Registered Officec/o State Street Bank International GmbH, Luxembourg Branch49, avenue J.F. KennedyL-1855 LuxembourgR.C.S. Luxembourg B41 751Grand Duchy of Luxembourg
Registrar and Transfer AgentRBC Investor Services Bank S.A.14, Porte de FranceL-4360 Esch-sur AlzetteGrand Duchy of Luxembourg
Goldman Sachs FundsDirectors and Other Information
1

Paying Agents:
Paying and Information Agent in AustriaRaiffeisen Bank International AGAm Stadtpark 91030 Vienna, Austria
Paying and Information Agent in BelgiumRBC Investor Services Belgium S.A.Place Rogier II1210 Brussels, Belgium
Paying Agent in CyprusEurobank EFG Cyprus Ltd.Banking Institution41, Arch. MakariosAve, 1065 Nicosia, Cyprus
Representative in DenmarkStockRate Asset Management A/S18D, sdr. Jernbanevej3400 Hillerod, Denmark
Paying and Information Agent in FranceRBC Investor Services Bank France S.A.105, rue Réaumur75002 Paris, France
Paying and Information Agent in GermanyState Street Bank GmbHBrienner Strasse 5980333 Munich, Germany
Paying Agents in GreecePiraeus Asset Management Mutual Funds Management S.A.87 Syngrou AveGR-11745 Athens, Greece
Citibank International Plc.3, Achaias Street, Nea KifissiaGR-14564 Athens, Greece
Eurobank EFG Ergasias S.A.Stadiou 10, 3rd Floor,GR-10564 Athens, Greece
Paying Agents in ItalySociété Générale Securities Services S.p.A.Maciachini Center MAC 2Via Benigno Crespi 19/A20159 Milan, Italy
AllFunds Bank S.A. Milan BranchVia Santa Margherita 720121 Milan, Italy
Paying Agents in Italy (Continued)RBC Dexia Investor Services Bank S.A. Milan BranchCia Vittor Pisani 2620154 Milan, Italy
State Street Bank S.p.A.Via Ferrante Aporti 1020125 Milan, Italy
BNP Paribas Securities Services – Succursale di MilanoVia Ansperto 520121 Milan, Italy
Banca Sella Holdings S.p.A.Piazza Gaudenzio Sella 1I-13900 Biella, Italy
Banca Monte Dei Paschi Di Siena S.p.A.Via Sassetti 450123 Firenze, Italy
Paying Agent in LiechtensteinLGT Bank AGHerrengasse 12FL-9490 Vaduz, Liechtenstein
Paying Agent in PolandBank Polska Kasa Opieki Spolka AkcyjnaGrzybowska 53/5700-950 Warsaw, Poland
Sub-Transfer Agent in PolandPekao Financial Services Sp. z o.o.Postepu Street no 2102-676 Warsaw, Poland
Representative in SpainAllFunds Bank S.A.La Moraleja, Calle Estafeta 628109 Alcobendas, Spain
Paying Agent in SwitzerlandGoldman Sachs Bank AG4
Münsterhof 48001 Zurich, Switzerland
Representative in SwitzerlandFirst Independent Fund Services AGKlausstrasse 338008 Zurich, Switzerland
The Fund’s Prospectus with its Supplements, Key Investor InformationDocument, Articles of Incorporation, Annual Report, Semi-AnnualReport and the list of all transactions carried out by the InvestmentAdviser during the year are available free of charge at the offices ofthe local Paying and Information Agents and the Swiss Representative.
1 Independent Directors.2 Director of the Fund employed by Goldman Sachs Group, Inc. or its direct or indirect subsidiary.3 Mr. Jonathan Beinner was appointed as a member of the Board of Directors as of 9 March 2020.4 Related party to Goldman Sachs Funds.5 Refer to Note 6 for non-affiliated Investment Sub-Advisers.
Goldman Sachs FundsDirectors and Other Information
2
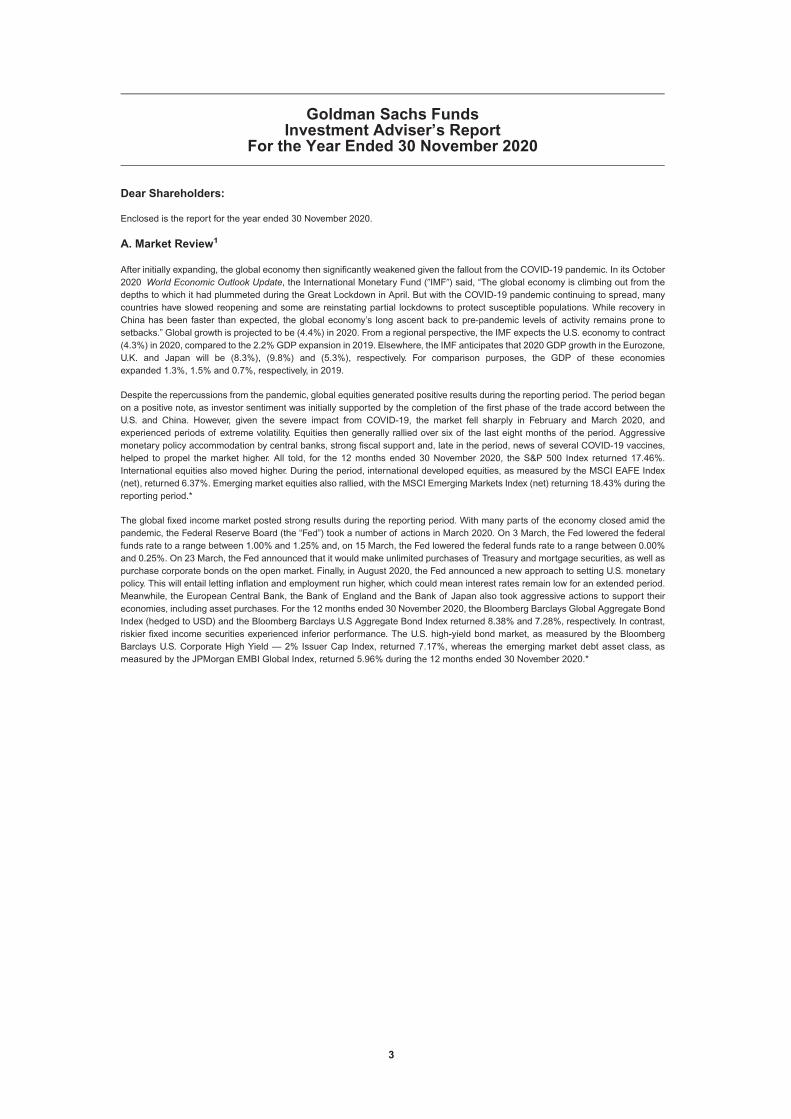
Dear Shareholders:
Enclosed is the report for the year ended 30 November 2020.
A. Market Review1
After initially expanding, the global economy then significantly weakened given the fallout from the COVID-19 pandemic. In its October2020 World Economic Outlook Update, the International Monetary Fund (�IMF�) said, “The global economy is climbing out from thedepths to which it had plummeted during the Great Lockdown in April. But with the COVID-19 pandemic continuing to spread, manycountries have slowed reopening and some are reinstating partial lockdowns to protect susceptible populations. While recovery inChina has been faster than expected, the global economy’s long ascent back to pre-pandemic levels of activity remains prone tosetbacks.” Global growth is projected to be (4.4%) in 2020. From a regional perspective, the IMF expects the U.S. economy to contract(4.3%) in 2020, compared to the 2.2% GDP expansion in 2019. Elsewhere, the IMF anticipates that 2020 GDP growth in the Eurozone,U.K. and Japan will be (8.3%), (9.8%) and (5.3%), respectively. For comparison purposes, the GDP of these economiesexpanded 1.3%, 1.5% and 0.7%, respectively, in 2019.
Despite the repercussions from the pandemic, global equities generated positive results during the reporting period. The period beganon a positive note, as investor sentiment was initially supported by the completion of the first phase of the trade accord between theU.S. and China. However, given the severe impact from COVID-19, the market fell sharply in February and March 2020, andexperienced periods of extreme volatility. Equities then generally rallied over six of the last eight months of the period. Aggressivemonetary policy accommodation by central banks, strong fiscal support and, late in the period, news of several COVID-19 vaccines,helped to propel the market higher. All told, for the 12 months ended 30 November 2020, the S&P 500 Index returned 17.46%.International equities also moved higher. During the period, international developed equities, as measured by the MSCI EAFE Index(net), returned 6.37%. Emerging market equities also rallied, with the MSCI Emerging Markets Index (net) returning 18.43% during thereporting period.*
The global fixed income market posted strong results during the reporting period. With many parts of the economy closed amid thepandemic, the Federal Reserve Board (the “Fed”) took a number of actions in March 2020. On 3 March, the Fed lowered the federalfunds rate to a range between 1.00% and 1.25% and, on 15 March, the Fed lowered the federal funds rate to a range between 0.00%and 0.25%. On 23 March, the Fed announced that it would make unlimited purchases of Treasury and mortgage securities, as well aspurchase corporate bonds on the open market. Finally, in August 2020, the Fed announced a new approach to setting U.S. monetarypolicy. This will entail letting inflation and employment run higher, which could mean interest rates remain low for an extended period.Meanwhile, the European Central Bank, the Bank of England and the Bank of Japan also took aggressive actions to support theireconomies, including asset purchases. For the 12 months ended 30 November 2020, the Bloomberg Barclays Global Aggregate BondIndex (hedged to USD) and the Bloomberg Barclays U.S Aggregate Bond Index returned 8.38% and 7.28%, respectively. In contrast,riskier fixed income securities experienced inferior performance. The U.S. high-yield bond market, as measured by the BloombergBarclays U.S. Corporate High Yield — 2% Issuer Cap Index, returned 7.17%, whereas the emerging market debt asset class, asmeasured by the JPMorgan EMBI Global Index, returned 5.96% during the 12 months ended 30 November 2020.*
Goldman Sachs FundsInvestment Adviser’s Report
For the Year Ended 30 November 2020
3

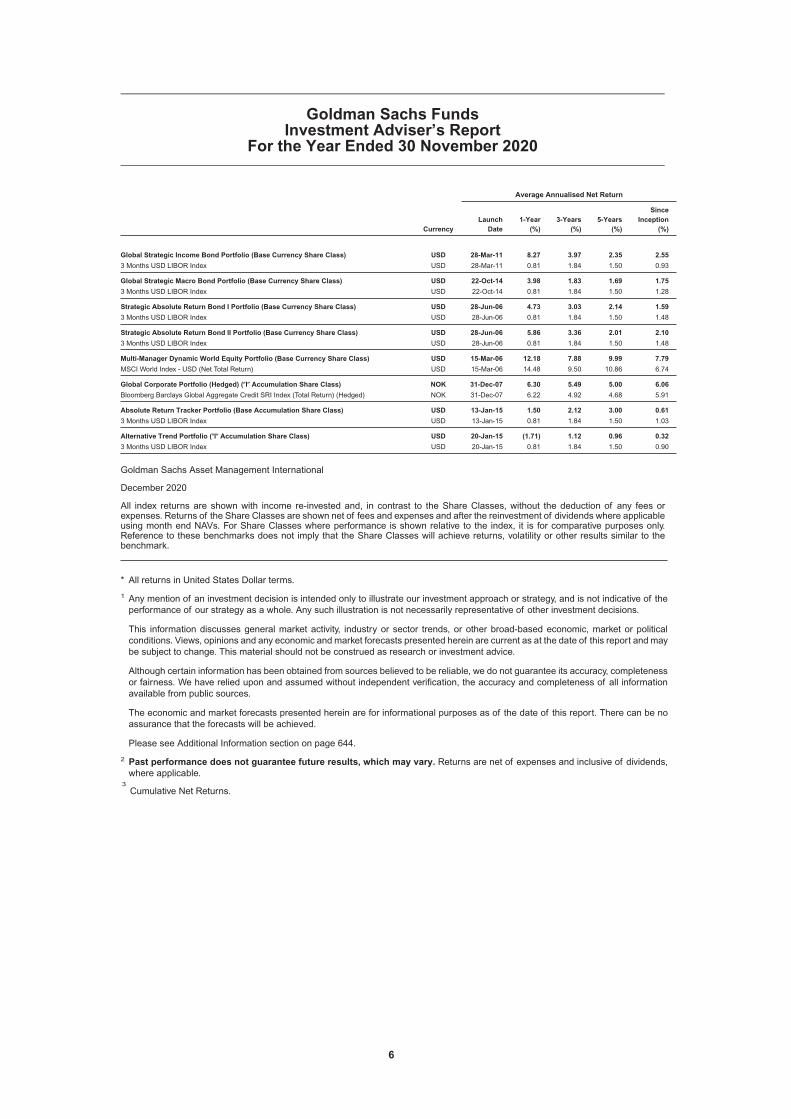
B. Performance Overview (as at 30 November 2020)2
Average Annualised Net Return
CurrencyLaunchDate
1-Year(%)
3-Years(%)
5-Years(%)
SinceInception
(%)
Asia Equity Portfolio (Base Currency Share Class) USD 31-May-94 35.84 9.56 13.20 5.65
MSCI AC Asia Free ex-Japan Index (Net Total Return) USD 31-May-94 24.78 6.74 11.98 4.74
China Opportunity Equity Portfolio (Base Accumulation Share Class) USD 26-Aug-09 44.74 13.31 14.58 8.71
MSCI China Index (Total Return Net, Unhedged) USD 26-Aug-09 37.60 9.39 12.53 7.42
Emerging Markets Equity ESG Portfolio (Base Accumulation Share Class) USD 27-Sep-18 29.24 — — 16.26
MSCI Emerging Markets Index (Net Total Return, Unhedged) USD 27-Sep-18 18.37 — — 8.89
Emerging Markets Equity Portfolio (Base Currency Share Class) USD 15-Dec-97 27.49 6.78 12.33 7.56
MSCI Emerging Markets Index (Net Total Return, Unhedged) USD 15-Dec-97 18.37 4.91 10.71 7.68
Global Environmental Impact Equity Portfolio (Base Accumulation Share Class)3 USD 14-Feb-20 — — — 38.80
MSCI All Country World Index (Net Total Return, Unhedged, Daily) USD 14-Feb-20 — — — 8.12
Global Equity Income Portfolio (Base Currency Share Class) USD 4-Dec-92 3.84 4.48 6.36 5.54
MSCI World Index - USD (Net Total Return) USD 4-Dec-92 14.48 9.50 10.86 7.82
Global Equity Partners ESG Portfolio (Base Accumulation Share Class) USD 16-Sep-08 18.93 12.19 10.42 6.59
MSCI World Index - USD (Net Total Return, Unhedged) USD 16-Sep-08 14.48 9.50 10.86 7.91
Global Equity Partners Portfolio (Base Accumulation Share Class) USD 23-Feb-06 20.12 12.18 10.69 6.12
MSCI World Index - USD (Net Total Return) USD 23-Feb-06 14.48 9.50 10.86 6.83
Global Future Health Care Equity Portfolio (Base Accumulation Share Class)3 USD 30-Sep-20 — — — 5.30
MSCI ACWI Health Care Index (Total Return Net) USD 30-Sep-20 — — — 4.11
Global Future Technology Leaders Equity Portfolio (Base Accumulation Share Class)3 USD 25-Feb-20 — — — 55.80
MSCI All Country World Index Select IT+ Communication Services + Internet & DirectMarketing Retail Index (Net Total Return,USD) USD 25-Feb-20 — — — 31.25
Global Millennials Equity Portfolio (Base Accumulation Share Class) USD 19-Sep-12 51.09 23.28 17.73 13.50
MSCI ACWI Growth Index (Net Total Return, Unhedged) USD 19-Sep-12 31.49 16.28 15.55 12.59
India Equity Portfolio (Base Currency Share Class) USD 26-Mar-08 11.37 0.63 7.11 6.76
MSCI India IMI (Net Return, Unhedged) USD 26-Mar-08 7.28 1.42 7.58 3.08
Japan Equity Partners Portfolio (Base Accumulation Share Class) JPY 27-May-15 25.56 10.63 11.36 9.98
Topix Index (Net Total Return, Unhedged) JPY 27-May-15 5.40 1.31 4.11 2.93
Japan Equity Portfolio (Base Currency Share Class) JPY 30-Apr-96 14.00 5.31 5.60 2.65
Topix Index (Net Total Return, Unhedged) JPY 30-Apr-96 5.40 1.31 4.11 1.42
US Equity Portfolio (Base Currency Share Class) USD 3-Feb-06 17.42 11.80 10.09 7.76
S&P 500 Index (Net Total Return, USD Unhedged) USD 3-Feb-06 16.76 12.50 13.29 8.89
US Focused Growth Equity Portfolio (Base Currency Share Class) USD 15-Nov-99 43.54 21.54 15.66 5.51
Russell 1000 Growth Index (Net) USD 15-Nov-99 35.87 21.02 19.07 6.60
US Smaller Cap Equity Portfolio (Base Accumulation Share Class) USD 15-Jun-18 12.77 — — 6.32
Russell 2500 Index (Net Total Return, Unhedged) USD 15-Jun-18 13.32 — — 6.77
US Technology Opportunities Equity Portfolio (Base Accumulation Share Class)3 USD 30-Oct-20 — — — 10.50
NASDAQ Composite Index (Net Total Return, USD, Unhedged) USD 30-Oct-20 — — — 11.87
Global Infrastructure Equity Portfolio (Base Currency Share Class) USD 2-Dec-16 1.24 4.08 — 7.17
DJ Brookfield Global Infrastructure Index (NTR, USD Unhedged) USD 2-Dec-16 (1.79) 2.99 — 7.17
Global Real Estate Equity Portfolio (Base Currency Share Class) USD 2-Dec-16 (19.35) (2.50) — (0.42)
FTSE EPRA-NAREIT Developed Index Net—USD USD 2-Dec-16 (11.53) 0.96 — 3.84
North America Energy & Energy Infrastructure Equity Portfolio (Base Currency ShareClass) USD 14-Apr-14 (19.43) (9.00) (5.06) (10.26)
50% Alerian Midstream Energy Select Index (Total Return Gross)/ 50% Energy Select SectorIndex (Total Return Net) USD 14-Apr-14 (25.37) (10.38) (5.51) (8.41)
Emerging Markets CORE® Equity Portfolio (Base Accumulation Close Share Class) USD 10-Aug-09 19.62 3.05 9.64 5.88
MSCI Emerging Markets Index (Net Total Return, Unhedged) USD 10-Aug-09 18.37 4.91 10.71 5.54
Europe CORE® Equity Portfolio (Base Currency Share Class) EUR 1-Oct-99 (5.03) 0.42 2.91 3.99
MSCI Europe Index (Net Total Return, Unhedged) EUR 1-Oct-99 (3.60) 2.38 2.66 3.60
Global CORE® Equity Portfolio (Base Accumulation Close Share Class) USD 21-Nov-05 11.58 6.07 9.16 6.60
MSCI World Index - USD (Net Total Return) USD 21-Nov-05 14.48 9.50 10.86 7.16
Global Small Cap CORE® Equity Portfolio (Base Currency Snap Share Class) USD 3-Aug-06 2.90 3.48 7.49 6.32
S&P Developed Small Cap Index (Net) USD 3-Aug-06 11.74 5.71 9.16 7.10
US CORE® Equity Portfolio (Base Accumulation Close Share Class) USD 21-Nov-05 16.51 10.20 11.79 7.47
S&P 500 Index (Net Total Return, USD Unhedged) USD 21-Nov-05 16.76 12.50 13.29 8.88
US Small Cap CORE® Equity Portfolio (Base Accumulation Close Share Class) USD 5-Dec-05 1.83 4.12 7.70 6.44
Russell 2000 Index (Net Total Return) USD 5-Dec-05 13.10 6.66 9.79 7.75
Asia High Yield Bond Portfolio (Base Accumulation Share Class)3 USD 13-Aug-20 — — — 3.18
ICE BofA Asian Dollar High Yield Corp Sector & Issuer Constrained Index USD 13-Aug-20 — — — 3.20
Goldman Sachs FundsInvestment Adviser’s Report
For the Year Ended 30 November 2020
4

Average Annualised Net Return
CurrencyLaunchDate
1-Year(%)
3-Years(%)
5-Years(%)
SinceInception
(%)
Emerging Markets Corporate Bond Portfolio (Base Currency Share Class) USD 17-May-11 6.58 5.19 6.24 5.53
JPM CEMBI Broad Diversified Index USD 17-May-11 6.59 5.61 6.54 5.51
Emerging Markets Debt Blend Portfolio (Base Currency Share Class) USD 8-May-13 6.17 3.09 5.39 1.02
50% JP Morgan GBI-EM Global Diversified Index, 25% JPM EMBI Global Diversified Index,25% CEMBI Broad Diversified Index USD 8-May-13 4.71 3.89 6.06 2.00
Emerging Markets Debt Local Portfolio (Base Currency Share Class) USD 29-Jun-07 3.46 0.37 3.74 1.22
JP Morgan GBI-EM Global Diversified Index USD 29-Jun-07 3.34 2.52 5.51 —
Emerging Markets Debt Portfolio (Base Currency Share Class) USD 3-May-00 6.26 3.22 5.09 8.60
JP Morgan Emerging Markets Bond Index—Global Diversified USD 3-May-00 5.36 4.64 6.31 8.61
Emerging Markets Short Duration Bond Portfolio (Base Accumulation Share Class) USD 8-Jan-19 1.38 — — 3.99
3 Months USD LIBOR Index USD 8-Jan-19 0.81 — — 1.56
Euro Short Duration Bond Plus Portfolio (Base Currency Share Class) EUR 15-Jan-14 0.53 0.14 0.34 0.55
Bloomberg Barclays Euro Aggregate 500mm 1-3 yr EUR 15-Jan-14 0.18 0.11 0.16 0.45
Europe High Yield Bond Portfolio (Base Currency Share Class) EUR 17-Jun-14 2.87 2.71 3.93 3.54
ICE BofA European Currency High Yield Constrained Index (Total Return, Hedged) EUR 17-Jun-14 3.13 3.11 4.59 4.06
Global Credit Portfolio (Hedged) (Base Currency Share Class) USD 26-Jan-06 10.75 7.53 6.03 4.17
Bloomberg Barclays Global Aggregate Corporate Bond Index (Hedged) USD 26-Jan-06 7.97 6.48 5.99 5.26
Global ESG Enhanced Income Bond Portfolio (Base Accumulation Share Class)3 USD 16-Sep-20 — — — 3.58
Bloomberg Barclays Global Aggregate Bond Index (Hedged) USD 16-Sep-20 — — — 0.56
Global Fixed Income Portfolio (Base Currency Share Class) USD 26-Feb-93 11.50 5.43 4.86 4.37
Bloomberg Barclays Global Aggregate Index (Total Return Gross) USD 26-Feb-93 8.35 4.50 4.62 5.17
Global Fixed Income Portfolio (Hedged) (Base Currency Share Class) EUR 17-Dec-01 7.58 3.91 2.58 3.24
Bloomberg Barclays Global Aggregate Bond Index (Hedged) EUR 17-Dec-01 3.56 2.66 2.22 3.93
Global High Yield Portfolio (Base Currency Share Class) USD 27-Jan-98 5.71 4.39 5.75 5.71
Bloomberg Barclays US Corporate High Yield Bond Index – 2% Issuer Cap (Total ReturnGross) USD 27-Jan-98 7.15 5.66 7.61 6.56
Global Sovereign Bond Portfolio (Base Currency Share Class) USD 22-May-15 7.31 4.46 4.57 3.04
60% Bloomberg Barclays Emerging Market Local Currency Government (USD) / 40% GlobalTreasury Country (USD-Hedged) Bond Index USD 22-May-15 6.80 5.26 5.44 3.85
Short Duration Opportunistic Corporate Bond Portfolio (Base Currency Share Class) USD 4-Apr-12 5.33 3.40 4.09 3.52
ICE BofA USD LIBOR 1 Month Constant Maturity Index USD 4-Apr-12 0.79 1.69 1.29 0.83
Sterling Credit Portfolio (�I� Share Class) GBP 18-Dec-08 8.41 6.22 6.06 7.60
iBoxx Sterling Non Gilts Index (Total Return, Unhedged) GBP 18-Dec-08 6.06 5.01 5.50 6.72
US Dollar Short Duration Bond Portfolio (�I� Accumulation Share Class) USD 6-Jun-16 3.90 3.17 — 2.40
Bloomberg Barclays US Govt-Credit 1-3 yr Index USD 6-Jun-16 3.48 2.96 — 2.17
US Fixed Income Portfolio (Base Currency Share Class) USD 27-Jul-98 8.26 5.35 3.82 4.21
Bloomberg Barclays US Aggregate Bond Index USD 27-Jul-98 7.26 5.45 4.33 4.98
US Mortgage Backed Securities Portfolio (Base Currency Share Class) USD 30-Sep-02 4.54 3.48 2.69 3.65
Bloomberg Barclays US Securitized Index (Total Return, Unhedged) USD 30-Sep-02 4.16 3.87 3.09 4.01
Emerging Markets Multi-Asset Portfolio (Base Accumulation Share Class) USD 14-Dec-17 13.96 — — 3.38
30% JPMorgan GBI EM Index– Global Diversified (Total Return Gross) + 15% JPMorganEMB Index– Global / Diversified (Total Return Gross) + 15% JPMorgan CEMBI Index – BroadDiversified (Total Return Gross) + 40% MSCI Emerging Markets Index (Total Return Net)
USD 14-Dec-17 10.25 — — 4.54
Global Multi-Asset Balanced Portfolio (Base Accumulation Share Class) USD 30-Jun-14 9.50 4.99 5.83 4.28
50% Bloomberg Barclays Global Aggregate (Total Return, Hedged) & 50% MSCI World Index(Net) USD 30-Jun-14 10.05 7.89 7.93 6.52
Global Multi-Asset Conservative Portfolio (Base Accumulation Share Class) USD 30-Jun-14 9.42 5.07 4.87 3.76
70% Bloomberg Barclays Global Aggregate (Total Return, Hedged) & 30% MSCI World Index(Net) USD 30-Jun-14 8.19 6.87 6.43 5.56
Global Multi-Asset Growth Portfolio (Base Accumulation Share Class) USD 30-Jun-14 8.76 4.67 6.32 4.63
30% Bloomberg Barclays Global Aggregate (Total Return, Hedged) & 70% MSCI World Index(Net) USD 30-Jun-14 11.68 8.78 9.10 7.29
Global Multi-Asset Income Portfolio (Base Currency Share Class) USD 18-Mar-14 5.71 5.41 5.83 4.52
40% ICE BofA US High Yield BB-B Constrained Index (USD Hedged) (Total Return Gross) /40% MSCI World Index (USD Hedged)(Total Return Net) / 20% Bloomberg Barclays GlobalAggregate – Corporate Index (USD Hedged) (Total Return Gross)
USD 18-Mar-14 9.57 7.57 9.36 7.04
US Real Estate Balanced Portfolio (Base Accumulation Share Class) USD 2-Oct-12 3.91 5.02 6.13 6.80
Emerging Markets Total Return Bond Portfolio (Base Currency Share Class) USD 21-Nov-17 8.43 3.32 — 3.47
3 Months USD LIBOR Index USD 21-Nov-17 0.81 1.84 — 1.84
Global Absolute Return Portfolio (Base Currency Share Class) USD 27-Aug-15 (0.87) (0.36) 0.23 0.25
3 Months USD LIBOR Index USD 27-Aug-15 0.81 1.84 1.50 1.44
Global Fixed Income Plus Portfolio (Hedged) (Base Currency Share Class) EUR 25-Jan-06 6.89 3.36 2.21 3.32
Bloomberg Barclays Global Aggregate Bond Index (Hedged) EUR 25-Jan-06 3.56 2.66 2.22 3.49
Goldman Sachs FundsInvestment Adviser’s Report
For the Year Ended 30 November 2020
5
Average Annualised Net Return
CurrencyLaunchDate
1-Year(%)
3-Years(%)
5-Years(%)
SinceInception
(%)
Global Strategic Income Bond Portfolio (Base Currency Share Class) USD 28-Mar-11 8.27 3.97 2.35 2.55
3 Months USD LIBOR Index USD 28-Mar-11 0.81 1.84 1.50 0.93
Global Strategic Macro Bond Portfolio (Base Currency Share Class) USD 22-Oct-14 3.98 1.83 1.69 1.75
3 Months USD LIBOR Index USD 22-Oct-14 0.81 1.84 1.50 1.28
Strategic Absolute Return Bond I Portfolio (Base Currency Share Class) USD 28-Jun-06 4.73 3.03 2.14 1.59
3 Months USD LIBOR Index USD 28-Jun-06 0.81 1.84 1.50 1.48
Strategic Absolute Return Bond II Portfolio (Base Currency Share Class) USD 28-Jun-06 5.86 3.36 2.01 2.10
3 Months USD LIBOR Index USD 28-Jun-06 0.81 1.84 1.50 1.48
Multi-Manager Dynamic World Equity Portfolio (Base Currency Share Class) USD 15-Mar-06 12.18 7.88 9.99 7.79
MSCI World Index - USD (Net Total Return) USD 15-Mar-06 14.48 9.50 10.86 6.74
Global Corporate Portfolio (Hedged) (�I� Accumulation Share Class) NOK 31-Dec-07 6.30 5.49 5.00 6.06
Bloomberg Barclays Global Aggregate Credit SRI Index (Total Return) (Hedged) NOK 31-Dec-07 6.22 4.92 4.68 5.91
Absolute Return Tracker Portfolio (Base Accumulation Share Class) USD 13-Jan-15 1.50 2.12 3.00 0.61
3 Months USD LIBOR Index USD 13-Jan-15 0.81 1.84 1.50 1.03
Alternative Trend Portfolio (�I� Accumulation Share Class) USD 20-Jan-15 (1.71) 1.12 0.96 0.32
3 Months USD LIBOR Index USD 20-Jan-15 0.81 1.84 1.50 0.90
Goldman Sachs Asset Management International
December 2020
All index returns are shown with income re-invested and, in contrast to the Share Classes, without the deduction of any fees orexpenses. Returns of the Share Classes are shown net of fees and expenses and after the reinvestment of dividends where applicableusing month end NAVs. For Share Classes where performance is shown relative to the index, it is for comparative purposes only.Reference to these benchmarks does not imply that the Share Classes will achieve returns, volatility or other results similar to thebenchmark.
* All returns in United States Dollar terms.
1 Any mention of an investment decision is intended only to illustrate our investment approach or strategy, and is not indicative of theperformance of our strategy as a whole. Any such illustration is not necessarily representative of other investment decisions.
This information discusses general market activity, industry or sector trends, or other broad-based economic, market or politicalconditions. Views, opinions and any economic and market forecasts presented herein are current as at the date of this report and maybe subject to change. This material should not be construed as research or investment advice.
Although certain information has been obtained from sources believed to be reliable, we do not guarantee its accuracy, completenessor fairness. We have relied upon and assumed without independent verification, the accuracy and completeness of all informationavailable from public sources.
The economic and market forecasts presented herein are for informational purposes as of the date of this report. There can be noassurance that the forecasts will be achieved.
Please see Additional Information section on page 64 .
2 Past performance does not guarantee future results, which may vary. Returns are net of expenses and inclusive of dividends,where applicable.
3Cumulative Net Returns.
Goldman Sachs FundsInvestment Adviser’s Report
For the Year Ended 30 November 2020
6

PricewaterhouseCoopers, Société coopérative, 2 rue Gerhard Mercator, B.P. 1443, L-1014 LuxembourgT : +352 494848 1, F : +352 494848 2900, www.pwc.lu Cabinet de révision agréé. Expert-comptable (autorisation gouvernementale n°10028256)R.C.S. Luxembourg B 65 477 - TVA LU25482518
Audit report
To the Shareholders ofGoldman Sachs Funds
Our opinion
In our opinion, the accompanying financial statements give a true and fair view of the financial position of Goldman Sachs Funds (the “Fund”) and of each of its sub-funds as at 30 November 2020, and of the results of their operations and changes in their net assets for the year then ended in accordance with Luxembourg legal and regulatory requirements relating to the preparation and presentation of the financial statements.
What we have audited
The Fund’s financial statements comprise:
• the statement of assets and liabilities as at 30 November 2020;• the schedule of investments as at 30 November 2020;• the statement of operations for the year then ended;• the statement of changes in shareholders' equity for the year then ended; and• the notes to the financial statements, which include a summary of significant accounting policies.
Basis for opinion
We conducted our audit in accordance with the Law of 23 July 2016 on the audit profession (Law of 23 July 2016) and with International Standards on Auditing (ISAs) as adopted for Luxembourg by the “Commission de Surveillance du Secteur Financier” (CSSF). Our responsibilities under the Law of 23 July 2016 and ISAs as adopted for Luxembourg by the CSSF are further described in the “Responsibilities of the “Réviseur d’entreprises agréé” for the audit of the financial statements” section of our report.
We believe that the audit evidence we have obtained is sufficient and appropriate to provide a basis for our opinion.
We are independent of the Fund in accordance with the International Code of Ethics for Professional Accountants, including International Independence Standards, issued by the International Ethics Standards Board for Accountants (IESBA Code) as adopted for Luxembourg by the CSSF together with the ethical requirements that are relevant to our audit of the financial statements. We have fulfilled our other ethical responsibilities under those ethical requirements.
Other information
The Board of Directors of the Fund is responsible for the other information. The other information comprises the information stated in the annual report but does not include the financial statements and our audit report thereon.
Our opinion on the financial statements does not cover the other information and we do not express any form of assurance conclusion thereon.
7

In connection with our audit of the financial statements, our responsibility is to read the other information identified above and, in doing so, consider whether the other information is materially inconsistent with the financial statements or our knowledge obtained in the audit, or otherwise appears to be materially misstated. If, based on the work we have performed, we conclude that there is a material misstatement of this other information, we are required to report that fact. We have nothing to report in this regard.
Responsibilities of the Board of Directors of the Fund for the financial statements
The Board of Directors of the Fund is responsible for the preparation and fair presentation of the financial statements in accordance with Luxembourg legal and regulatory requirements relating to the preparation and presentation of the financial statements, and for such internal control as the Board of Directors of the Fund determines is necessary to enable the preparation of financial statements that are free from material misstatement, whether due to fraud or error.
In preparing the financial statements, the Board of Directors of the Fund is responsible for assessing the Fund’s and each of its sub-funds' ability to continue as a going concern, disclosing, as applicable, matters related to going concern and using the going concern basis of accounting unless the Board of Directors of the Fund either intends to liquidate the Fund or close any of its sub-funds or to cease operations, or has no realistic alternative but to do so.
Responsibilities of the “Réviseur d’entreprises agréé” for the audit of the financial statements
The objectives of our audit are to obtain reasonable assurance about whether the financial statements as a whole are free from material misstatement, whether due to fraud or error, and to issue an audit report that includes our opinion. Reasonable assurance is a high level of assurance, but is not a guarantee that an audit conducted in accordance with the Law of 23 July 2016 and with ISAs as adopted for Luxembourg by the CSSF will always detect a material misstatement when it exists. Misstatements can arise from fraud or error and are considered material if, individually or in the aggregate, they could reasonably be expected to influence the economic decisions of users taken on the basis of these financial statements.
As part of an audit in accordance with the Law of 23 July 2016 and with ISAs as adopted for Luxembourg by the CSSF, we exercise professional judgment and maintain professional scepticism throughout the audit. We also:
• identify and assess the risks of material misstatement of the financial statements, whether due to fraud or error, design and perform audit procedures responsive to those risks, and obtain audit evidence that is sufficient and appropriate to provide a basis for our opinion. The risk of not detecting a material misstatement resulting from fraud is higher than for one resulting from error, as fraud may involve collusion, forgery, intentional omissions, misrepresentations, or the override of internal control;
• obtain an understanding of internal control relevant to the audit in order to design audit procedures that are appropriate in the circumstances, but not for the purpose of expressing an opinion on the effectiveness of the Fund’s internal control;
• evaluate the appropriateness of accounting policies used and the reasonableness of accounting estimates and related disclosures made by the Board of Directors of the Fund;
8

• conclude on the appropriateness of the Board of Directors of the Fund’s use of the going concern basis of accounting and, based on the audit evidence obtained, whether a material uncertainty exists related to events or conditions that may cast significant doubt on the Fund’s or any of its sub-funds' ability to continue as a going concern. If we conclude that a material uncertainty exists, we are required to draw attention in our audit report to the related disclosures in the financial statements or, if such disclosures are inadequate, to modify our opinion. Our conclusions are based on the audit evidence obtained up to the date of our audit report. However, future events or conditions may cause the Fund or any of its sub-funds to cease to continue as a going concern;
• evaluate the overall presentation, structure and content of the financial statements, including the disclosures, and whether the financial statements represent the underlying transactions and events in a manner that achieves fair presentation.
We communicate with those charged with governance regarding, among other matters, the planned scope and timing of the audit and significant audit findings, including any significant deficiencies in internal control that we identify during our audit.
Other Matter
In addition to our responsibility to audit and express an opinion on the financial statements in accordance with the Law of 23 July 2016 and with ISAs as adopted for Luxembourg by the CSSF, we have been requested by the Board of Directors of the Fund to express an opinion on the financial statements in accordance with generally accepted auditing standards in the United States of America as issued by the AICPA, in order to meet the requirements of Rule 206(4)-2 of the US Investment Advisors Act of 1940. We have reported separately in this respect on Page 10.
PricewaterhouseCoopers, Société coopérativeRepresented by@esig
@esigJohn Parkhouse
Luxembourg, 18 March 2021
9

Report of Independent Auditors
To the Shareholders of Goldman Sachs Funds
We have audited the accompanying financial statements of Goldman Sachs Funds and of each of its sub-funds (the “Fund”), which comprise the statement of assets and liabilities, the schedule of investments, as of 30 November 2020 and the related statements of operations and statement of changes in shareholders’ equity for the year then ended.
Responsibility of the Board of Directors of the Fund for the financial statements
The Board of Directors of the Fund is responsible for the preparation and fair presentation of the financial statements in accordance with Luxembourg legal and regulatory requirements relating to the preparation and presentation of the financial statements; this includes the design, implementation, and maintenance of internal controls relevant to the preparation and fair presentation of financial statements that are free from material misstatement, whether due to fraud or error.
Auditors’ Responsibility
Our responsibility is to express an opinion on the financial statements based on our audit. We conducted our audit in accordance with auditing standards generally accepted in the United States of America. Those standards require that we plan and perform the audit to obtain reasonable assurance about whether the financial statements are free from material misstatement.
An audit involves performing procedures to obtain audit evidence about the amounts and disclosures in the financial statements. The procedures selected depend on our judgment, including the assessment of the risks of material misstatement of the financial statements, whether due to fraud or error. In making those risk assessments, we consider internal control relevant to the Fund’s preparation and fair presentation of the financial statements in order to design audit procedures that are appropriate in the circumstances, but not for the purpose of expressing an opinion on the effectiveness of the Fund’s internal control. Accordingly, we express no such opinion. An audit also includes evaluating the appropriateness of accounting policies used and the reasonableness of accounting estimates made by the Board of Directors of the Fund, as well as evaluating the overall presentation of the financial statements. We believe that the audit evidence we have obtained is sufficient and appropriate to provide a basis for our audit opinion.
10

Opinion
In our opinion, the financial statements referred to above present fairly, in all material respects, the financial position of Goldman Sachs Funds and of each of its sub-funds as of 30 November 2020, and the results of their operations and changes in their net assets for the year then ended in accordance with Luxembourg legal and regulatory requirements relating to the preparation and presentation of the financial statements.
PricewaterhouseCoopers, Société coopérative Luxembourg, 18 March 2021Represented by
John Parkhouse
11

Notes
Asia EquityPortfolio
USD
ChinaOpportunity
EquityPortfolio
USD
EmergingMarkets EquityESG Portfolio
USD
EmergingMarkets Equity
PortfolioUSD
GlobalEnvironmentalImpact Equity
Portfolio(a)
USD
Global EquityIncomePortfolio
USD
Global EquityPartners ESG
PortfolioUSD
Global EquityPartnersPortfolio
USD
Global FutureHealth Care
EquityPortfolio(a)
USD
Global FutureTechnology
Leaders EquityPortfolio(a)
USDAssetsInvestments, at value, excluding derivatives 3(d) 192,157,468 90,207,361 170,894,320 4,045,139,808 234,189,228 15,675,234 29,446,364 1,021,398,398 44,440,818 3,300,149,024Unrealised gain on non-deliverable bond forward contracts 3(d) — — — — — — — — — —Unrealised gain on forward currency contracts and share class specific forward currency contracts 3(d) — — — — — — — 1,060,415 — —Unrealised gain on futures and futures on duration hedging share classes 3(d) — — — — — — — — — —Unrealised gain on swap contracts and swap contracts on duration hedging share classes 3(d) — — — — — — — — — —Upfront payments paid on swap transactions 3(d) — — — — — — — — — —Market value of purchased options 3(d) — — — — — — — — — —Cash 3(e) 10,113,527 81,839 2,827,933 60,664,284 2,658,441 73,117 61,222 5,403,747 950,857 9,066,857Due from Brokers 3(f),13 378,091 — — — — — — 340,000 — —Receivable for investments sold 2,655,866 487,518 — 18,543,029 3,360,384 3,067 10,855 385,930 649,924 30,546,244Receivable for shares sold 1,403,306 1,023,341 250,000 13,977,338 5,498,914 1,819 1,193,269 1,854,003 5,549,500 11,379,058Dividends receivable excluding swap contracts and contracts for difference 3(b) 10,716 50 3,300 143,721 84,648 36,521 29,420 1,373,108 4,400 1,813,541Interest receivable excluding swap contracts 3(b) — — — — — — — — — —Interest receivable on swap contracts 3(b) — — — — — — — — — —Dividend tax reclaim receivable 5 — — 5,644 19,744 — 2,538 8,579 463,805 — —Interest tax reclaim receivable 5 — — — — — — — — — —Interest receivable on securities lending 6 — — — 34,728 — — — 2,812 — —Investment Adviser fees waived receivable 6 31 — — — 42,753 13,127 29,800 88 23,624 12Other assets 632 172 243 5,244 466 28 3,407 1,393 246 8,297Total Assets 206,719,637 91,800,281 173,981,440 4,138,527,896 245,834,834 15,805,451 30,782,916 1,032,283,699 51,619,369 3,352,963,033LiabilitiesBank overdraft — — — 944 — — — — — 1,089Due to Brokers 3(f),13 — — — — — — — 260,000 — —Unrealised loss on forward currency contracts and share class specific forward currency contracts 3(d) — — — — — — — 962,263 — —Unrealised loss on futures and futures on duration hedging share classes 3(d) 14,369 — — — — — — — — —Unrealised loss on swap contracts and swap contracts on duration hedging share classes 3(d) — — — — — — — — — —Upfront payments received on swap transactions 3(d) — — — — — — — — — —Market value of written options 3(d) — — — — — — — — — —Market value of covered forward mortgage backed securities 3(d) — — — — — — — — — —Payable for investments purchased 2,620,671 1,131,998 26,934 19,934,138 9,440,427 — 1,007,219 — 6,035,832 —Payable for shares redeemed 12,894 1,263 7,077 8,183,253 30,611 27,602 549,206 3,215,349 — 31,000,000Interest payable on swap contracts 3(b) — — — — — — — — — —Interest payable excluding Swap Contracts 3(b) — — — 44,725 — — — — — —Dividends payable on swap contracts 3(b) — — — — — — — — — —Securities lending fee payable 6 — — — 3,473 — — — 281 — —Distributions payable 8 — — — — — 63 — — — —Investment Adviser fee payable 6 77,815 58,832 125,573 2,984,484 146,813 16,142 22,275 557,774 24,914 163,307Performance fees payable 6 — — — — — — — — — —Administration fees payable 6 30,784 16,962 24,845 187,223 28,240 16,776 17,604 102,112 5,923 150,759Depositary fees payable 6 33,488 16,224 34,356 515,149 30,249 6,183 12,083 49,369 1,666 117,087Distribution and servicing fees payable 6 6,732 — 10 55,695 1,648 345 1,261 4,559 4 123Transfer Agent fee payable 6 20,208 9,848 11,421 132,722 11,718 12,721 12,744 41,025 5,321 9,113Taxe d’abonnement payable 5 7,104 2,962 5,506 154,799 10,566 1,280 2,073 46,451 2,395 59,653Capital gains tax payable 5 1,035,312 — 407,339 12,615,302 — — — — — —Audit fee payable 17,446 17,447 12,369 24,306 12,369 12,369 12,369 12,369 12,512 12,369Management Company fees payable 6 2,812 1,037 2,199 58,546 2,931 425 605 17,092 425 26,525Directors fees payable 6 — — — — — — — — — —Legal fees payable 4,884 9,993 7,386 50,713 1,853 9,344 9,720 10,358 882 49,448Insurance fees payable 5,762 693 781 56,018 157 2,343 678 20,785 47 3,022Printing fees payable 5,314 3,397 3,182 42,335 2,448 3,573 3,366 13,528 — 10,383Publishing fees payable 1,265 759 1,013 2,194 1,350 928 1,014 2,954 463 1,098Payable for Withholding Tax on Dividend and Interest Income 5 2,207 — 756 — 21,414 5,873 2,485 215,990 1,315 420,033Tax reporting fees payable 18,037 11,644 13,758 22,995 25,694 13,449 14,716 23,088 21,615 22,713Paying Agency fee payable 14,858 14,918 15,242 14,923 13,870 14,918 14,918 15,252 4,319 13,870Regulatory reporting fees payable 12,281 10,665 12,236 39,010 19,799 10,668 10,969 20,121 4,167 34,778Other liabilities 7,337 4,448 5,574 83,318 1,867 3,933 — 11,178 2,096 12,180Total Liabilities 3,951,580 1,313,090 717,557 45,206,265 9,804,024 158,935 1,695,305 5,601,898 6,123,896 32,107,550Shareholders’ Equity 202,768,057 90,487,191 173,263,883 4,093,321,631 236,030,810 15,646,516 29,087,611 1,026,681,801 45,495,473 3,320,855,483Swing Pricing 3(k) — — 415,833 — — — — (718,677) — —Shareholders’ Equity (after Swing Pricing) 202,768,057 90,487,191 173,679,716 4,093,321,631 236,030,810 15,646,516 29,087,611 1,025,963,124 45,495,473 3,320,855,483
(a) Refer to Appendix II.
Please refer to Statistical information for Outstanding Shares and Net Asset Value Per Share as at 30 November 2020.
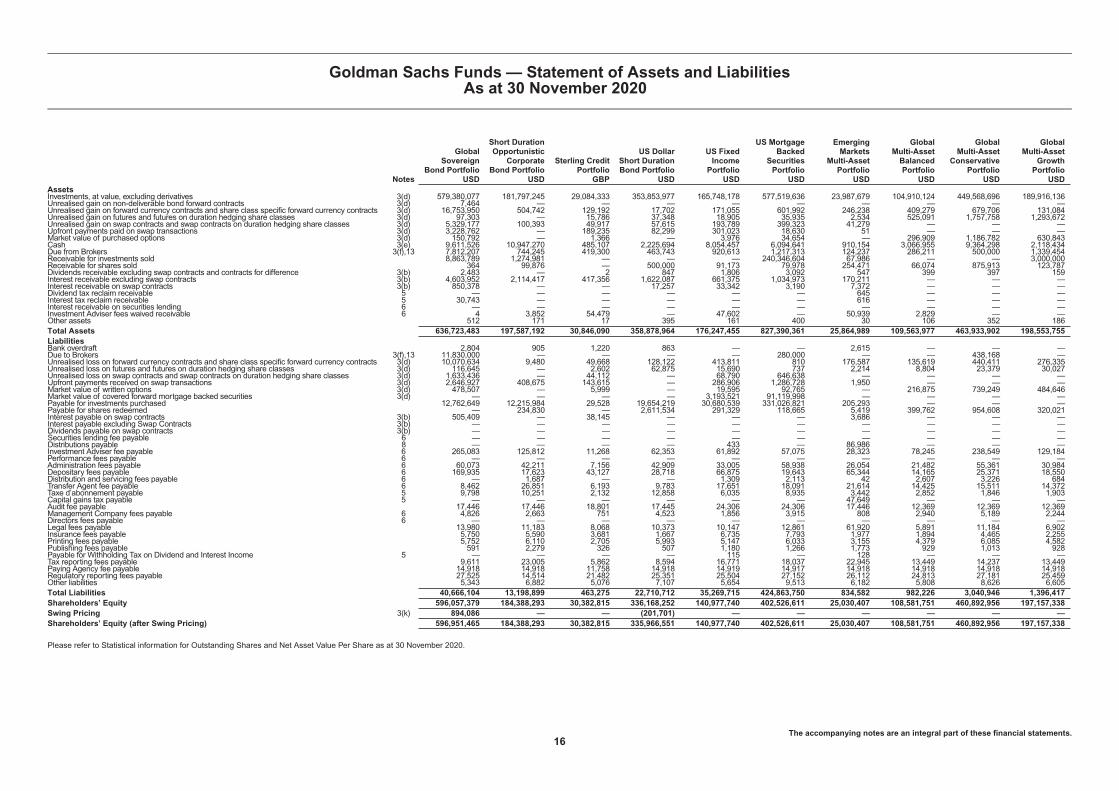
Goldman Sachs Funds — Statement of Assets and LiabilitiesAs at 30 November 2020
The accompanying notes are an integral part of these financial statements.12

Notes
GlobalMillennials
EquityPortfolio
USD
India EquityPortfolio
USD
Japan EquityPartners
Portfolio(b)(c)
JPY
Japan EquityPortfolio(b)(c)
JPY
US EquityPortfolio
USD
US FocusedGrowth Equity
PortfolioUSD
USSmaller Cap
EquityPortfolio
USD
USTechnology
OpportunitiesEquity
Portfolio(a)
USD
GlobalInfrastructure
EquityPortfolio
USD
Global RealEstate Equity
PortfolioUSD
AssetsInvestments, at value, excluding derivatives 3(d) 1,330,377,252 1,474,589,577 175,595,688 123,825,746 705,000,962 37,190,460 36,077,235 83,186,265 13,380,351 38,888,854Unrealised gain on non-deliverable bond forward contracts 3(d) — — — — — — — — — —Unrealised gain on forward currency contracts and share class specific forward currency contracts 3(d) — — 355,984 496,748 2,448,387 — 25,043 — — —Unrealised gain on futures and futures on duration hedging share classes 3(d) — — — — — — — — — —Unrealised gain on swap contracts and swap contracts on duration hedging share classes 3(d) — — — — — — — — — —Upfront payments paid on swap transactions 3(d) — — — — — — — — — —Market value of purchased options 3(d) — — — — — — — — — —Cash 3(e) 1,615,978 17,197,773 2,203,137 2,321,059 5,974,320 55,759 52,496 1,121,625 85,263 89,325Due from Brokers 3(f),13 — 708,225 221,000 — — — — — — —Receivable for investments sold — 4,564,603 — 707,641 — — — — 10,143 3,810Receivable for shares sold 23,726,178 3,374,969 684,312 136,238 265,055 94,886 780,800 10,624,852 221,367 120,015Dividends receivable excluding swap contracts and contracts for difference 3(b) 253,845 441,283 591,981 559,021 934,242 8,406 25,470 27,193 40,226 114,523Interest receivable excluding swap contracts 3(b) — — — — — — — — — —Interest receivable on swap contracts 3(b) — — — — — — — — — —Dividend tax reclaim receivable 5 27,648 — — — — — — — — 7,322Interest tax reclaim receivable 5 — — — — — — — — — —Interest receivable on securities lending 6 7,676 — — 97 — — — — — —Investment Adviser fees waived receivable 6 1 — — — — 9,808 31,542 30,875 28,945 20,219Other assets 2,756 19,555 1,231 1,172 840 374 39 — 22 53Total Assets 1,356,011,334 1,500,895,985 179,653,333 128,047,722 714,623,806 37,359,693 36,992,625 94,990,810 13,766,317 39,244,121LiabilitiesBank overdraft 323 — — — — — — — 915 —Due to Brokers 3(f),13 — — 179,507 412,237 1,720,000 — — — — —Unrealised loss on forward currency contracts and share class specific forward currency contracts 3(d) — — 270,710 44,771 15,167 — — — — —Unrealised loss on futures and futures on duration hedging share classes 3(d) — 19,263 — — — — — — — —Unrealised loss on swap contracts and swap contracts on duration hedging share classes 3(d) — — — — — — — — — —Upfront payments received on swap transactions 3(d) — — — — — — — — — —Market value of written options 3(d) — — — — — — — — — —Market value of covered forward mortgage backed securities 3(d) — — — — — — — — — —Payable for investments purchased 33,631,041 2,213,005 — 762,814 — — 760,006 10,518,844 184,267 —Payable for shares redeemed 1,722,620 3,352,518 447,689 415,174 728,500 27,950 44,317 — 46,342 4,308Interest payable on swap contracts 3(b) — — — — — — — — — —Interest payable excluding Swap Contracts 3(b) — — — — — — — — — —Dividends payable on swap contracts 3(b) — — — — — — — — — —Securities lending fee payable 6 768 — — 10 — — — — — —Distributions payable 8 — — — — — — — — 884 116,214Investment Adviser fee payable 6 919,519 1,372,228 101,927 77,613 719,806 40,445 20,761 241 10,984 31,780Performance fees payable 6 — — — — — — — — — —Administration fees payable 6 88,253 123,482 13,177 12,570 85,476 17,628 17,556 3,393 27,596 27,594Depositary fees payable 6 51,226 314,469 11,091 10,126 37,389 7,297 31,202 1,187 12,243 20,323Distribution and servicing fees payable 6 93,706 44,461 — 6,286 8,149 4,894 51 4 1,361 173Transfer Agent fee payable 6 35,146 106,317 3,349 5,423 35,802 15,215 11,513 2,638 20,416 21,024Taxe d’abonnement payable 5 63,854 78,154 5,438 3,945 54,116 — 2,874 1,444 650 1,772Capital gains tax payable 5 — 13,059,563 — — — — — — — —Audit fee payable 12,369 53,944 1,305 1,305 12,369 12,369 12,370 13,106 12,370 12,369Management Company fees payable 6 23,173 31,116 1,928 1,496 21,589 1,033 1,059 382 220 550Directors fees payable 6 — 3,458 — — — — — 1 — —Legal fees payable 60,971 — 1,100 2,092 18,578 10,456 9,976 402 10,251 4,374Insurance fees payable 236 39,787 647 2,603 14,330 2,848 782 12 164 1,324Printing fees payable 11,038 22,706 1,686 1,601 9,670 4,063 3,258 164 3,189 3,619Publishing fees payable 1,519 1,688 205 223 1,855 1,012 1,013 288 2,026 2,026Payable for Withholding Tax on Dividend and Interest Income 5 74,889 88,257 90,662 85,614 263,081 2,481 7,628 8,157 7,521 16,467Tax reporting fees payable 20,161 16,291 2,423 2,426 22,955 14,716 14,186 18,893 22,973 22,976Paying Agency fee payable 15,126 15,473 1,585 1,461 15,020 14,918 15,242 215 14,918 14,918Regulatory reporting fees payable 17,280 16,956 — — 16,635 10,958 10,916 2,243 12,935 13,097Other liabilities 11,011 233,867 1,610 2,070 10,318 4,851 4,107 166 3,924 4,375Total Liabilities 36,854,229 21,207,003 1,136,039 1,851,860 3,810,805 193,134 968,817 10,571,780 396,149 319,283Shareholders’ Equity 1,319,157,105 1,479,688,982 178,517,294 126,195,862 710,813,001 37,166,559 36,023,808 84,419,030 13,370,168 38,924,838Swing Pricing 3(k) — — — — — — — 25,326 — —Shareholders’ Equity (after Swing Pricing) 1,319,157,105 1,479,688,982 178,517,294 126,195,862 710,813,001 37,166,559 36,023,808 84,444,356 13,370,168 38,924,838
(a) Refer to Appendix II.(b) Expressed in ‘000(c) Refer to Note 3(i).
Please refer to Statistical information for Outstanding Shares and Net Asset Value Per Share as at 30 November 2020.
Goldman Sachs Funds — Statement of Assets and LiabilitiesAs at 30 November 2020
The accompanying notes are an integral part of these financial statements.13

Notes
North AmericaEnergy &Energy
InfrastructureEquity
PortfolioUSD
EmergingMarkets
CORE® EquityPortfolio(c)
USD
Europe CORE®
EquityPortfolio
EUR
Global CORE®
EquityPortfolio(c)
USD
Global SmallCap CORE®
EquityPortfolio(c)
USD
US CORE®
EquityPortfolio(c)
USD
US Small CapCORE® Equity
Portfolio(c)
USD
Asia HighYield BondPortfolio(a)
USD
EmergingMarkets
CorporateBond Portfolio
USD
EmergingMarkets Debt
Blend PortfolioUSD
AssetsInvestments, at value, excluding derivatives 3(d) 38,944,684 2,674,374,234 1,836,015,275 3,720,633,982 451,228,897 1,716,455,678 214,161,017 30,237,439 3,370,930,674 1,008,436,867Unrealised gain on non-deliverable bond forward contracts 3(d) — — — — — — — — — 216,507Unrealised gain on forward currency contracts and share class specific forward currency contracts 3(d) — 5,363 62,710 603,082 686 1,019,048 — 13,395 23,316,419 35,925,931Unrealised gain on futures and futures on duration hedging share classes 3(d) — 1,279,222 — — 16,177 216,750 — 620 863,019 163,775Unrealised gain on swap contracts and swap contracts on duration hedging share classes 3(d) — — — — — — — — 1,607,093 3,904,795Upfront payments paid on swap transactions 3(d) — — — — — — — — 3,359,969 1,496,174Market value of purchased options 3(d) — — — — — — — — — 659,636Cash 3(e) 217,518 38,995,885 18,507,996 37,365,885 4,928,658 29,428,542 2,402,859 519,046 54,737,400 17,696,773Due from Brokers 3(f),13 — — 619,708 5,166 — 1,825,370 — 8,535 56,709,845 23,243,276Receivable for investments sold — — 192,484 — — — — 387,388 3,946,638 1,645,887Receivable for shares sold 117,414 3,442,432 1,844,676 6,969,456 347,064 6,993,561 77,347 20,833 97,288,238 —Dividends receivable excluding swap contracts and contracts for difference 3(b) 182,947 967,323 1,755,330 5,427,477 626,976 1,855,921 229,987 228 14,919 947Interest receivable excluding swap contracts 3(b) — — 378 — — — — 501,206 37,761,351 14,712,462Interest receivable on swap contracts 3(b) — — — — — — — — 423,122 925,104Dividend tax reclaim receivable 5 75,069 738,841 3,711,975 1,609,434 74,976 2,946 — — — —Interest tax reclaim receivable 5 — — — — — — — — — 56,532Interest receivable on securities lending 6 2,781 — 5,084 19,164 801 — 1,049 — — —Investment Adviser fees waived receivable 6 12,698 — — 2 — — 358 52,948 — —Other assets 26 2,016 1,370 3,288 553 2,266 143 1,241 6,636 796Total Assets 39,553,137 2,719,805,316 1,862,716,986 3,772,636,936 457,224,788 1,757,800,082 216,872,760 31,742,879 3,650,965,323 1,109,085,462LiabilitiesBank overdraft — — — 838 — — — — 2,884 1,850Due to Brokers 3(f),13 — 234,555 — 320,000 3,358 680,000 — — 13,170,000 21,390,000Unrealised loss on forward currency contracts and share class specific forward currency contracts 3(d) — — 1,470,331 7,839 — — — — 2,894,979 17,771,519Unrealised loss on futures and futures on duration hedging share classes 3(d) — — — — — — — 1,800 197,848 19,684Unrealised loss on swap contracts and swap contracts on duration hedging share classes 3(d) — — — — — — — — 624,452 2,140,596Upfront payments received on swap transactions 3(d) — — — — — — — — 980,472 976,839Market value of written options 3(d) — — — — — — — — — 251,591Market value of covered forward mortgage backed securities 3(d) — — — — — — — — — —Payable for investments purchased — — — — — — — 754,782 22,308,593 9,949,491Payable for shares redeemed 114,661 2,806,342 6,112,516 27,426,005 745,323 9,600,109 443,972 — 5,320,535 404,711Interest payable on swap contracts 3(b) — — 378 — — — — — 50,990 622,708Interest payable excluding Swap Contracts 3(b) — — — — 2 — — — — —Dividends payable on swap contracts 3(b) — — — — — — — — — —Securities lending fee payable 6 278 — 508 1,916 80 — 105 — — —Distributions payable 8 — — — 30 — — — 25,048 742,861 —Investment Adviser fee payable 6 38,608 1,312,641 843,394 1,101,352 260,180 837,085 41,820 13,973 2,016,456 336,429Performance fees payable 6 — — — — — — — — — —Administration fees payable 6 16,774 153,045 108,392 209,570 61,322 119,115 31,646 12,641 184,023 89,313Depositary fees payable 6 15,172 514,298 155,688 200,727 80,797 72,568 22,509 9,526 131,175 158,584Distribution and servicing fees payable 6 1,015 602 49,317 103,996 11,194 60,204 1,583 2 9,731 357Transfer Agent fee payable 6 14,437 72,646 69,326 97,713 44,563 53,485 20,921 14,450 97,012 13,896Taxe d’abonnement payable 5 3,085 72,774 60,110 99,102 21,132 56,601 6,242 823 100,617 17,324Capital gains tax payable 5 — — — — — — — — — 3,012Audit fee payable 12,370 17,446 10,548 12,370 17,446 17,446 12,370 16,778 17,446 17,446Management Company fees payable 6 825 31,920 25,687 43,933 8,888 24,237 2,283 349 41,877 8,563Directors fees payable 6 — — — — — — — — — —Legal fees payable 9,973 52,467 45,733 76,217 15,517 56,311 11,830 1,989 34,351 17,739Insurance fees payable 7,371 10,911 15,989 33,288 7,815 13,838 6,409 641 32,970 4,992Printing fees payable 4,952 21,501 22,263 33,481 8,678 17,023 8,537 3,951 31,841 7,320Publishing fees payable 929 1,941 2,092 3,123 1,773 1,688 1,097 1,619 3,124 1,182Payable for Withholding Tax on Dividend and Interest Income 5 45,681 165,537 70,806 1,120,990 146,347 553,135 67,754 — — —Tax reporting fees payable 13,689 22,965 19,636 23,109 22,945 22,694 15,743 28,993 23,108 17,010Paying Agency fee payable 14,931 14,822 5,350 14,776 14,918 14,549 14,975 8,815 15,033 14,077Regulatory reporting fees payable 10,794 29,633 31,784 40,989 17,426 18,083 12,078 17,303 53,668 30,718Other liabilities 4,848 59,962 34,599 40,686 21,682 21,687 8,499 — 51,924 19,806Total Liabilities 330,393 5,596,008 9,154,447 31,012,050 1,511,386 12,239,858 730,373 913,483 49,137,970 54,286,757Shareholders’ Equity 39,222,744 2,714,209,308 1,853,562,539 3,741,624,886 455,713,402 1,745,560,224 216,142,387 30,829,396 3,601,827,353 1,054,798,705Swing Pricing 3(k) — — — — — — — — — —Shareholders’ Equity (after Swing Pricing) 39,222,744 2,714,209,308 1,853,562,539 3,741,624,886 455,713,402 1,745,560,224 216,142,387 30,829,396 3,601,827,353 1,054,798,705
(a) Refer to Appendix II.(c) Refer to Note 3(i).
Please refer to Statistical information for Outstanding Shares and Net Asset Value Per Share as at 30 November 2020.
Goldman Sachs Funds — Statement of Assets and LiabilitiesAs at 30 November 2020
The accompanying notes are an integral part of these financial statements.14

Notes
EmergingMarkets DebtLocal Portfolio
USD
EmergingMarkets Debt
PortfolioUSD
EmergingMarkets ShortDuration Bond
PortfolioUSD
Euro ShortDuration BondPlus Portfolio
EUR
Europe HighYield BondPortfolio
EUR
Global CreditPortfolio(Hedged)
USD
Global ESGEnhanced
Income BondPortfolio
USD
Global FixedIncomePortfolio
USD
Global FixedIncomePortfolio(Hedged)
EUR
Global HighYield Portfolio
USDAssetsInvestments, at value, excluding derivatives 3(d) 1,643,438,063 6,157,966,752 65,017,130 288,101,784 61,998,476 1,307,982,500 23,449,090 191,686,667 1,101,807,741 2,968,025,221Unrealised gain on non-deliverable bond forward contracts 3(d) 516,563 — — — — — — — — —Unrealised gain on forward currency contracts and share class specific forward currency contracts 3(d) 61,095,179 124,425,223 446,702 690,294 101,316 9,301,705 23,355 725,411 10,238,325 20,698,792Unrealised gain on futures and futures on duration hedging share classes 3(d) 140,286 2,400,425 5,243 169,124 82 260,579 1,152 277,886 1,486,586 642,805Unrealised gain on swap contracts and swap contracts on duration hedging share classes 3(d) 11,840,867 20,887,118 — 264,529 9,260 2,129,086 27,249 356,076 1,991,442 15,326,308Upfront payments paid on swap transactions 3(d) 3,134,174 11,924,824 — 605,116 21,247 6,787,652 20,381 767,383 4,813,386 9,314,231Market value of purchased options 3(d) 1,417,722 2,552,273 — — — 254,436 — 72,123 414,912 —Cash 3(e) 36,278,265 106,270,380 1,011,465 4,894,147 1,130,545 21,678,412 1,511,945 10,150,942 61,078,230 48,533,538Due from Brokers 3(f),13 37,263,885 205,782,795 89,794 1,855,577 87,618 25,601,308 135,567 2,369,221 25,413,295 13,061,071Receivable for investments sold 366,706 6,029,409 — — — 3,098,856 — 10,635,273 61,052,416 —Receivable for shares sold 1,560,079 19,572,928 — 435,090 14,625 12,748,623 — 447,683 5,494,315 1,998,188Dividends receivable excluding swap contracts and contracts for difference 3(b) 1,368 16,264 143 — — 2,328 83 12,188 499 5,874Interest receivable excluding swap contracts 3(b) 24,847,455 82,393,839 773,217 1,732,983 769,743 10,874,378 207,318 962,559 5,360,024 42,744,773Interest receivable on swap contracts 3(b) 2,439,545 2,533,531 — 66,216 2,960 607,617 5,854 46,157 290,582 2,718,171Dividend tax reclaim receivable 5 — — — — — — — — — —Interest tax reclaim receivable 5 177,670 — — — — — — — — —Interest receivable on securities lending 6 — — — — — — — — — 12,627Investment Adviser fees waived receivable 6 — — 14,766 41,028 14,042 197 65,925 73,012 127 —Other assets 862 7,019 122 249 106 1,162 166 290 1,780 3,261Total Assets 1,824,518,689 6,742,762,780 67,358,582 298,856,137 64,150,020 1,401,328,839 25,448,085 218,582,871 1,279,443,660 3,123,084,860LiabilitiesBank overdraft 1,605 800 — — — 658 — 152 — 1,511Due to Brokers 3(f),13 38,100,001 48,970,000 — 284,000 — 3,090,000 — 350,000 13,236,221 16,740,000Unrealised loss on forward currency contracts and share class specific forward currency contracts 3(d) 40,013,255 74,010,592 70,246 367,302 153,810 9,858,531 72,396 106,380 6,269,620 1,171,949Unrealised loss on futures and futures on duration hedging share classes 3(d) 12,881 109,489 19,840 10,995 4,209 186,360 9,384 25,971 168,528 227,063Unrealised loss on swap contracts and swap contracts on duration hedging share classes 3(d) 4,795,367 11,819,359 — 299,459 4,175 2,436,430 45 346,620 1,971,550 —Upfront payments received on swap transactions 3(d) 1,074,632 14,765,146 — 682,401 32,585 3,810,461 53 986,053 5,653,506 1,247,566Market value of written options 3(d) 539,388 978,745 — — — 1,069,345 — 164,482 1,135,433 —Market value of covered forward mortgage backed securities 3(d) — — — — — — — 1,067,070 2,659,061 —Payable for investments purchased 21,171,346 76,929,854 — 25,404 238,423 10,432,500 4,497,421 39,209,510 183,185,583 25,533,000Payable for shares redeemed 381,152 7,124,110 162,442 373,709 80,936 1,872,169 — 221,051 1,656,763 2,339,531Interest payable on swap contracts 3(b) 1,637,110 1,817,456 — 10,468 — 76,398 — — 2,126 55,773Interest payable excluding Swap Contracts 3(b) — — — — — — — — — —Dividends payable on swap contracts 3(b) — — — — — — — — — —Securities lending fee payable 6 — — — — — — — — — 1,263Distributions payable 8 63,391 659,306 — — 2,789 — 1,226 — — 1,687,389Investment Adviser fee payable 6 880,544 3,348,323 30,687 71,289 33,831 358,391 8,631 67,204 273,664 1,084,763Performance fees payable 6 — — — — — — — — — —Administration fees payable 6 126,794 335,218 25,923 33,391 14,353 97,452 9,584 45,960 87,046 215,540Depositary fees payable 6 256,862 371,978 11,870 69,359 21,115 167,565 7,893 90,128 128,181 131,189Distribution and servicing fees payable 6 3,951 183,276 203 1,255 564 16,353 54 5,327 2,018 36,794Transfer Agent fee payable 6 41,066 143,353 17,491 11,731 13,930 40,307 11,998 15,035 24,596 105,269Taxe d’abonnement payable 5 31,977 216,697 3,894 15,840 2,528 44,507 412 8,000 40,937 97,790Capital gains tax payable 5 175,829 — — — — — — — — —Audit fee payable 24,309 24,306 17,446 14,877 14,877 24,306 19,229 24,305 20,727 24,305Management Company fees payable 6 14,644 92,373 1,499 5,567 872 20,756 189 2,999 15,610 41,151Directors fees payable 6 — — — — — — — — — —Legal fees payable 25,499 107,700 9,679 10,621 7,642 18,870 764 11,435 12,504 50,423Insurance fees payable 23,412 78,336 1,793 1,495 3,063 25,715 413 4,362 12,482 97,062Printing fees payable 15,139 52,309 3,963 5,183 3,537 14,717 5,602 4,527 9,204 38,043Publishing fees payable 2,363 6,243 1,688 649 1,082 2,701 1,526 1,013 1,658 5,568Payable for Withholding Tax on Dividend and Interest Income 5 — — — — — — — — — —Tax reporting fees payable 23,016 23,489 18,143 9,930 15,177 23,057 31,761 14,716 19,583 23,407Paying Agency fee payable 14,957 19,249 15,262 12,871 12,871 14,894 9,084 14,918 12,871 22,618Regulatory reporting fees payable 37,558 84,203 26,187 24,862 24,473 35,815 16,269 25,390 32,530 57,125Other liabilities 28,654 84,249 4,590 6,088 7,562 18,042 4,295 5,252 9,870 50,192Total Liabilities 109,516,702 242,356,159 442,846 2,348,746 694,404 33,756,300 4,708,229 42,817,860 216,641,872 51,086,284Shareholders’ Equity 1,715,001,987 6,500,406,621 66,915,736 296,507,391 63,455,616 1,367,572,539 20,739,856 175,765,011 1,062,801,788 3,071,998,576Swing Pricing 3(k) — — — — — — — — 1,169,082 —Shareholders’ Equity (after Swing Pricing) 1,715,001,987 6,500,406,621 66,915,736 296,507,391 63,455,616 1,367,572,539 20,739,856 175,765,011 1,063,970,870 3,071,998,576
Please refer to Statistical information for Outstanding Shares and Net Asset Value Per Share as at 30 November 2020.
Goldman Sachs Funds — Statement of Assets and LiabilitiesAs at 30 November 2020
The accompanying notes are an integral part of these financial statements.15
Notes
GlobalSovereign
Bond PortfolioUSD
Short DurationOpportunistic
CorporateBond Portfolio
USD
Sterling CreditPortfolio
GBP
US DollarShort DurationBond Portfolio
USD
US FixedIncomePortfolio
USD
US MortgageBacked
SecuritiesPortfolio
USD
EmergingMarkets
Multi-AssetPortfolio
USD
GlobalMulti-AssetBalancedPortfolio
USD
GlobalMulti-Asset
ConservativePortfolio
USD
GlobalMulti-Asset
GrowthPortfolio
USDAssetsInvestments, at value, excluding derivatives 3(d) 579,380,077 181,797,245 29,084,333 353,853,977 165,748,178 577,519,636 23,987,679 104,910,124 449,568,696 189,916,136Unrealised gain on non-deliverable bond forward contracts 3(d) 7,464 — — — — — — — — —Unrealised gain on forward currency contracts and share class specific forward currency contracts 3(d) 16,753,950 504,742 129,192 17,702 171,055 601,992 246,238 409,279 679,706 131,084Unrealised gain on futures and futures on duration hedging share classes 3(d) 97,303 — 15,786 37,348 18,905 35,935 2,534 525,091 1,757,758 1,293,672Unrealised gain on swap contracts and swap contracts on duration hedging share classes 3(d) 5,329,177 100,393 49,917 57,615 193,789 399,323 41,279 — — —Upfront payments paid on swap transactions 3(d) 3,228,762 — 189,235 82,299 301,023 18,630 51 — — —Market value of purchased options 3(d) 150,792 — 1,366 — 3,976 34,654 — 296,909 1,186,782 630,843Cash 3(e) 9,611,526 10,947,270 485,107 2,225,694 8,054,457 6,094,641 910,154 3,066,955 9,364,298 2,118,434Due from Brokers 3(f),13 7,812,207 744,245 419,300 463,743 920,613 1,217,313 124,237 286,211 500,000 1,339,454Receivable for investments sold 8,863,789 1,274,981 — — — 240,346,604 67,986 — — 3,000,000Receivable for shares sold 364 99,876 — 500,000 91,173 79,978 254,471 66,074 875,913 123,787Dividends receivable excluding swap contracts and contracts for difference 3(b) 2,483 — 2 847 1,806 3,092 547 399 397 159Interest receivable excluding swap contracts 3(b) 4,603,952 2,114,417 417,356 1,622,087 661,375 1,034,973 170,211 — — —Interest receivable on swap contracts 3(b) 850,378 — — 17,257 33,342 3,190 7,372 — — —Dividend tax reclaim receivable 5 — — — — — — 645 — — —Interest tax reclaim receivable 5 30,743 — — — — — 616 — — —Interest receivable on securities lending 6 — — — — — — — — — —Investment Adviser fees waived receivable 6 4 3,852 54,479 — 47,602 — 50,939 2,829 — —Other assets 512 171 17 395 161 400 30 106 352 186Total Assets 636,723,483 197,587,192 30,846,090 358,878,964 176,247,455 827,390,361 25,864,989 109,563,977 463,933,902 198,553,755LiabilitiesBank overdraft 2,804 905 1,220 863 — — 2,615 — — —Due to Brokers 3(f),13 11,830,000 — — — — 280,000 — — 438,168 —Unrealised loss on forward currency contracts and share class specific forward currency contracts 3(d) 10,070,634 9,480 49,668 128,122 413,811 810 176,587 135,619 440,411 276,335Unrealised loss on futures and futures on duration hedging share classes 3(d) 116,645 — 2,602 62,875 15,690 737 2,214 8,804 23,379 30,027Unrealised loss on swap contracts and swap contracts on duration hedging share classes 3(d) 1,633,436 — 44,112 — 68,790 646,638 — — — —Upfront payments received on swap transactions 3(d) 2,646,927 408,675 143,615 — 286,906 1,286,728 1,950 — — —Market value of written options 3(d) 478,507 — 5,999 — 19,595 92,765 — 216,875 739,249 484,646Market value of covered forward mortgage backed securities 3(d) — — — — 3,193,521 91,119,998 — — — —Payable for investments purchased 12,762,649 12,215,984 29,528 19,654,219 30,680,539 331,026,821 205,293 — — —Payable for shares redeemed — 234,830 — 2,611,534 291,329 118,665 5,419 399,762 954,608 320,021Interest payable on swap contracts 3(b) 505,409 — 38,145 — — — 3,686 — — —Interest payable excluding Swap Contracts 3(b) — — — — — — — — — —Dividends payable on swap contracts 3(b) — — — — — — — — — —Securities lending fee payable 6 — — — — — — — — — —Distributions payable 8 — — — — 433 — 86,986 — — —Investment Adviser fee payable 6 265,083 125,812 11,268 62,353 61,892 57,075 28,323 78,245 238,549 129,184Performance fees payable 6 — — — — — — — — — —Administration fees payable 6 60,073 42,211 7,156 42,909 33,005 58,938 26,054 21,482 55,361 30,984Depositary fees payable 6 169,935 17,623 43,127 28,718 66,875 19,643 65,344 14,165 25,371 18,550Distribution and servicing fees payable 6 — 1,687 — — 1,309 2,113 42 2,607 3,226 684Transfer Agent fee payable 6 8,462 26,851 6,193 9,783 17,651 18,091 21,614 14,425 15,511 14,372Taxe d’abonnement payable 5 9,798 10,251 2,132 12,858 6,035 8,935 3,442 2,852 1,846 1,903Capital gains tax payable 5 — — — — — — 47,649 — — —Audit fee payable 17,446 17,446 18,801 17,445 24,306 24,306 17,446 12,369 12,369 12,369Management Company fees payable 6 4,826 2,663 751 4,523 1,856 3,915 808 2,940 5,189 2,244Directors fees payable 6 — — — — — — — — — —Legal fees payable 13,980 11,183 8,068 10,373 10,147 12,861 61,920 5,891 11,184 6,902Insurance fees payable 5,750 5,590 3,681 1,667 6,735 7,793 1,977 1,894 4,465 2,255Printing fees payable 5,752 6,110 2,705 5,993 5,147 6,033 3,155 4,379 6,085 4,582Publishing fees payable 591 2,279 326 507 1,180 1,266 1,773 929 1,013 928Payable for Withholding Tax on Dividend and Interest Income 5 — — — — 115 — 128 — — —Tax reporting fees payable 9,611 23,005 5,862 8,594 16,771 18,037 22,945 13,449 14,237 13,449Paying Agency fee payable 14,918 14,918 11,758 14,918 14,919 14,917 14,918 14,918 14,918 14,918Regulatory reporting fees payable 27,525 14,514 21,482 25,351 25,504 27,152 26,112 24,813 27,181 25,459Other liabilities 5,343 6,882 5,076 7,107 5,654 9,513 6,182 5,808 8,626 6,605Total Liabilities 40,666,104 13,198,899 463,275 22,710,712 35,269,715 424,863,750 834,582 982,226 3,040,946 1,396,417Shareholders’ Equity 596,057,379 184,388,293 30,382,815 336,168,252 140,977,740 402,526,611 25,030,407 108,581,751 460,892,956 197,157,338Swing Pricing 3(k) 894,086 — — (201,701) — — — — — —Shareholders’ Equity (after Swing Pricing) 596,951,465 184,388,293 30,382,815 335,966,551 140,977,740 402,526,611 25,030,407 108,581,751 460,892,956 197,157,338
Please refer to Statistical information for Outstanding Shares and Net Asset Value Per Share as at 30 November 2020.
Goldman Sachs Funds — Statement of Assets and LiabilitiesAs at 30 November 2020
The accompanying notes are an integral part of these financial statements.16

Notes
GlobalMulti-Asset
IncomePortfolio
USD
US Real EstateBalancedPortfolio
USD
EmergingMarkets TotalReturn Bond
PortfolioUSD
GlobalAbsoluteReturn
PortfolioUSD
Global FixedIncome Plus
Portfolio(Hedged)
EUR
GlobalStrategic
Income BondPortfolio
USD
GlobalStrategic
Macro BondPortfolio
USD
StrategicAbsolute
Return Bond IPortfolio
USD
StrategicAbsolute
Return Bond IIPortfolio
USD
Multi-ManagerDynamic
World EquityPortfolio
USDAssetsInvestments, at value, excluding derivatives 3(d) 86,779,055 210,276,475 152,915,565 186,713,770 1,793,227,833 1,736,609,881 704,138,284 686,397,421 105,718,150 702,900,141Unrealised gain on non-deliverable bond forward contracts 3(d) — — 73,746 — — — 228,701 — — —Unrealised gain on forward currency contracts and share class specific forward currency contracts 3(d) 330,518 392,160 9,900,237 1,859,165 32,974,111 47,104,349 25,308,898 34,420,465 9,056,754 2,167,103Unrealised gain on futures and futures on duration hedging share classes 3(d) 1,412,141 30,441 77,443 1,075,666 1,863,945 755,055 5,560 106,732 48,766 —Unrealised gain on swap contracts and swap contracts on duration hedging share classes 3(d) — 37,435 415,908 181,174 6,567,302 21,602,907 5,526,512 2,540,164 1,034,951 —Upfront payments paid on swap transactions 3(d) — — 315,578 412,411 12,087,223 16,968,010 7,978,230 4,136,776 1,609,816 —Market value of purchased options 3(d) — — 156,453 531,608 1,869,333 1,902,244 1,284,660 719,755 201,874 —Cash 3(e) 11,041,604 2,904,791 2,668,622 17,009,958 24,843,374 24,233,873 8,933,245 79,510,670 12,190,291 9,216,836Due from Brokers 3(f),13 5,344,482 206,143 4,746,383 16,687,116 45,407,235 85,915,035 26,455,199 13,920,571 5,615,322 —Receivable for investments sold 431,873 34,637 1,125 17,213 94,247,066 117,351,811 76,481,440 71,290,512 11,937,325 5,555,735Receivable for shares sold 1,153,828 41,922 3,619,520 30,990 7,113,858 307,132 17,798,924 436,357 4,953 2,666,798Dividends receivable excluding swap contracts and contracts for difference 3(b) 79,601 13,845 195 30,946 656 2,545 3,878 9,077 1,126 480,863Interest receivable excluding swap contracts 3(b) 563,337 1,737,766 1,879,713 553,486 9,174,175 11,072,234 1,591,407 2,573,079 428,837 —Interest receivable on swap contracts 3(b) — 525 93,904 50,143 654,815 1,557,416 379,043 106,014 95,483 —Dividend tax reclaim receivable 5 10,119 — — 6,317 — — — — — 388,325Interest tax reclaim receivable 5 — — — — 1,929 10,107 — 2,205 919 —Interest receivable on securities lending 6 — — — — — — — — — 1,676Investment Adviser fees waived receivable 6 1,725 — 26,631 49,241 68 — — 47,204 95,654 —Other assets 164 80 159 6,185 1,815 856 60 656 — 882Total Assets 107,148,447 215,676,220 176,891,182 225,215,389 2,030,034,738 2,065,393,455 876,114,041 896,217,658 148,040,221 723,378,359LiabilitiesBank overdraft — 66 670 1,910 10,053 470 7,132 846 71 —Due to Brokers 3(f),13 — — 5,890,000 1,037,725 14,601,798 25,960,000 7,400,000 25,590,000 3,080,000 600,000Unrealised loss on forward currency contracts and share class specific forward currency contracts 3(d) 399,805 4,596 4,587,272 265,329 27,672,739 24,108,557 18,657,698 8,876,585 6,146,990 1,422,811Unrealised loss on futures and futures on duration hedging share classes 3(d) 6,905 2,335 6,186 675,226 88,889 447,588 267,776 111,050 23,895 —Unrealised loss on swap contracts and swap contracts on duration hedging share classes 3(d) — 588 456,086 3,855,316 5,675,062 8,338,867 4,766,884 2,140,211 739,357 —Upfront payments received on swap transactions 3(d) — 189,597 354,366 — 14,207,884 23,126,502 9,547,336 5,931,197 1,917,046 —Market value of written options 3(d) 398,521 — 59,613 1,918,847 3,432,586 5,831,910 4,748,063 1,712,019 613,592 —Market value of covered forward mortgage backed securities 3(d) — — — — 5,318,122 — — — — —Payable for investments purchased 835,501 — 2,325,580 59,685 336,360,515 618,794,304 337,467,389 249,157,640 46,670,784 201,422Payable for shares redeemed 1,667,414 1,369,672 — 312,216 3,907,765 331,824 492,007 2,975,000 7,430 3,579,770Interest payable on swap contracts 3(b) — — 75,186 2,314 4,919 259,020 189,894 36,085 17,266 —Interest payable excluding Swap Contracts 3(b) — — — — — — — — — —Dividends payable on swap contracts 3(b) — — — — — — — — — —Securities lending fee payable 6 — — — — — — — — — 168Distributions payable 8 398,445 122,061 — — — 938,663 — — — —Investment Adviser fee payable 6 96,384 175,018 4,164 57,933 195,672 569,596 214,565 20,775 66,838 1,742,533Performance fees payable 6 — — 121,259 — — — 597,620 1,221,436 1,324 —Administration fees payable 6 30,354 38,607 28,851 34,579 101,267 130,625 60,369 77,222 28,393 72,206Depositary fees payable 6 17,635 20,746 76,052 82,322 199,392 202,127 189,814 166,287 144,111 91,024Distribution and servicing fees payable 6 7,034 576 9 1 2,055 15,442 9,020 253 411 —Transfer Agent fee payable 6 25,673 30,956 12,237 18,108 24,539 64,349 43,486 16,267 14,302 14,523Taxe d’abonnement payable 5 12,135 13,691 2,713 6,458 39,203 37,517 14,939 7,875 2,646 38,400Capital gains tax payable 5 — — — 9,905 36,310 — 118 — — 59,650Audit fee payable 17,446 17,446 17,446 24,306 20,727 24,306 24,306 24,306 24,306 12,370Management Company fees payable 6 3,246 4,354 1,306 1,808 14,267 15,639 6,232 5,666 898 11,637Directors fees payable 6 — — — — — — — — 76 —Legal fees payable 59,620 87,283 7,888 5,291 17,845 20,549 20,360 14,790 10,242 13,203Insurance fees payable 1,615 13,272 503 1,666 13,139 56,894 19,560 13,489 3,671 12,111Printing fees payable 4,202 7,189 3,433 4,017 12,019 15,574 8,842 6,540 4,276 8,819Publishing fees payable 1,941 1,604 1,182 1,688 1,588 3,798 3,039 1,518 1,180 843Payable for Withholding Tax on Dividend and Interest Income 5 15,324 2,025 — 3,707 — — — — — 60,624Tax reporting fees payable 22,965 21,906 16,291 22,933 19,574 23,191 23,099 20,879 17,249 12,662Paying Agency fee payable 14,980 14,906 14,918 14,918 12,871 15,230 15,155 14,918 14,948 14,918Regulatory reporting fees payable 26,864 26,907 25,626 13,455 36,647 38,451 35,315 29,787 25,537 14,809Other liabilities 4,648 9,594 6,240 — 19,514 30,805 16,994 11,855 7,603 17,153Total Liabilities 4,068,657 2,174,995 14,095,077 8,431,663 412,046,961 709,401,798 384,847,012 298,184,496 59,584,442 8,001,656Shareholders’ Equity 103,079,790 213,501,225 162,796,105 216,783,726 1,617,987,777 1,355,991,657 491,267,029 598,033,162 88,455,779 715,376,703Swing Pricing 3(k) — — — 151,749 — — 638,647 — — (500,764)Shareholders’ Equity (after Swing Pricing) 103,079,790 213,501,225 162,796,105 216,935,475 1,617,987,777 1,355,991,657 491,905,676 598,033,162 88,455,779 714,875,939
Please refer to Statistical information for Outstanding Shares and Net Asset Value Per Share as at 30 November 2020.
Goldman Sachs Funds — Statement of Assets and LiabilitiesAs at 30 November 2020
The accompanying notes are an integral part of these financial statements.17

Notes
GlobalCorporatePortfolio(Hedged)
NOK
AbsoluteReturn Tracker
PortfolioUSD
AlternativeTrend Portfolio
USD
CombinedTotal
Year Ended30 November
2020USD
AssetsInvestments, at value, excluding derivatives 3(d) 16,485,039,687 647,961,026 300,885,936 57,472,283,367Unrealised gain on non-deliverable bond forward contracts 3(d) — — — 1,042,981Unrealised gain on forward currency contracts and share class specific forward currency contracts 3(d) 556,942,573 4,727,697 3,934,231 564,340,859Unrealised gain on futures and futures on duration hedging share classes 3(d) 3,980,808 3,250,764 5,463,078 26,957,622Unrealised gain on swap contracts and swap contracts on duration hedging share classes 3(d) 42,243,368 4,181,605 302,081 113,484,206Upfront payments paid on swap transactions 3(d) 85,796,307 3,727,249 2,582,551 109,191,469Market value of purchased options 3(d) 3,208,402 44,635 — 15,207,790Cash 3(e) 489,797,748 48,205,774 28,152,134 1,058,471,158Due from Brokers 3(f),13 403,350,394 44,112,802 39,117,919 759,585,448Receivable for investments sold 19,071,632 41,964 — 819,503,324Receivable for shares sold — 2,529,325 213,650 289,564,526Dividends receivable excluding swap contracts and contracts for difference 3(b) 10,242 205,781 4,320 28,679,908Interest receivable excluding swap contracts 3(b) 112,450,819 101,334 15,057 280,273,156Interest receivable on swap contracts 3(b) 8,573,209 683,242 246,156 16,013,643Dividend tax reclaim receivable 5 — 115 — 7,894,766Interest tax reclaim receivable 5 — — — 281,106Interest receivable on securities lending 6 — — — 90,343Investment Adviser fees waived receivable 6 — 6,686 1 922,247Other assets 18,460 502 392 117,414Total Assets 18,210,483,649 759,780,501 380,917,506 61,563,905,333LiabilitiesBank overdraft 4,347 — 2,232 48,337Due to Brokers 3(f),13 611,513,607 1,363,346 393,824 337,777,828Unrealised loss on forward currency contracts and share class specific forward currency contracts 3(d) 26,779,962 340,102 1,460,108 274,116,247Unrealised loss on futures and futures on duration hedging share classes 3(d) 3,671,883 981,300 506,484 4,880,751Unrealised loss on swap contracts and swap contracts on duration hedging share classes 3(d) 24,579,253 568,765 — 57,766,088Upfront payments received on swap transactions 3(d) 41,094,812 301,105 — 99,382,993Market value of written options 3(d) 12,324,852 584,413 — 27,790,044Market value of covered forward mortgage backed securities 3(d) — — — 104,949,618Payable for investments purchased 124,231,017 41,961 — 2,605,399,421Payable for shares redeemed — 3,413,738 15,255,760 165,085,955Interest payable on swap contracts 3(b) 1,032,670 19,737 — 5,558,831Interest payable excluding Swap Contracts 3(b) — — — 44,727Dividends payable on swap contracts 3(b) — 630 — 630Securities lending fee payable 6 — — — 9,037Distributions payable 8 — — — 4,846,346Investment Adviser fee payable 6 3,521,079 415,256 33,559 27,311,939Performance fees payable 6 — — — 1,941,639Administration fees payable 6 598,548 78,960 43,673 4,438,701Depositary fees payable 6 1,450,941 79,441 59,696 6,203,767Distribution and servicing fees payable 6 — 106 — 828,858Transfer Agent fee payable 6 33,493 29,796 11,513 2,015,633Taxe d’abonnement payable 5 270,381 23,048 6,000 1,813,813Capital gains tax payable 5 — — — 27,457,235Audit fee payable 227,420 17,446 24,305 1,144,092Management Company fees payable 6 140,843 9,995 3,068 745,242Directors fees payable 6 — — — 3,535Legal fees payable 258,540 3,911 9,658 1,351,541Insurance fees payable 118,652 2,803 1,581 769,346Printing fees payable 108,711 12,657 4,469 654,192Publishing fees payable 791 1,519 760 104,692Payable for Withholding Tax on Dividend and Interest Income 5 — 50,215 — 5,145,887Tax reporting fees payable 32,838 20,640 11,645 1,200,986Paying Agency fee payable 132,560 14,918 14,918 907,962Regulatory reporting fees payable 109,963 16,633 12,438 1,499,895Other liabilities 243,736 17,183 7,073 1,182,689Total Liabilities 852,480,899 8,409,624 17,862,764 3,774,378,497Shareholders’ Equity 17,358,002,750 751,370,877 363,054,742 57,789,526,836Swing Pricing 3(k) — — — 2,106,871Shareholders’ Equity (after Swing Pricing) 17,358,002,750 751,370,877 363,054,742 57,791,633,707
Please refer to Statistical information for Outstanding Shares and Net Asset Value Per Share as at 30 November 2020.
Goldman Sachs Funds — Statement of Assets and LiabilitiesAs at 30 November 2020
The accompanying notes are an integral part of these financial statements.18

Notes
Asia EquityPortfolio
USD
BRICs EquityPortfolio(a)
USD
ChinaOpportunity
EquityPortfolio
USD
EmergingMarkets EquityESG Portfolio
USD
EmergingMarkets Equity
PortfolioUSD
GlobalEnvironmentalImpact Equity
Portfolio(a)
USD
Global EquityIncomePortfolio
USD
Global EquityPartners ESG
PortfolioUSD
Global EquityPartnersPortfolio
USD
Global FutureHealth Care
EquityPortfolio(a)
USDIncomeDividend Income excluding swap contracts and contracts for difference 3(b) 2,475,466 1,336,168 837,898 1,521,846 49,229,663 830,485 369,283 360,043 10,766,337 5,839Dividend Income on swap contracts 3(b) — — — — — — — — — —Interest Income excluding swap contracts 3(b) 105 266 — 374 10,291 27 — — 2,234 —Interest Income on swap contracts 3(b) — — — — — — — — — —Interest Income on reverse repurchase agreements 3(b) — — — — — — — — — —Net (amortisation)/ Net accretion 3(b) — — — — — — — — — —Interest Income on securities lending 6 1,408 — — — 227,776 — — — 18,999 —
2,476,979 1,336,434 837,898 1,522,220 49,467,730 830,512 369,283 360,043 10,787,570 5,839ExpensesBank overdraft interest expense 3(b) — 803 202 — 656 603 57 321 6,654 —Interest Expense excluding swap contracts 3(b) — 172 — — — — — — 1,358 —Interest Expense on swap contracts 3(b) — — — — — — — — — —Fees charged on securities lending 6 141 — — — 22,778 — — — 1,900 —Investment Adviser fee 6 630,984 1,139,433 426,021 939,826 29,645,294 641,364 160,452 251,111 5,700,295 29,718Performance fees 6 — — — — — — — — — —Depositary fees 6 75,916 57,102 35,854 88,279 1,335,759 53,099 17,311 25,054 123,754 1,666Administration fees 6 69,136 58,586 37,877 53,980 420,835 46,257 40,000 41,999 232,838 5,923Distribution and servicing fees 6 65,775 153,580 — 76 559,266 2,328 5,420 11,441 50,472 9Transfer Agent fees 6 48,892 72,814 23,541 27,493 307,927 25,923 30,699 30,462 100,718 5,321Taxe d’abonnement 5 29,874 28,737 10,678 17,283 687,747 25,794 5,793 13,256 219,342 2,503Audit fee 17,166 12,619 17,167 12,715 24,342 12,660 12,109 12,108 12,108 12,512Management Company fees 6 23,318 27,800 7,490 14,694 574,239 10,907 4,231 8,388 169,915 505Directors fees 6 654 563 284 637 20,241 183 70 152 5,343 3Legal fees 5,660 6,847 4,381 9,000 82,884 3,943 4,304 4,632 8,484 882Insurance fees 2,469 — 297 446 24,008 157 1,004 290 8,908 46Printing fees 9,585 11,816 6,157 7,364 79,346 4,150 9,804 6,214 26,042 601Publishing fees 4,528 7,091 2,472 3,040 8,111 1,850 3,391 13,226 981 463Tax Reporting fees 23,692 23,412 16,500 18,051 20,816 36,501 17,464 18,600 14,464 21,615Paying Agency fees 22,789 23,448 22,796 22,796 22,918 16,778 22,796 22,796 26,759 4,319Regulatory reporting fees 28,075 34,521 26,933 25,679 50,134 36,108 27,022 27,312 33,247 5,437Other expenses 45,498 79,066 15,522 39,969 292,053 18,714 8,607 1,368 23,971 3,073
1,104,152 1,738,410 654,172 1,281,328 34,179,354 937,319 370,534 488,730 6,767,553 94,596Less: Investment Adviser fee waived 6 35 124,101 24,336 4 — 43,245 158,670 169,513 88 53,537Total expenses 1,104,117 1,614,309 629,836 1,281,324 34,179,354 894,074 211,864 319,217 6,767,465 41,059Withholding tax on dividends and other investment income 5 251,196 136,534 61,478 193,508 6,154,748 165,540 68,031 63,471 1,909,618 1,747Net investment income/(expense) for the Year 1,121,666 (414,409) 146,584 47,388 9,133,628 (229,102) 89,388 (22,645) 2,110,487 (36,967)Net realised gain/(loss) on investment securities 6,806,207 53,112,677 1,546,955 674,670 35,824,005 12,426,981 463,060 2,773,864 58,035,555 14,570Net realised gain/(loss) on futures transactions and futures contracts on duration hedging shareclasses 705,389 200,874 — — — — — — — —Net realised gain/(loss) on foreign currencies, forward currency contracts and share class specificforward currency contracts (732,918) (3,769,028) 119,552 (1,298,985) (55,350,366) 299,297 8,113 272,282 3,274,903 (5,141)Net realised gain/(loss) on swap contracts and swap contracts on duration hedging share classes — — — — — — — — — —Net realised gain/(loss) on options contracts — — — — — — — — — —Net realised gain/(loss) 6,778,678 49,544,523 1,666,507 (624,315) (19,526,361) 12,726,278 471,173 3,046,146 61,310,458 9,429Net change in unrealised gain/(loss) on investment securities 44,038,309 (28,569,169) 23,271,047 30,794,116 819,976,165 44,124,097 229,694 3,733,977 101,258,678 1,240,948Net change in unrealised gain/(loss) on covered forward mortgage backed securities — — — — — — — — — —Net change in unrealised gain/(loss) on futures transactions and futures contracts on durationhedging share classes (14,369) — — — — — — — — —Net change in unrealised gain/(loss) on non deliverable bond forward contracts — — — — — — — — — —Net change in unrealised gain/(loss) on foreign currencies, forward currency contracts and shareclass specific forward currency contracts (341) 17,799 1,167 2,941 26,093 (11,321) 417 587 532,653 (318)Net change in unrealised gain/(loss) on swap contracts and swap contracts on duration hedgingshare classes — — — — — — — — — —Net change in unrealised gain/(loss) on options contracts — — — — — — — — — —Net change in unrealised gain/(loss) 44,023,599 (28,551,370) 23,272,214 30,797,057 820,002,258 44,112,776 230,111 3,734,564 101,791,331 1,240,630Net income gain/(loss) for the Year 51,923,943 20,578,744 25,085,305 30,220,130 809,609,525 56,609,952 790,672 6,758,065 165,212,276 1,213,092
(a) Refer to Appendix II.
Gains and losses arose solely from continuing operations. There were no gains or losses other than those dealt with in the Statement of Operations.
Goldman Sachs Funds — Statement of OperationsFor the Year Ended 30 November 2020
The accompanying notes are an integral part of these financial statements.19

Notes
Global FutureTechnology
Leaders EquityPortfolio(a)
USD
GlobalMillennials
EquityPortfolio
USD
India EquityPortfolio
USD
Japan EquityPartners
Portfolio(b)(c)
JPY
Japan EquityPortfolio(b)(c)
JPY
N-11® EquityPortfolio(a)
USD
US EquityPortfolio
USD
US FocusedGrowth Equity
PortfolioUSD
USSmaller Cap
EquityPortfolio
USD
USTechnology
OpportunitiesEquity
Portfolio(a)
USDIncomeDividend Income excluding swap contracts and contracts for difference 3(b) 11,191,873 2,893,489 13,171,856 1,489,190 1,904,425 800,987 10,045,298 104,422 363,653 28,499Dividend Income on swap contracts 3(b) — — — — — — — — — —Interest Income excluding swap contracts 3(b) 861 — 4,863 — — — 1,325 — — —Interest Income on swap contracts 3(b) — — — — — — — — — —Interest Income on reverse repurchase agreements 3(b) — — — — — — — — — —Net (amortisation)/ Net accretion 3(b) — — — — — — — — — —Interest Income on securities lending 6 — 373,786 — 13,896 44,590 — 234 — — —
11,192,734 3,267,275 13,176,719 1,503,086 1,949,015 800,987 10,046,857 104,422 363,653 28,499ExpensesBank overdraft interest expense 3(b) 25,036 2,743 62 5,302 5,499 339 — — — —Interest Expense excluding swap contracts 3(b) 3,157 — — — 5 — 4,198 — — —Interest Expense on swap contracts 3(b) — — — — — — — — — —Fees charged on securities lending 6 — 37,379 — 1,390 4,459 — 23 — — —Investment Adviser fee 6 449,296 5,565,915 17,181,657 908,105 886,836 580,593 9,230,882 401,978 224,630 249Performance fees 6 — — — — — — — — — —Depositary fees 6 205,451 113,526 801,876 24,546 25,170 62,222 82,918 17,658 67,528 1,187Administration fees 6 236,609 155,917 298,849 25,112 26,722 50,609 185,738 41,999 42,000 3,393Distribution and servicing fees 6 400 659,245 523,814 — 74,222 98,797 91,898 50,088 120 4Transfer Agent fees 6 20,227 85,527 285,271 7,855 12,637 70,615 81,348 35,879 26,992 2,638Taxe d’abonnement 5 214,982 219,201 431,400 23,657 19,137 15,222 300,466 14,618 12,490 1,444Audit fee 12,660 12,522 55,291 1,277 1,277 11,675 12,110 12,109 12,521 13,106Management Company fees 6 161,073 143,858 384,471 16,864 17,283 15,399 247,585 10,249 9,885 381Directors fees 6 6,585 2,400 27,423 589 791 302 4,568 192 181 1Legal fees 51,528 84,297 20,207 849 555 5,135 6,478 4,146 6,620 402Insurance fees 3,021 101 17,051 268 1,080 — 6,141 1,220 335 12Printing fees 20,490 25,001 40,254 3,390 2,895 10,444 17,778 7,212 6,107 164Publishing fees 1,503 4,568 5,962 611 775 6,386 7,804 4,683 3,289 288Tax Reporting fees 32,482 23,127 25,509 2,822 2,291 22,231 23,460 18,870 17,867 18,893Paying Agency fees 16,639 22,796 28,618 2,187 2,474 23,864 23,487 22,796 22,796 215Regulatory reporting fees 50,313 33,475 28,398 665 372 37,494 29,864 27,229 25,174 2,243Other expenses 46,927 65,538 266,606 4,204 6,941 68,364 24,996 8,019 8,487 166
1,558,379 7,257,136 20,422,719 1,029,693 1,091,421 1,079,691 10,381,742 678,945 487,022 44,786Less: Investment Adviser fee waived 6 12 1 — — — 235,462 — 111,325 148,411 30,882Total expenses 1,558,367 7,257,135 20,422,719 1,029,693 1,091,421 844,229 10,381,742 567,620 338,611 13,904Withholding tax on dividends and other investment income 5 2,546,979 565,342 1,451,515 228,069 291,663 137,511 2,857,306 27,790 96,547 8,549Net investment income/(expense) for the Year 7,087,388 (4,555,202) (8,697,515) 245,324 565,931 (180,753) (3,192,191) (490,988) (71,505) 6,046Net realised gain/(loss) on investment securities 191,085,101 60,971,969 150,569,782 8,342,381 5,526,636 13,056,831 66,696,465 2,323,578 (2,164,142) 16,444Net realised gain/(loss) on futures transactions and futures contracts on duration hedging shareclasses (14,361,511) (9,857) (5,059,977) 238,634 57,227 95,608 — — — —Net realised gain/(loss) on foreign currencies, forward currency contracts and share class specificforward currency contracts 2,708,813 730,627 (77,232,374) (316,342) 407,430 (11,944,144) 8,659,123 — 89,613 (191)Net realised gain/(loss) on swap contracts and swap contracts on duration hedging share classes — — — — — — — — — —Net realised gain/(loss) on options contracts — — — — — — — — — —Net realised gain/(loss) 179,432,403 61,692,739 68,277,431 8,264,673 5,991,293 1,208,295 75,355,588 2,323,578 (2,074,529) 16,253Net change in unrealised gain/(loss) on investment securities 867,360,707 243,437,151 37,316,250 30,031,260 9,523,764 (2,696,792) 40,437,561 8,824,804 3,139,617 2,049,538Net change in unrealised gain/(loss) on covered forward mortgage backed securities — — — — — — — — — —Net change in unrealised gain/(loss) on futures transactions and futures contracts on durationhedging share classes — — 27,441 — — — — — — —Net change in unrealised gain/(loss) on non deliverable bond forward contracts — — — — — — — — — —Net change in unrealised gain/(loss) on foreign currencies, forward currency contracts and shareclass specific forward currency contracts (172,368) (5,109) 94,209 (285,374) (165,343) (126) 2,678,898 488 27,204 —Net change in unrealised gain/(loss) on swap contracts and swap contracts on duration hedgingshare classes — — — — — — — — — —Net change in unrealised gain/(loss) on options contracts — — — — — — — — — —Net change in unrealised gain/(loss) 867,188,339 243,432,042 37,437,900 29,745,886 9,358,421 (2,696,918) 43,116,459 8,825,292 3,166,821 2,049,538Net income gain/(loss) for the Year 1,053,708,130 300,569,579 97,017,816 38,255,883 15,915,645 (1,669,376) 115,279,856 10,657,882 1,020,787 2,071,837
(a) Refer to Appendix II.(b) Expressed in ‘000(c) Refer to Note 3(i).
Gains and losses arose solely from continuing operations. There were no gains or losses other than those dealt with in the Statement of Operations.
Goldman Sachs Funds — Statement of OperationsFor the Year Ended 30 November 2020
The accompanying notes are an integral part of these financial statements.20

Notes
GlobalInfrastructure
EquityPortfolio
USD
Global RealEstate Equity
PortfolioUSD
North AmericaEnergy &Energy
InfrastructureEquity
PortfolioUSD
EmergingMarkets
CORE® EquityPortfolio(c)
USD
Europe CORE®
EquityPortfolio
EUR
Global CORE®
EquityPortfolio(c)
USD
Global SmallCap CORE®
EquityPortfolio(c)
USD
US CORE®
EquityPortfolio(c)
USD
US Small CapCORE® Equity
Portfolio(c)
USD
GQG PartnersGlobal Equity
PortfolioUSD
IncomeDividend Income excluding swap contracts and contracts for difference 3(b) 358,519 2,053,547 2,267,752 75,673,420 55,159,055 59,669,750 8,153,785 22,676,527 3,026,227 2,523,370Dividend Income on swap contracts 3(b) — — — — — — — — — —Interest Income excluding swap contracts 3(b) — — 68 13,602 8,238 10,836 4,494 2,393 1,351 3,067Interest Income on swap contracts 3(b) — — — — — — — — — —Interest Income on reverse repurchase agreements 3(b) — — — — — — — — — —Net (amortisation)/ Net accretion 3(b) — — — — — — — — — —Interest Income on securities lending 6 — — 24,026 320,491 450,579 373,969 91,974 29,452 47,742 —
358,519 2,053,547 2,291,846 76,007,513 55,617,872 60,054,555 8,250,253 22,708,372 3,075,320 2,526,437ExpensesBank overdraft interest expense 3(b) 168 135 26 8,419 177,359 55,769 1,841 20,789 — 686Interest Expense excluding swap contracts 3(b) — — — — 21,306 — — — — —Interest Expense on swap contracts 3(b) — — — — — — — — — —Fees charged on securities lending 6 — — 2,403 32,049 45,058 37,397 9,197 2,945 4,774 —Investment Adviser fee 6 115,612 426,198 570,630 16,507,157 12,836,577 14,734,577 3,374,570 9,454,094 518,898 1,401,595Performance fees 6 — — — — — — — — — —Depositary fees 6 35,711 44,110 36,728 1,280,687 422,065 507,679 168,278 170,604 57,971 53,309Administration fees 6 66,001 66,077 40,528 379,448 334,973 522,682 150,551 280,258 79,069 66,814Distribution and servicing fees 6 15,910 1,935 12,451 7,000 706,663 1,322,812 150,682 697,142 24,435 8,446Transfer Agent fees 6 48,973 50,201 33,368 186,884 160,485 233,916 105,951 121,548 49,218 27,680Taxe d’abonnement 5 3,249 11,213 18,265 422,464 412,365 619,425 127,619 323,451 36,299 22,605Audit fee 12,109 12,109 12,109 17,166 10,279 12,931 17,167 17,166 12,110 12,638Management Company fees 6 2,230 7,303 12,384 386,427 384,990 584,579 114,169 294,379 28,781 23,232Directors fees 6 79 264 288 19,727 15,972 29,824 3,134 10,342 1,524 1,559Legal fees 4,166 4,512 4,449 88,283 81,271 115,470 7,544 112,355 4,607 6,745Insurance fees 70 567 3,159 4,676 6,162 14,266 3,350 5,930 2,747 —Printing fees 5,931 6,872 7,631 42,683 41,823 59,189 15,164 32,898 15,810 10,089Publishing fees 6,607 6,607 3,033 6,243 8,422 10,428 6,375 6,620 3,952 1,688Tax Reporting fees 23,482 23,482 17,660 23,512 14,816 12,680 25,372 24,511 20,389 10,970Paying Agency fees 22,796 22,796 23,096 22,864 20,588 22,960 22,796 23,067 23,508 9,724Regulatory reporting fees 29,145 29,170 26,861 36,075 35,210 36,184 34,265 30,853 27,205 24,056Other expenses 9,045 11,109 5,563 266,307 131,376 170,494 73,509 81,197 17,622 5,632
401,284 724,660 830,632 19,738,071 15,867,760 19,103,262 4,411,534 11,710,149 928,919 1,687,468Less: Investment Adviser fee waived 6 227,821 144,941 83,045 — — 2 — — 623 5,412Total expenses 173,463 579,719 747,587 19,738,071 15,867,760 19,103,260 4,411,534 11,710,149 928,296 1,682,056Withholding tax on dividends and other investment income 5 71,429 333,419 418,914 10,047,727 5,984,331 12,923,894 1,746,639 6,448,476 702,686 550,593Net investment income/(expense) for the Year 113,627 1,140,409 1,125,345 46,221,715 33,765,781 28,027,401 2,092,080 4,549,747 1,444,338 293,788Net realised gain/(loss) on investment securities (71,400) (9,993,549) (19,149,241) 96,636,183 (238,891,681) 134,130,654 (34,017,365) 93,596,300 (2,517,400) 74,905,877Net realised gain/(loss) on futures transactions and futures contracts on duration hedging shareclasses — — — 4,742,908 221,182 3,216,468 912,395 11,270,677 349,507 —Net realised gain/(loss) on foreign currencies, forward currency contracts and share class specificforward currency contracts 2,774 (258,960) (250,662) (67,957,438) (17,677,674) 23,032,521 2,401,000 913,953 (16) 1,122,965Net realised gain/(loss) on swap contracts and swap contracts on duration hedging share classes — — — — — — — — — —Net realised gain/(loss) on options contracts — — — — — — — — — —Net realised gain/(loss) (68,626) (10,252,509) (19,399,903) 33,421,653 (256,348,173) 160,379,643 (30,703,970) 105,780,930 (2,167,909) 76,028,842Net change in unrealised gain/(loss) on investment securities 190,985 (1,857,630) 5,507,249 380,014,791 (50,483,816) 191,248,915 22,574,491 135,034,800 (2,732,595) (28,213,080)Net change in unrealised gain/(loss) on covered forward mortgage backed securities — — — — — — — — — —Net change in unrealised gain/(loss) on futures transactions and futures contracts on durationhedging share classes — — — 1,279,222 (152,158) — (35,736) 216,750 — —Net change in unrealised gain/(loss) on non deliverable bond forward contracts — — — — — — — — — —Net change in unrealised gain/(loss) on foreign currencies, forward currency contracts and shareclass specific forward currency contracts 612 2,184 837 130,824 (1,843,340) 1,261,180 44,200 1,766,924 — 2,151Net change in unrealised gain/(loss) on swap contracts and swap contracts on duration hedgingshare classes — — — — — — — — — —Net change in unrealised gain/(loss) on options contracts — — — — — — — — — —Net change in unrealised gain/(loss) 191,597 (1,855,446) 5,508,086 381,424,837 (52,479,314) 192,510,095 22,582,955 137,018,474 (2,732,595) (28,210,929)Net income gain/(loss) for the Year 236,598 (10,967,546) (12,766,472) 461,068,205 (275,061,706) 380,917,139 (6,028,935) 247,349,151 (3,456,166) 48,111,701
(c) Refer to Note 3(i).
Gains and losses arose solely from continuing operations. There were no gains or losses other than those dealt with in the Statement of Operations.
Goldman Sachs Funds — Statement of OperationsFor the Year Ended 30 November 2020
The accompanying notes are an integral part of these financial statements.21

Notes
Asia HighYield BondPortfolio(a)
USD
EmergingMarkets
CorporateBond Portfolio
USD
EmergingMarkets Debt
Blend PortfolioUSD
EmergingMarkets DebtLocal Portfolio
USD
EmergingMarkets Debt
PortfolioUSD
EmergingMarkets ShortDuration Bond
PortfolioUSD
Euro ShortDuration BondPlus Portfolio
EUR
Europe HighYield BondPortfolio
EUR
Global CreditPortfolio(Hedged)
USD
Global ESGEnhanced
Income BondPortfolio
USDIncomeDividend Income excluding swap contracts and contracts for difference 3(b) 943 260,161 134,103 452,304 471,839 9,309 — — 93,328 384Dividend Income on swap contracts 3(b) — — — — — — — — — —Interest Income excluding swap contracts 3(b) 460,159 122,323,710 50,278,541 88,268,079 305,051,892 2,977,791 5,015,782 2,605,234 36,468,047 161,413Interest Income on swap contracts 3(b) — 257,102 1,031,778 2,823,664 2,052,489 — 134,375 17,403 2,513,081 4,437Interest Income on reverse repurchase agreements 3(b) — — — — — — — — — —Net (amortisation)/ Net accretion 3(b) 74,536 23,134 (454,581) (710,525) 51,104,749 (347,725) (2,597,044) 166,278 (3,727,116) (22,621)Interest Income on securities lending 6 — — — — — — — — — —
535,638 122,864,107 50,989,841 90,833,522 358,680,969 2,639,375 2,553,113 2,788,915 35,347,340 143,613ExpensesBank overdraft interest expense 3(b) — 2,676 1,548 4,642 13,050 — 35,044 7,499 4,208 —Interest Expense excluding swap contracts 3(b) 1 — — — — — 20,836 914 — 3Interest Expense on swap contracts 3(b) — — — — — — — — — —Fees charged on securities lending 6 — — — — — — — — — —Investment Adviser fee 6 43,244 17,976,598 3,998,925 11,231,374 45,783,143 320,661 853,045 414,468 3,803,365 21,188Performance fees 6 — — — — — — — — — —Depositary fees 6 9,526 314,323 403,030 583,510 942,071 41,322 165,524 51,406 350,906 7,893Administration fees 6 12,641 389,946 217,864 308,275 808,015 59,024 84,194 43,466 272,450 9,584Distribution and servicing fees 6 2 102,073 4,603 50,287 2,195,126 1,431 13,412 7,918 90,150 129Transfer Agent fees 6 14,451 230,780 33,026 95,066 347,283 42,325 27,595 32,844 93,633 11,998Taxe d’abonnement 5 1,883 458,082 98,824 184,748 1,284,857 19,822 93,775 15,111 244,824 978Audit fee 16,778 19,234 17,998 24,346 26,399 21,655 14,577 14,577 23,930 19,229Management Company fees 6 1,103 393,624 100,525 181,602 1,204,139 13,682 67,210 11,142 185,814 462Directors fees 6 — 15,116 7,907 13,313 46,364 374 2,201 403 8,109 —Legal fees 1,989 87,992 20,468 30,472 152,590 8,317 4,541 2,585 6,840 763Insurance fees 641 14,130 2,139 10,034 33,572 896 576 1,180 11,021 413Printing fees 5,510 65,341 16,025 26,830 102,002 8,080 11,656 5,246 29,485 6,436Publishing fees 1,619 9,433 4,153 8,632 22,861 4,966 2,206 3,685 9,522 1,526Tax Reporting fees 28,993 19,438 21,440 22,223 — 20,980 14,939 18,463 15,969 31,761Paying Agency fees 6,643 22,894 22,796 23,189 66,951 22,796 20,433 20,433 22,796 7,884Regulatory reporting fees 19,902 67,117 39,720 41,936 74,096 28,427 34,228 34,520 43,865 17,494Other expenses 9,706 203,872 89,119 126,936 252,920 26,620 13,293 18,931 46,336 5,424
174,632 20,392,669 5,100,110 12,967,415 53,355,439 641,378 1,479,285 704,791 5,263,223 143,165Less: Investment Adviser fee waived 6 114,728 — — — 54 219,278 207,845 135,333 198 113,108Total expenses 59,904 20,392,669 5,100,110 12,967,415 53,355,385 422,100 1,271,440 569,458 5,263,025 30,057Withholding tax on dividends and other investment income 5 — 25,127 88,411 463,290 24,888 431 — 3,740 54,651 335Net investment income/(expense) for the Year 475,734 102,446,311 45,801,320 77,402,817 305,300,696 2,216,844 1,281,673 2,215,717 30,029,664 113,221Net realised gain/(loss) on investment securities (37,285) (17,750,935) 5,369,559 34,457,893 (123,421,264) (2,435,439) (304,081) (1,981,841) 32,286,081 44,356Net realised gain/(loss) on futures transactions and futures contracts on duration hedging shareclasses 1,643 22,642,550 8,463,581 2,076,082 203,201,497 (493,913) (562,613) (160,794) 4,293,018 (1,424)Net realised gain/(loss) on foreign currencies, forward currency contracts and share class specificforward currency contracts (3,032) 34,778,934 (33,288,195) (167,464,971) 76,232,054 1,204,119 1,731,778 120,878 12,392,875 7,970Net realised gain/(loss) on swap contracts and swap contracts on duration hedging share classes — (228,520) 3,855,599 15,424,186 (40,762,293) — (203,361) 101,253 (4,220,520) —Net realised gain/(loss) on options contracts — — (2,730,232) (5,941,566) (11,174,551) — — — 2,533,745 —Net realised gain/(loss) (38,674) 39,442,029 (18,329,688) (121,448,376) 104,075,443 (1,725,233) 661,723 (1,920,504) 47,285,199 50,902Net change in unrealised gain/(loss) on investment securities 422,179 77,116,824 23,157,957 92,410,446 34,295,532 1,909,312 (2,350,297) 130,877 80,922,238 607,136Net change in unrealised gain/(loss) on covered forward mortgage backed securities — — — — — — — — — —Net change in unrealised gain/(loss) on futures transactions and futures contracts on durationhedging share classes (1,180) (178,584) 159,285 189,588 1,850,509 (28,559) 970,058 (11,605) (443,221) (8,232)Net change in unrealised gain/(loss) on non deliverable bond forward contracts — — 216,507 516,563 — — — — — —Net change in unrealised gain/(loss) on foreign currencies, forward currency contracts and shareclass specific forward currency contracts 13,573 16,509,333 8,465,694 25,738,220 48,960,858 371,645 1,019,573 151,010 820,651 (48,884)Net change in unrealised gain/(loss) on swap contracts and swap contracts on duration hedgingshare classes — 1,361,363 104,107 3,061,661 9,798,644 — (482,076) 7,941 (1,446,249) 27,204Net change in unrealised gain/(loss) on options contracts — — 307,563 661,628 1,186,053 — — — 456,309 —Net change in unrealised gain/(loss) 434,572 94,808,936 32,411,113 122,578,106 96,091,596 2,252,398 (842,742) 278,223 80,309,728 577,224Net income gain/(loss) for the Year 871,632 236,697,276 59,882,745 78,532,547 505,467,735 2,744,009 1,100,654 573,436 157,624,591 741,347
(a) Refer to Appendix II.
Gains and losses arose solely from continuing operations. There were no gains or losses other than those dealt with in the Statement of Operations.
Goldman Sachs Funds — Statement of OperationsFor the Year Ended 30 November 2020
The accompanying notes are an integral part of these financial statements.22

Notes
Global FixedIncomePortfolio
USD
Global FixedIncomePortfolio(Hedged)
EUR
Global HighYield Portfolio
USD
GlobalSovereign
Bond PortfolioUSD
Short DurationOpportunistic
CorporateBond Portfolio
USD
Sterling CreditPortfolio
GBP
US DollarShort DurationBond Portfolio
USD
US FixedIncomePortfolio
USD
US MortgageBacked
SecuritiesPortfolio
USD
EmergingMarkets
Multi-AssetPortfolio
USDIncomeDividend Income excluding swap contracts and contracts for difference 3(b) 27,301 — 421,008 169,562 17 711 118,990 42,609 117,462 359,255Dividend Income on swap contracts 3(b) — — — — — — — — — —Interest Income excluding swap contracts 3(b) 3,675,893 18,420,080 180,663,664 17,004,067 9,440,468 887,630 8,567,413 3,225,837 12,049,133 747,393Interest Income on swap contracts 3(b) 169,805 1,031,342 — 641,591 5 19,020 37,735 149,254 187,997 8,929Interest Income on reverse repurchase agreements 3(b) — — 74,998 — — — — — — —Net (amortisation)/ Net accretion 3(b) (315,203) (2,382,935) 4,347,523 (2,701,161) 213,192 (113,771) (1,205,241) (236,640) (251,440) (3,217)Interest Income on securities lending 6 — — 54,917 — — — — — — —
3,557,796 17,068,487 185,562,110 15,114,059 9,653,682 793,590 7,518,897 3,181,060 12,103,152 1,112,360ExpensesBank overdraft interest expense 3(b) 336 218,350 1,046 587 226 — — — — 42Interest Expense excluding swap contracts 3(b) — — — 165,903 — 2,287 — — — 769Interest Expense on swap contracts 3(b) — — 8,009,011 — — — — — — —Fees charged on securities lending 6 — — 5,492 — — — — — — —Investment Adviser fee 6 680,295 2,343,597 14,177,038 3,522,551 1,588,582 128,538 706,762 510,008 562,261 429,746Performance fees 6 — — — — — — — — — —Depositary fees 6 219,314 324,396 314,262 404,885 46,781 99,139 66,490 151,986 43,959 161,920Administration fees 6 61,414 188,883 495,394 153,511 101,937 22,468 90,010 60,103 114,472 60,000Distribution and servicing fees 6 56,184 10,634 469,140 — 22,755 — — 14,811 20,453 428Transfer Agent fees 6 35,899 58,604 253,432 19,520 64,257 14,536 22,925 41,363 42,788 49,319Taxe d’abonnement 5 40,563 188,074 568,719 58,222 62,994 11,167 72,215 33,747 48,967 13,988Audit fee 23,930 20,322 24,348 17,165 17,220 18,524 17,165 23,930 23,930 17,556Management Company fees 6 29,451 140,832 519,193 64,126 34,109 9,342 50,057 19,824 43,830 12,259Directors fees 6 966 5,097 21,732 4,554 1,409 197 2,380 873 2,557 222Legal fees 4,811 4,247 68,738 9,325 5,649 2,402 7,313 3,886 5,848 83,630Insurance fees 1,870 4,809 41,598 2,464 2,395 1,474 714 2,887 3,340 847Printing fees 8,350 18,868 69,354 11,088 11,123 4,680 12,451 9,259 10,861 5,022Publishing fees 4,061 6,957 20,958 1,903 7,395 1,086 1,648 4,623 4,506 5,768Tax Reporting fees 18,600 19,898 — 16,374 23,089 12,022 15,886 22,136 22,037 25,868Paying Agency fees 22,796 20,433 78,435 22,796 22,796 17,617 22,796 22,796 22,796 22,796Regulatory reporting fees 37,255 40,941 62,385 37,262 33,222 30,851 36,240 37,527 38,253 35,835Other expenses 15,711 33,998 85,817 18,615 13,504 36,765 11,736 9,500 18,132 84,021
1,261,806 3,648,940 25,286,092 4,530,851 2,059,443 413,095 1,136,788 969,259 1,028,990 1,010,036Less: Investment Adviser fee waived 6 207,425 127 — 4 18,245 217,893 68,322 179,938 — 455,879Total expenses 1,054,381 3,648,813 25,286,092 4,530,847 2,041,198 195,202 1,068,466 789,321 1,028,990 554,157Withholding tax on dividends and other investment income 5 16,048 68,434 256,051 203,505 — 944 49,414 13,039 170,243 36,869Net investment income/(expense) for the Year 2,487,367 13,351,240 160,019,967 10,379,707 7,612,484 597,444 6,401,017 2,378,700 10,903,919 521,334Net realised gain/(loss) on investment securities 2,697,225 12,306,835 (107,301,057) 17,223,247 (2,286,915) 694,327 (806,366) 1,407,093 813,396 865,315Net realised gain/(loss) on futures transactions and futures contracts on duration hedging shareclasses 1,923,646 7,666,628 25,133,869 3,666,367 (203) 314,452 1,592,849 2,839,087 1,863,810 220,686Net realised gain/(loss) on foreign currencies, forward currency contracts and share class specificforward currency contracts 246,491 4,548,956 38,423,704 (27,013,841) 967,865 70,120 38,181 (199,747) 1,122,373 (1,504,200)Net realised gain/(loss) on swap contracts and swap contracts on duration hedging share classes (572,298) (1,076,743) (11,169,291) 2,805,594 (1,041,680) (27,540) (54,006) (302,601) (457,979) 57,502Net realised gain/(loss) on options contracts 246,351 2,230,549 — 106,185 — 25,120 10,906 54,137 136,387 —Net realised gain/(loss) 4,541,415 25,676,225 (54,912,775) (3,212,448) (2,360,933) 1,076,479 781,564 3,797,969 3,477,987 (360,697)Net change in unrealised gain/(loss) on investment securities 8,195,174 (9,257,418) 93,305,430 22,617,736 3,882,338 291,651 3,408,864 3,371,849 5,320,402 2,712,245Net change in unrealised gain/(loss) on covered forward mortgage backed securities 1,758 39,222 — — — — (49,964) 555 (494,042) —Net change in unrealised gain/(loss) on futures transactions and futures contracts on durationhedging share classes 359,200 1,690,949 446,809 396,595 — 8,653 (31,662) (59,721) 61,443 (20,425)Net change in unrealised gain/(loss) on non deliverable bond forward contracts — — — 7,464 — — — — — —Net change in unrealised gain/(loss) on foreign currencies, forward currency contracts and shareclass specific forward currency contracts 600,331 4,569,487 14,204,019 (6,285,604) 253,422 (73,271) (23,911) (84,064) 634,583 3,699Net change in unrealised gain/(loss) on swap contracts and swap contracts on duration hedgingshare classes (108,749) (442,402) 13,334,685 469,204 176,189 12,051 117,706 33,132 (253,393) (14,767)Net change in unrealised gain/(loss) on options contracts 34,804 570,446 — (85,407) — (4,575) — (3,644) 102,856 —Net change in unrealised gain/(loss) 9,082,518 (2,829,716) 121,290,943 17,119,988 4,311,949 234,509 3,421,033 3,258,107 5,371,849 2,680,752Net income gain/(loss) for the Year 16,111,300 36,197,749 226,398,135 24,287,247 9,563,500 1,908,432 10,603,614 9,434,776 19,753,755 2,841,389
Gains and losses arose solely from continuing operations. There were no gains or losses other than those dealt with in the Statement of Operations.
Goldman Sachs Funds — Statement of OperationsFor the Year Ended 30 November 2020
The accompanying notes are an integral part of these financial statements.23

Notes
GlobalMulti-AssetBalancedPortfolio
USD
GlobalMulti-Asset
ConservativePortfolio
USD
GlobalMulti-Asset
GrowthPortfolio
USD
GlobalMulti-Asset
IncomePortfolio
USD
US Real EstateBalancedPortfolio
USD
CoCos &Capital
SecuritiesPortfolio(a)
USD
EmergingMarkets TotalReturn Bond
PortfolioUSD
GlobalAbsoluteReturn
PortfolioUSD
Global FixedIncome Plus
Portfolio(Hedged)
EUR
GlobalStrategic
Income BondPortfolio
USDIncomeDividend Income excluding swap contracts and contracts for difference 3(b) 2,163,711 12,836,646 4,289,279 1,039,590 1,995,458 20,763 13,073 1,420,078 — 124,412Dividend Income on swap contracts 3(b) — — — — — — — — — —Interest Income excluding swap contracts 3(b) 705 2,835 1,371 1,747,992 7,327,494 1,052,820 7,138,547 607,644 41,392,487 63,791,601Interest Income on swap contracts 3(b) — — — — 1,750 — 92,432 — 536,115 —Interest Income on reverse repurchase agreements 3(b) — — — — — — — — — —Net (amortisation)/ Net accretion 3(b) — — — (45,586) 578,214 (25,960) (113,532) 543,469 (5,040,553) 2,251,870Interest Income on securities lending 6 — — — — 8,384 — — — — —
2,164,416 12,839,481 4,290,650 2,741,996 9,911,300 1,047,623 7,130,520 2,571,191 36,888,049 66,167,883ExpensesBank overdraft interest expense 3(b) 1,170 1,305 546 2,226 — — 523 5,717 147,922 6,411Interest Expense excluding swap contracts 3(b) 6,687 19,318 11,363 4,445 — 109 — — — —Interest Expense on swap contracts 3(b) — — — — — — — 445,407 — 3,025,203Fees charged on securities lending 6 — — — — 838 — — — — —Investment Adviser fee 6 943,760 2,979,884 1,772,909 876,254 2,531,515 151 81,663 747,598 2,120,965 7,022,786Performance fees 6 — — — — — — 121,249 — — —Depositary fees 6 32,192 59,913 45,925 49,013 52,456 8,872 206,698 189,378 493,715 464,824Administration fees 6 51,158 135,290 76,686 69,595 100,435 10,012 67,421 91,028 257,142 315,760Distribution and servicing fees 6 31,942 33,375 8,904 81,990 10,591 — 242 146 24,997 190,880Transfer Agent fees 6 33,113 36,818 34,137 60,445 71,824 5,378 29,125 43,425 57,077 157,991Taxe d’abonnement 5 15,820 11,668 13,205 39,718 91,451 1,604 14,854 20,764 176,231 216,983Audit fee 12,109 12,109 12,108 17,995 17,193 17,565 17,165 23,930 20,322 23,937Management Company fees 6 34,672 63,052 30,904 30,290 61,904 2,023 15,007 20,699 160,501 196,985Directors fees 6 764 3,662 1,634 526 1,982 204 983 1,507 10,862 11,024Legal fees 6,252 7,822 5,544 83,847 85,512 3,545 2,334 24,898 15,551 22,936Insurance fees 812 1,914 967 692 5,688 — 215 714 5,063 24,383Printing fees 7,072 12,739 9,531 10,570 12,897 1,901 6,800 7,249 22,334 21,655Publishing fees 2,975 3,253 2,997 6,294 5,236 58 3,807 5,477 6,596 12,370Tax Reporting fees 18,581 18,788 18,581 25,663 26,571 10,462 21,129 24,513 20,013 9,433Paying Agency fees 22,796 22,796 22,796 23,044 22,798 508 22,796 22,796 20,433 27,790Regulatory reporting fees 36,726 37,102 36,502 38,940 37,855 15,409 38,122 28,826 42,117 42,794Other expenses 13,045 18,143 13,058 17,340 21,032 10 26,439 64,609 79,848 73,718
1,271,646 3,478,951 2,118,297 1,438,887 3,157,778 77,811 676,572 1,768,681 3,681,689 11,867,863Less: Investment Adviser fee waived 6 39,437 — — 240,805 — 35,300 160,757 148,658 70 —Total expenses 1,232,209 3,478,951 2,118,297 1,198,082 3,157,778 42,511 515,815 1,620,023 3,681,619 11,867,863Withholding tax on dividends and other investment income 5 — — — 157,040 506,623 10,806 5,372 238,666 122,929 31,507Net investment income/(expense) for the Year 932,207 9,360,530 2,172,353 1,386,874 6,246,899 994,306 6,609,333 712,502 33,083,501 54,268,513Net realised gain/(loss) on investment securities 187,041 5,341,227 5,706,278 (1,285,436) (607,291) (1,637,996) 570,857 (243,662) 24,347,033 2,571,550Net realised gain/(loss) on futures transactions and futures contracts on duration hedging shareclasses 12,867 2,864,506 (744,384) 1,596,830 1,499,224 — 2,133,451 (4,425,028) 25,951,292 24,134,942Net realised gain/(loss) on foreign currencies, forward currency contracts and share class specificforward currency contracts 3,375,958 6,213,250 (10,599) 1,335,540 998,122 (1,000) (3,021,441) (549,220) 35,005,494 19,381,651Net realised gain/(loss) on swap contracts and swap contracts on duration hedging share classes — — — — — — 112,486 1,660,438 (4,724,506) (17,993,509)Net realised gain/(loss) on options contracts 1,412,877 4,751,070 2,614,484 (1,204,895) — — (662,948) 187,642 3,841,583 11,927,308Net realised gain/(loss) 4,988,743 19,170,053 7,565,779 442,039 1,890,055 (1,638,996) (867,595) (3,369,830) 84,420,896 40,021,942Net change in unrealised gain/(loss) on investment securities 6,222,822 19,810,725 7,987,201 3,348,119 (9,159,013) (1,707,829) 6,374,682 5,892,915 (39,744,607) 45,527,607Net change in unrealised gain/(loss) on covered forward mortgage backed securities — — — — — — — — 96,519 —Net change in unrealised gain/(loss) on futures transactions and futures contracts on durationhedging share classes 238,140 1,156,802 307,205 940,275 93,328 — 49,821 (43,401) 1,849,419 (1,367,636)Net change in unrealised gain/(loss) on non deliverable bond forward contracts — — — — — — 73,746 — — —Net change in unrealised gain/(loss) on foreign currencies, forward currency contracts and shareclass specific forward currency contracts (1,727,835) (4,435,825) (654,042) (671,643) 164,697 235,486 5,862,075 3,730,867 16,789,063 3,257,176Net change in unrealised gain/(loss) on swap contracts and swap contracts on duration hedgingshare classes — — — — 36,847 — (132,037) (3,707,794) (366,574) 3,585,984Net change in unrealised gain/(loss) on options contracts 422,746 1,689,784 1,041,408 (65,572) — — 73,002 864,730 1,860,321 1,796,480Net change in unrealised gain/(loss) 5,155,873 18,221,486 8,681,772 3,551,179 (8,864,141) (1,472,343) 12,301,289 6,737,317 (19,515,859) 52,799,611Net income gain/(loss) for the Year 11,076,823 46,752,069 18,419,904 5,380,092 (727,187) (2,117,033) 18,043,027 4,079,989 97,988,538 147,090,066
(a) Refer to Appendix II.
Gains and losses arose solely from continuing operations. There were no gains or losses other than those dealt with in the Statement of Operations.
Goldman Sachs Funds — Statement of OperationsFor the Year Ended 30 November 2020
The accompanying notes are an integral part of these financial statements.24
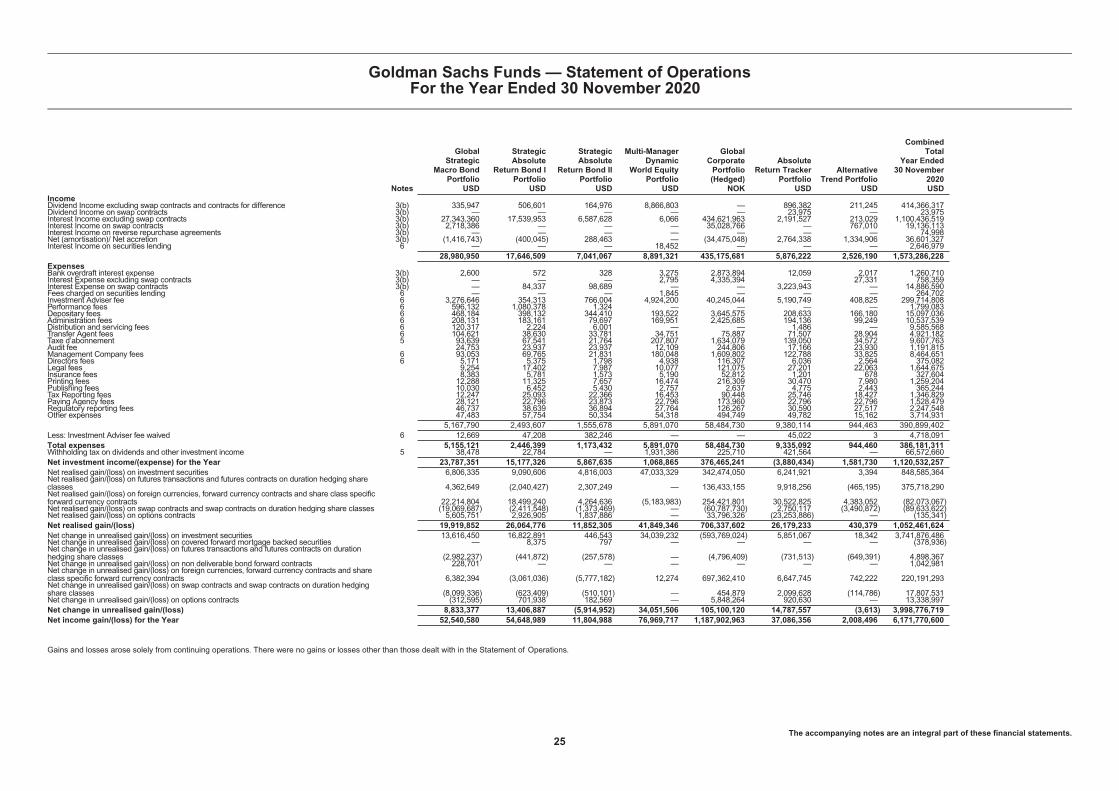
Notes
GlobalStrategic
Macro BondPortfolio
USD
StrategicAbsolute
Return Bond IPortfolio
USD
StrategicAbsolute
Return Bond IIPortfolio
USD
Multi-ManagerDynamic
World EquityPortfolio
USD
GlobalCorporatePortfolio(Hedged)
NOK
AbsoluteReturn Tracker
PortfolioUSD
AlternativeTrend Portfolio
USD
CombinedTotal
Year Ended30 November
2020USD
IncomeDividend Income excluding swap contracts and contracts for difference 3(b) 335,947 506,601 164,976 8,866,803 — 896,382 211,245 414,366,317Dividend Income on swap contracts 3(b) — — — — — 23,975 — 23,975Interest Income excluding swap contracts 3(b) 27,343,360 17,539,953 6,587,628 6,066 434,621,963 2,191,527 213,029 1,100,436,519Interest Income on swap contracts 3(b) 2,718,386 — — — 35,028,766 — 767,010 19,136,113Interest Income on reverse repurchase agreements 3(b) — — — — — — — 74,998Net (amortisation)/ Net accretion 3(b) (1,416,743) (400,045) 288,463 — (34,475,048) 2,764,338 1,334,906 36,601,327Interest Income on securities lending 6 — — — 18,452 — — — 2,646,979
28,980,950 17,646,509 7,041,067 8,891,321 435,175,681 5,876,222 2,526,190 1,573,286,228ExpensesBank overdraft interest expense 3(b) 2,600 572 328 3,275 2,873,894 12,059 2,017 1,260,710Interest Expense excluding swap contracts 3(b) — — — 2,795 4,335,394 — 27,331 758,359Interest Expense on swap contracts 3(b) — 84,337 98,689 — — 3,223,943 — 14,886,590Fees charged on securities lending 6 — — — 1,845 — — — 264,702Investment Adviser fee 6 3,276,646 354,313 766,004 4,924,200 40,245,044 5,190,749 408,825 299,714,808Performance fees 6 596,132 1,080,378 1,324 — — — — 1,799,083Depositary fees 6 468,184 398,132 344,410 193,522 3,645,575 208,633 166,180 15,097,036Administration fees 6 208,131 183,161 79,697 169,951 2,425,685 194,136 99,249 10,537,539Distribution and servicing fees 6 120,317 2,224 6,001 — — 1,486 — 9,585,568Transfer Agent fees 6 104,621 38,630 33,781 34,751 75,887 71,507 28,904 4,921,182Taxe d’abonnement 5 93,639 67,541 21,764 207,807 1,634,079 139,050 34,572 9,607,763Audit fee 24,753 23,937 23,937 12,109 244,806 17,166 23,930 1,191,815Management Company fees 6 93,053 69,765 21,831 180,048 1,609,802 122,788 33,825 8,464,651Directors fees 6 5,171 5,375 1,798 4,938 116,307 6,036 2,564 375,082Legal fees 9,254 17,402 7,987 10,077 121,075 27,201 22,063 1,644,675Insurance fees 8,383 5,781 1,573 5,190 52,812 1,201 678 327,604Printing fees 12,288 11,325 7,657 16,474 216,309 30,470 7,980 1,259,204Publishing fees 10,030 6,452 5,430 2,757 2,637 4,775 2,443 365,244Tax Reporting fees 12,247 25,093 22,366 16,453 90,448 25,746 18,427 1,346,829Paying Agency fees 28,121 22,796 23,873 22,796 173,960 22,796 22,796 1,528,479Regulatory reporting fees 46,737 38,639 36,894 27,764 126,267 30,590 27,517 2,247,548Other expenses 47,483 57,754 50,334 54,318 494,749 49,782 15,162 3,714,931
5,167,790 2,493,607 1,555,678 5,891,070 58,484,730 9,380,114 944,463 390,899,402Less: Investment Adviser fee waived 6 12,669 47,208 382,246 — — 45,022 3 4,718,091Total expenses 5,155,121 2,446,399 1,173,432 5,891,070 58,484,730 9,335,092 944,460 386,181,311Withholding tax on dividends and other investment income 5 38,478 22,784 — 1,931,386 225,710 421,564 — 66,572,660Net investment income/(expense) for the Year 23,787,351 15,177,326 5,867,635 1,068,865 376,465,241 (3,880,434) 1,581,730 1,120,532,257Net realised gain/(loss) on investment securities 6,806,335 9,090,606 4,816,003 47,033,329 342,474,050 6,241,921 3,394 848,585,364Net realised gain/(loss) on futures transactions and futures contracts on duration hedging shareclasses 4,362,649 (2,040,427) 2,307,249 — 136,433,155 9,918,256 (465,195) 375,718,290Net realised gain/(loss) on foreign currencies, forward currency contracts and share class specificforward currency contracts 22,214,804 18,499,240 4,264,636 (5,183,983) 254,421,801 30,522,825 4,383,052 (82,073,067)Net realised gain/(loss) on swap contracts and swap contracts on duration hedging share classes (19,069,687) (2,411,548) (1,373,469) — (60,787,730) 2,750,117 (3,490,872) (89,633,622)Net realised gain/(loss) on options contracts 5,605,751 2,926,905 1,837,886 — 33,796,326 (23,253,886) — (135,341)Net realised gain/(loss) 19,919,852 26,064,776 11,852,305 41,849,346 706,337,602 26,179,233 430,379 1,052,461,624Net change in unrealised gain/(loss) on investment securities 13,616,450 16,822,891 446,543 34,039,232 (593,769,024) 5,851,067 18,342 3,741,876,486Net change in unrealised gain/(loss) on covered forward mortgage backed securities — 8,375 797 — — — — (378,936)Net change in unrealised gain/(loss) on futures transactions and futures contracts on durationhedging share classes (2,982,237) (441,872) (257,578) — (4,796,409) (731,513) (649,391) 4,898,367Net change in unrealised gain/(loss) on non deliverable bond forward contracts 228,701 — — — — — — 1,042,981Net change in unrealised gain/(loss) on foreign currencies, forward currency contracts and shareclass specific forward currency contracts 6,382,394 (3,061,036) (5,777,182) 12,274 697,362,410 6,647,745 742,222 220,191,293Net change in unrealised gain/(loss) on swap contracts and swap contracts on duration hedgingshare classes (8,099,336) (623,409) (510,101) — 454,879 2,099,628 (114,786) 17,807,531Net change in unrealised gain/(loss) on options contracts (312,595) 701,938 182,569 — 5,848,264 920,630 — 13,338,997Net change in unrealised gain/(loss) 8,833,377 13,406,887 (5,914,952) 34,051,506 105,100,120 14,787,557 (3,613) 3,998,776,719Net income gain/(loss) for the Year 52,540,580 54,648,989 11,804,988 76,969,717 1,187,902,963 37,086,356 2,008,496 6,171,770,600
Gains and losses arose solely from continuing operations. There were no gains or losses other than those dealt with in the Statement of Operations.
Goldman Sachs Funds — Statement of OperationsFor the Year Ended 30 November 2020
The accompanying notes are an integral part of these financial statements.25

Notes
Asia EquityPortfolio
USD
BRICs EquityPortfolio(a)
USD
ChinaOpportunity
EquityPortfolio
USD
EmergingMarkets EquityESG Portfolio
USD
EmergingMarkets Equity
PortfolioUSD
GlobalEnvironmentalImpact Equity
Portfolio(a)
USD
Global EquityIncomePortfolio
USD
Global EquityPartners ESG
PortfolioUSD
Global EquityPartnersPortfolio
USD
Global FutureHealth Care
EquityPortfolio(a)
USD
Shareholders’ equity at the start of the Year 133,786,244 86,082,003 37,222,179 92,765,495 2,831,776,571 — 11,090,167 13,183,215 783,882,522 —Reversal of Alternative Net Asset Value Calculation Method 3(k) — — — — — — — — — —Proceeds from shares issued 7 56,838,771 21,434,726 32,317,709 61,624,604 1,419,091,820 193,293,500 6,391,772 24,738,344 290,206,683 44,304,971Payment for shares redeemed 7 (39,712,274) (128,028,215) (4,134,271) (11,290,573) (963,041,407) (13,872,642) (2,523,669) (15,581,902) (211,690,734) (22,590)Net income gain/(loss) for the Year 51,923,943 20,578,744 25,085,305 30,220,130 809,609,525 56,609,952 790,672 6,758,065 165,212,276 1,213,092Distributions 8 (68,627) (67,258) (3,731) (55,773) (4,114,878) — (102,426) (10,111) (928,946) —Currency adjustments 17 — — — — — — — — — —
Shareholders’ Equity at 30 November 2020 202,768,057 — 90,487,191 173,263,883 4,093,321,631 236,030,810 15,646,516 29,087,611 1,026,681,801 45,495,473
Swing Pricing 3(k) — — — 415,833 — — — — (718,677) —
Shareholders’ Equity (after Swing Pricing) 202,768,057 — 90,487,191 173,679,716 4,093,321,631 236,030,810 15,646,516 29,087,611 1,025,963,124 45,495,473
(a) Refer to Appendix II.
Goldman Sachs Funds — Statement of Changes in Shareholder’s EquityFor the Year Ended 30 November 2020
The accompanying notes are an integral part of these financial statements.26

Notes
Global FutureTechnology
Leaders EquityPortfolio(a)
USD
GlobalMillennials
EquityPortfolio
USD
India EquityPortfolio
USD
Japan EquityPartners
Portfolio(b)(c)
JPY
Japan EquityPortfolio(b)(c)
JPY
N-11® EquityPortfolio(a)
USD
US EquityPortfolio
USD
US FocusedGrowth Equity
PortfolioUSD
USSmaller Cap
EquityPortfolio
USD
USTechnology
OpportunitiesEquity
Portfolio(a)
USD
Shareholders’ equity at the start of the Year — 191,469,865 1,928,749,707 64,723,245 106,186,552 57,358,545 697,857,101 25,877,458 34,023,695 —Reversal of Alternative Net Asset Value Calculation Method 3(k) — — — — — — — — — —Proceeds from shares issued 7 2,305,732,270 1,012,880,825 296,505,557 164,348,472 73,680,701 1,435,259 46,981,283 5,965,439 19,598,198 82,347,193Payment for shares redeemed 7 (38,584,917) (185,763,164) (842,258,353) (88,795,362) (69,504,606) (57,082,738) (149,096,889) (5,334,220) (18,618,872) —Net income gain/(loss) for the Year 1,053,708,130 300,569,579 97,017,816 38,255,883 15,915,645 (1,669,376) 115,279,856 10,657,882 1,020,787 2,071,837Distributions 8 — — (325,745) (14,944) (82,430) (41,690) (208,350) — — —Currency adjustments 17 — — — — — — — — — —
Shareholders’ Equity at 30 November 2020 3,320,855,483 1,319,157,105 1,479,688,982 178,517,294 126,195,862 — 710,813,001 37,166,559 36,023,808 84,419,030
Swing Pricing 3(k) — — — — — — — — — 25,326
Shareholders’ Equity (after Swing Pricing) 3,320,855,483 1,319,157,105 1,479,688,982 178,517,294 126,195,862 — 710,813,001 37,166,559 36,023,808 84,444,356
(a) Refer to Appendix II.(b) Expressed in ‘000(c) Refer to Note 3(i).
Goldman Sachs Funds — Statement of Changes in Shareholder’s EquityFor the Year Ended 30 November 2020
The accompanying notes are an integral part of these financial statements.27

Notes
GlobalInfrastructure
EquityPortfolio
USD
Global RealEstate Equity
PortfolioUSD
North AmericaEnergy &Energy
InfrastructureEquity
PortfolioUSD
EmergingMarkets
CORE® EquityPortfolio(c)
USD
Europe CORE®
EquityPortfolio
EUR
Global CORE®
EquityPortfolio(c)
USD
Global SmallCap CORE®
EquityPortfolio(c)
USD
US CORE®
EquityPortfolio(c)
USD
US Small CapCORE® Equity
Portfolio(c)
USD
GQG PartnersGlobal Equity
PortfolioUSD
Shareholders’ equity at the start of the Year 10,593,097 53,243,273 65,005,171 3,049,398,971 3,072,696,103 5,217,627,774 566,448,407 1,650,836,282 280,335,719 247,028,083Reversal of Alternative Net Asset Value Calculation Method 3(k) — (100,970) 45,535 — — — — — — —Proceeds from shares issued 7 6,057,042 17,018,527 2,857,805 900,525,012 674,102,082 901,995,702 83,755,530 1,038,921,174 42,479,264 25,911,683Payment for shares redeemed 7 (3,506,398) (19,473,294) (15,792,347) (1,693,151,569) (1,609,808,914) (2,753,524,538) (186,934,594) (1,189,278,634) (103,149,387) (321,046,161)Net income gain/(loss) for the Year 236,598 (10,967,546) (12,766,472) 461,068,205 (275,061,706) 380,917,139 (6,028,935) 247,349,151 (3,456,166) 48,111,701Distributions 8 (10,171) (795,152) (126,948) (3,631,311) (8,365,026) (5,391,191) (1,527,006) (2,267,749) (67,043) (5,306)Currency adjustments 17 — — — — — — — — — —
Shareholders’ Equity at 30 November 2020 13,370,168 38,924,838 39,222,744 2,714,209,308 1,853,562,539 3,741,624,886 455,713,402 1,745,560,224 216,142,387 —
Swing Pricing 3(k) — — — — — — — — — —
Shareholders’ Equity (after Swing Pricing) 13,370,168 38,924,838 39,222,744 2,714,209,308 1,853,562,539 3,741,624,886 455,713,402 1,745,560,224 216,142,387 —
(c) Refer to Note 3(i).
Goldman Sachs Funds — Statement of Changes in Shareholder’s EquityFor the Year Ended 30 November 2020
The accompanying notes are an integral part of these financial statements.28

Notes
Asia HighYield BondPortfolio(a)
USD
EmergingMarkets
CorporateBond Portfolio
USD
EmergingMarkets Debt
Blend PortfolioUSD
EmergingMarkets DebtLocal Portfolio
USD
EmergingMarkets Debt
PortfolioUSD
EmergingMarkets ShortDuration Bond
PortfolioUSD
Euro ShortDuration BondPlus Portfolio
EUR
Europe HighYield BondPortfolio
EUR
Global CreditPortfolio(Hedged)
USD
Global ESGEnhanced
Income BondPortfolio
USD
Shareholders’ equity at the start of the Year — 2,021,760,390 1,089,738,911 1,850,523,317 7,681,352,146 37,316,193 241,820,591 60,791,321 966,030,394 —Reversal of Alternative Net Asset Value Calculation Method 3(k) — — — — — — — — — —Proceeds from shares issued 7 33,230,460 2,602,629,070 150,582,950 677,706,028 3,595,118,662 56,420,812 224,398,916 29,894,970 734,915,708 20,250,504Payment for shares redeemed 7 (3,195,742) (1,245,455,910) (244,276,918) (808,325,981) (5,127,830,403) (29,532,496) (170,456,294) (27,633,822) (481,455,453) (250,000)Net income gain/(loss) for the Year 871,632 236,697,276 59,882,745 78,532,547 505,467,735 2,744,009 1,100,654 573,436 157,624,591 741,347Distributions 8 (76,954) (13,803,473) (1,128,983) (83,433,924) (153,701,519) (32,782) (356,476) (170,289) (9,542,701) (1,995)Currency adjustments 17 — — — — — — — — — —
Shareholders’ Equity at 30 November 2020 30,829,396 3,601,827,353 1,054,798,705 1,715,001,987 6,500,406,621 66,915,736 296,507,391 63,455,616 1,367,572,539 20,739,856
Swing Pricing 3(k) — — — — — — — — — —
Shareholders’ Equity (after Swing Pricing) 30,829,396 3,601,827,353 1,054,798,705 1,715,001,987 6,500,406,621 66,915,736 296,507,391 63,455,616 1,367,572,539 20,739,856
(a) Refer to Appendix II.
Goldman Sachs Funds — Statement of Changes in Shareholder’s EquityFor the Year Ended 30 November 2020
The accompanying notes are an integral part of these financial statements.29
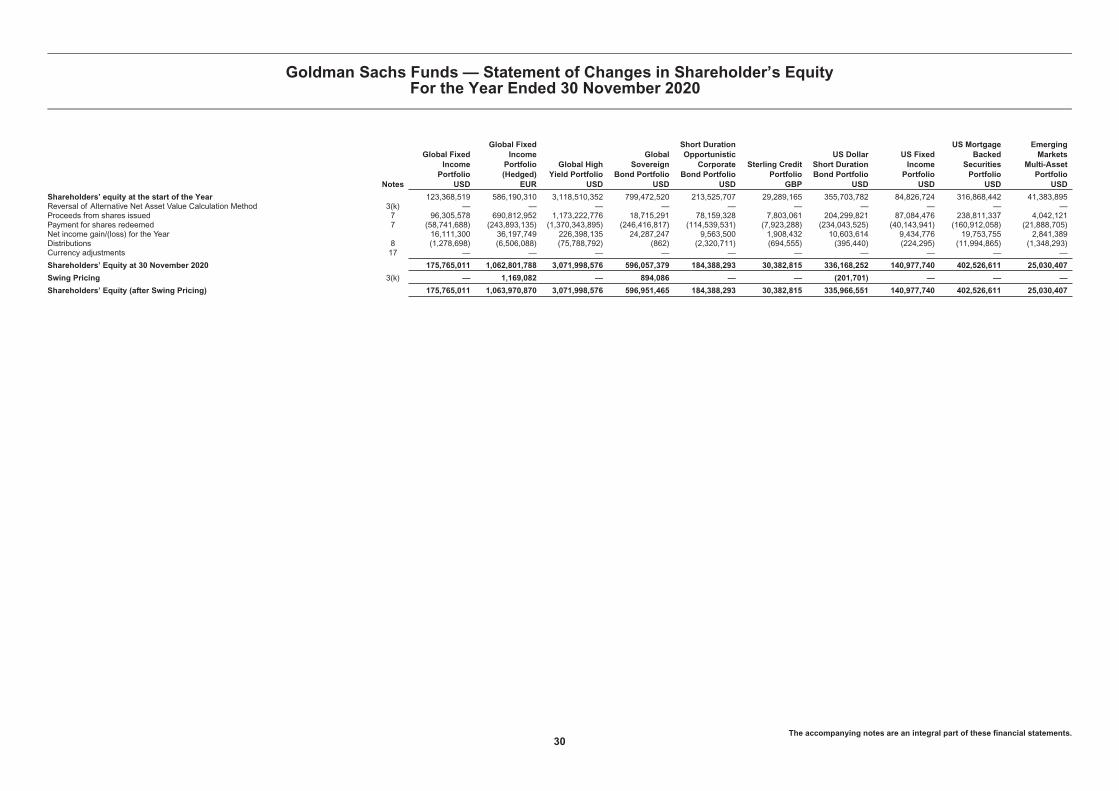
Notes
Global FixedIncomePortfolio
USD
Global FixedIncomePortfolio(Hedged)
EUR
Global HighYield Portfolio
USD
GlobalSovereign
Bond PortfolioUSD
Short DurationOpportunistic
CorporateBond Portfolio
USD
Sterling CreditPortfolio
GBP
US DollarShort DurationBond Portfolio
USD
US FixedIncomePortfolio
USD
US MortgageBacked
SecuritiesPortfolio
USD
EmergingMarkets
Multi-AssetPortfolio
USD
Shareholders’ equity at the start of the Year 123,368,519 586,190,310 3,118,510,352 799,472,520 213,525,707 29,289,165 355,703,782 84,826,724 316,868,442 41,383,895Reversal of Alternative Net Asset Value Calculation Method 3(k) — — — — — — — — — —Proceeds from shares issued 7 96,305,578 690,812,952 1,173,222,776 18,715,291 78,159,328 7,803,061 204,299,821 87,084,476 238,811,337 4,042,121Payment for shares redeemed 7 (58,741,688) (243,893,135) (1,370,343,895) (246,416,817) (114,539,531) (7,923,288) (234,043,525) (40,143,941) (160,912,058) (21,888,705)Net income gain/(loss) for the Year 16,111,300 36,197,749 226,398,135 24,287,247 9,563,500 1,908,432 10,603,614 9,434,776 19,753,755 2,841,389Distributions 8 (1,278,698) (6,506,088) (75,788,792) (862) (2,320,711) (694,555) (395,440) (224,295) (11,994,865) (1,348,293)Currency adjustments 17 — — — — — — — — — —
Shareholders’ Equity at 30 November 2020 175,765,011 1,062,801,788 3,071,998,576 596,057,379 184,388,293 30,382,815 336,168,252 140,977,740 402,526,611 25,030,407
Swing Pricing 3(k) — 1,169,082 — 894,086 — — (201,701) — — —
Shareholders’ Equity (after Swing Pricing) 175,765,011 1,063,970,870 3,071,998,576 596,951,465 184,388,293 30,382,815 335,966,551 140,977,740 402,526,611 25,030,407
Goldman Sachs Funds — Statement of Changes in Shareholder’s EquityFor the Year Ended 30 November 2020
The accompanying notes are an integral part of these financial statements.30

Notes
GlobalMulti-AssetBalancedPortfolio
USD
GlobalMulti-Asset
ConservativePortfolio
USD
GlobalMulti-Asset
GrowthPortfolio
USD
GlobalMulti-Asset
IncomePortfolio
USD
US Real EstateBalancedPortfolio
USD
CoCos &Capital
SecuritiesPortfolio(a)
USD
EmergingMarkets TotalReturn Bond
PortfolioUSD
GlobalAbsoluteReturn
PortfolioUSD
Global FixedIncome Plus
Portfolio(Hedged)
EUR
GlobalStrategic
Income BondPortfolio
USD
Shareholders’ equity at the start of the Year 112,824,627 521,488,076 268,297,324 54,082,376 329,911,533 56,552,928 150,985,461 206,181,608 1,247,518,606 1,588,090,509Reversal of Alternative Net Asset Value Calculation Method 3(k) — — — — — — — — — —Proceeds from shares issued 7 21,689,436 37,750,751 13,684,768 81,352,790 23,580,469 4,740,633 4,771,461 54,374,400 403,844,469 100,485,185Payment for shares redeemed 7 (36,319,665) (144,434,888) (103,139,190) (33,405,688) (136,692,490) (59,176,068) (10,992,124) (46,971,124) (128,345,652) (441,175,517)Net income gain/(loss) for the Year 11,076,823 46,752,069 18,419,904 5,380,092 (727,187) (2,117,033) 18,043,027 4,079,989 97,988,538 147,090,066Distributions 8 (689,470) (663,052) (105,468) (4,329,780) (2,571,100) (460) (11,720) (881,147) (3,018,184) (38,498,586)Currency adjustments 17 — — — — — — — — — —
Shareholders’ Equity at 30 November 2020 108,581,751 460,892,956 197,157,338 103,079,790 213,501,225 — 162,796,105 216,783,726 1,617,987,777 1,355,991,657
Swing Pricing 3(k) — — — — — — — 151,749 — —
Shareholders’ Equity (after Swing Pricing) 108,581,751 460,892,956 197,157,338 103,079,790 213,501,225 — 162,796,105 216,935,475 1,617,987,777 1,355,991,657
(a) Refer to Appendix II.
Goldman Sachs Funds — Statement of Changes in Shareholder’s EquityFor the Year Ended 30 November 2020
The accompanying notes are an integral part of these financial statements.31

Notes
GlobalStrategic
Macro BondPortfolio
USD
StrategicAbsolute
Return Bond IPortfolio
USD
StrategicAbsolute
Return Bond IIPortfolio
USD
Multi-ManagerDynamic
World EquityPortfolio
USD
GlobalCorporatePortfolio(Hedged)
NOK
AbsoluteReturn Tracker
PortfolioUSD
AlternativeTrend Portfolio
USD
CombinedTotal
Year Ended30 November
2020USD
Shareholders’ equity at the start of the Year 1,011,151,316 697,657,537 236,543,092 800,174,890 14,856,694,818 820,998,321 318,430,281 52,884,012,759Reversal of Alternative Net Asset Value Calculation Method 3(k) — — — — — — — (55,435)Proceeds from shares issued 7 107,047,592 7,240,445 5,605,306 95,346,209 1,313,404,969 446,581,281 122,113,228 24,497,464,746Payment for shares redeemed 7 (675,920,718) (158,358,301) (160,903,906) (254,965,179) — (552,648,784) (78,223,218) (26,006,672,406)Net income gain/(loss) for the Year 52,540,580 54,648,989 11,804,988 76,969,717 1,187,902,963 37,086,356 2,008,496 6,171,770,600Distributions 8 (3,551,741) (3,155,508) (4,593,701) (2,148,934) — (646,297) (1,274,045) (460,578,832)Currency adjustments 17 — — — — — — — 703,585,404
Shareholders’ Equity at 30 November 2020 491,267,029 598,033,162 88,455,779 715,376,703 17,358,002,750 751,370,877 363,054,742 57,789,526,836
Swing Pricing 3(k) 638,647 — — (500,764) — — — 2,106,871
Shareholders’ Equity (after Swing Pricing) 491,905,676 598,033,162 88,455,779 714,875,939 17,358,002,750 751,370,877 363,054,742 57,791,633,707
Goldman Sachs Funds — Statement of Changes in Shareholder’s EquityFor the Year Ended 30 November 2020
The accompanying notes are an integral part of these financial statements.32

OutstandingSharesas at
Net Asset Value per Shareas at(a) Net Assets as at(a)
Currency 30-Nov-20 30-Nov-20 30-Nov-19 30-Nov-18 30-Nov-20 30-Nov-19 30-Nov-18
Asia Equity PortfolioBase Accumulation Share Class USD 80,568 29.82 21.94 19.68 2,402,354 1,408,718 1,017,083Base Currency Share Class USD 176,239 38.61 28.40 25.48 6,804,777 8,305,611 7,818,882�A� Accumulation Share Class USD 6,541 19.37 14.32 12.91 126,711 342,502 365,454�A� Share Class USD 71,914 45.86 33.91 30.57 3,298,004 3,347,484 3,543,557�E� Accumulation Share Class EUR 219,375 35.62 28.79 25.25 7,814,386 5,449,355 4,808,838�I� Accumulation Share Class USD 1,712,044 16.45 12.00 10.68 28,165,067 15,471,620 15,156,954�I� Share Class GBP 781 20.75 15.78 14.33 16,200 12,246 11,035�I� Share Class USD 425,811 56.72 41.63 37.31 24,151,839 10,667,573 9,323,437�IO� Accumulation Share Class JPY 4,988,865 1,949.52 1,483.75 1,358.55 9,725,867,782 8,811,952,127 7,607,964,958�P� Accumulation Share Class USD 182,375 24.72 18.14 16.23 4,507,942 1,756,639 4,003,119�P� Share Class USD 63,869 24.19 17.76 15.90 1,544,935 1,277,018 1,142,466�R� Accumulation Share Class EUR 2,384 23.49 18.71 16.16 56,019 39,794 24,875�R� Accumulation Share Class USD 1,142,772 21.62 15.79 14.06 24,707,025 3,957,916 1,083,963�R� Share Class GBP 20,884 20.73 15.77 14.31 432,898 265,325 277,960�R� Share Class USD 177,224 21.04 15.44 13.84 3,728,659 419,979 339,073BRICs Equity Portfolio(b)
Base Accumulation Share Class (b) USD — — 20.65 17.52 — 19,246,323 23,434,024Base Accumulation Share Class (Long BRICsCCY vs. USD) (b) EUR — — 14.96 13.09 — 11,310,789 11,491,559Base Currency Share Class (b) USD — — 20.31 17.23 — 2,761,986 3,141,436Other Currency Share Class (b) GBP — — 14.39 12.37 — 22,365 26,675Other Currency Share Class (b) SGD — — 13.29 11.32 — 41,113 34,997�A� Share Class (b) USD — — 19.27 16.44 — 8,491,689 11,284,158�E� Accumulation Share Class (b) EUR — — 21.03 17.43 — 26,695,838 65,633,889�I� Accumulation Share Class (b) EUR — — 20.03 16.34 — 4,744,705 3,602,697�I� Accumulation Share Class (b) USD — — 13.31 11.20 — 3,014,736 3,294,450�I� Share Class (b) GBP — — 14.88 12.80 — 425,277 285,270�I� Share Class (b) USD — — 13.14 11.16 — 1,521,534 1,344,140�IO� Accumulation Share Class (b) GBP — — 24.42 20.61 — 4,271 3,605�P� Accumulation Share Class (b) USD — — 14.96 12.63 — 1,011,680 829,944�P� Share Class (b) USD — — 14.11 11.97 — 408,509 346,271�R� Accumulation Share Class (b) EUR — — 17.90 14.60 — 360,862 350,839�R� Accumulation Share Class (b) USD — — 15.14 12.73 — 35,774 30,089�R� Share Class (b) GBP — — 17.99 15.47 — 1,007,174 626,565�R� Share Class (b) USD — — 14.28 12.13 — 246,654 209,263China Opportunity Equity PortfolioBase Accumulation Share Class USD 45,457 25.63 17.69 16.03 1,165,044 204,825 215,418Base Currency Share Class USD 8,897 25.07 17.31 15.72 223,069 89,509 79,500�I� Accumulation Share Class USD 2,387,724 28.14 19.28 17.33 67,189,371 28,841,533 17,004,206�I� Share Class USD 707 25.82 17.82 16.21 18,263 12,512 11,250�P� Accumulation Share Class USD 555,512 25.35 17.39 15.66 14,084,709 5,248,287 4,904,264�P� Share Class USD 6,984 23.79 16.43 14.93 166,168 12,482 11,235�R� Accumulation Share Class USD 150,726 24.76 16.97 15.27 3,732,385 2,324,509 1,745,264�R� Share Class GBP 29,689 26.94 19.21 17.75 799,929 349,221 355,787�R� Share Class USD 122,498 23.19 16.00 14.55 2,840,316 36,823 11,526Emerging Markets Equity ESG PortfolioBase Accumulation Share Class USD 2,042,905 13.89 10.74 9.43 28,382,993 11,320,735 9,426Base Currency Share Class USD 21,985 13.89 10.74 9.43 305,404 10,741 9,426�E� Accumulation Share Class EUR 1,831 12.29 10.41 — 22,497 10,409 —�I� (Dis) (Quarterly) Share Class USD 2,346,200 14.07 10.80 9.44 33,020,090 25,330,712 22,150,243�I� Accumulation Share Class EUR 231,701 12.07 10.08 — 2,796,911 9,150 —�I� Accumulation Share Class (b) GBP 98,691 10.54 — — 1,040,047 — —�I� Accumulation Share Class USD 6,151,286 14.19 10.86 9.44 87,280,193 47,191,170 40,759,729�I� Share Class USD 32,022 14.09 10.86 9.44 451,082 10,864 9,441�IO� Accumulation Share Class EUR 570,121 15.17 12.56 10.50 8,648,652 7,158,091 6,347,573�P� Accumulation Share Class (b) USD 1,000 12.55 — — 12,546 — —�R� Accumulation Share Class USD 1,000 14.17 10.86 9.44 14,171 10,856 9,440�R� Share Class GBP 523,783 12.80 10.17 — 6,703,860 753,162 —�R� Share Class USD 7,191 14.02 10.87 9.44 100,795 21,856 9,440Emerging Markets Equity PortfolioBase Accumulation Share Class USD 12,282,320 26.63 20.87 18.42 327,124,009 237,484,857 231,739,466Base Currency Share Class USD 618,179 50.19 39.35 34.72 31,028,624 22,153,230 22,798,377Other Currency Accumulation Share Class CHF 53,058 15.02 13.04 11.49 797,148 526,761 570,237Other Currency Accumulation Share Class EUR 13,774,856 19.12 16.34 13.99 263,344,190 273,372,863 299,865,278Other Currency Snap Share Class GBP 29,658 20.40 16.57 14.81 604,975 452,005 947,271�A� Accumulation Share Class USD 528,661 17.70 13.92 12.33 9,356,871 11,523,751 10,245,176�A� Share Class USD 282,732 51.28 40.34 35.73 14,497,808 13,146,371 14,241,486�B� Share Class USD 1,107 42.45 33.73 30.18 46,996 37,340 33,405�E� Accumulation Share Class EUR 2,975,715 41.97 36.05 31.03 124,891,008 99,006,389 263,666,326�I� Accumulation Share Class EUR 9,771,088 19.01 16.09 13.65 185,777,830 161,683,078 149,754,279�I� Accumulation Share Class SEK 4,645,162 123.21 107.70 89.80 572,326,045 210,690,147 134,820,835�I� Accumulation Share Class USD 64,604,376 25.66 19.91 17.40 1,657,444,226 1,113,360,306 1,080,356,372�I� Share Class EUR 3,531,269 12.04 10.29 8.80 42,529,182 36,330,879 22,017,556�I� Share Class GBP 6,596,501 19.02 15.44 13.81 125,482,178 85,610,737 40,481,889�I� Share Class USD 3,665,021 61.63 48.29 42.61 225,884,922 164,288,938 180,070,353�IO� Accumulation Share Class GBP 435,040 33.68 26.88 23.60 14,651,878 26,221,825 40,369,274�IO� Accumulation Share Class USD 17,205,341 18.52 14.26 12.36 318,712,058 166,726,293 146,079,244�IS� (Dis) (Stable Semi-Annual) Share Class EUR 6,075,952 12.39 10.46 — 75,290,342 63,559,402 —�IX� (Dis) (Cap Monthly) Share Class USD 428,025 9.56 7.85 7.28 4,092,153 16,699,464 17,312,464�P� Accumulation Share Class USD 2,591,412 21.23 16.56 14.53 55,026,621 24,866,795 37,423,859
Goldman Sachs FundsStatistical InformationAs at 30 November 2020
33

OutstandingSharesas at
Net Asset Value per Shareas at(a) Net Assets as at(a)
Currency 30-Nov-20 30-Nov-20 30-Nov-19 30-Nov-18 30-Nov-20 30-Nov-19 30-Nov-18
Emerging Markets EquityPortfolio (Continued)�P� Share Class USD 182,997 20.60 16.14 14.23 3,768,907 4,707,595 4,289,549�R� Accumulation Share Class CHF 163,508 15.60 13.43 11.73 2,551,509 1,820,905 1,857,584�R� Accumulation Share Class EUR 1,200,639 15.82 13.40 11.37 18,988,628 8,827,884 6,461,238�R� Accumulation Share Class USD 10,830,470 18.40 14.29 12.50 199,260,319 127,991,919 102,568,838�R� Share Class GBP 4,210,177 21.12 17.16 15.34 88,937,009 34,163,622 49,560,894�R� Share Class USD 913,938 17.61 13.80 12.17 16,096,206 8,204,506 8,956,178Global Environmental Impact EquityPortfolio(b)
Base Accumulation Share Class (b) USD 537,363 13.88 — — 7,459,811 — —Base Currency Share Class (b) USD 2,609 13.88 — — 36,205 — —�E� Accumulation Share Class (b) EUR 273,335 12.47 — — 3,407,905 — —�I� Accumulation Share Class (b) EUR 932 17.12 — — 15,957 — —�I� Accumulation Share Class (b) GBP 341,620 13.60 — — 4,645,387 — —�I� Accumulation Share Class (b) USD 9,160,585 13.96 — — 127,886,813 — —�I� Share Class (b) GBP 3,300 13.61 — — 44,899 — —�I� Share Class (b) USD 109 13.97 — — 1,523 — —�P� Accumulation Share Class (b) GBP 187,691 13.55 — — 2,543,286 — —�P� Accumulation Share Class (b) USD 3,718,932 13.91 — — 51,721,437 — —�P� Share Class (b) GBP 1,000 13.55 — — 13,547 — —�P� Share Class (b) USD 100 13.90 — — 1,390 — —�R� Accumulation Share Class (b) GBP 62,513 13.58 — — 849,172 — —�R� Accumulation Share Class (b) USD 2,363,350 13.95 — — 32,969,373 — —�R� Share Class (b) GBP 56,024 13.60 — — 761,679 — —�R� Share Class (b) USD 100 13.95 — — 1,395 — —Global Equity Income PortfolioBase Accumulation Share Class USD 1,421 19.15 18.44 16.13 27,219 26,212 28,647Base Currency Share Class USD 202,705 42.77 41.63 36.41 8,669,933 9,011,981 7,883,684�A� Share Class USD 17,797 18.19 17.71 15.57 323,733 325,507 328,827�E� Accumulation Share Class EUR 21,738 14.10 14.92 12.76 306,579 531,845 556,793�I� Accumulation Share Class USD 965 15.52 14.81 12.83 14,983 14,294 12,389�P� Accumulation Share Class USD 221,756 18.60 17.87 15.59 4,124,717 954,624 477,937�P� Share Class USD 668 18.05 17.57 15.32 12,061 11,586 15,569�R� (Dis) (Gross Quarterly) Share Class USD 1,053 12.46 12.21 — 13,124 12,525 —�R� Accumulation Share Class USD 71,233 18.43 17.60 15.26 1,312,837 17,597 15,260�R� Share Class GBP 26,052 21.12 21.29 18.78 550,162 21,977 19,305�R� Share Class USD 2,535 17.52 17.05 14.85 44,418 102,363 112,696Global Equity Partners ESG PortfolioBase Accumulation Share Class USD 4,778 21.81 18.33 15.50 104,221 69,988 38,213Other Currency Share Class GBP 1,005 25.99 22.63 19.38 26,119 22,743 19,483�A� Accumulation Share Class USD 20,861 20.53 17.34 14.74 428,363 216,270 89,975�A� Share Class USD 14,853 20.53 17.34 14.74 304,969 232,435 72,318�E� Accumulation Share Class EUR 44,188 24.08 22.18 18.29 1,064,053 506,136 131,643�E� Share Class EUR 42,090 24.17 22.26 18.36 1,017,353 618,609 569,312�I� Accumulation Share Class USD 94,897 24.01 20.02 16.80 2,278,841 172,063 156,180�P� Accumulation Share Class EUR 89,556 26.81 24.51 20.06 2,401,319 2,314,095 1,978,551�P� Accumulation Share Class USD 273,953 22.81 19.12 16.13 6,247,682 4,944,621 2,771,617�P� Share Class EUR 640 26.15 23.90 19.56 16,728 15,289 12,514�P� Share Class USD 72,696 22.17 18.58 15.67 1,611,573 18,979 16,009�R� Share Class USD 609,412 20.81 17.40 14.66 12,679,709 3,699,441 803,181Global Equity Partners PortfolioBase Accumulation Share Class USD 287,930 24.06 20.02 16.77 6,928,878 8,188,078 13,748,121Base Accumulation Share Class (USDHedged Class) USD 4,643 15.98 13.52 11.28 74,187 13,518 11,279Base Currency Share Class USD 544,276 19.71 16.40 13.74 10,728,709 10,009,268 9,548,398Base Currency Share Class (USD HedgedClass) USD 1,000 15.97 13.51 11.27 15,974 13,513 11,275Other Currency Accumulation Share Class EUR 670,238 23.81 21.59 17.56 15,958,291 15,138,302 14,517,827Other Currency Accumulation Share Class GBP 239,628 31.93 27.52 23.36 7,650,390 6,020,641 3,841,016Other Currency Accumulation Share Class(EUR Hedged Class) EUR 12,865 14.52 12.63 10.81 186,819 150,059 187,653Other Currency Share Class GBP 306,102 31.83 27.43 23.29 9,743,634 11,336,520 10,693,576Other Currency Share Class (EUR HedgedClass) EUR 10,661 14.53 12.64 10.81 154,878 162,547 219,032�A� Accumulation Share Class USD 62,403 30.31 25.34 21.35 1,891,753 3,197,404 2,656,332�A� Share Class USD 62,328 30.32 25.34 21.34 1,889,553 1,682,282 1,816,240�E� Accumulation Share Class EUR 133,198 32.03 29.26 23.98 4,265,692 4,365,327 4,844,565�I� Accumulation Share Class EUR 924,413 32.02 28.81 23.23 29,603,376 14,758,068 42,395,239�I� Accumulation Share Class USD 13,918,115 19.01 15.68 13.04 264,575,690 195,793,824 129,543,763�I� Accumulation Share Class (EUR HedgedClass) EUR 4,086,918 13.62 11.75 9.98 55,671,054 67,634,430 10,197,942�I� Accumulation Share Class (USD HedgedClass) USD 1,066 17.17 14.40 11.93 18,298 15,352 12,713�I� Share Class GBP 10,256 22.20 19.03 16.11 227,656 182,461 234,764�I� Share Class (USD Hedged Class) USD 1,412,824 16.97 14.28 11.88 23,970,434 20,249,732 16,995,923�IO� Accumulation Share Class GBP 1,484,973 25.89 21.97 18.36 38,445,381 16,013,691 1,548,223�IO� Accumulation Share Class USD 2,419,242 25.27 20.69 17.07 61,126,424 31,244,989 28,638,924�IO� Accumulation Share Class (USD HedgedClass) USD 1,033,921 17.66 14.70 12.08 18,255,520 16,720,739 11,280,522�IO� Share Class USD 2,871,135 17.46 14.43 12.07 50,129,649 54,597,443 40,230,251
Goldman Sachs FundsStatistical Information
As at 30 November 2020
34
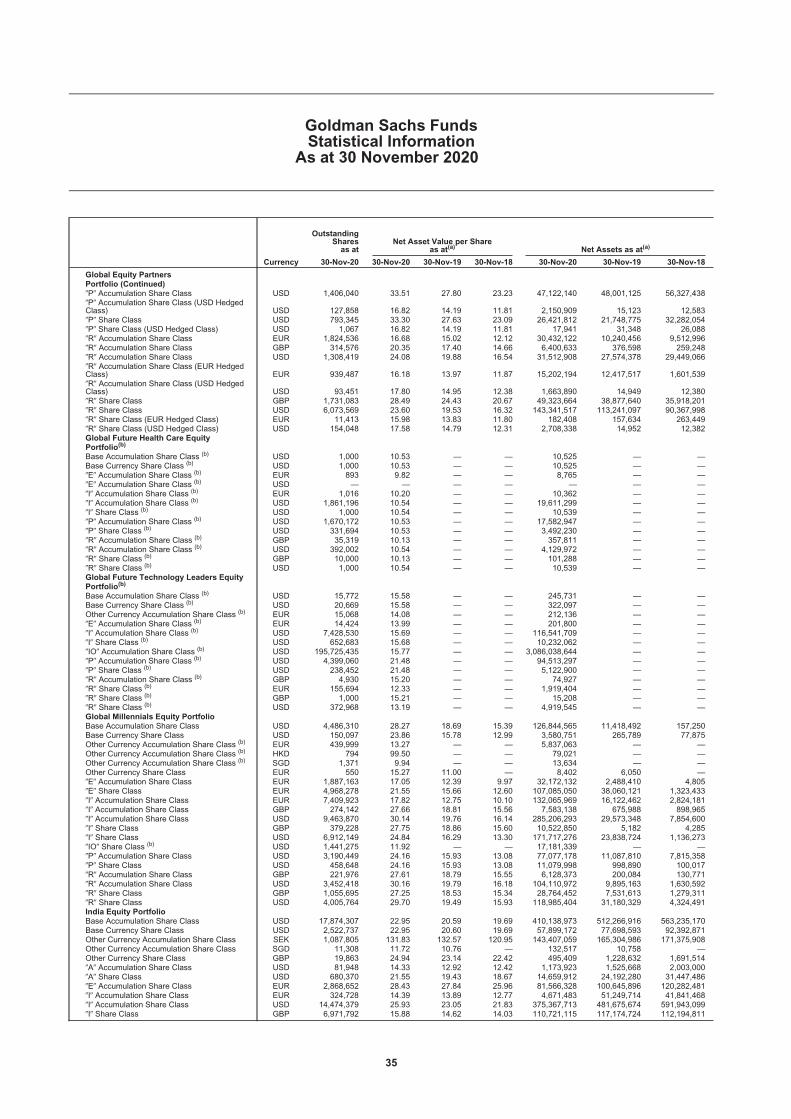
OutstandingSharesas at
Net Asset Value per Shareas at(a) Net Assets as at(a)
Currency 30-Nov-20 30-Nov-20 30-Nov-19 30-Nov-18 30-Nov-20 30-Nov-19 30-Nov-18
Global Equity PartnersPortfolio (Continued)�P� Accumulation Share Class USD 1,406,040 33.51 27.80 23.23 47,122,140 48,001,125 56,327,438�P� Accumulation Share Class (USD HedgedClass) USD 127,858 16.82 14.19 11.81 2,150,909 15,123 12,583�P� Share Class USD 793,345 33.30 27.63 23.09 26,421,812 21,748,775 32,282,054�P� Share Class (USD Hedged Class) USD 1,067 16.82 14.19 11.81 17,941 31,348 26,088�R� Accumulation Share Class EUR 1,824,536 16.68 15.02 12.12 30,432,122 10,240,456 9,512,996�R� Accumulation Share Class GBP 314,576 20.35 17.40 14.66 6,400,633 376,598 259,248�R� Accumulation Share Class USD 1,308,419 24.08 19.88 16.54 31,512,908 27,574,378 29,449,066�R� Accumulation Share Class (EUR HedgedClass) EUR 939,487 16.18 13.97 11.87 15,202,194 12,417,517 1,601,539�R� Accumulation Share Class (USD HedgedClass) USD 93,451 17.80 14.95 12.38 1,663,890 14,949 12,380�R� Share Class GBP 1,731,083 28.49 24.43 20.67 49,323,664 38,877,640 35,918,201�R� Share Class USD 6,073,569 23.60 19.53 16.32 143,341,517 113,241,097 90,367,998�R� Share Class (EUR Hedged Class) EUR 11,413 15.98 13.83 11.80 182,408 157,634 263,449�R� Share Class (USD Hedged Class) USD 154,048 17.58 14.79 12.31 2,708,338 14,952 12,382Global Future Health Care EquityPortfolio(b)
Base Accumulation Share Class (b) USD 1,000 10.53 — — 10,525 — —Base Currency Share Class (b) USD 1,000 10.53 — — 10,525 — —�E� Accumulation Share Class (b) EUR 893 9.82 — — 8,765 — —�E� Accumulation Share Class (b) USD — — — — — — —�I� Accumulation Share Class (b) EUR 1,016 10.20 — — 10,362 — —�I� Accumulation Share Class (b) USD 1,861,196 10.54 — — 19,611,299 — —�I� Share Class (b) USD 1,000 10.54 — — 10,539 — —�P� Accumulation Share Class (b) USD 1,670,172 10.53 — — 17,582,947 — —�P� Share Class (b) USD 331,694 10.53 — — 3,492,230 — —�R� Accumulation Share Class (b) GBP 35,319 10.13 — — 357,811 — —�R� Accumulation Share Class (b) USD 392,002 10.54 — — 4,129,972 — —�R� Share Class (b) GBP 10,000 10.13 — — 101,288 — —�R� Share Class (b) USD 1,000 10.54 — — 10,539 — —Global Future Technology Leaders EquityPortfolio(b)
Base Accumulation Share Class (b) USD 15,772 15.58 — — 245,731 — —Base Currency Share Class (b) USD 20,669 15.58 — — 322,097 — —Other Currency Accumulation Share Class (b) EUR 15,068 14.08 — — 212,136 — —�E� Accumulation Share Class (b) EUR 14,424 13.99 — — 201,800 — —�I� Accumulation Share Class (b) USD 7,428,530 15.69 — — 116,541,709 — —�I� Share Class (b) USD 652,683 15.68 — — 10,232,062 — —�IO� Accumulation Share Class (b) USD 195,725,435 15.77 — — 3,086,038,644 — —�P� Accumulation Share Class (b) USD 4,399,060 21.48 — — 94,513,297 — —�P� Share Class (b) USD 238,452 21.48 — — 5,122,900 — —�R� Accumulation Share Class (b) GBP 4,930 15.20 — — 74,927 — —�R� Share Class (b) EUR 155,694 12.33 — — 1,919,404 — —�R� Share Class (b) GBP 1,000 15.21 — — 15,208 — —�R� Share Class (b) USD 372,968 13.19 — — 4,919,545 — —Global Millennials Equity PortfolioBase Accumulation Share Class USD 4,486,310 28.27 18.69 15.39 126,844,565 11,418,492 157,250Base Currency Share Class USD 150,097 23.86 15.78 12.99 3,580,751 265,789 77,875Other Currency Accumulation Share Class (b) EUR 439,999 13.27 — — 5,837,063 — —Other Currency Accumulation Share Class (b) HKD 794 99.50 — — 79,021 — —Other Currency Accumulation Share Class (b) SGD 1,371 9.94 — — 13,634 — —Other Currency Share Class EUR 550 15.27 11.00 — 8,402 6,050 —�E� Accumulation Share Class EUR 1,887,163 17.05 12.39 9.97 32,172,132 2,488,410 4,805�E� Share Class EUR 4,968,278 21.55 15.66 12.60 107,085,050 38,060,121 1,323,433�I� Accumulation Share Class EUR 7,409,923 17.82 12.75 10.10 132,065,969 16,122,462 2,824,181�I� Accumulation Share Class GBP 274,142 27.66 18.81 15.56 7,583,138 675,988 898,965�I� Accumulation Share Class USD 9,463,870 30.14 19.76 16.14 285,206,293 29,573,348 7,854,600�I� Share Class GBP 379,228 27.75 18.86 15.60 10,522,850 5,182 4,285�I� Share Class USD 6,912,149 24.84 16.29 13.30 171,717,276 23,838,724 1,136,273�IO� Share Class (b) USD 1,441,275 11.92 — — 17,181,339 — —�P� Accumulation Share Class USD 3,190,449 24.16 15.93 13.08 77,077,178 11,087,810 7,815,358�P� Share Class USD 458,648 24.16 15.93 13.08 11,079,998 998,890 100,017�R� Accumulation Share Class GBP 221,976 27.61 18.79 15.55 6,128,373 200,084 130,771�R� Accumulation Share Class USD 3,452,418 30.16 19.79 16.18 104,110,972 9,895,163 1,630,592�R� Share Class GBP 1,055,695 27.25 18.53 15.34 28,764,452 7,531,613 1,279,311�R� Share Class USD 4,005,764 29.70 19.49 15.93 118,985,404 31,180,329 4,324,491India Equity PortfolioBase Accumulation Share Class USD 17,874,307 22.95 20.59 19.69 410,138,973 512,266,916 563,235,170Base Currency Share Class USD 2,522,737 22.95 20.60 19.69 57,899,172 77,698,593 92,392,871Other Currency Accumulation Share Class SEK 1,087,805 131.83 132.57 120.95 143,407,059 165,304,986 171,375,908Other Currency Accumulation Share Class SGD 11,308 11.72 10.76 — 132,517 10,758 —Other Currency Share Class GBP 19,863 24.94 23.14 22.42 495,409 1,228,632 1,691,514�A� Accumulation Share Class USD 81,948 14.33 12.92 12.42 1,173,923 1,525,668 2,003,000�A� Share Class USD 680,370 21.55 19.43 18.67 14,659,912 24,192,280 31,447,486�E� Accumulation Share Class EUR 2,868,652 28.43 27.84 25.96 81,566,328 100,645,896 120,282,481�I� Accumulation Share Class EUR 324,728 14.39 13.89 12.77 4,671,483 51,249,714 41,841,468�I� Accumulation Share Class USD 14,474,379 25.93 23.05 21.83 375,367,713 481,675,674 591,943,099�I� Share Class GBP 6,971,792 15.88 14.62 14.03 110,721,115 117,174,724 112,194,811
Goldman Sachs FundsStatistical Information
As at 30 November 2020
35

OutstandingSharesas at
Net Asset Value per Shareas at(a) Net Assets as at(a)
Currency 30-Nov-20 30-Nov-20 30-Nov-19 30-Nov-18 30-Nov-20 30-Nov-19 30-Nov-18
India Equity Portfolio (Continued)�I� Share Class USD 972,825 25.64 22.78 21.68 24,941,181 96,958,763 48,076,591�IO� Accumulation Share Class USD 6,125,585 14.33 12.63 11.86 87,771,787 75,904,349 13,996,937�P� Accumulation Share Class EUR 1,974 14.02 13.58 12.54 27,670 13,910 1,113,621�P� Accumulation Share Class USD 938,192 29.74 26.55 25.25 27,900,807 43,658,147 60,569,251�P� Share Class USD 69,332 29.58 26.51 25.23 2,051,165 2,879,251 4,611,485�R� Accumulation Share Class EUR 1,142,192 13.50 13.04 11.99 15,418,967 18,711,395 10,759,862�R� Accumulation Share Class USD 4,018,814 21.69 19.29 18.28 87,186,682 122,548,484 105,976,184�R� Share Class GBP 2,322,713 25.86 23.81 22.88 60,074,865 78,339,978 85,601,760�R� Share Class USD 1,091,926 21.63 19.25 18.25 23,618,103 30,481,077 31,408,887Japan Equity Partners PortfolioBase Accumulation Share Class JPY 44,670 16,908.61 13,458.52 12,005.40 755,312,031 108,900,306 168,226,513Other Currency Accumulation Share Class (b) EUR 925 11.07 — — 10,246 — —Other Currency Accumulation Share Class(CHF Hedged Class) CHF 29,738 15.77 12.69 11.42 468,834 138,495 114,186Other Currency Accumulation Share Class(EUR Hedged Class) EUR 59,410 16.01 12.86 11.53 950,904 679,950 834,966�I� Accumulation Close Share Class JPY 818,336 19,723.56 15,576.04 13,832.07 16,140,488,878 5,854,273,785 3,606,180,979�I� Accumulation Share Class EUR 7,326,231 14.07 11.53 9.55 103,092,322 53,791,495 44,598,508�I� Accumulation Share Class GBP 255,333 24.06 18.76 16.22 6,143,997 9,323 8,059�I� Accumulation Share Class JPY 4,724,462 17,685.24 13,960.88 12,353.44 83,553,223,610 16,715,216,928 5,959,570,634�I� Accumulation Share Class (EUR HedgedClass) EUR 1,734,538 16.82 13.41 11.93 29,179,734 10,787,269 34,692,475�I� Accumulation Share Class (GBP HedgedClass) GBP 1,526,467 17.21 13.68 12.06 26,267,457 20,674,434 17,864,970�I� Accumulation Share Class (USD HedgedClass) USD 4,130,298 20.95 16.45 14.22 86,527,337 41,933,394 36,235,513�I� Share Class GBP 1,349,264 15.04 11.74 10.18 20,287,094 17,138,290 23,477,102�IO� Accumulation Share Class (b) JPY 1,016,796 11,726.58 — — 11,923,542,124 — —�IO� Accumulation Share Class (b) USD 1,102 11.50 — — 12,667 — —�P� Accumulation Share Class JPY 305,122 19,367.30 15,373.24 13,677.92 5,909,381,190 3,052,985,412 3,331,617,329�P� Accumulation Share Class (USD HedgedClass) USD 2,420,346 20.44 16.14 14.03 49,474,965 61,365,479 74,650,497�P� Share Class (GBP Hedged Class) GBP 147,091 18.97 15.17 13.43 2,790,191 1,651,236 1,471,470�P� Share Class (USD Hedged Class) USD 1,645,200 14.21 11.22 9.76 23,386,396 14,234,904 12,377,043�R� Accumulation Share Class JPY 530,549 17,626.52 13,924.36 12,329.87 9,351,730,726 6,336,970,303 4,848,299,833�R� Accumulation Share Class (EUR HedgedClass) EUR 1,617,077 16.78 13.38 11.91 27,138,045 16,008,761 12,893,281�R� Accumulation Share Class (GBP HedgedClass) GBP 66,002 17.16 13.65 12.03 1,132,375 249,922 231,060�R� Accumulation Share Class (USD HedgedClass) USD 1,434,270 14.33 11.26 9.74 20,551,928 12,457,984 8,889,028�R� Share Class (b) GBP 1,073 10.49 — — 11,260 — —�R� Share Class (GBP Hedged Class) GBP 1,681,134 17.33 13.82 12.20 29,131,860 20,839,324 7,466,105Japan Equity PortfolioBase Accumulation Share Class JPY 168,738 16,480.30 14,451.92 13,336.21 2,780,855,383 3,161,417,626 4,512,687,072Base Currency Share Class JPY 780,788 1,895.22 1,661.92 1,533.70 1,479,764,935 2,270,846,118 2,331,852,960Other Currency Accumulation Share Class(EUR Hedged Class) EUR 977,800 24.05 21.32 19.76 23,519,911 26,340,164 38,982,942Other Currency Accumulation Share Class(SEK Hedged Class) SEK 38,180 181.17 161.08 149.43 6,917,205 9,926,543 15,817,650Other Currency Accumulation Share Class(USD Hedged Class) USD 50,018 18.66 16.24 14.65 933,163 994,589 1,871,770Other Currency Share Class GBP 1,567 23.29 20.14 18.16 36,494 23,820 21,477Other Currency Share Class USD 228,995 27.56 23.01 20.49 6,310,790 13,538,158 11,831,089�A� Share Class USD 262,789 19.53 16.39 14.66 5,133,131 9,730,924 13,807,039�B� Share Class USD 8,021 16.66 14.12 12.76 133,660 113,227 102,317�E� Accumulation Share Class EUR 3,497,321 14.91 13.67 11.90 52,135,942 137,553,242 141,158,676�E� Accumulation Share Class (EUR HedgedClass) EUR 1,820,961 14.83 13.24 12.37 26,998,619 26,953,976 32,902,213�I� Accumulation Close Share Class JPY 9,409,746 1,557.36 1,351.99 1,240.21 14,654,346,863 10,403,518,462 3,824,525,285�I� Accumulation Share Class JPY 4,169,650 16,811.17 14,607.37 13,357.26 70,096,688,695 48,147,697,350 63,326,254,733�I� Accumulation Share Class (EUR HedgedClass) EUR 2,269,696 20.22 17.76 16.32 45,899,532 19,548,464 31,397,416�I� Accumulation Share Class (USD HedgedClass) USD 493,530 20.64 17.80 15.91 10,184,984 5,893,427 11,530,423�I� Share Class JPY 727,978 2,367.67 2,072.67 1,908.43 1,723,610,157 1,774,472,722 1,454,927,764�I� Share Class (GBP Hedged Class) GBP 4,399,231 16.45 14.51 13.29 72,352,435 55,036,419 46,830,532�P� Accumulation Share Class JPY 19,035 20,423.97 17,862.11 16,438.58 388,775,004 394,807,957 746,900,053�P� Accumulation Share Class (USD HedgedClass) USD 440,034 19.22 16.69 15.00 8,455,796 10,192,605 15,185,871�P� Share Class JPY 26,079 20,064.01 17,577.04 16,177.38 523,248,016 468,062,881 430,791,138�R� Accumulation Snap Share Class JPY 418,327 2,984.95 2,595.68 2,375.23 1,248,686,694 321,158,146 257,934,120�R� Share Class (GBP Hedged Class) GBP 9,636 16.42 14.49 13.26 158,228 138,787 126,149�R� Snap Share Class GBP 232,411 27.06 23.36 21.02 6,288,181 9,295,351 24,896,888�R� Snap Share Class JPY 73,119 2,887.47 2,527.84 2,327.33 211,128,333 171,875,462 157,441,184�R� Snap Share Class USD 4,057 12.23 10.19 9.06 49,607 10,980 9,693N-11® Equity Portfolio(b)
Base Accumulation Share Class (b) USD — — 8.36 7.92 — 7,269,280 9,903,508Base Currency Share Class (b) USD — — 8.34 7.91 — 2,473,827 2,843,894Other Currency Accumulation Share Class (b) EUR — — 10.36 9.52 — 10,841,055 11,950,357Other Currency Share Class (b) EUR — — 11.13 10.24 — 2,226,225 2,368,755Other Currency Share Class (b) GBP — — 10.19 9.79 — 99,109 329,381
Goldman Sachs FundsStatistical Information
As at 30 November 2020
36

OutstandingSharesas at
Net Asset Value per Shareas at(a) Net Assets as at(a)
Currency 30-Nov-20 30-Nov-20 30-Nov-19 30-Nov-18 30-Nov-20 30-Nov-19 30-Nov-18
N-11® Equity Portfolio(b) (Continued)Other Currency Share Class (b) SGD — — 9.45 8.99 — 9,484 9,011�E� Accumulation Share Class (b) EUR — — 9.74 9.02 — 15,608,538 18,839,848�I� Accumulation Share Class (b) USD — — 9.14 8.58 — 5,482,503 9,724,387�I� Share Class (b) GBP — — 11.57 11.10 — 16,247 209,661�I� Share Class (b) USD — — 8.52 8.09 — 1,111,745 1,162,266�P� Accumulation Share Class (b) USD — — 8.81 8.31 — 883,864 834,613�P� Share Class (b) USD — — 8.46 8.03 — 589,629 557,985�R� Accumulation Share Class (b) EUR — — 10.36 9.44 — 5,834,062 8,345,674�R� Accumulation Share Class (b) USD — — 8.81 8.27 — 195,724 218,072�R� Share Class (b) EUR — — 9.83 9.05 — 208,172 369,368�R� Share Class (b) GBP — — 10.38 9.99 — 84,694 89,252�R� Share Class (b) USD — — 8.22 7.81 — 891,778 810,884US Equity PortfolioBase Accumulation Share Class USD 14,824,400 30.26 25.77 22.63 448,638,588 439,360,041 432,716,103Base Currency Share Class USD 228,736 30.32 25.81 22.67 6,934,353 6,921,782 6,613,780Other Currency Accumulation Share Class EUR 14,862 29.99 27.84 23.75 445,708 409,515 256,642Other Currency Accumulation Share Class(EUR Hedged Class) EUR 4,425,963 30.40 26.42 23.91 134,565,593 132,337,135 131,907,796Other Currency Share Class GBP 20,135 31.02 27.38 24.35 624,619 1,424,614 1,219,264Other Currency Share Class SGD 28,119 27.51 23.95 21.09 773,465 673,333 593,155�A� Share Class USD 425,763 28.15 24.09 21.26 11,984,026 10,905,915 9,943,014�E� Accumulation Share Class EUR 166,838 27.08 25.33 21.75 4,518,004 4,837,367 4,456,053�E� Accumulation Share Class (EUR HedgedClass) EUR 8,576 25.40 22.24 20.28 217,880 467,210 648,596�I� Accumulation Share Class EUR 14,168 15.37 14.15 11.96 217,713 213,359 192,244�I� Accumulation Share Class USD 132,656 26.32 22.23 19.36 3,490,910 10,251,521 10,974,684�I� Share Class GBP 66,904 35.49 31.18 27.60 2,374,227 2,754,734 3,196,317�I� Share Class USD 163,202 31.77 26.93 23.54 5,185,009 4,471,221 5,174,937�IO� Accumulation Share Class USD 180,183 30.11 25.24 21.82 5,425,844 5,181,075 11,905,089�IS� Share Class GBP 1,202,272 12.99 11.41 10.06 15,620,529 18,543,455 21,236,599�P� Accumulation Share Class USD 292,791 27.29 23.17 20.29 7,988,922 12,563,733 14,963,710�P� Share Class USD 112,815 27.32 23.20 20.32 3,081,936 4,947,336 4,333,414�R� Accumulation Share Class EUR 227,572 26.96 24.85 21.01 6,136,370 8,051,284 10,743,327�R� Accumulation Share Class USD 58,824 24.87 21.02 18.32 1,462,744 1,326,814 1,154,551�R� Accumulation Share Class (EUR HedgedClass) EUR 384,294 22.64 19.53 17.54 8,700,718 4,420,352 1,490,308�R� Share Class GBP 36,510 29.60 26.00 23.02 1,080,583 1,134,354 880,398�R� Share Class USD 162,079 24.71 20.95 18.31 4,004,876 4,811,542 4,440,195US Focused Growth Equity PortfolioBase Accumulation Share Class USD 164,917 38.52 26.81 22.58 6,352,799 3,805,482 2,994,826Base Currency Share Class USD 277,594 30.95 21.54 18.14 8,591,262 6,040,428 5,653,235�A� Share Class USD 351,417 29.80 20.84 17.64 10,472,446 7,888,070 6,537,772�B� Share Class USD 5,124 24.47 17.29 14.78 125,384 88,569 75,720�E� Accumulation Share Class EUR 23,819 38.16 29.18 24.04 909,026 835,666 736,215�I� Accumulation Share Class USD 17,113 34.16 23.58 19.71 584,586 328,891 274,812�I� Share Class USD 1,151 37.68 26.02 21.74 43,384 58,122 1,942,942�P� Accumulation Share Class USD 205,637 36.07 25.04 21.03 7,416,650 5,181,830 6,047,884�P� Share Class USD 1,000 36.04 25.02 21.02 36,042 25,018 21,016�R� Accumulation Share Class USD 13,439 32.22 22.25 18.60 432,991 272,619 18,603�R� Share Class GBP 23,839 39.08 27.97 23.68 931,575 570,087 456,983�R� Share Class USD 24,033 32.24 22.27 18.61 774,798 533,289 445,778US Smaller Cap Equity PortfolioBase Accumulation Share Class USD 116 11.63 10.31 9.26 1,349 10,312 9,256Base Currency Share Class USD 116 11.64 10.31 9.26 1,350 10,312 9,256�E� Accumulation Share Class EUR 6,532 11.04 10.75 9.43 72,084 10,750 9,433�I� Accumulation Share Class USD 115 11.87 10.44 9.29 1,365 7,240,249 9,290�I� Share Class USD 100 11.86 10.43 9.29 1,186 2,895,480 2,588,121�P� Accumulation Share Class USD 96,714 11.71 10.36 9.27 1,132,402 1,849,995 998,124�P� Accumulation Share Class (EUR HedgedClass) EUR 998 10.78 9.77 9.02 10,755 9,753 8,998�P� Share Class USD 6,502 11.70 10.35 9.27 76,106 76,468 9,266�R� Accumulation Share Class USD 1,788,145 11.85 10.43 9.29 21,182,481 13,406,299 8,502,343�R� Accumulation Share Class (EUR HedgedClass) EUR 122,147 11.16 10.07 9.25 1,363,176 1,324,976 1,724,753�R� Share Class GBP 765 12.20 11.12 — 9,324 8,503 —�R� Share Class USD 1,003,089 11.84 10.42 9.29 11,880,532 7,043,377 9,288US Technology Opportunities EquityPortfolio(b)
Base Accumulation Share Class (b) USD 1,000 11.05 — — 11,047 — —Base Currency Share Class (b) USD 1,000 11.05 — — 11,047 — —Other Currency Accumulation Share Class (b) EUR 850 10.75 — — 9,142 — —�E� Accumulation Share Class (b) EUR 850 10.75 — — 9,138 — —�I� Accumulation Share Class (b) GBP 2,300 10.69 — — 24,594 — —�I� Accumulation Share Class (b) USD 3,000 11.05 — — 33,163 — —�I� Share Class (b) USD 3,000 11.05 — — 33,163 — —�IO� Accumulation Share Class (b) USD 7,607,075 11.06 — — 84,157,793 — —�P� Accumulation Share Class (b) USD 10,000 11.05 — — 110,493 — —�R� Accumulation Share Class (b) GBP 750 10.69 — — 8,020 — —�R� Accumulation Share Class (b) USD 1,000 11.05 — — 11,054 — —�R� Share Class (b) USD 1,000 11.05 — — 11,054 — —
Goldman Sachs FundsStatistical Information
As at 30 November 2020
37

OutstandingSharesas at
Net Asset Value per Shareas at(a) Net Assets as at(a)
Currency 30-Nov-20 30-Nov-20 30-Nov-19 30-Nov-18 30-Nov-20 30-Nov-19 30-Nov-18
Global Infrastructure Equity PortfolioBase Accumulation Share Class USD 116,954 13.19 13.03 10.92 1,542,134 109,922 10,921Base Currency (Dis) (Gross Quarterly) ShareClass USD 90 11.21 11.37 10.32 1,005 940 10,853Base Currency Share Class USD 2,552 12.83 12.78 10.80 32,744 996 10,923Other Currency (Dis) (Gross Quarterly) ShareClass EUR 93 9.93 10.97 9.69 925 944 10,191Other Currency Accumulation Share Class EUR 18,354 11.71 12.61 10.26 214,895 251,049 10,258Other Currency Share Class EUR 82 11.40 12.37 10.14 932 1,003 10,258�E� (Dis) (Gross Quarterly) Share Class EUR 13,110 9.79 10.92 9.12 128,337 141,784 9,181�E� Accumulation Share Class EUR 159,331 10.85 11.77 9.65 1,728,771 1,267,577 28,625�E� Share Class EUR 13,520 10.79 11.71 9.60 145,900 199,073 9,242�I� (Dis) (Gross Quarterly) Share Class GBP 92 10.55 11.00 9.79 973 966 8,405�I� (Dis) (Gross Quarterly) Share Class USD 86 11.81 11.89 10.48 1,011 960 11,024�I� Accumulation Share Class GBP 81 12.10 12.29 10.36 984 999 8,461�I� Accumulation Share Class USD 481,559 13.61 13.34 11.10 6,552,708 6,421,958 3,074,550�I� Share Class GBP 86 11.49 11.86 10.17 982 998 8,461�I� Share Class USD 79 12.95 12.90 10.89 1,019 998 11,096�P� (Dis) (Gross Quarterly) Share Class USD 970 1.03 12.08 10.37 1,003 85,539 64,514�P� Accumulation Share Class USD 154,373 13.35 13.15 10.99 2,061,034 1,816,185 1,057,798�P� Share Class USD 20,245 12.87 12.81 10.83 260,513 996 10,986�R� (Dis) (Gross Quarterly) Share Class GBP 92 10.58 11.05 9.79 979 972 8,398�R� (Dis) (Gross Quarterly) Share Class USD 86 11.78 11.86 10.47 1,012 960 11,015�R� Accumulation Share Class GBP 81 12.07 12.27 10.35 982 998 8,453�R� Accumulation Share Class USD 16,164 13.58 13.32 11.08 219,508 85,233 148,732�R� Share Class GBP 393 11.49 11.86 10.16 4,521 10,223 18,622�R� Share Class USD 1,637 12.93 12.87 10.88 21,164 996 11,087Global Real Estate Equity PortfolioBase Accumulation Share Class USD 146,937 9.83 12.20 10.76 1,444,232 608,314 10,755Base Currency (Dis) (Gross Quarterly) ShareClass USD 1,249 7.76 10.29 9.91 9,693 112,656 173,558Base Currency Share Class USD 1,071 9.18 11.63 10.51 9,828 12,197 10,755Other Currency (Dis) (Gross Quarterly) ShareClass EUR 1,173 7.37 10.41 9.27 8,647 11,720 10,018Other Currency Accumulation Share Class EUR 404,705 8.72 11.80 10.10 3,527,765 4,217,024 10,100Other Currency Share Class EUR 1,071 8.14 11.25 9.87 8,723 11,804 10,099�E� (Dis) (Gross Quarterly) Share Class EUR 10,138 6.94 9.87 8.81 70,347 88,182 9,103�E� Accumulation Share Class EUR 7,859 8.16 11.12 9.59 64,104 73,898 37,856�E� Share Class EUR 13,363 7.78 10.75 9.43 103,949 93,325 9,177�I� (Dis) (Gross Quarterly) Share Class GBP 956 7.76 10.33 9.53 7,420 9,482 8,394�I� (Dis) (Gross Quarterly) Share Class USD 655,695 8.60 11.05 10.03 5,639,672 7,291,429 10,838�I� Accumulation Share Class GBP 817 9.16 11.69 10.36 7,485 9,550 8,462�I� Accumulation Share Class USD 1,462,753 10.14 12.49 10.93 14,837,554 15,055,572 1,767,794�I� Share Class GBP 894 8.37 10.98 10.05 7,483 9,547 8,462�I� Share Class USD 1,096 9.27 11.73 10.60 10,158 4,476,661 5,104,837�P� (Dis) (Gross Quarterly) Share Class USD 854,830 8.09 10.46 9.58 6,919,117 11,322,349 12,871,428�P� Accumulation Share Class USD 491,339 9.52 11.78 10.36 4,675,218 8,355,660 7,493,254�P� Share Class USD 83,990 8.85 11.21 10.13 742,990 941,234 1,084,135�R� (Dis) (Gross Quarterly) Share Class GBP 1,700 7.75 10.32 9.52 13,178 17,158 8,387�R� (Dis) (Gross Quarterly) Share Class USD 1,173 8.56 11.00 10.03 10,039 12,386 10,830�R� Accumulation Share Class GBP 817 9.15 11.68 10.35 7,473 9,538 8,455�R� Accumulation Share Class USD 1,000 10.13 12.47 10.91 10,125 12,474 10,910�R� Share Class GBP 893 8.36 10.98 10.05 7,471 9,535 8,455�R� Share Class USD 1,095 9.25 11.72 10.59 10,126 12,474 10,916North America Energy & EnergyInfrastructure Equity PortfolioBase Accumulation Share Class USD 2,706,768 4.87 6.05 6.39 13,193,126 23,257,435 31,189,870Base Currency Share Class USD 209,756 4.51 5.70 6.09 946,175 1,695,081 2,451,305�A� Share Class USD 3,992 7.18 9.06 9.65 28,659 35,945 48,866�E� Accumulation Share Class EUR 286,768 5.34 7.28 7.52 1,531,228 1,627,121 1,817,575�I� Accumulation Share Class USD 173,412 5.21 6.42 6.73 904,108 2,483,726 2,549,892�I� Share Class USD 361 4.51 5.70 6.09 1,630 2,004 1,775,851�P� Accumulation Share Class USD 3,913,687 4.72 5.84 6.16 18,491,435 29,131,973 34,675,686�P� Share Class USD 662,634 4.26 5.38 5.75 2,823,056 4,376,219 5,246,482�R� Accumulation Share Class EUR 429 6.71 9.00 9.16 2,879 3,862 3,931�R� Accumulation Share Class USD 172,607 5.17 6.36 6.67 891,925 1,899,306 2,019,176�R� Share Class USD 22,655 4.52 5.71 6.11 102,390 329,154 1,386,950Emerging Markets CORE® Equity PortfolioBase Accumulation Close Share Class USD 10,069,337 19.10 15.96 15.57 192,366,244 126,130,107 117,919,912Base Accumulation Snap Share Class USD 386,570 11.06 9.20 8.97 4,275,300 92,570,542 10,349Base Currency Snap Share Class USD 19,667 12.50 10.56 10.46 245,846 707,604 1,050,724Other Currency Accumulation Close ShareClass EUR 3,112,557 12.23 11.14 10.54 38,056,165 29,075,854 27,634,523Other Currency Accumulation Close ShareClass (Long Emerging Markets CCY vs. USD) CHF 9,800 9.69 8.32 8.39 94,995 41,594 41,929Other Currency Accumulation Close ShareClass (Long Emerging Markets CCY vs. USD) EUR 12,000 9.76 8.36 8.40 117,157 8,361 8,403�A� Accumulation Snap Share Class (LongEmerging Markets CCY vs. USD) PLN 38,079 11.10 9.55 — 422,637 363,637 —�E� Accumulation Close Share Class EUR 69,987 10.92 10.03 9.56 764,463 767,411 331,873�I� Accumulation Close Share Class EUR 13,825,325 10.25 9.27 8.70 141,699,439 213,103,180 133,691,944�I� Accumulation Close Share Class USD 71,698,783 21.36 17.71 17.13 1,531,187,614 1,949,656,481 1,794,924,291
Goldman Sachs FundsStatistical Information
As at 30 November 2020
38

OutstandingSharesas at
Net Asset Value per Shareas at(a) Net Assets as at(a)
Currency 30-Nov-20 30-Nov-20 30-Nov-19 30-Nov-18 30-Nov-20 30-Nov-19 30-Nov-18
Emerging Markets CORE® EquityPortfolio (Continued)�I� Accumulation Snap Share Class GBP 4,324,407 11.41 9.78 — 49,352,809 43,498,859 —�I� Close Share Class EUR 3,593,162 10.33 9.54 9.13 37,116,427 32,854,496 49,545,165�IO� Accumulation Close Share Class GBP 244,225 19.38 16.54 16.10 4,732,175 4,036,002 4,024,885�IO� Accumulation Close Share Class JPY 4,518,979 1,120.53 970.06 — 5,063,645,127 2,901,670,535 —�IO� Accumulation Close Share Class USD 13,300,613 23.30 19.20 18.45 309,908,757 245,726,682 309,552,478�IO� Accumulation Snap Share Class USD 3,997,679 11.51 9.45 9.08 45,997,342 43,881,674 55,953,189�IO� Snap Share Class USD 3,083,820 12.19 10.30 10.23 37,606,416 30,250,589 119,077,659�P� Accumulation Close Share Class USD 1,556,376 16.24 13.49 13.08 25,277,399 34,086,543 48,175,390�P� Close Share Class USD 116,964 14.30 12.11 12.02 1,672,792 4,086,028 4,058,857�R� Accumulation Close Share Class USD 3,850,417 15.76 13.08 12.67 60,697,876 35,703,860 28,791,251�R� Accumulation Close Share Class (LongEmerging Markets CCY vs. USD) EUR 13,436 9.94 8.45 8.44 133,531 113,562 33,764�R� Close Share Class GBP 4,630,083 16.25 14.26 14.34 75,251,270 63,700,063 7,446,188�R� Close Share Class USD 816,508 13.82 11.70 11.61 11,280,895 11,638,013 6,188,497Europe CORE® Equity PortfolioBase Accumulation Share Class EUR 4,946,200 18.92 19.93 17.46 93,600,234 185,203,905 131,866,394Base Currency Share Class EUR 2,047,354 16.08 17.26 15.37 32,912,989 48,434,379 83,990,617Other Currency Accumulation Share Class USD 53,300 11.51 11.11 10.03 613,447 3,154,113 3,109,542Other Currency Accumulation Share Class(USD Hedged Class) USD 14,708 10.38 10.61 9.18 152,711 10,748 9,297Other Currency Share Class GBP 4,223 10.46 10.67 9.92 44,152 78,922 73,355Other Currency Share Class USD 61,117 11.52 11.34 10.41 704,081 4,846,312 5,090,905�A� Accumulation Share Class EUR 78,539 10.12 10.72 9.44 794,886 2,098,968 416,004�A� Accumulation Share Class USD 621,397 10.41 10.10 9.17 6,468,090 18,206,390 22,885,781�A� Accumulation Share Class (PLN HedgedClass) PLN 38,079 10.06 10.52 — 383,137 400,680 —�A� Share Class EUR 1,406,542 14.40 15.46 13.76 20,249,387 33,149,941 35,815,238�A� Share Class USD 764,155 10.86 10.70 9.81 8,297,522 8,762,090 11,581,778�E� Accumulation Share Class EUR 4,213,545 21.24 22.49 19.79 89,509,547 130,775,159 142,037,796�I� Accumulation Share Class CHF 12,783 9.35 9.91 8.85 119,513 674,009 9,781�I� Accumulation Share Class EUR 50,458,159 18.20 19.02 16.52 918,405,265 1,751,520,147 1,715,356,933�I� Accumulation Share Class USD 2,878,949 11.65 11.16 9.99 33,551,981 79,516,179 7,016,615�I� Accumulation Share Class (CHF HedgedClass) CHF 18,137 10.37 10.71 9.50 188,161 630,315 2,220,175�I� Accumulation Share Class (EUR HedgedClass) EUR 3,780,381 9.91 10.25 9.05 37,459,072 38,738,940 36,270,857�I� Accumulation Share Class (USD HedgedClass) USD 10,000 11.22 11.38 9.76 112,240 113,766 97,629�I� Share Class EUR 7,796,515 20.96 22.49 20.05 163,402,113 159,248,542 144,284,489�IO� Accumulation Share Class EUR 1,294,960 16.95 17.62 15.23 21,947,249 23,146,071 3,548,327�IO� Accumulation Share Class (LongEuropean CCY vs. EUR) SGD 31,736,935 10.36 10.68 — 328,936,076 403,511,765 —�P� Accumulation Share Class EUR 4,250,382 14.15 14.87 12.99 60,161,169 82,994,962 112,141,283�P� Share Class EUR 156,257 9.90 10.63 9.47 1,546,419 2,979,394 4,491,057�P� Share Class GBP 38,969 10.49 10.70 9.95 408,896 653,038 599,717�P� Share Class USD 177,000 10.77 10.60 9.74 1,906,677 13,229,550 14,060,499�R� Accumulation Share Class EUR 6,136,181 19.23 20.11 17.48 118,015,037 136,854,396 184,762,532�R� Share Class EUR 2,328,487 16.35 17.55 15.64 38,076,886 78,363,384 76,042,667�R� Share Class GBP 260,818 18.07 18.43 17.16 4,713,963 5,083,601 5,823,003�R� Share Class USD 344,665 10.91 10.74 9.87 3,760,446 7,322,287 3,593,493Global CORE® Equity PortfolioBase Accumulation Close Share Class USD 1,756,740 26.15 23.43 21.57 45,931,927 67,320,143 53,324,127Base Accumulation Snap Share Class USD 2,402,208 26.55 23.78 21.75 63,783,113 82,590,611 56,599,010Base Currency (Dis) (Gross Quarterly) CloseShare Class USD 917 11.45 10.38 9.71 10,495 9,403 8,680Base Currency Close Share Class USD 456,910 21.44 19.26 17.79 9,796,191 11,387,202 10,779,611Base Currency Snap Share Class USD 734,703 28.65 25.73 23.60 21,052,532 47,322,322 75,485,713Other Currency Accumulation Close ShareClass HKD 34,410 120.89 109.39 — 4,159,825 6,407,942 —Other Currency Accumulation Close ShareClass SGD 238,740 12.00 10.99 10.15 2,864,391 4,365,885 5,569,246Other Currency Accumulation Close ShareClass (AUD Hedged Class) AUD 89,566 11.65 11.01 — 1,043,618 150,474 —Other Currency Accumulation Close ShareClass (SGD Hedged Class) SGD 260,576 11.64 10.71 9.83 3,032,199 3,057,197 698,556Other Currency Accumulation Snap ShareClass EUR 2,797,900 12.11 11.82 10.49 33,874,506 41,922,131 13,488,927Other Currency Accumulation Snap ShareClass (EUR Hedged Class) EUR 15,304 11.39 10.61 — 174,241 6,967 —�A� Snap Share Class USD 465,008 21.67 19.51 17.93 10,077,970 12,762,679 16,417,319�E� Accumulation Close Share Class EUR 3,407,776 22.10 21.70 19.48 75,298,013 116,125,270 126,537,385�E� Accumulation Snap Share Class EUR 4,275,224 26.55 26.06 23.24 113,508,453 133,468,083 153,582,239�E� Accumulation Snap Share Class (EURHedged Class) EUR 1,645,831 11.20 10.48 9.83 18,426,463 11,082,732 368,448�I� Accumulation Close Share Class EUR 15,214,905 24.80 24.04 21.30 377,370,550 650,006,822 616,280,953�I� Accumulation Close Share Class USD 27,996,279 26.68 23.71 21.66 746,902,311 962,878,732 1,084,281,074�I� Accumulation Close Share Class (CHFHedged Class) CHF 6,908 11.54 10.66 9.95 79,692 73,667 56,281�I� Accumulation Close Share Class (EURHedged Class) EUR 1,289,016 11.21 10.36 9.65 14,445,389 60,366,428 131,889,449�I� Accumulation Snap Share Class USD 1,348,929 12.27 10.90 — 16,552,259 47,601,293 —
Goldman Sachs FundsStatistical Information
As at 30 November 2020
39

OutstandingSharesas at
Net Asset Value per Shareas at(a) Net Assets as at(a)
Currency 30-Nov-20 30-Nov-20 30-Nov-19 30-Nov-18 30-Nov-20 30-Nov-19 30-Nov-18
Global CORE® Equity Portfolio (Continued)�I� Accumulation Snap Share Class (EURHedged Class) EUR 1,627,723 11.62 10.74 9.94 18,910,770 15,397,903 6,008,651�I� Close Share Class GBP 16,310 13.36 12.42 11.62 217,869 24,032,956 17,730,056�I� Close Share Class USD 2,242,340 21.73 19.51 18.03 48,728,619 161,010,344 100,273,843�I� Snap Share Class USD 1,920,000 29.58 26.55 24.37 56,785,336 60,821,500 110,635,820�IO� (Dis) (Cap Monthly) Snap Share Class USD 21,079 10.78 10.35 — 227,197 129,630 —�IO� Accumulation Close Share Class EUR 2,294,542 36.84 35.52 31.32 84,519,511 85,373,697 91,848,943�IO� Accumulation Close Share Class GBP 214 39.50 36.19 33.31 8,470 7,759 2,204,132�IO� Accumulation Close Share Class USD 3,459,253 23.19 20.50 18.64 80,208,174 16,909,908 14,210,779�IO� Accumulation Snap Share Class USD 83,887,357 16.72 14.78 13.34 1,402,427,234 2,064,527,613 2,388,151,316�IO� Snap Share Class USD 9,872,153 16.47 14.78 13.57 162,547,196 143,475,278 103,563,172�P� Accumulation Snap Share Class USD 3,728,239 20.34 18.17 16.58 75,850,292 96,384,973 133,044,385�P� Snap Share Class USD 276,541 33.75 30.31 27.79 9,332,627 21,151,688 18,281,319�R� Accumulation Close Share Class (CHFHedged Class) CHF 2,202 10.56 9.77 9.12 23,258 11,957 11,159�R� Accumulation Snap Share Class EUR 199,981 12.41 12.02 10.59 2,480,829 3,032,237 3,615,776�R� Accumulation Snap Share Class USD 2,838,053 24.94 22.17 20.13 70,780,115 114,633,360 111,278,284�R� Close Share Class GBP 247,683 13.31 12.39 11.59 3,297,753 8,146,059 6,045,040�R� Snap Share Class USD 891,871 23.17 20.81 19.09 20,669,070 26,061,651 29,578,993Global Small Cap CORE® Equity PortfolioBase Currency Close Share Class USD 641,732 22.85 22.38 20.24 14,666,191 16,380,105 88,281,739Base Currency Snap Share Class USD 7,292,138 23.02 22.42 20.16 167,879,480 182,890,194 174,270,460Other Currency Accumulation Snap ShareClass EUR 125,098 11.14 11.80 10.29 1,393,374 3,318,786 2,409,709Other Currency Accumulation Snap ShareClass SEK 13,163 145.71 159.54 136.83 1,917,883 68,239,136 34,934,908�A� Close Share Class USD 40,934 18.65 18.31 16.64 763,242 1,318,609 708,586�A� Snap Share Class USD 35,525 17.88 17.46 15.78 635,175 896,519 1,811,060�E� Accumulation Close Share Class EUR 527,540 20.88 22.36 19.72 11,016,266 17,422,210 18,786,830�E� Accumulation Snap Share Class EUR 547,063 20.13 21.43 18.79 11,012,327 15,739,702 16,893,029�I� Accumulation Close Share Class GBP 830 11.72 11.78 10.71 9,730 9,851 6,872,587�I� Accumulation Snap Share Class EUR 1,719,108 26.51 27.88 24.15 45,568,290 107,185,083 128,539,237�I� Accumulation Snap Share Class USD 1,632,159 14.63 14.12 12.60 23,883,211 26,508,077 5,861,215�I� Close Share Class GBP 796,571 11.51 11.67 10.70 9,166,181 6,733,810 6,287,030�IO� Accumulation Close Share Class GBP 5,685 42.74 42.70 38.62 242,961 205,260 1,260,515�IO� Accumulation Close Share Class JPY 4,926,618 982.87 995.97 921.63 4,842,237,877 4,940,112,613 4,605,543,777�IO� Accumulation Close Share Class USD 967,863 25.90 24.98 22.29 25,063,029 22,472,016 29,380,160�IO� Accumulation Snap Share Class USD 886,739 14.87 14.26 12.65 13,183,171 8,687,662 14,911,961�IO� Snap Share Class USD 3,943,739 14.50 14.11 12.71 57,189,092 55,585,417 93,324,636�P� Accumulation Snap Share Class USD 141,769 20.31 19.68 17.64 2,878,802 3,452,731 4,443,411�R� Accumulation Snap Share Class USD 134,054 22.24 21.47 19.18 2,981,580 4,068,429 6,689,869�R� Snap Share Class GBP 152,358 16.43 16.57 15.10 2,503,019 14,269,117 10,603,020�R� Snap Share Class USD 57,816 21.02 20.47 18.41 1,215,336 7,230,887 8,222,450US CORE® Equity PortfolioBase Accumulation Close Share Class USD 1,167,555 29.56 25.36 23.04 34,507,125 70,511,229 77,502,116Base Accumulation Snap Share Class USD 1,556,375 30.02 25.86 23.27 46,728,009 210,872,156 138,367,333Base Currency Close Share Class USD 171,812 29.20 25.10 22.80 5,016,703 4,434,677 3,641,672Base Currency Snap Share Class USD 1,137,044 51.84 44.73 40.26 58,940,855 59,443,081 52,029,341Other Currency Accumulation Close ShareClass HKD 889 121.54 105.37 — 108,018 93,645 —Other Currency Accumulation Close ShareClass SGD 68,120 12.36 10.84 9.89 841,901 12,700,967 13,375�A� Snap Share Class USD 739,763 29.94 25.92 23.45 22,150,601 38,153,449 28,580,823�E� Accumulation Snap Share Class EUR 4,216,487 23.17 21.87 19.19 97,675,075 92,210,867 93,035,016�E� Accumulation Snap Share Class (EURHedged Class) EUR 737,367 11.75 10.43 9.72 8,666,992 11,932,147 3,028,518�I� Accumulation Close Share Class HKD 788 130.20 112.18 — 102,543 88,353 —�I� Accumulation Close Share Class USD 15,579,643 19.33 16.50 14.90 301,191,506 314,919,064 340,413,468�I� Accumulation Snap Share Class USD 36,281,116 18.36 15.73 14.07 666,230,304 286,202,199 324,420,250�I� Accumulation Snap Share Class (EURHedged Class) EUR 5,467,518 12.12 10.64 9.81 66,276,584 116,559,019 84,841,572�I� Snap Share Class USD 6,426,420 36.55 31.53 28.42 234,905,773 184,395,403 178,603,077�P� Accumulation Snap Share Class USD 1,580,048 25.92 22.27 20.00 40,952,870 60,297,726 70,470,732�P� Snap Share Class USD 19,581 27.92 24.09 21.71 546,725 836,057 2,092,279�R� Accumulation Snap Share Class USD 1,762,716 28.34 24.29 21.75 49,952,614 46,459,153 37,580,297�R� Snap Share Class GBP 60,473 32.61 29.15 26.61 1,972,316 2,492,797 1,449,122�R� Snap Share Class USD 2,585,707 27.18 23.45 21.13 70,285,155 114,839,045 37,766,543�U� Close Share Class USD 141,230 33.08 28.44 25.86 4,671,872 4,016,910 3,652,828US Small Cap CORE® Equity PortfolioBase Accumulation Close Share Class USD 62,051 25.50 25.04 23.06 1,582,264 1,658,954 2,182,963Base Accumulation Snap Share Class USD 16,514 26.32 25.70 23.53 434,683 581,272 974,988Base Currency Snap Share Class USD 17,409 26.37 25.74 23.58 459,089 599,405 2,190,698�A� Close Share Class USD 77,570 23.67 23.34 21.60 1,835,832 13,241,291 10,746,469�E� Accumulation Close Share Class EUR 27,450 22.99 24.75 22.23 631,042 1,181,708 2,594,236�E� Accumulation Snap Share Class EUR 52,841 23.92 25.58 22.85 1,263,714 3,686,211 5,360,236�I� Accumulation Snap Share Class USD 445,602 26.28 25.49 23.18 11,711,832 27,558,319 3,196,609�I� Snap Share Class USD 413,779 24.43 23.77 22.20 10,108,500 3,873,071 3,617,382�IO� Accumulation Snap Share Class USD 10,763,380 13.54 13.05 11.79 145,736,892 182,330,817 203,444,248�P� Accumulation Snap Share Class USD 1,527,389 23.41 22.74 20.73 35,750,582 34,121,613 32,585,019�R� Accumulation Snap Share Class USD 159,360 23.00 22.30 20.29 3,665,087 8,039,606 7,263,391�R� Snap Share Class GBP 42,224 27.18 27.41 25.31 1,147,596 848,323 904,625
Goldman Sachs FundsStatistical Information
As at 30 November 2020
40

OutstandingSharesas at
Net Asset Value per Shareas at(a) Net Assets as at(a)
Currency 30-Nov-20 30-Nov-20 30-Nov-19 30-Nov-18 30-Nov-20 30-Nov-19 30-Nov-18
US Small Cap CORE® EquityPortfolio (Continued)�R� Snap Share Class USD 52,703 22.47 21.86 19.93 1,184,067 1,954,127 1,700,194GQG Partners Global Equity Portfolio(b)
Base Accumulation Share Class (b) USD — — 11.64 10.22 — 20,854 10,217Base Currency Share Class (b) USD — — 11.64 10.22 — 11,638 10,217Other Currency Accumulation Share Class (b) EUR — — 12.42 10.58 — 12,416 10,576�A� Accumulation Share Class (b) USD — — 11.72 10.34 — 113,868 10,340�E� Accumulation Share Class (b) EUR — — 12.16 10.47 — 845,023 447,650�I� Accumulation Share Class (b) USD — — 11.85 10.31 — 27,339,884 6,118,359�IS� Accumulation Share Class (b) EUR — — 12.89 10.88 — 66,797,743 42,716,376�IS� Accumulation Share Class (b) USD — — 11.85 10.31 — 118,509,386 118,259,531�P� Accumulation Share Class (b) USD — — 11.69 10.25 — 22,664,556 336,681�R� Accumulation Share Class (b) USD — — 11.84 10.31 — 2,077,140 516,217�R� Share Class (b) USD — — 11.84 10.31 — 1,859,910 344,068Asia High Yield Bond Portfolio(b)
Base Accumulation Share Class (b) USD 712 103.12 — — 73,438 — —Base Currency (Dis) (Gross Monthly) ShareClass (b) USD 31,934 101.12 — — 3,229,179 — —Base Currency (Dis) (Stable Monthly) ShareClass (b) USD 6,768 101.01 — — 683,637 — —Other Currency (Dis) (Gross Monthly) ShareClass (AUD Hedged Class)(b) AUD 1,015 101.05 — — 102,524 — —Other Currency (Dis) (Gross Monthly) ShareClass (b) HKD 811 101.10 — — 82,043 — —Other Currency (Dis) (Stable Monthly) ShareClass (AUD Hedged Class)(b) AUD 1,015 101.02 — — 102,529 — —Other Currency (Dis) (Stable Monthly) ShareClass (EUR Hedged Class)(b) EUR 1,015 100.69 — — 102,197 — —Other Currency (Dis) (Stable Monthly) ShareClass (GBP Hedged Class)(b) GBP 1,015 100.98 — — 102,493 — —Other Currency (Dis) (Stable Monthly) ShareClass (SGD Hedged Class)(b) SGD 1,421 100.96 — — 143,456 — —�E� Accumulation Share Class (EUR HedgedClass) (b) EUR 101 100.74 — — 10,189 — —�E� Share Class (EUR Hedged Class) (b) EUR 101 100.74 — — 10,189 — —�I� Accumulation Share Class (b) USD 74,494 103.33 — — 7,697,768 — —�I SD� Accumulation Share Class (b) USD 15,580 102.22 — — 1,592,514 — —�I� Share Class (b) GBP 100 100.02 — — 10,014 — —�I� Share Class (b) USD 100 103.34 — — 10,334 — —�IS� Share Class (b) USD 163,851 103.40 — — 16,941,855 — —�P� Accumulation Share Class (b) USD 100 103.22 — — 10,322 — —�P� Share Class (b) USD 100 103.23 — — 10,323 — —�R� Share Class (b) GBP 100 100.02 — — 10,014 — —Emerging Markets Corporate BondPortfolioBase Accumulation Share Class USD 1,295,506 167.15 156.78 139.01 216,544,442 169,829,886 92,257,903Base Currency (Dis) (Gross Monthly) ShareClass USD 162,960 98.61 97.29 91.20 16,070,146 28,114,652 11,878Base Currency (Dis) (Monthly) Share Class USD 281,492 104.20 101.34 93.85 29,331,086 38,442,473 24,932,755Base Currency (Dis) (Stable Monthly) ShareClass USD 737,746 100.54 99.15 92.42 74,172,569 62,043,181 41,575,137Base Currency Share Class USD 66,280 119.46 116.95 108.52 7,917,908 1,963,019 2,190,237Other Currency (Dis) (Gross Monthly) ShareClass (AUD Hedged Class) AUD 64,052 103.74 103.64 — 6,645,046 6,492,806 —Other Currency (Dis) (Gross Monthly) ShareClass HKD 477,705 104.42 104.06 — 49,879,959 65,681,708 —Other Currency (Dis) (Monthly) Share Class(SGD Hedged Class) SGD 209,140 101.88 99.64 92.92 21,308,056 25,226,609 30,729,443Other Currency (Dis) (Stable Monthly) ShareClass (AUD Hedged Class) AUD 43,539 97.97 97.88 91.92 4,265,715 3,742,905 2,861,043Other Currency (Dis) (Stable Monthly) ShareClass (EUR Hedged Class) EUR 650 99.38 99.72 — 64,559 10,174 —Other Currency (Dis) (Stable Monthly) ShareClass (GBP Hedged Class) GBP 34,122 94.65 94.70 89.82 3,229,714 1,950,947 1,507,821Other Currency (Dis) (Stable Monthly) ShareClass (SGD Hedged Class) SGD 531,466 98.31 97.49 91.51 52,245,838 81,847,436 77,190,170Other Currency Accumulation Share Class(CHF Hedged Class) (b) CHF 356 100.58 — — 35,822 — —Other Currency Accumulation Share Class(EUR Hedged Class) EUR 421,317 149.63 142.92 130.64 63,040,770 25,006,720 16,873,928Other Currency Share Class (EUR HedgedClass) EUR 78,168 106.00 105.81 101.45 8,285,980 10,832,196 9,667,368Other Currency Share Class (GBP HedgedClass) GBP 19,092 112.92 112.00 106.11 2,155,801 1,931,161 714,792�A� Share Class USD 90,098 119.18 116.67 108.25 10,738,077 6,311,759 2,247,969�E� (Dis) (Quarterly) Share Class (EURHedged Class) EUR 59,877 97.90 97.09 92.87 5,861,746 5,287,563 3,255,970�E� Accumulation Share Class (EUR HedgedClass) EUR 71,202 142.69 137.02 125.86 10,160,074 9,158,990 4,692,840�I� (Dis) (Stable Monthly) Share Class USD 35,232 102.05 99.99 — 3,595,339 10,134 —�I� Accumulation Share Class USD 9,356,151 177.04 165.03 145.42 1,656,371,666 757,604,795 359,934,236�I� Accumulation Share Class (CHF HedgedClass) (b) CHF 158,131 101.09 — — 15,984,811 — —
Goldman Sachs FundsStatistical Information
As at 30 November 2020
41

OutstandingSharesas at
Net Asset Value per Shareas at(a) Net Assets as at(a)
Currency 30-Nov-20 30-Nov-20 30-Nov-19 30-Nov-18 30-Nov-20 30-Nov-19 30-Nov-18
Emerging Markets Corporate BondPortfolio (Continued)�I� Accumulation Share Class (EUR HedgedClass) EUR 2,380,575 158.52 150.48 136.69 377,375,027 220,479,351 159,984,227�I� Accumulation Share Class (GBP HedgedClass) GBP 49,651 132.99 125.73 112.74 6,603,033 83,117,380 60,432,874�I� Share Class USD 427,182 120.22 117.67 109.21 51,356,901 12,143,711 4,084,772�I� Share Class (EUR Hedged Class) EUR 1,095,930 106.58 106.39 102.07 116,801,842 42,077,360 26,085,459�I� Share Class (GBP Hedged Class) (b) GBP 1,189,406 105.82 — — 125,866,070 — —�IO� Accumulation Share Class JPY 527,121 13,319.65 12,956.74 11,754.32 7,021,067,957 6,466,500,686 5,511,086,974�IO� Accumulation Share Class USD 710,000 142.60 132.00 115.50 101,248,504 99,020,166 86,644,934�IO� Share Class USD 12,523 114.04 111.60 103.60 1,428,090 2,553,445 2,488,281�IS� Accumulation Share Class (EUR HedgedClass) EUR 2,339,246 112.00 106.06 — 262,003,775 162,214,937 —�P� Accumulation Share Class USD 117,364 144.67 135.33 119.67 16,979,363 20,420,480 12,159,473�P� Share Class USD 6,288 108.31 105.98 98.34 681,029 1,453,392 656,378�R� Accumulation Share Class USD 303,616 149.46 139.42 122.94 45,379,788 23,440,800 15,782,069�R� Accumulation Share Class (CHF HedgedClass) (b) CHF 4,799 101.02 — — 484,743 — —�R� Share Class USD 84,537 108.98 106.67 98.99 9,212,709 3,313,984 2,437,325�R� Share Class (GBP Hedged Class) GBP 68,545 102.85 102.01 96.69 7,049,796 5,825,451 3,846,364Emerging Markets Debt Blend PortfolioBase Accumulation Share Class USD 3,513 108.24 101.90 91.31 380,204 1,699,295 1,299,638Base Currency Share Class USD 15,634 80.43 79.03 74.61 1,257,434 4,033,017 2,104,342Other Currency Accumulation Share Class(EUR Partially Hedged Class) EUR 9,775 106.84 106.11 95.10 1,044,349 1,688,664 2,080,516Other Currency Share Class (EUR PartiallyHedged Class) EUR 1,716 78.65 81.56 77.14 134,938 110,905 99,603�E� Accumulation Share Class (EUR PartiallyHedged Class) EUR 7,013 103.13 102.93 92.72 723,269 553,875 131,873�I� Accumulation Share Class EUR 197,071 106.70 108.72 93.81 21,028,265 20,954,912 17,367,041�I� Accumulation Share Class USD 1,140,903 114.62 107.11 95.24 130,771,664 16,118,774 13,677,244�I� Accumulation Share Class (EUR PartiallyHedged Class) EUR 3,361,551 107.50 105.94 94.22 361,374,060 331,142,724 48,116,245�I� Accumulation Share Class (GBP PartiallyHedged Class) (b) GBP — — 125.33 113.16 — 196,527,322 125,831,220�I� Share Class USD 141 80.98 79.60 75.21 11,456 10,704 9,518�I� Share Class (GBP Partially Hedged Class) GBP 1,418 84.84 85.53 82.24 120,342 115,458 104,307�IO� Share Class (GBP Partially HedgedClass) GBP 3,302,258 104.37 99.65 — 344,659,299 328,369,218 —�R� Accumulation Share Class USD 100 114.09 106.67 94.90 11,409 10,667 9,490�R� Share Class USD 1,191 80.94 79.51 75.13 96,393 94,158 88,381�R� Share Class (GBP Partially Hedged Class) GBP 1,793 84.74 85.43 82.15 151,955 167,261 47,378Emerging Markets Debt Local PortfolioBase Accumulation Share Class USD 770,466 11.81 11.41 10.50 9,102,675 8,802,794 10,649,696Base Currency (Dis) (Monthly) Share Class USD 1,457 6.00 6.01 5.78 8,748 8,443 7,759Base Currency Share Class USD 148,595 6.29 6.36 6.20 935,389 944,564 984,423Other Currency Share Class GBP 32,331 7.53 7.89 7.79 243,587 255,680 251,639�A� Accumulation Share Class USD 168,858 11.42 11.06 10.20 1,928,927 2,042,425 2,055,246�A� Share Class USD 663,834 6.46 6.53 6.36 4,289,263 4,542,826 4,801,264�E� (Dis) (Quarterly) Share Class EUR 564,887 7.25 7.93 7.41 4,096,835 4,012,408 2,091,487�E� Accumulation Share Class EUR 345,333 12.77 13.48 12.06 4,409,637 5,735,085 4,944,137�E� Share Class EUR 402,077 7.31 8.06 7.62 2,940,073 4,790,433 5,721,857�I� (Dis) (Quarterly) Share Class EUR 4,578,872 7.63 8.35 7.80 34,930,307 36,455,800 31,589,723�I� Accumulation Share Class EUR 19,717,032 13.35 13.93 12.31 263,266,848 242,831,945 236,986,658�I� Accumulation Share Class GBP 723,103 12.12 12.02 11.09 8,761,389 105,996,185 125,926,945�I� Accumulation Share Class USD 31,652,619 13.29 12.71 11.58 420,630,084 531,792,789 631,976,539�I� Share Class USD 8,981,903 6.77 6.84 6.67 60,821,021 67,812,339 84,441,932�IO� (Dis) (Gross Monthly) Share Class USD 1,844,040 9.93 9.95 — 18,312,755 16,390,199 —�IO� Accumulation Share Class JPY 11,095,211 1,184.44 1,182.00 1,108.52 13,141,642,523 12,619,913,297 11,666,325,604�IO� Accumulation Share Class USD 3,191,415 14.62 13.89 12.56 46,670,991 42,378,751 203,507,719�IO� Share Class USD 1,409,186 6.94 7.01 6.85 9,780,141 9,288,795 36,367,927�IS� Share Class (b) EUR 10,365,153 11.21 — — 116,236,285 — —�IX� (Dis) (Cap Monthly) Share Class USD 191,306,626 1.94 2.17 2.30 371,539,627 455,473,215 410,957,558�IXO� (Dis) (Cap Monthly) Share Class USD 37,679,731 2.61 2.89 3.09 98,500,703 114,326,615 99,032,655�P� Accumulation Share Class USD 1,362,921 13.09 12.59 11.54 17,843,223 15,449,594 15,942,895�P� Share Class USD 178,457 7.67 7.74 7.55 1,368,018 2,051,026 3,858,005�R� Accumulation Share Class EUR 32,689 9.90 10.33 9.13 323,502 353,042 1,961,755�R� Accumulation Share Class USD 238,327 9.12 8.73 7.96 2,174,096 2,558,063 1,921,139�R� Share Class EUR 652 6.59 7.25 6.87 4,297 10,319 9,127�R� Share Class GBP 33,133 7.34 7.68 7.58 243,036 324,074 244,987�R� Share Class USD 233,504 6.08 6.14 5.99 1,418,561 264,039 367,647Emerging Markets Debt PortfolioBase Accumulation Share Class USD 7,934,251 24.47 23.01 20.46 194,133,779 226,014,510 272,450,111Base Accumulation Share Class (DurationHedged Class) USD 389,565 11.95 12.04 11.56 4,654,261 8,128,746 18,716,740Base Accumulation Share Class (EURHedged Class) EUR 7,000,440 17.72 17.02 15.61 124,055,979 729,208,030 428,658,957Base Currency (Dis) (Gross Monthly) ShareClass USD 1,312 9.11 9.06 8.61 11,960 11,237 9,991Base Currency (Dis) (Monthly) Share Class USD 18,561,496 10.62 10.41 9.75 197,212,610 251,802,447 252,531,018
Goldman Sachs FundsStatistical Information
As at 30 November 2020
42

OutstandingSharesas at
Net Asset Value per Shareas at(a) Net Assets as at(a)
Currency 30-Nov-20 30-Nov-20 30-Nov-19 30-Nov-18 30-Nov-20 30-Nov-19 30-Nov-18
Emerging Markets DebtPortfolio (Continued)Base Currency (Dis) (Stable Monthly) ShareClass USD 4,707,258 8.95 8.94 8.44 42,111,835 47,168,979 54,056,210Base Currency Share Class USD 5,407,150 14.32 14.20 13.36 77,455,877 84,388,529 89,426,341Base Currency Share Class (Duration HedgedClass) USD 430,891 8.05 8.56 8.70 3,470,424 7,168,413 11,668,009Other Currency (Dis) (Monthly) Share Class(EUR Hedged Class) EUR 655,134 8.39 8.40 8.11 5,499,064 4,349,601 2,704,091Other Currency (Dis) (Monthly) Share Class(HKD Hedged Class) HKD 514,141 91.36 89.28 84.18 46,971,824 60,032,202 63,430,985Other Currency (Dis) (Stable Monthly) ShareClass (SGD Hedged Class) SGD 7,831,407 8.71 8.76 8.34 68,201,174 86,469,774 80,642,078Other Currency Accumulation Share Class(CHF Hedged Class) CHF 521,051 11.38 10.96 10.09 5,928,649 4,925,370 3,412,462Other Currency Accumulation Share Class(EUR Hedged Class) (Duration Hedged Class) EUR 52,535 10.64 10.95 10.84 559,091 1,030,472 1,276,634Other Currency Share Class (EUR HedgedClass) EUR 1,611,900 8.92 9.05 8.81 14,385,139 19,730,119 24,517,751Other Currency Share Class (SGD HedgedClass) SGD 910,360 10.61 10.59 10.05 9,655,856 9,112,240 11,932,485�A� (Dis) (Monthly) Share Class USD 3,239,527 10.49 10.28 9.63 33,977,334 39,206,758 37,870,483�A� Accumulation Share Class USD 578,132 11.23 10.59 9.44 6,493,250 5,629,100 2,002,462�A� Accumulation Share Class (PLN HedgedClass) PLN 1,393,117 11.79 11.27 10.15 16,430,677 28,771,330 37,044,284�A� Share Class USD 2,403,951 16.96 16.80 15.81 40,761,484 50,379,386 49,167,634�B� Share Class (b) USD — — 16.61 15.59 — 1,029 966�E� (Dis) (Quarterly) Share Class (EURHedged Class) EUR 4,304,853 9.45 9.52 9.19 40,686,375 52,559,666 48,689,456�E� (Dis) (Quarterly) Share Class (EURHedged Class) (Duration Hedged Class) EUR 1,336,626 6.94 7.49 7.81 9,276,407 14,228,379 20,837,618�E� Accumulation Share Class EUR 6,314,348 26.33 27.13 23.53 166,232,355 169,953,368 115,485,682�E� Accumulation Share Class (EUR HedgedClass) EUR 8,722,241 13.45 12.99 11.97 117,322,857 119,040,518 95,129,394�E� Accumulation Share Class (EUR HedgedClass) (Duration Hedged Class) EUR 709,946 10.16 10.50 10.45 7,210,473 12,465,388 17,650,524�I� (Dis) (Gross Quarterly) Share Class (EURHedged Class) EUR 49,940 8.23 8.34 8.28 410,789 2,081,015 50,415,985�I� (Dis) (Quarterly) Share Class GBP 9,045 9.34 9.54 9.06 84,499 3,240,561 18,520,956�I� (Dis) (Quarterly) Share Class (CHF HedgedClass) CHF 5,684,601 8.43 8.51 8.26 47,945,103 142,015,357 122,385,095�I� Accumulation Share Class USD 50,915,753 17.60 16.46 14.55 896,239,481 1,185,473,634 1,193,911,248�I� Accumulation Share Class (CHF HedgedClass) CHF 944,145 11.66 11.17 10.23 11,009,499 16,381,764 43,155,023�I� Accumulation Share Class (DurationHedged Class) EUR 944 10.56 11.54 10.68 9,973 10,893 10,086�I� Accumulation Share Class (EUR HedgedClass) EUR 37,432,316 21.22 20.27 18.47 794,218,740 799,549,687 759,734,489�I� Accumulation Share Class (EUR HedgedClass) (Duration Hedged Class) EUR 133,035 9.89 10.12 9.96 1,315,605 2,343,524 2,426,803�I� Accumulation Share Class (JPY HedgedClass) JPY 12,801 1,054.94 1,005.80 915.02 13,504,202 12,875,151 13,242,031�I� Share Class EUR 285,142 9.71 10.49 9.59 2,768,259 7,017,659 5,679,017�I� Share Class USD 5,924,303 18.00 17.84 16.79 106,648,699 180,274,766 323,341,510�I� Share Class (Duration Hedged Class) USD 195,613 8.89 9.46 9.67 1,739,065 1,849,631 1,892,254�I� Share Class (EUR Hedged Class) EUR 23,441,542 9.14 9.27 9.03 214,302,442 597,799,078 650,197,269�I� Share Class (EUR Hedged Class) (DurationHedged Class) EUR 4,080 7.33 7.97 8.38 29,909 3,613,251 7,804,241�I� Share Class (GBP Hedged Class) GBP 12,690,882 10.70 10.76 10.36 135,790,686 203,509,043 111,848,230�I� Share Class (GBP Hedged Class) (DurationHedged Class) GBP 4,302 7.55 8.15 8.50 32,492 33,086 32,164�IO� (Dis) (Gross Monthly) Share Class USD 1,636,130 10.20 10.00 — 16,681,460 15,008,443 —�IO� Accumulation Share Class GBP 65,639,210 11.42 10.99 9.76 749,600,614 100,822,565 139,269,394�IO� Accumulation Share Class JPY 2,225,507 1,218.43 1,188.21 1,081.07 2,711,625,328 2,666,727,674 2,441,600,743�IO� Accumulation Share Class USD 5,663,266 24.88 23.09 20.27 140,920,574 267,677,857 248,297,536�IO� Accumulation Share Class (EUR HedgedClass) EUR 3,201,762 11.46 10.86 9.83 36,688,928 31,257,397 27,792,246�IO� Accumulation Share Class (GBP HedgedClass) GBP 520,718 22.36 21.08 18.83 11,642,607 6,331,755 12,645,834�IO� Accumulation Share Class (JPY HedgedClass) JPY 4,854,657 1,097.60 1,038.65 937.85 5,328,481,265 11,960,074,118 11,801,569,893�IO� Share Class USD 2,917,861 12.68 12.57 11.84 37,012,526 46,339,535 68,655,759�IS� (Dis) (Quarterly) Share Class (EURHedged Class) EUR 4,096,884 8.58 8.65 8.35 35,144,345 522,360,990 447,495,229�IS� Accumulation Share Class USD 3,282,394 11.31 10.54 9.30 37,128,576 33,719,932 196,227,804�IS� Accumulation Share Class (CHF HedgedClass) CHF 122,199 10.36 9.89 — 1,265,546 2,416,167 —�IS� Accumulation Share Class (EUR HedgedClass) EUR 33,411,681 10.44 9.93 9.04 348,712,067 47,260,514 107,064,430�IS� Share Class USD 21,967,367 10.56 9.94 — 231,901,986 185,643,274 —�IS� Share Class (EUR Hedged Class) EUR 2,951,884 10.30 9.90 — 30,395,626 52,356,353 —�IS� Share Class (GBP Hedged Class) GBP 21,821,118 9.48 9.53 9.14 206,790,699 235,928,705 10,387,518�IX� (Dis) (Cap Monthly) Share Class USD 899,878 4.47 4.81 4.91 4,023,717 4,731,045 4,834,242�P� Accumulation Share Class USD 138,979 11.38 10.68 9.47 1,582,167 1,119,961 539,814�P� Share Class USD 3,464 9.87 9.78 9.19 34,188 11,670 56,095
Goldman Sachs FundsStatistical Information
As at 30 November 2020
43
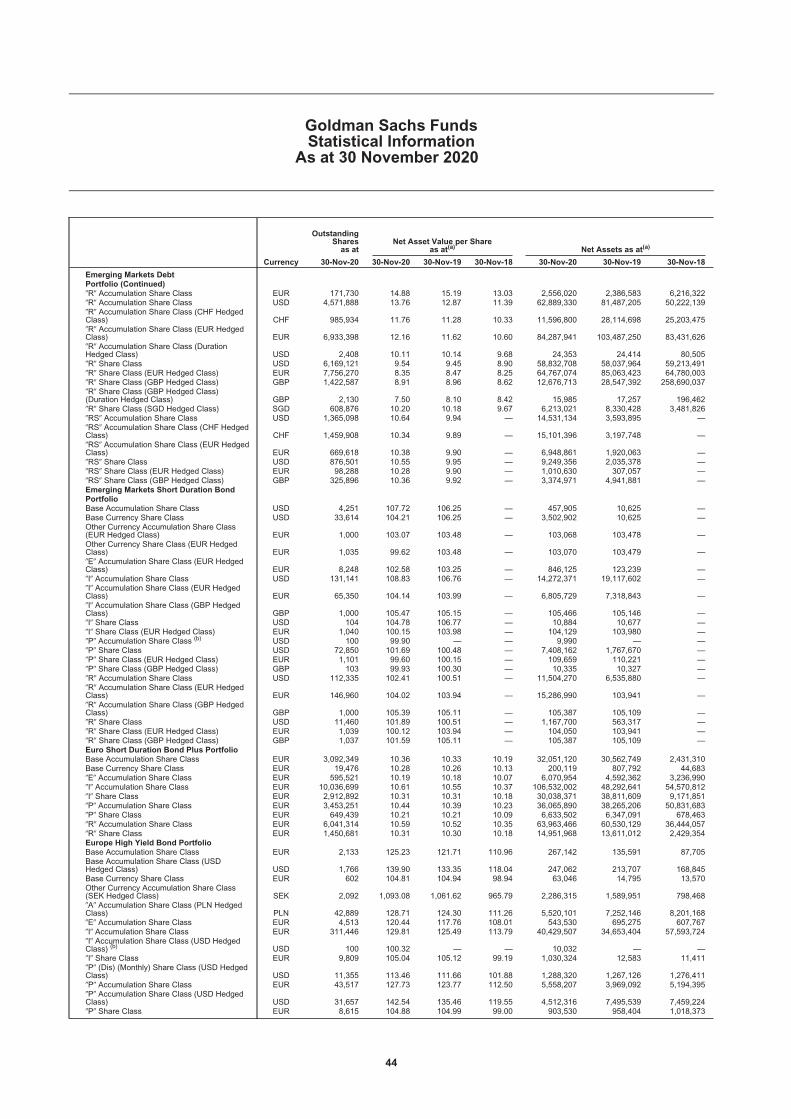
OutstandingSharesas at
Net Asset Value per Shareas at(a) Net Assets as at(a)
Currency 30-Nov-20 30-Nov-20 30-Nov-19 30-Nov-18 30-Nov-20 30-Nov-19 30-Nov-18
Emerging Markets DebtPortfolio (Continued)�R� Accumulation Share Class EUR 171,730 14.88 15.19 13.03 2,556,020 2,386,583 6,216,322�R� Accumulation Share Class USD 4,571,888 13.76 12.87 11.39 62,889,330 81,487,205 50,222,139�R� Accumulation Share Class (CHF HedgedClass) CHF 985,934 11.76 11.28 10.33 11,596,800 28,114,698 25,203,475�R� Accumulation Share Class (EUR HedgedClass) EUR 6,933,398 12.16 11.62 10.60 84,287,941 103,487,250 83,431,626�R� Accumulation Share Class (DurationHedged Class) USD 2,408 10.11 10.14 9.68 24,353 24,414 80,505�R� Share Class USD 6,169,121 9.54 9.45 8.90 58,832,708 58,037,964 59,213,491�R� Share Class (EUR Hedged Class) EUR 7,756,270 8.35 8.47 8.25 64,767,074 85,063,423 64,780,003�R� Share Class (GBP Hedged Class) GBP 1,422,587 8.91 8.96 8.62 12,676,713 28,547,392 258,690,037�R� Share Class (GBP Hedged Class)(Duration Hedged Class) GBP 2,130 7.50 8.10 8.42 15,985 17,257 196,462�R� Share Class (SGD Hedged Class) SGD 608,876 10.20 10.18 9.67 6,213,021 8,330,428 3,481,826�RS� Accumulation Share Class USD 1,365,098 10.64 9.94 — 14,531,134 3,593,895 —�RS� Accumulation Share Class (CHF HedgedClass) CHF 1,459,908 10.34 9.89 — 15,101,396 3,197,748 —�RS� Accumulation Share Class (EUR HedgedClass) EUR 669,618 10.38 9.90 — 6,948,861 1,920,063 —�RS� Share Class USD 876,501 10.55 9.95 — 9,249,356 2,035,378 —�RS� Share Class (EUR Hedged Class) EUR 98,288 10.28 9.90 — 1,010,630 307,057 —�RS� Share Class (GBP Hedged Class) GBP 325,896 10.36 9.92 — 3,374,971 4,941,881 —Emerging Markets Short Duration BondPortfolioBase Accumulation Share Class USD 4,251 107.72 106.25 — 457,905 10,625 —Base Currency Share Class USD 33,614 104.21 106.25 — 3,502,902 10,625 —Other Currency Accumulation Share Class(EUR Hedged Class) EUR 1,000 103.07 103.48 — 103,068 103,478 —Other Currency Share Class (EUR HedgedClass) EUR 1,035 99.62 103.48 — 103,070 103,479 —�E� Accumulation Share Class (EUR HedgedClass) EUR 8,248 102.58 103.25 — 846,125 123,239 —�I� Accumulation Share Class USD 131,141 108.83 106.76 — 14,272,371 19,117,602 —�I� Accumulation Share Class (EUR HedgedClass) EUR 65,350 104.14 103.99 — 6,805,729 7,318,843 —�I� Accumulation Share Class (GBP HedgedClass) GBP 1,000 105.47 105.15 — 105,466 105,146 —�I� Share Class USD 104 104.78 106.77 — 10,884 10,677 —�I� Share Class (EUR Hedged Class) EUR 1,040 100.15 103.98 — 104,129 103,980 —�P� Accumulation Share Class (b) USD 100 99.90 — — 9,990 — —�P� Share Class USD 72,850 101.69 100.48 — 7,408,162 1,767,670 —�P� Share Class (EUR Hedged Class) EUR 1,101 99.60 100.15 — 109,659 110,221 —�P� Share Class (GBP Hedged Class) GBP 103 99.93 100.30 — 10,335 10,327 —�R� Accumulation Share Class USD 112,335 102.41 100.51 — 11,504,270 6,535,880 —�R� Accumulation Share Class (EUR HedgedClass) EUR 146,960 104.02 103.94 — 15,286,990 103,941 —�R� Accumulation Share Class (GBP HedgedClass) GBP 1,000 105.39 105.11 — 105,387 105,109 —�R� Share Class USD 11,460 101.89 100.51 — 1,167,700 563,317 —�R� Share Class (EUR Hedged Class) EUR 1,039 100.12 103.94 — 104,050 103,941 —�R� Share Class (GBP Hedged Class) GBP 1,037 101.59 105.11 — 105,387 105,109 —Euro Short Duration Bond Plus PortfolioBase Accumulation Share Class EUR 3,092,349 10.36 10.33 10.19 32,051,120 30,562,749 2,431,310Base Currency Share Class EUR 19,476 10.28 10.26 10.13 200,119 807,792 44,683�E� Accumulation Share Class EUR 595,521 10.19 10.18 10.07 6,070,954 4,592,362 3,236,990�I� Accumulation Share Class EUR 10,036,699 10.61 10.55 10.37 106,532,002 48,292,641 54,570,812�I� Share Class EUR 2,912,892 10.31 10.31 10.18 30,038,371 38,811,609 9,171,851�P� Accumulation Share Class EUR 3,453,251 10.44 10.39 10.23 36,065,890 38,265,206 50,831,683�P� Share Class EUR 649,439 10.21 10.21 10.09 6,633,502 6,347,091 678,463�R� Accumulation Share Class EUR 6,041,314 10.59 10.52 10.35 63,963,466 60,530,129 36,444,057�R� Share Class EUR 1,450,681 10.31 10.30 10.18 14,951,968 13,611,012 2,429,354Europe High Yield Bond PortfolioBase Accumulation Share Class EUR 2,133 125.23 121.71 110.96 267,142 135,591 87,705Base Accumulation Share Class (USDHedged Class) USD 1,766 139.90 133.35 118.04 247,062 213,707 168,845Base Currency Share Class EUR 602 104.81 104.94 98.94 63,046 14,795 13,570Other Currency Accumulation Share Class(SEK Hedged Class) SEK 2,092 1,093.08 1,061.62 965.79 2,286,315 1,589,951 798,468�A� Accumulation Share Class (PLN HedgedClass) PLN 42,889 128.71 124.30 111.26 5,520,101 7,252,146 8,201,168�E� Accumulation Share Class EUR 4,513 120.44 117.76 108.01 543,530 695,275 607,767�I� Accumulation Share Class EUR 311,446 129.81 125.49 113.79 40,429,507 34,653,404 57,593,724�I� Accumulation Share Class (USD HedgedClass) (b) USD 100 100.32 — — 10,032 — —�I� Share Class EUR 9,809 105.04 105.12 99.19 1,030,324 12,583 11,411�P� (Dis) (Monthly) Share Class (USD HedgedClass) USD 11,355 113.46 111.66 101.88 1,288,320 1,267,126 1,276,411�P� Accumulation Share Class EUR 43,517 127.73 123.77 112.50 5,558,207 3,969,092 5,194,395�P� Accumulation Share Class (USD HedgedClass) USD 31,657 142.54 135.46 119.55 4,512,316 7,495,539 7,459,224�P� Share Class EUR 8,615 104.88 104.99 99.00 903,530 958,404 1,018,373
Goldman Sachs FundsStatistical Information
As at 30 November 2020
44

OutstandingSharesas at
Net Asset Value per Shareas at(a) Net Assets as at(a)
Currency 30-Nov-20 30-Nov-20 30-Nov-19 30-Nov-18 30-Nov-20 30-Nov-19 30-Nov-18
Europe High Yield BondPortfolio (Continued)�R� Accumulation Share Class EUR 46,599 129.28 125.02 113.41 6,024,195 7,304,200 11,668,511�R� Share Class EUR 16,104 105.36 105.47 99.48 1,696,669 708,024 11,354�R� Share Class (GBP Hedged Class) GBP 3,498 110.52 110.32 102.83 386,611 2,002,080 1,026,832Global Credit Portfolio (Hedged)Base Accumulation Share Class USD 1,188,708 18.38 16.60 14.44 21,847,226 14,875,948 3,029,510Base Currency Share Class USD 259,903 12.84 11.85 10.55 3,337,002 2,952,365 2,591,760Other Currency Accumulation Share Class(SEK Hedged Class) SEK 12,850 123.34 113.33 101.38 1,584,977 751,406 672,183�A� Share Class USD 182,950 12.91 11.92 10.61 2,360,985 382,680 109,877�E� Accumulation Share Class (EUR HedgedClass) EUR 2,186,847 17.68 16.30 14.65 38,673,973 20,359,576 11,376,659�I� (Dis) (Quarterly) Share Class (DurationHedged Class) USD 13,765 10.20 9.85 9.37 140,468 135,310 128,385�I� Accumulation Share Class USD 15,626,006 16.20 14.54 12.56 253,195,050 85,968,559 27,401,178�I� Accumulation Share Class (CHF HedgedClass) CHF 4,947,472 15.17 13.92 12.44 75,059,367 58,112,361 39,617,899�I� Accumulation Share Class (EUR HedgedClass) EUR 15,447,985 17.43 15.92 14.18 269,213,254 181,898,651 107,589,069�I� Accumulation Share Class (EUR HedgedClass) (Duration Hedged Class) EUR 2,189 11.20 10.72 10.19 24,521 23,557 39,110�I� Accumulation Share Class (GBP HedgedClass) (Duration Hedged Class) GBP 71,926 11.75 11.19 10.51 845,084 3,381,496 5,111,608�I� Share Class (GBP Hedged Class) GBP 404,960 11.69 10.92 9.91 4,732,103 3,956,129 21,110,041�IO� Accumulation Share Class USD 11,451,793 15.77 14.09 12.12 180,574,726 153,733,268 117,254,595�IO� Accumulation Share Class (GBP HedgedClass) (Duration Hedged Class) GBP 747,096 11.69 11.09 10.37 8,732,882 8,282,453 7,750,143�IO� Accumulation Share Class (JPY HedgedClass) (b) JPY — — 1,088.31 965.12 — 908,867,969 498,786,176�IO� Share Class USD 10,670,653 12.24 11.30 10.06 130,659,990 140,132,131 77,985,005�IXO� (Dis) (Cap Monthly) Share Class USD 3,456,773 8.91 8.92 8.61 30,811,259 17,468,685 13,549,809�P� Accumulation Share Class USD 2,357,231 19.40 17.43 15.08 45,736,833 28,110,866 24,402,145�P� Accumulation Share Class (DurationHedged Class) USD 3,562,359 12.38 11.65 10.76 44,089,870 46,662,905 76,151,000�P� Accumulation Share Class (EUR HedgedClass) EUR 935,272 19.71 18.03 16.08 18,433,049 15,902,164 17,064,037�P� Accumulation Share Class (EUR HedgedClass) (Duration Hedged Class) EUR 372,757 10.95 10.50 10.00 4,083,295 4,226,148 5,847,403�P� Share Class USD 1,062,272 14.00 12.93 11.51 14,873,616 7,629,588 4,112,784�P� Share Class (EUR Hedged Class) EUR 40,086 10.85 10.21 9.38 434,990 1,311,090 1,464,505�P� Share Class (GBP Hedged Class) GBP 195,036 10.40 9.71 10.63 2,027,765 3,558,527 91,763�R� Accumulation Share Class USD 1,837,902 15.01 13.47 11.65 27,585,954 14,390,571 17,544,579�R� Accumulation Share Class (EUR HedgedClass) EUR 719,289 13.42 12.27 10.93 9,656,335 16,585,603 14,220,695�R� Accumulation Share Class (EUR HedgedClass) (Duration Hedged Class) EUR 2,551,103 11.14 10.66 10.15 28,412,542 33,272,359 43,320,802�R� Accumulation Share Class (GBP HedgedClass) GBP 84,113 12.12 11.02 9.69 1,019,791 473,153 416,185�R� Accumulation Share Class (DurationHedged Class) USD 455,917 12.29 11.55 10.67 5,601,659 7,290,106 8,412,051�R� Share Class USD 3,108,944 12.43 11.47 10.21 38,633,816 33,231,454 25,720,361�R� Share Class (EUR Hedged Class) EUR 344,264 10.82 10.18 9.35 3,723,770 5,429,665 4,449,349�R� Share Class (GBP Hedged Class) GBP 615,621 11.77 11.00 9.98 7,246,590 4,772,107 5,170,880�R� Share Class (GBP Hedged Class)(Duration Hedged Class) GBP 377,613 9.85 9.65 9.38 3,720,480 6,326,749 12,775,430Global ESG Enhanced Income BondPortfolio(b)
Base Accumulation Share Class (b) USD 100 103.52 — — 10,352 — —Base Currency (Dis) (Gross Monthly) ShareClass (b) USD 100 102.74 — — 10,274 — —Base Currency (Dis) (Monthly) Share Class (b) USD 100 103.06 — — 10,331 — —Base Currency (Dis) (Stable Monthly) ShareClass (b) USD 100 103.18 — — 10,318 — —Other Currency (Dis) (Gross Monthly) ShareClass (AUD Hedged Class)(b) AUD 1,412 102.73 — — 145,061 — —Other Currency (Dis) (Gross Monthly) ShareClass (b) HKD 775 102.76 — — 79,642 — —Other Currency (Dis) (Monthly) Share Class(EUR Hedged Class)(b) EUR 1,002 102.89 — — 103,141 — —Other Currency (Dis) (Stable Monthly) ShareClass (SGD Hedged Class)(b) SGD 1,358 103.16 — — 140,129 — —Other Currency Accumulation Share Class(EUR Hedged Class) (b) EUR 1,000 103.34 — — 103,339 — —�E� (Dis) (Gross Quarterly) Share Class (EURHedged Class) (b) EUR 85 102.62 — — 8,691 — —�E� Accumulation Share Class (EUR HedgedClass) (b) EUR 1,000 103.23 — — 103,233 — —�I� (Dis) (Monthly) Share Class (b) USD 100 103.06 — — 10,338 — —�I� Accumulation Share Class (b) USD 190,659 103.62 — — 19,755,707 — —�I� Accumulation Share Class (EUR HedgedClass) (b) EUR 85 103.28 — — 8,747 — —�P� (Dis) (Monthly) Share Class (b) USD 100 103.06 — — 10,335 — —�P� Accumulation Share Class (b) USD 100 103.57 — — 10,357 — —
Goldman Sachs FundsStatistical Information
As at 30 November 2020
45

OutstandingSharesas at
Net Asset Value per Shareas at(a) Net Assets as at(a)
Currency 30-Nov-20 30-Nov-20 30-Nov-19 30-Nov-18 30-Nov-20 30-Nov-19 30-Nov-18
Global ESG Enhanced Income BondPortfolio(b) (Continued)�R� (Dis) (Monthly) Share Class (b) USD 100 103.06 — — 10,337 — —�R� (Dis) (Monthly) Share Class (GBP HedgedClass) (b) GBP 1,003 103.00 — — 103,311 — —�R� Accumulation Share Class (b) USD 100 103.61 — — 10,361 — —�R� Accumulation Share Class (GBP HedgedClass) (b) GBP 1,000 103.55 — — 103,549 — —Global Fixed Income PortfolioBase Accumulation Share Class USD 1,159,722 17.30 15.50 14.24 20,059,161 11,332,209 5,113,886Base Currency Share Class USD 73,669 18.28 16.63 15.47 1,346,797 1,038,164 1,118,673�A� Share Class USD 1,323,725 14.23 12.94 12.04 18,837,386 16,765,839 15,759,795�B� Share Class USD 119 14.27 12.97 12.09 1,703 1,545 1,439�E� Accumulation Share Class EUR 783,299 8.22 8.05 7.19 6,435,752 3,053,465 1,265,702�I� Accumulation Share Class EUR 773,853 19.55 18.99 16.81 15,126,910 9,494,437 7,768,091�I� Share Class USD 3,043,003 15.40 14.00 13.03 46,856,556 45,731,909 42,453,937�IO� Accumulation Share Class USD 1,796,997 17.74 15.74 14.31 31,879,593 19,911,165 15,414,894�P� Accumulation Share Class USD 747,951 15.74 14.02 12.80 11,772,127 7,942,751 8,451,706�P� Share Class USD 838,851 12.21 11.11 10.34 10,245,806 2,280,050 3,644,956�R� Accumulation Share Class USD 392,044 12.33 10.98 10.02 4,835,796 2,054,064 1,311,800�R� Share Class USD 378,178 10.75 9.77 9.09 4,064,595 2,506,249 3,743,981Global Fixed Income Portfolio (Hedged)Base Accumulation Share Class EUR 6,037,047 15.23 14.17 13.21 91,971,663 39,916,563 5,659,783Base Currency Share Class EUR 180,819 12.28 11.55 10.89 2,220,164 98,202 97,913�E� Accumulation Share Class EUR 697,173 14.67 13.68 12.78 10,227,564 1,071,912 763,807�I� Accumulation Share Class EUR 15,368,364 16.15 14.91 13.80 248,160,885 70,911,416 12,903,052�I� Accumulation Share Class (NOK HedgedClass) NOK 5,097,380 119.98 109.68 99.65 611,564,389 468,255,745 400,620,165�I� Accumulation Share Class (USD HedgedClass) USD 3,893,508 12.28 11.15 10.02 47,793,513 1,014,016 10,018�I� Share Class EUR 15,698,369 5.77 5.43 5.12 90,539,386 57,883,621 40,370,559�IO� Accumulation Share Class (GBP HedgedClass) GBP 783 11.22 10.24 — 8,784 8,017 —�IO� Accumulation Share Class (USD HedgedClass) USD 18,220,995 14.59 13.21 11.82 265,882,592 167,486,378 69,192�IO� Share Class (USD Hedged Class) USD 3,233,369 12.38 11.45 10.47 40,031,999 43,833,303 60,075,529�IXO� (Dis) (Cap Monthly) Share Class (USDHedged Class) USD 4,486,726 7.67 7.68 7.63 34,425,385 29,402,166 32,345,954�P� Accumulation Share Class EUR 2,521,537 15.76 14.56 13.49 39,736,784 22,685,236 22,691,913�P� Accumulation Share Class (CHF HedgedClass) CHF 520,889 12.28 11.38 10.59 6,397,398 5,334,242 9,748,524�P� Accumulation Share Class (USD HedgedClass) (b) USD 693,796 10.21 — — 7,083,233 — —�P� Share Class EUR 175,132 12.96 12.19 11.49 2,268,988 2,174,413 2,133,729�P� Share Class (GBP Hedged Class) GBP 231,824 12.91 12.04 11.21 2,993,176 7,709,213 6,817,737�P� Share Class (USD Hedged Class) USD 1,332,001 13.44 12.44 11.38 17,905,075 3,241,856 5,280,536�R� Accumulation Share Class EUR 1,649,991 12.66 11.70 10.83 20,890,503 11,745,015 9,995,899�R� Accumulation Share Class (USD HedgedClass) USD 1,519,269 13.32 12.11 10.88 20,241,332 10,387,375 6,498,179�R� Share Class EUR 445,617 11.24 10.58 9.97 5,009,258 4,197,514 2,712,306�R� Share Class (CHF Hedged Class) CHF 503,863 10.90 10.29 9.74 5,494,400 3,608,407 6,425,306�R� Share Class (GBP Hedged Class) GBP 7,676,565 12.01 11.21 10.44 92,213,402 53,546,010 48,790,175�R� Share Class (USD Hedged Class) USD 1,586,641 12.58 11.63 10.64 19,952,221 18,809,716 21,110,689Global High Yield PortfolioBase Accumulation Share Class USD 5,227,616 22.78 21.54 19.69 119,081,460 143,761,529 120,352,677Base Accumulation Share Class (DurationHedged Class) USD 2,829,470 13.34 13.09 12.44 37,748,344 56,046,244 78,241,150Base Accumulation Share Class (SEK HedgedClass) SEK 154,755 151.55 145.91 137.28 23,453,783 31,183,015 27,068,087Base Currency (Dis) (Gross Monthly) ShareClass USD 1,652 9.45 9.49 9.25 15,615 14,763 13,484Base Currency (Dis) (Monthly) Share Class USD 1,736,045 9.53 9.44 9.10 16,539,017 18,261,256 28,722,771Base Currency (Dis) (Monthly) Share Class(Duration Hedged Class) USD 793,237 8.27 8.51 8.52 6,561,909 12,538,280 21,962,578Base Currency Share Class USD 6,508,330 8.07 8.04 7.74 52,531,532 77,180,639 84,142,838Base Currency Share Class (Duration HedgedClass) USD 1,404,303 8.57 8.87 8.87 12,035,625 16,869,756 31,454,803Other Currency (Dis) (Gross Monthly) ShareClass HKD 892 100.77 102.11 — 89,874 85,801 —Other Currency (Dis) (Monthly) Share Class(AUD Hedged Class) AUD 306,346 9.55 9.59 9.31 2,924,430 2,838,630 2,756,479Other Currency (Dis) (Monthly) Share Class(HKD Hedged Class) (Duration Hedged Class) HKD 12,821 81.34 82.88 83.54 1,042,874 43,425,837 44,618,489Other Currency (Dis) (Quarterly) Share Class(CHF Hedged Class) (Duration Hedged Class) CHF 46,850 7.33 7.72 8.00 343,418 465,987 477,183Other Currency (Dis) (Quarterly) Share Class(SGD Hedged Class) (Duration Hedged Class) SGD 119,481 8.30 8.61 8.69 991,320 1,114,657 5,314,021Other Currency Accumulation Share Class(CHF Hedged Class) (Duration Hedged Class) CHF 43,641 10.35 10.39 10.20 451,872 678,680 751,898Other Currency Accumulation Share Class(EUR Hedged Class) EUR 2,495,838 27.67 26.66 25.12 69,049,602 74,510,534 72,002,762Other Currency Accumulation Share Class(EUR Hedged Class) (Duration Hedged Class) EUR 212,109 11.92 11.91 11.66 2,527,542 4,724,045 8,126,427
Goldman Sachs FundsStatistical Information
As at 30 November 2020
46

OutstandingSharesas at
Net Asset Value per Shareas at(a) Net Assets as at(a)
Currency 30-Nov-20 30-Nov-20 30-Nov-19 30-Nov-18 30-Nov-20 30-Nov-19 30-Nov-18
Global High Yield Portfolio (Continued)Other Currency Share Class (CHF HedgedClass) CHF 173,586 8.31 8.47 8.45 1,442,116 1,604,587 1,948,501Other Currency Share Class (GBP HedgedClass) GBP 374,352 10.49 10.59 10.42 3,928,146 4,649,242 6,054,233�A� (Dis) (Monthly) Share Class USD 413,044 9.45 9.38 9.03 3,903,426 8,764,851 6,392,388�A� Share Class USD 2,973,542 9.76 9.72 9.36 29,029,163 45,480,483 56,889,745�B� Share Class USD 3,817 5.87 5.85 5.63 22,418 22,333 21,490�E� (Dis) (Quarterly) Share Class (EURHedged Class) EUR 1,435,876 8.60 8.70 8.64 12,342,389 14,491,492 16,006,851�E� (Dis) (Quarterly) Share Class (EURHedged Class) (Duration Hedged Class) EUR 891,868 7.47 7.85 8.11 6,664,689 9,091,823 10,882,739�E� Accumulation Share Class EUR 610,683 30.72 31.83 28.37 18,758,337 23,475,448 24,249,633�E� Accumulation Share Class (EUR HedgedClass) EUR 1,359,849 14.92 14.44 13.68 20,286,848 24,440,475 28,455,441�E� Accumulation Share Class (EUR HedgedClass) (Duration Hedged Class) EUR 365,123 11.39 11.45 11.27 4,160,444 6,161,407 7,803,671�E� Share Class (EUR Hedged Class) EUR 6,488,907 6.11 6.21 6.18 39,663,211 45,103,537 46,417,577�G� Share Class USD 237,007 11.11 11.06 — 2,633,467 2,462,764 —�I� (Dis) (Monthly) Share Class USD 40,539,709 9.16 9.08 8.75 371,400,970 263,639,579 253,495,473�I� (Dis) (Monthly) Share Class (EUR HedgedClass) EUR 1,176 9.10 9.19 9.13 10,705 10,249 131,998,352�I� Accumulation Share Class USD 14,522,088 21.88 20.58 18.70 317,779,417 129,917,844 155,765,011�I� Accumulation Share Class (DurationHedged Class) USD 40,698 15.18 14.82 14.00 617,850 7,144,984 7,148,557�I� Accumulation Share Class (EUR HedgedClass) EUR 1,936,407 18.96 18.16 17.02 36,723,612 58,871,497 81,054,364�I� Accumulation Share Class (GBP HedgedClass) GBP 11,905 23.64 22.56 20.87 281,466 258,902 239,538�I� Share Class EUR 11,450,473 10.96 11.90 11.12 125,509,885 136,463,206 127,188,401�I� Share Class USD 22,764,577 10.34 10.29 9.91 235,272,187 281,462,195 199,410,193�I� Share Class (EUR Hedged Class) EUR 762,357 10.83 11.01 10.96 8,258,454 8,786,070 10,177,830�I� Share Class (GBP Hedged Class) GBP 186,208 9.02 9.10 8.96 1,679,406 997,534 2,654,876�I� Share Class (GBP Hedged Class) (DurationHedged Class) GBP 54 8.10 8.48 8.70 434 112,738 108,510�IO� (Dis) (Quarterly) Share Class (AUDHedged Class) AUD 15,689 9.91 10.00 9.72 155,458 147,279 134,101�IO� Accumulation Share Class USD 11,064,810 23.22 21.70 19.61 256,922,948 253,700,791 183,760,218�IO� Accumulation Share Class (EUR HedgedClass) EUR 2,932,059 20.83 19.83 18.47 61,068,891 87,759,303 75,729,758�IO� Accumulation Share Class (GBP HedgedClass) GBP 821,325 21.68 20.56 18.91 17,807,539 10,254,648 16,457,948�IO� Accumulation Share Class (JPY HedgedClass) JPY 54,829,265 1,184.58 1,127.83 1,048.09 64,949,418,791 63,659,397,441 57,959,584,075�IO� Share Class USD 4,179,305 8.55 8.52 8.20 35,742,387 50,999,627 82,623,358�IS� Accumulation Share Class USD 7,598,340 13.22 12.41 11.27 100,420,832 93,571,680 58,835,164�IS� Accumulation Share Class (CHF HedgedClass) CHF 133,470 11.42 10.97 10.30 1,524,300 5,793,501 4,659,321�IS� Accumulation Share Class (EUR HedgedClass) EUR 1,563,635 11.82 11.31 10.58 18,485,860 16,993,805 64,114,727�IS� Accumulation Share Class (GBP HedgedClass) GBP 957 12.44 11.86 10.96 11,911 123,083 113,735�IS� Share Class USD 8,289,169 9.61 9.57 9.22 79,660,389 76,967,278 70,408,144�IS� Share Class (GBP Hedged Class) GBP 4,415,093 9.08 9.17 9.03 40,091,686 56,240,796 581,688�P� Accumulation Share Class USD 1,010 11.72 11.05 10.08 11,833 26,206 10,176�P� Share Class USD 11,661 10.20 10.16 9.79 118,988 112,281 10,176�R� (Dis) (Monthly) Share Class (AUD HedgedClass) AUD 31,839 10.01 10.06 9.76 318,655 438,311 386,918�R� Accumulation Share Class USD 2,833,446 14.78 13.91 12.65 41,879,813 58,771,266 57,328,289�R� Accumulation Share Class (CHF HedgedClass) CHF 58,812 11.80 11.35 10.68 693,874 208,154 176,635�R� Accumulation Share Class (CHF HedgedClass) (Duration Hedged Class) CHF 101,417 10.75 10.73 10.49 1,090,022 1,306,387 1,883,616�R� Accumulation Share Class (EUR HedgedClass) EUR 3,461,550 13.15 12.60 11.82 45,512,806 64,290,361 67,730,342�R� Accumulation Share Class (EUR HedgedClass) (Duration Hedged Class) EUR 247,512 11.35 11.29 11.00 2,809,304 5,110,677 7,028,907�R� Accumulation Share Class (SEK HedgedClass) SEK 10,442 118.81 113.81 106.54 1,240,579 2,024,097 2,091,877�R� Accumulation Share Class (DurationHedged Class) USD 47,779 11.94 11.67 11.03 570,652 2,224,220 2,291,501�R� Share Class USD 1,911,055 9.97 9.93 9.56 19,054,987 42,494,547 43,576,546�R� Share Class (CHF Hedged Class) CHF 793,140 8.59 8.76 8.74 6,815,057 7,897,056 6,153,005�R� Share Class (EUR Hedged Class) EUR 896,066 8.80 8.94 8.90 7,884,299 11,521,290 15,860,922�R� Share Class (GBP Hedged Class) GBP 1,796,476 9.34 9.43 9.28 16,778,910 83,950,910 138,571,177�R� Share Class (Duration Hedged Class) USD 730,852 8.58 8.88 8.88 6,273,122 11,723,653 17,737,803Global Sovereign Bond PortfolioBase Accumulation Share Class USD 2,665 117.94 109.88 99.88 314,302 274,379 174,398Base Currency Share Class USD 977 111.26 104.68 96.27 108,675 53,413 5,302�I� Accumulation Share Class USD 28,188 122.26 113.20 102.23 3,446,245 11,320 10,223�I� Accumulation Share Class (EUR PartiallyHedged Class) EUR 754,063 111.19 109.11 97.97 83,840,685 78,754,401 44,037,927�I� Accumulation Share Class (GBP PartiallyHedged Class) GBP 2,743,669 134.22 127.34 116.70 368,257,259 552,023,818 501,187,252
Goldman Sachs FundsStatistical Information
As at 30 November 2020
47

OutstandingSharesas at
Net Asset Value per Shareas at(a) Net Assets as at(a)
Currency 30-Nov-20 30-Nov-20 30-Nov-19 30-Nov-18 30-Nov-20 30-Nov-19 30-Nov-18
Global Sovereign BondPortfolio (Continued)�I� Share Class USD 213 112.02 105.39 96.97 23,862 6,640 5,998�I� Share Class (GBP Partially Hedged Class) GBP 99 125.15 120.57 112.63 12,427 11,788 10,808Short Duration Opportunistic CorporateBond PortfolioBase Accumulation Share Class USD 9,914 135.01 128.16 120.42 1,338,453 2,490,205 2,640,957Base Currency (Dis) (Quarterly) Share Class USD 127 104.93 103.16 100.48 13,316 12,641 11,878Base Currency Share Class USD 12,853 106.59 104.70 101.93 1,369,987 2,730,607 3,231,659Other Currency (Dis) (Quarterly) Share Class(EUR Hedged Class) EUR 90 92.68 92.73 93.14 8,349 3,891 3,767Other Currency Accumulation Share Class(EUR Hedged Class) EUR 210 120.62 116.45 112.78 25,284 172,307 34,445�A� (Dis) (Quarterly) Share Class USD 9,422 103.57 101.80 99.14 975,787 919,265 594,300�E� (Dis) (Quarterly) Share Class (EURHedged Class) EUR 4,609 90.66 90.69 91.05 417,852 429,048 562,789�E� Accumulation Share Class EUR 100 96.43 100.30 — 9,658 10,045 —�E� Accumulation Share Class (EUR HedgedClass) EUR 19,431 115.54 112.16 109.18 2,245,043 2,635,801 1,729,940�I� (Dis) (Quarterly) Share Class (GBP HedgedClass) GBP 76 98.94 98.80 97.90 7,493 7,153 6,779�I� Accumulation Share Class EUR 100 99.07 101.67 — 9,907 10,167 —�I� Accumulation Share Class USD 342,559 145.41 136.87 127.51 49,812,349 36,929,090 11,939,746�I� Accumulation Share Class (EUR HedgedClass) EUR 78,821 129.94 124.47 119.52 10,242,307 9,482,367 4,279,889�I� Share Class USD 25,330 107.47 105.55 102.85 2,722,223 3,734,439 2,616�IXO� (Dis) (Cap Monthly) Share Class USD 120,556 74.08 75.81 77.09 8,930,343 15,912,875 43,316,191�P� (Dis) (Quarterly) Share Class USD 108,023 102.37 100.65 98.03 11,058,405 18,198,210 20,009,527�P� Accumulation Share Class USD 504,695 141.07 133.24 124.57 71,196,808 94,137,722 90,119,221�P� Accumulation Share Class (EUR HedgedClass) EUR 15,075 126.05 121.15 116.75 1,900,261 1,826,377 1,759,937�P� Share Class USD 22,705 107.10 105.19 102.44 2,431,706 2,196,122 2,319,044�P� Share Class (EUR Hedged Class) EUR 27 95.10 95.10 95.68 2,612 2,509 12,081�P� Share Class (GBP Hedged Class) GBP 44,435 101.27 100.81 100.16 4,500,170 4,465,734 4,110,449�R� (Dis) (Quarterly) Share Class USD 9,171 100.07 98.40 95.83 917,711 744,894 691,724�R� Accumulation Share Class USD 50,090 136.01 128.07 119.38 6,812,574 8,992,481 7,387,975�R� Accumulation Share Class (EUR HedgedClass) EUR 24 123.07 117.71 113.09 2,924 936,802 811,788�R� Share Class USD 22,652 103.49 101.64 98.99 2,344,247 2,470,575 2,397,372�R� Share Class (EUR Hedged Class) EUR 5,168 92.69 92.76 93.33 479,042 593,423 1,170,081�R� Share Class (GBP Hedged Class) GBP 238 98.46 97.95 97.35 23,404 440,259 455,279Sterling Credit PortfolioBase Currency Share Class GBP 35,466 166.37 157.71 144.63 5,900,563 6,221,251 7,693,539�I� Share Class GBP 55,193 161.40 152.97 140.30 8,908,016 3,984,713 2,699,077�P� Share Class GBP 1,409 166.52 157.83 144.74 234,649 812,399 622,098�R� Accumulation Share Class GBP 12,989 155.37 143.35 128.18 2,018,110 2,259,972 3,599,987�R� Share Class GBP 105,621 126.13 119.55 109.64 13,321,472 16,010,827 22,022,107US Dollar Short Duration Bond Portfolio�I� Accumulation Share Class USD 1,803,984 111.24 107.05 102.43 200,671,572 248,107,966 105,748,508�I� Share Class USD 208,302 105.33 103.79 100.97 21,940,211 31,286 30,170�P� Accumulation Share Class USD 555,322 110.54 106.53 102.07 61,387,654 62,362,548 55,424,726�P� Share Class USD 71,815 105.14 103.61 100.88 7,550,560 3,988,041 4,827,831�R� Accumulation Share Class USD 270,671 109.92 105.82 101.30 29,752,287 28,087,698 10,534,322�R� Share Class USD 139,366 105.22 103.69 100.96 14,664,256 13,126,232 7,804,986US Fixed Income PortfolioBase Accumulation Share Class USD 123,821 17.42 16.07 14.54 2,156,458 1,991,209 1,801,746Base Currency (Dis) (Monthly) Share Class USD 1,143 11.75 11.01 10.17 13,421 12,377 11,196Base Currency Share Class USD 172,964 12.26 11.56 10.65 2,121,267 2,539,317 1,794,625�A� (Dis) (Monthly) Share Class USD 53,539 11.75 11.01 10.18 629,191 458,343 429,504�A� Share Class USD 180,499 14.17 13.35 12.31 2,557,808 2,350,211 2,507,007�B� Share Class USD 1,019 12.36 11.65 10.73 12,592 11,766 10,779�E� Accumulation Share Class EUR 207,518 11.93 12.03 10.59 2,475,454 1,972,582 525,477�I� Accumulation Share Class USD 4,419,444 18.09 16.58 14.90 79,935,777 36,796,989 45,597,888�I� Share Class USD 298,691 12.36 11.64 10.73 3,690,709 4,009,682 3,496,716�P� (Dis) (Monthly) Share Class USD 1,196 11.75 11.01 10.18 14,053 12,890 11,595�P� Accumulation Share Class USD 2,327,193 17.91 16.44 14.79 41,677,154 30,068,336 41,244,570�P� Share Class USD 26,669 14.09 13.28 12.24 375,869 354,117 326,375�R� Accumulation Share Class USD 324,046 13.08 11.99 10.78 4,237,780 4,035,057 3,649,997�R� Share Class USD 52,388 11.19 10.54 9.71 586,232 16,294 10,792US Mortgage Backed Securities PortfolioBase Accumulation Share Class USD 134,038 17.43 16.62 15.53 2,336,772 6,785,975 7,104,883Base Currency Share Class USD 423,697 2.34 2.30 2.20 993,406 962,989 2,416,502�A� Accumulation Share Class (PLN HedgedClass) PLN 332,749 10.93 10.47 9.91 3,635,853 3,412,942 4,797,755�A� Share Class USD 314,438 7.74 7.58 7.28 2,433,477 2,875,800 1,727,978�E� Accumulation Share Class (EUR HedgedClass) EUR 575,557 10.53 10.22 9.87 6,062,580 1,738,828 520,553�I� Accumulation Share Class USD 10,647,203 11.68 11.07 10.28 124,325,135 74,480,786 26,767,580�I� Accumulation Share Class (EUR HedgedClass) EUR 1,594,459 15.43 14.84 14.22 24,598,438 9,743,635 9,944,846�I� Accumulation Share Class (GBP HedgedClass) GBP 5,218 15.08 14.43 13.64 78,689 75,299 71,187
Goldman Sachs FundsStatistical Information
As at 30 November 2020
48

OutstandingSharesas at
Net Asset Value per Shareas at(a) Net Assets as at(a)
Currency 30-Nov-20 30-Nov-20 30-Nov-19 30-Nov-18 30-Nov-20 30-Nov-19 30-Nov-18
US Mortgage Backed SecuritiesPortfolio (Continued)�I� Share Class USD 1,225,400 10.60 10.38 9.96 12,984,619 12,984,836 16,749,666�IO� (Dis) (Cap Monthly) Share Class USD 19,874,298 8.76 8.83 8.73 174,080,717 129,630,019 231,492,066�IO� Share Class USD 2,297,064 10.83 10.60 10.18 24,866,993 38,432,432 35,602,421�P� Accumulation Share Class USD 996,479 15.41 14.65 13.64 15,351,420 15,753,161 11,410,936�P� Share Class USD 40,052 11.83 11.59 11.13 473,974 2,611,407 2,371,160�R� Accumulation Share Class USD 478,184 12.46 11.82 10.99 5,959,493 17,348,896 19,404,081�R� Share Class USD 83,973 10.26 10.03 9.63 861,149 1,402,418 40,736Emerging Markets Multi-Asset PortfolioBase Accumulation Share Class USD 4,288 110.35 96.80 87.24 473,148 1,647,402 2,129,527Base Currency (Dis) (Cap Monthly) ShareClass USD 50,573 95.14 87.75 83.14 4,811,758 13,093,793 14,455,931Base Currency (Dis) (Gross Monthly) ShareClass USD 26,491 99.37 90.27 84.53 2,632,427 5,630,913 7,356,354Base Currency (Dis) (Monthly) Share Class USD 158 99.53 88.68 81.55 15,693 13,765 12,397Base Currency Share Class USD 104 106.25 95.03 87.27 11,040 9,684 8,727Other Currency (Dis) (Cap Monthly) ShareClass (AUD Partially Hedged Class) AUD 19,160 97.01 95.35 85.98 1,858,631 2,663,078 3,473,613Other Currency (Dis) (Cap Monthly) ShareClass (EUR Partially Hedged Class) EUR 5,012 92.13 90.63 84.90 461,785 212,393 205,805Other Currency (Dis) (Cap Monthly) ShareClass (GBP Partially Hedged Class) GBP 14,407 93.61 89.21 85.67 1,348,633 1,109,497 1,032,222Other Currency (Dis) (Cap Monthly) ShareClass (SGD Partially Hedged Class) SGD 141,369 93.88 88.19 83.94 13,271,609 15,067,076 16,544,420Other Currency (Dis) (Gross Monthly) ShareClass (AUD Partially Hedged Class) AUD 1,664 101.25 97.88 87.22 168,498 157,503 135,018Other Currency (Dis) (Gross Monthly) ShareClass (GBP Partially Hedged Class) GBP 1,110 97.69 91.57 86.91 108,388 98,233 89,688Other Currency (Dis) (Gross Monthly) ShareClass HKD 816 108.70 99.59 — 88,748 78,608 —Other Currency (Dis) (Gross Monthly) ShareClass (SGD Partially Hedged Class) SGD 39,878 98.09 90.65 85.31 3,911,614 4,721,049 7,843,698�E� Accumulation Share Class EUR 421 104.76 100.82 88.68 44,136 32,751 10,884�E� Share Class EUR 311 102.32 99.82 88.63 31,797 32,561 10,879�I� Accumulation Share Class USD 727 112.63 98.22 87.86 81,898 2,685,646 2,355,066�I� Share Class USD 105 106.95 95.64 87.90 11,283 9,825 8,790�P� Accumulation Share Class USD 100 111.05 97.22 87.44 11,105 9,722 8,744�P� Share Class USD 104 106.43 95.19 87.44 11,105 9,722 8,744�R� Accumulation Share Class USD 100 112.69 98.17 87.86 11,269 9,817 8,786�R� Share Class USD 105 106.91 95.60 87.86 11,269 9,817 8,786Global Multi-Asset Balanced PortfolioBase Accumulation Share Class USD 86,853 130.89 119.50 108.62 11,368,533 14,590,790 13,647,635Base Currency Share Class USD 3,578 125.76 115.49 106.21 449,907 3,913,157 476,748Other Currency Accumulation Share Class(EUR Partially Hedged Class) EUR 58,722 113.34 107.52 — 6,655,748 5,423,680 —Other Currency Share Class (EUR PartiallyHedged Class) EUR 26,422 123.17 117.50 109.28 3,254,455 5,156,641 4,556,463Other Currency Share Class (GBP PartiallyHedged Class) GBP 49,673 132.04 124.09 115.65 6,558,681 8,039,182 11,985,416�E� Accumulation Share Class (EUR PartiallyHedged Class) EUR 43,934 123.79 118.02 109.06 5,438,443 4,873,495 2,124,271�I� Accumulation Share Class USD 149,084 137.27 124.40 112.23 20,464,129 21,730,987 13,606,401�I� Accumulation Share Class (EUR PartiallyHedged Class) EUR 2,100 113.17 106.56 97.26 237,655 10,656 9,726�I� Share Class USD 6,555 126.68 116.30 107.02 830,438 1,390,722 1,338,315�R� Accumulation Share Class (EUR PartiallyHedged Class) EUR 100 113.05 106.49 97.23 11,305 10,649 9,723�R� Share Class (GBP Partially Hedged Class) GBP 269,091 133.35 125.27 116.86 35,884,009 33,935,008 33,877,195Global Multi-Asset Conservative PortfolioBase Accumulation Share Class USD 64,686 126.81 115.86 105.76 8,203,087 5,991,446 3,067,209Base Currency Share Class USD 2,095 119.62 110.75 102.64 250,629 1,000,058 260,987Other Currency Accumulation Share Class(EUR Partially Hedged Class) EUR 62,664 112.34 105.85 — 7,039,572 6,667,750 —Other Currency Share Class (EUR PartiallyHedged Class) EUR 4,893 113.17 108.01 101.87 553,781 662,788 401,119Other Currency Share Class (GBP PartiallyHedged Class) GBP 21,070 121.20 114.53 107.65 2,553,678 3,191,988 3,024,775�E� Accumulation Share Class (EUR PartiallyHedged Class) EUR 60,537 116.19 110.02 102.76 7,034,089 5,420,896 2,251,705�I� Accumulation Share Class USD 2,477,818 132.61 120.33 109.06 328,581,047 394,612,937 568,111,476�I� Accumulation Share Class (EUR PartiallyHedged Class) EUR 13,396 112.18 104.96 96.88 1,502,660 59,115 33,353�I� Accumulation Share Class (GBP PartiallyHedged Class) GBP 452,321 112.87 104.53 — 51,054,028 55,746,286 —�I� Share Class USD 110 120.43 111.46 103.34 13,277 12,043 10,914�R� Accumulation Share Class (EUR PartiallyHedged Class) EUR 1,356 112.11 104.92 96.85 152,056 10,492 9,685�R� Share Class (GBP Partially Hedged Class) GBP 200,139 121.89 115.17 108.33 24,395,437 23,009,947 22,981,385Global Multi-Asset Growth PortfolioBase Accumulation Share Class USD 47,929 133.80 122.99 111.82 6,413,106 18,613,609 17,878,611Base Currency Share Class USD 1,984 130.99 120.40 110.35 259,860 262,453 457,433Other Currency Accumulation Share Class(EUR Partially Hedged Class) EUR 6,419 112.75 108.46 — 723,752 1,110,107 —
Goldman Sachs FundsStatistical Information
As at 30 November 2020
49

OutstandingSharesas at
Net Asset Value per Shareas at(a) Net Assets as at(a)
Currency 30-Nov-20 30-Nov-20 30-Nov-19 30-Nov-18 30-Nov-20 30-Nov-19 30-Nov-18
Global Multi-Asset GrowthPortfolio (Continued)Other Currency Share Class (EUR PartiallyHedged Class) EUR 3,400 131.17 126.44 116.51 445,969 747,452 866,676Other Currency Share Class (GBP PartiallyHedged Class) GBP 11,265 141.51 133.69 124.20 1,594,091 2,360,229 3,417,420�E� Accumulation Share Class (EUR PartiallyHedged Class) EUR 11,075 130.06 125.75 115.56 1,440,358 1,891,882 1,421,276�I� Accumulation Share Class USD 1,220,178 141.02 128.60 115.98 172,074,771 231,166,809 339,247,763�I� Accumulation Share Class (EUR PartiallyHedged Class) EUR 100 113.03 107.85 97.82 11,303 10,785 9,782�I� Share Class USD 107 131.80 121.36 111.32 14,096 12,853 11,591�R� Accumulation Share Class (EUR PartiallyHedged Class) EUR 100 112.89 107.76 97.78 11,289 10,776 9,778�R� Share Class (GBP Partially Hedged Class) GBP 68,599 142.86 135.21 125.73 9,800,120 8,559,018 6,734,535Global Multi-Asset Income PortfolioBase Accumulation Share Class USD 6,643 134.57 127.29 113.82 893,943 364,750 183,758Base Currency (Dis) (Cap Monthly) ShareClass USD 295,446 102.94 103.42 97.63 30,412,105 14,543,753 4,609,270Base Currency (Dis) (Gross Monthly) ShareClass USD 322,711 98.14 99.61 93.62 31,670,788 6,037,204 419,990Base Currency Share Class USD 34,395 115.19 112.21 103.13 3,961,943 1,832,808 119,384Other Currency (Dis) (Gross Monthly) ShareClass (AUD Hedged Class) AUD 17,439 97.93 101.41 — 1,707,882 167,674 —Other Currency (Dis) (Gross Monthly) ShareClass HKD 216,737 99.42 102.03 — 21,546,966 103,155 —Other Currency (Dis) (Stable Monthly) ShareClass (EUR Hedged Class) EUR 282 95.60 97.53 94.15 26,969 118,191 109,448Other Currency Accumulation Share Class(EUR Hedged Class) EUR 351 113.16 109.26 100.70 39,668 140,628 129,613Other Currency Share Class (EUR HedgedClass) EUR 12,203 112.83 112.32 106.57 1,376,861 1,261,999 191,864�A� (Dis) (Monthly) Share Class USD 15,775 105.98 106.03 98.29 1,671,832 1,133,768 700,937�E� (Dis) (Gross Quarterly) Share Class (EURHedged Class) EUR 7,907 92.11 95.91 93.58 728,265 477,397 443,527�E� (Dis) (Quarterly) Share Class (EURHedged Class) EUR 55,969 105.77 108.06 103.04 5,919,810 5,032,035 4,922,220�E� (Dis) (Stable Monthly) Share Class (EURHedged Class) EUR 2,028 92.98 95.44 92.69 188,510 263,904 229,003�E� Accumulation Share Class (EUR HedgedClass) EUR 32,254 127.19 123.54 114.54 4,102,537 4,552,292 5,597,056�I� Accumulation Share Class USD 14,616 140.97 132.42 117.59 2,060,316 28,692 25,479�I� Accumulation Share Class (EUR HedgedClass) EUR 11,699 131.43 126.02 115.34 1,537,629 1,528,443 3,246,361�I� Share Class USD 473 115.83 112.97 103.85 54,806 73,677 11,349�P� Accumulation Share Class USD 100 136.85 129.11 115.16 13,685 12,911 11,516�P� Share Class USD 119 114.84 112.48 103.38 13,685 12,911 11,516�R� (Dis) (Gross Monthly) Share Class (GBPHedged Class) GBP 78,883 108.04 111.24 105.92 8,522,597 11,282,958 13,275,444�R� Accumulation Share Class (EUR HedgedClass) EUR 79 138.38 132.68 121.49 10,997 132,682 121,493�R� Share Class (EUR Hedged Class) EUR 97 112.91 113.02 107.30 11,005 132,695 121,505�R� Share Class (GBP Hedged Class) GBP 1,011 122.17 121.09 113.63 123,530 268,545 122,683US Real Estate Balanced PortfolioBase Accumulation Share Class USD 167,447 171.13 164.68 143.39 28,654,615 41,657,252 43,658,294Base Currency (Dis) (Cap Gross MonthlyMBS) Share Class USD 119 112.91 112.87 102.30 13,448 12,938 11,254Base Currency (Dis) (Cap Monthly MBS)Share Class USD 131,569 143.62 141.02 125.78 18,895,477 25,414,523 31,978,869Base Currency (Dis) (Monthly) Share Class USD 124 136.09 133.59 119.14 16,894 29,494 13,461Other Currency (Dis) (Cap Gross MonthlyMBS) Share Class (SGD Hedged Class) SGD 1,666 110.06 110.86 101.22 183,393 177,886 155,893Other Currency (Dis) (Cap Monthly MBS)Share Class (SGD Hedged Class) SGD 16,777 141.60 140.16 125.90 2,375,638 2,297,656 3,951,906�E� Accumulation Share Class (EUR HedgedClass) EUR 8,086 146.37 144.48 130.31 1,183,642 2,284,017 2,681,131�I� (Dis) (Cap Monthly MBS) Share Class USD 140,750 141.29 138.74 123.73 19,886,722 21,213,155 19,576,926�I� (Dis) (Monthly) Share Class USD 8,200 136.17 133.67 119.21 1,116,559 57,441 14,162�I� Accumulation Share Class USD 82,954 185.50 176.96 152.74 15,387,777 47,213,497 60,170,057�I� Accumulation Share Class (EUR HedgedClass) EUR 109,636 152.27 148.27 131.90 16,693,771 13,469,110 11,969,005�P� (Dis) (Cap Monthly MBS) Share Class USD 259,301 143.40 140.81 125.58 37,184,637 69,419,267 64,268,309�P� (Dis) (Monthly) Share Class USD 123 136.03 133.53 119.10 16,740 16,019 187,794�P� Accumulation Share Class USD 218,309 180.09 172.41 149.33 39,315,307 69,886,228 85,035,397�R� (Dis) (Cap Monthly MBS) Share Class USD 4,402 109.57 107.60 95.96 482,324 473,646 421,935�R� (Dis) (Monthly) Share Class GBP 117 115.43 117.40 106.04 13,530 13,265 11,492�R� (Dis) (Monthly) Share Class (GBP HedgedClass) GBP 5,084 110.93 111.19 101.01 563,972 3,999,725 16,302,604�R� Accumulation Share Class USD 121,984 177.84 169.78 146.66 21,693,630 23,110,306 9,752,742�R� Share Class USD 45,530 147.30 144.97 129.26 6,706,586 7,087,196 6,635,312CoCos & Capital Securities Portfolio(b)
Base Accumulation Share Class (b) USD — — 129.05 112.93 — 12,905 11,293Base Currency Share Class (b) USD — — 110.32 100.14 — 12,896 11,282�I� Accumulation Share Class (b) USD — — 134.15 116.60 — 13,415 11,660
Goldman Sachs FundsStatistical Information
As at 30 November 2020
50

OutstandingSharesas at
Net Asset Value per Shareas at(a) Net Assets as at(a)
Currency 30-Nov-20 30-Nov-20 30-Nov-19 30-Nov-18 30-Nov-20 30-Nov-19 30-Nov-18
CoCos & Capital SecuritiesPortfolio(b) (Continued)�IO� Accumulation Share Class (b) USD — — 138.59 119.71 — 56,513,712 60,038,119Emerging Markets Total Return BondPortfolioBase Accumulation Share Class USD 9,331 110.89 102.26 95.29 1,034,751 10,226 9,529Base Currency Share Class USD 109 101.37 97.22 95.29 11,090 10,227 9,529Other Currency Accumulation Share Class(EUR Hedged Class) EUR 200 102.76 96.57 92.65 20,553 19,314 18,530Other Currency Share Class (EUR HedgedClass) EUR 220 93.53 91.52 92.65 20,553 19,314 18,530�E� Accumulation Share Class (EUR HedgedClass) EUR 200 101.46 95.61 92.18 20,292 19,121 18,436�I� Accumulation Share Class USD 83,000 112.69 103.56 95.90 9,353,157 15,418,577 19,371,801�I� Accumulation Share Class (EUR HedgedClass) EUR 106 106.71 100.25 — 11,335 10,650 —�I� Share Class USD 100 101.62 97.80 95.91 10,133 149,280 9,413,247�IO� Accumulation Share Class (AUD HedgedClass) AUD 1,350 113.03 103.84 96.35 152,587 140,183 130,075�IO� Accumulation Share Class (GBP HedgedClass) GBP 1,050,000 108.25 99.66 — 113,657,319 104,641,133 —�R� Accumulation Share Class (EUR HedgedClass) EUR 200 104.35 97.75 93.22 20,870 19,550 18,644�R� Accumulation Share Class (GBP HedgedClass) GBP 500 107.00 99.91 94.20 53,502 49,953 47,102�R� Share Class (EUR Hedged Class) EUR 223 93.76 92.01 93.22 20,870 19,550 18,644�R� Share Class (GBP Hedged Class) GBP 555 96.31 93.96 94.20 53,477 49,924 47,102Global Absolute Return PortfolioBase Accumulation Share Class USD 558 102.55 103.23 97.87 57,241 66,634 66,134Base Currency Share Class USD 101 100.61 102.00 97.21 10,131 10,221 9,721Other Currency Accumulation Share Class(EUR Hedged Class) EUR 1,000 91.80 94.10 91.92 91,796 94,102 91,918Other Currency Accumulation Share Class(SEK Hedged Class) SEK 8,171 91.32 93.60 91.23 746,138 764,786 746,404�E� Accumulation Share Class (EUR HedgedClass) EUR 21 89.52 92.18 90.49 1,898 127,420 96,906�I� Accumulation Share Class USD 193,166 106.61 106.58 100.36 20,593,850 32,185,517 48,700,065�I� Accumulation Share Class (EUR HedgedClass) EUR 319,771 95.45 97.18 94.29 30,521,935 48,978,288 35,752,511�I� Accumulation Share Class (GBP HedgedClass) GBP 6,392 100.03 101.47 97.22 639,402 753,438 65,428�I� Accumulation Share Class (JPY HedgedClass) JPY 625,237 9,819.83 9,965.71 9,647.31 6,139,725,809 6,230,933,875 6,031,859,882�I� Share Class USD 100 103.42 104.96 99.84 10,360 10,356 9,746�I� Share Class (EUR Hedged Class) EUR 76 93.04 95.86 94.01 7,098 97,416 94,500�I� Share Class (GBP Hedged Class) GBP 599 94.51 97.00 93.99 56,610 117,269 255,550�IO� Accumulation Share Class USD 127,830 110.40 109.71 102.69 14,112,843 12,171,118 12,598,373�IO� Share Class USD 799,208 104.31 105.53 100.44 83,366,193 46,818,417 39,698,565�P� Accumulation Share Class USD 100 104.59 104.80 98.89 10,459 10,480 9,889�P� Accumulation Share Class (EUR HedgedClass) EUR 56 93.81 95.58 92.94 5,282 95,579 92,942�P� Share Class USD 102 102.75 103.98 98.89 10,459 10,480 9,889�R� Accumulation Share Class (EUR HedgedClass) EUR 3,123 95.46 97.09 94.22 298,139 97,092 94,225�R� Share Class (EUR Hedged Class) EUR 73 92.93 95.66 93.81 6,773 97,082 94,215�R� Share Class (GBP Hedged Class) GBP 13,413 97.46 100.04 96.93 1,307,259 1,756,044 2,113,071Global Fixed Income Plus Portfolio(Hedged)Base Accumulation Share Class EUR 260,084 16.25 15.19 14.15 4,227,456 3,666,391 5,367,176Base Accumulation Share Class (USDHedged Class) USD 178,788 18.18 16.71 15.09 3,249,847 1,496,205 1,384,711Base Currency Share Class EUR 145,344 12.27 11.69 11.04 1,784,000 1,876,014 2,173,217Base Currency Share Class (USD HedgedClass) USD 218,714 12.26 11.46 10.50 2,682,157 3,734,786 3,646,893�A� Share Class EUR 155,215 12.70 12.07 11.41 1,970,922 2,046,719 2,174,988�A� Share Class (USD Hedged Class) USD 562,901 14.26 13.33 12.21 8,026,440 7,883,079 7,700,092�E� Accumulation Share Class EUR 86,809 15.31 14.35 13.40 1,329,236 1,187,159 1,305,307�I� Accumulation Share Class EUR 16,688,834 16.72 15.54 14.39 279,083,413 201,037,339 286,909,157�I� Accumulation Share Class (USD HedgedClass) USD 6,968,544 18.41 16.83 15.12 128,315,733 83,583,777 74,812,131�I� Share Class (GBP Hedged Class) GBP 90,075 12.79 12.06 11.24 1,152,253 1,153,377 48,766,847�IO� Accumulation Share Class EUR 57,862,138 17.93 16.58 15.27 1,037,242,199 774,416,875 524,456,130�IO� Accumulation Share Class (GBP HedgedClass) GBP 192,448 19.29 17.71 16.09 3,712,002 3,318,145 2,969,933�IO� Accumulation Share Class (USD HedgedClass) USD 3,080,101 19.68 17.90 16.00 60,625,142 38,637,789 29,790,246�IO� Share Class (USD Hedged Class) USD 7,613,137 12.12 11.32 10.37 92,297,229 107,877,818 78,693,661�P� Accumulation Share Class EUR 208,166 16.77 15.64 14.54 3,491,057 1,249,155 1,921,019�P� Accumulation Share Class (USD HedgedClass) USD 1,384,846 18.51 16.97 15.30 25,629,277 16,498,969 18,742,677�P� Share Class (GBP Hedged Class) GBP 700 14.31 13.49 12.57 10,015 2,737,338 1,317,431�R� Accumulation Share Class EUR 520,338 12.74 11.85 10.98 6,626,607 6,937,096 11,219,027�R� Accumulation Share Class (USD HedgedClass) USD 304,011 14.20 12.99 11.68 4,317,229 4,526,782 4,222,467
Goldman Sachs FundsStatistical Information
As at 30 November 2020
51

OutstandingSharesas at
Net Asset Value per Shareas at(a) Net Assets as at(a)
Currency 30-Nov-20 30-Nov-20 30-Nov-19 30-Nov-18 30-Nov-20 30-Nov-19 30-Nov-18
Global Fixed Income Plus Portfolio(Hedged) (Continued)�R� Share Class EUR 209,276 11.27 10.71 10.13 2,359,377 1,514,107 2,809,900�R� Share Class (GBP Hedged Class) GBP 232,810 12.04 11.35 10.58 2,803,085 4,030,137 10,659,588�R� Share Class (USD Hedged Class) USD 26,939 11.59 10.83 9.89 312,245 239,722 434,359Global Strategic Income Bond PortfolioBase Accumulation Share Class USD 203,325 127.60 117.83 112.44 25,944,346 31,308,455 50,426,047Base Currency (Dis) (Monthly) Share Class USD 8,688 103.55 98.69 97.10 899,651 3,583,104 5,172,819Base Currency Share Class USD 208,146 106.78 101.69 100.03 22,226,743 25,882,295 43,379,149Other Currency (Dis) (Quarterly) Share Class(SGD Hedged Class) SGD 14,905 95.48 91.44 90.45 1,423,091 1,220,323 2,094,523Other Currency Accumulation Share Class(CHF Hedged Class) CHF 18,597 98.55 92.87 91.73 1,832,836 3,142,096 3,449,498Other Currency Accumulation Share Class(EUR Hedged Class) EUR 99,281 114.21 107.25 105.51 11,339,076 12,760,406 22,440,715Other Currency Accumulation Share Class(SEK Hedged Class) SEK 68,092 100.98 94.72 93.06 6,875,814 6,412,135 5,882,130Other Currency Share Class (CHF HedgedClass) CHF 1,209 87.59 85.15 86.79 105,870 99,764 203,538Other Currency Share Class (EUR HedgedClass) EUR 236,970 88.56 85.84 87.21 20,985,261 23,775,234 29,717,925Other Currency Share Class (GBP HedgedClass) GBP 3,571 101.11 97.38 97.81 361,080 538,049 543,416�A� (Dis) (Monthly) Share Class USD 21,065 103.49 98.64 97.05 2,180,070 2,879,852 4,218,392�A� Share Class USD 87,127 106.54 101.45 99.79 9,282,320 11,557,208 15,955,339�E� (Dis) (Quarterly) Share Class (EURHedged Class) EUR 129,553 93.62 90.67 91.81 12,129,072 14,495,684 18,136,389�E� Accumulation Share Class (EUR HedgedClass) EUR 136,203 109.02 102.89 101.73 14,848,985 18,560,923 28,024,900�I� (Dis) (Monthly) Share Class (GBP HedgedClass) GBP 2,000,119 98.49 95.01 95.20 197,001,445 190,028,046 343,134,520�I� (Dis) (Semi-Annual) Share Class (JPYHedged Class) JPY 48,063 8,681.14 8,393.29 8,466.18 417,242,472 1,262,973,665 1,273,941,504�I� Accumulation Share Class USD 330,123 136.48 125.19 118.67 45,056,702 46,411,731 101,458,303�I� Accumulation Share Class (CHF HedgedClass) CHF 35,874 103.61 96.99 95.16 3,717,076 3,963,254 6,340,626�I� Accumulation Share Class (EUR HedgedClass) EUR 1,854,486 122.46 114.23 111.63 227,109,535 220,637,828 267,304,212�I� Accumulation Share Class (GBP HedgedClass) GBP 896,267 109.80 101.95 98.44 98,414,517 91,353,010 87,223,418�I� Accumulation Share Class (JPY HedgedClass) JPY 911,482 10,447.32 9,740.60 9,496.49 9,522,546,136 9,057,105,803 16,657,053,882�I� Accumulation Share Class (SEK HedgedClass) SEK 2,503 102.67 95.66 93.36 256,937 239,397 233,642�I� Share Class EUR 5,856 111.13 115.41 110.22 650,760 835,656 2,424,479�I� Share Class USD 46,629 107.42 102.35 100.70 5,008,921 167,500,662 220,203,352�I� Share Class (AUD Hedged Class) AUD 1,464 98.55 98.09 97.51 144,244 133,661 335,105,183�I� Share Class (EUR Hedged Class) EUR 15,956 95.78 92.87 94.41 1,528,321 1,584,645 3,389,635�I� Share Class (GBP Hedged Class) GBP 5,301 101.59 97.92 98.41 538,549 460,424 20,898,995�IO� Accumulation Share Class (GBP HedgedClass) GBP 1,366,285 114.38 105.56 101.31 156,277,068 227,358,755 344,554,540�IS� Accumulation Share Class USD 103 117.08 107.36 101.74 12,065 11,063 10,483�IS� Share Class USD 164 106.91 101.81 100.14 17,579 16,105 15,249�IS� Share Class (GBP Hedged Class) GBP 122 101.76 98.01 98.49 12,403 11,502 11,098�IXO� (Dis) (Cap Monthly) Share Class USD 2,375,581 48.50 51.76 57.01 115,207,649 135,085,934 163,744,810�P� (Dis) (Monthly) Share Class USD 4,789 103.50 98.65 97.05 495,716 461,005 443,097�P� Accumulation Share Class USD 88,176 133.22 122.51 116.39 11,747,175 12,674,373 48,785,242�P� Accumulation Share Class (EUR HedgedClass) EUR 48,523 119.59 111.83 109.55 5,802,975 8,044,931 9,709,603�P� Share Class USD 31,696 107.22 102.10 100.44 3,398,315 4,548,978 7,992,924�P� Share Class (EUR Hedged Class) EUR 96 92.70 91.29 94.11 8,938 8,354 8,182�P� Share Class (GBP Hedged Class) GBP 30,234 101.60 97.86 98.28 3,071,896 2,537,936 2,456,662�R� (Dis) (Monthly) Share Class USD 4,852 97.96 93.37 91.85 475,330 775,765 1,064,478�R� Accumulation Share Class USD 171,896 123.48 113.34 107.52 21,226,218 20,110,480 18,994,365�R� Accumulation Share Class (CHF HedgedClass) CHF 781 101.97 95.51 93.78 79,630 74,587 73,239�R� Accumulation Share Class (EUR HedgedClass) EUR 69,421 111.57 104.14 101.84 7,745,017 9,557,849 15,468,706�R� Share Class USD 41,403 102.51 97.62 96.04 4,244,285 3,651,776 5,522,508�R� Share Class (EUR Hedged Class) EUR 76,131 92.04 89.22 90.68 7,006,908 7,798,387 10,553,310�R� Share Class (GBP Hedged Class) GBP 35,569 97.70 94.09 94.56 3,475,070 5,719,543 6,896,432Global Strategic Macro Bond PortfolioBase Accumulation Share Class USD 109,026 111.23 106.98 102.85 12,127,129 20,986,781 42,850,782Base Accumulation Share Class (CHFHedged Class) CHF 6,122 94.29 92.29 91.85 577,271 586,233 782,135Base Currency Share Class USD 4,293 100.88 99.26 98.34 433,037 521,193 1,287,439Other Currency Accumulation Share Class(EUR Hedged Class) EUR 124,557 99.83 97.52 96.73 12,433,903 19,523,032 51,050,398Other Currency Accumulation Share Class(GBP Hedged Class) GBP 1,954 102.68 99.57 97.53 200,686 489,396 479,331Other Currency Accumulation Share Class(SEK Hedged Class) SEK 984,885 99.99 97.30 96.35 98,481,615 122,226,867 301,527,929Other Currency Share Class (EUR HedgedClass) EUR 667 88.80 88.81 90.92 59,266 57,890 97,798
Goldman Sachs FundsStatistical Information
As at 30 November 2020
52

OutstandingSharesas at
Net Asset Value per Shareas at(a) Net Assets as at(a)
Currency 30-Nov-20 30-Nov-20 30-Nov-19 30-Nov-18 30-Nov-20 30-Nov-19 30-Nov-18
Global Strategic Macro BondPortfolio (Continued)�A� Accumulation Share Class (PLN HedgedClass) PLN 41,204 104.89 101.62 98.93 4,321,980 6,545,399 10,247,077�E� Accumulation Share Class (EUR HedgedClass) EUR 185,272 97.09 95.33 94.99 17,988,659 25,024,094 48,643,489�I� Accumulation Share Class USD 152,191 114.67 109.95 105.11 17,452,489 72,454,106 109,468,491�I� Accumulation Share Class (CHF HedgedClass) CHF 30,690 99.32 96.78 95.77 3,048,034 12,047,989 21,678,197�I� Accumulation Share Class (EUR HedgedClass) EUR 2,252,489 103.06 100.26 98.84 232,138,335 485,270,064 624,484,096�I� Accumulation Share Class (Flat) (EURHedged Class) EUR 25,943 98.60 96.12 95.09 2,557,974 3,028,225 8,826,241�I� Accumulation Share Class (Flat) (GBPHedged Class) GBP 39 107.92 104.39 102.00 4,232 4,094 1,082,143�I� Accumulation Share Class (GBP HedgedClass) GBP 50,236 108.82 105.17 102.41 5,466,473 6,173,098 6,224,295�I� Accumulation Share Class (SEK HedgedClass) SEK 4,003,981 103.29 99.95 98.42 413,582,776 1,307,830,219 1,106,240,627�I� Share Class USD 1,155 101.26 100.33 99.42 116,958 1,362,047 85,094,316�I� Share Class (EUR Hedged Class) EUR 21,677 91.24 91.33 93.51 1,977,848 75,923,985 116,585,938�IO� Accumulation Share Class USD 50,661 122.00 116.08 110.42 6,180,623 5,266,280 10,838,622�IO� Share Class USD 258,169 100.71 99.12 98.23 26,001,412 22,389,545 62,615,026�P� Accumulation Share Class USD 11,192 112.82 108.18 103.73 1,262,703 2,950,438 5,542,723�P� Accumulation Share Class (CHF HedgedClass) CHF 100 94.92 92.71 92.18 9,492 9,271 9,218�P� Accumulation Share Class (EUR HedgedClass) EUR 1,034 101.37 98.76 97.64 104,836 453,417 3,008,965�P� Accumulation Share Class (GBP HedgedClass) GBP 58 100.24 96.89 94.57 5,784 5,591 9,457�P� Share Class USD 5,990 101.38 99.76 98.83 607,228 254,010 601,079�R� Accumulation Share Class USD 34,671 108.02 103.43 98.95 3,745,285 7,316,013 8,043,113�R� Accumulation Share Class (CHF HedgedClass) CHF 8,690 96.03 93.54 92.63 834,524 6,971,496 12,760,753�R� Accumulation Share Class (EUR HedgedClass) EUR 83,578 102.86 100.03 98.67 8,596,826 11,847,956 49,093,684�R� Share Class USD 57,789 98.27 96.77 95.88 5,678,734 7,514,044 11,745,439�R� Share Class (EUR Hedged Class) EUR 7,788 91.23 91.25 93.42 710,495 1,384,267 2,227,153�R� Share Class (GBP Hedged Class) GBP 16,437 96.29 95.57 96.70 1,582,680 1,767,194 7,783,846�RS� Accumulation Share Class USD 30,006 106.63 102.23 — 3,199,427 401,803 —�RS� Accumulation Share Class (CHF HedgedClass) CHF 44,830 104.25 101.74 — 4,673,484 1,383,441 —�RS� Accumulation Share Class (EUR HedgedClass) EUR 4,122 104.53 101.78 — 430,866 982,585 —�RS� Share Class USD 9,350 106.32 102.22 — 994,045 11,150 —�RS� Share Class (EUR Hedged Class) EUR 3,904 104.23 101.78 — 406,893 397,300 —Strategic Absolute Return Bond I PortfolioBase Accumulation Share Class USD 918 124.97 119.53 115.17 114,723 116,190 935,004Base Accumulation Share Class (EURHedged Class) EUR 1,709 111.14 107.91 107.20 189,964 212,874 165,914Base Currency Share Class USD 796 92.26 89.46 87.42 73,404 89,683 203,415Base Currency Share Class (EUR HedgedClass) EUR 1,400 86.20 85.03 86.30 120,714 199,581 214,834Base Currency Share Class (GBP HedgedClass) GBP 576 89.22 87.20 86.85 51,424 50,255 50,056�A� Share Class USD 5,998 101.51 98.42 96.19 608,861 537,856 408,989�E� Accumulation Share Class (EUR HedgedClass) EUR 5,845 103.96 101.19 100.77 607,668 180,793 208,121�I� Accumulation Share Class USD 100 124.59 119.41 114.61 12,459 11,941 11,461�I� Accumulation Share Class (EUR HedgedClass) EUR 26,988 112.23 109.00 107.82 3,028,983 635,024 737,398�I� Share Class (EUR Hedged Class) EUR 797 70.16 69.35 69.94 55,945 54,201 53,618�I� Share Class (GBP Hedged Class) (b) GBP — — 95.51 95.21 — 114,241,912 223,368,179�IO� Accumulation Share Class (GBP HedgedClass) GBP 3,336,030 128.43 122.81 119.70 428,455,523 409,692,700 399,323,504�IO� Share Class (AUD Hedged Class) AUD 232,348 107.46 105.01 103.57 24,968,493 27,773,242 26,904,060�R� Accumulation Share Class USD 100 116.12 111.15 106.74 11,620 11,456 10,674�R� Accumulation Share Class (EUR HedgedClass) EUR 4,408 103.92 100.88 99.86 458,048 136,134 134,763�R� Share Class USD 1,187 102.99 100.50 98.22 122,226 11,117 10,676�R� Share Class (EUR Hedged Class) EUR 1,131 91.90 90.96 91.71 103,946 100,892 99,873�R� Share Class (GBP Hedged Class) GBP 1,129 97.97 96.16 95.78 110,648 106,617 104,249Strategic Absolute Return Bond II PortfolioBase Accumulation Share Class USD 4,800 134.26 126.81 120.88 644,491 140,431 238,054Base Accumulation Share Class (EURHedged Class) EUR 6,567 119.98 115.10 113.10 787,958 756,132 937,393Base Currency Share Class USD 2,694 104.51 100.55 97.83 281,534 266,336 286,703Base Currency Share Class (EUR HedgedClass) EUR 2,560 93.85 91.75 92.13 240,262 223,789 222,562Base Currency Share Class (GBP HedgedClass) GBP 265 101.53 98.75 98.00 26,902 72,815 71,314�A� Share Class USD 4,662 108.59 104.48 101.65 506,197 582,794 694,042�E� Accumulation Share Class (EUR HedgedClass) EUR 6,113 109.00 105.11 103.80 666,323 1,130,798 2,211,438
Goldman Sachs FundsStatistical Information
As at 30 November 2020
53

OutstandingSharesas at
Net Asset Value per Shareas at(a) Net Assets as at(a)
Currency 30-Nov-20 30-Nov-20 30-Nov-19 30-Nov-18 30-Nov-20 30-Nov-19 30-Nov-18
Strategic Absolute Return Bond IIPortfolio (Continued)�I� Accumulation Share Class USD 112 145.63 137.05 129.75 16,331 10,709 5,719,347�I� Accumulation Share Class (EUR HedgedClass) EUR 31,104 131.37 125.26 122.36 4,086,109 3,896,225 3,805,770�I� Accumulation Share Class (Flat) (GBPHedged Class) GBP 531,002 105.68 100.85 97.81 56,117,479 53,308,503 51,463,807�IO� Accumulation Share Class (GBP HedgedClass) GBP 546 145.98 137.92 132.43 79,692 75,293 72,295�IO� Share Class (GBP Hedged Class) (b) GBP — — 111.14 110.38 — 120,356,947 115,564,748�R� Accumulation Share Class USD 780 118.98 111.98 106.20 92,803 87,345 82,833�R� Share Class USD 7,956 102.66 98.90 96.23 816,685 786,540 765,037�R� Share Class (GBP Hedged Class) GBP 30,648 96.99 94.32 93.65 2,972,451 2,888,317 2,865,143Multi-Manager Dynamic World EquityPortfolioBase Accumulation Share Class USD 1,365,609 25.56 22.78 19.91 34,905,134 46,398,612 60,619,341Base Currency Share Class USD 2,433,308 29.52 26.38 23.09 71,841,589 70,677,763 65,564,679Other Currency Accumulation Share Class EUR 717,316 27.28 26.50 22.48 19,566,859 27,995,464 27,327,380�I� Share Class USD 2,446,005 22.83 20.39 17.85 55,836,948 83,207,835 77,941,044�IO� Accumulation Share Class USD 9,638,399 24.50 21.67 18.80 236,112,141 304,956,675 277,939,479�R� Accumulation Share Class EUR 578,097 25.44 24.56 20.70 14,705,525 8,447,381 8,745,241�R� Accumulation Share Class USD 2,242,685 23.12 20.47 17.77 51,846,276 46,676,725 43,226,226�R� Accumulation Share Class (EUR HedgedClass) EUR 883,094 12.12 11.05 9.89 10,703,854 16,139,773 13,969,437�R� Accumulation Share Class (GBP HedgedClass) GBP 1,825,540 12.71 11.64 10.31 23,198,818 24,153,804 22,308,836�R� Share Class USD 8,153,104 22.00 19.65 17.20 179,358,812 159,234,392 133,693,522Global Corporate Portfolio (Hedged)�I� Accumulation Share Class NOK 93,537,023 185.57 174.54 154.16 17,358,002,749 14,856,694,817 13,111,581,662Absolute Return Tracker PortfolioBase Accumulation Share Class USD 97,114 10.82 10.66 10.06 1,050,967 904,816 976,767Other Currency Accumulation Share Class(CHF Hedged Class) CHF 464,982 10.03 10.07 9.82 4,665,047 1,263,287 580,907Other Currency Accumulation Share Class(EUR Hedged Class) EUR 934,273 9.95 9.96 9.67 9,295,578 13,547,468 3,725,060Other Currency Accumulation Share Class(SGD Hedged Class) (b) SGD 14,000 10.97 — — 153,579 — —�A� Accumulation Share Class USD 18,807 10.75 10.64 10.09 202,128 123,328 9,724�E� Accumulation Share Class (EUR HedgedClass) EUR 4,159 10.20 10.26 10.01 42,421 15,604 154,349�I� Accumulation Share Class USD 8,920,322 12.15 11.89 11.14 108,402,642 170,680,785 144,264,360�I� Accumulation Share Class (AUD HedgedClass) AUD 103 11.75 11.69 11.06 1,209 1,203 1,138�I� Accumulation Share Class (CHF HedgedClass) CHF 20,717,455 10.63 10.60 10.26 220,306,778 209,831,054 131,500,047�I� Accumulation Share Class (EUR HedgedClass) EUR 12,038,557 11.72 11.65 11.23 141,040,751 186,467,842 111,695,614�I� Accumulation Share Class (GBP HedgedClass) GBP 961,928 11.97 11.85 11.31 11,517,377 15,828,220 11,221,923�I� Accumulation Share Class (JPY HedgedClass) JPY 3,497,150 1,024.01 1,014.31 975.67 3,581,122,944 3,548,401,962 3,414,343,913�I� Accumulation Share Class (SEK HedgedClass) SEK 1,063,939 104.00 104.09 100.27 110,652,214 116,272,798 468,920,810�P� Accumulation Share Class USD 1,184,134 11.07 10.87 10.22 13,111,525 14,304,580 8,898,354�P� Accumulation Share Class (EUR HedgedClass) EUR 152,062 10.93 10.91 10.55 1,662,627 1,310,307 4,383�R� Accumulation Share Class (EUR HedgedClass) EUR 4,626,129 10.09 10.03 9.68 46,686,011 55,555,612 13,569,460�R� Share Class USD 4,320,272 11.74 11.58 10.91 50,699,236 46,738,703 4,589,757�R� Share Class (GBP Hedged Class) GBP 1,928,524 11.23 11.20 10.76 21,650,512 22,215,534 1,029,653Alternative Trend PortfolioOther Currency Accumulation Share Class(EUR Hedged Class) EUR 146,378 8.94 9.28 8.62 1,308,131 234,324 77,566�I� Accumulation Share Class USD 17,138 10.33 10.51 9.42 177,002 757,708 829,892�I� Accumulation Share Class (EUR HedgedClass) EUR 2,834,749 9.65 9.94 9.16 27,344,340 45,154,120 33,207,534�I� Accumulation Share Class (GBP HedgedClass) GBP 227,818 9.96 10.17 9.24 2,268,172 1,004,467 1,294,581�I� Share Class (GBP Hedged Class) GBP 1,723,452 10.56 10.95 9.96 18,191,192 13,928,260 9,957�IO� Accumulation Share Class USD 23,800,716 10.88 11.00 9.80 258,955,979 184,872,649 244,174,160�IO� Accumulation Share Class (JPY HedgedClass) JPY 205,149 998.88 1,022.58 937.86 204,919,705 1,959,291,332 600,561,636�IO� Share Class USD 3,940,927 10.21 10.56 9.59 40,232,681 45,458,075 36,499,385�R� Share Class (GBP Hedged Class) GBP 10,729 9.46 9.93 9.14 101,542 69,279 11,027,673
(a) Refer to Note 3(k).(b) Refer to Appendix II.
Goldman Sachs FundsStatistical Information
As at 30 November 2020
54

1 Organisat ion
Goldman Sachs Funds (the “Fund”) was incorporated on 5 November 1992 under the laws of the Grand Duchyof Luxembourg as a “Société d’Investissement à Capital Variable” (“SICAV”), for an unlimited period of time. TheFund is registered in accordance with the Law of 17 December 2010, as amended. The Fund appointedGoldman Sachs Asset Management Fund Services Limited (“GSAMFSL”) (the “Management Company”) as itsManagement Company. GSAMFSL is authorised and regulated by the Central Bank of Ireland, and is a whollyowned indirect subsidiary of The Goldman Sachs Group, Inc.
Refer to Note 6 for details of functions the Management Company has delegated.
The Fund has appointed State Street Bank International GmbH, Luxembourg Branch (the “Depositary”) to act asthe Depositary of the Fund’s assets.
As at 30 November 2020, the Fund is comprised of sixty-three different portfolios (“the Portfolios”).
As at 30 November 2020, the Fund offered shares in the Portfolios as detailed in Appendix I.
Please refer to Appendix II for Portfolios and Share Classes that were launched, merged or closed during theyear.
Goldman Sachs India Equity Portfolio (the “India Equity Portfolio”) invests through a wholly-owned specialpurpose subsidiary Goldman Sachs India Limited (the “Subsidiary”), a private company incorporated inMauritius with limited liability. The Subsidiary is administered by Intercontinental Trust Limited, based inMauritius. Intercontinental Trust Limited has sub-delegated the administration function to State Street BankInternational GmbH, Luxembourg Branch.
The India Equity Portfolio’s continued ability to invest in India is dependent on it continuing to meet current andfuture requirements placed on foreign institutional investors by the Securities and Exchange Board of India. If theIndia Equity Portfolio (or the Investment Adviser) were to fail to meet applicable requirements in the future, theIndia Equity Portfolio would no longer be permitted to invest directly in Indian securities, may not be able topursue its principal strategy and may be forced to liquidate.
The underlying investments of the Subsidiary comply with the investment guidelines and restrictions applicableto the India Equity Portfolio. Appropriate procedures have been put in place in order to allow the Custodian of theFund to fulfill its supervisory and monitoring functions as regards to the assets held by the Subsidiary on behalfof the India Equity Portfolio.
The costs and expenses borne by the Subsidiary are allocated to the India Equity Portfolio, which invests itsassets through the Subsidiary. As a wholly owned subsidiary of the Portfolio, all assets and liabilities, income andexpenses of the Subsidiary are consolidated in the Statement of Assets and Liabilities and Statement ofOperations of the India Equity Portfolio, and all intercompany balances and transactions have been eliminated.
All investments held by the Subsidiary are disclosed in the financial statements and accounts of the India EquityPortfolio and all the assets held by the Subsidiary on behalf of the Fund are to be considered as assets helddirectly by the Fund. The Subsidiary’s accounts are audited by PricewaterhouseCoopers Ltd., Mauritius.
The Subsidiary incurs and pays certain fees and expenses relating to its investment activity in India. These feesand expenses may include brokerage costs and commissions, transaction costs associated with convertingcurrency to and from Indian Rupee to United States Dollars, fees incurred by its standing proxy, corporate andregistration fees and taxes associated with the establishment and operation of the Subsidiary.
Since 30 November 2020 there is a firm intention to close the Goldman Sachs India Equity Portfolio Subsidiary.There is currently no confirmed date of closure, with an expected period of transition as investments held by theSubsidiary are moved to the Fund. It is not expected to cause any significant disruption to the operationalactivities of Goldman Sachs India Equity Portfolio.
Goldman Sachs FundsNotes to the Financial Statements
For the Year Ended 30 November 2020
55

2 Investment Object ive Pol icies
The primary investment objectives of the Portfolios are detailed in the Prospectus and in the relevantSupplements of the Prospectus.
Fund Name Strategy Name
Asia Equity Portfolio Global And Regional Equity Portfolios
China Opportunity Equity Portfolio Global And Regional Equity Portfolios
Emerging Markets Equity ESG Portfolio Global And Regional Equity Portfolios
Emerging Markets Equity Portfolio Global And Regional Equity Portfolios
Global Environmental Impact Equity Portfolio Global And Regional Equity Portfolios
Global Equity Income Portfolio Global And Regional Equity Portfolios
Global Equity Partners ESG Portfolio Global And Regional Equity Portfolios
Global Equity Partners Portfolio Global And Regional Equity Portfolios
Global Future Health Care Equity Portfolio Global And Regional Equity Portfolios
Global Future Technology Leaders Equity Portfolio Global And Regional Equity Portfolios
Global Millennials Equity Portfolio Global And Regional Equity Portfolios
India Equity Portfolio Global And Regional Equity Portfolios
Japan Equity Partners Portfolio Global And Regional Equity Portfolios
Japan Equity Portfolio Global And Regional Equity Portfolios
US Equity Portfolio Global And Regional Equity Portfolios
US Focused Growth Equity Portfolio Global And Regional Equity Portfolios
US Smaller Cap Equity Portfolio Global And Regional Equity Portfolios
US Technology Opportunities Equity Portfolio Global And Regional Equity Portfolios
Global Infrastructure Equity Portfolio Sector Equity Portfolios
Global Real Estate Equity Portfolio Sector Equity Portfolios
North America Energy & Energy Infrastructure Equity Portfolio Sector Equity Portfolios
Emerging Markets CORE® Equity Portfolio Global And Regional Core® Equity Portfolios
Europe CORE® Equity Portfolio Global And Regional Core® Equity Portfolios
Global CORE® Equity Portfolio Global And Regional Core® Equity Portfolios
Global Small Cap CORE® Equity Portfolio Global And Regional Core® Equity Portfolios
US CORE® Equity Portfolio Global And Regional Core® Equity Portfolios
US Small Cap CORE® Equity Portfolio Global And Regional Core® Equity Portfolios
Asia High Yield Bond Portfolio Fixed Income Portfolios
Emerging Markets Corporate Bond Portfolio Fixed Income Portfolios
Emerging Markets Debt Blend Portfolio Fixed Income Portfolios
Emerging Markets Debt Local Portfolio Fixed Income Portfolios
Emerging Markets Debt Portfolio Fixed Income Portfolios
Emerging Markets Short Duration Bond Portfolio Fixed Income Portfolios
Euro Short Duration Bond Plus Portfolio Fixed Income Portfolios
Europe High Yield Bond Portfolio Fixed Income Portfolios
Global Credit Portfolio (Hedged) Fixed Income Portfolios
Global ESG Enhanced Income Bond Portfolio Fixed Income Portfolios
Global Fixed Income Portfolio Fixed Income Portfolios
Global Fixed Income Portfolio (Hedged) Fixed Income Portfolios
Global High Yield Portfolio Fixed Income Portfolios
Global Sovereign Bond Portfolio Fixed Income Portfolios
Short Duration Opportunistic Corporate Bond Portfolio Fixed Income Portfolios
Sterling Credit Portfolio Fixed Income Portfolios
US Dollar Short Duration Bond Portfolio Fixed Income Portfolios
US Fixed Income Portfolio Fixed Income Portfolios
US Mortgage Backed Securities Portfolio Fixed Income Portfolios
Emerging Markets Multi-Asset Portfolio Flexible Portfolios
Global Multi-Asset Balanced Portfolio Flexible Portfolios
Goldman Sachs FundsNotes to the Financial Statements
For the Year Ended 30 November 2020
56

2 Investment Object ive Pol icies (Continued)
Fund Name Strategy Name
Global Multi-Asset Conservative Portfolio Flexible Portfolios
Global Multi-Asset Growth Portfolio Flexible Portfolios
Global Multi-Asset Income Portfolio Flexible Portfolios
US Real Estate Balanced Portfolio Flexible Portfolios
Emerging Markets Total Return Bond Portfolio Specialist Portfolios
Global Absolute Return Portfolio Specialist Portfolios
Global Fixed Income Plus Portfolio (Hedged) Specialist Portfolios
Global Strategic Income Bond Portfolio Specialist Portfolios
Global Strategic Macro Bond Portfolio Specialist Portfolios
Strategic Absolute Return Bond I Portfolio Specialist Portfolios
Strategic Absolute Return Bond II Portfolio Specialist Portfolios
Multi-Manager Dynamic World Equity Portfolio Global Manager Strategies Portfolios
Global Corporate Portfolio (Hedged) Select Portfolios
Absolute Return Tracker Portfolio Alternative Portfolios
Alternative Trend Portfolio Alternative Portfolios
3 Signif icant Accounting Pol icies
(a) Basis of Preparat ion of Financial Statements
The financial statements of the individual Portfolios are presented in their base currency while the CombinedTotal of all the Portfolios is presented in United States Dollars. The Board of Directors considers that thePortfolios’ base currency most accurately represents the economic effects of the underlying transactions, eventsand conditions of the Portfolios.
The financial statements have been prepared in accordance with Luxembourg legal regulatory requirementsrelating to investment funds. The financial statements have been prepared on a going concern basis (except forthe Portfolios where an intention to liquidate or to cease the operations has been taken by the Board of Directors)as the Directors are of the view that the Fund can continue in operational existence for the foreseeable future.
The preparation of financial statements requires the Board of Directors to make estimates and assumptions thatmay affect the amounts reported in the financial statements and accompanying notes. Refer to the Statement ofAssets and Liabilities and Note 4 where the Board of Directors was required to make certain estimates andassumptions to determine value. Actual results may differ from those estimates.
(b) Investment Transact ions, Related Investment Income and Operat ing Expenses
Investment transactions are recorded on a trade date basis plus one in accounting. Realised gains and lossesare based on the Weighted Average Cost Method. Dividend income and dividend expense are recorded on theex-dividend date and interest income and interest expense are accrued over the life of the investment. Interestincome includes accretion of market discount, original issue discounts and amortisation of premiums and isrecorded into income over the life of the underlying investment. Interest income and dividend income arerecognised on a gross basis before withholding tax, if any.
Operating expenses are recognised on an accrual basis.
(c) Transact ion Costs
Transaction costs are recognised in the Statement of Operations as part of net change in unrealised gain/(loss)on investment securities and net realised gain/(loss) on investment securities. Depositary based transactioncosts are included in ‘Depositary fees’ in the Statement of Operations.
Please refer to Note 14 for details of the Portfolios that incurred separately identifiable transaction costs.
Goldman Sachs FundsNotes to the Financial Statements
For the Year Ended 30 November 2020
57

3 Signif icant Accounting Pol icies (Continued)
(c) Transact ion Costs (Continued)
Transaction costs for fixed income investments, forward currency contracts and other derivative contracts are notseparately identifiable. For these investments, transaction costs are included in the purchase and sales price andare part of the gross investment performance of each Portfolio.
(d) Financial Investment in Securi t ies and Valuat ion
i. Recognition and Derecognition
The Portfolios recognise financial assets and financial liabilities on the date they become a party to thecontractual provisions of the investment. Purchases and sales of financial assets and financial liabilities arerecognised using trade date plus one accounting. From trade date plus one, any gains and losses arising fromchanges in value of the financial assets or financial liabilities are recorded in the Statement of Operations.
Financial assets are derecognised when the rights to receive cash flows from the investments have expired or thePortfolio has transferred substantially all risks and rewards of ownership.
ii. Value Measurement Principles
The value of all securities and derivatives is determined according to the following policies:
(ii.1) Exchange Listed Assets and Liabilities
The value of exchange traded financial investments, including transferable securities admitted to an officialexchange listing or dealt in on any other regulated market that operates regularly, which comprise CommonStocks, Bonds, Rights, Warrants, Mutual Funds, Preferred Stocks, Options and Futures Contracts, are valuedbased upon quoted market prices at the period end date without any deduction for estimated future transactioncosts.
(ii.2) Debt Securities
Debt securities, comprising Bonds, Non-Agencies Asset Backed Obligations and Agencies Asset BackedObligations, are valued at mid or bid depending on fund methodology, by third party service providers without anydeduction for estimated future transaction costs.
Included within debt securities are mortgage-backed security To Be Announced (“TBA”) commitments. Thesecommitments reflect future dated purchases and sales of agency Mortgage Backed Securities (“MBS”). CertainPortfolios use these forward commitments to efficiently manage exposure to MBS. In addition, certain Portfoliosmay enter into “Dollar Roll” transactions, principally using TBAs, in which the Portfolios commit to simultaneouslysell and repurchase MBS for delivery in future months. The Portfolios must maintain liquid securities having avalue not less than the repurchase price (including accrued interest) for such forward commitments. The marketvalue of the securities that the Portfolios are committed to purchase may decline below the agreed uponpurchase price of those securities.
When a debt security has been identified as being in default, the interest accrual on the defaulted security maybe stopped, and upon confirmation from relevant parties, the amount receivable may be written off.
(ii.3) Certificates of Deposit and Money Market Investments
Certificates of Deposit, comprising Time Deposits and Commercial Paper, and Money Market Investments arevalued at mid (or bid for fixed income securities held by Global Corporate Portfolio (Hedged)) by third partyservice providers, or where such pricing service is unavailable, at cost which approximates market value.
(ii.4) Shares in Collective Investment Schemes
The value of investments in open-ended investment funds, comprising Mutual Funds, are valued based upon theofficial net asset values per share as at the last available date as supplied by the funds, in accordance with thevaluation policy of the applicable fund as outlined in its prospectus.
Goldman Sachs FundsNotes to the Financial Statements
For the Year Ended 30 November 2020
58

3 Signif icant Accounting Pol icies (Continued)
(d) Financial Investment in Securi t ies and Valuat ion (Continued)
ii. Value Measurement Principles (Continued)
(ii.5) Derivatives
A derivative is an instrument whose value is derived from an underlying instrument, index reference rate or acombination of these factors. Derivative instruments may be privately negotiated contracts which are oftenreferred to as over the counter (“OTC”) derivatives or they may be listed and traded on an exchange. Derivativecontracts may involve future commitments to purchase or sell financial instruments or commodities at specifiedterms on a specified date, or to exchange interest payment streams or currencies based on a notional orcontractual amount.
Derivative contracts are stated at market value and recognised as assets and liabilities in the Statement ofAssets and Liabilities. Gains and losses resulting from the change in the market value are reflected in theStatement of Operations as a component of net change in unrealised gain/(loss). Realised gains or losses arerecorded on termination or from periodic cash flow payments.
(ii.5) (a) Option Contracts
The Portfolios may enter into exchange traded and OTC option contracts with various counterparties. When thePortfolio purchases an option, an amount equal to market value which is based on the premium paid is recordedas an asset, the value of which is marked-to-market daily. When the Portfolio writes an option, an amount equalto market value which is based on the premium received by the Portfolio is recorded as a liability and is adjustedto the market value of the option written on each valuation date.
When options are closed, the difference between the premium and the amount paid or received, net of brokeragecommissions, or the full amount of the premium if the option expires worthless, is treated as realised gain or loss.The exercise of an option written by the Portfolio could result in the Portfolio buying or selling a financialinstrument at a price different from the current market value.
The fair value of an OTC contract is determined by using counterparty supplied valuations, an independentpricing service or valuation models which use market data inputs supplied by a third party pricing service, and istypically valued at mid. Exchange traded options are valued based on the exchange settlement/last sale prices,or, if the last settlement price is not available for any reason, at the midpoint of the bid and ask prices (or, in theabsence of two-way trading, at the last bid price for long positions and the last ask price for short positions), orindependent market quotes provided by a pricing service or counterparty.
(ii.5) (b) Futures Contracts
Futures contracts are contracts to buy or sell a standardised quantity of a specified commodity, security or indexand are valued based on exchange settlement/last sale prices, last bid or ask prices on the exchange, orindependent market quotes. Initial margin deposits, in either cash or securities, are required to trade in thefutures market. Unrealised gains or losses on futures contracts are recognised to reflect the market value of thecontracts and are included as a component of the unrealised gains or losses on the Portfolio’s Statement ofOperations. Variation margin is received or paid, depending on whether unrealised gains or losses are incurred.When the contract is terminated, the Portfolio will recognise a realised gain or loss equal to the differencebetween the value of the contract at the time it was entered into and the time it was closed.
(ii.5) (c) Swap Contracts
Swaps, comprising Interest Rate Swaps, Credit Default Swaps and Total Return Swaps, can be linked to anynumber of underlying investments and indices, and swap terms can vary greatly. Cash flows are exchangedbased on the underlying. Upfront payments, which represent a risk premium, are amortised or accreted over thecontract term. Swap agreements are carried at market value, typically valued at mid, and the value of the swapagreement is based on a counterparty provided price, third party pricing service or valuation model. The modelconsiders various inputs including the market value of the underlying, the risks associated with the underlyingand the specific terms of the contract. In connection with these agreements, securities or cash may be identified
Goldman Sachs FundsNotes to the Financial Statements
For the Year Ended 30 November 2020
59

3 Signif icant Accounting Pol icies (Continued)
(d) Financial Investment in Securi t ies and Valuat ion (Continued)
ii. Value Measurement Principles (Continued)
(ii.5) Derivatives (Continued)
(ii.5) (c) Swap Contracts (Continued)
as collateral or margin in accordance with the terms of the respective swap agreements to provide assets ofvalue and recourse in the event of default or bankruptcy/insolvency. This collateral or margin is primarilydenominated in base currency, and is paid from the custody account to the broker.
For the year ended 30 November 2020, all collateral in relation to total return swaps was pledged in the form ofcash. Please refer to Note 13 for cash collateral information and to Appendix VI for more information.
Total return swaps and more specifically OTC derivative transactions are entered into by the Portfolio under anInternational Swaps and Derivatives Associations, Inc. Master Agreement (“ISDA Master Agreement”) or similaragreement. An ISDA Master Agreement is a bilateral agreement between the Portfolio and a counterparty thatgoverns OTC derivative transactions (including total return swaps) entered into by the parties.
All returns from OTC derivative transactions will accrue to the Portfolio and are not subject to any returns sharingagreement with the Portfolio’s manager or any other third parties.
(ii.5) (d) Forward Foreign Currency Contracts
In a forward foreign currency contract, the Portfolio agrees to receive or deliver a fixed quantity of one currencyfor another, at a pre-determined price at a future date. Purchases and sales of forward foreign currency contractshaving the same notional value, settlement date and counterparty and right to settle net are generally offset(which result in a net foreign currency position of zero with the counterparty) and any realised gains or losses arerecognised on trade date plus one.
Forward foreign currency contracts are valued at mid by third party pricing service providers.
(ii.5) (e) Non-Deliverable Bond Forward Contracts
Non-Deliverable Bond Forward Contracts are financial derivative instruments which differ from normal BondForward contracts in that there is no physical settlement of the reference security at maturity. Instead, a net cashsettlement (usually in USD) will be made by one party to the other based on the movement of the referencesecurity. Any realised gains and losses are recognised on trade date plus one. Non-Deliverable Bond ForwardContracts are valued at mid by a third party pricing service providers.
(ii.5) (f) Covered Forward Mortgage Backed Securities
Covered forward mortgage backed securities represents TBA sales covered by long FNMA positions, and aretypically valued at mid.
(ii.5) (g) All Securities and Derivatives
If a quoted market price is not available from a third party pricing service or a dealer, or a quotation is believed tobe materially inaccurate, the market value of the investment is determined by using valuation techniques.Valuation techniques include the use of recent market transactions, reference to the current market value ofanother investment that is substantially the same, discounted cash flow analyses or any other techniques thatprovides a reliable estimate of prices obtained in actual market transactions. Such securities and derivativesshall be valued at their probable realisation value as determined by the Valuer. Please refer to note 4 for furtherdetails.
The investments have been valued in accordance with generally accepted accounting principles that may requirethe use of certain estimates and assumptions to determine value. Although these estimates and assumptionsare based on the best available information, actual results could be materially different from these estimates.
Goldman Sachs FundsNotes to the Financial Statements
For the Year Ended 30 November 2020
60

3 Signif icant Accounting Pol icies (Continued)
(d) Financial Investment in Securi t ies and Valuat ion (Continued)
ii. Value Measurement Principles (Continued)
(ii.5) Derivatives (Continued)
(ii.5) (g) All Securities and Derivatives (Continued)
Refer to Note 4 for securities where the Valuer was used to determine probable realisation value.
(e) Cash
Cash is valued at cost, which approximates market value.
( f ) Due from/to Brokers
Due from brokers consists primarily of cash receivable for collateral from the Portfolios’ clearing brokers andvarious counterparties. Due to brokers consists primarily of cash payable for collateral to the Portfolios’ clearingbrokers and various counterparties.
Due from/to broker balances are valued at cost, which approximates market value. Refer to Note 13 for furtherdetails.
(g) Foreign Currency Translat ion
The books and records of all Portfolios are maintained in their base currency. Please refer to Appendix I for thebase currency of each Portfolio. Transactions in foreign currencies are translated at the foreign currencyexchange rate in effect at the date of the transaction. Assets and liabilities denominated in foreign currencies aretranslated into base currency at the foreign currency closing exchange rate in effect at the year end date. Foreigncurrency exchange differences arising on translation and realised gains and losses on disposals or settlementsof assets and liabilities are recognised in the Statement of Operations. Foreign currency exchange gains orlosses relating to investments, derivative financial investments, and all other foreign currency exchange gains orlosses relating to monetary items, including cash and cash equivalents, are reflected in the net realised gain/(loss) or net change in unrealised gain/(loss) in the Statement of Operations.
(h) Expenses
Expenses incurred by the Fund that do not specifically relate to an individual Portfolio or Share Class of the Fundare allocated to the Portfolios based on an allocation basis that depends upon the nature of the charges.Expenses directly attributable to a Portfolio or Share Class are generally charged to that Portfolio or Share Class.
( i ) �Snap” and “Close” Valuat ion
In the case of certain Portfolios, the Fund may decide to issue Share Classes which have different ValuationPoints, termed “snap” and “close”, where the “snap” Valuation Point takes a value at a time other than at marketclose and “close” takes the value based on market closing prices. In consequence, the net asset values andperformance per share of such Share Classes are expected to differ from each other as a result of theapplication of different Valuation Points.
For the year ended 30 November 2020, such “snap” and “close” Share Classes as described above areapplicable to:
• Japan Equity Partners Portfolio• Japan Equity Portfolio• Emerging Markets CORE® Equity Portfolio• Global CORE® Equity Portfolio• Global Small Cap CORE® Equity Portfolio• US CORE® Equity Portfolio• US Small Cap CORE® Equity Portfolio
Goldman Sachs FundsNotes to the Financial Statements
For the Year Ended 30 November 2020
61

3 Signif icant Accounting Pol icies (Continued)
( i ) �Snap” and “Close” Valuat ion (Continued)
The Statement of Assets and Liabilities, the Statement of Operations, the Statement of Changes inShareholders’ Equity and the Schedules of Investments have been presented using prices as of “snap” of allmarkets as of 30 November 2020. If the Schedules of Investments, the Statement of Assets and Liabilities, theStatement of Operations and the Statement of Changes in Shareholders’ Equity were to be presented using the“close” prices, then the total market value and the Shareholders’ Equity would vary as follows:
Market Value of Investments andForeign Currencies including
Unrealised Gain/(Loss) on Futures Shareholders’ Equity
Portfolios Currency Snap Close Variation Snap Close VariationPercentageVariation
Japan Equity Partners Portfolio* JPY 175,094,927 174,488,153 (606,774) 178,517,294 177,910,520 (606,774) (0.34%)
Japan Equity Portfolio* JPY 124,186,354 123,729,523 (456,831) 126,195,862 125,739,031 (456,831) (0.36%)
Emerging Markets CORE® EquityPortfolio USD 2,679,108,595 2,667,422,415 (11,686,180) 2,714,209,308 2,702,523,128 (11,686,180) (0.43%)
Global CORE® Equity Portfolio USD 3,731,777,614 3,717,930,492 (13,847,122) 3,741,624,886 3,727,777,764 (13,847,122) (0.37%)
Global Small Cap CORE® EquityPortfolio USD 455,085,821 451,382,961 (3,702,860) 455,713,402 452,010,542 (3,702,860) (0.81%)
US CORE® Equity Portfolio USD 1,715,115,473 1,712,870,328 (2,245,145) 1,745,560,224 1,743,315,079 (2,245,145) (0.13%)
US Small Cap CORE® Equity Portfolio USD 214,161,022 211,677,670 (2,483,352) 216,142,387 213,659,035 (2,483,352) (1.15%)
* Expressed in ‘000
( j ) Income Equal isat ion Arrangements
Income equalisation arrangements may be applied in some or all of the Portfolios of the Fund. Where they areapplied, these arrangements are intended to ensure that the income per share which is distributed or deemeddistributed in respect of a distribution period is not affected by changes in the number of shares in issue duringthat period, and the amount of the first distribution received by a Shareholder in an impacted Portfolio followingthe purchase of shares in that Portfolio will represent partly participation in income received by the Portfolio andpartly a return of capital (the “equalisation amount”). The equalisation amounts are included within the proceedsfrom shares issued and the payment for shares redeemed in the Statements of Changes in Shareholders’ Equity.
(k) Swing Pricing
On any Business Day the Management Company in consultation with its appointed delegate, Goldman SachsAsset Management International (“GSAMI”) as Investment Adviser, in conformity with guidelines established bythe Board of Directors, may determine to apply swing pricing (to include such reasonable factors as they see fit)to the net asset value per share. This method of net asset value calculation is intended to pass the estimatedcosts of underlying investment activity of the Portfolio to the active Shareholders by adjusting the net asset valueof the relevant share and thus to protect the Portfolio’s long-term Shareholders from costs associated withongoing redemption and subscription activity. This is processed as a capital adjustment.
Swing pricing may take account of trading spreads on the Portfolio’s investments, the value of any duties andcharges incurred as a result of trading and may include an estimate of market impact. Where GSAMI, based onthe prevailing market conditions and the level of subscriptions or redemptions requested by Shareholders orpotential Shareholders in relation to the size of the relevant Portfolio, have determined for a particular Portfolio toapply swing pricing, the Portfolio’s net asset value may be valued either on a bid or offer basis.
Because the determination of whether to value the Portfolio’s net asset value on a bid or offer basis is based onthe net transaction activity of the relevant day, Shareholders transacting in the opposite direction of thePortfolio’s net transaction activity may benefit at the expense of the other Shareholders in the Portfolio. Inaddition, the Portfolio’s net asset value and short-term performance may experience greater volatility as a resultof swing pricing.
Investors should be aware that, the factor used to apply swing pricing (“swing factor”) will under normalconditions not exceed 2% of the net asset value per share of the relevant Share Class of the Portfolio, unlessotherwise stated in the relevant Supplement. Notwithstanding the above, where exceptional circumstances(including, but not limited to, widening bid offer spreads often as a result of high market volatility and/or illiquidity,
Goldman Sachs FundsNotes to the Financial Statements
For the Year Ended 30 November 2020
62

3 Signif icant Accounting Pol icies (Continued)
(k) Swing Pricing (Continued)
exceptional market conditions market disruptions) the Management Company, in consultation with the Board ofDirectors, may decide, in the best interest of Shareholders and in respect of any particular Portfolio and on anyBusiness Day, to apply a swing factor which is above 2%. Shareholders will be informed on such decision via anotice and/or a publication posted on www.gsam.com. The swing factor applied to individual Portfolios will bereviewed by the Investment Adviser on a periodic basis in order to verify their appropriateness in light ofprevailing market conditions.
The following Portfolios are able to apply swing pricing:
Asia Equity Portfolio Emerging Markets Debt Local PortfolioChina Opportunity Equity Portfolio Emerging Markets Debt PortfolioEmerging Markets Equity ESG Portfolio Emerging Markets Short Duration Bond PortfolioEmerging Markets Equity Portfolio Euro Short Duration Bond Plus PortfolioGlobal Environmental Impact Equity Portfolio Europe High Yield Bond PortfolioGlobal Equity Income Portfolio Global Credit Portfolio (Hedged)Global Equity Partners ESG Portfolio Global ESG Enhanced Income Bond PortfolioGlobal Equity Partners Portfolio Global Fixed Income PortfolioGlobal Future Health Care Equity Portfolio Global Fixed Income Portfolio (Hedged)Global Future Technology Leaders Equity Portfolio Global High Yield PortfolioGlobal Millennials Equity Portfolio Global Sovereign Bond PortfolioIndia Equity Portfolio Short Duration Opportunistic Corporate Bond PortfolioJapan Equity Partners Portfolio Sterling Credit PortfolioJapan Equity Portfolio US Dollar Short Duration Bond PortfolioUS Equity Portfolio US Fixed Income PortfolioUS Focused Growth Equity Portfolio US Mortgage Backed Securities PortfolioUS Smaller Cap Equity Portfolio Emerging Markets Multi-Asset PortfolioUS Technology Opportunities Equity Portfolio Global Multi-Asset Income PortfolioGlobal Infrastructure Equity Portfolio US Real Estate Balanced PortfolioGlobal Real Estate Equity Portfolio Emerging Markets Total Return Bond PortfolioNorth America Energy & Energy Infrastructure EquityPortfolio
Global Absolute Return Portfolio
Emerging Markets CORE® Equity Portfolio Global Fixed Income Plus Portfolio (Hedged)Europe CORE® Equity Portfolio Global Strategic Income Bond PortfolioGlobal CORE® Equity Portfolio Global Strategic Macro Bond PortfolioGlobal Small Cap CORE® Equity Portfolio Strategic Absolute Return Bond I PortfolioUS CORE® Equity Portfolio Strategic Absolute Return Bond II PortfolioUS Small Cap CORE® Equity Portfolio Multi-Manager Dynamic World Equity PortfolioAsia High Yield Bond Portfolio Absolute Return Tracker PortfolioEmerging Markets Corporate Bond Portfolio Alternative Trend PortfolioEmerging Markets Debt Blend Portfolio
The reversal of the swing net asset calculation method presented in the Statement of Changes in Shareholders’Equity represents the reversal of the amount applied as at 30 November 2019.
Refer to the Statement of Assets and Liabilities and the Statement of Changes in Shareholders’ Equity for thePortfolios that applied swing pricing as at 30 November 2020.
4 Valuat ion Determined by the Valuer
The Valuer is appointed by the Management Company. The Valuer also has direct responsibilities to the Board ofDirectors for certain valuation functions, which are ultimately reflected in the financial statements. The Valuerduring the year ended 30 November 2020 was Goldman Sachs & Co. LLC and the valuation function wasperformed by Goldman Sachs Controllers Division (“Controllers”).
Goldman Sachs FundsNotes to the Financial Statements
For the Year Ended 30 November 2020
63

4 Valuat ion Determined by the Valuer (Continued)
The following table sets forth the assets where the Valuer was used to determine the probable realisationvalue as at 30 November 2020:
As at 30 November 2020
Portfolios Currency Number ofAssets valued Value % of Shareholders’ equity
China Opportunity Equity Portfolio USD 1 0 0.00%
Global Real Estate Equity Portfolio USD 1 177 0.00%
Europe High Yield Bond Portfolio EUR 1 323 0.00%
Securities traded on certain Asia Pacific/Middle Eastern exchanges may utilise international equity adjustedprices provided by an independent third party pricing service in order to more accurately reflect the value ofsecurities traded on markets which are closed at the valuation point.
The independent valuation service takes into account multiple factors including, but not limited to, movements inthe securities markets, certain depositary receipts, futures contracts and foreign currency exchange rates thathave occurred subsequent to the close of the foreign securities exchange. These investments are not included inthe above table.
5 Taxat ion
Taxation – Luxembourg
The Fund is not liable for any Luxembourg tax on profits or income. However, the Fund is liable in Luxembourg toan annual subscription tax (taxe d’abonnement) of 0.05% per annum. The taxable basis of the subscription taxis the aggregate net assets of the Fund as valued on the last day of each quarter. This rate is however 0.01% perannum for each of the following:
• undertakings whose exclusive object is the collective investment in money market instruments and theplacing of deposits with credit institutions;
• undertakings whose exclusive object is the collective investment in deposits with credit institutions; and• individual compartments of undertakings for collective investment (“UCI”) with multiple compartmentsreferred to in the law dated 17 December 2010, as amended, as well as for individual classes of securitiesissued within a UCI or within a compartment of a UCI with multiple compartments, provided that the securitiesof such compartments or classes are reserved to one or more institutional investors.
Taxation – Belgium
The Fund may incur a liability to subscription tax at the rate of 0.0925% in respect of subscriptions made throughintermediaries situated in Belgium to the extent that net shares are outstanding as of 31 December of theprevious year.
Taxation – Subsidiary
The Governments of India and Mauritius signed a protocol on 10 May 2016 by virtue of which capital gains on allIndian investments made until 31 March 2017 would continue to be exempt from Indian tax under theIndia-Mauritius Treaty, irrespective of when they are sold. Short term capital gains arising on sale of equityshares sold on or after and from 1 April 2019 are taxable at the full capital gains tax rate as per the Indian taxlaws. Long term capital gains were exempt up till March 2018 provided they were traded on the recognised stockexchange in India and suffered securities transaction tax. With effect from April 2018, these have been madetaxable at the applicable rates provided under the India tax laws. The Fund will continue to actively monitor anyfuture developments in the Indian domestic tax laws with respect to taxation of capital gains as well as anychanges with respect to the India-Mauritius Treaty and assess the impact of future tax law changes to the extentapplicable to it.
Goldman Sachs FundsNotes to the Financial Statements
For the Year Ended 30 November 2020
64

5 Taxat ion (Continued)
Taxation – General
Each Portfolio may be subject to taxation on capital gains, interest and dividends in certain jurisdictions in whicheach Portfolio invests. It is the policy of each Portfolio to accrue for any such taxes on dividends and interestwhen the dividend is declared, interest is earned or capital gains are realised. At each valuation date, taxation onrealised and unrealised appreciation of securities may be accrued for at statutory rates.
Prospective investors should consult their own taxation advisers regarding the tax implications of investing in theFund in relation to their own individual circumstances as they may differ from the general statements that appearabove.
6 Signif icant Agreements and Related Part ies
Management Company
As outlined in Note 1, the Fund appointed GSAMFSL, a wholly-owned indirect subsidiary of The Goldman SachsGroup, Inc., as its Management Company.
The Portfolios pay the Management Company an annual fee which shall be accrued daily and generally paidmonthly in arrears.
Investment Adviser and Investment Sub-Advisers
The Management Company has appointed GSAMI (the “Investment Adviser”), a related party to the Fund, as itsdelegate to provide portfolio management services.
GSAMI has entered into sub-delegation agreements with each of the following affiliated InvestmentSub-Advisers:
• Goldman Sachs Asset Management, L.P.• Goldman Sachs Asset Management (Hong Kong) Ltd.• Goldman Sachs Asset Management (Singapore) Pte. Ltd.• Goldman Sachs Asset Management Co., Ltd.• Goldman Sachs Hedge Fund Strategies, LLC• Goldman Sachs International• GS Investment Strategies, LLC
GSAMI has entered into sub-advisory agreements with each of the following external Investment Sub-Advisers(“the External Managers”):
Portfolios External Managers*
Multi-Manager Dynamic World Equity Portfolio Artisan Partners UK LLPEagle Capital Management LLCHarris Associates LPWCM Investment Management
* None of these investment advisers are an affiliate of GSAMI. As compensation for the services rendered under the InvestmentAdvisory Agreement, GSAMI receives a fee, payable monthly, at an annual rate. A portion of the Investment Adviser’s fees may beremitted to the Investment Sub-Adviser.
Expense Cap
GSAMI has voluntarily agreed to limit total expenses in respect of certain Portfolios and certain Share Classes.Therefore, to the extent that total ordinary expenses would exceed the expense cap, GSAMI has voluntarilyagreed to bear any actual operating expenses that exceed any expense cap, either directly by waiving a portionof its fees or by reimbursement to the account of the relevant Share Class. The Investment Adviser may, in itssole discretion, designate which expenses of the Fund will be subject to any such expense cap imposed by theInvestment Adviser. The expense cap does not include the GSAMI fee portion paid to external Investment
Goldman Sachs FundsNotes to the Financial Statements
For the Year Ended 30 November 2020
65

6 Signif icant Agreements and Related Part ies (Continued)
Expense Cap (Continued)
Sub-Advisers. There is no guarantee that the existence or level of these expense caps will continue in the futureand no obligation on the part of GSAMI to agree to limit total expenses in this way. In addition, the Portfolios arenot obliged to reimburse GSAMI for prior financial year expense reimbursement, if any.
Details of advisory fee rates and the expense caps as at 30 November 2020 are detailed in Appendix I.
Directors’ Remuneration
Ms. Grainne Alexander and Mr. Frank Ennis are independent Directors and have no executive function with theInvestment Adviser or its affiliated companies. The Fund pays each independent Director an annual fee for theirservices as a Director of the Fund.
Mr. Jonathan Beinner, Mr. Glenn Thorpe and Ms. Katherine Uniacke are affiliated with the Investment Adviser andreceive no compensation from the Fund.
Performance Fees
GSAMI is entitled to a performance fee on certain Portfolios. For the Strategic Absolute Return Bond I Portfolioand Strategic Absolute Return Bond II Portfolio the performance fee accrues daily and is paid annually out of theassets attributable to each Share Class of the Portfolios. The performance fee is equal to 20% of the amount bywhich the Class NAV per share exceeds such Class’ Benchmark Value per share, as defined within theProspectus.
For the Emerging Markets Total Return Bond Portfolio the performance fee accrues daily and is paid annually outof the assets attributable to each Share Class of the Portfolio. The performance fee is equal to 15% of theamount by which the Class NAV per share exceeds such Class’s Benchmark Value per share, as defined withinthe Prospectus.
For the Global Strategic Macro Bond Portfolio the performance fee accrues daily and is paid annually out of theassets attributable to each Share Class of the Portfolios. The performance fee is equal to 10% of the amount bywhich the Class NAV per share exceeds such Class’ Benchmark Value per share, as defined within theProspectus.
Fees earned on other Goldman Sachs Funds
To the extent permitted by applicable law and the terms of the Prospectus, any Portfolio may invest all or someof its short term cash investments in any money market fund advised or managed by Goldman Sachs and mayinvest in other investment funds advised or managed by Goldman Sachs (together “Goldman Sachs Funds”).Subject to applicable law and the terms of the Prospectus, the Fund may be required to bear its proportionateshare of any fees (including investment advisory and management fees) applicable to its investment in suchinvestment funds.
For further details on investments into other Goldman Sachs Funds please refer to the Schedules ofInvestments.
All Portfolios invested in the Goldman Sachs Funds were invested in the non-investment advisory fee bearingshare classes. As a result, for the year ended 30 November 2020, there were no investment advisory fees earnedon each Portfolio’s investment in the Goldman Sachs Funds.
Commissions
In the normal course of its operations, each Portfolio may enter into transactions on securities or futurescontracts with the Goldman Sachs Funds or other Goldman Sachs affiliates (together “Goldman SachsAffiliates”).
Goldman Sachs FundsNotes to the Financial Statements
For the Year Ended 30 November 2020
66

6 Signif icant Agreements and Related Part ies (Continued)
Commissions (Continued)
For the year ended 30 November 2020, the following transactions were entered into with Goldman SachsAffiliates with total brokerage commissions paid to Goldman Sachs Affiliates being split between commissionsrelated to security transactions and futures contracts:
Security Transactions Brokerage Commissions
Portfolios Currency Aggregate Value*
Percent oftotal securitytransactions Aggregate Value
Percent oftotal brokeragecommissions
FuturesCommissions**
Asia Equity Portfolio USD — — — — 1,658
BRICs Equity Portfolio USD — — — — 1,109
Emerging Markets Equity ESG Portfolio USD 69,403 0.06% 69 0.05% —
Emerging Markets Equity Portfolio USD 4,178,066 0.17% 3,787 0.16% —
Global Equity Partners ESG Portfolio USD 421,726 0.79% 88 0.61% —
Global Equity Partners Portfolio USD 12,339,936 1.54% 2,567 0.70% —
Global Future Technology Leaders Equity Portfolio USD 125,202,398 2.86% 19,980 1.14% —
Global Millennials Equity Portfolio USD 736,344 0.05% 515 0.08% —
India Equity Portfolio USD 20,297,669 1.58% 37,841 1.79% 67,815
Japan Equity Partners Portfolio*** JPY 31,800,068 12.72% 7,526 8.41% 3,156
Japan Equity Portfolio*** JPY 16,267,227 6.21% 13,474 7.74% 508
N-11® Equity Portfolio USD 22,962 0.03% 23 0.04% —
US Equity Portfolio USD 1,553,800 0.17% 560 0.23% —
US Focused Growth Equity Portfolio USD 989,388 4.16% 432 7.60% —
US Technology Opportunities Equity Portfolio USD 161,152 0.10% 27 0.25% —
Global Infrastructure Equity Portfolio USD 85,260 0.46% 60 0.66% —
North America Energy & Energy InfrastructureEquity Portfolio
USD 140,520 0.17% 137 0.22% —
Emerging Markets CORE® Equity Portfolio USD 1,704,330 0.02% 1,704 0.04% 13,489
Europe CORE® Equity Portfolio EUR — — — — 24,474
Global CORE® Equity Portfolio USD — — — — 7,504
US Small Cap CORE® Equity Portfolio USD — — — — 928
Emerging Markets Corporate Bond Portfolio USD — — — — 166,225
Emerging Markets Debt Local Portfolio USD — — — — 50,591
Emerging Markets Debt Portfolio USD — — — — 506,927
Euro Short Duration Bond Plus Portfolio EUR 5,613,070 0.16% — — 21,883
Europe High Yield Bond Portfolio EUR 1,476,065 0.45% — — 481
Global Credit Portfolio (Hedged) USD 24,496,922 0.11% — — 83,779
Global ESG Enhanced Income Bond Portfolio USD 1,254,709 1.15% — — —
Global Fixed Income Portfolio USD 592,468 0.01% — — 14,125
Global Fixed Income Portfolio (Hedged) EUR 8,708,206 0.03% — — 74,868
Global High Yield Portfolio USD — — — — 140,512
Sterling Credit Portfolio GBP 1,137,138 0.22% — — 1,639
US Fixed Income Portfolio USD — — — — 6,622
US Mortgage Backed Securities Portfolio USD — — — — 14,005
Emerging Markets Multi-Asset Portfolio USD 10,681 0.01% 11 0.07% —
US Real Estate Balanced Portfolio USD — — — — 11,980
Global Absolute Return Portfolio USD 225,648 0.00% 65 0.20% —
Global Fixed Income Plus Portfolio (Hedged) EUR 504,028 0.00% — — 165,666
Global Strategic Income Bond Portfolio USD — — — — 367,608
Strategic Absolute Return Bond I Portfolio USD — — — — 88,926
Strategic Absolute Return Bond II Portfolio USD — — — — 51,850
Goldman Sachs FundsNotes to the Financial Statements
For the Year Ended 30 November 2020
67

6 Signif icant Agreements and Related Part ies (Continued)
Commissions (Continued)
Security Transactions Brokerage Commissions
Portfolios Currency Aggregate Value*
Percent oftotal securitytransactions Aggregate Value
Percent oftotal brokeragecommissions
FuturesCommissions**
Multi-Manager Dynamic World Equity Portfolio USD 53,156,416 6.04% 12,845 3.76% —
Global Corporate Portfolio (Hedged) NOK — — — — 1,034,928
Total (in USD) **** 715,910,625 276,599 2,066,663
* Represents the cost of securities (excluding futures transactions and investments in the Goldman Sachs Liquid Reserves Funds) fortransactions entered into with Goldman Sachs Affiliates.
** All portfolio futures transactions disclosed in this table were affected through Goldman Sachs.*** Expressed in ‘000**** The amount used is calculated using the average exchange rates disclosed in Note 10.
For all the remaining Portfolios, there were no transactions with Goldman Sachs Affiliates, for the year ended30 November 2020.
All such transactions, including those with Goldman Sachs Affiliates, were entered into in the ordinary course ofbusiness and on normal commercial terms.
Securities Lending
The securities lending agent is Goldman Sachs Agency Lending (“GSAL”), an affiliate of Goldman Sachs.Approved borrowers of GSAL may include Goldman Sachs International (“GSI”), an affiliate of the InvestmentAdviser, as well as other third parties. The Portfolios may lend portions of investments to third parties. In return,the Portfolios receive a fee that is negotiated for each transaction. The Portfolios receive G-10 (excluding Italy,Japan and the United States) government securities as collateral against the securities loaned. G-10 is made ofeleven industrial countries (Belgium, Canada, France, Germany, Italy, Japan, the Netherlands, Sweden,Switzerland, the United Kingdom and the United States) which consult and co-operate on economic, monetaryand financial matters. This collateral is maintained over the life of the loan for an amount not less than 105% ofthe value of lent securities, with any subsequent margin posted in the form of the aforementioned governmentsecurities or cash. In general, loans may be effected through the intermediary of prime financial institutions thatspecialise in such activities and in the way specified by them.
Collateral received by Portfolios in the form of G-10 (excluding Italy, Japan and the United States) governmentsecurities or cash, denominated in their respective currencies, is held by the appointed tri-party collateralmanager in segregated accounts.
The following summarises the securities lent as at 30 November 2020 and the income earned by each Portfolioand the fees earned by Securities Lending Agent that is part of the Securities Lending program:
Portfolios Currency
MarketValue of
SecuritiesLent as at
30-Nov-2020
% ofShareholders’
Equity
% of TotalLendableAssets*
MarketValue ofCollateralReceived
as at30-Nov-2020
Collateralas a
Percentageof theMarketValue of
SecuritiesLent as at
30-Nov-2020
GrossIncome
Earned forthe YearEnded
30-Nov-2020
FeesChargedfor theYear
Ended30-Nov-2020
Net IncomeEarned forthe YearEnded
30-Nov-2020
Asia Equity Portfolio USD — — — — — 1,408 141 1,267
Emerging Markets Equity Portfolio USD 50,263,373 1.23% 1.28% 55,415,691 110% 227,776 22,778 204,998
Global Equity Partners Portfolio USD 23,765,959 2.32% 2.39% 26,201,972 110% 18,999 1,900 17,099
Global Millennials Equity Portfolio USD 15,717,675 1.19% 1.24% 17,328,736 110% 373,786 37,379 336,407
Japan Equity Partners Portfolio** JPY — — — — — 13,896 1,390 12,506
Japan Equity Portfolio** JPY 924,509 0.73% 0.76% 1,019,374 110% 44,590 4,459 40,131
US Equity Portfolio USD — — — — — 234 23 211
North America Energy & EnergyInfrastructure Equity Portfolio
USD 3,881,759 9.90% 10.33% 4,778,845 123% 24,026 2,403 21,623
Emerging Markets CORE® Equity Portfolio USD 1,830,096 0.07% 0.07% 2,017,683 110% 320,491 32,049 288,442
Europe CORE® Equity Portfolio EUR 13,174,849 0.71% 0.72% 14,708,963 112% 450,579 45,058 405,521
Global CORE® Equity Portfolio USD 3,235,206 0.09% 0.09% 3,567,330 110% 373,969 37,397 336,572
Global Small Cap CORE® Equity Portfolio USD 2,099,674 0.46% 0.47% 2,314,924 110% 91,974 9,197 82,777
US CORE® Equity Portfolio USD — — — — — 29,452 2,945 26,507
Goldman Sachs FundsNotes to the Financial Statements
For the Year Ended 30 November 2020
68

6 Signif icant Agreements and Related Part ies (Continued)
Securities Lending (Continued)
Portfolios Currency
MarketValue of
SecuritiesLent as at
30-Nov-2020
% ofShareholders’
Equity
% of TotalLendableAssets*
MarketValue ofCollateralReceived
as at30-Nov-2020
Collateralas a
Percentageof theMarketValue of
SecuritiesLent as at
30-Nov-2020
GrossIncome
Earned forthe YearEnded
30-Nov-2020
FeesChargedfor theYear
Ended30-Nov-2020
Net IncomeEarned forthe YearEnded
30-Nov-2020
US Small Cap CORE® Equity Portfolio USD 716,875 0.33% 0.33% 790,354 110% 47,742 4,774 42,968
Global High Yield Portfolio USD 35,745,477 1.16% 1.22% 39,409,390 110% 54,917 5,492 49,425
US Real Estate Balanced Portfolio USD — — — — — 8,384 838 7,546
Multi-Manager Dynamic World EquityPortfolio
USD 1,908,176 0.27% 0.28% 2,103,766 110% 18,452 1,845 16,607
Total (in USD) *** 2,646,979 264,702 2,382,277
* Lendable assets are defined as the aggregate market value of equities and bonds held in the portfolio.** Expressed in ‘000*** The amount is calculated using the average exchange rates disclosed on Note 10.
Administrator, Domiciliary Agent and Listing Agent
The Management Company has appointed State Street Bank International GmbH, Luxembourg Branch as thecentral administration agent of the Fund. The Fund has appointed State Street Bank International GmbH,Luxembourg Branch as its domiciliary and corporate agent, paying agent and as its listing agent in Luxembourg.
For its services as an Administrator, Domiciliary Agent and Listing Agent, State Street Bank International GmbH,Luxembourg Branch receives a fee payable monthly in arrears and calculated on the Monthly Average NetAssets of each Portfolio.
For India Equity Portfolio, State Street Bank International GmbH, Luxembourg Branch receives a flat fee ofUSD 25,000 for Administrator services. State Street Bank International GmbH, Luxembourg Branch may alsoreceive Custodian fees in respect of any residual assets held by the India Equity Portfolio.
For its Financial Reporting Services, State Street Bank International GmbH, Luxembourg Branch receives afixed fee per annum per Portfolio payable monthly in arrears.
Depositary
The Fund has appointed State Street Bank International GmbH, Luxembourg Branch as Depositary. For itsservices as Depositary, State Street Bank International GmbH, Luxembourg Branch charges a fee which is acombination of a basis point charge on assets and transaction-based charge which is dependent on the countryof transaction.
Distributor
The Fund has appointed the Management Company as global distributor and the Management Companyappoints sub-distributors and oversees them. GSAMFSL may receive a portion of the sales charge imposed onthe sale of Portfolio shares. Please see the table below which details the value of retained sales charges perPortfolio.
Portfolios CurrencySales
Charge
Emerging Markets Equity Portfolio USD 27,190
Global CORE® Equity Portfolio USD 186,214
Emerging Markets Corporate Bond Portfolio USD 407
Emerging Markets Debt Portfolio USD 2,099
Global Multi-Asset Income Portfolio USD 69,198
Total (in USD) 285,108
For the year ended 30 November, 2020, there were no retained sales charges for all other remaining Portfolios.
Goldman Sachs FundsNotes to the Financial Statements
For the Year Ended 30 November 2020
69

6 Signif icant Agreements and Related Part ies (Continued)
Distributor (Continued)
Please refer to Prospectus for further details about distribution fees.
Out of its fees, the Distributor is responsible for remunerating third party sub-distributors.
Transfer Agent
The Management Company has appointed RBC Investor Services Bank S.A. (the “Transfer Agent”) to performregistrar and transfer agency functions in respect of the Fund pursuant to the Registrar and Transfer AgentAgreement between the Fund, the Management Company and the Transfer Agent.
The day-to-day services provided to the Fund by the Transfer Agent include receiving and processingsubscription and redemption orders, allotting and issuing shares and maintaining the shareholder register for theshares. The Transfer Agent is paid a fee, quarterly in arrears, out of the net assets of the Portfolios. The TransferAgent’s fee consists of both a fixed and variable fee.
The fixed portion consists of an annual charge for maintenance and shareholder account charges. Variablecosts are determined by the level of transactions in each Portfolio.
Valuer
The Management Company has appointed Goldman Sachs & Co. LLC as its delegate to act as the Valuer andthe valuation function was performed by Controllers during the year ended 30 November 2020. Please also referto Note 4.
7 Share Capital
The following summarises the activity in the Portfolios’ shares for the year ended 30 November 2020.
CurrencyBalance at
30-Nov-2019 Subscriptions RedemptionsBalance at
30-Nov-2020
Asia Equity PortfolioBase Accumulation Share Class USD 64,219 34,597 18,248 80,568Base Currency Share Class USD 292,406 81,520 197,687 176,239�A� Accumulation Share Class USD 23,912 6,452 23,823 6,541�A� Share Class USD 98,723 11,028 37,837 71,914�E� Accumulation Share Class EUR 189,284 52,940 22,849 219,375�I� Accumulation Share Class USD 1,288,834 463,970 40,760 1,712,044�I� Share Class GBP 776 5 — 781�I� Share Class USD 256,237 229,807 60,233 425,811�IO� Accumulation Share Class JPY 5,938,958 367,302 1,317,395 4,988,865�P� Accumulation Share Class USD 96,863 146,906 61,394 182,375�P� Share Class USD 71,910 6,907 14,948 63,869�R� Accumulation Share Class EUR 2,127 399 142 2,384�R� Accumulation Share Class USD 250,585 1,103,555 211,368 1,142,772�R� Share Class GBP 16,829 10,001 5,946 20,884�R� Share Class USD 27,193 160,961 10,930 177,224
Asia Equity Portfolio Total 8,618,856 2,676,350 2,023,560 9,271,646
BRICs Equity Portfolio*
Base Accumulation Share Class* USD 932,247 127,624 1,059,871 —Base Accumulation Share Class (Long BRICs CCY vs. USD)* EUR 756,220 172,918 929,138 —Base Currency Share Class* USD 136,002 9,899 145,901 —Other Currency Share Class* GBP 1,554 1,901 3,455 —Other Currency Share Class* SGD 3,093 — 3,093 —�A� Share Class* USD 440,598 3,937 444,535 —�E� Accumulation Share Class* EUR 1,269,214 122,786 1,392,000 —�I� Accumulation Share Class* EUR 236,938 74,924 311,862 —�I� Accumulation Share Class* USD 226,452 188,239 414,691 —�I� Share Class* GBP 28,574 6,459 35,033 —�I� Share Class* USD 115,756 511,863 627,619 —�IO� Accumulation Share Class* GBP 175 — 175 —�P� Accumulation Share Class* USD 67,616 707 68,323 —�P� Share Class* USD 28,954 25 28,979 —�R� Accumulation Share Class* EUR 20,165 23,711 43,876 —�R� Accumulation Share Class* USD 2,363 1,099 3,462 —�R� Share Class* GBP 55,973 27,466 83,439 —�R� Share Class* USD 17,276 717 17,993 —
BRICs Equity Portfolio Total 4,339,170 1,274,275 5,613,445 —
Goldman Sachs FundsNotes to the Financial Statements
For the Year Ended 30 November 2020
70

7 Share Capital (Continued)
CurrencyBalance at
30-Nov-2019 Subscriptions RedemptionsBalance at
30-Nov-2020
China Opportunity Equity PortfolioBase Accumulation Share Class USD 11,577 39,435 5,555 45,457Base Currency Share Class USD 5,170 4,432 705 8,897�I� Accumulation Share Class USD 1,496,228 891,496 — 2,387,724�I� Share Class USD 702 5 — 707�P� Accumulation Share Class USD 301,778 434,021 180,287 555,512�P� Share Class USD 760 6,224 — 6,984�R� Accumulation Share Class USD 136,963 40,540 26,777 150,726�R� Share Class GBP 18,184 13,050 1,545 29,689�R� Share Class USD 2,301 123,227 3,030 122,498
China Opportunity Equity Portfolio Total 1,973,663 1,552,430 217,899 3,308,194
Emerging Markets Equity ESG PortfolioBase Accumulation Share Class USD 1,053,692 2,110,512 1,121,299 2,042,905Base Currency Share Class USD 1,000 20,985 — 21,985�E� Accumulation Share Class EUR 1,000 831 — 1,831�I� (Dis) (Quarterly) Share Class USD 2,346,200 — — 2,346,200�I� Accumulation Share Class EUR 908 230,793 — 231,701�I� Accumulation Share Class* GBP — 101,889 3,198 98,691�I� Accumulation Share Class USD 4,344,571 1,818,839 12,124 6,151,286�I� Share Class USD 1,000 32,322 1,300 32,022�IO� Accumulation Share Class EUR 570,121 — — 570,121�P� Accumulation Share Class* USD — 1,000 — 1,000�R� Accumulation Share Class USD 1,000 — — 1,000�R� Share Class GBP 74,091 474,960 25,268 523,783�R� Share Class USD 2,011 6,454 1,274 7,191
Emerging Markets Equity ESG Portfolio Total 8,395,594 4,798,585 1,164,463 12,029,716
Emerging Markets Equity PortfolioBase Accumulation Share Class USD 11,376,765 5,150,612 4,245,057 12,282,320Base Currency Share Class USD 563,018 240,510 185,349 618,179Other Currency Accumulation Share Class CHF 40,384 15,974 3,300 53,058Other Currency Accumulation Share Class EUR 16,733,432 1,627,176 4,585,752 13,774,856Other Currency Snap Share Class GBP 27,279 17,388 15,009 29,658�A� Accumulation Share Class USD 827,653 122,468 421,460 528,661�A� Share Class USD 325,900 121,176 164,344 282,732�B� Share Class USD 1,107 — — 1,107�E� Accumulation Share Class EUR 2,746,647 1,291,209 1,062,141 2,975,715�I� Accumulation Share Class EUR 10,047,688 2,166,636 2,443,236 9,771,088�I� Accumulation Share Class SEK 1,956,308 5,212,690 2,523,836 4,645,162�I� Accumulation Share Class USD 55,911,193 29,807,626 21,114,443 64,604,376�I� Share Class EUR 3,531,257 12 — 3,531,269�I� Share Class GBP 5,543,074 2,716,579 1,663,152 6,596,501�I� Share Class USD 3,402,369 871,816 609,164 3,665,021�IO� Accumulation Share Class GBP 975,567 226,836 767,363 435,040�IO� Accumulation Share Class USD 11,695,594 7,595,771 2,086,024 17,205,341�IS� (Dis) (Stable Semi-Annual) Share Class EUR 6,075,952 — — 6,075,952�IX� (Dis) (Cap Monthly) Share Class USD 2,127,673 201,323 1,900,971 428,025�P� Accumulation Share Class USD 1,501,994 2,135,574 1,046,156 2,591,412�P� Share Class USD 291,735 89,339 198,077 182,997�R� Accumulation Share Class CHF 135,602 85,419 57,513 163,508�R� Accumulation Share Class EUR 658,951 723,272 181,584 1,200,639�R� Accumulation Share Class USD 8,956,581 3,915,973 2,042,084 10,830,470�R� Share Class GBP 1,990,432 3,210,235 990,490 4,210,177�R� Share Class USD 594,566 586,723 267,351 913,938
Emerging Markets Equity Portfolio Total 148,038,721 68,132,337 48,573,856 167,597,202
Global Environmental Impact Equity Portfolio*
Base Accumulation Share Class* USD — 543,116 5,753 537,363Base Currency Share Class* USD — 3,500 891 2,609�E� Accumulation Share Class* EUR — 277,151 3,816 273,335�I� Accumulation Share Class* EUR — 932 — 932�I� Accumulation Share Class* GBP — 342,763 1,143 341,620�I� Accumulation Share Class* USD — 10,683,586 1,523,001 9,160,585�I� Share Class* GBP — 3,300 — 3,300�I� Share Class* USD — 1,000 891 109�P� Accumulation Share Class* GBP — 188,329 638 187,691�P� Accumulation Share Class* USD — 3,729,704 10,772 3,718,932�P� Share Class* GBP — 1,000 — 1,000�P� Share Class* USD — 1,000 900 100�R� Accumulation Share Class* GBP — 66,634 4,121 62,513�R� Accumulation Share Class* USD — 2,364,522 1,172 2,363,350�R� Share Class* GBP — 56,072 48 56,024�R� Share Class* USD — 1,000 900 100
Global Environmental Impact Equity Portfolio Total — 18,263,609 1,554,046 16,709,563
Global Equity Income PortfolioBase Accumulation Share Class USD 1,421 — — 1,421Base Currency Share Class USD 216,458 13,291 27,044 202,705
Goldman Sachs FundsNotes to the Financial Statements
For the Year Ended 30 November 2020
71
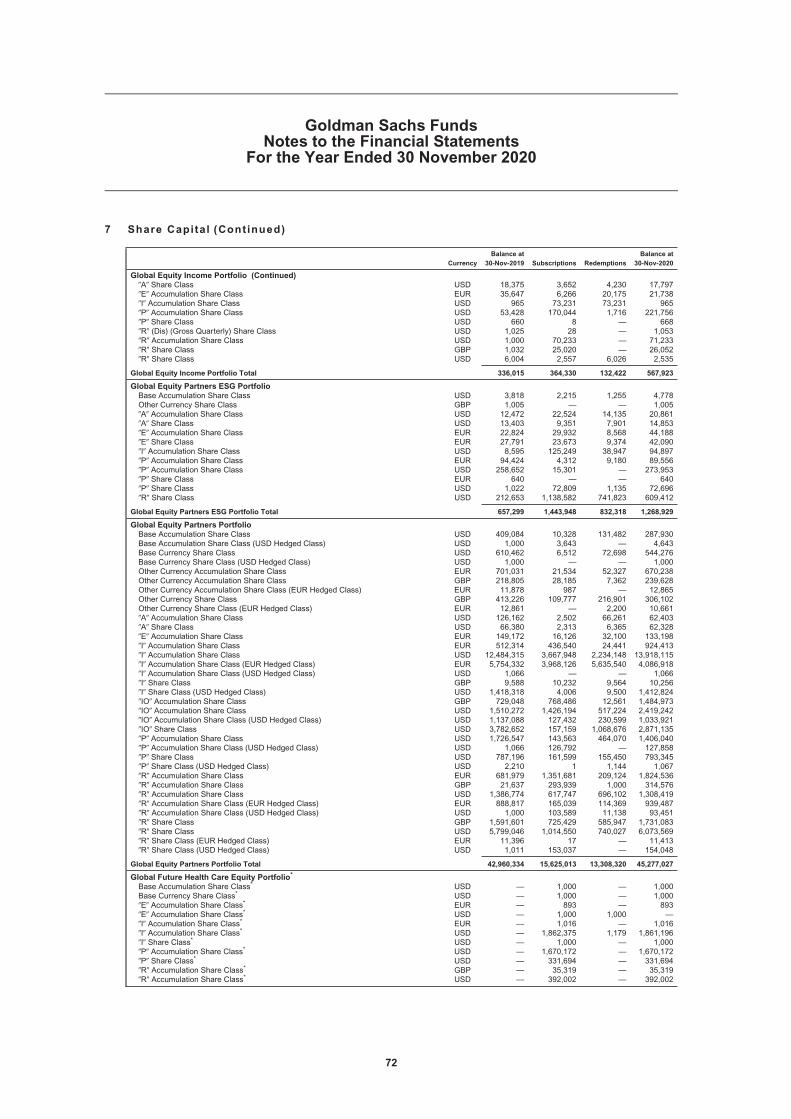
7 Share Capital (Continued)
CurrencyBalance at
30-Nov-2019 Subscriptions RedemptionsBalance at
30-Nov-2020
Global Equity Income Portfolio (Continued)�A� Share Class USD 18,375 3,652 4,230 17,797�E� Accumulation Share Class EUR 35,647 6,266 20,175 21,738�I� Accumulation Share Class USD 965 73,231 73,231 965�P� Accumulation Share Class USD 53,428 170,044 1,716 221,756�P� Share Class USD 660 8 — 668�R� (Dis) (Gross Quarterly) Share Class USD 1,025 28 — 1,053�R� Accumulation Share Class USD 1,000 70,233 — 71,233�R� Share Class GBP 1,032 25,020 — 26,052�R� Share Class USD 6,004 2,557 6,026 2,535
Global Equity Income Portfolio Total 336,015 364,330 132,422 567,923
Global Equity Partners ESG PortfolioBase Accumulation Share Class USD 3,818 2,215 1,255 4,778Other Currency Share Class GBP 1,005 — — 1,005�A� Accumulation Share Class USD 12,472 22,524 14,135 20,861�A� Share Class USD 13,403 9,351 7,901 14,853�E� Accumulation Share Class EUR 22,824 29,932 8,568 44,188�E� Share Class EUR 27,791 23,673 9,374 42,090�I� Accumulation Share Class USD 8,595 125,249 38,947 94,897�P� Accumulation Share Class EUR 94,424 4,312 9,180 89,556�P� Accumulation Share Class USD 258,652 15,301 — 273,953�P� Share Class EUR 640 — — 640�P� Share Class USD 1,022 72,809 1,135 72,696�R� Share Class USD 212,653 1,138,582 741,823 609,412
Global Equity Partners ESG Portfolio Total 657,299 1,443,948 832,318 1,268,929
Global Equity Partners PortfolioBase Accumulation Share Class USD 409,084 10,328 131,482 287,930Base Accumulation Share Class (USD Hedged Class) USD 1,000 3,643 — 4,643Base Currency Share Class USD 610,462 6,512 72,698 544,276Base Currency Share Class (USD Hedged Class) USD 1,000 — — 1,000Other Currency Accumulation Share Class EUR 701,031 21,534 52,327 670,238Other Currency Accumulation Share Class GBP 218,805 28,185 7,362 239,628Other Currency Accumulation Share Class (EUR Hedged Class) EUR 11,878 987 — 12,865Other Currency Share Class GBP 413,226 109,777 216,901 306,102Other Currency Share Class (EUR Hedged Class) EUR 12,861 — 2,200 10,661�A� Accumulation Share Class USD 126,162 2,502 66,261 62,403�A� Share Class USD 66,380 2,313 6,365 62,328�E� Accumulation Share Class EUR 149,172 16,126 32,100 133,198�I� Accumulation Share Class EUR 512,314 436,540 24,441 924,413�I� Accumulation Share Class USD 12,484,315 3,667,948 2,234,148 13,918,115�I� Accumulation Share Class (EUR Hedged Class) EUR 5,754,332 3,968,126 5,635,540 4,086,918�I� Accumulation Share Class (USD Hedged Class) USD 1,066 — — 1,066�I� Share Class GBP 9,588 10,232 9,564 10,256�I� Share Class (USD Hedged Class) USD 1,418,318 4,006 9,500 1,412,824�IO� Accumulation Share Class GBP 729,048 768,486 12,561 1,484,973�IO� Accumulation Share Class USD 1,510,272 1,426,194 517,224 2,419,242�IO� Accumulation Share Class (USD Hedged Class) USD 1,137,088 127,432 230,599 1,033,921�IO� Share Class USD 3,782,652 157,159 1,068,676 2,871,135�P� Accumulation Share Class USD 1,726,547 143,563 464,070 1,406,040�P� Accumulation Share Class (USD Hedged Class) USD 1,066 126,792 — 127,858�P� Share Class USD 787,196 161,599 155,450 793,345�P� Share Class (USD Hedged Class) USD 2,210 1 1,144 1,067�R� Accumulation Share Class EUR 681,979 1,351,681 209,124 1,824,536�R� Accumulation Share Class GBP 21,637 293,939 1,000 314,576�R� Accumulation Share Class USD 1,386,774 617,747 696,102 1,308,419�R� Accumulation Share Class (EUR Hedged Class) EUR 888,817 165,039 114,369 939,487�R� Accumulation Share Class (USD Hedged Class) USD 1,000 103,589 11,138 93,451�R� Share Class GBP 1,591,601 725,429 585,947 1,731,083�R� Share Class USD 5,799,046 1,014,550 740,027 6,073,569�R� Share Class (EUR Hedged Class) EUR 11,396 17 — 11,413�R� Share Class (USD Hedged Class) USD 1,011 153,037 — 154,048
Global Equity Partners Portfolio Total 42,960,334 15,625,013 13,308,320 45,277,027
Global Future Health Care Equity Portfolio*
Base Accumulation Share Class* USD — 1,000 — 1,000Base Currency Share Class* USD — 1,000 — 1,000�E� Accumulation Share Class* EUR — 893 — 893�E� Accumulation Share Class* USD — 1,000 1,000 —�I� Accumulation Share Class* EUR — 1,016 — 1,016�I� Accumulation Share Class* USD — 1,862,375 1,179 1,861,196�I� Share Class* USD — 1,000 — 1,000�P� Accumulation Share Class* USD — 1,670,172 — 1,670,172�P� Share Class* USD — 331,694 — 331,694�R� Accumulation Share Class* GBP — 35,319 — 35,319�R� Accumulation Share Class* USD — 392,002 — 392,002
Goldman Sachs FundsNotes to the Financial Statements
For the Year Ended 30 November 2020
72

7 Share Capital (Continued)
CurrencyBalance at
30-Nov-2019 Subscriptions RedemptionsBalance at
30-Nov-2020
Global Future Health Care Equity Portfolio* (Continued)�R� Share Class* GBP — 10,000 — 10,000�R� Share Class* USD — 1,000 — 1,000
Global Future Health Care Equity Portfolio Total — 4,308,471 2,179 4,306,292
Global Future Technology Leaders Equity Portfolio*
Base Accumulation Share Class* USD — 15,772 — 15,772Base Currency Share Class* USD — 20,669 — 20,669Other Currency Accumulation Share Class* EUR — 15,769 701 15,068�E� Accumulation Share Class* EUR — 14,424 — 14,424�I� Accumulation Share Class* USD — 7,429,371 841 7,428,530�I� Share Class* USD — 652,683 — 652,683�IO� Accumulation Share Class* USD — 197,730,610 2,005,175 195,725,435�P� Accumulation Share Class* USD — 4,660,565 261,505 4,399,060�P� Share Class* USD — 395,439 156,987 238,452�R� Accumulation Share Class* GBP — 4,930 — 4,930�R� Share Class* EUR — 155,694 — 155,694�R� Share Class* GBP — 1,000 — 1,000�R� Share Class* USD — 373,165 197 372,968
Global Future Technology Leaders Equity Portfolio Total — 211,470,091 2,425,406 209,044,685
Global Millennials Equity PortfolioBase Accumulation Share Class USD 610,782 5,129,506 1,253,978 4,486,310Base Currency Share Class USD 16,848 154,702 21,453 150,097Other Currency Accumulation Share Class* EUR — 532,628 92,629 439,999Other Currency Accumulation Share Class* HKD — 794 — 794Other Currency Accumulation Share Class* SGD — 1,371 — 1,371Other Currency Share Class EUR 550 10,611 10,611 550�E� Accumulation Share Class EUR 200,851 2,273,626 587,314 1,887,163�E� Share Class EUR 2,430,814 4,272,724 1,735,260 4,968,278�I� Accumulation Share Class EUR 1,264,962 7,312,575 1,167,614 7,409,923�I� Accumulation Share Class GBP 35,943 297,570 59,371 274,142�I� Accumulation Share Class USD 1,496,425 9,627,765 1,660,320 9,463,870�I� Share Class GBP 275 379,228 275 379,228�I� Share Class USD 1,463,191 5,762,681 313,723 6,912,149�IO� Share Class* USD — 1,441,275 — 1,441,275�P� Accumulation Share Class USD 695,971 3,389,295 894,817 3,190,449�P� Share Class USD 62,712 448,500 52,564 458,648�R� Accumulation Share Class GBP 10,649 213,520 2,193 221,976�R� Accumulation Share Class USD 499,905 3,625,281 672,768 3,452,418�R� Share Class GBP 406,486 702,962 53,753 1,055,695�R� Share Class USD 1,599,469 2,883,841 477,546 4,005,764
Global Millennials Equity Portfolio Total 10,795,833 48,460,455 9,056,189 50,200,099
India Equity PortfolioBase Accumulation Share Class USD 24,876,968 4,164,526 11,167,187 17,874,307Base Currency Share Class USD 3,772,349 460,829 1,710,441 2,522,737Other Currency Accumulation Share Class SEK 1,246,964 205,800 364,959 1,087,805Other Currency Accumulation Share Class SGD 1,000 14,454 4,146 11,308Other Currency Share Class GBP 53,086 699 33,922 19,863�A� Accumulation Share Class USD 118,088 15,968 52,108 81,948�A� Share Class USD 1,244,866 127,256 691,752 680,370�E� Accumulation Share Class EUR 3,615,231 951,823 1,698,402 2,868,652�I� Accumulation Share Class EUR 3,689,578 343,313 3,708,163 324,728�I� Accumulation Share Class USD 20,897,882 3,092,980 9,516,483 14,474,379�I� Share Class GBP 8,016,552 1,472,854 2,517,614 6,971,792�I� Share Class USD 4,255,564 394,028 3,676,767 972,825�IO� Accumulation Share Class USD 6,011,085 114,500 — 6,125,585�P� Accumulation Share Class EUR 1,024 950 — 1,974�P� Accumulation Share Class USD 1,644,369 346,071 1,052,248 938,192�P� Share Class USD 108,625 21,336 60,629 69,332�R� Accumulation Share Class EUR 1,435,311 707,380 1,000,499 1,142,192�R� Accumulation Share Class USD 6,351,441 1,322,836 3,655,463 4,018,814�R� Share Class GBP 3,289,934 838,180 1,805,401 2,322,713�R� Share Class USD 1,583,260 138,599 629,933 1,091,926
India Equity Portfolio Total 92,213,177 14,734,382 43,346,117 63,601,442
Japan Equity Partners PortfolioBase Accumulation Share Class JPY 8,092 41,773 5,195 44,670Other Currency Accumulation Share Class* EUR — 925 — 925Other Currency Accumulation Share Class (CHF Hedged Class) CHF 10,910 21,870 3,042 29,738Other Currency Accumulation Share Class (EUR Hedged Class) EUR 52,864 21,761 15,215 59,410�I� Accumulation Close Share Class JPY 375,851 477,125 34,640 818,336�I� Accumulation Share Class EUR 4,665,662 3,881,320 1,220,751 7,326,231�I� Accumulation Share Class GBP 497 265,502 10,666 255,333�I� Accumulation Share Class JPY 1,197,289 8,566,653 5,039,480 4,724,462�I� Accumulation Share Class (EUR Hedged Class) EUR 804,398 1,476,041 545,901 1,734,538�I� Accumulation Share Class (GBP Hedged Class) GBP 1,511,044 145,287 129,864 1,526,467�I� Accumulation Share Class (USD Hedged Class) USD 2,549,837 2,253,699 673,238 4,130,298
Goldman Sachs FundsNotes to the Financial Statements
For the Year Ended 30 November 2020
73

7 Share Capital (Continued)
CurrencyBalance at
30-Nov-2019 Subscriptions RedemptionsBalance at
30-Nov-2020
Japan Equity Partners Portfolio (Continued)�I� Share Class GBP 1,459,283 537,616 647,635 1,349,264�IO� Accumulation Share Class* JPY — 1,016,796 — 1,016,796�IO� Accumulation Share Class* USD — 1,102 — 1,102�P� Accumulation Share Class JPY 198,591 185,890 79,359 305,122�P� Accumulation Share Class (USD Hedged Class) USD 3,803,105 743,854 2,126,613 2,420,346�P� Share Class (GBP Hedged Class) GBP 108,875 38,216 — 147,091�P� Share Class (USD Hedged Class) USD 1,268,421 376,779 — 1,645,200�R� Accumulation Share Class JPY 455,099 140,777 65,327 530,549�R� Accumulation Share Class (EUR Hedged Class) EUR 1,196,212 1,292,656 871,791 1,617,077�R� Accumulation Share Class (GBP Hedged Class) GBP 18,303 109,359 61,660 66,002�R� Accumulation Share Class (USD Hedged Class) USD 1,106,832 1,826,320 1,498,882 1,434,270�R� Share Class* GBP — 1,073 — 1,073�R� Share Class (GBP Hedged Class) GBP 1,507,777 805,955 632,598 1,681,134
Japan Equity Partners Portfolio Total 22,298,942 24,228,349 13,661,857 32,865,434
Japan Equity PortfolioBase Accumulation Share Class JPY 218,754 15,087 65,103 168,738Base Currency Share Class JPY 1,366,399 104,428 690,039 780,788Other Currency Accumulation Share Class (EUR Hedged Class) EUR 1,235,627 200,427 458,254 977,800Other Currency Accumulation Share Class (SEK Hedged Class) SEK 61,624 3,096 26,540 38,180Other Currency Accumulation Share Class (USD Hedged Class) USD 61,226 11,181 22,389 50,018Other Currency Share Class GBP 1,183 427 43 1,567Other Currency Share Class USD 588,411 121,525 480,941 228,995�A� Share Class USD 593,865 59,414 390,490 262,789�B� Share Class USD 8,021 — — 8,021�E� Accumulation Share Class EUR 10,062,636 2,869,638 9,434,953 3,497,321�E� Accumulation Share Class (EUR Hedged Class) EUR 2,036,052 482,244 697,335 1,820,961�I� Accumulation Close Share Class JPY 7,694,966 24,385,538 22,670,758 9,409,746�I� Accumulation Share Class JPY 3,296,123 1,453,784 580,257 4,169,650�I� Accumulation Share Class (EUR Hedged Class) EUR 1,101,008 2,942,735 1,774,047 2,269,696�I� Accumulation Share Class (USD Hedged Class) USD 331,013 376,054 213,537 493,530�I� Share Class JPY 856,130 106,410 234,562 727,978�I� Share Class (GBP Hedged Class) GBP 3,792,724 2,138,699 1,532,192 4,399,231�P� Accumulation Share Class JPY 22,103 569 3,637 19,035�P� Accumulation Share Class (USD Hedged Class) USD 610,849 12,833 183,648 440,034�P� Share Class JPY 26,629 43 593 26,079�R� Accumulation Snap Share Class JPY 123,728 426,423 131,824 418,327�R� Share Class (GBP Hedged Class) GBP 9,579 1,440 1,383 9,636�R� Snap Share Class GBP 397,876 28,945 194,410 232,411�R� Snap Share Class JPY 67,993 37,637 32,511 73,119�R� Snap Share Class USD 1,078 3,294 315 4,057
Japan Equity Portfolio Total 34,565,597 35,781,871 39,819,761 30,527,707
N-11® Equity Portfolio*
Base Accumulation Share Class* USD 869,460 15,506 884,966 —Base Currency Share Class* USD 296,577 5,697 302,274 —Other Currency Accumulation Share Class* EUR 1,046,731 28,036 1,074,767 —Other Currency Share Class* EUR 200,101 11,417 211,518 —Other Currency Share Class* GBP 9,728 433 10,161 —Other Currency Share Class* SGD 1,004 2 1,006 —�E� Accumulation Share Class* EUR 1,603,313 60,221 1,663,534 —�I� Accumulation Share Class* USD 600,143 — 600,143 —�I� Share Class* GBP 1,404 10 1,414 —�I� Share Class* USD 130,519 1,470 131,989 —�P� Accumulation Share Class* USD 100,343 — 100,343 —�P� Share Class* USD 69,684 219 69,903 —�R� Accumulation Share Class* EUR 563,399 18,285 581,684 —�R� Accumulation Share Class* USD 22,215 — 22,215 —�R� Share Class* EUR 21,181 3,498 24,679 —�R� Share Class* GBP 8,157 2 8,159 —�R� Share Class* USD 108,495 594 109,089 —
N-11® Equity Portfolio Total 5,652,454 145,390 5,797,844 —
US Equity PortfolioBase Accumulation Share Class USD 17,050,421 730,086 2,956,107 14,824,400Base Currency Share Class USD 268,151 9,726 49,141 228,736Other Currency Accumulation Share Class EUR 14,709 2,097 1,944 14,862Other Currency Accumulation Share Class (EUR Hedged Class) EUR 5,008,832 124,749 707,618 4,425,963Other Currency Share Class GBP 52,033 — 31,898 20,135Other Currency Share Class SGD 28,119 — — 28,119�A� Share Class USD 452,779 1,207 28,223 425,763�E� Accumulation Share Class EUR 190,968 30,550 54,680 166,838�E� Accumulation Share Class (EUR Hedged Class) EUR 21,006 1,577 14,007 8,576�I� Accumulation Share Class EUR 15,078 — 910 14,168�I� Accumulation Share Class USD 461,241 522,143 850,728 132,656�I� Share Class GBP 88,362 3,407 24,865 66,904�I� Share Class USD 166,002 — 2,800 163,202�IO� Accumulation Share Class USD 205,269 137,654 162,740 180,183
Goldman Sachs FundsNotes to the Financial Statements
For the Year Ended 30 November 2020
74

7 Share Capital (Continued)
CurrencyBalance at
30-Nov-2019 Subscriptions RedemptionsBalance at
30-Nov-2020
US Equity Portfolio (Continued)�IS� Share Class GBP 1,625,165 — 422,893 1,202,272�P� Accumulation Share Class USD 542,307 101,474 350,990 292,791�P� Share Class USD 213,277 12,552 113,014 112,815�R� Accumulation Share Class EUR 324,043 13,267 109,738 227,572�R� Accumulation Share Class USD 63,135 7,098 11,409 58,824�R� Accumulation Share Class (EUR Hedged Class) EUR 226,356 188,851 30,913 384,294�R� Share Class GBP 43,622 15,378 22,490 36,510�R� Share Class USD 229,666 13,179 80,766 162,079
US Equity Portfolio Total 27,290,541 1,914,995 6,027,874 23,177,662
US Focused Growth Equity PortfolioBase Accumulation Share Class USD 141,961 96,873 73,917 164,917Base Currency Share Class USD 280,472 11,114 13,992 277,594�A� Share Class USD 378,481 12,443 39,507 351,417�B� Share Class USD 5,124 — — 5,124�E� Accumulation Share Class EUR 28,640 30,432 35,253 23,819�I� Accumulation Share Class USD 13,945 3,168 — 17,113�I� Share Class USD 2,233 73 1,155 1,151�P� Accumulation Share Class USD 206,981 — 1,344 205,637�P� Share Class USD 1,000 — — 1,000�R� Accumulation Share Class USD 12,250 1,189 — 13,439�R� Share Class GBP 20,381 23,318 19,860 23,839�R� Share Class USD 23,950 83 — 24,033
US Focused Growth Equity Portfolio Total 1,115,418 178,693 185,028 1,109,083
US Smaller Cap Equity PortfolioBase Accumulation Share Class USD 1,000 — 884 116Base Currency Share Class USD 1,000 — 884 116�E� Accumulation Share Class EUR 1,000 6,428 896 6,532�I� Accumulation Share Class USD 693,750 291,413 985,048 115�I� Share Class USD 277,561 — 277,461 100�P� Accumulation Share Class USD 178,643 18,008 99,937 96,714�P� Accumulation Share Class (EUR Hedged Class) EUR 998 — — 998�P� Share Class USD 7,385 — 883 6,502�R� Accumulation Share Class USD 1,285,661 1,256,163 753,679 1,788,145�R� Accumulation Share Class (EUR Hedged Class) EUR 131,568 10,942 20,363 122,147�R� Share Class GBP 765 — — 765�R� Share Class USD 675,629 412,322 84,862 1,003,089
US Smaller Cap Equity Portfolio Total 3,254,960 1,995,276 2,224,897 3,025,339
US Technology Opportunities Equity Portfolio*
Base Accumulation Share Class* USD — 1,000 — 1,000Base Currency Share Class* USD — 1,000 — 1,000Other Currency Accumulation Share Class* EUR — 850 — 850�E� Accumulation Share Class* EUR — 850 — 850�I� Accumulation Share Class* GBP — 2,300 — 2,300�I� Accumulation Share Class* USD — 3,000 — 3,000�I� Share Class* USD — 3,000 — 3,000�IO� Accumulation Share Class* USD — 7,607,075 — 7,607,075�P� Accumulation Share Class* USD — 10,000 — 10,000�R� Accumulation Share Class* GBP — 750 — 750�R� Accumulation Share Class* USD — 1,000 — 1,000�R� Share Class* USD — 1,000 — 1,000
US Technology Opportunities Equity Portfolio Total — 7,631,825 — 7,631,825
Global Infrastructure Equity PortfolioBase Accumulation Share Class USD 8,438 111,921 3,405 116,954Base Currency (Dis) (Gross Quarterly) Share Class USD 83 7 — 90Base Currency Share Class USD 78 2,474 — 2,552Other Currency (Dis) (Gross Quarterly) Share Class EUR 86 7 — 93Other Currency Accumulation Share Class EUR 19,910 13,436 14,992 18,354Other Currency Share Class EUR 81 1 — 82�E� (Dis) (Gross Quarterly) Share Class EUR 12,990 3,401 3,281 13,110�E� Accumulation Share Class EUR 107,675 195,072 143,416 159,331�E� Share Class EUR 16,996 7,073 10,549 13,520�I� (Dis) (Gross Quarterly) Share Class GBP 88 4 — 92�I� (Dis) (Gross Quarterly) Share Class USD 81 5 — 86�I� Accumulation Share Class GBP 81 — — 81�I� Accumulation Share Class USD 481,559 — — 481,559�I� Share Class GBP 84 2 — 86�I� Share Class USD 77 2 — 79�P� (Dis) (Gross Quarterly) Share Class USD 7,078 83,692 89,800 970�P� Accumulation Share Class USD 138,108 34,767 18,502 154,373�P� Share Class USD 78 20,167 — 20,245�R� (Dis) (Gross Quarterly) Share Class GBP 88 4 — 92�R� (Dis) (Gross Quarterly) Share Class USD 81 5 — 86�R� Accumulation Share Class GBP 81 — — 81�R� Accumulation Share Class USD 6,401 16,670 6,907 16,164
Goldman Sachs FundsNotes to the Financial Statements
For the Year Ended 30 November 2020
75

7 Share Capital (Continued)
CurrencyBalance at
30-Nov-2019 Subscriptions RedemptionsBalance at
30-Nov-2020
Global Infrastructure Equity Portfolio (Continued)�R� Share Class GBP 862 2 471 393�R� Share Class USD 77 1,560 — 1,637
Global Infrastructure Equity Portfolio Total 801,161 490,272 291,323 1,000,110
Global Real Estate Equity PortfolioBase Accumulation Share Class USD 49,868 140,441 43,372 146,937Base Currency (Dis) (Gross Quarterly) Share Class USD 10,946 1,859 11,556 1,249Base Currency Share Class USD 1,049 22 — 1,071Other Currency (Dis) (Gross Quarterly) Share Class EUR 1,126 47 — 1,173Other Currency Accumulation Share Class EUR 357,416 501,973 454,684 404,705Other Currency Share Class EUR 1,049 22 — 1,071�E� (Dis) (Gross Quarterly) Share Class EUR 8,937 2,042 841 10,138�E� Accumulation Share Class EUR 6,645 1,729 515 7,859�E� Share Class EUR 8,678 4,685 — 13,363�I� (Dis) (Gross Quarterly) Share Class GBP 918 38 — 956�I� (Dis) (Gross Quarterly) Share Class USD 659,829 225,109 229,243 655,695�I� Accumulation Share Class GBP 817 — — 817�I� Accumulation Share Class USD 1,205,362 557,751 300,360 1,462,753�I� Share Class GBP 869 25 — 894�I� Share Class USD 381,752 84,856 465,512 1,096�P� (Dis) (Gross Quarterly) Share Class USD 1,082,809 44,129 272,108 854,830�P� Accumulation Share Class USD 709,451 157,836 375,948 491,339�P� Share Class USD 83,965 25 — 83,990�R� (Dis) (Gross Quarterly) Share Class GBP 1,662 38 — 1,700�R� (Dis) (Gross Quarterly) Share Class USD 1,126 47 — 1,173�R� Accumulation Share Class GBP 817 — — 817�R� Accumulation Share Class USD 1,000 — — 1,000�R� Share Class GBP 869 24 — 893�R� Share Class USD 1,065 30 — 1,095
Global Real Estate Equity Portfolio Total 4,578,025 1,722,728 2,154,139 4,146,614
North America Energy & Energy Infrastructure Equity PortfolioBase Accumulation Share Class USD 3,845,980 72,970 1,212,182 2,706,768Base Currency Share Class USD 297,605 7,199 95,048 209,756�A� Share Class USD 3,966 1,698 1,672 3,992�E� Accumulation Share Class EUR 223,582 203,617 140,431 286,768�I� Accumulation Share Class USD 386,856 37,134 250,578 173,412�I� Share Class USD 351 10 — 361�P� Accumulation Share Class USD 4,984,853 156,271 1,227,437 3,913,687�P� Share Class USD 813,509 36,428 187,303 662,634�R� Accumulation Share Class EUR 429 — — 429�R� Accumulation Share Class USD 298,548 38,612 164,553 172,607�R� Share Class USD 57,628 9,242 44,215 22,655
North America Energy & Energy Infrastructure Equity Portfolio Total 10,913,307 563,181 3,323,419 8,153,069
Emerging Markets CORE® Equity PortfolioBase Accumulation Close Share Class USD 7,900,928 4,584,614 2,416,205 10,069,337Base Accumulation Snap Share Class USD 10,062,737 1,948,196 11,624,363 386,570Base Currency Snap Share Class USD 67,031 12,168 59,532 19,667Other Currency Accumulation Close Share Class EUR 2,610,090 2,011,312 1,508,845 3,112,557Other Currency Accumulation Close Share Class (Long Emerging Markets CCY vs.USD) CHF 5,000 4,800 — 9,800Other Currency Accumulation Close Share Class (Long Emerging Markets CCY vs.USD) EUR 1,000 11,000 — 12,000�A� Accumulation Snap Share Class (Long Emerging Markets CCY vs. USD) PLN 38,079 — — 38,079�E� Accumulation Close Share Class EUR 76,543 44,634 51,190 69,987�I� Accumulation Close Share Class EUR 22,988,791 5,572,537 14,736,003 13,825,325�I� Accumulation Close Share Class USD 110,096,588 25,113,252 63,511,057 71,698,783�I� Accumulation Snap Share Class GBP 4,449,924 4,177,619 4,303,136 4,324,407�I� Close Share Class EUR 3,443,649 282,513 133,000 3,593,162�IO� Accumulation Close Share Class GBP 244,015 2,085 1,875 244,225�IO� Accumulation Close Share Class JPY 2,991,242 1,544,450 16,713 4,518,979�IO� Accumulation Close Share Class USD 12,800,927 1,972,548 1,472,862 13,300,613�IO� Accumulation Snap Share Class USD 4,643,999 808,005 1,454,325 3,997,679�IO� Snap Share Class USD 2,938,045 1,125,652 979,877 3,083,820�P� Accumulation Close Share Class USD 2,526,059 342,240 1,311,923 1,556,376�P� Close Share Class USD 337,386 3,971 224,393 116,964�R� Accumulation Close Share Class USD 2,729,143 2,880,913 1,759,639 3,850,417�R� Accumulation Close Share Class (Long Emerging Markets CCY vs. USD) EUR 13,436 — — 13,436�R� Close Share Class GBP 4,465,522 4,384,009 4,219,448 4,630,083�R� Close Share Class USD 994,534 112,352 290,378 816,508
Emerging Markets CORE® Equity Portfolio Total 196,424,668 56,938,870 110,074,764 143,288,774
Europe CORE® Equity PortfolioBase Accumulation Share Class EUR 9,291,760 3,291,627 7,637,187 4,946,200Base Currency Share Class EUR 2,806,159 168,890 927,695 2,047,354Other Currency Accumulation Share Class USD 283,844 39,790 270,334 53,300Other Currency Accumulation Share Class (USD Hedged Class) USD 1,013 13,695 — 14,708
Goldman Sachs FundsNotes to the Financial Statements
For the Year Ended 30 November 2020
76
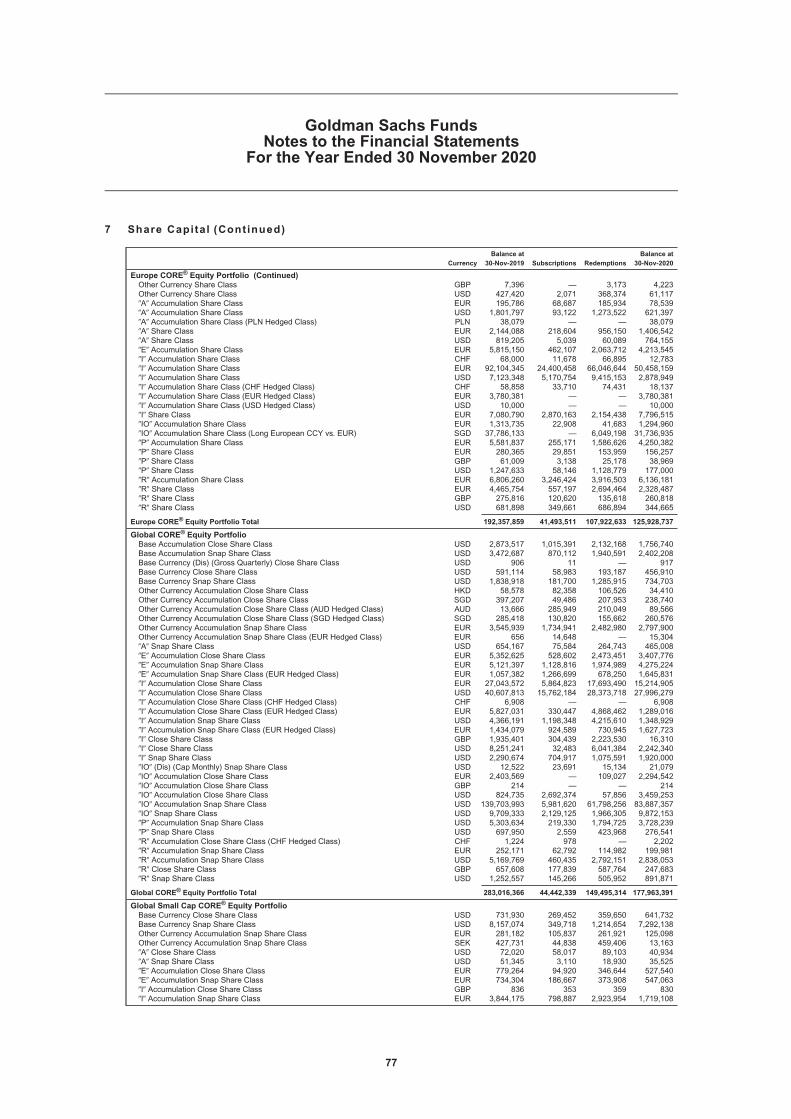
7 Share Capital (Continued)
CurrencyBalance at
30-Nov-2019 Subscriptions RedemptionsBalance at
30-Nov-2020
Europe CORE® Equity Portfolio (Continued)Other Currency Share Class GBP 7,396 — 3,173 4,223Other Currency Share Class USD 427,420 2,071 368,374 61,117�A� Accumulation Share Class EUR 195,786 68,687 185,934 78,539�A� Accumulation Share Class USD 1,801,797 93,122 1,273,522 621,397�A� Accumulation Share Class (PLN Hedged Class) PLN 38,079 — — 38,079�A� Share Class EUR 2,144,088 218,604 956,150 1,406,542�A� Share Class USD 819,205 5,039 60,089 764,155�E� Accumulation Share Class EUR 5,815,150 462,107 2,063,712 4,213,545�I� Accumulation Share Class CHF 68,000 11,678 66,895 12,783�I� Accumulation Share Class EUR 92,104,345 24,400,458 66,046,644 50,458,159�I� Accumulation Share Class USD 7,123,348 5,170,754 9,415,153 2,878,949�I� Accumulation Share Class (CHF Hedged Class) CHF 58,858 33,710 74,431 18,137�I� Accumulation Share Class (EUR Hedged Class) EUR 3,780,381 — — 3,780,381�I� Accumulation Share Class (USD Hedged Class) USD 10,000 — — 10,000�I� Share Class EUR 7,080,790 2,870,163 2,154,438 7,796,515�IO� Accumulation Share Class EUR 1,313,735 22,908 41,683 1,294,960�IO� Accumulation Share Class (Long European CCY vs. EUR) SGD 37,786,133 — 6,049,198 31,736,935�P� Accumulation Share Class EUR 5,581,837 255,171 1,586,626 4,250,382�P� Share Class EUR 280,365 29,851 153,959 156,257�P� Share Class GBP 61,009 3,138 25,178 38,969�P� Share Class USD 1,247,633 58,146 1,128,779 177,000�R� Accumulation Share Class EUR 6,806,260 3,246,424 3,916,503 6,136,181�R� Share Class EUR 4,465,754 557,197 2,694,464 2,328,487�R� Share Class GBP 275,816 120,620 135,618 260,818�R� Share Class USD 681,898 349,661 686,894 344,665
Europe CORE® Equity Portfolio Total 192,357,859 41,493,511 107,922,633 125,928,737
Global CORE® Equity PortfolioBase Accumulation Close Share Class USD 2,873,517 1,015,391 2,132,168 1,756,740Base Accumulation Snap Share Class USD 3,472,687 870,112 1,940,591 2,402,208Base Currency (Dis) (Gross Quarterly) Close Share Class USD 906 11 — 917Base Currency Close Share Class USD 591,114 58,983 193,187 456,910Base Currency Snap Share Class USD 1,838,918 181,700 1,285,915 734,703Other Currency Accumulation Close Share Class HKD 58,578 82,358 106,526 34,410Other Currency Accumulation Close Share Class SGD 397,207 49,486 207,953 238,740Other Currency Accumulation Close Share Class (AUD Hedged Class) AUD 13,666 285,949 210,049 89,566Other Currency Accumulation Close Share Class (SGD Hedged Class) SGD 285,418 130,820 155,662 260,576Other Currency Accumulation Snap Share Class EUR 3,545,939 1,734,941 2,482,980 2,797,900Other Currency Accumulation Snap Share Class (EUR Hedged Class) EUR 656 14,648 — 15,304�A� Snap Share Class USD 654,167 75,584 264,743 465,008�E� Accumulation Close Share Class EUR 5,352,625 528,602 2,473,451 3,407,776�E� Accumulation Snap Share Class EUR 5,121,397 1,128,816 1,974,989 4,275,224�E� Accumulation Snap Share Class (EUR Hedged Class) EUR 1,057,382 1,266,699 678,250 1,645,831�I� Accumulation Close Share Class EUR 27,043,572 5,864,823 17,693,490 15,214,905�I� Accumulation Close Share Class USD 40,607,813 15,762,184 28,373,718 27,996,279�I� Accumulation Close Share Class (CHF Hedged Class) CHF 6,908 — — 6,908�I� Accumulation Close Share Class (EUR Hedged Class) EUR 5,827,031 330,447 4,868,462 1,289,016�I� Accumulation Snap Share Class USD 4,366,191 1,198,348 4,215,610 1,348,929�I� Accumulation Snap Share Class (EUR Hedged Class) EUR 1,434,079 924,589 730,945 1,627,723�I� Close Share Class GBP 1,935,401 304,439 2,223,530 16,310�I� Close Share Class USD 8,251,241 32,483 6,041,384 2,242,340�I� Snap Share Class USD 2,290,674 704,917 1,075,591 1,920,000�IO� (Dis) (Cap Monthly) Snap Share Class USD 12,522 23,691 15,134 21,079�IO� Accumulation Close Share Class EUR 2,403,569 — 109,027 2,294,542�IO� Accumulation Close Share Class GBP 214 — — 214�IO� Accumulation Close Share Class USD 824,735 2,692,374 57,856 3,459,253�IO� Accumulation Snap Share Class USD 139,703,993 5,981,620 61,798,256 83,887,357�IO� Snap Share Class USD 9,709,333 2,129,125 1,966,305 9,872,153�P� Accumulation Snap Share Class USD 5,303,634 219,330 1,794,725 3,728,239�P� Snap Share Class USD 697,950 2,559 423,968 276,541�R� Accumulation Close Share Class (CHF Hedged Class) CHF 1,224 978 — 2,202�R� Accumulation Snap Share Class EUR 252,171 62,792 114,982 199,981�R� Accumulation Snap Share Class USD 5,169,769 460,435 2,792,151 2,838,053�R� Close Share Class GBP 657,608 177,839 587,764 247,683�R� Snap Share Class USD 1,252,557 145,266 505,952 891,871
Global CORE® Equity Portfolio Total 283,016,366 44,442,339 149,495,314 177,963,391
Global Small Cap CORE® Equity PortfolioBase Currency Close Share Class USD 731,930 269,452 359,650 641,732Base Currency Snap Share Class USD 8,157,074 349,718 1,214,654 7,292,138Other Currency Accumulation Snap Share Class EUR 281,182 105,837 261,921 125,098Other Currency Accumulation Snap Share Class SEK 427,731 44,838 459,406 13,163�A� Close Share Class USD 72,020 58,017 89,103 40,934�A� Snap Share Class USD 51,345 3,110 18,930 35,525�E� Accumulation Close Share Class EUR 779,264 94,920 346,644 527,540�E� Accumulation Snap Share Class EUR 734,304 186,667 373,908 547,063�I� Accumulation Close Share Class GBP 836 353 359 830�I� Accumulation Snap Share Class EUR 3,844,175 798,887 2,923,954 1,719,108
Goldman Sachs FundsNotes to the Financial Statements
For the Year Ended 30 November 2020
77

7 Share Capital (Continued)
CurrencyBalance at
30-Nov-2019 Subscriptions RedemptionsBalance at
30-Nov-2020
Global Small Cap CORE® Equity Portfolio (Continued)�I� Accumulation Snap Share Class USD 1,877,749 592,080 837,670 1,632,159�I� Close Share Class GBP 576,964 285,251 65,644 796,571�IO� Accumulation Close Share Class GBP 4,807 1,979 1,101 5,685�IO� Accumulation Close Share Class JPY 4,960,113 — 33,495 4,926,618�IO� Accumulation Close Share Class USD 899,662 381,920 313,719 967,863�IO� Accumulation Snap Share Class USD 609,343 394,119 116,723 886,739�IO� Snap Share Class USD 3,939,167 611,425 606,853 3,943,739�P� Accumulation Snap Share Class USD 175,458 — 33,689 141,769�R� Accumulation Snap Share Class USD 189,469 14,892 70,307 134,054�R� Snap Share Class GBP 861,251 323,869 1,032,762 152,358�R� Snap Share Class USD 353,280 4,339 299,803 57,816
Global Small Cap CORE® Equity Portfolio Total 29,527,124 4,521,673 9,460,295 24,588,502
US CORE® Equity PortfolioBase Accumulation Close Share Class USD 2,780,029 385,065 1,997,539 1,167,555Base Accumulation Snap Share Class USD 8,154,445 601,559 7,199,629 1,556,375Base Currency Close Share Class USD 176,653 30,941 35,782 171,812Base Currency Snap Share Class USD 1,328,984 183,650 375,590 1,137,044Other Currency Accumulation Close Share Class HKD 889 — — 889Other Currency Accumulation Close Share Class SGD 1,171,803 169,578 1,273,261 68,120�A� Snap Share Class USD 1,471,805 219,304 951,346 739,763�E� Accumulation Snap Share Class EUR 4,216,981 1,717,392 1,717,886 4,216,487�E� Accumulation Snap Share Class (EUR Hedged Class) EUR 1,144,109 382,111 788,853 737,367�I� Accumulation Close Share Class HKD 788 — — 788�I� Accumulation Close Share Class USD 19,089,620 8,667,045 12,177,022 15,579,643�I� Accumulation Snap Share Class USD 18,197,883 40,504,008 22,420,775 36,281,116�I� Accumulation Snap Share Class (EUR Hedged Class) EUR 10,952,710 5,096,619 10,581,811 5,467,518�I� Snap Share Class USD 5,848,378 3,547,268 2,969,226 6,426,420�P� Accumulation Snap Share Class USD 2,707,044 196,940 1,323,936 1,580,048�P� Snap Share Class USD 34,706 31,132 46,257 19,581�R� Accumulation Snap Share Class USD 1,912,773 205,182 355,239 1,762,716�R� Snap Share Class GBP 85,510 34,793 59,830 60,473�R� Snap Share Class USD 4,898,058 621,108 2,933,459 2,585,707�U� Close Share Class USD 141,230 — — 141,230
US CORE® Equity Portfolio Total 84,314,398 62,593,695 67,207,441 79,700,652
US Small Cap CORE® Equity PortfolioBase Accumulation Close Share Class USD 66,244 41,273 45,466 62,051Base Accumulation Snap Share Class USD 22,622 — 6,108 16,514Base Currency Snap Share Class USD 23,283 10,162 16,036 17,409�A� Close Share Class USD 567,294 33,359 523,083 77,570�E� Accumulation Close Share Class EUR 47,742 6,219 26,511 27,450�E� Accumulation Snap Share Class EUR 144,079 18,355 109,593 52,841�I� Accumulation Snap Share Class USD 1,081,086 402,696 1,038,180 445,602�I� Snap Share Class USD 162,914 572,774 321,909 413,779�IO� Accumulation Snap Share Class USD 13,975,703 134,568 3,346,891 10,763,380�P� Accumulation Snap Share Class USD 1,500,209 702,955 675,775 1,527,389�R� Accumulation Snap Share Class USD 360,461 104,895 305,996 159,360�R� Snap Share Class GBP 30,954 25,355 14,085 42,224�R� Snap Share Class USD 89,390 29,550 66,237 52,703
US Small Cap CORE® Equity Portfolio Total 18,071,981 2,082,161 6,495,870 13,658,272
GQG Partners Global Equity Portfolio*
Base Accumulation Share Class* USD 1,792 77,098 78,890 —Base Currency Share Class* USD 1,000 — 1,000 —Other Currency Accumulation Share Class* EUR 1,000 — 1,000 —�A� Accumulation Share Class* USD 9,718 — 9,718 —�E� Accumulation Share Class* EUR 69,468 10,596 80,064 —�I� Accumulation Share Class* USD 2,307,091 949,514 3,256,605 —�IS� Accumulation Share Class* EUR 5,181,115 23,056 5,204,171 —�IS� Accumulation Share Class* USD 9,997,783 8,219 10,006,002 —�P� Accumulation Share Class* USD 1,938,393 658,791 2,597,184 —�R� Accumulation Share Class* USD 175,405 321,693 497,098 —�R� Share Class* USD 157,036 157,048 314,084 —
GQG Partners Global Equity Portfolio Total 19,839,801 2,206,015 22,045,816 —
Asia High Yield Bond Portfolio*
Base Accumulation Share Class* USD — 712 — 712Base Currency (Dis) (Gross Monthly) Share Class* USD — 32,123 189 31,934Base Currency (Dis) (Stable Monthly) Share Class* USD — 6,768 — 6,768Other Currency (Dis) (Gross Monthly) Share Class (AUD Hedged Class)* AUD — 1,015 — 1,015Other Currency (Dis) (Gross Monthly) Share Class* HKD — 811 — 811Other Currency (Dis) (Stable Monthly) Share Class (AUD Hedged Class)* AUD — 1,015 — 1,015Other Currency (Dis) (Stable Monthly) Share Class (EUR Hedged Class)* EUR — 1,015 — 1,015Other Currency (Dis) (Stable Monthly) Share Class (GBP Hedged Class)* GBP — 1,015 — 1,015Other Currency (Dis) (Stable Monthly) Share Class (SGD Hedged Class)* SGD — 1,421 — 1,421�E� Accumulation Share Class (EUR Hedged Class)* EUR — 101 — 101�E� Share Class (EUR Hedged Class)* EUR — 101 — 101
Goldman Sachs FundsNotes to the Financial Statements
For the Year Ended 30 November 2020
78

7 Share Capital (Continued)
CurrencyBalance at
30-Nov-2019 Subscriptions RedemptionsBalance at
30-Nov-2020
Asia High Yield Bond Portfolio* (Continued)�I� Accumulation Share Class* USD — 75,659 1,165 74,494�I SD� Accumulation Share Class* USD — 15,580 — 15,580�I� Share Class* GBP — 100 — 100�I� Share Class* USD — 100 — 100�IS� Share Class* USD — 194,300 30,449 163,851�P� Accumulation Share Class* USD — 100 — 100�P� Share Class* USD — 100 — 100�R� Share Class* GBP — 100 — 100
Asia High Yield Bond Portfolio Total — 332,136 31,803 300,333
Emerging Markets Corporate Bond PortfolioBase Accumulation Share Class USD 1,083,252 979,045 766,791 1,295,506Base Currency (Dis) (Gross Monthly) Share Class USD 288,969 100,714 226,723 162,960Base Currency (Dis) (Monthly) Share Class USD 379,346 122,647 220,501 281,492Base Currency (Dis) (Stable Monthly) Share Class USD 625,769 619,589 507,612 737,746Base Currency Share Class USD 16,786 55,315 5,821 66,280Other Currency (Dis) (Gross Monthly) Share Class (AUD Hedged Class) AUD 62,646 24,050 22,644 64,052Other Currency (Dis) (Gross Monthly) Share Class HKD 631,188 294,816 448,299 477,705Other Currency (Dis) (Monthly) Share Class (SGD Hedged Class) SGD 253,170 97,625 141,655 209,140Other Currency (Dis) (Stable Monthly) Share Class (AUD Hedged Class) AUD 38,239 20,193 14,893 43,539Other Currency (Dis) (Stable Monthly) Share Class (EUR Hedged Class) EUR 102 2,592 2,044 650Other Currency (Dis) (Stable Monthly) Share Class (GBP Hedged Class) GBP 20,602 28,864 15,344 34,122Other Currency (Dis) (Stable Monthly) Share Class (SGD Hedged Class) SGD 839,552 343,469 651,555 531,466Other Currency Accumulation Share Class (CHF Hedged Class)* CHF — 356 — 356Other Currency Accumulation Share Class (EUR Hedged Class) EUR 174,967 415,399 169,049 421,317Other Currency Share Class (EUR Hedged Class) EUR 102,369 86,321 110,522 78,168Other Currency Share Class (GBP Hedged Class) GBP 17,242 13,172 11,322 19,092�A� Share Class USD 54,098 59,084 23,084 90,098�E� (Dis) (Quarterly) Share Class (EUR Hedged Class) EUR 54,459 22,916 17,498 59,877�E� Accumulation Share Class (EUR Hedged Class) EUR 66,847 44,436 40,081 71,202�I� (Dis) (Stable Monthly) Share Class USD 101 35,131 — 35,232�I� Accumulation Share Class USD 4,590,829 8,808,740 4,043,418 9,356,151�I� Accumulation Share Class (CHF Hedged Class)* CHF — 158,802 671 158,131�I� Accumulation Share Class (EUR Hedged Class) EUR 1,465,128 1,446,986 531,539 2,380,575�I� Accumulation Share Class (GBP Hedged Class) GBP 661,052 42,440 653,841 49,651�I� Share Class USD 103,204 397,685 73,707 427,182�I� Share Class (EUR Hedged Class) EUR 395,504 750,465 50,039 1,095,930�I� Share Class (GBP Hedged Class)* GBP — 1,211,595 22,189 1,189,406�IO� Accumulation Share Class JPY 499,084 55,324 27,287 527,121�IO� Accumulation Share Class USD 750,140 — 40,140 710,000�IO� Share Class USD 22,881 1,308 11,666 12,523�IS� Accumulation Share Class (EUR Hedged Class) EUR 1,529,456 1,071,276 261,486 2,339,246�P� Accumulation Share Class USD 150,899 50,369 83,904 117,364�P� Share Class USD 13,714 5,838 13,264 6,288�R� Accumulation Share Class USD 168,126 199,218 63,728 303,616�R� Accumulation Share Class (CHF Hedged Class)* CHF — 4,915 116 4,799�R� Share Class USD 31,068 57,653 4,184 84,537�R� Share Class (GBP Hedged Class) GBP 57,107 27,666 16,228 68,545
Emerging Markets Corporate Bond Portfolio Total 15,147,896 17,656,014 9,292,845 23,511,065
Emerging Markets Debt Blend PortfolioBase Accumulation Share Class USD 16,676 292 13,455 3,513Base Currency Share Class USD 51,033 6,646 42,045 15,634Other Currency Accumulation Share Class (EUR Partially Hedged Class) EUR 15,914 1,342 7,481 9,775Other Currency Share Class (EUR Partially Hedged Class) EUR 1,360 413 57 1,716�E� Accumulation Share Class (EUR Partially Hedged Class) EUR 5,381 5,553 3,921 7,013�I� Accumulation Share Class EUR 192,742 4,329 — 197,071�I� Accumulation Share Class USD 150,488 996,515 6,100 1,140,903�I� Accumulation Share Class (EUR Partially Hedged Class) EUR 3,125,730 304,705 68,884 3,361,551�I� Accumulation Share Class (GBP Partially Hedged Class)* GBP 1,568,109 2,979 1,571,088 —�I� Share Class USD 134 7 — 141�I� Share Class (GBP Partially Hedged Class) GBP 1,350 68 — 1,418�IO� Share Class (GBP Partially Hedged Class) GBP 3,295,111 7,147 — 3,302,258�R� Accumulation Share Class USD 100 — — 100�R� Share Class USD 1,184 7 — 1,191�R� Share Class (GBP Partially Hedged Class) GBP 1,958 468 633 1,793
Emerging Markets Debt Blend Portfolio Total 8,427,270 1,330,471 1,713,664 8,044,077
Emerging Markets Debt Local PortfolioBase Accumulation Share Class USD 771,595 166,400 167,529 770,466Base Currency (Dis) (Monthly) Share Class USD 1,406 51 — 1,457Base Currency Share Class USD 148,529 1,896 1,830 148,595Other Currency Share Class GBP 32,408 8 85 32,331�A� Accumulation Share Class USD 184,700 65,814 81,656 168,858�A� Share Class USD 695,827 99,484 131,477 663,834�E� (Dis) (Quarterly) Share Class EUR 505,811 137,938 78,862 564,887�E� Accumulation Share Class EUR 425,542 71,874 152,083 345,333�E� Share Class EUR 594,640 15,739 208,302 402,077
Goldman Sachs FundsNotes to the Financial Statements
For the Year Ended 30 November 2020
79
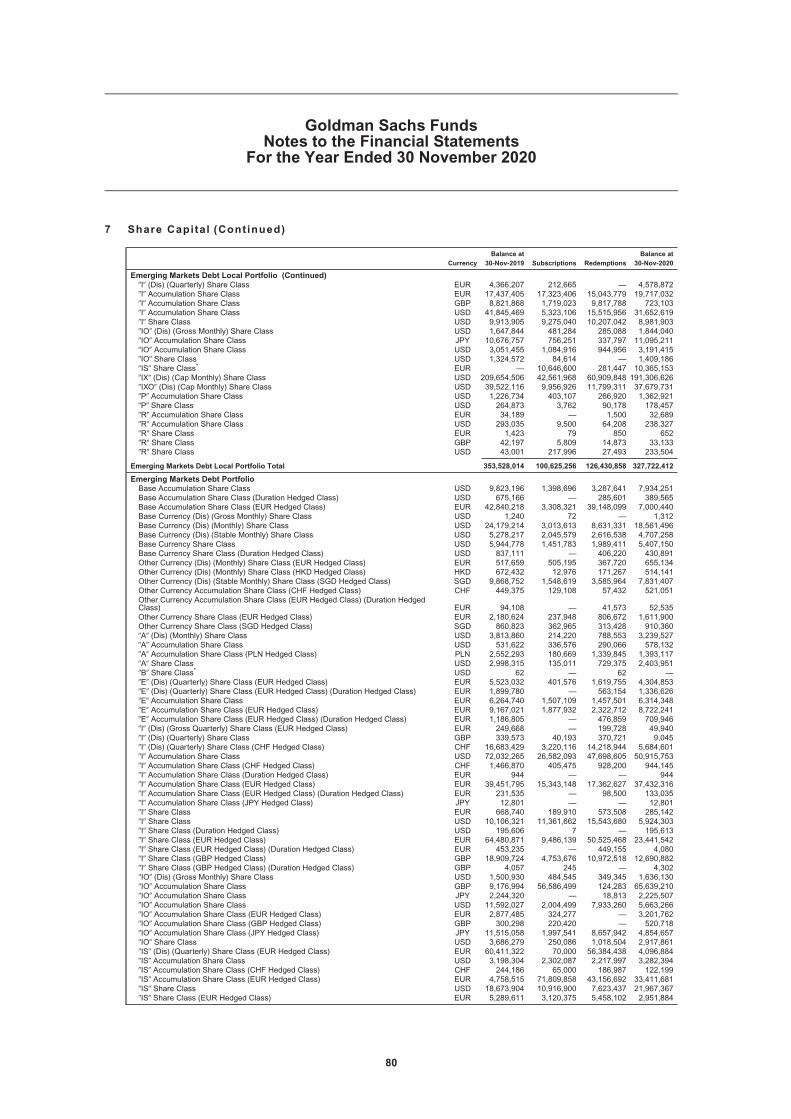
7 Share Capital (Continued)
CurrencyBalance at
30-Nov-2019 Subscriptions RedemptionsBalance at
30-Nov-2020
Emerging Markets Debt Local Portfolio (Continued)�I� (Dis) (Quarterly) Share Class EUR 4,366,207 212,665 — 4,578,872�I� Accumulation Share Class EUR 17,437,405 17,323,406 15,043,779 19,717,032�I� Accumulation Share Class GBP 8,821,868 1,719,023 9,817,788 723,103�I� Accumulation Share Class USD 41,845,469 5,323,106 15,515,956 31,652,619�I� Share Class USD 9,913,905 9,275,040 10,207,042 8,981,903�IO� (Dis) (Gross Monthly) Share Class USD 1,647,844 481,284 285,088 1,844,040�IO� Accumulation Share Class JPY 10,676,757 756,251 337,797 11,095,211�IO� Accumulation Share Class USD 3,051,455 1,084,916 944,956 3,191,415�IO� Share Class USD 1,324,572 84,614 — 1,409,186�IS� Share Class* EUR — 10,646,600 281,447 10,365,153�IX� (Dis) (Cap Monthly) Share Class USD 209,654,506 42,561,968 60,909,848 191,306,626�IXO� (Dis) (Cap Monthly) Share Class USD 39,522,116 9,956,926 11,799,311 37,679,731�P� Accumulation Share Class USD 1,226,734 403,107 266,920 1,362,921�P� Share Class USD 264,873 3,762 90,178 178,457�R� Accumulation Share Class EUR 34,189 — 1,500 32,689�R� Accumulation Share Class USD 293,035 9,500 64,208 238,327�R� Share Class EUR 1,423 79 850 652�R� Share Class GBP 42,197 5,809 14,873 33,133�R� Share Class USD 43,001 217,996 27,493 233,504
Emerging Markets Debt Local Portfolio Total 353,528,014 100,625,256 126,430,858 327,722,412
Emerging Markets Debt PortfolioBase Accumulation Share Class USD 9,823,196 1,398,696 3,287,641 7,934,251Base Accumulation Share Class (Duration Hedged Class) USD 675,166 — 285,601 389,565Base Accumulation Share Class (EUR Hedged Class) EUR 42,840,218 3,308,321 39,148,099 7,000,440Base Currency (Dis) (Gross Monthly) Share Class USD 1,240 72 — 1,312Base Currency (Dis) (Monthly) Share Class USD 24,179,214 3,013,613 8,631,331 18,561,496Base Currency (Dis) (Stable Monthly) Share Class USD 5,278,217 2,045,579 2,616,538 4,707,258Base Currency Share Class USD 5,944,778 1,451,783 1,989,411 5,407,150Base Currency Share Class (Duration Hedged Class) USD 837,111 — 406,220 430,891Other Currency (Dis) (Monthly) Share Class (EUR Hedged Class) EUR 517,659 505,195 367,720 655,134Other Currency (Dis) (Monthly) Share Class (HKD Hedged Class) HKD 672,432 12,976 171,267 514,141Other Currency (Dis) (Stable Monthly) Share Class (SGD Hedged Class) SGD 9,868,752 1,548,619 3,585,964 7,831,407Other Currency Accumulation Share Class (CHF Hedged Class) CHF 449,375 129,108 57,432 521,051Other Currency Accumulation Share Class (EUR Hedged Class) (Duration HedgedClass) EUR 94,108 — 41,573 52,535Other Currency Share Class (EUR Hedged Class) EUR 2,180,624 237,948 806,672 1,611,900Other Currency Share Class (SGD Hedged Class) SGD 860,823 362,965 313,428 910,360�A� (Dis) (Monthly) Share Class USD 3,813,860 214,220 788,553 3,239,527�A� Accumulation Share Class USD 531,622 336,576 290,066 578,132�A� Accumulation Share Class (PLN Hedged Class) PLN 2,552,293 180,669 1,339,845 1,393,117�A� Share Class USD 2,998,315 135,011 729,375 2,403,951�B� Share Class* USD 62 — 62 —�E� (Dis) (Quarterly) Share Class (EUR Hedged Class) EUR 5,523,032 401,576 1,619,755 4,304,853�E� (Dis) (Quarterly) Share Class (EUR Hedged Class) (Duration Hedged Class) EUR 1,899,780 — 563,154 1,336,626�E� Accumulation Share Class EUR 6,264,740 1,507,109 1,457,501 6,314,348�E� Accumulation Share Class (EUR Hedged Class) EUR 9,167,021 1,877,932 2,322,712 8,722,241�E� Accumulation Share Class (EUR Hedged Class) (Duration Hedged Class) EUR 1,186,805 — 476,859 709,946�I� (Dis) (Gross Quarterly) Share Class (EUR Hedged Class) EUR 249,668 — 199,728 49,940�I� (Dis) (Quarterly) Share Class GBP 339,573 40,193 370,721 9,045�I� (Dis) (Quarterly) Share Class (CHF Hedged Class) CHF 16,683,429 3,220,116 14,218,944 5,684,601�I� Accumulation Share Class USD 72,032,265 26,582,093 47,698,605 50,915,753�I� Accumulation Share Class (CHF Hedged Class) CHF 1,466,870 405,475 928,200 944,145�I� Accumulation Share Class (Duration Hedged Class) EUR 944 — — 944�I� Accumulation Share Class (EUR Hedged Class) EUR 39,451,795 15,343,148 17,362,627 37,432,316�I� Accumulation Share Class (EUR Hedged Class) (Duration Hedged Class) EUR 231,535 — 98,500 133,035�I� Accumulation Share Class (JPY Hedged Class) JPY 12,801 — — 12,801�I� Share Class EUR 668,740 189,910 573,508 285,142�I� Share Class USD 10,106,321 11,361,662 15,543,680 5,924,303�I� Share Class (Duration Hedged Class) USD 195,606 7 — 195,613�I� Share Class (EUR Hedged Class) EUR 64,480,871 9,486,139 50,525,468 23,441,542�I� Share Class (EUR Hedged Class) (Duration Hedged Class) EUR 453,235 — 449,155 4,080�I� Share Class (GBP Hedged Class) GBP 18,909,724 4,753,676 10,972,518 12,690,882�I� Share Class (GBP Hedged Class) (Duration Hedged Class) GBP 4,057 245 — 4,302�IO� (Dis) (Gross Monthly) Share Class USD 1,500,930 484,545 349,345 1,636,130�IO� Accumulation Share Class GBP 9,176,994 56,586,499 124,283 65,639,210�IO� Accumulation Share Class JPY 2,244,320 — 18,813 2,225,507�IO� Accumulation Share Class USD 11,592,027 2,004,499 7,933,260 5,663,266�IO� Accumulation Share Class (EUR Hedged Class) EUR 2,877,485 324,277 — 3,201,762�IO� Accumulation Share Class (GBP Hedged Class) GBP 300,298 220,420 — 520,718�IO� Accumulation Share Class (JPY Hedged Class) JPY 11,515,058 1,997,541 8,657,942 4,854,657�IO� Share Class USD 3,686,279 250,086 1,018,504 2,917,861�IS� (Dis) (Quarterly) Share Class (EUR Hedged Class) EUR 60,411,322 70,000 56,384,438 4,096,884�IS� Accumulation Share Class USD 3,198,304 2,302,087 2,217,997 3,282,394�IS� Accumulation Share Class (CHF Hedged Class) CHF 244,186 65,000 186,987 122,199�IS� Accumulation Share Class (EUR Hedged Class) EUR 4,758,515 71,809,858 43,156,692 33,411,681�IS� Share Class USD 18,673,904 10,916,900 7,623,437 21,967,367�IS� Share Class (EUR Hedged Class) EUR 5,289,611 3,120,375 5,458,102 2,951,884
Goldman Sachs FundsNotes to the Financial Statements
For the Year Ended 30 November 2020
80

7 Share Capital (Continued)
CurrencyBalance at
30-Nov-2019 Subscriptions RedemptionsBalance at
30-Nov-2020
Emerging Markets Debt Portfolio (Continued)�IS� Share Class (GBP Hedged Class) GBP 24,759,780 15,214,332 18,152,994 21,821,118�IX� (Dis) (Cap Monthly) Share Class USD 982,833 192,189 275,144 899,878�P� Accumulation Share Class USD 104,898 41,690 7,609 138,979�P� Share Class USD 1,193 2,271 — 3,464�R� Accumulation Share Class EUR 157,158 94,883 80,311 171,730�R� Accumulation Share Class USD 6,331,679 1,314,492 3,074,283 4,571,888�R� Accumulation Share Class (CHF Hedged Class) CHF 2,493,016 198,799 1,705,881 985,934�R� Accumulation Share Class (EUR Hedged Class) EUR 8,905,500 2,136,982 4,109,084 6,933,398�R� Accumulation Share Class (Duration Hedged Class) USD 2,408 — — 2,408�R� Share Class USD 6,141,364 2,459,370 2,431,613 6,169,121�R� Share Class (EUR Hedged Class) EUR 10,046,220 4,234,518 6,524,468 7,756,270�R� Share Class (GBP Hedged Class) GBP 3,185,682 364,199 2,127,294 1,422,587�R� Share Class (GBP Hedged Class) (Duration Hedged Class) GBP 2,130 — — 2,130�R� Share Class (SGD Hedged Class) SGD 817,950 168,116 377,190 608,876�RS� Accumulation Share Class USD 361,628 1,175,670 172,200 1,365,098�RS� Accumulation Share Class (CHF Hedged Class) CHF 323,288 1,474,677 338,057 1,459,908�RS� Accumulation Share Class (EUR Hedged Class) EUR 194,040 577,507 101,929 669,618�RS� Share Class USD 204,586 852,337 180,422 876,501�RS� Share Class (EUR Hedged Class) EUR 31,005 91,138 23,855 98,288�RS� Share Class (GBP Hedged Class) GBP 498,322 56,377 228,803 325,896
Emerging Markets Debt Portfolio Total 564,461,790 270,852,266 403,279,370 432,034,686
Emerging Markets Short Duration Bond PortfolioBase Accumulation Share Class USD 100 4,151 — 4,251Base Currency Share Class USD 100 38,366 4,852 33,614Other Currency Accumulation Share Class (EUR Hedged Class) EUR 1,000 — — 1,000Other Currency Share Class (EUR Hedged Class) EUR 1,000 35 — 1,035�E� Accumulation Share Class (EUR Hedged Class) EUR 1,194 7,054 — 8,248�I� Accumulation Share Class USD 179,070 127,473 175,402 131,141�I� Accumulation Share Class (EUR Hedged Class) EUR 70,377 26,085 31,112 65,350�I� Accumulation Share Class (GBP Hedged Class) GBP 1,000 — — 1,000�I� Share Class USD 100 4 — 104�I� Share Class (EUR Hedged Class) EUR 1,000 40 — 1,040�P� Accumulation Share Class* USD — 100 — 100�P� Share Class USD 17,592 61,136 5,878 72,850�P� Share Class (EUR Hedged Class) EUR 1,101 — — 1,101�P� Share Class (GBP Hedged Class) GBP 103 — — 103�R� Accumulation Share Class USD 65,030 58,749 11,444 112,335�R� Accumulation Share Class (EUR Hedged Class) EUR 1,000 188,052 42,092 146,960�R� Accumulation Share Class (GBP Hedged Class) GBP 1,000 — — 1,000�R� Share Class USD 5,605 14,484 8,629 11,460�R� Share Class (EUR Hedged Class) EUR 1,000 39 — 1,039�R� Share Class (GBP Hedged Class) GBP 1,000 37 — 1,037
Emerging Markets Short Duration Bond Portfolio Total 348,372 525,805 279,409 594,768
Euro Short Duration Bond Plus PortfolioBase Accumulation Share Class EUR 2,959,496 2,169,804 2,036,951 3,092,349Base Currency Share Class EUR 78,698 97,705 156,927 19,476�E� Accumulation Share Class EUR 450,970 391,942 247,391 595,521�I� Accumulation Share Class EUR 4,579,122 8,941,583 3,484,006 10,036,699�I� Share Class EUR 3,765,629 701,835 1,554,572 2,912,892�P� Accumulation Share Class EUR 3,682,043 2,979,487 3,208,279 3,453,251�P� Share Class EUR 621,548 285,535 257,644 649,439�R� Accumulation Share Class EUR 5,753,097 5,563,253 5,275,036 6,041,314�R� Share Class EUR 1,320,952 334,468 204,739 1,450,681
Euro Short Duration Bond Plus Portfolio Total 23,211,555 21,465,612 16,425,545 28,251,622
Europe High Yield Bond PortfolioBase Accumulation Share Class EUR 1,114 1,842 823 2,133Base Accumulation Share Class (USD Hedged Class) USD 1,603 652 489 1,766Base Currency Share Class EUR 141 33,309 32,848 602Other Currency Accumulation Share Class (SEK Hedged Class) SEK 1,498 2,762 2,168 2,092�A� Accumulation Share Class (PLN Hedged Class) PLN 58,344 35,788 51,243 42,889�E� Accumulation Share Class EUR 5,904 1,973 3,364 4,513�I� Accumulation Share Class EUR 276,155 112,957 77,666 311,446�I� Accumulation Share Class (USD Hedged Class)* USD — 100 — 100�I� Share Class EUR 120 9,711 22 9,809�P� (Dis) (Monthly) Share Class (USD Hedged Class) USD 11,348 155 148 11,355�P� Accumulation Share Class EUR 32,069 41,073 29,625 43,517�P� Accumulation Share Class (USD Hedged Class) USD 55,334 5,130 28,807 31,657�P� Share Class EUR 9,129 232 746 8,615�R� Accumulation Share Class EUR 58,425 18,800 30,626 46,599�R� Share Class EUR 6,713 12,519 3,128 16,104�R� Share Class (GBP Hedged Class) GBP 18,147 3,531 18,180 3,498
Europe High Yield Bond Portfolio Total 536,044 280,534 279,883 536,695
Global Credit Portfolio (Hedged)Base Accumulation Share Class USD 896,219 1,026,706 734,217 1,188,708
Goldman Sachs FundsNotes to the Financial Statements
For the Year Ended 30 November 2020
81

7 Share Capital (Continued)
CurrencyBalance at
30-Nov-2019 Subscriptions RedemptionsBalance at
30-Nov-2020
Global Credit Portfolio (Hedged) (Continued)Base Currency Share Class USD 249,048 13,808 2,953 259,903Other Currency Accumulation Share Class (SEK Hedged Class) SEK 6,630 6,220 — 12,850�A� Share Class USD 32,110 166,420 15,580 182,950�E� Accumulation Share Class (EUR Hedged Class) EUR 1,249,053 1,718,440 780,646 2,186,847�I� (Dis) (Quarterly) Share Class (Duration Hedged Class) USD 13,732 33 — 13,765�I� Accumulation Share Class USD 5,914,373 14,706,370 4,994,737 15,626,006�I� Accumulation Share Class (CHF Hedged Class) CHF 4,176,194 1,128,886 357,608 4,947,472�I� Accumulation Share Class (EUR Hedged Class) EUR 11,427,856 14,554,519 10,534,390 15,447,985�I� Accumulation Share Class (EUR Hedged Class) (Duration Hedged Class) EUR 2,198 — 9 2,189�I� Accumulation Share Class (GBP Hedged Class) (Duration Hedged Class) GBP 302,133 — 230,207 71,926�I� Share Class (GBP Hedged Class) GBP 362,360 132,728 90,128 404,960�IO� Accumulation Share Class USD 10,911,317 2,618,306 2,077,830 11,451,793�IO� Accumulation Share Class (GBP Hedged Class) (Duration Hedged Class) GBP 747,096 — — 747,096�IO� Accumulation Share Class (JPY Hedged Class)* JPY 835,117 322,763 1,157,880 —�IO� Share Class USD 12,400,718 1,419,054 3,149,119 10,670,653�IXO� (Dis) (Cap Monthly) Share Class USD 1,959,342 1,768,242 270,811 3,456,773�P� Accumulation Share Class USD 1,612,448 1,892,005 1,147,222 2,357,231�P� Accumulation Share Class (Duration Hedged Class) USD 4,006,086 — 443,727 3,562,359�P� Accumulation Share Class (EUR Hedged Class) EUR 882,123 79,096 25,947 935,272�P� Accumulation Share Class (EUR Hedged Class) (Duration Hedged Class) EUR 402,648 — 29,891 372,757�P� Share Class USD 590,151 652,768 180,647 1,062,272�P� Share Class (EUR Hedged Class) EUR 128,384 2,428 90,726 40,086�P� Share Class (GBP Hedged Class) GBP 366,376 11,290 182,630 195,036�R� Accumulation Share Class USD 1,068,030 1,576,794 806,922 1,837,902�R� Accumulation Share Class (EUR Hedged Class) EUR 1,351,946 211,481 844,138 719,289�R� Accumulation Share Class (EUR Hedged Class) (Duration Hedged Class) EUR 3,120,520 — 569,417 2,551,103�R� Accumulation Share Class (GBP Hedged Class) GBP 42,928 41,185 — 84,113�R� Accumulation Share Class (Duration Hedged Class) USD 630,944 — 175,027 455,917�R� Share Class USD 2,897,417 1,580,827 1,369,300 3,108,944�R� Share Class (EUR Hedged Class) EUR 533,614 129,164 318,514 344,264�R� Share Class (GBP Hedged Class) GBP 433,903 384,282 202,564 615,621�R� Share Class (GBP Hedged Class) (Duration Hedged Class) GBP 655,308 7,754 285,449 377,613
Global Credit Portfolio (Hedged) Total 70,208,322 46,151,569 31,068,236 85,291,655
Global ESG Enhanced Income Bond Portfolio*
Base Accumulation Share Class* USD — 100 — 100Base Currency (Dis) (Gross Monthly) Share Class* USD — 100 — 100Base Currency (Dis) (Monthly) Share Class* USD — 100 — 100Base Currency (Dis) (Stable Monthly) Share Class* USD — 100 — 100Other Currency (Dis) (Gross Monthly) Share Class (AUD Hedged Class)* AUD — 1,412 — 1,412Other Currency (Dis) (Gross Monthly) Share Class* HKD — 775 — 775Other Currency (Dis) (Monthly) Share Class (EUR Hedged Class)* EUR — 1,002 — 1,002Other Currency (Dis) (Stable Monthly) Share Class (SGD Hedged Class)* SGD — 1,358 — 1,358Other Currency Accumulation Share Class (EUR Hedged Class)* EUR — 1,000 — 1,000�E� (Dis) (Gross Quarterly) Share Class (EUR Hedged Class)* EUR — 85 — 85�E� Accumulation Share Class (EUR Hedged Class)* EUR — 1,000 — 1,000�I� (Dis) (Monthly) Share Class* USD — 100 — 100�I� Accumulation Share Class* USD — 193,150 2,491 190,659�I� Accumulation Share Class (EUR Hedged Class)* EUR — 85 — 85�P� (Dis) (Monthly) Share Class* USD — 100 — 100�P� Accumulation Share Class* USD — 100 — 100�R� (Dis) (Monthly) Share Class* USD — 100 — 100�R� (Dis) (Monthly) Share Class (GBP Hedged Class)* GBP — 1,003 — 1,003�R� Accumulation Share Class* USD — 100 — 100�R� Accumulation Share Class (GBP Hedged Class)* GBP — 1,000 — 1,000
Global ESG Enhanced Income Bond Portfolio Total — 202,770 2,491 200,279
Global Fixed Income PortfolioBase Accumulation Share Class USD 730,941 1,048,837 620,056 1,159,722Base Currency Share Class USD 62,437 38,171 26,939 73,669�A� Share Class USD 1,295,341 69,689 41,305 1,323,725�B� Share Class USD 119 — — 119�E� Accumulation Share Class EUR 379,282 590,293 186,276 783,299�I� Accumulation Share Class EUR 499,938 1,190,072 916,157 773,853�I� Share Class USD 3,266,337 1,078,389 1,301,723 3,043,003�IO� Accumulation Share Class USD 1,265,179 606,684 74,866 1,796,997�P� Accumulation Share Class USD 566,353 513,029 331,431 747,951�P� Share Class USD 205,257 702,260 68,666 838,851�R� Accumulation Share Class USD 187,006 236,506 31,468 392,044�R� Share Class USD 256,465 123,662 1,949 378,178
Global Fixed Income Portfolio Total 8,714,655 6,197,592 3,600,836 11,311,411
Global Fixed Income Portfolio (Hedged)Base Accumulation Share Class EUR 2,817,935 4,780,142 1,561,030 6,037,047Base Currency Share Class EUR 8,499 236,973 64,653 180,819�E� Accumulation Share Class EUR 78,368 804,525 185,720 697,173�I� Accumulation Share Class EUR 4,756,929 18,577,333 7,965,898 15,368,364�I� Accumulation Share Class (NOK Hedged Class) NOK 4,269,470 1,281,707 453,797 5,097,380
Goldman Sachs FundsNotes to the Financial Statements
For the Year Ended 30 November 2020
82

7 Share Capital (Continued)
CurrencyBalance at
30-Nov-2019 Subscriptions RedemptionsBalance at
30-Nov-2020
Global Fixed Income Portfolio (Hedged) (Continued)�I� Accumulation Share Class (USD Hedged Class) USD 90,918 4,944,663 1,142,073 3,893,508�I� Share Class EUR 10,666,049 5,430,471 398,151 15,698,369�IO� Accumulation Share Class (GBP Hedged Class) GBP 783 — — 783�IO� Accumulation Share Class (USD Hedged Class) USD 12,683,182 7,985,676 2,447,863 18,220,995�IO� Share Class (USD Hedged Class) USD 3,827,848 84,284 678,763 3,233,369�IXO� (Dis) (Cap Monthly) Share Class (USD Hedged Class) USD 3,826,967 1,566,779 907,020 4,486,726�P� Accumulation Share Class EUR 1,557,794 1,020,992 57,249 2,521,537�P� Accumulation Share Class (CHF Hedged Class) CHF 468,559 137,454 85,124 520,889�P� Accumulation Share Class (USD Hedged Class)* USD — 693,796 — 693,796�P� Share Class EUR 178,377 754 3,999 175,132�P� Share Class (GBP Hedged Class) GBP 640,409 37,709 446,294 231,824�P� Share Class (USD Hedged Class) USD 260,685 1,150,900 79,584 1,332,001�R� Accumulation Share Class EUR 1,004,126 883,397 237,532 1,649,991�R� Accumulation Share Class (USD Hedged Class) USD 857,961 1,104,553 443,245 1,519,269�R� Share Class EUR 396,860 84,360 35,603 445,617�R� Share Class (CHF Hedged Class) CHF 350,690 153,173 — 503,863�R� Share Class (GBP Hedged Class) GBP 4,777,304 3,686,894 787,633 7,676,565�R� Share Class (USD Hedged Class) USD 1,616,955 420,289 450,603 1,586,641
Global Fixed Income Portfolio (Hedged) Total 55,136,668 55,066,824 18,431,834 91,771,658
Global High Yield PortfolioBase Accumulation Share Class USD 6,673,636 3,313,137 4,759,157 5,227,616Base Accumulation Share Class (Duration Hedged Class) USD 4,280,484 — 1,451,014 2,829,470Base Accumulation Share Class (SEK Hedged Class) SEK 213,713 131,509 190,467 154,755Base Currency (Dis) (Gross Monthly) Share Class USD 1,556 96 — 1,652Base Currency (Dis) (Monthly) Share Class USD 1,933,853 167,474 365,282 1,736,045Base Currency (Dis) (Monthly) Share Class (Duration Hedged Class) USD 1,473,583 — 680,346 793,237Base Currency Share Class USD 9,599,612 4,186,666 7,277,948 6,508,330Base Currency Share Class (Duration Hedged Class) USD 1,902,757 4,685 503,139 1,404,303Other Currency (Dis) (Gross Monthly) Share Class HKD 840 52 — 892Other Currency (Dis) (Monthly) Share Class (AUD Hedged Class) AUD 295,979 10,367 — 306,346Other Currency (Dis) (Monthly) Share Class (HKD Hedged Class) (Duration HedgedClass) HKD 523,980 50 511,209 12,821Other Currency (Dis) (Quarterly) Share Class (CHF Hedged Class) (Duration HedgedClass) CHF 60,328 — 13,478 46,850Other Currency (Dis) (Quarterly) Share Class (SGD Hedged Class) (Duration HedgedClass) SGD 129,401 — 9,920 119,481Other Currency Accumulation Share Class (CHF Hedged Class) (Duration HedgedClass) CHF 65,337 — 21,696 43,641Other Currency Accumulation Share Class (EUR Hedged Class) EUR 2,795,279 1,285,480 1,584,921 2,495,838Other Currency Accumulation Share Class (EUR Hedged Class) (Duration HedgedClass) EUR 396,637 — 184,528 212,109Other Currency Share Class (CHF Hedged Class) CHF 189,508 12,253 28,175 173,586Other Currency Share Class (GBP Hedged Class) GBP 438,853 51,281 115,782 374,352�A� (Dis) (Monthly) Share Class USD 934,904 725,757 1,247,617 413,044�A� Share Class USD 4,677,163 310,590 2,014,211 2,973,542�B� Share Class USD 3,817 — — 3,817�E� (Dis) (Quarterly) Share Class (EUR Hedged Class) EUR 1,666,398 114,619 345,141 1,435,876�E� (Dis) (Quarterly) Share Class (EUR Hedged Class) (Duration Hedged Class) EUR 1,158,506 — 266,638 891,868�E� Accumulation Share Class EUR 737,478 76,091 202,886 610,683�E� Accumulation Share Class (EUR Hedged Class) EUR 1,692,128 46,950 379,229 1,359,849�E� Accumulation Share Class (EUR Hedged Class) (Duration Hedged Class) EUR 538,128 — 173,005 365,123�E� Share Class (EUR Hedged Class) EUR 7,260,825 1,210,694 1,982,612 6,488,907�G� Share Class USD 222,619 14,388 — 237,007�I� (Dis) (Monthly) Share Class USD 29,035,295 15,607,890 4,103,476 40,539,709�I� (Dis) (Monthly) Share Class (EUR Hedged Class) EUR 1,115 61 — 1,176�I� Accumulation Share Class USD 6,313,726 15,803,090 7,594,728 14,522,088�I� Accumulation Share Class (Duration Hedged Class) USD 482,060 — 441,362 40,698�I� Accumulation Share Class (EUR Hedged Class) EUR 3,241,132 1,607,642 2,912,367 1,936,407�I� Accumulation Share Class (GBP Hedged Class) GBP 11,479 476 50 11,905�I� Share Class EUR 11,463,118 — 12,645 11,450,473�I� Share Class USD 27,345,487 3,971,024 8,551,934 22,764,577�I� Share Class (EUR Hedged Class) EUR 798,154 191,209 227,006 762,357�I� Share Class (GBP Hedged Class) GBP 109,626 150,030 73,448 186,208�I� Share Class (GBP Hedged Class) (Duration Hedged Class) GBP 13,293 774 14,013 54�IO� (Dis) (Quarterly) Share Class (AUD Hedged Class) AUD 14,730 959 — 15,689�IO� Accumulation Share Class USD 11,688,904 6,945,518 7,569,612 11,064,810�IO� Accumulation Share Class (EUR Hedged Class) EUR 4,424,637 801,611 2,294,189 2,932,059�IO� Accumulation Share Class (GBP Hedged Class) GBP 498,710 322,959 344 821,325�IO� Accumulation Share Class (JPY Hedged Class) JPY 56,443,942 6,333,863 7,948,540 54,829,265�IO� Share Class USD 5,987,799 481,999 2,290,493 4,179,305�IS� Accumulation Share Class USD 7,538,638 3,080,631 3,020,929 7,598,340�IS� Accumulation Share Class (CHF Hedged Class) CHF 528,270 628,594 1,023,394 133,470�IS� Accumulation Share Class (EUR Hedged Class) EUR 1,502,899 748,517 687,781 1,563,635�IS� Accumulation Share Class (GBP Hedged Class) GBP 10,374 — 9,417 957�IS� Share Class USD 8,042,175 4,169,192 3,922,198 8,289,169�IS� Share Class (GBP Hedged Class) GBP 6,130,325 7,430,254 9,145,486 4,415,093�P� Accumulation Share Class USD 2,371 — 1,361 1,010
Goldman Sachs FundsNotes to the Financial Statements
For the Year Ended 30 November 2020
83

7 Share Capital (Continued)
CurrencyBalance at
30-Nov-2019 Subscriptions RedemptionsBalance at
30-Nov-2020
Global High Yield Portfolio (Continued)�P� Share Class USD 11,048 613 — 11,661�R� (Dis) (Monthly) Share Class (AUD Hedged Class) AUD 43,587 7,426 19,174 31,839�R� Accumulation Share Class USD 4,225,414 1,200,368 2,592,336 2,833,446�R� Accumulation Share Class (CHF Hedged Class) CHF 18,332 52,646 12,166 58,812�R� Accumulation Share Class (CHF Hedged Class) (Duration Hedged Class) CHF 121,768 — 20,351 101,417�R� Accumulation Share Class (EUR Hedged Class) EUR 5,100,800 596,946 2,236,196 3,461,550�R� Accumulation Share Class (EUR Hedged Class) (Duration Hedged Class) EUR 452,706 — 205,194 247,512�R� Accumulation Share Class (SEK Hedged Class) SEK 17,785 — 7,343 10,442�R� Accumulation Share Class (Duration Hedged Class) USD 190,674 — 142,895 47,779�R� Share Class USD 4,278,393 486,218 2,853,556 1,911,055�R� Share Class (CHF Hedged Class) CHF 901,333 224,627 332,820 793,140�R� Share Class (EUR Hedged Class) EUR 1,288,497 1,389,785 1,782,216 896,066�R� Share Class (GBP Hedged Class) GBP 8,900,389 872,201 7,976,114 1,796,476�R� Share Class (Duration Hedged Class) USD 1,320,858 27,214 617,220 730,852
Global High Yield Portfolio Total 258,367,145 84,796,476 104,950,755 238,212,866
Global Sovereign Bond PortfolioBase Accumulation Share Class USD 2,497 648 480 2,665Base Currency Share Class USD 510 922 455 977�I� Accumulation Share Class USD 100 28,725 637 28,188�I� Accumulation Share Class (EUR Partially Hedged Class) EUR 721,799 107,993 75,729 754,063�I� Accumulation Share Class (GBP Partially Hedged Class) GBP 4,335,196 11,915 1,603,442 2,743,669�I� Share Class USD 63 150 — 213�I� Share Class (GBP Partially Hedged Class) GBP 98 1 — 99
Global Sovereign Bond Portfolio Total 5,060,263 150,354 1,680,743 3,529,874
Short Duration Opportunistic Corporate Bond PortfolioBase Accumulation Share Class USD 19,431 41 9,558 9,914Base Currency (Dis) (Quarterly) Share Class USD 123 4 — 127Base Currency Share Class USD 26,080 258 13,485 12,853Other Currency (Dis) (Quarterly) Share Class (EUR Hedged Class) EUR 42 203 155 90Other Currency Accumulation Share Class (EUR Hedged Class) EUR 1,480 — 1,270 210�A� (Dis) (Quarterly) Share Class USD 9,030 2,936 2,544 9,422�E� (Dis) (Quarterly) Share Class (EUR Hedged Class) EUR 4,731 674 796 4,609�E� Accumulation Share Class EUR 100 — — 100�E� Accumulation Share Class (EUR Hedged Class) EUR 23,500 20,132 24,201 19,431�I� (Dis) (Quarterly) Share Class (GBP Hedged Class) GBP 72 4 — 76�I� Accumulation Share Class EUR 100 — — 100�I� Accumulation Share Class USD 269,813 318,870 246,124 342,559�I� Accumulation Share Class (EUR Hedged Class) EUR 76,183 23,135 20,497 78,821�I� Share Class USD 35,380 14,537 24,587 25,330�IXO� (Dis) (Cap Monthly) Share Class USD 209,901 42,809 132,154 120,556�P� (Dis) (Quarterly) Share Class USD 180,800 21,002 93,779 108,023�P� Accumulation Share Class USD 706,550 111,190 313,045 504,695�P� Accumulation Share Class (EUR Hedged Class) EUR 15,075 — — 15,075�P� Share Class USD 20,877 31,976 30,148 22,705�P� Share Class (EUR Hedged Class) EUR 26 1 — 27�P� Share Class (GBP Hedged Class) GBP 44,298 1,729 1,592 44,435�R� (Dis) (Quarterly) Share Class USD 7,570 2,252 651 9,171�R� Accumulation Share Class USD 70,214 20,547 40,671 50,090�R� Accumulation Share Class (EUR Hedged Class) EUR 7,959 — 7,935 24�R� Share Class USD 24,307 1,022 2,677 22,652�R� Share Class (EUR Hedged Class) EUR 6,398 91 1,321 5,168�R� Share Class (GBP Hedged Class) GBP 4,495 182 4,439 238
Short Duration Opportunistic Corporate Bond Portfolio Total 1,764,535 613,595 971,629 1,406,501
Sterling Credit PortfolioBase Currency Share Class GBP 39,448 3,436 7,418 35,466�I� Share Class GBP 26,048 35,915 6,770 55,193�P� Share Class GBP 5,147 206 3,944 1,409�R� Accumulation Share Class GBP 15,765 666 3,442 12,989�R� Share Class GBP 133,931 12,304 40,614 105,621
Sterling Credit Portfolio Total 220,339 52,527 62,188 210,678
US Dollar Short Duration Bond Portfolio�I� Accumulation Share Class USD 2,317,688 1,026,259 1,539,963 1,803,984�I� Share Class USD 301 208,001 — 208,302�P� Accumulation Share Class USD 585,387 296,573 326,638 555,322�P� Share Class USD 38,492 43,597 10,274 71,815�R� Accumulation Share Class USD 265,418 236,638 231,385 270,671�R� Share Class USD 126,596 73,037 60,267 139,366
US Dollar Short Duration Bond Portfolio Total 3,333,882 1,884,105 2,168,527 3,049,460
US Fixed Income PortfolioBase Accumulation Share Class USD 123,892 4,069 4,140 123,821Base Currency (Dis) (Monthly) Share Class USD 1,125 18 — 1,143Base Currency Share Class USD 219,734 80,015 126,785 172,964�A� (Dis) (Monthly) Share Class USD 41,624 19,843 7,928 53,539
Goldman Sachs FundsNotes to the Financial Statements
For the Year Ended 30 November 2020
84

7 Share Capital (Continued)
CurrencyBalance at
30-Nov-2019 Subscriptions RedemptionsBalance at
30-Nov-2020
US Fixed Income Portfolio (Continued)�A� Share Class USD 176,010 14,242 9,753 180,499�B� Share Class USD 1,010 9 — 1,019�E� Accumulation Share Class EUR 163,944 150,172 106,598 207,518�I� Accumulation Share Class USD 2,219,839 3,779,499 1,579,894 4,419,444�I� Share Class USD 344,456 32,331 78,096 298,691�P� (Dis) (Monthly) Share Class USD 1,171 25 — 1,196�P� Accumulation Share Class USD 1,829,347 820,956 323,110 2,327,193�P� Share Class USD 26,669 4,633 4,633 26,669�R� Accumulation Share Class USD 336,552 119,760 132,266 324,046�R� Share Class USD 1,546 169,979 119,137 52,388
US Fixed Income Portfolio Total 5,486,919 5,195,551 2,492,340 8,190,130
US Mortgage Backed Securities PortfolioBase Accumulation Share Class USD 408,299 55,304 329,565 134,038Base Currency Share Class USD 419,187 245,689 241,179 423,697�A� Accumulation Share Class (PLN Hedged Class) PLN 325,851 33,859 26,961 332,749�A� Share Class USD 379,189 90,743 155,494 314,438�E� Accumulation Share Class (EUR Hedged Class) EUR 170,195 537,677 132,315 575,557�I� Accumulation Share Class USD 6,727,930 7,096,756 3,177,483 10,647,203�I� Accumulation Share Class (EUR Hedged Class) EUR 656,511 1,810,176 872,228 1,594,459�I� Accumulation Share Class (GBP Hedged Class) GBP 5,218 — — 5,218�I� Share Class USD 1,250,702 496 25,798 1,225,400�IO� (Dis) (Cap Monthly) Share Class USD 14,678,005 11,000,140 5,803,847 19,874,298�IO� Share Class USD 3,624,298 354,156 1,681,390 2,297,064�P� Accumulation Share Class USD 1,075,601 464,498 543,620 996,479�P� Share Class USD 225,258 6,301 191,507 40,052�R� Accumulation Share Class USD 1,467,546 520,049 1,509,411 478,184�R� Share Class USD 139,821 278,828 334,676 83,973
US Mortgage Backed Securities Portfolio Total 31,553,611 22,494,672 15,025,474 39,022,809
Emerging Markets Multi-Asset PortfolioBase Accumulation Share Class USD 17,018 567 13,297 4,288Base Currency (Dis) (Cap Monthly) Share Class USD 149,210 3,938 102,575 50,573Base Currency (Dis) (Gross Monthly) Share Class USD 62,381 4,518 40,408 26,491Base Currency (Dis) (Monthly) Share Class USD 155 3 — 158Base Currency Share Class USD 102 2 — 104Other Currency (Dis) (Cap Monthly) Share Class (AUD Partially Hedged Class) AUD 27,928 767 9,535 19,160Other Currency (Dis) (Cap Monthly) Share Class (EUR Partially Hedged Class) EUR 2,343 9,408 6,739 5,012Other Currency (Dis) (Cap Monthly) Share Class (GBP Partially Hedged Class) GBP 12,438 6,355 4,386 14,407Other Currency (Dis) (Cap Monthly) Share Class (SGD Partially Hedged Class) SGD 170,854 18,465 47,950 141,369Other Currency (Dis) (Gross Monthly) Share Class (AUD Partially Hedged Class) AUD 1,609 55 — 1,664Other Currency (Dis) (Gross Monthly) Share Class (GBP Partially Hedged Class) GBP 1,073 37 — 1,110Other Currency (Dis) (Gross Monthly) Share Class HKD 789 27 — 816Other Currency (Dis) (Gross Monthly) Share Class (SGD Partially Hedged Class) SGD 52,079 2,970 15,171 39,878�E� Accumulation Share Class EUR 325 96 — 421�E� Share Class EUR 326 4 19 311�I� Accumulation Share Class USD 27,344 98 26,715 727�I� Share Class USD 103 2 — 105�P� Accumulation Share Class USD 100 — — 100�P� Share Class USD 102 2 — 104�R� Accumulation Share Class USD 100 — — 100�R� Share Class USD 103 2 — 105
Emerging Markets Multi-Asset Portfolio Total 526,482 47,316 266,795 307,003
Global Multi-Asset Balanced PortfolioBase Accumulation Share Class USD 122,096 19,681 54,924 86,853Base Currency Share Class USD 33,883 1,547 31,852 3,578Other Currency Accumulation Share Class (EUR Partially Hedged Class) EUR 50,442 57,092 48,812 58,722Other Currency Share Class (EUR Partially Hedged Class) EUR 43,885 2 17,465 26,422Other Currency Share Class (GBP Partially Hedged Class) GBP 64,787 3,972 19,086 49,673�E� Accumulation Share Class (EUR Partially Hedged Class) EUR 41,295 22,377 19,738 43,934�I� Accumulation Share Class USD 174,691 — 25,607 149,084�I� Accumulation Share Class (EUR Partially Hedged Class) EUR 100 3,253 1,253 2,100�I� Share Class USD 11,958 1 5,404 6,555�R� Accumulation Share Class (EUR Partially Hedged Class) EUR 100 — — 100�R� Share Class (GBP Partially Hedged Class) GBP 270,891 51,850 53,650 269,091
Global Multi-Asset Balanced Portfolio Total 814,128 159,775 277,791 696,112
Global Multi-Asset Conservative PortfolioBase Accumulation Share Class USD 51,712 40,395 27,421 64,686Base Currency Share Class USD 9,030 8,731 15,666 2,095Other Currency Accumulation Share Class (EUR Partially Hedged Class) EUR 62,995 39,424 39,755 62,664Other Currency Share Class (EUR Partially Hedged Class) EUR 6,136 149 1,392 4,893Other Currency Share Class (GBP Partially Hedged Class) GBP 27,870 1,714 8,514 21,070�E� Accumulation Share Class (EUR Partially Hedged Class) EUR 49,272 24,415 13,150 60,537�I� Accumulation Share Class USD 3,279,527 106,157 907,866 2,477,818�I� Accumulation Share Class (EUR Partially Hedged Class) EUR 563 13,314 481 13,396�I� Accumulation Share Class (GBP Partially Hedged Class) GBP 533,329 10,786 91,794 452,321
Goldman Sachs FundsNotes to the Financial Statements
For the Year Ended 30 November 2020
85

7 Share Capital (Continued)
CurrencyBalance at
30-Nov-2019 Subscriptions RedemptionsBalance at
30-Nov-2020
Global Multi-Asset Conservative Portfolio (Continued)�I� Share Class USD 108 2 — 110�R� Accumulation Share Class (EUR Partially Hedged Class) EUR 100 1,256 — 1,356�R� Share Class (GBP Partially Hedged Class) GBP 199,791 50,606 50,258 200,139
Global Multi-Asset Conservative Portfolio Total 4,220,433 296,949 1,156,297 3,361,085
Global Multi-Asset Growth PortfolioBase Accumulation Share Class USD 151,341 2,009 105,421 47,929Base Currency Share Class USD 2,180 — 196 1,984Other Currency Accumulation Share Class (EUR Partially Hedged Class) EUR 10,235 3,702 7,518 6,419Other Currency Share Class (EUR Partially Hedged Class) EUR 5,912 — 2,512 3,400Other Currency Share Class (GBP Partially Hedged Class) GBP 17,655 200 6,590 11,265�E� Accumulation Share Class (EUR Partially Hedged Class) EUR 15,044 1,250 5,219 11,075�I� Accumulation Share Class USD 1,797,523 77,257 654,602 1,220,178�I� Accumulation Share Class (EUR Partially Hedged Class) EUR 100 — — 100�I� Share Class USD 106 369 368 107�R� Accumulation Share Class (EUR Partially Hedged Class) EUR 100 — — 100�R� Share Class (GBP Partially Hedged Class) GBP 63,304 18,436 13,141 68,599
Global Multi-Asset Growth Portfolio Total 2,063,500 103,223 795,567 1,371,156
Global Multi-Asset Income PortfolioBase Accumulation Share Class USD 2,866 6,189 2,412 6,643Base Currency (Dis) (Cap Monthly) Share Class USD 140,625 221,487 66,666 295,446Base Currency (Dis) (Gross Monthly) Share Class USD 60,606 428,477 166,372 322,711Base Currency Share Class USD 16,334 30,208 12,147 34,395Other Currency (Dis) (Gross Monthly) Share Class (AUD Hedged Class) AUD 1,653 15,786 — 17,439Other Currency (Dis) (Gross Monthly) Share Class HKD 1,011 216,776 1,050 216,737Other Currency (Dis) (Stable Monthly) Share Class (EUR Hedged Class) EUR 1,212 55 985 282Other Currency Accumulation Share Class (EUR Hedged Class) EUR 1,287 — 936 351Other Currency Share Class (EUR Hedged Class) EUR 11,235 1,519 551 12,203�A� (Dis) (Monthly) Share Class USD 10,693 8,518 3,436 15,775�E� (Dis) (Gross Quarterly) Share Class (EUR Hedged Class) EUR 4,978 6,430 3,501 7,907�E� (Dis) (Quarterly) Share Class (EUR Hedged Class) EUR 46,566 31,277 21,874 55,969�E� (Dis) (Stable Monthly) Share Class (EUR Hedged Class) EUR 2,765 512 1,249 2,028�E� Accumulation Share Class (EUR Hedged Class) EUR 36,850 5,219 9,815 32,254�I� Accumulation Share Class USD 217 16,571 2,172 14,616�I� Accumulation Share Class (EUR Hedged Class) EUR 12,129 563 993 11,699�I� Share Class USD 652 141 320 473�P� Accumulation Share Class USD 100 — — 100�P� Share Class USD 115 4 — 119�R� (Dis) (Gross Monthly) Share Class (GBP Hedged Class) GBP 101,429 8,405 30,951 78,883�R� Accumulation Share Class (EUR Hedged Class) EUR 1,000 — 921 79�R� Share Class (EUR Hedged Class) EUR 1,174 51 1,128 97�R� Share Class (GBP Hedged Class) GBP 2,218 1,127 2,334 1,011
Global Multi-Asset Income Portfolio Total 457,715 999,315 329,813 1,127,217
US Real Estate Balanced PortfolioBase Accumulation Share Class USD 252,954 12,330 97,837 167,447Base Currency (Dis) (Cap Gross Monthly MBS) Share Class USD 115 103 99 119Base Currency (Dis) (Cap Monthly MBS) Share Class USD 180,216 10,803 59,450 131,569Base Currency (Dis) (Monthly) Share Class USD 221 4 101 124Other Currency (Dis) (Cap Gross Monthly MBS) Share Class (SGD Hedged Class) SGD 1,605 61 — 1,666Other Currency (Dis) (Cap Monthly MBS) Share Class (SGD Hedged Class) SGD 16,393 3,557 3,173 16,777�E� Accumulation Share Class (EUR Hedged Class) EUR 15,808 8,119 15,841 8,086�I� (Dis) (Cap Monthly MBS) Share Class USD 152,896 3,433 15,579 140,750�I� (Dis) (Monthly) Share Class USD 430 8,077 307 8,200�I� Accumulation Share Class USD 266,807 41,749 225,602 82,954�I� Accumulation Share Class (EUR Hedged Class) EUR 90,842 19,275 481 109,636�P� (Dis) (Cap Monthly MBS) Share Class USD 492,990 5,103 238,792 259,301�P� (Dis) (Monthly) Share Class USD 120 3 — 123�P� Accumulation Share Class USD 405,358 5,565 192,614 218,309�R� (Dis) (Cap Monthly MBS) Share Class USD 4,402 99 99 4,402�R� (Dis) (Monthly) Share Class GBP 113 4 — 117�R� (Dis) (Monthly) Share Class (GBP Hedged Class) GBP 35,973 2,625 33,514 5,084�R� Accumulation Share Class USD 136,116 12,295 26,427 121,984�R� Share Class USD 48,889 14,140 17,499 45,530
US Real Estate Balanced Portfolio Total 2,102,248 147,345 927,415 1,322,178
CoCos & Capital Securities Portfolio*
Base Accumulation Share Class* USD 100 — 100 —Base Currency Share Class* USD 117 4 121 —�I� Accumulation Share Class* USD 100 — 100 —�IO� Accumulation Share Class* USD 407,774 38,214 445,988 —
CoCos & Capital Securities Portfolio Total 408,091 38,218 446,309 —
Emerging Markets Total Return Bond PortfolioBase Accumulation Share Class USD 100 9,231 — 9,331Base Currency Share Class USD 105 4 — 109Other Currency Accumulation Share Class (EUR Hedged Class) EUR 200 — — 200
Goldman Sachs FundsNotes to the Financial Statements
For the Year Ended 30 November 2020
86

7 Share Capital (Continued)
CurrencyBalance at
30-Nov-2019 Subscriptions RedemptionsBalance at
30-Nov-2020
Emerging Markets Total Return Bond Portfolio (Continued)Other Currency Share Class (EUR Hedged Class) EUR 211 9 — 220�E� Accumulation Share Class (EUR Hedged Class) EUR 200 1,294 1,294 200�I� Accumulation Share Class USD 148,882 32,000 97,882 83,000�I� Accumulation Share Class (EUR Hedged Class) EUR 106 — — 106�I� Share Class USD 1,526 71 1,497 100�IO� Accumulation Share Class (AUD Hedged Class) AUD 1,350 — — 1,350�IO� Accumulation Share Class (GBP Hedged Class) GBP 1,050,000 — — 1,050,000�R� Accumulation Share Class (EUR Hedged Class) EUR 200 — — 200�R� Accumulation Share Class (GBP Hedged Class) GBP 500 — — 500�R� Share Class (EUR Hedged Class) EUR 212 11 — 223�R� Share Class (GBP Hedged Class) GBP 531 24 — 555
Emerging Markets Total Return Bond Portfolio Total 1,204,123 42,644 100,673 1,146,094
Global Absolute Return PortfolioBase Accumulation Share Class USD 645 264 351 558Base Currency Share Class USD 100 1 — 101Other Currency Accumulation Share Class (EUR Hedged Class) EUR 1,000 — — 1,000Other Currency Accumulation Share Class (SEK Hedged Class) SEK 8,171 533 533 8,171�E� Accumulation Share Class (EUR Hedged Class) EUR 1,382 220 1,581 21�I� Accumulation Share Class USD 301,988 1,871 110,693 193,166�I� Accumulation Share Class (EUR Hedged Class) EUR 504,007 82,068 266,304 319,771�I� Accumulation Share Class (GBP Hedged Class) GBP 7,425 1,465 2,498 6,392�I� Accumulation Share Class (JPY Hedged Class) JPY 625,237 — — 625,237�I� Share Class USD 99 1 — 100�I� Share Class (EUR Hedged Class) EUR 1,016 13 953 76�I� Share Class (GBP Hedged Class) GBP 1,209 47 657 599�IO� Accumulation Share Class USD 110,940 29,639 12,749 127,830�IO� Share Class USD 443,669 407,829 52,290 799,208�P� Accumulation Share Class USD 100 — — 100�P� Accumulation Share Class (EUR Hedged Class) EUR 1,000 — 944 56�P� Share Class USD 101 1 — 102�R� Accumulation Share Class (EUR Hedged Class) EUR 1,000 3,052 929 3,123�R� Share Class (EUR Hedged Class) EUR 1,015 12 954 73�R� Share Class (GBP Hedged Class) GBP 17,554 882 5,023 13,413
Global Absolute Return Portfolio Total 2,027,658 527,898 456,459 2,099,097
Global Fixed Income Plus Portfolio (Hedged)Base Accumulation Share Class EUR 241,327 155,273 136,516 260,084Base Accumulation Share Class (USD Hedged Class) USD 89,560 100,119 10,891 178,788Base Currency Share Class EUR 160,529 15,021 30,206 145,344Base Currency Share Class (USD Hedged Class) USD 325,884 2,561 109,731 218,714�A� Share Class EUR 169,550 30,921 45,256 155,215�A� Share Class (USD Hedged Class) USD 591,566 3,562 32,227 562,901�E� Accumulation Share Class EUR 82,738 39,559 35,488 86,809�I� Accumulation Share Class EUR 12,934,045 7,875,206 4,120,417 16,688,834�I� Accumulation Share Class (USD Hedged Class) USD 4,966,844 2,737,024 735,324 6,968,544�I� Share Class (GBP Hedged Class) GBP 95,624 3,746 9,295 90,075�IO� Accumulation Share Class EUR 46,712,963 11,149,175 — 57,862,138�IO� Accumulation Share Class (GBP Hedged Class) GBP 187,398 24,466 19,416 192,448�IO� Accumulation Share Class (USD Hedged Class) USD 2,158,901 1,605,668 684,468 3,080,101�IO� Share Class (USD Hedged Class) USD 9,526,836 259,193 2,172,892 7,613,137�P� Accumulation Share Class EUR 79,863 128,303 — 208,166�P� Accumulation Share Class (USD Hedged Class) USD 972,033 466,864 54,051 1,384,846�P� Share Class (GBP Hedged Class) GBP 202,846 4,435 206,581 700�R� Accumulation Share Class EUR 585,625 153,740 219,027 520,338�R� Accumulation Share Class (USD Hedged Class) USD 348,584 17,882 62,455 304,011�R� Share Class EUR 141,308 182,758 114,790 209,276�R� Share Class (GBP Hedged Class) GBP 355,084 77,694 199,968 232,810�R� Share Class (USD Hedged Class) USD 22,141 98,051 93,253 26,939
Global Fixed Income Plus Portfolio (Hedged) Total 80,951,249 25,131,221 9,092,252 96,990,218
Global Strategic Income Bond PortfolioBase Accumulation Share Class USD 265,719 3,317 65,711 203,325Base Currency (Dis) (Monthly) Share Class USD 36,305 — 27,617 8,688Base Currency Share Class USD 254,520 4,696 51,070 208,146Other Currency (Dis) (Quarterly) Share Class (SGD Hedged Class) SGD 13,346 5,593 4,034 14,905Other Currency Accumulation Share Class (CHF Hedged Class) CHF 33,834 205 15,442 18,597Other Currency Accumulation Share Class (EUR Hedged Class) EUR 118,975 9,546 29,240 99,281Other Currency Accumulation Share Class (SEK Hedged Class) SEK 67,694 31,627 31,229 68,092Other Currency Share Class (CHF Hedged Class) CHF 1,172 37 — 1,209Other Currency Share Class (EUR Hedged Class) EUR 276,971 3,857 43,858 236,970Other Currency Share Class (GBP Hedged Class) GBP 5,525 45 1,999 3,571�A� (Dis) (Monthly) Share Class USD 29,194 586 8,715 21,065�A� Share Class USD 113,917 568 27,358 87,127�E� (Dis) (Quarterly) Share Class (EUR Hedged Class) EUR 159,870 271 30,588 129,553�E� Accumulation Share Class (EUR Hedged Class) EUR 180,389 3,347 47,533 136,203�I� (Dis) (Monthly) Share Class (GBP Hedged Class) GBP 2,000,119 — — 2,000,119�I� (Dis) (Semi-Annual) Share Class (JPY Hedged Class) JPY 150,474 — 102,411 48,063
Goldman Sachs FundsNotes to the Financial Statements
For the Year Ended 30 November 2020
87

7 Share Capital (Continued)
CurrencyBalance at
30-Nov-2019 Subscriptions RedemptionsBalance at
30-Nov-2020
Global Strategic Income Bond Portfolio (Continued)�I� Accumulation Share Class USD 370,722 154,702 195,301 330,123�I� Accumulation Share Class (CHF Hedged Class) CHF 40,864 900 5,890 35,874�I� Accumulation Share Class (EUR Hedged Class) EUR 1,931,456 62,707 139,677 1,854,486�I� Accumulation Share Class (GBP Hedged Class) GBP 896,089 178 — 896,267�I� Accumulation Share Class (JPY Hedged Class) JPY 929,831 — 18,349 911,482�I� Accumulation Share Class (SEK Hedged Class) SEK 2,503 — — 2,503�I� Share Class EUR 7,241 — 1,385 5,856�I� Share Class USD 1,636,542 60,863 1,650,776 46,629�I� Share Class (AUD Hedged Class) AUD 1,363 101 — 1,464�I� Share Class (EUR Hedged Class) EUR 17,063 — 1,107 15,956�I� Share Class (GBP Hedged Class) GBP 4,702 194,960 194,361 5,301�IO� Accumulation Share Class (GBP Hedged Class) GBP 2,153,854 53,396 840,965 1,366,285�IS� Accumulation Share Class USD 103 — — 103�IS� Share Class USD 158 6 — 164�IS� Share Class (GBP Hedged Class) GBP 117 5 — 122�IXO� (Dis) (Cap Monthly) Share Class USD 2,609,718 428,087 662,224 2,375,581�P� (Dis) (Monthly) Share Class USD 4,673 116 — 4,789�P� Accumulation Share Class USD 103,458 4,662 19,944 88,176�P� Accumulation Share Class (EUR Hedged Class) EUR 71,939 — 23,416 48,523�P� Share Class USD 44,556 976 13,836 31,696�P� Share Class (EUR Hedged Class) EUR 92 4 — 96�P� Share Class (GBP Hedged Class) GBP 25,935 4,671 372 30,234�R� (Dis) (Monthly) Share Class USD 8,309 — 3,457 4,852�R� Accumulation Share Class USD 177,429 58,328 63,861 171,896�R� Accumulation Share Class (CHF Hedged Class) CHF 781 — — 781�R� Accumulation Share Class (EUR Hedged Class) EUR 91,776 2,955 25,310 69,421�R� Share Class USD 37,406 12,071 8,074 41,403�R� Share Class (EUR Hedged Class) EUR 87,403 1,473 12,745 76,131�R� Share Class (GBP Hedged Class) GBP 60,790 1,893 27,114 35,569
Global Strategic Income Bond Portfolio Total 15,024,897 1,106,749 4,394,969 11,736,677
Global Strategic Macro Bond PortfolioBase Accumulation Share Class USD 196,172 14,737 101,883 109,026Base Accumulation Share Class (CHF Hedged Class) CHF 6,352 1,630 1,860 6,122Base Currency Share Class USD 5,251 — 958 4,293Other Currency Accumulation Share Class (EUR Hedged Class) EUR 200,205 13,201 88,849 124,557Other Currency Accumulation Share Class (GBP Hedged Class) GBP 4,915 — 2,961 1,954Other Currency Accumulation Share Class (SEK Hedged Class) SEK 1,256,138 174,320 445,573 984,885Other Currency Share Class (EUR Hedged Class) EUR 652 15 — 667�A� Accumulation Share Class (PLN Hedged Class) PLN 64,408 80 23,284 41,204�E� Accumulation Share Class (EUR Hedged Class) EUR 262,508 8,403 85,639 185,272�I� Accumulation Share Class USD 658,977 111,157 617,943 152,191�I� Accumulation Share Class (CHF Hedged Class) CHF 124,489 23,241 117,040 30,690�I� Accumulation Share Class (EUR Hedged Class) EUR 4,840,269 454,857 3,042,637 2,252,489�I� Accumulation Share Class (Flat) (EUR Hedged Class) EUR 31,504 1,809 7,370 25,943�I� Accumulation Share Class (Flat) (GBP Hedged Class) GBP 39 — — 39�I� Accumulation Share Class (GBP Hedged Class) GBP 58,697 7,116 15,577 50,236�I� Accumulation Share Class (SEK Hedged Class) SEK 13,084,317 1,471,805 10,552,141 4,003,981�I� Share Class USD 13,575 440 12,860 1,155�I� Share Class (EUR Hedged Class) EUR 831,357 2,893 812,573 21,677�IO� Accumulation Share Class USD 45,366 13,973 8,678 50,661�IO� Share Class USD 225,884 48,713 16,428 258,169�P� Accumulation Share Class USD 27,273 — 16,081 11,192�P� Accumulation Share Class (CHF Hedged Class) CHF 100 — — 100�P� Accumulation Share Class (EUR Hedged Class) EUR 4,591 — 3,557 1,034�P� Accumulation Share Class (GBP Hedged Class) GBP 58 — — 58�P� Share Class USD 2,546 5,005 1,561 5,990�R� Accumulation Share Class USD 70,735 3,523 39,587 34,671�R� Accumulation Share Class (CHF Hedged Class) CHF 74,529 510 66,349 8,690�R� Accumulation Share Class (EUR Hedged Class) EUR 118,446 2,725 37,593 83,578�R� Share Class USD 77,648 928 20,787 57,789�R� Share Class (EUR Hedged Class) EUR 15,170 600 7,982 7,788�R� Share Class (GBP Hedged Class) GBP 18,492 351 2,406 16,437�RS� Accumulation Share Class USD 3,930 26,076 — 30,006�RS� Accumulation Share Class (CHF Hedged Class) CHF 13,598 44,937 13,705 44,830�RS� Accumulation Share Class (EUR Hedged Class) EUR 9,654 3,600 9,132 4,122�RS� Share Class USD 109 9,241 — 9,350�RS� Share Class (EUR Hedged Class) EUR 3,904 — — 3,904
Global Strategic Macro Bond Portfolio Total 22,351,858 2,445,886 16,172,994 8,624,750
Strategic Absolute Return Bond I PortfolioBase Accumulation Share Class USD 972 — 54 918Base Accumulation Share Class (EUR Hedged Class) EUR 1,973 — 264 1,709Base Currency Share Class USD 1,003 12 219 796Base Currency Share Class (EUR Hedged Class) EUR 2,347 37 984 1,400Base Currency Share Class (GBP Hedged Class) GBP 576 — — 576�A� Share Class USD 5,465 1,270 737 5,998�E� Accumulation Share Class (EUR Hedged Class) EUR 1,787 5,030 972 5,845
Goldman Sachs FundsNotes to the Financial Statements
For the Year Ended 30 November 2020
88

7 Share Capital (Continued)
CurrencyBalance at
30-Nov-2019 Subscriptions RedemptionsBalance at
30-Nov-2020
Strategic Absolute Return Bond I Portfolio (Continued)�I� Accumulation Share Class USD 100 — — 100�I� Accumulation Share Class (EUR Hedged Class) EUR 5,826 21,761 599 26,988�I� Share Class (EUR Hedged Class) EUR 782 15 — 797�I� Share Class (GBP Hedged Class)* GBP 1,196,162 22,035 1,218,197 —�IO� Accumulation Share Class (GBP Hedged Class) GBP 3,336,030 — — 3,336,030�IO� Share Class (AUD Hedged Class) AUD 264,487 6,224 38,363 232,348�R� Accumulation Share Class USD 103 — 3 100�R� Accumulation Share Class (EUR Hedged Class) EUR 1,350 3,058 — 4,408�R� Share Class USD 111 1,076 — 1,187�R� Share Class (EUR Hedged Class) EUR 1,109 22 — 1,131�R� Share Class (GBP Hedged Class) GBP 1,109 20 — 1,129
Strategic Absolute Return Bond I Portfolio Total 4,821,292 60,560 1,260,392 3,621,460
Strategic Absolute Return Bond II PortfolioBase Accumulation Share Class USD 1,107 3,814 121 4,800Base Accumulation Share Class (EUR Hedged Class) EUR 6,570 1,746 1,749 6,567Base Currency Share Class USD 2,649 45 — 2,694Base Currency Share Class (EUR Hedged Class) EUR 2,439 121 — 2,560Base Currency Share Class (GBP Hedged Class) GBP 737 — 472 265�A� Share Class USD 5,578 184 1,100 4,662�E� Accumulation Share Class (EUR Hedged Class) EUR 10,758 153 4,798 6,113�I� Accumulation Share Class USD 78 85 51 112�I� Accumulation Share Class (EUR Hedged Class) EUR 31,104 — — 31,104�I� Accumulation Share Class (Flat) (GBP Hedged Class) GBP 528,575 2,427 — 531,002�IO� Accumulation Share Class (GBP Hedged Class) GBP 546 — — 546�IO� Share Class (GBP Hedged Class)* GBP 1,082,903 31,533 1,114,436 —�R� Accumulation Share Class USD 780 — — 780�R� Share Class USD 7,953 3 — 7,956�R� Share Class (GBP Hedged Class) GBP 30,623 25 — 30,648
Strategic Absolute Return Bond II Portfolio Total 1,712,400 40,136 1,122,727 629,809
Multi-Manager Dynamic World Equity PortfolioBase Accumulation Share Class USD 2,037,252 136,349 807,992 1,365,609Base Currency Share Class USD 2,679,006 190,743 436,441 2,433,308Other Currency Accumulation Share Class EUR 1,056,321 11,000 350,005 717,316�I� Share Class USD 4,080,944 587,432 2,222,371 2,446,005�IO� Accumulation Share Class USD 14,071,735 192,887 4,626,223 9,638,399�R� Accumulation Share Class EUR 343,961 527,596 293,460 578,097�R� Accumulation Share Class USD 2,280,723 593,615 631,653 2,242,685�R� Accumulation Share Class (EUR Hedged Class) EUR 1,460,503 537,951 1,115,360 883,094�R� Accumulation Share Class (GBP Hedged Class) GBP 2,074,581 968,016 1,217,057 1,825,540�R� Share Class USD 8,104,759 1,649,264 1,600,919 8,153,104
Multi-Manager Dynamic World Equity Portfolio Total 38,189,785 5,394,853 13,301,481 30,283,157
Global Corporate Portfolio (Hedged)�I� Accumulation Share Class NOK 85,120,886 8,416,137 — 93,537,023
Global Corporate Portfolio (Hedged) Total 85,120,886 8,416,137 — 93,537,023
Absolute Return Tracker PortfolioBase Accumulation Share Class USD 84,850 58,029 45,765 97,114Other Currency Accumulation Share Class (CHF Hedged Class) CHF 125,455 402,608 63,081 464,982Other Currency Accumulation Share Class (EUR Hedged Class) EUR 1,359,868 276,799 702,394 934,273Other Currency Accumulation Share Class (SGD Hedged Class)* SGD — 14,000 — 14,000�A� Accumulation Share Class USD 11,587 23,452 16,232 18,807�E� Accumulation Share Class (EUR Hedged Class) EUR 1,520 8,247 5,608 4,159�I� Accumulation Share Class USD 14,358,292 11,853,505 17,291,475 8,920,322�I� Accumulation Share Class (AUD Hedged Class) AUD 103 — — 103�I� Accumulation Share Class (CHF Hedged Class) CHF 19,801,989 7,427,291 6,511,825 20,717,455�I� Accumulation Share Class (EUR Hedged Class) EUR 16,010,056 8,713,669 12,685,168 12,038,557�I� Accumulation Share Class (GBP Hedged Class) GBP 1,335,511 329,005 702,588 961,928�I� Accumulation Share Class (JPY Hedged Class) JPY 3,498,355 — 1,205 3,497,150�I� Accumulation Share Class (SEK Hedged Class) SEK 1,117,087 4,035,619 4,088,767 1,063,939�P� Accumulation Share Class USD 1,315,674 505,035 636,575 1,184,134�P� Accumulation Share Class (EUR Hedged Class) EUR 120,101 43,061 11,100 152,062�R� Accumulation Share Class (EUR Hedged Class) EUR 5,536,588 1,226,178 2,136,637 4,626,129�R� Share Class USD 4,036,251 2,706,426 2,422,405 4,320,272�R� Share Class (GBP Hedged Class) GBP 1,982,862 556,449 610,787 1,928,524
Absolute Return Tracker Portfolio Total 70,696,149 38,179,373 47,931,612 60,943,910
Alternative Trend PortfolioOther Currency Accumulation Share Class (EUR Hedged Class) EUR 25,254 161,231 40,107 146,378�I� Accumulation Share Class USD 72,105 21,426 76,393 17,138�I� Accumulation Share Class (EUR Hedged Class) EUR 4,544,658 1,409,065 3,118,974 2,834,749�I� Accumulation Share Class (GBP Hedged Class) GBP 98,795 154,104 25,081 227,818�I� Share Class (GBP Hedged Class) GBP 1,272,286 529,882 78,716 1,723,452�IO� Accumulation Share Class USD 16,806,191 8,273,376 1,278,851 23,800,716�IO� Accumulation Share Class (JPY Hedged Class) JPY 1,916,034 496,003 2,206,888 205,149
Goldman Sachs FundsNotes to the Financial Statements
For the Year Ended 30 November 2020
89

7 Share Capital (Continued)
CurrencyBalance at
30-Nov-2019 Subscriptions RedemptionsBalance at
30-Nov-2020
Alternative Trend Portfolio (Continued)�IO� Share Class USD 4,306,755 146,330 512,158 3,940,927�R� Share Class (GBP Hedged Class) GBP 6,976 8,428 4,675 10,729
Alternative Trend Portfolio Total 29,049,054 11,199,845 7,341,843 32,907,056
* Refer to Appendix II.
8 Distr ibut ions
The Fund intends that substantially all the net investment income, if any, of each Portfolio will be declared as adividend and paid at least annually to the Shareholders of the Distribution Share Classes of the Portfolios. Netcapital and currency gains realised on each Portfolio’s investments are expected to be retained by each Portfolio,except in the case of “IX” shares where at the discretion of the Board of Directors of the Fund, the Portfolio mayalso distribute to its Shareholders the Portfolio’s capital gains, if any, and capital attributable to such shares. Forshares denoted with MBS in the US Real Estate Balanced Portfolio, the Board of Directors currently intends forany realised gains, net of losses on prepayments from mortgage backed securities, attributable to such shares,to also be declared as a dividend.
Dividends distributed by each Portfolio may be paid in cash or reinvested in additional shares of the Portfolio atthe net asset value of the shares as of the date on which such dividends are declared. When Shareholders makeuse of this reinvestment facility, each dividend due to the Shareholder will be processed by the Transfer Agent assubscriptions in further shares. Any contingent deferred sales charges of “B” shares due as the result ofreinvestment of dividends will be waived.
Generally no distributions will be made in respect of the Accumulation Share Classes.
9 Financial Investments and Associated Risks
The Fund’s investing activities expose it to various types of risks that are associated with the financialinvestments and markets in which it and its underlying Portfolios invest (the “Investment Risks”). These may beboth derivative and non-derivative financial investments. The Fund’s underlying Portfolios’ investments arecomprised of debt, equity, derivative investments and investments in other funds at the year end. The Board ofDirectors has appointed the Management Company to be responsible for, among other things, investmentmanagement and risk management. The Management Company has delegated certain investmentmanagement functions to the Investment Adviser.
The main types of financial risks which the Fund is exposed to are market risk, liquidity risk and credit risk. TheProspectus provides details of these and other types of risk some of which are additional to that informationprovided in these financial statements.
Asset allocation is determined by the Fund’s Investment Adviser who manages the allocation of assets toachieve the investment objectives as detailed in the Prospectus. Achievement of the investment objectivesinvolves taking risks. The Investment Adviser exercises judgment based on analysis, research and riskmanagement techniques when making investment decisions. Divergence from the benchmark and/or the targetasset allocations and the composition of the Portfolio is monitored in accordance with the Fund’s riskmanagement policy.
The risk management policies employed in relation to the Fund are outlined below.
(a) Market Risk
The potential for changes in the market value of the Fund’s underlying Portfolios’ investments is referred to asmarket risk. Commonly used categories of market risk include currency risk, interest rate risk and other pricerisk.
(i) Currency risks may result from exposures to changes in spot prices, forward prices and volatilitiesof currency rates.
Goldman Sachs FundsNotes to the Financial Statements
For the Year Ended 30 November 2020
90

9 Financial Investments and Associated Risks (Continued)
(a) Market Risk (Continued)
(ii) Interest rate risks may result from exposures to changes in the level, slope and curvature of thevarious yield curves, the volatility of interest rates, mortgage prepayment speeds and creditspreads.
(iii) Other price risks are the risk that the value of an investment will fluctuate as a result of changes inmarket prices other than those arising from currency risk and may result from exposures to changesin the prices and volatilities of individual equities, equity baskets, equity indices, and commodities.
The Fund’s market risk strategy is driven by the Fund’s underlying Portfolios’ investment risk and returnobjectives.
Market risk is managed through the application of risk budgeting principles. The Investment Adviser determinesan appropriate risk target, commonly referred to as Tracking Error, employing a risk budgeting framework.
The AMD Divisional Risk Management group at Goldman Sachs (“Divisional Risk”) is responsible for overall riskgovernance structure and establishing appropriate risk management best practices. The risk governancestructure includes identifying, measuring, monitoring, escalating and remediating applicable risks. AMDDivisional Risk uses a number of risk metrics to monitor the risk profile of funds on a regular and ongoing basis.GSAMFSL’s risk management function, in association with AMD Divisional Risk Management team, will seek toensure that the risk profile of funds remain consistent with applicable risk limits and internal thresholds which areestablished consistent with the risk profile disclosed to investors. Adherence with these risk thresholds ismonitored on a weekly basis with exceptions promptly notified to the AMD Chief Risk Officer and portfoliomanagement teams. All governance exceptions are reported to the Risk Management Oversight Committee(“RMOC”) and the AMD Risk Working Group. In addition, the GSAMFSL risk management function presents orprovides written materials on the risks to the Board no less frequently than semi-annually.
(i) Currency Risk
The Fund may invest in financial investments and enter into transactions denominated in currencies other thanits Portfolios’ base currency. Consequently, the Fund may be exposed to risks that the exchange rate of its basecurrency relative to other foreign currencies may change in a manner that has an adverse effect on the value ofthat portion of the Fund’s assets or liabilities denominated in currencies other than the base currency.
When an investor invests into a Share Class which is in a different currency to the base currency of the Portfolioin which it invests, the currency risk of the investor will be different to the currency risk of the Portfolio.
(ii) Interest Rate Risk
The Fund may invest in fixed income securities and interest rate swaps contracts. Any change to relevant interestrates for particular securities may result in the Investment Adviser being unable to secure similar returns uponthe expiry of contracts or the sale of securities. In addition, changes to prevailing interest rates or changes inexpectations of future rates may result in an increase or decrease in the value of the securities held. In general,if interest rates rise, the value of fixed income securities will decline. A decline in interest rates will in general,have the opposite effect. All fixed income securities and floating rate securities, together with their interest rateand maturity date are disclosed in the Schedule of Investments. The Fund may invest in instruments in desiredcurrencies at fixed, floating and zero rates of interest.
(iii) Other Price Risk
Other price risk is the risk that the value of a financial investment will fluctuate as a result of changes in marketprices, other than those arising from currency risk or interest rate risk whether caused by factors specific to anindividual investment, its issuer or any factor affecting financial investments traded in the market.
The Fund’s financial investments are carried at market value with market value changes recognised in theStatement of Operations, all changes in market conditions will directly affect Shareholders’ equity.
Goldman Sachs FundsNotes to the Financial Statements
For the Year Ended 30 November 2020
91

9 Financial Investments and Associated Risks (Continued)
(a) Market Risk (Continued)
(iii) Other Price Risk (Continued)
The Fund’s investments in mutual funds is based upon the net asset value as supplied by the funds, inaccordance with the valuation policy of the applicable fund as outlined in its prospectus. While it is expected thatthe assets of the mutual funds will generally be valued by an independent third party administrator or otherservice provider, there may be circumstances in which certain securities or other assets of a mutual fund may nothave a readily ascertainable market price. In such circumstances, the manager of the relevant mutual fund maybe required to value such securities or instruments.
During the year, an outbreak of a novel strain of coronavirus (COVID-19) emerged globally. Global financialmarkets have experienced and may continue to experience significant volatility resulting from the spread ofCOVID-19. The extent of the impact of COVID-19 on each Fund’s performance will depend on futuredevelopments, including the duration and continued spread of the outbreak.
(b) Liquidi ty Risk
Liquidity risk is the risk that the Fund will encounter difficulty in meeting obligations associated with financialliabilities that are settled by delivering cash or another financial asset. Among other things liquidity could beimpaired by an inability to access secured and/or unsecured sources of financing, an inability to sell assets orunforeseen outflows of cash or collateral or violations of counterparty or prime broker terms or covenants. Thissituation may arise due to circumstances outside of the Fund’s control, such as a general market disruption or anoperational problem affecting the Fund or third parties. Also, the ability to sell assets may be impaired if othermarket participants are seeking to sell similar assets at the same time.
The Fund’s investments include mutual funds, which may impose greater restrictions on redemptions than thoseimposed by the Fund. This may include offering less frequent redemption dates than are offered by the Fund toits shareholders.
The Fund’s financial investments include investments in derivative contracts traded over the counter, which arenot traded in an organised public market and which may be illiquid and in investments which may represent asignificant percentage of issue size. As a result, the Fund may not be able to liquidate quickly some of theseinvestments at an amount close to its market value in order to meet requirements, or to respond to specific eventssuch as deterioration in the credit-worthiness of any particular issuer. The forced liquidation of investmentpositions may cause financial losses.
The Fund provides for the subscription and redemption of shares and it is therefore exposed to the liquidity riskassociated with shareholder redemptions in accordance with the terms in the Prospectus. The Fund’s underlyingPortfolios are managed to include liquid investments which the Investment Adviser believes are sufficient to meetnormal liquidity needs. Substantial redemptions of shares in the Fund could require the Fund to liquidate itsinvestments more rapidly than otherwise desirable in order to raise cash for the redemptions and changes in theliquidity of the Portfolio’s underlying investments once acquired can adversely impact its position in this respect.
These factors could adversely affect the value of the shares redeemed and the valuation of the shares thatremain outstanding and the liquidity of the Portfolio’s remaining assets if more liquid assets have to be sold tomeet redemptions.
Please refer to Appendix III for details of Shareholders with holdings greater than 10% of the Portfolio’s netassets as at 30 November 2020.
Financing arrangements include reverse repurchase agreements, derivative transactions and lines of credit.Expiration or termination of available financing for leveraged positions, and the requirements to post collateral inrespect of changes in the market value of leveraged exposures or changes in advance rates or other terms andconditions of the Fund’s financing arrangements, can result in adverse effects to the Fund’s access to liquidityand ability to maintain leveraged positions, and may cause the Fund to incur material losses.
Goldman Sachs FundsNotes to the Financial Statements
For the Year Ended 30 November 2020
92

9 Financial Investments and Associated Risks (Continued)
(b) Liquidi ty Risk (Continued)
However, there is no guarantee that any such arrangements for obtaining leverage will be available, or, ifavailable, will be available on terms and conditions acceptable to the Fund. Unfavourable economic conditionsalso could increase funding costs, limit access to the capital markets or result in a decision by lenders not toextend credit to the Fund.
The use of leverage also increases risk as it magnifies the effect of any volatility in market values on the Fund’sequity.
A decline in the market value of the Fund’s assets may have particular adverse consequences in instanceswhere the Fund has borrowed money on the market value of those assets. A decrease in the market value ofthose assets may result in the lender (including derivative counterparties) requiring the Fund to post additionalcollateral or otherwise sell assets at a time when it may not be in the Fund’s best interest to do so.
The redemption of Shares of a Portfolio may be temporarily suspended, or deferred, by the Board of Directors orthe Management Company on behalf of the Fund upon certain circumstances, and where it is deemed in thebest interests of Shareholders.
As of 30 November 2020, the Fund participated in a USD 260,000,000 committed, unsecured revolving line ofcredit facility (the “facility”) together with other sub-funds of Goldman Sachs Funds II SICAV and Goldman SachsLux Investment Funds. This facility is to be used for temporary emergency purposes, or to allow for an orderlyliquidation of securities to meet redemption requests. The interest rate on borrowings is based on a referencerate related to the drawn currency (e.g. LIBOR, EURIBOR). The facility also requires a fee to be paid by the Fundbased on the amount of the commitment that has not been utilised. For the year ended 30 November 2020 theFund did not have any borrowings under the facility.
(c) Credit Risk
Credit and counterparty risk is the risk that one party to a financial investment will cause a financial loss for theother party by failing to discharge an obligation.
Procedures have been adopted to reduce credit risk related to the Fund’s dealings with counterparties. Beforetransacting with any counterparty, the Investment Adviser or its affiliates evaluate both credit-worthiness andreputation by conducting a credit analysis of the party, their business and reputation. The credit risk of approvedcounterparties is then monitored on an ongoing basis, including periodic reviews of financial statements andinterim financial reports as needed.
In order to reduce exposure to credit losses, some over-the-counter derivative agreements entered into by theFund permit netting of transactions arising under such agreements, excluding those with counterpartiesexecuting only spot foreign exchange contracts. These netting rights provide for the reduction of credit risk onfavourable over-the-counter transactions with a single counterparty to the extent of the value of unfavourableover-the-counter transactions with the same counterparty upon the occurrence of an event of default ortermination event as all over-the-counter transactions with the counterparty under such agreement areterminated and amounts owed from and amounts payable to the counterparty are settled on a net basis.
Debt securities are subject to the risk of an issuer’s or a guarantor’s inability to meet principal and interestpayments on its obligations and are subject to price volatility due to factors such as interest rate sensitivity,market perception of the credit-worthiness of the issuer, and general market liquidity.
The Fund is subject to a number of risks relating to the insolvency, administration, liquidation or other formalprotection from creditors (“Insolvency”) of the Depositary or any sub-custodian. These risks include withoutlimitation:
1. The loss of all cash held with the Depositary or sub-custodian which is not being treated as client moneyboth at the level of the Depositary and any sub-custodian (“client money”).
2. The loss of all cash which the Depositary or sub-custodian has failed to treat as client money in accordancewith procedures (if any) agreed with the Fund.
Goldman Sachs FundsNotes to the Financial Statements
For the Year Ended 30 November 2020
93

9 Financial Investments and Associated Risks (Continued)
(c) Credit Risk (Continued)
3. The loss of some or all of any securities held on trust which have not been properly segregated and soidentified both at the level of the Depositary and any sub-custodian (“Trust Assets”) or client money held byor with the Depositary or sub-custodian.
4. The loss of some or all assets due to the incorrect operation of accounts by the Depositary or sub-custodianor due to the process of identifying and transferring the relevant Trust Assets and/or client money includingany deduction to meet the administrative costs of an insolvency.
5. Losses caused by prolonged delays in receiving transfers of balances and regaining control over therelevant assets.
An insolvency could cause severe disruption to the Fund’s investment activity. In some circumstances, this couldcause the Directors to temporarily suspend the calculation of the Net Asset Value and dealings in shares.
(d) Addit ional Risks
(i) Concentration Risk
The Fund may invest in a limited number of investments and investment themes. A consequence of a limitednumber of investments is that performance may be more favourably or unfavourably affected by the performanceof an individual investment.
(ii) Operational Risk
Operational risk is the potential for loss caused by a deficiency in information, communications, transactionprocessing and settlement, and accounting systems. The Fund’s service providers, including sub-custodians,maintain controls and procedures for the purpose of helping to manage operational risk. Reviews of the servicelevels of service providers are performed on a regular basis by the Investment Adviser. No assurance is giventhat these measures will be 100% effective.
(iii) Legal, Tax and Regulatory Risks
Legal, tax and regulatory changes could occur which may adversely affect the Fund.
With respect to tax, the Fund may be subject to taxation on capital gains, interest and dividends in certainjurisdictions where the Fund invests.
The interpretation and applicability of the tax law and regulations by tax authorities at times may not be clear orconsistent. Tax obligations where probable and estimable are recorded as liabilities. However, some taxobligations are subject to uncertainty and may result in additional tax liabilities, interest and penalties based onfuture actions, interpretations or judgements of these authorities covering current and past tax positions.Accounting standards may also change, creating or removing an obligation for the Fund to accrue for a potentialtax liability.
Consequently, it is possible that certain potential tax obligations which currently are not probable may become sowhich may result in additional tax liabilities for a Fund in the future and these additional liabilities may be material.Because of the foregoing uncertainties, the Net Asset Value may not reflect the tax liabilities ultimately borne bythe Fund, including at the time of any subscriptions, redemptions or exchanges of interests in the Fund, whichcould have an adverse impact on investors at that time.
(iv) Non-Developed Markets Risk
The Fund may invest a portion of its capital in securities of companies based in non-developed or emergingmarkets or issued by governments of such countries. Investing in the securities of such companies and countriesinvolves certain considerations not usually associated with investing in securities of developed marketcompanies or countries, including, without limitation, less liquidity, greater price and foreign currency volatility,and greater legal, tax and regulatory risks.
Goldman Sachs FundsNotes to the Financial Statements
For the Year Ended 30 November 2020
94

9 Financial Investments and Associated Risks (Continued)
(d) Addit ional Risks (Continued)
(v) Small Capitalisation Companies Risk
The Fund may invest a portion of its capital in securities of companies with smaller capitalisation. Smallercapitalisation companies are generally not as well known to the investing public and have less investor followingthan larger capitalisation companies. Investing in the securities of such companies may involve certainconsiderations, including, without limitation, less liquidity, greater price volatility, and risks associated with limitedoperating histories and/or the availability of information pertaining to the company and its operations.
(vi) Investment Sub-Adviser Selection Risk
The investment decisions in respect of a Multi-Manager Portfolio will be made by its External Managers. TheExternal Managers in a Multi-Manager Portfolio will make decisions with respect to the purchase, management,disposition, or other realisation of a Multi-Manager Portfolio’s investments.
It is not intended that the External Managers will be selected from the Goldman Sachs Group or any of itsaffiliates. Consequently, the Investment Adviser has no control, directly or indirectly, over the business affairs ormarket conduct of the External Managers. In selecting the External Managers, the Investment Adviser hasundertaken reasonable investigative and due diligence procedures but is nevertheless reliant on informationsupplied to it by each of the External Managers as well as information in relation to the External Managersobtained from independent sources and from the public domain.
Additional details of risks not disclosed in these Financial Statements can be found in the Prospectus.
10 Exchange Rates
The following exchange rates (against USD) were used to calculate the Combined Total, in the Statement ofAssets and Liabilities, for the year ended 30 November 2020:
Currency 30-Nov-2020
Euro (EUR) 0.833646
Japanese Yen (JPY) 104.255000
Norwegian Krone (NOK) 8.801650
United Kingdom Pound (GBP) 0.747775
The following average exchange rates (against USD) were used to calculate the Combined Total, in theStatement of Operations and Statement of Changes in Shareholders’ Equity (except for Shareholder’s Equity atthe start and end of the year) for the year ended 30 November 2020:
Currency
Euro (EUR) 0.883814
Japanese Yen (JPY) 107.204208
Norwegian Krone (NOK) 9.444048
United Kingdom Pound (GBP) 0.781465
The following exchange rates were used to convert amounts from local share class currencies to base Portfolios’currencies, for the year ended November 30, 2020:
Share Class Currency
Base Currency
Euro (EUR) Japanese Yen (JPY)United States Dollar
(USD)
Australian Dollar (AUD) Not applicable Not applicable 1.355289
Euro (EUR) Not applicable 0.007996 0.833646
Hong Kong Dollar (HKD) Not applicable Not applicable 7.751750
Goldman Sachs FundsNotes to the Financial Statements
For the Year Ended 30 November 2020
95

10 Exchange Rates (Continued)
Share Class Currency
Base Currency
Euro (EUR) Japanese Yen (JPY)United States Dollar
(USD)
Japanese Yen (JPY) Not applicable Not applicable 104.255000
Norwegian Krone (NOK) 10.558019 Not applicable Not applicable
Polish Zloty (PLN) 4.474141 Not applicable 3.729850
Singapore Dollar (SGD) 1.604338 Not applicable 1.337450
Swedish Krona (SEK) 10.176022 0.081370 8.483200
Swiss Franc (CHF) 1.084273 0.008670 0.903900
United Kingdom Pound (GBP) 0.896993 0.007173 0.747775
United States Dollar (USD) 1.199550 0.009592 Not applicable
The following exchange rates as of 27 November 2020 were used to convert amounts from local share classcurrencies to India Equity Portfolio’s base currency:
Share Class Currency
Base Currency
United States Dollar(USD)
Euro (EUR) 0.837346
Singapore Dollar (SGD) 1.338000
Swedish Krona (SEK) 8.521000
United Kingdom Pound (GBP) 0.749260
11 Commission Recapture
All Portfolios may direct trades, subject to obtaining best price and execution, to various brokers who haveagreed to rebate a portion of the commissions generated. Such rebates are made directly to the applicablePortfolio as cash payments and are included in net realised gain and loss on investments in the Statement ofOperations. For the year ended 30 November 2020, there were no commissions paid on securities in theprogram and reimbursed to the Portfolios.
12 Statement of Changes in each Portfol io
A Statement of Changes is available, free of charge, upon request from the registered office.
13 Cash Collateral Information
The table below provides the cash collateral balances due from / due to brokers in relation to the followinginvestments held as at 30 November 2020:
Portfolios CurrencyDue from /Due to brokers
Investmenttype
Cash collateralbalances
Asia Equity Portfolio USDDue from Exchange Traded Derivatives 378,091
Due to Exchange Traded Derivatives —
Global Equity Partners Portfolio USDDue from OTC Derivatives 340,000
Due to OTC Derivatives 260,000
India Equity Portfolio USDDue from Exchange Traded Derivatives 708,225
Due to Exchange Traded Derivatives —
Japan Equity Partners Portfolio* JPYDue from OTC Derivatives 221,000
Due to OTC Derivatives 179,507
Japan Equity Portfolio* JPYDue from OTC Derivatives —
Due to OTC Derivatives 412,237
Goldman Sachs FundsNotes to the Financial Statements
For the Year Ended 30 November 2020
96

13 Cash Collateral Information (Continued)
Portfolios CurrencyDue from /Due to brokers
Investmenttype
Cash collateralbalances
US Equity Portfolio USDDue from OTC Derivatives —
Due to OTC Derivatives 1,720,000
Emerging Markets CORE® Equity Portfolio USDDue from Exchange Traded Derivatives —
Due to Exchange Traded Derivatives 234,555
Europe CORE® Equity Portfolio EUR
Due from Exchange Traded Derivatives 583
Due to Exchange Traded Derivatives —
Due from OTC Derivatives 619,125
Due to OTC Derivatives —
Global CORE® Equity Portfolio USD
Due from Exchange Traded Derivatives 5,166
Due to Exchange Traded Derivatives —
Due from OTC Derivatives —
Due to OTC Derivatives 320,000
Global Small Cap CORE® Equity Portfolio USDDue from Exchange Traded Derivatives —
Due to Exchange Traded Derivatives 3,358
US CORE® Equity Portfolio USD
Due from Exchange Traded Derivatives 1,825,370
Due to Exchange Traded Derivatives —
Due from OTC Derivatives —
Due to OTC Derivatives 680,000
Asia High Yield Bond Portfolio USDDue from Exchange Traded Derivatives 8,535
Due to Exchange Traded Derivatives —
Emerging Markets Corporate Bond Portfolio USD
Due from Exchange Traded Derivatives 10,530,424
Due to Exchange Traded Derivatives —
Due from OTC Derivatives 46,179,421
Due to OTC Derivatives 13,170,000
Emerging Markets Debt Blend Portfolio USD
Due from Exchange Traded Derivatives 2,337,663
Due to Exchange Traded Derivatives —
Due from OTC Derivatives 20,905,613
Due to OTC Derivatives 21,390,000
Emerging Markets Debt Local Portfolio USD
Due from Exchange Traded Derivatives 487,908
Due to Exchange Traded Derivatives —
Due from OTC Derivatives 36,775,977
Due to OTC Derivatives 38,100,001
Emerging Markets Debt Portfolio USD
Due from Exchange Traded Derivatives 20,170,569
Due to Exchange Traded Derivatives —
Due from OTC Derivatives 185,612,226
Due to OTC Derivatives 48,970,000
Emerging Markets Short Duration Bond Portfolio USDDue from Exchange Traded Derivatives 89,794
Due to Exchange Traded Derivatives —
Euro Short Duration Bond Plus Portfolio EUR
Due from Exchange Traded Derivatives 378,300
Due to Exchange Traded Derivatives —
Due from OTC Derivatives 1,477,277
Due to OTC Derivatives 284,000
Europe High Yield Bond Portfolio EUR
Due from Exchange Traded Derivatives 31,576
Due to Exchange Traded Derivatives —
Due from OTC Derivatives 56,042
Due to OTC Derivatives —
Goldman Sachs FundsNotes to the Financial Statements
For the Year Ended 30 November 2020
97

13 Cash Collateral Information (Continued)
Portfolios CurrencyDue from /Due to brokers
Investmenttype
Cash collateralbalances
Global Credit Portfolio (Hedged) USD
Due from Exchange Traded Derivatives 5,117,338
Due to Exchange Traded Derivatives —
Due from OTC Derivatives 20,483,970
Due to OTC Derivatives 3,090,000
Global ESG Enhanced Income Bond Portfolio USD
Due from Exchange Traded Derivatives 91,050
Due to Exchange Traded Derivatives —
Due from OTC Derivatives 44,517
Due to OTC Derivatives —
Global Fixed Income Portfolio USD
Due from Exchange Traded Derivatives 655,995
Due to Exchange Traded Derivatives —
Due from OTC Derivatives 1,713,226
Due to OTC Derivatives 350,000
Global Fixed Income Portfolio (Hedged) EUR
Due from Exchange Traded Derivatives 4,206,637
Due to Exchange Traded Derivatives —
Due from OTC Derivatives 20,781,499
Due to OTC Derivatives 12,485,940
Due From Mortgage Backed securities 425,159
Due To Mortgage Backed securities 750,281
Global High Yield Portfolio USD
Due from Exchange Traded Derivatives 8,493,930
Due to Exchange Traded Derivatives —
Due from OTC Derivatives 4,567,141
Due to OTC Derivatives 16,740,000
Global Sovereign Bond Portfolio USD
Due from Exchange Traded Derivatives 755,528
Due to Exchange Traded Derivatives —
Due from OTC Derivatives 7,056,679
Due to OTC Derivatives 11,830,000
Short Duration Opportunistic Corporate Bond Portfolio USDDue from OTC Derivatives 744,245
Due to OTC Derivatives —
Sterling Credit Portfolio GBP
Due from Exchange Traded Derivatives 134,422
Due to Exchange Traded Derivatives —
Due from OTC Derivatives 284,878
Due to OTC Derivatives —
US Dollar Short Duration Bond Portfolio USD
Due from Exchange Traded Derivatives 346,180
Due to Exchange Traded Derivatives —
Due from OTC Derivatives 117,563
Due to OTC Derivatives —
US Fixed Income Portfolio USD
Due from Exchange Traded Derivatives 285,678
Due to Exchange Traded Derivatives —
Due from OTC Derivatives 634,935
Due to OTC Derivatives —
US Mortgage Backed Securities Portfolio USD
Due from Exchange Traded Derivatives 110,368
Due to Exchange Traded Derivatives —
Due from OTC Derivatives 1,106,945
Due to OTC Derivatives —
Due From Mortgage Backed securities —
Due To Mortgage Backed securities 280,000
Goldman Sachs FundsNotes to the Financial Statements
For the Year Ended 30 November 2020
98

13 Cash Collateral Information (Continued)
Portfolios CurrencyDue from /Due to brokers
Investmenttype
Cash collateralbalances
Emerging Markets Multi-Asset Portfolio USD
Due from Exchange Traded Derivatives 45,564
Due to Exchange Traded Derivatives —
Due from OTC Derivatives 78,673
Due to OTC Derivatives —
Global Multi-Asset Balanced Portfolio USDDue from Exchange Traded Derivatives 286,211
Due to Exchange Traded Derivatives —
Global Multi-Asset Conservative Portfolio USD
Due from Exchange Traded Derivatives —
Due to Exchange Traded Derivatives 438,168
Due from OTC Derivatives 500,000
Due to OTC Derivatives —
Global Multi-Asset Growth Portfolio USD
Due from Exchange Traded Derivatives 759,454
Due to Exchange Traded Derivatives —
Due from OTC Derivatives 580,000
Due to OTC Derivatives —
Global Multi-Asset Income Portfolio USD
Due from Exchange Traded Derivatives 5,164,482
Due to Exchange Traded Derivatives —
Due from OTC Derivatives 180,000
Due to OTC Derivatives —
US Real Estate Balanced Portfolio USDDue from Exchange Traded Derivatives 206,143
Due to Exchange Traded Derivatives —
Emerging Markets Total Return Bond Portfolio USD
Due from Exchange Traded Derivatives 872,390
Due to Exchange Traded Derivatives —
Due from OTC Derivatives 3,873,993
Due to OTC Derivatives 5,890,000
Global Absolute Return Portfolio USD
Due from Exchange Traded Derivatives 9,182,350
Due to Exchange Traded Derivatives —
Due from OTC Derivatives 7,504,766
Due to OTC Derivatives 1,037,725
Global Fixed Income Plus Portfolio (Hedged) EUR
Due from Exchange Traded Derivatives 6,139,018
Due to Exchange Traded Derivatives —
Due from OTC Derivatives 33,707,798
Due to OTC Derivatives 8,424,481
Due From Mortgage Backed securities 5,560,419
Due To Mortgage Backed securities 6,177,317
Global Strategic Income Bond Portfolio USD
Due from Exchange Traded Derivatives 3,786,170
Due to Exchange Traded Derivatives —
Due from OTC Derivatives 82,128,865
Due to OTC Derivatives 23,570,000
Due From Mortgage Backed securities —
Due To Mortgage Backed securities 2,390,000
Global Strategic Macro Bond Portfolio USD
Due from Exchange Traded Derivatives 2,539,368
Due to Exchange Traded Derivatives —
Due from OTC Derivatives 23,885,831
Due to OTC Derivatives 6,410,000
Due From Mortgage Backed securities 30,000
Due To Mortgage Backed securities 990,000
Goldman Sachs FundsNotes to the Financial Statements
For the Year Ended 30 November 2020
99

13 Cash Collateral Information (Continued)
Portfolios CurrencyDue from /Due to brokers
Investmenttype
Cash collateralbalances
Strategic Absolute Return Bond I Portfolio USD
Due from Exchange Traded Derivatives 1,889,323
Due to Exchange Traded Derivatives —
Due from OTC Derivatives 12,031,248
Due to OTC Derivatives 24,960,000
Due From Mortgage Backed securities —
Due To Mortgage Backed securities 630,000
Strategic Absolute Return Bond II Portfolio USD
Due from Exchange Traded Derivatives 221,068
Due to Exchange Traded Derivatives —
Due from OTC Derivatives 5,394,254
Due to OTC Derivatives 3,080,000
Multi-Manager Dynamic World Equity Portfolio USDDue from OTC Derivatives —
Due to OTC Derivatives 600,000
Global Corporate Portfolio (Hedged) NOK
Due from Exchange Traded Derivatives 58,042,580
Due to Exchange Traded Derivatives —
Due from OTC Derivatives 345,307,814
Due to OTC Derivatives 611,513,607
Absolute Return Tracker Portfolio USD
Due from Exchange Traded Derivatives 25,752,802
Due to Exchange Traded Derivatives —
Due from OTC Derivatives 18,360,000
Due to OTC Derivatives 1,363,346
Alternative Trend Portfolio USD
Due from Exchange Traded Derivatives 23,577,919
Due to Exchange Traded Derivatives —
Due from OTC Derivatives 15,540,000
Due to OTC Derivatives 393,824
* Expressed in ‘000
14 Transact ion Costs
Transaction costs have been defined as broker commission fees, commission on futures contracts, market feesand taxes relating to purchase or sale of equity and investments in other funds. Depositary based transactioncosts are included in ‘Depositary fees’ in the Statement of Operations.
For the year ended 30 November, 2020, the following Portfolios incurred separately identifiable transactioncosts:
Portfolios CurrencyTransaction
Costs*
% of averageShareholders’
Equity
Asia Equity Portfolio USD 247,209 0.17%
BRICs Equity Portfolio USD 128,262 0.14%
China Opportunity Equity Portfolio USD 172,109 0.31%
Emerging Markets Equity ESG Portfolio USD 199,983 0.19%
Emerging Markets Equity Portfolio USD 3,405,903 0.11%
Global Environmental Impact Equity Portfolio USD 210,066 0.25%
Global Equity Income Portfolio USD 15,587 0.14%
Global Equity Partners ESG Portfolio USD 31,118 0.12%
Global Equity Partners Portfolio USD 559,136 0.07%
Global Future Health Care Equity Portfolio USD 11,317 0.06%
Goldman Sachs FundsNotes to the Financial Statements
For the Year Ended 30 November 2020
100

14 Transact ion Costs (Continued)
Portfolios CurrencyTransaction
Costs*
% of averageShareholders’
Equity
Global Future Technology Leaders Equity Portfolio USD 2,140,626 0.11%
Global Millennials Equity Portfolio USD 917,430 0.16%
India Equity Portfolio USD 3,661,730 0.23%
Japan Equity Partners Portfolio** JPY 89,439 0.08%
Japan Equity Portfolio** JPY 174,146 0.16%
N-11® Equity Portfolio USD 109,374 0.25%
US Equity Portfolio USD 256,132 0.04%
US Focused Growth Equity Portfolio USD 5,951 0.02%
US Smaller Cap Equity Portfolio USD 36,418 0.13%
US Technology Opportunities Equity Portfolio USD 5,479 0.01%
Global Infrastructure Equity Portfolio USD 14,708 0.13%
Global Real Estate Equity Portfolio USD 73,953 0.18%
North America Energy & Energy Infrastructure Equity Portfolio USD 65,813 0.15%
Emerging Markets CORE® Equity Portfolio USD 11,816,207 0.45%
Europe CORE® Equity Portfolio EUR 4,803,387 0.21%
Global CORE® Equity Portfolio USD 2,791,112 0.07%
Global Small Cap CORE® Equity Portfolio USD 339,711 0.07%
US CORE® Equity Portfolio USD 314,279 0.02%
US Small Cap CORE® Equity Portfolio USD 72,073 0.03%
GQG Partners Global Equity Portfolio USD 150,768 0.06%
Emerging Markets Multi-Asset Portfolio USD 32,900 0.11%
Global Multi-Asset Balanced Portfolio USD 1,146 0.00%
Global Multi-Asset Conservative Portfolio USD 944 0.00%
Global Multi-Asset Growth Portfolio USD 4,014 0.00%
Global Multi-Asset Income Portfolio USD 28,822 0.04%
US Real Estate Balanced Portfolio USD 31,132 0.01%
Global Absolute Return Portfolio USD 45,136 0.02%
Multi-Manager Dynamic World Equity Portfolio USD 546,674 0.08%
Absolute Return Tracker Portfolio USD 27,835 0.00%
Total (in USD)*** 36,364,615
* Transaction costs for fixed income investments, forward currency contracts and other derivative contracts are not separatelyidentifiable. Portfolios that invest solely in those investments are not disclosed in the table above.
** Expressed in ‘000*** Total amount is calculated using the exchange rates disclosed on Note 10.
Note: benchmark returns, with the exception of taxes at times, do not incorporate transaction costs.
15 Commissions for Research and/or Execution
Certain Portfolios pay commission for execution only and/or execution and investment research. Thecommissions for execution are recognised in the transaction price. The Fund did not otherwise enter into anythird party commission arrangements for the year ended 30 November 2020.
16 Prospectus
As at 30 November 2020, the latest Prospectus of the Fund is dated June 2020 with an addendum datedSeptember 2020.
Goldman Sachs FundsNotes to the Financial Statements
For the Year Ended 30 November 2020
101

17 Currency Adjustment
In the Statement of Changes in Shareholders’ Equity, the opening value of the Fund has been restated at theexchange rates ruling at 30 November 2019, and the combined figures have been calculated using the averageexchange rates throughout the year. The resulting gain of USD 703,585,404 represents the movement inexchange rates between 1 December 2019 and 30 November 2020. This is a notional gain, which has no impacton the Net Asset Value of the individual Portfolios.
18 Cross Liabi l i t ies
In accordance with Luxembourg law, each Portfolio is “ring-fenced” and considered to constitute a single pool ofassets and liabilities, so that the rights of Shareholders and creditors in relation to each Portfolio should belimited to the assets of that Portfolio.
19 Contingent Liabi l i t ies
There were no contingent liabilities as at 30 November 2020.
20 Subsequent Events
After the year ended 30 November 2020, the following Portfolios had name changes:
Former name of Portfolio New name of Portfolio Date
Global ESG Enhanced Income Bond Portfolio ESG-Enhanced Global Income Bond Portfolio 8 January 2021
Europe High Yield Bond PortfolioESG-Enhanced Europe High Yield BondPortfolio
8 January 2021
Euro Short Duration Bond Plus PortfolioESG-Enhanced Euro Short Duration BondPlus Portfolio
8 January 2021
Sterling Credit Portfolio ESG-Enhanced Sterling Credit Portfolio 8 January 2021
Emerging Markets Short Duration Bond PortfolioESG-Enhanced Emerging Markets ShortDuration Bond Portfolio
8 January 2021
China Opportunity Equity Portfolio All China Equity Portfolio 10 March 2021
US Smaller Cap Equity PortfolioGoldman Sachs US Small Cap EquityPortfolio
10 March 2021
Global Multi-Asset Balanced PortfolioESG-Enhanced Global Multi-Asset BalancedPortfolio
10 March 2021
Since 30 November 2020 there is a firm intention to close the Goldman Sachs India Equity Portfolio Subsidiary,the organisation of which is detailed in Note 1. There is currently no confirmed date of closure, with an expectedperiod of transition as investments held by the Subsidiary are moved to the Fund. It is not expected to cause anysignificant disruption to the operational activities of Goldman Sachs India Equity Portfolio.
After the year ended 30 November 2020, the following Benchmarks had name changes:
Former name of Benchmark New name of Benchmark Date
MSCI China Index (Total Return Net)MSCI China All Shares Index (Total ReturnNet)
10 March 2021
Russell 2500 Index (Total Return Net) Russell 2000 Index (Total Return Net) 10 March 2021
From 1 December 2020 to 16 March 2021, the following Portfolios had movements greater than 25% inShareholders’ Equity:
Portfolio Currency% Movement in
AUM
% Movement inGross
Performance
Asia Equity Portfolio USD 26.77% 14.19%
Goldman Sachs FundsNotes to the Financial Statements
For the Year Ended 30 November 2020
102

20 Subsequent Events (Continued)
Portfolio Currency% Movement in
AUM
% Movement inGross
Performance
Emerging Markets Equity ESG Portfolio USD 73.86% 13.39%
Global Environmental Impact Equity Portfolio USD 123.57% 12.25%
Global Equity Income Portfolio USD 38.79% 6.92%
Global Equity Partners ESG Portfolio USD 43.83% 7.34%
Global Future Health Care Equity Portfolio USD 385.99% 7.33%
Global Future Technology Leaders Equity Portfolio USD 25.50% 11.81%
Global Millennials Equity Portfolio USD 66.17% 11.46%
India Equity Portfolio USD 31.03% 19.39%
US Smaller Cap Equity Portfolio USD 69.37% 19.29%
US Technology Opportunities Equity Portfolio USD 243.86% 3.74%
Global Infrastructure Equity Portfolio USD 38.68% 0.86%
North America Energy & Energy Infrastructure Equity Portfolio USD 26.10% 21.06%
CORE® Equity Portfolio USD . % . 5%
Global Small Cap CORE® Equity Portfolio USD 42.88% 21.14%
Asia High Yield Bond Portfolio USD 232.98% 2.72%
Global ESG Enhanced Income Bond Portfolio USD 51.48% (1.14%)
Global Multi-Asset Income Portfolio USD 49.79% 1.43%
Strategic Absolute Return Bond II Portfolio USD 36.47% (4.40%)
There were no other subsequent events to note.
21 Indemnif icat ions
The Fund may enter into contracts that contain a variety of indemnifications. The Fund’s maximum exposureunder these arrangements is unknown. However, the Fund has not had prior claims or losses pursuant to thesecontracts.
22 Approval of Financial Statements
The Board of Directors approved the audited Annual Financial Statements on 16 March 2021.
23 Supplemental Information
The Investment Adviser is subject to the Securities and Exchange Commission’s amended Rule 206(4)-2 underthe Investment Advisers Act of 1940 (“the Act”). The Investment Adviser has determined that they are required toprovide the following information to all investors and has determined which Portfolios are to provide thisinformation in accordance with the Act. The Investment Adviser has requested that the Board of Directorsincludes this information in the Board of Directors’ financial statements.
The following is a summary of total return, expense and investment income results for the year ended30 November 2020:
Global Equity Partners Portfolio CurrencyTotalreturn1
Expense beforewaivers/
reimbursements toaverage netassets2,3
Expense afterwaivers/
reimbursements toaverage netassets2,3,4
Net investmentincome/(loss) toaverage netassets2,3
Base Accumulation Share Class USD 20.12% 1.67% 1.67% (0.52%)
Base Accumulation Share Class (USD HedgedClass) USD 18.14% 1.67% 1.67% (0.55%)
Base Currency Share Class USD 20.12% 1.67% 1.67% (0.55%)
Base Currency Share Class (USD Hedged Class) USD 18.15% 1.64% 1.64% (0.53%)
Goldman Sachs FundsNotes to the Financial Statements
For the Year Ended 30 November 2020
103

23 Supplemental Information (Continued)
Global Equity Partners Portfolio(Continued) Currency
Totalreturn1
Expense beforewaivers/
reimbursements toaverage netassets2,3
Expense afterwaivers/
reimbursements toaverage netassets2,3,4
Net investmentincome/(loss) toaverage netassets2,3
Other Currency Accumulation Share Class EUR 10.25% 1.66% 1.66% (0.56%)
Other Currency Accumulation Share Class GBP 15.98% 1.66% 1.66% (0.55%)
Other Currency Accumulation Share Class (EURHedged Class) EUR 14.92% 1.66% 1.66% (0.57%)
Other Currency Share Class GBP 15.99% 1.67% 1.67% (0.57%)
Other Currency Share Class (EUR Hedged Class) EUR 14.91% 1.66% 1.66% (0.58%)
�A� Accumulation Share Class USD 19.55% 2.17% 2.17% (1.14%)
�A� Share Class USD 19.59% 2.16% 2.16% (1.05%)
�E� Accumulation Share Class EUR 9.44% 2.42% 2.42% (1.29%)
�I� Accumulation Share Class EUR 11.11% 0.85% 0.85% 0.26%
�I� Accumulation Share Class USD 21.17% 0.85% 0.85% 0.27%
�I� Accumulation Share Class (EUR Hedged Class) EUR 15.87% 0.84% 0.84% 0.28%
�I� Accumulation Share Class (USD Hedged Class) USD 19.18% 0.84% 0.84% 0.28%
�I� Share Class GBP 16.94% 0.85% 0.85% 0.24%
�I� Share Class (USD Hedged Class) USD 19.12% 0.85% 0.85% 0.27%
�IO� Accumulation Share Class GBP 17.79% 0.10% 0.10% 1.02%
�IO� Accumulation Share Class USD 22.07% 0.10% 0.10% 0.98%
�IO� Accumulation Share Class (USD Hedged Class) USD 20.08% 0.10% 0.10% 1.02%
�IO� Share Class USD 22.09% 0.10% 0.10% 1.01%
�P� Accumulation Share Class USD 20.48% 1.40% 1.40% (0.28%)
�P� Accumulation Share Class (USD Hedged Class) USD 18.48% 1.45% 1.45% 0.03%
�P� Share Class USD 20.46% 1.40% 1.40% (0.31%)
�P� Share Class (USD Hedged Class) USD 18.48% 1.39% 1.39% (0.33%)
�R� Accumulation Share Class EUR 11.02% 0.93% 0.93% 0.20%
�R� Accumulation Share Class GBP 16.90% 0.92% 0.92% 0.24%
�R� Accumulation Share Class USD 21.06% 0.92% 0.92% 0.20%
�R� Accumulation Share Class (EUR Hedged Class) EUR 15.77% 0.91% 0.91% 0.19%
�R� Accumulation Share Class (USD Hedged Class) USD 19.01% 0.89% 0.89% 0.03%
�R� Share Class GBP 16.83% 0.92% 0.92% 0.19%
�R� Share Class USD 21.04% 0.92% 0.92% 0.20%
�R� Share Class (EUR Hedged Class) EUR 15.77% 0.92% 0.92% 0.19%
�R� Share Class (USD Hedged Class) USD 19.08% 0.91% 0.91% 0.10%
India Equity Portfolio CurrencyTotalreturn1
Expense beforewaivers/
reimbursements toaverage netassets2,3
Expense afterwaivers/
reimbursements toaverage netassets2,3,4
Net investmentincome/(loss) toaverage netassets2,3
Base Accumulation Share Class USD 11.43% 1.96% 1.96% (0.59%)
Base Currency Share Class USD 11.37% 1.96% 1.96% (0.54%)
Other Currency Accumulation Share Class SEK (0.56%) 1.96% 1.96% (0.73%)
Other Currency Accumulation Share Class SGD 8.90% 1.97% 1.97% (1.83%)
Other Currency Share Class GBP 7.76% 1.96% 1.96% (0.39%)
�A� Accumulation Share Class USD 10.88% 2.46% 2.46% (1.26%)
�A� Share Class USD 10.88% 2.46% 2.46% (0.85%)
�E� Accumulation Share Class EUR 2.11% 2.46% 2.46% (1.08%)
�I� Accumulation Share Class EUR 3.59% 0.98% 0.98% 2.17%
�I� Accumulation Share Class USD 12.46% 1.00% 1.00% 0.36%
�I� Share Class GBP 8.73% 1.00% 1.00% 0.23%
Goldman Sachs FundsNotes to the Financial Statements
For the Year Ended 30 November 2020
104

23 Supplemental Information (Continued)
India Equity Portfolio(Continued) Currency
Totalreturn1
Expense beforewaivers/
reimbursements toaverage netassets2,3
Expense afterwaivers/
reimbursements toaverage netassets2,3,4
Net investmentincome/(loss) toaverage netassets2,3
�I� Share Class USD 12.52% 0.99% 0.99% 1.43%
�IO� Accumulation Share Class USD 13.42% 0.15% 0.15% 0.98%
�P� Accumulation Share Class EUR 3.23% 1.42% 1.42% (0.45%)
�P� Accumulation Share Class USD 11.98% 1.45% 1.45% 0.04%
�P� Share Class USD 11.94% 1.44% 1.44% 0.17%
�R� Accumulation Share Class EUR 3.52% 1.06% 1.06% 0.47%
�R� Accumulation Share Class USD 12.41% 1.06% 1.06% 0.51%
�R� Share Class GBP 8.69% 1.07% 1.07% 0.35%
�R� Share Class USD 12.42% 1.06% 1.06% 0.36%
Emerging Markets CORE® Equity Portfolio CurrencyTotalreturn1
Expense beforewaivers/
reimbursements toaverage netassets2,3
Expense afterwaivers/
reimbursements toaverage netassets2,3,4
Net investmentincome/(loss) toaverage netassets2,3
Base Accumulation Close Share Class USD 19.62% 1.53% 1.53% 0.85%
Base Accumulation Snap Share Class USD 20.16% 1.53% 1.53% 1.74%
Base Currency Snap Share Class USD 19.94% 1.52% 1.52% 0.76%
Other Currency Accumulation Close Share Class EUR 9.76% 1.53% 1.53% 0.89%
Other Currency Accumulation Close Share Class(Long Emerging Markets CCY vs. USD) CHF 16.42% 1.52% 1.52% 0.76%
Other Currency Accumulation Close Share Class(Long Emerging Markets CCY vs. USD) EUR 16.70% 1.54% 1.54% 0.10%
�A� Accumulation Snap Share Class (Long EmergingMarkets CCY vs. USD) PLN 16.18% 2.02% 2.02% 0.38%
�E� Accumulation Close Share Class EUR 8.85% 2.27% 2.27% 0.19%
�I� Accumulation Close Share Class EUR 10.54% 0.76% 0.76% 1.65%
�I� Accumulation Close Share Class USD 20.55% 0.76% 0.76% 1.72%
�I� Accumulation Snap Share Class GBP 16.62% 0.76% 0.76% 1.85%
�I� Close Share Class EUR 10.58% 0.76% 0.76% 1.67%
�IO� Accumulation Close Share Class GBP 17.12% 0.11% 0.11% 2.32%
�IO� Accumulation Close Share Class JPY 15.47% 0.11% 0.11% 2.37%
�IO� Accumulation Close Share Class USD 21.29% 0.11% 0.11% 2.33%
�IO� Accumulation Snap Share Class USD 21.73% 0.11% 0.11% 2.36%
�IO� Snap Share Class USD 21.61% 0.11% 0.11% 2.33%
�P� Accumulation Close Share Class USD 20.32% 0.95% 0.95% 1.47%
�P� Close Share Class USD 20.32% 0.95% 0.95% 1.44%
�R� Accumulation Close Share Class USD 20.43% 0.83% 0.83% 1.36%
�R� Accumulation Close Share Class (LongEmerging Markets CCY vs. USD) EUR 17.58% 0.83% 0.83% 1.58%
�R� Close Share Class GBP 16.28% 0.83% 0.83% 1.86%
�R� Close Share Class USD 20.51% 0.83% 0.83% 1.69%
Europe CORE® Equity Portfolio CurrencyTotalreturn1
Expense beforewaivers/
reimbursements toaverage netassets2,3
Expense afterwaivers/
reimbursements toaverage netassets2,3,4
Net investmentincome/(loss) toaverage netassets2,3
Base Accumulation Share Class EUR (5.05%) 1.40% 1.40% 0.83%
Base Currency Share Class EUR (5.03%) 1.40% 1.40% 0.83%
Other Currency Accumulation Share Class USD 3.59% 1.41% 1.41% 0.04%
Goldman Sachs FundsNotes to the Financial Statements
For the Year Ended 30 November 2020
105

23 Supplemental Information (Continued)
Europe CORE® Equity Portfolio(Continued) Currency
Totalreturn1
Expense beforewaivers/
reimbursements toaverage netassets2,3
Expense afterwaivers/
reimbursements toaverage netassets2,3,4
Net investmentincome/(loss) toaverage netassets2,3
Other Currency Accumulation Share Class (USDHedged Class) USD (2.16%) 1.46% 1.46% 0.40%
Other Currency Share Class GBP (0.08%) 1.40% 1.40% 0.92%
Other Currency Share Class USD 3.53% 1.34% 1.34% 0.77%
�A� Accumulation Share Class EUR (5.58%) 1.91% 1.91% 0.35%
�A� Accumulation Share Class USD 3.06% 1.90% 1.90% 0.32%
�A� Accumulation Share Class (PLN Hedged Class) PLN (4.36%) 1.90% 1.90% 0.34%
�A� Share Class EUR (5.49%) 1.90% 1.90% 0.27%
�A� Share Class USD 2.96% 1.90% 1.90% 0.34%
�E� Accumulation Share Class EUR (5.54%) 1.90% 1.90% 0.33%
�I� Accumulation Share Class CHF (5.64%) 0.59% 0.59% 0.78%
�I� Accumulation Share Class EUR (4.30%) 0.58% 0.58% 1.58%
�I� Accumulation Share Class USD 4.38% 0.58% 0.58% 1.72%
�I� Accumulation Share Class (CHF Hedged Class) CHF (3.17%) 0.57% 0.57% 1.36%
�I� Accumulation Share Class (EUR Hedged Class) EUR (3.31%) 0.58% 0.58% 1.67%
�I� Accumulation Share Class (USD Hedged Class) USD (1.40%) 0.58% 0.58% 1.69%
�I� Share Class EUR (4.27%) 0.58% 0.58% 1.72%
�IO� Accumulation Share Class EUR (3.79%) 0.08% 0.08% 2.17%
�IO� Accumulation Share Class (Long EuropeanCCY vs. EUR) SGD (2.99%) 0.08% 0.08% 2.14%
�P� Accumulation Share Class EUR (4.83%) 1.13% 1.13% 1.12%
�P� Share Class EUR (4.82%) 1.13% 1.13% 1.00%
�P� Share Class GBP 0.18% 1.13% 1.13% 1.17%
�P� Share Class USD 3.81% 1.15% 1.15% 0.61%
�R� Accumulation Share Class EUR (4.36%) 0.65% 0.65% 1.64%
�R� Share Class EUR (4.37%) 0.64% 0.64% 1.55%
�R� Share Class GBP 0.64% 0.65% 0.65% 1.60%
�R� Share Class USD 4.24% 0.64% 0.64% 1.65%
Global Small Cap CORE® Equity Portfolio CurrencyTotalreturn1
Expense beforewaivers/
reimbursements toaverage netassets2,3
Expense afterwaivers/
reimbursements toaverage netassets2,3,4
Net investmentincome/(loss) toaverage netassets2,3
Base Currency Close Share Class USD 2.33% 1.48% 1.48% (0.07%)
Base Currency Snap Share Class USD 2.90% 1.48% 1.48% (0.07%)
Other Currency Accumulation Snap Share Class EUR (5.58%) 1.48% 1.48% (0.06%)
Other Currency Accumulation Snap Share Class SEK (8.65%) 1.45% 1.45% (0.21%)
�A� Close Share Class USD 1.85% 1.98% 1.98% (0.56%)
�A� Snap Share Class USD 2.40% 1.98% 1.98% (0.56%)
�E� Accumulation Close Share Class EUR (6.60%) 1.98% 1.98% (0.58%)
�E� Accumulation Snap Share Class EUR (6.05%) 1.98% 1.98% (0.57%)
�I� Accumulation Close Share Class GBP (0.51%) 0.73% 0.73% 0.70%
�I� Accumulation Snap Share Class EUR (4.90%) 0.76% 0.76% 0.65%
�I� Accumulation Snap Share Class USD 3.60% 0.76% 0.76% 0.66%
�I� Close Share Class GBP (0.48%) 0.76% 0.76% 0.65%
�IO� Accumulation Close Share Class GBP 0.09% 0.16% 0.16% 1.25%
�IO� Accumulation Close Share Class JPY (1.31%) 0.16% 0.16% 1.25%
�IO� Accumulation Close Share Class USD 3.67% 0.16% 0.16% 1.24%
Goldman Sachs FundsNotes to the Financial Statements
For the Year Ended 30 November 2020
106

23 Supplemental Information (Continued)
Global Small Cap CORE® Equity Portfolio(Continued) Currency
Totalreturn1
Expense beforewaivers/
reimbursements toaverage netassets2,3
Expense afterwaivers/
reimbursements toaverage netassets2,3,4
Net investmentincome/(loss) toaverage netassets2,3
�IO� Accumulation Snap Share Class USD 4.27% 0.16% 0.16% 1.28%
�IO� Snap Share Class USD 4.26% 0.16% 0.16% 1.25%
�P� Accumulation Snap Share Class USD 3.19% 1.20% 1.20% 0.19%
�R� Accumulation Snap Share Class USD 3.58% 0.83% 0.83% 0.60%
�R� Snap Share Class GBP (0.02%) 0.82% 0.82% 0.59%
�R� Snap Share Class USD 3.53% 0.81% 0.81% 0.52%
Emerging Markets Debt Blend Portfolio CurrencyTotalreturn1
Expense beforewaivers/
reimbursements toaverage netassets2,3
Expense afterwaivers/
reimbursements toaverage netassets2,3,4
Net investmentincome/(loss) toaverage netassets2,3
Base Accumulation Share Class USD 6.20% 1.57% 1.57% 3.69%
Base Currency Share Class USD 6.17% 1.58% 1.58% 3.66%
Other Currency Accumulation Share Class (EURPartially Hedged Class) EUR 0.69% 1.58% 1.58% 3.59%
Other Currency Share Class (EUR Partially HedgedClass) EUR 0.70% 1.58% 1.58% 3.53%
�E� Accumulation Share Class (EUR PartiallyHedged Class) EUR 0.19% 2.08% 2.08% 3.05%
�I� Accumulation Share Class EUR (1.85%) 0.81% 0.81% 4.33%
�I� Accumulation Share Class USD 6.99% 0.82% 0.82% 4.13%
�I� Accumulation Share Class (EUR Partially HedgedClass) EUR 1.47% 0.81% 0.81% 4.32%
�I� Share Class USD 7.01% 0.78% 0.78% 4.34%
�I� Share Class (GBP Partially Hedged Class) GBP 4.22% 0.81% 0.81% 4.34%
�IO� Share Class (GBP Partially Hedged Class) GBP 4.95% 0.11% 0.11% 5.03%
�R� Accumulation Share Class USD 6.94% 0.85% 0.85% 4.27%
�R� Share Class USD 6.93% 0.88% 0.88% 4.27%
�R� Share Class (GBP Partially Hedged Class) GBP 4.15% 0.88% 0.88% 4.29%
Global High Yield Portfolio CurrencyTotalreturn1
Expense beforewaivers/
reimbursements toaverage netassets2,3
Expense afterwaivers/
reimbursements toaverage netassets2,3,4
Net investmentincome/(loss) toaverage netassets2,3
Base Accumulation Share Class USD 5.74% 1.24% 1.24% 4.67%
Base Accumulation Share Class (Duration HedgedClass) USD 1.90% 1.24% 1.24% 4.72%
Base Accumulation Share Class (SEK HedgedClass) SEK 3.85% 1.23% 1.23% 4.71%
Base Currency (Dis) (Gross Monthly) Share Class USD 5.67% 1.23% 1.23% 4.69%
Base Currency (Dis) (Monthly) Share Class USD 5.80% 1.24% 1.24% 4.68%
Base Currency (Dis) (Monthly) Share Class(Duration Hedged Class) USD 1.87% 1.24% 1.24% 4.73%
Base Currency Share Class USD 5.71% 1.24% 1.24% 4.74%
Base Currency Share Class (Duration HedgedClass) USD 1.83% 1.24% 1.24% 4.70%
Other Currency (Dis) (Gross Monthly) Share Class HKD 4.73% 1.22% 1.22% 4.70%
Other Currency (Dis) (Monthly) Share Class (AUDHedged Class) AUD 4.36% 1.24% 1.24% 4.66%
Goldman Sachs FundsNotes to the Financial Statements
For the Year Ended 30 November 2020
107

23 Supplemental Information (Continued)
Global High Yield Portfolio(Continued) Currency
Totalreturn1
Expense beforewaivers/
reimbursements toaverage netassets2,3
Expense afterwaivers/
reimbursements toaverage netassets2,3,4
Net investmentincome/(loss) toaverage netassets2,3
Other Currency (Dis) (Monthly) Share Class (HKDHedged Class) (Duration Hedged Class) HKD 3.12% 1.21% 1.21% 4.98%
Other Currency (Dis) (Quarterly) Share Class (CHFHedged Class) (Duration Hedged Class) CHF (0.27%) 1.23% 1.23% 4.67%
Other Currency (Dis) (Quarterly) Share Class (SGDHedged Class) (Duration Hedged Class) SGD 1.32% 1.24% 1.24% 4.68%
Other Currency Accumulation Share Class (CHFHedged Class) (Duration Hedged Class) CHF (0.38%) 1.24% 1.24% 4.74%
Other Currency Accumulation Share Class (EURHedged Class) EUR 3.78% 1.24% 1.24% 4.70%
Other Currency Accumulation Share Class (EURHedged Class) (Duration Hedged Class) EUR 0.08% 1.23% 1.23% 4.68%
Other Currency Share Class (CHF Hedged Class) CHF 3.40% 1.24% 1.24% 4.66%
Other Currency Share Class (GBP Hedged Class) GBP 4.22% 1.24% 1.24% 4.69%
�A� (Dis) (Monthly) Share Class USD 5.33% 1.48% 1.48% 4.56%
�A� Share Class USD 5.49% 1.49% 1.49% 4.48%
�B� Share Class USD 4.40% 2.47% 2.47% 3.44%
�E� (Dis) (Quarterly) Share Class (EUR HedgedClass) EUR 3.27% 1.74% 1.74% 4.17%
�E� (Dis) (Quarterly) Share Class (EUR HedgedClass) (Duration Hedged Class) EUR (0.54%) 1.74% 1.74% 4.18%
�E� Accumulation Share Class EUR (3.48%) 1.74% 1.74% 4.19%
�E� Accumulation Share Class (EUR Hedged Class) EUR 3.31% 1.74% 1.74% 4.18%
�E� Accumulation Share Class (EUR Hedged Class)(Duration Hedged Class) EUR (0.52%) 1.74% 1.74% 4.19%
�E� Share Class (EUR Hedged Class) EUR 3.78% 1.24% 1.24% 4.66%
�G� Share Class USD 6.92% 0.12% 0.12% 5.79%
�I� (Dis) (Monthly) Share Class USD 6.32% 0.67% 0.67% 5.24%
�I� (Dis) (Monthly) Share Class (EUR Hedged Class) EUR 4.37% 0.65% 0.65% 5.25%
�I� Accumulation Share Class USD 6.30% 0.67% 0.67% 5.14%
�I� Accumulation Share Class (Duration HedgedClass) USD 2.42% 0.67% 0.67% 5.67%
�I� Accumulation Share Class (EUR Hedged Class) EUR 4.39% 0.67% 0.67% 5.32%
�I� Accumulation Share Class (GBP Hedged Class) GBP 4.77% 0.67% 0.67% 5.24%
�I� Share Class EUR (2.44%) 0.67% 0.67% 5.24%
�I� Share Class USD 6.41% 0.67% 0.67% 5.28%
�I� Share Class (EUR Hedged Class) EUR 4.35% 0.67% 0.67% 5.20%
�I� Share Class (GBP Hedged Class) GBP 4.83% 0.67% 0.67% 5.23%
�I� Share Class (GBP Hedged Class) (DurationHedged Class) GBP 1.10% 0.54% 0.54% 5.02%
�IO� (Dis) (Quarterly) Share Class (AUD HedgedClass) AUD 5.54% 0.07% 0.07% 5.83%
�IO� Accumulation Share Class USD 6.98% 0.07% 0.07% 5.84%
�IO� Accumulation Share Class (EUR Hedged Class) EUR 5.03% 0.07% 0.07% 5.84%
�IO� Accumulation Share Class (GBP Hedged Class) GBP 5.43% 0.07% 0.07% 5.78%
�IO� Accumulation Share Class (JPY Hedged Class) JPY 5.02% 0.07% 0.07% 5.82%
�IO� Share Class USD 6.90% 0.07% 0.07% 5.89%
�IS� Accumulation Share Class USD 6.51% 0.55% 0.55% 5.36%
�IS� Accumulation Share Class (CHF Hedged Class) CHF 4.09% 0.55% 0.55% 5.36%
�IS� Accumulation Share Class (EUR Hedged Class) EUR 4.50% 0.55% 0.55% 5.32%
Goldman Sachs FundsNotes to the Financial Statements
For the Year Ended 30 November 2020
108

23 Supplemental Information (Continued)
Global High Yield Portfolio(Continued) Currency
Totalreturn1
Expense beforewaivers/
reimbursements toaverage netassets2,3
Expense afterwaivers/
reimbursements toaverage netassets2,3,4
Net investmentincome/(loss) toaverage netassets2,3
�IS� Accumulation Share Class (GBP Hedged Class) GBP 4.88% 0.49% 0.49% 5.29%
�IS� Share Class USD 6.46% 0.55% 0.55% 5.33%
�IS� Share Class (GBP Hedged Class) GBP 4.85% 0.55% 0.55% 5.23%
�P� Accumulation Share Class USD 6.05% 1.01% 1.01% 5.11%
�P� Share Class USD 5.95% 1.02% 1.02% 4.89%
�R� (Dis) (Monthly) Share Class (AUD HedgedClass) AUD 4.80% 0.73% 0.73% 5.12%
�R� Accumulation Share Class USD 6.24% 0.74% 0.74% 5.18%
�R� Accumulation Share Class (CHF Hedged Class) CHF 3.95% 0.74% 0.74% 4.89%
�R� Accumulation Share Class (CHF Hedged Class)(Duration Hedged Class) CHF 0.19% 0.74% 0.74% 5.18%
�R� Accumulation Share Class (EUR Hedged Class) EUR 4.35% 0.74% 0.74% 5.19%
�R� Accumulation Share Class (EUR Hedged Class)(Duration Hedged Class) EUR 0.53% 0.73% 0.73% 5.27%
�R� Accumulation Share Class (SEK Hedged Class) SEK 4.38% 0.73% 0.73% 5.15%
�R� Accumulation Share Class (Duration HedgedClass) USD 2.31% 0.73% 0.73% 5.24%
�R� Share Class USD 6.25% 0.74% 0.74% 5.24%
�R� Share Class (CHF Hedged Class) CHF 3.85% 0.74% 0.74% 5.17%
�R� Share Class (EUR Hedged Class) EUR 4.35% 0.74% 0.74% 5.08%
�R� Share Class (GBP Hedged Class) GBP 4.70% 0.74% 0.74% 5.40%
�R� Share Class (Duration Hedged Class) USD 2.32% 0.74% 0.74% 5.20%
Short Duration Opportunistic Corporate Bond Portfolio CurrencyTotalreturn1
Expense beforewaivers/
reimbursements toaverage netassets2,3
Expense afterwaivers/
reimbursements toaverage netassets2,3,4
Net investmentincome/(loss) toaverage netassets2,3
Base Accumulation Share Class USD 5.33% 1.77% 1.75% 3.44%
Base Currency (Dis) (Quarterly) Share Class USD 5.32% 1.78% 1.75% 3.44%
Base Currency Share Class USD 5.33% 1.77% 1.75% 3.41%
Other Currency (Dis) (Quarterly) Share Class (EURHedged Class) EUR 3.53% 1.77% 1.72% 3.59%
Other Currency Accumulation Share Class (EURHedged Class) EUR 3.57% 1.70% 1.67% 3.39%
�A� (Dis) (Quarterly) Share Class USD 4.81% 2.28% 2.25% 2.94%
�E� (Dis) (Quarterly) Share Class (EUR HedgedClass) EUR 2.98% 2.28% 2.25% 2.93%
�E� Accumulation Share Class EUR (3.85%) 2.26% 2.24% 2.95%
�E� Accumulation Share Class (EUR Hedged Class) EUR 3.01% 2.28% 2.25% 2.97%
�I� (Dis) (Quarterly) Share Class (GBP HedgedClass) GBP 4.75% 0.90% 0.90% 4.28%
�I� Accumulation Share Class EUR (2.55%) 0.90% 0.90% 4.29%
�I� Accumulation Share Class USD 6.22% 0.90% 0.90% 4.24%
�I� Accumulation Share Class (EUR Hedged Class) EUR 4.38% 0.91% 0.90% 4.27%
�I� Share Class USD 6.23% 0.91% 0.90% 4.27%
�IXO� (Dis) (Cap Monthly) Share Class USD 6.97% 0.21% 0.20% 4.98%
�P� (Dis) (Quarterly) Share Class USD 5.86% 1.26% 1.25% 3.96%
�P� Accumulation Share Class USD 5.86% 1.26% 1.25% 3.94%
�P� Accumulation Share Class (EUR Hedged Class) EUR 4.03% 1.26% 1.25% 3.93%
Goldman Sachs FundsNotes to the Financial Statements
For the Year Ended 30 November 2020
109

23 Supplemental Information (Continued)
Short Duration Opportunistic Corporate Bond Portfolio(Continued) Currency
Totalreturn1
Expense beforewaivers/
reimbursements toaverage netassets2,3
Expense afterwaivers/
reimbursements toaverage netassets2,3,4
Net investmentincome/(loss) toaverage netassets2,3
�P� Share Class USD 5.86% 1.25% 1.25% 3.96%
�P� Share Class (EUR Hedged Class) EUR 4.10% 1.18% 1.18% 3.98%
�P� Share Class (GBP Hedged Class) GBP 4.37% 1.26% 1.25% 3.93%
�R� (Dis) (Quarterly) Share Class USD 6.18% 0.98% 0.95% 4.26%
�R� Accumulation Share Class USD 6.18% 0.98% 0.95% 4.26%
�R� Accumulation Share Class (EUR Hedged Class) EUR 4.54% 0.52% 0.51% 4.47%
�R� Share Class USD 6.18% 0.98% 0.95% 4.24%
�R� Share Class (EUR Hedged Class) EUR 4.34% 0.98% 0.95% 4.23%
�R� Share Class (GBP Hedged Class) GBP 4.73% 0.92% 0.90% 4.25%
Global Fixed Income Plus Portfolio (Hedged) CurrencyTotalreturn1
Expense beforewaivers/
reimbursements toaverage netassets2,3
Expense afterwaivers/
reimbursements toaverage netassets2,3,4
Net investmentincome/(loss) toaverage netassets2,3
Base Accumulation Share Class EUR 6.96% 1.16% 1.16% 1.34%
Base Accumulation Share Class (USD Hedged Class) USD 8.77% 1.17% 1.17% 1.34%
Base Currency Share Class EUR 6.89% 1.16% 1.16% 1.33%
Base Currency Share Class (USD Hedged Class) USD 8.74% 1.16% 1.16% 1.32%
�A� Share Class EUR 6.72% 1.41% 1.41% 1.08%
�A� Share Class (USD Hedged Class) USD 8.48% 1.41% 1.41% 1.08%
�E� Accumulation Share Class EUR 6.67% 1.41% 1.41% 1.07%
�I� Accumulation Share Class EUR 7.57% 0.59% 0.59% 1.89%
�I� Accumulation Share Class (USD Hedged Class) USD 9.36% 0.59% 0.59% 1.90%
�I� Share Class (GBP Hedged Class) GBP 8.36% 0.59% 0.59% 1.90%
�IO� Accumulation Share Class EUR 8.12% 0.09% 0.09% 2.39%
�IO� Accumulation Share Class (GBP Hedged Class) GBP 8.90% 0.09% 0.09% 2.40%
�IO� Accumulation Share Class (USD Hedged Class) USD 9.92% 0.09% 0.09% 2.39%
�IO� Share Class (USD Hedged Class) USD 9.95% 0.09% 0.09% 2.40%
�P� Accumulation Share Class EUR 7.20% 0.94% 0.94% 1.52%
�P� Accumulation Share Class (USD Hedged Class) USD 9.05% 0.94% 0.94% 1.54%
�P� Share Class (GBP Hedged Class) GBP 8.01% 0.93% 0.93% 1.56%
�R� Accumulation Share Class EUR 7.49% 0.66% 0.66% 1.83%
�R� Accumulation Share Class (USD Hedged Class) USD 9.29% 0.66% 0.66% 1.84%
�R� Share Class EUR 7.56% 0.67% 0.66% 1.84%
�R� Share Class (GBP Hedged Class) GBP 8.30% 0.66% 0.66% 1.85%
�R� Share Class (USD Hedged Class) USD 9.31% 0.66% 0.66% 1.79%
Multi-Manager Dynamic World Equity Portfolio CurrencyTotalreturn1
Expense beforewaivers/
reimbursements toaverage netassets2,3
Expense afterwaivers/
reimbursements toaverage netassets2,3,4
Net investmentincome/(loss) toaverage netassets2,3
Base Accumulation Share Class USD 12.17% 1.38% 1.38% (0.37%)
Base Currency Share Class USD 12.18% 1.38% 1.38% (0.40%)
Other Currency Accumulation Share Class EUR 2.94% 1.38% 1.38% (0.40%)
�I� Share Class USD 12.68% 0.96% 0.96% 0.00%
�IO� Accumulation Share Class USD 13.02% 0.66% 0.66% 0.32%
�R� Accumulation Share Class EUR 3.57% 0.74% 0.74% 0.26%
�R� Accumulation Share Class USD 12.91% 0.73% 0.73% 0.26%
Goldman Sachs FundsNotes to the Financial Statements
For the Year Ended 30 November 2020
110

23 Supplemental Information (Continued)
Multi-Manager Dynamic World Equity Portfolio(Continued) Currency
Totalreturn1
Expense beforewaivers/
reimbursements toaverage netassets2,3
Expense afterwaivers/
reimbursements toaverage netassets2,3,4
Net investmentincome/(loss) toaverage netassets2,3
�R� Accumulation Share Class (EUR Hedged Class) EUR 9.66% 0.73% 0.73% 0.24%
�R� Accumulation Share Class (GBP Hedged Class) GBP 9.17% 0.73% 0.73% 0.22%
�R� Share Class USD 12.91% 0.73% 0.73% 0.26%
1 Total returns are calculated by dividing the change in the net asset value per share for the year by the net asset value per share at thebeginning of the year. An individual shareholder’s return may vary from these returns due to the timing of capital transactions.
2 The expense and net investment income ratios are calculated for each group of shareholders taken as a whole. Under rules requiredfor SEC 206(4)-2 this ratio does not include realised gains and losses in net investment income. The computation of such ratios basedon the amount of income and expenses assessed to an individual shareholder’s capital may vary from these ratios based on the timingof capital transactions.
3 Refer to Note 6 Significant Agreements and Related Parties for further details on expense waivers/reimbursement amounts.
4 Includes additional fee to Investment Adviser for fixed operating share classes.
Financial Assets and Financial Liabilities at Value
The three levels of the fair value hierarchy under the Accounting Standards Codification (“ASC”) 820 aredescribed below:
Level 1 – Unadjusted quoted prices in active markets that are accessible at the measurement date for identical,unrestricted assets or liabilities;
Level 2 – Quoted prices in markets that are not active or financial instruments for which significant inputs areobservable (including but not limited to quoted prices for similar securities, interest rates, foreign exchange rates,volatility and credit risk spreads), either directly or indirectly;
Level 3 – Prices or valuations that require significant unobservable inputs (including the Valuer’s assumptions indetermining fair value measurement).
The level in the fair value hierarchy within which the fair value measurement is categorised in its entirety shall bedetermined on the basis of the lowest level input that is significant to the fair value measurement in its entirety.For this purpose, the significance of an input is assessed against the fair value measurement in its entirety. If afair value measurement uses observable inputs that require significant adjustment based on unobservableinputs, that measurement is a Level 3 measurement. Assessing the significance of a particular input to the fairvalue measurement in its entirety requires judgement, considering factors specific to the asset or liability.
Global Equity Partners PortfolioLevel 1USD
Level 2USD
Level 3USD
TotalUSD
Financial Assets at fair value
Common Stocks 907,433,590 85,702,013 — 993,135,603
Mutual Funds 28,262,795 — — 28,262,795
Unrealised Gain on Forward CurrencyContracts
— 1,060,415 — 1,060,415
Total 935,696,385 86,762,428 — 1,022,458,813
India Equity PortfolioLevel 1USD
Level 2USD
Level 3USD
TotalUSD
Financial Assets at fair value
Common Stocks 202,650,519 1,271,939,058 — 1,474,589,577
Total 202,650,519 1,271,939,058 — 1,474,589,577
Goldman Sachs FundsNotes to the Financial Statements
For the Year Ended 30 November 2020
111
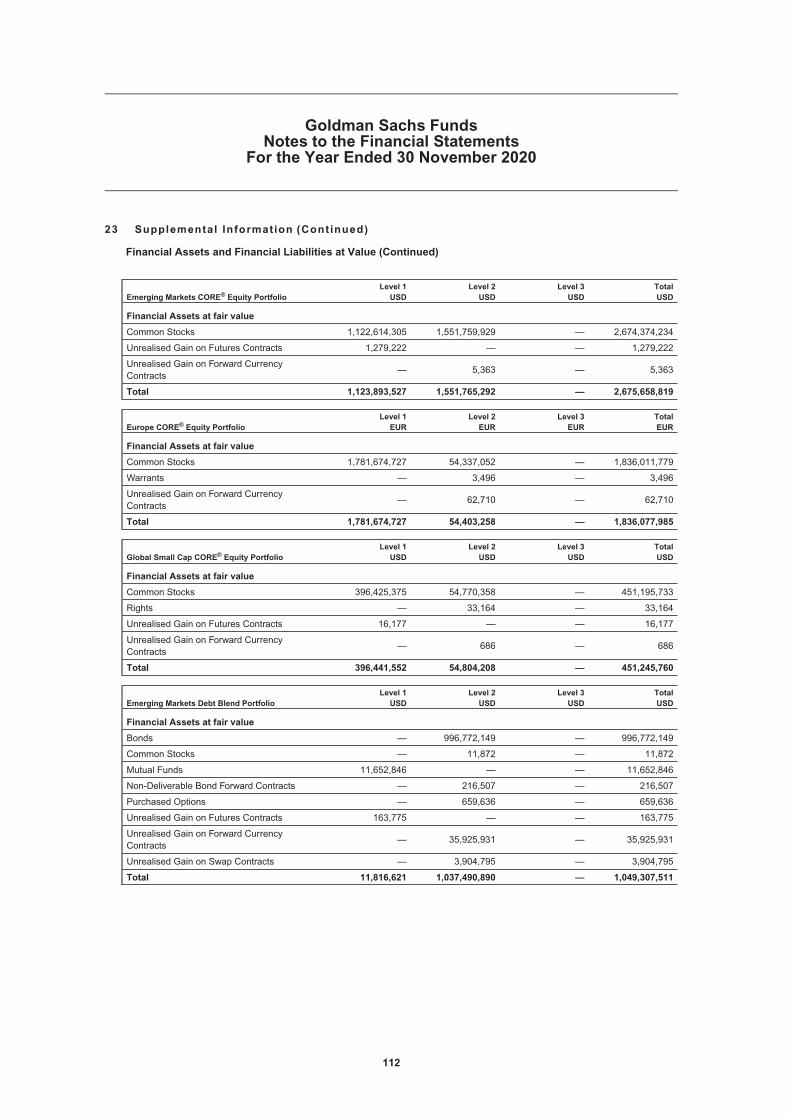
23 Supplemental Information (Continued)
Financial Assets and Financial Liabilities at Value (Continued)
Emerging Markets CORE® Equity PortfolioLevel 1USD
Level 2USD
Level 3USD
TotalUSD
Financial Assets at fair value
Common Stocks 1,122,614,305 1,551,759,929 — 2,674,374,234
Unrealised Gain on Futures Contracts 1,279,222 — — 1,279,222
Unrealised Gain on Forward CurrencyContracts
— 5,363 — 5,363
Total 1,123,893,527 1,551,765,292 — 2,675,658,819
Europe CORE® Equity PortfolioLevel 1EUR
Level 2EUR
Level 3EUR
TotalEUR
Financial Assets at fair value
Common Stocks 1,781,674,727 54,337,052 — 1,836,011,779
Warrants — 3,496 — 3,496
Unrealised Gain on Forward CurrencyContracts
— 62,710 — 62,710
Total 1,781,674,727 54,403,258 — 1,836,077,985
Global Small Cap CORE® Equity PortfolioLevel 1USD
Level 2USD
Level 3USD
TotalUSD
Financial Assets at fair value
Common Stocks 396,425,375 54,770,358 — 451,195,733
Rights — 33,164 — 33,164
Unrealised Gain on Futures Contracts 16,177 — — 16,177
Unrealised Gain on Forward CurrencyContracts
— 686 — 686
Total 396,441,552 54,804,208 — 451,245,760
Emerging Markets Debt Blend PortfolioLevel 1USD
Level 2USD
Level 3USD
TotalUSD
Financial Assets at fair value
Bonds — 996,772,149 — 996,772,149
Common Stocks — 11,872 — 11,872
Mutual Funds 11,652,846 — — 11,652,846
Non-Deliverable Bond Forward Contracts — 216,507 — 216,507
Purchased Options — 659,636 — 659,636
Unrealised Gain on Futures Contracts 163,775 — — 163,775
Unrealised Gain on Forward CurrencyContracts
— 35,925,931 — 35,925,931
Unrealised Gain on Swap Contracts — 3,904,795 — 3,904,795
Total 11,816,621 1,037,490,890 — 1,049,307,511
Goldman Sachs FundsNotes to the Financial Statements
For the Year Ended 30 November 2020
112
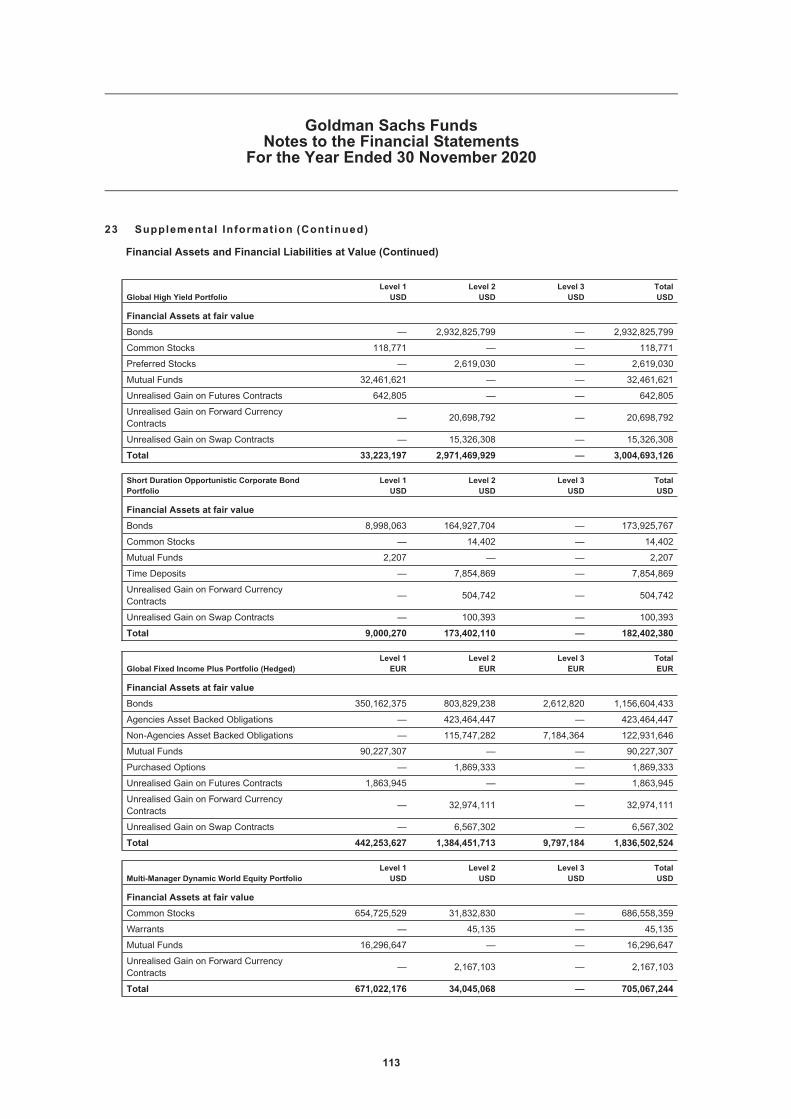
23 Supplemental Information (Continued)
Financial Assets and Financial Liabilities at Value (Continued)
Global High Yield PortfolioLevel 1USD
Level 2USD
Level 3USD
TotalUSD
Financial Assets at fair value
Bonds — 2,932,825,799 — 2,932,825,799
Common Stocks 118,771 — — 118,771
Preferred Stocks — 2,619,030 — 2,619,030
Mutual Funds 32,461,621 — — 32,461,621
Unrealised Gain on Futures Contracts 642,805 — — 642,805
Unrealised Gain on Forward CurrencyContracts
— 20,698,792 — 20,698,792
Unrealised Gain on Swap Contracts — 15,326,308 — 15,326,308
Total 33,223,197 2,971,469,929 — 3,004,693,126
Short Duration Opportunistic Corporate BondPortfolio
Level 1USD
Level 2USD
Level 3USD
TotalUSD
Financial Assets at fair value
Bonds 8,998,063 164,927,704 — 173,925,767
Common Stocks — 14,402 — 14,402
Mutual Funds 2,207 — — 2,207
Time Deposits — 7,854,869 — 7,854,869
Unrealised Gain on Forward CurrencyContracts
— 504,742 — 504,742
Unrealised Gain on Swap Contracts — 100,393 — 100,393
Total 9,000,270 173,402,110 — 182,402,380
Global Fixed Income Plus Portfolio (Hedged)Level 1EUR
Level 2EUR
Level 3EUR
TotalEUR
Financial Assets at fair value
Bonds 350,162,375 803,829,238 2,612,820 1,156,604,433
Agencies Asset Backed Obligations — 423,464,447 — 423,464,447
Non-Agencies Asset Backed Obligations — 115,747,282 7,184,364 122,931,646
Mutual Funds 90,227,307 — — 90,227,307
Purchased Options — 1,869,333 — 1,869,333
Unrealised Gain on Futures Contracts 1,863,945 — — 1,863,945
Unrealised Gain on Forward CurrencyContracts
— 32,974,111 — 32,974,111
Unrealised Gain on Swap Contracts — 6,567,302 — 6,567,302
Total 442,253,627 1,384,451,713 9,797,184 1,836,502,524
Multi-Manager Dynamic World Equity PortfolioLevel 1USD
Level 2USD
Level 3USD
TotalUSD
Financial Assets at fair value
Common Stocks 654,725,529 31,832,830 — 686,558,359
Warrants — 45,135 — 45,135
Mutual Funds 16,296,647 — — 16,296,647
Unrealised Gain on Forward CurrencyContracts
— 2,167,103 — 2,167,103
Total 671,022,176 34,045,068 — 705,067,244
Goldman Sachs FundsNotes to the Financial Statements
For the Year Ended 30 November 2020
113

23 Supplemental Information (Continued)
Financial Assets and Financial Liabilities at Value (Continued)
The following tables show financial liabilities recognised at fair value, analysed between the three different levelsdescribed above:
Global Equity Partners PortfolioLevel 1USD
Level 2USD
Level 3USD
TotalUSD
Financial Liabilities at fair value
Unrealised Loss on Forward CurrencyContracts
— 962,263 — 962,263
Total — 962,263 — 962,263
India Equity PortfolioLevel 1USD
Level 2USD
Level 3USD
TotalUSD
Financial Liabilities at fair value
Unrealised Loss on Futures Contracts 19,263 — — 19,263
Total 19,263 — — 19,263
Europe CORE® Equity PortfolioLevel 1EUR
Level 2EUR
Level 3EUR
TotalEUR
Financial Liabilities at fair value
Unrealised Loss on Forward CurrencyContracts
— 1,470,331 — 1,470,331
Total — 1,470,331 — 1,470,331
Emerging Markets Debt Blend PortfolioLevel 1USD
Level 2USD
Level 3USD
TotalUSD
Financial Liabilities at fair value
Written Options — 251,591 — 251,591
Unrealised Loss on Futures Contracts 19,684 — — 19,684
Unrealised Loss on Forward CurrencyContracts
— 17,771,519 — 17,771,519
Unrealised Loss on Swap Contracts — 2,140,596 — 2,140,596
Total 19,684 20,163,706 — 20,183,390
Global High Yield PortfolioLevel 1USD
Level 2USD
Level 3USD
TotalUSD
Financial Liabilities at fair value
Unrealised Loss on Futures Contracts 227,063 — — 227,063
Unrealised Loss on Forward CurrencyContracts
— 1,171,949 — 1,171,949
Total 227,063 1,171,949 — 1,399,012
Short Duration Opportunistic Corporate BondPortfolio
Level 1USD
Level 2USD
Level 3USD
TotalUSD
Financial Liabilities at fair value
Unrealised Loss on Forward CurrencyContracts
— 9,480 — 9,480
Total — 9,480 — 9,480
Goldman Sachs FundsNotes to the Financial Statements
For the Year Ended 30 November 2020
114

23 Supplemental Information (Continued)
Financial Assets and Financial Liabilities at Value (Continued)
Global Fixed Income Plus Portfolio (Hedged)Level 1EUR
Level 2EUR
Level 3EUR
TotalEUR
Financial Liabilities at fair value
Covered Forward Mortgage Backed Securities — 5,318,122 — 5,318,122
Written Options — 3,432,586 — 3,432,586
Unrealised Loss on Futures Contracts 88,889 — — 88,889
Unrealised Loss on Forward CurrencyContracts
— 27,672,739 — 27,672,739
Unrealised Loss on Swap Contracts — 5,675,062 — 5,675,062
Total 88,889 42,098,509 — 42,187,398
Multi-Manager Dynamic World Equity PortfolioLevel 1USD
Level 2USD
Level 3USD
TotalUSD
Financial Liabilities at fair value
Unrealised Loss on Forward CurrencyContracts
— 1,422,811 — 1,422,811
Total — 1,422,811 — 1,422,811
Goldman Sachs FundsNotes to the Financial Statements
For the Year Ended 30 November 2020
115
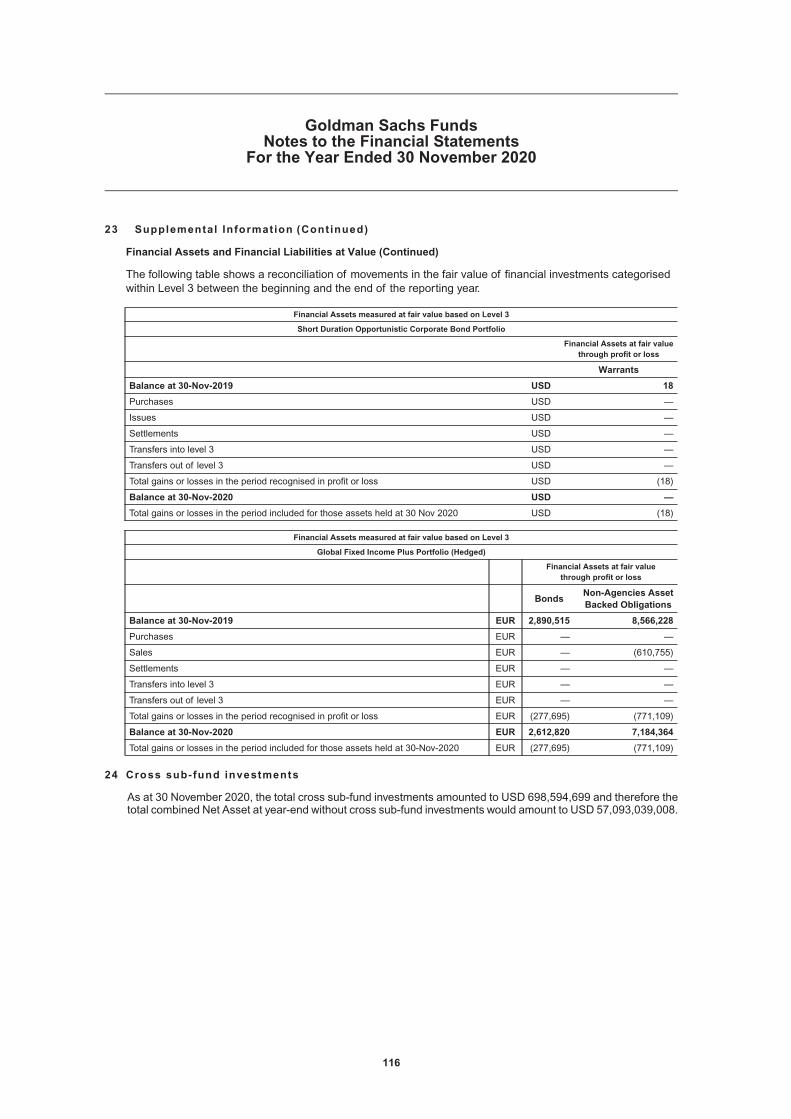
23 Supplemental Information (Continued)
Financial Assets and Financial Liabilities at Value (Continued)
The following table shows a reconciliation of movements in the fair value of financial investments categorisedwithin Level 3 between the beginning and the end of the reporting year.
Financial Assets measured at fair value based on Level 3
Short Duration Opportunistic Corporate Bond Portfolio
Financial Assets at fair valuethrough profit or loss
Warrants
Balance at 30-Nov-2019 USD 18
Purchases USD —
Issues USD —
Settlements USD —
Transfers into level 3 USD —
Transfers out of level 3 USD —
Total gains or losses in the period recognised in profit or loss USD (18)
Balance at 30-Nov-2020 USD —
Total gains or losses in the period included for those assets held at 30 Nov 2020 USD (18)
Financial Assets measured at fair value based on Level 3
Global Fixed Income Plus Portfolio (Hedged)
Financial Assets at fair valuethrough profit or loss
BondsNon-Agencies AssetBacked Obligations
Balance at 30-Nov-2019 EUR 2,890,515 8,566,228
Purchases EUR — —
Sales EUR — (610,755)
Settlements EUR — —
Transfers into level 3 EUR — —
Transfers out of level 3 EUR — —
Total gains or losses in the period recognised in profit or loss EUR (277,695) (771,109)
Balance at 30-Nov-2020 EUR 2,612,820 7,184,364
Total gains or losses in the period included for those assets held at 30-Nov-2020 EUR (277,695) (771,109)
24 Cross sub-fund investments
As at 30 November 2020, the total cross sub-fund investments amounted to USD 698,594,699 and therefore thetotal combined Net Asset at year-end without cross sub-fund investments would amount to USD 57,093,039,008.
Goldman Sachs FundsNotes to the Financial Statements
For the Year Ended 30 November 2020
116

HoldingsSecurityDescription
Market ValueUSD
% ofShareholders’
Equity
Transferable securities admitted to an official exchange listing
Common Stocks – 90.70%
China52,060 Alibaba Group Holding Ltd.—ADR(a) 13,840,151 6.83143,000 ANTA Sports Products Ltd. 1,947,202 0.96312,000 China Merchants Bank Co., Ltd. �H� 1,976,808 0.9865,500 Gree Electric Appliances, Inc.�A� 665,477 0.3336,940 Huami Corp.—ADR(a) 459,903 0.2332,613 Kweichow Moutai Co., Ltd. �A� 8,516,460 4.2054,697 LexinFintech Holdings Ltd.—ADR(a) 404,758 0.20230,000 Minth Group Ltd. 1,143,884 0.5624,945 New Oriental Education &
Technology Group, Inc.—ADR(a) 4,201,985 2.07547,500 Ping An Insurance Group Co. of
China Ltd. �H� 6,453,732 3.18119,300 Shenzhou International Group
Holdings Ltd. 2,023,006 1.0014,314 Silergy Corp. 1,116,018 0.5583,800 Sunny Optical Technology Group
Co., Ltd. 1,649,768 0.8118,046 TAL Education Group—ADR(a) 1,290,109 0.64232,500 Tencent Holdings Ltd. 16,971,868 8.37466,000 Topsports International Holdings Ltd.
144A(b) 694,538 0.3476,440 WuXi AppTec Co., Ltd. �H� 144A(b) 1,145,198 0.56606,000 Xinyi Solar Holdings Ltd. 1,107,436 0.55
65,608,301 32.36
Hong Kong258,929 AIA Group Ltd. 2,840,415 1.40135,000 Galaxy Entertainment Group Ltd. 1,029,283 0.5148,901 Hong Kong Exchanges & Clearing
Ltd. 2,433,636 1.201,958,500 Sino Biopharmaceutical Ltd. 1,972,468 0.9755,000 Techtronic Industries Co., Ltd. 706,789 0.35
8,982,591 4.43
India3,988 Abbott India Ltd. 828,512 0.4126,893 AIA Engineering Ltd. 673,450 0.3374,066 Bajaj Finance Ltd. 4,895,882 2.41119,313 Bharti Airtel Ltd. 745,913 0.3725,214 Computer Age Management
Services Ltd. 492,032 0.24137,414 Crompton Greaves Consumer
Electricals Ltd. 566,495 0.2824,578 Divi’s Laboratories Ltd. 1,194,616 0.5933,000 Eicher Motors Ltd. 1,129,458 0.56141,321 Hindustan Unilever Ltd. 4,074,575 2.01317,219 ICICI Bank Ltd. 2,022,175 1.0050,621 ICICI Lombard General Insurance
Co., Ltd. 144A(b) 991,677 0.4910,885 Info Edge India Ltd. 632,678 0.31116,904 Infosys Ltd. 1,742,242 0.8627,690 Infosys Ltd.—ADR(a) 415,765 0.2018,686 Larsen & Toubro Infotech Ltd.
144A(b) 807,214 0.4051,559 Maruti Suzuki India Ltd. 4,886,422 2.4158,441 Navin Fluorine International Ltd. 2,118,467 1.04155,120 Prestige Estates Projects Ltd. 558,425 0.2854,492 Route Mobile Ltd. 775,737 0.3857,895 SBI Life Insurance Co., Ltd. 144A(b) 661,417 0.3321,995 TeamLease Services Ltd. 741,252 0.37
30,954,404 15.27
Indonesia852,600 Bank Central Asia Tbk PT 1,873,128 0.93
16,022,000 BFI Finance Indonesia Tbk PT 433,132 0.211,653,700 Map Aktif Adiperkasa PT 300,396 0.15
HoldingsSecurityDescription
Market ValueUSD
% ofShareholders’
Equity
Common Stocks – (Continued)
Indonesia – (Continued)14,126,100 Pakuwon Jati Tbk PT 499,192 0.25766,800 Semen Indonesia Persero Tbk PT 634,844 0.31
3,740,692 1.85
Philippines227,540 Jollibee Foods Corp. 893,655 0.44
Singapore305,424 Nanofilm Technologies International
Ltd. 730,761 0.364,340 Sea Ltd.—ADR(a) 776,860 0.38
1,507,621 0.74
South Korea28,026 Fila Holdings Corp. 1,049,686 0.5226,543 Hankook Tire & Technology Co., Ltd. 785,833 0.3917,480 LG Electronics, Inc. 1,353,691 0.677,405 NAVER Corp. 1,861,261 0.927,368 NCSoft Corp. 5,398,816 2.663,572 Orion Corp. 383,287 0.198,507 Osstem Implant Co., Ltd. 405,408 0.20
307,905 Samsung Electronics Co., Ltd. 18,606,254 9.17109,351 SK Hynix, Inc. 9,661,397 4.76
39,505,633 19.48
Taiwan50,000 Largan Precision Co., Ltd. 5,666,513 2.7917,000 momo.com, Inc. 369,792 0.1854,000 Nien Made Enterprise Co., Ltd. 638,391 0.32
1,098,639 Taiwan SemiconductorManufacturing Co., Ltd. 18,711,273 9.23
213,000 Taiwan Union Technology Corp. 874,225 0.4352,109 Tong Hsing Electronic Industries Ltd. 363,813 0.18
26,624,007 13.13
Thailand1,308,400 Airports of Thailand PCL 2,764,512 1.36
United States1,107,000 Nexteer Automotive Group Ltd. 1,177,201 0.58
Vietnam461,210 Vietnam Dairy Products JSC 2,158,812 1.06
TOTAL COMMON STOCKS(cost USD 116,421,194) 183,917,429 90.70
Mutual Funds – 4.07%Ireland
8,240,039 Goldman Sachs US$ LiquidReserves Fund (X DistributionClass)(c)(d) 8,240,039 4.07
TOTAL MUTUAL FUNDS(cost USD 8,240,039) 8,240,039 4.07
TOTAL TRANSFERABLE SECURITIES ADMITTEDTO AN OFFICIAL EXCHANGE LISTING(cost USD 124,661,233) 192,157,468 94.77
MARKET VALUE OF INVESTMENTS EXCLUDINGDERIVATIVES(cost USD 124,661,233) 192,157,468 94.77
Goldman Sachs Funds—Asia Equity PortfolioSchedule of InvestmentsAs at 30 November 2020
The accompanying notes are an integral part of these financial statements.
117

Futures Contracts – (0.01%)
Number ofContracts Security Description
CommitmentMarketValueUSD
UnrealisedLossUSD
% ofShareholders’
Equity
HKD17 Hang Seng Index
Futures 30/12/2020Long 2,898,339 (4,057) (0.00)
12 HSCEI Index Futures30/12/2020
Long 818,757 (232) (0.00)
3,717,096 (4,289) (0.00)
USD24 FTSE Taiwan Index
Futures 30/12/2020Long 1,140,960 (10,080) (0.01)
UNREALISED LOSS ON FUTURES CONTRACTS (14,369) (0.01)
MARKET VALUE OF INVESTMENTS(cost USD 124,661,233)
192,143,099 94.76
OTHER ASSETS AND LIABILITIES 10,624,958 5.24
SHAREHOLDERS’ EQUITY 202,768,057 100.00
TOTAL INVESTMENTSMarket Value
USD
% ofShareholders’
Equity
Total Investments excluding derivatives (cost USD124,661,233) 192,157,468 94.77
Unrealised loss on futures contracts (14,369) (0.01)Other Assets and Liabilities 10,624,958 5.24
Shareholders’ Equity 202,768,057 100.00
The Futures Commission Merchant was Goldman Sachs & Co. LLC.
The maximum individual counterparty exposure as at 30 November 2020 is 0.00% of theNAV.
(a) Security holding is traded/held in USD. (ADR: American Depositary Receipt/GDR: Global Depositary Receipt).
(b) 144A: This security is issued to qualified institutional investors, pursuant to privateplacements, and is transferable as stated in rule 144A of the US Securities Act of1933.
(c) A related party to Goldman Sachs Funds.(d) The yield for this fund as at 30 November 2020 was 0.171%.
Allocation of Portfolio as at 30 November 2020
% ofShareholders’
Equity
Common StocksSemiconductors 23.34Internet 19.46Food, Beverages & Tobacco 5.45Insurance 5.40Diversified Financial Services 4.26Miscellaneous Manufacturing 3.96Automobile Manufacturers 2.97Banks 2.91Commercial Services 2.71Household Products/Wares 2.01Others 18.23
TOTAL COMMON STOCKS 90.70
Mutual Funds 4.07
Unrealised Loss on Futures Contracts (0.01)
Other Assets and Liabilities 5.24
TOTAL 100.00
Goldman Sachs Funds—Asia Equity PortfolioSchedule of InvestmentsAs at 30 November 2020
The accompanying notes are an integral part of these financial statements.
118

HoldingsSecurityDescription
Market ValueUSD
% ofShareholders’
Equity
Transferable securities admitted to an official exchange listing
Common Stocks – 97.36%China
57,895 Aier Eye Hospital Group Co., Ltd. �A� 576,108 0.64116,100 Alibaba Group Holding Ltd. 3,851,904 4.2615,875 Alibaba Group Holding Ltd.—ADR(a) 4,192,588 4.63145,500 Anhui Conch Cement Co., Ltd. �H� 942,191 1.0431,000 ANTA Sports Products Ltd. 441,872 0.49197,100 Bank of Ningbo Co., Ltd. �A� 1,124,277 1.24
1,678,000 China Construction Bank Corp. �H� 1,342,010 1.48461,000 China Life Insurance Co., Ltd. �H� 1,071,588 1.18436,500 China Merchants Bank Co., Ltd. �H� 2,818,127 3.11274,000 China Oilfield Services Ltd. �H� 209,947 0.23467,500 China Vanke Co., Ltd. �H� 1,721,710 1.9051,423 Contemporary Amperex Technology
Co., Ltd. �A� 1,929,636 2.1372,300 GDS HoldingsLtd. 820,250 0.9194,800 Gree Electric Appliances, Inc.�A� 971,092 1.07151,244 Hangzhou Robam Appliances Co.,
Ltd. �A� 936,024 1.0342,300 Hangzhou Tigermed Consulting Co.,
Ltd. �H� 144A(b) 738,807 0.82131,003 Hongfa Technology Co. Ltd. 971,909 1.07440,900 Jiangsu Changshu Rural
Commercial Bank Co., Ltd. �A� 530,946 0.5949,357 Jiangsu Hengrui Medicine Co., Ltd.
�A� 659,152 0.7383,400 Juewei Food Co., Ltd. �A� 938,221 1.04447,000 Kingdee International Software
Group Co., Ltd. 1,545,306 1.716,060 Kweichow Moutai Co., Ltd. �A� 1,604,558 1.77
108,485 Luxshare Precision Industry Co.,Ltd. �A� 871,161 0.96
131,500 Meituan Dianping �B� 4,905,647 5.42400,000 Minth Group Ltd. 1,914,283 2.1273,400 NetEase, Inc. 1,342,593 1.4810,222 Pinduoduo, Inc.—ADR(a) 1,432,102 1.58256,151 Ping An Bank Co., Ltd. �A� 782,877 0.87270,500 Ping An Insurance Group Co. of
China Ltd. �H� 3,290,419 3.64300,600 Sany Heavy Industry Co., Ltd. �A� 1,476,836 1.6370,400 SF Holding Co., Ltd. �A� 862,803 0.95154,400 Shenzhen Inovance Technology Co.,
Ltd. �A� 1,894,873 2.0910,900 Shenzhen Mindray Bio-Medical
Electronics Co., Ltd. �A� 566,749 0.6391,400 Shenzhen Sunway Communication
Co., Ltd. �A� 653,713 0.7240,800 Shenzhou International Group
Holdings Ltd. 696,293 0.77204,660 Songcheng Performance
Development Co., Ltd. �A� 603,666 0.6771,600 Sunny Optical Technology Group
Co., Ltd. 1,403,876 1.5518,009 TAL Education Group—ADR(a) 1,280,980 1.42113,300 Tencent Holdings Ltd. 8,447,535 9.34706,000 Topsports International Holdings Ltd.
144A(b) 1,074,630 1.1974,000 Tsingtao Brewery Co., Ltd. �H� 746,944 0.83240,000 Universal Scientific Industrial
Shanghai Co., Ltd. �A� 801,195 0.89464,000 Weichai Power Co., Ltd. �H� 993,570 1.1065,296 WuXi AppTec Co., Ltd. �H� 144A(b) 1,006,530 1.11123,000 Wuxi Biologics Cayman, Inc. 144A(b) 1,231,230 1.36
1,054,000 Xinyi Solar Holdings Ltd. 1,922,482 2.1223,970 XPeng, Inc.—ADR(a) 1,406,799 1.5576,834 Yantai Jereh Oilfield Services Group
Co., Ltd. �A� 432,881 0.4832,200 Yifeng Pharmacy Chain Co., Ltd. �A� 492,998 0.5564,600 Yunnan Energy New Material Co.,
Ltd. �A� 949,276 1.05
HoldingsSecurityDescription
Market ValueUSD
% ofShareholders’
Equity
Common Stocks – (Continued)China – (Continued)
7,560 Zai Lab Ltd.—ADR(a) 847,854 0.94374,947 Zhejiang Sanhua Intelligent Controls
Co., Ltd. �A� 1,348,854 1.49
75,619,872 83.57
Hong Kong61,000 AIA Group Ltd. 694,018 0.77428,000 Alibaba Health Information
Technology Ltd. 1,225,657 1.3676,200 ASM Pacific Technology Ltd. 925,438 1.02166,200 Budweiser Brewing Co. APAC Ltd.
144A(b) 588,499 0.65321,000 China Mengniu Dairy Co., Ltd. 1,650,082 1.82546,000 China Resources Cement Holdings
Ltd. 688,113 0.76236,000 China Resources Land Ltd. 1,038,099 1.15547,000 Geely Automobile Holdings Ltd. 1,527,627 1.6923,668 Hong Kong Exchanges & Clearing
Ltd. 1,179,088 1.30799,000 Sino Biopharmaceutical Ltd. 709,100 0.7863,500 Techtronic Industries Co., Ltd. 812,564 0.9080,000 Xinyi Glass Holdings Ltd. 183,482 0.20
11,221,767 12.40
Taiwan44,000 MediaTek, Inc. 1,075,485 1.19
United States168,000 Nexteer Automotive Group Ltd. 185,072 0.20
TOTAL COMMON STOCKS(cost USD 61,137,361) 88,102,196 97.36
Mutual Funds – 2.33%Ireland
2,105,165 Goldman Sachs US$ TreasuryLiquid Reserves Fund (X DistributionClass)(c)(d) 2,105,165 2.33
TOTAL MUTUAL FUNDS(cost USD 2,105,165) 2,105,165 2.33
TOTAL TRANSFERABLE SECURITIES ADMITTEDTO AN OFFICIAL EXCHANGE LISTING(cost USD 63,242,526) 90,207,361 99.69
HoldingsSecurityDescription
Market ValueUSD
% ofShareholders’
Equity
Other Transferable Securities
Rights – -%Hong Kong
1,815 China Resources LandLtd.—Rights(e) 0 -
TOTAL RIGHTS(cost USD nil) 0 -
TOTAL OTHER TRANSFERABLE SECURITIES(cost USD nil) 0 -
MARKET VALUE OF INVESTMENTS(cost USD 63,242,526) 90,207,361 99.69
OTHER ASSETS AND LIABILITIES 279,830 0.31
SHAREHOLDERS’ EQUITY 90,487,191 100.00
Goldman Sachs Funds—China Opportunity Equity PortfolioSchedule of InvestmentsAs at 30 November 2020
The accompanying notes are an integral part of these financial statements.
119
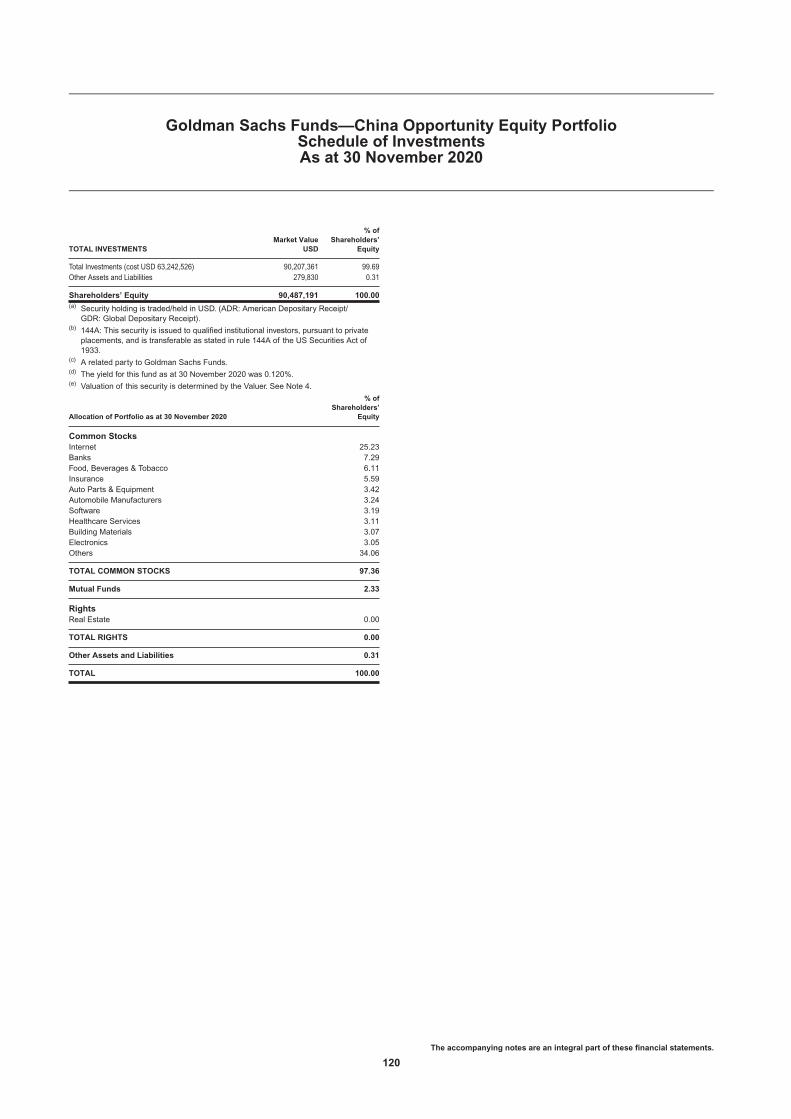
TOTAL INVESTMENTSMarket Value
USD
% ofShareholders’
Equity
Total Investments (cost USD 63,242,526) 90,207,361 99.69Other Assets and Liabilities 279,830 0.31
Shareholders’ Equity 90,487,191 100.00(a) Security holding is traded/held in USD. (ADR: American Depositary Receipt/
GDR: Global Depositary Receipt).(b) 144A: This security is issued to qualified institutional investors, pursuant to private
placements, and is transferable as stated in rule 144A of the US Securities Act of1933.
(c) A related party to Goldman Sachs Funds.(d) The yield for this fund as at 30 November 2020 was 0.120%.(e) Valuation of this security is determined by the Valuer. See Note 4.
Allocation of Portfolio as at 30 November 2020
% ofShareholders’
Equity
Common StocksInternet 25.23Banks 7.29Food, Beverages & Tobacco 6.11Insurance 5.59Auto Parts & Equipment 3.42Automobile Manufacturers 3.24Software 3.19Healthcare Services 3.11Building Materials 3.07Electronics 3.05Others 34.06
TOTAL COMMON STOCKS 97.36
Mutual Funds 2.33
RightsReal Estate 0.00
TOTAL RIGHTS 0.00
Other Assets and Liabilities 0.31
TOTAL 100.00
Goldman Sachs Funds—China Opportunity Equity PortfolioSchedule of InvestmentsAs at 30 November 2020
The accompanying notes are an integral part of these financial statements.
120

HoldingsSecurityDescription
Market ValueUSD
% ofShareholders’
Equity
Transferable securities admitted to an official exchange listing
Common Stocks – 98.28%Argentina
3,885 MercadoLibre, Inc. 5,951,820 3.43
Brazil415,300 Atacadao S.A. 1,545,423 0.89102,800 B3 S.A. - Brasil Bolsa Balcao 1,098,426 0.63473,218 Banco Bradesco S.A.—ADR(a) 2,209,928 1.27138,000 Fleury S.A. 696,058 0.4028,872 Pagseguro Digital Ltd. �A� 1,362,470 0.79
6,912,305 3.98
China39,693 Alibaba Group Holding Ltd.—ADR(a) 10,552,384 6.08119,000 ANTA Sports Products Ltd. 1,620,399 0.93667,500 China Merchants Bank Co., Ltd. �H� 4,229,229 2.4373,500 Contemporary Amperex Technology
Co., Ltd. �A� 2,723,156 1.5778,200 Gree Electric Appliances, Inc.�A� 794,509 0.46166,799 Hangzhou Robam Appliances Co.,
Ltd. �A� 1,015,442 0.58118,500 Meituan Dianping �B� 4,440,928 2.5610,563 New Oriental Education &
Technology Group, Inc.—ADR(a) 1,779,337 1.02374,000 Ping An Insurance Group Co. of
China Ltd. �H� 4,408,577 2.5471,113 SF Holding Co., Ltd. �A� 866,823 0.5024,000 Silergy Corp. 1,871,205 1.08112,200 Sunny Optical Technology Group
Co., Ltd. 2,208,878 1.2724,738 TAL Education Group—ADR(a) 1,768,520 1.02176,900 Tencent Holdings Ltd. 12,913,219 7.44563,000 Topsports International Holdings Ltd.
144A(b) 839,110 0.48109,372 WuXi AppTec Co., Ltd. �H� 144A(b) 1,638,574 0.94778,000 Xinyi Solar Holdings Ltd. 1,421,757 0.8218,823 XPeng, Inc.—ADR(a) 1,138,227 0.66259,355 Zhejiang Sanhua Intelligent Controls
Co., Ltd. �A� 926,655 0.53
57,156,929 32.91
Czech Republic415,882 Moneta Money Bank AS 144A(b) 1,251,362 0.72
Greece106,457 JUMBO S.A. 1,877,197 1.08
Hong Kong343,000 AIA Group Ltd. 3,762,663 2.17480,000 Alibaba Health Information
Technology Ltd. 1,414,107 0.82306,000 China Mengniu Dairy Co., Ltd. 1,549,424 0.8950,589 Hong Kong Exchanges & Clearing
Ltd. 2,517,641 1.451,175,000 Sino Biopharmaceutical Ltd. 1,183,380 0.68103,000 Techtronic Industries Co., Ltd. 1,323,623 0.76
11,750,838 6.77
India35,766 Avenue Supermarts Ltd. 1,105,586 0.64143,337 Bharti Airtel Ltd. 896,105 0.5221,732 Divi’s Laboratories Ltd. 1,056,286 0.6195,781 ICICI Lombard General Insurance
Co., Ltd. 144A(b) 1,876,372 1.0840,684 Info Edge India Ltd. 2,364,710 1.36241,422 Infosys Ltd.—ADR(a) 3,624,951 2.09128,390 Kotak Mahindra Bank Ltd. 3,300,671 1.9031,736 Larsen & Toubro Infotech Ltd.
144A(b) 1,370,960 0.7924,072 Maruti Suzuki India Ltd. 2,281,385 1.31
HoldingsSecurityDescription
Market ValueUSD
% ofShareholders’
Equity
Common Stocks – (Continued)India – (Continued)
88,149 SBI Life Insurance Co., Ltd. 144A(b) 1,007,052 0.58161,332 Tata Consumer Products Ltd. 1,171,380 0.67
20,055,458 11.55
Indonesia1,173,300 Bank Central Asia Tbk PT 2,577,692 1.48
Mexico201,567 Arca Continental SAB de CV 978,846 0.56375,710 Kimberly-Clark de Mexico SAB de
CV �A� 609,108 0.35882,900 Wal-Mart de Mexico SAB de CV 2,299,871 1.33
3,887,825 2.24
Peru5,714 Credicorp Ltd. 879,327 0.5129,825 Intercorp Financial Services, Inc. 909,663 0.52
1,788,990 1.03
Philippines150,210 Jollibee Foods Corp. 589,944 0.34
Poland168,446 Powszechna Kasa Oszczednosci
Bank Polski S.A. 1,196,783 0.69
Russia504,760 Moscow Exchange MICEX-RTS
PJSC 1,013,964 0.58235,269 Sberbank of Russia PJSC—ADR(a) 3,173,779 1.8348,924 Yandex NV �A� 3,409,513 1.96
7,597,256 4.37
Singapore8,212 Sea Ltd.—ADR(a) 1,469,948 0.85
South Africa39,267 Bid Corp., Ltd. 713,778 0.4188,045 Clicks Group Ltd. 1,348,025 0.7745,454 Santam Ltd. 742,546 0.43
2,804,349 1.61
South Korea21,152 LG Electronics, Inc. 1,638,059 0.949,546 NAVER Corp. 2,399,406 1.383,508 NCSoft Corp. 2,570,446 1.4812,974 Orion Corp. 1,392,152 0.803,382 Pearl Abyss Corp. 633,812 0.376,546 Samsung Electro-Mechanics Co.,
Ltd. 925,764 0.53170,847 Samsung Electronics Co., Ltd. 10,324,037 5.9435,483 SK Hynix, Inc. 3,135,000 1.81
23,018,676 13.25
Taiwan298,320 Chailease Holding Co., Ltd. 1,636,393 0.9417,000 Largan Precision Co., Ltd. 1,926,614 1.1151,000 Nien Made Enterprise Co., Ltd. 602,924 0.35790,000 Taiwan Semiconductor
Manufacturing Co., Ltd. 13,454,743 7.74118,000 Win Semiconductors Corp. 1,387,046 0.80
19,007,720 10.94
Thailand678,700 Airports of Thailand PCL 1,434,022 0.83
United States340,000 Nexteer Automotive Group Ltd. 361,561 0.21
TOTAL COMMON STOCKS(cost USD 128,675,803) 170,690,675 98.28
Goldman Sachs Funds—Emerging Markets Equity ESG PortfolioSchedule of InvestmentsAs at 30 November 2020
The accompanying notes are an integral part of these financial statements.
121

HoldingsSecurityDescription
Market ValueUSD
% ofShareholders’
Equity
Mutual Funds – 0.12%Ireland
136 Goldman Sachs US$ LiquidReserves Fund (X DistributionClass)(c)(d) 136 0.00
203,509 Goldman Sachs US$ TreasuryLiquid Reserves Fund (X DistributionClass)(c)(e) 203,509 0.12
203,645 0.12
TOTAL MUTUAL FUNDS(cost USD 203,645) 203,645 0.12
TOTAL TRANSFERABLE SECURITIES ADMITTEDTO AN OFFICIAL EXCHANGE LISTING(cost USD 128,879,448) 170,894,320 98.40
MARKET VALUE OF INVESTMENTS(cost USD 128,879,448) 170,894,320 98.40
OTHER ASSETS AND LIABILITIES 2,785,396 1.60
SHAREHOLDERS’ EQUITY 173,679,716 100.00
TOTAL INVESTMENTSMarket Value
USD
% ofShareholders’
Equity
Total Investments (cost USD 128,879,448) 170,894,320 98.40Other Assets and Liabilities 2,785,396 1.60
Shareholders’ Equity 173,679,716 100.00(a) Security holding is traded/held in USD. (ADR: American Depositary Receipt/
GDR: Global Depositary Receipt).(b) 144A: This security is issued to qualified institutional investors, pursuant to private
placements, and is transferable as stated in rule 144A of the US Securities Act of1933.
(c) A related party to Goldman Sachs Funds.(d) The yield for this fund as at 30 November 2020 was 0.171%.(e) The yield for this fund as at 30 November 2020 was 0.120%.
Allocation of Portfolio as at 30 November 2020
% ofShareholders’
Equity
Common StocksInternet 25.69Semiconductors 16.29Banks 10.83Insurance 6.80Retail 6.16Diversified Financial Services 4.91Food, Beverages & Tobacco 3.97Computers 2.88Miscellaneous Manufacturing 2.38Commercial Services 2.04Others 16.33
TOTAL COMMON STOCKS 98.28
Mutual Funds 0.12
Other Assets and Liabilities 1.60
TOTAL 100.00
Goldman Sachs Funds—Emerging Markets Equity ESG PortfolioSchedule of InvestmentsAs at 30 November 2020
The accompanying notes are an integral part of these financial statements.
122
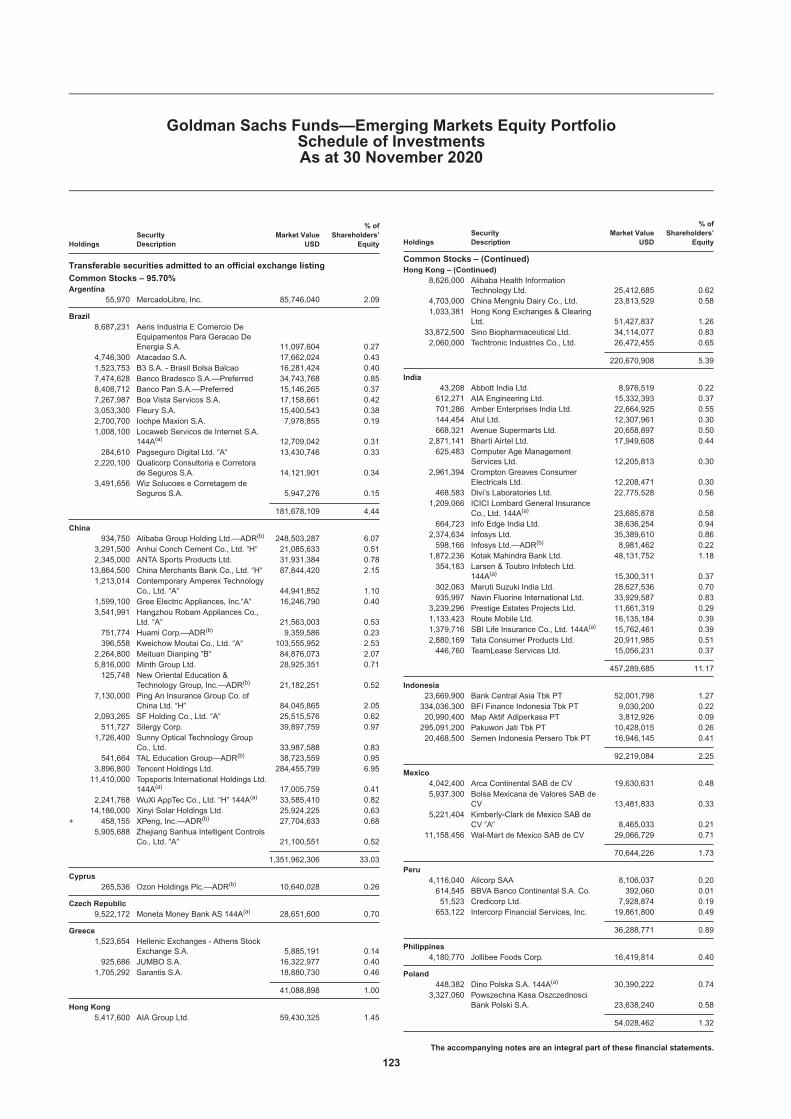
HoldingsSecurityDescription
Market ValueUSD
% ofShareholders’
Equity
Transferable securities admitted to an official exchange listing
Common Stocks – 95.70%Argentina
55,970 MercadoLibre, Inc. 85,746,040 2.09
Brazil8,687,231 Aeris Industria E Comercio De
Equipamentos Para Geracao DeEnergia S.A. 11,097,604 0.27
4,746,300 Atacadao S.A. 17,662,024 0.431,523,753 B3 S.A. - Brasil Bolsa Balcao 16,281,424 0.407,474,628 Banco Bradesco S.A.—Preferred 34,743,768 0.858,408,712 Banco Pan S.A.—Preferred 15,146,265 0.377,267,987 Boa Vista Servicos S.A. 17,158,661 0.423,053,300 Fleury S.A. 15,400,543 0.382,700,700 Iochpe Maxion S.A. 7,978,855 0.191,008,100 Locaweb Servicos de Internet S.A.
144A(a) 12,709,042 0.31284,610 Pagseguro Digital Ltd. �A� 13,430,746 0.33
2,220,100 Qualicorp Consultoria e Corretorade Seguros S.A. 14,121,901 0.34
3,491,656 Wiz Solucoes e Corretagem deSeguros S.A. 5,947,276 0.15
181,678,109 4.44
China934,750 Alibaba Group Holding Ltd.—ADR(b) 248,503,287 6.07
3,291,500 Anhui Conch Cement Co., Ltd. �H� 21,085,633 0.512,345,000 ANTA Sports Products Ltd. 31,931,384 0.7813,864,500 China Merchants Bank Co., Ltd. �H� 87,844,420 2.151,213,014 Contemporary Amperex Technology
Co., Ltd. �A� 44,941,852 1.101,599,100 Gree Electric Appliances, Inc.�A� 16,246,790 0.403,541,991 Hangzhou Robam Appliances Co.,
Ltd. �A� 21,563,003 0.53751,774 Huami Corp.—ADR(b) 9,359,586 0.23396,558 Kweichow Moutai Co., Ltd. �A� 103,555,952 2.53
2,264,800 Meituan Dianping �B� 84,876,073 2.075,816,000 Minth Group Ltd. 28,925,351 0.71125,748 New Oriental Education &
Technology Group, Inc.—ADR(b) 21,182,251 0.527,130,000 Ping An Insurance Group Co. of
China Ltd. �H� 84,045,865 2.052,093,265 SF Holding Co., Ltd. �A� 25,515,576 0.62511,727 Silergy Corp. 39,897,759 0.97
1,726,400 Sunny Optical Technology GroupCo., Ltd. 33,987,588 0.83
541,664 TAL Education Group—ADR(b) 38,723,559 0.953,896,800 Tencent Holdings Ltd. 284,455,799 6.9511,410,000 Topsports International Holdings Ltd.
144A(a) 17,005,759 0.412,241,768 WuXi AppTec Co., Ltd. �H� 144A(a) 33,585,410 0.8214,186,000 Xinyi Solar Holdings Ltd. 25,924,225 0.63
+ 458,155 XPeng, Inc.—ADR(b) 27,704,633 0.685,905,688 Zhejiang Sanhua Intelligent Controls
Co., Ltd. �A� 21,100,551 0.52
1,351,962,306 33.03
Cyprus265,536 Ozon Holdings Plc.—ADR(b) 10,640,028 0.26
Czech Republic9,522,172 Moneta Money Bank AS 144A(a) 28,651,600 0.70
Greece1,523,654 Hellenic Exchanges - Athens Stock
Exchange S.A. 5,885,191 0.14925,686 JUMBO S.A. 16,322,977 0.40
1,705,292 Sarantis S.A. 18,880,730 0.46
41,088,898 1.00
Hong Kong5,417,600 AIA Group Ltd. 59,430,325 1.45
HoldingsSecurityDescription
Market ValueUSD
% ofShareholders’
Equity
Common Stocks – (Continued)Hong Kong – (Continued)
8,626,000 Alibaba Health InformationTechnology Ltd. 25,412,685 0.62
4,703,000 China Mengniu Dairy Co., Ltd. 23,813,529 0.581,033,381 Hong Kong Exchanges & Clearing
Ltd. 51,427,837 1.2633,872,500 Sino Biopharmaceutical Ltd. 34,114,077 0.832,060,000 Techtronic Industries Co., Ltd. 26,472,455 0.65
220,670,908 5.39
India43,208 Abbott India Ltd. 8,976,519 0.22612,271 AIA Engineering Ltd. 15,332,393 0.37701,286 Amber Enterprises India Ltd. 22,664,925 0.55144,454 Atul Ltd. 12,307,961 0.30668,321 Avenue Supermarts Ltd. 20,658,897 0.50
2,871,141 Bharti Airtel Ltd. 17,949,608 0.44625,483 Computer Age Management
Services Ltd. 12,205,813 0.302,961,394 Crompton Greaves Consumer
Electricals Ltd. 12,208,471 0.30468,583 Divi’s Laboratories Ltd. 22,775,528 0.56
1,209,066 ICICI Lombard General InsuranceCo., Ltd. 144A(a) 23,685,878 0.58
664,723 Info Edge India Ltd. 38,636,254 0.942,374,634 Infosys Ltd. 35,389,610 0.86598,166 Infosys Ltd.—ADR(b) 8,981,462 0.22
1,872,236 Kotak Mahindra Bank Ltd. 48,131,752 1.18354,183 Larsen & Toubro Infotech Ltd.
144A(a) 15,300,311 0.37302,063 Maruti Suzuki India Ltd. 28,627,536 0.70935,997 Navin Fluorine International Ltd. 33,929,587 0.83
3,239,296 Prestige Estates Projects Ltd. 11,661,319 0.291,133,423 Route Mobile Ltd. 16,135,184 0.391,379,716 SBI Life Insurance Co., Ltd. 144A(a) 15,762,461 0.392,880,169 Tata Consumer Products Ltd. 20,911,985 0.51446,760 TeamLease Services Ltd. 15,056,231 0.37
457,289,685 11.17
Indonesia23,669,900 Bank Central Asia Tbk PT 52,001,798 1.27334,036,300 BFI Finance Indonesia Tbk PT 9,030,200 0.2220,990,400 Map Aktif Adiperkasa PT 3,812,926 0.09295,091,200 Pakuwon Jati Tbk PT 10,428,015 0.2620,468,500 Semen Indonesia Persero Tbk PT 16,946,145 0.41
92,219,084 2.25
Mexico4,042,400 Arca Continental SAB de CV 19,630,631 0.485,937,300 Bolsa Mexicana de Valores SAB de
CV 13,481,833 0.335,221,404 Kimberly-Clark de Mexico SAB de
CV �A� 8,465,033 0.2111,158,456 Wal-Mart de Mexico SAB de CV 29,066,729 0.71
70,644,226 1.73
Peru4,116,040 Alicorp SAA 8,106,037 0.20614,545 BBVA Banco Continental S.A. Co. 392,060 0.0151,523 Credicorp Ltd. 7,928,874 0.19653,122 Intercorp Financial Services, Inc. 19,861,800 0.49
36,288,771 0.89
Philippines4,180,770 Jollibee Foods Corp. 16,419,814 0.40
Poland448,382 Dino Polska S.A. 144A(a) 30,390,222 0.74
3,327,060 Powszechna Kasa OszczednosciBank Polski S.A. 23,638,240 0.58
54,028,462 1.32
Goldman Sachs Funds—Emerging Markets Equity PortfolioSchedule of InvestmentsAs at 30 November 2020
The accompanying notes are an integral part of these financial statements.
123
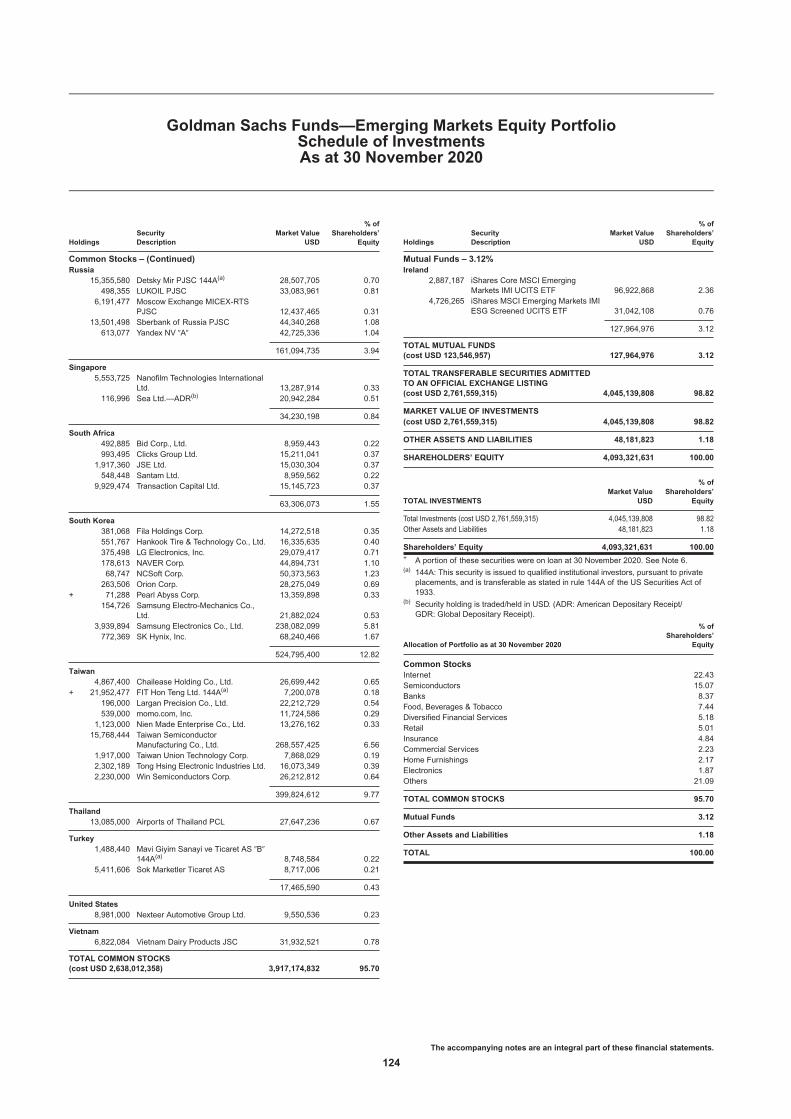
HoldingsSecurityDescription
Market ValueUSD
% ofShareholders’
Equity
Common Stocks – (Continued)Russia
15,355,580 Detsky Mir PJSC 144A(a) 28,507,705 0.70498,355 LUKOIL PJSC 33,083,961 0.81
6,191,477 Moscow Exchange MICEX-RTSPJSC 12,437,465 0.31
13,501,498 Sberbank of Russia PJSC 44,340,268 1.08613,077 Yandex NV �A� 42,725,336 1.04
161,094,735 3.94
Singapore5,553,725 Nanofilm Technologies International
Ltd. 13,287,914 0.33116,996 Sea Ltd.—ADR(b) 20,942,284 0.51
34,230,198 0.84
South Africa492,885 Bid Corp., Ltd. 8,959,443 0.22993,495 Clicks Group Ltd. 15,211,041 0.37
1,917,360 JSE Ltd. 15,030,304 0.37548,448 Santam Ltd. 8,959,562 0.22
9,929,474 Transaction Capital Ltd. 15,145,723 0.37
63,306,073 1.55
South Korea381,068 Fila Holdings Corp. 14,272,518 0.35551,767 Hankook Tire & Technology Co., Ltd. 16,335,635 0.40375,498 LG Electronics, Inc. 29,079,417 0.71178,613 NAVER Corp. 44,894,731 1.1068,747 NCSoft Corp. 50,373,563 1.23263,506 Orion Corp. 28,275,049 0.69
+ 71,288 Pearl Abyss Corp. 13,359,898 0.33154,726 Samsung Electro-Mechanics Co.,
Ltd. 21,882,024 0.533,939,894 Samsung Electronics Co., Ltd. 238,082,099 5.81772,369 SK Hynix, Inc. 68,240,466 1.67
524,795,400 12.82
Taiwan4,867,400 Chailease Holding Co., Ltd. 26,699,442 0.65
+ 21,952,477 FIT Hon Teng Ltd. 144A(a) 7,200,078 0.18196,000 Largan Precision Co., Ltd. 22,212,729 0.54539,000 momo.com, Inc. 11,724,586 0.29
1,123,000 Nien Made Enterprise Co., Ltd. 13,276,162 0.3315,768,444 Taiwan Semiconductor
Manufacturing Co., Ltd. 268,557,425 6.561,917,000 Taiwan Union Technology Corp. 7,868,029 0.192,302,189 Tong Hsing Electronic Industries Ltd. 16,073,349 0.392,230,000 Win Semiconductors Corp. 26,212,812 0.64
399,824,612 9.77
Thailand13,085,000 Airports of Thailand PCL 27,647,236 0.67
Turkey1,488,440 Mavi Giyim Sanayi ve Ticaret AS �B�
144A(a) 8,748,584 0.225,411,606 Sok Marketler Ticaret AS 8,717,006 0.21
17,465,590 0.43
United States8,981,000 Nexteer Automotive Group Ltd. 9,550,536 0.23
Vietnam6,822,084 Vietnam Dairy Products JSC 31,932,521 0.78
TOTAL COMMON STOCKS(cost USD 2,638,012,358) 3,917,174,832 95.70
HoldingsSecurityDescription
Market ValueUSD
% ofShareholders’
Equity
Mutual Funds – 3.12%Ireland
2,887,187 iShares Core MSCI EmergingMarkets IMI UCITS ETF 96,922,868 2.36
4,726,265 iShares MSCI Emerging Markets IMIESG Screened UCITS ETF 31,042,108 0.76
127,964,976 3.12
TOTAL MUTUAL FUNDS(cost USD 123,546,957) 127,964,976 3.12
TOTAL TRANSFERABLE SECURITIES ADMITTEDTO AN OFFICIAL EXCHANGE LISTING(cost USD 2,761,559,315) 4,045,139,808 98.82
MARKET VALUE OF INVESTMENTS(cost USD 2,761,559,315) 4,045,139,808 98.82
OTHER ASSETS AND LIABILITIES 48,181,823 1.18
SHAREHOLDERS’ EQUITY 4,093,321,631 100.00
TOTAL INVESTMENTSMarket Value
USD
% ofShareholders’
Equity
Total Investments (cost USD 2,761,559,315) 4,045,139,808 98.82Other Assets and Liabilities 48,181,823 1.18
Shareholders’ Equity 4,093,321,631 100.00+ A portion of these securities were on loan at 30 November 2020. See Note 6.(a) 144A: This security is issued to qualified institutional investors, pursuant to private
placements, and is transferable as stated in rule 144A of the US Securities Act of1933.
(b) Security holding is traded/held in USD. (ADR: American Depositary Receipt/GDR: Global Depositary Receipt).
Allocation of Portfolio as at 30 November 2020
% ofShareholders’
Equity
Common StocksInternet 22.43Semiconductors 15.07Banks 8.37Food, Beverages & Tobacco 7.44Diversified Financial Services 5.18Retail 5.01Insurance 4.84Commercial Services 2.23Home Furnishings 2.17Electronics 1.87Others 21.09
TOTAL COMMON STOCKS 95.70
Mutual Funds 3.12
Other Assets and Liabilities 1.18
TOTAL 100.00
Goldman Sachs Funds—Emerging Markets Equity PortfolioSchedule of InvestmentsAs at 30 November 2020
The accompanying notes are an integral part of these financial statements.
124

HoldingsSecurityDescription
Market ValueUSD
% ofShareholders’
Equity
Transferable securities admitted to an official exchange listing
Common Stocks – 98.53%Australia
290,039 Carbon Revolution Ltd. 662,926 0.28
Belgium96,466 Umicore S.A. 4,355,542 1.84
China136,900 Contemporary Amperex Technology
Co., Ltd. �A� 5,072,109 2.151,066,976 Xinyi Solar Holdings Ltd. 1,949,847 0.8236,605 XPeng, Inc.—ADR(a) 2,213,504 0.94
9,235,460 3.91
Denmark41,962 Chr Hansen Holding A/S 4,101,839 1.7466,928 Novozymes A/S �B� 3,850,504 1.6313,889 Orsted A/S 144A(b) 2,526,596 1.07
10,478,939 4.44
Finland36,456 Neste OYJ 2,469,915 1.05
France25,850 Imerys S.A. 1,082,812 0.4659,740 Schneider Electric S.E. 8,456,011 3.58
9,538,823 4.04
Germany221,302 Infineon Technologies AG 7,930,701 3.36
Ireland71,154 Aptiv Plc. 8,628,846 3.6646,028 Kingspan Group Plc. 4,038,822 1.7151,765 Trane Technologies Plc. 7,386,866 3.13
20,054,534 8.50
Israel10,132 SolarEdge Technologies, Inc. 2,850,030 1.21
Italy764,438 Enel SpA 7,759,498 3.29
Japan23,600 Daikin Industries Ltd. 5,388,649 2.2879,000 Horiba Ltd. 4,269,997 1.818,200 Keyence Corp. 4,202,772 1.78
135,300 Kurita Water Industries Ltd. 5,012,614 2.1340,800 Nidec Corp. 5,221,180 2.21
24,095,212 10.21
Netherlands155,980 Aalberts NV 6,892,978 2.9239,622 Koninklijke DSM NV 6,532,801 2.77
13,425,779 5.69
Norway1,435,514 Aker Carbon Capture AS 1,524,948 0.652,361,708 Aker Offshore Wind AS 1,784,096 0.75
3,309,044 1.40
Spain501,085 Iberdrola S.A. 6,897,353 2.92
Sweden68,245 Re:NewCell AB 983,065 0.42
Switzerland250,422 ABB Ltd. 6,693,435 2.8331,907 Nestle S.A. 3,602,642 1.53
10,296,077 4.36
HoldingsSecurityDescription
Market ValueUSD
% ofShareholders’
Equity
Common Stocks – (Continued)Taiwan
938,000 Delta Electronics, Inc. 7,396,493 3.13
United Kingdom978,565 Calisen Plc. 2,499,468 1.06
1,682,628 DS Smith Plc. 7,628,109 3.23
10,127,577 4.29
United States46,240 Albemarle Corp. 6,307,598 2.6776,330 Ball Corp. 7,381,874 3.1334,782 Beyond Meat, Inc. 4,859,393 2.0628,879 Danaher Corp. 6,396,699 2.7162,290 Darling Ingredients, Inc. 3,059,062 1.3028,495 Deere & Co. 7,501,594 3.188,604 DocuSign, Inc. 1,970,832 0.8441,353 Ecolab, Inc. 9,167,960 3.8866,698 Itron, Inc. 5,424,548 2.3064,642 Lordstown Motors Corp. �A� 1,566,276 0.6690,247 NextEra Energy, Inc. 6,751,378 2.8642,019 Waste Connections, Inc. 4,392,246 1.8637,864 Waste Management, Inc. 4,530,049 1.92127,704 Westrock Co. 5,521,283 2.3460,690 Xylem, Inc. 5,862,654 2.48
80,693,446 34.19
TOTAL COMMON STOCKS(cost USD 188,436,316) 232,560,414 98.53
Mutual Funds – 0.69%Ireland
1,628,814 Goldman Sachs US$ LiquidReserves Fund (X DistributionClass)(c)(d) 1,628,814 0.69
TOTAL MUTUAL FUNDS(cost USD 1,628,814) 1,628,814 0.69
TOTAL TRANSFERABLE SECURITIES ADMITTEDTO AN OFFICIAL EXCHANGE LISTING(cost USD 190,065,130) 234,189,228 99.22
MARKET VALUE OF INVESTMENTS(cost USD 190,065,130) 234,189,228 99.22
OTHER ASSETS AND LIABILITIES 1,841,582 0.78
SHAREHOLDERS’ EQUITY 236,030,810 100.00
TOTAL INVESTMENTSMarket Value
USD
% ofShareholders’
Equity
Total Investments (cost USD 190,065,130) 234,189,228 99.22Other Assets and Liabilities 1,841,582 0.78
Shareholders’ Equity 236,030,810 100.00(a) Security holding is traded/held in USD. (ADR: American Depositary Receipt/
GDR: Global Depositary Receipt).(b) 144A: This security is issued to qualified institutional investors, pursuant to private
placements, and is transferable as stated in rule 144A of the US Securities Act of1933.
(c) A related party to Goldman Sachs Funds.(d) The yield for this fund as at 30 November 2020 was 0.171%.
Goldman Sachs Funds—Global Environmental Impact Equity PortfolioSchedule of InvestmentsAs at 30 November 2020
The accompanying notes are an integral part of these financial statements.
125

Allocation of Portfolio as at 30 November 2020
% ofShareholders’
Equity
Common StocksChemicals 14.53Electric 10.14Electronics 9.15Electrical Components & Equipment 8.86Packaging & Containers 8.70Machinery—Diversified 7.44Environmental Control 6.33Miscellaneous Manufacturing 6.05Building Materials 4.45Auto Parts & Equipment 3.94Others 18.94
TOTAL COMMON STOCKS 98.53
Mutual Funds 0.69
Other Assets and Liabilities 0.78
TOTAL 100.00
Goldman Sachs Funds—Global Environmental Impact Equity PortfolioSchedule of InvestmentsAs at 30 November 2020
The accompanying notes are an integral part of these financial statements.
126

HoldingsSecurityDescription
Market ValueUSD
% ofShareholders’
Equity
Transferable securities admitted to an official exchange listing
Common Stocks – 99.64%France
9,818 BNP Paribas S.A. 512,896 3.281,736 Gecina S.A. 266,550 1.709,989 Klepierre S.A. 227,065 1.451,499 Sanofi 153,973 0.982,161 Schneider Electric S.E. 305,883 1.964,263 Vinci S.A. 447,140 2.86
1,913,507 12.23
Germany3,175 Vonovia S.E. 218,688 1.40
Ireland1,255 Accenture Plc. �A� 312,319 2.001,310 Medtronic Plc. 149,340 0.95
461,659 2.95
Italy24,608 Enel SpA 249,786 1.6024,866 UniCredit SpA 261,830 1.67
511,616 3.27
Japan6,700 Takeda Pharmaceutical Co., Ltd. 240,761 1.54
Netherlands77,859 Koninklijke KPN NV 235,544 1.5117,245 Royal Dutch Shell Plc. �A� 303,770 1.94
539,314 3.45
Singapore21,500 Singapore Exchange Ltd. 142,847 0.91
Spain6,008 Ferrovial S.A. 169,434 1.0816,747 Iberdrola S.A. 230,520 1.48
399,954 2.56
Switzerland3,683 Nestle S.A. 415,850 2.662,913 Swiss Re AG 269,353 1.7216,809 UBS Group AG 242,050 1.551,072 Zurich Insurance Group AG 441,893 2.82
1,369,146 8.75
Taiwan18,000 Taiwan Semiconductor
Manufacturing Co., Ltd. 306,564 1.96
United Kingdom3,406 AstraZeneca Plc. 359,833 2.3053,466 BP Plc. 182,719 1.1753,620 DS Smith Plc. 243,083 1.551,385 Ferguson Plc. 156,026 1.0017,785 National Grid Plc. 205,731 1.316,024 Rio Tinto Plc. 397,357 2.54
1,544,749 9.87
United States2,635 Ameren Corp. 207,085 1.321,188 American Tower Corp. 276,151 1.773,023 Apple, Inc. 359,737 2.301,454 AvalonBay Communities, Inc. 243,123 1.554,706 Bristol-Myers Squibb Co. 296,619 1.901,983 Chevron Corp. 179,660 1.157,210 Cisco Systems, Inc. 307,398 1.977,221 Coca-Cola Co. 371,520 2.376,368 Comcast Corp. �A� 326,901 2.092,646 Eaton Corp. Plc. 319,769 2.041,255 Home Depot, Inc. 343,268 2.19
HoldingsSecurityDescription
Market ValueUSD
% ofShareholders’
Equity
Common Stocks – (Continued)United States – (Continued)
2,066 Honeywell International, Inc. 425,451 2.721,050 Illinois Tool Works, Inc. 220,920 1.412,448 Johnson & Johnson 352,708 2.253,552 JP Morgan Chase & Co. 426,702 2.733,185 Las Vegas Sands Corp. 177,914 1.14944 McDonald’s Corp. 203,791 1.30
2,952 Microsoft Corp. 632,082 4.042,503 Procter & Gamble Co. 344,813 2.202,079 Prologis, Inc. 209,127 1.341,680 QUALCOMM, Inc. 244,541 1.562,359 Texas Instruments, Inc. 377,322 2.413,467 Truist Financial Corp. 166,139 1.063,742 Verizon Communications, Inc. 225,605 1.442,003 Walmart, Inc. 302,854 1.949,514 Wells Fargo & Co. 266,011 1.701,976 Xcel Energy, Inc. 133,775 0.86
7,940,986 50.75
TOTAL COMMON STOCKS(cost USD 13,631,670) 15,589,791 99.64
Mutual Funds – 0.54%Ireland
85,443 Goldman Sachs US$ TreasuryLiquid Reserves Fund (X DistributionClass)(a)(b) 85,443 0.54
TOTAL MUTUAL FUNDS(cost USD 85,443) 85,443 0.54
TOTAL TRANSFERABLE SECURITIES ADMITTEDTO AN OFFICIAL EXCHANGE LISTING(cost USD 13,717,113) 15,675,234 100.18
MARKET VALUE OF INVESTMENTS(cost USD 13,717,113) 15,675,234 100.18
OTHER ASSETS AND LIABILITIES (28,718) (0.18)
SHAREHOLDERS’ EQUITY 15,646,516 100.00
TOTAL INVESTMENTSMarket Value
USD
% ofShareholders’
Equity
Total Investments (cost USD 13,717,113) 15,675,234 100.18Other Assets and Liabilities (28,718) (0.18)
Shareholders’ Equity 15,646,516 100.00(a) A related party to Goldman Sachs Funds.(b) The yield for this fund as at 30 November 2020 was 0.120%.
Goldman Sachs Funds—Global Equity Income PortfolioSchedule of InvestmentsAs at 30 November 2020
The accompanying notes are an integral part of these financial statements.
127

Allocation of Portfolio as at 30 November 2020
% ofShareholders’
Equity
Common StocksBanks 11.99Pharmaceuticals 8.97Real Estate Investment Trust 7.81Electric 6.57Semiconductors 5.93Retail 5.43Food, Beverages & Tobacco 5.03Telecommunications 4.92Insurance 4.54Computers 4.30Others 34.15
TOTAL COMMON STOCKS 99.64
Mutual Funds 0.54
Other Assets and Liabilities (0.18)
TOTAL 100.00
Goldman Sachs Funds—Global Equity Income PortfolioSchedule of InvestmentsAs at 30 November 2020
The accompanying notes are an integral part of these financial statements.
128

HoldingsSecurityDescription
Market ValueUSD
% ofShareholders’
Equity
Transferable securities admitted to an official exchange listing
Common Stocks – 98.41%Finland
4,547 Neste OYJ 308,062 1.06
Ireland3,920 Accenture Plc. �A� 975,531 3.35
Japan6,300 Hoya Corp. 842,326 2.901,000 Keyence Corp. 512,533 1.767,300 Nidec Corp. 934,182 3.21
2,289,041 7.87
Netherlands3,687 Koninklijke DSM NV 607,906 2.09
Spain194,366 Banco Bilbao Vizcaya Argentaria
S.A. 923,747 3.18
Sweden6,772 Hexagon AB �B� 569,336 1.96
Switzerland4,785 Nestle S.A. 540,278 1.8661,196 UBS Group AG 881,482 3.03
1,421,760 4.89
Taiwan8,964 Taiwan Semiconductor
Manufacturing Co., Ltd.—ADR(a) 873,721 3.00
United Kingdom8,068 AstraZeneca Plc. 852,358 2.9319,279 Compass Group Plc. 354,113 1.228,753 Ferguson Plc. 986,062 3.3913,801 InterContinental Hotels Group Plc. 865,775 2.976,905 Reckitt Benckiser Group Plc. 611,110 2.1088,877 Rentokil Initial Plc. 593,445 2.04
4,262,863 14.65
United States932 Alphabet, Inc. �A� 1,646,732 5.66
3,427 American Tower Corp. 796,606 2.747,597 Ball Corp. 734,706 2.5333,817 Boston Scientific Corp. 1,123,401 3.863,173 Burlington Stores, Inc. 698,948 2.4016,834 Cheniere Energy, Inc. 992,869 3.411,293 Costco Wholesale Corp. 500,352 1.7230,275 Elanco Animal Health, Inc. 946,094 3.257,991 Fidelity National Information
Services, Inc. 1,176,675 4.053,136 Intuit, Inc. 1,111,054 3.827,758 Marsh & McLennan Cos., Inc. 884,567 3.043,093 Martin Marietta Materials, Inc. 823,140 2.839,164 NIKE, Inc. �B� 1,227,976 4.229,693 Northern Trust Corp. 927,523 3.199,329 Procter & Gamble Co. 1,285,163 4.421,721 S&P Global, Inc. 600,818 2.076,235 Walt Disney Co. 916,171 3.15
16,392,795 56.36
TOTAL COMMON STOCKS(cost USD 22,731,292) 28,624,762 98.41
HoldingsSecurityDescription
Market ValueUSD
% ofShareholders’
Equity
Mutual Funds – 2.82%Ireland
821,602 Goldman Sachs US$ TreasuryLiquid Reserves Fund (X DistributionClass)(b)(c) 821,602 2.82
TOTAL MUTUAL FUNDS(cost USD 821,602) 821,602 2.82
TOTAL TRANSFERABLE SECURITIES ADMITTEDTO AN OFFICIAL EXCHANGE LISTING(cost USD 23,552,894) 29,446,364 101.23
MARKET VALUE OF INVESTMENTS(cost USD 23,552,894) 29,446,364 101.23
OTHER ASSETS AND LIABILITIES (358,753) (1.23)
SHAREHOLDERS’ EQUITY 29,087,611 100.00
TOTAL INVESTMENTSMarket Value
USD
% ofShareholders’
Equity
Total Investments (cost USD 23,552,894) 29,446,364 101.23Other Assets and Liabilities (358,753) (1.23)
Shareholders’ Equity 29,087,611 100.00(a) Security holding is traded/held in USD. (ADR: American Depositary Receipt/
GDR: Global Depositary Receipt).(b) A related party to Goldman Sachs Funds.(c) The yield for this fund as at 30 November 2020 was 0.120%.
Allocation of Portfolio as at 30 November 2020
% ofShareholders’
Equity
Common StocksBanks 9.40Software 7.87Pharmaceuticals 6.18Electronics 6.11Internet 5.66Cosmetics/Personal Care 4.42Apparel 4.22Retail 4.12Commercial Services 4.11Healthcare Products 3.86Others 42.46
TOTAL COMMON STOCKS 98.41
Mutual Funds 2.82
Other Assets and Liabilities (1.23)
TOTAL 100.00
Goldman Sachs Funds—Global Equity Partners ESG PortfolioSchedule of InvestmentsAs at 30 November 2020
The accompanying notes are an integral part of these financial statements.
129

HoldingsSecurityDescription
Market ValueUSD
% ofShareholders’
Equity
Transferable securities admitted to an official exchange listing
Common Stocks – 96.80%Finland
155,303 Neste OYJ 10,521,868 1.02
France136,936 Safran S.A. 20,253,452 1.97
Ireland127,208 Accenture Plc. �A� 31,656,983 3.09
Italy1,493,711 Davide Campari-Milano NV 17,434,028 1.70
Japan224,900 Hoya Corp. 30,069,695 2.9344,900 Keyence Corp. 23,012,741 2.24254,900 Nidec Corp. 32,619,577 3.18
85,702,013 8.35
Netherlands125,866 Koninklijke DSM NV 20,752,552 2.02
Spain7,571,787 Banco Bilbao Vizcaya Argentaria
S.A. 35,985,802 3.51
Sweden235,804 Hexagon AB �B� 19,824,525 1.93
Switzerland+ 2,092,632 UBS Group AG 30,142,791 2.94
Taiwan307,003 Taiwan Semiconductor
Manufacturing Co., Ltd.—ADR(a) 29,923,582 2.92
United Kingdom260,735 AstraZeneca Plc. 27,545,806 2.69294,041 Ferguson Plc. 33,124,956 3.23441,992 InterContinental Hotels Group Plc. 27,727,384 2.70268,169 Reckitt Benckiser Group Plc. 23,733,642 2.31
2,945,543 Rentokil Initial Plc. 19,667,810 1.92
131,799,598 12.85
United States14,464 Alphabet, Inc. �A� 25,556,152 2.4915,998 Alphabet, Inc. �C� 28,357,095 2.76117,331 American Tower Corp. 27,273,591 2.66249,926 Ball Corp. 24,170,343 2.36
1,158,118 Boston Scientific Corp. 38,472,680 3.75108,426 Burlington Stores, Inc. 23,884,079 2.33541,680 Cheniere Energy, Inc. 31,948,286 3.11
1,027,030 Elanco Animal Health, Inc. 32,094,688 3.13273,692 Fidelity National Information
Services, Inc. 40,301,147 3.93136,262 Honeywell International, Inc. 28,060,434 2.73106,294 Intuit, Inc. 37,658,901 3.67265,695 Marsh & McLennan Cos., Inc. 30,294,544 2.95121,073 Martin Marietta Materials, Inc. 32,221,158 3.14256,536 NIKE, Inc. �B� 34,375,824 3.35314,727 Northern Trust Corp. 30,116,227 2.94319,519 Procter & Gamble Co. 44,016,937 4.2958,959 S&P Global, Inc. 20,583,177 2.01202,485 Walt Disney Co. 29,753,146 2.90
559,138,409 54.50
TOTAL COMMON STOCKS(cost USD 725,527,454) 993,135,603 96.80
HoldingsSecurityDescription
Market ValueUSD
% ofShareholders’
Equity
Mutual Funds – 2.76%Ireland
28,262,795 Goldman Sachs US$ TreasuryLiquid Reserves Fund (X DistributionClass)(b)(c) 28,262,795 2.76
TOTAL MUTUAL FUNDS(cost USD 28,262,795) 28,262,795 2.76
TOTAL TRANSFERABLE SECURITIES ADMITTEDTO AN OFFICIAL EXCHANGE LISTING(cost USD 753,790,249) 1,021,398,398 99.56
MARKET VALUE OF INVESTMENTS EXCLUDINGDERIVATIVES(cost USD 753,790,249) 1,021,398,398 99.56
Share Class Specific Forward Currency Contracts – 0.01%
CurrencyAmountBought Currency
AmountSold
MaturityDate
UnrealisedGainUSD
% ofShareholders’
Equity
CHF 823,801 USD 893,509 10/12/2020 18,110 0.00EUR 60,438,057 USD 71,566,692 21/01/2021 1,042,305 0.10
UNREALISED GAIN ON FORWARD CURRENCYCONTRACTS HELD FOR HEDGING PURPOSES 1,060,415 0.10
CurrencyAmountBought Currency
AmountSold
MaturityDate
UnrealisedLossUSD
% ofShareholders’
Equity
USD 4,456,910 CHF 4,073,153 10/12/2020 (50,444) (0.00)USD 11,246,700 JPY 1,189,723,800 23/12/2020 (170,415) (0.02)USD 17,206,897 GBP 13,347,394 13/01/2021 (654,087) (0.06)USD 5,991,323 EUR 5,059,721 21/01/2021 (87,317) (0.01)
UNREALISED LOSS ON FORWARD CURRENCYCONTRACTS HELD FOR HEDGING PURPOSES (962,263) (0.09)
MARKET VALUE OF INVESTMENTS(cost USD 753,790,249) 1,021,496,550 99.57
OTHER ASSETS AND LIABILITIES 4,466,574 0.43
SHAREHOLDERS’ EQUITY 1,025,963,124 100.00
TOTAL INVESTMENTSMarket Value
USD
% ofShareholders’
Equity
Total Investments excluding derivatives (cost USD753,790,249) 1,021,398,398 99.56
Unrealised gain on forward currency contracts held for hedgingpurposes 1,060,415 0.10
Unrealised loss on forward currency contracts held for hedgingpurposes (962,263) (0.09)
Other Assets and Liabilities 4,466,574 0.43
Shareholders’ Equity 1,025,963,124 100.00
The counterparties for forward currency contracts were Bank of America N.A., BarclaysBank Plc., BNP Paribas S.A., Citibank N.A., Deutsche Bank AG, JP Morgan Chase BankN.A., Royal Bank of Canada, Standard Chartered Bank, State Street Bank & Trust andUBS AG.
The maximum individual counterparty exposure as at 30 November 2020 is 0.05% of theNAV.
+ A portion of these securities were on loan at 30 November 2020. See Note 6.(a) Security holding is traded/held in USD. (ADR: American Depositary Receipt/
GDR: Global Depositary Receipt).(b) A related party to Goldman Sachs Funds.(c) The yield for this fund as at 30 November 2020 was 0.120%.
Goldman Sachs Funds—Global Equity Partners PortfolioSchedule of InvestmentsAs at 30 November 2020
The accompanying notes are an integral part of these financial statements.
130

Allocation of Portfolio as at 30 November 2020
% ofShareholders’
Equity
Common StocksBanks 9.39Electronics 8.84Software 7.60Pharmaceuticals 5.82Internet 5.25Cosmetics/Personal Care 4.29Machinery—Diversified 4.17Commercial Services 3.93Healthcare Products 3.75Apparel 3.35Others 40.41
TOTAL COMMON STOCKS 96.80
Mutual Funds 2.76
Unrealised Gain on Forward Currency Contracts Held for HedgingPurposes
0.10
Unrealised Loss on Forward Currency Contracts Held for HedgingPurposes
(0.09)
Other Assets and Liabilities 0.43
TOTAL 100.00
Goldman Sachs Funds—Global Equity Partners PortfolioSchedule of InvestmentsAs at 30 November 2020
The accompanying notes are an integral part of these financial statements.
131

HoldingsSecurityDescription
Market ValueUSD
% ofShareholders’
Equity
Transferable securities admitted to an official exchange listing
Common Stocks – 97.68%Australia
5,315 CSL Ltd. 1,169,159 2.57
China67,500 Wuxi Biologics Cayman, Inc. 144A(a) 670,965 1.47
Denmark37,641 Genmab A/S—ADR(b) 1,437,886 3.16
Japan20,500 Chugai Pharmaceutical Co., Ltd. 996,287 2.198,100 Hoya Corp. 1,082,990 2.38
2,079,277 4.57
Netherlands1,617 Argenx S.E.—ADR(b) 457,853 1.01
Switzerland1,358 Lonza Group AG 867,173 1.90
United Kingdom7,477 AstraZeneca Plc. 789,921 1.74
United States3,381 10X Genomics, Inc. �A� 520,065 1.142,822 Acceleron Pharma, Inc. 334,040 0.7318,479 Agios Pharmaceuticals, Inc. 822,316 1.814,663 Alexandria Real Estate Equities, Inc. 758,390 1.675,728 Allogene Therapeutics, Inc. 180,604 0.405,231 Alnylam Pharmaceuticals, Inc. 686,098 1.5115,263 American Well Corp. �A� 402,027 0.886,510 Axonics Modulation Technologies,
Inc. 295,424 0.6512,833 Beam Therapeutics, Inc. 593,911 1.311,727 Bio-Techne Corp. 516,442 1.147,713 Bluebird Bio, Inc. 340,452 0.7538,214 Boston Scientific Corp. 1,269,469 2.7923,221 Bristol-Myers Squibb Co. 1,463,620 3.226,377 Castle Biosciences, Inc. 286,774 0.6315,007 Catalent, Inc. 1,471,586 3.2310,758 Constellation Pharmaceuticals, Inc. 272,393 0.606,070 Danaher Corp. 1,344,505 2.961,054 DexCom, Inc. 338,302 0.749,593 Edwards Lifesciences Corp. 807,347 1.7711,464 Eli Lilly & Co. 1,691,857 3.723,138 Exact Sciences Corp. 374,991 0.8217,497 Exelixis, Inc. 339,442 0.7528,125 Fluidigm Corp. 175,781 0.399,494 Guardant Health, Inc. 1,128,837 2.4824,173 Halozyme Therapeutics, Inc. 936,704 2.0612,924 Hologic, Inc. 893,953 1.961,651 IDEXX Laboratories, Inc. 752,476 1.652,728 IGM Biosciences, Inc. 184,740 0.412,797 Illumina, Inc. 876,440 1.933,707 Insulet Corp. 924,637 2.031,879 Intuitive Surgical, Inc. 1,373,662 3.021,819 iRhythm Technologies, Inc. 431,994 0.95605 Mettler-Toledo International, Inc. 683,650 1.50
4,127 Neogen Corp. 306,306 0.6713,818 Neurocrine Biosciences, Inc. 1,331,641 2.935,924 Novanta, Inc. 699,032 1.5424,671 OraSure Technologies, Inc. 288,651 0.6321,935 Pacific Biosciences of California,
Inc. 342,625 0.7510,803 PerkinElmer, Inc. 1,402,337 3.0812,368 Quanterix Corp. 544,316 1.202,810 Repligen Corp. 530,219 1.175,284 Sarepta Therapeutics, Inc. 736,378 1.627,365 Seagen, Inc. 1,242,328 2.732,836 Shockwave Medical, Inc. 275,205 0.603,782 Tandem Diabetes Care, Inc. 340,531 0.755,402 Twist Bioscience Corp. 588,224 1.29
HoldingsSecurityDescription
Market ValueUSD
% ofShareholders’
Equity
Common Stocks – (Continued)United States – (Continued)
5,053 Ultragenyx Pharmaceutical, Inc. 610,099 1.343,917 Veeva Systems, Inc. �A� 1,091,942 2.402,315 Vertex Pharmaceuticals, Inc. 527,612 1.164,678 West Pharmaceutical Services, Inc. 1,292,298 2.847,962 Y-mAbs Therapeutics, Inc. 382,176 0.846,442 Zimmer Biomet Holdings, Inc. 963,723 2.12
36,968,572 81.26
TOTAL COMMON STOCKS(cost USD 43,199,859) 44,440,806 97.68
Mutual Funds – 0.00%Ireland
12 Goldman Sachs US$ TreasuryLiquid Reserves Fund (X DistributionClass)(c)(d) 12 0.00
TOTAL MUTUAL FUNDS(cost USD 12) 12 0.00
TOTAL TRANSFERABLE SECURITIES ADMITTEDTO AN OFFICIAL EXCHANGE LISTING(cost USD 43,199,871) 44,440,818 97.68
MARKET VALUE OF INVESTMENTS(cost USD 43,199,871) 44,440,818 97.68
OTHER ASSETS AND LIABILITIES 1,054,655 2.32
SHAREHOLDERS’ EQUITY 45,495,473 100.00
TOTAL INVESTMENTSMarket Value
USD
% ofShareholders’
Equity
Total Investments (cost USD 43,199,871) 44,440,818 97.68Other Assets and Liabilities 1,054,655 2.32
Shareholders’ Equity 45,495,473 100.00(a) 144A: This security is issued to qualified institutional investors, pursuant to private
placements, and is transferable as stated in rule 144A of the US Securities Act of1933.
(b) Security holding is traded/held in USD. (ADR: American Depositary Receipt/GDR: Global Depositary Receipt).
(c) A related party to Goldman Sachs Funds.(d) The yield for this fund as at 30 November 2020 was 0.120%.
Allocation of Portfolio as at 30 November 2020
% ofShareholders’
Equity
Common StocksHealthcare Products 30.00Biotechnology 28.60Pharmaceuticals 18.64Healthcare Services 7.48Electronics 7.35Software 2.40Real Estate Investment Trust 1.67Electrical Components & Equipment 1.54
TOTAL COMMON STOCKS 97.68
Mutual Funds 0.00
Other Assets and Liabilities 2.32
TOTAL 100.00
Goldman Sachs Funds—Global Future Health Care Equity PortfolioSchedule of InvestmentsAs at 30 November 2020
The accompanying notes are an integral part of these financial statements.
132

HoldingsSecurityDescription
Market ValueUSD
% ofShareholders’
Equity
Transferable securities admitted to an official exchange listing
Common Stocks – 99.37%Argentina
69,871 MercadoLibre, Inc. 107,042,372 3.22
Australia169,104 Atlassian Corp. Plc. �A� 38,247,943 1.15
Brazil454,881 Pagseguro Digital Ltd. �A� 21,465,834 0.65
China846,439 Baozun, Inc.—ADR(a) 31,902,286 0.96
17,319,000 Kingdee International SoftwareGroup Co., Ltd. 60,530,675 1.82
5,449,524 Luxshare Precision Industry Co.,Ltd. �A� 42,975,936 1.29
81,899 Luxshare Precision Industry Co.,Ltd. �A� 645,870 0.02
1,029,000 Meituan Dianping �B� 38,562,999 1.16606,453 NetEase, Inc.—ADR(a) 55,478,321 1.67276,849 Pinduoduo, Inc.—ADR(a) 38,670,268 1.17690,000 Silergy Corp. 53,797,149 1.62
322,563,504 9.71
Germany885,361 Infineon Technologies AG 31,728,288 0.95
Ireland434,162 Aptiv Plc. 52,650,826 1.59
Japan204,600 Daifuku Co., Ltd. 23,817,509 0.72249,800 Hamamatsu Photonics KK 14,120,696 0.42524,200 Hoya Corp. 70,086,857 2.11560,600 Nidec Corp. 71,740,035 2.16381,200 TDK Corp. 54,104,146 1.63148,500 Tokyo Electron Ltd. 50,770,651 1.53
284,639,894 8.57
Netherlands16,228 Adyen NV 144A(b) 31,798,195 0.96467,343 NXP Semiconductors NV 74,550,555 2.24
106,348,750 3.20
Russia975,328 Yandex NV �A� 67,970,608 2.05
Singapore426,356 Sea Ltd.—ADR(a) 76,317,724 2.30
South Korea183,341 Kakao Corp. 61,137,399 1.84173,158 NAVER Corp. 43,523,606 1.31320,749 Samsung Electro-Mechanics Co.,
Ltd. 45,361,719 1.37
150,022,724 4.52
Taiwan7,511,000 Delta Electronics, Inc. 59,227,140 1.78200,000 Largan Precision Co., Ltd. 22,666,050 0.68
3,278,000 MediaTek, Inc. 81,064,026 2.4412,620,000 Vanguard International
Semiconductor Corp. 46,532,454 1.404,001,000 Win Semiconductors Corp. 47,030,252 1.42
256,519,922 7.72
United States449,096 Akamai Technologies, Inc. 46,674,547 1.41345,494 Amphenol Corp. �A� 45,397,912 1.37228,790 Analog Devices, Inc. 31,788,083 0.96418,034 Applied Materials, Inc. 34,270,427 1.0317,372 Booking Holdings, Inc. 35,254,216 1.06
HoldingsSecurityDescription
Market ValueUSD
% ofShareholders’
Equity
Common Stocks – (Continued)United States – (Continued)
864,068 Cognizant Technology SolutionsCorp. �A� 67,500,992 2.03
63,428 Coupa Software, Inc. 21,204,615 0.64247,785 Cree, Inc. 22,887,901 0.69911,231 Dynatrace, Inc. 35,310,201 1.06316,970 Electronic Arts, Inc. 39,697,323 1.20140,210 EPAM Systems, Inc. 44,844,766 1.35232,384 Etsy, Inc. 36,972,294 1.11314,768 Expedia Group, Inc. 39,182,321 1.18159,188 F5 Networks, Inc. 25,869,642 0.78636,498 Fidelity National Information
Services, Inc. 93,724,331 2.82545,851 Fiserv, Inc. 62,439,896 1.88253,988 Global Payments, Inc. 49,545,439 1.49199,652 HubSpot, Inc. 78,794,658 2.37166,198 Intuit, Inc. 58,882,289 1.77
1,465,834 Juniper Networks, Inc. 32,028,473 0.961,670,094 Marvell Technology Group Ltd. 76,440,202 2.30521,942 Match Group, Inc. 72,106,287 2.17299,677 MKS Instruments, Inc. 41,445,329 1.25192,401 Motorola Solutions, Inc. 33,114,136 1.00
1,039,602 National Instruments Corp. 38,901,907 1.17211,416 Palo Alto Networks, Inc. 62,278,925 1.88210,569 Paylocity Holding Corp. 42,016,938 1.2780,579 Proofpoint, Inc. 8,475,299 0.26143,845 RingCentral, Inc. �A� 42,903,210 1.29158,183 SBA Communications Corp. 45,390,612 1.37183,671 ServiceNow, Inc. 97,892,970 2.95
2,120,529 Snap, Inc. �A� 96,590,096 2.91297,420 Splunk, Inc. 60,171,040 1.8188,399 Square, Inc. �A� 18,423,236 0.55
3,331,063 Viavi Solutions, Inc. 45,902,048 1.38124,200 WEX, Inc. 21,910,122 0.66351,748 Workday, Inc. �A� 78,397,594 2.36
1,784,630,277 53.74
TOTAL COMMON STOCKS(cost USD 2,432,787,958) 3,300,148,666 99.37
Mutual Funds – 0.00%Ireland
358 Goldman Sachs US$ TreasuryLiquid Reserves Fund (X DistributionClass)(c) 358 0.00
TOTAL MUTUAL FUNDS(cost USD 358) 358 0.00
TOTAL TRANSFERABLE SECURITIES ADMITTEDTO AN OFFICIAL EXCHANGE LISTING(cost USD 2,432,788,316) 3,300,149,024 99.37
MARKET VALUE OF INVESTMENTS(cost USD 2,432,788,316) 3,300,149,024 99.37
OTHER ASSETS AND LIABILITIES 20,706,459 0.63
SHAREHOLDERS’ EQUITY 3,320,855,483 100.00
TOTAL INVESTMENTSMarket Value
USD
% ofShareholders’
Equity
Total Investments (cost USD 2,432,788,316) 3,300,149,024 99.37Other Assets and Liabilities 20,706,459 0.63
Shareholders’ Equity 3,320,855,483 100.00(a) Security holding is traded/held in USD. (ADR: American Depositary Receipt/
GDR: Global Depositary Receipt).(b) 144A: This security is issued to qualified institutional investors, pursuant to private
placements, and is transferable as stated in rule 144A of the US Securities Act of1933.
(c) The yield for this fund as at 30 November 2020 was 0.120%.
Goldman Sachs Funds—Global Future Technology Leaders Equity PortfolioSchedule of InvestmentsAs at 30 November 2020
The accompanying notes are an integral part of these financial statements.
133

Allocation of Portfolio as at 30 November 2020
% ofShareholders’
Equity
Common StocksSoftware 28.50Internet 23.06Semiconductors 16.63Electronics 12.74Commercial Services 4.93Computers 3.38Telecommunications 3.34Electrical Components & Equipment 1.78Auto Parts & Equipment 1.59Real Estate Investment Trust 1.37Others 2.05
TOTAL COMMON STOCKS 99.37
Mutual Funds 0.00
Other Assets and Liabilities 0.63
TOTAL 100.00
Goldman Sachs Funds—Global Future Technology Leaders Equity PortfolioSchedule of InvestmentsAs at 30 November 2020
The accompanying notes are an integral part of these financial statements.
134

HoldingsSecurityDescription
Market ValueUSD
% ofShareholders’
Equity
Transferable securities admitted to an official exchange listing
Common Stocks – 96.34%Argentina
23,991 MercadoLibre, Inc. 36,754,212 2.78
Canada17,616 Shopify, Inc. �A� 18,732,326 1.42
China+ 518,918 Baozun, Inc.—ADR(a) 19,558,019 1.48
642,400 Meituan Dianping �B� 24,074,704 1.83224,719 NetEase, Inc.—ADR(a) 20,557,294 1.5686,414 New Oriental Education &
Technology Group, Inc.—ADR(a) 14,556,438 1.10869,500 Sunny Optical Technology Group
Co., Ltd. 17,117,822 1.30566,900 Tencent Holdings Ltd. 41,382,158 3.14
+ 199,080 XPeng, Inc.—ADR(a) 12,038,368 0.91
149,284,803 11.32
Germany405,082 CTS Eventim AG & Co. KGaA 24,757,424 1.88
Hong Kong6,720,000 Alibaba Health Information
Technology Ltd. 19,797,501 1.50
Ireland471,157 Experian Plc. 16,715,984 1.27
Italy1,135,162 Davide Campari-Milano NV 13,249,180 1.01541,755 Moncler SpA 26,832,809 2.03
40,081,989 3.04
Netherlands113,967 Koninklijke DSM NV 18,790,667 1.4390,444 NXP Semiconductors NV 14,427,627 1.09
33,218,294 2.52
Norway1,311,051 Adevinta ASA 21,643,182 1.64
Singapore159,149 Sea Ltd.—ADR(a) 28,487,671 2.16
South Korea71,562 NAVER Corp. 17,987,250 1.36
Spain1,210,131 EDP Renovaveis S.A. 25,896,768 1.96
Taiwan1,324,000 MediaTek, Inc. 32,742,151 2.482,589,000 Taiwan Semiconductor
Manufacturing Co., Ltd. 44,094,089 3.34
76,836,240 5.82
United Kingdom829,619 Ocado Group Plc. 24,541,035 1.86
United States32,426 Alphabet, Inc. �C� 57,476,382 4.3624,158 Amazon.com, Inc. 76,749,966 5.82136,278 American Tower Corp. 31,677,821 2.40386,031 Ball Corp. 37,333,058 2.8346,345 Beyond Meat, Inc. 6,474,860 0.49156,284 Electronic Arts, Inc. 19,573,008 1.48125,786 Etsy, Inc. 20,012,553 1.52161,968 Facebook, Inc. �A� 44,461,836 3.3796,889 Global Payments, Inc. 18,900,137 1.43178,435 Guardant Health, Inc. 21,215,922 1.6166,395 Illumina, Inc. 20,804,873 1.58552,718 Live Nation Entertainment, Inc. 36,772,329 2.79133,402 Mastercard, Inc. �A� 44,795,058 3.40231,464 Match Group, Inc. 31,976,752 2.42
HoldingsSecurityDescription
Market ValueUSD
% ofShareholders’
Equity
Common Stocks – (Continued)United States – (Continued)
566,073 NextEra Energy, Inc. 42,347,921 3.21286,660 NIKE, Inc. �B� 38,412,440 2.9190,669 PayPal Holdings, Inc. 19,102,145 1.45889,183 Slack Technologies, Inc. �A� 37,425,712 2.84805,908 Snap, Inc. �A� 36,709,109 2.78198,000 T-Mobile US, Inc. 25,916,220 1.96102,786 Ulta Beauty, Inc. 28,793,442 2.18267,296 Walt Disney Co. 39,276,474 2.98
736,208,018 55.81
TOTAL COMMON STOCKS(cost USD 1,012,042,817) 1,270,942,697 96.34
Mutual Funds – 4.51%Ireland
59,434,555 Goldman Sachs US$ TreasuryLiquid Reserves Fund (X DistributionClass)(b)(c) 59,434,555 4.51
TOTAL MUTUAL FUNDS(cost USD 59,434,555) 59,434,555 4.51
TOTAL TRANSFERABLE SECURITIES ADMITTEDTO AN OFFICIAL EXCHANGE LISTING(cost USD 1,071,477,372) 1,330,377,252 100.85
MARKET VALUE OF INVESTMENTS(cost USD 1,071,477,372) 1,330,377,252 100.85
OTHER ASSETS AND LIABILITIES (11,220,147) (0.85)
SHAREHOLDERS’ EQUITY 1,319,157,105 100.00
TOTAL INVESTMENTSMarket Value
USD
% ofShareholders’
Equity
Total Investments (cost USD 1,071,477,372) 1,330,377,252 100.85Other Assets and Liabilities (11,220,147) (0.85)
Shareholders’ Equity 1,319,157,105 100.00+ A portion of these securities were on loan at 30 November 2020. See Note 6.(a) Security holding is traded/held in USD. (ADR: American Depositary Receipt/
GDR: Global Depositary Receipt).(b) A related party to Goldman Sachs Funds.(c) The yield for this fund as at 30 November 2020 was 0.120%.
Allocation of Portfolio as at 30 November 2020
% ofShareholders’
Equity
Common StocksInternet 33.92Software 8.04Semiconductors 6.91Retail 5.71Commercial Services 5.25Electric 5.17Entertainment 4.67Diversified Financial Services 3.40Food, Beverages & Tobacco 3.36Biotechnology 3.19Others 16.72
TOTAL COMMON STOCKS 96.34
Mutual Funds 4.51
Other Assets and Liabilities (0.85)
TOTAL 100.00
Goldman Sachs Funds—Global Millennials Equity PortfolioSchedule of InvestmentsAs at 30 November 2020
The accompanying notes are an integral part of these financial statements.
135

HoldingsSecurityDescription
Market ValueUSD
% ofShareholders’
Equity
Transferable securities admitted to an official exchange listing
Common Stocks – 99.65%India
89,716 Abbott India Ltd. 18,662,943 1.26301,374 AIA Engineering Ltd. 7,558,306 0.51991,520 Alembic Pharmaceuticals Ltd. 13,370,493 0.90330,921 Amber Enterprises India Ltd. 10,740,830 0.73653,562 Angel Broking Ltd. 3,157,660 0.21854,635 Apar Industries Ltd. 4,027,582 0.27419,621 APL Apollo Tubes Ltd. 19,163,660 1.29346,870 Apollo Hospitals Enterprise Ltd. 10,997,263 0.74173,831 Atul Ltd. 14,810,194 1.00675,337 Avenue Supermarts Ltd. 20,875,773 1.41
8,521,533 Axis Bank Ltd. 69,294,365 4.681,655,000 Bajaj Consumer Care Ltd. 4,565,586 0.31139,585 Bajaj Finserv Ltd. 16,541,886 1.12
4,333,235 Balrampur Chini Mills Ltd. 9,625,757 0.653,716,828 Bharti Airtel Ltd. 23,253,009 1.571,199,233 Capacit’e Infraprojects Ltd. 2,966,657 0.20394,230 Coforge Ltd. 12,781,350 0.86368,596 Computer Age Management
Services Ltd. 7,192,864 0.493,372,340 Crompton Greaves Consumer
Electricals Ltd. 13,902,613 0.942,936,041 Delta Corp., Ltd. 5,148,312 0.35586,242 Divi’s Laboratories Ltd. 28,562,906 1.93111,792 Dixon Technologies India Ltd. 17,952,729 1.21481,324 Escorts Ltd. 9,127,749 0.62346,115 Fine Organic Industries Ltd. 12,041,628 0.81428,520 Gland Pharma Ltd. 12,226,689 0.83
1,219,487 Godrej Properties Ltd. 19,204,155 1.30398,257 Goodyear India Ltd. 4,416,381 0.30
1,722,906 Graphite India Ltd. 5,689,931 0.381,034,082 Grindwell Norton Ltd. 8,357,465 0.563,079,177 Gujarat Gas Ltd. 14,513,515 0.981,505,475 Happiest Minds Technologies Ltd. 6,382,228 0.433,806,468 HCL Technologies Ltd. 42,253,231 2.861,880,949 HDFC Bank Ltd. 36,621,033 2.47357,018 Hero MotoCorp Ltd. 15,006,079 1.01
1,499,295 Hindustan Unilever Ltd. 43,322,857 2.9316,757,004 ICICI Bank Ltd. 107,706,811 7.28917,834 ICICI Lombard General Insurance
Co., Ltd. 144A(a) 17,990,039 1.22623,705 Info Edge India Ltd. 36,269,793 2.45
4,134,112 Infosys Ltd. 61,683,896 4.174,752,364 Infosys Ltd.—ADR(b) 71,237,936 4.81457,180 InterGlobe Aviation Ltd. 144A(a) 9,375,192 0.63927,874 Ipca Laboratories Ltd. 27,168,333 1.84975,423 ISGEC Heavy Engineering Ltd. 3,374,974 0.23402,813 JK Cement Ltd. 11,049,624 0.75437,050 Jubilant Foodworks Ltd. 14,773,586 1.00
1,362,000 Kajaria Ceramics Ltd. 11,916,019 0.801,472,757 KEI Industries Ltd. 8,451,459 0.572,687,901 Kolte-Patil Developers Ltd. 7,699,361 0.521,424,768 Kotak Mahindra Bank Ltd. 36,727,566 2.48356,330 L&T Technology Services Ltd.
144A(a) 8,297,067 0.56310,612 Larsen & Toubro Infotech Ltd.
144A(a) 13,425,260 0.911,265,614 Lupin Ltd. 15,251,534 1.031,738,768 Mahindra Logistics Ltd. 144A(a) 9,273,038 0.632,730,462 Marico Ltd. 13,558,698 0.92414,868 Maruti Suzuki India Ltd. 39,475,873 2.672,424 MRF Ltd. 2,546,924 0.17
649,790 Muthoot Finance Ltd. 10,115,830 0.68833,811 Navin Fluorine International Ltd. 30,268,521 2.05
2,678,786 Newgen Software Technologies Ltd. 9,826,798 0.661,503,925 Oberoi Realty Ltd. 9,427,062 0.644,407,843 PNC Infratech Ltd. 10,177,269 0.692,576,734 Prestige Estates Projects Ltd. 9,316,025 0.631,368,423 Quess Corp., Ltd. 144A(a) 9,271,110 0.632,816,515 Reliance Industries Ltd. 73,486,464 4.97
HoldingsSecurityDescription
Market ValueUSD
% ofShareholders’
Equity
Common Stocks – (Continued)India – (Continued)
666,135 Rossari Biotech Ltd. 7,212,181 0.49874,445 Route Mobile Ltd. 12,448,425 0.84857,312 SBI Cards & Payment Services Ltd. 9,263,014 0.63
1,816,250 SBI Life Insurance Co., Ltd. 144A(a) 20,749,610 1.402,201,361 Sonata Software Ltd. 10,150,075 0.69756,395 Spandana Sphoorty Financial Ltd. 7,665,163 0.52911,341 Sudarshan Chemical Industries 5,792,554 0.3981,681 Sundram Fasteners Ltd. 576,054 0.04
1,880,000 Syngene International Ltd. 144A(a) 14,681,365 0.993,099,446 Tata Consumer Products Ltd. 22,519,464 1.52362,602 TeamLease Services Ltd. 12,252,465 0.83298,017 Torrent Pharmaceuticals Ltd. 10,523,343 0.71785,616 Trent Ltd. 7,645,884 0.52428,727 Tube Investments of India Ltd. 4,774,700 0.32
6,616,984 Ujjivan Small Finance Bank Ltd.144A(a) 3,379,287 0.23
423,782 UltraTech Cement Ltd. 27,504,684 1.86106,502 Valiant Organics Ltd. 144A(a) 4,506,137 0.30647,839 Vinati Organics Ltd. 10,312,221 0.70
1,525,124 Voltas Ltd. 16,624,381 1.123,136,994 Welspun Corp., Ltd. 5,011,060 0.34255,324 Whirlpool of India Ltd. 7,539,769 0.51
1,474,589,577 99.65
TOTAL COMMON STOCKS(cost USD 1,032,457,804) 1,474,589,577 99.65
TOTAL TRANSFERABLE SECURITIES ADMITTEDTO AN OFFICIAL EXCHANGE LISTING(cost USD 1,032,457,804) 1,474,589,577 99.65
MARKET VALUE OF INVESTMENTS EXCLUDINGDERIVATIVES(cost USD 1,032,457,804) 1,474,589,577 99.65
Futures Contracts – (0.00%)
Number ofContracts Security Description
CommitmentMarketValueUSD
UnrealisedLossUSD
% ofShareholders’
Equity
USD280 SGX Nifty 50 Index
Futures 31/12/2020Long 7,318,080 (19,263) (0.00)
UNREALISED LOSS ON FUTURES CONTRACTS (19,263) (0.00)
MARKET VALUE OF INVESTMENTS(cost USD 1,032,457,804)
1,474,570,314 99.65
OTHER ASSETS AND LIABILITIES 5,118,668 0.35
SHAREHOLDERS’ EQUITY 1,479,688,982 100.00
TOTAL INVESTMENTSMarket Value
USD
% ofShareholders’
Equity
Total Investments excluding derivatives (costUSD 1,032,457,804) 1,474,589,577 99.65
Unrealised loss on futures contracts (19,263) (0.00)Other Assets and Liabilities 5,118,668 0.35
Shareholders’ Equity 1,479,688,982 100.00
Goldman Sachs Funds—India Equity PortfolioSchedule of InvestmentsAs at 30 November 2020
The accompanying notes are an integral part of these financial statements.
136

The Futures Commission Merchant was Goldman Sachs & Co. LLC.
The maximum individual counterparty exposure as at 30 November 2020 is 0.00% of theNAV.
(a) 144A: This security is issued to qualified institutional investors, pursuant to privateplacements, and is transferable as stated in rule 144A of the US Securities Act of1933.
(b) Security holding is traded/held in USD. (ADR: American Depositary Receipt/GDR: Global Depositary Receipt).
Allocation of Portfolio as at 30 November 2020
% ofShareholders’
Equity
Common StocksBanks 17.14Computers 11.18Pharmaceuticals 8.50Building Materials 5.82Chemicals 5.74Oil & Gas 4.97Food, Beverages & Tobacco 4.50Insurance 3.74Software 3.55Internet 3.28Others 31.23
TOTAL COMMON STOCKS 99.65
Unrealised Loss on Futures Contracts (0.00)
Other Assets and Liabilities 0.35
TOTAL 100.00
Goldman Sachs Funds—India Equity PortfolioSchedule of InvestmentsAs at 30 November 2020
The accompanying notes are an integral part of these financial statements.
137

HoldingsSecurityDescription
Market Value(’000) JPY
% ofShareholders’
Equity
Transferable securities admitted to an official exchange listing
Common Stocks – 97.48%Japan
859,400 Advantest Corp. 6,267,558 3.511,711,800 AGC, Inc. 5,977,462 3.35805,000 Chugai Pharmaceutical Co., Ltd. 4,078,716 2.29269,300 Daifuku Co., Ltd. 3,268,315 1.83176,800 Daikin Industries Ltd. 4,208,691 2.36558,800 Fancl Corp. 2,378,547 1.3332,500 Fast Retailing Co., Ltd. 2,802,482 1.57485,700 Hamamatsu Photonics KK 2,862,389 1.60102,700 Hikari Tsushin, Inc. 2,584,777 1.45826,800 Hoya Corp. 11,524,894 6.4672,900 Keyence Corp. 3,895,349 2.18258,500 Kikkoman Corp. 1,685,231 0.94
1,610,200 Kurita Water Industries Ltd. 6,219,325 3.48945,000 Nidec Corp. 12,607,739 7.06327,100 Nitori Holdings Co., Ltd. 7,278,683 4.08550,000 Nomura Research Institute Ltd. 1,940,762 1.09344,900 Obic Co., Ltd. 8,105,901 4.54
2,529,700 Olympus Corp. 5,733,070 3.212,659,600 ORIX Corp. 4,154,819 2.331,080,600 Otsuka Corp. 5,480,964 3.073,496,600 Pan Pacific International Holdings
Corp. 8,648,445 4.841,651,700 Recruit Holdings Co., Ltd. 7,286,252 4.08616,400 Shin-Etsu Chemical Co., Ltd. 10,587,542 5.9354,600 SMC Corp. 3,639,192 2.04713,400 SoftBank Group Corp. 5,204,218 2.92833,600 Sony Corp. 8,140,670 4.56669,400 TDK Corp. 9,905,132 5.55583,000 Terumo Corp. 2,426,695 1.36
1,436,500 Tokio Marine Holdings, Inc. 7,493,644 4.20545,700 Trend Micro, Inc. 3,103,853 1.74384,900 Unicharm Corp. 1,953,303 1.09
3,901,500 Z Holdings Corp. 2,572,013 1.44
174,016,633 97.48
TOTAL COMMON STOCKS(cost (’000) JPY 134,653,794) 174,016,633 97.48
Mutual Funds – 0.88%Ireland
158,504 Goldman Sachs - Yen LiquidReserves Fund (X AccumulationClass)(a)(b) 1,579,055 0.88
TOTAL MUTUAL FUNDS(cost (’000) JPY 1,579,098) 1,579,055 0.88
TOTAL TRANSFERABLE SECURITIES ADMITTEDTO AN OFFICIAL EXCHANGE LISTING(cost (’000) JPY 136,232,892) 175,595,688 98.36
MARKET VALUE OF INVESTMENTS EXCLUDINGDERIVATIVES(cost (’000) JPY 136,232,892) 175,595,688 98.36
Share Class Specific Forward Currency Contracts – 0.05%
CurrencyAmountBought Currency
AmountSold
MaturityDate
UnrealisedGain(’000)JPY
% ofShareholders’
Equity
CHF 486,726 JPY 55,945,490 10/12/2020 202 0.00JPY 434,156,781 USD 4,141,406 23/12/2020 2,600 0.00GBP 63,597,377 JPY 8,621,297,024 13/01/2021 242,883 0.14EUR 57,955,155 JPY 7,141,042,374 21/01/2021 110,299 0.06
UNREALISED GAIN ON FORWARD CURRENCYCONTRACTS HELD FOR HEDGING PURPOSES 355,984 0.20
Share Class Specific Forward Currency Contracts – (Continued)
CurrencyAmountBought Currency
AmountSold
MaturityDate
UnrealisedLoss(’000)JPY
% ofShareholders’
Equity
JPY 3,207,188 CHF 28,000 10/12/2020 (24) (0.00)USD 183,629,135 JPY 19,393,328,429 23/12/2020 (258,199) (0.14)JPY 601,391,639 GBP 4,398,572 13/01/2021 (11,679) (0.01)JPY 103,666,559 EUR 835,000 21/01/2021 (808) (0.00)
UNREALISED LOSS ON FORWARD CURRENCYCONTRACTS HELD FOR HEDGING PURPOSES (270,710) (0.15)
MARKET VALUE OF INVESTMENTS(cost (’000) JPY 136,232,892) 175,680,962 98.41
OTHER ASSETS AND LIABILITIES 2,836,332 1.59
SHAREHOLDERS’ EQUITY 178,517,294 100.00
TOTAL INVESTMENTSMarket Value(’000) JPY
% ofShareholders’
Equity
Total Investments excluding derivatives (cost (’000) JPY136,232,892) 175,595,688 98.36
Unrealised gain on forward currency contracts held for hedgingpurposes 355,984 0.20
Unrealised loss on forward currency contracts held for hedgingpurposes (270,710) (0.15)
Other Assets and Liabilities 2,836,332 1.59
Shareholders’ Equity 178,517,294 100.00
The counterparties for forward currency contracts were Barclays Bank Plc., BNP ParibasS.A., Citibank N.A., Credit Suisse International, Deutsche Bank AG, JP Morgan ChaseBank N.A., Morgan Stanley & Co. International Plc., Natwest Markets Plc., Royal Bank ofCanada, Standard Chartered Bank, State Street Bank & Trust and UBS AG.
The maximum individual counterparty exposure as at 30 November 2020 is 0.09% of theNAV.
(a) A related party to Goldman Sachs Funds.(b) The yield for this fund as at 30 November 2020 was (0.202%).
Allocation of Portfolio as at 30 November 2020
% ofShareholders’
Equity
Common StocksElectronics 22.14Retail 10.49Machinery—Diversified 6.05Chemicals 5.93Building Materials 5.71Computers 5.63Semiconductors 5.11Healthcare Products 4.57Home Furnishings 4.56Telecommunications 4.37Others 22.92
TOTAL COMMON STOCKS 97.48
Mutual Funds 0.88
Unrealised Gain on Forward Currency Contracts Held for HedgingPurposes
0.20
Unrealised Loss on Forward Currency Contracts Held for HedgingPurposes
(0.15)
Other Assets and Liabilities 1.59
TOTAL 100.00
Goldman Sachs Funds—Japan Equity Partners PortfolioSchedule of InvestmentsAs at 30 November 2020
The accompanying notes are an integral part of these financial statements.
138

HoldingsSecurityDescription
Market Value(’000) JPY
% ofShareholders’
Equity
Transferable securities admitted to an official exchange listing
Common Stocks – 96.88%Japan
323,200 Advantest Corp. 2,357,080 1.87609,400 AGC, Inc. 2,127,974 1.6988,000 Ariake Japan Co., Ltd. 608,647 0.48
+ 286,700 Aruhi Corp. 554,977 0.44132,800 Bandai Namco Holdings, Inc. 1,265,535 1.00256,900 Bell System24 Holdings, Inc. 413,864 0.33582,400 Chugai Pharmaceutical Co., Ltd. 2,950,863 2.34223,900 COMSYS Holdings Corp. 693,949 0.5578,300 Daifuku Co., Ltd. 950,275 0.75603,600 Daiichi Sankyo Co., Ltd. 2,238,889 1.77110,200 Daikin Industries Ltd. 2,623,290 2.08144,600 Fancl Corp. 615,494 0.4913,300 Fast Retailing Co., Ltd. 1,146,862 0.91466,700 Fuji Corp. Via Aichi 1,185,167 0.9477,500 Fujitsu Ltd. 1,128,484 0.89104,100 Goldwin, Inc. 733,716 0.58158,400 Hamamatsu Photonics KK 933,503 0.7434,100 Hikari Tsushin, Inc. 858,236 0.68389,300 Hitachi Ltd. 1,553,101 1.23265,800 Hoya Corp. 3,705,027 2.94599,300 IBJ, Inc. 461,100 0.3789,800 Infocom Corp. 329,526 0.26719,400 ITOCHU Corp. 1,994,373 1.58112,100 JCR Pharmaceuticals Co., Ltd. 305,804 0.24
+ 127,000 JMDC, Inc. 673,871 0.53150,900 Katitas Co., Ltd. 469,448 0.37347,200 KDDI Corp. 1,037,423 0.8229,200 Keyence Corp. 1,560,277 1.2494,100 Kikkoman Corp. 613,463 0.49584,300 Kubota Corp. 1,213,475 0.96134,900 Kureha Corp. 718,184 0.57577,100 Kurita Water Industries Ltd. 2,229,023 1.77299,000 Kyoritsu Maintenance Co., Ltd. 1,091,504 0.87214,200 Mabuchi Motor Co., Ltd. 1,002,930 0.79147,900 Maruwa Unyu Kikan Co., Ltd. 685,308 0.54
1,119,500 Mitsubishi Estate Co., Ltd. 2,028,014 1.61128,500 Morinaga Milk Industry Co., Ltd. 651,955 0.52302,300 NET One Systems Co., Ltd. 1,126,433 0.89499,000 Nichirei Corp. 1,419,213 1.12378,800 Nidec Corp. 5,053,769 4.00368,600 Nifco, Inc. 1,359,584 1.08144,300 Nitori Holdings Co., Ltd. 3,210,987 2.54327,400 Nomura Research Institute Ltd. 1,155,283 0.9298,900 Obic Co., Ltd. 2,324,365 1.84864,200 Olympus Corp. 1,958,540 1.55722,500 ORIX Corp. 1,128,687 0.89416,300 Otsuka Corp. 2,111,536 1.67
1,158,700 Pan Pacific International HoldingsCorp. 2,865,914 2.27
815,900 Recruit Holdings Co., Ltd. 3,599,233 2.85+ 259,700 Retty, Inc. 450,579 0.36
448,400 Rohto Pharmaceutical Co., Ltd. 1,540,952 1.2228,500 SHIFT, Inc. 441,917 0.35265,000 Shin-Etsu Chemical Co., Ltd. 4,551,750 3.6118,900 SMC Corp. 1,259,720 1.00432,500 SoftBank Group Corp. 3,155,066 2.50551,700 Sony Corp. 5,387,725 4.27416,300 Subaru Corp. 868,533 0.69469,000 Sumitomo Metal Mining Co., Ltd. 1,832,158 1.45521,000 Sumitomo Mitsui Financial Group,
Inc. 1,579,070 1.25518,500 Sumitomo Mitsui Trust Holdings, Inc. 1,591,688 1.26146,700 Sumitomo Realty & Development
Co., Ltd. 501,272 0.40263,400 Suntory Beverage & Food Ltd. 1,009,167 0.80173,700 Taiyo Yuden Co., Ltd. 826,618 0.66237,500 TDK Corp. 3,514,295 2.78211,400 Terumo Corp. 879,937 0.70616,100 Tokai Carbon Co., Ltd. 709,369 0.56
HoldingsSecurityDescription
Market Value(’000) JPY
% ofShareholders’
Equity
Common Stocks – (Continued)Japan – (Continued)
682,000 Tokio Marine Holdings, Inc. 3,557,720 2.8253,300 Tokyo Electron Ltd. 1,899,811 1.51107,700 Tokyo Ohka Kogyo Co., Ltd. 711,661 0.56146,700 Tokyotokeiba Co., Ltd. 760,329 0.60493,200 Tokyu Corp. 627,263 0.50563,300 Toyota Motor Corp. 3,972,252 3.15275,500 Toyota Tsusho Corp. 1,000,573 0.79136,400 Trend Micro, Inc. 775,821 0.61108,700 Unicharm Corp. 551,634 0.44255,800 ValueCommerce Co., Ltd. 890,377 0.71251,800 Welcia Holdings Co., Ltd. 1,057,573 0.8498,500 Yamaha Corp. 590,078 0.47460,000 YA-MAN Ltd. 1,073,498 0.85
2,527,100 Z Holdings Corp. 1,665,958 1.32
122,258,519 96.88
TOTAL COMMON STOCKS(cost (’000) JPY 99,175,984) 122,258,519 96.88
Mutual Funds – 1.24%Ireland
157,317 Goldman Sachs - Yen LiquidReserves Fund (X AccumulationClass)(a)(b) 1,567,227 1.24
TOTAL MUTUAL FUNDS(cost (’000) JPY 1,567,375) 1,567,227 1.24
TOTAL TRANSFERABLE SECURITIES ADMITTEDTO AN OFFICIAL EXCHANGE LISTING(cost (’000) JPY 100,743,359) 123,825,746 98.12
MARKET VALUE OF INVESTMENTS EXCLUDINGDERIVATIVES(cost (’000) JPY 100,743,359) 123,825,746 98.12
Share Class Specific Forward Currency Contracts – 0.36%
CurrencyAmountBought Currency
AmountSold
MaturityDate
UnrealisedGain(’000)JPY
% ofShareholders’
Equity
SEK 7,554,447 JPY 89,864,846 10/12/2020 2,978 0.00JPY 106,523,205 USD 1,017,625 23/12/2020 481 0.00GBP 78,068,664 JPY 10,577,106,352 13/01/2021 304,076 0.24EUR 98,128,589 JPY 12,088,622,846 21/01/2021 189,213 0.15
UNREALISED GAIN ON FORWARD CURRENCYCONTRACTS HELD FOR HEDGING PURPOSES 496,748 0.39
CurrencyAmountBought Currency
AmountSold
MaturityDate
UnrealisedLoss(’000)JPY
% ofShareholders’
Equity
JPY 9,132,788 SEK 753,860 10/12/2020 (132) (0.00)USD 20,342,318 JPY 2,150,879,440 23/12/2020 (31,103) (0.03)JPY 714,765,518 GBP 5,216,713 13/01/2021 (12,336) (0.00)JPY 186,730,735 EUR 1,502,000 21/01/2021 (1,200) (0.00)
UNREALISED LOSS ON FORWARD CURRENCYCONTRACTS HELD FOR HEDGING PURPOSES (44,771) (0.03)
MARKET VALUE OF INVESTMENTS(cost (’000) JPY 100,743,359) 124,277,723 98.48
OTHER ASSETS AND LIABILITIES 1,918,139 1.52
SHAREHOLDERS’ EQUITY 126,195,862 100.00
Goldman Sachs Funds—Japan Equity PortfolioSchedule of InvestmentsAs at 30 November 2020
The accompanying notes are an integral part of these financial statements.
139

TOTAL INVESTMENTSMarket Value(’000) JPY
% ofShareholders’
Equity
Total Investments excluding derivatives (cost (’000) JPY100,743,359) 123,825,746 98.12
Unrealised gain on forward currency contracts held for hedgingpurposes 496,748 0.39
Unrealised loss on forward currency contracts held for hedgingpurposes (44,771) (0.03)
Other Assets and Liabilities 1,918,139 1.52
Shareholders’ Equity 126,195,862 100.00
The counterparties for forward currency contracts were Barclays Bank Plc., BNP ParibasS.A., Citibank N.A., Deutsche Bank AG, HSBC Bank Plc., JP Morgan Chase Bank N.A.,Morgan Stanley & Co. International Plc., Natwest Markets Plc., Royal Bank of Canada,Standard Chartered Bank, State Street Bank & Trust and UBS AG.
The maximum individual counterparty exposure as at 30 November 2020 is 0.19% of theNAV.
+ A portion of these securities were on loan at 30 November 2020. See Note 6.(a) A related party to Goldman Sachs Funds.(b) The yield for this fund as at 30 November 2020 was (0.202%).
Allocation of Portfolio as at 30 November 2020
% ofShareholders’
Equity
Common StocksElectronics 12.05Retail 7.14Semiconductors 5.62Computers 5.48Pharmaceuticals 5.33Chemicals 4.74Home Furnishings 4.27Building Materials 4.14Telecommunications 4.00Machinery—Diversified 3.95Others 40.16
TOTAL COMMON STOCKS 96.88
Mutual Funds 1.24
Unrealised Gain on Forward Currency Contracts Held for HedgingPurposes
0.39
Unrealised Loss on Forward Currency Contracts Held for HedgingPurposes
(0.03)
Other Assets and Liabilities 1.52
TOTAL 100.00
Goldman Sachs Funds—Japan Equity PortfolioSchedule of InvestmentsAs at 30 November 2020
The accompanying notes are an integral part of these financial statements.
140

HoldingsSecurityDescription
Market ValueUSD
% ofShareholders’
Equity
Transferable securities admitted to an official exchange listing
Common Stocks – 99.18%Denmark
87,880 Genmab A/S—ADR(a) 3,357,016 0.47
Ireland28,048 Accenture Plc. �A� 6,980,025 0.9838,600 Aptiv Plc. 4,681,022 0.6628,943 Trane Technologies Plc. 4,130,166 0.58
15,791,213 2.22
Netherlands24,878 NXP Semiconductors NV 3,968,539 0.56
United Kingdom57,306 Coca-Cola European Partners Plc. 2,566,736 0.36
United States16,951 Adobe, Inc. 8,063,591 1.1319,805 Advance Auto Parts, Inc. 2,945,202 0.41157,562 AES Corp. 3,310,378 0.4738,486 Agilent Technologies, Inc. 4,413,959 0.6231,219 Akamai Technologies, Inc. 3,244,591 0.4636,552 Allstate Corp. 3,784,594 0.538,531 Alphabet, Inc. �A� 15,073,253 2.126,831 Alphabet, Inc. �C� 12,108,221 1.708,814 Amazon.com, Inc. 28,002,078 3.9438,745 Ameren Corp. 3,044,970 0.4344,020 American Express Co. 5,322,458 0.7543,297 American Financial Group, Inc. 4,013,199 0.5622,831 American Water Works Co., Inc. 3,528,759 0.50378,688 Apple, Inc. 45,063,872 6.34126,548 Aramark 4,508,905 0.6361,487 AT&T, Inc. 1,771,440 0.2520,787 AvalonBay Communities, Inc. 3,475,794 0.49165,607 Baker Hughes Co. 3,255,834 0.4639,741 Ball Corp. 3,843,352 0.5444,318 Bank of America Corp. 1,275,472 0.1829,405 Berkshire Hathaway, Inc. �B� 6,764,914 0.9517,092 Biogen, Inc. 4,114,728 0.5839,949 BioMarin Pharmaceutical, Inc. 3,191,526 0.4535,803 Booz Allen Hamilton Holding Corp. 3,130,614 0.44125,464 Boston Scientific Corp. 4,167,914 0.59105,696 Bristol-Myers Squibb Co. 6,662,019 0.9434,045 Cadence Design Systems, Inc. 3,981,903 0.5638,648 Cboe Global Markets, Inc. 3,493,393 0.4961,082 Centene Corp. 3,856,107 0.5451,527 Cheniere Energy, Inc. 3,039,062 0.4378,178 Chevron Corp. 7,082,927 1.0034,801 Church & Dwight Co., Inc. 3,002,282 0.4250,822 CMS Energy Corp. 3,140,800 0.4489,889 Coca-Cola Co. 4,624,789 0.6557,653 Cognizant Technology Solutions
Corp. �A� 4,503,852 0.63160,503 Comcast Corp. �A� 8,239,422 1.1615,815 Constellation Brands, Inc. �A� 3,230,372 0.4510,359 Cooper Cos., Inc. 3,486,011 0.4955,289 CSX Corp. 5,068,896 0.7116,820 Cummins, Inc. 3,834,960 0.5475,356 CVS Health Corp. 5,125,715 0.7229,663 Danaher Corp. 6,570,354 0.9258,177 Discover Financial Services 4,555,259 0.6420,466 Dollar General Corp. 4,438,257 0.6276,852 East West Bancorp, Inc. 3,365,349 0.4737,388 Eaton Corp. Plc. 4,518,340 0.6419,198 Ecolab, Inc. 4,256,197 0.6021,477 Electronic Arts, Inc. 2,689,779 0.3843,460 Eli Lilly & Co. 6,413,827 0.9040,098 Equity LifeStyle Properties, Inc. 2,351,748 0.3313,752 Essex Property Trust, Inc. 3,417,510 0.4816,009 Estee Lauder Cos., Inc. �A� 3,894,670 0.5526,175 Extra Space Storage, Inc. 2,883,438 0.4162,581 Facebook, Inc. �A� 17,179,110 2.42
HoldingsSecurityDescription
Market ValueUSD
% ofShareholders’
Equity
Common Stocks – (Continued)United States – (Continued)
81,747 Fastenal Co. 3,999,881 0.5635,255 Fidelity National Information
Services, Inc. 5,191,299 0.7345,518 Fortive Corp. 3,188,536 0.4536,611 Globe Life, Inc. 3,482,438 0.4950,736 Graco, Inc. 3,432,798 0.4849,351 Hologic, Inc. 3,413,609 0.4813,372 Home Depot, Inc. 3,657,509 0.5134,102 Honeywell International, Inc. 7,022,625 0.9910,404 Humana, Inc. 4,214,660 0.5917,556 Huntington Ingalls Industries, Inc. 2,865,841 0.4018,190 IDEX Corp. 3,478,838 0.4921,218 Illinois Tool Works, Inc. 4,464,267 0.6335,285 Intel Corp. 1,682,036 0.2415,738 Intuit, Inc. 5,575,816 0.7891,381 Invitation Homes, Inc. 2,629,031 0.3746,152 ITT, Inc. 3,440,170 0.4838,785 Johnson & Johnson 5,588,143 0.7999,019 JP Morgan Chase & Co. 11,895,152 1.67137,838 Juniper Networks, Inc. 3,011,760 0.4211,499 Lam Research Corp. 5,217,211 0.7338,372 Lamb Weston Holdings, Inc. 2,771,610 0.3943,673 Lennar Corp. �A� 3,337,927 0.4760,104 Liberty Media Corp-Liberty SiriusXM
�A� 2,477,787 0.3536,091 Lowe’s Cos., Inc. 5,497,562 0.7731,694 M&T Bank Corp. 3,806,132 0.5413,722 Martin Marietta Materials, Inc. 3,651,836 0.5110,191 Mastercard, Inc. �A� 3,422,036 0.4818,563 Match Group, Inc. 2,564,478 0.3614,828 McCormick & Co., Inc. 2,755,784 0.3931,306 McDonald’s Corp. 6,758,339 0.9520,157 Merck & Co., Inc. 1,611,149 0.233,395 Mettler-Toledo International, Inc. 3,836,350 0.54
191,933 Microsoft Corp. 41,096,694 5.7824,071 MKS Instruments, Inc. 3,329,019 0.4773,818 Mondelez International, Inc. �A� 4,217,222 0.5940,589 Monster Beverage Corp. 3,410,694 0.4821,921 Motorola Solutions, Inc. 3,772,823 0.5375,438 NetApp, Inc. 3,991,425 0.564,150 Netflix, Inc. 2,030,844 0.2934,265 Neurocrine Biosciences, Inc. 3,302,118 0.467,407 NVIDIA Corp. 3,951,857 0.5616,835 Old Dominion Freight Line, Inc. 3,394,946 0.487,580 O’Reilly Automotive, Inc. 3,323,299 0.4727,045 Packaging Corp. of America 3,561,827 0.5011,444 Palo Alto Networks, Inc. 3,371,174 0.4711,072 PayPal Holdings, Inc. 2,332,649 0.3347,708 Pfizer, Inc. 1,816,721 0.2659,555 Phillips 66 3,812,116 0.5429,387 PRA Health Sciences, Inc. 3,259,018 0.4673,985 Procter & Gamble Co. 10,192,174 1.4327,386 Proofpoint, Inc. 2,880,459 0.4161,660 Public Service Enterprise Group,
Inc. 3,623,758 0.5155,377 PVH Corp. 4,550,882 0.6427,473 Quest Diagnostics, Inc. 3,442,642 0.4840,387 Raymond James Financial, Inc. 3,748,721 0.5328,031 Reinsurance Group of America, Inc. 3,334,568 0.4714,992 Rockwell Automation, Inc. 3,787,579 0.5313,588 S&P Global, Inc. 4,743,707 0.675,074 Salesforce.com, Inc. 1,216,187 0.1723,037 Sarepta Therapeutics, Inc. 3,210,436 0.4511,472 SBA Communications Corp. 3,291,890 0.4627,270 Sempra Energy 3,540,464 0.505,880 Sherwin-Williams Co. 4,337,147 0.6110,672 SVB Financial Group 3,732,852 0.5341,460 Texas Instruments, Inc. 6,631,527 0.9314,732 Ulta Beauty, Inc. 4,126,875 0.5811,501 UnitedHealth Group, Inc. 3,883,543 0.5518,478 Verisk Analytics, Inc. 3,704,654 0.52
Goldman Sachs Funds—US Equity PortfolioSchedule of InvestmentsAs at 30 November 2020
The accompanying notes are an integral part of these financial statements.
141

HoldingsSecurityDescription
Market ValueUSD
% ofShareholders’
Equity
Common Stocks – (Continued)United States – (Continued)
98,644 Verizon Communications, Inc. 5,947,247 0.8454,625 Visa, Inc. �A� 11,426,457 1.61102,482 Vontier Corp. 3,414,188 0.4849,332 Walmart, Inc. 7,458,998 1.0555,376 Walt Disney Co. 8,136,949 1.15230,482 Wells Fargo & Co. 6,444,277 0.9112,770 West Pharmaceutical Services, Inc. 3,527,713 0.5012,953 Workday, Inc. �A� 2,886,965 0.4137,474 Yum! Brands, Inc. 3,962,875 0.5625,994 Zimmer Biomet Holdings, Inc. 3,888,702 0.55
679,317,458 95.57
TOTAL COMMON STOCKS(cost USD 521,056,976) 705,000,962 99.18
TOTAL TRANSFERABLE SECURITIES ADMITTEDTO AN OFFICIAL EXCHANGE LISTING(cost USD 521,056,976) 705,000,962 99.18
MARKET VALUE OF INVESTMENTS EXCLUDINGDERIVATIVES(cost USD 521,056,976) 705,000,962 99.18
Share Class Specific Forward Currency Contracts – 0.34%
CurrencyAmountBought Currency
AmountSold
MaturityDate
UnrealisedGainUSD
% ofShareholders’
Equity
EUR 142,492,514 USD 168,739,093 21/01/2021 2,448,387 0.34
UNREALISED GAIN ON FORWARD CURRENCYCONTRACTS HELD FOR HEDGING PURPOSES 2,448,387 0.34
CurrencyAmountBought Currency
AmountSold
MaturityDate
UnrealisedLossUSD
% ofShareholders’
Equity
USD 943,000 EUR 797,556 21/01/2021 (15,167) (0.00)
UNREALISED LOSS ON FORWARD CURRENCYCONTRACTS HELD FOR HEDGING PURPOSES (15,167) (0.00)
MARKET VALUE OF INVESTMENTS(cost USD 521,056,976) 707,434,182 99.52
OTHER ASSETS AND LIABILITIES 3,378,819 0.48
SHAREHOLDERS’ EQUITY 710,813,001 100.00
TOTAL INVESTMENTSMarket Value
USD
% ofShareholders’
Equity
Total Investments excluding derivatives (cost USD521,056,976) 705,000,962 99.18
Unrealised gain on forward currency contracts held for hedgingpurposes 2,448,387 0.34
Unrealised loss on forward currency contracts held for hedgingpurposes (15,167) (0.00)
Other Assets and Liabilities 3,378,819 0.48
Shareholders’ Equity 710,813,001 100.00
The counterparties for forward currency contracts were Barclays Bank Plc., BNP ParibasS.A., Merrill Lynch International, Royal Bank of Canada, Standard Chartered Bank, StateStreet Bank & Trust and UBS AG.
The maximum individual counterparty exposure as at 30 November 2020 is 0.18% of theNAV.
(a) Security holding is traded/held in USD. (ADR: American Depositary Receipt/GDR: Global Depositary Receipt).
Allocation of Portfolio as at 30 November 2020
% ofShareholders’
Equity
Common StocksInternet 11.71Software 10.40Computers 8.51Retail 5.92Pharmaceuticals 5.21Diversified Financial Services 4.50Banks 4.30Food, Beverages & Tobacco 3.94Healthcare Products 3.53Semiconductors 3.49Others 37.67
TOTAL COMMON STOCKS 99.18
Unrealised Gain on Forward Currency Contracts Held for HedgingPurposes
0.34
Unrealised Loss on Forward Currency Contracts Held for HedgingPurposes
(0.00)
Other Assets and Liabilities 0.48
TOTAL 100.00
Goldman Sachs Funds—US Equity PortfolioSchedule of InvestmentsAs at 30 November 2020
The accompanying notes are an integral part of these financial statements.
142
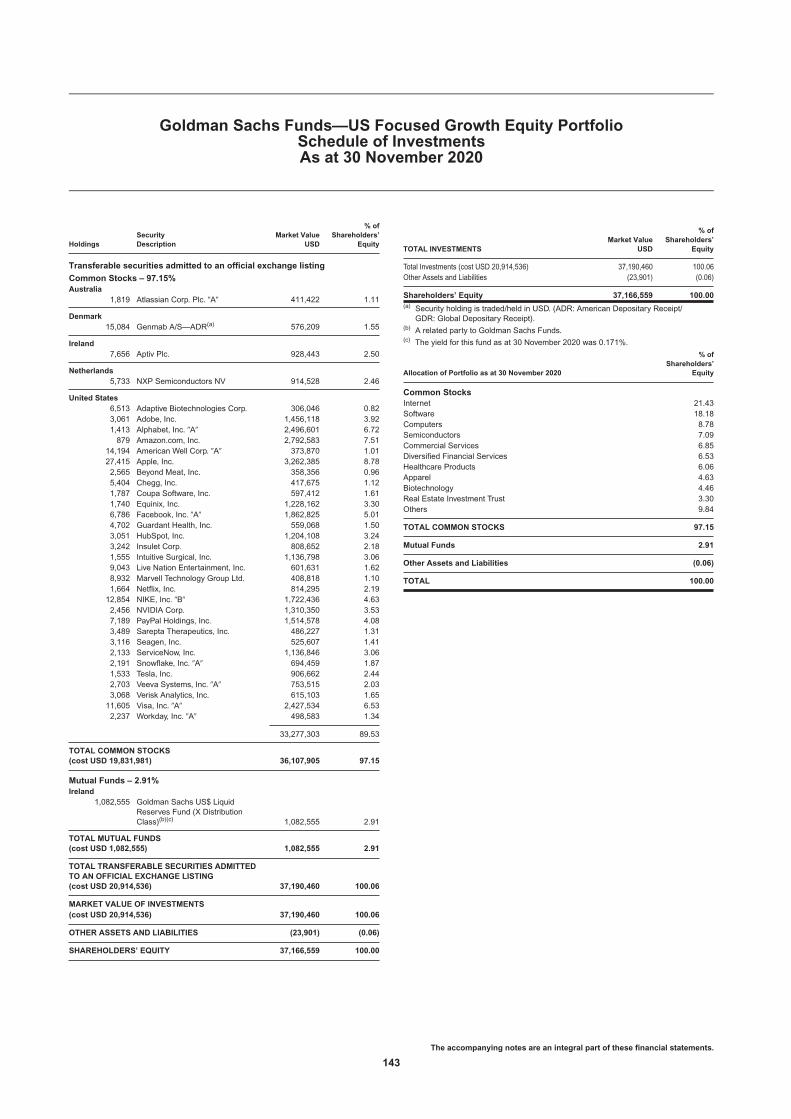
HoldingsSecurityDescription
Market ValueUSD
% ofShareholders’
Equity
Transferable securities admitted to an official exchange listing
Common Stocks – 97.15%Australia
1,819 Atlassian Corp. Plc. �A� 411,422 1.11
Denmark15,084 Genmab A/S—ADR(a) 576,209 1.55
Ireland7,656 Aptiv Plc. 928,443 2.50
Netherlands5,733 NXP Semiconductors NV 914,528 2.46
United States6,513 Adaptive Biotechnologies Corp. 306,046 0.823,061 Adobe, Inc. 1,456,118 3.921,413 Alphabet, Inc. �A� 2,496,601 6.72879 Amazon.com, Inc. 2,792,583 7.51
14,194 American Well Corp. �A� 373,870 1.0127,415 Apple, Inc. 3,262,385 8.782,565 Beyond Meat, Inc. 358,356 0.965,404 Chegg, Inc. 417,675 1.121,787 Coupa Software, Inc. 597,412 1.611,740 Equinix, Inc. 1,228,162 3.306,786 Facebook, Inc. �A� 1,862,825 5.014,702 Guardant Health, Inc. 559,068 1.503,051 HubSpot, Inc. 1,204,108 3.243,242 Insulet Corp. 808,652 2.181,555 Intuitive Surgical, Inc. 1,136,798 3.069,043 Live Nation Entertainment, Inc. 601,631 1.628,932 Marvell Technology Group Ltd. 408,818 1.101,664 Netflix, Inc. 814,295 2.1912,854 NIKE, Inc. �B� 1,722,436 4.632,456 NVIDIA Corp. 1,310,350 3.537,189 PayPal Holdings, Inc. 1,514,578 4.083,489 Sarepta Therapeutics, Inc. 486,227 1.313,116 Seagen, Inc. 525,607 1.412,133 ServiceNow, Inc. 1,136,846 3.062,191 Snowflake, Inc. �A� 694,459 1.871,533 Tesla, Inc. 906,662 2.442,703 Veeva Systems, Inc. �A� 753,515 2.033,068 Verisk Analytics, Inc. 615,103 1.6511,605 Visa, Inc. �A� 2,427,534 6.532,237 Workday, Inc. �A� 498,583 1.34
33,277,303 89.53
TOTAL COMMON STOCKS(cost USD 19,831,981) 36,107,905 97.15
Mutual Funds – 2.91%Ireland
1,082,555 Goldman Sachs US$ LiquidReserves Fund (X DistributionClass)(b)(c) 1,082,555 2.91
TOTAL MUTUAL FUNDS(cost USD 1,082,555) 1,082,555 2.91
TOTAL TRANSFERABLE SECURITIES ADMITTEDTO AN OFFICIAL EXCHANGE LISTING(cost USD 20,914,536) 37,190,460 100.06
MARKET VALUE OF INVESTMENTS(cost USD 20,914,536) 37,190,460 100.06
OTHER ASSETS AND LIABILITIES (23,901) (0.06)
SHAREHOLDERS’ EQUITY 37,166,559 100.00
TOTAL INVESTMENTSMarket Value
USD
% ofShareholders’
Equity
Total Investments (cost USD 20,914,536) 37,190,460 100.06Other Assets and Liabilities (23,901) (0.06)
Shareholders’ Equity 37,166,559 100.00(a) Security holding is traded/held in USD. (ADR: American Depositary Receipt/
GDR: Global Depositary Receipt).(b) A related party to Goldman Sachs Funds.(c) The yield for this fund as at 30 November 2020 was 0.171%.
Allocation of Portfolio as at 30 November 2020
% ofShareholders’
Equity
Common StocksInternet 21.43Software 18.18Computers 8.78Semiconductors 7.09Commercial Services 6.85Diversified Financial Services 6.53Healthcare Products 6.06Apparel 4.63Biotechnology 4.46Real Estate Investment Trust 3.30Others 9.84
TOTAL COMMON STOCKS 97.15
Mutual Funds 2.91
Other Assets and Liabilities (0.06)
TOTAL 100.00
Goldman Sachs Funds—US Focused Growth Equity PortfolioSchedule of InvestmentsAs at 30 November 2020
The accompanying notes are an integral part of these financial statements.
143

HoldingsSecurityDescription
Market ValueUSD
% ofShareholders’
Equity
Transferable securities admitted to an official exchange listing
Common Stocks – 99.52%Bermuda
650 RenaissanceRe Holdings Ltd. 110,026 0.31
Canada9,175 Sandstorm Gold Ltd. 66,335 0.18
France13,572 Constellium S.E. 170,464 0.47
Netherlands1,541 QIAGEN NV 75,756 0.21
United Kingdom6,515 Capri Holdings Ltd. 232,064 0.64
United States4,481 Acadia Healthcare Co., Inc. 190,980 0.535,770 Adient Plc. 181,928 0.516,401 AECOM 334,068 0.932,850 Aerojet Rocketdyne Holdings, Inc. 107,901 0.303,505 Agios Pharmaceuticals, Inc. 155,972 0.433,879 Alliant Energy Corp. 204,695 0.574,673 Ally Financial, Inc. 142,994 0.4010,505 American Eagle Outfitters, Inc. 191,821 0.532,045 American Financial Group, Inc. 189,551 0.535,120 Americold Realty Trust 174,285 0.482,526 AMN Healthcare Services, Inc. 170,101 0.474,775 Anaplan, Inc. 329,570 0.912,549 ArcBest Corp. 108,154 0.303,789 Arconic Corp. 106,206 0.293,900 ASGN, Inc. 312,546 0.872,789 Ashland Global Holdings, Inc. 209,984 0.582,007 Atmos Energy Corp. 194,177 0.542,487 Avanos Medical, Inc. 108,359 0.301,606 Avery Dennison Corp. 241,912 0.679,341 Avient Corp. 344,029 0.962,579 Axalta Coating Systems Ltd. 73,940 0.214,553 AZEK Co., Inc. 158,627 0.444,316 Beacon Roofing Supply, Inc. 159,606 0.446,017 BellRing Brands, Inc. �A� 125,515 0.35431 Beyond Meat, Inc. 60,215 0.17
1,718 BJ’s Wholesale Club Holdings, Inc. 71,366 0.202,644 Booz Allen Hamilton Holding Corp. 231,191 0.64184 Boston Beer Co., Inc. �A� 163,276 0.45
2,000 Bottomline Technologies DE, Inc. 92,220 0.265,694 Boyd Gaming Corp. 221,610 0.62828 Bright Horizons Family Solutions,
Inc. 141,861 0.394,084 Brinker International, Inc. 209,305 0.584,521 Brown & Brown, Inc. 204,440 0.573,095 Brunswick Corp. 231,723 0.64809 Burlington Stores, Inc. 178,207 0.49
1,003 CACI International, Inc. �A� 239,406 0.662,147 Caesars Entertainment, Inc. 148,272 0.413,353 Callaway Golf Co. 69,709 0.191,532 Carlisle Cos., Inc. 227,487 0.632,540 Casella Waste Systems, Inc. �A� 151,079 0.424,019 Catalent, Inc. 394,103 1.0911,393 ChampionX Corp. 143,666 0.401,053 Charles River Laboratories
International, Inc. 244,133 0.681,575 Chegg, Inc. 121,732 0.342,371 Cheniere Energy, Inc. 139,842 0.393,336 Ciena Corp. 147,785 0.418,242 Colfax Corp. 300,668 0.837,850 Columbia Property Trust, Inc. 110,999 0.312,440 Commerce Bancshares, Inc. 165,286 0.463,667 Commercial Metals Co. 75,027 0.212,396 Community Bank System, Inc. 154,782 0.431,705 CONMED Corp. 176,450 0.491,858 Cree, Inc. 171,623 0.483,320 Crocs, Inc. 196,909 0.55
HoldingsSecurityDescription
Market ValueUSD
% ofShareholders’
Equity
Common Stocks – (Continued)United States – (Continued)
3,168 Crown Holdings, Inc. 301,910 0.844,148 CubeSmart 131,865 0.371,433 Cullen Via Frost Bankers, Inc. 123,711 0.341,573 Curtiss-Wright Corp. 187,800 0.525,358 Cushman & Wakefield Plc. 81,924 0.232,953 CyrusOne, Inc. 203,639 0.57516 Deckers Outdoor Corp. 133,283 0.37
2,053 Dentsply Sirona, Inc. 106,345 0.305,232 Donaldson Co., Inc. 282,476 0.784,571 Duke Realty Corp. 175,664 0.495,015 Dynatrace, Inc. 194,331 0.544,748 East West Bancorp, Inc. 207,915 0.58919 EastGroup Properties, Inc. 128,688 0.36
2,411 Elastic NV 297,662 0.831,318 EMCOR Group, Inc. 115,918 0.321,602 Emergent BioSolutions, Inc. 133,463 0.379,636 Empire State Realty Trust, Inc. �A� 92,506 0.264,037 Entegris, Inc. 368,497 1.023,542 Equity LifeStyle Properties, Inc. 207,738 0.588,458 Exelixis, Inc. 164,085 0.466,322 First Financial Bankshares, Inc. 214,253 0.592,253 FirstCash, Inc. 148,518 0.411,461 Five Below, Inc. 229,421 0.6416,217 Flex Ltd. 269,040 0.752,008 frontdoor, Inc. 95,079 0.261,242 FTI Consulting, Inc. 131,491 0.3710,992 Gates Industrial Corp. Plc. 147,513 0.41781 GCI Liberty, Inc. �A� 71,110 0.20
4,369 Genpact Ltd. 178,954 0.501,941 Gibraltar Industries, Inc. 128,203 0.364,832 Glacier Bancorp, Inc. 202,461 0.561,924 Globe Life, Inc. 183,011 0.513,845 Globus Medical, Inc. �A� 230,700 0.644,800 Graco, Inc. 324,768 0.902,118 Guardant Health, Inc. 251,830 0.706,886 Halozyme Therapeutics, Inc. 266,832 0.741,850 Hamilton Lane, Inc. �A� 131,369 0.36962 Hanover Insurance Group, Inc. 110,947 0.31
6,624 Healthcare Realty Trust, Inc. 199,714 0.55121 HEICO Corp. 15,199 0.04375 Helen of Troy Ltd. 75,596 0.21
3,596 Hexcel Corp. 184,007 0.513,463 Highwoods Properties, Inc. 133,222 0.372,177 Hill-Rom Holdings, Inc. 206,967 0.573,168 HMS Holdings Corp. 101,566 0.288,670 Hostess Brands, Inc. 117,565 0.332,328 Houlihan Lokey, Inc. 150,738 0.421,094 Hubbell, Inc. 176,659 0.49998 HubSpot, Inc. 393,871 1.09
5,052 Hudson Pacific Properties, Inc. 133,979 0.371,580 Huntsman Corp. 40,100 0.112,147 IAA, Inc. 129,571 0.361,619 IDACORP, Inc. 148,381 0.413,079 Integra LifeSciences Holdings Corp. 170,607 0.47870 iRhythm Technologies, Inc. 206,616 0.57
1,237 Jacobs Engineering Group, Inc. 132,804 0.377,821 KBR, Inc. 219,379 0.612,070 Kemper Corp. 160,052 0.443,029 KKR Real Estate Finance Trust, Inc. 56,067 0.162,499 Lamb Weston Holdings, Inc. 180,503 0.506,563 Lattice Semiconductor Corp. 270,789 0.751,468 Lear Corp. 212,889 0.594,512 Liberty Media Corp.-Liberty Formula
One �C� 187,880 0.521,070 Life Storage, Inc. 115,528 0.32529 Lithia Motors, Inc. �A� 156,383 0.43701 Littelfuse, Inc. 168,689 0.47
2,078 Live Nation Entertainment, Inc. 138,249 0.382,129 LPL Financial Holdings, Inc. 196,783 0.552,746 MACOM Technology Solutions
Holdings, Inc. 123,488 0.34
Goldman Sachs Funds—US Smaller Cap Equity PortfolioSchedule of InvestmentsAs at 30 November 2020
The accompanying notes are an integral part of these financial statements.
144

HoldingsSecurityDescription
Market ValueUSD
% ofShareholders’
Equity
Common Stocks – (Continued)United States – (Continued)
1,413 Marriott Vacations Worldwide Corp. 181,938 0.511,725 Meritage Homes Corp. 154,595 0.43514 Mesa Laboratories, Inc. 140,636 0.39
7,321 MGIC Investment Corp. 87,669 0.241,190 Mid-America Apartment
Communities, Inc. 147,691 0.411,954 MKS Instruments, Inc. 270,238 0.751,279 Molina Healthcare, Inc. 264,727 0.731,628 National Health Investors, Inc. 107,090 0.305,633 National Instruments Corp. 210,787 0.592,109 Neurocrine Biosciences, Inc. 203,244 0.561,695 Nexstar Media Group, Inc. �A� 181,365 0.506,226 NMI Holdings, Inc. �A� 139,338 0.391,001 Nordson Corp. 203,724 0.576,609 Nuance Communications, Inc. 287,161 0.801,097 Old Dominion Freight Line, Inc. 221,221 0.612,479 ONE Gas, Inc. 195,742 0.542,771 OneMain Holdings, Inc. 110,868 0.311,898 Packaging Corp. of America 249,967 0.694,052 PacWest Bancorp 99,396 0.28650 Papa John’s International, Inc. 52,026 0.14
6,842 Parsley Energy, Inc. �A� 91,956 0.261,749 Paylocity Holding Corp. 348,995 0.975,730 Pebblebrook Hotel Trust 110,532 0.311,048 Penn National Gaming, Inc. 74,649 0.214,731 PennyMac Mortgage Investment
Trust 82,036 0.234,486 Performance Food Group Co. 193,616 0.542,059 PerkinElmer, Inc. 267,279 0.744,621 Pinnacle Financial Partners, Inc. 259,053 0.722,386 Portland General Electric Co. 101,214 0.281,048 Post Holdings, Inc. 101,111 0.282,792 PRA Health Sciences, Inc. 309,633 0.862,859 Prestige Consumer Healthcare, Inc. 104,354 0.291,569 Primerica, Inc. 207,971 0.581,693 Proofpoint, Inc. 178,070 0.492,772 Prosperity Bancshares, Inc. 176,493 0.49929 PS Business Parks, Inc. 122,386 0.34
3,907 Quanta Services, Inc. 271,810 0.755,346 Rexnord Corp. 202,560 0.56479 RH 217,945 0.60
9,149 RLJ Lodging Trust 115,277 0.322,515 Robert Half International, Inc. 163,022 0.452,781 RPM International, Inc. 240,862 0.67329 Saia, Inc. 57,213 0.16
1,637 Sarepta Therapeutics, Inc. 228,132 0.631,964 Science Applications International
Corp. 183,555 0.514,111 SeaWorld Entertainment, Inc. 117,287 0.331,927 Semtech Corp. 132,751 0.371,712 Signature Bank 197,642 0.553,012 SkyWest, Inc. 127,618 0.353,057 Stifel Financial Corp. 217,842 0.601,399 Sun Communities, Inc. 194,069 0.545,090 Syneos Health, Inc. 336,729 0.93609 SYNNEX Corp. 97,452 0.27
5,011 Synovus Financial Corp. 162,106 0.458,405 Tapestry, Inc. 237,904 0.666,081 Taylor Morrison Home Corp. 156,160 0.432,180 Teradyne, Inc. 237,489 0.661,900 Terreno Realty Corp. 110,352 0.31717 Texas Roadhouse, Inc. 53,273 0.15
3,767 Timken Co. 277,666 0.771,211 TopBuild Corp. 215,255 0.60336 Trex Co., Inc. 24,965 0.07
3,251 Trimble, Inc. 193,434 0.5419,545 Two Harbors Investment Corp. 124,502 0.35348 Ulta Beauty, Inc. 97,485 0.27
14,241 Viavi Solutions, Inc. 196,241 0.543,347 Viper Energy Partners LP 38,959 0.111,664 Virtu Financial, Inc. �A� 38,022 0.11
HoldingsSecurityDescription
Market ValueUSD
% ofShareholders’
Equity
Common Stocks – (Continued)United States – (Continued)
3,395 Voya Financial, Inc. 200,644 0.56486 Vulcan Materials Co. 68,181 0.19
3,069 Washington Federal, Inc. 75,098 0.21576 Watsco, Inc. 128,362 0.36
1,187 Westlake Chemical Corp. 90,734 0.25364 Wingstop, Inc. 45,409 0.13
2,478 Wintrust Financial Corp. 140,403 0.393,218 Wolverine World Wide, Inc. 94,995 0.2617,561 WPX Energy, Inc. 129,776 0.362,147 WR Berkley Corp. 138,181 0.382,740 Wyndham Destinations, Inc. 119,190 0.332,700 XPO Logistics, Inc. 289,845 0.803,982 YETI Holdings, Inc. 253,096 0.702,655 Zendesk, Inc. 359,195 1.00
35,197,513 97.71
TOTAL COMMON STOCKS(cost USD 30,280,437) 35,852,158 99.52
Mutual Funds – 0.63%Ireland
225,077 Goldman Sachs US$ LiquidReserves Fund (X DistributionClass)(a)(b) 225,077 0.63
TOTAL MUTUAL FUNDS(cost USD 225,077) 225,077 0.63
TOTAL TRANSFERABLE SECURITIES ADMITTEDTO AN OFFICIAL EXCHANGE LISTING(cost USD 30,505,514) 36,077,235 100.15
MARKET VALUE OF INVESTMENTS EXCLUDINGDERIVATIVES(cost USD 30,505,514) 36,077,235 100.15
Share Class Specific Forward Currency Contracts – 0.07%
CurrencyAmountBought Currency
AmountSold
MaturityDate
UnrealisedGainUSD
% ofShareholders’
Equity
EUR 1,355,742 USD 1,603,716 21/01/2021 25,043 0.07
UNREALISED GAIN ON FORWARD CURRENCYCONTRACTS HELD FOR HEDGING PURPOSES 25,043 0.07
MARKET VALUE OF INVESTMENTS(cost USD 30,505,514) 36,102,278 100.22
OTHER ASSETS AND LIABILITIES (78,470) (0.22)
SHAREHOLDERS’ EQUITY 36,023,808 100.00
TOTAL INVESTMENTSMarket Value
USD
% ofShareholders’
Equity
Total Investments excluding derivatives (cost USD 30,505,514) 36,077,235 100.15Unrealised gain on forward currency contracts held for hedgingpurposes 25,043 0.07
Other Assets and Liabilities (78,470) (0.22)
Shareholders’ Equity 36,023,808 100.00
The counterparties for forward currency contracts were Barclays Bank Plc., BNP ParibasS.A., Citibank N.A., Royal Bank of Canada and State Street Bank & Trust.
The maximum individual counterparty exposure as at 30 November 2020 is 0.03% of theNAV.
(a) A related party to Goldman Sachs Funds.(b) The yield for this fund as at 30 November 2020 was 0.171%.
Goldman Sachs Funds—US Smaller Cap Equity PortfolioSchedule of InvestmentsAs at 30 November 2020
The accompanying notes are an integral part of these financial statements.
145

Allocation of Portfolio as at 30 November 2020
% ofShareholders’
Equity
Common StocksReal Estate Investment Trust 8.30Banks 5.84Commercial Services 5.53Retail 5.01Insurance 4.82Semiconductors 4.37Healthcare Services 3.96Electronics 3.77Healthcare Products 3.55Software 3.52Others 50.85
TOTAL COMMON STOCKS 99.52
Mutual Funds 0.63
Unrealised Gain on Forward Currency Contracts Held for HedgingPurposes
0.07
Other Assets and Liabilities (0.22)
TOTAL 100.00
Goldman Sachs Funds—US Smaller Cap Equity PortfolioSchedule of InvestmentsAs at 30 November 2020
The accompanying notes are an integral part of these financial statements.
146

HoldingsSecurityDescription
Market ValueUSD
% ofShareholders’
Equity
Transferable securities admitted to an official exchange listing
Common Stocks – 98.51%Australia
5,648 Atlassian Corp. Plc. �A� 1,277,465 1.51
China5,518 Alibaba Group Holding Ltd.—ADR(a) 1,466,960 1.74
Ireland6,359 Accenture Plc. �A� 1,582,501 1.88
Netherlands11,598 NXP Semiconductors NV 1,850,113 2.19
Taiwan18,215 Taiwan Semiconductor
Manufacturing Co., Ltd.—ADR(a) 1,775,416 2.10
United States19,080 Activision Blizzard, Inc. 1,493,010 1.775,786 Adobe, Inc. 2,752,400 3.2616,998 Advanced Micro Devices, Inc. 1,524,381 1.8114,572 Akamai Technologies, Inc. 1,514,468 1.791,750 Alphabet, Inc. �A� 3,092,040 3.662,643 Alphabet, Inc. �C� 4,684,823 5.551,181 Amazon.com, Inc. 3,752,037 4.445,839 American Tower Corp. 1,357,276 1.6112,525 Amphenol Corp. �A� 1,645,785 1.9531,157 Apple, Inc. 3,707,683 4.391,807 Equinix, Inc. 1,275,453 1.5118,209 Facebook, Inc. �A� 4,998,553 5.9217,092 Fidelity National Information
Services, Inc. 2,516,797 2.9810,602 Fiserv, Inc. 1,212,763 1.444,568 HubSpot, Inc. 1,802,807 2.136,375 Intuit, Inc. 2,258,599 2.6734,741 Juniper Networks, Inc. 759,091 0.902,160 Lam Research Corp. 980,014 1.1655,032 Marvell Technology Group Ltd. 2,518,815 2.985,220 Mastercard, Inc. �A� 1,752,824 2.089,056 Microchip Technology, Inc. 1,206,531 1.4332,077 Microsoft Corp. 6,868,326 8.135,297 Motorola Solutions, Inc. 911,667 1.083,412 NVIDIA Corp. 1,820,404 2.163,173 Palo Alto Networks, Inc. 934,702 1.114,481 Paycom Software, Inc. 1,850,563 2.1917,261 PayPal Holdings, Inc. 3,636,547 4.312,263 ServiceNow, Inc. 1,206,134 1.437,810 Splunk, Inc. 1,580,041 1.8712,004 Texas Instruments, Inc. 1,920,040 2.2717,379 Visa, Inc. �A� 3,635,339 4.3013,279 Walt Disney Co. 1,951,216 2.319,479 Workday, Inc. �A� 2,112,679 2.50
75,233,808 89.09
TOTAL COMMON STOCKS(cost USD 81,136,726) 83,186,263 98.51
HoldingsSecurityDescription
Market ValueUSD
% ofShareholders’
Equity
Mutual Funds – 0.00%Ireland
2 Goldman Sachs US$ TreasuryLiquid Reserves Fund (X DistributionClass)(b)(c) 2 0.00
TOTAL MUTUAL FUNDS(cost USD 2) 2 0.00
TOTAL TRANSFERABLE SECURITIES ADMITTEDTO AN OFFICIAL EXCHANGE LISTING(cost USD 81,136,728) 83,186,265 98.51
MARKET VALUE OF INVESTMENTS(cost USD 81,136,728) 83,186,265 98.51
OTHER ASSETS AND LIABILITIES 1,258,091 1.49
SHAREHOLDERS’ EQUITY 84,444,356 100.00
TOTAL INVESTMENTSMarket Value
USD
% ofShareholders’
Equity
Total Investments (cost USD 81,136,728) 83,186,265 98.51Other Assets and Liabilities 1,258,091 1.49
Shareholders’ Equity 84,444,356 100.00(a) Security holding is traded/held in USD. (ADR: American Depositary Receipt/
GDR: Global Depositary Receipt).(b) A related party to Goldman Sachs Funds.(c) The yield for this fund as at 30 November 2020 was 0.120%.
Allocation of Portfolio as at 30 November 2020
% ofShareholders’
Equity
Common StocksSoftware 33.67Internet 22.42Semiconductors 16.10Diversified Financial Services 6.38Computers 6.27Commercial Services 4.31Real Estate Investment Trust 3.12Media 2.31Telecommunications 1.98Electronics 1.95
TOTAL COMMON STOCKS 98.51
Mutual Funds 0.00
Other Assets and Liabilities 1.49
TOTAL 100.00
Goldman Sachs Funds—US Technology Opportunities Equity PortfolioSchedule of InvestmentsAs at 30 November 2020
The accompanying notes are an integral part of these financial statements.
147
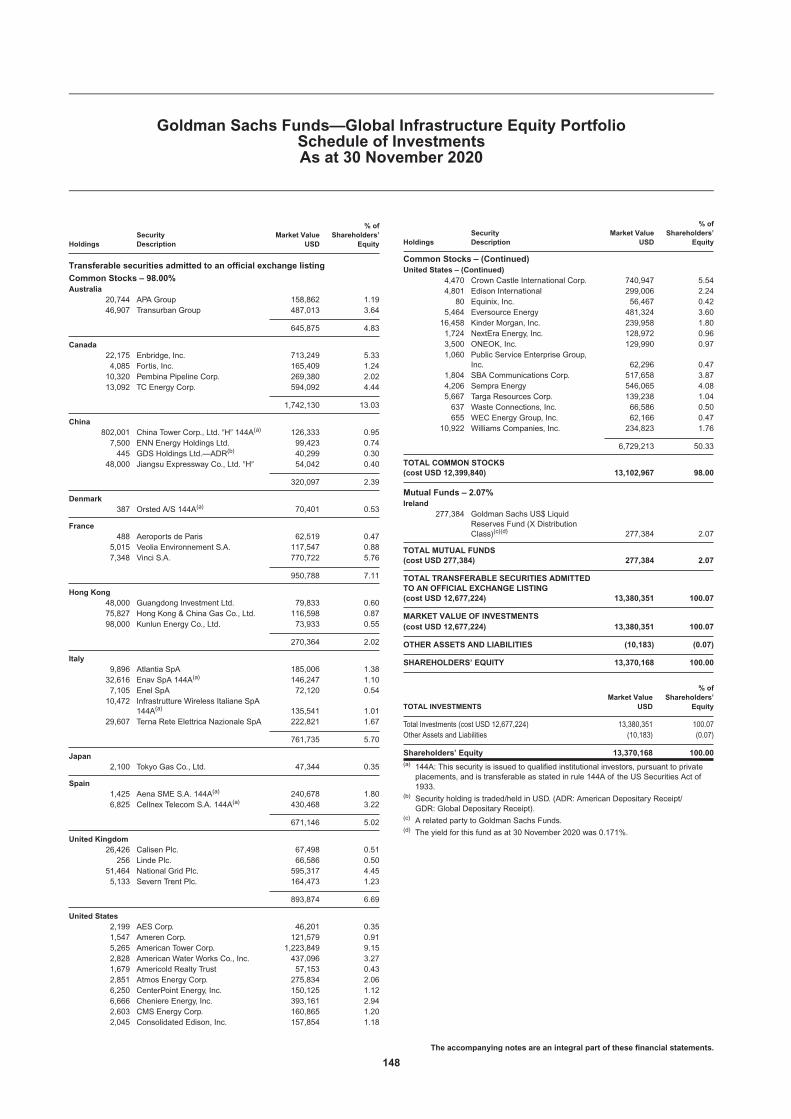
HoldingsSecurityDescription
Market ValueUSD
% ofShareholders’
Equity
Transferable securities admitted to an official exchange listing
Common Stocks – 98.00%Australia
20,744 APA Group 158,862 1.1946,907 Transurban Group 487,013 3.64
645,875 4.83
Canada22,175 Enbridge, Inc. 713,249 5.334,085 Fortis, Inc. 165,409 1.2410,320 Pembina Pipeline Corp. 269,380 2.0213,092 TC Energy Corp. 594,092 4.44
1,742,130 13.03
China802,001 China Tower Corp., Ltd. �H� 144A(a) 126,333 0.957,500 ENN Energy Holdings Ltd. 99,423 0.74445 GDS Holdings Ltd.—ADR(b) 40,299 0.30
48,000 Jiangsu Expressway Co., Ltd. �H� 54,042 0.40
320,097 2.39
Denmark387 Orsted A/S 144A(a) 70,401 0.53
France488 Aeroports de Paris 62,519 0.47
5,015 Veolia Environnement S.A. 117,547 0.887,348 Vinci S.A. 770,722 5.76
950,788 7.11
Hong Kong48,000 Guangdong Investment Ltd. 79,833 0.6075,827 Hong Kong & China Gas Co., Ltd. 116,598 0.8798,000 Kunlun Energy Co., Ltd. 73,933 0.55
270,364 2.02
Italy9,896 Atlantia SpA 185,006 1.3832,616 Enav SpA 144A(a) 146,247 1.107,105 Enel SpA 72,120 0.5410,472 Infrastrutture Wireless Italiane SpA
144A(a) 135,541 1.0129,607 Terna Rete Elettrica Nazionale SpA 222,821 1.67
761,735 5.70
Japan2,100 Tokyo Gas Co., Ltd. 47,344 0.35
Spain1,425 Aena SME S.A. 144A(a) 240,678 1.806,825 Cellnex Telecom S.A. 144A(a) 430,468 3.22
671,146 5.02
United Kingdom26,426 Calisen Plc. 67,498 0.51256 Linde Plc. 66,586 0.50
51,464 National Grid Plc. 595,317 4.455,133 Severn Trent Plc. 164,473 1.23
893,874 6.69
United States2,199 AES Corp. 46,201 0.351,547 Ameren Corp. 121,579 0.915,265 American Tower Corp. 1,223,849 9.152,828 American Water Works Co., Inc. 437,096 3.271,679 Americold Realty Trust 57,153 0.432,851 Atmos Energy Corp. 275,834 2.066,250 CenterPoint Energy, Inc. 150,125 1.126,666 Cheniere Energy, Inc. 393,161 2.942,603 CMS Energy Corp. 160,865 1.202,045 Consolidated Edison, Inc. 157,854 1.18
HoldingsSecurityDescription
Market ValueUSD
% ofShareholders’
Equity
Common Stocks – (Continued)United States – (Continued)
4,470 Crown Castle International Corp. 740,947 5.544,801 Edison International 299,006 2.2480 Equinix, Inc. 56,467 0.42
5,464 Eversource Energy 481,324 3.6016,458 Kinder Morgan, Inc. 239,958 1.801,724 NextEra Energy, Inc. 128,972 0.963,500 ONEOK, Inc. 129,990 0.971,060 Public Service Enterprise Group,
Inc. 62,296 0.471,804 SBA Communications Corp. 517,658 3.874,206 Sempra Energy 546,065 4.085,667 Targa Resources Corp. 139,238 1.04637 Waste Connections, Inc. 66,586 0.50655 WEC Energy Group, Inc. 62,166 0.47
10,922 Williams Companies, Inc. 234,823 1.76
6,729,213 50.33
TOTAL COMMON STOCKS(cost USD 12,399,840) 13,102,967 98.00
Mutual Funds – 2.07%Ireland
277,384 Goldman Sachs US$ LiquidReserves Fund (X DistributionClass)(c)(d) 277,384 2.07
TOTAL MUTUAL FUNDS(cost USD 277,384) 277,384 2.07
TOTAL TRANSFERABLE SECURITIES ADMITTEDTO AN OFFICIAL EXCHANGE LISTING(cost USD 12,677,224) 13,380,351 100.07
MARKET VALUE OF INVESTMENTS(cost USD 12,677,224) 13,380,351 100.07
OTHER ASSETS AND LIABILITIES (10,183) (0.07)
SHAREHOLDERS’ EQUITY 13,370,168 100.00
TOTAL INVESTMENTSMarket Value
USD
% ofShareholders’
Equity
Total Investments (cost USD 12,677,224) 13,380,351 100.07Other Assets and Liabilities (10,183) (0.07)
Shareholders’ Equity 13,370,168 100.00(a) 144A: This security is issued to qualified institutional investors, pursuant to private
placements, and is transferable as stated in rule 144A of the US Securities Act of1933.
(b) Security holding is traded/held in USD. (ADR: American Depositary Receipt/GDR: Global Depositary Receipt).
(c) A related party to Goldman Sachs Funds.(d) The yield for this fund as at 30 November 2020 was 0.171%.
Goldman Sachs Funds—Global Infrastructure Equity PortfolioSchedule of InvestmentsAs at 30 November 2020
The accompanying notes are an integral part of these financial statements.
148

Allocation of Portfolio as at 30 November 2020
% ofShareholders’
Equity
Common StocksElectric 25.01Pipelines 21.49Real Estate Investment Trust 19.41Construction & Engineering 14.31Water 5.98Commercial Services 5.93Gas 4.02Oil & Gas 0.55Chemicals 0.50Environmental Control 0.50Others 0.30
TOTAL COMMON STOCKS 98.00
Mutual Funds 2.07
Other Assets and Liabilities (0.07)
TOTAL 100.00
Goldman Sachs Funds—Global Infrastructure Equity PortfolioSchedule of InvestmentsAs at 30 November 2020
The accompanying notes are an integral part of these financial statements.
149

HoldingsSecurityDescription
Market ValueUSD
% ofShareholders’
Equity
Transferable securities admitted to an official exchange listing
Common Stocks – 92.29%Australia
322,994 APN Industria REIT 710,975 1.83290,003 Centuria Industrial REIT 667,261 1.71414,763 Centuria Office REIT 683,275 1.75245,390 Charter Hall Long Wale REIT 878,952 2.26372,743 Charter Hall Retail REIT 1,050,091 2.70868,673 Cromwell Property Group 548,940 1.41575,639 Stockland 1,937,454 4.98
6,476,948 16.64
Belgium14,301 Warehouses De Pauw CVA 488,911 1.26
Canada12,417 Allied Properties Real Estate
Investment Trust 390,554 1.0013,764 Canadian Apartment Properties
REIT 542,536 1.3946,256 Summit Industrial Income REIT 473,522 1.22
1,406,612 3.61
France7,355 Covivio 606,560 1.564,975 Gecina S.A. 763,873 1.9632,649 Klepierre S.A. 742,160 1.91
2,112,593 5.43
Germany28,939 alstria office REIT-AG 476,273 1.22
Hong Kong1,913,000 China Merchants Commercial Real
Estate Investment Trust 592,630 1.52
Ireland330,549 Hibernia REIT Plc. 455,987 1.17
Japan307 Comforia Residential REIT, Inc. 852,613 2.19733 ESCON Japan Reit Investment
Corp. 795,062 2.04717 GLP J-REIT 1,085,848 2.79535 Kenedix Retail REIT Corp. 1,189,382 3.06473 LaSalle Logiport REIT 709,181 1.82909 United Urban Investment Corp. 1,031,098 2.65
5,663,184 14.55
Singapore362,800 Ascendas India Trust 371,416 0.95494,652 Ascendas Real Estate Investment
Trust 1,099,539 2.83792,700 Elite Commercial REIT 710,230 1.82
1,469,200 Lendlease Global Commercial REIT 746,940 1.92529,300 Mapletree Industrial Trust 1,163,349 2.99
4,091,474 10.51
Spain69,197 Merlin Properties Socimi S.A. 655,742 1.69
United Kingdom44,298 Big Yellow Group Plc. 670,001 1.7276,886 British Land Co., Plc. 489,627 1.2657,980 Segro Plc. 704,809 1.81393,306 Tritax Big Box REIT Plc. 861,536 2.21222,269 Tritax EuroBox Plc. 144A(a) 293,285 0.7553,537 UNITE Group Plc. 714,161 1.84
3,733,419 9.59
United States3,357 Alexandria Real Estate Equities, Inc. 545,982 1.402,038 American Tower Corp. 473,733 1.22
HoldingsSecurityDescription
Market ValueUSD
% ofShareholders’
Equity
Common Stocks – (Continued)United States – (Continued)
29,756 Brandywine Realty Trust 341,004 0.881,553 Crown Castle International Corp. 257,425 0.662,368 Digital Realty Trust, Inc. 320,840 0.821,353 Equinix, Inc. 955,002 2.4523,468 Healthpeak Properties, Inc. 700,520 1.808,342 Highwoods Properties, Inc. 320,917 0.8316,952 MGM Growth Properties LLC �A� 515,341 1.328,614 Omega Healthcare Investors, Inc. 312,688 0.8033,476 PennyMac Mortgage Investment
Trust 580,474 1.499,992 Prologis, Inc. 1,005,095 2.583,200 Realty Income Corp. 195,936 0.5036,291 RLJ Lodging Trust 457,267 1.188,766 Simon Property Group, Inc. 750,545 1.9320,688 Urban Edge Properties 278,460 0.7210,061 Ventas, Inc. 491,882 1.2613,676 Welltower, Inc. 883,333 2.275,461 WP Carey, Inc. 383,635 0.99
9,770,079 25.10
TOTAL COMMON STOCKS(cost USD 35,591,630) 35,923,852 92.29
HoldingsSecurityDescription Currency Interest Rate
Market ValueUSD
% ofShareholders’
Equity
Preferred Stocks – 7.14%
United States16,752 Brookfield
Property REIT,Inc.—Series A—Preferred
USD 6.375% 369,884 0.95
15,456 PebblebrookHotelTrust—Series C—Preferred
USD 6.500% 358,734 0.92
13,220 PS BusinessParks,Inc.—Series Y—Preferred
USD 5.200% 352,577 0.90
29,339 SL Green RealtyCorp.—Series I—Preferred
USD 6.500% 757,533 1.95
28,864 TaubmanCenters,Inc.—Series J—Preferred
USD 6.500% 726,796 1.87
8,445 TaubmanCenters,Inc.—Series K—Preferred
USD 6.250% 212,476 0.55
2,778,000 7.14
TOTAL PREFERRED STOCKS(cost USD 2,809,700)
2,778,000 7.14
HoldingsSecurityDescription
Market ValueUSD
% ofShareholders’
Equity
Rights – 0.00%Singapore
18,302 Ascendas REIT—Rights(b) 177 0.00
TOTAL RIGHTS(cost USD nil) 177 0.00
Goldman Sachs Funds—Global Real Estate Equity PortfolioSchedule of InvestmentsAs at 30 November 2020
The accompanying notes are an integral part of these financial statements.
150
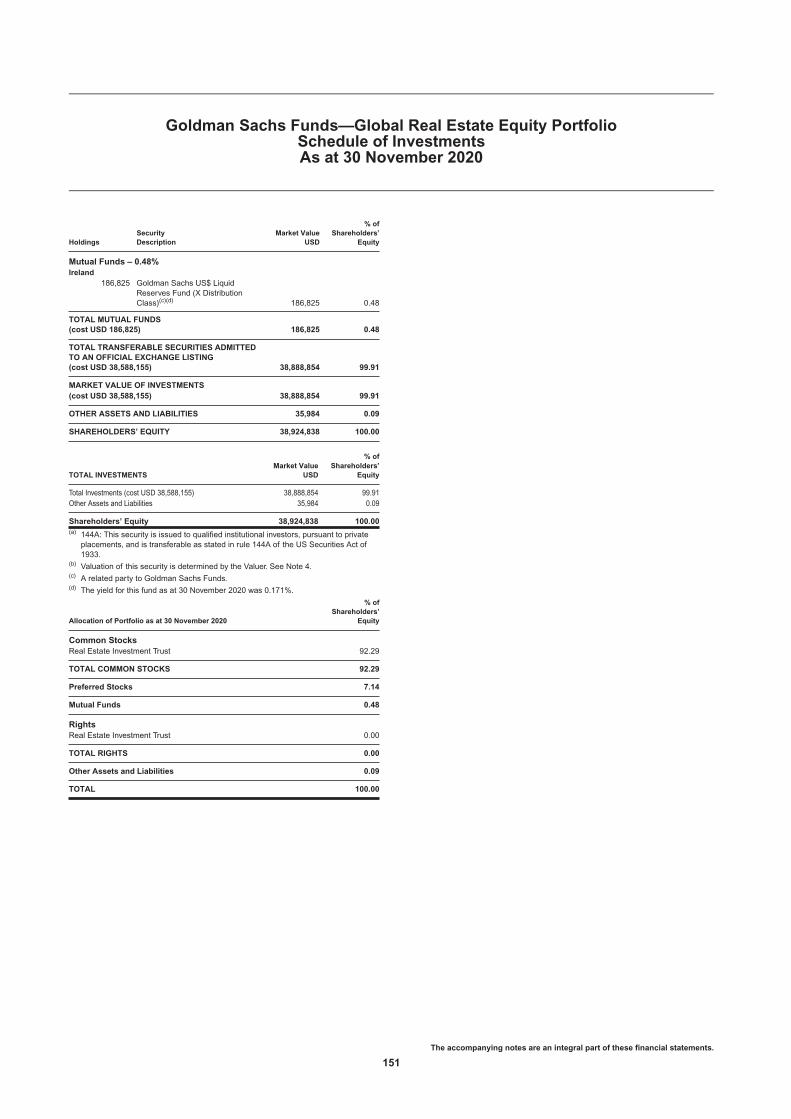
HoldingsSecurityDescription
Market ValueUSD
% ofShareholders’
Equity
Mutual Funds – 0.48%Ireland
186,825 Goldman Sachs US$ LiquidReserves Fund (X DistributionClass)(c)(d) 186,825 0.48
TOTAL MUTUAL FUNDS(cost USD 186,825) 186,825 0.48
TOTAL TRANSFERABLE SECURITIES ADMITTEDTO AN OFFICIAL EXCHANGE LISTING(cost USD 38,588,155) 38,888,854 99.91
MARKET VALUE OF INVESTMENTS(cost USD 38,588,155) 38,888,854 99.91
OTHER ASSETS AND LIABILITIES 35,984 0.09
SHAREHOLDERS’ EQUITY 38,924,838 100.00
TOTAL INVESTMENTSMarket Value
USD
% ofShareholders’
Equity
Total Investments (cost USD 38,588,155) 38,888,854 99.91Other Assets and Liabilities 35,984 0.09
Shareholders’ Equity 38,924,838 100.00(a) 144A: This security is issued to qualified institutional investors, pursuant to private
placements, and is transferable as stated in rule 144A of the US Securities Act of1933.
(b) Valuation of this security is determined by the Valuer. See Note 4.(c) A related party to Goldman Sachs Funds.(d) The yield for this fund as at 30 November 2020 was 0.171%.
Allocation of Portfolio as at 30 November 2020
% ofShareholders’
Equity
Common StocksReal Estate Investment Trust 92.29
TOTAL COMMON STOCKS 92.29
Preferred Stocks 7.14
Mutual Funds 0.48
RightsReal Estate Investment Trust 0.00
TOTAL RIGHTS 0.00
Other Assets and Liabilities 0.09
TOTAL 100.00
Goldman Sachs Funds—Global Real Estate Equity PortfolioSchedule of InvestmentsAs at 30 November 2020
The accompanying notes are an integral part of these financial statements.
151

HoldingsSecurityDescription
Market ValueUSD
% ofShareholders’
Equity
Transferable securities admitted to an official exchange listing
Common Stocks – 95.77%Canada
5,872 Ballard Power Systems, Inc. 120,904 0.3112,753 Boralex, Inc. �A� 408,222 1.0446,632 Canadian Natural Resources Ltd. 1,102,381 2.8164,568 Enbridge, Inc. 2,075,216 5.2939,805 Gibson Energy, Inc. 655,851 1.67
+ 40,879 Keyera Corp. 737,393 1.88+ 14,971 Northland Power, Inc. 540,454 1.38+ 70,149 Pembina Pipeline Corp. 1,831,082 4.67
49,239 Suncor Energy, Inc. 834,601 2.1343,661 TC Energy Corp. 1,981,261 5.05
10,287,365 26.23
Denmark2,699 Orsted A/S 144A(a) 490,985 1.252,852 Vestas Wind Systems A/S 588,238 1.50
1,079,223 2.75
France18,887 TOTAL S.E.—ADR(b) 840,849 2.14
Israel368 SolarEdge Technologies, Inc. 103,515 0.26
Netherlands24,018 Royal Dutch Shell Plc.—ADR �A�(b) 854,320 2.18
United Kingdom5,442 Atlantica Sustainable Infrastructure
Plc. 191,504 0.4944,536 BP Plc.—ADR(b) 912,543 2.331,496 Linde Plc. 389,109 0.99
1,493,156 3.81
United States16,319 AES Corp. 342,862 0.871,236 Air Products & Chemicals, Inc. 343,188 0.874,030 Ameren Corp. 316,718 0.8165,546 Antero Midstream Corp. 463,082 1.188,937 Cabot Oil & Gas Corp. 158,900 0.4131,946 Cheniere Energy, Inc. 1,884,175 4.8015,323 Chevron Corp. 1,388,264 3.5417,377 ConocoPhillips 727,401 1.858,725 Darling Ingredients, Inc. 428,485 1.094,026 Dominion Energy, Inc. 319,825 0.821,033 Enphase Energy, Inc. 145,901 0.3712,745 EOG Resources, Inc. 642,730 1.6440,547 Equitrans Midstream Corp. 345,460 0.883,540 Eversource Energy 311,839 0.802,580 Exxon Mobil Corp. 101,884 0.2611,203 Hennessy Capital Acquisition Corp.
IV �A� 153,033 0.3939,138 Hess Midstream LP �A� 719,748 1.8473,260 Kinder Morgan, Inc. 1,068,131 2.7218,718 Marathon Petroleum Corp. 765,941 1.955,022 NextEra Energy Partners LP 321,157 0.826,575 NextEra Energy, Inc. 491,876 1.2551,775 ONEOK, Inc. 1,922,923 4.9010,553 Phillips 66 675,497 1.725,494 Pioneer Natural Resources Co. 589,177 1.50
170,329 Plains GP Holdings LP �A� 1,400,104 3.577,161 QuantumScape Corp. 333,488 0.853,143 Renewable Energy Group, Inc. 190,623 0.491,391 Sempra Energy 180,594 0.46
+ 5,572 Switchback Energy Acquisition Corp.�A� 198,753 0.51
125,934 Targa Resources Corp. 3,094,198 7.89
HoldingsSecurityDescription
Market ValueUSD
% ofShareholders’
Equity
Common Stocks – (Continued)United States – (Continued)
12,689 Valero Energy Corp. 709,696 1.81100,998 Williams Companies, Inc. 2,171,457 5.54
22,907,110 58.40
TOTAL COMMON STOCKS(cost USD 39,332,233) 37,565,538 95.77
Mutual Funds – 3.52%Ireland
3 Goldman Sachs US$ LiquidReserves Fund (X DistributionClass)(c)(d) 3 0.00
United States+ 97,881 JPMorgan Alerian MLP Index ETN 1,379,143 3.52
TOTAL MUTUAL FUNDS(cost USD 1,312,226) 1,379,146 3.52
TOTAL TRANSFERABLE SECURITIES ADMITTEDTO AN OFFICIAL EXCHANGE LISTING(cost USD 40,644,459) 38,944,684 99.29
MARKET VALUE OF INVESTMENTS(cost USD 40,644,459) 38,944,684 99.29
OTHER ASSETS AND LIABILITIES 278,060 0.71
SHAREHOLDERS’ EQUITY 39,222,744 100.00
TOTAL INVESTMENTSMarket Value
USD
% ofShareholders’
Equity
Total Investments (cost USD 40,644,459) 38,944,684 99.29Other Assets and Liabilities 278,060 0.71
Shareholders’ Equity 39,222,744 100.00+ A portion of these securities were on loan at 30 November 2020. See Note 6.(a) 144A: This security is issued to qualified institutional investors, pursuant to private
placements, and is transferable as stated in rule 144A of the US Securities Act of1933.
(b) Security holding is traded/held in USD. (ADR: American Depositary Receipt/GDR: Global Depositary Receipt).
(c) A related party to Goldman Sachs Funds.(d) The yield for this fund as at 30 November 2020 was 0.171%.
Allocation of Portfolio as at 30 November 2020
% ofShareholders’
Equity
Common StocksPipelines 51.88Oil & Gas 26.27Electric 8.68Energy Sources 4.24Chemicals 1.86Agriculture 1.09Holding Companies—Diversified 0.90Auto Parts & Equipment 0.85
TOTAL COMMON STOCKS 95.77
Mutual Funds 3.52
Other Assets and Liabilities 0.71
TOTAL 100.00
Goldman Sachs Funds—North America Energy & Energy Infrastructure EquityPortfolio
Schedule of InvestmentsAs at 30 November 2020
The accompanying notes are an integral part of these financial statements.
152

HoldingsSecurityDescription
Market ValueUSD
% ofShareholders’
Equity
Transferable securities admitted to an official exchange listing
Common Stocks – 98.53%Brazil
270,700 AES Tiete Energia S.A. 821,169 0.03349,800 Alpargatas S.A.—Preferred 2,733,204 0.10
2,485,400 B3 S.A. - Brasil Bolsa Balcao 26,556,701 0.98268,900 BB Seguridade Participacoes S.A. 1,490,568 0.0527,100 Cia Paranaense de Energia 335,316 0.01678,300 Cia Paranaense de
Energia—Preferred 8,950,022 0.331,035,600 Cia Siderurgica Nacional S.A. 4,636,141 0.172,390,260 Duratex S.A. 8,669,500 0.32761,700 Klabin S.A. 3,587,915 0.13
6,663,780 Petrobras Distribuidora S.A. 26,404,509 0.97280,700 Porto Seguro S.A. 2,600,524 0.10520,900 Sao Martinho S.A. 2,634,238 0.10255,900 Vale S.A.—ADR(a) 3,756,612 0.14
1,428,900 WEG S.A. 20,375,165 0.75
113,551,584 4.18
Chile942,800 Colbun S.A. 153,357 0.01
China812,700 Alibaba Group Holding Ltd.—ADR(a) 216,056,295 7.96
1,666,500 Anhui Conch Cement Co., Ltd. �H� 10,675,743 0.39396,900 Baidu, Inc.—ADR(a) 54,510,246 2.01
12,012,000 Bank of China Ltd. �H� 4,245,341 0.1613,264,000 Bank of Communications Co., Ltd.
�H� 7,346,517 0.27236,376 BYD Co., Ltd. �A� 6,211,373 0.2366,000 BYD Co., Ltd. �H� 1,548,936 0.06
1,908,500 China Hongqiao Group Ltd. 1,666,841 0.069,814,000 China Lesso Group Holdings Ltd. 17,549,948 0.6513,981,000 China Life Insurance Co., Ltd. �H� 31,769,083 1.1712,715,000 China Longyuan Power Group
Corp., Ltd. �H� 10,708,152 0.3911,965,000 China Medical System Holdings Ltd. 12,232,594 0.45426,000 China Meidong Auto Holdings Ltd. 1,847,926 0.07
3,822,000 China National Building Material Co.,Ltd. �H� 5,024,413 0.18
10,240,000 China Petroleum & Chemical Corp.�H� 4,661,404 0.17
6,136,000 China Shenhua Energy Co., Ltd. �H� 11,869,913 0.442,735,637 China South Publishing & Media
Group Co., Ltd. �A� 4,482,894 0.177,369,252 China Yangtze Power Co., Ltd. �A� 22,561,628 0.832,746,500 China Yongda Automobiles Services
Holdings Ltd. 4,698,076 0.1716,631,480 Chinese Universe Publishing and
Media Group Co., Ltd. �A� 29,788,430 1.10405,665 Chongqing Changan Automobile
Co., Ltd. �A� 1,562,576 0.06859,000 Chongqing Rural Commercial Bank
Co., Ltd. �H� 368,246 0.011,811,500 COSCO SHIPPING Holdings Co.,
Ltd. �H� 1,695,437 0.06854,500 CSC Financial Co., Ltd. �H� 144A(b) 1,172,321 0.04401,000 Dongfang Electric Corp., Ltd. �H� 299,113 0.01
18,831,589 Focus Media Information TechnologyCo., Ltd. �A� 27,840,047 1.03
2,422,000 Great Wall Motor Co., Ltd. �H� 4,915,515 0.1874,500 Hengan International Group Co.,
Ltd. 514,627 0.02421,723 Huayu Automotive Systems Co., Ltd.
�A� 2,009,180 0.0720,303,000 Industrial & Commercial Bank of
China Ltd. �H� 12,899,028 0.48776,900 JD.com, Inc.—ADR(a) 66,541,485 2.45
1,784,804 Jiangsu Yuyue Medical Equipment &Supply Co., Ltd. �A� 7,522,454 0.28
1,818,195 Liaoning Cheng Da Co., Ltd. �A� 6,252,175 0.232,375,000 Logan Group Co., Ltd. 3,980,268 0.15
HoldingsSecurityDescription
Market ValueUSD
% ofShareholders’
Equity
Common Stocks – (Continued)China – (Continued)
671,500 Longfor Group Holdings Ltd. 4,402,248 0.1630,836 LONGi Green Energy Technology
Co., Ltd. �A� 322,975 0.01483,000 Lonking Holdings Ltd. 139,691 0.01
1,469,300 Meituan Dianping �B� 55,063,765 2.03160,100 NetEase, Inc.—ADR(a) 14,645,948 0.54293,800 NIO, Inc.—ADR(a) 15,462,694 0.5779,900 Pinduoduo, Inc.—ADR(a) 11,160,432 0.41
1,916,000 Powerlong Real Estate Holdings Ltd. 1,385,878 0.05616,010 Shaanxi Coal Industry Co., Ltd. �A� 979,883 0.04464,061 Shenzhen Mindray Bio-Medical
Electronics Co., Ltd. �A� 23,840,378 0.885,072,000 Sinotruk Hong Kong Ltd. 12,606,317 0.462,643,500 Tencent Holdings Ltd. 192,968,309 7.11
+ 1,620,000 Tianneng Power International Ltd. 3,398,097 0.1324,800 Tsingtao Brewery Co., Ltd. �A� 343,801 0.01332,000 Tsingtao Brewery Co., Ltd. �H� 3,227,877 0.12
1,805,400 Vipshop Holdings Ltd.—ADR(a) 45,459,972 1.675,483,482 Weichai Power Co., Ltd. �A� 13,948,848 0.513,884,000 Weichai Power Co., Ltd. �H� 7,939,938 0.291,250,000 Xinyi Energy Holdings Ltd. 721,555 0.033,022,500 Zhongsheng Group Holdings Ltd. 22,738,602 0.846,518,000 Zijin Mining Group Co., Ltd. �H� 6,499,712 0.24
1,034,285,145 38.11
Hong Kong5,842,000 Brilliance China Automotive Holdings
Ltd. 5,208,425 0.193,179,000 China High Speed Transmission
Equipment Group Co., Ltd. 2,280,161 0.09528,000 China Resources Beer Holdings Co.,
Ltd. 3,901,698 0.14107,500 Shimao Group Holdings Ltd. 401,267 0.02
6,905,000 SITC International Holdings Co., Ltd. 13,286,863 0.491,946,000 Xinyi Glass Holdings Ltd. 4,371,483 0.16
29,449,897 1.09
Hungary236,140 OTP Bank Nyrt 9,494,763 0.35169,508 Richter Gedeon Nyrt 4,024,833 0.15
13,519,596 0.50
India8,443 APL Apollo Tubes Ltd. 384,640 0.0116,131 Apollo Hospitals Enterprise Ltd. 511,422 0.02931,049 Aurobindo Pharma Ltd. 10,909,527 0.40
2,279,515 Cadila Healthcare Ltd. 13,832,104 0.51137,289 Cipla Ltd. 1,380,771 0.05127,138 Coromandel International Ltd. 1,419,991 0.05381,789 Divi’s Laboratories Ltd. 18,556,896 0.6827,500 Dr Lal PathLabs Ltd. 144A(b) 849,640 0.03222,637 Dr Reddy’s Laboratories
Ltd.—ADR(a) 14,584,950 0.54245,715 Escorts Ltd. 4,653,466 0.17159,465 FDC Ltd. 738,420 0.03626,960 Granules India Ltd. 3,483,675 0.13764,204 HCL Technologies Ltd. 8,481,129 0.31635,167 Hero MotoCorp Ltd. 26,613,167 0.98522,692 Housing Development Finance
Corp., Ltd. 15,895,991 0.5954,908 ICICI Lombard General Insurance
Co., Ltd. 144A(b) 1,075,660 0.04373,406 ICICI Securities Ltd. 144A(b) 2,257,892 0.08213,976 Indiabulls Housing Finance Ltd. 539,253 0.02
3,658,145 Infosys Ltd.—ADR(a) 54,927,047 2.02920,248 Jindal Steel & Power Ltd. 3,019,638 0.11443,532 LIC Housing Finance Ltd. 1,966,230 0.07
1,257,769 Manappuram Finance Ltd. 3,050,403 0.11488,693 Mindtree Ltd. 9,348,792 0.34551,035 Mphasis Ltd. 9,775,538 0.36
Goldman Sachs Funds—Emerging Markets CORE® Equity PortfolioSchedule of InvestmentsAs at 30 November 2020
The accompanying notes are an integral part of these financial statements.
153

HoldingsSecurityDescription
Market ValueUSD
% ofShareholders’
Equity
Common Stocks – (Continued)India – (Continued)
838,128 Muthoot Finance Ltd. 13,020,742 0.487,558 Pfizer Ltd. 520,265 0.02
3,451,831 Power Finance Corp., Ltd. 5,034,356 0.196,761,189 REC Ltd. 11,071,801 0.41
6,934 Sanofi India Ltd. 772,896 0.03798,499 Tata Consultancy Services Ltd. 28,892,873 1.07190,656 Tata Steel Ltd. 1,481,718 0.06
2,146,737 Torrent Power Ltd. 9,153,378 0.34
278,204,271 10.25
Indonesia74,787,200 Adaro Energy Tbk PT 7,343,260 0.2713,306,500 Bank Central Asia Tbk PT 29,233,834 1.0832,582,400 Bank Mandiri Persero Tbk PT 14,665,860 0.5465,237,100 Bank Rakyat Indonesia Persero Tbk
PT 18,881,522 0.7010,464,700 Bukit Asam Tbk PT 1,744,793 0.066,772,300 Mitra Keluarga Karyasehat Tbk PT 1,294,987 0.05
73,164,256 2.70
Luxembourg10,500 Ternium S.A.—ADR(a) 287,910 0.01
Mexico2,401,100 Fibra Uno Administracion S.A. de
CV 2,383,460 0.09984,217 Gruma SAB de CV �B� 11,096,370 0.41369,100 Grupo Financiero Banorte SAB de
CV �O� 1,908,051 0.073,303,187 Grupo Mexico SAB de CV �B� 11,661,307 0.437,726,887 Kimberly-Clark de Mexico SAB de
CV �A� 12,526,967 0.46458,069 Orbia Advance Corp., SAB de CV 919,902 0.03952,268 Qualitas Controladora SAB de CV 4,686,994 0.17
45,183,051 1.66
Peru732,800 Southern Copper Corp. 44,363,712 1.63
Philippines712,070 International Container Terminal
Services, Inc. 1,729,489 0.06
Poland+ 2,882 Mercator Medical S.A. 394,070 0.02
45,681 Powszechny Zaklad UbezpieczenS.A. 313,411 0.01
707,481 0.03
Qatar4,125,234 Masraf Al Rayan QSC 4,837,461 0.181,113,769 Qatar Gas Transport Co., Ltd. 990,479 0.03396,735 Qatar Islamic Bank SAQ 1,814,643 0.0715,685 Qatar National Bank QPSC 76,298 0.00
7,718,881 0.28
Russia256,411 LUKOIL PJSC—ADR(a) 17,030,819 0.6397,160 MMC Norilsk Nickel PJSC—ADR(a) 2,748,656 0.10664,200 Moscow Exchange MICEX-RTS
PJSC 1,334,248 0.0549,104 Novolipetskiy Metallurgicheskiy
Kombinat PAO—GDR(a) 1,246,260 0.05221,711,000 RusHydro PJSC 2,271,008 0.0816,059,210 Sberbank of Russia PJSC 52,740,049 1.94
21,894 Severstal PJSC—GDR(a) 323,155 0.01
77,694,195 2.86
Saudi Arabia89,926 Abdullah Al Othaim Markets Co. 3,048,424 0.11179,633 Advanced Petrochemical Co. 2,946,832 0.11
HoldingsSecurityDescription
Market ValueUSD
% ofShareholders’
Equity
Common Stocks – (Continued)Saudi Arabia – (Continued)
695,332 Al Rajhi Bank 13,867,337 0.5117,156 Bupa Arabia for Cooperative
Insurance Co. 574,979 0.0249,662 Saudi Ceramic Co. 603,131 0.02184,182 Savola Group 2,262,664 0.09
23,303,367 0.86
Singapore3,731,000 IGG, Inc. 3,733,906 0.14
South Africa280,809 Absa Group Ltd. 2,016,299 0.07316,530 African Rainbow Minerals Ltd. 5,026,738 0.19294,811 Anglo American Platinum Ltd. 21,633,048 0.80253,688 Coronation Fund Managers Ltd. 697,218 0.03140,884 Investec Ltd. 346,255 0.01378,467 Life Healthcare Group Holdings Ltd. 390,858 0.01
1,527,360 Momentum Metropolitan Holdings 1,519,647 0.0620,695 Naspers Ltd. �N� 4,211,168 0.15208,381 Remgro Ltd. 1,240,714 0.05
1,774,739 Sanlam Ltd. 6,447,920 0.24156,160 SPAR Group Ltd. 1,937,412 0.07
1,820,324 Standard Bank Group Ltd. 14,440,426 0.53
59,907,703 2.21
South Korea70,136 Cheil Worldwide, Inc. 1,318,798 0.0530,734 Chong Kun Dang Pharmaceutical
Corp. 4,845,459 0.18131,324 Daou Data Corp. 1,493,570 0.06365,631 DB HiTek Co., Ltd. 11,756,050 0.43119,648 DongKook Pharmaceutical Co., Ltd. 2,777,076 0.10137,250 Echo Marketing, Inc. 3,127,345 0.12297,032 Han Kuk Carbon Co., Ltd. 3,543,380 0.13319,958 Hana Financial Group, Inc. 9,825,450 0.3667,464 Hanjin Transportation Co., Ltd. 2,986,051 0.1160,531 Hansol Chemical Co., Ltd. 8,553,509 0.3259,383 Huons Global Co., Ltd. 1,662,608 0.06416,182 KB Financial Group, Inc. 17,320,741 0.6420,320 KIWOOM Securities Co., Ltd. 2,282,627 0.0835,887 Kumho Petrochemical Co., Ltd. 4,520,415 0.1727,719 LabGenomics Co., Ltd. 552,941 0.0240,062 LEENO Industrial, Inc. 4,431,126 0.1674,392 LG Chem Ltd. 53,984,383 1.9910,379 LG Corp. 663,415 0.0227,700 MagnaChip Semiconductor Corp. 393,063 0.0130,614 MiCo Ltd. 416,961 0.02
4,038,420 Mirae Asset Daewoo Co., Ltd. 34,722,722 1.28146,345 Mirae Asset Daewoo Co.,
Ltd.—Preferred 616,478 0.02105,944 NAVER Corp. 26,629,234 0.9874,101 NICE Information Service Co., Ltd. 1,436,030 0.0581,026 POSCO 17,238,829 0.6417,759 Samjin Pharmaceutical Co., Ltd. 461,791 0.0218,501 Samsung Biologics Co., Ltd. 13,164,078 0.49
2,342,055 Samsung Electronics Co., Ltd. 141,526,998 5.21337,717 Samsung Electronics Co.,
Ltd.—Preferred 18,689,489 0.6966,039 Samsung Life Insurance Co., Ltd. 4,265,811 0.1617,451 SK Chemicals Co., Ltd. 6,734,093 0.2520,020 SK Gas Ltd. 1,929,736 0.07112,122 Suheung Co., Ltd. 4,963,440 0.1861,976 Yuhan Corp. 3,615,221 0.13
412,448,918 15.20
Taiwan5,781,000 Ardentec Corp. 7,586,904 0.28445,000 Chailease Holding Co., Ltd. 2,440,985 0.09
8,046,000 Cheng Loong Corp. 8,979,548 0.331,175,000 Chicony Power Technology Co., Ltd. 2,777,688 0.101,007,000 China General Plastics Corp. 841,812 0.03
Goldman Sachs Funds—Emerging Markets CORE® Equity PortfolioSchedule of InvestmentsAs at 30 November 2020
The accompanying notes are an integral part of these financial statements.
154

HoldingsSecurityDescription
Market ValueUSD
% ofShareholders’
Equity
Common Stocks – (Continued)Taiwan – (Continued)
2,150,000 ChipMOS Technologies, Inc. 2,405,235 0.09142,000 Delta Electronics, Inc. 1,119,725 0.04364,000 Dynapack International Technology
Corp. 1,067,830 0.0414,256,000 Evergreen Marine Corp. Taiwan Ltd. 12,370,572 0.462,382,000 Everlight Electronics Co., Ltd. 3,096,006 0.11299,000 Fubon Financial Holding Co., Ltd. 465,124 0.02307,000 Giant Manufacturing Co., Ltd. 3,046,741 0.11
3,653,000 Gigabyte Technology Co., Ltd. 10,071,624 0.37278,000 Global Mixed Mode Technology, Inc. 1,582,496 0.06
1,695,000 Ho Tung Chemical Corp. 604,053 0.02396,000 International Games System Co.,
Ltd. 9,434,444 0.3575,000 Marketech International Corp. 295,115 0.01106,000 momo.com, Inc. 2,305,763 0.08445,000 Nantex Industry Co., Ltd. 959,580 0.04405,000 Pan Jit International, Inc. 634,793 0.02599,000 Sanyang Motor Co., Ltd. 778,920 0.03
1,330,000 Simplo Technology Co., Ltd. 15,465,364 0.57504,000 Soft-World International Corp. 1,598,089 0.06
1,402,000 Sonix Technology Co., Ltd. 3,290,959 0.123,499,000 Synnex Technology International
Corp. 5,466,603 0.20429,000 Systex Corp. 1,272,309 0.05
1,841,000 Taiwan SemiconductorManufacturing Co., Ltd.—ADR(a) 179,442,270 6.61
7,159,000 Teco Electric and Machinery Co.,Ltd. 7,428,715 0.27
1,725,000 Topco Scientific Co., Ltd. 7,362,612 0.279,640,000 Tung Ho Steel Enterprise Corp. 11,320,598 0.4226,928,000 United Microelectronics Corp. 38,448,935 1.42356,000 Universal Vision Biotechnology Co.,
Ltd. 3,711,560 0.14108,000 Universal, Inc. 403,543 0.01
2,064,000 USI Corp. 1,443,067 0.051,467,000 Vanguard International
Semiconductor Corp. 5,409,121 0.202,990,000 Walsin Lihwa Corp. 2,037,757 0.085,057,000 Youngtek Electronics Corp. 11,116,867 0.41550,000 YungShin Global Holding Corp. 885,362 0.03
368,968,689 13.59
Thailand13,134,200 Charoen Pokphand Foods PCL 12,478,516 0.465,708,000 Chularat Hospital PCL �F� 479,283 0.028,647,300 Com7 PCL �F� 11,717,191 0.43161,500 Hana Microelectronics PCL 228,541 0.01196,700 Kiatnakin Bank PCL 321,753 0.01
2,407,600 RS PCL 1,408,924 0.05304,100 Siam Cement PCL 3,760,795 0.14968,600 Siam Commercial Bank PCL 2,731,601 0.10
1,677,800 Siam Global House PCL 1,004,669 0.048,799,000 Sri Trang Agro-Industry PCL 7,784,400 0.282,387,500 Thanachart Capital PCL 2,682,115 0.10
44,597,788 1.64
Turkey580,209 Anadolu Efes Biracilik Ve Malt
Sanayii AS 1,585,628 0.06501,934 Arcelik AS 1,749,320 0.06
2,374,144 BIM Birlesik Magazalar AS 21,323,555 0.79121,741 Coca-Cola Icecek AS 896,391 0.03
1,819,658 Enerjisa Enerji AS 144A(b) 2,507,384 0.09371,755 Enka Insaat ve Sanayi AS 331,992 0.01290,126 Ford Otomotiv Sanayi AS 4,023,754 0.15474,072 Haci Omer Sabanci Holding AS 590,164 0.02379,586 Turk Traktor ve Ziraat Makineleri AS 6,726,287 0.25
39,734,475 1.46
HoldingsSecurityDescription
Market ValueUSD
% ofShareholders’
Equity
Common Stocks – (Continued)United Arab Emirates
281,440 Emirates NBD Bank PJSC 839,298 0.03175,516 Emirates Telecommunications
Group Co., PJSC 827,265 0.03
1,666,563 0.06
TOTAL COMMON STOCKS(cost USD 2,231,638,550) 2,674,374,234 98.53
TOTAL TRANSFERABLE SECURITIES ADMITTEDTO AN OFFICIAL EXCHANGE LISTING(cost USD 2,231,638,550) 2,674,374,234 98.53
MARKET VALUE OF INVESTMENTS EXCLUDINGDERIVATIVES(cost USD 2,231,638,550) 2,674,374,234 98.53
Futures Contracts – 0.05%
Number ofContracts Security Description
CommitmentMarketValueUSD
UnrealisedGainUSD
% ofShareholders’
Equity
USD260 MSCI Emerging
Markets Index Futures18/12/2020
Long 15,804,100 1,279,222 0.05
UNREALISED GAIN ON FUTURES CONTRACTS 1,279,222 0.05
Share Class Specific Forward Currency Contracts – 0.00%
CurrencyAmountBought Currency
AmountSold
MaturityDate
UnrealisedGainUSD
% ofShareholders’
Equity
CHF 96,156 USD 105,606 23/12/2020 864 0.00EUR 254,235 USD 301,690 23/12/2020 3,485 0.00PLN 426,028 USD 113,231 23/12/2020 1,014 0.00
UNREALISED GAIN ON FORWARD CURRENCYCONTRACTS HELD FOR HEDGING PURPOSES 5,363 0.00
MARKET VALUE OF INVESTMENTS(cost USD 2,231,638,550) 2,675,658,819 98.58
OTHER ASSETS AND LIABILITIES 38,550,489 1.42
SHAREHOLDERS’ EQUITY 2,714,209,308 100.00
TOTAL INVESTMENTSMarket Value
USD
% ofShareholders’
Equity
Total Investments excluding derivatives (costUSD 2,231,638,550) 2,674,374,234 98.53
Unrealised gain on futures contracts 1,279,222 0.05Unrealised gain on forward currency contracts held for hedgingpurposes 5,363 0.00
Other Assets and Liabilities 38,550,489 1.42
Shareholders’ Equity 2,714,209,308 100.00
The Futures Commission Merchant was Goldman Sachs & Co. LLC.
The counterparties for forward currency contracts were Barclays Bank Plc., BNP ParibasS.A., JP Morgan Chase Bank N.A., Morgan Stanley & Co. International Plc., NatwestMarkets Plc., Standard Chartered Bank and UBS AG.
The maximum individual counterparty exposure as at 30 November 2020 is 0.05% of theNAV.
+ A portion of these securities were on loan at 30 November 2020. See Note 6.(a) Security holding is traded/held in USD. (ADR: American Depositary Receipt/
GDR: Global Depositary Receipt).(b) 144A: This security is issued to qualified institutional investors, pursuant to private
placements, and is transferable as stated in rule 144A of the US Securities Act of1933.
Goldman Sachs Funds—Emerging Markets CORE® Equity PortfolioSchedule of InvestmentsAs at 30 November 2020
The accompanying notes are an integral part of these financial statements.
155

Allocation of Portfolio as at 30 November 2020
% ofShareholders’
Equity
Common StocksInternet 24.77Semiconductors 15.66Banks 7.20Diversified Financial Services 5.85Computers 4.21Mining 3.45Pharmaceuticals 3.24Chemicals 3.06Food, Beverages & Tobacco 2.23Electric 2.11Others 26.75
TOTAL COMMON STOCKS 98.53
Unrealised Gain on Futures Contracts 0.05
Unrealised Gain on Forward Currency Contracts Held for HedgingPurposes
0.00
Other Assets and Liabilities 1.42
TOTAL 100.00
Goldman Sachs Funds—Emerging Markets CORE® Equity PortfolioSchedule of InvestmentsAs at 30 November 2020
The accompanying notes are an integral part of these financial statements.
156
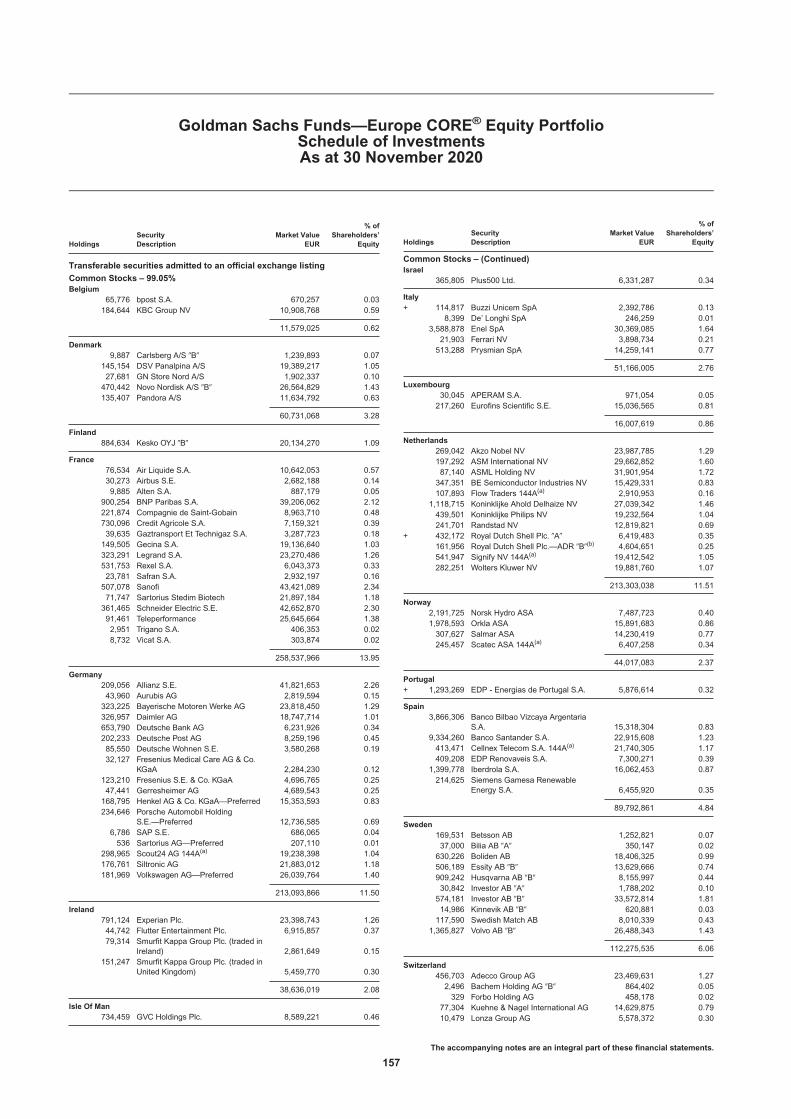
HoldingsSecurityDescription
Market ValueEUR
% ofShareholders’
Equity
Transferable securities admitted to an official exchange listing
Common Stocks – 99.05%Belgium
65,776 bpost S.A. 670,257 0.03184,644 KBC Group NV 10,908,768 0.59
11,579,025 0.62
Denmark9,887 Carlsberg A/S �B� 1,239,893 0.07
145,154 DSV Panalpina A/S 19,389,217 1.0527,681 GN Store Nord A/S 1,902,337 0.10470,442 Novo Nordisk A/S �B� 26,564,829 1.43135,407 Pandora A/S 11,634,792 0.63
60,731,068 3.28
Finland884,634 Kesko OYJ �B� 20,134,270 1.09
France76,534 Air Liquide S.A. 10,642,053 0.5730,273 Airbus S.E. 2,682,188 0.149,885 Alten S.A. 887,179 0.05
900,254 BNP Paribas S.A. 39,206,062 2.12221,874 Compagnie de Saint-Gobain 8,963,710 0.48730,096 Credit Agricole S.A. 7,159,321 0.3939,635 Gaztransport Et Technigaz S.A. 3,287,723 0.18149,505 Gecina S.A. 19,136,640 1.03323,291 Legrand S.A. 23,270,486 1.26531,753 Rexel S.A. 6,043,373 0.3323,781 Safran S.A. 2,932,197 0.16507,078 Sanofi 43,421,089 2.3471,747 Sartorius Stedim Biotech 21,897,184 1.18361,465 Schneider Electric S.E. 42,652,870 2.3091,461 Teleperformance 25,645,664 1.382,951 Trigano S.A. 406,353 0.028,732 Vicat S.A. 303,874 0.02
258,537,966 13.95
Germany209,056 Allianz S.E. 41,821,653 2.2643,960 Aurubis AG 2,819,594 0.15323,225 Bayerische Motoren Werke AG 23,818,450 1.29326,957 Daimler AG 18,747,714 1.01653,790 Deutsche Bank AG 6,231,926 0.34202,233 Deutsche Post AG 8,259,196 0.4585,550 Deutsche Wohnen S.E. 3,580,268 0.1932,127 Fresenius Medical Care AG & Co.
KGaA 2,284,230 0.12123,210 Fresenius S.E. & Co. KGaA 4,696,765 0.2547,441 Gerresheimer AG 4,689,543 0.25168,795 Henkel AG & Co. KGaA—Preferred 15,353,593 0.83234,646 Porsche Automobil Holding
S.E.—Preferred 12,736,585 0.696,786 SAP S.E. 686,065 0.04536 Sartorius AG—Preferred 207,110 0.01
298,965 Scout24 AG 144A(a) 19,238,398 1.04176,761 Siltronic AG 21,883,012 1.18181,969 Volkswagen AG—Preferred 26,039,764 1.40
213,093,866 11.50
Ireland791,124 Experian Plc. 23,398,743 1.2644,742 Flutter Entertainment Plc. 6,915,857 0.3779,314 Smurfit Kappa Group Plc. (traded in
Ireland) 2,861,649 0.15151,247 Smurfit Kappa Group Plc. (traded in
United Kingdom) 5,459,770 0.30
38,636,019 2.08
Isle Of Man734,459 GVC Holdings Plc. 8,589,221 0.46
HoldingsSecurityDescription
Market ValueEUR
% ofShareholders’
Equity
Common Stocks – (Continued)Israel
365,805 Plus500 Ltd. 6,331,287 0.34
Italy+ 114,817 Buzzi Unicem SpA 2,392,786 0.13
8,399 De’ Longhi SpA 246,259 0.013,588,878 Enel SpA 30,369,085 1.6421,903 Ferrari NV 3,898,734 0.21513,288 Prysmian SpA 14,259,141 0.77
51,166,005 2.76
Luxembourg30,045 APERAM S.A. 971,054 0.05217,260 Eurofins Scientific S.E. 15,036,565 0.81
16,007,619 0.86
Netherlands269,042 Akzo Nobel NV 23,987,785 1.29197,292 ASM International NV 29,662,852 1.6087,140 ASML Holding NV 31,901,954 1.72347,351 BE Semiconductor Industries NV 15,429,331 0.83107,893 Flow Traders 144A(a) 2,910,953 0.16
1,118,715 Koninklijke Ahold Delhaize NV 27,039,342 1.46439,501 Koninklijke Philips NV 19,232,564 1.04241,701 Randstad NV 12,819,821 0.69
+ 432,172 Royal Dutch Shell Plc. �A� 6,419,483 0.35161,956 Royal Dutch Shell Plc.—ADR �B�(b) 4,604,651 0.25541,947 Signify NV 144A(a) 19,412,542 1.05282,251 Wolters Kluwer NV 19,881,760 1.07
213,303,038 11.51
Norway2,191,725 Norsk Hydro ASA 7,487,723 0.401,978,593 Orkla ASA 15,891,683 0.86307,627 Salmar ASA 14,230,419 0.77245,457 Scatec ASA 144A(a) 6,407,258 0.34
44,017,083 2.37
Portugal+ 1,293,269 EDP - Energias de Portugal S.A. 5,876,614 0.32
Spain3,866,306 Banco Bilbao Vizcaya Argentaria
S.A. 15,318,304 0.839,334,260 Banco Santander S.A. 22,915,608 1.23413,471 Cellnex Telecom S.A. 144A(a) 21,740,305 1.17409,208 EDP Renovaveis S.A. 7,300,271 0.39
1,399,778 Iberdrola S.A. 16,062,453 0.87214,625 Siemens Gamesa Renewable
Energy S.A. 6,455,920 0.35
89,792,861 4.84
Sweden169,531 Betsson AB 1,252,821 0.0737,000 Bilia AB �A� 350,147 0.02630,226 Boliden AB 18,406,325 0.99506,189 Essity AB �B� 13,629,666 0.74909,242 Husqvarna AB �B� 8,155,997 0.4430,842 Investor AB �A� 1,788,202 0.10574,181 Investor AB �B� 33,572,814 1.8114,986 Kinnevik AB �B� 620,881 0.03117,590 Swedish Match AB 8,010,339 0.43
1,365,827 Volvo AB �B� 26,488,343 1.43
112,275,535 6.06
Switzerland456,703 Adecco Group AG 23,469,631 1.272,496 Bachem Holding AG �B� 864,402 0.05329 Forbo Holding AG 458,178 0.02
77,304 Kuehne & Nagel International AG 14,629,875 0.7910,479 Lonza Group AG 5,578,372 0.30
Goldman Sachs Funds—Europe CORE® Equity PortfolioSchedule of InvestmentsAs at 30 November 2020
The accompanying notes are an integral part of these financial statements.
157

HoldingsSecurityDescription
Market ValueEUR
% ofShareholders’
Equity
Common Stocks – (Continued)Switzerland – (Continued)
969,768 Nestle S.A. 91,281,905 4.92468,883 Novartis AG 35,304,394 1.90258,146 Roche Holding AG 71,757,935 3.8779,607 Sika AG 17,158,181 0.9384,736 Sonova Holding AG 17,826,026 0.96533,984 STMicroelectronics NV 17,728,269 0.964,470 Swatch Group AG 935,001 0.0532,142 Swiss Life Holding AG 12,186,575 0.6650,264 Tecan Group AG 18,542,928 1.00
+ 1,155,484 UBS Group AG 13,875,103 0.75104,716 Zurich Insurance Group AG 35,984,641 1.94
377,581,416 20.37
United Kingdom304,757 3i Group Plc. 3,671,041 0.20
1,091,596 Anglo American Plc. 27,557,828 1.49256,194 Associated British Foods Plc. 6,075,012 0.3351,268 AstraZeneca Plc.—ADR(b) 2,274,589 0.12
6,455,730 Aviva Plc. 23,440,876 1.261,408,900 Barratt Developments Plc. 9,823,105 0.531,828,805 boohoo Group Plc. 6,434,505 0.351,815,707 BP Plc.—ADR(b) 31,014,829 1.678,562,358 BT Group Plc. 11,340,196 0.611,480,468 CNH Industrial NV 13,756,509 0.74208,457 Diageo Plc. 6,760,377 0.3664,883 Dialog Semiconductor Plc. 2,930,765 0.16
4,401,763 Direct Line Insurance Group Plc. 14,569,598 0.791,476,510 Fiat Chrysler Automobiles NV 19,531,274 1.0521,230 Games Workshop Group Plc. 2,314,726 0.13578,377 GlaxoSmithKline Plc.—ADR(b) 17,979,809 0.97
1,281,086 Imperial Brands Plc. 19,830,556 1.0767,782 Inchcape Plc. 454,528 0.02
4,033,871 ITV Plc. 4,263,253 0.23439,031 JD Sports Fashion Plc. 3,795,664 0.21
4,073,436 Legal & General Group Plc. 11,679,993 0.6368,429 National Grid Plc. 659,883 0.04267,549 Rentokil Initial Plc. 1,489,278 0.08233,641 Rightmove Plc. 1,646,699 0.09718,580 Rio Tinto Plc.—ADR(b) 39,566,681 2.1368,957 Segro Plc. 698,800 0.04520,235 Smith & Nephew Plc. 8,537,252 0.46392,791 Tate & Lyle Plc. 2,810,425 0.15263,127 Unilever Plc.—ADR(b) 13,450,835 0.73
308,358,886 16.64
TOTAL COMMON STOCKS(cost EUR 1,634,381,522) 1,836,011,779 99.05
Warrants – 0.00%Switzerland
19,948 Cie Financiere Richemont S.A., exp.11/23—Warrants 3,496 0.00
TOTAL WARRANTS(cost EUR nil) 3,496 0.00
TOTAL TRANSFERABLE SECURITIES ADMITTEDTO AN OFFICIAL EXCHANGE LISTING(cost EUR 1,634,381,522) 1,836,015,275 99.05
MARKET VALUE OF INVESTMENTS EXCLUDINGDERIVATIVES(cost EUR 1,634,381,522) 1,836,015,275 99.05
Forward Currency Contracts – 0.00%
CurrencyAmountBought Currency
AmountSold
MaturityDate
UnrealisedGainEUR
% ofShareholders’
Equity
EUR 927,223 GBP 826,000 01/12/2020 6,369 0.00
UNREALISED GAIN ON FORWARD CURRENCYCONTRACTS 6,369 0.00
CurrencyAmountBought Currency
AmountSold
MaturityDate
UnrealisedLossEUR
% ofShareholders’
Equity
EUR 3,325,899 GBP 2,990,000 02/12/2020 (7,459) (0.00)USD 846,000 EUR 707,265 02/12/2020 (2,000) (0.00)
UNREALISED LOSS ON FORWARD CURRENCYCONTRACTS (9,459) (0.00)
Share Class Specific Forward Currency Contracts – (0.07%)
CurrencyAmountBought Currency
AmountSold
MaturityDate
UnrealisedGainEUR
% ofShareholders’
Equity
CHF 39,624 GBP 32,749 23/12/2020 53 0.00EUR 5,806,744 CHF 6,274,593 23/12/2020 18,642 0.00EUR 8,029,366 GBP 7,172,066 23/12/2020 36,964 0.01EUR 54,517 USD 64,690 23/12/2020 634 0.00PLN 58,541 CHF 14,168 23/12/2020 9 0.00PLN 82,015 GBP 16,405 23/12/2020 39 0.00
UNREALISED GAIN ON FORWARD CURRENCYCONTRACTS HELD FOR HEDGING PURPOSES 56,341 0.01
CurrencyAmountBought Currency
AmountSold
MaturityDate
UnrealisedLossEUR
% ofShareholders’
Equity
CHF 103,866 EUR 96,135 23/12/2020 (326) (0.00)CHF 1,658 NOK 16,390 23/12/2020 (22) (0.00)CHF 9,921 SEK 93,816 23/12/2020 (67) (0.00)EUR 329,906 NOK 3,523,732 23/12/2020 (3,618) (0.00)EUR 1,983,146 SEK 20,263,497 23/12/2020 (7,790) (0.00)PLN 207,554 EUR 46,484 23/12/2020 (116) (0.00)PLN 3,305 NOK 7,903 23/12/2020 (10) (0.00)PLN 19,639 SEK 44,919 23/12/2020 (26) (0.00)SGD 325,865,716 EUR 204,425,013 23/12/2020 (1,446,644) (0.08)USD 41,156 CHF 37,485 23/12/2020 (292) (0.00)USD 146,351 EUR 123,347 23/12/2020 (1,425) (0.00)USD 56,917 GBP 42,846 23/12/2020 (334) (0.00)USD 1,128 NOK 10,156 23/12/2020 (21) (0.00)USD 13,954 SEK 120,153 23/12/2020 (181) (0.00)
UNREALISED LOSS ON FORWARD CURRENCYCONTRACTS HELD FOR HEDGING PURPOSES (1,460,872) (0.08)
MARKET VALUE OF INVESTMENTS(cost EUR 1,634,381,522) 1,834,607,654 98.98
OTHER ASSETS AND LIABILITIES 18,954,885 1.02
SHAREHOLDERS’ EQUITY 1,853,562,539 100.00
TOTAL INVESTMENTSMarket Value
EUR
% ofShareholders’
Equity
Total Investments excluding derivatives (costEUR 1,634,381,522) 1,836,015,275 99.05
Unrealised gain on forward currency contracts 6,369 0.00Unrealised loss on forward currency contracts (9,459) (0.00)Unrealised gain on forward currency contracts held for hedgingpurposes 56,341 0.01
Unrealised loss on forward currency contracts held for hedgingpurposes (1,460,872) (0.08)
Other Assets and Liabilities 18,954,885 1.02
Shareholders’ Equity 1,853,562,539 100.00
Goldman Sachs Funds—Europe CORE® Equity PortfolioSchedule of InvestmentsAs at 30 November 2020
The accompanying notes are an integral part of these financial statements.
158

The counterparties for forward currency contracts were BNP Paribas S.A., Citibank N.A.,Deutsche Bank AG, JP Morgan Chase Bank N.A., Morgan Stanley & Co. InternationalPlc., Morgan Stanley & Co., Inc., Natwest Markets Plc., Standard Chartered Bank, StateStreet Bank & Trust and UBS AG.
The maximum individual counterparty exposure as at 30 November 2020 is 0.00% of theNAV.
+ A portion of these securities were on loan at 30 November 2020. See Note 6.(a) 144A: This security is issued to qualified institutional investors, pursuant to private
placements, and is transferable as stated in rule 144A of the US Securities Act of1933.
(b) Security holding is traded/held in USD. (ADR: American Depositary Receipt/GDR: Global Depositary Receipt).
Allocation of Portfolio as at 30 November 2020
% ofShareholders’
Equity
Common StocksFood, Beverages & Tobacco 11.51Pharmaceuticals 10.63Insurance 7.54Automobile Manufacturers 7.08Semiconductors 6.45Banks 6.25Electrical Components & Equipment 5.38Mining 5.01Healthcare Products 4.74Commercial Services 3.30Others 31.16
TOTAL COMMON STOCKS 99.05
WarrantsRetail 0.00
TOTAL WARRANTS 0.00
Unrealised Gain on Forward Currency Contracts 0.00
Unrealised Loss on Forward Currency Contracts (0.00)
Unrealised Gain on Forward Currency Contracts Held for HedgingPurposes
0.01
Unrealised Loss on Forward Currency Contracts Held for HedgingPurposes
(0.08)
Other Assets and Liabilities 1.02
TOTAL 100.00
Goldman Sachs Funds—Europe CORE® Equity PortfolioSchedule of InvestmentsAs at 30 November 2020
The accompanying notes are an integral part of these financial statements.
159

HoldingsSecurityDescription
Market ValueUSD
% ofShareholders’
Equity
Transferable securities admitted to an official exchange listing
Common Stocks – 99.44%Australia
1,028,884 Brambles Ltd. 8,343,164 0.222,500,359 Fortescue Metals Group Ltd. 33,685,448 0.90261,699 Goodman Group 3,618,427 0.1039,833 JB Hi-Fi Ltd. 1,345,528 0.03115,300 Pro Medicus Ltd. 2,515,856 0.0799,818 Rio Tinto Ltd. 7,482,050 0.2056,043 Sonic Healthcare Ltd. 1,364,739 0.04
58,355,212 1.56
Bermuda384,551 Athene Holding Ltd. �A� 17,435,542 0.47
Canada898,600 Alimentation Couche-Tard, Inc. �B� 29,841,010 0.80145,900 Barrick Gold Corp. 3,290,604 0.09
+ 96,300 Magna International, Inc. 5,975,239 0.16649,400 Manulife Financial Corp. 11,111,626 0.3016,600 Thomson Reuters Corp. 1,325,972 0.03
51,544,451 1.38
Denmark4,139 AP Moller - Maersk A/S �B� 8,510,187 0.2382,844 DSV Panalpina A/S 13,274,270 0.3572,204 Novo Nordisk A/S �B� 4,890,807 0.13
26,675,264 0.71
Finland43,296 Kesko OYJ �B� 1,182,057 0.03
France123,084 BNP Paribas S.A. 6,429,958 0.1753,744 Sartorius Stedim Biotech 19,675,820 0.52324,090 Schneider Electric S.E. 45,873,932 1.23
71,979,710 1.92
Germany16,203 Allianz S.E. 3,888,233 0.10673,487 Deutsche Post AG 32,993,872 0.8812,174 Gerresheimer AG 1,443,538 0.04139,944 Scout24 AG 144A(a) 10,802,423 0.2970,674 Siltronic AG 10,495,391 0.28
59,623,457 1.59
Hong Kong1,116,800 AIA Group Ltd. 12,251,142 0.3392,500 Sun Hung Kai Properties Ltd. 1,239,449 0.03
13,490,591 0.36
Ireland75,506 Jazz Pharmaceuticals Plc. 10,820,010 0.29
Israel124,470 Plus500 Ltd. 2,584,195 0.07
Italy1,185,383 Enel SpA 12,032,338 0.32226,329 Prysmian SpA 7,542,074 0.20
19,574,412 0.52
Japan519,600 Dai Nippon Printing Co., Ltd. 9,800,154 0.26372,800 DeNA Co., Ltd. 6,561,849 0.17124,600 Dentsu Group, Inc. 4,091,845 0.11276,700 Fujitsu Ltd. 38,646,145 1.03
1,306,400 Honda Motor Co., Ltd. 36,591,591 0.9821,200 Hoya Corp. 2,834,493 0.07
+ 288,500 Japan Tobacco, Inc. 5,881,150 0.16682,400 Konami Holdings Corp. 35,941,028 0.96287,000 M3, Inc. 26,563,590 0.71
HoldingsSecurityDescription
Market ValueUSD
% ofShareholders’
Equity
Common Stocks – (Continued)Japan – (Continued)
1,265,000 Mitsubishi Electric Corp. 18,701,476 0.502,301,100 Mitsubishi UFJ Financial Group, Inc. 9,965,368 0.27585,500 NEC Corp. 31,720,798 0.85513,300 Nippon Telegraph & Telephone
Corp. 12,182,752 0.32196,800 Nomura Research Institute Ltd. 6,660,976 0.18152,000 Omron Corp. 13,799,563 0.37
2,474,700 ORIX Corp. 37,081,853 0.9994,900 Rohm Co., Ltd. 7,965,810 0.21111,700 Sega Sammy Holdings, Inc. 1,576,690 0.04406,400 Sumitomo Mitsui Financial Group,
Inc. 11,814,641 0.32819,700 Takeda Pharmaceutical Co., Ltd. 29,455,544 0.7958,800 Teijin Ltd. 1,009,903 0.03161,200 TIS, Inc. 3,215,355 0.0942,400 Tokyo Electron Ltd. 14,496,132 0.39565,500 Toyota Motor Corp. 38,250,112 1.02
2,412,100 Yamada Holdings Co., Ltd. 11,511,574 0.314,264,900 Z Holdings Corp. 26,968,301 0.72
443,288,693 11.85
Luxembourg57,200 Eurofins Scientific S.E. 4,748,793 0.13
Netherlands253,646 ASM International NV 45,745,647 1.22968,266 Koninklijke Ahold Delhaize NV 28,073,054 0.7534,278 Koninklijke Philips NV 1,799,331 0.05209,111 NXP Semiconductors NV 33,357,387 0.8961,807 Signify NV 144A(a) 2,655,716 0.07
111,631,135 2.98
New Zealand232,555 Fisher & Paykel Healthcare Corp.,
Ltd. 5,879,619 0.16
Norway51,569 Salmar ASA 2,861,543 0.08
Singapore855,000 DBS Group Holdings Ltd. 16,104,960 0.43
Sweden460,491 Investor AB �B� 32,298,207 0.8665,689 Swedish Match AB 5,367,740 0.15675,307 Volvo AB �B� 15,710,090 0.42
53,376,037 1.43
Switzerland396,658 Adecco Group AG 24,451,581 0.652,137 Bachem Holding AG �B� 887,757 0.0242,984 Lonza Group AG 27,448,130 0.73168,932 Roche Holding AG 56,329,356 1.5147,636 Sonova Holding AG 12,020,989 0.3214,698 Tecan Group AG 6,504,259 0.18
127,642,072 3.41
United Kingdom3,123,650 Barclays Plc. 5,716,161 0.15173,101 Dialog Semiconductor Plc. 9,379,247 0.25
19,653,775 Lloyds Banking Group Plc. 9,613,010 0.261,084,929 Melrose Industries Plc. 2,284,405 0.06525,023 Rio Tinto Plc.—ADR(b) 34,677,769 0.93
1,377,159 TechnipFMC Plc. 12,174,086 0.3267,978 Unilever Plc.—ADR(b) 4,168,411 0.11
78,013,089 2.08
United States384,382 AbbVie, Inc. 40,313,984 1.08107,388 Adobe, Inc. 51,084,472 1.3624,232 Advanced Micro Devices, Inc. 2,173,126 0.06
Goldman Sachs Funds—Global CORE® Equity PortfolioSchedule of InvestmentsAs at 30 November 2020
The accompanying notes are an integral part of these financial statements.
160

HoldingsSecurityDescription
Market ValueUSD
% ofShareholders’
Equity
Common Stocks – (Continued)United States – (Continued)
62,144 AES Corp. 1,305,645 0.037,124 Align Technology, Inc. 3,422,370 0.09
322,004 Allstate Corp. 33,340,294 0.89592,247 Ally Financial, Inc. 18,122,758 0.4856,734 Alphabet, Inc. �C� 100,563,284 2.6923,760 Amazon.com, Inc. 75,485,520 2.0217,800 American Financial Group, Inc. 1,649,882 0.04149,064 Anthem, Inc. 46,973,048 1.2566,039 Aon Plc. �A� 13,587,524 0.36
1,133,647 Apple, Inc. 134,903,993 3.61355,428 Applied Materials, Inc. 29,137,987 0.7851,880 AvalonBay Communities, Inc. 8,674,855 0.23924,081 Axalta Coating Systems Ltd. 26,493,402 0.71133,655 Bank of New York Mellon Corp. 5,312,786 0.1440,581 Biogen, Inc. 9,769,470 0.2694,741 Black Knight, Inc. 8,699,119 0.23269,643 Brighthouse Financial, Inc. 9,933,648 0.2725,430 Camden Property Trust 2,501,041 0.0793,441 Capital One Financial Corp. 8,240,562 0.2256,278 Cardinal Health, Inc. 3,069,965 0.08251,617 Chevron Corp. 22,796,500 0.6132,258 Chipotle Mexican Grill, Inc. 41,410,885 1.1150,181 Cigna Corp. 10,612,278 0.28205,111 CME Group, Inc. 35,619,576 0.95137,105 CMS Energy Corp. 8,473,089 0.231,999 Cooper Cos., Inc. 672,703 0.0241,915 CoreSite Realty Corp. 5,246,081 0.14134,572 Costco Wholesale Corp. 52,075,327 1.39310,712 Dick’s Sporting Goods, Inc. 18,173,545 0.4921,638 DocuSign, Inc. 4,956,400 0.1314,192 Dow, Inc. 774,032 0.0250,409 Dropbox, Inc. �A� 1,003,391 0.03745,779 Duke Realty Corp. 28,660,287 0.77196,502 eBay, Inc. 9,869,313 0.26223,637 Edwards Lifesciences Corp. 18,821,290 0.50173,844 Entergy Corp. 19,173,255 0.5173,628 EOG Resources, Inc. 3,713,060 0.108,823 EPAM Systems, Inc. 2,821,948 0.08
408,912 Equity LifeStyle Properties, Inc. 23,982,689 0.64113,268 Etsy, Inc. 18,020,939 0.48147,602 Exxon Mobil Corp. 5,828,803 0.16301,030 Facebook, Inc. �A� 82,635,745 2.2131,894 FedEx Corp. 9,189,299 0.25204,801 Fidelity National Information
Services, Inc. 30,156,947 0.8127,265 First American Financial Corp. 1,339,257 0.04156,328 First Industrial Realty Trust, Inc. 6,611,111 0.1842,598 First Republic Bank 5,547,964 0.1580,575 First Solar, Inc. 7,553,101 0.20
3,355,814 Ford Motor Co. 30,504,349 0.81154,970 Gentex Corp. 5,070,618 0.1411,579 Global Payments, Inc. 2,258,716 0.0644,284 Globe Life, Inc. 4,212,294 0.11246,350 HCA Healthcare, Inc. 37,329,416 1.0054,834 Herbalife Nutrition Ltd. 2,677,544 0.0764,716 HollyFrontier Corp. 1,559,656 0.04412,772 Hologic, Inc. 28,551,439 0.7652,451 Humana, Inc. 21,247,900 0.575,195 IDEXX Laboratories, Inc. 2,367,725 0.06
1,230,715 Invitation Homes, Inc. 35,407,671 0.9530,695 Jabil, Inc. 1,189,124 0.0310,424 Johnson & Johnson 1,501,890 0.04106,229 Kohl’s Corp. 3,409,951 0.0941,512 L Brands, Inc. 1,582,437 0.04104,692 Lam Research Corp. 47,499,807 1.2748,063 Las Vegas Sands Corp. 2,684,799 0.0714,695 Lennox International, Inc. 4,187,487 0.11104,699 Liberty Broadband Corp. �C� 16,534,066 0.44199,624 Lowe’s Cos., Inc. 30,407,726 0.8197,068 Lumentum Holdings, Inc. 8,197,393 0.229,185 Martin Marietta Materials, Inc. 2,444,404 0.06
HoldingsSecurityDescription
Market ValueUSD
% ofShareholders’
Equity
Common Stocks – (Continued)United States – (Continued)
533,006 Masco Corp. 28,654,403 0.7730,464 MDU Resources Group, Inc. 775,004 0.0212,897 Mettler-Toledo International, Inc. 14,573,610 0.39567,333 Microsoft Corp. 121,477,342 3.2520,552 Mid-America Apartment
Communities, Inc. 2,550,709 0.07522,751 Monster Beverage Corp. 43,926,767 1.1793,736 Netflix, Inc. 45,870,649 1.23158,863 Old Dominion Freight Line, Inc. 32,036,313 0.86199,141 Omnicom Group, Inc. 12,653,419 0.3443,610 Otis Worldwide Corp. 2,944,111 0.0817,670 Parker-Hannifin Corp. 4,745,985 0.13285,509 PayPal Holdings, Inc. 60,151,036 1.6112,066 PerkinElmer, Inc. 1,566,287 0.0426,068 Philip Morris International, Inc. 1,971,001 0.0562,029 Phillips 66 3,970,476 0.11315,207 Pinterest, Inc. �A� 21,695,698 0.5824,994 Pioneer Natural Resources Co. 2,680,357 0.07130,816 Prologis, Inc. 13,158,781 0.3569,705 PulteGroup, Inc. 3,053,776 0.0829,510 Quidel Corp. 5,724,645 0.15137,098 S&P Global, Inc. 47,862,283 1.2887,719 SBA Communications Corp. 25,170,967 0.67173,957 Schlumberger NV 3,792,263 0.1053,622 Sempra Energy 6,961,744 0.1963,500 Sherwin-Williams Co. 46,838,235 1.2556,666 Signature Bank 6,541,806 0.17496,653 Starwood Property Trust, Inc. 9,006,802 0.2444,716 Steris Plc. 8,559,090 0.2386,284 Sun Communities, Inc. 11,969,317 0.32
1,123,020 Synchrony Financial 35,375,130 0.9555,802 Take-Two Interactive Software, Inc. 9,885,324 0.26281,415 Target Corp. 50,117,197 1.3420,140 Teledyne Technologies, Inc. 7,698,112 0.2182,936 Texas Instruments, Inc. 13,265,613 0.3531,189 TransUnion 2,890,908 0.0820,929 Tyson Foods, Inc. �A� 1,346,363 0.04212,382 United Parcel Service, Inc. �B� 36,168,655 0.97234,154 Universal Health Services, Inc. �B� 30,763,153 0.82120,120 Unum Group 2,751,949 0.07213,269 VEREIT, Inc. 1,561,129 0.04193,635 VeriSign, Inc. 38,422,993 1.03150,724 Vertex Pharmaceuticals, Inc. 34,351,507 0.92537,642 Viatris, Inc. 9,099,591 0.2416,762 Visa, Inc. �A� 3,506,275 0.09668,790 Voya Financial, Inc. 39,525,489 1.06327,060 Walmart, Inc. 49,451,472 1.3281,027 Wayfair, Inc. �A� 20,950,341 0.56108,370 West Pharmaceutical Services, Inc. 29,937,213 0.80186,678 Western Alliance Bancorp 9,970,472 0.2731,493 Western Digital Corp. 1,432,932 0.0461,443 Western Union Co. 1,382,160 0.047,186 White Mountains Insurance Group
Ltd. 6,898,560 0.1890,208 Workday, Inc. �A� 20,105,559 0.5413,491 WR Berkley Corp. 868,281 0.0216,494 Wyndham Hotels & Resorts, Inc. 940,158 0.02133,841 Wynn Resorts Ltd. 13,335,917 0.3633,300 XPO Logistics, Inc. 3,574,755 0.10211,706 Zoetis, Inc. 34,084,666 0.91
Goldman Sachs Funds—Global CORE® Equity PortfolioSchedule of InvestmentsAs at 30 November 2020
The accompanying notes are an integral part of these financial statements.
161

HoldingsSecurityDescription
Market ValueUSD
% ofShareholders’
Equity
Common Stocks – (Continued)United States – (Continued)
63,325 Zoom Video Communications, Inc.�A� 30,396,000 0.81
1,405,280 Zynga, Inc. �A� 11,558,428 0.31
2,543,823,140 67.99
TOTAL COMMON STOCKS(cost USD 3,111,364,172) 3,720,633,982 99.44
TOTAL TRANSFERABLE SECURITIES ADMITTEDTO AN OFFICIAL EXCHANGE LISTING(cost USD 3,111,364,172) 3,720,633,982 99.44
MARKET VALUE OF INVESTMENTS EXCLUDINGDERIVATIVES(cost USD 3,111,364,172) 3,720,633,982 99.44
Forward Currency Contracts – 0.00%
CurrencyAmountBought Currency
AmountSold
MaturityDate
UnrealisedGainUSD
% ofShareholders’
Equity
EUR 1,150,000 USD 1,370,201 01/12/2020 9,282 0.00EUR 1,643,000 USD 1,965,107 02/12/2020 5,753 0.00
UNREALISED GAIN ON FORWARD CURRENCYCONTRACTS 15,035 0.00
Share Class Specific Forward Currency Contracts – 0.01%
CurrencyAmountBought Currency
AmountSold
MaturityDate
UnrealisedGainUSD
% ofShareholders’
Equity
AUD 30,461 CHF 20,283 23/12/2020 22 0.00AUD 42,317 GBP 23,284 23/12/2020 83 0.00AUD 966 ILS 2,358 23/12/2020 0 0.00AUD 79,399 JPY 6,025,658 23/12/2020 773 0.00AUD 3,411 SGD 3,350 23/12/2020 13 0.00AUD 702,786 USD 513,916 23/12/2020 4,753 0.00CHF 3,929 GBP 3,247 23/12/2020 6 0.00CHF 7,813 JPY 890,420 23/12/2020 106 0.00CHF 67,580 USD 74,217 23/12/2020 612 0.00EUR 1,116,297 AUD 1,811,381 23/12/2020 3,138 0.00EUR 1,539,984 CHF 1,664,077 23/12/2020 5,981 0.00EUR 2,150,501 GBP 1,920,789 23/12/2020 11,852 0.00EUR 49,180 ILS 194,715 23/12/2020 157 0.00EUR 4,141,423 JPY 510,122,812 23/12/2020 75,875 0.00EUR 173,823 SGD 277,105 23/12/2020 1,461 0.00EUR 34,765,270 USD 41,256,250 23/12/2020 474,923 0.01SGD 239,301 JPY 18,491,501 23/12/2020 1,473 0.00SGD 2,034,190 USD 1,514,140 23/12/2020 6,819 0.00
UNREALISED GAIN ON FORWARD CURRENCYCONTRACTS HELD FOR HEDGING PURPOSES 588,047 0.01
CurrencyAmountBought Currency
AmountSold
MaturityDate
UnrealisedLossUSD
% ofShareholders’
Equity
AUD 31,053 CAD 29,704 23/12/2020 (53) (0.00)AUD 110,016 EUR 67,791 23/12/2020 (180) (0.00)AUD 1,756 NOK 11,557 23/12/2020 (17) (0.00)AUD 965 NZD 1,016 23/12/2020 (4) (0.00)AUD 10,555 SEK 66,462 23/12/2020 (49) (0.00)CHF 1,893 AUD 2,844 23/12/2020 (3) (0.00)CHF 2,913 CAD 4,186 23/12/2020 (11) (0.00)CHF 14,049 EUR 12,997 23/12/2020 (46) (0.00)CHF 168 NOK 1,665 23/12/2020 (3) (0.00)CHF 976 SEK 9,227 23/12/2020 (8) (0.00)EUR 1,600,477 CAD 2,484,470 23/12/2020 (135) (0.00)EUR 89,677 NOK 957,445 23/12/2020 (1,149) (0.00)EUR 46,507 NZD 79,467 23/12/2020 (164) (0.00)EUR 529,682 SEK 5,411,911 23/12/2020 (2,477) (0.00)JPY 3,993,248 EUR 32,123 23/12/2020 (238) (0.00)SGD 62,782 AUD 63,921 23/12/2020 (233) (0.00)
Share Class Specific Forward Currency Contracts – (Continued)
CurrencyAmountBought Currency
AmountSold
MaturityDate
UnrealisedLossUSD
% ofShareholders’
Equity
SGD 89,851 CAD 87,532 23/12/2020 (509) (0.00)SGD 88,650 CHF 60,095 23/12/2020 (257) (0.00)SGD 323,192 EUR 202,757 23/12/2020 (1,734) (0.00)SGD 122,585 GBP 68,690 23/12/2020 (234) (0.00)SGD 2,566 ILS 6,373 23/12/2020 (8) (0.00)SGD 4,919 NOK 32,948 23/12/2020 (66) (0.00)SGD 2,765 NZD 2,964 23/12/2020 (21) (0.00)SGD 29,220 SEK 187,271 23/12/2020 (240) (0.00)
UNREALISED LOSS ON FORWARD CURRENCYCONTRACTS HELD FOR HEDGING PURPOSES (7,839) (0.00)
MARKET VALUE OF INVESTMENTS(cost USD 3,111,364,172) 3,721,229,225 99.45
OTHER ASSETS AND LIABILITIES 20,395,661 0.55
SHAREHOLDERS’ EQUITY 3,741,624,886 100.00
TOTAL INVESTMENTSMarket Value
USD
% ofShareholders’
Equity
Total Investments excluding derivatives (costUSD 3,111,364,172) 3,720,633,982 99.44
Unrealised gain on forward currency contracts 15,035 0.00Unrealised gain on forward currency contracts held for hedgingpurposes 588,047 0.01
Unrealised loss on forward currency contracts held for hedgingpurposes (7,839) (0.00)
Other Assets and Liabilities 20,395,661 0.55
Shareholders’ Equity 3,741,624,886 100.00
The counterparties for forward currency contracts were BNP Paribas S.A., Deutsche BankAG, JP Morgan Chase Bank N.A., Morgan Stanley & Co. International Plc., NatwestMarkets Plc., Standard Chartered Bank, State Street Bank & Trust and UBS AG.
The maximum individual counterparty exposure as at 30 November 2020 is 0.01% of theNAV.
+ A portion of these securities were on loan at 30 November 2020. See Note 6.(a) 144A: This security is issued to qualified institutional investors, pursuant to private
placements, and is transferable as stated in rule 144A of the US Securities Act of1933.
(b) Security holding is traded/held in USD. (ADR: American Depositary Receipt/GDR: Global Depositary Receipt).
Goldman Sachs Funds—Global CORE® Equity PortfolioSchedule of InvestmentsAs at 30 November 2020
The accompanying notes are an integral part of these financial statements.
162

Allocation of Portfolio as at 30 November 2020
% ofShareholders’
Equity
Common StocksInternet 12.78Software 9.02Retail 7.73Computers 6.01Semiconductors 5.70Pharmaceuticals 5.42Real Estate Investment Trust 4.77Healthcare Services 4.54Insurance 4.24Commercial Services 4.16Others 35.07
TOTAL COMMON STOCKS 99.44
Unrealised Gain on Forward Currency Contracts 0.00
Unrealised Gain on Forward Currency Contracts Held for HedgingPurposes
0.01
Unrealised Loss on Forward Currency Contracts Held for HedgingPurposes
(0.00)
Other Assets and Liabilities 0.55
TOTAL 100.00
Goldman Sachs Funds—Global CORE® Equity PortfolioSchedule of InvestmentsAs at 30 November 2020
The accompanying notes are an integral part of these financial statements.
163

HoldingsSecurityDescription
Market ValueUSD
% ofShareholders’
Equity
Transferable securities admitted to an official exchange listing
Common Stocks – 99.01%Australia
932,010 Adairs Ltd. 2,191,430 0.482,248 Ansell Ltd. 62,080 0.0150,345 Charter Hall Group 512,469 0.1124,551 JB Hi-Fi Ltd. 829,314 0.1883,209 Mineral Resources Ltd. 1,988,264 0.44115,646 Pro Medicus Ltd. 2,523,406 0.56
8,106,963 1.78
Austria3,894 RHI Magnesita NV 169,867 0.048,126 Zumtobel Group AG 60,435 0.01
230,302 0.05
Belgium28,449 bpost S.A. 347,744 0.086,648 D’ieteren S.A./NV 472,097 0.1029,884 EVS Broadcast Equipment S.A. 530,541 0.12
1,350,382 0.30
Canada97,400 Aimia, Inc. 298,221 0.06
+ 95,200 Canfor Corp. 1,358,423 0.30198,300 CanWel Building Materials Group
Ltd. 1,100,857 0.2427,000 Celestica, Inc. 208,134 0.0411,800 Finning International, Inc. 240,498 0.0516,900 Granite Real Estate Investment Trust 1,000,659 0.22125,200 Hardwoods Distribution, Inc. 2,352,310 0.52102,700 Linamar Corp. 4,676,231 1.03207,800 Martinrea International, Inc. 2,279,879 0.5044,900 Stella-Jones, Inc. 1,535,143 0.342,900 TFI International, Inc. 147,450 0.032,400 West Fraser Timber Co., Ltd. 131,138 0.03
15,328,943 3.36
China939,000 Greenland Hong Kong Holdings Ltd. 289,859 0.06
Denmark204 Chemometec A/S 14,716 0.00
Finland32,903 Tokmanni Group Corp. 593,611 0.139,615 Uponor OYJ 198,379 0.04
+ 39,004 Valmet OYJ 997,972 0.22
1,789,962 0.39
France1,788 Albioma S.A. 92,441 0.0226,017 Gecina S.A. 3,994,712 0.884,933 Mersen S.A. 147,639 0.03
213,066 Rexel S.A. 2,904,704 0.64
7,139,496 1.57
Germany4,620 Aurubis AG 355,459 0.084,165 Elmos Semiconductor S.E. 136,894 0.0335,532 Gerresheimer AG 4,213,225 0.9329,296 GFT Technologies S.E. 435,761 0.103,515 Hornbach Holding AG & Co. KGaA 379,056 0.0872,374 SAF-Holland S.E. 918,516 0.2039,901 Scout24 AG 144A(a) 3,080,000 0.689,269 Siltronic AG 1,376,486 0.3012,374 Software AG 542,965 0.1215,636 Takkt AG 201,441 0.04
+ 4,090 Zooplus AG 780,079 0.17
12,419,882 2.73
HoldingsSecurityDescription
Market ValueUSD
% ofShareholders’
Equity
Common Stocks – (Continued)Hong Kong
389,200 Man Wah Holdings Ltd. 718,352 0.16
Ireland11,338 Alkermes Plc. 205,671 0.0439,737 Allegion Plc. 4,518,892 0.9921,859 Ardmore Shipping Corp. 74,539 0.0282,686 Greencore Group Plc. 129,485 0.0327,411 Jazz Pharmaceuticals Plc. 3,927,996 0.86
8,856,583 1.94
Isle Of Man55,519 GVC Holdings Plc. 778,836 0.17
Italy141,527 Azimut Holding SpA 3,025,278 0.6731,411 Buzzi Unicem SpA 785,232 0.1734,684 De’ Longhi SpA 1,219,864 0.27122,108 Esprinet SpA 1,237,711 0.2728,030 Interpump Group SpA 1,233,306 0.2737,990 Piaggio & C SpA 121,036 0.03508 Reply SpA 57,281 0.01
3,707 Sesa SpA 376,638 0.08
8,056,346 1.77
Japan22,000 A&D Co., Ltd. 192,958 0.046,400 Aichi Steel Corp. 157,281 0.0347,400 Arcland Sakamoto Co., Ltd. 815,021 0.187,900 Argo Graphics, Inc. 242,211 0.057,600 ASKUL Corp. 305,280 0.0740,900 Daikoku Denki Co., Ltd. 346,475 0.08130,900 DCM Holdings Co., Ltd. 1,490,622 0.338,500 Doshisha Co., Ltd. 164,072 0.0430,600 Eco’s Co., Ltd. 678,058 0.1531,700 EPS Holdings, Inc. 292,687 0.06367 Fukuoka REIT Corp. 489,824 0.11
14,400 Fumakilla Ltd. 206,822 0.0510,800 Furuno Electric Co., Ltd. 123,661 0.0313,600 Glory Ltd. 274,879 0.06252,800 Gumi, Inc. 2,114,048 0.463,800 Hanwa Co., Ltd. 91,383 0.0215,400 Happinet Corp. 211,228 0.05
+ 245 Heiwa Real Estate REIT, Inc. 274,757 0.065,500 Hirakawa Hewtech Corp. 56,048 0.014,300 HIS Co., Ltd. 66,812 0.013,900 Hito Communications Holdings, Inc. 56,374 0.011,200 Horiba Ltd. 64,861 0.01187 Ichigo Hotel REIT Investment Corp. 126,338 0.03
19,000 Ichinen Holdings Co., Ltd. 240,190 0.0532,100 Innotech Corp. 279,668 0.06257 Invincible Investment Corp. 76,748 0.02
1,100 JAFCO Group Co., Ltd. 47,466 0.011,732 Japan Hotel REIT Investment Corp. 859,705 0.1956 Japan Logistics Fund, Inc. 158,540 0.03
137,700 JBCC Holdings, Inc. 1,962,734 0.43386,500 JVC Kenwood Corp. 524,741 0.125,100 Kanematsu Corp. 59,165 0.0121,000 Kitagawa Corp. 258,184 0.066,800 Koa Corp. 93,824 0.0233,000 Kohnan Shoji Co., Ltd. 1,024,248 0.22116,400 Kojima Co., Ltd. 845,864 0.1913,900 Komeri Co., Ltd. 378,411 0.082,900 Kurimoto Ltd. 47,712 0.0129,100 Macnica Fuji Electronics Holdings,
Inc. 579,472 0.1318,800 MCJ Co., Ltd. 174,123 0.0415,500 Megachips Corp. 426,137 0.0911,000 Mitsubishi Research Institute, Inc. 440,563 0.1027,900 Mitsui E&S Holdings Co., Ltd. 91,625 0.0219,800 Mitsui Matsushima Holdings Co.,
Ltd. 140,502 0.03
Goldman Sachs Funds—Global Small Cap CORE® Equity PortfolioSchedule of InvestmentsAs at 30 November 2020
The accompanying notes are an integral part of these financial statements.
164

HoldingsSecurityDescription
Market ValueUSD
% ofShareholders’
Equity
Common Stocks – (Continued)Japan – (Continued)
8,800 Nihon Flush Co., Ltd. 115,617 0.038,800 Nikko Co., Ltd.via Hyogo 56,155 0.01
109,900 Nippon Denko Co., Ltd. 241,513 0.0517,270 Nippon Light Metal Holdings Co.,
Ltd. 297,932 0.073,300 Nippon Pillar Packing Co., Ltd. 51,410 0.0152,800 Nippon Systemware Co., Ltd. 1,068,458 0.238,700 Nisshin Oillio Group Ltd. 243,401 0.055,600 Nojima Corp. 147,120 0.035,300 Okinawa Cellular Telephone Co. 221,316 0.0524 One REIT, Inc. 56,561 0.01
2,191 Ooedo Onsen Reit Investment Corp. 1,443,226 0.3214,500 Raccoon Holdings, Inc. 302,645 0.0716,600 Ride On Express Holdings Co., Ltd. 322,570 0.07398,100 Riso Kyoiku Co., Ltd. 1,205,795 0.2620,100 Shinko Electric Industries Co., Ltd. 447,438 0.1064,800 SRA Holdings 1,544,143 0.341,539 Star Asia Investment Corp. 710,642 0.162,400 Tokuyama Corp. 51,389 0.011,900 Tokyo Seimitsu Co., Ltd. 84,365 0.0213,200 Tokyo Tekko Co., Ltd. 280,098 0.06257 Tokyu REIT, Inc. 374,843 0.08
11,200 Tomoe Engineering Co., Ltd. 206,564 0.0522,300 Torishima Pump Manufacturing Co.,
Ltd. 179,987 0.04175,500 Towa Corp. 3,075,548 0.6841,100 Toyo Kanetsu KK 843,134 0.195,000 Transcosmos, Inc. 129,712 0.033,900 Ulvac, Inc. 158,850 0.034,500 Valor Holdings Co., Ltd. 112,103 0.024,500 Valqua Ltd. 81,057 0.0280,700 Wellnet Corp. 381,717 0.08216 XYMAX REIT Investment Corp. 189,297 0.04
143,800 Yamaichi Electronics Co., Ltd. 2,098,683 0.4681,200 Zuken, Inc. 2,061,393 0.45
36,336,004 7.97
Luxembourg16,099 APERAM S.A. 624,149 0.14
Netherlands30,451 ASM International NV 5,491,909 1.2134,423 BE Semiconductor Industries NV 1,834,195 0.40662,196 PostNL NV 2,300,400 0.5014,353 Randstad NV 913,197 0.20113,586 Signify NV 144A(a) 4,880,550 1.0732,384 Van Lanschot Kempen NV 776,925 0.17
16,197,176 3.55
Norway159,985 Europris ASA 144A(a) 880,480 0.1922,365 Kid ASA 144A(a) 232,247 0.0527,296 SpareBank 1 Nord Norge 227,321 0.0548,304 Wallenius Wilhelmsen ASA 118,268 0.03
1,458,316 0.32
Singapore83,200 China Aviation Oil Singapore Corp.,
Ltd. 65,899 0.022,127,300 Frencken Group Ltd. 1,797,482 0.39309,800 UMS Holdings Ltd. 240,677 0.05
2,104,058 0.46
South Korea2,006 AfreecaTV Co., Ltd. 105,000 0.0215,950 Danawa Co., Ltd. 422,538 0.0916,063 DB HiTek Co., Ltd. 516,470 0.1133,188 Eugene Technology Co., Ltd. 1,008,170 0.225,641 Hanjin Transportation Co., Ltd. 249,678 0.06
104,892 Hanmi Semiconductor Co., Ltd. 1,159,814 0.25
HoldingsSecurityDescription
Market ValueUSD
% ofShareholders’
Equity
Common Stocks – (Continued)South Korea – (Continued)
5,835 Huons Global Co., Ltd. 163,369 0.0437,375 INTOPS Co., Ltd. 762,062 0.1716,332 Kginicis Co., Ltd. 295,180 0.068,271 LabGenomics Co., Ltd. 164,991 0.041,857 LEENO Industrial, Inc. 205,397 0.053,194 LOTTE Fine Chemical Co., Ltd. 159,016 0.043,810 LS Electric Co., Ltd. 190,161 0.0452,979 MagnaChip Semiconductor Corp. 751,772 0.1716,486 NICE Information Service Co., Ltd. 319,488 0.071,482 Soulbrain Holdings Co., Ltd. 57,907 0.0156,918 UBCare Co., Ltd. 515,822 0.117,118 Value Added Technology Co., Ltd. 143,134 0.03
7,189,969 1.58
Spain+ 368,974 Bankinter S.A. 1,862,472 0.41
22,116 Cia de Distribucion Integral LogistaHoldings S.A. 411,204 0.09
2,273,676 0.50
Sweden15,928 Arjo AB �B� 114,533 0.0330,675 Betsson AB 271,921 0.066,826 Bilia AB �A� 77,488 0.0211,741 Biotage AB 195,425 0.0421,625 Granges AB 241,787 0.0545,582 Hexatronic Group AB 353,020 0.0816,602 Karnov Group AB 107,246 0.024,874 KNOW IT AB 155,128 0.03
174,149 LeoVegas AB 144A(a) 695,101 0.1511,313 Nobia AB 77,748 0.0291,687 RaySearch Laboratories AB 813,847 0.18
3,103,244 0.68
Switzerland79,672 Adecco Group AG 4,911,300 1.08475 ALSO Holding AG 127,434 0.03
9,299 Bachem Holding AG �B� 3,863,010 0.85120 Bucher Industries AG 51,218 0.01
11,289 Huber & Suhner AG 934,193 0.20173 Interroll Holding AG 500,492 0.11377 Metall Zug AG 556,804 0.12
3,018 Sonova Holding AG 761,595 0.179,766 Tecan Group AG 4,321,717 0.95
16,027,763 3.52
United Kingdom10,429 Clarkson Plc. 350,062 0.0822,609 Concentric AB 437,085 0.1063,477 Dialog Semiconductor Plc. 3,439,417 0.758,734 Diploma Plc. 245,980 0.05
113,989 easyJet Plc. 1,229,866 0.277,187 Games Workshop Group Plc. 939,973 0.217,065 IMI Plc. 106,007 0.02
1,168,911 ITV Plc. 1,481,900 0.3381,219 Just Group Plc. 60,878 0.01120,504 Moneysupermarket.com Group Plc. 396,752 0.09145,158 Paragon Banking Group Plc. 802,103 0.1821,817 Spectris Plc. 777,829 0.17141,881 Tate & Lyle Plc. 1,217,736 0.2746,939 Tyman Plc. 201,497 0.0428,360 Vesuvius Plc. 186,140 0.04
11,873,225 2.61
United States211,747 Abercrombie & Fitch Co. �A� 4,603,380 1.015,467 AGCO Corp. 509,360 0.115,585 Amedisys, Inc. 1,346,599 0.303,657 American Assets Trust, Inc. 109,235 0.02
Goldman Sachs Funds—Global Small Cap CORE® Equity PortfolioSchedule of InvestmentsAs at 30 November 2020
The accompanying notes are an integral part of these financial statements.
165

HoldingsSecurityDescription
Market ValueUSD
% ofShareholders’
Equity
Common Stocks – (Continued)United States – (Continued)
144,851 American Equity Investment LifeHolding Co. 3,844,346 0.84
8,626 American Financial Group, Inc. 799,544 0.1835,220 American Homes 4 Rent �A� 1,010,814 0.2242,575 Amneal Pharmaceuticals, Inc. 168,171 0.0417,725 ANI Pharmaceuticals, Inc. 519,520 0.1156,117 Apartment Investment and
Management Co. �A� 1,723,914 0.38859 Arrow Electronics, Inc. 79,578 0.02
175,555 Axalta Coating Systems Ltd. 5,033,162 1.1039,582 Axcelis Technologies, Inc. 1,088,505 0.2456,758 Bancorp, Inc. 703,799 0.1575,227 Big Lots, Inc. 3,879,456 0.8515,547 BioDelivery Sciences International,
Inc. 58,146 0.0155,247 BJ’s Wholesale Club Holdings, Inc. 2,294,960 0.5087,939 Boise Cascade Co. 3,808,638 0.842,481 Booz Allen Hamilton Holding Corp. 216,939 0.053,127 Boston Beer Co., Inc. �A� 2,774,806 0.6140,769 Boston Private Financial Holdings,
Inc. 303,321 0.07238,397 Box, Inc. �A� 4,489,016 0.9972,520 Brandywine Realty Trust 831,079 0.181,914 Brighthouse Financial, Inc. 70,512 0.021,752 CACI International, Inc. �A� 418,185 0.096,109 Camden Property Trust 600,820 0.1324,509 Camping World Holdings, Inc. �A� 744,338 0.1661,355 CareTrust REIT, Inc. 1,219,124 0.278,382 Cargurus, Inc. 207,454 0.0529,631 Cars.com, Inc. 332,756 0.0757,001 Central Pacific Financial Corp. 990,677 0.22125,158 ChannelAdvisor Corp. 1,851,087 0.418,541 Chegg, Inc. 660,134 0.146,341 Chemed Corp. 3,008,170 0.6635,986 Chemours Co. 901,809 0.2010,936 City Office REIT, Inc. 97,877 0.0215,924 Clean Harbors, Inc. 1,183,312 0.2650,574 Cloudera, Inc. 601,325 0.1320,181 Collectors Universe, Inc. 1,515,593 0.3312,496 Conduent, Inc. 54,483 0.0116,667 CoreLogic, Inc. 1,297,859 0.2820,412 CoreSite Realty Corp. 2,554,766 0.5635,077 Cowen, Inc. �A� 845,356 0.1975,868 CubeSmart 2,411,844 0.53209,626 CVB Financial Corp. 4,131,728 0.9167,739 Dick’s Sporting Goods, Inc. 3,962,054 0.879,892 Dine Brands Global, Inc. 624,185 0.1412,800 Domo, Inc. �B� 487,552 0.11208,362 Dropbox, Inc. �A� 4,147,446 0.9120,366 Echo Global Logistics, Inc. 598,964 0.1311,654 Eiger BioPharmaceuticals, Inc. 104,303 0.0214,589 Emergent BioSolutions, Inc. 1,215,410 0.2725,710 Encompass Health Corp. 2,082,510 0.4647,951 Enova International, Inc. 1,032,865 0.232,022 Enphase Energy, Inc. 285,587 0.0658,200 Envista Holdings Corp. 1,743,672 0.3857,574 Equity LifeStyle Properties, Inc. 3,376,715 0.7423,774 Etsy, Inc. 3,782,443 0.838,726 Euronet Worldwide, Inc. 1,176,003 0.2612,127 Evercore, Inc. �A� 1,121,869 0.252,728 EverQuote, Inc. �A� 104,032 0.0277,514 Exelixis, Inc. 1,503,772 0.333,228 Fair Isaac Corp. 1,529,330 0.342,951 Federated Hermes, Inc. 81,182 0.0225,555 Fiesta Restaurant Group, Inc. 302,060 0.0739,093 First American Financial Corp. 1,920,248 0.4215,214 First Hawaiian, Inc. 342,924 0.0899,210 First Industrial Realty Trust, Inc. 4,195,591 0.9247,823 First Solar, Inc. 4,482,928 0.988,921 Franklin Electric Co., Inc. 602,970 0.1341,863 frontdoor, Inc. 1,982,213 0.43
HoldingsSecurityDescription
Market ValueUSD
% ofShareholders’
Equity
Common Stocks – (Continued)United States – (Continued)
86,976 Gentex Corp. 2,845,855 0.6210,047 Globe Life, Inc. 955,671 0.21176,459 Glu Mobile, Inc. 1,748,709 0.38118,145 Goodyear Tire & Rubber Co. 1,275,966 0.287,069 Gray Television, Inc. 127,595 0.0394,447 Green Plains, Inc. 1,468,651 0.32100,590 H&E Equipment Services, Inc. 2,793,384 0.61100,397 H&R Block, Inc. 1,906,539 0.4211,247 Haverty Furniture Cos., Inc. 315,141 0.0741,543 Healthcare Trust of America, Inc. �A� 1,097,774 0.2479,833 Herbalife Nutrition Ltd. 3,898,245 0.863,969 Highwoods Properties, Inc. 152,687 0.0352,975 Hilltop Holdings, Inc. 1,301,066 0.2944,710 HollyFrontier Corp. 1,077,511 0.2417,809 Horizon Therapeutics Plc. 1,277,440 0.2816,156 Huron Consulting Group, Inc. 731,705 0.1617,088 Ingevity Corp. 1,154,465 0.257,402 Ingles Markets, Inc. �A� 276,539 0.0660,718 Integer Holdings Corp. 4,341,337 0.9511,330 Intercept Pharmaceuticals, Inc. 410,939 0.09135,641 International Bancshares Corp. 4,538,548 1.0022,514 Iridium Communications, Inc. 733,281 0.1655,971 Jabil, Inc. 2,168,317 0.48151,429 Jefferies Financial Group, Inc. 3,529,810 0.7781,484 KAR Auction Services, Inc. 1,499,306 0.337,132 Kilroy Realty Corp. 443,147 0.1086,608 Knowles Corp. 1,482,729 0.3311,931 Koppers Holdings, Inc. 332,278 0.0727,911 L Brands, Inc. 1,063,967 0.2311,256 Lennox International, Inc. 3,207,510 0.702,563 Life Storage, Inc. 276,727 0.06
133,010 Louisiana-Pacific Corp. 4,511,699 0.998,070 LPL Financial Holdings, Inc. 745,910 0.1641,047 Lumentum Holdings, Inc. 3,466,419 0.764,585 M/I Homes, Inc. 208,801 0.052,311 Manhattan Associates, Inc. 231,655 0.0526,089 MarineMax, Inc. 875,547 0.19234,656 Marten Transport Ltd. 4,158,104 0.9151,221 Matrix Service Co. 511,698 0.1118,637 McGrath RentCorp 1,192,954 0.26108,383 MDU Resources Group, Inc. 2,757,264 0.6112,026 Mercury Systems, Inc. 847,592 0.191,938 Mirati Therapeutics, Inc. 456,399 0.10619 Molina Healthcare, Inc. 128,121 0.03
3,089 Monolithic Power Systems, Inc. 989,190 0.2291,218 MRC Global, Inc. 554,605 0.1222,457 Myriad Genetics, Inc. 389,180 0.092,104 National HealthCare Corp. 135,203 0.0323,724 National Storage Affiliates Trust 804,006 0.18198,603 Navient Corp. 1,954,254 0.4313,146 Nektar Therapeutics 216,778 0.05148,826 NeoPhotonics Corp. 1,220,373 0.2741,698 NETGEAR, Inc. 1,350,181 0.303,349 New Relic, Inc. 200,773 0.04563 NewMarket Corp. 208,085 0.05
39,165 NexPoint Residential Trust, Inc. 1,713,077 0.3844,526 NorthWestern Corp. 2,684,027 0.59464 Novanta, Inc. 54,752 0.01
6,700 Occidental Petroleum Corp. 109,244 0.0213,418 O-I Glass, Inc. 154,710 0.03108,370 Old Republic International Corp. 1,998,343 0.44130,540 OPKO Health, Inc. 546,963 0.127,992 Oppenheimer Holdings, Inc. �A� 239,680 0.05
124,163 ORBCOMM, Inc. 742,495 0.1617,334 Paramount Group, Inc. 169,700 0.04103,328 PennyMac Mortgage Investment
Trust 1,791,708 0.392,541 Perficient, Inc. 117,826 0.0324,380 PerkinElmer, Inc. 3,164,768 0.6910,188 Physicians Realty Trust 178,290 0.0434,888 PJT Partners, Inc. �A� 2,442,509 0.54
Goldman Sachs Funds—Global Small Cap CORE® Equity PortfolioSchedule of InvestmentsAs at 30 November 2020
The accompanying notes are an integral part of these financial statements.
166

HoldingsSecurityDescription
Market ValueUSD
% ofShareholders’
Equity
Common Stocks – (Continued)United States – (Continued)
78,868 PotlatchDeltic Corp. 3,554,581 0.783,765 Prestige Consumer Healthcare, Inc. 137,423 0.0310,731 Primerica, Inc. 1,422,394 0.312,191 PulteGroup, Inc. 95,988 0.0211,764 Quidel Corp. 2,282,098 0.502,794 RBC Bearings, Inc. 477,495 0.1044,952 Red Rock Resorts, Inc. �A� 973,660 0.2185,357 Rush Enterprises, Inc. �A� 3,263,198 0.72240,689 Sabra Health Care REIT, Inc. 4,118,189 0.909,814 Sangamo Therapeutics, Inc. 99,023 0.0233,258 Sciplay Corp. �A� 498,537 0.1135,473 SEACOR Holdings, Inc. 1,242,264 0.27147,094 Select Medical Holdings Corp. 3,637,635 0.8017,351 Signature Bank 2,003,086 0.44254,450 Sportsman’s Warehouse Holdings,
Inc. 3,661,535 0.8012,890 Standard Motor Products, Inc. 591,393 0.13113,421 Starwood Property Trust, Inc. 2,056,890 0.457,968 State Auto Financial Corp. 122,787 0.0311,796 Steris Plc. 2,257,872 0.5014,883 Stewart Information Services Corp. 638,630 0.14164,206 Summit Materials, Inc. �A� 3,113,346 0.6820,750 SVMK, Inc. 451,105 0.1044,220 TechTarget, Inc. 2,320,223 0.5111,003 Teledyne Technologies, Inc. 4,205,677 0.92110,098 Tenet Healthcare Corp. 3,610,113 0.793,311 Tredegar Corp. 54,433 0.0120,264 TriCo Bancshares 694,042 0.1528,079 TriState Capital Holdings, Inc. 440,840 0.10339,056 TTM Technologies, Inc. 4,485,711 0.9823,449 Twist Bioscience Corp. 2,553,362 0.562,723 UFP Industries, Inc. 145,599 0.0332,871 Universal Health Services, Inc. �B� 4,318,592 0.953,126 Universal Logistics Holdings, Inc. 68,522 0.021,144 Utah Medical Products, Inc. 100,901 0.02
223,192 VEREIT, Inc. 1,633,765 0.3611,651 Viatris, Inc. 197,193 0.0477,678 Vishay Intertechnology, Inc. 1,499,185 0.334,858 Visteon Corp. 582,231 0.1388,607 Voya Financial, Inc. 5,236,674 1.1521,414 Washington Federal, Inc. 524,001 0.116,911 Watsco, Inc. 1,540,116 0.3470,664 Werner Enterprises, Inc. 2,827,973 0.6217,187 Wingstop, Inc. 2,144,078 0.4739,470 World Fuel Services Corp. 1,184,100 0.2612,619 Wyndham Hotels & Resorts, Inc. 719,283 0.1610,996 Wynn Resorts Ltd. 1,095,641 0.2457,368 Xencor, Inc. 2,441,582 0.5416,768 XPO Logistics, Inc. 1,800,045 0.3910,782 Zillow Group, Inc. �C� 1,157,448 0.254,926 Zumiez, Inc. 175,661 0.04
380,713 Zynga, Inc. �A� 3,131,364 0.69
288,927,531 63.40
TOTAL COMMON STOCKS(cost USD 396,574,746) 451,195,733 99.01
Rights – 0.01%Sweden
21,625 Granges AB—Rights 33,164 0.01
TOTAL RIGHTS(cost USD nil) 33,164 0.01
TOTAL TRANSFERABLE SECURITIES ADMITTEDTO AN OFFICIAL EXCHANGE LISTING(cost USD 396,574,746) 451,228,897 99.02
MARKET VALUE OF INVESTMENTS EXCLUDINGDERIVATIVES(cost USD 396,574,746) 451,228,897 99.02
Futures Contracts – 0.00%
Number ofContracts Security Description
CommitmentMarketValueUSD
UnrealisedGainUSD
% ofShareholders’
Equity
KRW2 KOSPI 200 Index
Futures 10/12/2020Long 156,907 16,177 0.00
UNREALISED GAIN ON FUTURES CONTRACTS 16,177 0.00
Forward Currency Contracts – 0.00%
CurrencyAmountBought Currency
AmountSold
MaturityDate
UnrealisedGainUSD
% ofShareholders’
Equity
EUR 85,000 USD 101,276 01/12/2020 686 0.00
UNREALISED GAIN ON FORWARD CURRENCYCONTRACTS 686 0.00
MARKET VALUE OF INVESTMENTS(cost USD 396,574,746) 451,245,760 99.02
OTHER ASSETS AND LIABILITIES 4,467,642 0.98
SHAREHOLDERS’ EQUITY 455,713,402 100.00
TOTAL INVESTMENTSMarket Value
USD
% ofShareholders’
Equity
Total Investments excluding derivatives (cost USD396,574,746) 451,228,897 99.02
Unrealised gain on futures contracts 16,177 0.00Unrealised gain on forward currency contracts 686 0.00Other Assets and Liabilities 4,467,642 0.98
Shareholders’ Equity 455,713,402 100.00
The Futures Commission Merchant was Credit Suisse Securities (USA) LLC.
The counterparty for forward currency contracts was JP Morgan Chase Bank N.A.
The maximum individual counterparty exposure as at 30 November 2020 is 0.00% of theNAV.
+ A portion of these securities were on loan at 30 November 2020. See Note 6.(a) 144A: This security is issued to qualified institutional investors, pursuant to private
placements, and is transferable as stated in rule 144A of the US Securities Act of1933.
Goldman Sachs Funds—Global Small Cap CORE® Equity PortfolioSchedule of InvestmentsAs at 30 November 2020
The accompanying notes are an integral part of these financial statements.
167

Allocation of Portfolio as at 30 November 2020
% ofShareholders’
Equity
Common StocksReal Estate Investment Trust 10.18Retail 8.84Software 5.51Electronics 4.99Building Materials 4.43Healthcare Services 4.20Semiconductors 4.17Banks 3.98Healthcare Products 3.76Insurance 3.75Others 45.20
TOTAL COMMON STOCKS 99.01
RightsMetal Fabricate/Hardware 0.01
TOTAL RIGHTS 0.01
Unrealised Gain on Futures Contracts 0.00
Unrealised Gain on Forward Currency Contracts 0.00
Other Assets and Liabilities 0.98
TOTAL 100.00
Goldman Sachs Funds—Global Small Cap CORE® Equity PortfolioSchedule of InvestmentsAs at 30 November 2020
The accompanying notes are an integral part of these financial statements.
168

HoldingsSecurityDescription
Market ValueUSD
% ofShareholders’
Equity
Transferable securities admitted to an official exchange listing
Common Stocks – 97.39%Bermuda
141,225 Arch Capital Group Ltd. 4,613,821 0.2655,779 Athene Holding Ltd. �A� 2,529,020 0.15
7,142,841 0.41
Canada12,090 Lululemon Athletica, Inc. 4,402,453 0.25
Ireland19,170 Allegion Plc. 2,180,013 0.126,961 Jazz Pharmaceuticals Plc. 997,511 0.0616,559 Trane Technologies Plc. 2,362,969 0.14
5,540,493 0.32
Netherlands84,828 NXP Semiconductors NV 13,531,763 0.78
Switzerland78,637 Chubb Ltd. 11,822,286 0.6824,931 TE Connectivity Ltd. 2,849,863 0.16
14,672,149 0.84
United Kingdom39,791 Linde Plc. 10,349,639 0.59
United States227,700 AbbVie, Inc. 23,881,176 1.3752,075 Adobe, Inc. 24,772,077 1.4263,137 Advanced Micro Devices, Inc. 5,662,126 0.327,128 Align Technology, Inc. 3,424,291 0.2017,206 Allstate Corp. 1,781,509 0.1066,457 Ally Financial, Inc. 2,033,584 0.1221,067 Alphabet, Inc. �A� 37,222,861 2.1320,664 Alphabet, Inc. �C� 36,627,767 2.1023,414 Amazon.com, Inc. 74,386,278 4.2633,112 American Financial Group, Inc. 3,069,151 0.1862,883 Ametek, Inc. 7,520,807 0.4351,221 Anthem, Inc. 16,140,761 0.9245,617 Aon Plc. �A� 9,385,698 0.54777,564 Apple, Inc. 92,530,116 5.30216,373 Applied Materials, Inc. 17,738,259 1.0266,216 AvalonBay Communities, Inc. 11,071,977 0.63422,579 Axalta Coating Systems Ltd. 12,115,340 0.69314,191 Bank of America Corp. 9,042,417 0.52218,063 Bank of New York Mellon Corp. 8,668,004 0.5039,209 Berkshire Hathaway, Inc. �B� 9,020,423 0.529,845 Biogen, Inc. 2,370,085 0.1411,348 Boeing Co. 2,445,721 0.142,419 Booking Holdings, Inc. 4,909,046 0.2813,996 Broadcom, Inc. 5,529,260 0.327,296 Camden Property Trust 717,562 0.04
149,905 Capital One Financial Corp. 13,220,122 0.763,020 Caterpillar, Inc. 526,235 0.037,893 Centene Corp. 498,285 0.031,092 Chemed Corp. 518,045 0.03
242,070 Chevron Corp. 21,931,542 1.2610,672 Chipotle Mexican Grill, Inc. 13,700,073 0.7843,587 Cigna Corp. 9,217,779 0.53188,700 Citigroup, Inc. 10,584,183 0.6195,942 CME Group, Inc. 16,661,288 0.9521,230 Constellation Brands, Inc. �A� 4,336,440 0.2518,773 Cooper Cos., Inc. 6,317,490 0.3658,431 Costco Wholesale Corp. 22,611,044 1.2960,383 Danaher Corp. 13,374,834 0.7790,739 Dick’s Sporting Goods, Inc. 5,307,324 0.305,139 Dover Corp. 629,322 0.04
211,031 Dow, Inc. 11,509,631 0.6660,071 Dropbox, Inc. �A� 1,195,713 0.0753,361 Edwards Lifesciences Corp. 4,490,862 0.26120,124 Entergy Corp. 13,248,476 0.76122,496 Equity LifeStyle Properties, Inc. 7,184,390 0.41
HoldingsSecurityDescription
Market ValueUSD
% ofShareholders’
Equity
Common Stocks – (Continued)United States – (Continued)
55,777 Estee Lauder Cos., Inc. �A� 13,569,429 0.7824,750 Etsy, Inc. 3,937,725 0.2243,173 Extra Space Storage, Inc. 4,755,938 0.27109,613 Exxon Mobil Corp. 4,328,617 0.25186,100 Facebook, Inc. �A� 51,086,311 2.9323,784 FedEx Corp. 6,852,646 0.39121,614 Fidelity National Information
Services, Inc. 17,907,661 1.0338,522 First American Financial Corp. 1,892,201 0.1179,934 First Industrial Realty Trust, Inc. 3,380,409 0.1943,279 First Republic Bank 5,636,657 0.3261,049 Fiserv, Inc. 6,983,395 0.40
1,635,974 Ford Motor Co. 14,871,004 0.8557,346 Freeport-McMoRan, Inc. 1,347,058 0.0812,380 General Dynamics Corp. 1,869,875 0.1187,713 General Motors Co. 3,932,174 0.22102,038 Gentex Corp. 3,338,683 0.1936,586 Global Payments, Inc. 7,136,831 0.4137,771 Globe Life, Inc. 3,592,778 0.2198,418 HCA Healthcare, Inc. 14,913,280 0.85110,382 Herbalife Nutrition Ltd. 5,389,953 0.31167,189 Hologic, Inc. 11,564,463 0.6627,408 Humana, Inc. 11,102,981 0.6452,879 Illinois Tool Works, Inc. 11,125,742 0.64135,084 International Business Machines
Corp. 16,695,032 0.9622,281 Intuit, Inc. 7,893,935 0.45423,779 Invitation Homes, Inc. 12,192,122 0.707,706 IQVIA Holdings, Inc. 1,303,316 0.07
199,968 Johnson & Johnson 28,811,389 1.6575,764 Johnson Controls International Plc. 3,502,570 0.2034,799 JP Morgan Chase & Co. 4,180,404 0.24310,299 Kinder Morgan, Inc. 4,524,159 0.2614,167 KLA Corp. 3,565,126 0.2041,513 Kohl’s Corp. 1,332,567 0.0882,513 L Brands, Inc. 3,145,396 0.1834,604 Lam Research Corp. 15,700,181 0.9080,181 Las Vegas Sands Corp. 4,478,911 0.2623,417 Lennox International, Inc. 6,672,908 0.3881,390 Lowe’s Cos., Inc. 12,397,732 0.71559 MarketAxess Holdings, Inc. 295,057 0.02
43,402 Marriott International, Inc. �A� 5,540,699 0.32178,827 Masco Corp. 9,613,740 0.5518,881 Mastercard, Inc. �A� 6,340,051 0.3612,980 Mettler-Toledo International, Inc. 14,667,400 0.84445,286 Microsoft Corp. 95,344,638 5.4639,419 Mid-America Apartment
Communities, Inc. 4,892,292 0.28176,540 Monster Beverage Corp. 14,834,656 0.8519,855 Moody’s Corp. 5,606,258 0.3248,943 Netflix, Inc. 23,950,746 1.37102,251 NIKE, Inc. �B� 13,701,634 0.7833,280 Northern Trust Corp. 3,184,563 0.184,292 NVIDIA Corp. 2,289,911 0.1367,165 Old Dominion Freight Line, Inc. 13,544,494 0.78116,274 Omnicom Group, Inc. 7,388,050 0.42106,420 Otis Worldwide Corp. 7,184,414 0.41134,224 PACCAR, Inc. 11,758,022 0.6728,461 Parker-Hannifin Corp. 7,644,340 0.44126,038 PayPal Holdings, Inc. 26,553,686 1.5271,584 PerkinElmer, Inc. 9,292,319 0.53248,879 Philip Morris International, Inc. 18,817,741 1.0846,187 Phillips 66 2,956,430 0.1786,895 Pinterest, Inc. �A� 5,980,983 0.3423,915 Procter & Gamble Co. 3,294,530 0.19126,067 Prologis, Inc. 12,681,080 0.7355,096 PulteGroup, Inc. 2,413,756 0.144,051 Quidel Corp. 785,853 0.0448,178 S&P Global, Inc. 16,819,422 0.965,527 Salesforce.com, Inc. 1,324,767 0.0826,081 SBA Communications Corp. 7,483,943 0.43
Goldman Sachs Funds—US CORE® Equity PortfolioSchedule of InvestmentsAs at 30 November 2020
The accompanying notes are an integral part of these financial statements.
169
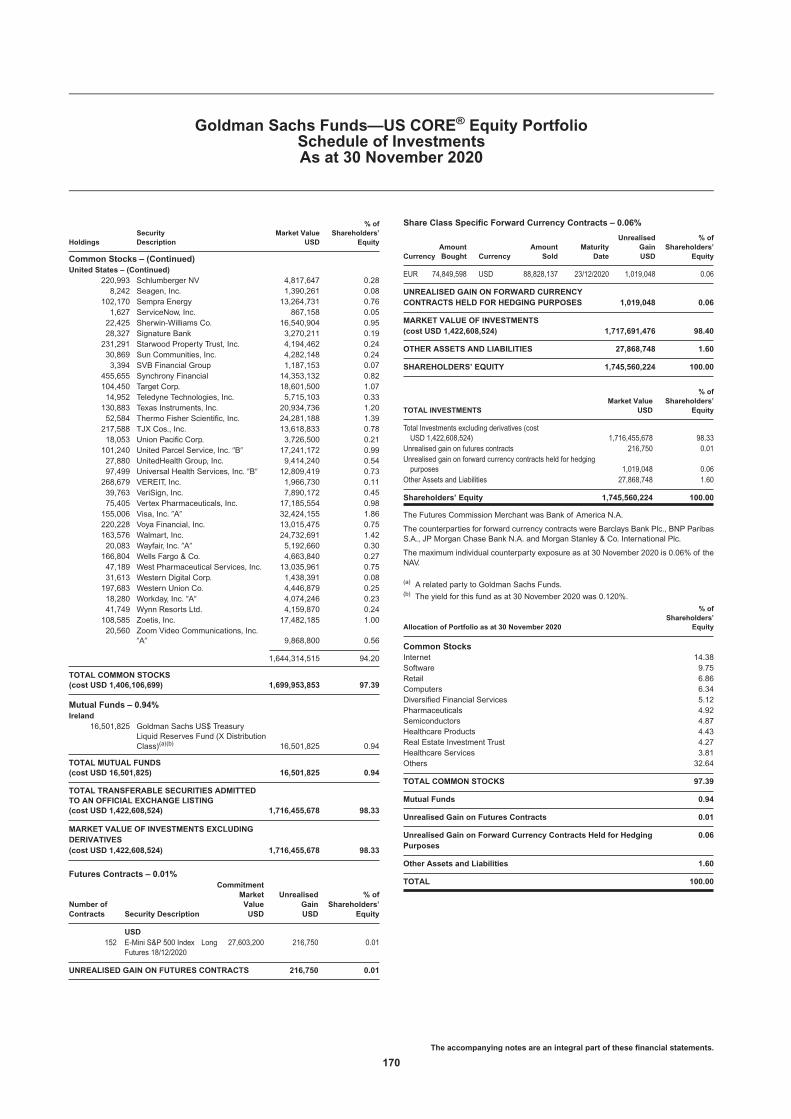
HoldingsSecurityDescription
Market ValueUSD
% ofShareholders’
Equity
Common Stocks – (Continued)United States – (Continued)
220,993 Schlumberger NV 4,817,647 0.288,242 Seagen, Inc. 1,390,261 0.08
102,170 Sempra Energy 13,264,731 0.761,627 ServiceNow, Inc. 867,158 0.0522,425 Sherwin-Williams Co. 16,540,904 0.9528,327 Signature Bank 3,270,211 0.19231,291 Starwood Property Trust, Inc. 4,194,462 0.2430,869 Sun Communities, Inc. 4,282,148 0.243,394 SVB Financial Group 1,187,153 0.07
455,655 Synchrony Financial 14,353,132 0.82104,450 Target Corp. 18,601,500 1.0714,952 Teledyne Technologies, Inc. 5,715,103 0.33130,883 Texas Instruments, Inc. 20,934,736 1.2052,584 Thermo Fisher Scientific, Inc. 24,281,188 1.39217,588 TJX Cos., Inc. 13,618,833 0.7818,053 Union Pacific Corp. 3,726,500 0.21101,240 United Parcel Service, Inc. �B� 17,241,172 0.9927,880 UnitedHealth Group, Inc. 9,414,240 0.5497,499 Universal Health Services, Inc. �B� 12,809,419 0.73268,679 VEREIT, Inc. 1,966,730 0.1139,763 VeriSign, Inc. 7,890,172 0.4575,405 Vertex Pharmaceuticals, Inc. 17,185,554 0.98155,006 Visa, Inc. �A� 32,424,155 1.86220,228 Voya Financial, Inc. 13,015,475 0.75163,576 Walmart, Inc. 24,732,691 1.4220,083 Wayfair, Inc. �A� 5,192,660 0.30166,804 Wells Fargo & Co. 4,663,840 0.2747,189 West Pharmaceutical Services, Inc. 13,035,961 0.7531,613 Western Digital Corp. 1,438,391 0.08197,683 Western Union Co. 4,446,879 0.2518,280 Workday, Inc. �A� 4,074,246 0.2341,749 Wynn Resorts Ltd. 4,159,870 0.24108,585 Zoetis, Inc. 17,482,185 1.0020,560 Zoom Video Communications, Inc.
�A� 9,868,800 0.56
1,644,314,515 94.20
TOTAL COMMON STOCKS(cost USD 1,406,106,699) 1,699,953,853 97.39
Mutual Funds – 0.94%Ireland
16,501,825 Goldman Sachs US$ TreasuryLiquid Reserves Fund (X DistributionClass)(a)(b) 16,501,825 0.94
TOTAL MUTUAL FUNDS(cost USD 16,501,825) 16,501,825 0.94
TOTAL TRANSFERABLE SECURITIES ADMITTEDTO AN OFFICIAL EXCHANGE LISTING(cost USD 1,422,608,524) 1,716,455,678 98.33
MARKET VALUE OF INVESTMENTS EXCLUDINGDERIVATIVES(cost USD 1,422,608,524) 1,716,455,678 98.33
Futures Contracts – 0.01%
Number ofContracts Security Description
CommitmentMarketValueUSD
UnrealisedGainUSD
% ofShareholders’
Equity
USD152 E-Mini S&P 500 Index
Futures 18/12/2020Long 27,603,200 216,750 0.01
UNREALISED GAIN ON FUTURES CONTRACTS 216,750 0.01
Share Class Specific Forward Currency Contracts – 0.06%
CurrencyAmountBought Currency
AmountSold
MaturityDate
UnrealisedGainUSD
% ofShareholders’
Equity
EUR 74,849,598 USD 88,828,137 23/12/2020 1,019,048 0.06
UNREALISED GAIN ON FORWARD CURRENCYCONTRACTS HELD FOR HEDGING PURPOSES 1,019,048 0.06
MARKET VALUE OF INVESTMENTS(cost USD 1,422,608,524) 1,717,691,476 98.40
OTHER ASSETS AND LIABILITIES 27,868,748 1.60
SHAREHOLDERS’ EQUITY 1,745,560,224 100.00
TOTAL INVESTMENTSMarket Value
USD
% ofShareholders’
Equity
Total Investments excluding derivatives (costUSD 1,422,608,524) 1,716,455,678 98.33
Unrealised gain on futures contracts 216,750 0.01Unrealised gain on forward currency contracts held for hedgingpurposes 1,019,048 0.06
Other Assets and Liabilities 27,868,748 1.60
Shareholders’ Equity 1,745,560,224 100.00
The Futures Commission Merchant was Bank of America N.A.
The counterparties for forward currency contracts were Barclays Bank Plc., BNP ParibasS.A., JP Morgan Chase Bank N.A. and Morgan Stanley & Co. International Plc.
The maximum individual counterparty exposure as at 30 November 2020 is 0.06% of theNAV.
(a) A related party to Goldman Sachs Funds.(b) The yield for this fund as at 30 November 2020 was 0.120%.
Allocation of Portfolio as at 30 November 2020
% ofShareholders’
Equity
Common StocksInternet 14.38Software 9.75Retail 6.86Computers 6.34Diversified Financial Services 5.12Pharmaceuticals 4.92Semiconductors 4.87Healthcare Products 4.43Real Estate Investment Trust 4.27Healthcare Services 3.81Others 32.64
TOTAL COMMON STOCKS 97.39
Mutual Funds 0.94
Unrealised Gain on Futures Contracts 0.01
Unrealised Gain on Forward Currency Contracts Held for HedgingPurposes
0.06
Other Assets and Liabilities 1.60
TOTAL 100.00
Goldman Sachs Funds—US CORE® Equity PortfolioSchedule of InvestmentsAs at 30 November 2020
The accompanying notes are an integral part of these financial statements.
170

HoldingsSecurityDescription
Market ValueUSD
% ofShareholders’
Equity
Transferable securities admitted to an official exchange listing
Common Stocks – 99.08%Bermuda
6,235 Argo Group International HoldingsLtd. 259,563 0.12
15,331 DHT Holdings, Inc. 79,338 0.041,205 Enstar Group Ltd. 235,216 0.118,227 Triton International Ltd. 371,943 0.17
946,060 0.44
Ireland25,543 Ardmore Shipping Corp. 87,102 0.0459,794 Endo International Plc. 316,609 0.1430,449 Prothena Corp., Plc. 339,506 0.16
743,217 0.34
Israel10,429 Sapiens International Corp., NV 311,671 0.14
Marshall Islands6,438 Diamond S Shipping, Inc. 46,225 0.02
Monaco20,586 Costamare, Inc. 152,748 0.0719,025 Scorpio Tankers, Inc. 227,729 0.11
380,477 0.18
Panama41,130 Banco Latinoamericano de
Comercio Exterior S.A. �E� 610,780 0.28
Puerto Rico17,385 Evertec, Inc. 642,550 0.3023,026 First BanCorp 187,201 0.08
829,751 0.38
Thailand6,914 Fabrinet 476,859 0.22
United Kingdom2,734 Tronox Holdings Plc. �A� 34,941 0.02
United States29,949 1st Source Corp. 1,151,240 0.532,022 Aaron’s Holdings Co., Inc. 129,287 0.0667,611 Abercrombie & Fitch Co. �A� 1,469,863 0.681,910 ABM Industries, Inc. 75,216 0.033,389 ACI Worldwide, Inc. 111,735 0.051,379 Addus HomeCare Corp. 133,487 0.0616,755 Aegion Corp. 294,888 0.1410,584 Aerojet Rocketdyne Holdings, Inc. 400,710 0.194,415 AeroVironment, Inc. 384,061 0.1863,019 Akebia Therapeutics, Inc. 209,223 0.108,432 Albany International Corp. �A� 593,276 0.2748,845 Alcoa Corp. 984,227 0.46385 Allakos, Inc. 40,244 0.02
24,708 Amalgamated Bank �A� 330,099 0.1511,315 Ambarella, Inc. 880,307 0.4133,672 American Assets Trust, Inc. 1,005,783 0.4734,299 American Axle & Manufacturing
Holdings, Inc. 279,880 0.1349,186 American Equity Investment Life
Holding Co. 1,305,396 0.6011,012 American Public Education, Inc. 342,033 0.163,410 Ameris Bancorp 117,543 0.054,062 AMERISAFE, Inc. 226,457 0.1034,464 Amicus Therapeutics, Inc. 790,949 0.3712,019 Amkor Technology, Inc. 177,040 0.0841,839 Amneal Pharmaceuticals, Inc. 165,264 0.0829,538 Amphastar Pharmaceuticals, Inc. 530,798 0.2516,778 ANI Pharmaceuticals, Inc. 491,763 0.23173,741 Anworth Mortgage Asset Corp. 387,442 0.1847,384 Ardelyx, Inc. 295,676 0.14
HoldingsSecurityDescription
Market ValueUSD
% ofShareholders’
Equity
Common Stocks – (Continued)United States – (Continued)
4,829 Arena Pharmaceuticals, Inc. 318,279 0.1512,862 ARMOUR Residential REIT, Inc. 138,524 0.067,939 Arrowhead Pharmaceuticals, Inc. 508,017 0.236,713 Artisan Partners Asset
Management, Inc. �A� 308,529 0.146,305 Astronics Corp. 74,399 0.0318,290 At Home Group, Inc. 346,230 0.1629,324 Atara Biotherapeutics, Inc. 677,678 0.3125,565 Atkore International Group, Inc. 1,011,096 0.4729,638 Atlantic Capital Bancshares, Inc. 447,534 0.216,738 Avaya Holdings Corp. 128,628 0.066,921 Avid Bioservices, Inc. 61,458 0.032,641 Avis Budget Group, Inc. 94,944 0.0438,867 Axcelis Technologies, Inc. 1,068,842 0.49370 Axsome Therapeutics, Inc. 26,962 0.01
6,544 Balchem Corp. 686,793 0.3269,394 Bancorp, Inc. 860,486 0.403,899 Banner Corp. 170,113 0.083,170 Beacon Roofing Supply, Inc. 117,227 0.0517,149 Bed Bath & Beyond, Inc. 357,042 0.1613,564 Bel Fuse, Inc. �B� 203,460 0.0920,127 Belden, Inc. 796,023 0.3721,569 Benchmark Electronics, Inc. 537,284 0.2524,346 Big Lots, Inc. 1,255,523 0.5898,439 BioDelivery Sciences International,
Inc. 368,162 0.173,273 Bioxcel Therapeutics, Inc. 146,696 0.0735,181 BJ’s Wholesale Club Holdings, Inc. 1,461,419 0.688,112 Black Hills Corp. 509,109 0.24446 Blackline, Inc. 54,791 0.03
19,192 Bloomin’ Brands, Inc. 335,284 0.151,316 Blueprint Medicines Corp. 140,720 0.0628,069 Boise Cascade Co. 1,215,668 0.5630,186 Boston Private Financial Holdings,
Inc. 224,584 0.105,815 Bottomline Technologies DE, Inc. 268,130 0.1276,465 Box, Inc. �A� 1,439,836 0.6715,685 Brightcove, Inc. 253,470 0.124,485 BrightView Holdings, Inc. 63,194 0.0310,735 Brinker International, Inc. 550,169 0.254,021 Buckle, Inc. 109,291 0.056,456 Cactus, Inc. �A� 160,367 0.0732,332 Cadence BanCorp 471,401 0.2217,416 Caesars Entertainment, Inc. 1,202,749 0.567,209 Caleres, Inc. 83,336 0.0429,212 Camping World Holdings, Inc. �A� 887,168 0.4125,785 Capstead Mortgage Corp. 148,522 0.0765,420 CareTrust REIT, Inc. 1,299,895 0.6031,298 Cargurus, Inc. 774,625 0.364,533 Carpenter Technology Corp. 113,914 0.0555,595 Cars.com, Inc. 624,332 0.29104,748 Catalyst Pharmaceuticals, Inc. 384,425 0.1818,410 Cathay General Bancorp 540,702 0.252,228 Central Garden & Pet Co. �A� 82,180 0.0462,986 Central Pacific Financial Corp. 1,094,697 0.518,977 Century Communities, Inc. 400,374 0.191,497 Cerence, Inc. 136,916 0.0634,444 ChannelAdvisor Corp. 509,427 0.244,975 ChemoCentryx, Inc. 274,769 0.133,013 Cherry Hill Mortgage Investment
Corp. 27,388 0.0116,433 Chimera Investment Corp. 172,382 0.0866,791 City Office REIT, Inc. 597,779 0.2819,855 Clean Energy Fuels Corp. 95,701 0.043,120 Clearwater Paper Corp. 108,701 0.0578,461 Cloudera, Inc. 932,901 0.437,141 Cogent Communications Holdings,
Inc. 413,035 0.1913,097 Cohen & Steers, Inc. 938,007 0.439,336 Collectors Universe, Inc. 701,134 0.3211,672 Columbus McKinnon Corp. 437,700 0.20
Goldman Sachs Funds—US Small Cap CORE® Equity PortfolioSchedule of InvestmentsAs at 30 November 2020
The accompanying notes are an integral part of these financial statements.
171

HoldingsSecurityDescription
Market ValueUSD
% ofShareholders’
Equity
Common Stocks – (Continued)United States – (Continued)
3,832 Commercial Metals Co. 78,403 0.0440,510 Community Health Systems, Inc. 345,145 0.1613,954 Community Healthcare Trust, Inc. 638,535 0.3072,207 Conduent, Inc. 314,823 0.158,074 CONMED Corp. 835,578 0.3939,358 Consolidated Communications
Holdings, Inc. 220,798 0.107,682 Cooper Tire & Rubber Co. 308,125 0.145,204 Corcept Therapeutics, Inc. 118,391 0.051,558 Cortexyme, Inc. 76,186 0.043,732 Covetrus, Inc. 102,406 0.0534,603 Cowen, Inc. �A� 833,932 0.394,383 Crocs, Inc. 259,956 0.1214,586 CTS Corp. 453,041 0.2168,689 CVB Financial Corp. 1,353,860 0.6325,790 Darling Ingredients, Inc. 1,266,547 0.59292 Deckers Outdoor Corp. 75,424 0.03
2,096 Denali Therapeutics, Inc. 128,296 0.0610,540 Digital Turbine, Inc. 467,133 0.229,678 Dine Brands Global, Inc. 610,682 0.2812,835 Domo, Inc. �B� 488,885 0.237,418 Donnelley Financial Solutions, Inc. 120,468 0.065,829 Eagle Pharmaceuticals, Inc. 270,990 0.137,340 EastGroup Properties, Inc. 1,027,820 0.4832,351 Echo Global Logistics, Inc. 951,443 0.442,308 Editas Medicine, Inc. 71,410 0.0334,144 Eiger BioPharmaceuticals, Inc. 305,589 0.1424,286 El Pollo Loco Holdings, Inc. 378,376 0.175,938 EMCOR Group, Inc. 522,247 0.2417,588 Emergent BioSolutions, Inc. 1,465,256 0.685,904 Enanta Pharmaceuticals, Inc. 249,149 0.121,303 Encore Capital Group, Inc. 43,546 0.026,997 Encore Wire Corp. 363,844 0.178,679 Ennis, Inc. 145,373 0.0735,256 Enova International, Inc. 759,414 0.351,392 Esquire Financial Holdings, Inc. 25,084 0.017,637 EverQuote, Inc. �A� 291,237 0.132,077 EW Scripps Co. �A� 26,980 0.0110,107 Fate Therapeutics, Inc. 583,376 0.278,261 Federal Signal Corp. 259,478 0.1236,159 Federated Hermes, Inc. 994,734 0.4669,115 Ferro Corp. 988,344 0.464,615 FibroGen, Inc. 182,939 0.0815,971 Fiesta Restaurant Group, Inc. 188,777 0.0912,492 First Bancorp Via Southern Pines
NC 405,740 0.1966,853 First Commonwealth Financial Corp. 670,536 0.3159,259 First Foundation, Inc. 1,111,106 0.5113,182 First Internet Bancorp 340,096 0.168,835 FirstCash, Inc. 582,403 0.2713,446 Flagstar Bancorp, Inc. 470,274 0.226,404 Forterra, Inc. 119,435 0.0620,899 Foundation Building Materials, Inc. 401,783 0.1933,003 Four Corners Property Trust, Inc. 925,074 0.4318,050 Franklin Electric Co., Inc. 1,219,999 0.567,748 Fulton Financial Corp. 99,329 0.0514,072 G1 Therapeutics, Inc. 237,676 0.115,299 Gaia, Inc. 55,110 0.0315,754 GenMark Diagnostics, Inc. 208,425 0.10103,854 Genworth Financial, Inc. �A� 469,420 0.2223,332 G-III Apparel Group Ltd. 489,739 0.238,030 Glacier Bancorp, Inc. 336,457 0.169,046 Gladstone Commercial Corp. 164,637 0.0832,507 Glatfelter Corp. 536,691 0.2592,066 Glu Mobile, Inc. 912,374 0.4216,721 GMS, Inc. 525,875 0.2415,161 Gold Resource Corp. 45,483 0.02121,708 Goodyear Tire & Rubber Co. 1,314,446 0.614,051 Goosehead Insurance, Inc. �A� 492,845 0.2342,812 Gray Television, Inc. 772,757 0.3639,070 Great Lakes Dredge & Dock Corp. 444,226 0.21
HoldingsSecurityDescription
Market ValueUSD
% ofShareholders’
Equity
Common Stocks – (Continued)United States – (Continued)
38,059 Green Plains, Inc. 591,817 0.2735,964 H&E Equipment Services, Inc. 998,720 0.46889 Hamilton Lane, Inc. �A� 63,128 0.03
3,853 Hancock Whitney Corp. 112,623 0.057,326 Hanger, Inc. 171,795 0.086,042 Hanmi Financial Corp. 62,837 0.0310,368 Haverty Furniture Cos., Inc. 290,511 0.139,478 Haynes International, Inc. 209,085 0.101,562 HCI Group, Inc. 81,724 0.0413,097 Healthcare Realty Trust, Inc. 394,875 0.1831,844 Heartland Financial USA, Inc. 1,288,567 0.604,440 Hecla Mining Co. 21,179 0.012,301 Herc Holdings, Inc. 134,401 0.065,625 Hibbett Sports, Inc. 240,863 0.1135,141 Hilltop Holdings, Inc. 863,063 0.4025,321 HNI Corp. 952,829 0.4410,506 Hope Bancorp, Inc. 104,009 0.0511,009 Houlihan Lokey, Inc. 712,833 0.336,937 Hub Group, Inc. �A� 385,905 0.186,464 Huron Consulting Group, Inc. 292,755 0.142,838 I3 Verticals, Inc. �A� 78,414 0.046,048 II-VI, Inc. 409,752 0.1910,963 Immunovant, Inc. 528,088 0.2438,106 Independence Realty Trust, Inc. 494,997 0.2324,247 Industrial Logistics Properties Trust 531,979 0.2518,899 Ingevity Corp. 1,276,816 0.5920,642 Ingles Markets, Inc. �A� 771,185 0.3673,532 Innoviva, Inc. 783,116 0.361,879 Inogen, Inc. 68,245 0.0311,722 Inovalon Holdings, Inc. �A� 224,125 0.106,463 Insmed, Inc. 253,737 0.12658 Insperity, Inc. 57,022 0.03
19,060 Integer Holdings Corp. 1,362,790 0.6310,805 Intellia Therapeutics, Inc. 417,721 0.1911,713 Intercept Pharmaceuticals, Inc. 424,831 0.2039,966 International Bancshares Corp. 1,337,262 0.6227,914 International Game Technology Plc. 360,091 0.174,186 International Seaways, Inc. 72,627 0.0311,133 Invacare Corp. 95,966 0.0445,298 Investors Bancorp, Inc. 452,074 0.211,609 Invitae Corp. 81,351 0.0444,412 Iridium Communications, Inc. 1,446,499 0.6712,837 Ironwood Pharmaceuticals, Inc. 149,551 0.078,971 John B Sanfilippo & Son, Inc. 661,611 0.319,865 K12, Inc. 238,536 0.11
102,904 Kadmon Holdings, Inc. 448,661 0.2144,118 KAR Auction Services, Inc. 811,771 0.386,511 KB Home 227,950 0.111,871 KBR, Inc. 52,482 0.026,753 Kforce, Inc. 282,546 0.133,869 Kinsale Capital Group, Inc. 924,033 0.4367,502 Knowles Corp. 1,155,634 0.5313,846 Koppers Holdings, Inc. 385,611 0.1810,039 Kraton Corp. 279,687 0.1319,732 Kura Oncology, Inc. 717,061 0.3345,703 Ladder Capital Corp. 432,350 0.203,925 Lakeland Bancorp, Inc. 48,866 0.024,076 Lattice Semiconductor Corp. 168,176 0.0896,968 Lexington Realty Trust 1,004,588 0.462,412 LHC Group, Inc. 476,901 0.223,630 Lithia Motors, Inc. �A� 1,073,101 0.505,838 Loral Space & Communications, Inc. 139,236 0.0648,859 Louisiana-Pacific Corp. 1,657,297 0.7711,532 Lumber Liquidators Holdings, Inc. 328,662 0.1518,545 M/I Homes, Inc. 844,539 0.3912,556 MACOM Technology Solutions
Holdings, Inc. 564,643 0.267,636 MacroGenics, Inc. 177,155 0.0823,450 MarineMax, Inc. 786,982 0.362,370 Marriott Vacations Worldwide Corp. 305,161 0.1468,134 Marten Transport Ltd. 1,207,334 0.56
Goldman Sachs Funds—US Small Cap CORE® Equity PortfolioSchedule of InvestmentsAs at 30 November 2020
The accompanying notes are an integral part of these financial statements.
172

HoldingsSecurityDescription
Market ValueUSD
% ofShareholders’
Equity
Common Stocks – (Continued)United States – (Continued)
6,506 Masonite International Corp. 656,911 0.3047,331 Matrix Service Co. 472,837 0.224,659 Matthews International Corp. �A� 132,036 0.0618,779 McGrath RentCorp 1,202,044 0.56538 MDC Holdings, Inc. 26,201 0.01
1,360 Medifast, Inc. 278,011 0.1316,675 Meridian Bioscience, Inc. 312,656 0.145,692 Merit Medical Systems, Inc. 312,832 0.144,667 Meritage Homes Corp. 418,257 0.192,072 Meritor, Inc. 55,923 0.033,368 Miller Industries, Inc. 116,971 0.0518,975 Minerals Technologies, Inc. 1,175,501 0.5452,330 Minerva Neurosciences, Inc. 207,750 0.106,562 Mirati Therapeutics, Inc. 1,545,351 0.711,712 Model N, Inc. 58,174 0.031,503 Monarch Casino & Resort, Inc. 84,063 0.044,670 Moog, Inc. �A� 373,600 0.1786,055 MRC Global, Inc. 523,214 0.2421,695 MSG Networks, Inc. �A� 264,679 0.1215,100 Mueller Industries, Inc. 496,790 0.2315,425 Mustang Bio, Inc. 52,291 0.0231,807 Myriad Genetics, Inc. 551,215 0.2514,726 Natera, Inc. 1,269,823 0.599,594 National Bank Holdings Corp. �A� 313,436 0.142,506 National HealthCare Corp. 161,036 0.0731,156 National Storage Affiliates Trust 1,055,877 0.49748 National Western Life Group, Inc. �A� 139,502 0.06
6,878 Natural Grocers by Vitamin Cottage,Inc. 103,583 0.05
40,730 Natus Medical, Inc. 871,215 0.403,486 Nautilus, Inc. 70,661 0.0378,702 Navient Corp. 774,428 0.3616,329 Neogen Corp. 1,211,938 0.5660,603 NeoPhotonics Corp. 496,945 0.2332,469 NETGEAR, Inc. 1,051,346 0.4927,161 NexPoint Residential Trust, Inc. 1,188,022 0.553,087 NextGen Healthcare, Inc. 55,689 0.033,690 Noodles & Co. 28,967 0.011,859 Northeast Bank 40,619 0.029,644 Northwest Natural Holding Co. 473,135 0.2223,824 NorthWestern Corp. 1,436,111 0.666,591 Novanta, Inc. 777,738 0.36
+ 4,065 Novavax, Inc. 523,572 0.247,693 NOW, Inc. 45,158 0.024,564 Ocular Therapeutix, Inc. 80,874 0.0445,790 O-I Glass, Inc. 527,959 0.249,859 Ooma, Inc. 153,702 0.07
200,854 OPKO Health, Inc. 841,578 0.3919,830 Oppenheimer Holdings, Inc. �A� 594,702 0.275,132 Option Care Health, Inc. 81,701 0.04
146,508 ORBCOMM, Inc. 876,118 0.4114,302 Ovintiv, Inc. 198,369 0.092,876 Owens & Minor, Inc. 73,367 0.031,275 Pacira BioSciences, Inc. 78,782 0.041,975 Patrick Industries, Inc. 125,294 0.0616,505 Penn National Gaming, Inc. 1,175,651 0.5411,276 PennyMac Financial Services, Inc. 651,640 0.3071,321 PennyMac Mortgage Investment
Trust 1,236,706 0.5734,188 Perdoceo Education Corp. 391,111 0.1824,342 Perficient, Inc. 1,128,739 0.5234,086 Perspecta, Inc. 779,888 0.3620,669 Phibro Animal Health Corp. �A� 403,046 0.193,685 Photronics, Inc. 42,783 0.0256,914 Physicians Realty Trust 995,995 0.46588 Piper Jaffray Cos. 55,548 0.03
17,829 PJT Partners, Inc. �A� 1,248,208 0.587,074 Plexus Corp. 539,393 0.2529,413 PotlatchDeltic Corp. 1,325,644 0.614,303 Powell Industries, Inc. 118,031 0.0510,706 Power Integrations, Inc. 760,340 0.35
HoldingsSecurityDescription
Market ValueUSD
% ofShareholders’
Equity
Common Stocks – (Continued)United States – (Continued)
4,461 Preferred Bank 170,321 0.0833,665 Prestige Consumer Healthcare, Inc. 1,228,772 0.5721,449 Primoris Services Corp. 532,150 0.255,683 Provident Financial Services, Inc. 91,383 0.0421,560 Quanex Building Products Corp. 450,388 0.2114,833 QuinStreet, Inc. 264,027 0.1232,163 Rambus, Inc. 521,041 0.245,510 RBC Bearings, Inc. 941,659 0.445,464 Realogy Holdings Corp. 67,262 0.0355,793 Red Rock Resorts, Inc. �A� 1,208,476 0.5612,147 Redfin Corp. 590,466 0.278,042 REGENXBIO, Inc. 290,718 0.133,551 Rent-A-Center, Inc. 122,829 0.061,192 Republic Bancorp, Inc. �A� 43,925 0.0232,404 Retail Opportunity Investments Corp. 435,510 0.2023,598 Retail Properties of America, Inc.
�A� 195,391 0.0918,620 Retail Value, Inc. 284,327 0.134,340 REVOLUTION Medicines, Inc. 188,399 0.09526 REX American Resources Corp. 43,053 0.02
34,053 Rexnord Corp. 1,290,268 0.60465 RH 211,575 0.10
13,759 Riverview Bancorp, Inc. 76,087 0.031,848 Rogers Corp. 274,687 0.1334,405 Rush Enterprises, Inc. �A� 1,315,303 0.6189,528 Sabra Health Care REIT, Inc. 1,531,824 0.714,836 Sailpoint Technologies Holdings, Inc. 224,052 0.1030,552 Sangamo Therapeutics, Inc. 308,270 0.1426,885 SEACOR Holdings, Inc. 941,513 0.4456,347 Select Medical Holdings Corp. 1,393,461 0.645,958 Seneca Foods Corp. �A� 253,870 0.123,649 Sierra Bancorp 82,577 0.042,728 Simpson Manufacturing Co., Inc. 252,258 0.124,066 SiteOne Landscape Supply, Inc. 562,450 0.26571 SiTime Corp. 50,562 0.02
13,027 SkyWest, Inc. 551,954 0.266,470 Sonos, Inc. 138,135 0.06
+ 29,959 Sorrento Therapeutics, Inc. 233,980 0.11609 Southwest Gas Holdings, Inc. 40,109 0.02
9,539 SpartanNash Co. 182,481 0.081,134 Spire, Inc. 74,073 0.0380,536 Sportsman’s Warehouse Holdings,
Inc. 1,158,913 0.541,229 SpringWorks Therapeutics, Inc. 84,150 0.044,356 Stamps.com, Inc. 814,572 0.3823,798 Standard Motor Products, Inc. 1,091,852 0.501,867 State Auto Financial Corp. 28,770 0.0122,190 Steelcase, Inc. �A� 274,268 0.1324,995 Stewart Information Services Corp. 1,072,535 0.504,952 Stifel Financial Corp. 352,880 0.169,347 Sturm Ruger & Co., Inc. 573,438 0.2759,032 Summit Materials, Inc. �A� 1,119,247 0.525,584 SunCoke Energy, Inc. 26,636 0.0113,567 Sunrun, Inc. 906,547 0.4216,054 Surmodics, Inc. 608,286 0.2848,626 SVMK, Inc. 1,057,129 0.4920,489 Sykes Enterprises, Inc. 782,065 0.3615,375 Taylor Morrison Home Corp. 394,830 0.188,180 Team, Inc. 76,238 0.0420,573 TechTarget, Inc. 1,079,465 0.5011,635 TEGNA, Inc. 171,384 0.084,004 Tenable Holdings, Inc. 142,542 0.0746,373 Tenet Healthcare Corp. 1,520,571 0.7018,646 Terreno Realty Corp. 1,082,960 0.5020,363 Texas Roadhouse, Inc. 1,512,971 0.708,789 TG Therapeutics, Inc. 260,506 0.125,194 Titan Machinery, Inc. 97,284 0.041,492 Tredegar Corp. 24,528 0.0168,180 TRI Pointe Group, Inc. 1,190,423 0.5537,585 TriCo Bancshares 1,287,286 0.6011,584 TriState Capital Holdings, Inc. 181,869 0.08
Goldman Sachs Funds—US Small Cap CORE® Equity PortfolioSchedule of InvestmentsAs at 30 November 2020
The accompanying notes are an integral part of these financial statements.
173

HoldingsSecurityDescription
Market ValueUSD
% ofShareholders’
Equity
Common Stocks – (Continued)United States – (Continued)
11,218 TrueCar, Inc. 47,003 0.028,061 Trupanion, Inc. 797,555 0.3710,897 Trustmark Corp. 277,765 0.133,338 TTEC Holdings, Inc. 229,921 0.1193,768 TTM Technologies, Inc. 1,240,551 0.572,396 Turning Point Therapeutics, Inc. 254,359 0.1211,330 Twist Bioscience Corp. 1,233,724 0.5720,498 UFP Industries, Inc. 1,096,028 0.5116,351 Ultra Clean Holdings, Inc. 511,786 0.245,259 Ultragenyx Pharmaceutical, Inc. 634,972 0.292,715 UniFirst Corp. 512,999 0.2411,798 United Bankshares, Inc. 354,412 0.162,511 Universal Health Realty Income
Trust 157,189 0.072,979 Universal Logistics Holdings, Inc. 65,300 0.033,433 Upwork, Inc. 116,928 0.057,775 Urban Edge Properties 104,652 0.054,352 USANA Health Sciences, Inc. 325,573 0.151,193 Utah Medical Products, Inc. 105,223 0.057,058 Varonis Systems, Inc. 855,641 0.4036,234 Vector Group Ltd. 407,995 0.195,841 Veeco Instruments, Inc. 97,837 0.0512,629 Veracyte, Inc. 670,789 0.3116,237 Vericel Corp. 409,822 0.196,714 Verint Systems, Inc. 394,783 0.1812,482 Viavi Solutions, Inc. 172,002 0.086,217 Vicor Corp. 512,716 0.241,164 Vir Biotechnology, Inc. 34,745 0.021,321 Virtus Investment Partners, Inc. 244,385 0.1171,309 Vishay Intertechnology, Inc. 1,376,264 0.6421,497 Vishay Precision Group, Inc. 639,966 0.3033,107 Vista Outdoor, Inc. 705,510 0.3313,705 Visteon Corp. 1,642,544 0.7620,581 Vonage Holdings Corp. 267,141 0.1213,621 Wabash National Corp. 241,773 0.1130,977 Washington Federal, Inc. 758,007 0.352,395 Washington Trust Bancorp, Inc. 96,854 0.045,282 Weis Markets, Inc. 254,540 0.1231,204 Werner Enterprises, Inc. 1,248,784 0.582,810 Westamerica BanCorp 158,259 0.0710,604 Wingstop, Inc. 1,322,849 0.613,160 Wolverine World Wide, Inc. 93,283 0.04980 Workiva, Inc. 73,275 0.03
29,672 World Fuel Services Corp. 890,160 0.417,269 Worthington Industries, Inc. 384,021 0.1833,118 Xencor, Inc. 1,409,502 0.6515,293 Xperi Holding Corp. 293,931 0.147,997 YETI Holdings, Inc. 508,289 0.2311,332 Y-mAbs Therapeutics, Inc. 543,936 0.258,662 Zumiez, Inc. 308,887 0.1427,988 Zuora, Inc. �A� 321,302 0.15
209,781,036 97.06
TOTAL COMMON STOCKS(cost USD 196,924,564) 214,161,017 99.08
TOTAL TRANSFERABLE SECURITIES ADMITTEDTO AN OFFICIAL EXCHANGE LISTING(cost USD 196,924,564) 214,161,017 99.08
MARKET VALUE OF INVESTMENTS(cost USD 196,924,564) 214,161,017 99.08
OTHER ASSETS AND LIABILITIES 1,981,370 0.92
SHAREHOLDERS’ EQUITY 216,142,387 100.00
TOTAL INVESTMENTSMarket Value
USD
% ofShareholders’
Equity
Total Investments (cost USD 196,924,564) 214,161,017 99.08Other Assets and Liabilities 1,981,370 0.92
Shareholders’ Equity 216,142,387 100.00+ A portion of these securities were on loan at 30 November 2020. See Note 6.
Allocation of Portfolio as at 30 November 2020
% ofShareholders’
Equity
Common StocksReal Estate Investment Trust 8.79Retail 8.44Biotechnology 8.26Banks 8.13Diversified Financial Services 4.81Pharmaceuticals 4.10Software 3.86Electronics 3.29Building Materials 2.90Healthcare Products 2.87Others 43.63
TOTAL COMMON STOCKS 99.08
Other Assets and Liabilities 0.92
TOTAL 100.00
Goldman Sachs Funds—US Small Cap CORE® Equity PortfolioSchedule of InvestmentsAs at 30 November 2020
The accompanying notes are an integral part of these financial statements.
174

Holdings Security Description Currency Interest Rate(a) Maturity Date(b)Market Value
USD
% ofShareholders’
Equity
Transferable securities admitted to an official exchange listing
Bonds – 90.58%Bermuda
750,000 China Oil & Gas Group Ltd. USD 5.500% 25/01/2023 771,211 2.50200,000 Li & Fung Ltd. USD 5.250% Perp. 147,219 0.48
918,430 2.98
British Virgin Islands210,000 Easy Tactic Ltd. USD 5.875% 13/02/2023 183,117 0.59450,000 Easy Tactic Ltd. USD 8.625% 05/03/2024 397,266 1.29
1,200,000 Fortune Star BVI Ltd. USD 6.850% 02/07/2024 1,264,500 4.10340,000 Fortune Star BVI Ltd. USD 5.950% 19/10/2025 348,500 1.13200,000 FPC Resources Ltd. USD 4.375% 11/09/2027 207,625 0.67200,000 Franshion Brilliant Ltd.(c) USD 5.750% Perp. 189,594 0.62200,000 Greenland Global Investment Ltd. USD 6.125% 22/04/2023 184,937 0.60380,000 Nuoxi Capital Ltd. USD 5.350% 24/01/2023 47,500 0.16181,400 Star Energy Geothermal Wayang Windu Ltd. USD 6.750% 24/04/2033 203,565 0.66400,000 Studio City Finance Ltd. USD 6.000% 15/07/2025 422,000 1.37250,000 Studio City Finance Ltd. USD 6.500% 15/01/2028 266,250 0.86
3,714,854 12.05
Cayman Islands900,000 21Vianet Group, Inc. USD 7.875% 15/10/2021 920,250 2.99300,000 Agile Group Holdings Ltd.(c) USD 7.750% Perp. 306,703 0.99550,000 Bright Scholar Education Holdings Ltd. USD 7.450% 31/07/2022 572,000 1.86200,000 Central China Real Estate Ltd. USD 7.750% 24/05/2024 197,500 0.64380,000 China Evergrande Group USD 10.000% 11/04/2023 325,434 1.06350,000 China Evergrande Group USD 10.500% 11/04/2024 290,664 0.94200,000 China SCE Group Holdings Ltd. USD 7.375% 09/04/2024 208,687 0.68200,000 CIFI Holdings Group Co., Ltd.(c) USD 5.375% Perp. 201,375 0.65300,000 Fantasia Holdings Group Co., Ltd. USD 11.875% 01/06/2023 315,516 1.02650,000 Kaisa Group Holdings Ltd. USD 9.375% 30/06/2024 627,859 2.04200,000 Kaisa Group Holdings Ltd. USD 11.250% 16/04/2025 199,969 0.65200,000 KWG Group Holdings Ltd. USD 7.400% 13/01/2027 206,313 0.67400,000 Melco Resorts Finance Ltd. USD 5.250% 26/04/2026 415,125 1.35300,000 Melco Resorts Finance Ltd. USD 5.750% 21/07/2028 316,828 1.03250,000 MGM China Holdings Ltd. USD 5.250% 18/06/2025 257,227 0.83500,000 NagaCorp Ltd. USD 7.950% 06/07/2024 518,359 1.68700,000 Sunac China Holdings Ltd. USD 7.500% 01/02/2024 715,750 2.32800,000 Wynn Macau Ltd. USD 5.500% 15/01/2026 814,000 2.64600,000 Yuzhou Group Holdings Co., Ltd.(c) USD 5.375% Perp. 583,594 1.89400,000 Zhenro Properties Group Ltd. USD 7.875% 14/04/2024 404,875 1.31
8,398,028 27.24
Hong Kong490,000 Bank of East Asia Ltd.(c) USD 5.825% Perp. 511,560 1.66600,000 Far East Horizon Ltd.(c) USD 4.350% Perp. 594,000 1.93200,000 Hero Asia Investment Ltd. USD 1.500% 18/11/2023 199,690 0.65200,000 Hong Kong Red Star Macalline Universal Home Furnishings Ltd. USD 3.375% 21/09/2022 181,375 0.59400,000 Wanda Group Overseas Ltd. USD 8.875% 21/03/2023 380,000 1.23
1,866,625 6.06
India500,000 Adani Green Energy UP Ltd. Via Prayatna Developers Pvt Ltd. Via
Parampujya Solar Energy Pvt Ltd. USD 6.250% 10/12/2024 551,484 1.79300,000 Delhi International Airport Ltd. USD 6.125% 31/10/2026 299,250 0.97200,000 Future Retail Ltd. USD 5.600% 22/01/2025 158,438 0.52400,000 ReNew Power Pvt Ltd. USD 5.875% 05/03/2027 420,000 1.36200,000 Shriram Transport Finance Co., Ltd. USD 5.950% 24/10/2022 206,031 0.67250,000 Shriram Transport Finance Co., Ltd. USD 5.100% 16/07/2023 255,977 0.83200,000 Yes Bank Ifsc Banking Unit Branch USD 3.750% 06/02/2023 198,500 0.64
2,089,680 6.78
Indonesia400,000 ABM Investama Tbk PT USD 7.125% 01/08/2022 288,188 0.93200,000 Alam Sutera Realty Tbk PT USD 6.250% 02/11/2025 147,000 0.48200,000 Bukit Makmur Mandiri Utama PT USD 7.750% 13/02/2022 180,000 0.58300,000 Cikarang Listrindo Tbk PT USD 4.950% 14/09/2026 312,937 1.02500,000 Delta Merlin Dunia Tekstil PT USD 8.625% 12/03/2024 43,125 0.14
971,250 3.15
Goldman Sachs Funds—Asia High Yield Bond PortfolioSchedule of InvestmentsAs at 30 November 2020
The accompanying notes are an integral part of these financial statements.
175

Holdings Security Description Currency Interest Rate(a) Maturity Date(b)Market Value
USD
% ofShareholders’
Equity
Bonds – (Continued)Japan
200,000 SoftBank Group Corp. USD 5.125% 19/09/2027 208,750 0.68200,000 SoftBank Group Corp.(c) USD 6.000% Perp. 196,000 0.63
404,750 1.31
Luxembourg300,000 Puma International Financing S.A. USD 5.000% 24/01/2026 274,547 0.89
Mauritius200,000 Azure Power Solar Energy Pvt Ltd. USD 5.650% 24/12/2024 213,468 0.69200,000 Greenko Mauritius Ltd. USD 6.250% 21/02/2023 208,000 0.68
1,000,000 Greenko Solar Mauritius Ltd. USD 5.950% 29/07/2026 1,073,750 3.48800,000 Network i2i Ltd.(c) USD 5.650% Perp. 838,500 2.72200,000 UPL Corp., Ltd.(c) USD 5.250% Perp. 199,094 0.65
2,532,812 8.22
Netherlands950,000 Mong Duong Finance Holdings BV USD 5.125% 07/05/2029 1,004,625 3.26200,000 Royal Capital BV(c) USD 5.000% Perp. 203,625 0.66
1,208,250 3.92
Philippines200,000 SMC Global Power Holdings Corp.(c) USD 6.500% Perp. 202,812 0.66280,000 SMC Global Power Holdings Corp.(c) USD 7.000% Perp. 288,225 0.93
491,037 1.59
Singapore200,000 ABJA Investment Co. Pte Ltd. USD 5.950% 31/07/2024 213,000 0.69200,000 AEV International Pte Ltd. USD 4.200% 16/01/2030 204,438 0.66270,000 Indika Energy Capital IV Pte Ltd. USD 8.250% 22/10/2025 292,612 0.95380,613 Innovate Capital Pte Ltd.—Series MCB(c) USD 6.000% 11/12/2024 47,676 0.16422,550 LLPL Capital Pte Ltd. USD 6.875% 04/02/2039 494,912 1.61300,000 Medco Oak Tree Pte Ltd. USD 7.375% 14/05/2026 316,687 1.03250,000 Parkway Pantai Ltd.(c) USD 4.250% Perp. 253,516 0.82200,000 Theta Capital Pte Ltd. USD 8.125% 22/01/2025 198,031 0.64200,000 TML Holdings Pte Ltd. USD 5.750% 07/05/2021 201,250 0.65300,000 TML Holdings Pte Ltd. USD 5.500% 03/06/2024 305,437 0.99500,000 Trafigura Group Pte Ltd.(c) USD 6.875% Perp. 491,094 1.59
3,018,653 9.79
Supranationals600,000 Mongolian Mining Corp. Via Energy Resources LLC USD 9.250% 15/04/2024 534,000 1.73
United Kingdom750,000 Vedanta Resources Finance II Plc. USD 8.000% 23/04/2023 513,750 1.66880,000 Vedanta Resources Ltd. USD 6.125% 09/08/2024 563,200 1.83
1,076,950 3.49
United States400,000 Periama Holdings LLC USD 5.950% 19/04/2026 424,500 1.38
TOTAL BONDS(cost USD 27,516,131) 27,924,366 90.58
Holdings Security DescriptionMarket Value
USD
% ofShareholders’
Equity
Mutual Funds – 4.45%Ireland
1,373,005 Goldman Sachs US$ Treasury Liquid Reserves Fund (X Distribution Class)(d)(e) 1,373,005 4.45
TOTAL MUTUAL FUNDS(cost USD 1,373,005) 1,373,005 4.45
TOTAL TRANSFERABLE SECURITIES ADMITTED TO AN OFFICIAL EXCHANGE LISTING(cost USD 28,889,136) 29,297,371 95.03
Goldman Sachs Funds—Asia High Yield Bond PortfolioSchedule of InvestmentsAs at 30 November 2020
The accompanying notes are an integral part of these financial statements.
176

Holdings Security Description Currency Interest Rate(a) Maturity Date(b)Market Value
USD
% ofShareholders’
Equity
Transferable securities dealt in another regulated market
Bonds – 3.05%Australia
300,000 NCIG Holdings Pty Ltd.(f) USD 12.500% 26/08/2031 317,250 1.03400,000 Scentre Group Trust 2(c) USD 4.750% 24/09/2080 417,068 1.35
734,318 2.38
British Virgin Islands200,000 Yingde Gases Investment Ltd. USD 6.250% 19/01/2023 205,750 0.67
TOTAL BONDS(cost USD 926,123) 940,068 3.05
TOTAL TRANSFERABLE SECURITIES DEALT IN ANOTHER REGULATED MARKET(cost USD 926,123) 940,068 3.05
MARKET VALUE OF INVESTMENTS EXCLUDING DERIVATIVES(cost USD 29,815,259) 30,237,439 98.08
Futures Contracts – (0.00%)
Number ofContracts Security Description
CommitmentMarket Value
USD
UnrealisedGainUSD
% ofShareholders’
Equity
USD1 US Treasury Long Bond Futures 22/03/2021 Long 174,719 56 0.0012 US Treasury Notes 2YR Futures 31/03/2021 Long 2,649,937 564 0.00
2,824,656 620 0.00
UNREALISED GAIN ON FUTURES CONTRACTS 620 0.00
Number ofContracts Security Description
CommitmentMarket Value
USD
UnrealisedLossUSD
% ofShareholders’
Equity
USD(17) US Treasury Notes 5YR Futures 31/03/2021 Short (2,141,867) (1,800) (0.00)
UNREALISED LOSS ON FUTURES CONTRACTS (1,800) (0.00)
Share Class Specific Forward Currency Contracts – 0.04%
CurrencyAmountBought Currency
AmountSold
MaturityDate
UnrealisedGainUSD
% ofShareholders’
Equity
SGD 142,372 USD 104,932 07/12/2020 1,517 0.00AUD 203,428 USD 145,066 21/12/2020 5,064 0.02GBP 102,000 USD 131,352 13/01/2021 5,141 0.02EUR 101,000 USD 119,667 21/01/2021 1,673 0.00
UNREALISED GAIN ON FORWARD CURRENCY CONTRACTS HELD FOR HEDGING PURPOSES 13,395 0.04
MARKET VALUE OF INVESTMENTS(cost USD 29,815,259) 30,249,654 98.12
OTHER ASSETS AND LIABILITIES 579,742 1.88
SHAREHOLDERS’ EQUITY 30,829,396 100.00
TOTAL INVESTMENTSMarket Value
USD
% ofShareholders’
Equity
Total Investments excluding derivatives (cost USD 29,815,259) 30,237,439 98.08Unrealised gain on futures contracts 620 0.00Unrealised loss on futures contracts (1,800) (0.00)Unrealised gain on forward currency contracts held for hedging purposes 13,395 0.04Other Assets and Liabilities 579,742 1.88
Shareholders’ Equity 30,829,396 100.00
Goldman Sachs Funds—Asia High Yield Bond PortfolioSchedule of InvestmentsAs at 30 November 2020
The accompanying notes are an integral part of these financial statements.
177

The Futures Commission Merchant was Credit Suisse Securities (USA) LLC.
The counterparties for forward currency contracts were Barclays Bank Plc., Deutsche Bank AG, HSBC Bank Plc., JP Morgan Chase Bank N.A., Royal Bank of Canada, State Street Bank& Trust and Westpac Banking Corp.
The maximum individual counterparty exposure as at 30 November 2020 is 0.02% of the NAV.
(a) Interest rates represent either the stated coupon rate, annualised discounted yield on date of purchase for discounted securities, or, for floating rate securities, the current reset ratewhich is based upon interest rates indices.
(b) Maturity dates represent either the stated date on the security, or the next interest reset date for floating rate securities or the prerefunded date for those type of securities.(c) Variable and floating coupon rates are those quoted as of 30 November 2020.(d) A related party to Goldman Sachs Funds.(e) The yield for this fund as at 30 November 2020 was 0.120%.(f) This security has a step up coupon which moves to the second rate at a set date in the future.
Goldman Sachs Funds—Asia High Yield Bond PortfolioSchedule of InvestmentsAs at 30 November 2020
The accompanying notes are an integral part of these financial statements.
178

Holdings Security Description Currency Interest Rate(a) Maturity Date(b)Market Value
USD
% ofShareholders’
Equity
Transferable securities admitted to an official exchange listing
Bonds – 71.61%Argentina
14,980,000 Arcor SAIC USD 6.000% 06/07/2023 14,806,794 0.418,137,000 Cia General de Combustibles S.A. USD 9.500% 08/03/2025 6,003,580 0.174,938,000 IRSA Propiedades Comerciales S.A. USD 8.750% 23/03/2023 3,847,782 0.112,670,000 YPF S.A. USD 8.500% 23/03/2021 2,523,150 0.0717,180,000 YPF S.A. USD 6.950% 21/07/2027 11,371,013 0.325,650,000 YPF S.A. USD 8.500% 27/06/2029 3,802,273 0.10
42,354,592 1.18
Australia2,790,000 Santos Finance Ltd. USD 4.125% 14/09/2027 2,933,657 0.0821,330,000 Santos Finance Ltd. USD 5.250% 13/03/2029 23,711,328 0.66
26,644,985 0.74
Bermuda5,390,000 Geopark Ltd. USD 6.500% 21/09/2024 5,483,483 0.156,190,000 Star Energy Geothermal Darajat II Via Star Energy Geothermal Salak USD 4.850% 14/10/2038 6,756,772 0.19
12,240,255 0.34
Brazil34,340,000 Banco do Brasil S.A.(c) USD 6.250% Perp. 34,604,418 0.964,840,000 BRF S.A. USD 5.750% 21/09/2050 5,093,344 0.147,040,000 Samarco Mineracao S.A. USD 4.125% 01/11/2022 4,266,900 0.126,320,000 Samarco Mineracao S.A. USD 5.750% 24/10/2023 3,861,125 0.11
47,825,787 1.33
British Virgin Islands1,560,000 Bluestar Finance Holdings Ltd.(c) USD 3.875% Perp. 1,544,888 0.0433,980,000 Central American Bottling Corp. USD 5.750% 31/01/2027 36,172,772 1.004,470,000 China Cinda 2020 I Management Ltd. USD 3.000% 18/03/2027 4,622,274 0.132,240,000 China Cinda Finance 2017 I Ltd. USD 4.750% 08/02/2028 2,569,000 0.072,570,000 Contemporary Ruiding Development Ltd. USD 1.875% 17/09/2025 2,588,660 0.072,140,000 Contemporary Ruiding Development Ltd. USD 2.625% 17/09/2030 2,170,094 0.061,630,000 Easy Tactic Ltd. USD 5.875% 13/02/2023 1,421,336 0.043,820,000 Easy Tactic Ltd. USD 8.625% 27/02/2024 3,365,778 0.09970,000 Easy Tactic Ltd. USD 8.625% 05/03/2024 856,328 0.02
9,120,000 Elect Global Investments Ltd.(c) USD 4.100% Perp. 9,019,680 0.251,960,000 Fortune Star BVI Ltd. USD 6.750% 02/07/2023 2,050,037 0.069,350,000 Fortune Star BVI Ltd. USD 6.850% 02/07/2024 9,852,562 0.271,180,000 Fortune Star BVI Ltd. USD 5.950% 19/10/2025 1,209,500 0.037,340,000 FPC Resources Ltd. USD 4.375% 11/09/2027 7,619,837 0.213,970,000 HKT Capital No 4 Ltd. USD 3.000% 14/07/2026 4,257,852 0.127,910,000 HKT Capital No 5 Ltd. USD 3.250% 30/09/2029 8,524,261 0.24860,000 Huarong Finance 2017 Co., Ltd. USD 4.250% 07/11/2027 931,756 0.03
3,860,000 Huarong Finance 2017 Co., Ltd.(c) USD 4.500% Perp. 3,928,756 0.114,830,000 Huarong Finance 2019 Co., Ltd. USD 3.750% 29/05/2024 5,065,462 0.1426,650,000 Huarong Finance 2019 Co., Ltd. USD 3.875% 13/11/2029 28,249,000 0.796,440,000 Huarong Finance 2019 Co., Ltd. USD 3.375% 24/02/2030 6,593,956 0.184,490,000 Huarong Finance II Co., Ltd. USD 3.625% 22/11/2021 4,573,486 0.133,830,000 Huarong Finance II Co., Ltd. USD 5.000% 19/11/2025 4,279,427 0.12820,000 Huarong Finance II Co., Ltd. USD 4.625% 03/06/2026 903,666 0.03
1,580,000 Huarong Finance II Co., Ltd. USD 4.875% 22/11/2026 1,777,500 0.05820,000 Joy Treasure Assets Holdings, Inc. USD 2.750% 17/11/2030 827,127 0.02560,000 Kunzhi Ltd. USD 6.250% 17/10/2020 68,250 0.00
1,400,000 Nuoxi Capital Ltd. USD 4.700% 24/01/2021 168,438 0.016,190,000 Nuoxi Capital Ltd. USD 5.350% 24/01/2023 773,750 0.022,940,000 NWD Finance BVI Ltd.(c) USD 5.250% Perp. 3,103,078 0.091,860,000 Sino-Ocean Land Treasure IV Ltd. USD 4.750% 14/01/2030 1,934,400 0.054,680,000 Sinopec Group Overseas Development 2012 Ltd. USD 3.900% 17/05/2022 4,880,362 0.141,600,000 Sinopec Group Overseas Development 2017 Ltd. USD 3.000% 12/04/2022 1,641,250 0.054,398,950 Star Energy Geothermal Wayang Windu Ltd. USD 6.750% 24/04/2033 4,936,447 0.144,580,000 Studio City Finance Ltd. USD 6.000% 15/07/2025 4,831,900 0.131,830,000 Studio City Finance Ltd. USD 6.500% 15/01/2028 1,948,950 0.05990,000 Sunny Express Enterprises Corp.(c) USD 3.350% Perp. 1,006,088 0.03
180,267,908 5.01
Cayman Islands8,730,000 21Vianet Group, Inc. USD 7.875% 15/10/2021 8,926,425 0.25360,000 Agile Group Holdings Ltd.(c) USD 7.875% Perp. 372,206 0.01
Goldman Sachs Funds—Emerging Markets Corporate Bond PortfolioSchedule of InvestmentsAs at 30 November 2020
The accompanying notes are an integral part of these financial statements.
179

Holdings Security Description Currency Interest Rate(a) Maturity Date(b)Market Value
USD
% ofShareholders’
Equity
Bonds – (Continued)Cayman Islands – (Continued)
860,000 Agile Group Holdings Ltd.(c) USD 8.375% Perp. 904,747 0.021,340,000 Aldar Sukuk Ltd. USD 4.750% 29/09/2025 1,495,566 0.044,090,000 Aldar Sukuk No 2 Ltd. USD 3.875% 22/10/2029 4,411,448 0.123,560,000 Bright Scholar Education Holdings Ltd. USD 7.450% 31/07/2022 3,702,400 0.10460,000 China Evergrande Group USD 9.500% 11/04/2022 419,966 0.01
1,740,000 China Evergrande Group USD 11.500% 22/01/2023 1,560,291 0.044,900,000 China Evergrande Group USD 10.000% 11/04/2023 4,196,391 0.126,410,000 Country Garden Holdings Co., Ltd. USD 3.875% 22/10/2030 6,482,112 0.1812,370,000 DP World Crescent Ltd. USD 4.848% 26/09/2028 14,132,725 0.397,070,000 DP World Crescent Ltd. USD 3.875% 18/07/2029 7,591,412 0.2113,520,000 DP World Salaam(c) USD 6.000% Perp. 14,711,450 0.411,190,000 Fantasia Holdings Group Co., Ltd. USD 11.875% 01/06/2023 1,251,545 0.03660,000 Fantasia Holdings Group Co., Ltd. USD 9.250% 28/07/2023 652,266 0.02
1,270,000 Fantasia Holdings Group Co., Ltd. USD 9.875% 19/10/2023 1,268,413 0.0412,420,000 Grupo Aval Ltd. USD 4.375% 04/02/2030 12,864,015 0.364,930,000 JD.com, Inc. USD 3.375% 14/01/2030 5,377,198 0.153,360,000 JD.com, Inc. USD 4.125% 14/01/2050 3,759,000 0.101,130,000 Kaisa Group Holdings Ltd. USD 11.950% 22/10/2022 1,189,325 0.032,990,000 Kaisa Group Holdings Ltd. USD 11.500% 30/01/2023 3,096,986 0.09550,000 Kaisa Group Holdings Ltd. USD 10.875% 23/07/2023 564,180 0.02400,000 Kaisa Group Holdings Ltd. USD 11.950% 12/11/2023 418,125 0.01
10,990,000 Kaisa Group Holdings Ltd. USD 11.250% 16/04/2025 10,988,283 0.3012,600,000 Meituan Dianping �B� USD 3.050% 28/10/2030 13,063,603 0.3611,440,000 Melco Resorts Finance Ltd. USD 5.750% 21/07/2028 12,081,712 0.342,040,000 MGM China Holdings Ltd. USD 5.250% 18/06/2025 2,098,969 0.064,370,000 NagaCorp Ltd. USD 7.950% 06/07/2024 4,530,461 0.137,020,000 New Oriental Education & Technology Group, Inc. USD 2.125% 02/07/2025 6,953,450 0.19172,469 Peru Enhanced Pass-Through Finance Ltd. USD 2.445% 02/06/2025 163,630 0.00
3,610,000 Sunac China Holdings Ltd. USD 8.350% 19/04/2023 3,784,859 0.102,470,000 Tencent Holdings Ltd. USD 2.390% 03/06/2030 2,537,925 0.076,327,000 Vale Overseas Ltd. USD 6.250% 10/08/2026 7,787,272 0.221,400,000 Vale Overseas Ltd. USD 3.750% 08/07/2030 1,538,600 0.0417,250,000 Wynn Macau Ltd. USD 5.500% 15/01/2026 17,551,875 0.494,390,000 Yuzhou Group Holdings Co., Ltd. USD 7.700% 20/02/2025 4,584,806 0.131,370,000 Yuzhou Group Holdings Co., Ltd.(c) USD 5.375% Perp. 1,332,539 0.041,310,000 Zhenro Properties Group Ltd. USD 8.350% 10/03/2024 1,344,387 0.04360,000 Zhenro Properties Group Ltd. USD 7.875% 14/04/2024 364,388 0.01
1,320,000 Zhenro Properties Group Ltd.(c) USD 10.250% Perp. 1,357,744 0.04
191,412,695 5.31
Chile8,425,000 Enel Americas S.A. USD 4.000% 25/10/2026 9,347,801 0.2630,339,000 GNL Quintero S.A. USD 4.634% 31/07/2029 33,439,267 0.932,320,000 Sociedad Quimica y Minera de Chile S.A. USD 3.625% 03/04/2023 2,442,887 0.07
45,229,955 1.26
China5,990,000 Bank of China Ltd. USD 5.000% 13/11/2024 6,686,337 0.18860,000 China Cinda Finance 2017 I Ltd. USD 4.750% 21/02/2029 995,450 0.03
3,120,000 ENN Energy Holdings Ltd. USD 2.625% 17/09/2030 3,149,250 0.09
10,831,037 0.30
Colombia12,680,000 Banco de Bogota S.A. USD 5.375% 19/02/2023 13,512,125 0.3751,000,000 Banco de Bogota S.A. USD 6.250% 12/05/2026 58,045,650 1.61200,000 Banco de Bogota S.A. USD 4.375% 03/08/2027 216,990 0.01
5,310,000 Grupo Energia Bogota S.A. ESP USD 4.875% 15/05/2030 6,199,425 0.17
77,974,190 2.16
Cyprus23,030,000 MHP S.E. USD 7.750% 10/05/2024 25,203,456 0.70
Dominican Republic14,054,000 Aeropuertos Dominicanos Siglo XXI S.A. USD 6.750% 30/03/2029 14,277,986 0.40
Egypt1,750,000 Egypt Government International Bond USD 4.550% 20/11/2023 1,796,211 0.05420,000 Egypt Government International Bond EUR 4.750% 11/04/2025 512,155 0.02
1,780,000 Egypt Government International Bond EUR 6.375% 11/04/2031 2,193,917 0.06
Goldman Sachs Funds—Emerging Markets Corporate Bond PortfolioSchedule of InvestmentsAs at 30 November 2020
The accompanying notes are an integral part of these financial statements.
180

Holdings Security Description Currency Interest Rate(a) Maturity Date(b)Market Value
USD
% ofShareholders’
Equity
Bonds – (Continued)Egypt – (Continued)
5,040,000 Egypt Government International Bond USD 7.625% 29/05/2032 5,526,675 0.1511,390,000 Egypt Government International Bond USD 8.875% 29/05/2050 12,705,189 0.35
22,734,147 0.63
Guatemala1,080,000 Guatemala Government Bond USD 6.125% 01/06/2050 1,383,244 0.04
Hong Kong8,100,000 Bank of East Asia Ltd.(c) USD 5.825% Perp. 8,456,400 0.231,570,000 Blossom Joy Ltd.(c) USD 3.100% Perp. 1,576,335 0.041,500,000 CNAC HK Finbridge Co., Ltd. USD 4.625% 14/03/2023 1,552,500 0.04610,000 CNAC HK Finbridge Co., Ltd. USD 3.375% 19/06/2024 615,147 0.02
4,450,000 CNAC HK Finbridge Co., Ltd. USD 3.000% 22/09/2030 4,234,008 0.123,390,000 Far East Horizon Ltd. USD 3.375% 18/02/2025 3,399,005 0.097,320,000 Far East Horizon Ltd.(c) USD 4.350% Perp. 7,246,800 0.201,100,000 Hong Kong Red Star Macalline Universal Home Furnishings Ltd. USD 3.375% 21/09/2022 997,562 0.032,080,000 Wanda Group Overseas Ltd. USD 8.875% 21/03/2023 1,976,000 0.06
30,053,757 0.83
Hungary42,074,000 OTP Bank Nyrt(c) EUR 2.875% 15/07/2029 51,226,912 1.42
India3,660,000 Adani Electricity Mumbai Ltd. USD 3.949% 12/02/2030 3,850,435 0.116,230,000 Adani Green Energy UP Ltd. Via Prayatna Developers Pvt Ltd. Via
Parampujya Solar Energy Pvt Ltd. USD 6.250% 10/12/2024 6,871,495 0.192,248,450 Adani Transmission Ltd. USD 4.250% 21/05/2036 2,364,737 0.071,200,000 Delhi International Airport Ltd. USD 6.125% 31/10/2026 1,197,000 0.03860,000 Future Retail Ltd. USD 5.600% 22/01/2025 681,281 0.02
6,500,000 Glenmark Pharmaceuticals Ltd. USD 2.000% 28/06/2022 7,164,755 0.205,910,000 Reliance Industries Ltd. USD 5.400% 14/02/2022 6,218,428 0.173,730,000 Reliance Industries Ltd. USD 4.125% 28/01/2025 4,138,552 0.1110,360,000 Reliance Industries Ltd. USD 3.667% 30/11/2027 11,561,113 0.321,580,000 ReNew Power Pvt Ltd. USD 6.450% 27/09/2022 1,642,706 0.051,880,000 ReNew Power Synthetic USD 6.670% 12/03/2024 1,998,381 0.052,820,000 Yes Bank Ifsc Banking Unit Branch USD 3.750% 06/02/2023 2,798,850 0.08
50,487,733 1.40
Indonesia7,390,000 ABM Investama Tbk PT USD 7.125% 01/08/2022 5,324,264 0.15582,000 Alam Sutera Realty Tbk PT USD 6.000% 02/05/2024 445,230 0.01
1,747,000 Alam Sutera Realty Tbk PT USD 6.250% 02/11/2025 1,284,045 0.044,020,000 Bukit Makmur Mandiri Utama PT USD 7.750% 13/02/2022 3,618,000 0.105,310,000 Cikarang Listrindo Tbk PT USD 4.950% 14/09/2026 5,538,994 0.169,430,000 Delta Merlin Dunia Tekstil PT USD 8.625% 12/03/2024 813,337 0.0213,050,000 Perusahaan Gas Negara Tbk PT USD 5.125% 16/05/2024 14,483,461 0.407,320,000 Tower Bersama Infrastructure Tbk PT USD 4.250% 21/01/2025 7,570,481 0.21
39,077,812 1.09
Ireland37,090,000 Alfa Bank AO Via Alfa Bond Issuance Plc.(c) USD 5.950% 15/04/2030 38,776,436 1.0812,890,000 Credit Bank of Moscow Via CBOM Finance Plc. USD 4.700% 29/01/2025 13,236,419 0.3723,646,000 Credit Bank of Moscow Via CBOM Finance Plc.(c) USD 7.500% 05/10/2027 23,764,230 0.664,960,000 Eurotorg LLC Via Bonitron DAC USD 9.000% 22/10/2025 5,257,600 0.145,526,548 Oilflow SPV 1 DAC USD 12.000% 13/01/2022 5,471,282 0.1534,320,000 Phosagro OAO Via Phosagro Bond Funding DAC USD 3.050% 23/01/2025 35,761,440 0.99
122,267,407 3.39
Isle Of Man38,040,000 Gohl Capital Ltd. USD 4.250% 24/01/2027 39,942,000 1.1111,370,000 Sasol Financing International Ltd. USD 4.500% 14/11/2022 11,497,912 0.32
51,439,912 1.43
Israel35,110,000 Bank Leumi Le-Israel BM 144A(c)(d) USD 3.275% 29/01/2031 36,163,300 1.002,870,000 Israel Electric Corp., Ltd. USD 6.875% 21/06/2023 3,275,388 0.095,560,000 Israel Electric Corp., Ltd.—Series 6 144A(d) USD 5.000% 12/11/2024 6,309,731 0.182,450,000 Israel Government International Bond USD 3.875% 03/07/2050 2,931,195 0.087,140,000 Israel Government International Bond USD 3.800% 13/05/2060 8,463,131 0.232,630,000 Israel Government International Bond USD 4.500% 03/04/2120 3,497,900 0.10
Goldman Sachs Funds—Emerging Markets Corporate Bond PortfolioSchedule of InvestmentsAs at 30 November 2020
The accompanying notes are an integral part of these financial statements.
181

Holdings Security Description Currency Interest Rate(a) Maturity Date(b)Market Value
USD
% ofShareholders’
Equity
Bonds – (Continued)Israel – (Continued)
11,710,000 Leviathan Bond Ltd. 144A(d) USD 5.750% 30/06/2023 12,354,050 0.344,800,000 Leviathan Bond Ltd. 144A(d) USD 6.750% 30/06/2030 5,280,000 0.15
78,274,695 2.17
Japan1,050,000 SoftBank Group Corp. USD 5.125% 19/09/2027 1,095,937 0.033,910,000 SoftBank Group Corp.(c) USD 6.000% Perp. 3,831,800 0.11
4,927,737 0.14
Jersey13,210,000 Galaxy Pipeline Assets Bidco Ltd. USD 2.625% 31/03/2036 13,688,863 0.3817,260,000 Galaxy Pipeline Assets Bidco Ltd. USD 3.250% 30/09/2040 17,918,037 0.50
31,606,900 0.88
Luxembourg20,550,000 Altice Financing S.A. EUR 2.250% 15/01/2025 24,096,109 0.677,725,000 Altice Financing S.A. EUR 3.000% 15/01/2028 8,988,527 0.2511,060,000 Gazprom PJSC Via Gaz Capital S.A. USD 4.950% 23/03/2027 12,487,431 0.347,700,000 MHP Lux S.A. USD 6.950% 03/04/2026 8,168,016 0.23690,000 Trafigura Funding S.A. USD 5.875% 23/09/2025 713,258 0.02
1,470,000 Tupy Overseas S.A. USD 6.625% 17/07/2024 1,508,955 0.04
55,962,296 1.55
Malaysia3,770,000 Axiata Spv5 Labuan Ltd. USD 3.064% 19/08/2050 3,795,330 0.10710,000 Petronas Capital Ltd. USD 4.800% 21/04/2060 1,043,478 0.03
4,838,808 0.13
Mauritius13,980,000 Greenko Investment Co. USD 4.875% 16/08/2023 14,231,203 0.4012,600,000 HTA Group Ltd. USD 7.000% 18/12/2025 13,572,562 0.389,050,000 MTN Mauritius Investments Ltd. USD 5.373% 13/02/2022 9,315,844 0.2623,570,000 MTN Mauritius Investments Ltd. USD 4.755% 11/11/2024 24,568,042 0.6811,787,000 MTN Mauritius Investments Ltd. USD 6.500% 13/10/2026 13,392,979 0.3710,520,000 Network i2i Ltd.(c) USD 5.650% Perp. 11,026,275 0.313,210,000 UPL Corp., Ltd. USD 4.500% 08/03/2028 3,386,550 0.095,480,000 UPL Corp., Ltd. USD 4.625% 16/06/2030 5,883,294 0.162,920,000 UPL Corp., Ltd.(c) USD 5.250% Perp. 2,906,769 0.08
98,283,518 2.73
Mexico14,300,000 America Movil SAB de CV MXN 7.125% 09/12/2024 744,068 0.0215,440,000 Banco Mercantil del Norte S.A.(c) USD 5.750% 04/10/2031 16,337,450 0.4514,980,000 Banco Mercantil del Norte S.A.(c) USD 6.750% Perp. 15,822,625 0.443,970,000 Banco Mercantil del Norte S.A.(c) USD 7.500% Perp. 4,305,589 0.1214,610,000 Banco Santander Mexico S.A. Institucion de Banca Multiple Grupo
Financiero Santander(c) USD 5.950% 01/10/2028 15,863,264 0.4419,910,000 Becle SAB de CV USD 3.750% 13/05/2025 21,524,577 0.601,470,000 Fomento Economico Mexicano SAB de CV USD 3.500% 16/01/2050 1,615,852 0.0421,033,000 Gruma SAB de CV USD 4.875% 01/12/2024 23,625,974 0.661,250,000 Grupo Bimbo SAB de CV USD 4.700% 10/11/2047 1,515,430 0.0420,483,000 Mexico City Airport Trust USD 4.250% 31/10/2026 20,473,399 0.572,060,000 Mexico City Airport Trust USD 3.875% 30/04/2028 1,986,612 0.06400,000 Mexico City Airport Trust USD 5.500% 31/10/2046 387,375 0.01
5,824,000 Mexico City Airport Trust USD 5.500% 31/07/2047 5,654,740 0.16810,000 Mexico City Airport Trust 144A(d) USD 4.250% 31/10/2026 809,620 0.02
5,590,000 Mexico City Airport Trust 144A(d) USD 3.875% 30/04/2028 5,390,856 0.151,510,000 Mexico City Airport Trust 144A(d) USD 5.500% 31/10/2046 1,462,341 0.044,030,000 Mexico City Airport Trust 144A(d) USD 5.500% 31/07/2047 3,912,878 0.111,990,000 Petroleos Mexicanos USD 6.875% 16/10/2025 2,076,028 0.062,065,000 Unifin Financiera SAB de CV USD 7.375% 12/02/2026 1,840,754 0.05
145,349,432 4.04
Mongolia3,562,929 Mongolian Mining Corp. USD 0.000% Perp. 1,248,139 0.03
Netherlands9,490,000 Bharti Airtel International Netherlands BV USD 5.350% 20/05/2024 10,470,139 0.294,930,000 First Bank of Nigeria Ltd. Via FBN Finance Co. BV USD 8.625% 27/10/2025 5,250,450 0.15
Goldman Sachs Funds—Emerging Markets Corporate Bond PortfolioSchedule of InvestmentsAs at 30 November 2020
The accompanying notes are an integral part of these financial statements.
182

Holdings Security Description Currency Interest Rate(a) Maturity Date(b)Market Value
USD
% ofShareholders’
Equity
Bonds – (Continued)Netherlands – (Continued)
1,980,000 Greenko Dutch BV USD 4.875% 24/07/2022 2,002,275 0.066,410,000 IHS Netherlands Holdco BV USD 7.125% 18/03/2025 6,756,541 0.195,880,000 IHS Netherlands Holdco BV USD 8.000% 18/09/2027 6,383,475 0.1817,070,000 Lukoil International Finance BV USD 4.563% 24/04/2023 18,336,914 0.512,600,000 Lukoil International Finance BV USD 4.750% 02/11/2026 2,957,094 0.0827,110,000 Lukoil Securities BV USD 3.875% 06/05/2030 29,312,688 0.814,610,000 Metinvest BV EUR 5.625% 17/06/2025 5,579,176 0.15200,000 Metinvest BV USD 8.500% 23/04/2026 216,250 0.01
1,240,000 Metinvest BV USD 7.650% 01/10/2027 1,298,706 0.0419,800,000 Minejesa Capital BV USD 4.625% 10/08/2030 21,210,750 0.5916,490,000 Mong Duong Finance Holdings BV USD 5.125% 07/05/2029 17,438,175 0.4825,158,612 MV24 Capital BV USD 6.748% 01/06/2034 26,837,163 0.746,310,000 NE Property BV EUR 2.625% 22/05/2023 7,777,312 0.223,500,000 NE Property BV EUR 1.750% 23/11/2024 4,243,033 0.1212,710,000 NE Property BV EUR 1.875% 09/10/2026 14,896,092 0.4110,860,000 NE Property BV EUR 3.375% 14/07/2027 13,613,332 0.3818,100,000 Petrobras Global Finance BV USD 5.999% 27/01/2028 21,195,100 0.594,837,000 Petrobras Global Finance BV USD 5.093% 15/01/2030 5,313,445 0.1513,490,000 Petrobras Global Finance BV USD 6.850% 05/06/2115 15,803,535 0.442,856,000 PPF Telecom Group BV EUR 2.125% 31/01/2025 3,489,671 0.105,320,000 PPF Telecom Group BV EUR 3.250% 29/09/2027 6,801,731 0.1931,370,000 Prosus NV USD 3.680% 21/01/2030 34,265,451 0.956,630,000 Prosus NV USD 4.027% 03/08/2050 7,077,525 0.202,750,000 Royal Capital BV(c) USD 5.000% Perp. 2,799,844 0.08460,000 Teva Pharmaceutical Finance Netherlands II BV EUR 1.250% 31/03/2023 535,785 0.01
19,000,000 Teva Pharmaceutical Finance Netherlands II BV EUR 1.125% 15/10/2024 21,214,052 0.59150,000 Teva Pharmaceutical Finance Netherlands III BV USD 2.200% 21/07/2021 149,625 0.00
5,130,000 Teva Pharmaceutical Finance Netherlands III BV USD 2.800% 21/07/2023 5,065,875 0.1417,500,000 Teva Pharmaceutical Finance Netherlands III BV USD 6.000% 15/04/2024 18,440,625 0.518,230,000 VEON Holdings BV USD 3.375% 25/11/2027 8,406,173 0.233,790,000 Vivo Energy Investments BV USD 5.125% 24/09/2027 4,059,445 0.11
349,197,447 9.70
Nigeria1,450,000 SEPLAT Petroleum Development Co., Plc. USD 9.250% 01/04/2023 1,497,351 0.041,950,000 United Bank for Africa Plc. USD 7.750% 08/06/2022 1,989,305 0.06
3,486,656 0.10
Norway9,500,000 DNO ASA 144A(d) USD 8.750% 31/05/2023 8,888,437 0.2410,430,000 DNO ASA 144A(d) USD 8.375% 29/05/2024 9,647,750 0.27
18,536,187 0.51
Panama400,000 Aeropuerto Internacional de Tocumen S.A. USD 5.625% 18/05/2036 452,500 0.01200,000 Autoridad del Canal de Panama USD 4.950% 29/07/2035 249,000 0.01
701,500 0.02
Paraguay6,280,000 Paraguay Government International Bond USD 4.950% 28/04/2031 7,474,770 0.21
Peru8,804,274 ABY Transmision Sur S.A. USD 6.875% 30/04/2043 11,833,494 0.33746,207 ABY Transmision Sur S.A. 144A(d) USD 6.875% 30/04/2043 1,002,949 0.03
11,280,000 Banco de Credito del Peru PEN 4.650% 17/09/2024 3,335,120 0.093,620,000 Peruvian Government International Bond USD 2.780% 01/12/2060 3,574,750 0.101,620,000 Peruvian Government International Bond USD 3.230% 28/07/2121 1,600,560 0.04
21,346,873 0.59
Philippines10,380,000 International Container Terminal Services, Inc. USD 4.750% 17/06/2030 11,171,475 0.315,320,000 San Miguel Corp.(c) USD 5.500% Perp. 5,343,275 0.1513,470,000 SMC Global Power Holdings Corp.(c) USD 6.500% Perp. 13,659,422 0.385,160,000 SMC Global Power Holdings Corp.(c) USD 7.000% Perp. 5,311,575 0.15
35,485,747 0.99
Qatar2,980,000 Qatar Government International Bond USD 4.400% 16/04/2050 3,946,638 0.11
Goldman Sachs Funds—Emerging Markets Corporate Bond PortfolioSchedule of InvestmentsAs at 30 November 2020
The accompanying notes are an integral part of these financial statements.
183

Holdings Security Description Currency Interest Rate(a) Maturity Date(b)Market Value
USD
% ofShareholders’
Equity
Bonds – (Continued)Romania
1,850,000 Romanian Government International Bond EUR 2.875% 11/03/2029 2,480,613 0.072,450,000 Romanian Government International Bond EUR 3.624% 26/05/2030 3,478,919 0.0910,080,000 Romanian Government International Bond EUR 2.000% 28/01/2032 12,596,403 0.351,560,000 Romanian Government International Bond EUR 2.625% 02/12/2040 1,890,011 0.055,050,000 Romanian Government International Bond EUR 3.375% 28/01/2050 6,732,596 0.19
27,178,542 0.75
Singapore7,180,000 AEV International Pte Ltd. USD 4.200% 16/01/2030 7,339,306 0.201,438,357 Eterna Capital Pte Ltd.—Series B USD 8.000% 11/12/2022 395,548 0.013,580,000 Indika Energy Capital IV Pte Ltd. USD 8.250% 22/10/2025 3,879,825 0.117,211,336 Innovate Capital Pte Ltd.—Series MCB(c) USD 6.000% 11/12/2024 903,292 0.023,660,000 Jollibee Worldwide Pte Ltd.(c) USD 3.900% Perp. 3,482,147 0.1017,024,070 LLPL Capital Pte Ltd. USD 6.875% 04/02/2039 19,939,442 0.551,000,000 Medco Bell Pte Ltd. USD 6.375% 30/01/2027 1,008,125 0.036,470,000 Parkway Pantai Ltd.(c) USD 4.250% Perp. 6,560,984 0.186,090,000 Theta Capital Pte Ltd. USD 8.125% 22/01/2025 6,030,052 0.174,500,000 TML Holdings Pte Ltd. USD 5.500% 03/06/2024 4,581,563 0.136,850,000 Trafigura Group Pte Ltd.(c) USD 6.875% Perp. 6,727,984 0.19
60,848,268 1.69
South Africa11,140,000 Growthpoint Properties International Pty Ltd. USD 5.872% 02/05/2023 11,749,219 0.33
Spain11,373,590 International Airport Finance S.A. USD 12.000% 15/03/2033 11,174,552 0.31
Supranationals21,410,000 Black Sea Trade & Development Bank USD 3.500% 25/06/2024 22,526,318 0.622,000,000 CANPACK S.A. Via Eastern PA Land Investment Holding LLC 144A(d) USD 3.125% 01/11/2025 2,045,000 0.062,370,000 Eastern & Southern African Trade & Development Bank USD 5.375% 14/03/2022 2,425,031 0.0728,440,000 Eastern & Southern African Trade & Development Bank USD 4.875% 23/05/2024 29,710,415 0.8210,480,000 Mongolian Mining Corp. Via Energy Resources LLC USD 9.250% 15/04/2024 9,327,200 0.269,890,000 Promigas S.A. ESP Via Gases del Pacifico SAC USD 3.750% 16/10/2029 10,409,225 0.29
76,443,189 2.12
Thailand16,200,000 Kasikornbank PCL(c) USD 3.343% 02/10/2031 16,377,187 0.4512,250,000 PTT Treasury Center Co., Ltd. USD 3.700% 16/07/2070 12,803,164 0.364,600,000 PTTEP Treasury Center Co., Ltd. USD 2.587% 10/06/2027 4,804,844 0.139,510,000 PTTEP Treasury Center Co., Ltd. USD 2.993% 15/01/2030 10,108,833 0.28
44,094,028 1.22
Turkey19,160,000 Akbank TAS USD 5.125% 31/03/2025 18,965,406 0.535,290,000 Akbank TAS(c) USD 6.797% 27/04/2028 5,097,411 0.1435,330,000 Anadolu Efes Biracilik ve Malt Sanayii AS USD 3.375% 01/11/2022 35,904,113 1.007,740,000 Coca-Cola Icecek AS USD 4.215% 19/09/2024 8,089,509 0.2232,690,000 Coca-Cola Icecek AS USD 4.215% 19/09/2024 34,166,158 0.9524,445,000 Global Liman Isletmeleri AS USD 8.125% 14/11/2021 17,967,075 0.5017,610,000 Mersin Uluslararasi Liman Isletmeciligi AS USD 5.375% 15/11/2024 18,526,270 0.5112,130,000 Turkiye Vakiflar Bankasi TAO USD 8.125% 28/03/2024 12,865,381 0.367,030,000 Turkiye Vakiflar Bankasi TAO USD 5.250% 05/02/2025 6,805,919 0.1912,710,000 Yapi ve Kredi Bankasi AS USD 6.100% 16/03/2023 12,922,495 0.364,750,000 Yapi ve Kredi Bankasi AS USD 5.850% 21/06/2024 4,785,625 0.1325,990,000 Yapi ve Kredi Bankasi AS USD 8.250% 15/10/2024 28,069,200 0.78
204,164,562 5.67
Ukraine340,000 Ukraine Government International Bond USD 7.750% 01/09/2022 363,375 0.01
1,250,000 Ukraine Government International Bond USD 7.750% 01/09/2023 1,361,563 0.041,380,000 Ukraine Government International Bond USD 7.750% 01/09/2024 1,512,178 0.04
3,237,116 0.09
United Arab Emirates3,420,000 Abu Dhabi Crude Oil Pipeline LLC USD 4.600% 02/11/2047 4,248,815 0.1211,050,000 Abu Dhabi Government International Bond USD 3.875% 16/04/2050 13,739,985 0.381,750,000 DP World Plc. USD 5.625% 25/09/2048 2,140,195 0.06640,000 DP World Plc. 144A(d) USD 6.850% 02/07/2037 849,900 0.03
Goldman Sachs Funds—Emerging Markets Corporate Bond PortfolioSchedule of InvestmentsAs at 30 November 2020
The accompanying notes are an integral part of these financial statements.
184

Holdings Security Description Currency Interest Rate(a) Maturity Date(b)Market Value
USD
% ofShareholders’
Equity
Bonds – (Continued)United Arab Emirates – (Continued)
28,740,000 National Central Cooling Co. PJSC USD 2.500% 21/10/2027 28,901,663 0.8042,710,000 NBK Tier 1 Financing 2 Ltd.(c) USD 4.500% Perp. 42,910,203 1.19
92,790,761 2.58
United Kingdom21,620,000 Gazprom PJSC Via Gaz Finance Plc. USD 3.000% 29/06/2027 21,998,350 0.618,100,000 Gazprom PJSC Via Gaz Finance Plc. USD 3.250% 25/02/2030 8,350,594 0.2315,180,000 Gazprom PJSC Via Gaz Finance Plc.(c) USD 4.599% Perp. 15,929,512 0.443,030,000 Vedanta Resources Finance II Plc. USD 8.000% 23/04/2023 2,075,550 0.061,510,000 Vedanta Resources Finance II Plc. USD 9.250% 23/04/2026 998,488 0.033,790,000 Vedanta Resources Ltd. USD 7.125% 31/05/2023 2,550,670 0.077,950,000 Vedanta Resources Ltd. USD 6.125% 09/08/2024 5,088,000 0.14
56,991,164 1.58
United States26,630,000 Kosmos Energy Ltd. USD 7.125% 04/04/2026 24,100,150 0.671,820,000 Kosmos Energy Ltd. 144A(d) USD 7.125% 04/04/2026 1,647,100 0.051,700,000 Periama Holdings LLC USD 5.950% 19/04/2026 1,804,125 0.0532,230,000 Sasol Financing USA LLC USD 5.875% 27/03/2024 33,373,158 0.93380,000 Sasol Financing USA LLC USD 6.500% 27/09/2028 395,675 0.01
10,760,000 United States Treasury Note/Bond USD 2.000% 15/11/2026 11,712,848 0.326,640,000 United States Treasury Note/Bond USD 3.125% 15/11/2028 7,889,150 0.22
80,922,206 2.25
Vietnam6,970,000 Viet Nam Debt & Asset Trading Corp. USD 1.000% 10/10/2025 5,899,452 0.16
TOTAL BONDS(cost USD 2,479,312,699) 2,579,094,172 71.61
Holdings Security DescriptionMarket Value
USD
% ofShareholders’
Equity
Mutual Funds – 3.50%Ireland
7,306 Goldman Sachs US$ Liquid Reserves Fund (X Distribution Class)(e)(f) 7,306 0.00126,139,243 Goldman Sachs US$ Treasury Liquid Reserves Fund (X Distribution Class)(e)(g) 126,139,243 3.50
126,146,549 3.50
TOTAL MUTUAL FUNDS(cost USD 126,146,549) 126,146,549 3.50
TOTAL TRANSFERABLE SECURITIES ADMITTED TO AN OFFICIAL EXCHANGE LISTING(cost USD 2,605,459,248) 2,705,240,721 75.11
Holdings Security Description Currency Interest Rate(a) Maturity Date(b)Market Value
USD
% ofShareholders’
Equity
Transferable securities dealt in another regulated market
Bonds – 18.48%Argentina
8,567,000 Tecpetrol S.A. USD 4.875% 12/12/2022 8,378,258 0.235,342,000 Telecom Argentina S.A. USD 8.500% 06/08/2025 4,927,161 0.144,180,000 Telecom Argentina S.A. USD 8.000% 18/07/2026 3,793,350 0.113,650,000 YPF S.A. USD 7.000% 15/12/2047 2,321,742 0.06
19,420,511 0.54
Bermuda13,320,000 Credicorp Ltd. USD 2.750% 17/06/2025 13,806,180 0.385,062,338 Digicel Group 0.5 Ltd. USD 10.000% 01/04/2024 4,062,526 0.111,602,801 Digicel Group 0.5 Ltd. 144A(d) USD 8.000% 01/04/2025 597,043 0.026,740,000 Geopark Ltd. USD 5.500% 17/01/2027 6,584,138 0.1829,790,000 Tengizchevroil Finance Co. International Ltd. USD 2.625% 15/08/2025 30,787,965 0.865,200,000 Tengizchevroil Finance Co. International Ltd. USD 4.000% 15/08/2026 5,713,500 0.1613,010,000 Tengizchevroil Finance Co. International Ltd. USD 3.250% 15/08/2030 13,595,450 0.38
75,146,802 2.09
Brazil7,400,000 Banco do Brasil S.A.(c) USD 9.000% Perp. 8,197,813 0.23
Goldman Sachs Funds—Emerging Markets Corporate Bond PortfolioSchedule of InvestmentsAs at 30 November 2020
The accompanying notes are an integral part of these financial statements.
185

Holdings Security Description Currency Interest Rate(a) Maturity Date(b)Market Value
USD
% ofShareholders’
Equity
Bonds – (Continued)Brazil – (Continued)
17,370,000 BRF S.A. USD 4.875% 24/01/2030 18,509,906 0.5210,110,000 Itau Unibanco Holding S.A.(c) USD 4.625% Perp. 9,465,488 0.261,180,000 Samarco Mineracao S.A. USD 5.375% 26/09/2024 717,034 0.02
36,890,241 1.03
Canada810,000 First Quantum Minerals Ltd. USD 7.250% 01/04/2023 828,225 0.02
28,550,000 First Quantum Minerals Ltd. 144A(d) USD 7.250% 01/04/2023 29,192,375 0.81
30,020,600 0.83
Cayman Islands2,780,000 CK Hutchison International 17 II Ltd. USD 2.750% 29/03/2023 2,906,403 0.08224,000 Embraer Overseas Ltd. USD 5.696% 16/09/2023 238,735 0.01
5,938,000 Energuate Trust USD 5.875% 03/05/2027 6,206,138 0.177,870,000 Grupo Aval Ltd. USD 4.750% 26/09/2022 8,226,117 0.231,540,000 iQIYI, Inc. USD 2.000% 01/04/2025 1,459,150 0.04650,000 King Talent Management Ltd.(c) USD 5.600% Perp. 570,375 0.02
2,070,000 Lima Metro Line 2 Finance Ltd. USD 4.350% 05/04/2036 2,277,000 0.06
21,883,918 0.61
Chile11,940,000 Embotelladora Andina S.A. USD 5.000% 01/10/2023 13,223,550 0.372,030,000 Embotelladora Andina S.A. USD 3.950% 21/01/2050 2,228,242 0.06268,000 Embotelladora Andina S.A. 144A(d) USD 5.000% 01/10/2023 296,810 0.01
1,915,000 Inversiones CMPC S.A. USD 4.375% 15/05/2023 2,047,853 0.061,430,000 Inversiones CMPC S.A. USD 4.375% 04/04/2027 1,623,273 0.0413,094,000 Sociedad Quimica y Minera de Chile S.A. USD 4.375% 28/01/2025 14,436,135 0.406,180,000 Sociedad Quimica y Minera de Chile S.A. USD 4.250% 22/01/2050 6,938,016 0.19
40,793,879 1.13
Colombia14,840,000 Empresas Publicas de Medellin ESP USD 4.250% 18/07/2029 15,820,831 0.4416,250,000 Transportadora de Gas Internacional S.A. ESP USD 5.550% 01/11/2028 19,192,774 0.53
35,013,605 0.97
Israel3,970,000 ICL Group Ltd. 144A(d) USD 6.375% 31/05/2038 5,230,475 0.15
Luxembourg5,680,000 JSM Global SARL USD 4.750% 20/10/2030 5,964,000 0.179,020,000 Millicom International Cellular S.A. USD 4.500% 27/04/2031 9,769,641 0.2717,880,000 Rede D’or Finance SARL USD 4.500% 22/01/2030 18,505,800 0.51
34,239,441 0.95
Mexico10,395,000 Alpha Holding S.A. de CV USD 9.000% 10/02/2025 7,895,327 0.226,820,000 Banco Santander Mexico S.A. Institucion de Banca Multiple Grupo
Financiero Santander USD 5.375% 17/04/2025 7,726,446 0.2128,067,000 BBVA Bancomer S.A.(c) USD 5.125% 18/01/2033 29,400,183 0.815,970,000 BBVA Bancomer S.A.(c) USD 5.875% 13/09/2034 6,553,941 0.189,220,000 Cemex SAB de CV USD 7.375% 05/06/2027 10,382,723 0.293,110,000 Cemex SAB de CV USD 5.450% 19/11/2029 3,407,394 0.0910,890,000 Cemex SAB de CV USD 5.200% 17/09/2030 11,853,329 0.333,510,000 Grupo Bimbo SAB de CV USD 4.000% 06/09/2049 3,848,386 0.115,440,000 Grupo Cementos de Chihuahua SAB de CV USD 5.250% 23/06/2024 5,647,400 0.165,530,000 Industrias Penoles SAB de CV USD 4.750% 06/08/2050 6,110,650 0.17300,000 Kimberly-Clark de Mexico SAB de CV 144A(d) USD 3.800% 08/04/2024 324,281 0.01890,000 Kimberly-Clark de Mexico SAB de CV 144A(d) USD 3.250% 12/03/2025 958,975 0.03
3,950,000 Minera Mexico S.A. de CV USD 4.500% 26/01/2050 4,456,711 0.121,610,000 Minera Mexico S.A. de CV 144A(d) USD 4.500% 26/01/2050 1,816,533 0.05200,000 Trust Fibra Uno USD 6.950% 30/01/2044 234,531 0.01
100,616,810 2.79
Netherlands280,000 Metinvest BV USD 7.750% 23/04/2023 297,369 0.01440,000 Prosus NV 144A(d) USD 3.680% 21/01/2030 480,612 0.01
5,570,000 Syngenta Finance NV USD 5.182% 24/04/2028 5,975,607 0.17
Goldman Sachs Funds—Emerging Markets Corporate Bond PortfolioSchedule of InvestmentsAs at 30 November 2020
The accompanying notes are an integral part of these financial statements.
186

Holdings Security Description Currency Interest Rate(a) Maturity Date(b)Market Value
USD
% ofShareholders’
Equity
Bonds – (Continued)Netherlands – (Continued)
350,000 Syngenta Finance NV USD 5.676% 24/04/2048 360,080 0.017,420,000 Teva Pharmaceutical Finance Netherlands III BV USD 7.125% 31/01/2025 8,190,604 0.23
15,304,272 0.43
Panama34,390,000 AES Panama Generation Holdings SRL USD 4.375% 31/05/2030 37,221,802 1.036,870,000 Banco Latinoamericano de Comercio Exterior S.A. USD 2.375% 14/09/2025 7,051,505 0.204,480,000 Banco Nacional de Panama USD 2.500% 11/08/2030 4,474,400 0.1323,020,000 Cable Onda S.A. USD 4.500% 30/01/2030 25,178,125 0.702,420,000 Cable Onda S.A. 144A(d) USD 4.500% 30/01/2030 2,646,875 0.07
76,572,707 2.13
Paraguay26,730,000 Telefonica Celular del Paraguay S.A. USD 5.875% 15/04/2027 28,651,219 0.801,140,000 Telefonica Celular del Paraguay S.A. 144A(d) USD 5.875% 15/04/2027 1,221,937 0.03
29,873,156 0.83
Peru25,400,000 Consorcio Transmantaro S.A. USD 4.700% 16/04/2034 30,233,937 0.841,350,000 Consorcio Transmantaro S.A. 144A(d) USD 4.700% 16/04/2034 1,606,922 0.045,872,500 Corp Lindley S.A. USD 6.750% 23/11/2021 6,090,884 0.17832,000 Corp Lindley S.A. USD 4.625% 12/04/2023 868,920 0.02
13,470,000 Hunt Oil Co. of Peru LLC Sucursal Del Peru USD 6.375% 01/06/2028 14,223,478 0.4037,070,000 Inretail Pharma S.A. USD 5.375% 02/05/2023 38,610,722 1.07
91,634,863 2.54
Qatar1,780,000 Ras Laffan Liquefied Natural Gas Co., Ltd. III USD 5.838% 30/09/2027 2,085,659 0.065,990,000 Ras Laffan Liquefied Natural Gas Co., Ltd. III USD 6.332% 30/09/2027 7,070,072 0.19540,000 Ras Laffan Liquefied Natural Gas Co., Ltd. III 144A(d) USD 5.838% 30/09/2027 632,728 0.02
9,788,459 0.27
Supranationals4,694,117 Digicel International Finance Ltd. Via Digicel Holdings Bermuda Ltd. 144A(d) USD 13.000% 31/12/2025 4,512,220 0.123,569,711 Digicel International Finance Ltd. Via Digicel Holdings Bermuda Ltd. 144A(d) USD 8.000% 31/12/2026 2,820,072 0.08
7,332,292 0.20
Turkey9,200,000 Akbank TAS USD 6.800% 06/02/2026 9,586,688 0.2615,320,000 Yapi ve Kredi Bankasi AS(c) USD 13.875% Perp. 17,158,400 0.48
26,745,088 0.74
United Arab Emirates7,530,000 Dolphin Energy Ltd., LLC USD 5.500% 15/12/2021 7,913,559 0.22
Venezuela35,140,000 Petroleos de Venezuela S.A. USD 6.000% 28/10/2022 1,124,480 0.032,440,000 Petroleos de Venezuela S.A. USD 6.000% 15/11/2026 91,500 0.00
1,215,980 0.03
TOTAL BONDS(cost USD 661,429,795) 665,636,658 18.48
Holdings Security DescriptionMarket Value
USD
% ofShareholders’
Equity
Common Stocks – 0.00%Mongolia
841,959 Mongolian Mining Corp. 53,295 0.00
TOTAL COMMON STOCKS(cost USD 202,046) 53,295 0.00
TOTAL TRANSFERABLE SECURITIES DEALT IN ANOTHER REGULATED MARKET(cost USD 661,631,841) 665,689,953 18.48
MARKET VALUE OF INVESTMENTS EXCLUDING DERIVATIVES(cost USD 3,267,091,089) 3,370,930,674 93.59
Goldman Sachs Funds—Emerging Markets Corporate Bond PortfolioSchedule of InvestmentsAs at 30 November 2020
The accompanying notes are an integral part of these financial statements.
187

Futures Contracts – 0.02%
Number ofContracts Security Description
CommitmentMarket Value
USD
UnrealisedGainUSD
% ofShareholders’
Equity
USD1,338 US Treasury Long Bond Futures 22/03/2021 Long 233,773,688 107,475 0.002,601 US Treasury Notes 10YR Futures 22/03/2021 Long 359,222,484 514,631 0.011,087 US Treasury Notes 2YR Futures 31/03/2021 Long 240,040,173 65,949 0.001,682 US Treasury Notes 5YR Futures 31/03/2021 Long 211,918,860 174,964 0.01
1,044,955,205 863,019 0.02
UNREALISED GAIN ON FUTURES CONTRACTS 863,019 0.02
Number ofContracts Security Description
CommitmentMarket Value
USD
UnrealisedLossUSD
% ofShareholders’
Equity
USD(11) US Treasury Ultra Long Bond Futures 22/03/2021 Short (2,372,219) (7,730) (0.00)(861) US Treasury Ultra Long Notes 10YR Futures 22/03/2021 Short (135,177,000) (190,118) (0.00)
(137,549,219) (197,848) (0.00)
UNREALISED LOSS ON FUTURES CONTRACTS (197,848) (0.00)
Forward Currency Contracts – (0.08%)
CurrencyAmountBought Currency
AmountSold
MaturityDate
UnrealisedGainUSD
% ofShareholders’
Equity
HKD 19,281,797 USD 2,487,275 18/12/2020 214 0.00USD 4,004,622 PEN 14,123,502 12/07/2021 92,514 0.00
UNREALISED GAIN ON FORWARD CURRENCY CONTRACTS 92,728 0.00
CurrencyAmountBought Currency
AmountSold
MaturityDate
UnrealisedLossUSD
% ofShareholders’
Equity
USD 2,375,407 HKD 18,418,000 18/12/2020 (645) (0.00)USD 184,379,118 EUR 155,771,252 21/01/2021 (2,761,158) (0.08)
UNREALISED LOSS ON FORWARD CURRENCY CONTRACTS (2,761,803) (0.08)
Share Class Specific Forward Currency Contracts – 0.64%
CurrencyAmountBought Currency
AmountSold
MaturityDate
UnrealisedGainUSD
% ofShareholders’
Equity
SGD 75,347,480 USD 55,546,557 07/12/2020 789,814 0.02CHF 16,209,119 USD 17,740,022 10/12/2020 196,998 0.00AUD 11,688,450 USD 8,327,910 21/12/2020 298,184 0.02GBP 146,092,907 USD 188,322,974 13/01/2021 7,173,106 0.20EUR 838,248,357 USD 992,288,188 21/01/2021 14,765,589 0.40
UNREALISED GAIN ON FORWARD CURRENCY CONTRACTS HELD FOR HEDGING PURPOSES 23,223,691 0.64
CurrencyAmountBought Currency
AmountSold
MaturityDate
UnrealisedLossUSD
% ofShareholders’
Equity
USD 1,214,081 SGD 1,658,792 07/12/2020 (26,177) (0.00)USD 632,288 AUD 884,457 21/12/2020 (20,443) (0.00)USD 2,402,700 GBP 1,860,204 13/01/2021 (86,556) (0.00)
UNREALISED LOSS ON FORWARD CURRENCY CONTRACTS HELD FOR HEDGING PURPOSES (133,176) (0.00)
Swap Contracts – 0.03%Net LocalNotionalAmount Pay Receive Currency Maturity Date
UnrealisedGainUSD
% ofShareholders’
Equity
Credit Default Swaps12,670,000 Floating (Indonesia Government
International Bond)Fixed 1.000% USD 20/12/2024 286,931 0.01
23,070,000 Floating (Abu Dhabi GovernmentInternational Bond)
Fixed 1.000% USD 20/06/2025 283,008 0.01
10,480,000 Floating (Indonesia GovernmentInternational Bond)
Fixed 1.000% USD 20/06/2025 122,532 0.00
Goldman Sachs Funds—Emerging Markets Corporate Bond PortfolioSchedule of InvestmentsAs at 30 November 2020
The accompanying notes are an integral part of these financial statements.
188

Swap Contracts – (Continued)
Net LocalNotionalAmount Pay Receive Currency Maturity Date
UnrealisedGainUSD
% ofShareholders’
Equity
Credit Default Swaps – (Continued)23,810,000 Floating (Peruvian Government
International Bond)Fixed 1.000% USD 20/06/2025 84,743 0.00
22,940,000 Floating (Qatar GovernmentInternational Bond)
Fixed 1.000% USD 20/06/2025 231,240 0.01
10,680,000 Floating (Russian Foreign Bond -Eurobond)
Fixed 1.000% USD 20/06/2025 258,441 0.01
23,640,000 Floating (Saudi GovernmentInternational Bond)
Fixed 1.000% USD 20/06/2025 173,726 0.00
19,340,000 Floating (Indonesia GovernmentInternational Bond)
Fixed 1.000% USD 20/12/2025 107,497 0.00
7,900,000 Floating (Peruvian GovernmentInternational Bond)
Fixed 1.000% USD 20/12/2025 26,917 0.00
18,870,000 Floating (Saudi GovernmentInternational Bond)
Fixed 1.000% USD 20/12/2025 32,058 0.00
UNREALISED GAIN ON CREDIT DEFAULT SWAPS 1,607,093 0.04
TOTAL UNREALISED GAIN ON SWAP CONTRACTS 1,607,093 0.04
Net LocalNotionalAmount Pay Receive Currency Maturity Date
UnrealisedLossUSD
% ofShareholders’
Equity
Interest Rate Swaps64,010,000 Fixed 0.000% Floating (EUR 6 month LIBOR) EUR 16/12/2023 (108,392) (0.00)41,430,000 Fixed 0.000% Floating (EUR 6 month LIBOR) EUR 16/12/2025 (134,079) (0.01)18,090,000 Fixed 0.000% Floating (EUR 6 month LIBOR) EUR 16/12/2027 (94,595) (0.00)14,170,000 Fixed 0.000% Floating (EUR 6 month LIBOR) EUR 16/12/2030 (55,850) (0.00)4,200,000 Fixed 0.250% Floating (EUR 6 month EURIBOR) EUR 16/12/2050 (90,300) (0.00)
UNREALISED LOSS ON INTEREST RATE SWAPS (483,216) (0.01)
Credit Default Swaps1,130,000 Fixed 1.000% Floating (China Government
International Bond)USD 20/06/2021 (7,271) (0.00)
80,000 Fixed 1.000% Floating (China GovernmentInternational Bond)
USD 20/06/2021 (503) (0.00)
370,000 Fixed 1.000% Floating (China GovernmentInternational Bond)
USD 20/06/2021 (2,339) (0.00)
30,000 Fixed 1.000% Floating (China GovernmentInternational Bond)
USD 20/06/2021 (191) (0.00)
320,000 Fixed 1.000% Floating (China GovernmentInternational Bond)
USD 20/06/2021 (2,020) (0.00)
9,420,000 Fixed 1.000% Floating (China GovernmentInternational Bond)
USD 20/06/2021 (60,226) (0.00)
790,000 Fixed 1.000% Floating (China GovernmentInternational Bond)
USD 20/06/2021 (4,353) (0.00)
4,060,000 Fixed 1.000% Floating (China GovernmentInternational Bond)
USD 20/06/2021 (21,316) (0.00)
5,880,000 Fixed 1.000% Floating (China GovernmentInternational Bond)
USD 20/06/2021 (28,942) (0.00)
42,370,000 Floating (Chile Government InternationalBond)
Fixed 1.000% USD 20/12/2025 (14,075) (0.00)
UNREALISED LOSS ON CREDIT DEFAULT SWAPS (141,236) (0.00)
TOTAL UNREALISED LOSS ON SWAP CONTRACTS (624,452) (0.01)
MARKET VALUE OF INVESTMENTS(cost USD 3,267,091,089)
3,392,999,926 94.20
OTHER ASSETS AND LIABILITIES 208,827,427 5.80
SHAREHOLDERS’ EQUITY 3,601,827,353 100.00
Goldman Sachs Funds—Emerging Markets Corporate Bond PortfolioSchedule of InvestmentsAs at 30 November 2020
The accompanying notes are an integral part of these financial statements.
189

TOTAL INVESTMENTSMarket Value
USD
% ofShareholders’
Equity
Total Investments excluding derivatives (cost USD 3,267,091,089) 3,370,930,674 93.59Unrealised gain on futures contracts 863,019 0.02Unrealised loss on futures contracts (197,848) (0.00)Unrealised gain on forward currency contracts 92,728 0.00Unrealised loss on forward currency contracts (2,761,803) (0.08)Unrealised gain on forward currency contracts held for hedging purposes 23,223,691 0.64Unrealised loss on forward currency contracts held for hedging purposes (133,176) (0.00)Unrealised gain on swap contracts 1,607,093 0.04Unrealised loss on swap contracts (624,452) (0.01)Other Assets and Liabilities 208,827,427 5.80
Shareholders’ Equity 3,601,827,353 100.00
The Futures Commission Merchant was Goldman Sachs & Co. LLC.
The counterparties for forward currency contracts were Australia and New Zealand Banking Group Ltd., Bank of America N.A., Barclays Bank Plc., BNP Paribas S.A., Citibank N.A.,Deutsche Bank AG, HSBC Bank Plc., JP Morgan Chase Bank N.A., Merrill Lynch International, Morgan Stanley & Co. International Plc., Natwest Markets Plc., Royal Bank of Canada,Standard Chartered Bank, State Street Bank & Trust, UBS AG and Westpac Banking Corp.
The counterparties for swap contracts were Barclays Capital, Inc., Citibank N.A., Credit Suisse, Deutsche Bank AG and JP Morgan Chase Bank N.A.
The maximum individual counterparty exposure as at 30 November 2020 is 0.21% of the NAV.
(a) Interest rates represent either the stated coupon rate, annualised discounted yield on date of purchase for discounted securities, or, for floating rate securities, the current reset ratewhich is based upon interest rates indices.
(b) Maturity dates represent either the stated date on the security, or the next interest reset date for floating rate securities or the prerefunded date for those type of securities.(c) Variable and floating coupon rates are those quoted as of 30 November 2020.(d) 144A: This security is issued to qualified institutional investors, pursuant to private placements, and is transferable as stated in rule 144A of the US Securities Act of 1933.(e) A related party to Goldman Sachs Funds.(f) The yield for this fund as at 30 November 2020 was 0.171%.(g) The yield for this fund as at 30 November 2020 was 0.120%.
Goldman Sachs Funds—Emerging Markets Corporate Bond PortfolioSchedule of InvestmentsAs at 30 November 2020
The accompanying notes are an integral part of these financial statements.
190

Holdings Security Description Currency Interest Rate(a) Maturity Date(b)Market Value
USD
% ofShareholders’
Equity
Transferable securities admitted to an official exchange listing
Bonds – 79.13%Angola
360,000 Angolan Government International Bond USD 8.250% 09/05/2028 323,100 0.031,447,000 Angolan Government International Bond USD 8.000% 26/11/2029 1,268,838 0.12200,000 Angolan Government International Bond USD 9.375% 08/05/2048 175,938 0.02880,000 Angolan Government International Bond USD 9.125% 26/11/2049 758,312 0.07
2,526,188 0.24
Argentina2,160,000 Arcor SAIC USD 6.000% 06/07/2023 2,135,025 0.2010,251 Argentina Government International Bond EUR 0.500% 09/07/2029 4,673 0.00266,608 Argentina Government International Bond USD 1.000% 09/07/2029 114,908 0.01
3,535,463 Argentina Government International Bond(c) USD 0.125% 09/07/2030 1,391,205 0.13300,700 Argentina Government International Bond EUR 0.125% 09/07/2030 132,649 0.01
4,199,339 Argentina Government International Bond(c) USD 0.125% 09/07/2035 1,501,264 0.141,688,912 Argentina Government International Bond(c) USD 0.125% 09/07/2041 626,164 0.06517,470 Argentina Government International Bond(c) USD 0.125% 09/07/2046 187,971 0.02
1,240,000 Cia General de Combustibles S.A. USD 9.500% 08/03/2025 914,887 0.09436,000 IRSA Propiedades Comerciales S.A. USD 8.750% 23/03/2023 339,739 0.03120,000 YPF S.A. USD 8.500% 23/03/2021 113,400 0.01
1,490,000 YPF S.A. USD 6.950% 21/07/2027 986,194 0.10390,000 YPF S.A. USD 8.500% 27/06/2029 262,458 0.03
8,710,537 0.83
Armenia650,000 Armenia International Bond USD 3.950% 26/09/2029 632,531 0.06
Australia1,770,000 Santos Finance Ltd. USD 5.250% 13/03/2029 1,967,607 0.19
Azerbaijan505,000 Azerbaijan International Bond USD 4.750% 18/03/2024 551,239 0.05
2,030,000 Azerbaijan International Bond USD 3.500% 01/09/2032 2,108,980 0.20340,000 State Oil Co. of the Azerbaijan Republic USD 6.950% 18/03/2030 428,081 0.04
3,088,300 0.29
Bahrain2,070,000 Bahrain Government International Bond USD 7.375% 14/05/2030 2,426,428 0.231,260,000 Bahrain Government International Bond USD 5.625% 30/09/2031 1,322,410 0.131,360,000 Bahrain Government International Bond USD 5.450% 16/09/2032 1,414,400 0.13440,000 CBB International Sukuk Programme Co. SPC USD 3.950% 16/09/2027 455,422 0.04
5,618,660 0.53
Belarus290,000 Belarus International Bond USD 7.625% 29/06/2027 312,384 0.03290,000 Belarus International Bond USD 6.200% 28/02/2030 292,447 0.03540,000 Republic of Belarus Ministry of Finance �T� USD 6.378% 24/02/2031 545,400 0.05
1,150,231 0.11
Belize187,758 Belize Government International Bond(d) USD 4.938% 20/02/2034 86,369 0.0177,800 Belize Government International Bond 144A(d)(e) USD 4.938% 20/02/2034 35,788 0.00
122,157 0.01
Bermuda330,000 Bermuda Government International Bond USD 2.375% 20/08/2030 343,860 0.04320,000 Bermuda Government International Bond USD 3.375% 20/08/2050 340,600 0.03330,000 Geopark Ltd. USD 6.500% 21/09/2024 335,723 0.03480,000 Star Energy Geothermal Darajat II Via Star Energy Geothermal Salak USD 4.850% 14/10/2038 523,950 0.05
1,544,133 0.15
Brazil2,970,000 Banco do Brasil S.A.(d) USD 6.250% Perp. 2,992,869 0.2832,020,000 Brazil Notas do Tesouro Nacional—Series F BRL 10.000% 01/01/2025 6,995,655 0.663,795,000 Brazilian Government International Bond USD 4.500% 30/05/2029 4,211,857 0.40780,000 Brazilian Government International Bond USD 4.750% 14/01/2050 827,653 0.08620,000 BRF S.A. USD 5.750% 21/09/2050 652,453 0.06
Goldman Sachs Funds—Emerging Markets Debt Blend PortfolioSchedule of InvestmentsAs at 30 November 2020
The accompanying notes are an integral part of these financial statements.
191

Holdings Security Description Currency Interest Rate(a) Maturity Date(b)Market Value
USD
% ofShareholders’
Equity
Bonds – (Continued)Brazil – (Continued)
820,000 Samarco Mineracao S.A. USD 4.125% 01/11/2022 496,997 0.051,000,000 Samarco Mineracao S.A. USD 5.750% 24/10/2023 610,938 0.06
16,788,422 1.59
British Virgin Islands1,450,000 Bluestar Finance Holdings Ltd.(d) USD 3.875% Perp. 1,435,953 0.142,770,000 Central American Bottling Corp. USD 5.750% 31/01/2027 2,948,752 0.28430,000 China Cinda 2020 I Management Ltd. USD 3.000% 18/03/2027 444,648 0.04260,000 Contemporary Ruiding Development Ltd. USD 1.875% 17/09/2025 261,888 0.02210,000 Contemporary Ruiding Development Ltd. USD 2.625% 17/09/2030 212,953 0.02400,000 Easy Tactic Ltd. USD 5.875% 13/02/2023 348,794 0.03310,000 Easy Tactic Ltd. USD 8.625% 27/02/2024 273,139 0.03
1,090,000 Elect Global Investments Ltd.(d) USD 4.100% Perp. 1,078,010 0.10590,000 Fortune Star BVI Ltd. USD 6.850% 02/07/2024 621,713 0.06480,000 Fortune Star BVI Ltd. USD 5.950% 19/10/2025 492,000 0.05610,000 FPC Resources Ltd. USD 4.375% 11/09/2027 633,256 0.06
1,050,000 HKT Capital No 4 Ltd. USD 3.000% 14/07/2026 1,126,132 0.111,740,000 HKT Capital No 5 Ltd. USD 3.250% 30/09/2029 1,875,122 0.18430,000 Huarong Finance 2017 Co., Ltd. USD 4.250% 07/11/2027 465,878 0.04
2,040,000 Huarong Finance 2019 Co., Ltd. USD 3.750% 29/05/2024 2,139,450 0.20650,000 Huarong Finance 2019 Co., Ltd. USD 3.875% 13/11/2029 689,000 0.07780,000 Huarong Finance 2019 Co., Ltd. USD 3.375% 24/02/2030 798,647 0.08430,000 Huarong Finance 2019 Co., Ltd. USD 3.625% 30/09/2030 447,265 0.04390,000 Huarong Finance II Co., Ltd. USD 5.000% 19/11/2025 435,764 0.04420,000 Huarong Finance II Co., Ltd. USD 4.625% 03/06/2026 462,853 0.04400,000 Huarong Finance II Co., Ltd. USD 4.875% 22/11/2026 450,000 0.04200,000 Joy Treasure Assets Holdings, Inc. USD 2.750% 17/11/2030 201,738 0.02720,000 Nuoxi Capital Ltd. USD 5.350% 24/01/2023 90,000 0.01280,000 NWD Finance BVI Ltd.(d) USD 5.250% Perp. 295,531 0.03310,000 Sino-Ocean Land Treasure IV Ltd. USD 4.750% 14/01/2030 322,400 0.03560,000 Studio City Finance Ltd. USD 6.000% 15/07/2025 590,800 0.06220,000 Sunny Express Enterprises Corp.(d) USD 3.350% Perp. 223,575 0.02
19,365,261 1.84
Cayman Islands700,000 21Vianet Group, Inc. USD 7.875% 15/10/2021 715,750 0.07240,000 Agile Group Holdings Ltd.(d) USD 7.875% Perp. 248,138 0.02600,000 Aldar Sukuk No 2 Ltd. USD 3.875% 22/10/2029 647,156 0.06200,000 Bright Scholar Education Holdings Ltd. USD 7.450% 31/07/2022 208,000 0.02560,000 China Evergrande Group USD 10.000% 11/04/2023 479,588 0.05620,000 Country Garden Holdings Co., Ltd. USD 3.875% 22/10/2030 626,975 0.06
1,530,000 DP World Crescent Ltd. USD 4.848% 26/09/2028 1,748,025 0.17830,000 DP World Crescent Ltd. USD 3.875% 18/07/2029 891,212 0.08
2,090,000 DP World Salaam(d) USD 6.000% Perp. 2,274,181 0.22440,000 Dubai DOF Sukuk Ltd. USD 2.763% 09/09/2030 446,050 0.04200,000 Fantasia Holdings Group Co., Ltd. USD 9.250% 28/07/2023 197,656 0.02
1,280,000 Grupo Aval Ltd. USD 4.375% 04/02/2030 1,325,760 0.13380,000 JD.com, Inc. USD 3.875% 29/04/2026 421,622 0.04290,000 JD.com, Inc. USD 3.375% 14/01/2030 316,306 0.03200,000 JD.com, Inc. USD 4.125% 14/01/2050 223,750 0.02210,000 Kaisa Group Holdings Ltd. USD 11.500% 30/01/2023 217,514 0.02360,000 Kaisa Group Holdings Ltd. USD 11.250% 16/04/2025 359,944 0.03460,000 Kaisa Group Holdings Ltd.(d) USD 10.875% Perp. 443,900 0.04
1,140,000 Meituan Dianping �B� USD 3.050% 28/10/2030 1,181,945 0.11990,000 Melco Resorts Finance Ltd. USD 5.750% 21/07/2028 1,045,533 0.10200,000 MGM China Holdings Ltd. USD 5.250% 18/06/2025 205,781 0.02560,000 Mumtalakat Sukuk Holding Co. USD 4.100% 21/01/2027 567,437 0.05420,000 NagaCorp Ltd. USD 7.950% 06/07/2024 435,422 0.04680,000 New Oriental Education & Technology Group, Inc. USD 2.125% 02/07/2025 673,554 0.06800,000 Sharjah Sukuk Program Ltd. USD 3.854% 03/04/2026 870,750 0.08
1,470,000 Sharjah Sukuk Program Ltd. USD 4.226% 14/03/2028 1,643,184 0.16606,000 Sharjah Sukuk Program Ltd. USD 3.234% 23/10/2029 635,164 0.06720,000 Sunac China Holdings Ltd. USD 8.350% 19/04/2023 754,875 0.07340,000 Tencent Holdings Ltd. USD 2.390% 03/06/2030 349,350 0.03502,000 Vale Overseas Ltd. USD 6.250% 10/08/2026 617,862 0.0630,000 Vale Overseas Ltd. USD 3.750% 08/07/2030 32,970 0.00
1,300,000 Wynn Macau Ltd. USD 5.500% 15/01/2026 1,322,750 0.13760,000 Yuzhou Group Holdings Co., Ltd. USD 7.700% 20/02/2025 793,725 0.08
Goldman Sachs Funds—Emerging Markets Debt Blend PortfolioSchedule of InvestmentsAs at 30 November 2020
The accompanying notes are an integral part of these financial statements.
192

Holdings Security Description Currency Interest Rate(a) Maturity Date(b)Market Value
USD
% ofShareholders’
Equity
Bonds – (Continued)Cayman Islands – (Continued)
200,000 Zhenro Properties Group Ltd. USD 8.350% 10/03/2024 205,250 0.02280,000 Zhenro Properties Group Ltd.(d) USD 10.250% Perp. 288,006 0.03
23,415,085 2.22
Chile4,064,223,800 Bonos de la Tesoreria de la Republica en pesos CLP 1.500% 01/03/2026 6,044,063 0.573,295,000,000 Bonos de la Tesoreria de la Republica en pesos CLP 4.500% 01/03/2026 4,988,408 0.471,725,000,000 Bonos de la Tesoreria de la Republica en pesos CLP 5.000% 01/03/2035 2,708,016 0.26590,000,000 Bonos de la Tesoreria de la Republica en pesos 144A(e) CLP 4.700% 01/09/2030 910,378 0.09
260,000 Corp Nacional del Cobre de Chile USD 3.150% 14/01/2030 282,953 0.03200,000 Corp Nacional del Cobre de Chile USD 3.750% 15/01/2031 226,500 0.02200,000 Empresa de Transporte de Pasajeros Metro S.A. USD 3.650% 07/05/2030 223,250 0.02930,000 Enel Americas S.A. USD 4.000% 25/10/2026 1,031,864 0.10200,000 Engie Energia Chile S.A. USD 4.500% 29/01/2025 221,812 0.02
2,347,000 GNL Quintero S.A. USD 4.634% 31/07/2029 2,586,834 0.24
19,224,078 1.82
China173,240,000 Agricultural Development Bank of China—Series 2004 CNY 2.960% 17/04/2030 24,724,402 2.35
490,000 Bank of China Ltd. USD 5.000% 13/11/2024 546,963 0.0551,910,000 China Development Bank—Series 2010 CNY 3.090% 18/06/2030 7,500,552 0.7186,710,000 China Government Bond CNY 2.850% 04/06/2027 12,869,799 1.22240,000 ENN Energy Holdings Ltd. USD 2.625% 17/09/2030 242,250 0.02
45,883,966 4.35
Colombia240,000 Banco de Bogota S.A. USD 5.375% 19/02/2023 255,750 0.02
5,970,000 Banco de Bogota S.A. USD 6.250% 12/05/2026 6,794,756 0.64250,000 Bancolombia S.A. USD 3.000% 29/01/2025 258,480 0.02
2,904,000,000 Colombia Government International Bond COP 7.750% 14/04/2021 824,319 0.08585,000,000 Colombia Government International Bond COP 4.375% 21/03/2023 167,256 0.02
850,000 Colombia Government International Bond USD 3.875% 25/04/2027 934,575 0.09820,000 Colombia Government International Bond USD 4.500% 15/03/2029 936,722 0.09670,000 Colombia Government International Bond USD 6.125% 18/01/2041 887,541 0.08620,000 Colombia Government International Bond USD 5.000% 15/06/2045 750,588 0.07910,000 Colombia Government International Bond USD 5.200% 15/05/2049 1,145,605 0.11
2,753,529,000 Colombian TES COP 3.300% 17/03/2027 850,515 0.0812,218,300,000 Colombian TES—Series B COP 6.250% 26/11/2025 3,743,219 0.3649,546,900,000 Colombian TES—Series B COP 7.500% 26/08/2026 15,996,424 1.5211,998,000,000 Colombian TES—Series B COP 5.750% 03/11/2027 3,532,079 0.3312,801,500,000 Colombian TES—Series B COP 6.000% 28/04/2028 3,804,187 0.364,038,600,000 Colombian TES—Series B COP 7.000% 30/06/2032 1,227,579 0.1214,646,300,000 Colombian TES—Series B COP 7.250% 26/10/2050 4,319,517 0.41
530,000 Grupo Energia Bogota S.A. ESP USD 4.875% 15/05/2030 618,775 0.06
47,047,887 4.46
Costa Rica230,000 Costa Rica Government International Bond USD 6.125% 19/02/2031 202,113 0.02
Croatia240,000 Croatia Government International Bond EUR 1.125% 19/06/2029 302,107 0.03
1,610,000 Croatia Government International Bond EUR 1.500% 17/06/2031 2,083,363 0.20
2,385,470 0.23
Cyprus1,740,000 MHP S.E. USD 7.750% 10/05/2024 1,904,212 0.18
Czech Republic36,150,000 Czech Republic Government Bond—Series 103 CZK 2.000% 13/10/2033 1,788,672 0.17265,660,000 Czech Republic Government Bond—Series 120 CZK 1.250% 14/02/2025 12,442,828 1.1828,220,000 Czech Republic Government Bond—Series 121 CZK 1.200% 13/03/2031 1,284,019 0.1225,800,000 Czech Republic Government Bond—Series 49 CZK 4.200% 04/12/2036 1,661,777 0.1649,680,000 Czech Republic Government Bond—Series 78 CZK 2.500% 25/08/2028 2,522,836 0.2441,200,000 Czech Republic Government Bond—Series 94 CZK 0.950% 15/05/2030 1,835,981 0.17
21,536,113 2.04
Dominican Republic3,500,000 Aeropuertos Dominicanos Siglo XXI S.A. USD 6.750% 30/03/2029 3,555,781 0.344,000,000 Dominican Republic Bond DOP 10.500% 07/04/2023 73,378 0.0171,900,000 Dominican Republic Bond DOP 12.000% 05/03/2032 1,512,379 0.14
Goldman Sachs Funds—Emerging Markets Debt Blend PortfolioSchedule of InvestmentsAs at 30 November 2020
The accompanying notes are an integral part of these financial statements.
193

Holdings Security Description Currency Interest Rate(a) Maturity Date(b)Market Value
USD
% ofShareholders’
Equity
Bonds – (Continued)Dominican Republic – (Continued)
66,667 Dominican Republic International Bond USD 7.500% 06/05/2021 68,406 0.0159,100,000 Dominican Republic International Bond DOP 8.900% 15/02/2023 1,038,194 0.10325,000 Dominican Republic International Bond USD 5.875% 18/04/2024 348,156 0.03
2,840,000 Dominican Republic International Bond USD 6.875% 29/01/2026 3,299,725 0.31150,000 Dominican Republic International Bond USD 8.625% 20/04/2027 184,289 0.02
4,900,000 Dominican Republic International Bond DOP 18.500% 04/02/2028 129,733 0.01815,000 Dominican Republic International Bond USD 6.000% 19/07/2028 931,265 0.09
30,500,000 Dominican Republic International Bond DOP 11.375% 06/07/2029 590,116 0.051,280,000 Dominican Republic International Bond USD 6.500% 15/02/2048 1,442,600 0.141,515,000 Dominican Republic International Bond USD 6.400% 05/06/2049 1,686,621 0.16980,000 Dominican Republic International Bond USD 5.875% 30/01/2060 1,026,703 0.10
15,887,346 1.51
Ecuador257,110 Ecuador Government International Bond(c) USD 0.500% 31/07/2030 163,586 0.01548,093 Ecuador Government International Bond USD 8.485% 31/07/2030 245,272 0.02
3,811,524 Ecuador Government International Bond(c) USD 0.500% 31/07/2035 2,093,956 0.202,070,890 Ecuador Government International Bond(c) USD 0.500% 31/07/2040 1,025,090 0.10
3,527,904 0.33
Egypt1,410,000 Egypt Government International Bond EUR 4.750% 11/04/2025 1,719,379 0.16780,000 Egypt Government International Bond EUR 4.750% 16/04/2026 945,152 0.09470,000 Egypt Government International Bond USD 6.588% 21/02/2028 504,442 0.05560,000 Egypt Government International Bond USD 7.600% 01/03/2029 625,100 0.06
1,555,000 Egypt Government International Bond EUR 5.625% 16/04/2030 1,884,245 0.181,175,000 Egypt Government International Bond EUR 6.375% 11/04/2031 1,448,232 0.14540,000 Egypt Government International Bond USD 7.053% 15/01/2032 573,159 0.05
1,430,000 Egypt Government International Bond USD 7.625% 29/05/2032 1,568,084 0.15680,000 Egypt Government International Bond USD 8.700% 01/03/2049 748,106 0.07
1,030,000 Egypt Government International Bond USD 8.875% 29/05/2050 1,148,933 0.11
11,164,832 1.06
El Salvador1,120,000 El Salvador Government International Bond USD 9.500% 15/07/2052 1,063,300 0.10
Gabon346,999 Gabon Government International Bond USD 6.375% 12/12/2024 351,066 0.03500,000 Gabon Government International Bond USD 6.625% 06/02/2031 493,906 0.05
844,972 0.08
Ghana340,000 Ghana Government International Bond USD 7.875% 11/02/2035 332,775 0.03310,000 Ghana Government International Bond USD 8.750% 11/03/2061 305,350 0.03
638,125 0.06
Guatemala1,845,000 Guatemala Government Bond USD 4.500% 03/05/2026 2,022,293 0.191,705,000 Guatemala Government Bond USD 4.375% 05/06/2027 1,878,963 0.18250,000 Guatemala Government Bond USD 4.875% 13/02/2028 284,063 0.03410,000 Guatemala Government Bond USD 4.900% 01/06/2030 471,564 0.04410,000 Guatemala Government Bond USD 6.125% 01/06/2050 525,120 0.05
5,182,003 0.49
Honduras1,245,000 Honduras Government International Bond USD 8.750% 16/12/2020 1,248,051 0.12530,000 Honduras Government International Bond USD 7.500% 15/03/2024 588,631 0.06680,000 Honduras Government International Bond USD 5.625% 24/06/2030 768,081 0.07
2,604,763 0.25
Hong Kong670,000 Bank of East Asia Ltd.(d) USD 5.825% Perp. 699,480 0.07
1,430,000 CNAC HK Finbridge Co., Ltd. USD 3.375% 19/06/2024 1,442,066 0.14370,000 CNAC HK Finbridge Co., Ltd. USD 3.000% 22/09/2030 352,041 0.03380,000 Far East Horizon Ltd. USD 3.375% 18/02/2025 381,009 0.03
1,040,000 Far East Horizon Ltd.(d) USD 4.350% Perp. 1,029,600 0.10650,000 MTR Corp., Ltd. USD 1.625% 19/08/2030 645,568 0.06200,000 Wanda Group Overseas Ltd. USD 8.875% 21/03/2023 190,000 0.02
4,739,764 0.45
Goldman Sachs Funds—Emerging Markets Debt Blend PortfolioSchedule of InvestmentsAs at 30 November 2020
The accompanying notes are an integral part of these financial statements.
194

Holdings Security Description Currency Interest Rate(a) Maturity Date(b)Market Value
USD
% ofShareholders’
Equity
Bonds – (Continued)Hungary2,519,480,000 Hungary Government Bond—Series 24/B HUF 3.000% 26/06/2024 8,969,420 0.851,973,670,000 Hungary Government Bond—Series 26/D HUF 2.750% 22/12/2026 7,050,774 0.67
20,000 Hungary Government Bond—Series 27/A HUF 3.000% 27/10/2027 73 0.0013,520,000 Hungary Government Bond—Series 28/A HUF 6.750% 22/10/2028 61,807 0.01734,020,000 Hungary Government Bond—Series 30/A HUF 3.000% 21/08/2030 2,653,345 0.25
100,000 Hungary Government International Bond EUR 1.500% 17/11/2050 119,073 0.013,645,000 OTP Bank Nyrt(d) EUR 2.875% 15/07/2029 4,437,945 0.42
23,292,437 2.21
India200,000 Adani Electricity Mumbai Ltd. USD 3.949% 12/02/2030 210,406 0.02770,000 Adani Green Energy UP Ltd. Via Prayatna Developers Pvt Ltd. Via
Parampujya Solar Energy Pvt Ltd. USD 6.250% 10/12/2024 849,286 0.08193,000 Adani Transmission Ltd. USD 4.250% 21/05/2036 202,982 0.02
1,000,000 Glenmark Pharmaceuticals Ltd. USD 2.000% 28/06/2022 1,102,270 0.102,070,000 Reliance Industries Ltd. USD 3.667% 30/11/2027 2,309,991 0.22280,000 ReNew Power Synthetic USD 6.670% 12/03/2024 297,631 0.03200,000 Yes Bank Ifsc Banking Unit Branch USD 3.750% 06/02/2023 198,500 0.02
5,171,066 0.49
Indonesia400,000 ABM Investama Tbk PT USD 7.125% 01/08/2022 288,187 0.03240,000 Alam Sutera Realty Tbk PT USD 6.250% 02/11/2025 176,400 0.02400,000 Bukit Makmur Mandiri Utama PT USD 7.750% 13/02/2022 360,000 0.03400,000 Cikarang Listrindo Tbk PT USD 4.950% 14/09/2026 417,250 0.04750,000 Delta Merlin Dunia Tekstil PT USD 8.625% 12/03/2024 64,688 0.01340,000 Indonesia Asahan Aluminium Persero PT USD 5.800% 15/05/2050 421,122 0.04360,000 Indonesia Government International Bond EUR 3.750% 14/06/2028 520,365 0.05240,000 Indonesia Government International Bond USD 3.850% 15/10/2030 281,363 0.03162,000 Indonesia Government International Bond USD 6.625% 17/02/2037 233,128 0.02
1,140,000 Indonesia Government International Bond USD 6.750% 15/01/2044 1,776,797 0.1710,000 Indonesia Government International Bond USD 5.125% 15/01/2045 13,102 0.00600,000 Indonesia Government International Bond USD 3.500% 14/02/2050 660,187 0.06310,000 Indonesia Government International Bond USD 4.450% 15/04/2070 384,642 0.04
8,000,000 Indonesia Treasury Bond—Series FR73 IDR 8.750% 15/05/2031 667 0.001,000,000 Indonesia Treasury Bond—Series FR82 IDR 7.000% 15/09/2030 75 0.001,340,000 Perusahaan Gas Negara Tbk PT USD 5.125% 16/05/2024 1,487,191 0.141,060,000 Perusahaan Penerbit SBSN Indonesia III USD 4.150% 29/03/2027 1,216,019 0.11570,000 Perusahaan Penerbit SBSN Indonesia III USD 4.400% 01/03/2028 668,859 0.06
1,950,000 Perusahaan Penerbit SBSN Indonesia III USD 4.450% 20/02/2029 2,311,359 0.22270,000 Perusahaan Penerbit SBSN Indonesia III USD 3.800% 23/06/2050 299,784 0.03700,000 Tower Bersama Infrastructure Tbk PT USD 4.250% 21/01/2025 723,953 0.07
12,305,138 1.17
Ireland2,700,000 Alfa Bank AO Via Alfa Bond Issuance Plc.(d) USD 5.950% 15/04/2030 2,822,766 0.27430,000 Credit Bank of Moscow Via CBOM Finance Plc. USD 4.700% 29/01/2025 441,556 0.04
2,800,000 Credit Bank of Moscow Via CBOM Finance Plc.(d) USD 7.500% 05/10/2027 2,814,000 0.27380,000 Eurotorg LLC Via Bonitron DAC USD 9.000% 22/10/2025 402,800 0.04579,270 Oilflow SPV 1 DAC USD 12.000% 13/01/2022 573,477 0.05
2,540,000 Phosagro OAO Via Phosagro Bond Funding DAC USD 3.050% 23/01/2025 2,646,680 0.25
9,701,279 0.92
Isle Of Man2,750,000 Gohl Capital Ltd. USD 4.250% 24/01/2027 2,887,500 0.27
Israel2,290,000 Bank Leumi Le-Israel BM 144A(d)(e) USD 3.275% 29/01/2031 2,358,700 0.22250,000 Israel Electric Corp., Ltd. USD 6.875% 21/06/2023 285,312 0.03
1,000,000 Israel Electric Corp., Ltd.—Series 6 144A(e) USD 5.000% 12/11/2024 1,134,844 0.112,020,000 Israel Government International Bond USD 3.800% 13/05/2060 2,394,331 0.231,160,000 Leviathan Bond Ltd. 144A(e) USD 5.750% 30/06/2023 1,223,800 0.11590,000 Leviathan Bond Ltd. 144A(e) USD 6.750% 30/06/2030 649,000 0.06
8,045,987 0.76
Ivory Coast100,000 Ivory Coast Government International Bond EUR 5.250% 22/03/2030 126,628 0.01210,000 Ivory Coast Government International Bond EUR 4.875% 30/01/2032 251,906 0.03
Goldman Sachs Funds—Emerging Markets Debt Blend PortfolioSchedule of InvestmentsAs at 30 November 2020
The accompanying notes are an integral part of these financial statements.
195
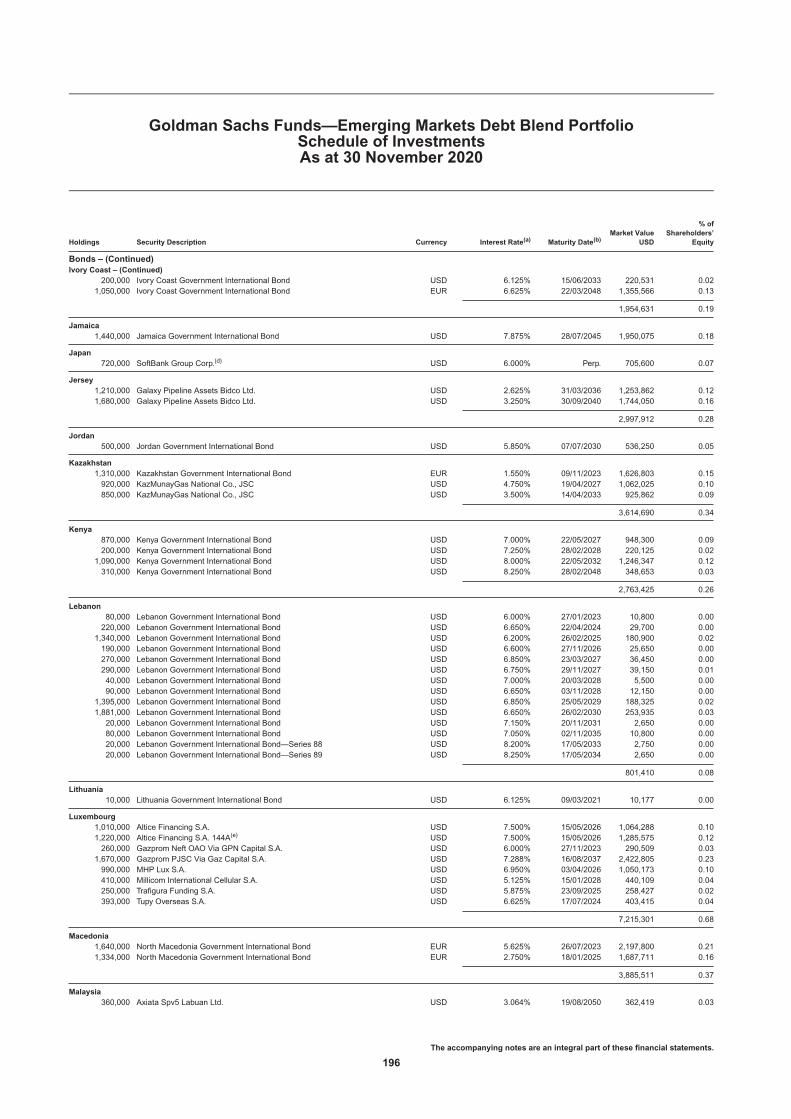
Holdings Security Description Currency Interest Rate(a) Maturity Date(b)Market Value
USD
% ofShareholders’
Equity
Bonds – (Continued)Ivory Coast – (Continued)
200,000 Ivory Coast Government International Bond USD 6.125% 15/06/2033 220,531 0.021,050,000 Ivory Coast Government International Bond EUR 6.625% 22/03/2048 1,355,566 0.13
1,954,631 0.19
Jamaica1,440,000 Jamaica Government International Bond USD 7.875% 28/07/2045 1,950,075 0.18
Japan720,000 SoftBank Group Corp.(d) USD 6.000% Perp. 705,600 0.07
Jersey1,210,000 Galaxy Pipeline Assets Bidco Ltd. USD 2.625% 31/03/2036 1,253,862 0.121,680,000 Galaxy Pipeline Assets Bidco Ltd. USD 3.250% 30/09/2040 1,744,050 0.16
2,997,912 0.28
Jordan500,000 Jordan Government International Bond USD 5.850% 07/07/2030 536,250 0.05
Kazakhstan1,310,000 Kazakhstan Government International Bond EUR 1.550% 09/11/2023 1,626,803 0.15920,000 KazMunayGas National Co., JSC USD 4.750% 19/04/2027 1,062,025 0.10850,000 KazMunayGas National Co., JSC USD 3.500% 14/04/2033 925,862 0.09
3,614,690 0.34
Kenya870,000 Kenya Government International Bond USD 7.000% 22/05/2027 948,300 0.09200,000 Kenya Government International Bond USD 7.250% 28/02/2028 220,125 0.02
1,090,000 Kenya Government International Bond USD 8.000% 22/05/2032 1,246,347 0.12310,000 Kenya Government International Bond USD 8.250% 28/02/2048 348,653 0.03
2,763,425 0.26
Lebanon80,000 Lebanon Government International Bond USD 6.000% 27/01/2023 10,800 0.00220,000 Lebanon Government International Bond USD 6.650% 22/04/2024 29,700 0.00
1,340,000 Lebanon Government International Bond USD 6.200% 26/02/2025 180,900 0.02190,000 Lebanon Government International Bond USD 6.600% 27/11/2026 25,650 0.00270,000 Lebanon Government International Bond USD 6.850% 23/03/2027 36,450 0.00290,000 Lebanon Government International Bond USD 6.750% 29/11/2027 39,150 0.0140,000 Lebanon Government International Bond USD 7.000% 20/03/2028 5,500 0.0090,000 Lebanon Government International Bond USD 6.650% 03/11/2028 12,150 0.00
1,395,000 Lebanon Government International Bond USD 6.850% 25/05/2029 188,325 0.021,881,000 Lebanon Government International Bond USD 6.650% 26/02/2030 253,935 0.0320,000 Lebanon Government International Bond USD 7.150% 20/11/2031 2,650 0.0080,000 Lebanon Government International Bond USD 7.050% 02/11/2035 10,800 0.0020,000 Lebanon Government International Bond—Series 88 USD 8.200% 17/05/2033 2,750 0.0020,000 Lebanon Government International Bond—Series 89 USD 8.250% 17/05/2034 2,650 0.00
801,410 0.08
Lithuania10,000 Lithuania Government International Bond USD 6.125% 09/03/2021 10,177 0.00
Luxembourg1,010,000 Altice Financing S.A. USD 7.500% 15/05/2026 1,064,288 0.101,220,000 Altice Financing S.A. 144A(e) USD 7.500% 15/05/2026 1,285,575 0.12260,000 Gazprom Neft OAO Via GPN Capital S.A. USD 6.000% 27/11/2023 290,509 0.03
1,670,000 Gazprom PJSC Via Gaz Capital S.A. USD 7.288% 16/08/2037 2,422,805 0.23990,000 MHP Lux S.A. USD 6.950% 03/04/2026 1,050,173 0.10410,000 Millicom International Cellular S.A. USD 5.125% 15/01/2028 440,109 0.04250,000 Trafigura Funding S.A. USD 5.875% 23/09/2025 258,427 0.02393,000 Tupy Overseas S.A. USD 6.625% 17/07/2024 403,415 0.04
7,215,301 0.68
Macedonia1,640,000 North Macedonia Government International Bond EUR 5.625% 26/07/2023 2,197,800 0.211,334,000 North Macedonia Government International Bond EUR 2.750% 18/01/2025 1,687,711 0.16
3,885,511 0.37
Malaysia360,000 Axiata Spv5 Labuan Ltd. USD 3.064% 19/08/2050 362,419 0.03
Goldman Sachs Funds—Emerging Markets Debt Blend PortfolioSchedule of InvestmentsAs at 30 November 2020
The accompanying notes are an integral part of these financial statements.
196

Holdings Security Description Currency Interest Rate(a) Maturity Date(b)Market Value
USD
% ofShareholders’
Equity
Bonds – (Continued)Malaysia – (Continued)
900,000 Petronas Capital Ltd. USD 4.550% 21/04/2050 1,214,578 0.12870,000 Petronas Capital Ltd. USD 4.800% 21/04/2060 1,278,628 0.12
2,855,625 0.27
Mauritius1,260,000 Greenko Investment Co. USD 4.875% 16/08/2023 1,282,641 0.121,100,000 HTA Group Ltd. USD 7.000% 18/12/2025 1,184,906 0.112,120,000 MTN Mauritius Investments Ltd. USD 5.373% 13/02/2022 2,182,275 0.211,432,000 MTN Mauritius Investments Ltd. USD 6.500% 13/10/2026 1,627,110 0.151,070,000 Network i2i Ltd.(d) USD 5.650% Perp. 1,121,494 0.11520,000 UPL Corp., Ltd. USD 4.500% 08/03/2028 548,600 0.05400,000 UPL Corp., Ltd. USD 4.625% 16/06/2030 429,437 0.04260,000 UPL Corp., Ltd.(d) USD 5.250% Perp. 258,822 0.03
8,635,285 0.82
Mexico420,000 Banco Mercantil del Norte S.A.(d) USD 5.750% 04/10/2031 444,413 0.04
2,370,000 Banco Mercantil del Norte S.A.(d) USD 6.750% Perp. 2,503,312 0.241,050,000 Banco Mercantil del Norte S.A.(d) USD 7.500% Perp. 1,138,758 0.11590,000 Banco Santander Mexico S.A. Institucion de Banca Multiple Grupo
Financiero Santander USD 4.125% 09/11/2022 623,512 0.06990,000 Banco Santander Mexico S.A. Institucion de Banca Multiple Grupo
Financiero Santander(d) USD 5.950% 01/10/2028 1,074,923 0.101,327,000 Becle SAB de CV USD 3.750% 13/05/2025 1,434,611 0.14290,000 Fomento Economico Mexicano SAB de CV USD 3.500% 16/01/2050 318,773 0.03
2,180,000 Gruma SAB de CV USD 4.875% 01/12/2024 2,448,753 0.23142,605,900 Mexican Bonos—Series M MXN 7.750% 29/05/2031 8,172,627 0.77102,839,100 Mexican Bonos—Series M 20 MXN 8.500% 31/05/2029 6,133,723 0.5994,427,600 Mexican Bonos—Series M 30 MXN 10.000% 20/11/2036 6,394,821 0.61119,825,500 Mexican Bonos—Series M 30 MXN 8.500% 18/11/2038 7,126,342 0.68
590,000 Mexico City Airport Trust USD 3.875% 30/04/2028 568,981 0.05200,000 Mexico City Airport Trust USD 5.500% 31/10/2046 193,688 0.02
1,629,000 Mexico City Airport Trust USD 5.500% 31/07/2047 1,581,657 0.152,620,000 Mexico City Airport Trust 144A(e) USD 3.875% 30/04/2028 2,526,662 0.24790,000 Mexico City Airport Trust 144A(e) USD 5.500% 31/10/2046 765,066 0.07800,000 Mexico City Airport Trust 144A(e) USD 5.500% 31/07/2047 776,750 0.07700,000 Mexico Government International Bond USD 3.750% 11/01/2028 774,703 0.07440,000 Mexico Government International Bond USD 3.250% 16/04/2030 468,710 0.04
1,190,000 Mexico Government International Bond USD 2.659% 24/05/2031 1,194,165 0.11540,000 Mexico Government International Bond USD 4.750% 27/04/2032 638,550 0.06240,000 Mexico Government International Bond USD 4.750% 08/03/2044 277,080 0.03460,000 Mexico Government International Bond USD 4.350% 15/01/2047 509,666 0.05200,000 Mexico Government International Bond USD 4.600% 10/02/2048 227,600 0.02
1,370,000 Mexico Government International Bond USD 5.000% 27/04/2051 1,653,590 0.161,822,000 Mexico Government International Bond USD 3.771% 24/05/2061 1,817,445 0.17400,000 Petroleos Mexicanos EUR 5.125% 15/03/2023 493,990 0.05630,000 Petroleos Mexicanos EUR 3.750% 21/02/2024 752,056 0.07550,000 Petroleos Mexicanos USD 6.875% 16/10/2025 573,776 0.05910,000 Petroleos Mexicanos USD 6.490% 23/01/2027 912,639 0.09100,000 Petroleos Mexicanos USD 6.500% 13/03/2027 100,230 0.01208,000 Petroleos Mexicanos USD 5.950% 28/01/2031 193,430 0.0250,000 Petroleos Mexicanos USD 6.750% 21/09/2047 43,213 0.00281,000 Petroleos Mexicanos USD 6.350% 12/02/2048 235,900 0.02
1,319,000 Petroleos Mexicanos USD 7.690% 23/01/2050 1,223,570 0.12178,000 Petroleos Mexicanos USD 6.950% 28/01/2060 153,659 0.01239,000 Unifin Financiera SAB de CV USD 7.375% 12/02/2026 213,046 0.02
56,684,390 5.37
Mongolia520,000 Mongolia Government International Bond USD 5.625% 01/05/2023 549,656 0.05270,000 Mongolia Government International Bond USD 5.125% 07/04/2026 285,862 0.03542,078 Mongolian Mining Corp. USD 0.000% Perp. 189,897 0.02
1,025,415 0.10
Morocco1,050,000 Morocco Government International Bond EUR 1.500% 27/11/2031 1,213,476 0.12
Mozambique380,000 Mozambique International Bond(c) USD 5.000% 15/09/2031 334,222 0.03
Goldman Sachs Funds—Emerging Markets Debt Blend PortfolioSchedule of InvestmentsAs at 30 November 2020
The accompanying notes are an integral part of these financial statements.
197

Holdings Security Description Currency Interest Rate(a) Maturity Date(b)Market Value
USD
% ofShareholders’
Equity
Bonds – (Continued)Netherlands
690,000 Bharti Airtel International Netherlands BV USD 5.350% 20/05/2024 761,264 0.07390,000 First Bank of Nigeria Ltd. Via FBN Finance Co. BV USD 8.625% 27/10/2025 415,350 0.04400,000 Greenko Dutch BV USD 4.875% 24/07/2022 404,500 0.04730,000 IHS Netherlands Holdco BV USD 7.125% 18/03/2025 769,466 0.07580,000 IHS Netherlands Holdco BV USD 8.000% 18/09/2027 629,662 0.06
1,070,000 Lukoil International Finance BV USD 4.750% 02/11/2026 1,216,958 0.121,680,000 Lukoil Securities BV USD 3.875% 06/05/2030 1,816,500 0.17410,000 Metinvest BV USD 8.500% 23/04/2026 443,313 0.04
1,600,000 Minejesa Capital BV USD 4.625% 10/08/2030 1,714,000 0.161,740,000 Mong Duong Finance Holdings BV USD 5.125% 07/05/2029 1,840,050 0.172,223,319 MV24 Capital BV USD 6.748% 01/06/2034 2,371,656 0.23600,000 NE Property BV EUR 2.625% 22/05/2023 739,523 0.07780,000 NE Property BV EUR 1.750% 23/11/2024 945,590 0.09
1,640,000 NE Property BV EUR 1.875% 09/10/2026 1,922,076 0.18230,000 NE Property BV EUR 3.375% 14/07/2027 288,312 0.03
2,151,000 Petrobras Global Finance BV USD 5.093% 15/01/2030 2,362,873 0.22360,000 Petrobras Global Finance BV USD 6.850% 05/06/2115 421,740 0.04300,000 PPF Telecom Group BV EUR 2.125% 31/01/2025 366,562 0.04625,000 PPF Telecom Group BV EUR 3.250% 29/09/2027 799,075 0.08410,000 Prosus NV USD 5.500% 21/07/2025 473,422 0.05
2,990,000 Prosus NV USD 3.680% 21/01/2030 3,265,977 0.311,130,000 Prosus NV USD 4.027% 03/08/2050 1,206,275 0.11200,000 Royal Capital BV(d) USD 5.000% Perp. 203,625 0.02300,000 Syngenta Finance NV EUR 1.250% 10/09/2027 350,552 0.03
1,380,000 Teva Pharmaceutical Finance Netherlands III BV USD 2.800% 21/07/2023 1,362,750 0.131,380,000 Teva Pharmaceutical Finance Netherlands III BV USD 6.000% 15/04/2024 1,454,175 0.14610,000 VEON Holdings BV USD 3.375% 25/11/2027 623,058 0.06320,000 Vivo Energy Investments BV USD 5.125% 24/09/2027 342,750 0.03
29,511,054 2.80
Nigeria1,860,000 Nigeria Government International Bond USD 6.500% 28/11/2027 1,954,454 0.18912,000 Nigeria Government International Bond USD 8.747% 21/01/2031 1,034,550 0.10470,000 Nigeria Government International Bond USD 7.875% 16/02/2032 508,114 0.05
1,200,000 Nigeria Government International Bond USD 7.696% 23/02/2038 1,246,313 0.12201,000 Nigeria Government International Bond USD 7.625% 28/11/2047 205,742 0.02395,000 Nigeria Government International Bond USD 9.248% 21/01/2049 450,485 0.04200,000 SEPLAT Petroleum Development Co., Plc. USD 9.250% 01/04/2023 206,531 0.02200,000 United Bank for Africa Plc. USD 7.750% 08/06/2022 204,031 0.02
5,810,220 0.55
Norway1,200,000 DNO ASA 144A(e) USD 8.750% 31/05/2023 1,122,750 0.111,240,000 DNO ASA 144A(e) USD 8.375% 29/05/2024 1,147,000 0.11
2,269,750 0.22
Oman1,080,000 Oman Government International Bond USD 6.750% 28/10/2027 1,124,550 0.11410,000 Oman Government International Bond USD 5.625% 17/01/2028 402,313 0.04960,000 Oman Government International Bond USD 7.375% 28/10/2032 1,006,800 0.10370,000 Oman Government International Bond USD 6.500% 08/03/2047 339,706 0.03
1,960,000 Oman Government International Bond USD 6.750% 17/01/2048 1,819,431 0.17
4,692,800 0.45
Pakistan357,000 Third Pakistan International Sukuk Co., Ltd. USD 5.500% 13/10/2021 362,076 0.04740,000 Third Pakistan International Sukuk Co., Ltd. USD 5.625% 05/12/2022 757,113 0.07
1,119,189 0.11
Panama390,000 Aeropuerto Internacional de Tocumen S.A. USD 5.625% 18/05/2036 441,187 0.04620,000 Panama Government International Bond USD 4.500% 16/04/2050 786,916 0.07310,000 Panama Government International Bond USD 4.500% 01/04/2056 394,320 0.04420,000 Panama Government International Bond USD 3.870% 23/07/2060 490,678 0.05545,000 Panama Notas del Tesoro USD 3.750% 17/04/2026 592,517 0.06
2,705,618 0.26
Papua New Guinea520,000 Papua New Guinea Government International Bond USD 8.375% 04/10/2028 529,669 0.05
Goldman Sachs Funds—Emerging Markets Debt Blend PortfolioSchedule of InvestmentsAs at 30 November 2020
The accompanying notes are an integral part of these financial statements.
198

Holdings Security Description Currency Interest Rate(a) Maturity Date(b)Market Value
USD
% ofShareholders’
Equity
Bonds – (Continued)Paraguay
1,560,000 Paraguay Government International Bond USD 4.625% 25/01/2023 1,670,906 0.16200,000 Paraguay Government International Bond USD 5.000% 15/04/2026 231,688 0.02325,000 Paraguay Government International Bond USD 4.700% 27/03/2027 375,324 0.03
2,000,000 Paraguay Government International Bond USD 4.950% 28/04/2031 2,380,500 0.231,175,000 Paraguay Government International Bond USD 6.100% 11/08/2044 1,558,711 0.15800,000 Paraguay Government International Bond USD 5.400% 30/03/2050 1,000,625 0.09
7,217,754 0.68
Peru2,449,885 ABY Transmision Sur S.A. USD 6.875% 30/04/2043 3,292,798 0.3151,200,000 Banco de Credito del Peru PEN 4.650% 17/09/2024 15,138,134 1.436,830,000 Peru Government Bond PEN 6.150% 12/08/2032 2,239,377 0.2113,575,000 Peru Government Bond PEN 5.400% 12/08/2034 4,072,943 0.397,375,000 Peru Government Bond PEN 5.350% 12/08/2040 2,080,739 0.2010,761,000 Peruvian Government International Bond PEN 6.950% 12/08/2031 3,770,648 0.36
30,594,639 2.90
Philippines1,140,000 International Container Terminal Services, Inc. USD 4.750% 17/06/2030 1,226,925 0.1218,650,000 Philippine Government Bond—Series 1064 PHP 6.875% 10/01/2029 498,582 0.05170,000 Philippine Government International Bond EUR 0.875% 17/05/2027 207,237 0.02690,000 Philippine Government International Bond EUR 0.700% 03/02/2029 828,595 0.08
20,000,000 Philippine Government International Bond PHP 6.250% 14/01/2036 536,597 0.05430,000 San Miguel Corp.(d) USD 5.500% Perp. 431,881 0.04380,000 SMC Global Power Holdings Corp.(d) USD 6.500% Perp. 385,344 0.04
1,080,000 SMC Global Power Holdings Corp.(d) USD 7.000% Perp. 1,111,725 0.10
5,226,886 0.50
Poland51,550,000 Poland Government Bond—Series 425 PLN 0.750% 25/04/2025 14,025,343 1.3336,360,000 Poland Government Bond—Series 428 PLN 2.750% 25/04/2028 11,014,306 1.0420,190,000 Poland Government Bond—Series 727 PLN 2.500% 25/07/2027 6,007,172 0.57
31,046,821 2.94
Qatar2,580,000 Qatar Government International Bond USD 5.103% 23/04/2048 3,700,284 0.35770,000 Qatar Government International Bond USD 4.400% 16/04/2050 1,019,769 0.10
4,720,053 0.45
Romania8,150,000 Romania Government Bond—Series 15Y RON 3.650% 24/09/2031 2,033,376 0.1920,150,000 Romania Government Bond—Series 5Y RON 3.650% 28/07/2025 5,151,371 0.496,720,000 Romania Government Bond—Series 8Y RON 4.150% 26/01/2028 1,767,758 0.17460,000 Romanian Government International Bond EUR 2.375% 19/04/2027 599,902 0.06430,000 Romanian Government International Bond EUR 2.875% 11/03/2029 576,575 0.06720,000 Romanian Government International Bond EUR 2.500% 08/02/2030 935,334 0.09
1,270,000 Romanian Government International Bond EUR 3.624% 26/05/2030 1,803,358 0.17330,000 Romanian Government International Bond USD 3.000% 14/02/2031 353,874 0.0390,000 Romanian Government International Bond EUR 2.124% 16/07/2031 113,577 0.01440,000 Romanian Government International Bond EUR 2.000% 28/01/2032 549,843 0.05150,000 Romanian Government International Bond EUR 4.125% 11/03/2039 220,586 0.02170,000 Romanian Government International Bond EUR 2.625% 02/12/2040 205,963 0.0210,000 Romanian Government International Bond EUR 4.625% 03/04/2049 15,739 0.00250,000 Romanian Government International Bond EUR 3.375% 28/01/2050 333,297 0.03
1,860,000 Romanian Government International Bond USD 4.000% 14/02/2051 2,038,734 0.19
16,699,287 1.58
Russia454,855,000 Russian Federal Bond - OFZ Bonds—Series 6221 RUB 7.700% 23/03/2033 6,807,882 0.64658,560,000 Russian Federal Bond - OFZ Bonds—Series 6223 RUB 6.500% 28/02/2024 9,082,244 0.865,170,000 Russian Federal Bond - OFZ Bonds—Series 6224 RUB 6.900% 23/05/2029 73,609 0.01
940,925,000 Russian Federal Bond - OFZ Bonds—Series 6226 RUB 7.950% 07/10/2026 14,025,841 1.33892,940,000 Russian Federal Bond - OFZ Bonds—Series 6228 RUB 7.650% 10/04/2030 13,333,319 1.26137,580,000 Russian Federal Bond - OFZ Bonds—Series 6230 RUB 7.700% 16/03/2039 2,094,958 0.20535,575,000 Russian Federal Bond - OFZ Bonds—Series 6235 RUB 5.900% 12/03/2031 7,034,260 0.67
800,000 Russian Foreign Bond - Eurobond USD 4.375% 21/03/2029 928,400 0.09
53,380,513 5.06
Goldman Sachs Funds—Emerging Markets Debt Blend PortfolioSchedule of InvestmentsAs at 30 November 2020
The accompanying notes are an integral part of these financial statements.
199

Holdings Security Description Currency Interest Rate(a) Maturity Date(b)Market Value
USD
% ofShareholders’
Equity
Bonds – (Continued)Saudi Arabia
240,000 Saudi Government International Bond USD 4.500% 26/10/2046 294,450 0.03320,000 Saudi Government International Bond USD 4.625% 04/10/2047 401,800 0.04210,000 Saudi Government International Bond USD 5.250% 16/01/2050 288,914 0.03560,000 Saudi Government International Bond USD 3.750% 21/01/2055 624,400 0.06
4,590,000 Saudi Government International Bond USD 4.500% 22/04/2060 5,852,250 0.55
7,461,814 0.71
Senegal1,160,000 Senegal Government International Bond EUR 4.750% 13/03/2028 1,467,792 0.14200,000 Senegal Government International Bond USD 6.750% 13/03/2048 217,219 0.02
1,685,011 0.16
Serbia560,000 Serbia International Bond EUR 3.125% 15/05/2027 753,197 0.07890,000 Serbia International Bond EUR 1.500% 26/06/2029 1,082,279 0.10
1,835,476 0.17
Singapore710,000 AEV International Pte Ltd. USD 4.200% 16/01/2030 725,753 0.07264,659 Eterna Capital Pte Ltd.—Series B USD 8.000% 11/12/2022 72,781 0.01270,000 Indika Energy Capital IV Pte Ltd. USD 8.250% 22/10/2025 292,612 0.03
1,178,090 Innovate Capital Pte Ltd.—Series MCB(d) USD 6.000% 11/12/2024 147,568 0.01200,000 Jollibee Worldwide Pte Ltd.(d) USD 3.900% Perp. 190,281 0.02
2,253,600 LLPL Capital Pte Ltd. USD 6.875% 04/02/2039 2,639,529 0.25830,000 Parkway Pantai Ltd.(d) USD 4.250% Perp. 841,672 0.08710,000 Theta Capital Pte Ltd. USD 8.125% 22/01/2025 703,011 0.06350,000 TML Holdings Pte Ltd. USD 5.500% 03/06/2024 356,344 0.03400,000 Trafigura Group Pte Ltd.(d) USD 6.875% Perp. 392,875 0.04
6,362,426 0.60
South Africa1,960,000 Growthpoint Properties International Pty Ltd. USD 5.872% 02/05/2023 2,067,187 0.20
123,872,200 South Africa Government Bond—Series 2030 ZAR 8.000% 31/01/2030 7,580,935 0.72268,158,000 South Africa Government Bond—Series 2032 ZAR 8.250% 31/03/2032 15,451,046 1.4691,685,000 South Africa Government Bond—Series 2035 ZAR 8.875% 28/02/2035 5,183,419 0.49120,250,000 South Africa Government Bond—Series 2037 ZAR 8.500% 31/01/2037 6,398,896 0.6151,790,000 South Africa Government Bond—Series 2044 ZAR 8.750% 31/01/2044 2,698,379 0.2522,900,000 South Africa Government Bond—Series 2048 ZAR 8.750% 28/02/2048 1,194,271 0.11163,710,000 South Africa Government Bond—Series R186 ZAR 10.500% 21/12/2026 12,431,866 1.1835,090,000 South Africa Government Bond—Series R213 ZAR 7.000% 28/02/2031 1,920,454 0.181,360,000 South Africa Government International Bond USD 4.875% 14/04/2026 1,448,187 0.141,440,000 South Africa Government International Bond USD 4.850% 30/09/2029 1,483,650 0.14430,000 South Africa Government International Bond USD 5.650% 27/09/2047 414,211 0.04410,000 South Africa Government International Bond USD 5.750% 30/09/2049 396,547 0.04
58,669,048 5.56
Spain1,157,313 International Airport Finance S.A. USD 12.000% 15/03/2033 1,137,060 0.11
Sri Lanka400,000 Sri Lanka Government International Bond USD 6.350% 28/06/2024 259,125 0.03500,000 Sri Lanka Government International Bond USD 6.125% 03/06/2025 318,125 0.03
1,160,000 Sri Lanka Government International Bond USD 6.850% 03/11/2025 727,900 0.07670,000 Sri Lanka Government International Bond USD 6.200% 11/05/2027 400,220 0.04780,000 Sri Lanka Government International Bond USD 6.750% 18/04/2028 465,685 0.04
1,070,000 Sri Lanka Government International Bond USD 7.850% 14/03/2029 640,161 0.06
2,811,216 0.27
Supranationals5,030,000 Black Sea Trade & Development Bank USD 3.500% 25/06/2024 5,292,264 0.501,040,000 Eastern & Southern African Trade & Development Bank USD 5.375% 14/03/2022 1,064,149 0.106,770,000 Eastern & Southern African Trade & Development Bank USD 4.875% 23/05/2024 7,072,416 0.67500,000 Mongolian Mining Corp. Via Energy Resources LLC USD 9.250% 15/04/2024 445,000 0.04
1,090,000 Promigas S.A. ESP Via Gases del Pacifico SAC USD 3.750% 16/10/2029 1,147,225 0.11
15,021,054 1.42
Tajikistan220,000 Republic of Tajikistan International Bond USD 7.125% 14/09/2027 179,163 0.02
Goldman Sachs Funds—Emerging Markets Debt Blend PortfolioSchedule of InvestmentsAs at 30 November 2020
The accompanying notes are an integral part of these financial statements.
200

Holdings Security Description Currency Interest Rate(a) Maturity Date(b)Market Value
USD
% ofShareholders’
Equity
Bonds – (Continued)Thailand
2,180,000 Kasikornbank PCL(d) USD 3.343% 02/10/2031 2,203,844 0.211,570,000 PTT Treasury Center Co., Ltd. USD 3.700% 16/07/2070 1,640,895 0.16510,000 PTTEP Treasury Center Co., Ltd. USD 2.587% 10/06/2027 532,711 0.05
1,550,000 PTTEP Treasury Center Co., Ltd. USD 2.993% 15/01/2030 1,647,602 0.167,320,000 Thailand Government Bond THB 3.850% 12/12/2025 278,153 0.03
202,406,083 Thailand Government Bond THB 1.250% 12/03/2028 6,504,210 0.62207,740,000 Thailand Government Bond THB 2.875% 17/12/2028 7,729,549 0.73275,300,000 Thailand Government Bond THB 1.600% 17/12/2029 9,328,870 0.88206,740,000 Thailand Government Bond THB 3.775% 25/06/2032 8,470,731 0.801,110,000 Thailand Government Bond THB 1.600% 17/06/2035 36,622 0.0029,650,000 Thailand Government Bond THB 3.400% 17/06/2036 1,207,614 0.1189,760,000 Thailand Government Bond THB 3.300% 17/06/2038 3,636,583 0.346,180,000 Thailand Government Bond THB 3.600% 17/06/2067 268,328 0.03
43,485,712 4.12
Trinidad And Tobago300,000 Trinidad & Tobago Government International Bond USD 4.500% 26/06/2030 312,563 0.03
Tunisia310,000 Banque Centrale de Tunisie International Bond EUR 6.375% 15/07/2026 337,347 0.03
Turkey2,290,000 Akbank TAS USD 5.125% 31/03/2025 2,266,742 0.21890,000 Akbank TAS(d) USD 6.797% 27/04/2028 857,598 0.08
3,900,000 Anadolu Efes Biracilik ve Malt Sanayii AS USD 3.375% 01/11/2022 3,963,375 0.38810,000 Coca-Cola Icecek AS USD 4.215% 19/09/2024 846,577 0.08
2,250,000 Coca-Cola Icecek AS USD 4.215% 19/09/2024 2,351,602 0.222,069,000 Global Liman Isletmeleri AS USD 8.125% 14/11/2021 1,520,715 0.142,030,000 Mersin Uluslararasi Liman Isletmeciligi AS USD 5.375% 15/11/2024 2,135,623 0.20200,000 TC Ziraat Bankasi AS USD 5.125% 03/05/2022 199,469 0.02
51,275,000 Turkey Government Bond TRY 12.200% 18/01/2023 6,458,577 0.6115,140,000 Turkey Government Bond TRY 8.800% 27/09/2023 1,755,938 0.176,320,000 Turkey Government Bond TRY 10.600% 11/02/2026 773,019 0.0723,740,000 Turkey Government Bond TRY 11.000% 24/02/2027 2,912,827 0.28670,000 Turkey Government International Bond EUR 5.200% 16/02/2026 844,135 0.08220,000 Turkey Government International Bond USD 4.250% 14/04/2026 211,784 0.02
2,700,000 Turkey Government International Bond USD 4.875% 09/10/2026 2,643,891 0.25660,000 Turkey Government International Bond USD 6.000% 25/03/2027 679,800 0.06200,000 Turkey Government International Bond USD 6.125% 24/10/2028 205,375 0.02210,000 Turkey Government International Bond USD 7.625% 26/04/2029 233,822 0.02310,000 Turkey Government International Bond USD 5.250% 13/03/2030 300,991 0.0320,000 Turkey Government International Bond USD 6.875% 17/03/2036 20,828 0.00290,000 Turkey Government International Bond USD 6.750% 30/05/2040 296,208 0.03680,000 Turkey Government International Bond USD 6.000% 14/01/2041 640,050 0.06390,000 Turkey Government International Bond USD 6.625% 17/02/2045 389,512 0.04200,000 Turkey Government International Bond USD 5.750% 11/05/2047 181,031 0.02470,000 Turkiye Vakiflar Bankasi TAO USD 8.125% 28/03/2024 498,494 0.05
2,280,000 Turkiye Vakiflar Bankasi TAO USD 5.250% 05/02/2025 2,207,325 0.211,880,000 Yapi ve Kredi Bankasi AS USD 6.100% 16/03/2023 1,911,431 0.18200,000 Yapi ve Kredi Bankasi AS USD 5.850% 21/06/2024 201,500 0.02
1,640,000 Yapi ve Kredi Bankasi AS USD 8.250% 15/10/2024 1,771,200 0.17
39,279,439 3.72
Ukraine670,000 Ukraine Government International Bond USD 7.750% 01/09/2023 729,797 0.07
1,580,000 Ukraine Government International Bond USD 8.994% 01/02/2024 1,769,600 0.162,180,000 Ukraine Government International Bond USD 7.750% 01/09/2024 2,388,803 0.23170,000 Ukraine Government International Bond USD 7.750% 01/09/2025 187,468 0.02670,000 Ukraine Government International Bond USD 7.750% 01/09/2026 742,130 0.07700,000 Ukraine Government International Bond USD 7.253% 15/03/2033 746,047 0.07687,000 Ukraine Government International Bond—Series GDP(d) USD 1.000% 31/05/2040 682,599 0.07
7,246,444 0.69
United Arab Emirates1,650,000 Abu Dhabi Crude Oil Pipeline LLC USD 4.600% 02/11/2047 2,049,867 0.20970,000 Abu Dhabi Government International Bond USD 3.875% 16/04/2050 1,206,134 0.11550,000 Emirate of Dubai Government International Bonds USD 3.900% 09/09/2050 540,375 0.05
2,020,000 National Central Cooling Co. PJSC USD 2.500% 21/10/2027 2,031,363 0.194,060,000 NBK Tier 1 Financing 2 Ltd.(d) USD 4.500% Perp. 4,079,031 0.39
9,906,770 0.94
Goldman Sachs Funds—Emerging Markets Debt Blend PortfolioSchedule of InvestmentsAs at 30 November 2020
The accompanying notes are an integral part of these financial statements.
201

Holdings Security Description Currency Interest Rate(a) Maturity Date(b)Market Value
USD
% ofShareholders’
Equity
Bonds – (Continued)United Kingdom
2,350,000 Gazprom PJSC Via Gaz Finance Plc.(d) USD 4.599% Perp. 2,466,031 0.23710,000 Vedanta Resources Finance II Plc. USD 8.000% 23/04/2023 486,350 0.05200,000 Vedanta Resources Finance II Plc. USD 9.250% 23/04/2026 132,250 0.01520,000 Vedanta Resources Ltd. USD 7.125% 31/05/2023 349,960 0.03290,000 Vedanta Resources Ltd. USD 6.125% 09/08/2024 185,600 0.02
3,620,191 0.34
United States143,381 Brazil Loan Trust 1 USD 5.477% 24/07/2023 149,116 0.01
2,040,000 Kosmos Energy Ltd. USD 7.125% 04/04/2026 1,846,200 0.18440,000 Kosmos Energy Ltd. 144A(e) USD 7.125% 04/04/2026 398,200 0.04
4,415,000 Sasol Financing USA LLC USD 5.875% 27/03/2024 4,571,595 0.43
6,965,111 0.66
Uruguay12,775,000 Uruguay Government International Bond UYU 8.500% 15/03/2028 315,311 0.038,384,227 Uruguay Government International Bond UYU 4.375% 15/12/2028 224,332 0.0225,000 Uruguay Government International Bond USD 4.375% 23/01/2031 30,367 0.00
8,161,373 Uruguay Government International Bond UYU 3.875% 02/07/2040 222,557 0.02895,000 Uruguay Government International Bond USD 4.975% 20/04/2055 1,223,772 0.12
2,016,339 0.19
Uzbekistan520,000 Republic of Uzbekistan Bond USD 4.750% 20/02/2024 557,700 0.05200,000 Republic of Uzbekistan Bond USD 3.700% 25/11/2030 203,500 0.02
761,200 0.07
Vietnam1,730,000 Viet Nam Debt & Asset Trading Corp. USD 1.000% 10/10/2025 1,464,283 0.14
Zambia1,350,000 Zambia Government International Bond USD 5.375% 20/09/2022 643,359 0.061,141,000 Zambia Government International Bond USD 8.970% 30/07/2027 549,641 0.05
1,193,000 0.11
TOTAL BONDS(cost USD 813,951,221) 834,627,682 79.13
Holdings Security DescriptionMarket Value
USD
% ofShareholders’
Equity
Mutual Funds – 1.10%Ireland
11,652,846 Goldman Sachs US$ Treasury Liquid Reserves Fund (X Distribution Class)(f)(g) 11,652,846 1.10
TOTAL MUTUAL FUNDS(cost USD 11,652,846) 11,652,846 1.10
TOTAL TRANSFERABLE SECURITIES ADMITTED TO AN OFFICIAL EXCHANGE LISTING(cost USD 825,604,067) 846,280,528 80.23
Holdings Security Description Currency Interest Rate(a) Maturity Date(b)Market Value
USD
% ofShareholders’
Equity
Transferable securities dealt in another regulated market
Bonds – 12.49%Argentina
1,063,000 Tecpetrol S.A. USD 4.875% 12/12/2022 1,039,581 0.10490,000 Telecom Argentina S.A. USD 8.500% 06/08/2025 451,948 0.04490,000 Telecom Argentina S.A. USD 8.000% 18/07/2026 444,675 0.04330,000 YPF S.A. USD 7.000% 15/12/2047 209,911 0.02
2,146,115 0.20
Bermuda890,000 Credicorp Ltd. USD 2.750% 17/06/2025 922,485 0.09409,608 Digicel Group 0.5 Ltd. USD 10.000% 01/04/2024 328,711 0.03153,021 Digicel Group 0.5 Ltd. 144A(e) USD 8.000% 01/04/2025 57,000 0.01590,000 Geopark Ltd. USD 5.500% 17/01/2027 576,356 0.05
2,630,000 Tengizchevroil Finance Co. International Ltd. USD 2.625% 15/08/2025 2,718,105 0.26
Goldman Sachs Funds—Emerging Markets Debt Blend PortfolioSchedule of InvestmentsAs at 30 November 2020
The accompanying notes are an integral part of these financial statements.
202

Holdings Security Description Currency Interest Rate(a) Maturity Date(b)Market Value
USD
% ofShareholders’
Equity
Bonds – (Continued)Bermuda – (Continued)
200,000 Tengizchevroil Finance Co. International Ltd. USD 4.000% 15/08/2026 219,750 0.021,350,000 Tengizchevroil Finance Co. International Ltd. USD 3.250% 15/08/2030 1,410,750 0.13
6,233,157 0.59
Brazil2,710,000 Banco do Brasil S.A.(d) USD 9.000% Perp. 3,002,172 0.281,560,000 BRF S.A. USD 4.875% 24/01/2030 1,662,375 0.161,720,000 Itau Unibanco Holding S.A.(d) USD 4.625% Perp. 1,610,350 0.15630,000 Samarco Mineracao S.A. USD 5.375% 26/09/2024 382,823 0.04
6,657,720 0.63
Canada1,270,000 First Quantum Minerals Ltd. 144A(e) USD 7.250% 01/04/2023 1,298,575 0.12
Cayman Islands82,000 Embraer Overseas Ltd. USD 5.696% 16/09/2023 87,394 0.01
1,410,000 Energuate Trust USD 5.875% 03/05/2027 1,473,670 0.141,220,000 Grupo Aval Ltd. USD 4.750% 26/09/2022 1,275,205 0.12140,000 iQIYI, Inc. USD 2.000% 01/04/2025 132,650 0.01400,000 Lima Metro Line 2 Finance Ltd. USD 4.350% 05/04/2036 440,000 0.04
3,408,919 0.32
Chile2,388,000 Embotelladora Andina S.A. USD 5.000% 01/10/2023 2,644,710 0.252,439,000 Sociedad Quimica y Minera de Chile S.A. USD 4.375% 28/01/2025 2,688,997 0.26420,000 Sociedad Quimica y Minera de Chile S.A. USD 4.250% 22/01/2050 471,516 0.04
5,805,223 0.55
Colombia1,050,000 Empresas Publicas de Medellin ESP USD 4.250% 18/07/2029 1,119,399 0.101,860,000 Transportadora de Gas Internacional S.A. ESP USD 5.550% 01/11/2028 2,196,834 0.21
3,316,233 0.31
Indonesia129,700,000,000 Indonesia Treasury Bond—Deutsche Bank AG 144A(e) IDR 7.500% 19/08/2032 9,805,577 0.93156,751,000,000 Indonesia Treasury Bond—JPMorgan Chase Bank NA 144A(e) IDR 8.375% 15/03/2024 12,272,538 1.1653,386,000,000 Indonesia Treasury Bond—JPMorgan Chase Bank NA 144A(e) IDR 8.375% 17/09/2026 4,298,858 0.4150,809,000,000 Indonesia Treasury Bond—JPMorgan Chase Bank NA 144A(e) IDR 9.000% 19/03/2029 4,229,885 0.4091,729,000,000 Indonesia Treasury Bond—JPMorgan Chase Bank NA 144A(e) IDR 6.500% 15/02/2031 6,691,280 0.64191,127,000,000 Indonesia Treasury Bond—JPMorgan Chase Bank NA 144A(d)(e) IDR 7.500% 17/06/2035 14,584,939 1.3846,233,000,000 Indonesia Treasury Bond—Standard Chartered Bank 144A(e) IDR 8.375% 17/09/2026 3,722,870 0.3514,515,000,000 Indonesia Treasury Bond—Standard Chartered Bank 144A(e) IDR 9.000% 20/03/2029 1,208,384 0.1221,980,000,000 Indonesia Treasury Bond—Standard Chartered Bank 144A(e) IDR 8.750% 19/05/2031 1,832,964 0.173,960,000,000 Indonesia Treasury Bond—Standard Chartered Bank 144A(e) IDR 7.500% 19/08/2032 299,384 0.03
58,946,679 5.59
Israel310,000 ICL Group Ltd. 144A(e) USD 6.375% 31/05/2038 408,425 0.04
Luxembourg110,000 Gazprom PJSC Via Gaz Capital S.A. USD 8.625% 28/04/2034 169,383 0.02440,000 JSM Global SARL USD 4.750% 20/10/2030 462,000 0.04200,000 Millicom International Cellular S.A. USD 4.500% 27/04/2031 216,622 0.02
1,470,000 Rede D’or Finance SARL USD 4.500% 22/01/2030 1,521,450 0.14
2,369,455 0.22
Mexico845,000 Alpha Holding S.A. de CV USD 9.000% 10/02/2025 641,804 0.06
2,160,000 Banco Santander Mexico S.A. Institucion de Banca Multiple GrupoFinanciero Santander USD 5.375% 17/04/2025 2,447,086 0.23
2,390,000 BBVA Bancomer S.A.(d) USD 5.125% 18/01/2033 2,503,525 0.241,080,000 BBVA Bancomer S.A.(d) USD 5.875% 13/09/2034 1,185,637 0.11220,000 Cemex SAB de CV USD 7.375% 05/06/2027 247,744 0.02920,000 Cemex SAB de CV USD 5.450% 19/11/2029 1,007,975 0.10
1,210,000 Cemex SAB de CV USD 5.200% 17/09/2030 1,317,037 0.13200,000 Grupo Bimbo SAB de CV USD 4.000% 06/09/2049 219,281 0.02870,000 Grupo Cementos de Chihuahua SAB de CV USD 5.250% 23/06/2024 903,169 0.09520,000 Industrias Penoles SAB de CV USD 4.750% 06/08/2050 574,600 0.05163,000 Kimberly-Clark de Mexico SAB de CV 144A(e) USD 3.250% 12/03/2025 175,633 0.02200,000 Minera Mexico S.A. de CV USD 4.500% 26/01/2050 225,656 0.02
Goldman Sachs Funds—Emerging Markets Debt Blend PortfolioSchedule of InvestmentsAs at 30 November 2020
The accompanying notes are an integral part of these financial statements.
203

Holdings Security Description Currency Interest Rate(a) Maturity Date(b)Market Value
USD
% ofShareholders’
Equity
Bonds – (Continued)Mexico – (Continued)
200,000 Minera Mexico S.A. de CV 144A(e) USD 4.500% 26/01/2050 225,656 0.02180,000 Petroleos Mexicanos USD 6.875% 04/08/2026 185,850 0.02
1,140,000 Petroleos Mexicanos USD 5.350% 12/02/2028 1,065,273 0.10150,000 Petroleos Mexicanos USD 5.625% 23/01/2046 118,678 0.01
13,044,604 1.24
Netherlands1,483,000 Metinvest BV USD 7.750% 23/04/2023 1,574,992 0.152,300,000 Syngenta Finance NV USD 5.182% 24/04/2028 2,467,486 0.23360,000 Syngenta Finance NV USD 5.676% 24/04/2048 370,368 0.04390,000 Teva Pharmaceutical Finance Netherlands III BV USD 7.125% 31/01/2025 430,504 0.04
4,843,350 0.46
Panama2,580,000 AES Panama Generation Holdings SRL USD 4.375% 31/05/2030 2,792,447 0.271,060,000 Banco Latinoamericano de Comercio Exterior S.A. USD 2.375% 14/09/2025 1,088,005 0.10730,000 Banco Nacional de Panama USD 2.500% 11/08/2030 729,088 0.07
2,620,000 Cable Onda S.A. USD 4.500% 30/01/2030 2,865,625 0.27
7,475,165 0.71
Paraguay2,660,000 Telefonica Celular del Paraguay S.A. USD 5.875% 15/04/2027 2,851,187 0.27
Peru2,490,000 Consorcio Transmantaro S.A. USD 4.700% 16/04/2034 2,963,878 0.28905,000 Corp Lindley S.A. USD 6.750% 23/11/2021 938,655 0.09
1,682,000 Corp Lindley S.A. USD 4.625% 12/04/2023 1,756,639 0.171,470,000 Hunt Oil Co. of Peru LLC Sucursal Del Peru USD 6.375% 01/06/2028 1,552,228 0.151,850,000 Inretail Pharma S.A. USD 5.375% 02/05/2023 1,926,890 0.18
9,138,290 0.87
Supranationals475,373 Digicel International Finance Ltd. Via Digicel Holdings Bermuda Ltd. 144A(e) USD 13.000% 31/12/2025 456,952 0.04360,773 Digicel International Finance Ltd. Via Digicel Holdings Bermuda Ltd. 144A(e) USD 8.000% 31/12/2026 285,011 0.03
741,963 0.07
Turkey2,220,000 Yapi ve Kredi Bankasi AS(d) USD 13.875% Perp. 2,486,400 0.24
Venezuela10,880,000 Petroleos de Venezuela S.A. USD 6.000% 28/10/2022 348,160 0.032,570,000 Petroleos de Venezuela S.A. USD 6.000% 16/05/2024 95,090 0.013,960,000 Petroleos de Venezuela S.A. USD 6.000% 15/11/2026 148,500 0.0280,000 Venezuela Government International Bond USD 8.250% 13/10/2024 7,600 0.00
599,350 0.06
TOTAL BONDS(cost USD 136,004,566) 131,770,810 12.49
Holdings Security DescriptionMarket Value
USD
% ofShareholders’
Equity
Common Stocks – 0.00%Mongolia
187,560 Mongolian Mining Corp. 11,872 0.00
TOTAL COMMON STOCKS(cost USD 44,753) 11,872 0.00
TOTAL TRANSFERABLE SECURITIES DEALT IN ANOTHER REGULATED MARKET(cost USD 136,049,319) 131,782,682 12.49
Holdings Security Description Currency Interest Rate(a) Maturity Date(b)Market Value
USD
% ofShareholders’
Equity
Other Transferable Securities
Bonds – 2.88%Dominican Republic
4,180,000 Dominican Republic Central Bank Notes DOP 11.000% 15/09/2023 78,115 0.01
Goldman Sachs Funds—Emerging Markets Debt Blend PortfolioSchedule of InvestmentsAs at 30 November 2020
The accompanying notes are an integral part of these financial statements.
204

Holdings Security Description Currency Interest Rate(a) Maturity Date(b)Market Value
USD
% ofShareholders’
Equity
Bonds – (Continued)Peru
22,397,000 Peruvian Government International Bond PEN 8.200% 12/08/2026 8,370,621 0.7911,183,000 Peruvian Government International Bond PEN 6.350% 12/08/2028 3,854,432 0.377,195,000 Peruvian Government International Bond PEN 6.850% 12/02/2042 2,422,792 0.23710,000 Peruvian Government International Bond PEN 6.714% 12/02/2055 241,100 0.02
14,888,945 1.41
United Kingdom81,775,000 HSBC Bank Plc. 144A(e) EGP 0.000% 07/01/2021 5,147,264 0.49
United States60,375,000 JPMorgan Chase Bank NA 144A(e) EGP 0.000% 08/07/2021 3,568,032 0.34115,350,000 JPMorgan Chase Bank NA 144A(e) EGP 0.000% 02/09/2021 6,691,301 0.63
10,259,333 0.97
TOTAL BONDS(cost USD 29,817,495) 30,373,657 2.88
TOTAL OTHER TRANSFERABLE SECURITIES(cost USD 29,817,495) 30,373,657 2.88
MARKET VALUE OF INVESTMENTS EXCLUDING DERIVATIVES(cost USD 991,470,881) 1,008,436,867 95.60
Futures Contracts – 0.01%
Number ofContracts Security Description
CommitmentMarket Value
USD
UnrealisedGainUSD
% ofShareholders’
Equity
USD199 US Treasury Long Bond Futures 22/03/2021 Long 34,769,031 15,535 0.00481 US Treasury Notes 10YR Futures 22/03/2021 Long 66,430,610 102,482 0.01443 US Treasury Notes 5YR Futures 31/03/2021 Long 55,814,539 45,758 0.00
157,014,180 163,775 0.01
UNREALISED GAIN ON FUTURES CONTRACTS 163,775 0.01
Number ofContracts Security Description
CommitmentMarket Value
USD
UnrealisedLossUSD
% ofShareholders’
Equity
USD(4) US Treasury Notes 2YR Futures 31/03/2021 Short (883,313) (186) (0.00)35 US Treasury Ultra Long Bond Futures 22/03/2021 Long 7,547,969 (5,311) (0.00)(76) US Treasury Ultra Long Notes 10YR Futures 22/03/2021 Short (11,932,000) (14,187) (0.00)
(5,267,344) (19,684) (0.00)
UNREALISED LOSS ON FUTURES CONTRACTS (19,684) (0.00)
Non-Deliverable Bond Forward Contracts – 0.02%
Number ofContracts Security Description
CommitmentMarket Value
USD
UnrealisedGainUSD
% ofShareholders’
Equity
COP13,218,500,000 BFS Finance COP Bond Forward 09/12/2020 Long 11,252 11,252 0.0037,274,900,000 BFS Finance COP Bond Forward 06/01/2021 Long 141,686 141,686 0.0110,076,400,000 BFS Finance COP Bond Forward 06/01/2021 Long 63,569 63,569 0.01
216,507 216,507 0.02
UNREALISED GAIN ON NON-DELIVERABLE BOND FORWARD CONTRACTS 216,507 0.02
Forward Currency Contracts – 0.56%
CurrencyAmountBought Currency
AmountSold
MaturityDate
UnrealisedGainUSD
% ofShareholders’
Equity
AUD 33,850,353 USD 24,872,170 01/12/2020 104,312 0.00EUR 61,602,527 USD 73,003,581 01/12/2020 891,729 0.04NOK 23,626,694 USD 2,607,200 01/12/2020 77,148 0.01BRL 209,958,773 USD 36,714,900 02/12/2020 2,844,729 0.27IDR 43,411,994,618 USD 2,952,585 04/12/2020 119,091 0.02IDR 79,185,439,077 USD 5,511,111 07/12/2020 84,045 0.01
Goldman Sachs Funds—Emerging Markets Debt Blend PortfolioSchedule of InvestmentsAs at 30 November 2020
The accompanying notes are an integral part of these financial statements.
205

Forward Currency Contracts – (Continued)
CurrencyAmountBought Currency
AmountSold
MaturityDate
UnrealisedGainUSD
% ofShareholders’
Equity
EUR 22,113,000 USD 26,421,364 10/12/2020 109,479 0.01USD 4,009,475 CLP 3,056,392,969 14/12/2020 15,670 0.00AUD 11,295,490 EUR 6,847,802 16/12/2020 117,873 0.00AUD 35,984,402 USD 25,992,039 16/12/2020 562,982 0.06CAD 2,099,740 CHF 1,444,516 16/12/2020 24,718 0.00CAD 2,129,563 JPY 170,543,956 16/12/2020 10,437 0.00CAD 57,368,616 USD 43,568,132 16/12/2020 793,161 0.04CHF 9,904,114 USD 10,864,168 16/12/2020 98,753 0.00CNH 725,859,646 USD 107,057,071 16/12/2020 3,280,002 0.34COP 4,845,963,008 USD 1,291,216 16/12/2020 60,407 0.01CZK 35,951,061 EUR 1,330,038 16/12/2020 48,276 0.01CZK 88,511,433 USD 3,941,174 16/12/2020 107,321 0.02EUR 1,306,357 CHF 1,403,202 16/12/2020 14,487 0.00EUR 5,413,716 SGD 8,656,945 16/12/2020 24,027 0.00EUR 31,261,901 USD 36,800,735 16/12/2020 715,255 0.05GBP 10,683,335 EUR 11,692,150 16/12/2020 258,300 0.01GBP 19,065,051 USD 24,730,699 16/12/2020 769,807 0.11HUF 3,727,372,896 USD 12,224,455 16/12/2020 223,099 0.02IDR 42,372,275,354 USD 2,984,001 16/12/2020 5,866 0.00ILS 37,966,241 USD 11,086,298 16/12/2020 393,381 0.07JPY 4,728,003,758 USD 45,044,643 16/12/2020 318,229 0.02MXN 871,116,043 USD 40,695,639 16/12/2020 2,627,254 0.26NOK 132,690,462 EUR 12,180,142 16/12/2020 459,861 0.07NOK 44,553,409 SEK 42,486,063 16/12/2020 52,528 0.00NOK 127,406,415 USD 14,107,809 16/12/2020 368,499 0.03NZD 2,371,157 AUD 2,253,384 16/12/2020 7,735 0.00NZD 2,346,386 EUR 1,322,653 16/12/2020 65,932 0.01NZD 31,271,811 USD 20,961,238 16/12/2020 1,071,870 0.08PLN 17,777,009 EUR 3,970,568 16/12/2020 1,816 0.00PLN 90,389,447 USD 23,979,902 16/12/2020 257,060 0.02RON 57,109,507 USD 13,873,317 16/12/2020 180,765 0.02SEK 125,274,246 EUR 12,094,520 16/12/2020 257,694 0.00SEK 68,749,193 USD 7,821,591 16/12/2020 285,007 0.03SGD 34,575,489 USD 25,536,550 16/12/2020 315,265 0.02THB 993,544,112 USD 31,920,454 16/12/2020 920,536 0.12TRY 48,482,230 USD 5,802,573 16/12/2020 368,977 0.04USD 2,955,469 IDR 41,869,042,608 16/12/2020 1,112 0.00ZAR 578,399,186 USD 35,501,542 17/12/2020 2,111,647 0.21BRL 196,071,759 USD 36,610,947 05/01/2021 319,738 0.03IDR 76,227,595,471 USD 5,370,084 06/01/2021 1,129 0.00USD 9,375,831 IDR 132,602,374,422 06/01/2021 32,292 0.00KRW 17,642,778,227 USD 15,784,248 08/01/2021 156,593 0.02TRY 13,671,236 USD 1,624,766 11/01/2021 98,640 0.01MYR 70,311,212 USD 16,862,819 13/01/2021 383,950 0.04TRY 26,609,769 USD 3,277,886 19/01/2021 66,373 0.01MYR 69,132,943 USD 16,641,698 26/01/2021 311,391 0.03USD 11,998,350 INR 891,693,359 27/01/2021 12,974 0.00COP 14,859,514,899 USD 4,055,543 29/01/2021 81,086 0.01INR 248,520,442 USD 3,304,046 05/02/2021 33,255 0.00USD 4,303,869 TWD 120,678,300 05/02/2021 35,094 0.00RUB 182,119,322 USD 2,338,115 08/02/2021 39,049 0.00NZD 5,358,397 AUD 4,986,875 09/02/2021 93,728 0.01USD 26,914,650 PEN 94,986,046 12/07/2021 604,200 0.06USD 6,048,715 TRY 51,927,620 04/08/2021 31,445 0.00
UNREALISED GAIN ON FORWARD CURRENCY CONTRACTS 23,727,079 2.25
CurrencyAmountBought Currency
AmountSold
MaturityDate
UnrealisedLossUSD
% ofShareholders’
Equity
USD 24,733,650 AUD 33,850,355 01/12/2020 (242,834) (0.01)USD 73,171,437 EUR 61,602,529 01/12/2020 (723,871) (0.02)USD 18,365,686 NOK 165,411,341 01/12/2020 (427,533) (0.03)AUD 30,262,048 USD 22,379,625 02/12/2020 (50,772) (0.01)USD 22,291,683 AUD 30,262,049 02/12/2020 (37,169) (0.00)USD 39,226,641 BRL 209,958,772 02/12/2020 (332,989) (0.03)USD 3,068,679 IDR 43,411,994,618 04/12/2020 (2,996) (0.00)USD 14,492,826 EUR 12,222,320 07/12/2020 (170,117) (0.02)USD 3,225,874 IDR 45,950,165,108 07/12/2020 (20,914) (0.00)USD 20,673,458 EUR 17,337,471 10/12/2020 (127,776) (0.00)CLP 1,767,362,553 USD 2,321,254 14/12/2020 (11,832) (0.00)
Goldman Sachs Funds—Emerging Markets Debt Blend PortfolioSchedule of InvestmentsAs at 30 November 2020
The accompanying notes are an integral part of these financial statements.
206

Forward Currency Contracts – (Continued)
CurrencyAmountBought Currency
AmountSold
MaturityDate
UnrealisedLossUSD
% ofShareholders’
Equity
TWD 138,757,871 USD 4,892,059 14/12/2020 (27,504) (0.00)USD 6,174,966 NOK 55,016,541 14/12/2020 (76,081) (0.01)USD 3,786,286 EUR 3,175,082 15/12/2020 (23,844) (0.00)USD 2,125,930 GBP 1,598,443 15/12/2020 (12,026) (0.00)AUD 2,192,823 CAD 2,108,070 16/12/2020 (11,889) (0.00)CHF 4,222,051 EUR 3,922,195 16/12/2020 (33,435) (0.00)EUR 1,340,897 CAD 2,089,526 16/12/2020 (6,613) (0.00)EUR 1,320,090 CZK 35,737,488 16/12/2020 (50,445) (0.01)EUR 6,298,282 GBP 5,721,640 16/12/2020 (94,711) (0.00)EUR 1,320,090 HUF 483,945,155 16/12/2020 (31,953) (0.00)EUR 3,294,401 NOK 36,540,365 16/12/2020 (198,367) (0.03)EUR 1,330,783 PLN 6,035,366 16/12/2020 (21,307) (0.00)EUR 16,936,234 SEK 175,962,904 16/12/2020 (424,353) (0.02)HUF 961,080,072 EUR 2,698,636 16/12/2020 (28,986) (0.00)JPY 333,827,588 AUD 4,400,199 16/12/2020 (44,256) (0.01)JPY 1,323,183,271 EUR 10,753,691 16/12/2020 (209,724) (0.01)USD 30,377,445 AUD 42,241,090 16/12/2020 (794,756) (0.08)USD 31,420,813 CAD 41,337,507 16/12/2020 (544,144) (0.05)USD 12,227,251 CHF 11,083,611 16/12/2020 (41,263) (0.00)USD 75,531,251 CNH 508,716,247 16/12/2020 (1,798,108) (0.18)USD 1,984,426 COP 7,211,916,496 16/12/2020 (27,103) (0.00)USD 3,904,052 CZK 88,701,625 16/12/2020 (153,143) (0.02)USD 75,053,622 EUR 63,857,238 16/12/2020 (1,578,556) (0.15)USD 26,846,906 GBP 20,614,555 16/12/2020 (726,141) (0.11)USD 4,075,859 HUF 1,249,626,964 16/12/2020 (97,267) (0.01)USD 17,356,254 ILS 59,276,410 16/12/2020 (566,887) (0.07)USD 44,869,120 JPY 4,710,708,545 16/12/2020 (327,819) (0.02)USD 11,030,985 MXN 233,929,992 16/12/2020 (602,970) (0.06)USD 17,454,324 NOK 161,942,775 16/12/2020 (946,112) (0.10)USD 8,738,660 NZD 13,154,184 16/12/2020 (529,353) (0.06)USD 12,004,296 PLN 45,236,942 16/12/2020 (125,505) (0.01)USD 7,942,885 RON 32,426,033 16/12/2020 (36,839) (0.00)USD 8,712,275 SEK 77,104,171 16/12/2020 (379,505) (0.06)USD 12,994,742 SGD 17,524,697 16/12/2020 (108,333) (0.00)USD 18,230,645 THB 566,480,730 16/12/2020 (494,027) (0.07)USD 2,481,406 TRY 21,343,814 16/12/2020 (235,556) (0.02)CLP 7,781,260,880 USD 10,289,754 17/12/2020 (121,215) (0.01)USD 5,400,334 CLP 4,169,005,376 17/12/2020 (47,717) (0.00)USD 43,656,854 ZAR 725,507,466 17/12/2020 (3,522,763) (0.36)USD 10,849,938 KRW 12,029,312,136 08/01/2021 (18,946) (0.00)USD 1,136,793 TRY 9,852,019 11/01/2021 (105,159) (0.01)USD 2,344,919 TRY 18,894,327 19/01/2021 (29,679) (0.00)TRY 5,457,668 USD 690,713 25/01/2021 (6,364) (0.00)USD 701,589 RUB 53,727,663 25/01/2021 (702) (0.00)USD 891,748 TRY 7,203,112 25/01/2021 (11,466) (0.00)CAD 1,800,847 NZD 1,981,130 27/01/2021 (3,019) (0.00)INR 1,006,992,319 USD 13,543,544 27/01/2021 (8,418) (0.00)USD 4,035,974 COP 14,748,901,411 29/01/2021 (69,862) (0.01)TWD 182,917,949 USD 6,516,923 05/02/2021 (46,532) (0.00)USD 8,992,268 RUB 690,068,324 08/02/2021 (15,042) (0.00)AUD 6,851,249 NZD 7,277,602 09/02/2021 (69,537) (0.01)USD 31,994,405 CNH 212,140,504 24/02/2021 (79,868) (0.01)PEN 2,611,975 USD 733,289 12/07/2021 (9,791) (0.00)TRY 25,390,410 USD 2,987,641 04/08/2021 (45,450) (0.00)
UNREALISED LOSS ON FORWARD CURRENCY CONTRACTS (17,769,214) (1.69)
Share Class Specific Forward Currency Contracts – 1.16%
CurrencyAmountBought Currency
AmountSold
MaturityDate
UnrealisedGainUSD
% ofShareholders’
Equity
GBP 167,675,148 USD 215,611,964 13/01/2021 8,764,669 0.83EUR 181,223,132 USD 214,283,439 21/01/2021 3,434,183 0.33
UNREALISED GAIN ON FORWARD CURRENCY CONTRACTS HELD FOR HEDGING PURPOSES 12,198,852 1.16
Goldman Sachs Funds—Emerging Markets Debt Blend PortfolioSchedule of InvestmentsAs at 30 November 2020
The accompanying notes are an integral part of these financial statements.
207

Share Class Specific Forward Currency Contracts – (Continued)
CurrencyAmountBought Currency
AmountSold
MaturityDate
UnrealisedLossUSD
% ofShareholders’
Equity
USD 388,675 EUR 325,443 21/01/2021 (2,305) (0.00)
UNREALISED LOSS ON FORWARD CURRENCY CONTRACTS HELD FOR HEDGING PURPOSES (2,305) (0.00)
Options – 0.04%
Holdings Security Description
UnrealisedGain/(Loss)
USDMarket Value
USD
% ofShareholders’
Equity
Purchased OptionsEUR
22,187,000 Call EUR / Put USD Expires 03/12/2020 Strike 1.19 93,845 159,660 0.0122,250,000 Call EUR / Put USD Expires 03/12/2020 Strike 1.19 145,819 195,290 0.0211,161,000 Call EUR / Put USD Expires 08/12/2020 Strike 1.19 64,549 89,112 0.0111,150,000 Call EUR / Put USD Expires 11/12/2020 Strike 1.20 36,909 68,734 0.01
341,122 512,796 0.05
GBP4,978,000 Call GBP / Put USD Expires 11/12/2020 Strike 1.35 12,186 34,164 0.00
USD6,557,000 Put USD / Call NOK Expires 10/12/2020 Strike 8.92 73,747 112,676 0.01
TOTAL PURCHASED OPTIONS(cost USD 232,581) 659,636 0.06
Written OptionsAUD
(17,229,000) Put AUD / Call NZD Expires 05/02/2021 Strike 1.06 (137,401) (200,627) (0.02)
NZD(9,493,000) Put NZD / Call CAD Expires 25/01/2021 Strike 0.89 4,125 (22,954) (0.00)
USD(6,592,000) Call USD / Put RUB Expires 22/01/2021 Strike 82.86 13,784 (28,010) (0.00)
TOTAL WRITTEN OPTIONS(cost USD (132,099)) (251,591) (0.02)
TOTAL OPTIONS(cost USD 100,482) 408,045 0.04
Swap Contracts – 0.17%Net LocalNotionalAmount Pay Receive Currency Maturity Date
UnrealisedGainUSD
% ofShareholders’
Equity
Interest Rate Swaps263,725,000 Floating (BRL 1 month BRCDI) Fixed 4.120% BRL 03/01/2022 410,086 0.0458,050,000 Floating (EUR 6 month LIBOR) Fixed 0.000% EUR 16/12/2022 102,309 0.011,845,000 Floating (ILS 3 month TELBOR) Fixed 1.405% ILS 18/12/2029 39,411 0.0021,690,000 Floating (ILS 3 month TELBOR) Fixed 1.020% ILS 18/03/2030 229,836 0.0232,880,000 Floating (ILS 3 month TELBOR) Fixed 0.855% ILS 16/06/2031 91,721 0.0117,550,000 Floating (ILS 3 month TELBOR) Fixed 0.862% ILS 16/06/2031 54,907 0.01
2,090,160,000 Floating (INR 6 month LIBOR) Fixed 3.750% INR 16/09/2022 26,932 0.00851,430,000 Floating (MXN 1 month TIIE) Fixed 4.500% MXN 14/12/2022 33,855 0.00524,940,000 Floating (MXN 1 month TIIE) Fixed 5.100% MXN 10/12/2025 158,425 0.02175,520,000 Floating (MXN 1 month TIIE) Fixed 5.400% MXN 08/12/2027 78,492 0.0170,490,000 Floating (MYR 3 month KLIBOR) Fixed 2.250% MYR 17/06/2022 44,077 0.0039,670,000 Floating (MYR 3 month KLIBOR) Fixed 2.250% MYR 17/06/2022 24,834 0.0048,720,000 Floating (MYR 3 month LIBOR) Fixed 2.250% MYR 17/06/2022 40,869 0.0025,960,000 Floating (MYR 3 month LIBOR) Fixed 2.250% MYR 17/06/2022 17,433 0.0047,630,000 Floating (MYR 3 month KLIBOR) Fixed 3.650% MYR 27/02/2024 579,924 0.0532,270,000 Floating (MYR 3 month KLIBOR) Fixed 3.693% MYR 01/03/2024 403,588 0.0422,780,000 Floating (MYR 3 month KLIBOR) Fixed 3.605% MYR 06/03/2024 271,755 0.035,690,000 Floating (MYR 3 month KLIBOR) Fixed 3.330% MYR 31/05/2024 58,392 0.0119,360,000 Floating (MYR 3 month KLIBOR) Fixed 3.250% MYR 18/12/2024 200,397 0.029,300,000 Floating (MYR 3 month KLIBOR) Fixed 3.250% MYR 18/12/2024 96,431 0.019,030,000 Floating (MYR 3 month KLIBOR) Fixed 3.000% MYR 18/03/2025 70,947 0.015,800,000 Floating (MYR 3 month LIBOR) Fixed 2.250% MYR 17/06/2025 2,850 0.0099,050,000 Floating (PLN 6 month WIBOR) Fixed 0.345% PLN 16/06/2023 6,179 0.0051,520,000 Floating (PLN 6 month WIBOR) Fixed 0.750% PLN 16/12/2025 87,346 0.01150,000 Fixed 1.000% Floating (USD 3 month LIBOR) USD 16/12/2030 1,896 0.00
UNREALISED GAIN ON INTEREST RATE SWAPS 3,132,892 0.30
Goldman Sachs Funds—Emerging Markets Debt Blend PortfolioSchedule of InvestmentsAs at 30 November 2020
The accompanying notes are an integral part of these financial statements.
208

Swap Contracts – (Continued)
Net LocalNotionalAmount Pay Receive Currency Maturity Date
UnrealisedGainUSD
% ofShareholders’
Equity
Credit Default Swaps650,000 Floating (Chile Government International
Bond)Fixed 1.000% USD 20/12/2020 429 0.00
120,000 Floating (Chile Government InternationalBond)
Fixed 1.000% USD 20/12/2020 80 0.00
4,650,000 Floating (Philippine GovernmentInternational Bond)
Fixed 1.000% USD 20/12/2023 112,023 0.01
460,000 Floating (Ukraine GovernmentInternational Bond)
Fixed 5.000% USD 20/12/2023 34,030 0.00
250,000 Floating (Chile Government InternationalBond)
Fixed 1.000% USD 20/06/2024 760 0.00
2,020,000 Floating (Peruvian GovernmentInternational Bond)
Fixed 1.000% USD 20/06/2024 4,900 0.00
1,160,000 Floating (Qatar GovernmentInternational Bond)
Fixed 1.000% USD 20/06/2024 13,754 0.00
3,120,000 Floating (Saudi GovernmentInternational Bond)
Fixed 1.000% USD 20/06/2024 46,920 0.00
2,460,000 Floating (Abu Dhabi GovernmentInternational Bond)
Fixed 1.000% USD 20/12/2024 48,334 0.01
3,120,000 Floating (Chile Government InternationalBond)
Fixed 1.000% USD 20/12/2024 19,248 0.00
5,710,000 Floating (Colombia GovernmentInternational Bond)
Fixed 1.000% USD 20/12/2024 70,100 0.01
1,000,000 Floating (Philippine GovernmentInternational Bond)
Fixed 1.000% USD 20/12/2024 35,379 0.00
2,670,000 Floating (Qatar GovernmentInternational Bond)
Fixed 1.000% USD 20/12/2024 23,789 0.00
5,670,000 Floating (Russian Foreign Bond -Eurobond)
Fixed 1.000% USD 20/12/2024 96,447 0.01
2,230,000 Floating (Saudi GovernmentInternational Bond)
Fixed 1.000% USD 20/12/2024 20,103 0.00
4,820,000 Floating (Chile Government InternationalBond)
Fixed 1.000% USD 20/12/2025 17,666 0.00
7,380,000 Floating (Indonesia GovernmentInternational Bond)
Fixed 1.000% USD 20/12/2025 73,823 0.01
2,700,000 Floating (Markit CDX Emerging Markets34 Version 1 Index)
Fixed 1.000% USD 20/12/2025 55,070 0.01
4,210,000 Floating (Russian Foreign Bond -Eurobond)
Fixed 1.000% USD 20/12/2025 99,048 0.01
UNREALISED GAIN ON CREDIT DEFAULT SWAPS 771,903 0.07
TOTAL UNREALISED GAIN ON SWAP CONTRACTS 3,904,795 0.37
Net LocalNotionalAmount Pay Receive Currency Maturity Date
UnrealisedLossUSD
% ofShareholders’
Equity
Interest Rate Swaps163,850,000 Floating (BRL 1 month BRCDI) Fixed 4.230% BRL 02/01/2023 (241,248) (0.02)184,260,000 Floating (BRL 1 month BRCDI) Fixed 4.930% BRL 02/01/2024 (555,968) (0.05)
17,912,630,000 Floating (CLP 6 month LIBOR) Fixed 1.500% CLP 16/12/2025 (256,302) (0.03)4,109,170,000 Floating (CLP 6 month LIBOR) Fixed 2.400% CLP 16/12/2030 (149,701) (0.02)166,400,000 Fixed 2.500% Floating (CNY 3 month LIBOR) CNY 17/03/2023 (28,141) (0.00)
80,781,720,000 Floating (COP 3 month LIBOR) Fixed 2.100% COP 16/12/2022 (24,824) (0.00)35,473,250,000 Fixed 3.400% Floating (COP 3 month LIBOR) COP 16/12/2025 (106,477) (0.01)126,240,000 Floating (CZK 6 month PTIBOR) Fixed 0.620% CZK 16/06/2023 (18,282) (0.00)1,950,000 Fixed 0.000% Floating (EUR 6 month LIBOR) EUR 16/12/2023 (3,302) (0.00)5,310,000 Fixed 0.000% Floating (EUR 6 month LIBOR) EUR 16/12/2024 (13,019) (0.00)29,870,000 Fixed 0.000% Floating (EUR 6 month LIBOR) EUR 16/12/2025 (118,426) (0.01)6,100,000 Fixed 0.000% Floating (EUR 6 month LIBOR) EUR 16/12/2027 (31,876) (0.00)5,870,000 Fixed 0.000% Floating (EUR 6 month LIBOR) EUR 16/12/2030 (51,129) (0.01)310,000 Fixed 0.250% Floating (EUR 6 month EURIBOR) EUR 16/12/2040 (4,953) (0.00)
256,330,000 Fixed 0.250% Floating (PLN 3 month WIBOR) PLN 16/12/2021 (30,170) (0.00)50,000 Fixed 1.250% Floating (THB 6 month LIBOR) THB 17/06/2025 (7) (0.00)
716,830,000 Floating (THB 6 month LIBOR) Fixed 0.750% THB 16/12/2025 (39,493) (0.01)20,980,000 Floating (THB 6 month LIBOR) Fixed 0.750% THB 17/03/2026 (2,542) (0.00)385,480,000 Floating (ZAR 3 month JIBAR) Fixed 4.000% ZAR 16/06/2023 (174,167) (0.02)291,090,000 Floating (ZAR 3 month JIBAR) Fixed 5.250% ZAR 17/03/2026 (227,348) (0.02)
UNREALISED LOSS ON INTEREST RATE SWAPS (2,077,375) (0.20)
Goldman Sachs Funds—Emerging Markets Debt Blend PortfolioSchedule of InvestmentsAs at 30 November 2020
The accompanying notes are an integral part of these financial statements.
209

Swap Contracts – (Continued)
Net LocalNotionalAmount Pay Receive Currency Maturity Date
UnrealisedLossUSD
% ofShareholders’
Equity
Credit Default Swaps1,010,000 Fixed 1.000% Floating (China Government
International Bond)USD 20/12/2020 (619) (0.00)
360,000 Fixed 1.000% Floating (China GovernmentInternational Bond)
USD 20/12/2020 (229) (0.00)
140,000 Fixed 1.000% Floating (China GovernmentInternational Bond)
USD 20/12/2020 (91) (0.00)
480,000 Fixed 1.000% Floating (China GovernmentInternational Bond)
USD 20/12/2020 (311) (0.00)
810,000 Fixed 1.000% Floating (China GovernmentInternational Bond)
USD 20/12/2020 (526) (0.00)
12,870,000 Fixed 1.000% Floating (China GovernmentInternational Bond)
USD 20/12/2020 (8,711) (0.00)
1,410,000 Fixed 1.000% Floating (China GovernmentInternational Bond)
USD 20/12/2020 (920) (0.00)
600,000 Fixed 1.000% Floating (China GovernmentInternational Bond)
USD 20/06/2021 (3,755) (0.00)
80,000 Fixed 1.000% Floating (China GovernmentInternational Bond)
USD 20/06/2021 (505) (0.00)
460,000 Fixed 1.000% Floating (China GovernmentInternational Bond)
USD 20/06/2021 (2,890) (0.00)
1,480,000 Fixed 1.000% Floating (China GovernmentInternational Bond)
USD 20/06/2021 (9,561) (0.00)
2,320,000 Fixed 1.000% Floating (China GovernmentInternational Bond)
USD 20/06/2021 (15,176) (0.00)
690,000 Fixed 1.000% Floating (China GovernmentInternational Bond)
USD 20/06/2021 (4,510) (0.00)
700,000 Fixed 1.000% Floating (China GovernmentInternational Bond)
USD 20/06/2021 (3,675) (0.00)
330,000 Fixed 1.000% Floating (China GovernmentInternational Bond)
USD 20/06/2021 (1,724) (0.00)
1,000,000 Floating (Argentine RepublicGovernment International Bond)
Fixed 5.000% USD 20/12/2025 (10,018) (0.00)
UNREALISED LOSS ON CREDIT DEFAULT SWAPS (63,221) (0.00)
TOTAL UNREALISED LOSS ON SWAP CONTRACTS (2,140,596) (0.20)
MARKET VALUE OF INVESTMENTS(cost USD 991,571,363)
1,029,124,121 97.56
OTHER ASSETS AND LIABILITIES 25,674,584 2.44
SHAREHOLDERS’ EQUITY 1,054,798,705 100.00
TOTAL INVESTMENTSMarket Value
USD
% ofShareholders’
Equity
Total Investments excluding derivatives (cost USD 991,470,881) 1,008,436,867 95.60Unrealised gain on futures contracts 163,775 0.01Unrealised loss on futures contracts (19,684) (0.00)Unrealised gain on non-deliverable bond forward contracts 216,507 0.02Unrealised gain on forward currency contracts 23,727,079 2.25Unrealised loss on forward currency contracts (17,769,214) (1.69)Unrealised gain on forward currency contracts held for hedging purposes 12,198,852 1.16Unrealised loss on forward currency contracts held for hedging purposes (2,305) (0.00)Market value of purchased options (cost USD 232,581) 659,636 0.06Market value of written options (cost USD (132,099)) (251,591) (0.02)Unrealised gain on swap contracts 3,904,795 0.37Unrealised loss on swap contracts (2,140,596) (0.20)Other Assets and Liabilities 25,674,584 2.44
Shareholders’ Equity 1,054,798,705 100.00
Goldman Sachs Funds—Emerging Markets Debt Blend PortfolioSchedule of InvestmentsAs at 30 November 2020
The accompanying notes are an integral part of these financial statements.
210

The Futures Commission Merchant was Morgan Stanley & Co., Inc.
The counterparties for forward currency contracts were Bank of America N.A., Barclays Bank Plc., BNP Paribas S.A., Citibank N.A., Credit Suisse International, Deutsche Bank AG, HSBCBank Plc., JP Morgan Chase Bank N.A., Merrill Lynch International, Morgan Stanley & Co. International Plc., Natwest Markets Plc., Royal Bank of Canada, Standard Chartered Bank,State Street Bank & Trust and UBS AG.
The counterparties for options contracts were BNP Paribas S.A., Citibank N.A., JP Morgan Chase Bank N.A., Morgan Stanley & Co. International Plc. and UBS AG.
The counterparties for swap contracts were Bank of America N.A., Barclays Capital, Inc., Citibank N.A., Deutsche Bank AG, JPMorgan Chase Bank N.A., Morgan Stanley, Morgan Stanley& Co. International Plc. and Morgan Stanley & Co. LLC.
The maximum individual counterparty exposure as at 30 November 2020 is 1.21% of the NAV.
(a) Interest rates represent either the stated coupon rate, annualised discounted yield on date of purchase for discounted securities, or, for floating rate securities, the current reset ratewhich is based upon interest rates indices.
(b) Maturity dates represent either the stated date on the security, or the next interest reset date for floating rate securities or the prerefunded date for those type of securities.(c) This security has a step up coupon which moves to the second rate at a set date in the future.(d) Variable and floating coupon rates are those quoted as of 30 November 2020.(e) 144A: This security is issued to qualified institutional investors, pursuant to private placements, and is transferable as stated in rule 144A of the US Securities Act of 1933.(f) A related party to Goldman Sachs Funds.(g) The yield for this fund as at 30 November 2020 was 0.120%.
Goldman Sachs Funds—Emerging Markets Debt Blend PortfolioSchedule of InvestmentsAs at 30 November 2020
The accompanying notes are an integral part of these financial statements.
211

Holdings Security Description Currency Interest Rate(a) Maturity Date(b)Market Value
USD
% ofShareholders’
Equity
Transferable securities admitted to an official exchange listing
Bonds – 76.40%Argentina
1,536,493 Argentina Government International Bond(c) USD 0.125% 09/07/2030 604,610 0.043,911,303 Argentina Government International Bond(c) USD 0.125% 09/07/2035 1,398,291 0.08
2,002,901 0.12
Bermuda620,000 Bermuda Government International Bond USD 2.375% 20/08/2030 646,040 0.04580,000 Bermuda Government International Bond USD 3.375% 20/08/2050 617,337 0.03
1,263,377 0.07
Brazil3,270,000 Banco do Brasil S.A.(d) USD 6.250% Perp. 3,295,179 0.197,534,000 Brazil Notas do Tesouro Nacional—Series B BRL 6.000% 15/08/2040 6,112,029 0.3654,644,000 Brazil Notas do Tesouro Nacional—Series F BRL 10.000% 01/01/2025 11,938,494 0.69600,000 BRF S.A. USD 5.750% 21/09/2050 631,406 0.04
21,977,108 1.28
British Virgin Islands200,000 Easy Tactic Ltd. USD 8.625% 27/02/2024 176,219 0.01390,000 Fortune Star BVI Ltd. USD 6.850% 02/07/2024 410,962 0.03200,000 Fortune Star BVI Ltd. USD 5.950% 19/10/2025 205,000 0.01200,000 FPC Resources Ltd. USD 4.375% 11/09/2027 207,625 0.01
1,110,000 Huarong Finance 2019 Co., Ltd. USD 3.625% 30/09/2030 1,154,568 0.072,930,000 Huarong Finance II Co., Ltd. USD 5.500% 16/01/2025 3,285,230 0.19200,000 Joy Treasure Assets Holdings, Inc. USD 2.750% 17/11/2030 201,738 0.01270,000 Studio City Finance Ltd. USD 6.000% 15/07/2025 284,850 0.02200,000 Studio City Finance Ltd. USD 6.500% 15/01/2028 213,000 0.01
6,139,192 0.36
Cayman Islands310,000 Country Garden Holdings Co., Ltd. USD 3.875% 22/10/2030 313,487 0.02400,000 DP World Crescent Ltd. USD 4.848% 26/09/2028 457,000 0.03
2,100,000 DP World Salaam(d) USD 6.000% Perp. 2,285,062 0.13290,000 Fantasia Holdings Group Co., Ltd. USD 9.875% 19/10/2023 289,638 0.02920,000 Grupo Aval Ltd. USD 4.375% 04/02/2030 952,890 0.05300,000 Kaisa Group Holdings Ltd. USD 11.950% 22/10/2022 315,750 0.02220,000 Meituan Dianping �B� USD 3.050% 28/10/2030 228,095 0.01320,000 Sunac China Holdings Ltd. USD 8.350% 19/04/2023 335,500 0.02200,000 Yuzhou Group Holdings Co., Ltd. USD 7.700% 20/02/2025 208,875 0.01300,000 Zhenro Properties Group Ltd.(d) USD 10.250% Perp. 308,578 0.02
5,694,875 0.33
Chile13,875,000,000 Bonos de la Tesoreria de la Republica en pesos CLP 4.500% 01/03/2021 18,527,959 1.086,967,240,800 Bonos de la Tesoreria de la Republica en pesos CLP 1.500% 01/03/2026 10,361,250 0.6010,975,000,000 Bonos de la Tesoreria de la Republica en pesos CLP 4.500% 01/03/2026 16,615,410 0.9714,595,000,000 Bonos de la Tesoreria de la Republica en pesos CLP 5.000% 01/03/2035 22,912,170 1.3413,385,000,000 Bonos de la Tesoreria de la Republica en pesos 144A(e) CLP 4.000% 01/03/2023 19,024,413 1.111,135,000,000 Bonos de la Tesoreria de la Republica en pesos 144A(e) CLP 4.700% 01/09/2030 1,751,321 0.102,104,687,325 Bonos del Banco Central de Chile en UF—Series 10YR CLP 3.000% 01/03/2022 2,958,163 0.17
92,150,686 5.37
China432,610,000 Agricultural Development Bank of China—Series 2004 CNY 2.960% 17/04/2030 61,741,073 3.60163,980,000 China Development Bank—Series 2010 CNY 3.090% 18/06/2030 23,693,710 1.38275,570,000 China Government Bond CNY 2.850% 04/06/2027 40,901,057 2.39
126,335,840 7.37
Colombia1,500,000 Banco de Bogota S.A. USD 6.250% 12/05/2026 1,707,225 0.10
13,044,000,000 Colombia Government International Bond COP 4.375% 21/03/2023 3,729,379 0.2220,407,300,000 Colombian TES—Series B COP 6.250% 26/11/2025 6,252,016 0.36128,993,200,000 Colombian TES—Series B COP 7.500% 26/08/2026 41,645,995 2.4344,203,800,000 Colombian TES—Series B COP 5.750% 03/11/2027 13,013,113 0.7655,226,300,000 Colombian TES—Series B COP 6.000% 28/04/2028 16,411,450 0.9530,378,800,000 Colombian TES—Series B COP 7.000% 30/06/2032 9,233,989 0.5428,903,000,000 Colombian TES—Series B COP 7.250% 26/10/2050 8,524,133 0.50
100,517,300 5.86
Goldman Sachs Funds—Emerging Markets Debt Local PortfolioSchedule of InvestmentsAs at 30 November 2020
The accompanying notes are an integral part of these financial statements.
212

Holdings Security Description Currency Interest Rate(a) Maturity Date(b)Market Value
USD
% ofShareholders’
Equity
Bonds – (Continued)Croatia
2,260,000 Croatia Government International Bond EUR 1.500% 17/06/2031 2,924,473 0.17
Czech Republic421,500,000 Czech Republic Government Bond—Series 100 CZK 0.250% 10/02/2027 18,465,032 1.08240,080,000 Czech Republic Government Bond—Series 103 CZK 2.000% 13/10/2033 11,878,955 0.69528,560,000 Czech Republic Government Bond—Series 120 CZK 1.250% 14/02/2025 24,756,385 1.4579,920,000 Czech Republic Government Bond—Series 121 CZK 1.200% 13/03/2031 3,636,385 0.21117,430,000 Czech Republic Government Bond—Series 49 CZK 4.200% 04/12/2036 7,563,662 0.44
66,300,419 3.87
Dominican Republic79,900,000 Dominican Republic Bond DOP 12.000% 05/03/2032 1,680,655 0.10191,550,000 Dominican Republic International Bond DOP 8.900% 15/02/2023 3,364,907 0.20119,600,000 Dominican Republic International Bond DOP 11.375% 06/07/2029 2,314,027 0.132,510,000 Dominican Republic International Bond USD 5.875% 30/01/2060 2,629,617 0.15
9,989,206 0.58
Egypt200,000 Egypt Government International Bond USD 4.550% 20/11/2023 205,281 0.01280,000 Egypt Government International Bond EUR 4.750% 11/04/2025 341,437 0.02640,000 Egypt Government International Bond USD 6.588% 21/02/2028 686,900 0.04170,000 Egypt Government International Bond EUR 5.625% 16/04/2030 205,995 0.01
1,790,000 Egypt Government International Bond USD 8.875% 29/05/2050 1,996,689 0.12
3,436,302 0.20
Hong Kong250,000 Bank of East Asia Ltd.(d) USD 5.825% Perp. 261,000 0.01820,000 CNAC HK Finbridge Co., Ltd. USD 3.000% 22/09/2030 780,199 0.05
1,041,199 0.06
Hungary6,142,260,000 Hungary Government Bond—Series 26/D HUF 2.750% 22/12/2026 21,942,720 1.282,508,410,000 Hungary Government Bond—Series 27/A HUF 3.000% 27/10/2027 9,143,078 0.533,978,240,000 Hungary Government Bond—Series 30/A HUF 3.000% 21/08/2030 14,380,596 0.84
1,000,000 MFB Magyar Fejlesztesi Bank Zrt EUR 1.375% 24/06/2025 1,247,719 0.07
46,714,113 2.72
India550,000 Reliance Industries Ltd. USD 4.125% 28/01/2025 610,242 0.04
Indonesia11,000,000 Indonesia Treasury Bond—Series FR64 IDR 6.125% 15/05/2028 785 0.00
107,345,000,000 Indonesia Treasury Bond—Series FR70 IDR 8.375% 15/03/2024 8,404,384 0.49540,000 Perusahaan Gas Negara Tbk PT USD 5.125% 16/05/2024 599,315 0.04
9,004,484 0.53
Isle Of Man310,000 Gohl Capital Ltd. USD 4.250% 24/01/2027 325,500 0.02
Israel710,000 Leviathan Bond Ltd. 144A(e) USD 5.750% 30/06/2023 749,050 0.04370,000 Leviathan Bond Ltd. 144A(e) USD 6.750% 30/06/2030 407,000 0.03
1,156,050 0.07
Japan400,000 SoftBank Group Corp. USD 5.125% 19/09/2027 417,500 0.02
Jersey320,000 Galaxy Pipeline Assets Bidco Ltd. USD 2.625% 31/03/2036 331,600 0.02570,000 Galaxy Pipeline Assets Bidco Ltd. USD 3.250% 30/09/2040 591,731 0.03
923,331 0.05
Malaysia200,000 Axiata Spv5 Labuan Ltd. USD 3.064% 19/08/2050 201,344 0.01
Mauritius1,440,000 MTN Mauritius Investments Ltd. USD 4.755% 11/11/2024 1,500,975 0.09
Mexico880,000 Banco Mercantil del Norte S.A.(d) USD 6.750% Perp. 929,500 0.05700,000 Banco Mercantil del Norte S.A.(d) USD 7.625% Perp. 761,250 0.04
Goldman Sachs Funds—Emerging Markets Debt Local PortfolioSchedule of InvestmentsAs at 30 November 2020
The accompanying notes are an integral part of these financial statements.
213

Holdings Security Description Currency Interest Rate(a) Maturity Date(b)Market Value
USD
% ofShareholders’
Equity
Bonds – (Continued)Mexico – (Continued)
48,665,200 Mexican Bonos—Series M MXN 8.000% 05/09/2024 2,693,523 0.1695,317,000 Mexican Bonos—Series M MXN 5.750% 05/03/2026 4,892,844 0.29136,731,100 Mexican Bonos—Series M MXN 7.750% 29/05/2031 7,835,947 0.4656,467,800 Mexican Bonos—Series M MXN 7.750% 23/11/2034 3,225,576 0.19123,130,400 Mexican Bonos—Series M MXN 8.000% 07/11/2047 6,901,266 0.40591,389,200 Mexican Bonos—Series M 20 MXN 8.500% 31/05/2029 35,272,746 2.06246,883,300 Mexican Bonos—Series M 30 MXN 10.000% 20/11/2036 16,719,419 0.98344,294,000 Mexican Bonos—Series M 30 MXN 8.500% 18/11/2038 20,476,083 1.192,140,000 Mexico City Airport Trust USD 3.875% 30/04/2028 2,063,763 0.121,190,000 Mexico City Airport Trust USD 5.500% 31/10/2046 1,152,441 0.073,460,000 Mexico Government International Bond USD 2.659% 24/05/2031 3,472,110 0.201,620,000 Mexico Government International Bond USD 3.771% 24/05/2061 1,615,950 0.09720,000 Petroleos Mexicanos USD 6.875% 16/10/2025 751,126 0.04
108,763,544 6.34
Mongolia340,000 Mongolia Government International Bond USD 5.125% 07/04/2026 359,975 0.02
Netherlands430,000 Bharti Airtel International Netherlands BV USD 5.125% 11/03/2023 460,100 0.03530,000 Lukoil International Finance BV USD 4.750% 02/11/2026 602,792 0.03450,000 Lukoil Securities BV USD 3.875% 06/05/2030 486,563 0.03200,000 Minejesa Capital BV USD 4.625% 10/08/2030 214,250 0.01230,000 PPF Telecom Group BV EUR 2.125% 31/01/2025 281,031 0.02275,000 PPF Telecom Group BV EUR 3.250% 29/09/2027 351,593 0.02
1,300,000 Prosus NV USD 3.680% 21/01/2030 1,419,990 0.08650,000 Prosus NV USD 4.027% 03/08/2050 693,875 0.04
4,510,194 0.26
Nigeria890,000 Nigeria Government International Bond USD 6.500% 28/11/2027 935,195 0.05410,000 Nigeria Government International Bond USD 7.143% 23/02/2030 432,935 0.03
1,368,130 0.08
Peru114,940,000 Banco de Credito del Peru PEN 4.650% 17/09/2024 33,983,928 1.9822,150,000 Peru Government Bond(e) PEN 5.940% 12/02/2029 7,481,738 0.4410,525,000 Peru Government Bond(e) PEN 6.150% 12/08/2032 3,450,870 0.2032,550,000 Peru Government Bond(e) PEN 5.400% 12/08/2034 9,766,061 0.5715,875,000 Peru Government Bond(e) PEN 5.350% 12/08/2040 4,478,879 0.264,949,000 Peruvian Government International Bond PEN 6.950% 12/08/2031 1,734,127 0.101,530,000 Peruvian Government International Bond USD 2.780% 01/12/2060 1,510,875 0.091,730,000 Peruvian Government International Bond USD 3.230% 28/07/2121 1,709,240 0.10
64,115,718 3.74
Philippines200,000 International Container Terminal Services, Inc. USD 4.750% 17/06/2030 215,250 0.01
35,890,000 Philippine Government Bond—Series 1063 PHP 6.250% 22/03/2028 910,070 0.0576,580,000 Philippine Government Bond—Series 1064 PHP 6.875% 10/01/2029 2,047,258 0.1210,000,000 Philippine Government International Bond PHP 3.900% 26/11/2022 212,501 0.0135,000,000 Philippine Government International Bond PHP 6.250% 14/01/2036 939,045 0.06200,000 SMC Global Power Holdings Corp.(d) USD 7.000% Perp. 205,875 0.01
4,529,999 0.26
Poland189,500,000 Poland Government Bond—Series 425 PLN 0.750% 25/04/2025 51,557,758 3.0178,310,000 Poland Government Bond—Series 428 PLN 2.750% 25/04/2028 23,721,956 1.3896,830,000 Poland Government Bond—Series 727 PLN 2.500% 25/07/2027 28,810,031 1.68
104,089,745 6.07
Romania50,670,000 Romania Government Bond—Series 15Y RON 3.650% 24/09/2031 12,641,860 0.7441,130,000 Romania Government Bond—Series 5Y RON 3.650% 28/07/2025 10,514,933 0.6113,710,000 Romania Government Bond—Series 8Y RON 4.150% 26/01/2028 3,606,543 0.211,410,000 Romanian Government International Bond EUR 3.624% 26/05/2030 2,002,154 0.12650,000 Romanian Government International Bond USD 3.000% 14/02/2031 697,023 0.04
2,470,000 Romanian Government International Bond EUR 2.000% 28/01/2032 3,086,618 0.181,630,000 Romanian Government International Bond USD 4.000% 14/02/2051 1,786,633 0.10
34,335,764 2.00
Goldman Sachs Funds—Emerging Markets Debt Local PortfolioSchedule of InvestmentsAs at 30 November 2020
The accompanying notes are an integral part of these financial statements.
214

Holdings Security Description Currency Interest Rate(a) Maturity Date(b)Market Value
USD
% ofShareholders’
Equity
Bonds – (Continued)Russia
50,030,000 Russian Federal Bond - OFZ Bonds—Series 6218 RUB 8.500% 17/09/2031 790,908 0.05921,260,000 Russian Federal Bond - OFZ Bonds—Series 6221 RUB 7.700% 23/03/2033 13,788,635 0.80776,900,000 Russian Federal Bond - OFZ Bonds—Series 6224 RUB 6.900% 23/05/2029 11,061,280 0.64
2,531,540,000 Russian Federal Bond - OFZ Bonds—Series 6226 RUB 7.950% 07/10/2026 37,736,246 2.202,547,230,000 Russian Federal Bond - OFZ Bonds—Series 6228 RUB 7.650% 10/04/2030 38,035,064 2.22670,260,000 Russian Federal Bond - OFZ Bonds—Series 6230 RUB 7.700% 16/03/2039 10,206,184 0.60275,070,000 Russian Federal Bond - OFZ Bonds—Series 6232 RUB 6.000% 06/10/2027 3,718,072 0.22
1,454,050,000 Russian Federal Bond - OFZ Bonds—Series 6235 RUB 5.900% 12/03/2031 19,097,542 1.11
134,433,931 7.84
Serbia1,070,000 Serbia International Bond EUR 3.125% 15/05/2027 1,439,145 0.08
Singapore200,000 Trafigura Group Pte Ltd.(d) USD 6.875% Perp. 196,438 0.01
South Africa216,190,000 South Africa Government Bond—Series 2030 ZAR 8.000% 31/01/2030 13,230,751 0.77163,395,000 South Africa Government Bond—Series 2032 ZAR 8.250% 31/03/2032 9,414,687 0.55404,824,000 South Africa Government Bond—Series 2035 ZAR 8.875% 28/02/2035 22,886,756 1.33321,950,000 South Africa Government Bond—Series 2037 ZAR 8.500% 31/01/2037 17,132,012 1.00410,847,300 South Africa Government Bond—Series 2040 ZAR 9.000% 31/01/2040 22,376,173 1.31134,590,000 South Africa Government Bond—Series 2044 ZAR 8.750% 31/01/2044 7,012,451 0.4186,150,000 South Africa Government Bond—Series 2048 ZAR 8.750% 28/02/2048 4,492,860 0.26542,640,000 South Africa Government Bond—Series R186 ZAR 10.500% 21/12/2026 41,207,182 2.40178,440,000 South Africa Government Bond—Series R213 ZAR 7.000% 28/02/2031 9,765,913 0.57
147,518,785 8.60
Supranationals6,400,000 Eastern & Southern African Trade & Development Bank USD 4.875% 23/05/2024 6,685,888 0.39
Thailand780,000 PTT Treasury Center Co., Ltd. USD 3.700% 16/07/2070 815,222 0.05360,000 PTTEP Treasury Center Co., Ltd. USD 2.587% 10/06/2027 376,031 0.02
896,125,128 Thailand Government Bond THB 1.200% 14/07/2021 29,560,700 1.72402,220,000 Thailand Government Bond THB 3.850% 12/12/2025 15,283,949 0.89206,270,000 Thailand Government Bond THB 3.580% 17/12/2027 8,072,871 0.47745,334,556 Thailand Government Bond THB 1.250% 12/03/2028 23,950,923 1.4092,470,000 Thailand Government Bond THB 3.650% 20/06/2031 3,712,362 0.22716,220,000 Thailand Government Bond THB 3.775% 25/06/2032 29,345,590 1.71267,190,000 Thailand Government Bond THB 3.400% 17/06/2036 10,882,378 0.64449,730,000 Thailand Government Bond THB 3.300% 17/06/2038 18,220,593 1.0619,670,000 Thailand Government Bond THB 3.600% 17/06/2067 854,048 0.05
141,074,667 8.23
Turkey103,600,000 Turkey Government Bond TRY 12.200% 18/01/2023 13,049,412 0.7627,545,000 Turkey Government Bond TRY 16.200% 14/06/2023 3,770,874 0.2252,555,000 Turkey Government Bond TRY 8.800% 27/09/2023 6,095,331 0.3615,460,000 Turkey Government Bond TRY 10.600% 11/02/2026 1,890,962 0.11117,490,000 Turkey Government Bond TRY 11.000% 24/02/2027 14,415,674 0.841,760,000 Turkiye Vakiflar Bankasi TAO USD 5.250% 05/02/2025 1,703,900 0.102,560,000 Yapi ve Kredi Bankasi AS USD 8.250% 15/10/2024 2,764,800 0.16
43,690,953 2.55
Ukraine2,530,000 Ukraine Government International Bond EUR 4.375% 27/01/2030 2,852,770 0.17290,000 Ukraine Government International Bond USD 7.253% 15/03/2033 309,076 0.02
3,161,846 0.19
United Arab Emirates400,000 DP World Plc. USD 5.625% 25/09/2048 489,187 0.03130,000 DP World Plc. 144A(e) USD 6.850% 02/07/2037 172,636 0.01
661,823 0.04
United Kingdom1,860,000 Gazprom PJSC Via Gaz Finance Plc.(d) USD 4.599% Perp. 1,951,837 0.11200,000 Vedanta Resources Ltd. USD 6.125% 09/08/2024 128,000 0.01
2,079,837 0.12
Goldman Sachs Funds—Emerging Markets Debt Local PortfolioSchedule of InvestmentsAs at 30 November 2020
The accompanying notes are an integral part of these financial statements.
215

Holdings Security Description Currency Interest Rate(a) Maturity Date(b)Market Value
USD
% ofShareholders’
Equity
Bonds – (Continued)United States
1,530,000 Sasol Financing USA LLC USD 5.875% 27/03/2024 1,584,267 0.09
Uruguay88,975,000 Uruguay Government International Bond UYU 8.500% 15/03/2028 2,196,068 0.1355,138,796 Uruguay Government International Bond UYU 4.375% 15/12/2028 1,475,316 0.0953,058,643 Uruguay Government International Bond UYU 3.875% 02/07/2040 1,446,884 0.08
5,118,268 0.30
TOTAL BONDS(cost USD 1,299,450,766) 1,310,345,334 76.40
Holdings Security DescriptionMarket Value
USD
% ofShareholders’
Equity
Mutual Funds – 4.25%Ireland
72,861,409 Goldman Sachs US$ Treasury Liquid Reserves Fund (X Distribution Class)(f)(g) 72,861,409 4.25
TOTAL MUTUAL FUNDS(cost USD 72,861,409) 72,861,409 4.25
TOTAL TRANSFERABLE SECURITIES ADMITTED TO AN OFFICIAL EXCHANGE LISTING(cost USD 1,372,312,175) 1,383,206,743 80.65
Holdings Security Description Currency Interest Rate(a) Maturity Date(b)Market Value
USD
% ofShareholders’
Equity
Transferable securities dealt in another regulated market
Bonds – 10.36%Bermuda
960,000 Tengizchevroil Finance Co. International Ltd. USD 2.625% 15/08/2025 992,160 0.06300,000 Tengizchevroil Finance Co. International Ltd. USD 3.250% 15/08/2030 313,500 0.02
1,305,660 0.08
Brazil480,000 BRF S.A. USD 4.875% 24/01/2030 511,500 0.03
Chile200,000 Sociedad Quimica y Minera de Chile S.A. USD 4.250% 22/01/2050 224,531 0.01
Germany187,800,000,000 Indonesia Treasury Bond—Deutsche Bank AG 144A(e) IDR 8.375% 19/03/2024 14,703,463 0.8573,400,000,000 Indonesia Treasury Bond—Deutsche Bank AG 144A(e) IDR 8.250% 19/05/2036 5,796,105 0.34
20,499,568 1.19
Indonesia108,401,000,000 Indonesia Treasury Bond—JPMorgan Chase Bank NA 144A(e) IDR 8.375% 15/03/2024 8,487,061 0.49124,530,000,000 Indonesia Treasury Bond—JPMorgan Chase Bank NA 144A(e) IDR 8.375% 17/09/2026 10,027,664 0.58109,298,000,000 Indonesia Treasury Bond—JPMorgan Chase Bank NA 144A(e) IDR 7.000% 17/05/2027 8,243,794 0.4884,680,000,000 Indonesia Treasury Bond—JPMorgan Chase Bank NA 144A(e) IDR 7.000% 18/09/2030 6,356,997 0.37171,863,000,000 Indonesia Treasury Bond—JPMorgan Chase Bank NA 144A(e) IDR 6.500% 15/02/2031 12,536,748 0.73207,584,000,000 Indonesia Treasury Bond—JPMorgan Chase Bank NA 144A(e) IDR 8.750% 17/05/2031 17,310,918 1.01392,838,000,000 Indonesia Treasury Bond—JPMorgan Chase Bank NA 144A(d)(e) IDR 7.500% 17/06/2035 29,977,546 1.75472,920,000,000 Indonesia Treasury Bond—Standard Chartered Bank 144A(e) IDR 9.000% 20/03/2029 39,370,925 2.30124,000,000,000 Indonesia Treasury Bond—Standard Chartered Bank 144A(e) IDR 7.500% 19/08/2032 9,374,646 0.55
141,686,299 8.26
Luxembourg200,000 Millicom International Cellular S.A. USD 4.500% 27/04/2031 216,622 0.01400,000 Rede D’or Finance SARL USD 4.500% 22/01/2030 414,000 0.03
630,622 0.04
Mexico830,000 Banco Santander Mexico S.A. Institucion de Banca Multiple Grupo
Financiero Santander USD 5.375% 17/04/2025 940,315 0.061,000,000 BBVA Bancomer S.A.(d) USD 5.125% 18/01/2033 1,047,500 0.06310,000 Cemex SAB de CV USD 5.450% 19/11/2029 339,644 0.02650,000 Cemex SAB de CV USD 5.200% 17/09/2030 707,499 0.04200,000 Industrias Penoles SAB de CV USD 4.750% 06/08/2050 221,000 0.01
3,255,958 0.19
Goldman Sachs Funds—Emerging Markets Debt Local PortfolioSchedule of InvestmentsAs at 30 November 2020
The accompanying notes are an integral part of these financial statements.
216
Holdings Security Description Currency Interest Rate(a) Maturity Date(b)Market Value
USD
% ofShareholders’
Equity
Bonds – (Continued)Panama
860,000 Banco Latinoamericano de Comercio Exterior S.A. USD 2.375% 14/09/2025 882,721 0.05670,000 Banco Nacional de Panama USD 2.500% 11/08/2030 669,163 0.04
1,551,884 0.09
United States54,704,000,000 Indonesia Treasury Bond—JPMorgan Chase Bank NA IDR 10.500% 19/08/2030 4,988,059 0.297,763,000,000 Indonesia Treasury Bond—JPMorgan Chase Bank NA 144A(e) IDR 8.250% 19/05/2036 613,013 0.04
5,601,072 0.33
Venezuela74,110,000 Petroleos de Venezuela S.A. USD 6.000% 28/10/2022 2,371,520 0.14
20,000 Petroleos de Venezuela S.A. USD 6.000% 15/11/2026 750 0.00
2,372,270 0.14
TOTAL BONDS(cost USD 217,958,787) 177,639,364 10.36
TOTAL TRANSFERABLE SECURITIES DEALT IN ANOTHER REGULATED MARKET(cost USD 217,958,787) 177,639,364 10.36
Other Transferable Securities
Bonds – 4.82%Dominican Republic
45,260,000 Dominican Republic Central Bank Notes DOP 11.000% 15/09/2023 845,809 0.05
Peru39,222,000 Peruvian Government International Bond PEN 8.200% 12/08/2026 14,658,771 0.8657,881,000 Peruvian Government International Bond PEN 6.350% 12/08/2028 19,949,776 1.1636,781,000 Peruvian Government International Bond PEN 6.850% 12/02/2042 12,385,368 0.72
46,993,915 2.74
United Kingdom216,100,000 HSBC Bank Plc. 144A(e) EGP 0.000% 07/01/2021 13,602,249 0.79
United States131,150,000 JPMorgan Chase Bank NA 144A(e) EGP 0.000% 08/07/2021 7,750,681 0.45205,450,000 JPMorgan Chase Bank NA 144A(e) EGP 0.000% 02/09/2021 11,917,883 0.70
4,360,000,000 Republic of Colombia—Citigroup, Inc. COP 11.000% 25/07/2024 1,481,419 0.09
21,149,983 1.24
TOTAL BONDS(cost USD 81,003,999) 82,591,956 4.82
TOTAL OTHER TRANSFERABLE SECURITIES(cost USD 81,003,999) 82,591,956 4.82
MARKET VALUE OF INVESTMENTS EXCLUDING DERIVATIVES(cost USD 1,671,274,961) 1,643,438,063 95.83
Futures Contracts – 0.01%
Number ofContracts Security Description
CommitmentMarket Value
USD
UnrealisedGainUSD
% ofShareholders’
Equity
USD150 US Treasury Notes 10YR Futures 22/03/2021 Long 20,716,406 39,844 0.00670 US Treasury Notes 5YR Futures 31/03/2021 Long 84,414,766 69,193 0.01152 US Treasury Ultra Long Notes 10YR Futures 22/03/2021 Long 23,864,000 31,249 0.00
128,995,172 140,286 0.01
UNREALISED GAIN ON FUTURES CONTRACTS 140,286 0.01
Number ofContracts Security Description
CommitmentMarket Value
USD
UnrealisedLossUSD
% ofShareholders’
Equity
USD(49) US Treasury Long Bond Futures 22/03/2021 Short (8,561,219) (247) (0.00)
Goldman Sachs Funds—Emerging Markets Debt Local PortfolioSchedule of InvestmentsAs at 30 November 2020
The accompanying notes are an integral part of these financial statements.
217

Futures Contracts – (Continued)
Number ofContracts Security Description
CommitmentMarket Value
USD
UnrealisedLossUSD
% ofShareholders’
Equity
USD – (Continued)(145) US Treasury Notes 2YR Futures 31/03/2021 Short (32,020,078) (7,715) (0.00)(7) US Treasury Ultra Long Bond Futures 22/03/2021 Short (1,509,594) (4,919) (0.00)
(42,090,891) (12,881) (0.00)
UNREALISED LOSS ON FUTURES CONTRACTS (12,881) (0.00)
Non-Deliverable Bond Forward Contracts – 0.03%
Number ofContracts Security Description
CommitmentMarket Value
USD
UnrealisedGainUSD
% ofShareholders’
Equity
COP41,473,500,000 BFS Finance COP Bond Forward 09/12/2020 Long 35,303 35,302 0.0093,531,500,000 BFS Finance COP Bond Forward 06/01/2021 Long 355,525 355,525 0.0219,930,600,000 BFS Finance COP Bond Forward 06/01/2021 Long 125,736 125,736 0.01
516,564 516,563 0.03
UNREALISED GAIN ON NON-DELIVERABLE BOND FORWARD CONTRACTS 516,563 0.03
Forward Currency Contracts – 1.23%
CurrencyAmountBought Currency
AmountSold
MaturityDate
UnrealisedGainUSD
% ofShareholders’
Equity
AUD 72,683,767 USD 53,405,734 01/12/2020 223,982 0.01EUR 131,226,987 USD 155,517,305 01/12/2020 1,896,020 0.05NOK 50,731,421 USD 5,598,200 01/12/2020 165,654 0.01BRL 711,487,689 USD 124,267,971 02/12/2020 9,787,818 0.57IDR 93,021,732,425 USD 6,326,697 04/12/2020 255,184 0.02IDR 169,929,699,859 USD 11,827,368 07/12/2020 179,675 0.01EUR 47,371,000 USD 56,600,481 10/12/2020 234,528 0.01USD 8,618,874 CLP 6,570,213,537 14/12/2020 33,543 0.00AUD 24,176,095 EUR 14,656,631 16/12/2020 252,214 0.01AUD 81,664,525 USD 59,018,011 16/12/2020 1,247,076 0.06CAD 4,447,449 CHF 3,059,622 16/12/2020 52,354 0.00CAD 4,572,063 JPY 366,149,066 16/12/2020 22,407 0.00CAD 129,298,543 USD 98,236,688 16/12/2020 1,745,688 0.08CHF 22,812,053 USD 25,036,456 16/12/2020 214,337 0.01CNH 1,861,548,058 USD 274,098,713 16/12/2020 8,873,024 0.54COP 10,264,445,512 USD 2,735,796 16/12/2020 127,136 0.01CZK 75,467,516 EUR 2,791,981 16/12/2020 101,339 0.01CZK 355,168,933 USD 15,829,092 16/12/2020 416,262 0.03EUR 2,756,153 CHF 2,960,478 16/12/2020 30,564 0.00EUR 11,575,116 SGD 18,509,495 16/12/2020 51,373 0.00EUR 94,138,492 USD 110,869,824 16/12/2020 2,101,517 0.11GBP 22,572,520 EUR 24,704,256 16/12/2020 545,471 0.02GBP 40,471,994 USD 52,503,446 16/12/2020 1,629,971 0.13HUF 10,204,936,367 USD 33,418,645 16/12/2020 660,716 0.03IDR 90,835,774,253 USD 6,396,983 16/12/2020 12,558 0.00ILS 84,956,583 USD 24,806,732 16/12/2020 881,204 0.07JPY 10,063,178,487 USD 95,878,322 16/12/2020 672,942 0.03MXN 2,218,499,930 USD 103,489,809 16/12/2020 6,842,028 0.42NOK 283,059,060 EUR 25,983,722 16/12/2020 980,153 0.07NOK 95,893,580 SEK 91,444,479 16/12/2020 113,000 0.01NOK 341,739,773 USD 37,845,476 16/12/2020 984,047 0.08NZD 5,121,910 AUD 4,867,510 16/12/2020 16,708 0.00NZD 4,903,982 EUR 2,764,364 16/12/2020 137,799 0.01NZD 69,386,459 USD 46,512,759 16/12/2020 2,374,694 0.13PLN 38,133,177 EUR 8,517,018 16/12/2020 4,115 0.00PLN 310,704,741 USD 82,434,009 16/12/2020 878,138 0.05RON 161,987,000 USD 39,350,662 16/12/2020 512,727 0.03SEK 267,518,423 EUR 25,827,791 16/12/2020 549,814 0.03SEK 155,026,078 USD 17,636,522 16/12/2020 643,460 0.04SGD 73,678,083 USD 54,418,841 16/12/2020 669,666 0.02THB 3,386,809,008 USD 109,910,922 16/12/2020 2,037,962 0.14TRY 104,056,160 USD 12,453,749 16/12/2020 792,086 0.05USD 6,316,002 IDR 89,476,520,266 16/12/2020 2,372 0.00USD 47,781,033 CLP 36,272,504,324 17/12/2020 380,174 0.03ZAR 1,224,928,895 USD 75,251,605 17/12/2020 4,405,295 0.28BRL 681,584,919 USD 127,267,026 05/01/2021 1,111,474 0.07
Goldman Sachs Funds—Emerging Markets Debt Local PortfolioSchedule of InvestmentsAs at 30 November 2020
The accompanying notes are an integral part of these financial statements.
218

Forward Currency Contracts – (Continued)
CurrencyAmountBought Currency
AmountSold
MaturityDate
UnrealisedGainUSD
% ofShareholders’
Equity
IDR 163,531,252,226 USD 11,520,452 06/01/2021 2,424 0.00USD 19,288,833 IDR 272,801,967,589 06/01/2021 66,434 0.00KRW 36,736,189,148 USD 32,868,599 08/01/2021 323,778 0.02TRY 29,380,944 USD 3,491,795 11/01/2021 211,988 0.01MYR 247,613,000 USD 59,385,313 13/01/2021 1,352,145 0.08TRY 57,053,583 USD 7,028,152 19/01/2021 142,220 0.01MYR 203,178,393 USD 48,909,150 26/01/2021 915,162 0.05USD 25,884,341 INR 1,923,668,713 27/01/2021 28,040 0.00COP 36,190,380,250 USD 9,877,284 29/01/2021 197,485 0.01INR 521,232,435 USD 6,929,716 05/02/2021 69,746 0.00USD 11,750,260 TWD 329,154,936 05/02/2021 107,001 0.01RUB 527,626,747 USD 6,799,808 08/02/2021 87,188 0.00USD 1,409,714 RUB 107,845,213 08/02/2021 2,034 0.00NZD 11,479,392 AUD 10,683,473 09/02/2021 200,796 0.01USD 65,721,759 PEN 231,944,023 12/07/2021 1,474,935 0.08USD 12,221,290 TRY 104,918,548 04/08/2021 63,534 0.00
UNREALISED GAIN ON FORWARD CURRENCY CONTRACTS 61,095,179 3.56
CurrencyAmountBought Currency
AmountSold
MaturityDate
UnrealisedLossUSD
% ofShareholders’
Equity
USD 53,108,302 AUD 72,683,763 01/12/2020 (521,415) (0.01)USD 155,868,288 EUR 131,226,998 01/12/2020 (1,545,037) (0.05)USD 39,434,941 NOK 355,157,069 01/12/2020 (916,250) (0.03)AUD 64,978,927 USD 48,053,721 02/12/2020 (109,018) (0.01)USD 47,864,892 AUD 64,978,928 02/12/2020 (79,810) (0.01)USD 132,931,508 BRL 711,487,689 02/12/2020 (1,124,280) (0.06)USD 6,575,461 IDR 93,021,732,425 04/12/2020 (6,421) (0.00)USD 31,093,630 EUR 26,222,342 07/12/2020 (364,938) (0.02)USD 6,909,447 IDR 98,419,901,248 07/12/2020 (44,795) (0.00)USD 44,625,490 EUR 37,425,936 10/12/2020 (277,580) (0.02)CLP 3,807,941,207 USD 5,001,415 14/12/2020 (25,560) (0.00)TWD 298,075,466 USD 10,508,978 14/12/2020 (59,088) (0.00)USD 13,246,222 NOK 118,017,153 14/12/2020 (163,032) (0.01)USD 8,194,677 EUR 6,871,846 15/12/2020 (51,606) (0.00)USD 4,601,198 GBP 3,459,548 15/12/2020 (26,028) (0.00)AUD 4,648,505 CAD 4,468,840 16/12/2020 (25,202) (0.00)CHF 8,931,462 EUR 8,297,147 16/12/2020 (70,743) (0.00)EUR 2,863,915 CAD 4,462,854 16/12/2020 (14,125) (0.00)EUR 2,759,009 CZK 74,691,891 16/12/2020 (105,430) (0.01)EUR 13,341,667 GBP 12,120,336 16/12/2020 (200,855) (0.00)EUR 2,759,009 HUF 1,011,452,692 16/12/2020 (66,782) (0.00)EUR 6,899,455 NOK 76,527,352 16/12/2020 (415,551) (0.03)EUR 2,780,725 PLN 12,611,144 16/12/2020 (44,521) (0.00)EUR 35,852,870 SEK 372,458,824 16/12/2020 (893,272) (0.07)HUF 2,060,832,301 EUR 5,786,651 16/12/2020 (62,154) (0.00)JPY 712,465,051 AUD 9,391,937 16/12/2020 (95,114) (0.01)JPY 2,809,341,326 EUR 22,832,017 16/12/2020 (445,417) (0.03)USD 64,485,241 AUD 89,665,516 16/12/2020 (1,684,255) (0.13)USD 70,396,718 CAD 92,617,396 16/12/2020 (1,221,317) (0.05)USD 28,204,116 CHF 25,580,935 16/12/2020 (111,570) (0.00)USD 166,969,961 CNH 1,125,315,109 16/12/2020 (4,087,870) (0.28)USD 4,255,042 COP 15,464,099,780 16/12/2020 (58,165) (0.00)USD 14,617,426 CZK 333,757,879 16/12/2020 (648,591) (0.04)USD 101,473,234 EUR 86,483,717 16/12/2020 (2,311,958) (0.12)USD 57,121,953 GBP 43,857,080 16/12/2020 (1,539,194) (0.11)USD 15,300,037 HUF 4,675,610,944 16/12/2020 (314,155) (0.01)USD 39,883,783 ILS 136,111,590 16/12/2020 (1,271,657) (0.11)USD 95,769,495 JPY 10,054,358,454 16/12/2020 (697,142) (0.02)USD 27,935,513 MXN 593,758,526 16/12/2020 (1,593,659) (0.09)USD 42,891,847 NOK 396,902,406 16/12/2020 (2,205,425) (0.15)USD 18,423,436 NZD 27,732,039 16/12/2020 (1,115,662) (0.07)USD 51,933,793 PLN 195,048,516 16/12/2020 (366,378) (0.02)USD 17,743,418 RON 72,435,730 16/12/2020 (82,294) (0.01)USD 18,364,141 SEK 162,517,127 16/12/2020 (799,151) (0.06)USD 27,882,892 SGD 37,602,708 16/12/2020 (232,351) (0.00)USD 90,822,599 THB 2,844,505,117 16/12/2020 (3,200,765) (0.20)USD 9,049,834 TRY 74,515,432 16/12/2020 (435,612) (0.03)CLP 8,149,332,674 USD 10,751,951 17/12/2020 (102,415) (0.00)USD 88,594,018 ZAR 1,470,852,216 17/12/2020 (7,055,232) (0.42)
Goldman Sachs Funds—Emerging Markets Debt Local PortfolioSchedule of InvestmentsAs at 30 November 2020
The accompanying notes are an integral part of these financial statements.
219

Forward Currency Contracts – (Continued)
CurrencyAmountBought Currency
AmountSold
MaturityDate
UnrealisedLossUSD
% ofShareholders’
Equity
USD 23,270,047 KRW 25,799,291,639 08/01/2021 (40,475) (0.00)USD 2,777,829 TRY 24,074,056 11/01/2021 (256,964) (0.02)USD 784,844 TRY 6,323,923 19/01/2021 (9,934) (0.00)TRY 11,692,615 USD 1,479,797 25/01/2021 (13,634) (0.00)USD 1,503,541 RUB 115,141,187 25/01/2021 (1,505) (0.00)USD 3,427,751 TRY 27,687,724 25/01/2021 (44,075) (0.00)CAD 3,887,766 NZD 4,276,970 27/01/2021 (6,518) (0.00)INR 2,178,600,042 USD 29,301,285 27/01/2021 (18,416) (0.00)USD 3,897,227 COP 14,245,006,480 29/01/2021 (68,335) (0.00)TWD 392,784,513 USD 13,993,983 05/02/2021 (99,943) (0.00)AUD 16,738,513 NZD 17,780,151 09/02/2021 (169,889) (0.01)USD 95,754,124 CNH 634,902,508 24/02/2021 (239,032) (0.01)PEN 24,169,632 USD 6,781,915 12/07/2021 (87,100) (0.00)TRY 42,314,173 USD 4,971,876 04/08/2021 (68,593) (0.00)
UNREALISED LOSS ON FORWARD CURRENCY CONTRACTS (40,013,255) (2.33)
Options – 0.05%
Holdings Security Description
UnrealisedGain/(Loss)
USDMarket Value
USD
% ofShareholders’
Equity
Purchased OptionsEUR
47,641,000 Call EUR / Put USD Expires 03/12/2020 Strike 1.19 201,508 342,830 0.0247,690,000 Call EUR / Put USD Expires 03/12/2020 Strike 1.19 312,545 418,580 0.0224,080,000 Call EUR / Put USD Expires 08/12/2020 Strike 1.19 139,265 192,260 0.0124,132,000 Call EUR / Put USD Expires 11/12/2020 Strike 1.20 79,883 148,761 0.01
733,201 1,102,431 0.06
GBP10,774,000 Call GBP / Put USD Expires 11/12/2020 Strike 1.35 26,375 73,942 0.01
USD14,045,000 Put USD / Call NOK Expires 10/12/2020 Strike 8.92 157,964 241,349 0.01
TOTAL PURCHASED OPTIONS(cost USD 500,182) 1,417,722 0.08
Written OptionsAUD
(36,910,000) Put AUD / Call NZD Expires 05/02/2021 Strike 1.06 (294,357) (429,808) (0.03)
NZD(20,494,000) Put NZD / Call CAD Expires 25/01/2021 Strike 0.89 8,905 (49,555) (0.00)
USD(14,127,000) Call USD / Put RUB Expires 22/01/2021 Strike 82.86 29,540 (60,025) (0.00)
TOTAL WRITTEN OPTIONS(cost USD (283,476)) (539,388) (0.03)
TOTAL OPTIONS(cost USD 216,706) 878,334 0.05
Swap Contracts – 0.41%Net LocalNotionalAmount Pay Receive Currency Maturity Date
UnrealisedGainUSD
% ofShareholders’
Equity
Interest Rate Swaps679,000,000 Floating (BRL 1 month BRCDI) Fixed 4.120% BRL 03/01/2022 1,134,222 0.07135,760,000 Floating (EUR 6 month LIBOR) Fixed 0.000% EUR 16/12/2022 239,589 0.0150,485,000 Floating (ILS 3 month TELBOR) Fixed 1.405% ILS 18/12/2029 1,078,410 0.069,345,000 Floating (ILS 3 month TELBOR) Fixed 1.020% ILS 18/03/2030 99,023 0.0121,130,000 Floating (ILS 3 month TELBOR) Fixed 0.893% ILS 17/06/2030 143,899 0.0136,910,000 Floating (ILS 3 month TELBOR) Fixed 0.855% ILS 16/06/2031 102,963 0.0135,010,000 Floating (ILS 3 month TELBOR) Fixed 0.862% ILS 16/06/2031 109,531 0.01
4,321,380,000 Floating (INR 6 month LIBOR) Fixed 3.750% INR 16/09/2022 59,306 0.001,916,995,000 Floating (MXN 1 month TIIE) Fixed 4.500% MXN 14/12/2022 74,205 0.011,244,285,000 Floating (MXN 1 month TIIE) Fixed 5.100% MXN 10/12/2025 375,522 0.02164,480,000 Floating (MXN 1 month TIIE) Fixed 5.400% MXN 08/12/2027 73,516 0.0073,990,000 Floating (MYR 3 month KLIBOR) Fixed 2.250% MYR 17/06/2022 46,264 0.0078,930,000 Floating (MYR 3 month KLIBOR) Fixed 2.250% MYR 17/06/2022 49,411 0.00
Goldman Sachs Funds—Emerging Markets Debt Local PortfolioSchedule of InvestmentsAs at 30 November 2020
The accompanying notes are an integral part of these financial statements.
220

Swap Contracts – (Continued)
Net LocalNotionalAmount Pay Receive Currency Maturity Date
UnrealisedGainUSD
% ofShareholders’
Equity
Interest Rate Swaps – (Continued)72,640,000 Floating (MYR 3 month LIBOR) Fixed 2.250% MYR 17/06/2022 58,695 0.00126,910,000 Floating (MYR 3 month KLIBOR) Fixed 3.650% MYR 27/02/2024 1,545,206 0.09191,640,000 Floating (MYR 3 month KLIBOR) Fixed 3.693% MYR 01/03/2024 2,396,765 0.14202,350,000 Floating (MYR 3 month KLIBOR) Fixed 3.605% MYR 06/03/2024 2,413,945 0.1431,000,000 Floating (MYR 3 month KLIBOR) Fixed 3.330% MYR 31/05/2024 318,129 0.0211,670,000 Floating (MYR 3 month KLIBOR) Fixed 3.250% MYR 18/12/2024 120,797 0.0126,240,000 Floating (MYR 3 month KLIBOR) Fixed 3.250% MYR 18/12/2024 272,081 0.0240,600,000 Floating (MYR 3 month KLIBOR) Fixed 3.000% MYR 18/03/2025 318,988 0.0219,680,000 Floating (MYR 3 month LIBOR) Fixed 2.250% MYR 17/06/2025 9,672 0.00204,980,000 Floating (PLN 6 month WIBOR) Fixed 0.345% PLN 16/06/2023 12,624 0.00120,460,000 Floating (PLN 6 month WIBOR) Fixed 0.750% PLN 16/12/2025 204,074 0.015,040,000 Fixed 1.000% Floating (USD 3 month LIBOR) USD 16/12/2030 63,687 0.00
UNREALISED GAIN ON INTEREST RATE SWAPS 11,320,524 0.66
Credit Default Swaps10,310,000 Floating (Colombia Government
International Bond)Fixed 1.000% USD 20/06/2024 119,856 0.01
1,660,000 Floating (Qatar GovernmentInternational Bond)
Fixed 1.000% USD 20/06/2024 19,508 0.00
2,970,000 Floating (Colombia GovernmentInternational Bond)
Fixed 1.000% USD 20/12/2024 14,319 0.00
5,080,000 Floating (Peruvian GovernmentInternational Bond)
Fixed 1.000% USD 20/12/2024 26,207 0.00
9,220,000 Floating (Philippine GovernmentInternational Bond)
Fixed 1.000% USD 20/12/2024 60,352 0.00
11,510,000 Floating (Qatar GovernmentInternational Bond)
Fixed 1.000% USD 20/12/2024 74,487 0.01
2,510,000 Floating (Russian Foreign Bond -Eurobond)
Fixed 1.000% USD 20/12/2024 26,470 0.00
4,680,000 Floating (Saudi GovernmentInternational Bond)
Fixed 1.000% USD 20/12/2024 37,626 0.00
2,910,000 Floating (Russian Foreign Bond -Eurobond)
Fixed 1.000% USD 20/06/2025 49,320 0.00
3,920,000 Floating (Russian Foreign Bond -Eurobond)
Fixed 1.000% USD 20/12/2025 92,198 0.01
UNREALISED GAIN ON CREDIT DEFAULT SWAPS 520,343 0.03
TOTAL UNREALISED GAIN ON SWAP CONTRACTS 11,840,867 0.69
Net LocalNotionalAmount Pay Receive Currency Maturity Date
UnrealisedLossUSD
% ofShareholders’
Equity
Interest Rate Swaps289,800,000 Floating (BRL 1 month BRCDI) Fixed 4.230% BRL 02/01/2023 (412,055) (0.02)519,795,000 Floating (BRL 1 month BRCDI) Fixed 4.930% BRL 02/01/2024 (1,487,296) (0.09)
31,682,600,000 Floating (CLP 6 month LIBOR) Fixed 1.500% CLP 16/12/2025 (453,329) (0.03)344,030,000 Fixed 2.500% Floating (CNY 3 month LIBOR) CNY 17/03/2023 (58,182) (0.00)
182,511,310,000 Floating (COP 3 month LIBOR) Fixed 2.100% COP 16/12/2022 (49,905) (0.00)93,126,450,000 Fixed 3.400% Floating (COP 3 month LIBOR) COP 16/12/2025 (291,730) (0.02)249,480,000 Floating (CZK 6 month PRIBOR) Fixed 0.620% CZK 16/06/2023 (36,107) (0.00)52,840,000 Fixed 0.000% Floating (EUR 6 month LIBOR) EUR 16/12/2025 (244,462) (0.02)1,030,000 Fixed 0.000% Floating (EUR 6 month LIBOR) EUR 16/12/2027 (5,386) (0.00)8,310,000 Fixed 0.000% Floating (EUR 6 month LIBOR) EUR 16/12/2030 (72,411) (0.00)
599,410,000 Fixed 0.250% Floating (PLN 3 month WIBOR) PLN 16/12/2021 (70,917) (0.00)220,000 Fixed 1.250% Floating (THB 6 month LIBOR) THB 17/06/2025 (32) (0.00)
1,460,300,000 Floating (THB 6 month LIBOR) Fixed 0.750% THB 16/12/2025 (80,421) (0.01)532,910,000 Floating (THB 6 month LIBOR) Fixed 0.750% THB 17/03/2026 (64,574) (0.00)797,860,000 Floating (ZAR 3 month JIBAR) Fixed 4.000% ZAR 16/06/2023 (360,385) (0.02)586,490,000 Floating (ZAR 3 month JIBAR) Fixed 5.250% ZAR 17/03/2026 (458,085) (0.03)
UNREALISED LOSS ON INTEREST RATE SWAPS (4,145,277) (0.24)
Credit Default Swaps10,520,000 Fixed 1.000% Floating (China Government
International Bond)USD 20/12/2020 (5,963) (0.00)
6,470,000 Fixed 1.000% Floating (China GovernmentInternational Bond)
USD 20/12/2020 (3,967) (0.00)
5,180,000 Fixed 1.000% Floating (China GovernmentInternational Bond)
USD 20/12/2020 (3,290) (0.00)
14,910,000 Fixed 1.000% Floating (China GovernmentInternational Bond)
USD 20/12/2020 (9,721) (0.00)
Goldman Sachs Funds—Emerging Markets Debt Local PortfolioSchedule of InvestmentsAs at 30 November 2020
The accompanying notes are an integral part of these financial statements.
221

Swap Contracts – (Continued)
Net LocalNotionalAmount Pay Receive Currency Maturity Date
UnrealisedLossUSD
% ofShareholders’
Equity
Credit Default Swaps – (Continued)18,180,000 Fixed 1.000% Floating (China Government
International Bond)USD 20/12/2020 (11,941) (0.00)
13,210,000 Fixed 1.000% Floating (China GovernmentInternational Bond)
USD 20/12/2020 (8,421) (0.00)
4,500,000 Fixed 1.000% Floating (China GovernmentInternational Bond)
USD 20/12/2020 (2,936) (0.00)
7,250,000 Fixed 1.000% Floating (China GovernmentInternational Bond)
USD 20/12/2020 (4,661) (0.00)
460,000 Fixed 1.000% Floating (China GovernmentInternational Bond)
USD 20/12/2020 (281) (0.00)
2,720,000 Fixed 1.000% Floating (China GovernmentInternational Bond)
USD 20/12/2020 (1,615) (0.00)
3,420,000 Fixed 1.000% Floating (China GovernmentInternational Bond)
USD 20/12/2020 (1,981) (0.00)
2,170,000 Fixed 1.000% Floating (People’s Republic of China) USD 20/12/2020 (1,273) (0.00)1,720,000 Fixed 1.000% Floating (People’s Republic of China) USD 20/12/2020 (988) (0.00)770,000 Fixed 1.000% Floating (China Government
International Bond)USD 20/06/2021 (4,819) (0.00)
6,030,000 Fixed 1.000% Floating (China GovernmentInternational Bond)
USD 20/06/2021 (37,684) (0.01)
630,000 Fixed 1.000% Floating (China GovernmentInternational Bond)
USD 20/06/2021 (3,974) (0.00)
1,680,000 Fixed 1.000% Floating (China GovernmentInternational Bond)
USD 20/06/2021 (10,555) (0.00)
4,530,000 Fixed 1.000% Floating (China GovernmentInternational Bond)
USD 20/06/2021 (29,263) (0.00)
370,000 Fixed 1.000% Floating (China GovernmentInternational Bond)
USD 20/06/2021 (2,420) (0.00)
1,630,000 Fixed 1.000% Floating (China GovernmentInternational Bond)
USD 20/06/2021 (10,655) (0.00)
5,620,000 Fixed 1.000% Floating (China GovernmentInternational Bond)
USD 20/06/2021 (36,179) (0.01)
2,360,000 Fixed 1.000% Floating (China GovernmentInternational Bond)
USD 20/06/2021 (14,829) (0.00)
10,310,000 Fixed 1.000% Floating (China GovernmentInternational Bond)
USD 20/06/2021 (65,179) (0.01)
4,140,000 Fixed 1.000% Floating (China GovernmentInternational Bond)
USD 20/06/2021 (26,392) (0.00)
4,450,000 Fixed 1.000% Floating (China GovernmentInternational Bond)
USD 20/06/2021 (28,083) (0.00)
3,560,000 Fixed 1.000% Floating (China GovernmentInternational Bond)
USD 20/06/2021 (20,729) (0.00)
1,550,000 Fixed 1.000% Floating (China GovernmentInternational Bond)
USD 20/06/2021 (9,025) (0.00)
2,730,000 Fixed 1.000% Floating (China GovernmentInternational Bond)
USD 20/06/2021 (15,473) (0.00)
5,220,000 Fixed 1.000% Floating (China GovernmentInternational Bond)
USD 20/06/2021 (29,519) (0.00)
2,250,000 Fixed 1.000% Floating (China GovernmentInternational Bond)
USD 20/06/2021 (12,224) (0.00)
1,580,000 Fixed 1.000% Floating (China GovernmentInternational Bond)
USD 20/06/2021 (8,687) (0.00)
2,840,000 Fixed 1.000% Floating (China GovernmentInternational Bond)
USD 20/06/2021 (15,615) (0.00)
4,070,000 Fixed 1.000% Floating (China GovernmentInternational Bond)
USD 20/06/2021 (21,368) (0.00)
5,430,000 Fixed 1.000% Floating (China GovernmentInternational Bond)
USD 20/06/2021 (26,727) (0.00)
5,350,000 Fixed 1.000% Floating (China GovernmentInternational Bond)
USD 20/06/2021 (27,879) (0.00)
7,410,000 Fixed 1.000% Floating (China GovernmentInternational Bond)
USD 20/06/2022 (81,870) (0.01)
Goldman Sachs Funds—Emerging Markets Debt Local PortfolioSchedule of InvestmentsAs at 30 November 2020
The accompanying notes are an integral part of these financial statements.
222

Swap Contracts – (Continued)
Net LocalNotionalAmount Pay Receive Currency Maturity Date
UnrealisedLossUSD
% ofShareholders’
Equity
Credit Default Swaps – (Continued)2,210,000 Fixed 1.000% Floating (China Government
International Bond)USD 20/06/2022 (21,570) (0.00)
590,000 Floating (Ukraine GovernmentInternational Bond)
Fixed 5.000% USD 20/12/2024 (32,334) (0.00)
UNREALISED LOSS ON CREDIT DEFAULT SWAPS (650,090) (0.04)
TOTAL UNREALISED LOSS ON SWAP CONTRACTS (4,795,367) (0.28)
MARKET VALUE OF INVESTMENTS(cost USD 1,671,491,667)
1,673,087,789 97.56
OTHER ASSETS AND LIABILITIES 41,914,198 2.44
SHAREHOLDERS’ EQUITY 1,715,001,987 100.00
TOTAL INVESTMENTSMarket Value
USD
% ofShareholders’
Equity
Total Investments excluding derivatives (cost USD 1,671,274,961) 1,643,438,063 95.83Unrealised gain on futures contracts 140,286 0.01Unrealised loss on futures contracts (12,881) (0.00)Unrealised gain on non-deliverable bond forward contracts 516,563 0.03Unrealised gain on forward currency contracts 61,095,179 3.56Unrealised loss on forward currency contracts (40,013,255) (2.33)Market value of purchased options (cost USD 500,182) 1,417,722 0.08Market value of written options (cost USD (283,476)) (539,388) (0.03)Unrealised gain on swap contracts 11,840,867 0.69Unrealised loss on swap contracts (4,795,367) (0.28)Other Assets and Liabilities 41,914,198 2.44
Shareholders’ Equity 1,715,001,987 100.00
The Futures Commission Merchant was Goldman Sachs & Co. LLC.
The counterparties for forward currency contracts were Bank of America N.A., Barclays Bank Plc., BNP Paribas S.A., Citibank N.A., Credit Suisse International, Deutsche Bank AG, HSBCBank Plc., JP Morgan Chase Bank N.A., Merrill Lynch International, Morgan Stanley & Co. International Plc., Natwest Markets Plc., Royal Bank of Canada, Standard Chartered Bank,State Street Bank & Trust and UBS AG.
The counterparties for options contracts were BNP Paribas S.A., Citibank N.A., JP Morgan Chase Bank N.A., Morgan Stanley & Co. International Plc. and UBS AG.
The counterparties for swap contracts were Bank of America N.A., Barclays Capital, Inc., BNP Paribas S.A., Citibank N.A., Credit Suisse, Deutsche Bank AG, HSBC Bank Plc., JP MorganChase Bank N.A., Morgan Stanley and Morgan Stanley & Co. International Plc.
The maximum individual counterparty exposure as at 30 November 2020 is 0.57% of the NAV.
(a) Interest rates represent either the stated coupon rate, annualised discounted yield on date of purchase for discounted securities, or, for floating rate securities, the current reset ratewhich is based upon interest rates indices.
(b) Maturity dates represent either the stated date on the security, or the next interest reset date for floating rate securities or the prerefunded date for those type of securities.(c) This security has a step up coupon which moves to the second rate at a set date in the future.(d) Variable and floating coupon rates are those quoted as of 30 November 2020.(e) 144A: This security is issued to qualified institutional investors, pursuant to private placements, and is transferable as stated in rule 144A of the US Securities Act of 1933.(f) A related party to Goldman Sachs Funds.(g) The yield for this fund as at 30 November 2020 was 0.120%.
Goldman Sachs Funds—Emerging Markets Debt Local PortfolioSchedule of InvestmentsAs at 30 November 2020
The accompanying notes are an integral part of these financial statements.
223

Holdings Security Description Currency Interest Rate(a) Maturity Date(b)Market Value
USD
% ofShareholders’
Equity
Transferable securities admitted to an official exchange listing
Bonds – 87.99%Albania
12,320,000 Albania Government International Bond EUR 3.500% 16/06/2027 15,757,528 0.24
Angola29,650,000 Angolan Government International Bond USD 8.250% 09/05/2028 26,610,875 0.4111,909,000 Angolan Government International Bond USD 8.000% 26/11/2029 10,442,704 0.164,730,000 Angolan Government International Bond USD 9.375% 08/05/2048 4,160,922 0.0624,920,000 Angolan Government International Bond USD 9.125% 26/11/2049 21,474,031 0.33
62,688,532 0.96
Argentina471,785 Argentina Government International Bond EUR 0.500% 09/07/2029 215,053 0.00
6,392,562 Argentina Government International Bond USD 1.000% 09/07/2029 2,755,194 0.04100,121,473 Argentina Government International Bond(c) USD 0.125% 09/07/2030 39,397,800 0.6114,132,900 Argentina Government International Bond EUR 0.125% 09/07/2030 6,234,510 0.10115,415,914 Argentina Government International Bond(c) USD 0.125% 09/07/2035 41,261,189 0.6345,155,235 Argentina Government International Bond(c) USD 0.125% 09/07/2041 16,741,303 0.26425,475 Argentina Government International Bond(c) USD 0.125% 09/07/2046 154,554 0.00
106,759,603 1.64
Armenia9,710,000 Armenia International Bond USD 3.950% 26/09/2029 9,449,044 0.15
Azerbaijan10,969,000 Azerbaijan International Bond USD 4.750% 18/03/2024 11,973,349 0.1843,610,000 Azerbaijan International Bond USD 3.500% 01/09/2032 45,306,702 0.702,340,000 State Oil Co. of the Azerbaijan Republic USD 4.750% 13/03/2023 2,497,716 0.045,190,000 State Oil Co. of the Azerbaijan Republic USD 6.950% 18/03/2030 6,534,534 0.10
66,312,301 1.02
Bahrain8,620,000 Bahrain Government International Bond USD 7.000% 12/10/2028 9,914,347 0.151,130,000 Bahrain Government International Bond USD 6.750% 20/09/2029 1,286,081 0.0241,920,000 Bahrain Government International Bond USD 7.375% 14/05/2030 49,138,100 0.7622,760,000 Bahrain Government International Bond USD 5.625% 30/09/2031 23,887,331 0.3732,230,000 Bahrain Government International Bond USD 5.450% 16/09/2032 33,519,200 0.514,460,000 Bahrain Government International Bond USD 6.000% 19/09/2044 4,540,838 0.0712,340,000 CBB International Sukuk Programme Co. SPC USD 3.950% 16/09/2027 12,772,517 0.20
135,058,414 2.08
Belarus5,180,000 Belarus International Bond USD 7.625% 29/06/2027 5,579,831 0.096,680,000 Belarus International Bond USD 6.200% 28/02/2030 6,736,363 0.1023,950,000 Republic of Belarus Ministry of Finance �T� USD 6.378% 24/02/2031 24,189,500 0.37
36,505,694 0.56
Belize4,242,704 Belize Government International Bond(d) USD 4.938% 20/02/2034 1,951,644 0.033,519,266 Belize Government International Bond 144A(d)(e) USD 4.938% 20/02/2034 1,618,862 0.03
3,570,506 0.06
Bermuda9,050,000 Bermuda Government International Bond USD 2.375% 20/08/2030 9,430,100 0.148,920,000 Bermuda Government International Bond USD 3.375% 20/08/2050 9,494,225 0.15
18,924,325 0.29
Bolivia2,160,000 Bolivian Government International Bond USD 4.500% 20/03/2028 1,968,975 0.03
Brazil21,900,000 Banco do Brasil S.A.(d) USD 6.250% Perp. 22,068,630 0.347,280,000 Brazilian Government International Bond USD 5.000% 27/01/2045 8,061,463 0.124,000,000 Brazilian Government International Bond USD 4.750% 14/01/2050 4,244,375 0.077,860,000 BRF S.A. USD 5.750% 21/09/2050 8,271,422 0.1312,255,000 Samarco Mineracao S.A. USD 4.125% 01/11/2022 7,427,679 0.1110,300,000 Samarco Mineracao S.A. USD 5.750% 24/10/2023 6,292,656 0.10
56,366,225 0.87
Goldman Sachs Funds—Emerging Markets Debt PortfolioSchedule of InvestmentsAs at 30 November 2020
The accompanying notes are an integral part of these financial statements.
224

Holdings Security Description Currency Interest Rate(a) Maturity Date(b)Market Value
USD
% ofShareholders’
Equity
Bonds – (Continued)British Virgin Islands
10,900,000 Central American Bottling Corp. USD 5.750% 31/01/2027 11,603,391 0.181,340,000 Contemporary Ruiding Development Ltd. USD 2.625% 17/09/2030 1,358,844 0.021,390,000 Easy Tactic Ltd. USD 5.875% 13/02/2023 1,212,059 0.022,470,000 Easy Tactic Ltd. USD 8.625% 27/02/2024 2,176,302 0.03420,000 Easy Tactic Ltd. USD 8.625% 05/03/2024 370,781 0.01
4,000,000 Fortune Star BVI Ltd. USD 6.850% 02/07/2024 4,215,000 0.063,900,000 Fortune Star BVI Ltd. USD 5.950% 19/10/2025 3,997,500 0.061,870,000 FPC Resources Ltd. USD 4.375% 11/09/2027 1,941,294 0.0312,360,000 Huarong Finance 2017 Co., Ltd.(d) USD 4.000% Perp. 12,556,987 0.197,260,000 Huarong Finance 2019 Co., Ltd. USD 3.875% 13/11/2029 7,695,600 0.1232,110,000 Huarong Finance 2019 Co., Ltd. USD 3.375% 24/02/2030 32,877,630 0.511,860,000 Joy Treasure Assets Holdings, Inc. USD 2.750% 17/11/2030 1,876,166 0.031,570,000 Sino-Ocean Land Treasure IV Ltd. USD 4.750% 14/01/2030 1,632,800 0.032,090,000 Studio City Finance Ltd. USD 6.000% 15/07/2025 2,204,950 0.03700,000 Studio City Finance Ltd. USD 6.500% 15/01/2028 745,500 0.01
4,540,000 Sunny Express Enterprises Corp.(d) USD 3.350% Perp. 4,613,775 0.07
91,078,579 1.40
Cayman Islands200,000 Agile Group Holdings Ltd.(d) USD 7.875% Perp. 206,781 0.00
2,900,000 Country Garden Holdings Co., Ltd. USD 3.875% 22/10/2030 2,932,625 0.054,580,000 DP World Crescent Ltd. USD 4.848% 26/09/2028 5,232,650 0.086,920,000 DP World Crescent Ltd. USD 3.875% 18/07/2029 7,430,350 0.116,890,000 DP World Crescent Ltd. USD 3.750% 30/01/2030 7,329,238 0.1130,820,000 DP World Salaam(d) USD 6.000% Perp. 33,536,012 0.5210,480,000 Dubai DOF Sukuk Ltd. USD 2.763% 09/09/2030 10,624,100 0.16360,000 Fantasia Holdings Group Co., Ltd. USD 9.250% 28/07/2023 355,781 0.01
2,710,000 Fantasia Holdings Group Co., Ltd. USD 9.875% 19/10/2023 2,706,613 0.0415,120,000 Grupo Aval Ltd. USD 4.375% 04/02/2030 15,660,540 0.241,100,000 Kaisa Group Holdings Ltd. USD 11.500% 30/01/2023 1,139,359 0.02860,000 Kaisa Group Holdings Ltd. USD 10.875% 23/07/2023 882,172 0.01710,000 Kaisa Group Holdings Ltd. USD 11.950% 12/11/2023 742,172 0.01
2,000,000 Kaisa Group Holdings Ltd. USD 11.250% 16/04/2025 1,999,688 0.038,950,000 Meituan Dianping �B� USD 3.050% 28/10/2030 9,279,305 0.143,050,000 Mumtalakat Sukuk Holding Co. USD 4.100% 21/01/2027 3,090,508 0.0522,890,000 Sharjah Sukuk Program Ltd. USD 4.226% 14/03/2028 25,586,728 0.396,784,000 Sharjah Sukuk Program Ltd. USD 3.234% 23/10/2029 7,110,480 0.1112,990,000 Sharjah Sukuk Program Ltd.—Series NOV USD 3.234% 23/10/2029 13,631,381 0.214,350,000 Sunac China Holdings Ltd. USD 8.350% 19/04/2023 4,560,703 0.074,710,000 Yuzhou Group Holdings Co., Ltd. USD 7.700% 20/02/2025 4,919,006 0.08380,000 Zhenro Properties Group Ltd. USD 8.350% 10/03/2024 389,975 0.01
3,540,000 Zhenro Properties Group Ltd.(d) USD 10.250% Perp. 3,641,222 0.06
162,987,389 2.51
Chile7,310,000 Corp Nacional del Cobre de Chile USD 3.150% 14/01/2030 7,955,336 0.123,070,000 Corp Nacional del Cobre de Chile USD 3.750% 15/01/2031 3,476,775 0.052,810,000 Empresa de los Ferrocarriles del Estado USD 3.068% 18/08/2050 2,730,530 0.042,870,000 Empresa de Transporte de Pasajeros Metro S.A. USD 3.650% 07/05/2030 3,203,638 0.055,170,000 GNL Quintero S.A. USD 4.634% 31/07/2029 5,698,309 0.09
23,064,588 0.35
Colombia220,000 Banco de Bogota S.A. USD 5.375% 19/02/2023 234,438 0.00
37,400,000 Banco de Bogota S.A. USD 6.250% 12/05/2026 42,566,810 0.662,350,000 Colombia Government International Bond USD 3.875% 25/04/2027 2,583,825 0.042,290,000 Colombia Government International Bond USD 4.500% 15/03/2029 2,615,967 0.0413,550,000 Colombia Government International Bond USD 3.000% 30/01/2030 14,100,469 0.2225,330,000 Colombia Government International Bond USD 3.125% 15/04/2031 26,653,492 0.4117,780,000 Colombia Government International Bond USD 5.000% 15/06/2045 21,524,912 0.3353,360,000 Colombia Government International Bond USD 4.125% 15/05/2051 58,549,260 0.90
168,829,173 2.60
Costa Rica5,120,000 Costa Rica Government International Bond USD 6.125% 19/02/2031 4,499,200 0.07
Croatia17,930,000 Croatia Government International Bond EUR 1.500% 17/06/2031 23,201,680 0.36
Cyprus9,720,000 MHP S.E. USD 7.750% 10/05/2024 10,637,325 0.16
Goldman Sachs Funds—Emerging Markets Debt PortfolioSchedule of InvestmentsAs at 30 November 2020
The accompanying notes are an integral part of these financial statements.
225

Holdings Security Description Currency Interest Rate(a) Maturity Date(b)Market Value
USD
% ofShareholders’
Equity
Bonds – (Continued)Dominican Republic
15,000,000 Aeropuertos Dominicanos Siglo XXI S.A. USD 6.750% 30/03/2029 15,239,062 0.232,267,000 Dominican Republic International Bond USD 7.500% 06/05/2021 2,326,155 0.035,150,000 Dominican Republic International Bond USD 6.600% 28/01/2024 5,735,813 0.0928,290,000 Dominican Republic International Bond USD 5.875% 18/04/2024 30,305,662 0.477,350,000 Dominican Republic International Bond USD 6.875% 29/01/2026 8,539,781 0.13339,000 Dominican Republic International Bond USD 8.625% 20/04/2027 416,493 0.01
97,500,000 Dominican Republic International Bond DOP 18.500% 04/02/2028 2,581,424 0.049,030,000 Dominican Republic International Bond USD 4.500% 30/01/2030 9,519,595 0.1543,060,000 Dominican Republic International Bond USD 6.850% 27/01/2045 50,205,269 0.7751,720,000 Dominican Republic International Bond USD 6.500% 15/02/2048 58,290,056 0.9019,210,000 Dominican Republic International Bond USD 6.400% 05/06/2049 21,386,133 0.339,920,000 Dominican Republic International Bond USD 5.875% 30/01/2060 10,392,750 0.16
214,938,193 3.31
Ecuador3,544,187 Ecuador Government International Bond(c) USD 0.500% 31/07/2030 2,254,989 0.0316,822,312 Ecuador Government International Bond USD 8.485% 31/07/2030 7,527,984 0.1287,463,048 Ecuador Government International Bond(c) USD 0.500% 31/07/2035 48,050,012 0.7460,897,141 Ecuador Government International Bond(c) USD 0.500% 31/07/2040 30,144,085 0.46
87,977,070 1.35
Egypt15,510,000 Egypt Government International Bond EUR 4.750% 11/04/2025 18,913,165 0.2930,450,000 Egypt Government International Bond EUR 4.750% 16/04/2026 36,897,266 0.571,840,000 Egypt Government International Bond USD 6.588% 21/02/2028 1,974,837 0.0364,220,000 Egypt Government International Bond EUR 5.625% 16/04/2030 77,817,484 1.2025,638,000 Egypt Government International Bond EUR 6.375% 11/04/2031 31,599,798 0.4828,890,000 Egypt Government International Bond USD 7.625% 29/05/2032 31,679,691 0.494,562,000 Egypt Government International Bond USD 8.500% 31/01/2047 4,956,898 0.0819,960,000 Egypt Government International Bond USD 8.875% 29/05/2050 22,264,756 0.344,940,000 Egypt Government International Bond USD 8.150% 20/11/2059 5,161,528 0.08
231,265,423 3.56
El Salvador27,500,000 El Salvador Government International Bond USD 9.500% 15/07/2052 26,107,812 0.40
Gabon8,105,079 Gabon Government International Bond USD 6.375% 12/12/2024 8,200,061 0.1313,460,000 Gabon Government International Bond USD 6.625% 06/02/2031 13,295,956 0.20
21,496,017 0.33
Ghana4,810,000 Ghana Government International Bond USD 6.375% 11/02/2027 4,854,342 0.07360,000 Ghana Government International Bond USD 7.625% 16/05/2029 369,056 0.01
4,080,000 Ghana Government International Bond USD 10.750% 14/10/2030 5,296,350 0.0829,590,000 Ghana Government International Bond USD 8.125% 26/03/2032 30,228,035 0.4714,448,000 Ghana Government International Bond USD 8.627% 16/06/2049 14,172,585 0.222,789,000 Ghana Government International Bond USD 8.950% 26/03/2051 2,780,720 0.041,630,000 Ghana Government International Bond USD 8.750% 11/03/2061 1,605,550 0.02
59,306,638 0.91
Guatemala31,615,000 Guatemala Government Bond USD 4.500% 03/05/2026 34,653,004 0.5334,690,000 Guatemala Government Bond USD 4.375% 05/06/2027 38,229,464 0.5912,089,000 Guatemala Government Bond USD 4.875% 13/02/2028 13,736,126 0.216,660,000 Guatemala Government Bond USD 4.900% 01/06/2030 7,660,041 0.1228,690,000 Guatemala Government Bond USD 6.125% 01/06/2050 36,745,614 0.57
131,024,249 2.02
Honduras39,026,000 Honduras Government International Bond USD 8.750% 16/12/2020 39,121,614 0.6023,309,000 Honduras Government International Bond USD 7.500% 15/03/2024 25,887,558 0.405,570,000 Honduras Government International Bond USD 5.625% 24/06/2030 6,291,489 0.10
71,300,661 1.10
Hong Kong1,510,000 Bank of East Asia Ltd.(d) USD 5.825% Perp. 1,576,440 0.0214,990,000 CNAC HK Finbridge Co., Ltd. USD 3.875% 19/06/2029 15,301,511 0.24
Goldman Sachs Funds—Emerging Markets Debt PortfolioSchedule of InvestmentsAs at 30 November 2020
The accompanying notes are an integral part of these financial statements.
226

Holdings Security Description Currency Interest Rate(a) Maturity Date(b)Market Value
USD
% ofShareholders’
Equity
Bonds – (Continued)Hong Kong – (Continued)
19,630,000 CNAC HK Finbridge Co., Ltd. USD 3.000% 22/09/2030 18,677,208 0.29540,000 Wanda Group Overseas Ltd. USD 8.875% 21/03/2023 513,000 0.01
36,068,159 0.56
Hungary9,310,000 Hungary Government International Bond EUR 1.750% 05/06/2035 12,321,235 0.19780,000 Hungary Government International Bond USD 7.625% 29/03/2041 1,394,128 0.02
4,620,000 Hungary Government International Bond EUR 1.500% 17/11/2050 5,501,160 0.09
19,216,523 0.30
India350,000 Adani Electricity Mumbai Ltd. USD 3.949% 12/02/2030 368,211 0.01
Indonesia3,860,000 Indonesia Asahan Aluminium Persero PT USD 5.800% 15/05/2050 4,780,972 0.0720,253,000 Indonesia Government International Bond EUR 3.750% 14/06/2028 29,274,854 0.451,800,000 Indonesia Government International Bond USD 6.625% 17/02/2037 2,590,313 0.049,070,000 Indonesia Government International Bond USD 4.625% 15/04/2043 11,154,683 0.175,560,000 Indonesia Government International Bond USD 4.350% 11/01/2048 6,767,563 0.118,960,000 Indonesia Government International Bond USD 3.500% 14/02/2050 9,858,800 0.1537,520,000 Indonesia Government International Bond USD 4.450% 15/04/2070 46,554,112 0.726,000,000 Pelabuhan Indonesia II PT USD 5.375% 05/05/2045 7,241,250 0.114,500,000 Pertamina Persero PT USD 4.700% 30/07/2049 5,143,359 0.0813,770,000 Pertamina Persero PT USD 4.175% 21/01/2050 14,931,844 0.2359,710,000 Perusahaan Penerbit SBSN Indonesia III USD 4.400% 01/03/2028 70,065,953 1.0825,790,000 Perusahaan Penerbit SBSN Indonesia III USD 4.450% 20/02/2029 30,569,209 0.472,380,000 Perusahaan Penerbit SBSN Indonesia III USD 3.800% 23/06/2050 2,642,544 0.04
241,575,456 3.72
Iraq693,750 Iraq International Bond USD 5.800% 15/01/2028 640,960 0.01
Ireland6,920,000 Credit Bank of Moscow Via CBOM Finance Plc.(d) USD 7.500% 05/10/2027 6,954,600 0.119,668,000 Credit Bank of Moscow Via CBOM Finance Plc.(d) USD 8.875% Perp. 9,640,809 0.15
16,595,409 0.26
Isle Of Man800,000 Sasol Financing International Ltd. USD 4.500% 14/11/2022 809,000 0.01
Israel32,670,000 Israel Government International Bond USD 3.800% 13/05/2060 38,724,159 0.602,160,000 Israel Government International Bond USD 4.500% 03/04/2120 2,872,800 0.0411,070,000 Leviathan Bond Ltd. 144A(e) USD 5.750% 30/06/2023 11,678,850 0.185,640,000 Leviathan Bond Ltd. 144A(e) USD 6.750% 30/06/2030 6,204,000 0.10
59,479,809 0.92
Ivory Coast11,370,000 Ivory Coast Government International Bond EUR 5.250% 22/03/2030 14,397,545 0.225,700,000 Ivory Coast Government International Bond EUR 4.875% 30/01/2032 6,837,435 0.111,770,000 Ivory Coast Government International Bond USD 6.125% 15/06/2033 1,951,702 0.0318,710,000 Ivory Coast Government International Bond EUR 6.625% 22/03/2048 24,154,902 0.37
47,341,584 0.73
Jamaica32,318,000 Jamaica Government International Bond USD 7.875% 28/07/2045 43,765,642 0.67
Japan6,570,000 SoftBank Group Corp.(d) USD 6.000% Perp. 6,438,600 0.10
Jersey3,060,000 Galaxy Pipeline Assets Bidco Ltd. USD 2.625% 31/03/2036 3,170,925 0.058,720,000 Galaxy Pipeline Assets Bidco Ltd. USD 3.250% 30/09/2040 9,052,450 0.14
12,223,375 0.19
Jordan14,040,000 Jordan Government International Bond USD 5.850% 07/07/2030 15,057,900 0.23
Kazakhstan28,580,000 KazMunayGas National Co., JSC USD 4.750% 19/04/2027 32,992,037 0.51
Goldman Sachs Funds—Emerging Markets Debt PortfolioSchedule of InvestmentsAs at 30 November 2020
The accompanying notes are an integral part of these financial statements.
227

Holdings Security Description Currency Interest Rate(a) Maturity Date(b)Market Value
USD
% ofShareholders’
Equity
Bonds – (Continued)Kazakhstan – (Continued)
11,680,000 KazMunayGas National Co., JSC USD 3.500% 14/04/2033 12,722,440 0.19510,000 KazMunayGas National Co., JSC USD 5.750% 19/04/2047 674,236 0.01
46,388,713 0.71
Kenya15,562,000 Kenya Government International Bond USD 6.875% 24/06/2024 16,845,865 0.2621,710,000 Kenya Government International Bond USD 7.000% 22/05/2027 23,663,900 0.362,350,000 Kenya Government International Bond USD 7.250% 28/02/2028 2,586,469 0.0419,130,000 Kenya Government International Bond USD 8.000% 22/05/2032 21,873,959 0.34
64,970,193 1.00
Lebanon8,810,000 Lebanon Government International Bond USD 6.650% 22/04/2024 1,189,350 0.0217,763,000 Lebanon Government International Bond USD 6.200% 26/02/2025 2,398,005 0.04650,000 Lebanon Government International Bond USD 6.600% 27/11/2026 87,750 0.00
3,680,000 Lebanon Government International Bond USD 6.850% 23/03/2027 496,800 0.0118,708,000 Lebanon Government International Bond USD 6.750% 29/11/2027 2,525,580 0.043,780,000 Lebanon Government International Bond USD 6.650% 03/11/2028 510,300 0.0134,469,000 Lebanon Government International Bond USD 6.850% 25/05/2029 4,653,315 0.0750,587,000 Lebanon Government International Bond USD 6.650% 26/02/2030 6,829,245 0.107,853,000 Lebanon Government International Bond USD 7.050% 02/11/2035 1,060,155 0.01
19,750,500 0.30
Luxembourg2,500,000 Altice Financing S.A. USD 7.500% 15/05/2026 2,634,375 0.041,870,000 MHP Lux S.A. USD 6.950% 03/04/2026 1,983,661 0.03
4,618,036 0.07
Macedonia10,400,000 North Macedonia Government International Bond EUR 5.625% 26/07/2023 13,937,271 0.2139,690,000 North Macedonia Government International Bond EUR 2.750% 18/01/2025 50,213,816 0.7711,500,000 North Macedonia Government International Bond EUR 3.675% 03/06/2026 15,269,146 0.24
79,420,233 1.22
Malaysia1,100,000 Axiata Spv5 Labuan Ltd. USD 3.064% 19/08/2050 1,107,391 0.0117,240,000 Petronas Capital Ltd. USD 4.550% 21/04/2050 23,265,919 0.367,910,000 Petronas Capital Ltd. USD 4.800% 21/04/2060 11,625,228 0.18
35,998,538 0.55
Mauritius4,510,000 Greenko Investment Co. USD 4.875% 16/08/2023 4,591,039 0.0713,730,000 MTN Mauritius Investments Ltd. USD 5.373% 13/02/2022 14,133,319 0.227,280,000 MTN Mauritius Investments Ltd. USD 4.755% 11/11/2024 7,588,262 0.12758,000 MTN Mauritius Investments Ltd. USD 6.500% 13/10/2026 861,278 0.01
27,173,898 0.42
Mexico25,400,000 Banco Mercantil del Norte S.A.(d) USD 6.750% Perp. 26,828,750 0.418,300,000 Banco Mercantil del Norte S.A.(d) USD 7.500% Perp. 9,001,610 0.14800,000 Banco Mercantil del Norte S.A.(d) USD 7.625% Perp. 870,000 0.01
3,970,000 Banco Santander Mexico S.A. Institucion de Banca Multiple GrupoFinanciero Santander(d) USD 5.950% 01/10/2028 4,310,552 0.07
6,060,000 Gruma SAB de CV USD 4.875% 01/12/2024 6,807,084 0.115,543,000 Mexico City Airport Trust USD 5.500% 31/10/2046 5,368,049 0.0844,620,000 Mexico City Airport Trust USD 5.500% 31/07/2047 43,323,231 0.672,405,000 Mexico City Airport Trust 144A(e) USD 4.250% 31/10/2026 2,403,873 0.0425,070,000 Mexico City Airport Trust 144A(e) USD 3.875% 30/04/2028 24,176,881 0.379,725,000 Mexico City Airport Trust 144A(e) USD 5.500% 31/10/2046 9,418,055 0.158,108,000 Mexico City Airport Trust 144A(e) USD 5.500% 31/07/2047 7,872,361 0.125,260,000 Mexico Government International Bond EUR 1.350% 18/09/2027 6,443,712 0.109,440,000 Mexico Government International Bond USD 4.500% 22/04/2029 10,934,175 0.1733,770,000 Mexico Government International Bond USD 2.659% 24/05/2031 33,888,195 0.5215,010,000 Mexico Government International Bond USD 4.750% 27/04/2032 17,749,325 0.2710,580,000 Mexico Government International Bond USD 4.750% 08/03/2044 12,214,610 0.192,350,000 Mexico Government International Bond USD 4.600% 23/01/2046 2,679,000 0.047,290,000 Mexico Government International Bond USD 4.350% 15/01/2047 8,077,092 0.121,396,000 Mexico Government International Bond USD 4.500% 31/01/2050 1,587,514 0.0231,492,000 Mexico Government International Bond USD 5.000% 27/04/2051 38,010,844 0.59
Goldman Sachs Funds—Emerging Markets Debt PortfolioSchedule of InvestmentsAs at 30 November 2020
The accompanying notes are an integral part of these financial statements.
228

Holdings Security Description Currency Interest Rate(a) Maturity Date(b)Market Value
USD
% ofShareholders’
Equity
Bonds – (Continued)Mexico – (Continued)
46,090,000 Mexico Government International Bond USD 3.771% 24/05/2061 45,974,775 0.7148,580,000 Petroleos Mexicanos EUR 5.125% 15/03/2023 59,995,044 0.9229,570,000 Petroleos Mexicanos EUR 3.750% 21/02/2024 35,298,880 0.543,240,000 Petroleos Mexicanos USD 6.875% 16/10/2025 3,380,065 0.052,890,000 Petroleos Mexicanos EUR 4.750% 26/02/2029 3,361,073 0.05900,000 Petroleos Mexicanos USD 6.750% 21/09/2047 777,825 0.01
4,772,000 Petroleos Mexicanos USD 6.350% 12/02/2048 4,006,094 0.0616,829,000 Petroleos Mexicanos USD 7.690% 23/01/2050 15,611,422 0.2411,821,000 Petroleos Mexicanos USD 6.950% 28/01/2060 10,204,478 0.16
450,574,569 6.93
Mongolia5,037,000 Mongolia Government International Bond USD 5.125% 05/12/2022 5,237,693 0.0814,670,000 Mongolia Government International Bond USD 5.625% 01/05/2023 15,506,648 0.2410,380,000 Mongolia Government International Bond USD 5.125% 07/04/2026 10,989,825 0.17
31,734,166 0.49
Morocco13,290,000 Morocco Government International Bond EUR 1.500% 27/11/2031 15,359,139 0.24
Mozambique10,270,000 Mozambique International Bond(c) USD 5.000% 15/09/2031 9,032,786 0.14
Netherlands2,580,000 Bharti Airtel International Netherlands BV USD 5.125% 11/03/2023 2,760,600 0.04270,000 Bharti Airtel International Netherlands BV USD 5.350% 20/05/2024 297,886 0.01
4,720,000 Greenko Dutch BV USD 4.875% 24/07/2022 4,773,100 0.072,600,000 IHS Netherlands Holdco BV USD 7.125% 18/03/2025 2,740,562 0.042,490,000 IHS Netherlands Holdco BV USD 8.000% 18/09/2027 2,703,206 0.042,220,000 Lukoil International Finance BV USD 4.750% 02/11/2026 2,524,903 0.0415,490,000 Lukoil Securities BV USD 3.875% 06/05/2030 16,748,562 0.26350,000 Minejesa Capital BV USD 4.625% 10/08/2030 374,938 0.01
7,518,329 MV24 Capital BV USD 6.748% 01/06/2034 8,019,943 0.123,350,000 NE Property BV EUR 2.625% 22/05/2023 4,129,001 0.063,970,000 NE Property BV EUR 1.750% 23/11/2024 4,812,812 0.084,870,000 NE Property BV EUR 1.875% 09/10/2026 5,707,629 0.094,500,000 NE Property BV EUR 3.375% 14/07/2027 5,640,884 0.096,140,000 Petrobras Global Finance BV USD 6.850% 05/06/2115 7,193,010 0.112,301,000 PPF Telecom Group BV EUR 2.125% 31/01/2025 2,811,531 0.045,665,000 PPF Telecom Group BV EUR 3.250% 29/09/2027 7,242,820 0.1116,500,000 Prosus NV USD 3.680% 21/01/2030 18,022,950 0.2811,160,000 Prosus NV USD 4.027% 03/08/2050 11,913,300 0.182,150,000 Royal Capital BV(d) USD 5.000% Perp. 2,188,969 0.03
110,606,606 1.70
Nigeria3,260,000 Nigeria Government International Bond USD 7.625% 21/11/2025 3,680,744 0.0619,170,000 Nigeria Government International Bond USD 6.500% 28/11/2027 20,143,477 0.319,810,000 Nigeria Government International Bond USD 7.143% 23/02/2030 10,358,747 0.166,930,000 Nigeria Government International Bond USD 8.747% 21/01/2031 7,861,219 0.1233,625,000 Nigeria Government International Bond USD 7.875% 16/02/2032 36,351,777 0.5648,230,000 Nigeria Government International Bond USD 7.696% 23/02/2038 50,091,376 0.77620,000 Nigeria Government International Bond USD 7.625% 28/11/2047 634,628 0.01200,000 Nigeria Government International Bond USD 9.248% 21/01/2049 228,094 0.00
129,350,062 1.99
Oman7,800,000 Oman Government International Bond USD 4.750% 15/06/2026 7,544,062 0.122,680,000 Oman Government International Bond USD 5.375% 08/03/2027 2,633,519 0.0410,950,000 Oman Government International Bond USD 6.750% 28/10/2027 11,401,687 0.173,010,000 Oman Government International Bond USD 5.625% 17/01/2028 2,953,563 0.0524,220,000 Oman Government International Bond USD 7.375% 28/10/2032 25,400,725 0.395,750,000 Oman Government International Bond USD 6.500% 08/03/2047 5,279,219 0.0832,300,000 Oman Government International Bond USD 6.750% 17/01/2048 29,983,484 0.46
85,196,259 1.31
Pakistan1,900,000 Pakistan Government International Bond USD 8.250% 30/09/2025 2,077,531 0.03
Goldman Sachs Funds—Emerging Markets Debt PortfolioSchedule of InvestmentsAs at 30 November 2020
The accompanying notes are an integral part of these financial statements.
229

Holdings Security Description Currency Interest Rate(a) Maturity Date(b)Market Value
USD
% ofShareholders’
Equity
Bonds – (Continued)Pakistan – (Continued)
5,857,000 Third Pakistan International Sukuk Co., Ltd. USD 5.500% 13/10/2021 5,940,279 0.0926,650,000 Third Pakistan International Sukuk Co., Ltd. USD 5.625% 05/12/2022 27,266,282 0.42
35,284,092 0.54
Panama8,800,000 Aeropuerto Internacional de Tocumen S.A. USD 5.625% 18/05/2036 9,955,000 0.15961,294 Aeropuerto Internacional de Tocumen S.A. USD 6.000% 18/11/2048 1,114,199 0.02
1,590,000 Autoridad del Canal de Panama USD 4.950% 29/07/2035 1,979,550 0.0322,360,000 Panama Government International Bond USD 4.500% 01/04/2056 28,441,920 0.4426,150,000 Panama Government International Bond USD 3.870% 23/07/2060 30,550,555 0.4713,740,000 Panama Notas del Tesoro USD 3.750% 17/04/2026 14,937,956 0.23
86,979,180 1.34
Papua New Guinea11,100,000 Papua New Guinea Government International Bond USD 8.375% 04/10/2028 11,306,391 0.17
Paraguay13,800,000 Paraguay Government International Bond USD 4.625% 25/01/2023 14,781,094 0.2324,530,000 Paraguay Government International Bond USD 5.000% 15/04/2026 28,416,472 0.4415,446,000 Paraguay Government International Bond USD 4.700% 27/03/2027 17,837,716 0.2711,020,000 Paraguay Government International Bond USD 4.950% 28/04/2031 13,116,555 0.2021,820,000 Paraguay Government International Bond USD 6.100% 11/08/2044 28,945,594 0.4428,130,000 Paraguay Government International Bond USD 5.600% 13/03/2048 35,764,658 0.5518,510,000 Paraguay Government International Bond USD 5.400% 30/03/2050 23,151,961 0.36496,000 Paraguay Government International Bond 144A(e) USD 5.000% 15/04/2026 574,585 0.01
162,588,635 2.50
Peru18,563,111 ABY Transmision Sur S.A. USD 6.875% 30/04/2043 24,949,981 0.381,812,217 ABY Transmision Sur S.A. 144A(e) USD 6.875% 30/04/2043 2,435,733 0.0423,370,000 Peruvian Government International Bond USD 2.780% 01/12/2060 23,077,875 0.3626,310,000 Peruvian Government International Bond USD 3.230% 28/07/2121 25,994,280 0.40
76,457,869 1.18
Philippines1,600,000 International Container Terminal Services, Inc. USD 4.750% 17/06/2030 1,722,000 0.037,710,000 Philippine Government International Bond EUR 0.700% 03/02/2029 9,258,646 0.14980,000 SMC Global Power Holdings Corp.(d) USD 6.500% Perp. 993,781 0.01
1,840,000 SMC Global Power Holdings Corp.(d) USD 7.000% Perp. 1,894,050 0.03
13,868,477 0.21
Qatar2,580,000 Qatar Government International Bond USD 4.625% 02/06/2046 3,477,356 0.0528,930,000 Qatar Government International Bond USD 5.103% 23/04/2048 41,491,948 0.6425,170,000 Qatar Government International Bond USD 4.817% 14/03/2049 34,966,636 0.5413,380,000 Qatar Government International Bond USD 4.400% 16/04/2050 17,720,138 0.276,180,000 Qatar Government International Bond 144A(e) USD 5.103% 23/04/2048 8,863,472 0.14
106,519,550 1.64
Romania3,430,000 Romanian Government International Bond EUR 2.375% 19/04/2027 4,473,185 0.075,220,000 Romanian Government International Bond EUR 2.875% 26/05/2028 6,979,784 0.1133,390,000 Romanian Government International Bond EUR 2.875% 11/03/2029 44,771,713 0.699,740,000 Romanian Government International Bond EUR 2.500% 08/02/2030 12,652,991 0.2013,730,000 Romanian Government International Bond EUR 3.624% 26/05/2030 19,496,150 0.309,500,000 Romanian Government International Bond USD 3.000% 14/02/2031 10,187,266 0.164,360,000 Romanian Government International Bond EUR 2.124% 16/07/2031 5,502,163 0.0810,090,000 Romanian Government International Bond EUR 2.000% 28/01/2032 12,608,899 0.197,804,000 Romanian Government International Bond EUR 3.375% 08/02/2038 10,603,121 0.1614,730,000 Romanian Government International Bond EUR 4.125% 11/03/2039 21,661,544 0.332,940,000 Romanian Government International Bond EUR 2.625% 02/12/2040 3,561,944 0.0610,889,000 Romanian Government International Bond EUR 3.375% 28/01/2050 14,517,076 0.2228,140,000 Romanian Government International Bond USD 4.000% 14/02/2051 30,844,078 0.47
197,859,914 3.04
Russia15,200,000 Russian Foreign Bond - Eurobond EUR 1.850% 20/11/2032 18,388,141 0.28
Goldman Sachs Funds—Emerging Markets Debt PortfolioSchedule of InvestmentsAs at 30 November 2020
The accompanying notes are an integral part of these financial statements.
230

Holdings Security Description Currency Interest Rate(a) Maturity Date(b)Market Value
USD
% ofShareholders’
Equity
Bonds – (Continued)Russia – (Continued)
65,600,000 Russian Foreign Bond - Eurobond USD 5.100% 28/03/2035 82,943,000 1.2817,000,000 Russian Foreign Bond - Eurobond USD 5.250% 23/06/2047 23,157,187 0.36
124,488,328 1.92
Saudi Arabia6,510,000 Saudi Government International Bond USD 4.500% 26/10/2046 7,986,956 0.1217,540,000 Saudi Government International Bond USD 4.625% 04/10/2047 22,023,663 0.346,290,000 Saudi Government International Bond USD 5.000% 17/04/2049 8,369,631 0.1316,790,000 Saudi Government International Bond USD 3.750% 21/01/2055 18,720,850 0.2937,060,000 Saudi Government International Bond USD 4.500% 22/04/2060 47,251,500 0.73
104,352,600 1.61
Senegal20,900,000 Senegal Government International Bond EUR 4.750% 13/03/2028 26,445,559 0.40470,000 Senegal Government International Bond USD 6.750% 13/03/2048 510,464 0.01
26,956,023 0.41
Serbia15,840,000 Serbia International Bond EUR 3.125% 15/05/2027 21,304,726 0.3321,410,000 Serbia International Bond EUR 1.500% 26/06/2029 26,035,497 0.40
47,340,223 0.73
Singapore1,864,109 Eterna Capital Pte Ltd.—Series B(d) USD 8.000% 11/12/2022 512,630 0.013,114,107 Innovate Capital Pte Ltd.—Series MCB(d) USD 6.000% 11/12/2024 390,073 0.001,850,000 Trafigura Group Pte Ltd.(d) USD 6.875% Perp. 1,817,047 0.03
2,719,750 0.04
South Africa4,280,000 Eskom Holdings SOC Ltd. USD 7.125% 11/02/2025 4,393,688 0.072,410,000 Eskom Holdings SOC Ltd. USD 6.350% 10/08/2028 2,640,080 0.045,420,000 South Africa Government International Bond USD 4.875% 14/04/2026 5,771,453 0.095,350,000 South Africa Government International Bond USD 4.850% 27/09/2027 5,641,742 0.099,170,000 South Africa Government International Bond USD 4.300% 12/10/2028 9,288,923 0.1423,460,000 South Africa Government International Bond USD 4.850% 30/09/2029 24,171,131 0.3730,450,000 South Africa Government International Bond USD 5.650% 27/09/2047 29,331,914 0.4528,410,000 South Africa Government International Bond USD 5.750% 30/09/2049 27,477,797 0.42
108,716,728 1.67
Sri Lanka19,230,000 Sri Lanka Government International Bond USD 5.750% 18/04/2023 13,142,503 0.209,200,000 Sri Lanka Government International Bond USD 6.850% 14/03/2024 5,981,438 0.098,230,000 Sri Lanka Government International Bond USD 6.350% 28/06/2024 5,331,497 0.089,020,000 Sri Lanka Government International Bond USD 6.125% 03/06/2025 5,738,975 0.0914,805,000 Sri Lanka Government International Bond USD 6.850% 03/11/2025 9,290,137 0.1430,780,000 Sri Lanka Government International Bond USD 6.825% 18/07/2026 18,852,750 0.295,150,000 Sri Lanka Government International Bond USD 6.200% 11/05/2027 3,076,320 0.055,490,000 Sri Lanka Government International Bond USD 6.750% 18/04/2028 3,277,702 0.05350,000 Sri Lanka Government International Bond USD 7.850% 14/03/2029 209,398 0.01
9,810,000 Sri Lanka Government International Bond USD 7.550% 28/03/2030 5,836,950 0.09
70,737,670 1.09
Supranationals74,530,000 Black Sea Trade & Development Bank USD 3.500% 25/06/2024 78,415,994 1.2125,630,000 Eastern & Southern African Trade & Development Bank USD 5.375% 14/03/2022 26,225,128 0.4079,210,000 Eastern & Southern African Trade & Development Bank USD 4.875% 23/05/2024 82,748,311 1.27
187,389,433 2.88
Tajikistan3,470,000 Republic of Tajikistan International Bond USD 7.125% 14/09/2027 2,825,881 0.04
Thailand13,260,000 PTT Treasury Center Co., Ltd. USD 3.700% 16/07/2070 13,858,772 0.21
Trinidad And Tobago6,770,000 Trinidad & Tobago Government International Bond USD 4.500% 26/06/2030 7,053,494 0.11
Goldman Sachs Funds—Emerging Markets Debt PortfolioSchedule of InvestmentsAs at 30 November 2020
The accompanying notes are an integral part of these financial statements.
231
Holdings Security Description Currency Interest Rate(a) Maturity Date(b)Market Value
USD
% ofShareholders’
Equity
Bonds – (Continued)Tunisia
2,970,000 Banque Centrale de Tunisie International Bond EUR 6.750% 31/10/2023 3,361,707 0.054,770,000 Banque Centrale de Tunisie International Bond EUR 6.375% 15/07/2026 5,190,793 0.08
8,552,500 0.13
Turkey2,550,000 TC Ziraat Bankasi AS USD 5.125% 03/05/2022 2,543,227 0.043,500,000 TC Ziraat Bankasi AS USD 5.125% 29/09/2023 3,452,969 0.0517,556,000 Turkey Government International Bond USD 5.750% 22/03/2024 18,014,102 0.282,110,000 Turkey Government International Bond USD 6.350% 10/08/2024 2,211,214 0.03990,000 Turkey Government International Bond USD 7.375% 05/02/2025 1,077,553 0.02
9,970,000 Turkey Government International Bond EUR 4.625% 31/03/2025 12,361,278 0.1913,000,000 Turkey Government International Bond EUR 3.250% 14/06/2025 15,350,490 0.2416,841,000 Turkey Government International Bond USD 4.250% 14/04/2026 16,212,094 0.2512,824,000 Turkey Government International Bond USD 6.000% 25/03/2027 13,208,720 0.207,440,000 Turkey Government International Bond USD 5.250% 13/03/2030 7,223,775 0.1115,750,000 Turkey Government International Bond USD 6.000% 14/01/2041 14,824,687 0.2373,490,000 Turkey Government International Bond USD 5.750% 11/05/2047 66,519,933 1.0210,240,000 Turkiye Vakiflar Bankasi TAO USD 8.125% 28/03/2024 10,860,800 0.1725,930,000 Turkiye Vakiflar Bankasi TAO USD 5.250% 05/02/2025 25,103,481 0.397,410,000 Yapi ve Kredi Bankasi AS USD 6.100% 16/03/2023 7,533,886 0.11220,000 Yapi ve Kredi Bankasi AS USD 5.850% 21/06/2024 221,650 0.00
20,250,000 Yapi ve Kredi Bankasi AS USD 8.250% 15/10/2024 21,870,000 0.34
238,589,859 3.67
Ukraine24,890,000 Ukraine Government International Bond USD 7.750% 01/09/2022 26,601,187 0.4120,360,000 Ukraine Government International Bond USD 7.750% 01/09/2023 22,177,130 0.349,275,000 Ukraine Government International Bond USD 8.994% 01/02/2024 10,388,000 0.1652,170,000 Ukraine Government International Bond USD 7.750% 01/09/2024 57,166,908 0.889,210,000 Ukraine Government International Bond USD 7.750% 01/09/2025 10,156,328 0.16520,000 Ukraine Government International Bond EUR 6.750% 20/06/2026 673,180 0.01
14,060,000 Ukraine Government International Bond USD 7.750% 01/09/2026 15,573,647 0.241,820,000 Ukraine Government International Bond USD 7.750% 01/09/2027 2,026,741 0.031,040,000 Ukraine Government International Bond USD 9.750% 01/11/2028 1,241,175 0.026,570,000 Ukraine Government International Bond EUR 4.375% 27/01/2030 7,408,180 0.1114,782,000 Ukraine Government International Bond USD 7.253% 15/03/2033 15,754,378 0.2416,710,000 Ukraine Government International Bond—Series GDP(d) USD 1.000% 31/05/2040 16,602,952 0.26
185,769,806 2.86
United Arab Emirates59,080,000 Abu Dhabi Crude Oil Pipeline LLC USD 4.600% 02/11/2047 73,397,668 1.1313,980,000 Abu Dhabi Government International Bond USD 3.875% 16/04/2050 17,383,256 0.274,430,000 DP World Plc. USD 5.625% 25/09/2048 5,417,752 0.081,330,000 DP World Plc. 144A(e) USD 6.850% 02/07/2037 1,766,198 0.0313,300,000 Emirate of Dubai Government International Bonds USD 3.900% 09/09/2050 13,067,250 0.2013,470,000 Finance Department Government of Sharjah USD 4.000% 28/07/2050 13,941,450 0.2112,920,000 NBK Tier 1 Financing 2 Ltd.(d) USD 4.500% Perp. 12,980,563 0.20
137,954,137 2.12
United Kingdom28,130,000 Gazprom PJSC Via Gaz Finance Plc. USD 3.250% 25/02/2030 29,000,272 0.4529,520,000 Gazprom PJSC Via Gaz Finance Plc.(d) USD 4.599% Perp. 30,977,550 0.48990,000 Vedanta Resources Finance II Plc. USD 9.250% 23/04/2026 654,637 0.01
3,270,000 Vedanta Resources Ltd. USD 7.125% 31/05/2023 2,200,710 0.034,290,000 Vedanta Resources Ltd. USD 6.125% 09/08/2024 2,745,600 0.04
65,578,769 1.01
United States12,534,432 Brazil Loan Trust 1 USD 5.477% 24/07/2023 13,035,809 0.201,542,778 Brazil Loan Trust 1 144A(e) USD 5.477% 24/07/2023 1,604,490 0.0323,240,000 Sasol Financing USA LLC USD 5.875% 27/03/2024 24,064,294 0.37111,640,000 United States Treasury Note/Bond USD 2.000% 15/11/2026 121,526,246 1.8718,500,000 United States Treasury Note/Bond USD 3.125% 15/11/2028 21,980,312 0.3413,810,000 United States Treasury Note/Bond USD 2.000% 15/02/2050 15,224,446 0.23
197,435,597 3.04
Goldman Sachs Funds—Emerging Markets Debt PortfolioSchedule of InvestmentsAs at 30 November 2020
The accompanying notes are an integral part of these financial statements.
232

Holdings Security Description Currency Interest Rate(a) Maturity Date(b)Market Value
USD
% ofShareholders’
Equity
Bonds – (Continued)Uruguay
660,000 Uruguay Government International Bond USD 4.375% 23/01/2031 801,694 0.013,200,000 Uruguay Government International Bond USD 5.100% 18/06/2050 4,408,500 0.07
5,210,194 0.08
Uzbekistan420,000 Republic of Uzbekistan Bond USD 5.375% 20/02/2029 476,910 0.01
9,320,000 Republic of Uzbekistan Bond USD 3.700% 25/11/2030 9,483,100 0.14
9,960,010 0.15
Venezuela635,000 Petroleos de Venezuela S.A. USD 5.375% 12/04/2027 23,495 0.00
9,523,000 Venezuela Government International Bond USD 7.650% 21/04/2025 904,685 0.01
928,180 0.01
Vietnam21,860,000 Viet Nam Debt & Asset Trading Corp. USD 1.000% 10/10/2025 18,502,441 0.28
Zambia27,723,000 Zambia Government International Bond USD 5.375% 20/09/2022 13,211,742 0.20
TOTAL BONDS(cost USD 5,597,375,106) 5,719,825,715 87.99
Holdings Security DescriptionMarket Value
USD
% ofShareholders’
Equity
Mutual Funds – 0.77%Ireland
49,869,913 Goldman Sachs US$ Treasury Liquid Reserves Fund (X Distribution Class)(f)(g) 49,869,913 0.77
TOTAL MUTUAL FUNDS(cost USD 49,869,913) 49,869,913 0.77
TOTAL TRANSFERABLE SECURITIES ADMITTED TO AN OFFICIAL EXCHANGE LISTING(cost USD 5,647,245,019) 5,769,695,628 88.76
Holdings Security Description Currency Interest Rate(a) Maturity Date(b)Market Value
USD
% ofShareholders’
Equity
Transferable securities dealt in another regulated market
Bonds – 4.54%Argentina
930,000 Telecom Argentina S.A. USD 8.500% 06/08/2025 857,780 0.01
Bermuda13,830,000 Tengizchevroil Finance Co. International Ltd. USD 2.625% 15/08/2025 14,293,305 0.226,910,000 Tengizchevroil Finance Co. International Ltd. USD 3.250% 15/08/2030 7,220,950 0.11
21,514,255 0.33
Brazil5,350,000 Banco do Brasil S.A. USD 4.750% 20/03/2024 5,762,117 0.0924,020,000 Banco do Brasil S.A.(d) USD 9.000% Perp. 26,609,656 0.417,850,000 BRF S.A. USD 4.875% 24/01/2030 8,365,156 0.1313,690,000 Itau Unibanco Holding S.A.(d) USD 4.625% Perp. 12,817,263 0.194,350,000 Samarco Mineracao S.A. USD 5.375% 26/09/2024 2,643,305 0.04
56,197,497 0.86
Cayman Islands33,000 Embraer Overseas Ltd. USD 5.696% 16/09/2023 35,171 0.00
2,620,000 Grupo Aval Ltd. USD 4.750% 26/09/2022 2,738,555 0.04500,000 iQIYI, Inc. USD 2.000% 01/04/2025 473,750 0.01
6,530,000 Lima Metro Line 2 Finance Ltd. USD 4.350% 05/04/2036 7,183,000 0.11
10,430,476 0.16
Chile470,000 Inversiones CMPC S.A. USD 4.375% 04/04/2027 533,524 0.01
6,924,000 Sociedad Quimica y Minera de Chile S.A. USD 4.375% 28/01/2025 7,633,710 0.12840,000 Sociedad Quimica y Minera de Chile S.A. USD 4.250% 22/01/2050 943,031 0.01
9,110,265 0.14
Goldman Sachs Funds—Emerging Markets Debt PortfolioSchedule of InvestmentsAs at 30 November 2020
The accompanying notes are an integral part of these financial statements.
233

Holdings Security Description Currency Interest Rate(a) Maturity Date(b)Market Value
USD
% ofShareholders’
Equity
Bonds – (Continued)Luxembourg
1,330,000 Millicom International Cellular S.A. USD 4.500% 27/04/2031 1,440,534 0.027,650,000 Rede D’or Finance SARL USD 4.500% 22/01/2030 7,917,750 0.12
9,358,284 0.14
Mexico10,850,000 Banco Santander Mexico S.A. Institucion de Banca Multiple Grupo
Financiero Santander USD 5.375% 17/04/2025 12,292,074 0.1916,317,000 BBVA Bancomer S.A.(d) USD 5.125% 18/01/2033 17,092,057 0.261,910,000 BBVA Bancomer S.A.(d) USD 5.875% 13/09/2034 2,096,822 0.03830,000 Cemex SAB de CV USD 7.375% 05/06/2027 934,670 0.01
4,520,000 Cemex SAB de CV USD 5.450% 19/11/2029 4,952,225 0.088,560,000 Cemex SAB de CV USD 5.200% 17/09/2030 9,317,218 0.142,040,000 Industrias Penoles SAB de CV USD 4.750% 06/08/2050 2,254,200 0.043,380,000 Petroleos Mexicanos USD 5.350% 12/02/2028 3,158,441 0.055,760,000 Petroleos Mexicanos USD 5.625% 23/01/2046 4,557,240 0.07
56,654,947 0.87
Netherlands200,000 Metinvest BV USD 7.750% 23/04/2023 212,406 0.00450,000 Prosus NV 144A(e) USD 3.680% 21/01/2030 491,535 0.01
31,140,000 Syngenta Finance NV USD 5.182% 24/04/2028 33,407,615 0.522,660,000 Syngenta Finance NV USD 5.676% 24/04/2048 2,736,608 0.04
36,848,164 0.57
Panama14,090,000 Banco Latinoamericano de Comercio Exterior S.A. USD 2.375% 14/09/2025 14,462,258 0.2210,580,000 Banco Nacional de Panama USD 2.500% 11/08/2030 10,566,775 0.17
25,029,033 0.39
Peru9,378,500 Corp Lindley S.A. USD 6.750% 23/11/2021 9,727,263 0.155,143,000 Corp Lindley S.A. USD 4.625% 12/04/2023 5,371,220 0.08
15,098,483 0.23
South Africa1,785,000 Eskom Holdings SOC Ltd. USD 6.750% 06/08/2023 1,834,366 0.03
Turkey21,970,000 Yapi ve Kredi Bankasi AS(d) USD 13.875% Perp. 24,606,400 0.38
Venezuela564,690,000 Petroleos de Venezuela S.A. USD 6.000% 28/10/2022 18,070,080 0.2846,220,000 Petroleos de Venezuela S.A. USD 6.000% 16/05/2024 1,710,140 0.03202,623,000 Petroleos de Venezuela S.A. USD 6.000% 15/11/2026 7,598,362 0.123,335,300 Venezuela Government International Bond USD 8.250% 13/10/2024 316,854 0.00
27,695,436 0.43
TOTAL BONDS(cost USD 807,048,176) 295,235,386 4.54
TOTAL TRANSFERABLE SECURITIES DEALT IN ANOTHER REGULATED MARKET(cost USD 807,048,176) 295,235,386 4.54
Other Transferable Securities
Bonds – 1.43%Cayman Islands
10,441,600 Brazil Minas SPE Via State of Minas Gerais USD 5.333% 15/02/2028 11,182,301 0.17
Dominican Republic848,400,000 Dominican Republic Bond DOP 10.750% 11/08/2028 16,405,349 0.2536,100,000 Dominican Republic International Bond 144A(e) DOP 18.500% 04/02/2028 955,789 0.02
17,361,138 0.27
United Kingdom376,900,000 HSBC Bank Plc. 144A(e) EGP 0.000% 07/01/2021 23,723,681 0.36
Goldman Sachs Funds—Emerging Markets Debt PortfolioSchedule of InvestmentsAs at 30 November 2020
The accompanying notes are an integral part of these financial statements.
234

Holdings Security Description Currency Interest Rate(a) Maturity Date(b)Market Value
USD
% ofShareholders’
Equity
Bonds – (Continued)United States
279,725,000 JPMorgan Chase Bank NA 144A(e) EGP 0.000% 08/07/2021 16,531,141 0.26417,825,000 JPMorgan Chase Bank NA 144A(e) EGP 0.000% 02/09/2021 24,237,477 0.37
40,768,618 0.63
TOTAL BONDS(cost USD 92,815,199) 93,035,738 1.43
TOTAL OTHER TRANSFERABLE SECURITIES(cost USD 92,815,199) 93,035,738 1.43
MARKET VALUE OF INVESTMENTS EXCLUDING DERIVATIVES(cost USD 6,547,108,394) 6,157,966,752 94.73
Futures Contracts – 0.04%
Number ofContracts Security Description
CommitmentMarket Value
USD
UnrealisedGainUSD
% ofShareholders’
Equity
EUR187 German Federal Republic Bonds 10YR Futures 08/12/2020 Long 39,331,539 423,921 0.01
USD1,676 US Treasury Long Bond Futures 22/03/2021 Long 292,828,625 134,647 0.005,627 US Treasury Notes 10YR Futures 22/03/2021 Long 777,141,453 1,132,344 0.02733 US Treasury Notes 2YR Futures 31/03/2021 Long 161,867,016 44,539 0.00
5,827 US Treasury Notes 5YR Futures 31/03/2021 Long 734,156,480 608,492 0.01263 US Treasury Ultra Long Notes 10YR Futures 22/03/2021 Long 41,291,000 53,668 0.00
2,007,284,574 1,973,690 0.03
UNREALISED GAIN ON FUTURES CONTRACTS 2,397,611 0.04
Number ofContracts Security Description
CommitmentMarket Value
USD
UnrealisedLossUSD
% ofShareholders’
Equity
USD(123) US Treasury Ultra Long Bond Futures 22/03/2021 Short (26,525,719) (86,434) (0.00)
UNREALISED LOSS ON FUTURES CONTRACTS (86,434) (0.00)
Share Class Specific Futures Contracts – (0.00%)
Number ofContracts Security Description
CommitmentMarket Value
USD
UnrealisedGainUSD
% ofShareholders’
Equity
USD(10) US Treasury Long Bond Futures 22/03/2021 Short (1,747,187) 493 0.00(27) US Treasury Ultra Long Bond Futures 22/03/2021 Short (5,822,719) 2,321 0.00
(7,569,906) 2,814 0.00
UNREALISED GAIN ON SHARE CLASS SPECIFIC FUTURES CONTRACTS 2,814 0.00
Number ofContracts Security Description
CommitmentMarket Value
USD
UnrealisedLossUSD
% ofShareholders’
Equity
USD(33) US Treasury Notes 10YR Futures 22/03/2021 Short (4,557,609) (8,250) (0.00)(28) US Treasury Notes 2YR Futures 31/03/2021 Short (6,183,188) (1,750) (0.00)(58) US Treasury Notes 5YR Futures 31/03/2021 Short (7,307,547) (6,141) (0.00)(28) US Treasury Ultra Long Notes 10YR Futures 22/03/2021 Short (4,396,000) (6,914) (0.00)
(22,444,344) (23,055) (0.00)
UNREALISED LOSS ON SHARE CLASS SPECIFIC FUTURES CONTRACTS (23,055) (0.00)
Forward Currency Contracts – (0.08%)
CurrencyAmountBought Currency
AmountSold
MaturityDate
UnrealisedGainUSD
% ofShareholders’
Equity
AUD 130,925,083 USD 96,199,615 01/12/2020 403,462 0.00EUR 245,577,734 USD 291,047,457 01/12/2020 3,535,290 0.04
Goldman Sachs Funds—Emerging Markets Debt PortfolioSchedule of InvestmentsAs at 30 November 2020
The accompanying notes are an integral part of these financial statements.
235

Forward Currency Contracts – (Continued)
CurrencyAmountBought Currency
AmountSold
MaturityDate
UnrealisedGainUSD
% ofShareholders’
Equity
NOK 91,382,166 USD 10,084,000 01/12/2020 298,390 0.00BRL 53,823,613 USD 10,104,853 02/12/2020 36,386 0.00IDR 169,117,789,478 USD 11,502,227 04/12/2020 463,937 0.01IDR 307,452,062,968 USD 21,397,128 07/12/2020 327,094 0.00ZAR 164,668,656 USD 10,027,596 07/12/2020 694,964 0.01EUR 85,825,000 USD 102,546,628 10/12/2020 424,910 0.01USD 15,527,457 CLP 11,836,599,943 14/12/2020 60,513 0.00AUD 44,098,697 EUR 26,734,494 16/12/2020 460,185 0.00AUD 152,456,439 USD 110,192,473 16/12/2020 2,314,159 0.06CAD 8,478,949 CHF 5,833,093 16/12/2020 99,812 0.00CAD 8,235,312 JPY 659,516,699 16/12/2020 40,361 0.00CAD 232,812,241 USD 176,834,553 16/12/2020 3,191,613 0.02CHF 39,105,092 USD 42,895,640 16/12/2020 390,015 0.00CNH 2,209,880,640 USD 326,960,184 16/12/2020 8,961,178 0.15COP 18,959,050,508 USD 5,049,626 16/12/2020 238,382 0.00CZK 142,588,768 EUR 5,275,185 16/12/2020 191,471 0.00CZK 144,410,249 USD 6,412,063 16/12/2020 193,231 0.00EUR 5,195,585 CHF 5,580,754 16/12/2020 57,617 0.00EUR 21,205,554 SGD 33,909,298 16/12/2020 94,115 0.00EUR 457,515,062 USD 539,749,408 16/12/2020 9,293,698 0.13GBP 42,470,303 EUR 46,476,050 16/12/2020 1,032,457 0.00GBP 75,321,539 USD 97,697,914 16/12/2020 3,048,601 0.08HUF 2,769,320,020 USD 9,056,371 16/12/2020 191,767 0.00IDR 163,864,857,667 USD 11,539,871 16/12/2020 22,738 0.00ILS 150,775,420 USD 44,026,510 16/12/2020 1,562,767 0.05JPY 18,140,737,384 USD 172,862,647 16/12/2020 1,188,829 0.02MXN 1,657,669,624 USD 76,575,159 16/12/2020 5,865,111 0.09NOK 519,275,696 EUR 47,664,779 16/12/2020 1,801,358 0.04NOK 172,534,836 SEK 164,528,421 16/12/2020 203,483 0.00NOK 578,072,630 USD 64,015,946 16/12/2020 1,666,444 0.02NZD 9,217,546 AUD 8,759,719 16/12/2020 30,069 0.00NZD 9,351,820 EUR 5,271,601 16/12/2020 262,780 0.01NZD 127,485,386 USD 85,432,002 16/12/2020 4,390,073 0.09PLN 69,756,969 EUR 15,581,462 16/12/2020 5,977 0.00PLN 117,564,250 USD 31,179,431 16/12/2020 344,162 0.00SEK 493,479,075 EUR 47,641,402 16/12/2020 1,016,555 0.00SEK 295,117,664 USD 33,573,046 16/12/2020 1,225,909 0.02SGD 135,219,626 USD 99,865,621 16/12/2020 1,237,005 0.01THB 2,448,122,219 USD 78,615,633 16/12/2020 2,305,538 0.03TRY 187,997,200 USD 22,497,589 16/12/2020 1,433,528 0.03USD 11,452,845 IDR 162,247,375,424 16/12/2020 4,367 0.00ZAR 1,139,229,272 USD 69,164,137 17/12/2020 4,919,736 0.08IDR 295,979,720,985 USD 20,851,356 06/01/2021 4,212 0.00KRW 68,342,034,572 USD 61,145,479 08/01/2021 603,838 0.02TRY 53,000,259 USD 6,298,847 11/01/2021 382,404 0.01TRY 61,010,139 USD 7,638,056 19/01/2021 29,568 0.00USD 46,423,093 INR 3,450,073,900 27/01/2021 50,164 0.00COP 98,220,265,554 USD 26,882,411 29/01/2021 460,395 0.01INR 984,810,992 USD 13,092,931 05/02/2021 131,778 0.00USD 15,953,511 TWD 447,411,127 05/02/2021 127,154 0.00RUB 1,115,079,764 USD 14,393,460 08/02/2021 161,431 0.00USD 2,539,279 RUB 194,258,669 08/02/2021 3,663 0.00NZD 20,870,038 AUD 19,423,023 09/02/2021 365,056 0.01
UNREALISED GAIN ON FORWARD CURRENCY CONTRACTS 67,849,700 1.05
CurrencyAmountBought Currency
AmountSold
MaturityDate
UnrealisedLossUSD
% ofShareholders’
Equity
USD 95,663,850 AUD 130,925,084 01/12/2020 (939,225) (0.01)USD 291,702,905 EUR 245,577,727 01/12/2020 (2,879,842) (0.01)USD 71,033,895 NOK 639,769,854 01/12/2020 (1,653,596) (0.02)AUD 117,046,377 USD 86,559,046 02/12/2020 (196,375) (0.00)USD 86,218,909 AUD 117,046,377 02/12/2020 (143,761) (0.00)USD 10,043,872 BRL 53,823,613 02/12/2020 (97,368) (0.00)USD 11,954,491 IDR 169,117,789,479 04/12/2020 (11,673) (0.00)USD 55,959,253 EUR 47,192,347 07/12/2020 (656,728) (0.02)USD 12,599,697 IDR 179,473,259,310 07/12/2020 (81,686) (0.00)USD 85,373,240 EUR 71,600,083 10/12/2020 (531,456) (0.00)USD 11,430,747 MXN 247,636,846 10/12/2020 (892,041) (0.02)CLP 6,838,776,452 USD 8,981,988 14/12/2020 (45,723) (0.00)
Goldman Sachs Funds—Emerging Markets Debt PortfolioSchedule of InvestmentsAs at 30 November 2020
The accompanying notes are an integral part of these financial statements.
236

Forward Currency Contracts – (Continued)
CurrencyAmountBought Currency
AmountSold
MaturityDate
UnrealisedLossUSD
% ofShareholders’
Equity
TWD 537,448,423 USD 18,948,354 14/12/2020 (106,560) (0.00)USD 23,902,173 NOK 212,961,908 14/12/2020 (294,821) (0.01)USD 14,703,353 EUR 12,329,855 15/12/2020 (92,594) (0.00)USD 8,255,594 GBP 6,207,213 15/12/2020 (46,701) (0.00)AUD 8,744,306 CAD 8,406,339 16/12/2020 (47,408) (0.00)CHF 16,657,516 EUR 15,474,456 16/12/2020 (131,893) (0.00)EUR 5,235,501 CAD 8,158,508 16/12/2020 (25,822) (0.00)EUR 5,261,389 CZK 142,436,328 16/12/2020 (201,053) (0.00)EUR 25,082,394 GBP 22,787,872 16/12/2020 (379,732) (0.00)EUR 5,261,389 HUF 1,928,825,277 16/12/2020 (127,353) (0.00)EUR 13,027,838 NOK 144,493,253 16/12/2020 (783,650) (0.02)EUR 5,305,107 PLN 24,059,719 16/12/2020 (84,938) (0.00)EUR 66,762,008 SEK 693,684,058 16/12/2020 (1,678,059) (0.02)HUF 3,722,239,442 EUR 10,451,757 16/12/2020 (112,269) (0.00)JPY 1,322,136,809 AUD 17,422,975 16/12/2020 (172,191) (0.00)JPY 5,193,507,054 EUR 42,207,975 16/12/2020 (822,727) (0.01)USD 119,685,195 AUD 166,420,267 16/12/2020 (3,126,178) (0.06)USD 123,968,367 CAD 163,100,698 16/12/2020 (2,152,120) (0.04)USD 49,189,261 CHF 44,588,097 16/12/2020 (165,564) (0.00)USD 298,092,062 CNH 2,006,840,347 16/12/2020 (6,965,383) (0.12)USD 7,670,494 COP 27,876,743,603 16/12/2020 (104,813) (0.00)USD 6,221,758 CZK 143,713,897 16/12/2020 (351,686) (0.01)USD 206,128,335 EUR 175,618,944 16/12/2020 (4,624,002) (0.07)USD 106,509,095 GBP 81,796,269 16/12/2020 (2,897,711) (0.05)USD 9,692,879 HUF 2,949,777,600 16/12/2020 (157,897) (0.00)USD 68,544,172 ILS 234,111,881 16/12/2020 (2,243,171) (0.04)USD 177,567,050 JPY 18,644,560,511 16/12/2020 (1,318,360) (0.01)USD 39,708,818 MXN 839,924,775 16/12/2020 (2,062,851) (0.03)USD 72,601,768 NOK 673,633,012 16/12/2020 (3,938,486) (0.09)USD 34,506,775 NZD 51,941,837 16/12/2020 (2,089,762) (0.04)USD 12,450,596 PLN 47,738,824 16/12/2020 (350,058) (0.01)USD 34,444,658 SEK 304,846,270 16/12/2020 (1,501,450) (0.03)USD 50,378,596 SGD 67,941,016 16/12/2020 (420,353) (0.00)USD 56,667,453 THB 1,750,853,145 16/12/2020 (1,205,920) (0.02)USD 5,720,876 TRY 45,567,925 16/12/2020 (79,695) (0.00)CLP 33,793,364,852 USD 44,698,292 17/12/2020 (537,169) (0.01)USD 22,202,611 CLP 17,141,072,518 17/12/2020 (197,318) (0.00)USD 67,922,840 ZAR 1,108,445,669 17/12/2020 (4,159,179) (0.06)USD 13,068,712 PLN 50,007,570 21/12/2020 (341,091) (0.01)USD 42,009,058 KRW 46,575,055,843 08/01/2021 (73,062) (0.00)USD 5,149,486 TRY 44,628,017 11/01/2021 (476,354) (0.01)USD 10,239,656 TRY 82,506,646 19/01/2021 (129,604) (0.00)USD 1,112,180,754 EUR 940,493,100 21/01/2021 (17,707,685) (0.27)TRY 21,178,761 USD 2,680,347 25/01/2021 (24,695) (0.00)USD 2,710,355 RUB 207,558,963 25/01/2021 (2,713) (0.00)USD 6,644,490 TRY 53,671,001 25/01/2021 (85,437) (0.00)CAD 6,992,629 NZD 7,692,661 27/01/2021 (11,723) (0.00)INR 3,793,393,708 USD 51,018,481 27/01/2021 (30,944) (0.00)USD 2,541,278 COP 9,295,359,312 29/01/2021 (46,388) (0.00)TWD 707,919,975 USD 25,221,579 05/02/2021 (180,193) (0.00)AUD 31,155,496 NZD 33,094,303 09/02/2021 (316,215) (0.01)
UNREALISED LOSS ON FORWARD CURRENCY CONTRACTS (73,312,475) (1.13)
Share Class Specific Forward Currency Contracts – 0.86%
CurrencyAmountBought Currency
AmountSold
MaturityDate
UnrealisedGainUSD
% ofShareholders’
Equity
SGD 91,098,456 USD 67,158,240 07/12/2020 954,937 0.02CHF 94,863,040 USD 103,861,467 10/12/2020 1,114,027 0.02HKD 46,849,983 USD 6,042,445 18/12/2020 1,535 0.00PLN 21,898,152 USD 5,724,342 21/12/2020 147,768 0.00JPY 5,271,594,405 USD 49,798,001 23/12/2020 790,540 0.02GBP 379,607,016 USD 489,993,770 13/01/2021 17,982,185 0.27EUR 1,924,690,510 USD 2,276,697,779 21/01/2021 35,584,531 0.54
UNREALISED GAIN ON FORWARD CURRENCY CONTRACTS HELD FOR HEDGING PURPOSES 56,575,523 0.87
Goldman Sachs Funds—Emerging Markets Debt PortfolioSchedule of InvestmentsAs at 30 November 2020
The accompanying notes are an integral part of these financial statements.
237

Share Class Specific Forward Currency Contracts – (Continued)
CurrencyAmountBought Currency
AmountSold
MaturityDate
UnrealisedLossUSD
% ofShareholders’
Equity
USD 5,292,804 SGD 7,200,685 07/12/2020 (91,061) (0.00)USD 3,161,788 CHF 2,905,680 10/12/2020 (53,637) (0.00)USD 16,877 HKD 130,865 18/12/2020 (5) (0.00)USD 1,413,208 PLN 5,475,290 21/12/2020 (55,020) (0.00)USD 12,123,992 GBP 9,413,036 13/01/2021 (472,183) (0.01)USD 2,592,048 EUR 2,179,379 21/01/2021 (26,211) (0.00)
UNREALISED LOSS ON FORWARD CURRENCY CONTRACTS HELD FOR HEDGING PURPOSES (698,117) (0.01)
Options – 0.02%
Holdings Security Description
UnrealisedGain/(Loss)
USDMarket Value
USD
% ofShareholders’
Equity
Purchased OptionsEUR
85,792,000 Call EUR / Put USD Expires 03/12/2020 Strike 1.19 362,876 617,368 0.0185,767,000 Call EUR / Put USD Expires 03/12/2020 Strike 1.19 562,090 752,786 0.0143,300,000 Call EUR / Put USD Expires 08/12/2020 Strike 1.19 250,423 345,716 0.0143,299,000 Call EUR / Put USD Expires 11/12/2020 Strike 1.20 143,330 266,916 0.00
1,318,719 1,982,786 0.03
GBP19,331,000 Call GBP / Put USD Expires 11/12/2020 Strike 1.35 47,322 132,669 0.00
USD25,420,000 Put USD / Call NOK Expires 10/12/2020 Strike 8.92 285,899 436,818 0.01
TOTAL PURCHASED OPTIONS(cost USD 900,333) 2,552,273 0.04
Written OptionsAUD
(67,104,000) Put AUD / Call NZD Expires 05/02/2021 Strike 1.06 (535,153) (781,409) (0.02)
NZD(36,861,000) Put NZD / Call CAD Expires 25/01/2021 Strike 0.89 16,017 (89,131) (0.00)
USD(25,466,000) Call USD / Put RUB Expires 22/01/2021 Strike 82.86 53,249 (108,205) (0.00)
TOTAL WRITTEN OPTIONS(cost USD (512,858)) (978,745) (0.02)
TOTAL OPTIONS(cost USD 387,475) 1,573,528 0.02
Swap Contracts – 0.14%Net LocalNotionalAmount Pay Receive Currency Maturity Date
UnrealisedGainUSD
% ofShareholders’
Equity
Interest Rate Swaps921,575,000 Floating (BRL 1 month BRCDI) Fixed 4.120% BRL 03/01/2022 851,981 0.01268,220,000 Floating (EUR 6 month LIBOR) Fixed 0.000% EUR 16/12/2022 473,356 0.01
4,036,715,000 Floating (MXN 1 month TIIE) Fixed 4.500% MXN 14/12/2022 171,147 0.002,048,610,000 Floating (MXN 1 month TIIE) Fixed 5.100% MXN 10/12/2025 618,265 0.01556,170,000 Floating (PLN 6 month WIBOR) Fixed 0.345% PLN 16/06/2023 34,252 0.00237,990,000 Floating (PLN 6 month WIBOR) Fixed 0.750% PLN 16/12/2025 403,193 0.01
UNREALISED GAIN ON INTEREST RATE SWAPS 2,552,194 0.04
Credit Default Swaps7,830,000 Floating (Chile Government International
Bond)Fixed 1.000% USD 20/12/2020 5,112 0.00
33,390,000 Floating (Chile Government InternationalBond)
Fixed 1.000% USD 20/12/2020 22,016 0.00
6,230,000 Floating (Chile Government InternationalBond)
Fixed 1.000% USD 20/12/2020 4,168 0.00
6,060,000 Floating (Colombia GovernmentInternational Bond)
Fixed 1.000% USD 20/12/2022 87,553 0.00
15,160,000 Floating (Colombia GovernmentInternational Bond)
Fixed 1.000% USD 20/12/2022 221,901 0.00
25,000,000 Floating (Mexico GovernmentInternational Bond)
Fixed 1.000% USD 20/12/2022 381,689 0.01
Goldman Sachs Funds—Emerging Markets Debt PortfolioSchedule of InvestmentsAs at 30 November 2020
The accompanying notes are an integral part of these financial statements.
238

Swap Contracts – (Continued)
Net LocalNotionalAmount Pay Receive Currency Maturity Date
UnrealisedGainUSD
% ofShareholders’
Equity
Credit Default Swaps – (Continued)33,490,000 Floating (Colombia Government
International Bond)Fixed 1.000% USD 20/06/2023 612,706 0.01
46,750,000 Floating (Colombia GovernmentInternational Bond)
Fixed 1.000% USD 20/12/2023 1,150,218 0.02
41,910,000 Floating (Philippine GovernmentInternational Bond)
Fixed 1.000% USD 20/12/2023 1,011,316 0.02
20,720,000 Floating (Ukraine GovernmentInternational Bond)
Fixed 5.000% USD 20/12/2023 1,532,848 0.02
64,110,000 Floating (Brazilian GovernmentInternational Bond)
Fixed 1.000% USD 20/06/2024 279,665 0.01
17,830,000 Floating (Chile Government InternationalBond)
Fixed 1.000% USD 20/06/2024 62,945 0.00
24,320,000 Floating (Colombia GovernmentInternational Bond)
Fixed 1.000% USD 20/06/2024 351,114 0.01
84,210,000 Floating (Peruvian GovernmentInternational Bond)
Fixed 1.000% USD 20/06/2024 717,616 0.01
26,470,000 Floating (Qatar GovernmentInternational Bond)
Fixed 1.000% USD 20/06/2024 311,964 0.01
70,890,000 Floating (Saudi GovernmentInternational Bond)
Fixed 1.000% USD 20/06/2024 1,033,189 0.02
19,730,000 Floating (Abu Dhabi GovernmentInternational Bond)
Fixed 1.000% USD 20/12/2024 146,995 0.00
78,010,000 Floating (Chile Government InternationalBond)
Fixed 1.000% USD 20/12/2024 440,381 0.01
30,950,000 Floating (Peruvian GovernmentInternational Bond)
Fixed 1.000% USD 20/12/2024 245,694 0.00
12,110,000 Floating (Philippine GovernmentInternational Bond)
Fixed 1.000% USD 20/12/2024 446,447 0.01
61,100,000 Floating (Qatar GovernmentInternational Bond)
Fixed 1.000% USD 20/12/2024 1,122,480 0.02
102,550,000 Floating (Russian Foreign Bond -Eurobond)
Fixed 1.000% USD 20/12/2024 3,463,556 0.05
18,960,000 Floating (Philippine GovernmentInternational Bond)
Fixed 1.000% USD 20/06/2025 232,196 0.00
13,840,000 Floating (Qatar GovernmentInternational Bond)
Fixed 1.000% USD 20/06/2025 241,942 0.00
20,730,000 Floating (Russian Foreign Bond -Eurobond)
Fixed 1.000% USD 20/06/2025 218,312 0.00
3,210,000 Floating (Ukraine GovernmentInternational Bond)
Fixed 5.000% USD 20/06/2025 191,841 0.00
115,080,000 Floating (Indonesia GovernmentInternational Bond)
Fixed 1.000% USD 20/12/2025 1,954,357 0.03
66,200,000 Floating (Markit CDX Emerging Markets34 Version 1 Index)
Fixed 1.000% USD 20/12/2025 1,451,929 0.02
4,400,000 Floating (Panama GovernmentInternational Bond)
Fixed 1.000% USD 20/12/2025 90,582 0.00
1,000,000 Floating (Russian Foreign Bond -Eurobond)
Fixed 1.000% USD 20/12/2025 23,524 0.00
18,780,000 Floating (Saudi GovernmentInternational Bond)
Fixed 1.000% USD 20/12/2025 278,668 0.00
UNREALISED GAIN ON CREDIT DEFAULT SWAPS 18,334,924 0.28
TOTAL UNREALISED GAIN ON SWAP CONTRACTS 20,887,118 0.32
Net LocalNotionalAmount Pay Receive Currency Maturity Date
UnrealisedLossUSD
% ofShareholders’
Equity
Interest Rate Swaps130,275,000 Floating (BRL 1 month BRCDI) Fixed 4.230% BRL 02/01/2023 (61,082) (0.00)345,910,000 Floating (BRL 1 month BRCDI) Fixed 4.930% BRL 02/01/2024 (990,555) (0.02)933,940,000 Fixed 2.500% Floating (CNY 3 month LIBOR) CNY 17/03/2023 (157,950) (0.00)133,150,000 Fixed 0.000% Floating (EUR 6 month LIBOR) EUR 16/12/2023 (225,472) (0.00)235,920,000 Fixed 0.000% Floating (EUR 6 month LIBOR) EUR 16/12/2025 (908,636) (0.02)151,810,000 Fixed 0.000% Floating (EUR 6 month LIBOR) EUR 16/12/2027 (793,837) (0.01)188,750,000 Fixed 0.000% Floating (EUR 6 month LIBOR) EUR 16/12/2030 (1,036,773) (0.02)31,000,000 Fixed 0.250% Floating (EUR 6 month EURIBOR) EUR 16/12/2040 (416,054) (0.01)8,500,000 Fixed 0.250% Floating (EUR 6 month EURIBOR) EUR 16/12/2050 (182,750) (0.00)
1,184,070,000 Fixed 0.250% Floating (PLN 3 month WIBOR) PLN 16/12/2021 (140,091) (0.00)
Goldman Sachs Funds—Emerging Markets Debt PortfolioSchedule of InvestmentsAs at 30 November 2020
The accompanying notes are an integral part of these financial statements.
239

Swap Contracts – (Continued)
Net LocalNotionalAmount Pay Receive Currency Maturity Date
UnrealisedLossUSD
% ofShareholders’
Equity
Interest Rate Swaps – (Continued)1,826,739,868 Floating (ZAR 3 month JIBAR) Fixed 4.000% ZAR 16/06/2023 (825,119) (0.01)2,401,365,000 Floating (ZAR 3 month JIBAR) Fixed 5.250% ZAR 17/03/2026 (1,529,653) (0.02)
UNREALISED LOSS ON INTEREST RATE SWAPS (7,267,972) (0.11)
Credit Default Swaps17,120,000 Fixed 1.000% Floating (China Government
International Bond)USD 20/12/2020 (9,704) (0.00)
10,470,000 Fixed 1.000% Floating (China GovernmentInternational Bond)
USD 20/12/2020 (6,671) (0.00)
12,580,000 Fixed 1.000% Floating (China GovernmentInternational Bond)
USD 20/12/2020 (7,989) (0.00)
4,750,000 Fixed 1.000% Floating (China GovernmentInternational Bond)
USD 20/12/2020 (3,097) (0.00)
5,540,000 Fixed 1.000% Floating (China GovernmentInternational Bond)
USD 20/12/2020 (3,650) (0.00)
11,640,000 Fixed 1.000% Floating (China GovernmentInternational Bond)
USD 20/12/2020 (7,535) (0.00)
16,980,000 Fixed 1.000% Floating (China GovernmentInternational Bond)
USD 20/12/2020 (11,033) (0.00)
25,350,000 Fixed 1.000% Floating (China GovernmentInternational Bond)
USD 20/12/2020 (17,159) (0.00)
26,290,000 Fixed 1.000% Floating (China GovernmentInternational Bond)
USD 20/12/2020 (17,540) (0.00)
13,880,000 Fixed 1.000% Floating (China GovernmentInternational Bond)
USD 20/12/2020 (9,059) (0.00)
2,090,000 Fixed 1.000% Floating (China GovernmentInternational Bond)
USD 20/12/2020 (1,363) (0.00)
6,480,000 Fixed 1.000% Floating (China GovernmentInternational Bond)
USD 20/12/2020 (4,256) (0.00)
1,660,000 Fixed 1.000% Floating (China GovernmentInternational Bond)
USD 20/12/2020 (1,014) (0.00)
20,370,000 Fixed 1.000% Floating (China GovernmentInternational Bond)
USD 20/12/2020 (12,548) (0.00)
9,710,000 Fixed 1.000% Floating (China GovernmentInternational Bond)
USD 20/12/2020 (5,767) (0.00)
6,470,000 Fixed 1.000% Floating (China GovernmentInternational Bond)
USD 20/12/2020 (3,748) (0.00)
10,140,000 Fixed 1.000% Floating (China GovernmentInternational Bond)
USD 20/12/2020 (5,903) (0.00)
21,100,000 Fixed 1.000% Floating (China GovernmentInternational Bond)
USD 20/12/2020 (11,943) (0.00)
24,530,000 Fixed 1.000% Floating (China GovernmentInternational Bond)
USD 20/06/2021 (154,138) (0.00)
5,800,000 Fixed 1.000% Floating (China GovernmentInternational Bond)
USD 20/06/2021 (36,297) (0.00)
1,300,000 Fixed 1.000% Floating (China GovernmentInternational Bond)
USD 20/06/2021 (8,206) (0.00)
8,950,000 Fixed 1.000% Floating (China GovernmentInternational Bond)
USD 20/06/2021 (56,231) (0.00)
17,430,000 Fixed 1.000% Floating (China GovernmentInternational Bond)
USD 20/06/2021 (112,596) (0.00)
32,790,000 Fixed 1.000% Floating (China GovernmentInternational Bond)
USD 20/06/2021 (214,494) (0.01)
24,790,000 Fixed 1.000% Floating (China GovernmentInternational Bond)
USD 20/06/2021 (162,041) (0.00)
30,740,000 Fixed 1.000% Floating (China GovernmentInternational Bond)
USD 20/06/2021 (197,794) (0.01)
14,110,000 Fixed 1.000% Floating (China GovernmentInternational Bond)
USD 20/06/2021 (90,833) (0.00)
7,140,000 Fixed 1.000% Floating (China GovernmentInternational Bond)
USD 20/06/2021 (44,864) (0.00)
31,370,000 Fixed 1.000% Floating (China GovernmentInternational Bond)
USD 20/06/2021 (198,319) (0.01)
13,010,000 Fixed 1.000% Floating (China GovernmentInternational Bond)
USD 20/06/2021 (82,938) (0.00)
15,160,000 Fixed 1.000% Floating (China GovernmentInternational Bond)
USD 20/06/2021 (95,672) (0.00)
21,570,000 Fixed 1.000% Floating (China GovernmentInternational Bond)
USD 20/06/2021 (123,388) (0.00)
25,000,000 Fixed 1.000% Floating (China GovernmentInternational Bond)
USD 20/06/2021 (142,981) (0.00)
Goldman Sachs Funds—Emerging Markets Debt PortfolioSchedule of InvestmentsAs at 30 November 2020
The accompanying notes are an integral part of these financial statements.
240

Swap Contracts – (Continued)
Net LocalNotionalAmount Pay Receive Currency Maturity Date
UnrealisedLossUSD
% ofShareholders’
Equity
Credit Default Swaps – (Continued)27,910,000 Fixed 1.000% Floating (China Government
International Bond)USD 20/06/2021 (160,346) (0.00)
20,150,000 Fixed 1.000% Floating (China GovernmentInternational Bond)
USD 20/06/2021 (117,326) (0.00)
7,340,000 Fixed 1.000% Floating (China GovernmentInternational Bond)
USD 20/06/2021 (42,738) (0.00)
30,740,000 Fixed 1.000% Floating (China GovernmentInternational Bond)
USD 20/06/2021 (178,988) (0.01)
13,070,000 Fixed 1.000% Floating (China GovernmentInternational Bond)
USD 20/06/2021 (74,080) (0.00)
20,480,000 Fixed 1.000% Floating (China GovernmentInternational Bond)
USD 20/06/2021 (115,813) (0.00)
8,860,000 Fixed 1.000% Floating (China GovernmentInternational Bond)
USD 20/06/2021 (48,134) (0.00)
24,540,000 Fixed 1.000% Floating (China GovernmentInternational Bond)
USD 20/06/2021 (135,231) (0.00)
7,470,000 Fixed 1.000% Floating (China GovernmentInternational Bond)
USD 20/06/2021 (41,071) (0.00)
2,490,000 Fixed 1.000% Floating (China GovernmentInternational Bond)
USD 20/06/2021 (13,690) (0.00)
25,860,000 Fixed 1.000% Floating (China GovernmentInternational Bond)
USD 20/06/2021 (135,797) (0.00)
21,760,000 Fixed 1.000% Floating (China GovernmentInternational Bond)
USD 20/06/2021 (107,105) (0.00)
11,550,000 Fixed 1.000% Floating (China GovernmentInternational Bond)
USD 20/06/2021 (59,733) (0.00)
23,420,000 Fixed 1.000% Floating (China GovernmentInternational Bond)
USD 20/06/2021 (122,348) (0.00)
4,410,000 Fixed 1.000% Floating (China GovernmentInternational Bond)
USD 20/12/2021 (47,171) (0.00)
25,870,000 Fixed 1.000% Floating (China GovernmentInternational Bond)
USD 20/12/2021 (276,526) (0.01)
60,640,000 Fixed 1.000% Floating (China GovernmentInternational Bond)
USD 20/12/2021 (549,899) (0.01)
8,430,000 Fixed 1.000% Floating (China GovernmentInternational Bond)
USD 20/06/2022 (93,209) (0.00)
16,010,000 Fixed 1.000% Floating (China GovernmentInternational Bond)
USD 20/06/2022 (156,259) (0.00)
3,650,000 Floating (Ukraine GovernmentInternational Bond)
Fixed 5.000% USD 20/12/2024 (200,034) (0.01)
2,940,000 Floating (Argentine RepublicGovernment International Bond)
Fixed 5.000% USD 20/12/2025 (15,118) (0.00)
UNREALISED LOSS ON CREDIT DEFAULT SWAPS (4,551,387) (0.07)
TOTAL UNREALISED LOSS ON SWAP CONTRACTS (11,819,359) (0.18)
MARKET VALUE OF INVESTMENTS(cost USD 6,547,495,869)
6,221,313,606 95.71
OTHER ASSETS AND LIABILITIES 279,093,015 4.29
SHAREHOLDERS’ EQUITY 6,500,406,621 100.00
Goldman Sachs Funds—Emerging Markets Debt PortfolioSchedule of InvestmentsAs at 30 November 2020
The accompanying notes are an integral part of these financial statements.
241

TOTAL INVESTMENTSMarket Value
USD
% ofShareholders’
Equity
Total Investments excluding derivatives (cost USD 6,547,108,394) 6,157,966,752 94.73Unrealised gain on futures contracts 2,397,611 0.04Unrealised loss on futures contracts (86,434) (0.00)Unrealised gain on share class specific futures contracts 2,814 0.00Unrealised loss on share class specific futures contracts (23,055) (0.00)Unrealised gain on forward currency contracts 67,849,700 1.05Unrealised loss on forward currency contracts (73,312,475) (1.13)Unrealised gain on forward currency contracts held for hedging purposes 56,575,523 0.87Unrealised loss on forward currency contracts held for hedging purposes (698,117) (0.01)Market value of purchased options (cost USD 900,333) 2,552,273 0.04Market value of written options (cost USD (512,858)) (978,745) (0.02)Unrealised gain on swap contracts 20,887,118 0.32Unrealised loss on swap contracts (11,819,359) (0.18)Other Assets and Liabilities 279,093,015 4.29
Shareholders’ Equity 6,500,406,621 100.00
The Futures Commission Merchant was Goldman Sachs & Co. LLC.
The counterparties for forward currency contracts were Bank of America N.A., Barclays Bank Plc., BNP Paribas S.A., Citibank N.A., Credit Suisse International, Deutsche Bank AG, HSBCBank Plc., JP Morgan Chase Bank N.A., Morgan Stanley & Co. International Plc., Natwest Markets Plc., Royal Bank of Canada, Standard Chartered Bank, State Street Bank & Trust, UBSAG and Westpac Banking Corp.
The counterparties for options contracts were BNP Paribas S.A., Citibank N.A., JP Morgan Chase Bank N.A., Morgan Stanley & Co. International Plc. and UBS AG.
The counterparties for swap contracts were Bank of America N.A., Barclays Bank Plc., Barclays Capital, Inc., Citibank N.A., Credit Suisse, Deutsche Bank AG, JP Morgan Chase BankN.A. and Morgan Stanley & Co. International Plc.
The maximum individual counterparty exposure as at 30 November 2020 is 0.46% of the NAV.
(a) Interest rates represent either the stated coupon rate, annualised discounted yield on date of purchase for discounted securities, or, for floating rate securities, the current reset ratewhich is based upon interest rates indices.
(b) Maturity dates represent either the stated date on the security, or the next interest reset date for floating rate securities or the prerefunded date for those type of securities.(c) This security has a step up coupon which moves to the second rate at a set date in the future.(d) Variable and floating coupon rates are those quoted as of 30 November 2020.(e) 144A: This security is issued to qualified institutional investors, pursuant to private placements, and is transferable as stated in rule 144A of the US Securities Act of 1933.(f) A related party to Goldman Sachs Funds.(g) The yield for this fund as at 30 November 2020 was 0.120%.
Goldman Sachs Funds—Emerging Markets Debt PortfolioSchedule of InvestmentsAs at 30 November 2020
The accompanying notes are an integral part of these financial statements.
242

Holdings Security Description Currency Interest Rate(a) Maturity Date(b)Market Value
USD
% ofShareholders’
Equity
Transferable securities admitted to an official exchange listing
Bonds – 76.00%Azerbaijan
510,000 Azerbaijan International Bond USD 4.750% 18/03/2024 556,697 0.83600,000 State Oil Co. of the Azerbaijan Republic USD 4.750% 13/03/2023 640,440 0.96
1,197,137 1.79
Bermuda540,000 China Oil & Gas Group Ltd. USD 5.500% 25/01/2023 555,272 0.83900,000 Geopark Ltd. USD 6.500% 21/09/2024 915,609 1.37
1,470,881 2.20
Brazil470,000 Banco Bradesco S.A. USD 3.200% 27/01/2025 486,920 0.73410,000 Banco do Brasil S.A. USD 3.875% 10/10/2022 426,400 0.63900,000 BRF S.A. USD 4.750% 22/05/2024 963,281 1.44
1,876,601 2.80
British Virgin Islands210,000 Fortune Star BVI Ltd. USD 5.950% 29/01/2023 215,644 0.32600,000 Fortune Star BVI Ltd. USD 6.750% 02/07/2023 627,562 0.94640,000 Huarong Finance 2019 Co., Ltd. USD 3.750% 29/05/2024 671,200 1.00680,000 Huarong Finance II Co., Ltd. USD 5.000% 19/11/2025 759,794 1.14200,000 Studio City Finance Ltd. USD 7.250% 11/02/2024 209,250 0.31
2,483,450 3.71
Canada580,000 MEGlobal Canada ULC USD 5.000% 18/05/2025 646,247 0.97
Cayman Islands1,140,000 21Vianet Group, Inc. USD 7.875% 15/10/2021 1,165,650 1.74680,000 Bright Scholar Education Holdings Ltd. USD 7.450% 31/07/2022 707,200 1.06400,000 Mumtalakat Sukuk Holding Co. USD 5.625% 27/02/2024 427,250 0.64430,000 NagaCorp Ltd. USD 7.950% 06/07/2024 445,789 0.66
2,745,889 4.10
Chile1,060,000 Empresa Nacional de Telecomunicaciones S.A. USD 4.875% 30/10/2024 1,145,794 1.71
Colombia1,120,000 Banco Bilbao Vizcaya Argentaria Colombia S.A. USD 4.875% 21/04/2025 1,194,550 1.79810,000 Banco de Bogota S.A. USD 5.375% 19/02/2023 863,157 1.29660,000 Bancolombia S.A. USD 3.000% 29/01/2025 682,387 1.02330,000 Ecopetrol S.A. USD 5.875% 18/09/2023 368,369 0.55
3,108,463 4.65
Cyprus1,250,000 MHP S.E. USD 7.750% 10/05/2024 1,367,969 2.04
Dominican Republic670,000 Dominican Republic International Bond USD 5.500% 27/01/2025 730,928 1.09
Egypt200,000 Egypt Government International Bond USD 4.550% 20/11/2023 205,281 0.31440,000 Egypt Government International Bond USD 5.750% 29/05/2024 463,788 0.69
669,069 1.00
Ghana700,000 Ghana Government International Bond USD 7.875% 07/08/2023 758,516 1.13
Guatemala600,000 Guatemala Government Bond USD 5.750% 06/06/2022 634,875 0.95
Honduras400,000 Honduras Government International Bond USD 8.750% 16/12/2020 400,980 0.60
Hong Kong1,070,000 Far East Horizon Ltd. USD 3.375% 18/02/2025 1,072,842 1.60
Goldman Sachs Funds—Emerging Markets Short Duration Bond PortfolioSchedule of InvestmentsAs at 30 November 2020
The accompanying notes are an integral part of these financial statements.
243

Holdings Security Description Currency Interest Rate(a) Maturity Date(b)Market Value
USD
% ofShareholders’
Equity
Bonds – (Continued)India
1,190,000 Adani Green Energy UP Ltd. Via Prayatna Developers Pvt Ltd. ViaParampujya Solar Energy Pvt Ltd. USD 6.250% 10/12/2024 1,312,533 1.96
250,000 Reliance Industries Ltd. USD 5.400% 14/02/2022 263,047 0.40
1,575,580 2.36
Indonesia200,000 Perusahaan Gas Negara Tbk PT USD 5.125% 16/05/2024 221,969 0.33
1,070,000 Tower Bersama Infrastructure Tbk PT USD 4.250% 21/01/2025 1,106,614 1.66
1,328,583 1.99
Isle Of Man410,000 Sasol Financing International Ltd. USD 4.500% 14/11/2022 414,613 0.62
Israel840,000 Leviathan Bond Ltd. 144A(c) USD 5.750% 30/06/2023 886,200 1.32
Japan200,000 SoftBank Group Corp. USD 5.500% 20/04/2023 212,000 0.32
Luxembourg760,000 Altice Financing S.A. EUR 2.250% 15/01/2025 891,146 1.33280,000 Tupy Overseas S.A. USD 6.625% 17/07/2024 287,420 0.43
1,178,566 1.76
Mauritius620,000 HTA Group Ltd. USD 7.000% 18/12/2025 667,856 1.00600,000 MTN Mauritius Investments Ltd. USD 5.373% 13/02/2022 617,625 0.92460,000 MTN Mauritius Investments Ltd. USD 4.755% 11/11/2024 479,478 0.72
1,764,959 2.64
Mexico870,000 Banco Nacional de Comercio Exterior SNC USD 4.375% 14/10/2025 948,164 1.42200,000 BBVA Bancomer S.A. USD 1.875% 18/09/2025 201,000 0.30
1,010,000 Cemex SAB de CV USD 5.700% 11/01/2025 1,034,934 1.55270,000 Credito Real SAB de CV SOFOM ER USD 7.250% 20/07/2023 277,045 0.41180,000 Petroleos Mexicanos EUR 2.500% 21/08/2021 216,020 0.32210,000 Petroleos Mexicanos EUR 5.125% 15/03/2023 259,345 0.39150,000 Petroleos Mexicanos USD 6.875% 16/10/2025 156,485 0.23320,000 Trust Fibra Uno USD 5.250% 30/01/2026 355,900 0.53
3,448,893 5.15
Morocco290,000 Morocco Government International Bond EUR 1.375% 30/03/2026 349,609 0.52
Netherlands530,000 Bharti Airtel International Netherlands BV USD 5.350% 20/05/2024 584,739 0.87790,000 Greenko Dutch BV USD 4.875% 24/07/2022 798,887 1.19680,000 IHS Netherlands Holdco BV USD 7.125% 18/03/2025 716,763 1.07580,000 NE Property BV EUR 1.750% 23/11/2024 703,131 1.05280,000 OCI NV EUR 3.125% 01/11/2024 344,654 0.51430,000 Petrobras Global Finance BV USD 6.250% 17/03/2024 492,148 0.74300,000 PPF Telecom Group BV EUR 2.125% 31/01/2025 366,562 0.55450,000 VEON Holdings BV USD 7.250% 26/04/2023 499,430 0.75
4,506,314 6.73
Nigeria850,000 Nigeria Government International Bond USD 5.625% 27/06/2022 880,812 1.32800,000 SEPLAT Petroleum Development Co., Plc. USD 9.250% 01/04/2023 826,125 1.23990,000 United Bank for Africa Plc. USD 7.750% 08/06/2022 1,009,955 1.51
2,716,892 4.06
Paraguay590,000 Paraguay Government International Bond USD 4.625% 25/01/2023 631,945 0.94
Peru420,000 Cementos Pacasmayo SAA USD 4.500% 08/02/2023 426,300 0.64
Romania520,000 Romanian Government International Bond EUR 2.875% 28/10/2024 683,901 1.02
South Africa340,000 Growthpoint Properties International Pty Ltd. USD 5.872% 02/05/2023 358,594 0.54
Goldman Sachs Funds—Emerging Markets Short Duration Bond PortfolioSchedule of InvestmentsAs at 30 November 2020
The accompanying notes are an integral part of these financial statements.
244

Holdings Security Description Currency Interest Rate(a) Maturity Date(b)Market Value
USD
% ofShareholders’
Equity
Bonds – (Continued)South Africa – (Continued)
190,000 South Africa Government International Bond USD 5.875% 30/05/2022 202,766 0.30220,000 South Africa Government International Bond USD 4.665% 17/01/2024 233,715 0.35250,000 South Africa Government International Bond USD 5.875% 16/09/2025 279,922 0.42400,000 Transnet SOC Ltd. USD 4.000% 26/07/2022 401,812 0.60
1,476,809 2.21
Supranationals400,000 African Export-Import Bank USD 5.250% 11/10/2023 437,596 0.65330,000 Black Sea Trade & Development Bank USD 3.500% 25/06/2024 347,206 0.52200,000 Eastern & Southern African Trade & Development Bank USD 5.375% 14/03/2022 204,644 0.31560,000 Eastern & Southern African Trade & Development Bank USD 4.875% 23/05/2024 585,015 0.87410,000 Mongolian Mining Corp. Via Energy Resources LLC USD 9.250% 15/04/2024 364,900 0.55
1,939,361 2.90
Turkey360,000 Akbank TAS USD 5.000% 24/10/2022 362,194 0.54640,000 Anadolu Efes Biracilik ve Malt Sanayii AS USD 3.375% 01/11/2022 650,400 0.97500,000 KOC Holding AS USD 5.250% 15/03/2023 512,656 0.76400,000 KOC Holding AS USD 6.500% 11/03/2025 425,875 0.64940,000 Mersin Uluslararasi Liman Isletmeciligi AS USD 5.375% 15/11/2024 988,909 1.48480,000 Turkey Government International Bond USD 6.250% 26/09/2022 495,825 0.74200,000 Turkey Government International Bond USD 5.750% 22/03/2024 205,219 0.31200,000 Turkey Government International Bond USD 6.350% 10/08/2024 209,594 0.31330,000 Turkey Government International Bond USD 4.250% 13/03/2025 321,183 0.48300,000 Turkiye Garanti Bankasi AS USD 5.875% 16/03/2023 307,453 0.46220,000 Turkiye Vakiflar Bankasi TAO USD 5.250% 05/02/2025 212,987 0.32350,000 Yapi ve Kredi Bankasi AS USD 5.850% 21/06/2024 352,625 0.53
5,044,920 7.54
Ukraine320,000 Ukraine Government International Bond USD 7.750% 01/09/2023 348,560 0.52480,000 Ukraine Government International Bond USD 7.750% 01/09/2024 525,975 0.79
874,535 1.31
United States524,995 Brazil Loan Trust 1 USD 5.477% 24/07/2023 545,995 0.82600,000 Kosmos Energy Ltd. USD 7.125% 04/04/2026 543,000 0.81
1,088,995 1.63
TOTAL BONDS(cost USD 49,093,176) 50,858,616 76.00
Holdings Security DescriptionMarket Value
USD
% ofShareholders’
Equity
Mutual Funds – 1.50%Ireland
999,743 Goldman Sachs US$ Treasury Liquid Reserves Fund (X Distribution Class)(d)(e) 999,743 1.50
TOTAL MUTUAL FUNDS(cost USD 999,743) 999,743 1.50
TOTAL TRANSFERABLE SECURITIES ADMITTED TO AN OFFICIAL EXCHANGE LISTING(cost USD 50,092,919) 51,858,359 77.50
Holdings Security Description Currency Interest Rate(a) Maturity Date(b)Market Value
USD
% ofShareholders’
Equity
Transferable securities dealt in another regulated market
Bonds – 19.66%Bermuda
920,000 Credicorp Ltd. USD 2.750% 17/06/2025 953,580 1.43390,000 Tengizchevroil Finance Co. International Ltd. USD 2.625% 15/08/2025 403,065 0.60
1,356,645 2.03
Brazil620,000 Embraer S.A. USD 5.150% 15/06/2022 636,178 0.95
Goldman Sachs Funds—Emerging Markets Short Duration Bond PortfolioSchedule of InvestmentsAs at 30 November 2020
The accompanying notes are an integral part of these financial statements.
245

Holdings Security Description Currency Interest Rate(a) Maturity Date(b)Market Value
USD
% ofShareholders’
Equity
Bonds – (Continued)Cayman Islands
1,200,000 Grupo Aval Ltd. USD 4.750% 26/09/2022 1,254,300 1.881,090,000 Industrial Senior Trust USD 5.500% 01/11/2022 1,146,033 1.71
2,400,333 3.59
Chile400,000 Embotelladora Andina S.A. USD 5.000% 01/10/2023 443,000 0.66
India520,000 Adani Ports & Special Economic Zone Ltd. USD 3.950% 19/01/2022 533,162 0.80
Luxembourg670,000 Rumo Luxembourg SARL USD 5.875% 18/01/2025 713,550 1.06
Mexico260,000 Alfa SAB de CV USD 5.250% 25/03/2024 285,634 0.43200,000 Alpha Holding S.A. de CV USD 9.000% 10/02/2025 151,906 0.23880,000 Banco Santander Mexico S.A. Institucion de Banca Multiple Grupo
Financiero Santander USD 5.375% 17/04/2025 996,961 1.49900,000 Grupo Cementos de Chihuahua SAB de CV USD 5.250% 23/06/2024 934,313 1.39
2,368,814 3.54
Netherlands290,000 Metinvest BV USD 7.750% 23/04/2023 307,989 0.46200,000 Syngenta Finance NV USD 4.441% 24/04/2023 211,344 0.31500,000 VEON Holdings BV USD 4.000% 09/04/2025 528,125 0.79
1,047,458 1.56
Panama300,000 Banco Latinoamericano de Comercio Exterior S.A. USD 2.375% 14/09/2025 307,926 0.46520,000 Multibank, Inc. USD 4.375% 09/11/2022 535,600 0.80
843,526 1.26
Peru300,000 Corp Lindley S.A. USD 6.750% 23/11/2021 311,156 0.47
1,550,000 Inretail Pharma S.A. USD 5.375% 02/05/2023 1,614,422 2.41870,000 SAN Miguel Industrias Pet S.A. USD 4.500% 18/09/2022 890,527 1.33
2,816,105 4.21
TOTAL BONDS(cost USD 12,738,252) 13,158,771 19.66
TOTAL TRANSFERABLE SECURITIES DEALT IN ANOTHER REGULATED MARKET(cost USD 12,738,252) 13,158,771 19.66
MARKET VALUE OF INVESTMENTS EXCLUDING DERIVATIVES(cost USD 62,831,171) 65,017,130 97.16
Futures Contracts – (0.02%)
Number ofContracts Security Description
CommitmentMarket Value
USD
UnrealisedGainUSD
% ofShareholders’
Equity
USD114 US Treasury Notes 2YR Futures 31/03/2021 Long 25,174,407 5,243 0.01
UNREALISED GAIN ON FUTURES CONTRACTS 5,243 0.01
Number ofContracts Security Description
CommitmentMarket Value
USD
UnrealisedLossUSD
% ofShareholders’
Equity
EUR(10) German Federal Republic Bonds 2YR Futures 08/12/2020 Short (1,347,454) (960) (0.00)(13) German Federal Republic Bonds 5Y Futures 08/12/2020 Short (2,111,604) (6,070) (0.01)
(3,459,058) (7,030) (0.01)
USD(121) US Treasury Notes 5YR Futures 31/03/2021 Short (15,245,055) (12,810) (0.02)
UNREALISED LOSS ON FUTURES CONTRACTS (19,840) (0.03)
Goldman Sachs Funds—Emerging Markets Short Duration Bond PortfolioSchedule of InvestmentsAs at 30 November 2020
The accompanying notes are an integral part of these financial statements.
246
Forward Currency Contracts – (0.09%)
CurrencyAmountBought Currency
AmountSold
MaturityDate
UnrealisedLossUSD
% ofShareholders’
Equity
USD 3,728,683 EUR 3,152,671 21/01/2021 (58,870) (0.09)
UNREALISED LOSS ON FORWARD CURRENCY CONTRACTS (58,870) (0.09)
Share Class Specific Forward Currency Contracts – 0.65%
CurrencyAmountBought Currency
AmountSold
MaturityDate
UnrealisedGainUSD
% ofShareholders’
Equity
GBP 323,511 USD 417,364 13/01/2021 15,547 0.02EUR 24,106,354 USD 28,529,707 21/01/2021 431,155 0.65
UNREALISED GAIN ON FORWARD CURRENCY CONTRACTS HELD FOR HEDGING PURPOSES 446,702 0.67
CurrencyAmountBought Currency
AmountSold
MaturityDate
UnrealisedLossUSD
% ofShareholders’
Equity
USD 1,078,573 EUR 907,249 21/01/2021 (11,376) (0.02)
UNREALISED LOSS ON FORWARD CURRENCY CONTRACTS HELD FOR HEDGING PURPOSES (11,376) (0.02)
MARKET VALUE OF INVESTMENTS(cost USD 62,831,171) 65,378,989 97.70
OTHER ASSETS AND LIABILITIES 1,536,747 2.30
SHAREHOLDERS’ EQUITY 66,915,736 100.00
TOTAL INVESTMENTSMarket Value
USD
% ofShareholders’
Equity
Total Investments excluding derivatives (cost USD 62,831,171) 65,017,130 97.16Unrealised gain on futures contracts 5,243 0.01Unrealised loss on futures contracts (19,840) (0.03)Unrealised loss on forward currency contracts (58,870) (0.09)Unrealised gain on forward currency contracts held for hedging purposes 446,702 0.67Unrealised loss on forward currency contracts held for hedging purposes (11,376) (0.02)Other Assets and Liabilities 1,536,747 2.30
Shareholders’ Equity 66,915,736 100.00
The Futures Commission Merchant was Morgan Stanley & Co., Inc.
The counterparties for forward currency contracts were Barclays Bank Plc., BNP Paribas S.A., Deutsche Bank AG, HSBC Bank Plc., Royal Bank of Canada, State Street Bank & Trust andUBS AG.
The maximum individual counterparty exposure as at 30 November 2020 is 0.33% of the NAV.
(a) Interest rates represent either the stated coupon rate, annualised discounted yield on date of purchase for discounted securities, or, for floating rate securities, the current reset ratewhich is based upon interest rates indices.
(b) Maturity dates represent either the stated date on the security, or the next interest reset date for floating rate securities or the prerefunded date for those type of securities.(c) 144A: This security is issued to qualified institutional investors, pursuant to private placements, and is transferable as stated in rule 144A of the US Securities Act of 1933.(d) A related party to Goldman Sachs Funds.(e) The yield for this fund as at 30 November 2020 was 0.120%.
Goldman Sachs Funds—Emerging Markets Short Duration Bond PortfolioSchedule of InvestmentsAs at 30 November 2020
The accompanying notes are an integral part of these financial statements.
247

Holdings Security Description Currency Interest Rate(a) Maturity Date(b)Market Value
EUR
% ofShareholders’
Equity
Transferable securities admitted to an official exchange listing
Bonds – 80.17%Austria
700,000 Raiffeisen Bank International AG EUR 6.625% 18/05/2021 721,420 0.24500,000 Raiffeisen Bank International AG EUR 6.000% 16/10/2023 578,115 0.20
1,299,535 0.44
Belgium1,500,000 KBC Group NV EUR 0.750% 01/03/2022 1,520,055 0.51
Brazil400,000 Brazilian Government International Bond EUR 2.875% 01/04/2021 403,687 0.14
1,220,000 Vale S.A. EUR 3.750% 10/01/2023 1,303,875 0.44
1,707,562 0.58
British Virgin Islands550,000 Fortune Star BVI Ltd. EUR 4.350% 06/05/2023 552,406 0.19
Bulgaria670,000 Bulgaria Government International Bond EUR 2.000% 26/03/2022 690,519 0.23
Canada1,175,000 Bausch Health Cos., Inc. EUR 4.500% 15/05/2023 1,186,750 0.40
Cayman Islands1,350,000 Mizuho Financial Group Cayman 2 Ltd. USD 4.200% 18/07/2022 1,184,642 0.40
Denmark700,000 Jyske Bank A/S EUR 0.875% 03/12/2021 708,540 0.24100,000 Nykredit Realkredit A/S EUR 0.750% 14/07/2021 100,557 0.03400,000 Nykredit Realkredit A/S EUR 0.500% 19/01/2022 402,708 0.14750,000 Nykredit Realkredit A/S(c) EUR 0.093% 02/06/2022 753,757 0.25
1,300,000 Nykredit Realkredit A/S EUR 0.250% 20/01/2023 1,309,789 0.44
3,275,351 1.10
Egypt310,000 Egypt Government International Bond USD 4.550% 20/11/2023 265,254 0.09
Finland700,000 Nokia OYJ EUR 2.375% 15/05/2025 740,775 0.25
France1,900,000 ALD S.A. EUR 0.375% 19/10/2023 1,915,409 0.65350,000 Banijay Entertainment SASU EUR 3.500% 01/03/2025 354,197 0.12650,000 Banque Federative du Credit Mutuel S.A. EUR 3.000% 21/05/2024 716,462 0.24650,000 BNP Paribas S.A. GBP 5.750% 24/01/2022 766,687 0.26750,000 BNP Paribas S.A. EUR 1.125% 22/11/2023 777,847 0.26
1,500,000 BPCE S.A. EUR 1.125% 18/01/2023 1,541,775 0.52600,000 BPCE S.A. EUR 4.625% 18/07/2023 673,494 0.23
2,200,000 Capgemini S.E. EUR 1.250% 15/04/2022 2,241,228 0.76500,000 Credit Agricole S.A.(c) EUR 0.291% 20/04/2022 504,795 0.17700,000 Crown European Holdings S.A. EUR 3.375% 15/05/2025 759,307 0.26800,000 Elis S.A. EUR 1.554% 03/04/2025 778,568 0.26625,000 Loxam SAS EUR 3.500% 03/05/2023 632,319 0.21800,000 Nexans S.A. EUR 3.750% 08/08/2023 854,772 0.29
2,900,000 Pernod Ricard S.A. EUR (0.171%) 24/10/2023 2,913,833 0.98150,000 RCI Banque S.A. EUR 2.250% 29/03/2021 151,185 0.05
1,000,000 RCI Banque S.A. EUR 0.750% 12/01/2022 1,007,100 0.342,700,000 Societe Generale S.A. EUR (0.238%) 01/04/2022 2,744,577 0.921,300,000 Societe Generale S.A. EUR 0.500% 13/01/2023 1,317,173 0.441,000,000 SPIE S.A. EUR 3.125% 22/03/2024 1,061,500 0.36
21,712,228 7.32
Germany1,100,000 Bundesobligation—Series 182 EUR (0.757%) 10/10/2025 1,141,448 0.381,300,000 Commerzbank AG EUR 0.500% 06/12/2021 1,311,232 0.44250,000 Commerzbank AG EUR 1.500% 21/09/2022 257,925 0.09250,000 Commerzbank AG EUR 0.500% 13/09/2023 254,408 0.08700,000 Deutsche Pfandbriefbank AG EUR 0.875% 29/01/2021 701,316 0.24
1,450,000 E.ON S.E. EUR (0.281%) 24/10/2022 1,457,859 0.491,750,000 HeidelbergCement AG EUR 2.250% 30/03/2023 1,836,992 0.627,090,000 KFW EUR (0.639%) 04/07/2024 7,254,772 2.45900,000 Volkswagen Financial Services AG EUR 0.625% 01/04/2022 909,153 0.31900,000 Volkswagen Leasing GmbH EUR 0.250% 16/02/2021 901,125 0.30
Goldman Sachs Funds—Euro Short Duration Bond Plus PortfolioSchedule of InvestmentsAs at 30 November 2020
The accompanying notes are an integral part of these financial statements.
248

Holdings Security Description Currency Interest Rate(a) Maturity Date(b)Market Value
EUR
% ofShareholders’
Equity
Bonds – (Continued)Germany – (Continued)
200,000 Volkswagen Leasing GmbH EUR 2.125% 04/04/2022 206,156 0.071,100,000 Volkswagen Leasing GmbH EUR 2.375% 06/09/2022 1,148,378 0.39
17,380,764 5.86
Guernsey3,400,000 Credit Suisse Group Funding Guernsey Ltd. EUR 1.250% 14/04/2022 3,468,374 1.17
Hong Kong850,000 CNAC HK Finbridge Co., Ltd. EUR 1.750% 14/06/2022 844,422 0.29
Indonesia1,220,000 Indonesia Government International Bond EUR 2.875% 08/07/2021 1,243,790 0.42510,000 Indonesia Government International Bond EUR 2.625% 14/06/2023 542,194 0.18
1,785,984 0.60
Ireland1,750,000 Abbott Ireland Financing DAC EUR 0.875% 27/09/2023 1,806,332 0.61450,000 AerCap Ireland Capital DAC Via AerCap Global Aviation Trust USD 4.450% 16/12/2021 386,324 0.13900,000 AerCap Ireland Capital DAC Via AerCap Global Aviation Trust USD 3.950% 01/02/2022 770,794 0.26
1,200,000 AIB Group Plc. EUR 1.500% 29/03/2023 1,240,440 0.421,150,000 Dell Bank International DAC EUR 0.625% 17/10/2022 1,161,765 0.39
5,365,655 1.81
Isle Of Man750,000 Playtech Plc. EUR 3.750% 12/10/2023 771,300 0.26
Italy725,000 Banco BPM SpA EUR 1.750% 28/01/2025 748,331 0.25350,000 FCA Bank SpA EUR (0.285%) 15/11/2021 354,319 0.12
1,150,000 FCA Bank SpA EUR 0.250% 28/02/2023 1,154,623 0.39625,000 FCA Bank SpA EUR 0.125% 16/11/2023 624,650 0.21400,000 Ferrovie dello Stato Italiane SpA EUR 3.500% 13/12/2021 414,436 0.14820,000 Italy Buoni Poliennali Del Tesoro EUR (0.458%) 15/07/2022 839,655 0.28
7,130,000 Italy Buoni Poliennali Del Tesoro 144A(d) EUR 3.750% 01/05/2021 7,256,771 2.459,820,000 Italy Buoni Poliennali Del Tesoro 144A(d) EUR 3.750% 01/08/2021 10,100,067 3.41675,000 Nexi SpA EUR 1.750% 31/10/2024 688,014 0.23975,000 Telecom Italia SpA EUR 4.000% 11/04/2024 1,052,907 0.36775,000 UniCredit SpA EUR 6.950% 31/10/2022 868,969 0.29
24,102,742 8.13
Japan400,000 Mizuho Financial Group, Inc. EUR 0.523% 10/06/2024 408,284 0.14200,000 Nissan Motor Co., Ltd. EUR 1.940% 15/09/2023 206,942 0.07775,000 SoftBank Group Corp. EUR 4.000% 20/04/2023 814,556 0.27
2,500,000 Sumitomo Mitsui Banking Corp. EUR (0.262%) 19/01/2022 2,535,825 0.86500,000 Takeda Pharmaceutical Co., Ltd.(c) EUR 0.573% 21/11/2022 507,605 0.17
1,900,000 Takeda Pharmaceutical Co., Ltd. EUR 1.125% 21/11/2022 1,948,412 0.66
6,421,624 2.17
Jersey900,000 Glencore Finance Europe Ltd. EUR 1.250% 17/03/2021 900,576 0.30650,000 Glencore Finance Europe Ltd. EUR 2.750% 01/04/2021 651,547 0.22550,000 Glencore Finance Europe Ltd. EUR 1.625% 18/01/2022 558,398 0.19700,000 LHC3 Plc. EUR 4.125% 15/08/2024 716,282 0.24
2,826,803 0.95
Kazakhstan400,000 Kazakhstan Government International Bond EUR 1.550% 09/11/2023 414,100 0.14
Luxembourg1,700,000 Blackstone Property Partners Europe Holdings SARL EUR 1.400% 06/07/2022 1,728,101 0.581,240,000 Gazprom PJSC Via Gaz Capital S.A. EUR 2.949% 24/01/2024 1,300,450 0.441,125,000 Greif Nevada Holdings, Inc. SCS EUR 7.375% 15/07/2021 1,170,731 0.391,125,000 Lincoln Financing SARL EUR 3.625% 01/04/2024 1,144,688 0.39200,000 Logicor Financing SARL EUR 0.500% 30/04/2021 200,512 0.07
2,100,000 Logicor Financing SARL EUR 1.500% 14/11/2022 2,155,629 0.731,900,000 Medtronic Global Holdings S.C.A. EUR 0.375% 07/03/2023 1,925,764 0.651,600,000 Prologis International Funding II S.A. EUR 2.875% 04/04/2022 1,663,792 0.56575,000 SIG Combibloc PurchaseCo SARL EUR 2.125% 18/06/2025 603,129 0.20
11,892,796 4.01
Goldman Sachs Funds—Euro Short Duration Bond Plus PortfolioSchedule of InvestmentsAs at 30 November 2020
The accompanying notes are an integral part of these financial statements.
249
Holdings Security Description Currency Interest Rate(a) Maturity Date(b)Market Value
EUR
% ofShareholders’
Equity
Bonds – (Continued)Macedonia
380,000 North Macedonia Government International Bond EUR 3.975% 24/07/2021 389,025 0.13
Mexico1,240,000 Petroleos Mexicanos EUR 2.500% 21/08/2021 1,240,581 0.42500,000 Petroleos Mexicanos EUR 5.125% 15/03/2023 514,766 0.17
1,755,347 0.59
Netherlands1,000,000 ABN AMRO Bank NV EUR 6.375% 27/04/2021 1,026,150 0.351,450,000 ABN AMRO Bank NV EUR 7.125% 06/07/2022 1,615,170 0.542,000,000 Cooperatieve Rabobank UA EUR 4.125% 14/09/2022 2,154,260 0.732,150,000 Digital Dutch Finco BV EUR 0.125% 15/10/2022 2,162,943 0.731,450,000 E.ON International Finance BV EUR 0.750% 30/11/2022 1,476,376 0.50901,000 EDP Finance BV EUR 4.125% 20/01/2021 906,505 0.31
1,100,000 Fiat Chrysler Automobiles NV EUR 3.375% 07/07/2023 1,173,865 0.403,000,000 ING Groep NV EUR 0.750% 09/03/2022 3,038,280 1.02650,000 ING Groep NV USD 3.150% 29/03/2022 561,339 0.19900,000 JAB Holdings BV EUR 1.500% 24/11/2021 915,516 0.31
1,100,000 LeasePlan Corp. NV EUR (0.218%) 24/05/2021 1,106,358 0.37350,000 LeasePlan Corp. NV EUR 0.750% 03/10/2022 355,719 0.12725,000 OI European Group BV EUR 3.125% 15/11/2024 751,419 0.25700,000 PACCAR Financial Europe BV EUR (0.131%) 03/03/2023 702,114 0.24850,000 Petrobras Global Finance BV EUR 4.250% 02/10/2023 931,148 0.31725,000 PPF Telecom Group BV EUR 2.125% 31/01/2025 738,492 0.25600,000 Q-Park Holding I BV EUR 1.500% 01/03/2025 580,452 0.20
1,100,000 RELX Finance BV EUR 0.375% 22/03/2021 1,101,716 0.37400,000 RELX Finance BV EUR (0.144%) 18/03/2024 401,928 0.14725,000 United Group BV EUR 4.875% 01/07/2024 742,297 0.25500,000 Upjohn Finance BV EUR 0.816% 23/06/2022 507,550 0.17100,000 Volkswagen International Finance NV—Series 4Y EUR 0.500% 30/03/2021 100,288 0.03
1,400,000 Vonovia Finance BV EUR 0.875% 10/06/2022 1,424,416 0.48700,000 Vonovia Finance BV EUR 0.125% 06/04/2023 705,320 0.24700,000 VZ Vendor Financing BV EUR 2.500% 31/01/2024 708,113 0.24600,000 Wintershall Dea Finance BV EUR 0.452% 25/09/2023 606,276 0.20
26,494,010 8.94
New Zealand1,600,000 ANZ New Zealand Int’l Ltd. EUR 0.625% 01/06/2021 1,608,720 0.54
Norway625,000 Adevinta ASA EUR 2.625% 15/11/2025 637,025 0.22
Spain1,500,000 Banco Bilbao Vizcaya Argentaria S.A. EUR 0.750% 11/09/2022 1,527,495 0.521,400,000 Banco de Sabadell S.A. EUR 0.875% 05/03/2023 1,425,004 0.482,200,000 Banco Santander S.A. EUR 1.375% 09/02/2022 2,244,110 0.762,100,000 CaixaBank S.A. EUR 1.125% 12/01/2023 2,153,172 0.73600,000 CaixaBank S.A. EUR 1.750% 24/10/2023 630,330 0.21
2,400,000 Merlin Properties Socimi S.A. EUR 2.375% 23/05/2022 2,472,888 0.83700,000 Santander Consumer Finance S.A. EUR 0.500% 04/10/2021 705,516 0.24
9,340,000 Spain Government Bond EUR 0.050% 31/01/2021 9,349,807 3.155,930,000 Spain Government Bond EUR 0.350% 30/07/2023 6,074,218 2.051,290,000 Spain Government Bond 144A(d) EUR 2.750% 31/10/2024 1,456,126 0.49
28,038,666 9.46
Sweden1,700,000 Akelius Residential Property AB EUR 1.500% 23/01/2022 1,732,691 0.58609,600 Intrum AB EUR 2.750% 15/07/2022 615,672 0.21575,000 Intrum AB EUR 3.125% 15/07/2024 579,514 0.20825,000 Scania CV AB EUR 0.500% 06/10/2023 834,545 0.28500,000 Verisure Holding AB EUR 3.500% 15/05/2023 510,625 0.17200,000 Verisure Holding AB(c) EUR 5.000% 15/04/2025 205,473 0.07
4,478,520 1.51
Switzerland2,500,000 UBS Group AG EUR 1.750% 16/11/2022 2,601,575 0.88
Turkey1,400,000 Turkey Government International Bond EUR 4.350% 12/11/2021 1,434,125 0.48
United Kingdom1,000,000 Barclays Bank Plc. GBP 10.000% 21/05/2021 1,160,833 0.39
Goldman Sachs Funds—Euro Short Duration Bond Plus PortfolioSchedule of InvestmentsAs at 30 November 2020
The accompanying notes are an integral part of these financial statements.
250

Holdings Security Description Currency Interest Rate(a) Maturity Date(b)Market Value
EUR
% ofShareholders’
Equity
Bonds – (Continued)United Kingdom – (Continued)
1,000,000 Barclays Plc.(c) EUR 0.625% 14/11/2023 1,012,820 0.34204,000 BAT International Finance Plc. EUR 3.625% 09/11/2021 211,295 0.07200,000 BAT International Finance Plc. EUR 0.024% 23/05/2022 202,872 0.07550,000 BAT International Finance Plc. EUR 2.375% 19/01/2023 579,211 0.19950,000 FCE Bank Plc. EUR 0.869% 13/09/2021 949,050 0.32
2,000,000 Imperial Brands Finance Plc. EUR 0.500% 27/07/2021 2,006,700 0.68200,000 Imperial Brands Finance Plc. 144A(d) USD 3.750% 21/07/2022 173,680 0.06300,000 Lloyds Banking Group Plc.(c) EUR 0.625% 15/01/2024 303,486 0.10600,000 NatWest Markets Plc.(c) EUR 0.233% 18/06/2021 601,944 0.20
1,750,000 NatWest Markets Plc. EUR 0.625% 02/03/2022 1,765,838 0.60
8,967,729 3.02
United States1,400,000 Altria Group, Inc. EUR (0.015%) 15/02/2023 1,431,094 0.48800,000 American Honda Finance Corp. EUR 1.600% 20/04/2022 820,216 0.28
2,975,000 American International Group, Inc. EUR 1.500% 08/06/2023 3,086,562 1.041,350,000 American Tower Corp. USD 3.500% 31/01/2023 1,196,875 0.40550,000 AT&T, Inc. EUR 1.875% 04/12/2020 550,066 0.19700,000 AT&T, Inc. EUR 2.650% 17/12/2021 716,338 0.24950,000 AT&T, Inc. EUR 1.450% 01/06/2022 970,273 0.33
1,050,000 AT&T, Inc. EUR 1.050% 05/09/2023 1,082,939 0.36800,000 Ball Corp. EUR 4.375% 15/12/2023 889,816 0.30950,000 Bank of America Corp.(c) EUR 0.736% 07/02/2022 951,986 0.32
1,050,000 Bank of America Corp. EUR 1.625% 14/09/2022 1,085,942 0.371,775,000 Bank of America Corp.(c) EUR 0.260% 04/05/2023 1,788,064 0.602,700,000 Becton Dickinson and Co. EUR 1.401% 24/05/2023 2,791,746 0.94750,000 Belden, Inc. EUR 2.875% 15/09/2025 763,073 0.26
1,000,000 Berry Global, Inc. EUR 1.000% 15/01/2025 992,610 0.33650,000 Capital One Financial Corp. USD 2.600% 11/05/2023 568,031 0.19550,000 Citigroup, Inc. USD 2.900% 08/12/2021 469,445 0.16400,000 Citigroup, Inc. EUR 0.500% 29/01/2022 404,040 0.14550,000 Citigroup, Inc. USD 4.050% 30/07/2022 485,672 0.16
2,450,000 Citigroup, Inc.(c) EUR 0.000% 21/03/2023 2,463,916 0.83750,000 Colfax Corp. EUR 3.250% 15/05/2025 767,595 0.26
1,250,000 Crown Castle International Corp. USD 5.250% 15/01/2023 1,143,189 0.391,450,000 Expedia Group, Inc. EUR 2.500% 03/06/2022 1,485,336 0.50550,000 Fidelity National Information Services, Inc. EUR 0.400% 15/01/2021 550,253 0.19500,000 Fidelity National Information Services, Inc. EUR 0.125% 21/05/2021 500,825 0.17
1,100,000 Fidelity National Information Services, Inc. EUR 0.125% 03/12/2022 1,107,524 0.37800,000 Fidelity National Information Services, Inc. EUR 0.750% 21/05/2023 817,696 0.28
1,800,000 Fiserv, Inc. EUR 0.375% 01/07/2023 1,825,002 0.621,200,000 General Electric Co. EUR 0.375% 17/05/2022 1,207,296 0.411,950,000 International Flavors & Fragrances, Inc. EUR 0.500% 25/09/2021 1,959,535 0.66750,000 JPMorgan Chase & Co. EUR 1.500% 26/10/2022 776,018 0.26
1,350,000 JPMorgan Chase & Co. USD 3.375% 01/05/2023 1,202,097 0.411,450,000 Kellogg Co. EUR 0.800% 17/11/2022 1,479,043 0.502,100,000 McDonald’s Corp. EUR (0.222%) 15/11/2023 2,176,923 0.73500,000 McKesson Corp. EUR 0.625% 17/08/2021 503,285 0.17
1,500,000 Metropolitan Life Global Funding I �I� EUR 1.250% 17/09/2021 1,519,740 0.51650,000 Morgan Stanley EUR 2.375% 31/03/2021 656,104 0.22
1,100,000 Morgan Stanley EUR (0.241%) 02/12/2022 1,127,489 0.38950,000 Morgan Stanley EUR 1.875% 30/03/2023 996,018 0.34
2,425,000 Nasdaq, Inc. EUR 1.750% 19/05/2023 2,528,208 0.85700,000 Netflix, Inc. EUR 3.000% 15/06/2025 749,952 0.25800,000 Sealed Air Corp. EUR 4.500% 15/09/2023 874,336 0.29
1,350,000 Wells Fargo & Co. EUR 1.500% 12/09/2022 1,392,241 0.471,000,000 WP Carey, Inc. EUR 2.000% 20/01/2023 1,039,880 0.35
51,894,289 17.50
TOTAL BONDS(cost EUR 236,270,370) 237,708,672 80.17
Goldman Sachs Funds—Euro Short Duration Bond Plus PortfolioSchedule of InvestmentsAs at 30 November 2020
The accompanying notes are an integral part of these financial statements.
251
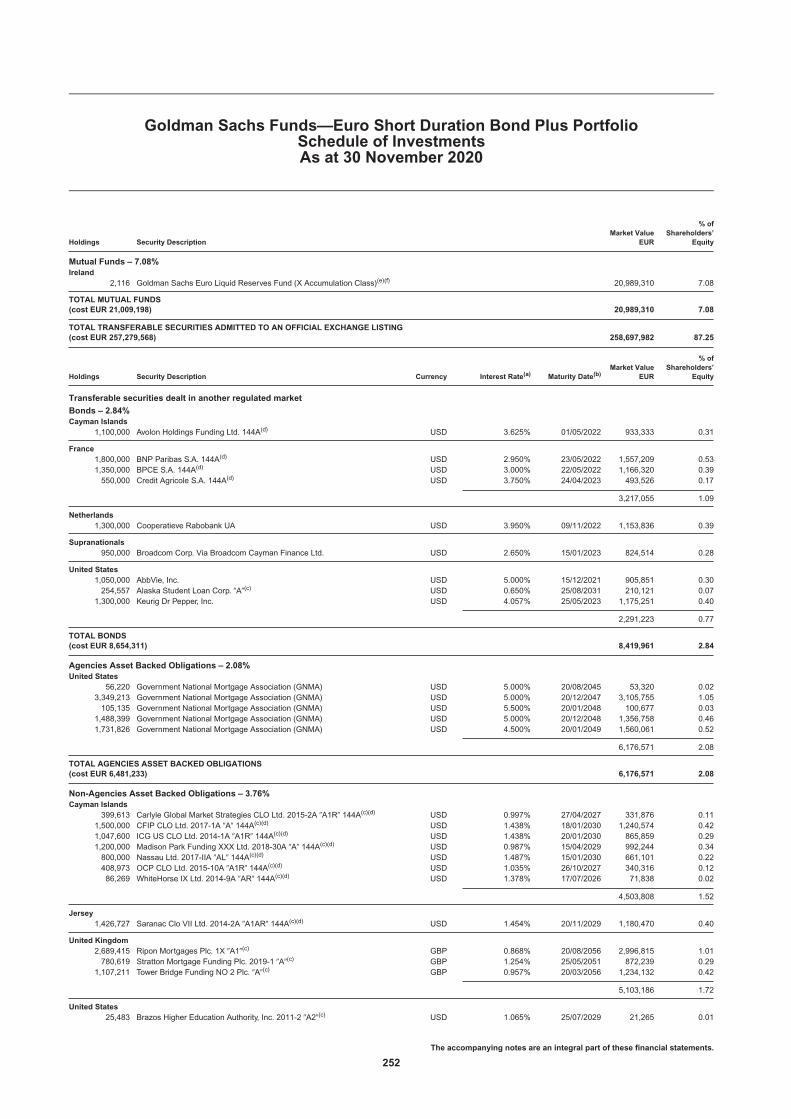
Holdings Security DescriptionMarket Value
EUR
% ofShareholders’
Equity
Mutual Funds – 7.08%Ireland
2,116 Goldman Sachs Euro Liquid Reserves Fund (X Accumulation Class)(e)(f) 20,989,310 7.08
TOTAL MUTUAL FUNDS(cost EUR 21,009,198) 20,989,310 7.08
TOTAL TRANSFERABLE SECURITIES ADMITTED TO AN OFFICIAL EXCHANGE LISTING(cost EUR 257,279,568) 258,697,982 87.25
Holdings Security Description Currency Interest Rate(a) Maturity Date(b)Market Value
EUR
% ofShareholders’
Equity
Transferable securities dealt in another regulated market
Bonds – 2.84%Cayman Islands
1,100,000 Avolon Holdings Funding Ltd. 144A(d) USD 3.625% 01/05/2022 933,333 0.31
France1,800,000 BNP Paribas S.A. 144A(d) USD 2.950% 23/05/2022 1,557,209 0.531,350,000 BPCE S.A. 144A(d) USD 3.000% 22/05/2022 1,166,320 0.39550,000 Credit Agricole S.A. 144A(d) USD 3.750% 24/04/2023 493,526 0.17
3,217,055 1.09
Netherlands1,300,000 Cooperatieve Rabobank UA USD 3.950% 09/11/2022 1,153,836 0.39
Supranationals950,000 Broadcom Corp. Via Broadcom Cayman Finance Ltd. USD 2.650% 15/01/2023 824,514 0.28
United States1,050,000 AbbVie, Inc. USD 5.000% 15/12/2021 905,851 0.30254,557 Alaska Student Loan Corp. �A�(c) USD 0.650% 25/08/2031 210,121 0.07
1,300,000 Keurig Dr Pepper, Inc. USD 4.057% 25/05/2023 1,175,251 0.40
2,291,223 0.77
TOTAL BONDS(cost EUR 8,654,311) 8,419,961 2.84
Agencies Asset Backed Obligations – 2.08%United States
56,220 Government National Mortgage Association (GNMA) USD 5.000% 20/08/2045 53,320 0.023,349,213 Government National Mortgage Association (GNMA) USD 5.000% 20/12/2047 3,105,755 1.05105,135 Government National Mortgage Association (GNMA) USD 5.500% 20/01/2048 100,677 0.03
1,488,399 Government National Mortgage Association (GNMA) USD 5.000% 20/12/2048 1,356,758 0.461,731,826 Government National Mortgage Association (GNMA) USD 4.500% 20/01/2049 1,560,061 0.52
6,176,571 2.08
TOTAL AGENCIES ASSET BACKED OBLIGATIONS(cost EUR 6,481,233) 6,176,571 2.08
Non-Agencies Asset Backed Obligations – 3.76%Cayman Islands
399,613 Carlyle Global Market Strategies CLO Ltd. 2015-2A �A1R� 144A(c)(d) USD 0.997% 27/04/2027 331,876 0.111,500,000 CFIP CLO Ltd. 2017-1A �A� 144A(c)(d) USD 1.438% 18/01/2030 1,240,574 0.421,047,600 ICG US CLO Ltd. 2014-1A �A1R� 144A(c)(d) USD 1.438% 20/01/2030 865,859 0.291,200,000 Madison Park Funding XXX Ltd. 2018-30A �A� 144A(c)(d) USD 0.987% 15/04/2029 992,244 0.34800,000 Nassau Ltd. 2017-IIA �AL� 144A(c)(d) USD 1.487% 15/01/2030 661,101 0.22408,973 OCP CLO Ltd. 2015-10A �A1R� 144A(c)(d) USD 1.035% 26/10/2027 340,316 0.1286,269 WhiteHorse IX Ltd. 2014-9A �AR� 144A(c)(d) USD 1.378% 17/07/2026 71,838 0.02
4,503,808 1.52
Jersey1,426,727 Saranac Clo VII Ltd. 2014-2A �A1AR� 144A(c)(d) USD 1.454% 20/11/2029 1,180,470 0.40
United Kingdom2,689,415 Ripon Mortgages Plc. 1X �A1�(c) GBP 0.868% 20/08/2056 2,996,815 1.01780,619 Stratton Mortgage Funding Plc. 2019-1 �A�(c) GBP 1.254% 25/05/2051 872,239 0.29
1,107,211 Tower Bridge Funding NO 2 Plc. �A�(c) GBP 0.957% 20/03/2056 1,234,132 0.42
5,103,186 1.72
United States25,483 Brazos Higher Education Authority, Inc. 2011-2 �A2�(c) USD 1.065% 25/07/2029 21,265 0.01
Goldman Sachs Funds—Euro Short Duration Bond Plus PortfolioSchedule of InvestmentsAs at 30 November 2020
The accompanying notes are an integral part of these financial statements.
252

Holdings Security Description Currency Interest Rate(a) Maturity Date(b)Market Value
EUR
% ofShareholders’
Equity
Non-Agencies Asset Backed Obligations – (Continued)United States – (Continued)
51,772 Montana Higher Education Student Assistance Corp. 2012-1 �A2�(c) USD 1.151% 20/05/2030 43,313 0.01366,617 Pennsylvania Higher Education Assistance Agency 2006-1 �A3�(c) USD 0.355% 25/10/2035 297,071 0.10
361,649 0.12
TOTAL NON-AGENCIES ASSET BACKED OBLIGATIONS(cost EUR 11,452,444) 11,149,113 3.76
TOTAL TRANSFERABLE SECURITIES DEALT IN ANOTHER REGULATED MARKET(cost EUR 26,587,988) 25,745,645 8.68
Other Transferable Securities
Bonds – 1.24%Qatar
1,500,000 Qatar National Bank SAQ EUR 0.000% 01/12/2020 1,500,026 0.51
United States1,900,000 AbbVie, Inc. EUR 1.500% 15/11/2023 1,989,946 0.67200,000 Broadcom, Inc. USD 3.125% 15/04/2021 168,185 0.06
2,158,131 0.73
TOTAL BONDS(cost EUR 3,629,924) 3,658,157 1.24
TOTAL OTHER TRANSFERABLE SECURITIES(cost EUR 3,629,924) 3,658,157 1.24
MARKET VALUE OF INVESTMENTS EXCLUDING DERIVATIVES(cost EUR 287,497,480) 288,101,784 97.17
Futures Contracts – 0.05%
Number ofContracts Security Description
CommitmentMarket Value
EUR
UnrealisedGainEUR
% ofShareholders’
Equity
EUR1,117 German Federal Republic Bonds 2YR Futures 08/12/2020 Long 125,472,610 41,175 0.02231 German Federal Republic Bonds 5Y Futures 08/12/2020 Long 31,279,710 100,270 0.0319 Short Euro Italian Government Bond Futures 08/12/2020 Long 2,166,190 20,240 0.01
158,918,510 161,685 0.06
USD(2) US Treasury Long Bond Futures 22/03/2021 Short (291,307) 82 0.003 US Treasury Notes 10YR Futures 22/03/2021 Long 345,403 391 0.0048 US Treasury Notes 5YR Futures 31/03/2021 Long 5,041,578 5,002 0.005 US Treasury Ultra Long Bond Futures 22/03/2021 Long 898,905 295 0.009 US Treasury Ultra Long Notes 10YR Futures 22/03/2021 Long 1,177,942 1,669 0.00
7,172,521 7,439 0.00
UNREALISED GAIN ON FUTURES CONTRACTS 169,124 0.06
Number ofContracts Security Description
CommitmentMarket Value
EUR
UnrealisedLossEUR
% ofShareholders’
Equity
AUD2 Australian Treasury Bonds 10YR Futures 15/12/2020 Long 182,967 (632) (0.00)
EUR(4) German Federal Republic Bonds 30YR Futures 08/12/2020 Short (906,320) (6,820) (0.01)
USD(68) US Treasury Notes 2YR Futures 31/03/2021 Short (12,518,289) (3,543) (0.00)
UNREALISED LOSS ON FUTURES CONTRACTS (10,995) (0.01)
Forward Currency Contracts – 0.11%
CurrencyAmountBought Currency
AmountSold
MaturityDate
UnrealisedGainEUR
% ofShareholders’
Equity
AUD 2,189,000 USD 1,559,846 16/12/2020 46,287 0.02CAD 2,019,141 USD 1,538,346 16/12/2020 19,148 0.00EUR 194,000 GBP 172,546 16/12/2020 1,684 0.00
Goldman Sachs Funds—Euro Short Duration Bond Plus PortfolioSchedule of InvestmentsAs at 30 November 2020
The accompanying notes are an integral part of these financial statements.
253
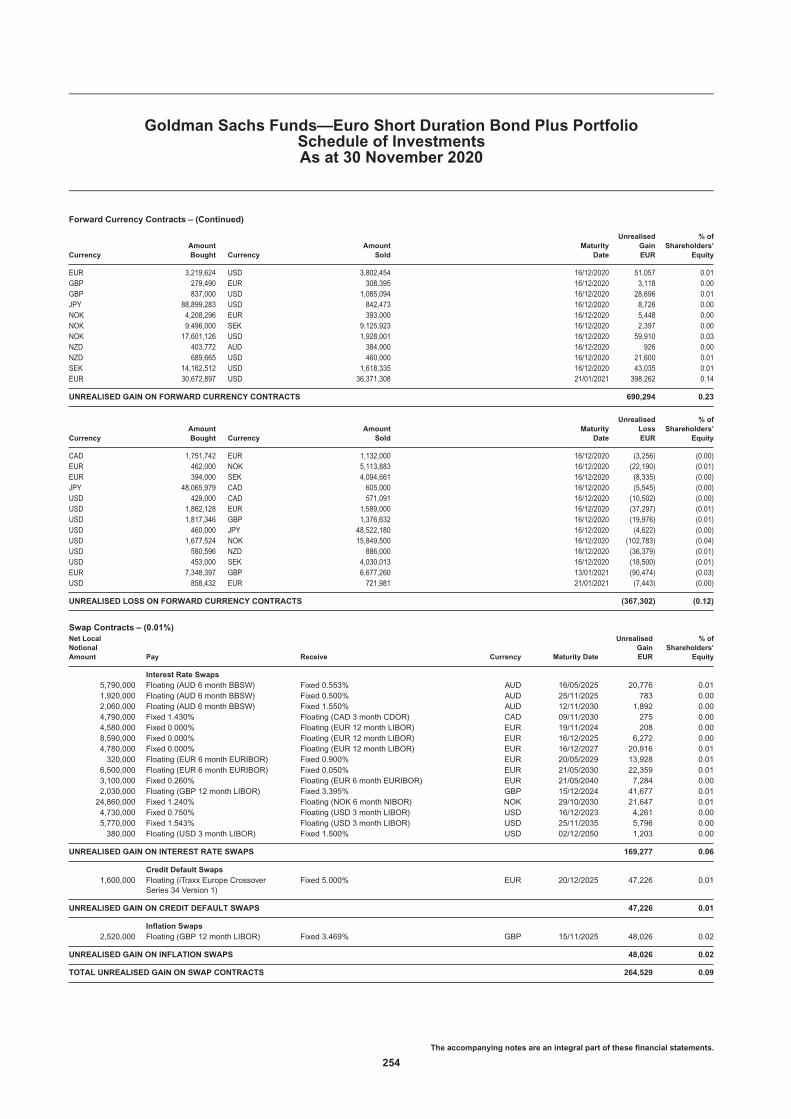
Forward Currency Contracts – (Continued)
CurrencyAmountBought Currency
AmountSold
MaturityDate
UnrealisedGainEUR
% ofShareholders’
Equity
EUR 3,219,624 USD 3,802,454 16/12/2020 51,057 0.01GBP 279,490 EUR 308,395 16/12/2020 3,118 0.00GBP 837,000 USD 1,085,094 16/12/2020 28,696 0.01JPY 88,899,283 USD 842,473 16/12/2020 8,726 0.00NOK 4,208,296 EUR 393,000 16/12/2020 5,448 0.00NOK 9,496,000 SEK 9,125,923 16/12/2020 2,397 0.00NOK 17,601,126 USD 1,928,001 16/12/2020 59,910 0.03NZD 403,772 AUD 384,000 16/12/2020 926 0.00NZD 689,665 USD 460,000 16/12/2020 21,600 0.01SEK 14,162,512 USD 1,618,335 16/12/2020 43,035 0.01EUR 30,672,897 USD 36,371,308 21/01/2021 398,262 0.14
UNREALISED GAIN ON FORWARD CURRENCY CONTRACTS 690,294 0.23
CurrencyAmountBought Currency
AmountSold
MaturityDate
UnrealisedLossEUR
% ofShareholders’
Equity
CAD 1,751,742 EUR 1,132,000 16/12/2020 (3,256) (0.00)EUR 462,000 NOK 5,113,883 16/12/2020 (22,190) (0.01)EUR 394,000 SEK 4,094,661 16/12/2020 (8,335) (0.00)JPY 48,065,979 CAD 605,000 16/12/2020 (5,545) (0.00)USD 429,000 CAD 571,091 16/12/2020 (10,502) (0.00)USD 1,862,128 EUR 1,589,000 16/12/2020 (37,297) (0.01)USD 1,817,346 GBP 1,376,632 16/12/2020 (19,976) (0.01)USD 460,000 JPY 48,522,180 16/12/2020 (4,622) (0.00)USD 1,677,524 NOK 15,849,500 16/12/2020 (102,783) (0.04)USD 580,596 NZD 886,000 16/12/2020 (36,379) (0.01)USD 453,000 SEK 4,030,013 16/12/2020 (18,500) (0.01)EUR 7,348,397 GBP 6,677,260 13/01/2021 (90,474) (0.03)USD 858,432 EUR 721,981 21/01/2021 (7,443) (0.00)
UNREALISED LOSS ON FORWARD CURRENCY CONTRACTS (367,302) (0.12)
Swap Contracts – (0.01%)Net LocalNotionalAmount Pay Receive Currency Maturity Date
UnrealisedGainEUR
% ofShareholders’
Equity
Interest Rate Swaps5,790,000 Floating (AUD 6 month BBSW) Fixed 0.553% AUD 16/05/2025 20,776 0.011,920,000 Floating (AUD 6 month BBSW) Fixed 0.500% AUD 25/11/2025 783 0.002,060,000 Floating (AUD 6 month BBSW) Fixed 1.550% AUD 12/11/2030 1,892 0.004,790,000 Fixed 1.430% Floating (CAD 3 month CDOR) CAD 09/11/2030 275 0.004,580,000 Fixed 0.000% Floating (EUR 12 month LIBOR) EUR 19/11/2024 208 0.008,590,000 Fixed 0.000% Floating (EUR 12 month LIBOR) EUR 16/12/2025 6,272 0.004,780,000 Fixed 0.000% Floating (EUR 12 month LIBOR) EUR 16/12/2027 20,916 0.01320,000 Floating (EUR 6 month EURIBOR) Fixed 0.900% EUR 20/05/2029 13,928 0.01
6,500,000 Floating (EUR 6 month EURIBOR) Fixed 0.050% EUR 21/05/2030 22,359 0.013,100,000 Fixed 0.260% Floating (EUR 6 month EURIBOR) EUR 21/05/2040 7,284 0.002,030,000 Floating (GBP 12 month LIBOR) Fixed 3.395% GBP 15/12/2024 41,677 0.0124,860,000 Fixed 1.240% Floating (NOK 6 month NIBOR) NOK 29/10/2030 21,647 0.014,730,000 Fixed 0.750% Floating (USD 3 month LIBOR) USD 16/12/2023 4,261 0.005,770,000 Fixed 1.543% Floating (USD 3 month LIBOR) USD 25/11/2035 5,796 0.00380,000 Floating (USD 3 month LIBOR) Fixed 1.500% USD 02/12/2050 1,203 0.00
UNREALISED GAIN ON INTEREST RATE SWAPS 169,277 0.06
Credit Default Swaps1,600,000 Floating (iTraxx Europe Crossover
Series 34 Version 1)Fixed 5.000% EUR 20/12/2025 47,226 0.01
UNREALISED GAIN ON CREDIT DEFAULT SWAPS 47,226 0.01
Inflation Swaps2,520,000 Floating (GBP 12 month LIBOR) Fixed 3.469% GBP 15/11/2025 48,026 0.02
UNREALISED GAIN ON INFLATION SWAPS 48,026 0.02
TOTAL UNREALISED GAIN ON SWAP CONTRACTS 264,529 0.09
Goldman Sachs Funds—Euro Short Duration Bond Plus PortfolioSchedule of InvestmentsAs at 30 November 2020
The accompanying notes are an integral part of these financial statements.
254

Swap Contracts – (Continued)
Net LocalNotionalAmount Pay Receive Currency Maturity Date
UnrealisedLossEUR
% ofShareholders’
Equity
Interest Rate Swaps7,890,000 Floating (AUD 6 month BBSW) Fixed 0.920% AUD 04/09/2028 (6,579) (0.00)2,900,000 Floating (AUD 6 month BBSW) Fixed 1.240% AUD 28/10/2030 (18,044) (0.01)4,380,000 Floating (AUD 6 month BBSW) Fixed 1.250% AUD 09/11/2030 (6,122) (0.00)1,050,000 Floating (AUD 6 month BBSW) Fixed 1.000% AUD 16/12/2030 (2,820) (0.00)9,780,000 Floating (CAD 3 month CDOR) Fixed 0.700% CAD 18/11/2023 (725) (0.00)10,340,000 Floating (CAD 3 month CDOR) Fixed 1.250% CAD 16/12/2023 (380) (0.00)9,100,000 Floating (CAD 3 month CDOR) Fixed 0.810% CAD 30/09/2024 (11,125) (0.01)23,900,000 Floating (CAD 3 month CDOR) Fixed 0.960% CAD 09/11/2024 (10,470) (0.00)5,620,000 Floating (CAD 3 month CDOR) Fixed 0.813% CAD 17/11/2024 (1,573) (0.00)4,980,000 Floating (CHF 6 month LIBOR) Fixed 0.000% CHF 16/12/2027 (2,160) (0.00)6,900,000 Fixed 0.000% Floating (EUR 6 month LIBOR) EUR 16/12/2022 (6,223) (0.00)3,060,000 Fixed 0.000% Floating (EUR 6 month LIBOR) EUR 16/12/2023 (4,375) (0.00)6,630,000 Fixed 0.000% Floating (EUR 6 month LIBOR) EUR 16/12/2024 (12,818) (0.01)4,250,000 Fixed 0.000% Floating (EUR 12 month LIBOR) EUR 18/05/2025 (673) (0.00)28,720,000 Fixed 0.000% Floating (EUR 6 month LIBOR) EUR 16/12/2025 (55,634) (0.02)2,830,000 Fixed 0.000% Floating (EUR 6 month LIBOR) EUR 16/12/2030 (9,510) (0.00)340,000 Fixed 0.100% Floating (EUR 6 month EURIBOR) EUR 02/12/2050 (66) (0.00)670,000 Fixed 0.250% Floating (EUR 6 month EURIBOR) EUR 16/12/2050 (2,101) (0.00)
767,700,000 Fixed 0.144% Floating (JPY 6 month LIBOR) JPY 13/11/2030 (1,958) (0.00)23,320,000 Floating (NOK 6 month NIBOR) Fixed 0.750% NOK 16/12/2025 (13,995) (0.01)49,920,000 Floating (SEK 3 month STIBOR) Fixed 0.000% SEK 16/12/2025 (5,977) (0.00)18,740,000 Floating (USD 1 month LIBOR) Floating (USD 3 month LIBOR) USD 25/07/2024 (5,070) (0.00)11,130,000 Floating (USD 3 month SOFR) Floating (USD 3 month LIBOR) USD 10/11/2024 (6,953) (0.00)370,000 Fixed 2.500% Floating (USD 3 month LIBOR) USD 20/05/2029 (18,048) (0.01)
3,130,000 Fixed 1.190% Floating (USD 3 month LIBOR) USD 10/11/2030 (7,539) (0.00)5,290,000 Floating (USD 3 month LIBOR) Fixed 1.245% USD 24/11/2030 (2,770) (0.00)
UNREALISED LOSS ON INTEREST RATE SWAPS (213,708) (0.07)
Credit Default Swaps5,350,000 Fixed 1.000% Floating (iTraxx Europe
Series 34 Version 1)EUR 20/12/2025 (28,175) (0.01)
15,775,000 Floating (The Markit CDX North AmericaInvestment Grade 28 Version 1 Index)
Fixed 1.000% USD 20/06/2022 (57,576) (0.02)
UNREALISED LOSS ON CREDIT DEFAULT SWAPS (85,751) (0.03)
TOTAL UNREALISED LOSS ON SWAP CONTRACTS (299,459) (0.10)
MARKET VALUE OF INVESTMENTS(cost EUR 287,497,480)
288,547,975 97.32
OTHER ASSETS AND LIABILITIES 7,959,416 2.68
SHAREHOLDERS’ EQUITY 296,507,391 100.00
TOTAL INVESTMENTSMarket Value
EUR
% ofShareholders’
Equity
Total Investments excluding derivatives (cost EUR 287,497,480) 288,101,784 97.17Unrealised gain on futures contracts 169,124 0.06Unrealised loss on futures contracts (10,995) (0.01)Unrealised gain on forward currency contracts 690,294 0.23Unrealised loss on forward currency contracts (367,302) (0.12)Unrealised gain on swap contracts 264,529 0.09Unrealised loss on swap contracts (299,459) (0.10)Other Assets and Liabilities 7,959,416 2.68
Shareholders’ Equity 296,507,391 100.00
Goldman Sachs Funds—Euro Short Duration Bond Plus PortfolioSchedule of InvestmentsAs at 30 November 2020
The accompanying notes are an integral part of these financial statements.
255
The Futures Commission Merchant was Goldman Sachs & Co. LLC.
The counterparties for forward currency contracts were Bank of America N.A., Barclays Bank Plc., BNP Paribas S.A., Citibank N.A., Credit Suisse International, JP Morgan Chase BankN.A., Morgan Stanley & Co. International Plc., Natwest Markets Plc. and State Street Bank & Trust.
The counterparties for swap contracts were Credit Suisse and Morgan Stanley & Co. LLC.
The maximum individual counterparty exposure as at 30 November 2020 is 0.14% of the NAV.
(a) Interest rates represent either the stated coupon rate, annualised discounted yield on date of purchase for discounted securities, or, for floating rate securities, the current reset ratewhich is based upon interest rates indices.
(b) Maturity dates represent either the stated date on the security, or the next interest reset date for floating rate securities or the prerefunded date for those type of securities.(c) Variable and floating coupon rates are those quoted as of 30 November 2020.(d) 144A: This security is issued to qualified institutional investors, pursuant to private placements, and is transferable as stated in rule 144A of the US Securities Act of 1933.(e) A related party to Goldman Sachs Funds.(f) The yield for this fund as at 30 November 2020 was (0.570%).
Goldman Sachs Funds—Euro Short Duration Bond Plus PortfolioSchedule of InvestmentsAs at 30 November 2020
The accompanying notes are an integral part of these financial statements.
256

Holdings Security Description Currency Interest Rate(a) Maturity Date(b)Market Value
EUR
% ofShareholders’
Equity
Transferable securities admitted to an official exchange listing
Bonds – 91.72%Austria
125,000 Sappi Papier Holding GmbH EUR 4.000% 01/04/2023 125,071 0.20
Belgium300,000 House of Finance NV EUR 4.375% 15/07/2026 296,778 0.47
British Virgin Islands150,000 Fortune Star BVI Ltd. EUR 4.350% 06/05/2023 150,656 0.24
Canada375,000 Bausch Health Cos., Inc. EUR 4.500% 15/05/2023 378,750 0.60
Cayman Islands180,000 UPCB Finance IV Ltd. EUR 4.000% 15/01/2027 184,040 0.29250,000 UPCB Finance VII Ltd. EUR 3.625% 15/06/2029 258,438 0.41
442,478 0.70
Denmark200,000 Norican A/S EUR 4.500% 15/05/2023 174,000 0.27
Finland150,000 Nokia OYJ EUR 2.375% 15/05/2025 158,738 0.25200,000 Nokia OYJ EUR 2.000% 11/03/2026 207,501 0.33150,000 Nokia OYJ EUR 3.125% 15/05/2028 165,233 0.26
531,472 0.84
France100,000 Accor S.A.(c) EUR 4.375% Perp. 101,750 0.16300,000 Altice France S.A. EUR 2.125% 15/02/2025 290,250 0.46100,000 Altice France S.A. EUR 4.125% 15/01/2029 102,212 0.16350,000 Banijay Group SAS EUR 6.500% 01/03/2026 353,752 0.56100,000 Casino Guichard Perrachon S.A. EUR 4.498% 07/03/2024 91,742 0.14200,000 Casino Guichard Perrachon S.A. EUR 3.580% 07/02/2025 172,192 0.27400,000 CMA CGM S.A. EUR 5.250% 15/01/2025 400,096 0.63200,000 Constellium S.E. EUR 4.250% 15/02/2026 205,230 0.32400,000 Electricite de France S.A.(c) EUR 2.875% Perp. 420,000 0.66300,000 Elis S.A. EUR 1.554% 03/04/2025 291,963 0.46300,000 Faurecia S.E. EUR 2.625% 15/06/2025 305,814 0.48225,000 Faurecia S.E. EUR 2.375% 15/06/2027 227,473 0.36100,000 Faurecia S.E. EUR 3.750% 15/06/2028 105,631 0.17300,000 Getlink S.E. EUR 3.500% 30/10/2025 312,513 0.49150,000 Kapla Holding SAS EUR 3.375% 15/12/2026 146,438 0.23300,000 La Financiere Atalian SASU EUR 5.125% 15/05/2025 283,893 0.45100,000 La Mondiale SAM(c) EUR 4.375% Perp. 105,685 0.17100,000 Loxam SAS EUR 3.500% 03/05/2023 101,171 0.16225,000 Loxam SAS EUR 3.250% 14/01/2025 225,547 0.36250,000 Loxam SAS EUR 5.750% 15/07/2027 250,887 0.40100,000 Nexans S.A. EUR 3.750% 08/08/2023 106,847 0.17100,000 Orano S.A. EUR 3.125% 20/03/2023 105,580 0.17400,000 Orano S.A. EUR 3.375% 23/04/2026 430,246 0.68200,000 Parts Europe S.A. EUR 6.500% 16/07/2025 207,996 0.33300,000 Quatrim SASU EUR 5.875% 15/01/2024 310,500 0.49200,000 RCI Banque S.A.(c) EUR 2.625% 18/02/2030 201,628 0.32300,000 Renault S.A. EUR 2.375% 25/05/2026 301,476 0.47150,000 Rexel S.A. EUR 2.750% 15/06/2026 154,042 0.24300,000 Rubis Terminal Infra SAS EUR 5.625% 15/05/2025 320,139 0.50275,000 SPCM S.A. EUR 2.625% 01/02/2029 280,765 0.44200,000 SPIE S.A. EUR 3.125% 22/03/2024 212,300 0.33
7,125,758 11.23
Germany200,000 ADLER Real Estate AG EUR 2.125% 06/02/2024 201,550 0.32200,000 ADLER Real Estate AG EUR 3.000% 27/04/2026 207,660 0.33200,000 CeramTec BondCo GmbH EUR 5.250% 15/12/2025 203,102 0.32428,000 Cheplapharm Arzneimittel GmbH USD 5.500% 15/01/2028 371,073 0.58200,000 Commerzbank AG(c) EUR 4.000% 05/12/2030 215,250 0.34200,000 Commerzbank AG(c) USD 7.000% Perp. 176,420 0.28200,000 Consus Real Estate AG EUR 9.625% 15/05/2024 214,880 0.34200,000 Deutsche Bank AG EUR 4.500% 19/05/2026 219,808 0.35200,000 Deutsche Bank AG(c) USD 4.296% 24/05/2028 170,064 0.27300,000 Deutsche Pfandbriefbank AG(c) EUR 2.875% 28/06/2027 299,625 0.47
Goldman Sachs Funds—Europe High Yield Bond PortfolioSchedule of InvestmentsAs at 30 November 2020
The accompanying notes are an integral part of these financial statements.
257

Holdings Security Description Currency Interest Rate(a) Maturity Date(b)Market Value
EUR
% ofShareholders’
Equity
Bonds – (Continued)Germany – (Continued)
300,000 IHO Verwaltungs GmbH EUR 3.625% 15/05/2025 309,657 0.49200,000 IHO Verwaltungs GmbH EUR 3.875% 15/05/2027 208,820 0.33200,000 Infineon Technologies AG(c) EUR 2.875% Perp. 207,000 0.33550,000 Kirk Beauty One GmbH EUR 8.750% 15/07/2023 384,824 0.61450,000 Nidda Healthcare Holding GmbH EUR 3.500% 30/09/2024 454,234 0.71200,000 Peach Property Finance GmbH EUR 4.375% 15/11/2025 209,770 0.33300,000 Platin 1426 GmbH EUR 5.375% 15/06/2023 301,749 0.47200,000 ProGroup AG EUR 3.000% 31/03/2026 204,064 0.32100,000 Rebecca Bidco GmbH EUR 5.750% 15/07/2025 105,741 0.17100,000 Schaeffler AG EUR 2.750% 12/10/2025 104,964 0.16200,000 Schaeffler AG EUR 3.375% 12/10/2028 216,091 0.34200,000 SGL Carbon S.E. EUR 4.625% 30/09/2024 186,424 0.29200,000 Techem Verwaltungsgesellschaft 674 mbH EUR 6.000% 30/07/2026 211,322 0.33200,000 Techem Verwaltungsgesellschaft 675 mbH EUR 2.000% 15/07/2025 198,256 0.31300,000 Thyssenkrupp AG EUR 1.875% 06/03/2023 297,741 0.47425,000 Thyssenkrupp AG EUR 2.875% 22/02/2024 423,262 0.67275,000 Vertical Midco GmbH EUR 4.375% 15/07/2027 289,476 0.46100,000 WEPA Hygieneprodukte GmbH EUR 2.875% 15/12/2027 101,505 0.16200,000 ZF Finance GmbH EUR 3.000% 21/09/2025 206,583 0.32200,000 ZF Finance GmbH EUR 2.750% 25/05/2027 200,814 0.32200,000 ZF Finance GmbH EUR 3.750% 21/09/2028 210,807 0.33
7,312,536 11.52
Hungary275,000 OTP Bank Nyrt(c) EUR 2.875% 15/07/2029 279,125 0.44
Ireland150,000 AIB Group Plc.(c) EUR 2.875% 30/05/2031 158,731 0.25200,000 Bank of Ireland Group Plc.(c) EUR 6.000% Perp. 213,314 0.33275,000 Smurfit Kappa Acquisitions ULC EUR 2.875% 15/01/2026 302,892 0.48
674,937 1.06
Isle Of Man275,000 Playtech Plc. EUR 3.750% 12/10/2023 282,810 0.45100,000 Playtech Plc. EUR 4.250% 07/03/2026 103,750 0.16
386,560 0.61
Italy300,000 Atlantia SpA EUR 1.625% 03/02/2025 299,511 0.47200,000 Autostrade per l’Italia SpA EUR 4.375% 16/09/2025 225,058 0.36300,000 Banca Monte dei Paschi di Siena SpA EUR 3.625% 24/09/2024 319,500 0.50300,000 Banca Monte dei Paschi di Siena SpA(c) EUR 5.375% 18/01/2028 267,375 0.42100,000 Banca Monte dei Paschi di Siena SpA(c) EUR 8.000% 22/01/2030 99,000 0.16175,000 Banco BPM SpA EUR 2.500% 21/06/2024 185,444 0.29200,000 Banco BPM SpA(c) EUR 5.000% 14/09/2030 215,750 0.34400,000 Banco BPM SpA(c) EUR 6.125% Perp. 400,000 0.63272,000 Centurion Bidco SpA EUR 5.875% 30/09/2026 277,478 0.44200,000 EVOCA SpA(c) EUR 4.250% 01/11/2026 178,500 0.28200,000 Infrastrutture Wireless Italiane SpA EUR 1.875% 08/07/2026 210,646 0.33100,000 Intesa Sanpaolo SpA EUR 6.625% 13/09/2023 114,496 0.18100,000 Intesa Sanpaolo SpA GBP 5.148% 10/06/2030 127,874 0.20200,000 Intesa Sanpaolo SpA(c) EUR 6.250% Perp. 217,250 0.34137,500 Sisal Group SpA EUR 7.000% 31/07/2023 139,668 0.22175,000 Sisal Pay SpA(c) EUR 3.875% 17/12/2026 174,261 0.28150,000 Telecom Italia SpA GBP 5.875% 19/05/2023 184,202 0.29600,000 Telecom Italia SpA EUR 2.750% 15/04/2025 630,333 0.99200,000 Telecom Italia SpA EUR 2.875% 28/01/2026 211,082 0.33200,000 Telecom Italia SpA EUR 5.250% 17/03/2055 249,611 0.39200,000 UniCredit SpA(c) EUR 2.731% 15/01/2032 202,750 0.32200,000 UniCredit SpA(c) EUR 6.625% Perp. 212,000 0.34200,000 Unione di Banche Italiane SpA(c) EUR 4.450% 15/09/2027 211,250 0.33100,000 Unione di Banche Italiane SpA(c) EUR 5.875% 04/03/2029 112,250 0.18200,000 Unione di Banche Italiane SpA(c) EUR 4.375% 12/07/2029 214,500 0.34200,000 Unipol Gruppo SpA EUR 3.000% 18/03/2025 211,625 0.33
5,891,414 9.28
Goldman Sachs Funds—Europe High Yield Bond PortfolioSchedule of InvestmentsAs at 30 November 2020
The accompanying notes are an integral part of these financial statements.
258

Holdings Security Description Currency Interest Rate(a) Maturity Date(b)Market Value
EUR
% ofShareholders’
Equity
Bonds – (Continued)Japan
850,000 SoftBank Group Corp. EUR 3.125% 19/09/2025 873,783 1.38200,000 SoftBank Group Corp. USD 5.125% 19/09/2027 174,024 0.27
1,047,807 1.65
Jersey225,000 Adient Global Holdings Ltd. EUR 3.500% 15/08/2024 222,944 0.35150,000 CPUK Finance Ltd. GBP 4.875% 28/02/2047 155,101 0.25200,000 LHC3 Plc. EUR 4.125% 15/08/2024 204,652 0.32
582,697 0.92
Luxembourg100,000 ADLER Group S.A. EUR 3.250% 05/08/2025 103,734 0.16200,000 Altice Financing S.A. USD 7.500% 15/05/2026 175,691 0.28200,000 Altice Financing S.A. EUR 3.000% 15/01/2028 194,000 0.31200,000 ArcelorMittal S.A. EUR 0.727% 19/05/2023 201,346 0.32250,000 ARD Finance S.A. EUR 5.000% 30/06/2027 256,327 0.40250,000 Arena Luxembourg Finance SARL EUR 1.875% 01/02/2028 231,953 0.36225,000 CPI Property Group S.A.(c) EUR 4.875% Perp. 234,422 0.37150,000 Garfunkelux Holdco 3 S.A. EUR 6.750% 01/11/2025 154,889 0.24200,000 Greif Nevada Holdings, Inc. SCS EUR 7.375% 15/07/2021 208,130 0.33119,824 Kleopatra Holdings 1 S.C.A. EUR 9.250% 30/06/2023 120,010 0.19416,000 LHMC Finco 2 SARL EUR 7.250% 02/10/2025 365,248 0.58425,000 Lincoln Financing SARL EUR 3.625% 01/04/2024 432,437 0.68100,000 Matterhorn Telecom S.A. EUR 3.125% 15/09/2026 100,251 0.16150,000 SIG Combibloc PurchaseCo SARL EUR 2.125% 18/06/2025 157,338 0.25400,000 Telecom Italia Finance S.A. EUR 7.750% 24/01/2033 596,968 0.94300,000 Vivion Investments SARL EUR 3.000% 08/08/2024 294,090 0.46
3,826,834 6.03
Mexico390,000 Banco Mercantil del Norte S.A.(c) USD 6.875% Perp. 340,667 0.54
Netherlands200,000 Ashland Services BV EUR 2.000% 30/01/2028 198,852 0.31175,000 Axalta Coating Systems Dutch Holding B BV EUR 3.750% 15/01/2025 180,015 0.28200,000 Diamond BC BV EUR 5.625% 15/08/2025 203,194 0.32100,000 ELM BV for Firmenich International S.A.(c) EUR 3.750% Perp. 107,750 0.17200,000 Energizer Gamma Acquisition BV EUR 4.625% 15/07/2026 208,910 0.33855,000 Fiat Chrysler Automobiles NV EUR 3.875% 05/01/2026 965,329 1.52150,000 Fiat Chrysler Automobiles NV EUR 4.500% 07/07/2028 179,977 0.28100,000 IPD 3 BV EUR 5.500% 01/12/2025 102,747 0.16200,000 Kongsberg Actuation Systems BV EUR 5.000% 15/07/2025 185,696 0.29150,000 LKQ European Holdings BV EUR 3.625% 01/04/2026 154,875 0.24200,000 Nouryon Holding BV EUR 6.500% 01/10/2026 211,202 0.33125,000 OCI NV EUR 3.125% 01/11/2024 128,268 0.20200,000 OCI NV EUR 3.625% 15/10/2025 204,850 0.32250,000 OI European Group BV EUR 3.125% 15/11/2024 259,110 0.41100,000 OI European Group BV EUR 2.875% 15/02/2025 101,220 0.16100,000 Petrobras Global Finance BV EUR 4.750% 14/01/2025 113,141 0.18450,000 PPF Telecom Group BV EUR 2.125% 31/01/2025 458,374 0.72100,000 PPF Telecom Group BV EUR 3.250% 29/09/2027 106,583 0.17275,000 Q-Park Holding I BV EUR 1.500% 01/03/2025 266,040 0.42100,000 Q-Park Holding I BV EUR 2.000% 01/03/2027 97,805 0.16275,000 Repsol International Finance BV(c) EUR 3.750% Perp. 295,655 0.47100,000 Sigma Holdco BV EUR 5.750% 15/05/2026 100,006 0.16300,000 Telefonica Europe BV(c) EUR 3.000% Perp. 306,750 0.48400,000 Telefonica Europe BV(c) EUR 3.875% Perp. 427,000 0.67300,000 Telefonica Europe BV(c) EUR 4.375% Perp. 324,750 0.51525,000 Teva Pharmaceutical Finance Netherlands II BV EUR 1.125% 15/10/2024 488,665 0.77105,000 Teva Pharmaceutical Finance Netherlands II BV EUR 4.500% 01/03/2025 108,799 0.17300,000 Teva Pharmaceutical Finance Netherlands III BV USD 3.150% 01/10/2026 237,902 0.38250,000 Trivium Packaging Finance BV EUR 3.750% 15/08/2026 257,385 0.41100,000 United Group BV EUR 4.875% 01/07/2024 102,386 0.16400,000 United Group BV EUR 3.125% 15/02/2026 393,041 0.62300,000 ZF Europe Finance BV EUR 2.000% 23/02/2026 295,363 0.47500,000 Ziggo Bond Co. BV EUR 3.375% 28/02/2030 505,900 0.80100,000 Ziggo BV EUR 2.875% 15/01/2030 101,900 0.16
8,379,440 13.20
Goldman Sachs Funds—Europe High Yield Bond PortfolioSchedule of InvestmentsAs at 30 November 2020
The accompanying notes are an integral part of these financial statements.
259

Holdings Security Description Currency Interest Rate(a) Maturity Date(b)Market Value
EUR
% ofShareholders’
Equity
Bonds – (Continued)Norway
150,000 Adevinta ASA EUR 2.625% 15/11/2025 152,886 0.24100,000 Adevinta ASA EUR 3.000% 15/11/2027 103,660 0.16
256,546 0.40
Panama100,000 Carnival Corp. EUR 10.125% 01/02/2026 117,094 0.18100,000 Carnival Corp. EUR 7.625% 01/03/2026 105,659 0.17
222,753 0.35
Portugal300,000 Banco Comercial Portugues S.A.(c) EUR 3.871% 27/03/2030 291,027 0.46200,000 Caixa Geral de Depositos S.A.(c) EUR 5.750% 28/06/2028 220,750 0.35300,000 EDP - Energias de Portugal S.A.(c) EUR 1.700% 20/07/2080 300,576 0.47
812,353 1.28
Spain200,000 Banco de Sabadell S.A. EUR 5.625% 06/05/2026 231,618 0.37300,000 Banco de Sabadell S.A.(c) EUR 5.375% 12/12/2028 324,900 0.51100,000 Banco de Sabadell S.A.(c) EUR 2.000% 17/01/2030 96,075 0.15100,000 Bankia S.A.(c) EUR 3.750% 15/02/2029 107,625 0.17200,000 Bankia S.A.(c) EUR 6.375% Perp. 213,850 0.34200,000 Cellnex Telecom S.A. EUR 1.875% 26/06/2029 205,982 0.32150,000 Gestamp Automocion S.A. EUR 3.250% 30/04/2026 151,824 0.24100,000 Grifols S.A. EUR 1.625% 15/02/2025 100,476 0.16300,000 Grifols S.A. EUR 3.200% 01/05/2025 304,674 0.48100,000 Grifols S.A. EUR 2.250% 15/11/2027 101,558 0.16100,000 Grupo Antolin-Irausa S.A. EUR 3.250% 30/04/2024 98,227 0.16100,000 Ibercaja Banco S.A.(c) EUR 2.750% 23/07/2030 98,022 0.15225,000 Lorca Telecom Bondco SAU EUR 4.000% 18/09/2027 235,051 0.37
2,269,882 3.58
Supranationals170,000 Ardagh Packaging Finance Plc. Via Ardagh Holdings USA, Inc. EUR 2.125% 15/08/2026 170,587 0.27200,000 Ardagh Packaging Finance Plc. Via Ardagh Holdings USA, Inc. GBP 4.750% 15/07/2027 230,734 0.36155,000 CANPACK S.A. Via Eastern PA Land Investment Holding LLC EUR 2.375% 01/11/2027 159,668 0.25225,000 Clarios Global LP Via Clarios US Finance Co. EUR 4.375% 15/05/2026 233,437 0.37
794,426 1.25
Sweden300,000 Akelius Residential Property AB(c) EUR 2.249% 17/05/2081 303,375 0.4882,500 Intrum AB EUR 2.750% 15/07/2022 83,322 0.13375,000 Intrum AB EUR 4.875% 15/08/2025 384,489 0.61200,000 Intrum AB EUR 3.500% 15/07/2026 198,362 0.31100,000 Verisure Holding AB EUR 3.500% 15/05/2023 102,125 0.16100,000 Verisure Holding AB(c) EUR 5.000% 15/04/2025 102,737 0.16350,000 Verisure Midholding AB EUR 5.750% 01/12/2023 356,345 0.56100,000 Volvo Car AB EUR 2.125% 02/04/2024 102,978 0.16275,000 Volvo Car AB EUR 2.500% 07/10/2027 287,972 0.46
1,921,705 3.03
United Kingdom100,000 Algeco Global Finance Plc. EUR 6.500% 15/02/2023 103,040 0.16150,000 Anglian Water Osprey Financing Plc. GBP 5.000% 30/04/2023 171,264 0.27300,000 EG Global Finance Plc. EUR 4.375% 07/02/2025 298,143 0.47200,000 EG Global Finance Plc. EUR 6.250% 30/10/2025 207,640 0.33325,000 Ellaktor Value Plc. EUR 6.375% 15/12/2024 313,196 0.49100,000 FCE Bank Plc. EUR 1.615% 11/05/2023 100,363 0.16250,000 Heathrow Finance Plc. GBP 6.000% 03/03/2025 298,990 0.47100,000 Heathrow Finance Plc. GBP 4.125% 01/03/2027 110,369 0.17100,000 International Game Technology Plc. EUR 4.750% 15/02/2023 105,358 0.17150,000 International Game Technology Plc. EUR 3.500% 15/06/2026 154,943 0.24100,000 International Game Technology Plc. EUR 2.375% 15/04/2028 97,500 0.15225,000 Jaguar Land Rover Automotive Plc. GBP 3.875% 01/03/2023 240,649 0.38100,000 Jaguar Land Rover Automotive Plc. EUR 5.875% 15/11/2024 100,924 0.16100,000 Jerrold Finco Plc. GBP 4.875% 15/01/2026 109,980 0.17200,000 Matalan Finance Plc. GBP 6.750% 31/01/2023 168,269 0.27100,000 Matalan Finance Plc. GBP 9.500% 31/01/2024 44,697 0.07200,000 Mclaren Finance Plc. GBP 5.000% 01/08/2022 214,086 0.34100,000 Miller Homes Group Holdings Plc. GBP 5.500% 15/10/2024 113,820 0.18
Goldman Sachs Funds—Europe High Yield Bond PortfolioSchedule of InvestmentsAs at 30 November 2020
The accompanying notes are an integral part of these financial statements.
260

Holdings Security Description Currency Interest Rate(a) Maturity Date(b)Market Value
EUR
% ofShareholders’
Equity
Bonds – (Continued)United Kingdom – (Continued)
150,000 National Express Group Plc.(c) GBP 4.250% Perp. 171,824 0.27225,000 Pinewood Finance Co., Ltd. GBP 3.250% 30/09/2025 254,762 0.40300,000 Pinnacle Bidco Plc. EUR 5.500% 15/02/2025 299,195 0.47225,000 Rolls-Royce Plc. EUR 0.875% 09/05/2024 212,195 0.34200,000 Rolls-Royce Plc. EUR 4.625% 16/02/2026 215,500 0.34200,000 Stonegate Pub Co. Financing 2019 Plc. GBP 8.250% 31/07/2025 228,675 0.36175,000 Synlab Bondco Plc.(c) EUR 4.750% 01/07/2025 178,159 0.28275,000 Synthomer Plc. EUR 3.875% 01/07/2025 287,595 0.45100,000 Thames Water Kemble Finance Plc. GBP 5.875% 15/07/2022 116,470 0.18100,000 Thames Water Kemble Finance Plc. GBP 4.625% 19/05/2026 112,617 0.18200,000 Travis Perkins Plc. GBP 3.750% 17/02/2026 230,426 0.36250,000 Very Group Funding Plc. GBP 7.750% 15/11/2022 283,464 0.45425,000 Virgin Media Secured Finance Plc. GBP 5.000% 15/04/2027 501,096 0.79100,000 Virgin Media Secured Finance Plc. GBP 5.250% 15/05/2029 120,568 0.19275,000 Vmed O2 UK Financing I Plc. EUR 3.250% 31/01/2031 283,341 0.45550,000 Vodafone Group Plc.(c) GBP 4.875% 03/10/2078 670,490 1.06100,000 William Hill Plc. GBP 4.875% 07/09/2023 120,130 0.19
7,239,738 11.41
United States100,000 Banff Merger Sub, Inc. EUR 8.375% 01/09/2026 104,315 0.16100,000 Belden, Inc. EUR 2.875% 15/09/2025 101,743 0.16200,000 Belden, Inc. EUR 3.875% 15/03/2028 207,568 0.33150,000 Berry Global, Inc. EUR 1.000% 15/01/2025 148,892 0.23100,000 Catalent Pharma Solutions, Inc. EUR 2.375% 01/03/2028 100,404 0.16200,000 Chemours Co. EUR 4.000% 15/05/2026 201,206 0.32250,000 Colfax Corp. EUR 3.250% 15/05/2025 255,865 0.40100,000 Crown Americas LLC Via Crown Americas Capital Corp. V �V� USD 4.250% 30/09/2026 90,867 0.14100,000 Encore Capital Group, Inc. GBP 5.375% 15/02/2026 112,751 0.18200,000 Ford Motor Co. USD 4.750% 15/01/2043 164,367 0.26200,000 Ford Motor Credit Co., LLC USD 4.140% 15/02/2023 171,747 0.27775,000 Ford Motor Credit Co., LLC EUR 1.744% 19/07/2024 771,660 1.22175,000 Ford Motor Credit Co., LLC EUR 3.250% 15/09/2025 183,225 0.29250,000 IQVIA, Inc. EUR 2.250% 15/01/2028 252,890 0.40400,000 IQVIA, Inc. EUR 2.875% 15/06/2028 414,976 0.65100,000 Kraft Heinz Foods Co. GBP 4.125% 01/07/2027 123,815 0.19100,000 Liberty Mutual Group, Inc.(c) EUR 3.625% 23/05/2059 102,750 0.16100,000 Mauser Packaging Solutions Holding Co. EUR 4.750% 15/04/2024 100,806 0.16175,000 MPT Operating Partnership LP Via MPT Finance Corp. GBP 2.550% 05/12/2023 197,471 0.31100,000 MPT Operating Partnership LP Via MPT Finance Corp. EUR 3.325% 24/03/2025 106,193 0.17200,000 MPT Operating Partnership LP Via MPT Finance Corp. USD 4.625% 01/08/2029 177,767 0.2880,000 MPT Operating Partnership LP Via MPT Finance Corp. USD 3.500% 15/03/2031 67,969 0.11175,000 Netflix, Inc. EUR 3.000% 15/06/2025 187,488 0.30750,000 Netflix, Inc. EUR 3.625% 15/05/2027 840,109 1.32300,000 Refinitiv US Holdings, Inc. EUR 4.500% 15/05/2026 315,399 0.50100,000 Scientific Games International, Inc. EUR 3.375% 15/02/2026 98,648 0.15150,000 Scientific Games International, Inc. EUR 5.500% 15/02/2026 149,424 0.24200,000 Silgan Holdings, Inc. EUR 2.250% 01/06/2028 203,496 0.32200,000 Standard Industries, Inc. EUR 2.250% 21/11/2026 201,924 0.32100,000 Superior Industries International, Inc. EUR 6.000% 15/06/2025 94,831 0.15100,000 Tenneco, Inc. EUR 5.000% 15/07/2024 100,814 0.16275,000 WMG Acquisition Corp. EUR 3.625% 15/10/2026 286,173 0.45100,000 ZF North America Capital, Inc. EUR 2.750% 27/04/2023 102,540 0.16
6,740,093 10.62
TOTAL BONDS(cost EUR 56,945,367) 58,204,476 91.72
Holdings Security DescriptionMarket Value
EUR
% ofShareholders’
Equity
Mutual Funds – 0.63%Ireland
40 Goldman Sachs Euro Liquid Reserves Fund (X Accumulation Class)(d)(e) 400,000 0.63
TOTAL MUTUAL FUNDS(cost EUR 400,000) 400,000 0.63
TOTAL TRANSFERABLE SECURITIES ADMITTED TO AN OFFICIAL EXCHANGE LISTING(cost EUR 57,345,367) 58,604,476 92.35
Goldman Sachs Funds—Europe High Yield Bond PortfolioSchedule of InvestmentsAs at 30 November 2020
The accompanying notes are an integral part of these financial statements.
261

Holdings Security Description Currency Interest Rate(a) Maturity Date(b)Market Value
EUR
% ofShareholders’
Equity
Transferable securities dealt in another regulated market
Bonds – 4.32%Bermuda
49,045 Digicel Group 0.5 Ltd. USD 8.000% 01/04/2025 15,537 0.038,101 Digicel Group 0.5 Ltd. USD 7.000% Perp. 1,519 0.00
17,056 0.03
Canada185,000 Bausch Health Cos., Inc. USD 5.000% 15/02/2029 155,767 0.25
Cayman Islands207,250 Global Aircraft Leasing Co., Ltd. USD 6.500% 15/09/2024 153,768 0.24
Germany200,000 Deutsche Bank AG(c) USD 6.000% Perp. 165,479 0.26
Ireland100,000 Virgin Media Vendor Financing Notes III DAC GBP 4.875% 15/07/2028 114,756 0.18
Italy350,000 UniCredit SpA(c) USD 5.459% 30/06/2035 316,252 0.50
Luxembourg200,000 Telenet Finance Luxembourg Notes SARL USD 5.500% 01/03/2028 178,817 0.28
Mexico700,000 Petroleos Mexicanos USD 5.350% 12/02/2028 545,300 0.86
United States150,000 Adient US LLC USD 7.000% 15/05/2026 135,988 0.2121,000 Arches Buyer, Inc. USD 6.125% 01/12/2028 18,054 0.03115,000 Goodyear Tire & Rubber Co. USD 9.500% 31/05/2025 107,973 0.17222,000 Kraft Heinz Foods Co. USD 3.875% 15/05/2027 200,072 0.31425,000 Occidental Petroleum Corp. USD 7.875% 15/09/2031 379,100 0.60150,000 Talen Energy Supply LLC USD 7.250% 15/05/2027 131,924 0.21141,000 Tenet Healthcare Corp. USD 6.125% 01/10/2028 120,189 0.19
1,093,300 1.72
TOTAL BONDS(cost EUR 2,721,078) 2,740,495 4.32
TOTAL TRANSFERABLE SECURITIES DEALT IN ANOTHER REGULATED MARKET(cost EUR 2,721,078) 2,740,495 4.32
Other Transferable Securities
Bonds – 1.03%Luxembourg
600,000 Altice France Holding S.A. EUR 8.000% 15/05/2027 651,180 1.03
Spain225,441 Grupo Isolux Corsan S.A.—Series B(c) EUR 6.000% 30/12/2021 1,803 0.0034,100 Grupo Isolux Corsan S.A.—Series C(c) EUR 1.000% 30/12/2021 199 0.00
2,002 0.00
TOTAL BONDS(cost EUR 1,437,683) 653,182 1.03
Holdings Security DescriptionMarket Value
EUR
% ofShareholders’
Equity
Warrants – 0.00%Spain
553 Barclays Bank Plc.—Grupo Isolux Corsan S.A., exp. 12/21—Warrants(f) 323 0.00
TOTAL WARRANTS(cost EUR nil) 323 0.00
TOTAL OTHER TRANSFERABLE SECURITIES(cost EUR 1,437,683) 653,505 1.03
MARKET VALUE OF INVESTMENTS EXCLUDING DERIVATIVES(cost EUR 61,504,128) 61,998,476 97.70
Goldman Sachs Funds—Europe High Yield Bond PortfolioSchedule of InvestmentsAs at 30 November 2020
The accompanying notes are an integral part of these financial statements.
262

Futures Contracts – (0.01%)
Number ofContracts Security Description
CommitmentMarket Value
EUR
UnrealisedGainEUR
% ofShareholders’
Equity
USD(2) US Treasury Long Bond Futures 22/03/2021 Short (291,307) 82 0.00
UNREALISED GAIN ON FUTURES CONTRACTS 82 0.00
Number ofContracts Security Description
CommitmentMarket Value
EUR
UnrealisedLossEUR
% ofShareholders’
Equity
USD(12) US Treasury Notes 10YR Futures 22/03/2021 Short (1,381,612) (2,501) (0.01)(4) US Treasury Notes 2YR Futures 31/03/2021 Short (736,370) (208) (0.00)(10) US Treasury Notes 5YR Futures 31/03/2021 Short (1,050,329) (882) (0.00)(3) US Treasury Ultra Long Notes 10YR Futures 22/03/2021 Short (392,647) (618) (0.00)
(3,560,958) (4,209) (0.01)
UNREALISED LOSS ON FUTURES CONTRACTS (4,209) (0.01)
Forward Currency Contracts – 0.00%
CurrencyAmountBought Currency
AmountSold
MaturityDate
UnrealisedGainEUR
% ofShareholders’
Equity
GBP 1,041,266 EUR 1,153,837 13/01/2021 6,196 0.01EUR 4,770,050 USD 5,656,230 21/01/2021 61,935 0.10
UNREALISED GAIN ON FORWARD CURRENCY CONTRACTS 68,131 0.11
CurrencyAmountBought Currency
AmountSold
MaturityDate
UnrealisedLossEUR
% ofShareholders’
Equity
EUR 6,739,916 GBP 6,111,503 13/01/2021 (68,668) (0.11)
UNREALISED LOSS ON FORWARD CURRENCY CONTRACTS (68,668) (0.11)
Share Class Specific Forward Currency Contracts – (0.08%)
CurrencyAmountBought Currency
AmountSold
MaturityDate
UnrealisedGainEUR
% ofShareholders’
Equity
SEK 2,899,683 EUR 278,883 10/12/2020 6,045 0.01PLN 8,910,376 EUR 1,979,848 21/12/2020 10,827 0.02GBP 1,112,512 EUR 1,225,170 13/01/2021 14,234 0.02EUR 215,167 USD 256,000 21/01/2021 2,079 0.00
UNREALISED GAIN ON FORWARD CURRENCY CONTRACTS HELD FOR HEDGING PURPOSES 33,185 0.05
CurrencyAmountBought Currency
AmountSold
MaturityDate
UnrealisedLossEUR
% ofShareholders’
Equity
EUR 62,498 SEK 645,240 10/12/2020 (905) (0.00)EUR 753,881 PLN 3,399,064 21/12/2020 (5,508) (0.01)EUR 803,577 GBP 730,398 13/01/2021 (10,128) (0.02)USD 6,261,874 EUR 5,280,841 21/01/2021 (68,601) (0.10)
UNREALISED LOSS ON FORWARD CURRENCY CONTRACTS HELD FOR HEDGING PURPOSES (85,142) (0.13)
Swap Contracts – 0.01%Net LocalNotionalAmount Pay Receive Currency Maturity Date
UnrealisedGainEUR
% ofShareholders’
Equity
Interest Rate Swaps3,030,000 Floating (EUR 6 month LIBOR) Fixed 0.000% EUR 16/12/2022 2,800 0.012,870,000 Floating (EUR 6 month LIBOR) Fixed 0.000% EUR 16/12/2023 3,914 0.011,540,000 Fixed 0.000% Floating (EUR 6 month LIBOR) EUR 16/12/2025 123 0.00360,000 Floating (EUR 6 month LIBOR) Fixed 0.000% EUR 16/12/2027 1,582 0.00320,000 Floating (EUR 6 month LIBOR) Fixed 0.000% EUR 16/12/2030 539 0.00560,000 Fixed 0.500% Floating (GBP 6 month LIBOR) GBP 16/12/2023 302 0.00
UNREALISED GAIN ON INTEREST RATE SWAPS 9,260 0.02
TOTAL UNREALISED GAIN ON SWAP CONTRACTS 9,260 0.02
Goldman Sachs Funds—Europe High Yield Bond PortfolioSchedule of InvestmentsAs at 30 November 2020
The accompanying notes are an integral part of these financial statements.
263

Swap Contracts – (Continued)
Net LocalNotionalAmount Pay Receive Currency Maturity Date
UnrealisedLossEUR
% ofShareholders’
Equity
Interest Rate Swaps110,000 Fixed 0.250% Floating (EUR 6 month EURIBOR) EUR 16/12/2040 (1,411) (0.00)340,000 Floating (GBP 6 month LIBOR) Fixed 0.500% GBP 16/12/2025 (622) (0.00)230,000 Floating (GBP 6 month LIBOR) Fixed 0.500% GBP 16/12/2027 (574) (0.00)290,000 Floating (GBP 6 month LIBOR) Fixed 0.750% GBP 16/12/2030 (1,568) (0.01)
UNREALISED LOSS ON INTEREST RATE SWAPS (4,175) (0.01)
TOTAL UNREALISED LOSS ON SWAP CONTRACTS (4,175) (0.01)
MARKET VALUE OF INVESTMENTS(cost EUR 61,504,128)
61,946,940 97.62
OTHER ASSETS AND LIABILITIES 1,508,676 2.38
SHAREHOLDERS’ EQUITY 63,455,616 100.00
TOTAL INVESTMENTSMarket Value
EUR
% ofShareholders’
Equity
Total Investments excluding derivatives (cost EUR 61,504,128) 61,998,476 97.70Unrealised gain on futures contracts 82 0.00Unrealised loss on futures contracts (4,209) (0.01)Unrealised gain on forward currency contracts 68,131 0.11Unrealised loss on forward currency contracts (68,668) (0.11)Unrealised gain on forward currency contracts held for hedging purposes 33,185 0.05Unrealised loss on forward currency contracts held for hedging purposes (85,142) (0.13)Unrealised gain on swap contracts 9,260 0.02Unrealised loss on swap contracts (4,175) (0.01)Other Assets and Liabilities 1,508,676 2.38
Shareholders’ Equity 63,455,616 100.00
The Futures Commission Merchant was Goldman Sachs International.
The counterparties for forward currency contracts were Australia and New Zealand Banking Group Ltd., Bank of America N.A., Barclays Bank Plc., BNP Paribas S.A., Citibank N.A., HSBCBank Plc., JP Morgan Chase Bank N.A., Morgan Stanley & Co. International Plc., Natwest Markets Plc., Royal Bank of Canada, Standard Chartered Bank, State Street Bank & Trust andUBS AG.
The counterparty for swap contracts was Credit Suisse.
The maximum individual counterparty exposure as at 30 November 2020 is 0.10% of the NAV.
(a) Interest rates represent either the stated coupon rate, annualised discounted yield on date of purchase for discounted securities, or, for floating rate securities, the current reset ratewhich is based upon interest rates indices.
(b) Maturity dates represent either the stated date on the security, or the next interest reset date for floating rate securities or the prerefunded date for those type of securities.(c) Variable and floating coupon rates are those quoted as of 30 November 2020.(d) A related party to Goldman Sachs Funds.(e) The yield for this fund as at 30 November 2020 was (0.570%).(f) Valuation of this security is determined by the Valuer. See Note 4.
Goldman Sachs Funds—Europe High Yield Bond PortfolioSchedule of InvestmentsAs at 30 November 2020
The accompanying notes are an integral part of these financial statements.
264

Holdings Security Description Currency Interest Rate(a) Maturity Date(b)Market Value
USD
% ofShareholders’
Equity
Transferable securities admitted to an official exchange listing
Bonds – 61.69%Australia
1,250,000 APT Pipelines Ltd. EUR 2.000% 15/07/2030 1,696,313 0.121,400,000 APT Pipelines Ltd. GBP 3.125% 18/07/2031 2,138,245 0.164,200,000 Origin Energy Finance Ltd. EUR 1.037% 17/09/2029 5,031,359 0.37600,000 Scentre Group Trust 1 GBP 3.875% 16/07/2026 898,233 0.06
9,764,150 0.71
Austria2,900,000 BAWAG Group AG(c) EUR 2.375% 26/03/2029 3,575,924 0.261,000,000 Erste Group Bank AG(c) EUR 6.500% Perp. 1,341,541 0.101,600,000 Raiffeisen Bank International AG(c) EUR 2.875% 18/06/2032 2,024,111 0.15
6,941,576 0.51
Belgium3,200,000 Ageas S.A./NV(c) EUR 1.875% 24/11/2051 3,837,562 0.281,600,000 Anheuser-Busch InBev S.A./NV GBP 9.750% 30/07/2024 2,858,914 0.21300,000 Anheuser-Busch InBev S.A./NV EUR 2.750% 17/03/2036 449,126 0.03
1,600,000 Anheuser-Busch InBev S.A./NV EUR 3.700% 02/04/2040 2,694,208 0.201,000,000 Cofinimmo S.A. EUR 0.875% 02/12/2030 1,217,291 0.09
11,057,101 0.81
Bermuda5,950,000 Bacardi Ltd. EUR 2.750% 03/07/2023 7,514,886 0.55400,000 IHS Markit Ltd. USD 3.625% 01/05/2024 430,412 0.03
1,050,000 IHS Markit Ltd. USD 4.250% 01/05/2029 1,240,922 0.09
9,186,220 0.67
British Virgin Islands1,490,000 Bluestar Finance Holdings Ltd.(c) USD 3.875% Perp. 1,475,566 0.11200,000 Huarong Finance 2017 Co., Ltd. USD 4.250% 07/11/2027 216,688 0.01230,000 Huarong Finance 2019 Co., Ltd. USD 3.750% 29/05/2024 241,212 0.02320,000 Huarong Finance 2019 Co., Ltd. USD 3.875% 13/11/2029 339,200 0.02300,000 Huarong Finance 2019 Co., Ltd. USD 3.375% 24/02/2030 307,172 0.02590,000 Huarong Finance 2019 Co., Ltd. USD 3.625% 30/09/2030 613,689 0.04200,000 Huarong Finance II Co., Ltd. USD 4.625% 03/06/2026 220,406 0.02200,000 Huarong Finance II Co., Ltd. USD 4.875% 22/11/2026 225,000 0.02
3,638,933 0.26
Canada2,500,000 Suncor Energy, Inc. USD 3.100% 15/05/2025 2,715,850 0.20
Cayman Islands740,000 Country Garden Holdings Co., Ltd. USD 3.875% 22/10/2030 748,325 0.06400,000 DP World Crescent Ltd. USD 4.848% 26/09/2028 457,000 0.03500,000 Sun Hung Kai Properties Capital Market Ltd. USD 4.500% 14/02/2022 519,375 0.04250,000 Tencent Holdings Ltd. USD 2.390% 03/06/2030 256,875 0.02
2,850,000 XLIT Ltd.(c) EUR 3.250% 29/06/2047 3,848,997 0.28
5,830,572 0.43
Chile3,094,000 GNL Quintero S.A. USD 4.634% 31/07/2029 3,410,168 0.25
Colombia470,000 Colombia Government International Bond USD 5.200% 15/05/2049 591,686 0.04
Croatia1,350,000 Croatia Government International Bond EUR 1.500% 17/06/2031 1,746,919 0.13
Denmark5,125,000 Danske Bank A/S(c) EUR 1.375% 12/02/2030 6,239,171 0.46
Finland925,000 Stora Enso OYJ EUR 0.625% 02/12/2030 1,117,545 0.08
France2,300,000 Aeroports de Paris EUR 2.750% 02/04/2030 3,344,610 0.252,100,000 BNP Paribas S.A.(c) EUR 0.375% 14/10/2027 2,546,135 0.19700,000 BNP Paribas S.A.(c) EUR 2.625% 14/10/2027 875,791 0.07
3,200,000 BNP Paribas S.A.(c) EUR 0.500% 01/09/2028 3,871,379 0.281,500,000 BNP Paribas S.A. EUR 0.625% 03/12/2032 1,797,004 0.13350,000 BNP Paribas S.A. 144A(c)(d) USD 6.625% Perp. 382,924 0.03
Goldman Sachs Funds—Global Credit Portfolio (Hedged)Schedule of InvestmentsAs at 30 November 2020
The accompanying notes are an integral part of these financial statements.
265

Holdings Security Description Currency Interest Rate(a) Maturity Date(b)Market Value
USD
% ofShareholders’
Equity
Bonds – (Continued)France – (Continued)
4,400,000 Capgemini S.E. EUR 2.375% 15/04/2032 6,303,539 0.463,000,000 Credit Agricole S.A.(c) EUR 1.625% 05/06/2030 3,749,577 0.281,350,000 Credit Agricole S.A. 144A(c)(d) USD 8.125% Perp. 1,632,973 0.122,200,000 Electricite de France S.A.(c) EUR 2.875% Perp. 2,770,960 0.202,300,000 Engie S.A.(c) EUR 1.500% Perp. 2,766,111 0.201,300,000 Firmenich Productions Participations SAS EUR 1.375% 30/10/2026 1,674,266 0.122,150,000 Firmenich Productions Participations SAS EUR 1.750% 30/04/2030 2,867,781 0.21400,000 Imerys S.A. EUR 2.000% 10/12/2024 506,949 0.04
1,700,000 La Mondiale SAM EUR 0.750% 20/04/2026 2,058,485 0.152,000,000 La Mondiale SAM EUR 2.125% 23/06/2031 2,502,213 0.181,300,000 La Poste S.A. EUR 1.375% 21/04/2032 1,728,689 0.131,400,000 La Poste S.A. EUR 0.440% 17/09/2034 1,809,152 0.131,100,000 Orange S.A. EUR 1.625% 07/04/2032 1,517,906 0.111,800,000 Pernod Ricard S.A. EUR 1.750% 08/04/2030 2,472,359 0.183,100,000 Societe Generale S.A. EUR 0.875% 01/07/2026 3,829,977 0.281,600,000 Societe Generale S.A.(c) EUR 0.875% 22/09/2028 1,968,932 0.14800,000 Terega SASU EUR 0.625% 27/02/2028 947,021 0.07
1,100,000 Total Capital International S.A. USD 3.461% 12/07/2049 1,278,420 0.09
55,203,153 4.04
Germany2,200,000 Allianz S.E.(c) EUR 2.625% Perp. 2,652,944 0.191,100,000 alstria office REIT-AG EUR 1.500% 23/06/2026 1,375,755 0.103,100,000 Bayer AG EUR 1.125% 06/01/2030 3,921,008 0.291,400,000 Bayer AG EUR 1.375% 06/07/2032 1,797,782 0.131,300,000 Commerzbank AG(c) EUR 4.000% 05/12/2030 1,678,320 0.122,900,000 Deutsche Bank AG(c) EUR 1.750% 19/11/2030 3,591,265 0.261,000,000 Deutsche Telekom AG GBP 3.125% 06/02/2034 1,602,675 0.121,450,000 Landesbank Baden-Wuerttemberg EUR 3.625% 16/06/2025 1,914,535 0.14400,000 Schaeffler AG EUR 2.750% 12/10/2025 503,641 0.04600,000 Schaeffler AG EUR 3.375% 12/10/2028 777,636 0.06
1,200,000 Volkswagen Bank GmbH EUR 1.875% 31/01/2024 1,519,134 0.11
21,334,695 1.56
Hong Kong200,000 CNAC HK Finbridge Co., Ltd. USD 3.875% 19/06/2029 204,156 0.02200,000 CNAC HK Finbridge Co., Ltd. USD 3.000% 22/09/2030 190,293 0.01
394,449 0.03
Indonesia1,510,000 Indonesia Government International Bond USD 4.125% 15/01/2025 1,693,323 0.122,390,000 Indonesia Government International Bond USD 3.850% 18/07/2027 2,736,177 0.20200,000 Indonesia Government International Bond USD 3.850% 15/10/2030 234,469 0.02
4,663,969 0.34
Ireland4,100,000 AerCap Ireland Capital DAC Via AerCap Global Aviation Trust USD 3.500% 26/05/2022 4,229,929 0.31750,000 AerCap Ireland Capital DAC Via AerCap Global Aviation Trust USD 6.500% 15/07/2025 864,675 0.06
1,350,000 AIB Group Plc. EUR 2.250% 03/07/2025 1,768,458 0.132,650,000 AIB Group Plc.(c) EUR 1.875% 19/11/2029 3,228,301 0.242,450,000 AIB Group Plc.(c) EUR 2.875% 30/05/2031 3,109,971 0.231,400,000 Bank of Ireland Group Plc.(c) EUR 2.375% 14/10/2029 1,713,419 0.121,950,000 DAA Finance Plc. EUR 1.601% 05/11/2032 2,560,438 0.192,650,000 Dell Bank International DAC EUR 1.625% 24/06/2024 3,286,378 0.241,500,000 GE Capital International Funding Co. Unlimited Co. USD 3.373% 15/11/2025 1,644,480 0.122,200,000 GE Capital International Funding Co. Unlimited Co. USD 4.418% 15/11/2035 2,537,810 0.193,700,000 Glencore Capital Finance DAC EUR 1.125% 10/03/2028 4,535,046 0.331,400,000 Ryanair DAC EUR 2.875% 15/09/2025 1,797,967 0.13
31,276,872 2.29
Israel1,630,000 Israel Government International Bond USD 3.800% 13/05/2060 1,932,059 0.14
Italy875,000 Aeroporti di Roma SpA EUR 1.625% 02/02/2029 1,055,578 0.08
2,475,000 Infrastrutture Wireless Italiane SpA EUR 1.625% 21/10/2028 3,045,884 0.221,950,000 UniCredit SpA(c) EUR 1.250% 25/06/2025 2,413,928 0.171,375,000 UniCredit SpA(c) EUR 2.200% 22/07/2027 1,750,670 0.13
Goldman Sachs Funds—Global Credit Portfolio (Hedged)Schedule of InvestmentsAs at 30 November 2020
The accompanying notes are an integral part of these financial statements.
266

Holdings Security Description Currency Interest Rate(a) Maturity Date(b)Market Value
USD
% ofShareholders’
Equity
Bonds – (Continued)Italy – (Continued)
2,850,000 UniCredit SpA EUR 1.800% 20/01/2030 3,581,482 0.261,650,000 UniCredit SpA(c) EUR 2.731% 15/01/2032 2,006,472 0.15
13,854,014 1.01
Japan1,950,000 Mitsubishi UFJ Financial Group, Inc. USD 3.751% 18/07/2039 2,344,934 0.17800,000 Nissan Motor Co., Ltd. EUR 1.940% 15/09/2023 992,949 0.07
2,300,000 Takeda Pharmaceutical Co., Ltd. EUR 3.000% 21/11/2030 3,397,720 0.251,750,000 Takeda Pharmaceutical Co., Ltd. EUR 1.375% 09/07/2032 2,252,434 0.171,650,000 Takeda Pharmaceutical Co., Ltd. EUR 2.000% 09/07/2040 2,236,086 0.16
11,224,123 0.82
Jersey200,000 Galaxy Pipeline Assets Bidco Ltd. USD 2.625% 31/03/2036 207,250 0.02360,000 Galaxy Pipeline Assets Bidco Ltd. USD 3.250% 30/09/2040 373,725 0.03
1,200,000 Heathrow Funding Ltd. EUR 1.500% 12/10/2025 1,508,439 0.111,525,000 Heathrow Funding Ltd. GBP 2.750% 13/10/2029 2,179,673 0.16500,000 Porterbrook Rail Finance Ltd. GBP 7.125% 20/10/2026 881,729 0.06
5,150,816 0.38
Luxembourg2,350,000 Aroundtown S.A. GBP 3.000% 16/10/2029 3,423,233 0.25750,000 Becton Dickinson Euro Finance SARL EUR 1.208% 04/06/2026 942,792 0.07
2,400,000 Blackstone Property Partners Europe Holdings SARL EUR 2.000% 15/02/2024 3,020,044 0.221,350,000 DH Europe Finance II SARL EUR 0.750% 18/09/2031 1,671,262 0.121,480,000 Gazprom PJSC Via Gaz Capital S.A. USD 5.150% 11/02/2026 1,683,037 0.121,700,000 Helvetia Europe S.A.(c) EUR 2.750% 30/09/2041 2,195,685 0.161,000,000 Logicor Financing SARL EUR 1.500% 14/11/2022 1,231,326 0.091,100,000 Logicor Financing SARL EUR 2.250% 13/05/2025 1,430,383 0.111,350,000 Logicor Financing SARL EUR 3.250% 13/11/2028 1,906,754 0.143,650,000 Richemont International Holding S.A. EUR 1.625% 26/05/2040 5,112,126 0.37650,000 Whirlpool EMEA Finance SARL EUR 0.500% 20/02/2028 795,208 0.06
23,411,850 1.71
Mexico14,290,000 America Movil SAB de CV MXN 6.450% 05/12/2022 726,533 0.05240,000 Fomento Economico Mexicano SAB de CV USD 3.500% 16/01/2050 263,812 0.02425,000 Mexico City Airport Trust USD 4.250% 31/10/2026 424,801 0.03400,000 Mexico City Airport Trust USD 3.875% 30/04/2028 385,750 0.03400,000 Mexico City Airport Trust USD 5.500% 31/07/2047 388,375 0.03210,000 Mexico City Airport Trust 144A(d) USD 4.250% 31/10/2026 209,902 0.02550,000 Mexico City Airport Trust 144A(d) USD 3.875% 30/04/2028 530,406 0.04200,000 Mexico City Airport Trust 144A(d) USD 5.500% 31/10/2046 193,688 0.01650,000 Mexico City Airport Trust 144A(d) USD 5.500% 31/07/2047 631,109 0.05210,000 Mexico Government International Bond USD 4.500% 22/04/2029 243,239 0.02570,000 Mexico Government International Bond USD 2.659% 24/05/2031 571,995 0.04
1,831,000 Mexico Government International Bond USD 3.771% 24/05/2061 1,826,422 0.13320,000 Petroleos Mexicanos USD 6.875% 16/10/2025 333,834 0.02
6,729,866 0.49
Netherlands2,000,000 ABN AMRO Bank NV(c) EUR 2.875% 18/01/2028 2,525,101 0.184,600,000 ABN AMRO Bank NV 144A(d) USD 4.750% 28/07/2025 5,282,640 0.392,700,000 Airbus S.E. EUR 2.000% 07/04/2028 3,626,759 0.272,950,000 Airbus S.E. EUR 2.375% 07/04/2032 4,147,819 0.302,150,000 Airbus S.E. EUR 2.375% 09/06/2040 2,970,994 0.221,550,000 Akelius Residential Property Financing BV EUR 0.621% 17/01/2028 1,909,187 0.142,000,000 AT Securities BV(c) USD 5.250% Perp. 2,092,020 0.153,400,000 BAT Netherlands Finance BV EUR 3.125% 07/04/2028 4,768,465 0.351,700,000 Bayer Capital Corp. BV EUR 1.500% 26/06/2026 2,192,626 0.161,300,000 Enel Finance International NV GBP 0.912% 20/10/2027 1,751,008 0.132,800,000 Fiat Chrysler Automobiles NV EUR 3.875% 05/01/2026 3,792,152 0.28750,000 Givaudan Finance Europe BV EUR 1.625% 22/04/2032 1,026,002 0.08
1,800,000 Iberdrola International BV—Series NC8(c) EUR 2.250% Perp. 2,234,394 0.162,100,000 ING Groep NV GBP 3.000% 18/02/2026 3,106,464 0.231,800,000 ING Groep NV(c) EUR 0.786% 13/11/2030 2,177,651 0.161,300,000 ING Groep NV(c) EUR 2.125% 26/05/2031 1,663,475 0.122,050,000 ING Groep NV(c) USD 6.750% Perp. 2,244,750 0.161,500,000 JAB Holdings BV EUR 1.250% 22/05/2024 1,874,069 0.14
Goldman Sachs Funds—Global Credit Portfolio (Hedged)Schedule of InvestmentsAs at 30 November 2020
The accompanying notes are an integral part of these financial statements.
267
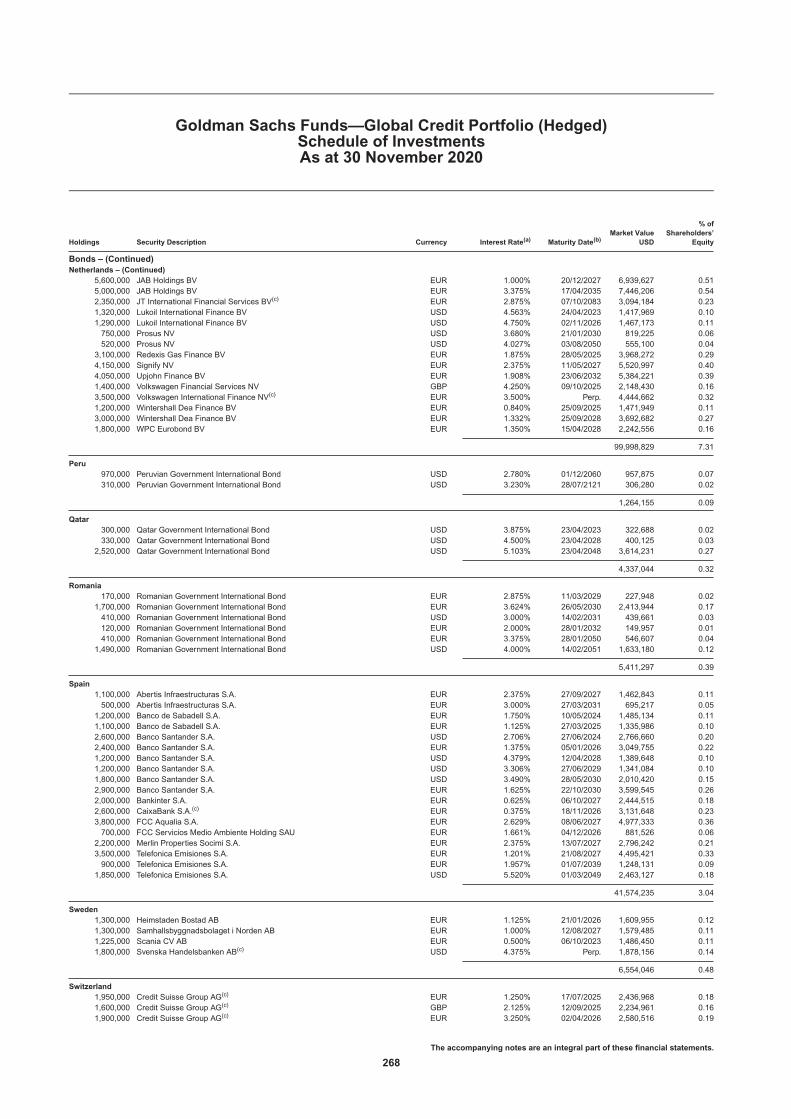
Holdings Security Description Currency Interest Rate(a) Maturity Date(b)Market Value
USD
% ofShareholders’
Equity
Bonds – (Continued)Netherlands – (Continued)
5,600,000 JAB Holdings BV EUR 1.000% 20/12/2027 6,939,627 0.515,000,000 JAB Holdings BV EUR 3.375% 17/04/2035 7,446,206 0.542,350,000 JT International Financial Services BV(c) EUR 2.875% 07/10/2083 3,094,184 0.231,320,000 Lukoil International Finance BV USD 4.563% 24/04/2023 1,417,969 0.101,290,000 Lukoil International Finance BV USD 4.750% 02/11/2026 1,467,173 0.11750,000 Prosus NV USD 3.680% 21/01/2030 819,225 0.06520,000 Prosus NV USD 4.027% 03/08/2050 555,100 0.04
3,100,000 Redexis Gas Finance BV EUR 1.875% 28/05/2025 3,968,272 0.294,150,000 Signify NV EUR 2.375% 11/05/2027 5,520,997 0.404,050,000 Upjohn Finance BV EUR 1.908% 23/06/2032 5,384,221 0.391,400,000 Volkswagen Financial Services NV GBP 4.250% 09/10/2025 2,148,430 0.163,500,000 Volkswagen International Finance NV(c) EUR 3.500% Perp. 4,444,662 0.321,200,000 Wintershall Dea Finance BV EUR 0.840% 25/09/2025 1,471,949 0.113,000,000 Wintershall Dea Finance BV EUR 1.332% 25/09/2028 3,692,682 0.271,800,000 WPC Eurobond BV EUR 1.350% 15/04/2028 2,242,556 0.16
99,998,829 7.31
Peru970,000 Peruvian Government International Bond USD 2.780% 01/12/2060 957,875 0.07310,000 Peruvian Government International Bond USD 3.230% 28/07/2121 306,280 0.02
1,264,155 0.09
Qatar300,000 Qatar Government International Bond USD 3.875% 23/04/2023 322,688 0.02330,000 Qatar Government International Bond USD 4.500% 23/04/2028 400,125 0.03
2,520,000 Qatar Government International Bond USD 5.103% 23/04/2048 3,614,231 0.27
4,337,044 0.32
Romania170,000 Romanian Government International Bond EUR 2.875% 11/03/2029 227,948 0.02
1,700,000 Romanian Government International Bond EUR 3.624% 26/05/2030 2,413,944 0.17410,000 Romanian Government International Bond USD 3.000% 14/02/2031 439,661 0.03120,000 Romanian Government International Bond EUR 2.000% 28/01/2032 149,957 0.01410,000 Romanian Government International Bond EUR 3.375% 28/01/2050 546,607 0.04
1,490,000 Romanian Government International Bond USD 4.000% 14/02/2051 1,633,180 0.12
5,411,297 0.39
Spain1,100,000 Abertis Infraestructuras S.A. EUR 2.375% 27/09/2027 1,462,843 0.11500,000 Abertis Infraestructuras S.A. EUR 3.000% 27/03/2031 695,217 0.05
1,200,000 Banco de Sabadell S.A. EUR 1.750% 10/05/2024 1,485,134 0.111,100,000 Banco de Sabadell S.A. EUR 1.125% 27/03/2025 1,335,986 0.102,600,000 Banco Santander S.A. USD 2.706% 27/06/2024 2,766,660 0.202,400,000 Banco Santander S.A. EUR 1.375% 05/01/2026 3,049,755 0.221,200,000 Banco Santander S.A. USD 4.379% 12/04/2028 1,389,648 0.101,200,000 Banco Santander S.A. USD 3.306% 27/06/2029 1,341,084 0.101,800,000 Banco Santander S.A. USD 3.490% 28/05/2030 2,010,420 0.152,900,000 Banco Santander S.A. EUR 1.625% 22/10/2030 3,599,545 0.262,000,000 Bankinter S.A. EUR 0.625% 06/10/2027 2,444,515 0.182,600,000 CaixaBank S.A.(c) EUR 0.375% 18/11/2026 3,131,648 0.233,800,000 FCC Aqualia S.A. EUR 2.629% 08/06/2027 4,977,333 0.36700,000 FCC Servicios Medio Ambiente Holding SAU EUR 1.661% 04/12/2026 881,526 0.06
2,200,000 Merlin Properties Socimi S.A. EUR 2.375% 13/07/2027 2,796,242 0.213,500,000 Telefonica Emisiones S.A. EUR 1.201% 21/08/2027 4,495,421 0.33900,000 Telefonica Emisiones S.A. EUR 1.957% 01/07/2039 1,248,131 0.09
1,850,000 Telefonica Emisiones S.A. USD 5.520% 01/03/2049 2,463,127 0.18
41,574,235 3.04
Sweden1,300,000 Heimstaden Bostad AB EUR 1.125% 21/01/2026 1,609,955 0.121,300,000 Samhallsbyggnadsbolaget i Norden AB EUR 1.000% 12/08/2027 1,579,485 0.111,225,000 Scania CV AB EUR 0.500% 06/10/2023 1,486,450 0.111,800,000 Svenska Handelsbanken AB(c) USD 4.375% Perp. 1,878,156 0.14
6,554,046 0.48
Switzerland1,950,000 Credit Suisse Group AG(c) EUR 1.250% 17/07/2025 2,436,968 0.181,600,000 Credit Suisse Group AG(c) GBP 2.125% 12/09/2025 2,234,961 0.161,900,000 Credit Suisse Group AG(c) EUR 3.250% 02/04/2026 2,580,516 0.19
Goldman Sachs Funds—Global Credit Portfolio (Hedged)Schedule of InvestmentsAs at 30 November 2020
The accompanying notes are an integral part of these financial statements.
268

Holdings Security Description Currency Interest Rate(a) Maturity Date(b)Market Value
USD
% ofShareholders’
Equity
Bonds – (Continued)Switzerland – (Continued)
2,850,000 Credit Suisse Group AG 144A(c)(d) USD 2.593% 11/09/2025 3,003,301 0.224,500,000 Credit Suisse Group Funding Guernsey Ltd. USD 4.550% 17/04/2026 5,274,225 0.392,250,000 UBS Group AG 144A(c)(d) USD 7.000% Perp. 2,477,813 0.18
18,007,784 1.32
United Arab Emirates4,210,000 Abu Dhabi Crude Oil Pipeline LLC USD 4.600% 02/11/2047 5,230,267 0.38400,000 DP World Plc. USD 5.625% 25/09/2048 489,188 0.04100,000 DP World Plc. 144A(d) USD 6.850% 02/07/2037 132,797 0.01
5,852,252 0.43
United Kingdom2,250,000 Annington Funding Plc. GBP 3.184% 12/07/2029 3,379,686 0.25750,000 Aviva Plc.(c) GBP 6.625% 03/06/2041 1,031,460 0.07
2,850,000 Barclays Bank Plc. USD 10.179% 12/06/2021 2,986,999 0.223,000,000 Barclays Plc. USD 3.684% 10/01/2023 3,097,590 0.232,950,000 Barclays Plc.(c) EUR 3.375% 02/04/2025 3,900,643 0.281,200,000 Barclays Plc.(c) GBP 1.700% 03/11/2026 1,643,243 0.124,600,000 Barclays Plc.(c) GBP 3.750% 22/11/2030 6,639,527 0.491,600,000 BAT International Finance Plc. GBP 2.250% 26/06/2028 2,193,622 0.161,400,000 BP Capital Markets Plc.(c) EUR 3.250% Perp. 1,794,541 0.131,400,000 BP Capital Markets Plc.(c) EUR 3.625% Perp. 1,839,649 0.13800,000 Direct Line Insurance Group Plc. GBP 4.000% 05/06/2032 1,219,725 0.09
1,450,000 Gazprom PJSC Via Gaz Finance Plc. USD 3.250% 25/02/2030 1,494,859 0.116,650,000 HSBC Holdings Plc.(c) USD 3.803% 11/03/2025 7,226,754 0.533,300,000 HSBC Holdings Plc.(c) USD 1.645% 18/04/2026 3,348,840 0.242,600,000 HSBC Holdings Plc. USD 4.375% 23/11/2026 2,971,878 0.222,500,000 HSBC Holdings Plc.(c) USD 4.583% 19/06/2029 2,950,300 0.222,125,000 Informa Plc. EUR 2.125% 06/10/2025 2,658,423 0.192,400,000 InterContinental Hotels Group Plc. EUR 1.625% 08/10/2024 2,952,160 0.221,150,000 Legal & General Group Plc.(c) GBP 3.750% 26/11/2049 1,640,643 0.121,550,000 Legal & General Group Plc.(c) GBP 5.625% Perp. 2,272,387 0.17350,000 Liberty Living Finance Plc. GBP 3.375% 28/11/2029 507,171 0.04
4,575,000 Lloyds Banking Group Plc.(c) EUR 3.500% 01/04/2026 6,252,960 0.46700,000 M&G Plc.(c) GBP 3.875% 20/07/2049 987,007 0.07900,000 M&G Plc.(c) GBP 6.340% 19/12/2063 1,561,175 0.11700,000 Nationwide Building Society 144A(c)(d) USD 3.622% 26/04/2023 728,028 0.05
3,150,000 Nationwide Building Society 144A(c)(d) USD 4.302% 08/03/2029 3,638,218 0.271,050,000 Nationwide Building Society 144A(c)(d) USD 3.960% 18/07/2030 1,214,294 0.093,265,000 Natwest Group Plc.(c) USD 3.498% 15/05/2023 3,397,657 0.251,400,000 Pension Insurance Corp. Plc. GBP 4.625% 07/05/2031 2,175,858 0.16850,000 Pension Insurance Corp. Plc.(c) GBP 7.375% Perp. 1,346,144 0.10
1,100,000 Phoenix Group Holdings Plc. GBP 5.625% 28/04/2031 1,765,413 0.13850,000 Places For People Treasury Plc. GBP 2.875% 17/08/2026 1,236,042 0.09
1,900,000 Prudential Plc. USD 5.250% Perp. 1,921,356 0.143,950,000 Santander UK Group Holdings Plc.(c) USD 1.532% 21/08/2026 3,981,718 0.291,450,000 Stagecoach Group Plc. GBP 4.000% 29/09/2025 2,036,777 0.152,400,000 Swiss Re Finance UK Plc.(c) EUR 2.714% 04/06/2052 3,166,092 0.231,050,000 Tesco Corporate Treasury Services Plc. GBP 2.750% 27/04/2030 1,536,986 0.111,850,000 Thames Water Utilities Finance Plc. GBP 2.375% 03/05/2023 2,481,973 0.182,050,000 Thames Water Utilities Finance Plc.(c) GBP 5.750% 13/09/2030 2,918,839 0.21750,000 Virgin Money UK Plc.(c) GBP 5.125% 11/12/2030 1,058,440 0.08
2,150,000 Western Power Distribution Plc. GBP 3.625% 06/11/2023 3,070,624 0.221,200,000 Westfield Stratford City Finance No. 2 Plc. GBP 1.642% 04/08/2026 1,620,407 0.12
105,846,108 7.74
United States1,800,000 AbbVie, Inc. USD 4.250% 14/11/2028 2,172,474 0.163,200,000 AbbVie, Inc. USD 3.200% 21/11/2029 3,625,856 0.27175,000 AbbVie, Inc. USD 4.875% 14/11/2048 238,375 0.02
4,350,000 Aetna, Inc. USD 2.800% 15/06/2023 4,576,504 0.33750,000 Agree LP USD 2.900% 01/10/2030 787,373 0.06
1,300,000 Air Lease Corp. USD 3.000% 15/09/2023 1,348,659 0.102,825,000 Air Lease Corp. USD 2.875% 15/01/2026 2,922,462 0.216,675,000 Air Lease Corp. USD 3.750% 01/06/2026 7,188,975 0.531,000,000 Alexandria Real Estate Equities, Inc. USD 3.800% 15/04/2026 1,149,150 0.081,050,000 Alexandria Real Estate Equities, Inc. USD 3.375% 15/08/2031 1,203,153 0.09500,000 Alexandria Real Estate Equities, Inc. USD 4.000% 01/02/2050 619,630 0.05
2,300,000 Ally Financial, Inc. USD 1.450% 02/10/2023 2,343,723 0.173,850,000 Ameren Corp. USD 3.500% 15/01/2031 4,452,871 0.33
Goldman Sachs Funds—Global Credit Portfolio (Hedged)Schedule of InvestmentsAs at 30 November 2020
The accompanying notes are an integral part of these financial statements.
269
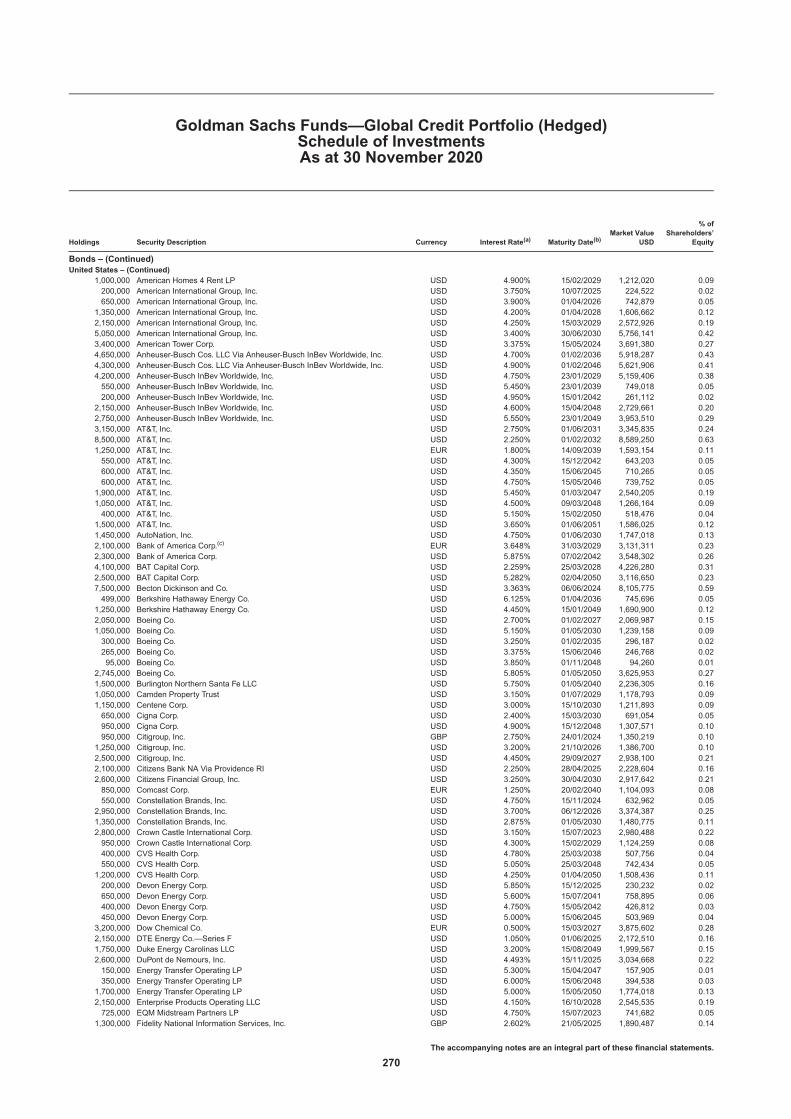
Holdings Security Description Currency Interest Rate(a) Maturity Date(b)Market Value
USD
% ofShareholders’
Equity
Bonds – (Continued)United States – (Continued)
1,000,000 American Homes 4 Rent LP USD 4.900% 15/02/2029 1,212,020 0.09200,000 American International Group, Inc. USD 3.750% 10/07/2025 224,522 0.02650,000 American International Group, Inc. USD 3.900% 01/04/2026 742,879 0.05
1,350,000 American International Group, Inc. USD 4.200% 01/04/2028 1,606,662 0.122,150,000 American International Group, Inc. USD 4.250% 15/03/2029 2,572,926 0.195,050,000 American International Group, Inc. USD 3.400% 30/06/2030 5,756,141 0.423,400,000 American Tower Corp. USD 3.375% 15/05/2024 3,691,380 0.274,650,000 Anheuser-Busch Cos. LLC Via Anheuser-Busch InBev Worldwide, Inc. USD 4.700% 01/02/2036 5,918,287 0.434,300,000 Anheuser-Busch Cos. LLC Via Anheuser-Busch InBev Worldwide, Inc. USD 4.900% 01/02/2046 5,621,906 0.414,200,000 Anheuser-Busch InBev Worldwide, Inc. USD 4.750% 23/01/2029 5,159,406 0.38550,000 Anheuser-Busch InBev Worldwide, Inc. USD 5.450% 23/01/2039 749,018 0.05200,000 Anheuser-Busch InBev Worldwide, Inc. USD 4.950% 15/01/2042 261,112 0.02
2,150,000 Anheuser-Busch InBev Worldwide, Inc. USD 4.600% 15/04/2048 2,729,661 0.202,750,000 Anheuser-Busch InBev Worldwide, Inc. USD 5.550% 23/01/2049 3,953,510 0.293,150,000 AT&T, Inc. USD 2.750% 01/06/2031 3,345,835 0.248,500,000 AT&T, Inc. USD 2.250% 01/02/2032 8,589,250 0.631,250,000 AT&T, Inc. EUR 1.800% 14/09/2039 1,593,154 0.11550,000 AT&T, Inc. USD 4.300% 15/12/2042 643,203 0.05600,000 AT&T, Inc. USD 4.350% 15/06/2045 710,265 0.05600,000 AT&T, Inc. USD 4.750% 15/05/2046 739,752 0.05
1,900,000 AT&T, Inc. USD 5.450% 01/03/2047 2,540,205 0.191,050,000 AT&T, Inc. USD 4.500% 09/03/2048 1,266,164 0.09400,000 AT&T, Inc. USD 5.150% 15/02/2050 518,476 0.04
1,500,000 AT&T, Inc. USD 3.650% 01/06/2051 1,586,025 0.121,450,000 AutoNation, Inc. USD 4.750% 01/06/2030 1,747,018 0.132,100,000 Bank of America Corp.(c) EUR 3.648% 31/03/2029 3,131,311 0.232,300,000 Bank of America Corp. USD 5.875% 07/02/2042 3,548,302 0.264,100,000 BAT Capital Corp. USD 2.259% 25/03/2028 4,226,280 0.312,500,000 BAT Capital Corp. USD 5.282% 02/04/2050 3,116,650 0.237,500,000 Becton Dickinson and Co. USD 3.363% 06/06/2024 8,105,775 0.59499,000 Berkshire Hathaway Energy Co. USD 6.125% 01/04/2036 745,696 0.05
1,250,000 Berkshire Hathaway Energy Co. USD 4.450% 15/01/2049 1,690,900 0.122,050,000 Boeing Co. USD 2.700% 01/02/2027 2,069,987 0.151,050,000 Boeing Co. USD 5.150% 01/05/2030 1,239,158 0.09300,000 Boeing Co. USD 3.250% 01/02/2035 296,187 0.02265,000 Boeing Co. USD 3.375% 15/06/2046 246,768 0.0295,000 Boeing Co. USD 3.850% 01/11/2048 94,260 0.01
2,745,000 Boeing Co. USD 5.805% 01/05/2050 3,625,953 0.271,500,000 Burlington Northern Santa Fe LLC USD 5.750% 01/05/2040 2,236,305 0.161,050,000 Camden Property Trust USD 3.150% 01/07/2029 1,178,793 0.091,150,000 Centene Corp. USD 3.000% 15/10/2030 1,211,893 0.09650,000 Cigna Corp. USD 2.400% 15/03/2030 691,054 0.05950,000 Cigna Corp. USD 4.900% 15/12/2048 1,307,571 0.10950,000 Citigroup, Inc. GBP 2.750% 24/01/2024 1,350,219 0.10
1,250,000 Citigroup, Inc. USD 3.200% 21/10/2026 1,386,700 0.102,500,000 Citigroup, Inc. USD 4.450% 29/09/2027 2,938,100 0.212,100,000 Citizens Bank NA Via Providence RI USD 2.250% 28/04/2025 2,228,604 0.162,600,000 Citizens Financial Group, Inc. USD 3.250% 30/04/2030 2,917,642 0.21850,000 Comcast Corp. EUR 1.250% 20/02/2040 1,104,093 0.08550,000 Constellation Brands, Inc. USD 4.750% 15/11/2024 632,962 0.05
2,950,000 Constellation Brands, Inc. USD 3.700% 06/12/2026 3,374,387 0.251,350,000 Constellation Brands, Inc. USD 2.875% 01/05/2030 1,480,775 0.112,800,000 Crown Castle International Corp. USD 3.150% 15/07/2023 2,980,488 0.22950,000 Crown Castle International Corp. USD 4.300% 15/02/2029 1,124,259 0.08400,000 CVS Health Corp. USD 4.780% 25/03/2038 507,756 0.04550,000 CVS Health Corp. USD 5.050% 25/03/2048 742,434 0.05
1,200,000 CVS Health Corp. USD 4.250% 01/04/2050 1,508,436 0.11200,000 Devon Energy Corp. USD 5.850% 15/12/2025 230,232 0.02650,000 Devon Energy Corp. USD 5.600% 15/07/2041 758,895 0.06400,000 Devon Energy Corp. USD 4.750% 15/05/2042 426,812 0.03450,000 Devon Energy Corp. USD 5.000% 15/06/2045 503,969 0.04
3,200,000 Dow Chemical Co. EUR 0.500% 15/03/2027 3,875,602 0.282,150,000 DTE Energy Co.—Series F USD 1.050% 01/06/2025 2,172,510 0.161,750,000 Duke Energy Carolinas LLC USD 3.200% 15/08/2049 1,999,567 0.152,600,000 DuPont de Nemours, Inc. USD 4.493% 15/11/2025 3,034,668 0.22150,000 Energy Transfer Operating LP USD 5.300% 15/04/2047 157,905 0.01350,000 Energy Transfer Operating LP USD 6.000% 15/06/2048 394,538 0.03
1,700,000 Energy Transfer Operating LP USD 5.000% 15/05/2050 1,774,018 0.132,150,000 Enterprise Products Operating LLC USD 4.150% 16/10/2028 2,545,535 0.19725,000 EQM Midstream Partners LP USD 4.750% 15/07/2023 741,682 0.05
1,300,000 Fidelity National Information Services, Inc. GBP 2.602% 21/05/2025 1,890,487 0.14
Goldman Sachs Funds—Global Credit Portfolio (Hedged)Schedule of InvestmentsAs at 30 November 2020
The accompanying notes are an integral part of these financial statements.
270

Holdings Security Description Currency Interest Rate(a) Maturity Date(b)Market Value
USD
% ofShareholders’
Equity
Bonds – (Continued)United States – (Continued)
1,400,000 FirstEnergy Corp. USD 2.650% 01/03/2030 1,386,714 0.102,000,000 Ford Motor Credit Co., LLC USD 4.375% 06/08/2023 2,082,560 0.153,400,000 General Electric Co. USD 2.700% 09/10/2022 3,533,790 0.261,400,000 General Electric Co. USD 3.100% 09/01/2023 1,472,114 0.112,950,000 General Electric Co. USD 3.625% 01/05/2030 3,305,947 0.241,282,000 General Electric Co. USD 5.875% 14/01/2038 1,653,754 0.1276,000 General Electric Co. USD 4.125% 09/10/2042 85,181 0.01
1,550,000 General Electric Co. USD 4.350% 01/05/2050 1,817,809 0.13900,000 General Electric Co.—Series MTNA USD 6.750% 15/03/2032 1,224,432 0.09
1,950,000 General Motors Co. USD 5.400% 02/10/2023 2,185,989 0.161,100,000 General Motors Co. USD 5.000% 01/04/2035 1,305,205 0.10325,000 General Motors Co. USD 6.600% 01/04/2036 438,669 0.03500,000 General Motors Co. USD 6.250% 02/10/2043 673,285 0.05
1,500,000 General Motors Financial Co., Inc. USD 5.200% 20/03/2023 1,643,310 0.12650,000 General Motors Financial Co., Inc. USD 5.650% 17/01/2029 804,856 0.06500,000 Healthpeak Properties, Inc. USD 3.250% 15/07/2026 557,885 0.04
1,550,000 Hewlett Packard Enterprise Co. USD 4.450% 02/10/2023 1,708,038 0.125,050,000 Hewlett Packard Enterprise Co. USD 4.900% 15/10/2025 5,872,897 0.432,350,000 Hewlett Packard Enterprise Co. USD 6.350% 15/10/2045 3,105,830 0.231,900,000 Huntsman International LLC USD 4.500% 01/05/2029 2,186,047 0.164,450,000 Intercontinental Exchange, Inc. USD 1.850% 15/09/2032 4,496,858 0.333,200,000 JPMorgan Chase & Co. USD 3.625% 01/12/2027 3,624,512 0.262,100,000 JPMorgan Chase & Co.(c) EUR 1.001% 25/07/2031 2,667,805 0.19600,000 Kinder Morgan Energy Partners LP USD 6.550% 15/09/2040 792,654 0.06275,000 Kroger Co. USD 3.950% 15/01/2050 336,501 0.02
5,000,000 Lowe’s Cos., Inc. USD 4.500% 15/04/2030 6,197,850 0.451,750,000 Marathon Petroleum Corp. USD 4.750% 15/09/2044 1,931,965 0.145,100,000 MPLX LP USD 2.650% 15/08/2030 5,190,831 0.382,975,000 MPLX LP USD 4.500% 15/04/2038 3,293,950 0.24400,000 MPLX LP USD 5.500% 15/02/2049 496,680 0.04
2,000,000 MPT Operating Partnership LP Via MPT Finance Corp. GBP 2.550% 05/12/2023 2,707,151 0.201,150,000 NiSource, Inc. USD 3.600% 01/05/2030 1,332,471 0.103,850,000 NiSource, Inc. USD 1.700% 15/02/2031 3,844,802 0.28700,000 Occidental Petroleum Corp. USD 3.200% 15/08/2026 620,487 0.05650,000 Occidental Petroleum Corp. USD 3.500% 15/08/2029 569,849 0.04
1,400,000 Pacific Gas & Electric Co. USD 2.500% 01/02/2031 1,409,324 0.10550,000 Pacific Gas & Electric Co. USD 3.300% 01/08/2040 553,729 0.04
1,150,000 Pacific Gas & Electric Co. USD 3.500% 01/08/2050 1,158,326 0.08450,000 Pfizer, Inc. USD 7.200% 15/03/2039 773,267 0.06750,000 Phillips 66 USD 3.850% 09/04/2025 837,653 0.06775,000 Phillips 66 USD 1.300% 15/02/2026 780,611 0.06750,000 Piedmont Natural Gas Co., Inc. USD 3.350% 01/06/2050 856,103 0.0616,000 Progress Energy, Inc. USD 7.750% 01/03/2031 23,550 0.00
1,775,000 Prologis Euro Finance LLC EUR 1.000% 06/02/2035 2,240,047 0.162,400,000 Prudential Financial, Inc. USD 3.000% 10/03/2040 2,599,824 0.191,300,000 Reynolds American, Inc. USD 4.450% 12/06/2025 1,482,390 0.11850,000 Sempra Energy USD 4.000% 01/02/2048 1,016,065 0.075,000 Sherwin-Williams Co. USD 2.750% 01/06/2022 5,164 0.00
350,000 Sherwin-Williams Co. USD 3.125% 01/06/2024 378,760 0.03200,000 Southern California Edison Co.—Series E USD 3.700% 01/08/2025 224,494 0.02
2,400,000 Southern Co. USD 3.250% 01/07/2026 2,687,880 0.201,050,000 Spirit Realty LP USD 3.200% 15/01/2027 1,106,259 0.081,350,000 Spirit Realty LP USD 4.000% 15/07/2029 1,502,537 0.11850,000 Sunoco Logistics Partners Operations LP USD 5.300% 01/04/2044 887,145 0.06650,000 Sunoco Logistics Partners Operations LP USD 5.400% 01/10/2047 692,283 0.05800,000 Sysco Corp. USD 5.950% 01/04/2030 1,056,552 0.08
1,150,000 Sysco Corp. USD 6.600% 01/04/2050 1,777,992 0.13900,000 Thermo Fisher Scientific, Inc. EUR 1.875% 01/10/2049 1,238,835 0.09
3,325,000 Valero Energy Corp. USD 4.000% 01/04/2029 3,681,074 0.27400,000 Valero Energy Partners LP USD 4.375% 15/12/2026 452,964 0.03400,000 VEREIT Operating Partnership LP USD 4.600% 06/02/2024 436,164 0.03
3,150,000 VEREIT Operating Partnership LP USD 4.625% 01/11/2025 3,544,726 0.26925,000 VEREIT Operating Partnership LP USD 2.850% 15/12/2032 943,112 0.07
1,200,000 Verizon Communications, Inc. USD 4.400% 01/11/2034 1,516,932 0.112,000,000 Verizon Communications, Inc. USD 4.862% 21/08/2046 2,748,700 0.20875,000 Verizon Communications, Inc. USD 4.522% 15/09/2048 1,168,230 0.0974,000 Verizon Communications, Inc. USD 5.012% 15/04/2049 105,055 0.01700,000 Verizon Communications, Inc. USD 4.000% 22/03/2050 878,332 0.06
5,750,000 Wells Fargo & Co. USD 3.000% 23/10/2026 6,332,762 0.462,850,000 Wells Fargo & Co.(c) EUR 1.741% 04/05/2030 3,754,401 0.271,300,000 Wells Fargo & Co. EUR 0.625% 14/08/2030 1,564,670 0.11
Goldman Sachs Funds—Global Credit Portfolio (Hedged)Schedule of InvestmentsAs at 30 November 2020
The accompanying notes are an integral part of these financial statements.
271

Holdings Security Description Currency Interest Rate(a) Maturity Date(b)Market Value
USD
% ofShareholders’
Equity
Bonds – (Continued)United States – (Continued)
1,850,000 Western Midstream Operating LP USD 4.000% 01/07/2022 1,887,129 0.142,850,000 Western Midstream Operating LP USD 4.100% 01/02/2025 2,878,699 0.21850,000 Whirlpool Corp. USD 4.600% 15/05/2050 1,124,125 0.08
1,300,000 Williams Cos., Inc. USD 4.300% 04/03/2024 1,428,687 0.102,150,000 WP Carey, Inc. USD 3.850% 15/07/2029 2,423,028 0.18475,000 WP Carey, Inc. USD 2.400% 01/02/2031 485,631 0.04
317,445,989 23.21
TOTAL BONDS(cost USD 757,268,099) 843,707,496 61.69
Holdings Security DescriptionMarket Value
USD
% ofShareholders’
Equity
Mutual Funds – 1.27%Ireland
17,328,754 Goldman Sachs US$ Treasury Liquid Reserves Fund (X Distribution Class)(e)(f) 17,328,754 1.27
TOTAL MUTUAL FUNDS(cost USD 17,328,754) 17,328,754 1.27
TOTAL TRANSFERABLE SECURITIES ADMITTED TO AN OFFICIAL EXCHANGE LISTING(cost USD 774,596,853) 861,036,250 62.96
Holdings Security Description Currency Interest Rate(a) Maturity Date(b)Market Value
USD
% ofShareholders’
Equity
Transferable securities dealt in another regulated market
Bonds – 30.76%Australia
2,600,000 Australia & New Zealand Banking Group Ltd. 144A(c)(d) USD 2.950% 22/07/2030 2,728,674 0.203,200,000 Commonwealth Bank of Australia 144A(c)(d) USD 3.610% 12/09/2034 3,505,760 0.261,200,000 Macquarie Bank Ltd. 144A(d) USD 3.624% 03/06/2030 1,298,328 0.091,000,000 Macquarie Group Ltd. 144A(c)(d) USD 3.763% 28/11/2028 1,105,900 0.081,150,000 Newcrest Finance Pty Ltd. 144A(d) USD 3.250% 13/05/2030 1,270,290 0.093,950,000 Westpac Banking Corp.(c) USD 2.668% 15/11/2035 4,081,653 0.30
13,990,605 1.02
Bermuda2,450,000 Bacardi Ltd. 144A(d) USD 5.300% 15/05/2048 3,283,882 0.24
Canada2,300,000 Glencore Finance Canada Ltd. 144A(d) USD 4.950% 15/11/2021 2,394,622 0.184,725,000 Teck Resources Ltd. USD 3.900% 15/07/2030 5,191,499 0.38
7,586,121 0.56
Cayman Islands2,850,000 Avolon Holdings Funding Ltd. 144A(d) USD 3.950% 01/07/2024 2,911,275 0.221,475,000 Avolon Holdings Funding Ltd. 144A(d) USD 4.250% 15/04/2026 1,527,333 0.111,700,000 Avolon Holdings Funding Ltd. 144A(d) USD 3.250% 15/02/2027 1,645,056 0.12
6,083,664 0.45
France6,050,000 BNP Paribas S.A. 144A(d) USD 3.500% 01/03/2023 6,440,225 0.471,650,000 BNP Paribas S.A. 144A(c)(d) USD 2.219% 09/06/2026 1,718,822 0.132,950,000 BNP Paribas S.A. 144A(d) USD 4.625% 13/03/2027 3,419,905 0.253,000,000 BNP Paribas S.A. 144A(c)(d) USD 4.375% 01/03/2033 3,397,440 0.252,600,000 BNP Paribas S.A. 144A(c)(d) USD 2.588% 12/08/2035 2,623,972 0.193,900,000 BPCE S.A. 144A(d) USD 4.000% 12/09/2023 4,248,270 0.313,375,000 BPCE S.A. 144A(c)(d) USD 1.652% 06/10/2026 3,426,637 0.25800,000 Credit Agricole S.A. 144A(d) USD 3.750% 24/04/2023 861,104 0.06
3,600,000 Credit Agricole S.A. 144A(d) USD 3.250% 04/10/2024 3,908,808 0.291,450,000 Credit Agricole S.A. 144A(c)(d) USD 1.907% 16/06/2026 1,497,227 0.11955,000 Pernod Ricard S.A. 144A(d) USD 5.500% 15/01/2042 1,355,451 0.10
32,897,861 2.41
Germany2,350,000 Deutsche Bank AG(c) USD 2.222% 18/09/2024 2,398,645 0.18
Goldman Sachs Funds—Global Credit Portfolio (Hedged)Schedule of InvestmentsAs at 30 November 2020
The accompanying notes are an integral part of these financial statements.
272

Holdings Security Description Currency Interest Rate(a) Maturity Date(b)Market Value
USD
% ofShareholders’
Equity
Bonds – (Continued)Germany – (Continued)
1,425,000 Deutsche Bank AG(c) USD 2.129% 24/11/2026 1,441,031 0.101,300,000 Deutsche Telekom AG 144A(d) USD 3.625% 21/01/2050 1,522,326 0.11
5,362,002 0.39
Hong Kong1,500,000 AIA Group Ltd. 144A(d) USD 3.600% 09/04/2029 1,696,035 0.12
Mexico370,000 Trust Fibra Uno USD 5.250% 15/12/2024 408,792 0.03
Netherlands1,300,000 Enel Finance International NV 144A(d) USD 4.250% 14/09/2023 1,426,373 0.10360,000 Prosus NV 144A(d) USD 3.680% 21/01/2030 393,228 0.03
3,200,000 Syngenta Finance NV 144A(d) USD 4.441% 24/04/2023 3,381,504 0.251,550,000 Syngenta Finance NV 144A(d) USD 4.892% 24/04/2025 1,678,945 0.12
6,880,050 0.50
Supranationals4,750,000 Broadcom Corp. Via Broadcom Cayman Finance Ltd. USD 3.625% 15/01/2024 5,124,727 0.374,050,000 Broadcom Corp. Via Broadcom Cayman Finance Ltd. USD 3.125% 15/01/2025 4,355,168 0.321,150,000 NXP BV Via NXP Funding LLC Via NXP USA, Inc. 144A(d) USD 3.400% 01/05/2030 1,298,523 0.10
10,778,418 0.79
Switzerland2,200,000 Credit Suisse Group AG 144A(c)(d) USD 3.869% 12/01/2029 2,492,820 0.184,250,000 Credit Suisse Group AG 144A(c)(d) USD 4.194% 01/04/2031 5,009,177 0.374,100,000 UBS Group AG 144A(c)(d) USD 1.364% 30/01/2027 4,137,310 0.30
11,639,307 0.85
United Arab Emirates300,000 Dolphin Energy Ltd., LLC USD 5.500% 15/12/2021 315,281 0.02
United Kingdom1,850,000 Lloyds Banking Group Plc.(c) USD 7.500% Perp. 2,092,813 0.15700,000 Royalty Pharma Plc. 144A(d) USD 1.200% 02/09/2025 704,858 0.05
1,000,000 Royalty Pharma Plc. 144A(d) USD 1.750% 02/09/2027 1,019,820 0.08
3,817,491 0.28
United States8,100,000 AbbVie, Inc. USD 4.050% 21/11/2039 9,828,945 0.725,750,000 AbbVie, Inc. USD 4.250% 21/11/2049 7,258,857 0.53650,000 AEP Transmission Co., LLC—Series M USD 3.650% 01/04/2050 792,675 0.06
2,200,000 American International Group, Inc. USD 4.375% 30/06/2050 2,858,746 0.211,950,000 Amgen, Inc. USD 4.400% 01/05/2045 2,475,740 0.182,000,000 Apple, Inc. USD 3.850% 04/05/2043 2,572,400 0.193,100,000 Arch Capital Finance LLC USD 4.011% 15/12/2026 3,606,168 0.26800,000 AT&T, Inc. USD 4.850% 15/07/2045 1,005,432 0.07
5,500,000 Bank of America Corp.(c) USD 3.864% 23/07/2024 5,967,445 0.442,350,000 Bank of America Corp.(c) USD 3.458% 15/03/2025 2,549,938 0.193,550,000 Bank of America Corp.(c) USD 3.366% 23/01/2026 3,895,273 0.283,775,000 Bank of America Corp.(c) USD 1.922% 24/10/2031 3,813,618 0.2865,000 Bay Area Toll Authority USD 6.263% 01/04/2049 112,432 0.01300,000 Berkshire Hathaway Energy Co. 144A(d) USD 4.250% 15/10/2050 393,867 0.03100,000 Boeing Co. USD 3.625% 01/03/2048 96,284 0.01
2,200,000 Bristol-Myers Squibb Co. USD 4.550% 20/02/2048 3,073,928 0.22400,000 Bristol-Myers Squibb Co. USD 4.250% 26/10/2049 543,572 0.04
3,850,000 Broadcom, Inc. USD 3.625% 15/10/2024 4,217,944 0.312,550,000 Broadcom, Inc. USD 4.700% 15/04/2025 2,917,888 0.213,850,000 Broadcom, Inc. USD 4.250% 15/04/2026 4,387,652 0.325,663,000 Broadcom, Inc. USD 3.459% 15/09/2026 6,256,369 0.465,600,000 Carrier Global Corp. 144A(d) USD 2.722% 15/02/2030 5,971,392 0.449,800,000 Charter Communications Operating LLC Via Charter Communications
Operating Capital USD 4.500% 01/02/2024 10,865,162 0.794,850,000 Charter Communications Operating LLC Via Charter Communications
Operating Capital USD 4.908% 23/07/2025 5,609,898 0.412,700,000 Charter Communications Operating LLC Via Charter Communications
Operating Capital USD 4.800% 01/03/2050 3,234,357 0.243,400,000 Citigroup, Inc.(c) USD 4.044% 01/06/2024 3,689,442 0.274,350,000 Citigroup, Inc.(c) USD 0.776% 30/10/2024 4,361,962 0.329,350,000 Citigroup, Inc.(c) USD 4.412% 31/03/2031 11,308,731 0.832,800,000 Citigroup, Inc.(c) USD 2.572% 03/06/2031 2,977,996 0.22
Goldman Sachs Funds—Global Credit Portfolio (Hedged)Schedule of InvestmentsAs at 30 November 2020
The accompanying notes are an integral part of these financial statements.
273

Holdings Security Description Currency Interest Rate(a) Maturity Date(b)Market Value
USD
% ofShareholders’
Equity
Bonds – (Continued)United States – (Continued)
3,400,000 Citrix Systems, Inc. USD 3.300% 01/03/2030 3,654,354 0.271,675,000 CMS Energy Corp.(c) USD 3.750% 01/12/2050 1,690,058 0.12400,000 Comcast Corp. USD 3.250% 01/11/2039 455,524 0.03
1,000,000 Comcast Corp. USD 6.400% 01/03/2040 1,586,850 0.125,825,000 Comcast Corp. USD 3.750% 01/04/2040 7,062,754 0.52400,000 Commonwealth Edison Co. USD 3.800% 01/10/2042 479,120 0.03
1,250,000 Commonwealth Edison Co. USD 4.000% 01/03/2048 1,593,538 0.122,550,000 CoStar Group, Inc. 144A(d) USD 2.800% 15/07/2030 2,676,285 0.202,700,000 Dell International LLC Via EMC Corp. 144A(d) USD 5.850% 15/07/2025 3,217,347 0.2310,200,000 Dell International LLC Via EMC Corp. 144A(d) USD 6.020% 15/06/2026 12,382,392 0.90475,000 Dell International LLC Via EMC Corp. 144A(d) USD 4.900% 01/10/2026 555,289 0.04
1,850,000 Dell International LLC Via EMC Corp. 144A(d) USD 5.300% 01/10/2029 2,234,301 0.16300,000 Dell International LLC Via EMC Corp. 144A(d) USD 6.200% 15/07/2030 380,418 0.03800,000 Dentsply Sirona, Inc. USD 3.250% 01/06/2030 882,776 0.06350,000 Diamondback Energy, Inc. USD 4.750% 31/05/2025 390,145 0.03
2,800,000 Diamondback Energy, Inc. USD 3.500% 01/12/2029 2,937,984 0.21600,000 East Ohio Gas Co. 144A(d) USD 3.000% 15/06/2050 651,702 0.05
4,400,000 Elanco Animal Health, Inc. USD 5.272% 28/08/2023 4,775,888 0.353,200,000 Energy Transfer Operating LP—Series 5Y USD 4.200% 15/09/2023 3,409,504 0.251,400,000 Exelon Corp. USD 3.400% 15/04/2026 1,571,556 0.112,835,000 Expedia Group, Inc. USD 4.500% 15/08/2024 3,067,385 0.224,650,000 Expedia Group, Inc. USD 3.800% 15/02/2028 4,848,555 0.351,050,000 Fiserv, Inc. USD 3.800% 01/10/2023 1,144,353 0.083,450,000 GE Capital Funding LLC 144A(d) USD 4.400% 15/05/2030 3,976,746 0.291,300,000 Gilead Sciences, Inc. USD 4.150% 01/03/2047 1,602,380 0.123,552,000 Glencore Funding LLC 144A(d) USD 4.125% 30/05/2023 3,824,652 0.283,800,000 Glencore Funding LLC 144A(d) USD 4.125% 12/03/2024 4,141,658 0.301,200,000 Glencore Funding LLC 144A(d) USD 4.625% 29/04/2024 1,332,960 0.10800,000 Hewlett Packard Enterprise Co. USD 4.650% 01/10/2024 907,880 0.07
5,750,000 JPMorgan Chase & Co.(c) USD 4.493% 24/03/2031 7,058,700 0.522,250,000 JPMorgan Chase & Co.(c) USD 2.956% 13/05/2031 2,449,103 0.182,900,000 JPMorgan Chase & Co.(c) USD 3.882% 24/07/2038 3,508,072 0.263,200,000 JPMorgan Chase & Co.—Series HH(c) USD 4.600% Perp. 3,258,496 0.242,500,000 Keurig Dr Pepper, Inc. USD 4.057% 25/05/2023 2,711,100 0.202,850,000 Keurig Dr Pepper, Inc. USD 4.417% 25/05/2025 3,284,739 0.24100,000 Keurig Dr Pepper, Inc. USD 4.500% 15/11/2045 128,671 0.01275,000 Keurig Dr Pepper, Inc. USD 5.085% 25/05/2048 387,684 0.03650,000 Keurig Dr Pepper, Inc. USD 3.800% 01/05/2050 780,910 0.06300,000 Los Angeles Unified School District USD 6.758% 01/07/2034 441,816 0.03
1,450,000 Marathon Petroleum Corp. USD 3.800% 01/04/2028 1,585,909 0.12800,000 Mars, Inc. 144A(d) USD 3.950% 01/04/2049 1,017,024 0.07550,000 Metropolitan Transportation Authority USD 6.668% 15/11/2039 699,880 0.0580,000 Metropolitan Transportation Authority USD 7.336% 15/11/2039 128,696 0.01
1,850,000 Microchip Technology, Inc. USD 3.922% 01/06/2021 1,880,667 0.147,500,000 Morgan Stanley(c) USD 3.622% 01/04/2031 8,729,775 0.641,775,000 Morgan Stanley(c) USD 5.597% 24/03/2051 2,854,945 0.211,250,000 New York Life Insurance Co. 144A(d) USD 3.750% 15/05/2050 1,483,113 0.111,100,000 NRG Energy, Inc. 144A(d) USD 3.750% 15/06/2024 1,184,271 0.09850,000 NRG Energy, Inc. 144A(d) USD 4.450% 15/06/2029 972,103 0.07
2,200,000 Nutrition & Biosciences, Inc. 144A(d) USD 1.230% 01/10/2025 2,223,980 0.16900,000 Nutrition & Biosciences, Inc. 144A(d) USD 1.832% 15/10/2027 917,406 0.07
1,600,000 Nutrition & Biosciences, Inc. 144A(d) USD 2.300% 01/11/2030 1,644,960 0.12550,000 Nutrition & Biosciences, Inc. 144A(d) USD 3.268% 15/11/2040 594,611 0.04
1,850,000 Nutrition & Biosciences, Inc. 144A(d) USD 3.468% 01/12/2050 2,032,392 0.15900,000 Occidental Petroleum Corp. USD 5.550% 15/03/2026 897,750 0.06
1,100,000 Occidental Petroleum Corp. USD 6.450% 15/09/2036 1,050,500 0.084,250,000 Otis Worldwide Corp. USD 3.112% 15/02/2040 4,663,312 0.342,650,000 Penske Truck Leasing Co. LP Via PTL Finance Corp. 144A(d) USD 4.875% 11/07/2022 2,833,539 0.21900,000 Penske Truck Leasing Co. LP Via PTL Finance Corp. 144A(d) USD 3.400% 15/11/2026 998,478 0.07250,000 Regents of the University of California Medical Center Pooled Revenue USD 6.583% 15/05/2049 401,060 0.03
3,900,000 Sabine Pass Liquefaction LLC USD 6.250% 15/03/2022 4,117,932 0.302,950,000 Sabine Pass Liquefaction LLC USD 5.750% 15/05/2024 3,349,489 0.242,000,000 Sabine Pass Liquefaction LLC USD 5.625% 01/03/2025 2,313,580 0.173,425,000 Sabine Pass Liquefaction LLC 144A(d) USD 4.500% 15/05/2030 4,000,742 0.29875,000 State of California USD 7.625% 01/03/2040 1,520,063 0.11250,000 State of Illinois USD 6.725% 01/04/2035 273,980 0.02
1,480,000 Teachers Insurance & Annuity Association of America 144A(d) USD 4.900% 15/09/2044 1,978,257 0.142,250,000 T-Mobile USA, Inc. 144A(d) USD 3.500% 15/04/2025 2,484,000 0.185,550,000 T-Mobile USA, Inc. 144A(d) USD 3.750% 15/04/2027 6,273,276 0.4610,350,000 T-Mobile USA, Inc. 144A(d) USD 3.875% 15/04/2030 11,883,352 0.871,850,000 T-Mobile USA, Inc. 144A(d) USD 2.550% 15/02/2031 1,927,219 0.14
Goldman Sachs Funds—Global Credit Portfolio (Hedged)Schedule of InvestmentsAs at 30 November 2020
The accompanying notes are an integral part of these financial statements.
274

Holdings Security Description Currency Interest Rate(a) Maturity Date(b)Market Value
USD
% ofShareholders’
Equity
Bonds – (Continued)United States – (Continued)
3,550,000 T-Mobile USA, Inc. 144A(d) USD 3.000% 15/02/2041 3,640,702 0.27450,000 VEREIT Operating Partnership LP USD 3.400% 15/01/2028 487,692 0.043,000 Verizon Communications, Inc. USD 4.016% 03/12/2029 3,587 0.00
780,000 Verizon Communications, Inc. 144A(d) USD 2.987% 30/10/2056 820,856 0.063,900,000 Vistra Operations Co., LLC 144A(d) USD 4.300% 15/07/2029 4,371,003 0.321,150,000 Walgreens Boots Alliance, Inc. USD 3.200% 15/04/2030 1,242,012 0.092,100,000 Walgreens Boots Alliance, Inc. USD 4.100% 15/04/2050 2,255,883 0.163,250,000 Wells Fargo & Co.(c) USD 2.393% 02/06/2028 3,435,705 0.252,025,000 Wells Fargo & Co.(c) USD 2.572% 11/02/2031 2,148,505 0.16350,000 Wells Fargo & Co.(c) USD 5.013% 04/04/2051 500,350 0.04
315,910,314 23.10
TOTAL BONDS(cost USD 385,349,437) 420,649,823 30.76
Non-Agencies Asset Backed Obligations – 1.92%Cayman Islands
3,150,000 Battalion CLO XII Ltd. 2018-12A �A1� 144A(c)(d) USD 1.292% 17/05/2031 3,139,369 0.238,850,000 Madison Park Funding XXX Ltd. 2018-30A �A� 144A(c)(d) USD 0.987% 15/04/2029 8,778,069 0.645,500,000 Tryon Park CLO Ltd. 2013-1A �A1SR� 144A(c)(d) USD 1.127% 15/04/2029 5,456,353 0.40
17,373,791 1.27
United States9,983 Alternative Loan Trust 2006-OA16 �A2�(c) USD 0.340% 25/10/2046 9,485 0.00
483,414 Bayview Opportunity Master Fund IVb Trust 2017-SPL4 �A� 144A(c)(d) USD 3.500% 28/01/2055 493,471 0.042,899,331 Higher Education Funding I 2014-1 �A� 144A(c)(d) USD 1.257% 25/05/2034 2,919,688 0.212,269,962 SLM Student Loan Trust 2003-1 �A5A� 144A(c)(d) USD 0.360% 15/12/2032 2,095,395 0.152,847,888 SLM Student Loan Trust 2007-2 �A4�(c) USD 0.275% 25/07/2022 2,732,648 0.20672,758 SLM Student Loan Trust 2008-4 �A4�(c) USD 1.865% 25/07/2022 671,949 0.05
8,922,636 0.65
TOTAL NON-AGENCIES ASSET BACKED OBLIGATIONS(cost USD 26,495,740) 26,296,427 1.92
TOTAL TRANSFERABLE SECURITIES DEALT IN ANOTHER REGULATED MARKET(cost USD 411,845,177) 446,946,250 32.68
MARKET VALUE OF INVESTMENTS EXCLUDING DERIVATIVES(cost USD 1,186,442,030) 1,307,982,500 95.64
Futures Contracts – 0.01%
Number ofContracts Security Description
CommitmentMarket Value
USD
UnrealisedGainUSD
% ofShareholders’
Equity
GBP6 UK Long Gilt Bond Futures 29/03/2021 Long 1,078,399 2,554 0.00
USD307 US Treasury Long Bond Futures 22/03/2021 Long 53,638,656 17,318 0.00855 US Treasury Notes 10YR Futures 22/03/2021 Long 118,083,516 212,796 0.0283 US Treasury Notes 2YR Futures 31/03/2021 Long 18,328,734 3,898 0.00239 US Treasury Ultra Long Bond Futures 22/03/2021 Long 51,541,844 16,909 0.00
241,592,750 250,921 0.02
UNREALISED GAIN ON FUTURES CONTRACTS 253,475 0.02
Number ofContracts Security Description
CommitmentMarket Value
USD
UnrealisedLossUSD
% ofShareholders’
Equity
AUD32 Australian Treasury Bonds 10YR Futures 15/12/2020 Long 3,511,646 (10,057) (0.00)
CAD89 Canadian Government Bond 10YR Futures 22/03/2021 Long 10,233,263 (27,373) (0.00)
Goldman Sachs Funds—Global Credit Portfolio (Hedged)Schedule of InvestmentsAs at 30 November 2020
The accompanying notes are an integral part of these financial statements.
275

Futures Contracts – (Continued)
Number ofContracts Security Description
CommitmentMarket Value
USD
UnrealisedLossUSD
% ofShareholders’
Equity
USD(22) US Treasury Notes 5YR Futures 31/03/2021 Short (2,771,828) (739) (0.00)(412) US Treasury Ultra Long Notes 10YR Futures 22/03/2021 Short (64,684,000) (101,740) (0.01)
(67,455,828) (102,479) (0.01)
UNREALISED LOSS ON FUTURES CONTRACTS (139,909) (0.01)
Share Class Specific Futures Contracts – (0.00%)
Number ofContracts Security Description
CommitmentMarket Value
USD
UnrealisedGainUSD
% ofShareholders’
Equity
USD(36) US Treasury Long Bond Futures 22/03/2021 Short (6,289,875) 1,776 0.00(62) US Treasury Ultra Long Bond Futures 22/03/2021 Short (13,370,688) 5,328 0.00
(19,660,563) 7,104 0.00
UNREALISED GAIN ON SHARE CLASS SPECIFIC FUTURES CONTRACTS 7,104 0.00
Number ofContracts Security Description
CommitmentMarket Value
USD
UnrealisedLossUSD
% ofShareholders’
Equity
USD(64) US Treasury Notes 10YR Futures 22/03/2021 Short (8,839,000) (16,000) (0.00)(48) US Treasury Notes 2YR Futures 31/03/2021 Short (10,599,750) (3,000) (0.00)(145) US Treasury Notes 5YR Futures 31/03/2021 Short (18,268,867) (15,351) (0.00)(49) US Treasury Ultra Long Notes 10YR Futures 22/03/2021 Short (7,693,000) (12,100) (0.00)
(45,400,617) (46,451) (0.00)
UNREALISED LOSS ON SHARE CLASS SPECIFIC FUTURES CONTRACTS (46,451) (0.00)
Forward Currency Contracts – (0.71%)
CurrencyAmountBought Currency
AmountSold
MaturityDate
UnrealisedGainUSD
% ofShareholders’
Equity
JPY 979,562,137 USD 9,393,216 16/12/2020 5,202 0.00GBP 1,615,527 USD 2,120,099 13/01/2021 41,739 0.01
UNREALISED GAIN ON FORWARD CURRENCY CONTRACTS 46,941 0.01
CurrencyAmountBought Currency
AmountSold
MaturityDate
UnrealisedLossUSD
% ofShareholders’
Equity
EUR 6,213,221 NOK 69,428,243 16/12/2020 (432,446) (0.03)EUR 7,128,910 SEK 74,333,859 16/12/2020 (210,034) (0.02)USD 6,386,410 AUD 9,092,839 16/12/2020 (323,734) (0.02)USD 7,910,077 CAD 10,574,349 16/12/2020 (266,725) (0.02)USD 6,390,463 NZD 9,651,737 16/12/2020 (409,838) (0.03)USD 71,203,063 GBP 55,347,073 13/01/2021 (2,860,327) (0.22)USD 336,185,465 EUR 284,242,956 21/01/2021 (5,297,987) (0.38)
UNREALISED LOSS ON FORWARD CURRENCY CONTRACTS (9,801,091) (0.72)
Share Class Specific Forward Currency Contracts – 0.67%
CurrencyAmountBought Currency
AmountSold
MaturityDate
UnrealisedGainUSD
% ofShareholders’
Equity
CHF 74,920,796 USD 82,026,580 10/12/2020 880,813 0.07SEK 1,578,557 USD 178,160 10/12/2020 7,942 0.00GBP 31,615,760 USD 40,763,547 13/01/2021 1,543,482 0.11EUR 371,311,865 USD 439,263,662 21/01/2021 6,822,527 0.50
UNREALISED GAIN ON FORWARD CURRENCY CONTRACTS HELD FOR HEDGING PURPOSES 9,254,764 0.68
CurrencyAmountBought Currency
AmountSold
MaturityDate
UnrealisedLossUSD
% ofShareholders’
Equity
USD 398,863 CHF 363,000 10/12/2020 (2,833) (0.00)
Goldman Sachs Funds—Global Credit Portfolio (Hedged)Schedule of InvestmentsAs at 30 November 2020
The accompanying notes are an integral part of these financial statements.
276

Share Class Specific Forward Currency Contracts – (Continued)
CurrencyAmountBought Currency
AmountSold
MaturityDate
UnrealisedLossUSD
% ofShareholders’
Equity
USD 4,103,081 GBP 3,102,690 13/01/2021 (48,822) (0.01)USD 563,683 EUR 474,012 21/01/2021 (5,785) (0.00)
UNREALISED LOSS ON FORWARD CURRENCY CONTRACTS HELD FOR HEDGING PURPOSES (57,440) (0.01)
Options – (0.06%)
Holdings Security Description
UnrealisedGain/(Loss)
USDMarket Value
USD
% ofShareholders’
Equity
Purchased OptionsUSD
2,940,000 Call 3 month LIBOR Swaption Expires 15/01/2021 Strike 0.61 (12,997) 3,026 0.002,980,000 Call 3 month LIBOR Swaption Expires 12/02/2021 Strike 0.83 6,961 22,755 0.002,570,000 Call 3 month LIBOR Swaption Expires 16/02/2021 Strike 0.78 2,849 15,668 0.0021,000,000 Call 3 month LIBOR Swaption Expires 17/03/2021 Strike 1.10 (161,032) 90,968 0.0110,800,000 Call 3 month LIBOR Swaption Expires 14/11/2022 Strike 0.70 12,708 122,019 0.01
(151,511) 254,436 0.02
TOTAL PURCHASED OPTIONS(cost USD 405,946) 254,436 0.02
Written OptionsEUR
(5,880,000) Call 6 month EURIBOR Swaption Expires 30/11/2020 Strike 0.15 (13,310) (72,699) (0.01)(6,270,000) Call 6 month EURIBOR Swaption Expires 30/11/2020 Strike 0.27 32,920 (1) (0.00)(1,840,000) Call 6 month EURIBOR Swaption Expires 01/12/2020 Strike 0.15 (3,675) (22,705) (0.00)(1,250,000) Call 6 month EURIBOR Swaption Expires 02/12/2020 Strike 0.15 (1,200) (15,398) (0.00)(5,150,000) Call 6 month EURIBOR Swaption Expires 02/12/2020 Strike 0.20 14,803 (32,011) (0.01)(3,820,000) Call 6 month EURIBOR Swaption Expires 03/12/2020 Strike 0.20 14,700 (23,762) (0.00)(6,270,000) Call 6 month EURIBOR Swaption Expires 07/12/2020 Strike 0.26 17,236 (9,099) (0.00)(6,270,000) Call 6 month EURIBOR Swaption Expires 16/12/2020 Strike 0.21 (11,004) (38,436) (0.01)(6,270,000) Call 6 month EURIBOR Swaption Expires 23/12/2020 Strike 0.24 142 (25,988) (0.00)(2,470,000) Call 6 month EURIBOR Swaption Expires 14/01/2021 Strike 0.25 10,639 (11,631) (0.00)(2,470,000) Call 6 month EURIBOR Swaption Expires 14/01/2021 Strike 0.25 10,783 (11,631) (0.00)(3,590,000) Call 6 month EURIBOR Swaption Expires 15/01/2021 Strike 0.39 11,979 (2,633) (0.00)(3,640,000) Call 6 month EURIBOR Swaption Expires 12/02/2021 Strike 0.26 (6,009) (20,437) (0.00)(3,130,000) Call 6 month EURIBOR Swaption Expires 16/02/2021 Strike 0.29 (1,535) (13,286) (0.00)(5,880,000) Put 6 month EURIBOR Swaption Expires 30/11/2020 Strike 0.10 18,864 (1) (0.00)(6,270,000) Put 6 month EURIBOR Swaption Expires 30/11/2020 Strike 0.27 17,656 (15,265) (0.00)(1,840,000) Put 6 month EURIBOR Swaption Expires 01/12/2020 Strike 0.10 5,280 (0) (0.00)(1,250,000) Put 6 month EURIBOR Swaption Expires 02/12/2020 Strike 0.10 2,810 (0) (0.00)(6,270,000) Put 6 month EURIBOR Swaption Expires 07/12/2020 Strike 0.26 8,863 (17,473) (0.00)(6,270,000) Put 6 month EURIBOR Swaption Expires 16/12/2020 Strike 0.21 17,019 (10,412) (0.00)(6,270,000) Put 6 month EURIBOR Swaption Expires 23/12/2020 Strike 0.24 3,288 (22,841) (0.00)(2,470,000) Put 6 month EURIBOR Swaption Expires 14/01/2021 Strike 0.00 6,924 (835) (0.00)(2,470,000) Put 6 month EURIBOR Swaption Expires 14/01/2021 Strike 0.00 6,924 (835) (0.00)
164,097 (367,379) (0.03)
USD(7,470,000) Call 3 month LIBOR Swaption Expires 30/11/2020 Strike 0.82 62,411 (1) (0.00)(7,470,000) Call 3 month LIBOR Swaption Expires 14/12/2020 Strike 0.90 (5,982) (52,109) (0.01)(7,470,000) Call 3 month LIBOR Swaption Expires 21/12/2020 Strike 0.87 5,782 (41,652) (0.00)(7,470,000) Call 3 month LIBOR Swaption Expires 29/12/2020 Strike 0.86 (1,467) (44,980) (0.01)(21,100,000) Call 3 month LIBOR Swaption Expires 06/01/2021 Strike 0.28 20,488 (2,722) (0.00)(21,110,000) Call 3 month LIBOR Swaption Expires 20/01/2021 Strike 0.31 16,829 (7,448) (0.00)(21,000,000) Call 3 month LIBOR Swaption Expires 17/03/2021 Strike 0.70 74,621 (21,243) (0.00)(21,000,000) Call 3 month LIBOR Swaption Expires 17/03/2021 Strike 0.90 123,033 (44,967) (0.01)(5,300,000) Call 3 month LIBOR Swaption Expires 06/04/2021 Strike 0.51 32,721 (25,844) (0.00)(7,100,000) Call 3 month LIBOR Swaption Expires 12/05/2021 Strike 0.45 48,137 (26,378) (0.00)(4,200,000) Call 3 month LIBOR Swaption Expires 18/05/2021 Strike 0.49 22,435 (19,985) (0.00)(4,400,000) Call 3 month LIBOR Swaption Expires 19/05/2021 Strike 0.48 24,854 (19,883) (0.00)(2,100,000) Call 3 month LIBOR Swaption Expires 14/11/2022 Strike 1.06 (15,959) (125,037) (0.01)(7,470,000) Put 3 month LIBOR Swaption Expires 30/11/2020 Strike 0.82 39,510 (22,901) (0.00)(7,470,000) Put 3 month LIBOR Swaption Expires 14/12/2020 Strike 0.90 28,934 (17,194) (0.00)(7,470,000) Put 3 month LIBOR Swaption Expires 21/12/2020 Strike 0.87 11,714 (35,721) (0.00)(7,470,000) Put 3 month LIBOR Swaption Expires 29/12/2020 Strike 0.86 765 (42,748) (0.01)(21,100,000) Put 3 month LIBOR Swaption Expires 06/01/2021 Strike 0.48 30,492 (22,786) (0.00)(21,110,000) Put 3 month LIBOR Swaption Expires 20/01/2021 Strike 0.51 36,007 (23,101) (0.00)(5,300,000) Put 3 month LIBOR Swaption Expires 06/04/2021 Strike 0.51 40,180 (18,385) (0.00)(7,100,000) Put 3 month LIBOR Swaption Expires 12/05/2021 Strike 0.45 32,215 (42,299) (0.00)
Goldman Sachs Funds—Global Credit Portfolio (Hedged)Schedule of InvestmentsAs at 30 November 2020
The accompanying notes are an integral part of these financial statements.
277

Options – (Continued)
Holdings Security Description
UnrealisedGain/(Loss)
USDMarket Value
USD
% ofShareholders’
Equity
Written Options – (Continued)USD – (Continued)
(4,200,000) Put 3 month LIBOR Swaption Expires 18/05/2021 Strike 0.49 21,254 (21,166) (0.00)(4,400,000) Put 3 month LIBOR Swaption Expires 19/05/2021 Strike 0.48 21,321 (23,416) (0.00)
670,295 (701,966) (0.05)
TOTAL WRITTEN OPTIONS(cost USD (1,903,736)) (1,069,345) (0.08)
TOTAL OPTIONS(cost USD (1,497,790)) (814,909) (0.06)
Swap Contracts – (0.02%)Net LocalNotionalAmount Pay Receive Currency Maturity Date
UnrealisedGainUSD
% ofShareholders’
Equity
Interest Rate Swaps17,090,000 Floating (AUD 6 month BBSW) Fixed 0.553% AUD 16/05/2025 73,271 0.016,400,000 Floating (AUD 6 month BBSW) Fixed 0.500% AUD 25/11/2025 3,104 0.007,090,000 Floating (AUD 6 month BBSW) Fixed 1.550% AUD 12/11/2030 8,017 0.0020,400,000 Floating (BRL 1 month BRCDI) Fixed 4.120% BRL 03/01/2022 18,859 0.0024,150,000 Floating (CAD 3 month CDOR) Fixed 1.250% CAD 16/12/2023 522 0.0088,550,000 Floating (CAD 3 month CDOR) Fixed 0.960% CAD 09/11/2024 11,346 0.003,300,000 Floating (CHF 6 month LIBOR) Fixed 0.000% CHF 16/12/2025 1,194 0.003,880,000 Fixed 0.000% Floating (CHF 6 month LIBOR) CHF 17/09/2030 6,098 0.0037,190,000 Floating (EUR 6 month LIBOR) Fixed 0.000% EUR 16/12/2022 48,297 0.0022,320,000 Floating (EUR 6 month LIBOR) Fixed 0.000% EUR 16/12/2023 36,050 0.0015,940,000 Fixed 0.000% Floating (EUR 12 month LIBOR) EUR 19/11/2024 853 0.0029,360,000 Fixed 0.000% Floating (EUR 12 month LIBOR) EUR 16/12/2025 23,322 0.0017,130,000 Fixed 0.000% Floating (EUR 12 month LIBOR) EUR 16/12/2027 87,709 0.0124,110,000 Floating (EUR 6 month EURIBOR) Fixed 0.050% EUR 21/05/2030 77,017 0.0111,510,000 Fixed 0.260% Floating (EUR 6 month EURIBOR) EUR 21/05/2040 52,338 0.015,430,000 Fixed 0.500% Floating (EUR 6 month EURIBOR) EUR 20/06/2050 9,694 0.008,240,000 Fixed 0.500% Floating (GBP 6 month LIBOR) GBP 16/12/2025 14,016 0.005,560,000 Fixed 0.750% Floating (GBP 6 month LIBOR) GBP 16/12/2035 44,474 0.001,330,000 Floating (GBP 6 month LIBOR) Fixed 1.500% GBP 19/06/2040 28,513 0.001,700,000 Floating (GBP 6 month LIBOR) Fixed 1.000% GBP 20/06/2050 31,312 0.00
156,020,000 Floating (MXN 1 month TIIE) Fixed 4.500% MXN 14/12/2022 6,714 0.0075,895,000 Floating (MXN 1 month TIIE) Fixed 5.100% MXN 10/12/2025 22,905 0.0081,620,000 Fixed 1.240% Floating (NOK 6 month NIBOR) NOK 29/10/2030 85,248 0.0123,610,000 Floating (NOK 6 month NIBOR) Fixed 1.000% NOK 18/03/2031 183 0.0020,180,000 Floating (PLN 6 month WIBOR) Fixed 0.345% PLN 16/06/2023 1,243 0.009,880,000 Floating (PLN 6 month WIBOR) Fixed 0.750% PLN 16/12/2025 16,737 0.0025,920,000 Fixed 0.750% Floating (USD 3 month LIBOR) USD 16/12/2023 22,136 0.0026,430,000 Fixed 1.543% Floating (USD 3 month LIBOR) USD 25/11/2035 31,953 0.001,320,000 Floating (USD 3 month LIBOR) Fixed 1.500% USD 02/12/2050 4,972 0.00
UNREALISED GAIN ON INTEREST RATE SWAPS 768,097 0.05
Credit Default Swaps33,950,000 Floating (The Markit CDX North America
Investment Grade 34 Index)Fixed 1.000% USD 20/06/2023 135,697 0.01
4,350,000 Floating (AT&T, Inc.) Fixed 1.000% USD 20/06/2024 59,577 0.015,590,000 Floating (Colombia Government
International Bond)Fixed 1.000% USD 20/06/2024 92,800 0.01
1,510,000 Floating (Indonesia GovernmentInternational Bond)
Fixed 1.000% USD 20/06/2024 31,317 0.00
1,010,000 Floating (Mexico GovernmentInternational Bond)
Fixed 1.000% USD 20/06/2024 26,800 0.00
1,780,000 Floating (Peruvian GovernmentInternational Bond)
Fixed 1.000% USD 20/06/2024 4,124 0.00
3,650,000 Floating (Prudential Financial, Inc.) Fixed 1.000% USD 20/06/2024 54,255 0.00130,000 Floating (Saudi Government
International Bond)Fixed 1.000% USD 20/06/2024 2,060 0.00
1,000,000 Floating (Indonesia GovernmentInternational Bond)
Fixed 1.000% USD 20/12/2024 5,018 0.00
Goldman Sachs Funds—Global Credit Portfolio (Hedged)Schedule of InvestmentsAs at 30 November 2020
The accompanying notes are an integral part of these financial statements.
278

Swap Contracts – (Continued)
Net LocalNotionalAmount Pay Receive Currency Maturity Date
UnrealisedGainUSD
% ofShareholders’
Equity
Credit Default Swaps – (Continued)1,300,000 Floating (Saudi Government
International Bond)Fixed 1.000% USD 20/12/2024 10,674 0.00
206,025,000 Floating (The Markit CDX North AmericaInvestment Grade 34 Index)
Fixed 1.000% USD 20/06/2025 902,720 0.07
UNREALISED GAIN ON CREDIT DEFAULT SWAPS 1,325,042 0.10
TOTAL UNREALISED GAIN ON SWAP CONTRACTS 2,093,139 0.15
Net LocalNotionalAmount Pay Receive Currency Maturity Date
UnrealisedLossUSD
% ofShareholders’
Equity
Interest Rate Swaps27,740,000 Floating (AUD 6 month BBSW) Fixed 0.920% AUD 04/09/2028 (28,110) (0.00)9,530,000 Floating (AUD 6 month BBSW) Fixed 1.240% AUD 28/10/2030 (71,206) (0.01)14,860,000 Floating (AUD 6 month BBSW) Fixed 1.250% AUD 09/11/2030 (25,855) (0.00)4,900,000 Floating (AUD 6 month BBSW) Fixed 1.000% AUD 16/12/2030 (15,071) (0.00)5,575,000 Floating (BRL 1 month BRCDI) Fixed 4.230% BRL 02/01/2023 (2,614) (0.00)20,475,000 Floating (BRL 1 month BRCDI) Fixed 4.930% BRL 02/01/2024 (56,774) (0.01)32,300,000 Floating (CAD 3 month CDOR) Fixed 0.700% CAD 18/11/2023 (2,867) (0.00)28,900,000 Floating (CAD 3 month CDOR) Fixed 0.810% CAD 30/09/2024 (42,317) (0.00)19,490,000 Floating (CAD 3 month CDOR) Fixed 0.813% CAD 17/11/2024 (6,519) (0.00)28,600,000 Floating (CAD 3 month CDOR) Fixed 1.250% CAD 16/12/2025 (60,250) (0.01)17,820,000 Fixed 1.430% Floating (CAD 3 month CDOR) CAD 09/11/2030 (44,345) (0.00)7,940,000 Floating (CAD 3 month CDOR) Fixed 1.500% CAD 16/12/2030 (55,731) (0.01)6,340,000 Floating (CAD 3 month CDOR) Fixed 1.500% CAD 19/03/2031 (13,135) (0.00)2,430,000 Floating (CAD 3 month CDOR) Fixed 1.750% CAD 17/06/2050 (74,586) (0.01)18,730,000 Floating (CHF 6 month LIBOR) Fixed 0.000% CHF 16/12/2027 (11,100) (0.00)37,800,000 Fixed 2.500% Floating (CNY 3 month LIBOR) CNY 17/03/2023 (6,392) (0.00)12,580,000 Fixed 0.000% Floating (EUR 12 month LIBOR) EUR 18/05/2025 (2,753) (0.00)7,540,000 Fixed 0.000% Floating (EUR 6 month LIBOR) EUR 16/12/2025 (23,872) (0.00)19,080,000 Fixed 0.000% Floating (EUR 6 month LIBOR) EUR 16/12/2027 (95,297) (0.01)24,840,000 Fixed 0.250% Floating (EUR 6 month EURIBOR) EUR 18/06/2030 (188,198) (0.01)30,150,000 Fixed 0.000% Floating (EUR 6 month LIBOR) EUR 16/12/2030 (106,235) (0.01)2,940,000 Fixed 0.000% Floating (EUR 6 month EURIBOR) EUR 16/12/2035 (36,689) (0.00)5,860,000 Fixed 0.750% Floating (EUR 6 month EURIBOR) EUR 19/06/2040 (22,853) (0.00)7,500,000 Fixed 0.250% Floating (EUR 6 month EURIBOR) EUR 16/12/2040 (119,937) (0.01)1,190,000 Fixed 0.100% Floating (EUR 6 month EURIBOR) EUR 02/12/2050 (260) (0.00)2,370,000 Fixed 0.250% Floating (EUR 6 month EURIBOR) EUR 16/12/2050 (10,129) (0.00)6,860,000 Floating (GBP 6 month LIBOR) Fixed 0.750% GBP 16/12/2040 (87,094) (0.01)2,300,000 Floating (GBP 6 month LIBOR) Fixed 0.750% GBP 16/12/2050 (54,887) (0.00)
537,940,000 Floating (JPY 6 month LIBOR) Fixed 0.000% JPY 16/12/2025 (2,284) (0.00)242,700,000 Fixed 0.250% Floating (JPY 6 month LIBOR) JPY 19/03/2030 (2,695) (0.00)
2,646,220,000 Fixed 0.144% Floating (JPY 6 month LIBOR) JPY 13/11/2030 (8,231) (0.00)269,630,000 Floating (JPY 6 month LIBOR) Fixed 0.000% JPY 16/12/2030 (792) (0.00)218,940,000 Fixed 0.500% Floating (JPY 6 month LIBOR) JPY 19/03/2041 (11,224) (0.00)101,220,000 Fixed 0.500% Floating (JPY 6 month LIBOR) JPY 20/06/2050 (6,651) (0.00)90,980,000 Floating (NOK 6 month NIBOR) Fixed 0.750% NOK 16/12/2025 (64,789) (0.01)3,880,000 Floating (NZD 3 month NZDBB) Fixed 1.750% NZD 19/03/2030 (2,111) (0.00)49,260,000 Fixed 0.250% Floating (PLN 3 month WIBOR) PLN 16/12/2021 (5,828) (0.00)173,960,000 Floating (SEK 3 month STIBOR) Fixed 0.000% SEK 16/12/2025 (25,834) (0.00)20,480,000 Fixed 0.750% Floating (SEK 3 month STIBOR) SEK 18/06/2030 (5,789) (0.00)64,000,000 Floating (USD 1 month LIBOR) Floating (USD 3 month LIBOR) USD 25/07/2024 (20,287) (0.00)37,980,000 Floating (USD 3 month SOFR) Floating (USD 3 month LIBOR) USD 10/11/2024 (28,460) (0.00)4,790,000 Fixed 1.000% Floating (USD 3 month LIBOR) USD 16/12/2025 (20,489) (0.00)18,130,000 Floating (USD 3 month LIBOR) Fixed 1.750% USD 18/06/2030 (145,044) (0.01)10,630,000 Fixed 1.190% Floating (USD 3 month LIBOR) USD 10/11/2030 (29,876) (0.00)23,990,000 Floating (USD 3 month LIBOR) Fixed 1.245% USD 24/11/2030 (15,375) (0.00)4,550,000 Fixed 1.000% Floating (USD 3 month LIBOR) USD 16/12/2030 (14,613) (0.00)4,630,000 Floating (USD 3 month LIBOR) Fixed 1.750% USD 19/06/2040 (62,501) (0.01)4,350,000 Floating (USD 3 month LIBOR) Fixed 1.750% USD 20/06/2050 (34,994) (0.00)65,480,000 Floating (ZAR 3 month JIBAR) Fixed 4.000% ZAR 16/06/2023 (29,576) (0.00)104,085,000 Floating (ZAR 3 month JIBAR) Fixed 5.250% ZAR 17/03/2026 (67,658) (0.01)
UNREALISED LOSS ON INTEREST RATE SWAPS (1,870,177) (0.14)
Credit Default Swaps3,000,000 Floating (Unibail-Rodamco-Westfield
S.E.)Fixed 1.000% EUR 20/06/2024 (73,700) (0.01)
19,520,000 Fixed 1.000% Floating (China GovernmentInternational Bond)
USD 20/06/2021 (114,776) (0.01)
Goldman Sachs Funds—Global Credit Portfolio (Hedged)Schedule of InvestmentsAs at 30 November 2020
The accompanying notes are an integral part of these financial statements.
279

Swap Contracts – (Continued)
Net LocalNotionalAmount Pay Receive Currency Maturity Date
UnrealisedLossUSD
% ofShareholders’
Equity
Credit Default Swaps – (Continued)1,240,000 Fixed 1.000% Floating (China Government
International Bond)USD 20/06/2021 (7,093) (0.00)
1,190,000 Fixed 1.000% Floating (China GovernmentInternational Bond)
USD 20/06/2021 (6,825) (0.00)
3,970,000 Fixed 1.000% Floating (China GovernmentInternational Bond)
USD 20/06/2021 (23,048) (0.00)
250,000 Fixed 1.000% Floating (China GovernmentInternational Bond)
USD 20/06/2021 (1,456) (0.00)
540,000 Fixed 1.000% Floating (China GovernmentInternational Bond)
USD 20/06/2021 (3,144) (0.00)
930,000 Fixed 1.000% Floating (China GovernmentInternational Bond)
USD 20/06/2021 (5,271) (0.00)
360,000 Fixed 1.000% Floating (China GovernmentInternational Bond)
USD 20/06/2021 (2,036) (0.00)
260,000 Fixed 1.000% Floating (China GovernmentInternational Bond)
USD 20/06/2021 (1,413) (0.00)
1,620,000 Fixed 1.000% Floating (China GovernmentInternational Bond)
USD 20/06/2021 (8,927) (0.00)
530,000 Fixed 1.000% Floating (China GovernmentInternational Bond)
USD 20/06/2021 (2,914) (0.00)
1,260,000 Fixed 1.000% Floating (China GovernmentInternational Bond)
USD 20/06/2021 (6,928) (0.00)
290,000 Fixed 1.000% Floating (China GovernmentInternational Bond)
USD 20/06/2021 (1,523) (0.00)
900,000 Fixed 1.000% Floating (China GovernmentInternational Bond)
USD 20/06/2021 (4,430) (0.00)
2,500,000 Fixed 1.000% Floating (China GovernmentInternational Bond)
USD 20/06/2021 (13,027) (0.00)
49,225,000 Floating (The Markit CDX North AmericaInvestment Grade 28 Version 1 Index)
Fixed 1.000% USD 20/06/2022 (156,509) (0.01)
UNREALISED LOSS ON CREDIT DEFAULT SWAPS (433,020) (0.03)
TOTAL UNREALISED LOSS ON SWAP CONTRACTS (2,303,197) (0.17)
Share Class Specific Swap Contracts – (0.01%)
Net LocalNotionalAmount Pay Receive Currency Maturity Date
UnrealisedGainUSD
% ofShareholders’
Equity
Interest Rate Swaps1,540,000 Fixed 1.250% Floating (CAD 3 month CDOR) CAD 16/12/2025 3,378 0.002,370,000 Fixed 1.500% Floating (CAD 3 month CDOR) CAD 16/12/2030 16,513 0.00620,000 Fixed 0.500% Floating (GBP 6 month LIBOR) GBP 16/12/2023 403 0.0010,000 Floating (GBP 6 month LIBOR) Fixed 1.500% GBP 20/03/2024 162 0.00140,000 Fixed 0.500% Floating (GBP 6 month LIBOR) GBP 16/12/2025 297 0.00970,000 Fixed 0.750% Floating (GBP 6 month LIBOR) GBP 16/12/2030 4,614 0.00460,000 Fixed 0.750% Floating (GBP 6 month LIBOR) GBP 16/12/2040 5,619 0.00230,000 Fixed 0.750% Floating (GBP 6 month LIBOR) GBP 16/12/2050 4,321 0.00
154,620,000 Fixed 0.000% Floating (JPY 6 month LIBOR) JPY 16/12/2025 640 0.00
UNREALISED GAIN ON INTEREST RATE SWAPS HELD FOR HEDGING PURPOSES 35,947 0.00
TOTAL UNREALISED GAIN ON SWAPS HELD FOR HEDGING PURPOSES 35,947 0.00
Net LocalNotionalAmount Pay Receive Currency Maturity Date
UnrealisedLossUSD
% ofShareholders’
Equity
Interest Rate Swaps4,630,000 Fixed 0.000% Floating (EUR 6 month LIBOR) EUR 16/12/2022 (5,147) (0.00)3,590,000 Fixed 0.000% Floating (EUR 6 month LIBOR) EUR 16/12/2023 (6,266) (0.00)4,850,000 Fixed 0.000% Floating (EUR 6 month LIBOR) EUR 16/12/2025 (16,353) (0.00)3,440,000 Fixed 0.000% Floating (EUR 6 month LIBOR) EUR 16/12/2027 (18,129) (0.00)2,570,000 Fixed 0.000% Floating (EUR 6 month LIBOR) EUR 16/12/2030 (19,112) (0.00)
Goldman Sachs Funds—Global Credit Portfolio (Hedged)Schedule of InvestmentsAs at 30 November 2020
The accompanying notes are an integral part of these financial statements.
280

Share Class Specific Swap Contracts – (Continued)
Net LocalNotionalAmount Pay Receive Currency Maturity Date
UnrealisedLossUSD
% ofShareholders’
Equity
Interest Rate Swaps – (Continued)340,000 Fixed 0.250% Floating (EUR 6 month EURIBOR) EUR 16/12/2040 (5,607) (0.00)740,000 Fixed 1.500% Floating (GBP 6 month LIBOR) GBP 19/06/2026 (62,619) (0.01)
UNREALISED LOSS ON INTEREST RATE SWAPS HELD FOR HEDGING PURPOSES (133,233) (0.01)
TOTAL UNREALISED LOSS ON SWAPS HELD FOR HEDGING PURPOSES (133,233) (0.01)
MARKET VALUE OF INVESTMENTS(cost USD 1,184,944,240)
1,306,377,640 95.52
OTHER ASSETS AND LIABILITIES 61,194,899 4.48
SHAREHOLDERS’ EQUITY 1,367,572,539 100.00
TOTAL INVESTMENTSMarket Value
USD
% ofShareholders’
Equity
Total Investments excluding derivatives (cost USD 1,186,442,030) 1,307,982,500 95.64Unrealised gain on futures contracts 253,475 0.02Unrealised loss on futures contracts (139,909) (0.01)Unrealised gain on share class specific futures contracts 7,104 0.00Unrealised loss on share class specific futures contracts (46,451) (0.00)Unrealised gain on forward currency contracts 46,941 0.01Unrealised loss on forward currency contracts (9,801,091) (0.72)Unrealised gain on forward currency contracts held for hedging purposes 9,254,764 0.68Unrealised loss on forward currency contracts held for hedging purposes (57,440) (0.01)Market value of purchased options (cost USD 405,946) 254,436 0.02Market value of written options (cost USD (1,903,736)) (1,069,345) (0.08)Unrealised gain on swap contracts 2,093,139 0.15Unrealised loss on swap contracts (2,303,197) (0.17)Unrealised gain on swaps held for hedging purposes 35,947 0.00Unrealised loss on swaps held for hedging purposes (133,233) (0.01)Other Assets and Liabilities 61,194,899 4.48
Shareholders’ Equity 1,367,572,539 100.00
The Futures Commission Merchant was Goldman Sachs & Co. LLC.
The counterparties for forward currency contracts were Bank of America N.A., Barclays Bank Plc., BNP Paribas S.A., Citibank N.A., Credit Suisse International, Deutsche Bank AG, HSBCBank Plc., JP Morgan Chase Bank N.A., Morgan Stanley & Co. International Plc., Royal Bank of Canada, Standard Chartered Bank, State Street Bank & Trust, UBS AG and WestpacBanking Corp.
The counterparties for options contracts were Bank of America N.A., Citibank N.A., Deutsche Bank AG, JP Morgan Chase Bank N.A., Morgan Stanley & Co. International Plc. and UBSAG.
The counterparties for swap contracts were Barclays Capital, Inc., Citibank N.A., Credit Suisse, Deutsche Bank AG, HSBC Bank Plc., JP Morgan Chase Bank N.A. and UBS AG.
The maximum individual counterparty exposure as at 30 November 2020 is 0.25% of the NAV.
(a) Interest rates represent either the stated coupon rate, annualised discounted yield on date of purchase for discounted securities, or, for floating rate securities, the current reset ratewhich is based upon interest rates indices.
(b) Maturity dates represent either the stated date on the security, or the next interest reset date for floating rate securities or the prerefunded date for those type of securities.(c) Variable and floating coupon rates are those quoted as of 30 November 2020.(d) 144A: This security is issued to qualified institutional investors, pursuant to private placements, and is transferable as stated in rule 144A of the US Securities Act of 1933.(e) A related party to Goldman Sachs Funds.(f) The yield for this fund as at 30 November 2020 was 0.120%.
Goldman Sachs Funds—Global Credit Portfolio (Hedged)Schedule of InvestmentsAs at 30 November 2020
The accompanying notes are an integral part of these financial statements.
281

Holdings Security Description Currency Interest Rate(a) Maturity Date(b)Market Value
USD
% ofShareholders’
Equity
Transferable securities admitted to an official exchange listing
Bonds – 56.22%Argentina
200,000 Argentina Government International Bond(c) USD 0.125% 09/07/2030 78,700 0.38
Austria200,000 ams AG USD 7.000% 31/07/2025 223,000 1.07
Brazil200,000 Banco do Brasil S.A.(d) USD 6.250% Perp. 201,540 0.97200,000 BRF S.A. USD 5.750% 21/09/2050 210,469 1.02
412,009 1.99
Dominican Republic150,000 Dominican Republic International Bond USD 4.875% 23/09/2032 160,852 0.78
Egypt200,000 Egypt Government International Bond USD 8.875% 29/05/2050 223,094 1.08
France100,000 BNP Paribas S.A. EUR 1.625% 02/07/2031 127,726 0.62100,000 BPCE S.A. EUR 0.875% 31/01/2024 123,516 0.59100,000 Credit Agricole S.A. EUR 0.375% 21/10/2025 122,148 0.59100,000 Engie S.A.(d) EUR 1.500% Perp. 120,266 0.58100,000 Getlink S.E. EUR 3.500% 30/10/2025 124,958 0.60
618,614 2.98
Germany50,000 Commerzbank AG EUR 4.000% 23/03/2026 65,650 0.32
Hungary200,000 MOL Hungarian Oil & Gas Plc. EUR 1.500% 08/10/2027 244,408 1.18
Indonesia200,000 Perusahaan Penerbit SBSN Indonesia III USD 4.150% 29/03/2027 229,438 1.11
Ireland150,000 Dell Bank International DAC EUR 1.625% 24/06/2024 186,021 0.90
Japan100,000 Nissan Motor Co., Ltd. EUR 1.940% 15/09/2023 124,119 0.60100,000 Takeda Pharmaceutical Co., Ltd. EUR 3.000% 21/11/2030 147,727 0.71
271,846 1.31
Jersey200,000 Galaxy Pipeline Assets Bidco Ltd. USD 3.250% 30/09/2040 207,625 1.00
Kazakhstan200,000 KazMunayGas National Co., JSC USD 3.500% 14/04/2033 217,850 1.05
Luxembourg100,000 Blackstone Property Partners Europe Holdings SARL EUR 2.200% 24/07/2025 128,364 0.62100,000 DH Europe Finance II SARL EUR 0.450% 18/03/2028 122,432 0.5962,000 Intelsat Jackson Holdings S.A. USD 5.500% 01/08/2023 41,850 0.20100,000 Logicor Financing SARL EUR 3.250% 13/11/2028 141,241 0.68100,000 Motion Finco SARL EUR 7.000% 15/05/2025 127,765 0.62
561,652 2.71
Mexico200,000 Banco Mercantil del Norte S.A.(d) USD 7.625% Perp. 217,500 1.05200,000 Mexico City Airport Trust USD 5.500% 31/10/2046 193,687 0.93200,000 Mexico Government International Bond USD 2.659% 24/05/2031 200,700 0.97
611,887 2.95
Netherlands100,000 Airbus S.E. EUR 2.000% 07/04/2028 134,325 0.65100,000 Cooperatieve Rabobank UA EUR 3.875% 25/07/2023 132,508 0.64200,000 IHS Netherlands Holdco BV USD 8.000% 18/09/2027 217,125 1.05100,000 JAB Holdings BV EUR 1.000% 20/12/2027 123,922 0.60200,000 Metinvest BV USD 7.650% 01/10/2027 209,469 1.01195,028 MV24 Capital BV USD 6.748% 01/06/2034 208,040 1.00100,000 PPF Telecom Group BV EUR 3.250% 29/09/2027 127,852 0.62
Goldman Sachs Funds—Global ESG Enhanced Income Bond PortfolioSchedule of InvestmentsAs at 30 November 2020
The accompanying notes are an integral part of these financial statements.
282

Holdings Security Description Currency Interest Rate(a) Maturity Date(b)Market Value
USD
% ofShareholders’
Equity
Bonds – (Continued)Netherlands – (Continued)
100,000 Signify NV EUR 2.375% 11/05/2027 133,036 0.64200,000 VEON Holdings BV USD 3.375% 25/11/2027 204,281 0.98
1,490,558 7.19
Paraguay200,000 Paraguay Government International Bond USD 4.950% 28/04/2031 238,050 1.15
Qatar200,000 Qatar Government International Bond USD 4.000% 14/03/2029 237,000 1.14
Romania30,000 Romanian Government International Bond EUR 2.625% 02/12/2040 36,346 0.17
Russia200,000 Russian Foreign Bond - Eurobond USD 4.750% 27/05/2026 230,969 1.11
Spain100,000 Banco de Sabadell S.A. EUR 0.875% 05/03/2023 122,097 0.59200,000 Banco Santander S.A. USD 2.706% 27/06/2024 212,820 1.03100,000 CaixaBank S.A. EUR 1.125% 17/05/2024 124,763 0.60100,000 FCC Aqualia S.A. EUR 2.629% 08/06/2027 130,983 0.63100,000 Telefonica Emisiones S.A. EUR 1.788% 12/03/2029 135,194 0.65
725,857 3.50
Switzerland200,000 Credit Suisse Group AG(d) USD 5.250% Perp. 212,500 1.02
Turkey200,000 Turkey Government International Bond USD 7.625% 26/04/2029 222,688 1.07
Ukraine200,000 Ukraine Government International Bond USD 7.750% 01/09/2026 221,531 1.07
United Kingdom50,000 Aviva Plc.(d) GBP 6.125% 14/11/2036 81,695 0.39250,000 Barclays Plc.(d) USD 4.610% 15/02/2023 261,632 1.26100,000 BP Capital Markets Plc.(d) EUR 3.250% Perp. 128,182 0.62100,000 EG Global Finance Plc. EUR 4.375% 07/02/2025 119,212 0.58100,000 Legal & General Group Plc.(d) GBP 3.750% 26/11/2049 142,665 0.69
733,386 3.54
United States100,000 AbbVie, Inc. USD 4.250% 14/11/2028 120,693 0.5850,000 AbbVie, Inc. USD 4.700% 14/05/2045 64,947 0.3125,000 AbbVie, Inc. USD 4.875% 14/11/2048 34,054 0.1650,000 American International Group, Inc. USD 3.900% 01/04/2026 57,144 0.2825,000 American International Group, Inc. USD 4.500% 16/07/2044 32,150 0.1525,000 Anheuser-Busch Cos. LLC Via Anheuser-Busch InBev Worldwide, Inc. USD 4.900% 01/02/2046 32,686 0.1625,000 Anheuser-Busch InBev Worldwide, Inc. USD 4.150% 23/01/2025 28,381 0.14100,000 Anheuser-Busch InBev Worldwide, Inc. USD 4.750% 23/01/2029 122,843 0.5950,000 Anheuser-Busch InBev Worldwide, Inc. USD 4.950% 15/01/2042 65,278 0.3125,000 Anheuser-Busch InBev Worldwide, Inc. USD 5.550% 23/01/2049 35,941 0.1770,000 Antero Resources Corp. USD 5.125% 01/12/2022 66,850 0.3275,000 AT&T, Inc. USD 4.100% 15/02/2028 88,465 0.4350,000 AT&T, Inc. USD 4.350% 15/06/2045 59,189 0.2950,000 Becton Dickinson and Co. USD 3.700% 06/06/2027 57,479 0.28100,000 Citigroup, Inc. GBP 2.750% 24/01/2024 142,128 0.6940,000 Cleveland-Cliffs, Inc. USD 5.750% 01/03/2025 40,300 0.1950,000 DuPont de Nemours, Inc. USD 4.493% 15/11/2025 58,359 0.2822,000 EnLink Midstream Partners LP USD 4.400% 01/04/2024 21,258 0.1070,000 EQT Corp. USD 7.875% 01/02/2025 80,500 0.3934,000 Ford Motor Co. USD 9.000% 22/04/2025 41,404 0.2044,000 Ford Motor Co. USD 4.750% 15/01/2043 43,377 0.21100,000 General Electric Co. USD 3.625% 01/05/2030 112,066 0.5450,000 General Electric Co. USD 6.150% 07/08/2037 65,625 0.3225,000 General Motors Co. USD 5.150% 01/04/2038 29,823 0.1425,000 General Motors Financial Co., Inc. USD 5.650% 17/01/2029 30,956 0.1556,000 Genesis Energy LP Via Genesis Energy Finance Corp. USD 7.750% 01/02/2028 51,520 0.2520,000 HB Fuller Co. USD 4.250% 15/10/2028 20,650 0.1050,000 Hewlett Packard Enterprise Co. USD 4.450% 02/10/2023 55,098 0.2762,000 Hewlett Packard Enterprise Co. USD 6.350% 15/10/2045 81,941 0.404,000 Howmet Aerospace, Inc. USD 6.875% 01/05/2025 4,643 0.0270,000 Howmet Aerospace, Inc. USD 5.950% 01/02/2037 81,987 0.40
Goldman Sachs Funds—Global ESG Enhanced Income Bond PortfolioSchedule of InvestmentsAs at 30 November 2020
The accompanying notes are an integral part of these financial statements.
283

Holdings Security Description Currency Interest Rate(a) Maturity Date(b)Market Value
USD
% ofShareholders’
Equity
Bonds – (Continued)United States – (Continued)
200,000 JPMorgan Chase & Co. USD 3.625% 01/12/2027 226,532 1.0938,000 MGM Resorts International USD 4.750% 15/10/2028 39,710 0.1955,000 MPT Operating Partnership LP Via MPT Finance Corp. USD 3.500% 15/03/2031 56,054 0.2750,000 National Retail Properties, Inc. USD 3.900% 15/06/2024 54,199 0.26102,000 Navient Corp. USD 5.000% 15/03/2027 101,745 0.4968,000 NuStar Logistics LP USD 6.375% 01/10/2030 73,950 0.36100,000 Occidental Petroleum Corp. USD 8.000% 15/07/2025 110,000 0.5332,000 Occidental Petroleum Corp. USD 6.625% 01/09/2030 33,560 0.16100,000 Prologis Euro Finance LLC EUR 0.375% 06/02/2028 122,804 0.5920,000 Quanta Services, Inc. USD 2.900% 01/10/2030 21,486 0.1025,000 Summit Midstream Holdings LLC Via Summit Midstream Finance Corp. USD 5.500% 15/08/2022 20,688 0.1079,000 TransDigm, Inc. USD 6.375% 15/06/2026 82,357 0.4052,000 TransDigm, Inc. USD 5.500% 15/11/2027 53,820 0.26100,000 Verizon Communications, Inc. USD 2.625% 15/08/2026 109,386 0.5350,000 Verizon Communications, Inc. USD 4.125% 15/08/2046 62,993 0.30
2,997,019 14.45
TOTAL BONDS(cost USD 11,263,614) 11,658,550 56.22
Holdings Security DescriptionMarket Value
USD
% ofShareholders’
Equity
Mutual Funds – 5.69%Ireland
1,180,472 Goldman Sachs US$ Treasury Liquid Reserves Fund (X Distribution Class)(e)(f) 1,180,472 5.69
TOTAL MUTUAL FUNDS(cost USD 1,180,472) 1,180,472 5.69
TOTAL TRANSFERABLE SECURITIES ADMITTED TO AN OFFICIAL EXCHANGE LISTING(cost USD 12,444,086) 12,839,022 61.91
Holdings Security Description Currency Interest Rate(a) Maturity Date(b)Market Value
USD
% ofShareholders’
Equity
Transferable securities dealt in another regulated market
Bonds – 34.06%Australia
50,000 Westpac Banking Corp.(d) USD 2.894% 04/02/2030 52,002 0.25
Bermuda75,000 NCL Corp., Ltd. USD 3.625% 15/12/2024 67,500 0.32
Canada42,000 1011778 BC ULC Via New Red Finance, Inc. USD 4.000% 15/10/2030 42,315 0.2040,000 1011778 BC ULC Via New Red Finance, Inc.—Series NOV USD 4.000% 15/10/2030 40,200 0.1971,000 Bausch Health Cos., Inc. USD 5.000% 30/01/2028 71,555 0.3566,000 GFL Environmental, Inc. USD 4.000% 01/08/2028 66,082 0.3250,000 Intelligent Packaging Ltd. Finco, Inc. Via Intelligent Packaging Ltd. Co-Issuer
LLC USD 6.000% 15/09/2028 53,125 0.26
273,277 1.32
Cayman Islands18,000 Transocean Poseidon Ltd. USD 6.875% 01/02/2027 15,210 0.07
France200,000 Altice France S.A. USD 5.125% 15/01/2029 207,500 1.00
Germany150,000 Deutsche Bank AG(d) USD 2.222% 18/09/2024 153,105 0.74
Mexico200,000 BBVA Bancomer S.A.(d) USD 5.125% 18/01/2033 209,500 1.01
Netherlands50,000 Deutsche Telekom International Finance BV USD 8.750% 15/06/2030 79,443 0.38
United States25,000 Acadia Healthcare Co., Inc. USD 5.000% 15/04/2029 26,625 0.1362,000 AdaptHealth LLC USD 6.125% 01/08/2028 66,960 0.3236,000 Adient US LLC USD 7.000% 15/05/2026 39,150 0.19
Goldman Sachs Funds—Global ESG Enhanced Income Bond PortfolioSchedule of InvestmentsAs at 30 November 2020
The accompanying notes are an integral part of these financial statements.
284

Holdings Security Description Currency Interest Rate(a) Maturity Date(b)Market Value
USD
% ofShareholders’
Equity
Bonds – (Continued)United States – (Continued)
50,000 Alliant Holdings Intermediate LLC Via Alliant HoldingsCo-Issuer—Series OCT USD 6.750% 15/10/2027 53,821 0.26
35,000 Allison Transmission, Inc. USD 3.750% 30/01/2031 35,219 0.1745,000 AMC Entertainment Holdings, Inc. USD 10.500% 15/04/2025 36,000 0.1746,000 Amkor Technology, Inc. USD 6.625% 15/09/2027 50,025 0.2422,000 Antero Midstream Partners LP Via Antero Midstream Finance Corp. USD 5.375% 15/09/2024 20,790 0.1048,000 Aramark Services, Inc. USD 6.375% 01/05/2025 51,360 0.258,000 Arches Buyer, Inc. USD 6.125% 01/12/2028 8,250 0.0448,000 Arconic Corp. USD 6.125% 15/02/2028 52,440 0.2520,000 AT&T, Inc. USD 4.850% 15/07/2045 25,136 0.12127,000 Avaya, Inc. USD 6.125% 15/09/2028 133,667 0.6438,000 Avient Corp. USD 5.750% 15/05/2025 40,708 0.20150,000 Bank of America Corp.(d) USD 2.592% 29/04/2031 159,868 0.7725,000 Bank of America Corp.(d) USD 1.922% 24/10/2031 25,256 0.1266,000 Beacon Roofing Supply, Inc. USD 4.875% 01/11/2025 67,650 0.3392,000 Boyd Gaming Corp. USD 4.750% 01/12/2027 93,519 0.45150,000 Broadcom, Inc. USD 3.625% 15/10/2024 164,335 0.7939,000 BY Crown Parent LLC Via BY Bond Finance, Inc. USD 4.250% 31/01/2026 40,268 0.1940,000 Central Garden & Pet Co. USD 4.125% 15/10/2030 42,000 0.20100,000 Charter Communications Operating LLC Via Charter Communications
Operating Capital USD 4.500% 01/02/2024 110,869 0.53100,000 Charter Communications Operating LLC Via Charter Communications
Operating Capital USD 4.908% 23/07/2025 115,668 0.5629,000 CHS Via Community Health Systems, Inc. USD 8.000% 15/03/2026 30,595 0.1550,000 Citigroup, Inc.(d) USD 0.776% 30/10/2024 50,138 0.2450,000 Citigroup, Inc.(d) USD 4.412% 31/03/2031 60,474 0.2925,000 CMS Energy Corp.(d) USD 3.750% 01/12/2050 25,225 0.1293,000 Cornerstone Building Brands, Inc. USD 6.125% 15/01/2029 98,812 0.4825,000 CP Atlas Buyer, Inc. USD 7.000% 01/12/2028 26,063 0.13103,000 DaVita, Inc. USD 3.750% 15/02/2031 102,485 0.4969,000 Dealer Tire LLC Via DT Issuer LLC USD 8.000% 01/02/2028 71,415 0.3479,000 Energizer Holdings, Inc. USD 4.750% 15/06/2028 82,709 0.4045,000 Energizer Holdings, Inc. USD 4.375% 31/03/2029 46,275 0.2275,000 Freedom Mortgage Corp. USD 7.625% 01/05/2026 76,687 0.3718,000 Frontier Communications Corp. USD 5.000% 01/05/2028 18,360 0.0988,000 General Electric Co.—Series D(d) USD 5.000% 29/12/2049 79,341 0.3826,000 Getty Images, Inc. USD 9.750% 01/03/2027 27,170 0.1345,000 Global Partners LP Via GLP Finance Corp. USD 6.875% 15/01/2029 48,150 0.2358,000 Gray Television, Inc. USD 7.000% 15/05/2027 64,235 0.3151,000 Hexion, Inc. USD 7.875% 15/07/2027 55,016 0.2748,000 Hilton Domestic Operating Co., Inc. USD 4.875% 15/01/2030 51,900 0.2520,000 Hilton Domestic Operating Co., Inc. USD 4.000% 01/05/2031 21,104 0.10144,000 HLF Financing SARL LLC Via Herbalife International, Inc. USD 7.250% 15/08/2026 152,100 0.7350,000 Howard Hughes Corp. USD 5.375% 01/08/2028 53,062 0.2620,025 iHeartCommunications, Inc. USD 8.375% 01/05/2027 21,327 0.1028,000 IRB Holding Corp. USD 7.000% 15/06/2025 30,590 0.15111,000 IRB Holding Corp. USD 6.750% 15/02/2026 115,162 0.5680,000 J2 Global, Inc. USD 4.625% 15/10/2030 83,700 0.4067,000 Jaguar Holding Co. II Via PPD Development LP USD 4.625% 15/06/2025 70,350 0.3464,000 JELD-WEN, Inc. USD 4.875% 15/12/2027 67,840 0.3331,000 KBR, Inc. USD 4.750% 30/09/2028 32,240 0.1650,000 Keurig Dr Pepper, Inc. USD 4.985% 25/05/2038 66,152 0.3252,000 Kraft Heinz Foods Co. USD 5.000% 15/07/2035 61,299 0.30103,000 Kraft Heinz Foods Co. USD 6.875% 26/01/2039 142,873 0.6928,000 L Brands, Inc. USD 6.875% 01/07/2025 30,239 0.1535,000 LD Holdings Group LLC USD 6.500% 01/11/2025 37,013 0.1850,000 Lions Gate Capital Holdings LLC USD 5.875% 01/11/2024 50,125 0.2440,000 Lithia Motors, Inc. USD 4.375% 15/01/2031 42,491 0.2128,000 Live Nation Entertainment, Inc. USD 6.500% 15/05/2027 31,150 0.1584,000 Marriott Ownership Resorts, Inc. USD 4.750% 15/01/2028 85,260 0.4129,000 Meritor, Inc. USD 6.250% 01/06/2025 31,175 0.1539,000 Minerals Technologies, Inc. USD 5.000% 01/07/2028 40,658 0.2020,000 Molina Healthcare, Inc. USD 3.875% 15/11/2030 21,200 0.1075,000 Morgan Stanley(d) USD 2.699% 22/01/2031 81,378 0.3970,000 MPH Acquisition Holdings LLC USD 5.750% 01/11/2028 68,600 0.3367,000 Nationstar Mortgage Holdings, Inc. USD 5.500% 15/08/2028 69,345 0.33137,000 NFP Corp.—Series SEP USD 6.875% 15/08/2028 143,077 0.6947,000 NMI Holdings, Inc. USD 7.375% 01/06/2025 52,052 0.2532,000 Novelis Corp. USD 4.750% 30/01/2030 34,000 0.168,000 NRG Energy, Inc. USD 3.375% 15/02/2029 8,180 0.0423,000 NRG Energy, Inc. USD 3.625% 15/02/2031 23,748 0.11
Goldman Sachs Funds—Global ESG Enhanced Income Bond PortfolioSchedule of InvestmentsAs at 30 November 2020
The accompanying notes are an integral part of these financial statements.
285

Holdings Security Description Currency Interest Rate(a) Maturity Date(b)Market Value
USD
% ofShareholders’
Equity
Bonds – (Continued)United States – (Continued)
79,000 PennyMac Financial Services, Inc. USD 5.375% 15/10/2025 82,752 0.4076,000 Pike Corp. USD 5.500% 01/09/2028 79,420 0.3827,000 Prime Security Services Borrower LLC Via Prime Finance, Inc. USD 3.375% 31/08/2027 26,595 0.1315,000 Providence Service Corp. USD 5.875% 15/11/2025 16,050 0.0837,000 Qorvo, Inc. USD 4.375% 15/10/2029 40,053 0.1950,000 QualityTech LP Via QTS Finance Corp. USD 3.875% 01/10/2028 51,250 0.2570,000 Radiate Holdco LLC Via Radiate Finance, Inc. USD 6.500% 15/09/2028 74,812 0.3630,000 Realogy Group LLC Via Realogy Co-Issuer Corp. USD 4.875% 01/06/2023 30,750 0.1510,000 Realogy Group LLC Via Realogy Co-Issuer Corp. USD 7.625% 15/06/2025 10,812 0.0585,000 Sabre GLBL, Inc. USD 9.250% 15/04/2025 99,344 0.4837,000 Scripps Escrow, Inc. USD 5.875% 15/07/2027 37,555 0.1877,000 Sealed Air Corp. USD 6.875% 15/07/2033 101,640 0.4995,000 SeaWorld Parks & Entertainment, Inc. USD 9.500% 01/08/2025 103,312 0.5015,000 SEG Holding LLC Via SEG Finance Corp. USD 5.625% 15/10/2028 15,844 0.0836,000 Sensata Technologies, Inc. USD 3.750% 15/02/2031 36,405 0.1867,000 Service Properties Trust USD 4.750% 01/10/2026 63,084 0.3015,000 Shift4 Payments LLC Via Shift4 Payments Finance Sub, Inc. USD 4.625% 01/11/2026 15,544 0.0882,000 Six Flags Entertainment Corp. USD 5.500% 15/04/2027 83,025 0.4018,000 Spirit AeroSystems, Inc. USD 5.500% 15/01/2025 19,118 0.0947,000 Sprint Capital Corp. USD 8.750% 15/03/2032 72,086 0.3543,000 Station Casinos LLC USD 4.500% 15/02/2028 42,463 0.2018,000 Summit Materials LLC Via Summit Materials Finance Corp. USD 5.250% 15/01/2029 18,900 0.0953,000 Tallgrass Energy Partners LP Via Tallgrass Energy Finance Corp. USD 4.750% 01/10/2023 52,072 0.2570,000 Targa Resources Partners LP Via Targa Resources Partners Finance Corp. USD 4.875% 01/02/2031 74,287 0.3680,000 Tenet Healthcare Corp. USD 6.125% 01/10/2028 81,800 0.3941,000 Terrier Media Buyer, Inc. USD 8.875% 15/12/2027 44,639 0.2229,000 United Natural Foods, Inc. USD 6.750% 15/10/2028 30,124 0.1540,000 United Shore Financial Services LLC USD 5.500% 15/11/2025 42,100 0.2029,000 USA Compression Partners LP Via USA Compression Finance Corp. USD 6.875% 01/04/2026 30,233 0.1550,000 VEREIT Operating Partnership LP USD 3.400% 15/01/2028 54,188 0.2625,000 Walgreens Boots Alliance, Inc. USD 4.800% 18/11/2044 28,506 0.1420,000 Walgreens Boots Alliance, Inc. USD 4.100% 15/04/2050 21,485 0.1060,000 Waste Pro USA, Inc. USD 5.500% 15/02/2026 62,250 0.3068,000 WR Grace & Co-Conn USD 4.875% 15/06/2027 71,868 0.3520,000 Xerox Holdings Corp. USD 5.000% 15/08/2025 20,950 0.1028,000 Yum! Brands, Inc. USD 4.750% 15/01/2030 30,415 0.15
6,007,855 28.97
TOTAL BONDS(cost USD 6,880,706) 7,065,392 34.06
Agencies Asset Backed Obligations – 15.25%United States
2,000,000 Government National Mortgage Association (GNMA) TBA(g) USD 2.000% 21/12/2050 2,087,877 10.071,000,000 Government National Mortgage Association (GNMA) TBA(g) USD 4.500% 21/12/2050 1,074,531 5.18
3,162,408 15.25
TOTAL AGENCIES ASSET BACKED OBLIGATIONS(cost USD 3,142,266) 3,162,408 15.25
TOTAL TRANSFERABLE SECURITIES DEALT IN ANOTHER REGULATED MARKET(cost USD 10,022,972) 10,227,800 49.31
Other Transferable Securities
Bonds – 1.84%Luxembourg
100,000 Altice France Holding S.A. EUR 8.000% 15/05/2027 130,187 0.63
Turkey200,000 Turkiye Vakiflar Bankasi TAO USD 6.000% 01/11/2022 199,781 0.96
Goldman Sachs Funds—Global ESG Enhanced Income Bond PortfolioSchedule of InvestmentsAs at 30 November 2020
The accompanying notes are an integral part of these financial statements.
286

Holdings Security Description Currency Interest Rate(a) Maturity Date(b)Market Value
USD
% ofShareholders’
Equity
Bonds – (Continued)United States
30,000 Ingevity Corp. USD 3.875% 01/11/2028 30,600 0.1520,000 Unisys Corp. USD 6.875% 01/11/2027 21,700 0.10
52,300 0.25
TOTAL BONDS(cost USD 374,896) 382,268 1.84
TOTAL OTHER TRANSFERABLE SECURITIES(cost USD 374,896) 382,268 1.84
MARKET VALUE OF INVESTMENTS EXCLUDING DERIVATIVES(cost USD 22,841,954) 23,449,090 113.06
Futures Contracts – (0.04%)
Number ofContracts Security Description
CommitmentMarket Value
USD
UnrealisedGainUSD
% ofShareholders’
Equity
USD(3) US Treasury Long Bond Futures 22/03/2021 Short (524,156) 148 0.004 US Treasury Notes 2YR Futures 31/03/2021 Long 883,313 188 0.002 US Treasury Notes 5YR Futures 31/03/2021 Long 251,984 250 0.008 US Treasury Ultra Long Bond Futures 22/03/2021 Long 1,725,250 566 0.01
2,336,391 1,152 0.01
UNREALISED GAIN ON FUTURES CONTRACTS 1,152 0.01
Number ofContracts Security Description
CommitmentMarket Value
USD
UnrealisedLossUSD
% ofShareholders’
Equity
EUR(4) German Federal Republic Bonds 10YR Futures 08/12/2020 Short (841,317) (5,890) (0.03)(3) German Federal Republic Bonds 5Y Futures 08/12/2020 Short (487,293) (1,259) (0.01)
(1,328,610) (7,149) (0.04)
USD(4) US Treasury Notes 10YR Futures 22/03/2021 Short (552,437) (1,000) (0.00)(5) US Treasury Ultra Long Notes 10YR Futures 22/03/2021 Short (785,000) (1,235) (0.01)
(1,337,437) (2,235) (0.01)
UNREALISED LOSS ON FUTURES CONTRACTS (9,384) (0.05)
Forward Currency Contracts – (0.33%)
CurrencyAmountBought Currency
AmountSold
MaturityDate
UnrealisedGainUSD
% ofShareholders’
Equity
EUR 190,898 USD 226,991 21/01/2021 2,351 0.02
UNREALISED GAIN ON FORWARD CURRENCY CONTRACTS 2,351 0.02
CurrencyAmountBought Currency
AmountSold
MaturityDate
UnrealisedLossUSD
% ofShareholders’
Equity
USD 354,214 GBP 274,627 13/01/2021 (13,282) (0.06)USD 3,730,535 EUR 3,154,416 21/01/2021 (59,114) (0.29)
UNREALISED LOSS ON FORWARD CURRENCY CONTRACTS (72,396) (0.35)
Share Class Specific Forward Currency Contracts – 0.10%
CurrencyAmountBought Currency
AmountSold
MaturityDate
UnrealisedGainUSD
% ofShareholders’
Equity
SGD 138,840 USD 102,330 07/12/2020 1,479 0.00AUD 143,214 USD 101,943 21/12/2020 3,747 0.02GBP 204,000 USD 263,070 13/01/2021 9,915 0.05EUR 321,938 USD 380,909 21/01/2021 5,863 0.03
UNREALISED GAIN ON FORWARD CURRENCY CONTRACTS HELD FOR HEDGING PURPOSES 21,004 0.10
Goldman Sachs Funds—Global ESG Enhanced Income Bond PortfolioSchedule of InvestmentsAs at 30 November 2020
The accompanying notes are an integral part of these financial statements.
287

Swap Contracts – 0.13%Net LocalNotionalAmount Pay Receive Currency Maturity Date
UnrealisedGainUSD
% ofShareholders’
Equity
Interest Rate Swaps100,000 Floating (AUD 6 month BBSW) Fixed 0.500% AUD 25/11/2025 48 0.00
UNREALISED GAIN ON INTEREST RATE SWAPS 48 0.00
Credit Default Swaps2,975,000 Floating (The Markit CDX North America
Investment Grade 34 Index)Fixed 1.000% USD 20/06/2025 27,201 0.13
UNREALISED GAIN ON CREDIT DEFAULT SWAPS 27,201 0.13
TOTAL UNREALISED GAIN ON SWAP CONTRACTS 27,249 0.13
Net LocalNotionalAmount Pay Receive Currency Maturity Date
UnrealisedLossUSD
% ofShareholders’
Equity
Interest Rate Swaps500,000 Floating (CAD 3 month CDOR) Fixed 0.700% CAD 18/11/2023 (45) (0.00)
UNREALISED LOSS ON INTEREST RATE SWAPS (45) (0.00)
TOTAL UNREALISED LOSS ON SWAP CONTRACTS (45) (0.00)
MARKET VALUE OF INVESTMENTS(cost USD 22,841,954)
23,419,021 112.92
OTHER ASSETS AND LIABILITIES (2,679,165) (12.92)
SHAREHOLDERS’ EQUITY 20,739,856 100.00
TOTAL INVESTMENTSMarket Value
USD
% ofShareholders’
Equity
Total Investments excluding derivatives (cost USD 22,841,954) 23,449,090 113.06Unrealised gain on futures contracts 1,152 0.01Unrealised loss on futures contracts (9,384) (0.05)Unrealised gain on forward currency contracts 2,351 0.02Unrealised loss on forward currency contracts (72,396) (0.35)Unrealised gain on forward currency contracts held for hedging purposes 21,004 0.10Unrealised gain on swap contracts 27,249 0.13Unrealised loss on swap contracts (45) (0.00)Other Assets and Liabilities (2,679,165) (12.92)
Shareholders’ Equity 20,739,856 100.00
The Futures Commission Merchant was Morgan Stanley & Co., Inc.
The counterparties for forward currency contracts were Bank of America N.A., Barclays Bank Plc., BNP Paribas S.A., Citibank N.A., Deutsche Bank AG, JP Morgan Chase Bank N.A.,Royal Bank of Canada, Standard Chartered Bank, State Street Bank & Trust and Westpac Banking Corp.
The counterparty for swap contracts was Morgan Stanley.
The maximum individual counterparty exposure as at 30 November 2020 is 0.13% of the NAV.
(a) Interest rates represent either the stated coupon rate, annualised discounted yield on date of purchase for discounted securities, or, for floating rate securities, the current reset ratewhich is based upon interest rates indices.
(b) Maturity dates represent either the stated date on the security, or the next interest reset date for floating rate securities or the prerefunded date for those type of securities.(c) This security has a step up coupon which moves to the second rate at a set date in the future.(d) Variable and floating coupon rates are those quoted as of 30 November 2020.(e) A related party to Goldman Sachs Funds.(f) The yield for this fund as at 30 November 2020 was 0.120%.(g) TBA (To Be Announced) Securities are purchased on a forward commitment basis with an approximate (generally +/-2.5%) principal amount and no defined maturity date. The actual
principal amount and maturity date will be determined upon settlement when the specific mortgage pools are assigned.
Goldman Sachs Funds—Global ESG Enhanced Income Bond PortfolioSchedule of InvestmentsAs at 30 November 2020
The accompanying notes are an integral part of these financial statements.
288

Holdings Security Description Currency Interest Rate(a) Maturity Date(b)Market Value
USD
% ofShareholders’
Equity
Transferable securities admitted to an official exchange listing
Bonds – 51.58%Australia
100,000 Macquarie Group Ltd. EUR 0.625% 03/02/2027 122,745 0.07100,000 Origin Energy Finance Ltd. EUR 1.037% 17/09/2029 119,794 0.07
242,539 0.14
Austria80,000 Austria Government Bond 144A(c) EUR 2.100% 20/09/2117 216,379 0.1380,000 Austria Government Bond 144A(c) EUR 0.850% 30/06/2120 127,770 0.07
344,149 0.20
Belgium100,000 Anheuser-Busch InBev S.A./NV EUR 3.700% 02/04/2040 168,388 0.10150,000 Belgium Government Bond—Series 80 144A(c) EUR 2.150% 22/06/2066 307,771 0.17
476,159 0.27
British Virgin Islands200,000 Bluestar Finance Holdings Ltd.(d) USD 3.875% Perp. 198,063 0.11200,000 Huarong Finance 2019 Co., Ltd. USD 3.750% 29/05/2024 209,750 0.12200,000 Huarong Finance 2019 Co., Ltd. USD 3.625% 30/09/2030 208,030 0.12
615,843 0.35
Canada1,070,000 Canada Government Bond CAD 2.750% 01/12/2048 1,138,245 0.65350,000 Province of Ontario Canada CAD 2.850% 02/06/2023 286,909 0.16100,000 Province of Ontario Canada CAD 4.650% 02/06/2041 112,533 0.07250,000 Suncor Energy, Inc. USD 3.600% 01/12/2024 275,402 0.16200,000 Suncor Energy, Inc. USD 3.100% 15/05/2025 217,268 0.12
2,030,357 1.16
China2,210,000 Agricultural Development Bank of China—Series 1906 CNY 3.740% 12/07/2029 336,633 0.1912,800,000 Agricultural Development Bank of China—Series 2004 CNY 2.960% 17/04/2030 1,826,786 1.041,280,000 China Development Bank—Series 1710 CNY 4.040% 10/04/2027 200,176 0.114,550,000 China Development Bank—Series 1909 CNY 3.500% 13/08/2026 691,769 0.39200,000 China Development Bank—Series 1910 CNY 3.650% 21/05/2029 30,379 0.02
2,800,000 China Development Bank—Series 1915 CNY 3.450% 20/09/2029 417,806 0.2410,650,000 China Development Bank—Series 2010 CNY 3.090% 18/06/2030 1,538,834 0.875,690,000 China Government Bond CNY 2.850% 04/06/2027 844,530 0.48520,000 China Government Bond—Series 1824 CNY 4.080% 22/10/2048 81,836 0.05
4,130,000 China Government Bond—Series 1827 CNY 3.250% 22/11/2028 628,746 0.363,490,000 China Government Bond—Series 1906 CNY 3.290% 23/05/2029 532,173 0.303,160,000 China Government Bond—Series 1907 CNY 3.250% 06/06/2026 484,743 0.283,540,000 China Government Bond—Series 1910 CNY 3.860% 22/07/2049 537,212 0.31
8,151,623 4.64
Colombia200,000 Colombia Government International Bond USD 5.200% 15/05/2049 251,781 0.14
Croatia120,000 Croatia Government International Bond EUR 1.500% 17/06/2031 155,282 0.09
Denmark150,000 Danske Bank A/S(d) EUR 1.375% 12/02/2030 182,610 0.11930,000 Denmark Government Bond DKK 4.500% 15/11/2039 287,773 0.16
470,383 0.27
Finland100,000 Stora Enso OYJ EUR 0.625% 02/12/2030 120,816 0.07
France100,000 Aeroports de Paris EUR 0.233% 05/01/2029 127,387 0.07100,000 Aeroports de Paris EUR 2.750% 02/04/2030 145,418 0.08200,000 AXA S.A.(d) EUR 3.250% 28/05/2049 277,739 0.16100,000 BNP Paribas S.A.(d) EUR 0.375% 14/10/2027 121,245 0.07150,000 BNP Paribas S.A.(d) EUR 2.625% 14/10/2027 187,670 0.11200,000 BNP Paribas S.A.(d) EUR 0.500% 01/09/2028 241,961 0.14100,000 BNP Paribas S.A. EUR 0.625% 03/12/2032 119,800 0.07200,000 Caisse Centrale du Credit Immobilier de France S.A. EUR (0.419%) 17/01/2024 243,118 0.14200,000 Capgemini S.E. EUR 2.375% 15/04/2032 286,525 0.16100,000 Credit Agricole S.A.(d) EUR 1.625% 05/06/2030 124,986 0.07
Goldman Sachs Funds—Global Fixed Income PortfolioSchedule of InvestmentsAs at 30 November 2020
The accompanying notes are an integral part of these financial statements.
289

Holdings Security Description Currency Interest Rate(a) Maturity Date(b)Market Value
USD
% ofShareholders’
Equity
Bonds – (Continued)France – (Continued)
200,000 Electricite de France S.A.(d) EUR 2.875% Perp. 251,905 0.14300,000 Engie S.A.(d) EUR 1.500% Perp. 360,797 0.20150,000 Firmenich Productions Participations SAS EUR 1.375% 30/10/2026 193,185 0.11150,000 Firmenich Productions Participations SAS EUR 1.750% 30/04/2030 200,078 0.11200,000 France Government Bond OAT EUR 3.250% 25/05/2045 415,634 0.2480,000 France Government Bond OAT 144A(c) EUR 1.750% 25/05/2066 148,157 0.08100,000 La Mondiale SAM EUR 0.750% 20/04/2026 121,087 0.07200,000 La Mondiale SAM EUR 2.125% 23/06/2031 250,221 0.14100,000 La Poste S.A. EUR 1.375% 21/04/2032 132,976 0.08200,000 La Poste S.A. EUR 0.440% 17/09/2034 258,450 0.15200,000 Orange S.A. EUR (0.131%) 04/09/2026 241,748 0.14100,000 Orange S.A. EUR 1.625% 07/04/2032 137,991 0.08100,000 Sanofi EUR (0.362%) 21/03/2022 120,508 0.07100,000 Sanofi EUR 1.500% 01/04/2030 137,712 0.08100,000 Societe Generale S.A.(d) EUR 0.875% 22/09/2028 123,058 0.0750,000 Total Capital International S.A. USD 3.461% 12/07/2049 58,110 0.03
5,027,466 2.86
Germany200,000 Allianz S.E.(d) EUR 2.625% Perp. 241,177 0.14100,000 Bayer AG EUR 1.125% 06/01/2030 126,484 0.07100,000 Bayer AG EUR 1.375% 06/07/2032 128,413 0.07100,000 Commerzbank AG(d) EUR 4.000% 05/12/2030 129,101 0.07400,000 Deutsche Bank AG(d) EUR 1.750% 19/11/2030 495,347 0.28100,000 Deutsche Telekom AG EUR 0.500% 05/07/2027 124,837 0.07100,000 Deutsche Telekom AG EUR 1.375% 05/07/2034 134,951 0.08150,000 E.ON S.E. EUR 0.375% 29/09/2027 185,428 0.11200,000 KFW EUR 0.625% 07/01/2028 259,700 0.15
1,825,438 1.04
Indonesia310,000 Indonesia Government International Bond USD 4.125% 15/01/2025 347,636 0.20100,000 Indonesia Government International Bond EUR 3.750% 14/06/2028 144,546 0.08200,000 Indonesia Government International Bond USD 3.850% 15/10/2030 234,468 0.13
2,337,000,000 Indonesia Treasury Bond—Series FR73 IDR 8.750% 15/05/2031 194,888 0.11
921,538 0.52
Ireland150,000 Abbott Ireland Financing DAC EUR 0.875% 27/09/2023 185,725 0.10350,000 AerCap Ireland Capital DAC Via AerCap Global Aviation Trust USD 3.500% 26/05/2022 361,092 0.20350,000 AerCap Ireland Capital DAC Via AerCap Global Aviation Trust USD 4.625% 01/07/2022 367,020 0.21100,000 AIB Group Plc.(d) EUR 1.875% 19/11/2029 121,823 0.07150,000 AIB Group Plc.(d) EUR 2.875% 30/05/2031 190,406 0.11200,000 Dell Bank International DAC EUR 0.625% 17/10/2022 242,364 0.14350,000 Dell Bank International DAC EUR 1.625% 24/06/2024 434,050 0.25200,000 GE Capital International Funding Co. Unlimited Co. USD 4.418% 15/11/2035 230,710 0.13290,000 Ireland Government Bond EUR 0.200% 18/10/2030 364,365 0.21
2,497,555 1.42
Israel370,000 Israel Government Bond - Fixed—Series 327 ILS 2.000% 31/03/2027 124,029 0.07310,000 Israel Government International Bond USD 3.800% 13/05/2060 367,447 0.21
491,476 0.28
Italy270,000 Italy Buoni Poliennali Del Tesoro EUR 0.950% 01/08/2030 336,963 0.19840,000 Italy Buoni Poliennali Del Tesoro 144A(c) EUR 2.950% 01/09/2038 1,307,148 0.74110,000 Italy Buoni Poliennali Del Tesoro 144A(c) EUR 2.800% 01/03/2067 175,417 0.10180,000 Italy Certificati di Credito del Tesoro(d) EUR 1.518% 15/01/2025 228,345 0.13250,000 UniCredit SpA EUR 1.800% 20/01/2030 314,165 0.18200,000 UniCredit SpA(d) EUR 2.731% 15/01/2032 243,209 0.14
2,605,247 1.48
Japan350,000 Asahi Group Holdings Ltd. EUR 0.541% 23/10/2028 426,434 0.24
216,550,000 Japan Government Bond—Series 13 JPY 0.500% 20/03/2060 1,952,409 1.1117,150,000 Japan Government Bond—Series 168 JPY 0.400% 20/03/2039 165,723 0.0922,500,000 Japan Government Bond—Series 169 JPY 0.300% 20/06/2039 213,281 0.1261,050,000 Japan Government Bond—Series 171 JPY 0.300% 20/12/2039 577,479 0.33
Goldman Sachs Funds—Global Fixed Income PortfolioSchedule of InvestmentsAs at 30 November 2020
The accompanying notes are an integral part of these financial statements.
290

Holdings Security Description Currency Interest Rate(a) Maturity Date(b)Market Value
USD
% ofShareholders’
Equity
Bonds – (Continued)Japan – (Continued)
107,400,000 Japan Government Bond—Series 173 JPY 0.400% 20/06/2040 1,031,526 0.59124,000,000 Japan Government Bond—Series 174 JPY 0.400% 20/09/2040 1,189,867 0.6824,746,616 Japan Government Bond—Series 23 JPY 0.100% 10/03/2028 238,453 0.13221,380,616 Japan Government Bond—Series 24 JPY 0.100% 10/03/2029 2,131,140 1.2126,800,000 Japan Government Bond—Series 360 JPY 0.100% 20/09/2030 258,890 0.15528,800,000 Japan Government Bond—Series 418 JPY 0.100% 01/11/2022 5,096,069 2.90254,000,000 Japan Government Bond—Series 68 JPY 0.600% 20/09/2050 2,407,464 1.37
200,000 Mitsubishi UFJ Financial Group, Inc. EUR 0.339% 19/07/2024 243,278 0.14200,000 Mitsubishi UFJ Financial Group, Inc. USD 3.751% 18/07/2039 240,506 0.14250,000 Takeda Pharmaceutical Co., Ltd. EUR 1.375% 09/07/2032 321,776 0.18100,000 Takeda Pharmaceutical Co., Ltd. EUR 2.000% 09/07/2040 135,520 0.08
16,629,815 9.46
Luxembourg150,000 Blackstone Property Partners Europe Holdings SARL EUR 2.000% 15/02/2024 188,753 0.11100,000 Blackstone Property Partners Europe Holdings SARL EUR 1.750% 12/03/2029 125,808 0.07150,000 DH Europe Finance II SARL EUR 0.750% 18/09/2031 185,695 0.10540,000 Gazprom PJSC Via Gaz Capital S.A. USD 4.950% 23/03/2027 609,694 0.35150,000 Helvetia Europe S.A.(d) EUR 2.750% 30/09/2041 193,737 0.11150,000 Logicor Financing SARL EUR 0.750% 15/07/2024 183,756 0.10300,000 Logicor Financing SARL EUR 1.625% 15/07/2027 381,331 0.22300,000 Medtronic Global Holdings S.C.A. EUR 0.375% 07/03/2023 364,745 0.21150,000 Medtronic Global Holdings S.C.A. EUR 0.286% 02/07/2031 193,431 0.11100,000 Richemont International Holding S.A. EUR 1.625% 26/05/2040 140,058 0.08
2,567,008 1.46
Mexico1,228,800 Mexican Bonos—Series M MXN 5.750% 05/03/2026 63,077 0.042,191,900 Mexican Bonos—Series M 30 MXN 10.000% 20/11/2036 148,440 0.08200,000 Mexico City Airport Trust 144A(c) USD 5.500% 31/10/2046 193,687 0.11280,000 Mexico Government International Bond USD 2.659% 24/05/2031 280,980 0.16210,000 Mexico Government International Bond USD 3.771% 24/05/2061 209,475 0.12
895,659 0.51
Netherlands200,000 ABN AMRO Bank NV(d) EUR 2.875% 18/01/2028 252,510 0.14200,000 ABN AMRO Bank NV 144A(c) USD 4.750% 28/07/2025 229,680 0.13200,000 Airbus S.E. EUR 2.000% 07/04/2028 268,649 0.15150,000 Airbus S.E. EUR 2.375% 07/04/2032 210,906 0.12200,000 Airbus S.E. EUR 2.375% 09/06/2040 276,372 0.16200,000 BAT Netherlands Finance BV EUR 3.125% 07/04/2028 280,498 0.16100,000 Bayer Capital Corp. BV EUR 1.500% 26/06/2026 128,978 0.07100,000 Cooperatieve Rabobank UA EUR 3.875% 25/07/2023 132,508 0.08150,000 CRH Funding BV EUR 1.625% 05/05/2030 202,604 0.12100,000 Enel Finance International NV EUR 0.375% 17/06/2027 122,641 0.07200,000 Fiat Chrysler Automobiles NV EUR 3.875% 05/01/2026 270,868 0.15125,000 Fiat Chrysler Automobiles NV EUR 4.500% 07/07/2028 179,910 0.10100,000 Givaudan Finance Europe BV EUR 1.625% 22/04/2032 136,800 0.08100,000 ING Groep NV EUR (0.216%) 20/09/2023 124,045 0.07100,000 ING Groep NV(d) EUR 2.125% 26/05/2031 127,960 0.07200,000 ING Groep NV(d) USD 6.750% Perp. 219,000 0.1350,000 Innogy Finance BV GBP 6.125% 06/07/2039 111,962 0.06200,000 JAB Holdings BV EUR 1.000% 20/12/2027 247,844 0.14200,000 JAB Holdings BV EUR 3.375% 17/04/2035 297,848 0.17200,000 Prosus NV USD 3.680% 21/01/2030 218,460 0.12300,000 Upjohn Finance BV EUR 1.908% 23/06/2032 398,831 0.23200,000 Volkswagen International Finance NV(d) EUR 3.500% Perp. 253,981 0.15100,000 Wintershall Dea Finance BV EUR 1.332% 25/09/2028 123,089 0.07200,000 WPC Eurobond BV EUR 1.350% 15/04/2028 249,173 0.14
5,065,117 2.88
Peru100,000 Peruvian Government International Bond USD 2.780% 01/12/2060 98,750 0.0550,000 Peruvian Government International Bond USD 3.230% 28/07/2121 49,400 0.03
148,150 0.08
Portugal240,000 Portugal Obrigacoes do Tesouro OT 144A(c) EUR 1.950% 15/06/2029 339,220 0.19
Goldman Sachs Funds—Global Fixed Income PortfolioSchedule of InvestmentsAs at 30 November 2020
The accompanying notes are an integral part of these financial statements.
291

Holdings Security Description Currency Interest Rate(a) Maturity Date(b)Market Value
USD
% ofShareholders’
Equity
Bonds – (Continued)Qatar
200,000 Qatar Government International Bond USD 5.103% 23/04/2048 286,844 0.16
Romania80,000 Romanian Government International Bond EUR 3.375% 28/01/2050 106,655 0.06
Russia4,470,000 Russian Federal Bond - OFZ Bonds—Series 6212 RUB 7.050% 19/01/2028 64,054 0.04
Saudi Arabia210,000 Saudi Government International Bond USD 3.250% 22/10/2030 231,525 0.13
South Korea302,290,000 Inflation Linked Korea Treasury Bond—Series 2606 KRW 0.809% 10/06/2026 294,632 0.17620,700,000 Korea Treasury Bond—Series 2906 KRW 1.875% 10/06/2029 577,054 0.33
1,177,260,000 Korea Treasury Bond—Series 2912 KRW 1.375% 10/12/2029 1,046,677 0.59
1,918,363 1.09
Spain100,000 Banco Bilbao Vizcaya Argentaria S.A. EUR 0.750% 11/09/2022 122,154 0.07100,000 Banco de Sabadell S.A. EUR 0.875% 05/03/2023 122,097 0.07100,000 Banco de Sabadell S.A. EUR 1.125% 27/03/2025 121,453 0.07200,000 Banco Santander S.A. USD 2.706% 27/06/2024 212,820 0.12100,000 Banco Santander S.A. EUR 1.375% 05/01/2026 127,073 0.07200,000 Banco Santander S.A. USD 3.306% 27/06/2029 223,514 0.13300,000 Banco Santander S.A. EUR 1.625% 22/10/2030 372,367 0.21100,000 Bankinter S.A. EUR 0.625% 06/10/2027 122,226 0.07200,000 CaixaBank S.A. EUR 1.125% 17/05/2024 249,526 0.14200,000 CaixaBank S.A.(d) EUR 0.375% 18/11/2026 240,896 0.14150,000 FCC Aqualia S.A. EUR 2.629% 08/06/2027 196,474 0.11100,000 FCC Servicios Medio Ambiente Holding SAU EUR 1.661% 04/12/2026 125,932 0.07250,000 Spain Government Bond EUR 0.050% 31/01/2021 300,202 0.17130,000 Spain Government Bond 144A(c) EUR 5.900% 30/07/2026 211,881 0.12810,000 Spain Government Bond 144A(c) EUR 1.500% 30/04/2027 1,085,093 0.62890,000 Spain Government Bond 144A(c) EUR 1.250% 31/10/2030 1,192,466 0.68180,000 Spain Government Bond 144A(c) EUR 3.450% 30/07/2066 393,009 0.22500,000 Telefonica Emisiones S.A. EUR 1.201% 21/08/2027 642,203 0.37100,000 Telefonica Emisiones S.A. EUR 1.957% 01/07/2039 138,681 0.08
6,200,067 3.53
Supranationals540,000 European Investment Bank EUR 0.125% 20/06/2029 680,799 0.39160,000 European Investment Bank EUR (0.060%) 14/11/2042 236,805 0.1460,000 European Union EUR (0.187%) 04/07/2035 73,983 0.04760,000 Inter-American Development Bank USD 7.000% 15/06/2025 972,868 0.55
1,964,455 1.12
Sweden100,000 Heimstaden Bostad AB EUR 1.125% 21/01/2026 123,843 0.07200,000 Svenska Handelsbanken AB(d) USD 4.375% Perp. 208,684 0.12300,000 Volvo Treasury AB EUR 0.125% 17/09/2024 362,071 0.21
694,598 0.40
Switzerland250,000 Credit Suisse AG USD 2.950% 09/04/2025 273,775 0.15150,000 Credit Suisse Group AG(d) EUR 3.250% 02/04/2026 203,725 0.12200,000 Credit Suisse Group AG(d) EUR 0.650% 14/01/2028 245,133 0.14650,000 Credit Suisse Group AG 144A(c)(d) USD 2.593% 11/09/2025 684,963 0.39
1,407,596 0.80
Thailand14,580,000 Thailand Government Bond THB 3.650% 17/12/2021 497,743 0.289,460,000 Thailand Government Bond THB 1.875% 17/06/2022 319,202 0.1817,900,000 Thailand Government Bond THB 2.400% 17/12/2023 623,490 0.36
1,440,435 0.82
United Arab Emirates290,000 Abu Dhabi Crude Oil Pipeline LLC USD 4.600% 02/11/2047 360,280 0.21200,000 Abu Dhabi Government International Bond USD 4.125% 11/10/2047 254,500 0.14200,000 DP World Plc. USD 5.625% 25/09/2048 244,594 0.14
859,374 0.49
Goldman Sachs Funds—Global Fixed Income PortfolioSchedule of InvestmentsAs at 30 November 2020
The accompanying notes are an integral part of these financial statements.
292

Holdings Security Description Currency Interest Rate(a) Maturity Date(b)Market Value
USD
% ofShareholders’
Equity
Bonds – (Continued)United Kingdom
50,000 Aviva Plc.(d) GBP 6.125% 14/11/2036 81,695 0.05100,000 Barclays Bank Plc. USD 10.179% 12/06/2021 104,807 0.06200,000 Barclays Plc.(d) USD 4.610% 15/02/2023 209,306 0.12150,000 Barclays Plc.(d) EUR 3.375% 02/04/2025 198,338 0.11150,000 Barclays Plc.(d) GBP 3.750% 22/11/2030 216,506 0.12100,000 BAT International Finance Plc. GBP 2.250% 26/06/2028 137,101 0.0850,000 BP Capital Markets Plc. USD 3.814% 10/02/2024 54,842 0.03100,000 BP Capital Markets Plc.(d) EUR 3.250% Perp. 128,182 0.07100,000 BP Capital Markets Plc.(d) EUR 3.625% Perp. 131,404 0.07300,000 HSBC Holdings Plc.(d) USD 3.803% 11/03/2025 326,019 0.18250,000 HSBC Holdings Plc. USD 4.950% 31/03/2030 311,462 0.18100,000 Legal & General Group Plc.(d) GBP 3.750% 26/11/2049 142,665 0.08150,000 Lloyds Banking Group Plc.(d) EUR 3.500% 01/04/2026 205,015 0.12100,000 M&G Plc.(d) GBP 6.340% 19/12/2063 173,464 0.10400,000 Nationwide Building Society 144A(c)(d) USD 3.960% 18/07/2030 462,588 0.26200,000 Natwest Group Plc.(d) USD 3.498% 15/05/2023 208,126 0.12100,000 Pension Insurance Corp. Plc. GBP 4.625% 07/05/2031 155,418 0.09100,000 Phoenix Group Holdings Plc. GBP 5.625% 28/04/2031 160,492 0.09250,000 Santander UK Group Holdings Plc.(d) USD 1.532% 21/08/2026 252,008 0.14425,000 Smith & Nephew Plc. USD 2.032% 14/10/2030 432,340 0.25200,000 Swiss Re Finance UK Plc.(d) EUR 2.714% 04/06/2052 263,841 0.15220,000 United Kingdom Gilt GBP 4.250% 07/03/2036 451,224 0.26560,000 United Kingdom Gilt GBP 3.250% 22/01/2044 1,134,970 0.65140,000 United Kingdom Gilt GBP 3.500% 22/01/2045 297,247 0.17200,000 United Kingdom Gilt GBP 1.750% 22/07/2057 349,800 0.20140,000 United Kingdom Gilt GBP 3.500% 22/07/2068 394,372 0.22
6,983,232 3.97
United States50,000 AbbVie, Inc. USD 3.750% 14/11/2023 54,646 0.03250,000 AbbVie, Inc. USD 2.950% 21/11/2026 276,600 0.1650,000 AbbVie, Inc. USD 4.250% 14/11/2028 60,347 0.03900,000 AbbVie, Inc. USD 3.200% 21/11/2029 1,019,772 0.58100,000 AbbVie, Inc. USD 4.875% 14/11/2048 136,214 0.08175,000 Air Lease Corp. USD 3.250% 01/03/2025 184,035 0.10100,000 Alexandria Real Estate Equities, Inc. USD 3.375% 15/08/2031 114,586 0.0750,000 Ameren Corp. USD 2.500% 15/09/2024 53,213 0.03250,000 American International Group, Inc. USD 3.400% 30/06/2030 284,957 0.16350,000 American Tower Corp. USD 3.800% 15/08/2029 405,111 0.2350,000 American Water Capital Corp. USD 3.450% 01/05/2050 59,860 0.03150,000 Anheuser-Busch Cos. LLC Via Anheuser-Busch InBev Worldwide, Inc. USD 4.900% 01/02/2046 196,113 0.11250,000 Anheuser-Busch InBev Worldwide, Inc. USD 4.150% 23/01/2025 283,807 0.16250,000 Anheuser-Busch InBev Worldwide, Inc. USD 4.750% 23/01/2029 307,107 0.17150,000 Anheuser-Busch InBev Worldwide, Inc. USD 4.600% 15/04/2048 190,442 0.11150,000 Anheuser-Busch InBev Worldwide, Inc. USD 5.550% 23/01/2049 215,646 0.12200,000 Anthem, Inc. USD 2.250% 15/05/2030 210,076 0.12100,000 Archer-Daniels-Midland Co. USD 3.250% 27/03/2030 116,198 0.0750,000 AT&T, Inc. USD 3.000% 30/06/2022 51,840 0.03100,000 AT&T, Inc. USD 4.100% 15/02/2028 117,953 0.07550,000 AT&T, Inc. USD 2.750% 01/06/2031 584,193 0.33100,000 AT&T, Inc. EUR 1.800% 14/09/2039 127,480 0.07150,000 AT&T, Inc. USD 4.500% 09/03/2048 180,881 0.10100,000 AT&T, Inc. USD 3.650% 01/06/2051 105,735 0.06150,000 Bank of America Corp.(d) EUR 3.648% 31/03/2029 223,665 0.13100,000 Bank of America Corp. USD 5.875% 07/02/2042 154,274 0.09100,000 BAT Capital Corp. USD 5.282% 02/04/2050 124,666 0.07250,000 Becton Dickinson and Co. USD 2.894% 06/06/2022 258,450 0.15350,000 Becton Dickinson and Co. USD 3.363% 06/06/2024 378,269 0.22150,000 Boeing Co. USD 5.150% 01/05/2030 177,023 0.10133,000 Cigna Corp. USD 3.750% 15/07/2023 143,980 0.08250,000 Cigna Corp. USD 2.400% 15/03/2030 265,790 0.1550,000 Cigna Corp. USD 4.900% 15/12/2048 68,820 0.04100,000 Citigroup, Inc. GBP 2.750% 24/01/2024 142,128 0.08350,000 Coca-Cola Co. USD 2.600% 01/06/2050 370,727 0.21100,000 Constellation Brands, Inc. USD 4.400% 15/11/2025 116,370 0.07550,000 Constellation Brands, Inc. USD 2.875% 01/05/2030 603,278 0.34175,000 CVS Health Corp. USD 4.250% 01/04/2050 219,980 0.1350,000 Devon Energy Corp. USD 5.850% 15/12/2025 57,558 0.03400,000 Dominion Energy, Inc.—Series C USD 3.375% 01/04/2030 458,292 0.26100,000 Duke Energy Carolinas LLC USD 3.200% 15/08/2049 114,261 0.07
Goldman Sachs Funds—Global Fixed Income PortfolioSchedule of InvestmentsAs at 30 November 2020
The accompanying notes are an integral part of these financial statements.
293

Holdings Security Description Currency Interest Rate(a) Maturity Date(b)Market Value
USD
% ofShareholders’
Equity
Bonds – (Continued)United States – (Continued)
100,000 DuPont de Nemours, Inc. USD 4.493% 15/11/2025 116,718 0.07300,000 DuPont de Nemours, Inc. USD 4.725% 15/11/2028 366,555 0.2150,000 Energy Transfer Operating LP USD 5.250% 15/04/2029 56,586 0.03100,000 Enterprise Products Operating LLC USD 2.850% 15/04/2021 100,715 0.06400,000 Enterprise Products Operating LLC USD 3.750% 15/02/2025 446,108 0.25150,000 Fidelity National Information Services, Inc. EUR 0.625% 03/12/2025 185,958 0.1150,000 General Electric Co. USD 3.100% 09/01/2023 52,576 0.03150,000 General Electric Co. USD 3.625% 01/05/2030 168,099 0.10200,000 General Electric Co. USD 4.350% 01/05/2050 234,556 0.1350,000 General Electric Co.—Series MTNA USD 6.750% 15/03/2032 68,024 0.04100,000 General Mills, Inc. USD 2.875% 15/04/2030 111,122 0.06100,000 General Motors Co. USD 5.400% 02/10/2023 112,102 0.0650,000 Healthcare Realty Trust, Inc. USD 2.050% 15/03/2031 49,986 0.0350,000 Healthpeak Properties, Inc. USD 3.250% 15/07/2026 55,789 0.03100,000 Hewlett Packard Enterprise Co. USD 4.450% 02/10/2023 110,196 0.06350,000 Hewlett Packard Enterprise Co. USD 4.900% 15/10/2025 407,032 0.2375,000 Hewlett Packard Enterprise Co. USD 6.350% 15/10/2045 99,122 0.06250,000 Intercontinental Exchange, Inc. USD 1.850% 15/09/2032 252,632 0.14200,000 JPMorgan Chase & Co.(d) EUR 1.001% 25/07/2031 254,077 0.1475,000 Kroger Co. USD 3.950% 15/01/2050 91,773 0.0575,000 McDonald’s Corp. USD 4.200% 01/04/2050 96,406 0.06100,000 MetLife, Inc.—Series D USD 4.368% 15/09/2023 110,673 0.0650,000 MPLX LP USD 4.500% 15/04/2038 55,361 0.0350,000 MPLX LP USD 5.500% 15/02/2049 62,085 0.04175,000 NiSource, Inc. USD 3.600% 01/05/2030 202,767 0.1250,000 Pacific Gas & Electric Co. USD 2.500% 01/02/2031 50,333 0.0350,000 Pacific Gas & Electric Co. USD 3.500% 01/08/2050 50,362 0.0350,000 Phillips 66 USD 3.850% 09/04/2025 55,844 0.0375,000 Phillips 66 USD 1.300% 15/02/2026 75,543 0.04150,000 PNC Financial Services Group, Inc. USD 3.500% 23/01/2024 163,236 0.09300,000 Prudential Financial, Inc. USD 3.000% 10/03/2040 324,978 0.19100,000 Sempra Energy USD 3.400% 01/02/2028 111,773 0.06200,000 Snap-on, Inc. USD 3.100% 01/05/2050 227,132 0.13300,000 Stryker Corp. USD 1.950% 15/06/2030 309,915 0.1850,000 Sunoco Logistics Partners Operations LP USD 5.300% 01/04/2044 52,185 0.03150,000 Sysco Corp. USD 5.950% 01/04/2030 198,103 0.1150,000 Thermo Fisher Scientific, Inc. USD 4.497% 25/03/2030 62,809 0.04100,000 Thermo Fisher Scientific, Inc. EUR 1.875% 01/10/2049 137,648 0.08150,000 VEREIT Operating Partnership LP USD 4.625% 01/11/2025 168,797 0.1075,000 VEREIT Operating Partnership LP USD 2.850% 15/12/2032 76,469 0.04100,000 Verizon Communications, Inc. USD 2.625% 15/08/2026 109,386 0.0650,000 Verizon Communications, Inc. USD 3.875% 08/02/2029 58,924 0.0310,000 Verizon Communications, Inc. USD 5.012% 15/04/2049 14,197 0.0150,000 Verizon Communications, Inc. USD 4.000% 22/03/2050 62,738 0.04150,000 Wells Fargo & Co.(d) EUR 1.741% 04/05/2030 197,600 0.11150,000 Wells Fargo & Co. EUR 0.625% 14/08/2030 180,539 0.10100,000 Williams Cos., Inc. USD 3.900% 15/01/2025 110,000 0.06375,000 WP Carey, Inc. USD 2.400% 01/02/2031 383,392 0.22350,000 Zoetis, Inc. USD 2.000% 15/05/2030 364,091 0.21
16,627,355 9.46
TOTAL BONDS(cost USD 82,998,882) 90,657,174 51.58
Holdings Security DescriptionMarket Value
USD
% ofShareholders’
Equity
Mutual Funds – 8.49%Ireland
14,926,084 Goldman Sachs US$ Treasury Liquid Reserves Fund (X Distribution Class)(e)(f) 14,926,084 8.49
TOTAL MUTUAL FUNDS(cost USD 14,926,084) 14,926,084 8.49
TOTAL TRANSFERABLE SECURITIES ADMITTED TO AN OFFICIAL EXCHANGE LISTING(cost USD 97,924,966) 105,583,258 60.07
Goldman Sachs Funds—Global Fixed Income PortfolioSchedule of InvestmentsAs at 30 November 2020
The accompanying notes are an integral part of these financial statements.
294

Holdings Security Description Currency Interest Rate(a) Maturity Date(b)Market Value
USD
% ofShareholders’
Equity
Transferable securities dealt in another regulated market
Bonds – 16.24%Australia
200,000 Australia & New Zealand Banking Group Ltd. 144A(c)(d) USD 2.950% 22/07/2030 209,898 0.12200,000 Commonwealth Bank of Australia 144A(c)(d) USD 3.610% 12/09/2034 219,110 0.1230,000 Macquarie Group Ltd. 144A(c)(d) USD 3.763% 28/11/2028 33,177 0.02250,000 Westpac Banking Corp.(d) USD 2.668% 15/11/2035 258,332 0.15
720,517 0.41
Bermuda250,000 Bacardi Ltd. 144A(c) USD 4.700% 15/05/2028 293,068 0.17
Cayman Islands50,000 Avolon Holdings Funding Ltd. 144A(c) USD 3.950% 01/07/2024 51,075 0.03
France200,000 BNP Paribas S.A. USD 3.375% 09/01/2025 218,204 0.12250,000 BNP Paribas S.A. 144A(c) USD 3.375% 09/01/2025 272,755 0.15300,000 BNP Paribas S.A. 144A(c)(d) USD 2.219% 09/06/2026 312,513 0.18200,000 BNP Paribas S.A. 144A(c)(d) USD 4.375% 01/03/2033 226,496 0.13500,000 BPCE S.A. 144A(c) USD 4.000% 12/09/2023 544,650 0.31250,000 BPCE S.A. 144A(c)(d) USD 1.652% 06/10/2026 253,825 0.14250,000 Credit Agricole S.A. 144A(c) USD 3.375% 10/01/2022 258,172 0.15200,000 Electricite de France S.A. 144A(c) USD 4.500% 21/09/2028 238,678 0.14
2,325,293 1.32
Germany250,000 Deutsche Bank AG(d) USD 2.222% 18/09/2024 255,175 0.15150,000 Deutsche Telekom AG 144A(c) USD 3.625% 21/01/2050 175,653 0.10
430,828 0.25
Indonesia6,525,000,000 Indonesia Treasury Bond—JPMorgan Chase Bank NA 144A(c)(d) IDR 7.500% 17/06/2035 497,924 0.28
Luxembourg90,000 Gazprom PJSC Via Gaz Capital S.A. USD 8.625% 28/04/2034 138,586 0.08
Netherlands300,000 Deutsche Telekom International Finance BV 144A(c) USD 4.375% 21/06/2028 357,906 0.21200,000 Syngenta Finance NV 144A(c) USD 4.441% 24/04/2023 211,344 0.12200,000 Syngenta Finance NV 144A(c) USD 4.892% 24/04/2025 216,638 0.12
785,888 0.45
Supranationals100,000 NXP BV Via NXP Funding LLC Via NXP USA, Inc. 144A(c) USD 3.400% 01/05/2030 112,915 0.06
Switzerland250,000 Credit Suisse Group AG 144A(c)(d) USD 3.869% 12/01/2029 283,275 0.16
United Kingdom250,000 Vodafone Group Plc. USD 3.750% 16/01/2024 273,420 0.15100,000 Vodafone Group Plc. USD 4.375% 30/05/2028 119,919 0.07
393,339 0.22
United States250,000 AbbVie, Inc. USD 2.600% 21/11/2024 267,575 0.15150,000 AbbVie, Inc. USD 4.050% 21/11/2039 182,018 0.10300,000 AbbVie, Inc. USD 4.250% 21/11/2049 378,723 0.2250,000 AEP Transmission Co., LLC—Series M USD 3.650% 01/04/2050 60,975 0.03350,000 Air Lease Corp. USD 3.875% 03/07/2023 370,282 0.21250,000 American International Group, Inc. USD 4.375% 30/06/2050 324,857 0.19350,000 Bank of America Corp.(d) USD 3.864% 23/07/2024 379,746 0.22225,000 Bank of America Corp.(d) USD 3.366% 23/01/2026 246,883 0.14350,000 Bank of America Corp.(d) USD 2.592% 29/04/2031 373,026 0.21100,000 Bank of America Corp.(d) USD 4.083% 20/03/2051 127,775 0.07250,000 BBVA USA USD 3.500% 11/06/2021 253,570 0.14200,000 Biogen, Inc. USD 2.250% 01/05/2030 207,332 0.1225,000 Bristol-Myers Squibb Co. USD 4.250% 26/10/2049 33,973 0.02350,000 Broadcom, Inc. USD 3.625% 15/10/2024 383,449 0.22350,000 Broadcom, Inc. USD 4.700% 15/04/2025 400,494 0.23775,000 Broadcom, Inc. USD 4.250% 15/04/2026 883,229 0.50415,000 Broadcom, Inc. USD 3.459% 15/09/2026 458,484 0.26300,000 Carrier Global Corp. 144A(c) USD 2.722% 15/02/2030 319,896 0.18
Goldman Sachs Funds—Global Fixed Income PortfolioSchedule of InvestmentsAs at 30 November 2020
The accompanying notes are an integral part of these financial statements.
295
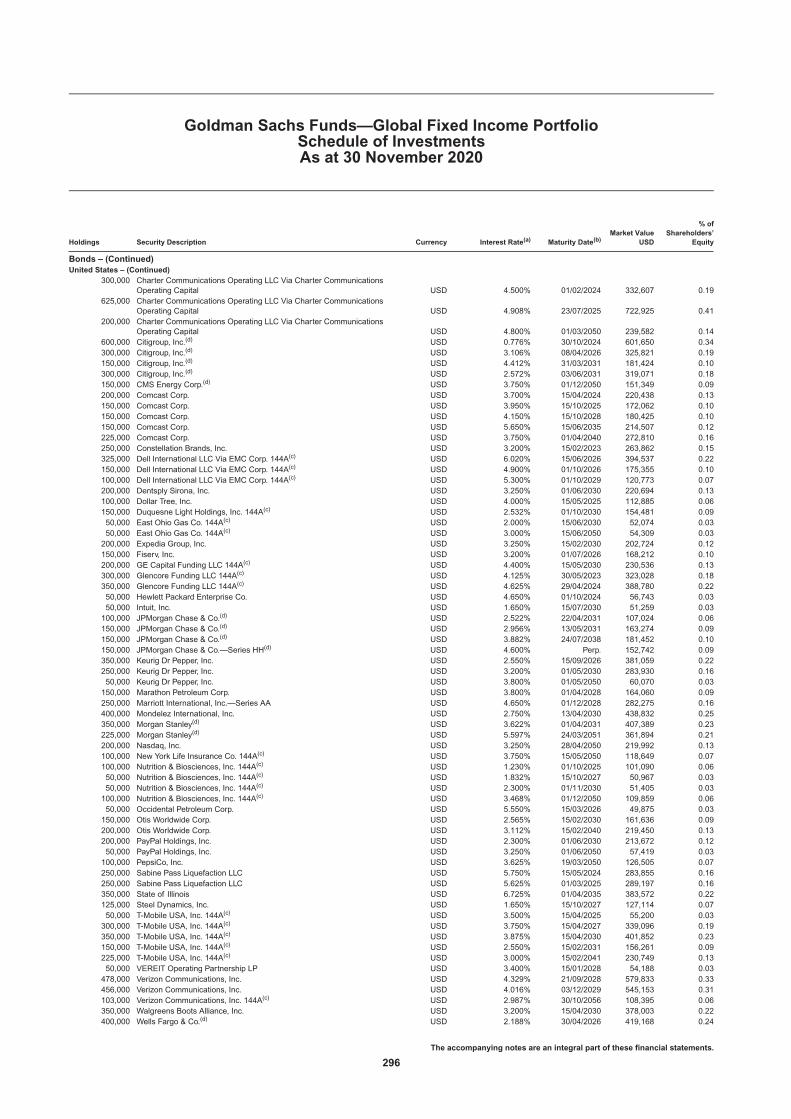
Holdings Security Description Currency Interest Rate(a) Maturity Date(b)Market Value
USD
% ofShareholders’
Equity
Bonds – (Continued)United States – (Continued)
300,000 Charter Communications Operating LLC Via Charter CommunicationsOperating Capital USD 4.500% 01/02/2024 332,607 0.19
625,000 Charter Communications Operating LLC Via Charter CommunicationsOperating Capital USD 4.908% 23/07/2025 722,925 0.41
200,000 Charter Communications Operating LLC Via Charter CommunicationsOperating Capital USD 4.800% 01/03/2050 239,582 0.14
600,000 Citigroup, Inc.(d) USD 0.776% 30/10/2024 601,650 0.34300,000 Citigroup, Inc.(d) USD 3.106% 08/04/2026 325,821 0.19150,000 Citigroup, Inc.(d) USD 4.412% 31/03/2031 181,424 0.10300,000 Citigroup, Inc.(d) USD 2.572% 03/06/2031 319,071 0.18150,000 CMS Energy Corp.(d) USD 3.750% 01/12/2050 151,349 0.09200,000 Comcast Corp. USD 3.700% 15/04/2024 220,438 0.13150,000 Comcast Corp. USD 3.950% 15/10/2025 172,062 0.10150,000 Comcast Corp. USD 4.150% 15/10/2028 180,425 0.10150,000 Comcast Corp. USD 5.650% 15/06/2035 214,507 0.12225,000 Comcast Corp. USD 3.750% 01/04/2040 272,810 0.16250,000 Constellation Brands, Inc. USD 3.200% 15/02/2023 263,862 0.15325,000 Dell International LLC Via EMC Corp. 144A(c) USD 6.020% 15/06/2026 394,537 0.22150,000 Dell International LLC Via EMC Corp. 144A(c) USD 4.900% 01/10/2026 175,355 0.10100,000 Dell International LLC Via EMC Corp. 144A(c) USD 5.300% 01/10/2029 120,773 0.07200,000 Dentsply Sirona, Inc. USD 3.250% 01/06/2030 220,694 0.13100,000 Dollar Tree, Inc. USD 4.000% 15/05/2025 112,885 0.06150,000 Duquesne Light Holdings, Inc. 144A(c) USD 2.532% 01/10/2030 154,481 0.0950,000 East Ohio Gas Co. 144A(c) USD 2.000% 15/06/2030 52,074 0.0350,000 East Ohio Gas Co. 144A(c) USD 3.000% 15/06/2050 54,309 0.03200,000 Expedia Group, Inc. USD 3.250% 15/02/2030 202,724 0.12150,000 Fiserv, Inc. USD 3.200% 01/07/2026 168,212 0.10200,000 GE Capital Funding LLC 144A(c) USD 4.400% 15/05/2030 230,536 0.13300,000 Glencore Funding LLC 144A(c) USD 4.125% 30/05/2023 323,028 0.18350,000 Glencore Funding LLC 144A(c) USD 4.625% 29/04/2024 388,780 0.2250,000 Hewlett Packard Enterprise Co. USD 4.650% 01/10/2024 56,743 0.0350,000 Intuit, Inc. USD 1.650% 15/07/2030 51,259 0.03100,000 JPMorgan Chase & Co.(d) USD 2.522% 22/04/2031 107,024 0.06150,000 JPMorgan Chase & Co.(d) USD 2.956% 13/05/2031 163,274 0.09150,000 JPMorgan Chase & Co.(d) USD 3.882% 24/07/2038 181,452 0.10150,000 JPMorgan Chase & Co.—Series HH(d) USD 4.600% Perp. 152,742 0.09350,000 Keurig Dr Pepper, Inc. USD 2.550% 15/09/2026 381,059 0.22250,000 Keurig Dr Pepper, Inc. USD 3.200% 01/05/2030 283,930 0.1650,000 Keurig Dr Pepper, Inc. USD 3.800% 01/05/2050 60,070 0.03150,000 Marathon Petroleum Corp. USD 3.800% 01/04/2028 164,060 0.09250,000 Marriott International, Inc.—Series AA USD 4.650% 01/12/2028 282,275 0.16400,000 Mondelez International, Inc. USD 2.750% 13/04/2030 438,832 0.25350,000 Morgan Stanley(d) USD 3.622% 01/04/2031 407,389 0.23225,000 Morgan Stanley(d) USD 5.597% 24/03/2051 361,894 0.21200,000 Nasdaq, Inc. USD 3.250% 28/04/2050 219,992 0.13100,000 New York Life Insurance Co. 144A(c) USD 3.750% 15/05/2050 118,649 0.07100,000 Nutrition & Biosciences, Inc. 144A(c) USD 1.230% 01/10/2025 101,090 0.0650,000 Nutrition & Biosciences, Inc. 144A(c) USD 1.832% 15/10/2027 50,967 0.0350,000 Nutrition & Biosciences, Inc. 144A(c) USD 2.300% 01/11/2030 51,405 0.03100,000 Nutrition & Biosciences, Inc. 144A(c) USD 3.468% 01/12/2050 109,859 0.0650,000 Occidental Petroleum Corp. USD 5.550% 15/03/2026 49,875 0.03150,000 Otis Worldwide Corp. USD 2.565% 15/02/2030 161,636 0.09200,000 Otis Worldwide Corp. USD 3.112% 15/02/2040 219,450 0.13200,000 PayPal Holdings, Inc. USD 2.300% 01/06/2030 213,672 0.1250,000 PayPal Holdings, Inc. USD 3.250% 01/06/2050 57,419 0.03100,000 PepsiCo, Inc. USD 3.625% 19/03/2050 126,505 0.07250,000 Sabine Pass Liquefaction LLC USD 5.750% 15/05/2024 283,855 0.16250,000 Sabine Pass Liquefaction LLC USD 5.625% 01/03/2025 289,197 0.16350,000 State of Illinois USD 6.725% 01/04/2035 383,572 0.22125,000 Steel Dynamics, Inc. USD 1.650% 15/10/2027 127,114 0.0750,000 T-Mobile USA, Inc. 144A(c) USD 3.500% 15/04/2025 55,200 0.03300,000 T-Mobile USA, Inc. 144A(c) USD 3.750% 15/04/2027 339,096 0.19350,000 T-Mobile USA, Inc. 144A(c) USD 3.875% 15/04/2030 401,852 0.23150,000 T-Mobile USA, Inc. 144A(c) USD 2.550% 15/02/2031 156,261 0.09225,000 T-Mobile USA, Inc. 144A(c) USD 3.000% 15/02/2041 230,749 0.1350,000 VEREIT Operating Partnership LP USD 3.400% 15/01/2028 54,188 0.03478,000 Verizon Communications, Inc. USD 4.329% 21/09/2028 579,833 0.33456,000 Verizon Communications, Inc. USD 4.016% 03/12/2029 545,153 0.31103,000 Verizon Communications, Inc. 144A(c) USD 2.987% 30/10/2056 108,395 0.06350,000 Walgreens Boots Alliance, Inc. USD 3.200% 15/04/2030 378,003 0.22400,000 Wells Fargo & Co.(d) USD 2.188% 30/04/2026 419,168 0.24
Goldman Sachs Funds—Global Fixed Income PortfolioSchedule of InvestmentsAs at 30 November 2020
The accompanying notes are an integral part of these financial statements.
296

Holdings Security Description Currency Interest Rate(a) Maturity Date(b)Market Value
USD
% ofShareholders’
Equity
Bonds – (Continued)United States – (Continued)
400,000 Wells Fargo & Co.(d) USD 2.393% 02/06/2028 422,856 0.24125,000 Wells Fargo & Co.(d) USD 5.013% 04/04/2051 178,696 0.10500,000 Wells Fargo Bank NA USD 3.550% 14/08/2023 540,980 0.31
22,515,898 12.81
TOTAL BONDS(cost USD 26,190,729) 28,548,606 16.24
Agencies Asset Backed Obligations – 22.62%United States
400,000 Federal Home Loan Mortgage Corp. (FHLMC) USD 6.750% 15/03/2031 617,296 0.354,414 Federal Home Loan Mortgage Corp. (FHLMC) USD 5.000% 01/01/2033 4,948 0.002,385 Federal Home Loan Mortgage Corp. (FHLMC) USD 5.000% 01/04/2033 2,653 0.00167 Federal Home Loan Mortgage Corp. (FHLMC) USD 5.000% 01/05/2033 187 0.00411 Federal Home Loan Mortgage Corp. (FHLMC) USD 5.000% 01/06/2033 461 0.00
6,341 Federal Home Loan Mortgage Corp. (FHLMC) USD 5.000% 01/07/2033 7,320 0.006,375 Federal Home Loan Mortgage Corp. (FHLMC) USD 5.000% 01/08/2033 7,362 0.00757 Federal Home Loan Mortgage Corp. (FHLMC) USD 5.000% 01/08/2033 873 0.00
2,092 Federal Home Loan Mortgage Corp. (FHLMC) USD 5.000% 01/08/2033 2,423 0.00205 Federal Home Loan Mortgage Corp. (FHLMC) USD 5.000% 01/08/2033 237 0.00386 Federal Home Loan Mortgage Corp. (FHLMC) USD 5.000% 01/09/2033 444 0.00
1,366 Federal Home Loan Mortgage Corp. (FHLMC) USD 5.000% 01/10/2033 1,580 0.001,220 Federal Home Loan Mortgage Corp. (FHLMC) USD 5.000% 01/11/2033 1,394 0.003,535 Federal Home Loan Mortgage Corp. (FHLMC) USD 5.000% 01/11/2033 3,922 0.001,950 Federal Home Loan Mortgage Corp. (FHLMC) USD 5.000% 01/12/2033 2,252 0.001,310 Federal Home Loan Mortgage Corp. (FHLMC) USD 5.000% 01/01/2034 1,512 0.00595 Federal Home Loan Mortgage Corp. (FHLMC) USD 5.000% 01/01/2034 686 0.00
4,908 Federal Home Loan Mortgage Corp. (FHLMC) USD 5.000% 01/02/2034 5,671 0.001,038 Federal Home Loan Mortgage Corp. (FHLMC) USD 5.000% 01/02/2034 1,179 0.00393 Federal Home Loan Mortgage Corp. (FHLMC) USD 5.000% 01/02/2034 456 0.00163 Federal Home Loan Mortgage Corp. (FHLMC) USD 5.000% 01/02/2034 181 0.00456 Federal Home Loan Mortgage Corp. (FHLMC) USD 5.000% 01/03/2034 526 0.00570 Federal Home Loan Mortgage Corp. (FHLMC) USD 5.000% 01/03/2034 658 0.00
1,436 Federal Home Loan Mortgage Corp. (FHLMC) USD 5.000% 01/03/2034 1,665 0.001,094 Federal Home Loan Mortgage Corp. (FHLMC) USD 5.000% 01/03/2034 1,267 0.00434 Federal Home Loan Mortgage Corp. (FHLMC) USD 5.000% 01/04/2034 492 0.00
1,245 Federal Home Loan Mortgage Corp. (FHLMC) USD 5.000% 01/04/2034 1,379 0.00384 Federal Home Loan Mortgage Corp. (FHLMC) USD 5.000% 01/04/2034 445 0.00
3,692 Federal Home Loan Mortgage Corp. (FHLMC) USD 5.000% 01/04/2034 4,270 0.006,665 Federal Home Loan Mortgage Corp. (FHLMC) USD 5.000% 01/05/2034 7,448 0.008,792 Federal Home Loan Mortgage Corp. (FHLMC) USD 5.000% 01/06/2034 10,200 0.012,429 Federal Home Loan Mortgage Corp. (FHLMC) USD 5.000% 01/06/2034 2,807 0.0091,935 Federal Home Loan Mortgage Corp. (FHLMC) USD 5.000% 01/06/2034 106,042 0.061,688 Federal Home Loan Mortgage Corp. (FHLMC) USD 5.000% 01/11/2034 1,953 0.0026,248 Federal Home Loan Mortgage Corp. (FHLMC) USD 5.000% 01/04/2035 30,294 0.02845 Federal Home Loan Mortgage Corp. (FHLMC) USD 5.000% 01/11/2035 933 0.00
1,929 Federal Home Loan Mortgage Corp. (FHLMC) USD 5.000% 01/02/2037 2,217 0.00145,491 Federal Home Loan Mortgage Corp. (FHLMC) USD 5.000% 01/12/2038 168,977 0.1039,964 Federal Home Loan Mortgage Corp. (FHLMC)(d) USD 5.959% 15/07/2039 8,123 0.0122,589 Federal Home Loan Mortgage Corp. (FHLMC) USD 4.000% 01/02/2041 24,706 0.0112,909 Federal Home Loan Mortgage Corp. (FHLMC) USD 4.000% 01/02/2041 14,038 0.01141,162 Federal Home Loan Mortgage Corp. (FHLMC)(d) USD 6.059% 15/05/2048 16,307 0.01
1,000,001 Federal Home Loan Mortgage Corp. (FHLMC) USD 4.500% 01/07/2048 1,085,688 0.622,119,340 Federal Home Loan Mortgage Corp. (FHLMC) USD 4.500% 25/06/2050 290,506 0.17317,011 Federal Home Loan Mortgage Corp. (FHLMC) USD 3.000% 25/08/2050 38,999 0.02770,050 Federal Home Loan Mortgage Corp. (FHLMC) USD 2.000% 25/09/2050 66,024 0.04496,431 Federal Home Loan Mortgage Corp. (FHLMC) USD 4.000% 25/09/2050 68,231 0.04300,000 Federal National Mortgage Association (FNMA) USD 6.625% 15/11/2030 455,217 0.2636,007 Federal National Mortgage Association (FNMA)(d) USD 2.685% 01/07/2034 37,635 0.025,163 Federal National Mortgage Association (FNMA) USD 4.500% 01/05/2039 5,775 0.006,046 Federal National Mortgage Association (FNMA) USD 4.500% 01/05/2039 6,779 0.009,529 Federal National Mortgage Association (FNMA) USD 4.500% 01/06/2039 10,681 0.017,074 Federal National Mortgage Association (FNMA) USD 4.500% 01/08/2039 7,929 0.0136,691 Federal National Mortgage Association (FNMA) USD 4.500% 01/08/2041 41,062 0.0259,432 Federal National Mortgage Association (FNMA) USD 7.000% 25/07/2042 74,782 0.0417,342 Federal National Mortgage Association (FNMA) USD 7.000% 25/10/2042 21,347 0.0112,636 Federal National Mortgage Association (FNMA) USD 3.000% 01/12/2042 13,749 0.0118,587 Federal National Mortgage Association (FNMA) USD 3.000% 01/12/2042 20,260 0.0122,957 Federal National Mortgage Association (FNMA) USD 3.000% 01/01/2043 25,023 0.0118,580 Federal National Mortgage Association (FNMA) USD 3.000% 01/01/2043 20,252 0.0149,884 Federal National Mortgage Association (FNMA) USD 3.000% 01/01/2043 54,373 0.03
Goldman Sachs Funds—Global Fixed Income PortfolioSchedule of InvestmentsAs at 30 November 2020
The accompanying notes are an integral part of these financial statements.
297

Holdings Security Description Currency Interest Rate(a) Maturity Date(b)Market Value
USD
% ofShareholders’
Equity
Agencies Asset Backed Obligations – (Continued)United States – (Continued)
27,312 Federal National Mortgage Association (FNMA) USD 3.000% 01/04/2043 29,770 0.0212,519 Federal National Mortgage Association (FNMA) USD 3.000% 01/04/2043 13,646 0.0116,356 Federal National Mortgage Association (FNMA) USD 3.000% 01/04/2043 17,828 0.0158,931 Federal National Mortgage Association (FNMA) USD 3.000% 01/04/2043 64,235 0.0451,176 Federal National Mortgage Association (FNMA) USD 3.000% 01/04/2043 55,781 0.03226,318 Federal National Mortgage Association (FNMA)(d) USD 5.950% 25/06/2045 45,523 0.03
1,415,030 Federal National Mortgage Association (FNMA) USD 4.000% 01/01/2048 1,542,283 0.88481,571 Federal National Mortgage Association (FNMA)(d) USD 2.500% 25/03/2048 29,684 0.02878,828 Federal National Mortgage Association (FNMA) USD 4.000% 25/06/2048 136,235 0.08297,552 Federal National Mortgage Association (FNMA)(d) USD 6.050% 25/06/2048 40,197 0.02
1,000,000 Federal National Mortgage Association (FNMA) USD 4.500% 01/07/2048 1,085,687 0.62779,674 Federal National Mortgage Association (FNMA) USD 5.000% 01/11/2048 889,092 0.51694,192 Federal National Mortgage Association (FNMA) USD 2.000% 25/09/2050 59,520 0.03461,038 Federal National Mortgage Association (FNMA) USD 4.000% 25/09/2050 63,493 0.04
1,000,000 Federal National Mortgage Association (FNMA) TBA(g) USD 2.000% 14/12/2050 1,037,697 0.593,000,000 Federal National Mortgage Association (FNMA) TBA(g) USD 3.000% 14/12/2050 3,134,297 1.782,000,000 Federal National Mortgage Association (FNMA) TBA(g) USD 5.000% 14/12/2050 2,212,812 1.26
562 Government National Mortgage Association (GNMA)(d) USD 2.875% 20/06/2023 571 0.00338 Government National Mortgage Association (GNMA)(d) USD 2.250% 20/07/2023 344 0.00324 Government National Mortgage Association (GNMA)(d) USD 2.250% 20/08/2023 329 0.00738 Government National Mortgage Association (GNMA)(d) USD 2.250% 20/09/2023 747 0.00224 Government National Mortgage Association (GNMA)(d) USD 3.000% 20/03/2024 228 0.00
1,356 Government National Mortgage Association (GNMA)(d) USD 2.875% 20/04/2024 1,380 0.00704 Government National Mortgage Association (GNMA)(d) USD 2.875% 20/04/2024 721 0.00288 Government National Mortgage Association (GNMA)(d) USD 2.875% 20/05/2024 295 0.00608 Government National Mortgage Association (GNMA)(d) USD 2.875% 20/06/2024 620 0.00
1,349 Government National Mortgage Association (GNMA)(d) USD 2.875% 20/06/2024 1,373 0.00456 Government National Mortgage Association (GNMA)(d) USD 2.875% 20/06/2024 465 0.00782 Government National Mortgage Association (GNMA)(d) USD 2.250% 20/07/2024 794 0.00987 Government National Mortgage Association (GNMA)(d) USD 2.250% 20/07/2024 1,005 0.00
1,643 Government National Mortgage Association (GNMA)(d) USD 2.250% 20/08/2024 1,667 0.00809 Government National Mortgage Association (GNMA)(d) USD 2.250% 20/08/2024 824 0.00297 Government National Mortgage Association (GNMA)(d) USD 2.250% 20/09/2024 302 0.00466 Government National Mortgage Association (GNMA)(d) USD 2.250% 20/09/2024 473 0.00804 Government National Mortgage Association (GNMA)(d) USD 3.125% 20/11/2024 820 0.00295 Government National Mortgage Association (GNMA)(d) USD 3.125% 20/12/2024 300 0.00645 Government National Mortgage Association (GNMA)(d) USD 3.125% 20/12/2024 662 0.00536 Government National Mortgage Association (GNMA)(d) USD 3.000% 20/01/2025 547 0.00334 Government National Mortgage Association (GNMA)(d) USD 3.000% 20/02/2025 341 0.00
1,295 Government National Mortgage Association (GNMA)(d) USD 2.875% 20/05/2025 1,326 0.001,343 Government National Mortgage Association (GNMA)(d) USD 2.250% 20/07/2025 1,372 0.00471 Government National Mortgage Association (GNMA)(d) USD 3.000% 20/02/2026 481 0.0030 Government National Mortgage Association (GNMA)(d) USD 2.250% 20/07/2026 31 0.00775 Government National Mortgage Association (GNMA)(d) USD 3.000% 20/01/2027 793 0.00490 Government National Mortgage Association (GNMA)(d) USD 3.000% 20/01/2027 503 0.00525 Government National Mortgage Association (GNMA)(d) USD 3.000% 20/02/2027 537 0.00
1,881 Government National Mortgage Association (GNMA)(d) USD 2.875% 20/04/2027 1,927 0.002,181 Government National Mortgage Association (GNMA)(d) USD 2.875% 20/04/2027 2,235 0.00423 Government National Mortgage Association (GNMA)(d) USD 2.875% 20/05/2027 434 0.00606 Government National Mortgage Association (GNMA)(d) USD 2.875% 20/06/2027 621 0.00223 Government National Mortgage Association (GNMA)(d) USD 3.125% 20/11/2027 228 0.00641 Government National Mortgage Association (GNMA)(d) USD 3.125% 20/12/2027 655 0.00
1,433 Government National Mortgage Association (GNMA)(d) USD 3.000% 20/01/2028 1,469 0.00546 Government National Mortgage Association (GNMA)(d) USD 3.000% 20/02/2028 560 0.00518 Government National Mortgage Association (GNMA)(d) USD 3.000% 20/03/2028 531 0.00
2,813 Government National Mortgage Association (GNMA)(d) USD 2.250% 20/07/2029 2,883 0.001,507 Government National Mortgage Association (GNMA)(d) USD 2.250% 20/08/2029 1,542 0.00346 Government National Mortgage Association (GNMA)(d) USD 2.250% 20/09/2029 354 0.00802 Government National Mortgage Association (GNMA)(d) USD 3.125% 20/10/2029 823 0.00449 Government National Mortgage Association (GNMA)(d) USD 3.125% 20/10/2029 461 0.00637 Government National Mortgage Association (GNMA)(d) USD 3.125% 20/11/2029 654 0.00
1,194 Government National Mortgage Association (GNMA)(d) USD 3.125% 20/11/2029 1,225 0.00286 Government National Mortgage Association (GNMA)(d) USD 3.125% 20/12/2029 293 0.0058 Government National Mortgage Association (GNMA)(d) USD 3.125% 20/12/2029 59 0.00582 Government National Mortgage Association (GNMA)(d) USD 3.000% 20/01/2030 598 0.00247 Government National Mortgage Association (GNMA)(d) USD 3.000% 20/02/2030 254 0.00
1,597 Government National Mortgage Association (GNMA)(d) USD 3.000% 20/03/2030 1,642 0.00314 Government National Mortgage Association (GNMA)(d) USD 2.875% 20/04/2030 323 0.00
1,124 Government National Mortgage Association (GNMA)(d) USD 2.875% 20/04/2030 1,157 0.001,848 Government National Mortgage Association (GNMA)(d) USD 2.875% 20/05/2030 1,903 0.001,875 Government National Mortgage Association (GNMA)(d) USD 2.875% 20/05/2030 1,946 0.00
Goldman Sachs Funds—Global Fixed Income PortfolioSchedule of InvestmentsAs at 30 November 2020
The accompanying notes are an integral part of these financial statements.
298

Holdings Security Description Currency Interest Rate(a) Maturity Date(b)Market Value
USD
% ofShareholders’
Equity
Agencies Asset Backed Obligations – (Continued)United States – (Continued)
412 Government National Mortgage Association (GNMA)(d) USD 2.875% 20/06/2030 424 0.003,817 Government National Mortgage Association (GNMA)(d) USD 2.250% 20/07/2030 3,947 0.00787 Government National Mortgage Association (GNMA)(d) USD 2.250% 20/09/2030 814 0.00
1,078 Government National Mortgage Association (GNMA)(d) USD 3.125% 20/10/2030 1,107 0.0079,390 Government National Mortgage Association (GNMA)(d) USD 6.104% 20/02/2040 16,045 0.0136,662 Government National Mortgage Association (GNMA)(d) USD 6.004% 20/06/2043 7,374 0.00441,965 Government National Mortgage Association (GNMA)(d) USD 6.294% 20/07/2043 87,027 0.0543,300 Government National Mortgage Association (GNMA)(d) USD 5.954% 20/09/2043 8,624 0.01213,060 Government National Mortgage Association (GNMA)(d) USD 5.454% 20/09/2044 37,740 0.02236,994 Government National Mortgage Association (GNMA) USD 4.000% 20/01/2045 259,940 0.15325,971 Government National Mortgage Association (GNMA)(d) USD 5.564% 20/08/2045 56,723 0.03123,350 Government National Mortgage Association (GNMA)(d) USD 5.594% 20/08/2045 20,815 0.01347,589 Government National Mortgage Association (GNMA) USD 4.000% 20/10/2045 39,259 0.02137,866 Government National Mortgage Association (GNMA) USD 4.000% 20/04/2046 17,884 0.01116,335 Government National Mortgage Association (GNMA) USD 4.000% 20/10/2046 14,382 0.01431,242 Government National Mortgage Association (GNMA) USD 4.500% 20/05/2048 468,318 0.27119,195 Government National Mortgage Association (GNMA) USD 5.000% 20/08/2048 131,175 0.08431,961 Government National Mortgage Association (GNMA) USD 5.000% 20/10/2048 474,699 0.27490,378 Government National Mortgage Association (GNMA)(d) USD 6.054% 20/10/2048 82,766 0.05420,462 Government National Mortgage Association (GNMA) USD 5.000% 20/11/2048 462,063 0.26644,311 Government National Mortgage Association (GNMA) USD 6.004% 20/11/2048 103,164 0.06138,780 Government National Mortgage Association (GNMA) USD 5.000% 20/12/2048 151,750 0.09
2,147,119 Government National Mortgage Association (GNMA) USD 4.500% 20/01/2049 2,320,128 1.32648,778 Government National Mortgage Association (GNMA) USD 5.000% 20/01/2049 710,794 0.40194,228 Government National Mortgage Association (GNMA) USD 5.904% 20/01/2049 31,382 0.02163,628 Government National Mortgage Association (GNMA) USD 5.904% 20/01/2049 24,947 0.01105,360 Government National Mortgage Association (GNMA)(d) USD 3.644% 20/02/2049 9,275 0.0125,599 Government National Mortgage Association (GNMA) USD 4.500% 20/03/2049 27,710 0.02334,039 Government National Mortgage Association (GNMA) USD 5.000% 20/03/2049 365,515 0.21465,715 Government National Mortgage Association (GNMA) USD 3.124% 20/06/2049 37,701 0.02582,829 Government National Mortgage Association (GNMA) USD 4.000% 20/06/2049 622,091 0.35211,239 Government National Mortgage Association (GNMA)(d) USD 5.904% 20/08/2049 32,770 0.02103,207 Government National Mortgage Association (GNMA)(d) USD 5.954% 20/08/2049 16,198 0.01235,438 Government National Mortgage Association (GNMA)(d) USD 5.954% 20/09/2049 36,621 0.02223,580 Government National Mortgage Association (GNMA)(d) USD 5.954% 20/09/2049 31,632 0.02283,220 Government National Mortgage Association (GNMA) USD 3.500% 20/10/2049 32,812 0.02345,662 Government National Mortgage Association (GNMA) USD 3.500% 20/10/2049 31,105 0.02162,088 Government National Mortgage Association (GNMA) USD 4.000% 20/10/2049 19,320 0.01841,547 Government National Mortgage Association (GNMA) USD 4.500% 20/10/2049 908,903 0.52403,732 Government National Mortgage Association (GNMA) USD 3.500% 20/12/2049 43,176 0.03798,342 Government National Mortgage Association (GNMA) USD 4.500% 20/12/2049 859,620 0.49658,604 Government National Mortgage Association (GNMA)(d) USD 5.904% 20/02/2050 114,506 0.07999,901 Government National Mortgage Association (GNMA) USD 4.500% 20/03/2050 1,070,635 0.61649,178 Government National Mortgage Association (GNMA) USD 3.500% 20/04/2050 73,294 0.04352,411 Government National Mortgage Association (GNMA)(d) USD 5.904% 20/04/2050 62,716 0.04446,015 Government National Mortgage Association (GNMA) USD 5.000% 20/05/2050 45,517 0.03540,909 Government National Mortgage Association (GNMA) USD 4.000% 20/06/2050 71,406 0.04
1,157,111 Government National Mortgage Association (GNMA) USD 2.500% 20/10/2050 113,684 0.076,000,000 Government National Mortgage Association (GNMA) TBA(g) USD 2.000% 21/12/2050 6,263,629 3.563,000,000 Government National Mortgage Association (GNMA) TBA(g) USD 2.500% 21/12/2050 3,157,440 1.801,000,000 Government National Mortgage Association (GNMA) TBA(g) USD 3.000% 21/12/2050 1,044,125 0.594,000,000 Government National Mortgage Association (GNMA) TBA(g) USD 2.000% 21/01/2051 4,166,222 2.371,000,000 Government National Mortgage Association (GNMA) TBA(g) USD 2.500% 21/01/2051 1,050,097 0.60
39,755,515 22.62
TOTAL AGENCIES ASSET BACKED OBLIGATIONS(cost USD 38,999,676) 39,755,515 22.62
Non-Agencies Asset Backed Obligations – 5.80%Cayman Islands
476,644 Catamaran CLO 2013-1 Ltd. 144A(c)(d) USD 1.067% 27/01/2028 474,880 0.27650,000 Cedar Funding II CLO Ltd. 144A(c)(d) USD 1.472% 09/06/2030 650,248 0.37194,344 Cutwater 2014-I Ltd. 144A(c)(d) USD 1.487% 15/07/2026 194,071 0.11600,000 ICG US CLO Ltd. 2015-2R �A1� 144A(c)(d) USD 1.600% 16/01/2033 596,629 0.34900,000 Madison Park Funding XXX Ltd. 144A(c)(d) USD 0.987% 15/04/2029 892,685 0.51500,000 Marble Point CLO XVII Ltd. 144A(c)(d) USD 1.518% 20/04/2033 499,781 0.28650,000 Sounds Point CLO Ltd. 2013-3RA �A� 144A(c)(d) USD 1.368% 18/04/2031 644,823 0.37650,000 Tryon Park CLO Ltd. 144A(c)(d) USD 1.127% 15/04/2029 644,842 0.3735,990 WhiteHorse VIII Ltd. 2014-1A �AR� 144A(c)(d) USD 1.114% 01/05/2026 35,957 0.02
4,633,916 2.64
Goldman Sachs Funds—Global Fixed Income PortfolioSchedule of InvestmentsAs at 30 November 2020
The accompanying notes are an integral part of these financial statements.
299

Holdings Security Description Currency Interest Rate(a) Maturity Date(b)Market Value
USD
% ofShareholders’
Equity
Non-Agencies Asset Backed Obligations – (Continued)United Kingdom
94,194 Eurohome UK Mortgages 2007-2 Plc.(d) GBP 0.249% 15/09/2044 124,926 0.07312,498 Finsbury Square Plc. 2018-2 �A�(d) GBP 1.010% 12/09/2068 418,531 0.24151,886 Harben Finance 2017-1 Plc.(d) GBP 0.851% 20/08/2056 203,042 0.11473,864 Malt Hill No 2 Plc.(d) GBP 0.794% 27/11/2055 633,034 0.36433,677 Stratton Mortgage Funding 2019-1 Plc.(d) GBP 1.254% 25/05/2051 581,275 0.33246,047 Tower Bridge Funding NO 2 Plc.(d) GBP 0.957% 20/03/2056 328,978 0.19
2,289,786 1.30
United States403,900 Alternative Loan Trust 2006-39CB �2A4�(d) USD 0.600% 25/01/2037 29,870 0.02265,219 American Home Mortgage Assets Trust 2006-2 �1A1�(d) USD 1.703% 25/09/2046 255,791 0.1575,343 Banc of America Funding 2006-I Trust(d) USD 0.337% 20/10/2046 68,977 0.04200,000 Bank 2017-BNK4(d) USD 4.372% 15/05/2050 215,088 0.12100,000 Bank 2018-BNK15 144A(c) USD 3.000% 15/11/2061 77,471 0.04100,000 CFCRE Commercial Mortgage Trust 2016-C6 �D� 144A(c)(d) USD 4.345% 10/11/2049 79,529 0.05100,000 Citigroup Commercial Mortgage Trust 2017-P8 144A(c) USD 3.000% 15/09/2050 72,648 0.0430,064 GMACM Home Equity Loan Trust 2007-HE3(d) USD 7.000% 25/09/2037 31,012 0.0274,315 Goal Capital Funding Trust 2010-1 �A� 144A(c)(d) USD 0.907% 25/08/2048 73,745 0.04337,131 Higher Education Funding I 2014-1 �A� 144A(c)(d) USD 1.257% 25/05/2034 339,499 0.19236,303 Home Equity Asset Trust 2007-3 �2A3�(d) USD 0.390% 25/08/2037 226,629 0.13100,000 JPMDB Commercial Mortgage Securities Trust 2017-C7 144A(c) USD 3.000% 15/10/2050 77,011 0.04113,504 KnowledgeWorks Foundation 2010-1 �A�(d) USD 1.157% 25/02/2042 113,142 0.06397,097 Lehman Mortgage Trust 2006-5 �2A1�(d) USD 0.500% 25/09/2036 37,916 0.0297,680 Lehman XS Trust Series 2006-14N(d) USD 0.340% 25/09/2046 91,480 0.05216,838 Merrill Lynch First Franklin Mortgage Loan Trust Series 2007-3 �A2B�(d) USD 0.280% 25/06/2037 155,369 0.09277,547 PHEAA Student Loan Trust 2016-1 144A(c)(d) USD 1.300% 25/09/2065 278,459 0.16372,680 SLM Student Loan Trust 2003-1 144A(c)(d) USD 0.360% 15/12/2032 344,020 0.20487,139 SLM Student Loan Trust 2007-2(d) USD 0.275% 25/07/2022 467,427 0.2761,480 SLM Student Loan Trust 2008-2(d) USD 0.965% 25/04/2023 59,735 0.0399,668 SLM Student Loan Trust 2008-4(d) USD 1.865% 25/07/2022 99,548 0.06100,000 Wells Fargo Commercial Mortgage Trust 2017-C38 144A(c) USD 3.000% 15/07/2050 72,693 0.04
3,267,059 1.86
TOTAL NON-AGENCIES ASSET BACKED OBLIGATIONS(cost USD 10,662,583) 10,190,761 5.80
TOTAL TRANSFERABLE SECURITIES DEALT IN ANOTHER REGULATED MARKET(cost USD 75,852,988) 78,494,882 44.66
Other Transferable Securities
Bonds – 0.25%Canada
530,000 Province of Ontario Canada CAD 2.600% 02/06/2025 443,498 0.25
TOTAL BONDS(cost USD 405,854) 443,498 0.25
TOTAL OTHER TRANSFERABLE SECURITIES(cost USD 405,854) 443,498 0.25
Time Deposits – 4.08%
Netherlands7,165,029 Rabobank Nederland USD Time Deposit USD 0.030% 01/12/2020 7,165,029 4.08
TOTAL TIME DEPOSITS(cost USD 7,165,029) 7,165,029 4.08
MARKET VALUE OF INVESTMENTS EXCLUDING DERIVATIVES(cost USD 181,348,837) 191,686,667 109.06
Covered Forward Mortgage Backed Securities – (0.61%)(1,000,000) Federal National Mortgage Association (FNMA) TBA(g)(h) USD 4.000% 14/12/2050 (1,067,070) (0.61)
TOTAL COVERED FORWARD MORTGAGE BACKED SECURITIES(cost USD (1,068,828)) (1,067,070) (0.61)
Goldman Sachs Funds—Global Fixed Income PortfolioSchedule of InvestmentsAs at 30 November 2020
The accompanying notes are an integral part of these financial statements.
300

Futures Contracts – 0.14%
Number ofContracts Security Description
CommitmentMarket Value
USD
UnrealisedGainUSD
% ofShareholders’
Equity
AUD15 Australian Treasury Bonds 10YR Futures 15/12/2020 Long 1,646,084 1,253 0.00
EUR6 Euro BTP Italian Government Bond Futures 08/12/2020 Long 1,089,671 41,312 0.0227 Euro OAT Futures 08/12/2020 Long 5,503,343 77,695 0.0516 German Federal Republic Bonds 2YR Futures 08/12/2020 Long 2,155,927 1,631 0.005 German Federal Republic Bonds 30YR Futures 08/12/2020 Long 1,358,970 48,918 0.0348 German Federal Republic Bonds 5Y Futures 08/12/2020 Long 7,796,691 23,895 0.0115 Short Euro Italian Government Bond Futures 08/12/2020 Long 2,051,410 19,145 0.01
19,956,012 212,596 0.12
GBP17 UK Long Gilt Bond Futures 29/03/2021 Long 3,055,465 7,221 0.01
JPY5 Japan Government Bonds 10YR Futures 14/12/2020 Long 7,291,257 5,755 0.00
USD70 US Treasury Long Bond Futures 22/03/2021 Long 12,230,312 3,949 0.00187 US Treasury Notes 10YR Futures 22/03/2021 Long 25,826,453 46,687 0.036 US Treasury Ultra Long Bond Futures 22/03/2021 Long 1,293,938 425 0.00
39,350,703 51,061 0.03
UNREALISED GAIN ON FUTURES CONTRACTS 277,886 0.16
Number ofContracts Security Description
CommitmentMarket Value
USD
UnrealisedLossUSD
% ofShareholders’
Equity
AUD21 Australian Treasury Bonds 3YR Futures 15/12/2020 Long 1,819,686 (253) (0.00)
CAD16 Canadian Government Bond 10YR Futures 22/03/2021 Long 1,839,688 (4,921) (0.01)
USD(27) US Treasury Notes 2YR Futures 31/03/2021 Short (5,962,359) (1,688) (0.00)(3) US Treasury Notes 5YR Futures 31/03/2021 Short (377,977) (95) (0.00)(77) US Treasury Ultra Long Notes 10YR Futures 22/03/2021 Short (12,089,000) (19,014) (0.01)
(18,429,336) (20,797) (0.01)
UNREALISED LOSS ON FUTURES CONTRACTS (25,971) (0.02)
Forward Currency Contracts – 0.35%
CurrencyAmountBought Currency
AmountSold
MaturityDate
UnrealisedGainUSD
% ofShareholders’
Equity
SGD 349,218 USD 257,390 07/12/2020 3,716 0.00CZK 3,318,446 USD 144,367 09/12/2020 7,383 0.01CHF 773,143 USD 846,413 10/12/2020 9,147 0.01MXN 5,346,860 USD 246,735 10/12/2020 19,333 0.01NOK 1,481,236 USD 160,931 10/12/2020 7,363 0.01SEK 6,571,000 USD 745,729 10/12/2020 28,946 0.02AUD 2,611,179 USD 1,858,794 21/12/2020 68,260 0.04CAD 4,248,982 USD 3,201,582 21/12/2020 84,188 0.05PLN 915,741 USD 239,315 21/12/2020 6,246 0.00JPY 998,939,977 USD 9,439,580 23/12/2020 146,688 0.08NZD 306,629 USD 202,250 24/12/2020 13,794 0.01IDR 953,597,506 USD 64,467 06/01/2021 2,726 0.00USD 261,301 IDR 3,695,584,971 06/01/2021 900 0.00GBP 1,808,043 USD 2,330,636 13/01/2021 88,820 0.05EUR 12,365,485 USD 14,630,110 21/01/2021 225,521 0.12MYR 1,442,525 USD 347,245 26/01/2021 6,497 0.00CNH 15,626,576 USD 2,356,754 24/02/2021 5,883 0.00
UNREALISED GAIN ON FORWARD CURRENCY CONTRACTS 725,411 0.41
Goldman Sachs Funds—Global Fixed Income PortfolioSchedule of InvestmentsAs at 30 November 2020
The accompanying notes are an integral part of these financial statements.
301

Forward Currency Contracts – (Continued)
CurrencyAmountBought Currency
AmountSold
MaturityDate
UnrealisedLossUSD
% ofShareholders’
Equity
USD 1,037,883 THB 32,706,288 16/12/2020 (43,203) (0.03)USD 428,292 CAD 569,528 21/12/2020 (12,127) (0.01)USD 983,097 JPY 104,105,376 23/12/2020 (15,944) (0.01)USD 2,966,318 EUR 2,498,315 21/01/2021 (35,106) (0.01)
UNREALISED LOSS ON FORWARD CURRENCY CONTRACTS (106,380) (0.06)
Options – (0.05%)
Holdings Security Description
UnrealisedGain/(Loss)
USDMarket Value
USD
% ofShareholders’
Equity
Purchased OptionsUSD
770,000 Call 3 month LIBOR Swaption Expires 15/01/2021 Strike 0.61 (3,404) 793 0.00800,000 Call 3 month LIBOR Swaption Expires 12/02/2021 Strike 0.83 1,869 6,109 0.00690,000 Call 3 month LIBOR Swaption Expires 16/02/2021 Strike 0.78 765 4,206 0.00
6,000,000 Call 3 month LIBOR Swaption Expires 17/03/2021 Strike 1.10 (46,009) 25,991 0.023,100,000 Call 3 month LIBOR Swaption Expires 14/11/2022 Strike 0.70 3,647 35,024 0.02
(43,132) 72,123 0.04
TOTAL PURCHASED OPTIONS(cost USD 115,254) 72,123 0.04
Written OptionsEUR
(1,540,000) Call 6 month EURIBOR Swaption Expires 30/11/2020 Strike 0.15 (3,486) (19,040) (0.01)(490,000) Call 6 month EURIBOR Swaption Expires 01/12/2020 Strike 0.15 (979) (6,047) (0.00)(330,000) Call 6 month EURIBOR Swaption Expires 02/12/2020 Strike 0.15 (317) (4,065) (0.00)
(1,350,000) Call 6 month EURIBOR Swaption Expires 02/12/2020 Strike 0.20 3,881 (8,391) (0.01)(1,010,000) Call 6 month EURIBOR Swaption Expires 03/12/2020 Strike 0.20 3,887 (6,283) (0.01)(700,000) Call 6 month EURIBOR Swaption Expires 14/01/2021 Strike 0.25 3,015 (3,296) (0.00)(700,000) Call 6 month EURIBOR Swaption Expires 14/01/2021 Strike 0.25 3,056 (3,296) (0.00)(930,000) Call 6 month EURIBOR Swaption Expires 15/01/2021 Strike 0.39 3,103 (682) (0.00)(970,000) Call 6 month EURIBOR Swaption Expires 12/02/2021 Strike 0.26 (1,601) (5,446) (0.00)(850,000) Call 6 month EURIBOR Swaption Expires 16/02/2021 Strike 0.29 (417) (3,608) (0.00)
(1,540,000) Put 6 month EURIBOR Swaption Expires 30/11/2020 Strike 0.10 4,941 (0) (0.00)(490,000) Put 6 month EURIBOR Swaption Expires 01/12/2020 Strike 0.10 1,406 (0) (0.00)(330,000) Put 6 month EURIBOR Swaption Expires 02/12/2020 Strike 0.10 742 (0) (0.00)(700,000) Put 6 month EURIBOR Swaption Expires 14/01/2021 Strike 0.00 1,962 (237) (0.00)(700,000) Put 6 month EURIBOR Swaption Expires 14/01/2021 Strike 0.00 1,962 (237) (0.00)
21,155 (60,628) (0.03)
USD(960,000) Call 3 month LIBOR Swaption Expires 30/11/2020 Strike 0.82 2,760 (0) (0.00)(960,000) Call 3 month LIBOR Swaption Expires 14/12/2020 Strike 0.90 (1,753) (6,697) (0.01)(960,000) Call 3 month LIBOR Swaption Expires 21/12/2020 Strike 0.87 335 (5,353) (0.00)(960,000) Call 3 month LIBOR Swaption Expires 29/12/2020 Strike 0.86 (188) (5,780) (0.00)
(6,100,000) Call 3 month LIBOR Swaption Expires 06/01/2021 Strike 0.28 5,923 (787) (0.00)(6,060,000) Call 3 month LIBOR Swaption Expires 20/01/2021 Strike 0.31 4,831 (2,138) (0.00)(6,000,000) Call 3 month LIBOR Swaption Expires 17/03/2021 Strike 0.70 21,321 (6,070) (0.00)(6,000,000) Call 3 month LIBOR Swaption Expires 17/03/2021 Strike 0.90 35,152 (12,848) (0.01)(600,000) Call 3 month LIBOR Swaption Expires 14/11/2022 Strike 1.06 (4,560) (35,725) (0.02)(960,000) Put 3 month LIBOR Swaption Expires 30/11/2020 Strike 0.82 (183) (2,943) (0.00)(960,000) Put 3 month LIBOR Swaption Expires 14/12/2020 Strike 0.90 2,734 (2,210) (0.00)(960,000) Put 3 month LIBOR Swaption Expires 21/12/2020 Strike 0.87 1,097 (4,591) (0.00)(960,000) Put 3 month LIBOR Swaption Expires 29/12/2020 Strike 0.86 98 (5,494) (0.00)
(6,100,000) Put 3 month LIBOR Swaption Expires 06/01/2021 Strike 0.48 8,815 (6,587) (0.01)(6,060,000) Put 3 month LIBOR Swaption Expires 20/01/2021 Strike 0.51 10,337 (6,631) (0.01)
86,719 (103,854) (0.06)
TOTAL WRITTEN OPTIONS(cost USD (272,355)) (164,482) (0.09)
TOTAL OPTIONS(cost USD (157,101)) (92,359) (0.05)
Goldman Sachs Funds—Global Fixed Income PortfolioSchedule of InvestmentsAs at 30 November 2020
The accompanying notes are an integral part of these financial statements.
302

Swap Contracts – 0.01%Net LocalNotionalAmount Pay Receive Currency Maturity Date
UnrealisedGainUSD
% ofShareholders’
Equity
Interest Rate Swaps4,280,000 Floating (AUD 6 month BBSW) Fixed 0.553% AUD 16/05/2025 17,874 0.011,770,000 Floating (AUD 6 month BBSW) Fixed 0.500% AUD 25/11/2025 858 0.001,880,000 Floating (AUD 6 month BBSW) Fixed 1.550% AUD 12/11/2030 2,126 0.005,500,000 Floating (BRL 1 month BRCDI) Fixed 4.120% BRL 03/01/2022 5,085 0.002,260,000 Fixed 1.430% Floating (CAD 3 month CDOR) CAD 09/11/2030 61 0.00580,000 Floating (CHF 6 month LIBOR) Fixed 0.000% CHF 16/12/2025 210 0.00
1,040,000 Fixed 0.000% Floating (CHF 6 month LIBOR) CHF 17/09/2030 1,651 0.001,800,000 Floating (EUR 6 month LIBOR) Fixed 0.000% EUR 16/12/2022 3,177 0.004,190,000 Fixed 0.000% Floating (EUR 12 month LIBOR) EUR 19/11/2024 229 0.00180,000 Floating (EUR 6 month EURIBOR) Fixed 0.080% EUR 15/01/2025 3,852 0.00
7,630,000 Fixed 0.000% Floating (EUR 12 month LIBOR) EUR 16/12/2025 5,983 0.014,540,000 Fixed 0.000% Floating (EUR 12 month LIBOR) EUR 16/12/2027 23,246 0.013,180,000 Floating (EUR 6 month EURIBOR) Fixed 0.050% EUR 21/05/2030 12,362 0.011,520,000 Fixed 0.260% Floating (EUR 6 month EURIBOR) EUR 21/05/2040 449 0.001,420,000 Fixed 0.500% Floating (EUR 6 month EURIBOR) EUR 20/06/2050 1,927 0.00190,000 Fixed 0.750% Floating (GBP 6 month LIBOR) GBP 16/12/2030 772 0.00370,000 Floating (GBP 6 month LIBOR) Fixed 1.500% GBP 19/06/2040 8,100 0.01480,000 Floating (GBP 6 month LIBOR) Fixed 1.000% GBP 20/06/2050 9,111 0.01
20,465,000 Floating (MXN 1 month TIIE) Fixed 4.500% MXN 14/12/2022 995 0.0019,040,000 Floating (MXN 1 month TIIE) Fixed 5.100% MXN 10/12/2025 5,746 0.011,780,000 Floating (MYR 3 month KLIBOR) Fixed 3.650% MYR 27/02/2024 21,673 0.0121,570,000 Fixed 1.240% Floating (NOK 6 month NIBOR) NOK 29/10/2030 22,528 0.016,560,000 Floating (NOK 6 month NIBOR) Fixed 1.000% NOK 18/03/2031 20 0.003,660,000 Floating (PLN 6 month WIBOR) Fixed 0.345% PLN 16/06/2023 226 0.001,620,000 Floating (PLN 6 month WIBOR) Fixed 0.750% PLN 16/12/2025 2,744 0.00180,000 Floating (SGD 6 month SORF6) Fixed 1.250% SGD 16/09/2030 3,105 0.00
5,970,000 Fixed 0.750% Floating (USD 3 month LIBOR) USD 16/12/2023 5,098 0.002,530,000 Fixed 1.543% Floating (USD 3 month LIBOR) USD 25/11/2035 2,563 0.00340,000 Floating (USD 3 month LIBOR) Fixed 1.500% USD 02/12/2050 1,283 0.00
UNREALISED GAIN ON INTEREST RATE SWAPS 163,054 0.09
Credit Default Swaps3,900,000 Floating (The Markit CDX North America
Investment Grade 34 Index)Fixed 1.000% USD 20/06/2023 15,589 0.01
330,000 Floating (Colombia GovernmentInternational Bond)
Fixed 1.000% USD 20/06/2024 6,059 0.00
270,000 Floating (Indonesia GovernmentInternational Bond)
Fixed 1.000% USD 20/06/2024 4,423 0.00
200,000 Floating (Saudi GovernmentInternational Bond)
Fixed 1.000% USD 20/06/2024 3,151 0.00
200,000 Floating (Russian Foreign Bond -Eurobond)
Fixed 1.000% USD 20/12/2024 4,430 0.00
8,650,000 Floating (The Markit CDX North AmericaInvestment Grade 34 Index)
Fixed 1.000% USD 20/06/2025 69,724 0.04
450,000 Floating (The Markit CMBX NorthAmerica BBB- 11 Index)
Fixed 3.000% USD 18/11/2054 45,943 0.03
400,000 Floating (The Markit CMBX NorthAmerica BBB- 11 Index)
Fixed 3.000% USD 18/11/2054 14,974 0.01
250,000 Floating (The Markit CMBX NorthAmerica BBB- 8 Index)
Fixed 3.000% USD 17/10/2057 15,742 0.01
200,000 Floating (The Markit CMBX NorthAmerica BBB- 10 Index)
Fixed 3.000% USD 17/11/2059 12,987 0.01
UNREALISED GAIN ON CREDIT DEFAULT SWAPS 193,022 0.11
TOTAL UNREALISED GAIN ON SWAP CONTRACTS 356,076 0.20
Net LocalNotionalAmount Pay Receive Currency Maturity Date
UnrealisedLossUSD
% ofShareholders’
Equity
Interest Rate Swaps7,030,000 Floating (AUD 6 month BBSW) Fixed 0.920% AUD 04/09/2028 (7,092) (0.00)2,510,000 Floating (AUD 6 month BBSW) Fixed 1.240% AUD 28/10/2030 (18,754) (0.01)3,960,000 Floating (AUD 6 month BBSW) Fixed 1.250% AUD 09/11/2030 (6,929) (0.00)1,170,000 Floating (AUD 6 month BBSW) Fixed 1.000% AUD 16/12/2030 (3,599) (0.00)275,000 Floating (BRL 1 month BRCDI) Fixed 4.230% BRL 02/01/2023 (129) (0.00)
3,245,000 Floating (BRL 1 month BRCDI) Fixed 4.930% BRL 02/01/2024 (9,252) (0.01)9,000,000 Floating (CAD 3 month CDOR) Fixed 0.700% CAD 18/11/2023 (798) (0.00)8,870,000 Floating (CAD 3 month CDOR) Fixed 1.250% CAD 16/12/2023 (95) (0.00)8,230,000 Floating (CAD 3 month CDOR) Fixed 0.810% CAD 30/09/2024 (12,051) (0.01)11,310,000 Floating (CAD 3 month CDOR) Fixed 0.960% CAD 09/11/2024 (5,816) (0.00)
Goldman Sachs Funds—Global Fixed Income PortfolioSchedule of InvestmentsAs at 30 November 2020
The accompanying notes are an integral part of these financial statements.
303

Swap Contracts – (Continued)
Net LocalNotionalAmount Pay Receive Currency Maturity Date
UnrealisedLossUSD
% ofShareholders’
Equity
Interest Rate Swaps – (Continued)5,120,000 Floating (CAD 3 month CDOR) Fixed 0.812% CAD 17/11/2024 (1,710) (0.00)1,700,000 Floating (CAD 3 month CDOR) Fixed 1.500% CAD 19/03/2031 (3,812) (0.00)4,820,000 Floating (CHF 6 month LIBOR) Fixed 0.000% CHF 16/12/2027 (2,856) (0.00)220,000 Floating (CHF 6 month LIBOR) Fixed 0.000% CHF 16/12/2030 (247) (0.00)
6,590,000 Fixed 2.500% Floating (CNY 3 month LIBOR) CNY 17/03/2023 (1,115) (0.00)3,220,000 Fixed 0.000% Floating (EUR 12 month LIBOR) EUR 18/05/2025 (705) (0.00)3,310,000 Fixed 0.000% Floating (EUR 6 month LIBOR) EUR 16/12/2025 (7,670) (0.01)1,680,000 Fixed 0.000% Floating (EUR 6 month LIBOR) EUR 16/12/2027 (8,785) (0.01)6,680,000 Fixed 0.250% Floating (EUR 6 month EURIBOR) EUR 18/06/2030 (46,190) (0.03)3,360,000 Fixed 0.000% Floating (EUR 6 month LIBOR) EUR 16/12/2030 (27,361) (0.02)180,000 Fixed 0.000% Floating (EUR 6 month EURIBOR) EUR 16/12/2035 (2,246) (0.00)
1,550,000 Fixed 0.750% Floating (EUR 6 month EURIBOR) EUR 19/06/2040 (5,166) (0.00)740,000 Fixed 0.250% Floating (EUR 6 month EURIBOR) EUR 16/12/2040 (8,307) (0.01)310,000 Fixed 0.100% Floating (EUR 6 month EURIBOR) EUR 02/12/2050 (64) (0.00)580,000 Fixed 0.250% Floating (EUR 6 month EURIBOR) EUR 16/12/2050 (2,606) (0.00)
1,120,000 Floating (GBP 6 month LIBOR) Fixed 0.500% GBP 16/12/2025 (2,074) (0.00)61,050,000 Fixed 0.250% Floating (JPY 6 month LIBOR) JPY 19/03/2030 (678) (0.00)700,400,000 Fixed 0.144% Floating (JPY 6 month LIBOR) JPY 13/11/2030 (2,196) (0.00)60,140,000 Fixed 0.500% Floating (JPY 6 month LIBOR) JPY 19/03/2041 (3,098) (0.00)28,120,000 Fixed 0.500% Floating (JPY 6 month LIBOR) JPY 20/06/2050 (1,839) (0.00)24,240,000 Floating (NOK 6 month NIBOR) Fixed 0.750% NOK 16/12/2025 (17,924) (0.01)960,000 Floating (NZD 3 month NZDBB) Fixed 1.750% NZD 19/03/2030 (702) (0.00)
7,980,000 Fixed 0.250% Floating (PLN 3 month WIBOR) PLN 16/12/2021 (944) (0.00)43,430,000 Floating (SEK 3 month STIBOR) Fixed 0.000% SEK 16/12/2025 (6,575) (0.00)5,090,000 Fixed 0.750% Floating (SEK 3 month STIBOR) SEK 18/06/2030 (1,812) (0.00)20,180,000 Floating (THB 6 month LIBOR) Fixed 0.750% THB 16/12/2025 (1,112) (0.00)8,360,000 Floating (USD 1 month LIBOR) Floating (USD 3 month LIBOR) USD 25/07/2024 (2,655) (0.00)4,950,000 Floating (USD 3 month SOFR) Floating (USD 3 month LIBOR) USD 10/11/2024 (3,709) (0.00)390,000 Floating (USD 3 month LIBOR) Fixed 1.000% USD 16/12/2025 (1,558) (0.00)
4,800,000 Floating (USD 3 month LIBOR) Fixed 1.750% USD 18/06/2030 (39,265) (0.02)2,830,000 Fixed 1.190% Floating (USD 3 month LIBOR) USD 10/11/2030 (7,925) (0.01)2,310,000 Floating (USD 3 month LIBOR) Fixed 1.245% USD 24/11/2030 (1,110) (0.00)440,000 Fixed 1.000% Floating (USD 3 month LIBOR) USD 16/12/2030 (1,413) (0.00)
1,200,000 Floating (USD 3 month LIBOR) Fixed 1.750% USD 19/06/2040 (15,866) (0.01)1,170,000 Floating (USD 3 month LIBOR) Fixed 1.750% USD 20/06/2050 (9,573) (0.01)12,000,000 Floating (ZAR 3 month JIBAR) Fixed 4.000% ZAR 16/06/2023 (5,421) (0.00)15,340,000 Floating (ZAR 3 month JIBAR) Fixed 5.250% ZAR 17/03/2026 (9,571) (0.01)
UNREALISED LOSS ON INTEREST RATE SWAPS (320,375) (0.18)
Credit Default Swaps200,000 Floating (Unibail-Rodamco-Westfield
S.E.)Fixed 1.000% EUR 20/06/2024 (4,764) (0.00)
1,080,000 Fixed 1.000% Floating (China GovernmentInternational Bond)
USD 20/12/2020 (647) (0.00)
50,000 Fixed 1.000% Floating (China GovernmentInternational Bond)
USD 20/12/2020 (31) (0.00)
20,000 Fixed 1.000% Floating (China GovernmentInternational Bond)
USD 20/12/2020 (12) (0.00)
20,000 Fixed 1.000% Floating (China GovernmentInternational Bond)
USD 20/12/2020 (12) (0.00)
1,100,000 Fixed 1.000% Floating (China GovernmentInternational Bond)
USD 20/12/2020 (669) (0.00)
90,000 Fixed 1.000% Floating (China GovernmentInternational Bond)
USD 20/12/2020 (52) (0.00)
140,000 Fixed 1.000% Floating (China GovernmentInternational Bond)
USD 20/12/2020 (79) (0.00)
60,000 Fixed 1.000% Floating (China GovernmentInternational Bond)
USD 20/06/2021 (384) (0.00)
50,000 Fixed 1.000% Floating (China GovernmentInternational Bond)
USD 20/06/2021 (314) (0.00)
10,000 Fixed 1.000% Floating (China GovernmentInternational Bond)
USD 20/06/2021 (63) (0.00)
90,000 Fixed 1.000% Floating (China GovernmentInternational Bond)
USD 20/06/2021 (562) (0.00)
Goldman Sachs Funds—Global Fixed Income PortfolioSchedule of InvestmentsAs at 30 November 2020
The accompanying notes are an integral part of these financial statements.
304

Swap Contracts – (Continued)
Net LocalNotionalAmount Pay Receive Currency Maturity Date
UnrealisedLossUSD
% ofShareholders’
Equity
Credit Default Swaps – (Continued)5,800,000 Floating (The Markit CDX North America
Investment Grade 28 Version 1 Index)Fixed 1.000% USD 20/06/2022 (18,460) (0.01)
100,000 Floating (The Markit CMBX NorthAmerica BBB- 11 Index)
Fixed 3.000% USD 18/11/2054 (196) (0.00)
UNREALISED LOSS ON CREDIT DEFAULT SWAPS (26,245) (0.01)
TOTAL UNREALISED LOSS ON SWAP CONTRACTS (346,620) (0.19)
MARKET VALUE OF INVESTMENTS(cost USD 180,122,908)
191,407,640 108.90
OTHER ASSETS AND LIABILITIES (15,642,629) (8.90)
SHAREHOLDERS’ EQUITY 175,765,011 100.00
TOTAL INVESTMENTSMarket Value
USD
% ofShareholders’
Equity
Total Investments excluding derivatives (cost USD 181,348,837) 191,686,667 109.06Market value of covered forward mortgage backed securities (cost USD (1,068,828)) (1,067,070) (0.61)Unrealised gain on futures contracts 277,886 0.16Unrealised loss on futures contracts (25,971) (0.02)Unrealised gain on forward currency contracts 725,411 0.41Unrealised loss on forward currency contracts (106,380) (0.06)Market value of purchased options (cost USD 115,254) 72,123 0.04Market value of written options (cost USD (272,355)) (164,482) (0.09)Unrealised gain on swap contracts 356,076 0.20Unrealised loss on swap contracts (346,620) (0.19)Other Assets and Liabilities (15,642,629) (8.90)
Shareholders’ Equity 175,765,011 100.00
The Futures Commission Merchant was Goldman Sachs & Co. LLC.
The counterparties for forward currency contracts were Bank of America N.A., Barclays Bank Plc., BNP Paribas S.A., Citibank N.A., Deutsche Bank AG, HSBC Bank Plc., JP MorganChase Bank N.A., Morgan Stanley & Co. International Plc., Royal Bank of Canada, Standard Chartered Bank, State Street Bank & Trust, UBS AG and Westpac Banking Corp.
The counterparties for options contracts were Bank of America N.A., Citibank N.A., Deutsche Bank AG, JP Morgan Chase Bank N.A., Morgan Stanley & Co. International Plc. and UBSAG.
The counterparties for swap contracts were Bank of America N.A., Barclays Capital, Inc., Citibank N.A., Credit Suisse, HSBC Bank Plc., JP Morgan Chase Bank N.A. and Morgan Stanley& Co. International Plc.
The maximum individual counterparty exposure as at 30 November 2020 is 0.26% of the NAV.
(a) Interest rates represent either the stated coupon rate, annualised discounted yield on date of purchase for discounted securities, or, for floating rate securities, the current reset ratewhich is based upon interest rates indices.
(b) Maturity dates represent either the stated date on the security, or the next interest reset date for floating rate securities or the prerefunded date for those type of securities.(c) 144A: This security is issued to qualified institutional investors, pursuant to private placements, and is transferable as stated in rule 144A of the US Securities Act of 1933.(d) Variable and floating coupon rates are those quoted as of 30 November 2020.(e) A related party to Goldman Sachs Funds.(f) The yield for this fund as at 30 November 2020 was 0.120%.(g) TBA (To Be Announced) Securities are purchased on a forward commitment basis with an approximate (generally +/-2.5%) principal amount and no defined maturity date. The actual
principal amount and maturity date will be determined upon settlement when the specific mortgage pools are assigned.(h) These represent TBA sales covered by long FNMA positions. These amounts are disclosed separately as Covered Forward Mortgage Backed Securities in the Statement of Assets
and Liabilities.
Goldman Sachs Funds—Global Fixed Income PortfolioSchedule of InvestmentsAs at 30 November 2020
The accompanying notes are an integral part of these financial statements.
305
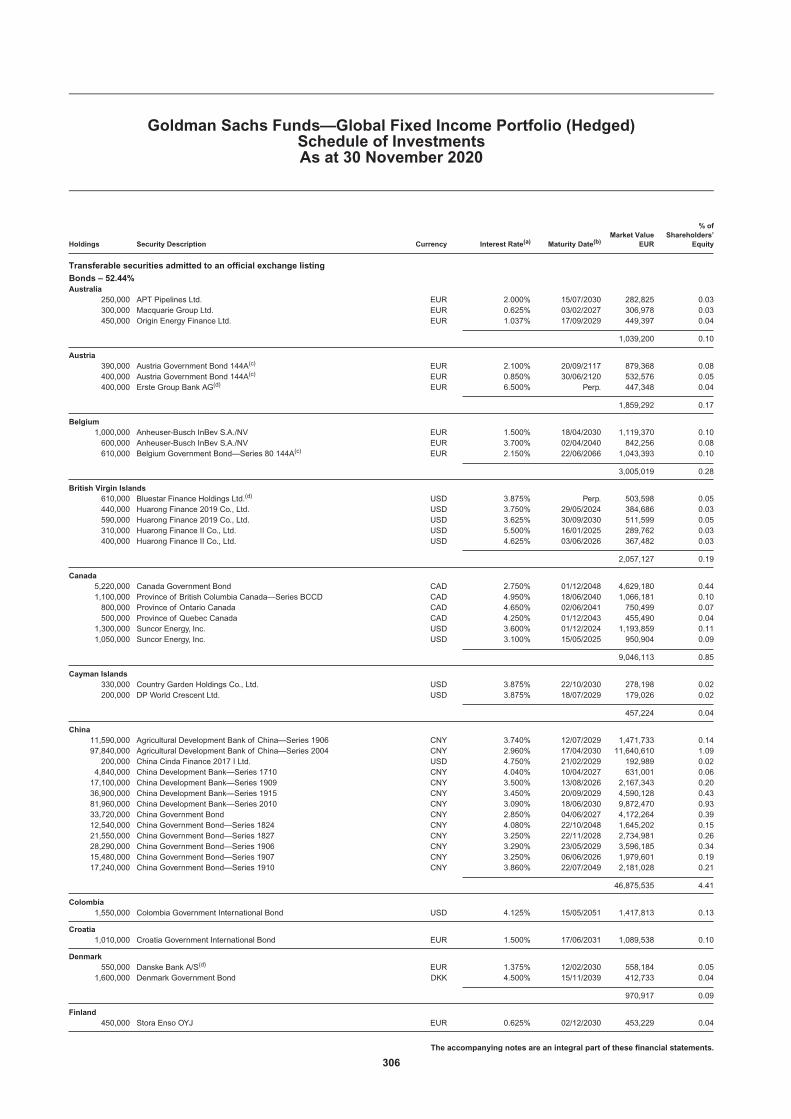
Holdings Security Description Currency Interest Rate(a) Maturity Date(b)Market Value
EUR
% ofShareholders’
Equity
Transferable securities admitted to an official exchange listing
Bonds – 52.44%Australia
250,000 APT Pipelines Ltd. EUR 2.000% 15/07/2030 282,825 0.03300,000 Macquarie Group Ltd. EUR 0.625% 03/02/2027 306,978 0.03450,000 Origin Energy Finance Ltd. EUR 1.037% 17/09/2029 449,397 0.04
1,039,200 0.10
Austria390,000 Austria Government Bond 144A(c) EUR 2.100% 20/09/2117 879,368 0.08400,000 Austria Government Bond 144A(c) EUR 0.850% 30/06/2120 532,576 0.05400,000 Erste Group Bank AG(d) EUR 6.500% Perp. 447,348 0.04
1,859,292 0.17
Belgium1,000,000 Anheuser-Busch InBev S.A./NV EUR 1.500% 18/04/2030 1,119,370 0.10600,000 Anheuser-Busch InBev S.A./NV EUR 3.700% 02/04/2040 842,256 0.08610,000 Belgium Government Bond—Series 80 144A(c) EUR 2.150% 22/06/2066 1,043,393 0.10
3,005,019 0.28
British Virgin Islands610,000 Bluestar Finance Holdings Ltd.(d) USD 3.875% Perp. 503,598 0.05440,000 Huarong Finance 2019 Co., Ltd. USD 3.750% 29/05/2024 384,686 0.03590,000 Huarong Finance 2019 Co., Ltd. USD 3.625% 30/09/2030 511,599 0.05310,000 Huarong Finance II Co., Ltd. USD 5.500% 16/01/2025 289,762 0.03400,000 Huarong Finance II Co., Ltd. USD 4.625% 03/06/2026 367,482 0.03
2,057,127 0.19
Canada5,220,000 Canada Government Bond CAD 2.750% 01/12/2048 4,629,180 0.441,100,000 Province of British Columbia Canada—Series BCCD CAD 4.950% 18/06/2040 1,066,181 0.10800,000 Province of Ontario Canada CAD 4.650% 02/06/2041 750,499 0.07500,000 Province of Quebec Canada CAD 4.250% 01/12/2043 455,490 0.04
1,300,000 Suncor Energy, Inc. USD 3.600% 01/12/2024 1,193,859 0.111,050,000 Suncor Energy, Inc. USD 3.100% 15/05/2025 950,904 0.09
9,046,113 0.85
Cayman Islands330,000 Country Garden Holdings Co., Ltd. USD 3.875% 22/10/2030 278,198 0.02200,000 DP World Crescent Ltd. USD 3.875% 18/07/2029 179,026 0.02
457,224 0.04
China11,590,000 Agricultural Development Bank of China—Series 1906 CNY 3.740% 12/07/2029 1,471,733 0.1497,840,000 Agricultural Development Bank of China—Series 2004 CNY 2.960% 17/04/2030 11,640,610 1.09200,000 China Cinda Finance 2017 I Ltd. USD 4.750% 21/02/2029 192,989 0.02
4,840,000 China Development Bank—Series 1710 CNY 4.040% 10/04/2027 631,001 0.0617,100,000 China Development Bank—Series 1909 CNY 3.500% 13/08/2026 2,167,343 0.2036,900,000 China Development Bank—Series 1915 CNY 3.450% 20/09/2029 4,590,128 0.4381,960,000 China Development Bank—Series 2010 CNY 3.090% 18/06/2030 9,872,470 0.9333,720,000 China Government Bond CNY 2.850% 04/06/2027 4,172,264 0.3912,540,000 China Government Bond—Series 1824 CNY 4.080% 22/10/2048 1,645,202 0.1521,550,000 China Government Bond—Series 1827 CNY 3.250% 22/11/2028 2,734,981 0.2628,290,000 China Government Bond—Series 1906 CNY 3.290% 23/05/2029 3,596,185 0.3415,480,000 China Government Bond—Series 1907 CNY 3.250% 06/06/2026 1,979,601 0.1917,240,000 China Government Bond—Series 1910 CNY 3.860% 22/07/2049 2,181,028 0.21
46,875,535 4.41
Colombia1,550,000 Colombia Government International Bond USD 4.125% 15/05/2051 1,417,813 0.13
Croatia1,010,000 Croatia Government International Bond EUR 1.500% 17/06/2031 1,089,538 0.10
Denmark550,000 Danske Bank A/S(d) EUR 1.375% 12/02/2030 558,184 0.05
1,600,000 Denmark Government Bond DKK 4.500% 15/11/2039 412,733 0.04
970,917 0.09
Finland450,000 Stora Enso OYJ EUR 0.625% 02/12/2030 453,229 0.04
Goldman Sachs Funds—Global Fixed Income Portfolio (Hedged)Schedule of InvestmentsAs at 30 November 2020
The accompanying notes are an integral part of these financial statements.
306

Holdings Security Description Currency Interest Rate(a) Maturity Date(b)Market Value
EUR
% ofShareholders’
Equity
Bonds – (Continued)France
900,000 Aeroports de Paris EUR 0.233% 05/01/2029 955,764 0.09800,000 Aeroports de Paris EUR 2.750% 02/04/2030 969,816 0.09850,000 AXA S.A.(d) EUR 3.250% 28/05/2049 984,028 0.09
1,300,000 BNP Paribas S.A. EUR 1.125% 22/11/2023 1,348,269 0.131,000,000 BNP Paribas S.A.(d) EUR 0.375% 14/10/2027 1,010,750 0.09300,000 BNP Paribas S.A.(d) EUR 2.625% 14/10/2027 312,900 0.03
1,200,000 BNP Paribas S.A.(d) EUR 0.500% 01/09/2028 1,210,260 0.11400,000 BNP Paribas S.A. EUR 0.625% 03/12/2032 399,484 0.04
1,000,000 Caisse Centrale du Credit Immobilier de France S.A. EUR (0.419%) 17/01/2024 1,013,370 0.09900,000 Capgemini S.E. EUR 2.375% 15/04/2032 1,074,870 0.10700,000 Credit Agricole S.A.(d) EUR 1.625% 05/06/2030 729,358 0.07400,000 Electricite de France S.A. EUR 2.000% 02/10/2030 466,312 0.04
2,000,000 Electricite de France S.A.(d) EUR 2.875% Perp. 2,100,000 0.202,200,000 Engie S.A.(d) EUR 1.500% Perp. 2,205,698 0.211,200,000 EssilorLuxottica S.A. USD 2.500% 30/06/2022 1,028,216 0.10950,000 Firmenich Productions Participations SAS EUR 1.375% 30/10/2026 1,019,967 0.10750,000 Firmenich Productions Participations SAS EUR 1.750% 30/04/2030 833,970 0.08
1,300,000 France Government Bond OAT EUR 4.500% 25/04/2041 2,470,221 0.231,870,000 France Government Bond OAT EUR 3.250% 25/05/2045 3,239,700 0.30650,000 France Government Bond OAT 144A(c) EUR 1.750% 25/05/2066 1,003,522 0.09600,000 La Mondiale SAM EUR 0.750% 20/04/2026 605,664 0.06
1,800,000 La Mondiale SAM EUR 2.125% 23/06/2031 1,877,364 0.18300,000 La Poste S.A. EUR 1.375% 21/04/2032 332,565 0.03700,000 La Poste S.A. EUR 0.440% 17/09/2034 754,096 0.07800,000 Orange S.A. EUR (0.131%) 04/09/2026 806,128 0.08300,000 Orange S.A. EUR 1.625% 07/04/2032 345,108 0.03400,000 Sanofi EUR (0.362%) 21/03/2022 401,844 0.04300,000 Sanofi EUR 1.500% 01/04/2030 344,409 0.03700,000 Societe Generale S.A.(d) EUR 0.875% 22/09/2028 718,109 0.07
2,300,000 Societe Generale S.A. EUR 1.750% 22/03/2029 2,520,018 0.24250,000 Total Capital International S.A. USD 3.461% 12/07/2049 242,216 0.02
33,323,996 3.13
Germany1,800,000 Allianz S.E.(d) EUR 2.625% Perp. 1,809,504 0.17600,000 Bayer AG EUR 1.125% 06/01/2030 632,658 0.06300,000 Bayer AG EUR 1.375% 06/07/2032 321,153 0.03
1,130,000 Bundesobligation—Series 182 EUR (0.757%) 10/10/2025 1,172,578 0.11500,000 Commerzbank AG(d) EUR 4.000% 05/12/2030 538,125 0.05100,000 Deutsche Bank AG USD 3.125% 13/01/2021 83,554 0.01
2,300,000 Deutsche Bank AG(d) EUR 1.750% 19/11/2030 2,374,428 0.22450,000 Deutsche Telekom AG EUR 0.500% 05/07/2027 468,315 0.04
1,400,000 Deutsche Telekom AG EUR 1.750% 25/03/2031 1,620,567 0.15550,000 Deutsche Telekom AG EUR 1.375% 05/07/2034 618,755 0.06
1,000,000 E.ON S.E. EUR 0.375% 29/09/2027 1,030,540 0.107,170,000 KFW EUR (0.639%) 04/07/2024 7,336,631 0.69900,000 KFW EUR 0.625% 22/02/2027 967,635 0.09
1,000,000 KFW EUR 0.625% 07/01/2028 1,082,490 0.10100,000 Volkswagen Bank GmbH EUR 1.875% 31/01/2024 105,535 0.01
20,162,468 1.89
Hong Kong640,000 CNAC HK Finbridge Co., Ltd. USD 3.000% 22/09/2030 507,637 0.05
Hungary100,000 Hungary Government International Bond EUR 1.500% 17/11/2050 99,265 0.01
Indonesia1,180,000 Indonesia Government International Bond USD 4.125% 15/01/2025 1,103,130 0.104,300,000 Indonesia Government International Bond EUR 1.750% 24/04/2025 4,515,000 0.42
12,336,000,000 Indonesia Treasury Bond—Series FR73 IDR 8.750% 15/05/2031 857,595 0.081,040,000 Perusahaan Penerbit SBSN Indonesia III USD 4.550% 29/03/2026 1,005,440 0.10
7,481,165 0.70
Ireland750,000 Abbott Ireland Financing DAC EUR 0.875% 27/09/2023 774,142 0.07
1,800,000 AerCap Ireland Capital DAC Via AerCap Global Aviation Trust USD 3.500% 26/05/2022 1,548,116 0.141,650,000 AerCap Ireland Capital DAC Via AerCap Global Aviation Trust USD 4.625% 01/07/2022 1,442,407 0.14500,000 AIB Group Plc.(d) EUR 1.875% 19/11/2029 507,785 0.05
1,100,000 AIB Group Plc.(d) EUR 2.875% 30/05/2031 1,164,031 0.11800,000 Dell Bank International DAC EUR 0.625% 17/10/2022 808,184 0.08
Goldman Sachs Funds—Global Fixed Income Portfolio (Hedged)Schedule of InvestmentsAs at 30 November 2020
The accompanying notes are an integral part of these financial statements.
307

Holdings Security Description Currency Interest Rate(a) Maturity Date(b)Market Value
EUR
% ofShareholders’
Equity
Bonds – (Continued)Ireland – (Continued)
1,900,000 Dell Bank International DAC EUR 1.625% 24/06/2024 1,964,296 0.18750,000 GE Capital International Funding Co. Unlimited Co. USD 3.373% 15/11/2025 685,457 0.06
1,250,000 GE Capital International Funding Co. Unlimited Co. USD 4.418% 15/11/2035 1,202,065 0.11930,000 Ireland Government Bond EUR 0.900% 15/05/2028 1,023,949 0.10
1,990,000 Ireland Government Bond EUR 0.200% 18/10/2030 2,084,366 0.20
13,204,798 1.24
Israel1,640,000 Israel Government Bond - Fixed—Series 327 ILS 2.000% 31/03/2027 458,296 0.041,200,000 Israel Government International Bond USD 3.800% 13/05/2060 1,185,757 0.11
1,644,053 0.15
Italy1,260,000 Italy Buoni Poliennali Del Tesoro EUR 2.800% 01/12/2028 1,502,701 0.14880,000 Italy Buoni Poliennali Del Tesoro EUR 0.950% 01/08/2030 915,552 0.08
1,510,000 Italy Buoni Poliennali Del Tesoro 144A(c) EUR 3.500% 01/03/2030 1,922,819 0.184,140,000 Italy Buoni Poliennali Del Tesoro 144A(c) EUR 2.950% 01/09/2038 5,370,656 0.50930,000 Italy Buoni Poliennali Del Tesoro 144A(c) EUR 2.800% 01/03/2067 1,236,361 0.12
1,990,000 Italy Certificati di Credito del Tesoro(d) EUR 1.518% 15/01/2025 2,104,525 0.20500,000 UniCredit SpA(d) EUR 2.200% 22/07/2027 530,705 0.05
1,000,000 UniCredit SpA EUR 1.800% 20/01/2030 1,047,610 0.10500,000 UniCredit SpA(d) EUR 2.731% 15/01/2032 506,875 0.05
15,137,804 1.42
Japan2,375,000 Asahi Group Holdings Ltd. EUR 0.541% 23/10/2028 2,412,287 0.23
1,519,000,000 Japan Government Bond—Series 13 JPY 0.500% 20/03/2060 11,416,998 1.073,606,200,000 Japan Government Bond—Series 141 JPY 0.100% 20/09/2024 29,101,551 2.741,052,050,000 Japan Government Bond—Series 150 JPY 1.400% 20/09/2034 9,801,652 0.9238,000,000 Japan Government Bond—Series 169 JPY 0.300% 20/06/2039 300,286 0.03738,500,000 Japan Government Bond—Series 171 JPY 0.300% 20/12/2039 5,823,481 0.55337,750,000 Japan Government Bond—Series 173 JPY 0.400% 20/06/2040 2,704,288 0.25817,000,000 Japan Government Bond—Series 174 JPY 0.400% 20/09/2040 6,535,526 0.61899,408,703 Japan Government Bond—Series 24 JPY 0.100% 10/03/2029 7,217,905 0.6825,000,000 Japan Government Bond—Series 34 JPY 2.200% 20/03/2041 269,401 0.03111,350,000 Japan Government Bond—Series 360 JPY 0.100% 20/09/2030 896,710 0.09
3,619,950,000 Japan Government Bond—Series 418 JPY 0.100% 01/11/2022 29,082,255 2.731,800,000,000 Japan Government Bond—Series 68 JPY 0.600% 20/09/2050 14,222,638 1.34
650,000 Mitsubishi UFJ Financial Group, Inc. EUR 0.339% 19/07/2024 659,126 0.061,300,000 Mitsubishi UFJ Financial Group, Inc. USD 3.751% 18/07/2039 1,303,230 0.12350,000 Nissan Motor Co., Ltd. EUR 1.940% 15/09/2023 362,148 0.03
1,750,000 Takeda Pharmaceutical Co., Ltd. EUR 1.375% 09/07/2032 1,877,732 0.18600,000 Takeda Pharmaceutical Co., Ltd. EUR 2.000% 09/07/2040 677,856 0.06
124,665,070 11.72
Jersey200,000 Galaxy Pipeline Assets Bidco Ltd. USD 2.625% 31/03/2036 172,773 0.02270,000 Galaxy Pipeline Assets Bidco Ltd. USD 3.250% 30/09/2040 233,666 0.02
406,439 0.04
Luxembourg550,000 Blackstone Property Partners Europe Holdings SARL EUR 2.000% 15/02/2024 576,961 0.05
2,550,000 Blackstone Property Partners Europe Holdings SARL EUR 1.750% 12/03/2029 2,674,427 0.25150,000 DH Europe Finance II SARL EUR 0.450% 18/03/2028 153,098 0.02250,000 DH Europe Finance II SARL USD 2.600% 15/11/2029 229,669 0.02650,000 DH Europe Finance II SARL EUR 0.750% 18/09/2031 670,820 0.06220,000 Gazprom PJSC Via Gaz Capital S.A. USD 5.150% 11/02/2026 208,563 0.02230,000 Gazprom PJSC Via Gaz Capital S.A. USD 7.288% 16/08/2037 278,171 0.03600,000 Helvetia Europe S.A.(d) EUR 2.750% 30/09/2041 646,032 0.06650,000 Logicor Financing SARL EUR 0.750% 15/07/2024 663,812 0.06
1,900,000 Logicor Financing SARL EUR 1.625% 15/07/2027 2,013,335 0.191,000,000 Medtronic Global Holdings S.C.A. EUR 0.375% 07/03/2023 1,013,560 0.10350,000 Medtronic Global Holdings S.C.A. EUR 0.250% 02/07/2025 355,551 0.03800,000 Medtronic Global Holdings S.C.A. EUR 0.286% 02/07/2031 860,016 0.08100,000 Medtronic Global Holdings S.C.A. EUR 1.500% 02/07/2039 109,848 0.01600,000 Richemont International Holding S.A. EUR 1.625% 26/05/2040 700,554 0.07
11,154,417 1.05
Goldman Sachs Funds—Global Fixed Income Portfolio (Hedged)Schedule of InvestmentsAs at 30 November 2020
The accompanying notes are an integral part of these financial statements.
308

Holdings Security Description Currency Interest Rate(a) Maturity Date(b)Market Value
EUR
% ofShareholders’
Equity
Bonds – (Continued)Mexico
200,000 Mexico City Airport Trust USD 4.250% 31/10/2026 166,651 0.02200,000 Mexico City Airport Trust USD 5.500% 31/07/2047 161,884 0.01290,000 Mexico City Airport Trust 144A(c) USD 3.875% 30/04/2028 233,145 0.02300,000 Mexico City Airport Trust 144A(c) USD 5.500% 31/07/2047 242,825 0.02330,000 Mexico Government International Bond USD 3.250% 16/04/2030 293,054 0.03800,000 Mexico Government International Bond USD 2.659% 24/05/2031 669,251 0.06320,000 Mexico Government International Bond USD 5.000% 27/04/2051 321,987 0.03
1,631,000 Mexico Government International Bond USD 3.771% 24/05/2061 1,356,277 0.13
3,445,074 0.32
Netherlands700,000 ABN AMRO Bank NV(d) EUR 2.875% 18/01/2028 736,764 0.07
1,050,000 ABN AMRO Bank NV 144A(c) USD 4.750% 28/07/2025 1,005,227 0.091,200,000 Airbus S.E. EUR 2.000% 07/04/2028 1,343,748 0.13800,000 Airbus S.E. EUR 2.375% 07/04/2032 937,712 0.09
1,550,000 Airbus S.E. EUR 2.375% 09/06/2040 1,785,569 0.17600,000 BAT Netherlands Finance BV EUR 3.125% 07/04/2028 701,508 0.06700,000 Bayer Capital Corp. BV EUR 1.500% 26/06/2026 752,654 0.07
1,010,000 BNG Bank NV GBP 0.375% 15/12/2025 1,133,224 0.11450,000 Cooperatieve Rabobank UA EUR 3.875% 25/07/2023 497,093 0.05900,000 CRH Funding BV EUR 1.625% 05/05/2030 1,013,400 0.09400,000 Enel Finance International NV EUR 0.375% 17/06/2027 408,956 0.04
1,200,000 Fiat Chrysler Automobiles NV EUR 3.875% 05/01/2026 1,354,848 0.13875,000 Fiat Chrysler Automobiles NV EUR 4.500% 07/07/2028 1,049,869 0.10300,000 Givaudan Finance Europe BV EUR 1.625% 22/04/2032 342,129 0.03400,000 ING Groep NV EUR (0.216%) 20/09/2023 413,640 0.04200,000 ING Groep NV(d) EUR 0.786% 13/11/2030 201,710 0.02400,000 ING Groep NV(d) EUR 2.125% 26/05/2031 426,692 0.04600,000 ING Groep NV(d) USD 6.750% Perp. 547,705 0.05250,000 Innogy Finance BV GBP 6.125% 06/07/2039 466,684 0.04
1,000,000 JAB Holdings BV EUR 1.000% 20/12/2027 1,033,070 0.101,200,000 JAB Holdings BV EUR 3.375% 17/04/2035 1,489,800 0.14250,000 Koninklijke Philips NV EUR 1.375% 30/03/2025 265,585 0.02720,000 Lukoil Securities BV USD 3.875% 06/05/2030 648,993 0.06210,000 Prosus NV USD 3.680% 21/01/2030 191,224 0.02210,000 Prosus NV USD 4.027% 03/08/2050 186,883 0.02
2,800,000 Upjohn Finance BV EUR 1.908% 23/06/2032 3,103,184 0.291,300,000 Volkswagen International Finance NV(d) EUR 3.500% Perp. 1,376,245 0.13400,000 Wintershall Dea Finance BV EUR 0.840% 25/09/2025 409,028 0.04900,000 Wintershall Dea Finance BV EUR 1.332% 25/09/2028 923,517 0.09
1,050,000 WPC Eurobond BV EUR 1.350% 15/04/2028 1,090,540 0.10
25,837,201 2.43
Peru730,000 Peruvian Government International Bond USD 2.780% 01/12/2060 600,954 0.06370,000 Peruvian Government International Bond USD 3.230% 28/07/2121 304,748 0.03
905,702 0.09
Portugal1,600,000 Portugal Obrigacoes do Tesouro OT 144A(c) EUR 1.950% 15/06/2029 1,885,264 0.18
Qatar200,000 Qatar Government International Bond USD 3.875% 23/04/2023 179,338 0.02210,000 Qatar Government International Bond USD 4.500% 23/04/2028 212,267 0.02
1,240,000 Qatar Government International Bond USD 5.103% 23/04/2048 1,482,582 0.14
1,874,187 0.18
Romania70,000 Romanian Government International Bond EUR 2.000% 28/01/2032 72,923 0.01380,000 Romanian Government International Bond EUR 3.375% 28/01/2050 422,335 0.04
495,258 0.05
Russia17,600,000 Russian Federal Bond - OFZ Bonds—Series 6212 RUB 7.050% 19/01/2028 210,249 0.023,200,000 Russian Foreign Bond - Eurobond USD 4.750% 27/05/2026 3,080,739 0.29
3,290,988 0.31
Goldman Sachs Funds—Global Fixed Income Portfolio (Hedged)Schedule of InvestmentsAs at 30 November 2020
The accompanying notes are an integral part of these financial statements.
309

Holdings Security Description Currency Interest Rate(a) Maturity Date(b)Market Value
EUR
% ofShareholders’
Equity
Bonds – (Continued)Saudi Arabia
220,000 Saudi Government International Bond USD 3.250% 22/10/2030 202,201 0.02310,000 Saudi Government International Bond USD 4.500% 22/04/2060 329,498 0.03
531,699 0.05
South Korea1,076,620,000 Inflation Linked Korea Treasury Bond—Series 2606 KRW 0.809% 10/06/2026 874,782 0.081,701,150,000 Korea Treasury Bond—Series 2906 KRW 1.875% 10/06/2029 1,318,435 0.139,370,750,000 Korea Treasury Bond—Series 2912 KRW 1.375% 10/12/2029 6,945,384 0.65
9,138,601 0.86
Spain300,000 Abertis Infraestructuras S.A. EUR 2.375% 27/09/2027 332,589 0.03400,000 Banco Bilbao Vizcaya Argentaria S.A. EUR 0.750% 11/09/2022 407,332 0.04400,000 Banco de Sabadell S.A. EUR 0.875% 05/03/2023 407,144 0.04300,000 Banco de Sabadell S.A. EUR 1.750% 10/05/2024 309,519 0.03400,000 Banco de Sabadell S.A. EUR 1.125% 27/03/2025 404,996 0.04800,000 Banco Santander S.A. USD 2.706% 27/06/2024 709,666 0.07500,000 Banco Santander S.A. EUR 1.375% 05/01/2026 529,670 0.05
3,000,000 Banco Santander S.A. USD 3.306% 27/06/2029 2,794,973 0.26400,000 Banco Santander S.A. USD 3.490% 28/05/2030 372,440 0.03
1,600,000 Banco Santander S.A. EUR 1.625% 22/10/2030 1,655,584 0.16600,000 Bankinter S.A. EUR 0.625% 06/10/2027 611,358 0.06300,000 CaixaBank S.A. EUR 1.125% 17/05/2024 312,024 0.03
2,000,000 CaixaBank S.A.(d) EUR 0.375% 18/11/2026 2,008,220 0.19650,000 FCC Aqualia S.A. EUR 2.629% 08/06/2027 709,755 0.07200,000 FCC Servicios Medio Ambiente Holding SAU EUR 1.661% 04/12/2026 209,966 0.02
1,940,000 Spain Government Bond EUR 0.050% 31/01/2021 1,942,037 0.188,290,000 Spain Government Bond 144A(c) EUR 1.500% 30/04/2027 9,258,023 0.876,200,000 Spain Government Bond 144A(c) EUR 1.250% 31/10/2030 6,925,152 0.65720,000 Spain Government Bond 144A(c) EUR 3.450% 30/07/2066 1,310,522 0.12
3,100,000 Telefonica Emisiones S.A. EUR 1.201% 21/08/2027 3,319,294 0.31550,000 Telefonica Emisiones S.A. EUR 1.957% 01/07/2039 635,861 0.06
35,166,125 3.31
Supranationals2,200,000 Asian Development Bank EUR 0.200% 25/05/2023 2,241,338 0.211,350,000 European Investment Bank GBP 1.375% 07/03/2025 1,580,595 0.156,800,000 European Investment Bank SEK 1.750% 12/11/2026 727,430 0.072,010,000 European Investment Bank EUR 0.875% 14/01/2028 2,216,487 0.211,040,000 European Investment Bank EUR (0.060%) 14/11/2042 1,283,173 0.12650,000 European Union EUR (0.187%) 04/07/2035 668,148 0.06
8,717,171 0.82
Sweden350,000 Heimstaden Bostad AB EUR 1.125% 21/01/2026 361,344 0.04400,000 Svenska Handelsbanken AB(d) USD 4.375% Perp. 347,937 0.03
1,700,000 Volvo Treasury AB EUR 0.125% 17/09/2024 1,710,421 0.16
2,419,702 0.23
Switzerland1,100,000 Credit Suisse AG USD 2.950% 09/04/2025 1,004,218 0.09700,000 Credit Suisse Group AG(d) EUR 3.250% 02/04/2026 792,561 0.08
1,400,000 Credit Suisse Group AG(d) EUR 0.650% 14/01/2028 1,430,478 0.131,300,000 Credit Suisse Group AG 144A(c)(d) USD 2.593% 11/09/2025 1,142,034 0.11
4,369,291 0.41
Thailand72,680,000 Thailand Government Bond THB 1.875% 17/06/2022 2,044,428 0.1930,540,000 Thailand Government Bond THB 3.625% 16/06/2023 906,522 0.0981,650,000 Thailand Government Bond THB 2.400% 17/12/2023 2,370,906 0.22
5,321,856 0.50
United Arab Emirates780,000 Abu Dhabi Crude Oil Pipeline LLC USD 4.600% 02/11/2047 807,826 0.08510,000 Abu Dhabi Government International Bond USD 3.125% 11/10/2027 477,241 0.05
1,370,000 Abu Dhabi Government International Bond USD 4.125% 11/10/2047 1,453,316 0.13100,000 DP World Plc. 144A(c) USD 6.850% 02/07/2037 110,706 0.01
2,849,089 0.27
Goldman Sachs Funds—Global Fixed Income Portfolio (Hedged)Schedule of InvestmentsAs at 30 November 2020
The accompanying notes are an integral part of these financial statements.
310

Holdings Security Description Currency Interest Rate(a) Maturity Date(b)Market Value
EUR
% ofShareholders’
Equity
Bonds – (Continued)United Kingdom
450,000 Aviva Plc.(d) GBP 6.125% 14/11/2036 612,943 0.06700,000 Barclays Bank Plc. USD 10.179% 12/06/2021 611,604 0.06650,000 Barclays Plc.(d) USD 4.610% 15/02/2023 567,083 0.05
1,100,000 Barclays Plc.(d) EUR 3.375% 02/04/2025 1,212,519 0.111,550,000 Barclays Plc.(d) GBP 3.750% 22/11/2030 1,865,059 0.17600,000 BAT International Finance Plc. GBP 2.250% 26/06/2028 685,764 0.06200,000 BP Capital Markets Plc. USD 3.814% 10/02/2024 182,875 0.02500,000 BP Capital Markets Plc.(d) EUR 3.250% Perp. 534,290 0.05450,000 BP Capital Markets Plc.(d) EUR 3.625% Perp. 492,948 0.05
2,300,000 Diageo Capital Plc. USD 2.000% 29/04/2030 2,010,532 0.19940,000 Gazprom PJSC Via Gaz Finance Plc. USD 3.250% 25/02/2030 807,871 0.08
2,850,000 HSBC Holdings Plc.(d) USD 3.803% 11/03/2025 2,581,952 0.24800,000 HSBC Holdings Plc. USD 4.950% 31/03/2030 830,878 0.08450,000 Legal & General Group Plc.(d) GBP 3.750% 26/11/2049 535,193 0.05950,000 Lloyds Banking Group Plc.(d) EUR 3.500% 01/04/2026 1,082,430 0.10100,000 M&G Plc.(d) GBP 6.340% 19/12/2063 144,608 0.01
1,950,000 Nationwide Building Society 144A(c)(d) USD 3.960% 18/07/2030 1,879,969 0.18850,000 Natwest Group Plc.(d) USD 3.498% 15/05/2023 737,389 0.07400,000 Pension Insurance Corp. Plc. GBP 4.625% 07/05/2031 518,256 0.05600,000 Phoenix Group Holdings Plc. GBP 5.625% 28/04/2031 802,762 0.08
1,500,000 Santander UK Group Holdings Plc.(d) USD 1.532% 21/08/2026 1,260,510 0.122,975,000 Smith & Nephew Plc. USD 2.032% 14/10/2030 2,522,928 0.241,300,000 Swiss Re Finance UK Plc.(d) EUR 2.714% 04/06/2052 1,429,675 0.131,460,000 United Kingdom Gilt GBP 0.375% 22/10/2030 1,637,637 0.151,340,000 United Kingdom Gilt GBP 4.500% 07/09/2034 2,285,352 0.211,170,000 United Kingdom Gilt GBP 3.250% 22/01/2044 1,976,806 0.19830,000 United Kingdom Gilt GBP 3.500% 22/01/2045 1,469,092 0.14
2,810,000 United Kingdom Gilt GBP 4.250% 07/12/2046 5,650,084 0.531,320,000 United Kingdom Gilt GBP 1.750% 22/07/2057 1,924,624 0.181,100,000 United Kingdom Gilt GBP 3.500% 22/07/2068 2,583,167 0.24
41,436,800 3.89
United States350,000 AbbVie, Inc. USD 3.750% 14/11/2023 318,888 0.03
1,300,000 AbbVie, Inc. USD 2.950% 21/11/2026 1,199,050 0.11150,000 AbbVie, Inc. USD 4.250% 14/11/2028 150,923 0.01
6,975,000 AbbVie, Inc. USD 3.200% 21/11/2029 6,588,499 0.62675,000 AbbVie, Inc. USD 4.875% 14/11/2048 766,491 0.07
2,550,000 Air Lease Corp. USD 3.250% 01/03/2025 2,235,552 0.21775,000 Air Lease Corp. USD 2.875% 15/01/2026 668,365 0.06400,000 Alexandria Real Estate Equities, Inc. USD 3.375% 15/08/2031 382,097 0.04100,000 Ameren Corp. USD 2.500% 15/09/2024 88,722 0.01225,000 American Express Co. USD 3.700% 05/11/2021 192,948 0.02355,000 American Express Co. USD 2.500% 01/08/2022 306,045 0.03290,000 American Express Co. USD 2.500% 30/07/2024 257,759 0.02250,000 American International Group, Inc. USD 4.875% 01/06/2022 222,212 0.02125,000 American International Group, Inc. USD 4.125% 15/02/2024 115,917 0.01
2,400,000 American International Group, Inc. USD 3.900% 01/04/2026 2,286,638 0.223,075,000 American International Group, Inc. USD 3.400% 30/06/2030 2,921,910 0.272,100,000 American Tower Corp. USD 3.800% 15/08/2029 2,026,315 0.191,000,000 American Tower Corp. USD 2.900% 15/01/2030 909,166 0.091,200,000 American Water Capital Corp. USD 2.800% 01/05/2030 1,107,395 0.10300,000 American Water Capital Corp. USD 3.450% 01/05/2050 299,412 0.03
1,050,000 Anheuser-Busch Cos. LLC Via Anheuser-Busch InBev Worldwide, Inc. USD 4.900% 01/02/2046 1,144,422 0.11450,000 Anheuser-Busch InBev Worldwide, Inc. USD 4.150% 23/01/2025 425,871 0.04
2,700,000 Anheuser-Busch InBev Worldwide, Inc. USD 4.750% 23/01/2029 2,765,005 0.261,050,000 Anheuser-Busch InBev Worldwide, Inc. USD 4.600% 15/04/2048 1,111,326 0.102,450,000 Anthem, Inc. USD 2.250% 15/05/2030 2,145,330 0.20400,000 Archer-Daniels-Midland Co. USD 3.250% 27/03/2030 387,472 0.04250,000 AT&T, Inc. USD 3.000% 30/06/2022 216,079 0.02600,000 AT&T, Inc. USD 4.100% 15/02/2028 589,986 0.06
3,700,000 AT&T, Inc. USD 2.750% 01/06/2031 3,276,253 0.31550,000 AT&T, Inc. EUR 1.800% 14/09/2039 584,397 0.06150,000 AT&T, Inc. USD 4.350% 15/06/2045 148,027 0.01550,000 AT&T, Inc. USD 5.450% 01/03/2047 612,999 0.06650,000 AT&T, Inc. USD 4.500% 09/03/2048 653,425 0.06550,000 AT&T, Inc. USD 3.650% 01/06/2051 484,801 0.05850,000 Bank of America Corp.(d) EUR 3.648% 31/03/2029 1,056,592 0.10600,000 Bank of America Corp. USD 5.875% 07/02/2042 771,659 0.07600,000 BAT Capital Corp. USD 5.282% 02/04/2050 623,564 0.06
Goldman Sachs Funds—Global Fixed Income Portfolio (Hedged)Schedule of InvestmentsAs at 30 November 2020
The accompanying notes are an integral part of these financial statements.
311

Holdings Security Description Currency Interest Rate(a) Maturity Date(b)Market Value
EUR
% ofShareholders’
Equity
Bonds – (Continued)United States – (Continued)
1,100,000 Becton Dickinson and Co. USD 2.894% 06/06/2022 948,006 0.091,700,000 Becton Dickinson and Co. USD 3.363% 06/06/2024 1,531,665 0.144,300,000 Becton Dickinson and Co. USD 3.700% 06/06/2027 4,120,910 0.39750,000 Boeing Co. USD 5.150% 01/05/2030 737,870 0.07150,000 Boston Properties LP USD 4.125% 15/05/2021 126,006 0.01700,000 BP Capital Markets America, Inc. USD 3.790% 06/02/2024 637,554 0.06550,000 Capital One Financial Corp. USD 3.500% 15/06/2023 491,811 0.05585,000 Capital One Financial Corp. USD 3.300% 30/10/2024 531,165 0.05565,000 Cigna Corp. USD 3.750% 15/07/2023 509,897 0.05
3,300,000 Cigna Corp. USD 2.400% 15/03/2030 2,924,787 0.28550,000 Cigna Corp. USD 4.900% 15/12/2048 631,082 0.06
1,310,000 Citigroup, Inc. USD 3.500% 15/05/2023 1,169,199 0.11550,000 Citigroup, Inc. GBP 2.750% 24/01/2024 651,666 0.06
2,300,000 Coca-Cola Co. USD 2.600% 01/06/2050 2,030,933 0.192,300,000 Constellation Brands, Inc. USD 4.400% 15/11/2025 2,231,262 0.21650,000 Constellation Brands, Inc. USD 3.700% 06/12/2026 619,823 0.06
1,850,000 Constellation Brands, Inc. USD 2.875% 01/05/2030 1,691,642 0.16417,000 CVS Health Corp. USD 3.700% 09/03/2023 371,759 0.04330,000 CVS Health Corp. USD 2.625% 15/08/2024 294,215 0.03100,000 CVS Health Corp. USD 5.050% 25/03/2048 112,532 0.01
1,575,000 CVS Health Corp. USD 4.250% 01/04/2050 1,650,471 0.162,400,000 Dominion Energy, Inc.—Series C USD 3.375% 01/04/2030 2,292,320 0.22573,000 DTE Energy Co. USD 2.250% 01/11/2022 494,761 0.05650,000 Duke Energy Carolinas LLC USD 3.200% 15/08/2049 619,146 0.06
1,700,000 DuPont de Nemours, Inc. USD 4.493% 15/11/2025 1,654,125 0.161,600,000 DuPont de Nemours, Inc. USD 4.725% 15/11/2028 1,629,745 0.151,800,000 Emerson Electric Co. USD 1.950% 15/10/2030 1,583,244 0.15600,000 Energy Transfer Operating LP USD 5.000% 15/05/2050 521,966 0.05550,000 Enterprise Products Operating LLC USD 2.850% 15/04/2021 461,784 0.04
2,000,000 Enterprise Products Operating LLC USD 3.750% 15/02/2025 1,859,481 0.17300,000 EQM Midstream Partners LP USD 4.750% 15/07/2023 255,848 0.02350,000 Fidelity National Information Services, Inc. EUR 0.750% 21/05/2023 357,742 0.03150,000 Fidelity National Information Services, Inc. GBP 2.602% 21/05/2025 181,846 0.02550,000 Fidelity National Information Services, Inc. EUR 0.625% 03/12/2025 568,419 0.05100,000 Fidelity National Information Services, Inc. EUR 1.500% 21/05/2027 108,287 0.01150,000 General Electric Co. USD 2.700% 09/10/2022 129,967 0.01250,000 General Electric Co. USD 3.100% 09/01/2023 219,147 0.02450,000 General Electric Co. USD 3.625% 01/05/2030 420,405 0.04
1,050,000 General Electric Co. USD 4.350% 01/05/2050 1,026,568 0.10250,000 General Electric Co.—Series MTNA USD 6.750% 15/03/2032 283,540 0.03550,000 General Mills, Inc. USD 2.875% 15/04/2030 509,500 0.05700,000 General Motors Co. USD 5.400% 02/10/2023 654,174 0.06150,000 General Motors Financial Co., Inc. USD 5.650% 17/01/2029 154,838 0.01550,000 Healthcare Realty Trust, Inc. USD 2.050% 15/03/2031 458,372 0.04150,000 Healthpeak Properties, Inc. USD 3.250% 15/07/2026 139,524 0.01
1,300,000 Hewlett Packard Enterprise Co. USD 4.450% 02/10/2023 1,194,238 0.114,325,000 Hewlett Packard Enterprise Co. USD 4.900% 15/10/2025 4,193,038 0.39450,000 Hewlett Packard Enterprise Co. USD 6.350% 15/10/2045 495,797 0.05
1,700,000 Intercontinental Exchange, Inc. USD 1.850% 15/09/2032 1,432,121 0.13250,000 JM Smucker Co. USD 3.000% 15/03/2022 215,187 0.02900,000 JPMorgan Chase & Co.(d) EUR 1.001% 25/07/2031 953,145 0.0950,000 Kinder Morgan Energy Partners LP USD 4.300% 01/05/2024 46,061 0.00
1,200,000 Kroger Co. USD 2.200% 01/05/2030 1,057,857 0.10750,000 Kroger Co. USD 3.950% 15/01/2050 765,062 0.07150,000 McDonald’s Corp. USD 4.200% 01/04/2050 160,737 0.02130,000 MetLife, Inc. USD 3.600% 10/04/2024 119,383 0.01450,000 MetLife, Inc.—Series D USD 4.368% 15/09/2023 415,179 0.04300,000 Morgan Stanley USD 5.500% 28/07/2021 258,519 0.02250,000 MPLX LP USD 4.500% 15/04/2038 230,755 0.02200,000 MPLX LP USD 5.500% 15/02/2049 207,028 0.02410,000 National Retail Properties, Inc. USD 3.900% 15/06/2024 370,495 0.03
1,425,000 NiSource, Inc. USD 3.600% 01/05/2030 1,376,437 0.13300,000 Pacific Gas & Electric Co. USD 2.500% 01/02/2031 251,759 0.02150,000 Pacific Gas & Electric Co. USD 3.300% 01/08/2040 125,895 0.01250,000 Pacific Gas & Electric Co. USD 3.500% 01/08/2050 209,920 0.02350,000 Phillips 66 USD 3.850% 09/04/2025 325,876 0.03425,000 Phillips 66 USD 1.300% 15/02/2026 356,865 0.03550,000 PNC Financial Services Group, Inc. USD 3.500% 23/01/2024 498,964 0.05475,000 Prologis Euro Finance LLC EUR 1.000% 06/02/2035 499,728 0.05
1,150,000 Prologis LP USD 2.250% 15/04/2030 1,027,470 0.101,750,000 Prudential Financial, Inc. USD 3.000% 10/03/2040 1,580,347 0.15
Goldman Sachs Funds—Global Fixed Income Portfolio (Hedged)Schedule of InvestmentsAs at 30 November 2020
The accompanying notes are an integral part of these financial statements.
312

Holdings Security Description Currency Interest Rate(a) Maturity Date(b)Market Value
EUR
% ofShareholders’
Equity
Bonds – (Continued)United States – (Continued)
226,000 Regions Financial Corp. USD 3.800% 14/08/2023 204,769 0.02330,000 Sasol Financing USA LLC USD 5.875% 27/03/2024 284,861 0.03500,000 Sempra Energy USD 3.400% 01/02/2028 465,896 0.04630,000 Simon Property Group LP USD 2.750% 01/06/2023 552,617 0.05950,000 Snap-on, Inc. USD 3.100% 01/05/2050 899,401 0.08
2,050,000 Stryker Corp. USD 1.950% 15/06/2030 1,765,456 0.17250,000 Sunoco Logistics Partners Operations LP USD 5.300% 01/04/2044 217,519 0.0250,000 Sunoco Logistics Partners Operations LP USD 5.400% 01/10/2047 44,394 0.00
1,450,000 Sysco Corp. USD 5.950% 01/04/2030 1,596,432 0.15200,000 Thermo Fisher Scientific, Inc. USD 4.497% 25/03/2030 209,442 0.02350,000 Thermo Fisher Scientific, Inc. EUR 1.875% 01/10/2049 401,625 0.04
1,975,000 VEREIT Operating Partnership LP USD 4.625% 01/11/2025 1,852,768 0.17575,000 VEREIT Operating Partnership LP USD 2.850% 15/12/2032 488,732 0.05750,000 Verizon Communications, Inc. USD 2.625% 15/08/2026 683,919 0.06250,000 Verizon Communications, Inc. USD 3.875% 08/02/2029 245,609 0.0278,000 Verizon Communications, Inc. USD 5.012% 15/04/2049 92,313 0.01350,000 Verizon Communications, Inc. USD 4.000% 22/03/2050 366,109 0.03150,000 Walt Disney Co. USD 4.700% 23/03/2050 174,158 0.02
1,050,000 Wells Fargo & Co.(d) EUR 1.741% 04/05/2030 1,153,099 0.11950,000 Wells Fargo & Co. EUR 0.625% 14/08/2030 953,201 0.09550,000 Williams Cos., Inc. USD 3.900% 15/01/2025 504,356 0.05255,000 WP Carey, Inc. USD 4.600% 01/04/2024 236,021 0.02200,000 WP Carey, Inc. USD 4.000% 01/02/2025 183,886 0.02
1,975,000 WP Carey, Inc. USD 2.400% 01/02/2031 1,683,298 0.16
114,268,260 10.74
TOTAL BONDS(cost EUR 541,849,263) 558,010,387 52.44
Holdings Security DescriptionMarket Value
EUR
% ofShareholders’
Equity
Mutual Funds – 9.50%Ireland
10,190 Goldman Sachs Euro Liquid Reserves Fund (X Accumulation Class)(e)(f) 101,082,758 9.50
TOTAL MUTUAL FUNDS(cost EUR 101,278,760) 101,082,758 9.50
TOTAL TRANSFERABLE SECURITIES ADMITTED TO AN OFFICIAL EXCHANGE LISTING(cost EUR 643,128,023) 659,093,145 61.94
Holdings Security Description Currency Interest Rate(a) Maturity Date(b)Market Value
EUR
% ofShareholders’
Equity
Transferable securities dealt in another regulated market
Bonds – 17.21%Australia
700,000 Australia & New Zealand Banking Group Ltd. 144A(c)(d) USD 2.950% 22/07/2030 612,432 0.06650,000 Commonwealth Bank of Australia 144A(c)(d) USD 3.610% 12/09/2034 593,646 0.05270,000 Macquarie Group Ltd. 144A(c)(d) USD 3.763% 28/11/2028 248,921 0.02
1,300,000 Westpac Banking Corp.(d) USD 2.894% 04/02/2030 1,127,122 0.111,500,000 Westpac Banking Corp.(d) USD 2.668% 15/11/2035 1,292,147 0.12
3,874,268 0.36
Bermuda1,100,000 Bacardi Ltd. 144A(c) USD 4.700% 15/05/2028 1,074,984 0.10
Cayman Islands350,000 Avolon Holdings Funding Ltd. 144A(c) USD 3.950% 01/07/2024 298,049 0.03
France3,125,000 BNP Paribas S.A. 144A(c) USD 3.375% 09/01/2025 2,842,264 0.272,450,000 BNP Paribas S.A. 144A(c)(d) USD 2.219% 09/06/2026 2,127,623 0.201,950,000 BNP Paribas S.A. 144A(c)(d) USD 4.375% 01/03/2033 1,840,970 0.174,150,000 BPCE S.A. 144A(c) USD 4.000% 12/09/2023 3,768,576 0.351,575,000 BPCE S.A. 144A(c)(d) USD 1.652% 06/10/2026 1,333,081 0.13350,000 Credit Agricole S.A. 144A(c) USD 3.375% 10/01/2022 301,314 0.03650,000 Credit Agricole S.A. 144A(c) USD 3.750% 24/04/2023 583,258 0.05
Goldman Sachs Funds—Global Fixed Income Portfolio (Hedged)Schedule of InvestmentsAs at 30 November 2020
The accompanying notes are an integral part of these financial statements.
313

Holdings Security Description Currency Interest Rate(a) Maturity Date(b)Market Value
EUR
% ofShareholders’
Equity
Bonds – (Continued)France – (Continued)
450,000 Credit Agricole S.A. 144A(c)(d) USD 1.907% 16/06/2026 387,359 0.043,100,000 Electricite de France S.A. 144A(c) USD 4.500% 21/09/2028 3,084,081 0.29
16,268,526 1.53
Germany950,000 Deutsche Bank AG(d) USD 2.222% 18/09/2024 808,357 0.08550,000 Deutsche Bank AG(d) USD 2.129% 24/11/2026 463,664 0.04450,000 Deutsche Telekom AG 144A(c) USD 3.625% 21/01/2050 439,297 0.04
1,711,318 0.16
Indonesia49,255,000,000 Indonesia Treasury Bond—JPMorgan Chase Bank NA 144A(c)(d) IDR 7.500% 17/06/2035 3,133,391 0.30
Ireland1,600,000 AIB Group Plc. 144A(c)(d) USD 4.263% 10/04/2025 1,453,772 0.14
Luxembourg110,000 Gazprom PJSC Via Gaz Capital S.A. USD 8.625% 28/04/2034 141,205 0.01
Netherlands500,000 Deutsche Telekom International Finance BV 144A(c) USD 2.485% 19/09/2023 436,364 0.04
1,000,000 Deutsche Telekom International Finance BV 144A(c) USD 4.375% 21/06/2028 994,557 0.09500,000 Syngenta Finance NV 144A(c) USD 4.441% 24/04/2023 440,465 0.04
2,900,000 Syngenta Finance NV 144A(c) USD 4.892% 24/04/2025 2,618,691 0.25250,000 Syngenta Finance NV 144A(c) USD 5.182% 24/04/2028 223,588 0.02
4,713,665 0.44
Supranationals500,000 NXP BV Via NXP Funding LLC Via NXP USA, Inc. 144A(c) USD 3.400% 01/05/2030 470,656 0.04
Switzerland4,000,000 Credit Suisse Group AG 144A(c)(d) USD 3.869% 12/01/2029 3,778,417 0.36
United Kingdom5,650,000 Vodafone Group Plc. USD 3.750% 16/01/2024 5,151,342 0.491,100,000 Vodafone Group Plc. USD 4.375% 30/05/2028 1,099,670 0.10
6,251,012 0.59
United States650,000 AbbVie, Inc. USD 2.300% 21/11/2022 561,269 0.05
1,300,000 AbbVie, Inc. USD 2.600% 21/11/2024 1,159,927 0.11550,000 AbbVie, Inc. USD 4.050% 21/11/2039 556,373 0.05
2,550,000 AbbVie, Inc. USD 4.250% 21/11/2049 2,683,628 0.25150,000 AEP Transmission Co., LLC—Series M USD 3.650% 01/04/2050 152,495 0.01250,000 AIG Global Funding 144A(c) USD 2.300% 01/07/2022 214,822 0.02950,000 American International Group, Inc. USD 4.375% 30/06/2050 1,029,101 0.1050,000 AT&T, Inc. USD 4.850% 15/07/2045 52,386 0.00
9,600,000 Bank of America Corp.(d) USD 3.366% 23/01/2026 8,781,374 0.832,400,000 Bank of America Corp.(d) USD 2.592% 29/04/2031 2,132,380 0.20750,000 Bank of America Corp.(d) USD 4.083% 20/03/2051 798,893 0.08
1,100,000 BBVA USA USD 3.500% 11/06/2021 930,106 0.09300,000 Berkshire Hathaway Energy Co. USD 2.375% 15/01/2021 250,734 0.0250,000 Berkshire Hathaway Energy Co. 144A(c) USD 4.250% 15/10/2050 54,724 0.01
2,400,000 Biogen, Inc. USD 2.250% 01/05/2030 2,074,098 0.2075,000 Bristol-Myers Squibb Co. USD 4.250% 26/10/2049 84,965 0.01
1,650,000 Broadcom, Inc. USD 3.625% 15/10/2024 1,506,974 0.142,950,000 Broadcom, Inc. USD 4.700% 15/04/2025 2,814,053 0.266,950,000 Broadcom, Inc. USD 4.250% 15/04/2026 6,602,949 0.622,079,000 Broadcom, Inc. USD 3.459% 15/09/2026 1,914,750 0.183,200,000 Carrier Global Corp. 144A(c) USD 2.722% 15/02/2030 2,844,587 0.27900,000 Charter Communications Operating LLC Via Charter Communications
Operating Capital USD 4.500% 01/02/2024 831,829 0.085,925,000 Charter Communications Operating LLC Via Charter Communications
Operating Capital USD 4.908% 23/07/2025 5,713,250 0.541,450,000 Charter Communications Operating LLC Via Charter Communications
Operating Capital USD 4.800% 01/03/2050 1,448,018 0.14960,000 Citigroup, Inc.(d) USD 4.044% 01/06/2024 868,430 0.08
4,050,000 Citigroup, Inc.(d) USD 0.776% 30/10/2024 3,385,551 0.326,825,000 Citigroup, Inc.(d) USD 3.106% 08/04/2026 6,179,341 0.582,050,000 Citigroup, Inc.(d) USD 4.412% 31/03/2031 2,066,987 0.191,900,000 Citigroup, Inc.(d) USD 2.572% 03/06/2031 1,684,618 0.16275,000 Citizens Bank NA Via Providence RI USD 3.250% 14/02/2022 236,596 0.02
Goldman Sachs Funds—Global Fixed Income Portfolio (Hedged)Schedule of InvestmentsAs at 30 November 2020
The accompanying notes are an integral part of these financial statements.
314

Holdings Security Description Currency Interest Rate(a) Maturity Date(b)Market Value
EUR
% ofShareholders’
Equity
Bonds – (Continued)United States – (Continued)
1,025,000 CMS Energy Corp.(d) USD 3.750% 01/12/2050 862,169 0.08800,000 Comcast Corp. USD 3.700% 15/04/2024 735,069 0.07600,000 Comcast Corp. USD 3.950% 15/10/2025 573,755 0.05
1,200,000 Comcast Corp. USD 4.150% 15/10/2028 1,203,281 0.11650,000 Comcast Corp. USD 5.650% 15/06/2035 774,901 0.07
1,575,000 Comcast Corp. USD 3.750% 01/04/2040 1,591,990 0.15350,000 Comcast Corp. USD 4.700% 15/10/2048 412,997 0.04
1,250,000 Constellation Brands, Inc. USD 3.200% 15/02/2023 1,099,840 0.103,550,000 Dell International LLC Via EMC Corp. 144A(c) USD 6.020% 15/06/2026 3,592,646 0.34800,000 Dell International LLC Via EMC Corp. 144A(c) USD 4.900% 01/10/2026 779,646 0.07525,000 Dell International LLC Via EMC Corp. 144A(c) USD 5.300% 01/10/2029 528,580 0.05
1,575,000 Dentsply Sirona, Inc. USD 3.250% 01/06/2030 1,448,848 0.14800,000 Duquesne Light Holdings, Inc. 144A(c) USD 2.532% 01/10/2030 686,838 0.06200,000 East Ohio Gas Co. 144A(c) USD 2.000% 15/06/2030 173,643 0.02250,000 East Ohio Gas Co. 144A(c) USD 3.000% 15/06/2050 226,370 0.02900,000 Expedia Group, Inc. USD 3.250% 15/02/2030 760,500 0.07600,000 Federal Home Loan Banks USD 2.625% 12/09/2025 552,082 0.05630,000 Fifth Third Bancorp USD 2.375% 28/01/2025 556,651 0.05550,000 Fiserv, Inc. USD 3.200% 01/07/2026 514,172 0.05
4,125,000 GE Capital Funding LLC 144A(c) USD 4.400% 15/05/2030 3,963,824 0.372,400,000 Georgia-Pacific LLC 144A(c) USD 2.300% 30/04/2030 2,136,141 0.201,600,000 Glencore Funding LLC 144A(c) USD 4.125% 30/05/2023 1,436,219 0.141,200,000 Glencore Funding LLC 144A(c) USD 4.625% 29/04/2024 1,111,217 0.102,250,000 Glencore Funding LLC 144A(c) USD 4.875% 12/03/2029 2,216,237 0.21350,000 Hewlett Packard Enterprise Co. USD 4.650% 01/10/2024 331,122 0.03
1,650,000 Huntington National Bank USD 3.250% 14/05/2021 1,390,743 0.13325,000 Huntington National Bank USD 1.800% 03/02/2023 278,499 0.03500,000 Intuit, Inc. USD 1.650% 15/07/2030 427,319 0.04330,000 JPMorgan Chase & Co.(d) USD 3.559% 23/04/2024 294,889 0.03325,000 JPMorgan Chase & Co.(d) USD 3.797% 23/07/2024 293,509 0.03900,000 JPMorgan Chase & Co.(d) USD 2.522% 22/04/2031 802,981 0.08800,000 JPMorgan Chase & Co.(d) USD 2.956% 13/05/2031 725,932 0.07750,000 JPMorgan Chase & Co.(d) USD 3.882% 24/07/2038 756,334 0.07650,000 JPMorgan Chase & Co.—Series HH(d) USD 4.600% Perp. 551,775 0.05
1,500,000 Keurig Dr Pepper, Inc. USD 2.550% 15/09/2026 1,361,436 0.13900,000 Keurig Dr Pepper, Inc. USD 4.597% 25/05/2028 911,509 0.09300,000 Keurig Dr Pepper, Inc. USD 3.200% 01/05/2030 284,037 0.0350,000 Keurig Dr Pepper, Inc. USD 5.085% 25/05/2048 58,762 0.01200,000 Keurig Dr Pepper, Inc. USD 3.800% 01/05/2050 200,308 0.02600,000 Marathon Petroleum Corp. USD 3.800% 01/04/2028 547,070 0.05900,000 Marriott International, Inc.—Series AA USD 4.650% 01/12/2028 847,143 0.08
1,550,000 Mondelez International, Inc. USD 2.750% 13/04/2030 1,417,593 0.133,600,000 Morgan Stanley(d) USD 3.622% 01/04/2031 3,493,220 0.331,275,000 Morgan Stanley(d) USD 5.597% 24/03/2051 1,709,587 0.161,550,000 Nasdaq, Inc. USD 3.250% 28/04/2050 1,421,315 0.13450,000 New York Life Insurance Co. 144A(c) USD 3.750% 15/05/2050 445,101 0.04700,000 Nutrition & Biosciences, Inc. 144A(c) USD 1.230% 01/10/2025 589,913 0.06250,000 Nutrition & Biosciences, Inc. 144A(c) USD 1.832% 15/10/2027 212,442 0.02
1,175,000 Nutrition & Biosciences, Inc. 144A(c) USD 2.300% 01/11/2030 1,007,059 0.09150,000 Nutrition & Biosciences, Inc. 144A(c) USD 3.268% 15/11/2040 135,189 0.01600,000 Nutrition & Biosciences, Inc. 144A(c) USD 3.468% 01/12/2050 549,501 0.05300,000 Occidental Petroleum Corp. USD 5.550% 15/03/2026 249,469 0.02300,000 Occidental Petroleum Corp. USD 6.450% 15/09/2036 238,840 0.02
1,000,000 Otis Worldwide Corp. USD 2.565% 15/02/2030 898,312 0.081,050,000 Otis Worldwide Corp. USD 3.112% 15/02/2040 960,454 0.091,150,000 PayPal Holdings, Inc. USD 2.300% 01/06/2030 1,024,229 0.10550,000 PayPal Holdings, Inc. USD 3.250% 01/06/2050 526,538 0.05450,000 PepsiCo, Inc. USD 3.625% 19/03/2050 474,572 0.04
1,200,000 Sabine Pass Liquefaction LLC USD 5.750% 15/05/2024 1,135,846 0.112,100,000 Sabine Pass Liquefaction LLC USD 5.625% 01/03/2025 2,025,142 0.19150,000 State of California USD 7.625% 01/03/2040 217,233 0.02150,000 State of Illinois USD 6.725% 01/04/2035 137,041 0.01
2,075,000 Steel Dynamics, Inc. USD 1.650% 15/10/2027 1,759,067 0.1750,000 Time Warner Cable LLC USD 4.125% 15/02/2021 41,782 0.00550,000 T-Mobile USA, Inc. 144A(c) USD 3.500% 15/04/2025 506,190 0.05
1,650,000 T-Mobile USA, Inc. 144A(c) USD 3.750% 15/04/2027 1,554,773 0.152,200,000 T-Mobile USA, Inc. 144A(c) USD 3.875% 15/04/2030 2,105,731 0.201,300,000 T-Mobile USA, Inc. 144A(c) USD 2.550% 15/02/2031 1,128,975 0.111,750,000 T-Mobile USA, Inc. 144A(c) USD 3.000% 15/02/2041 1,496,155 0.14850,000 Truist Bank USD 2.250% 11/03/2030 745,000 0.07300,000 VEREIT Operating Partnership LP USD 3.400% 15/01/2028 271,042 0.03
Goldman Sachs Funds—Global Fixed Income Portfolio (Hedged)Schedule of InvestmentsAs at 30 November 2020
The accompanying notes are an integral part of these financial statements.
315

Holdings Security Description Currency Interest Rate(a) Maturity Date(b)Market Value
EUR
% ofShareholders’
Equity
Bonds – (Continued)United States – (Continued)
3,160,000 Verizon Communications, Inc. USD 4.329% 21/09/2028 3,195,537 0.30833,000 Verizon Communications, Inc. 144A(c) USD 2.987% 30/10/2056 730,801 0.07
3,000,000 Walgreens Boots Alliance, Inc. USD 3.200% 15/04/2030 2,701,038 0.252,700,000 Wells Fargo & Co.(d) USD 2.188% 30/04/2026 2,358,705 0.222,350,000 Wells Fargo & Co.(d) USD 2.393% 02/06/2028 2,071,009 0.19725,000 Wells Fargo & Co.(d) USD 5.013% 04/04/2051 864,023 0.08
2,100,000 Wells Fargo Bank NA USD 3.550% 14/08/2023 1,894,140 0.18
139,908,756 13.15
TOTAL BONDS(cost EUR 181,619,102) 183,078,019 17.21
Agencies Asset Backed Obligations – 20.82%United States
1,845 Federal Home Loan Mortgage Corp. (FHLMC) USD 5.000% 01/08/2023 1,697 0.009,925 Federal Home Loan Mortgage Corp. (FHLMC) USD 5.000% 01/09/2023 9,133 0.004,263 Federal Home Loan Mortgage Corp. (FHLMC) USD 5.000% 01/07/2025 3,922 0.00
163,618 Federal Home Loan Mortgage Corp. (FHLMC) USD 3.000% 15/12/2027 7,687 0.0057,671 Federal Home Loan Mortgage Corp. (FHLMC) USD 6.000% 01/08/2028 53,816 0.01500,000 Federal Home Loan Mortgage Corp. (FHLMC) USD 6.750% 15/03/2031 643,258 0.06145,491 Federal Home Loan Mortgage Corp. (FHLMC) USD 5.000% 01/12/2038 140,867 0.01524,533 Federal Home Loan Mortgage Corp. (FHLMC)(d) USD 5.959% 15/07/2039 88,880 0.0111,327 Federal Home Loan Mortgage Corp. (FHLMC) USD 4.000% 01/06/2040 10,374 0.0058,763 Federal Home Loan Mortgage Corp. (FHLMC) USD 4.000% 01/02/2041 53,580 0.0133,583 Federal Home Loan Mortgage Corp. (FHLMC) USD 4.000% 01/02/2041 30,444 0.00278,155 Federal Home Loan Mortgage Corp. (FHLMC)(d) USD 5.859% 15/05/2041 35,069 0.006,563 Federal Home Loan Mortgage Corp. (FHLMC) USD 4.000% 01/11/2041 6,065 0.00
491,840 Federal Home Loan Mortgage Corp. (FHLMC)(d) USD 5.909% 15/03/2044 65,419 0.01614,273 Federal Home Loan Mortgage Corp. (FHLMC)(d) USD 5.859% 15/05/2046 88,926 0.01
1,084,724 Federal Home Loan Mortgage Corp. (FHLMC) USD 5.000% 01/12/2048 1,000,660 0.09981,730 Federal Home Loan Mortgage Corp. (FHLMC) USD 5.000% 01/01/2049 904,828 0.0940,533 Federal Home Loan Mortgage Corp. (FHLMC) USD 5.000% 01/06/2049 37,571 0.00377,572 Federal Home Loan Mortgage Corp. (FHLMC) USD 5.000% 01/07/2049 348,901 0.03702,066 Federal Home Loan Mortgage Corp. (FHLMC)(d) USD 5.951% 25/08/2049 106,564 0.01743,276 Federal Home Loan Mortgage Corp. (FHLMC) USD 5.000% 01/09/2049 686,041 0.06
4,054,588 Federal Home Loan Mortgage Corp. (FHLMC) USD 5.000% 01/10/2049 3,738,573 0.35664,478 Federal Home Loan Mortgage Corp. (FHLMC)(d) USD 5.850% 25/12/2049 69,183 0.01
2,748,796 Federal Home Loan Mortgage Corp. (FHLMC) USD 5.000% 01/04/2050 2,536,487 0.24251,204 Federal Home Loan Mortgage Corp. (FHLMC) USD 5.000% 01/04/2050 232,587 0.02
10,377,295 Federal Home Loan Mortgage Corp. (FHLMC) USD 4.500% 25/06/2050 1,185,824 0.113,144,074 Federal Home Loan Mortgage Corp. (FHLMC) USD 5.000% 25/07/2050 333,375 0.032,980,664 Federal Home Loan Mortgage Corp. (FHLMC)(d) USD 5.950% 25/07/2050 461,228 0.045,082,078 Federal Home Loan Mortgage Corp. (FHLMC) USD 3.000% 25/08/2050 521,202 0.053,410,637 Federal Home Loan Mortgage Corp. (FHLMC) USD 4.000% 25/08/2050 389,800 0.042,191,681 Federal Home Loan Mortgage Corp. (FHLMC) USD 2.000% 25/09/2050 156,655 0.01756,075 Federal Home Loan Mortgage Corp. (FHLMC) USD 4.000% 25/09/2050 86,631 0.0172,841 Federal National Mortgage Association (FNMA) USD 2.349% 25/05/2022 62,177 0.018,856 Federal National Mortgage Association (FNMA) USD 5.000% 01/12/2022 8,148 0.006,559 Federal National Mortgage Association (FNMA) USD 5.000% 01/04/2023 6,035 0.00
242,590 Federal National Mortgage Association (FNMA) USD 5.000% 01/05/2023 223,179 0.029,413 Federal National Mortgage Association (FNMA) USD 5.000% 01/07/2023 8,660 0.004,306 Federal National Mortgage Association (FNMA) USD 5.000% 01/09/2023 3,961 0.008,191 Federal National Mortgage Association (FNMA) USD 5.000% 01/07/2024 7,536 0.004,219 Federal National Mortgage Association (FNMA) USD 5.000% 01/02/2025 3,882 0.00
600,000 Federal National Mortgage Association (FNMA) USD 6.625% 15/11/2030 758,980 0.0768,099 Federal National Mortgage Association (FNMA) USD 5.000% 01/08/2031 62,651 0.01535,754 Federal National Mortgage Association (FNMA)(d) USD 4.900% 25/10/2040 59,019 0.01414,913 Federal National Mortgage Association (FNMA) USD 5.000% 25/06/2041 396,150 0.0415,229 Federal National Mortgage Association (FNMA) USD 4.500% 01/08/2041 14,208 0.00258,452 Federal National Mortgage Association (FNMA)(d) USD 6.400% 25/12/2041 38,909 0.00854,785 Federal National Mortgage Association (FNMA)(d) USD 6.520% 25/07/2042 121,330 0.0171,318 Federal National Mortgage Association (FNMA) USD 7.000% 25/07/2042 74,811 0.0126,013 Federal National Mortgage Association (FNMA) USD 7.000% 25/10/2042 26,693 0.0013,799 Federal National Mortgage Association (FNMA) USD 3.000% 01/12/2042 12,517 0.0012,472 Federal National Mortgage Association (FNMA) USD 3.000% 01/12/2042 11,333 0.0020,299 Federal National Mortgage Association (FNMA) USD 3.000% 01/12/2042 18,445 0.0025,071 Federal National Mortgage Association (FNMA) USD 3.000% 01/01/2043 22,781 0.0020,291 Federal National Mortgage Association (FNMA) USD 3.000% 01/01/2043 18,438 0.0054,478 Federal National Mortgage Association (FNMA) USD 3.000% 01/01/2043 49,502 0.0014,979 Federal National Mortgage Association (FNMA) USD 3.000% 01/01/2043 13,611 0.0029,827 Federal National Mortgage Association (FNMA) USD 3.000% 01/04/2043 27,103 0.00
Goldman Sachs Funds—Global Fixed Income Portfolio (Hedged)Schedule of InvestmentsAs at 30 November 2020
The accompanying notes are an integral part of these financial statements.
316

Holdings Security Description Currency Interest Rate(a) Maturity Date(b)Market Value
EUR
% ofShareholders’
Equity
Agencies Asset Backed Obligations – (Continued)United States – (Continued)
13,672 Federal National Mortgage Association (FNMA) USD 3.000% 01/04/2043 12,423 0.0017,862 Federal National Mortgage Association (FNMA) USD 3.000% 01/04/2043 16,231 0.0064,358 Federal National Mortgage Association (FNMA) USD 3.000% 01/04/2043 58,480 0.0155,888 Federal National Mortgage Association (FNMA) USD 3.000% 01/04/2043 50,783 0.00
1,456,114 Federal National Mortgage Association (FNMA)(d) USD 5.950% 25/06/2045 244,168 0.02761,350 Federal National Mortgage Association (FNMA)(d) USD 5.950% 25/05/2047 120,153 0.01525,736 Federal National Mortgage Association (FNMA) USD 4.500% 01/07/2047 483,091 0.05416,550 Federal National Mortgage Association (FNMA) USD 4.500% 01/07/2047 382,762 0.04221,086 Federal National Mortgage Association (FNMA) USD 4.500% 01/11/2047 203,556 0.02487,585 Federal National Mortgage Association (FNMA) USD 4.500% 01/11/2047 449,178 0.04
3,537,575 Federal National Mortgage Association (FNMA) USD 4.000% 01/01/2048 3,214,296 0.30638,374 Federal National Mortgage Association (FNMA)(d) USD 6.000% 25/02/2048 78,307 0.01
2,187,732 Federal National Mortgage Association (FNMA)(d) USD 2.500% 25/03/2048 112,419 0.011,845,539 Federal National Mortgage Association (FNMA) USD 4.000% 25/06/2048 238,501 0.0212,999,998 Federal National Mortgage Association (FNMA) USD 4.500% 01/07/2048 11,766,017 1.111,000,000 Federal National Mortgage Association (FNMA) USD 4.500% 01/08/2048 905,078 0.09993,936 Federal National Mortgage Association (FNMA) USD 5.000% 01/08/2048 917,685 0.09619,370 Federal National Mortgage Association (FNMA) USD 4.500% 01/09/2048 579,457 0.05
4,000,000 Federal National Mortgage Association (FNMA) USD 4.500% 01/10/2048 3,620,313 0.344,171,619 Federal National Mortgage Association (FNMA) USD 5.000% 01/11/2048 3,965,701 0.371,000,000 Federal National Mortgage Association (FNMA) USD 4.500% 01/01/2049 905,078 0.091,976,680 Federal National Mortgage Association (FNMA) USD 5.000% 01/02/2049 1,823,493 0.17361,030 Federal National Mortgage Association (FNMA) USD 5.000% 01/03/2049 333,229 0.03452,486 Federal National Mortgage Association (FNMA) USD 5.000% 01/03/2049 417,184 0.04532,226 Federal National Mortgage Association (FNMA) USD 5.000% 01/06/2049 490,618 0.05173,492 Federal National Mortgage Association (FNMA) USD 5.000% 01/08/2049 159,902 0.02
3,524,733 Federal National Mortgage Association (FNMA)(d) USD 5.900% 25/08/2049 595,867 0.06668,367 Federal National Mortgage Association (FNMA) USD 4.000% 25/07/2050 75,397 0.01601,217 Federal National Mortgage Association (FNMA) USD 5.000% 25/07/2050 77,343 0.01
3,429,628 Federal National Mortgage Association (FNMA) USD 2.000% 25/09/2050 245,140 0.02702,170 Federal National Mortgage Association (FNMA) USD 4.000% 25/09/2050 80,614 0.01
4,000,000 Federal National Mortgage Association (FNMA) TBA(g) USD 2.000% 14/12/2050 3,460,289 0.3324,000,000 Federal National Mortgage Association (FNMA) TBA(g) USD 3.000% 14/12/2050 20,903,153 1.964,000,000 Federal National Mortgage Association (FNMA) TBA(g) USD 5.000% 14/12/2050 3,689,405 0.35407,126 Government National Mortgage Association (GNMA)(d) USD 6.104% 20/02/2040 68,594 0.01270,539 Government National Mortgage Association (GNMA)(d) USD 5.854% 20/08/2040 43,917 0.00574,370 Government National Mortgage Association (GNMA)(d) USD 6.004% 20/06/2043 96,309 0.01
2,000,219 Government National Mortgage Association (GNMA)(d) USD 6.294% 20/07/2043 328,339 0.03165,837 Government National Mortgage Association (GNMA)(d) USD 6.554% 20/08/2043 31,578 0.00259,799 Government National Mortgage Association (GNMA)(d) USD 5.954% 20/09/2043 43,135 0.00393,407 Government National Mortgage Association (GNMA)(d) USD 5.954% 20/10/2043 47,082 0.00178,715 Government National Mortgage Association (GNMA)(d) USD 5.954% 20/11/2043 31,050 0.00213,060 Government National Mortgage Association (GNMA)(d) USD 5.454% 20/09/2044 31,462 0.00369,733 Government National Mortgage Association (GNMA) USD 4.000% 20/11/2044 338,068 0.03489,107 Government National Mortgage Association (GNMA)(d) USD 5.454% 20/11/2044 67,177 0.01436,546 Government National Mortgage Association (GNMA) USD 4.000% 20/12/2044 399,160 0.0434,728 Government National Mortgage Association (GNMA) USD 4.000% 20/05/2045 31,699 0.00314,563 Government National Mortgage Association (GNMA) USD 4.000% 20/08/2045 28,651 0.00
1,310,033 Government National Mortgage Association (GNMA)(d) USD 5.564% 20/08/2045 190,038 0.02266,555 Government National Mortgage Association (GNMA)(d) USD 6.104% 20/08/2045 40,011 0.0088,154 Government National Mortgage Association (GNMA) USD 4.000% 20/10/2045 80,237 0.01142,094 Government National Mortgage Association (GNMA)(d) USD 6.054% 20/11/2045 24,025 0.00199,825 Government National Mortgage Association (GNMA)(d) USD 6.104% 20/11/2045 28,928 0.00262,594 Government National Mortgage Association (GNMA) USD 4.000% 20/01/2046 238,463 0.02220,586 Government National Mortgage Association (GNMA) USD 4.000% 20/04/2046 23,855 0.00431,242 Government National Mortgage Association (GNMA) USD 4.500% 20/05/2048 390,412 0.04941,884 Government National Mortgage Association (GNMA) USD 4.500% 20/08/2048 851,478 0.08953,562 Government National Mortgage Association (GNMA) USD 5.000% 20/08/2048 874,826 0.08292,736 Government National Mortgage Association (GNMA)(d) USD 6.054% 20/08/2048 39,095 0.00
2,188,564 Government National Mortgage Association (GNMA) USD 4.500% 20/09/2048 1,978,497 0.19384,349 Government National Mortgage Association (GNMA) USD 5.000% 20/09/2048 352,613 0.03
1,920,153 Government National Mortgage Association (GNMA)(d) USD 6.054% 20/09/2048 257,380 0.021,619,878 Government National Mortgage Association (GNMA) USD 5.000% 20/10/2048 1,484,014 0.14710,340 Government National Mortgage Association (GNMA)(d) USD 6.004% 20/10/2048 90,982 0.01
2,087,432 Government National Mortgage Association (GNMA)(d) USD 6.004% 20/10/2048 277,613 0.033,732,391 Government National Mortgage Association (GNMA) USD 5.000% 20/11/2048 3,419,344 0.321,866,872 Government National Mortgage Association (GNMA) USD 5.000% 20/12/2048 1,701,756 0.168,683,387 Government National Mortgage Association (GNMA) USD 4.500% 20/01/2049 7,822,160 0.741,967,552 Government National Mortgage Association (GNMA) USD 5.000% 20/01/2049 1,797,030 0.17254,051 Government National Mortgage Association (GNMA) USD 5.904% 20/01/2049 32,918 0.00
1,131,309 Government National Mortgage Association (GNMA) USD 5.904% 20/01/2049 152,381 0.01
Goldman Sachs Funds—Global Fixed Income Portfolio (Hedged)Schedule of InvestmentsAs at 30 November 2020
The accompanying notes are an integral part of these financial statements.
317

Holdings Security Description Currency Interest Rate(a) Maturity Date(b)Market Value
EUR
% ofShareholders’
Equity
Agencies Asset Backed Obligations – (Continued)United States – (Continued)
489,003 Government National Mortgage Association (GNMA) USD 5.904% 20/01/2049 62,151 0.011,074,910 Government National Mortgage Association (GNMA)(d) USD 3.644% 20/02/2049 78,882 0.011,134,975 Government National Mortgage Association (GNMA) USD 4.000% 20/02/2049 1,012,198 0.101,638,275 Government National Mortgage Association (GNMA) USD 4.000% 20/03/2049 1,459,879 0.14563,348 Government National Mortgage Association (GNMA) USD 4.500% 20/03/2049 508,358 0.05
1,248,482 Government National Mortgage Association (GNMA) USD 5.000% 20/03/2049 1,138,864 0.111,200,101 Government National Mortgage Association (GNMA) USD 5.904% 20/04/2049 134,121 0.011,087,208 Government National Mortgage Association (GNMA) USD 4.000% 20/05/2049 967,970 0.092,088,619 Government National Mortgage Association (GNMA) USD 3.124% 20/06/2049 140,951 0.01297,758 Government National Mortgage Association (GNMA) USD 5.954% 20/06/2049 38,477 0.00985,783 Government National Mortgage Association (GNMA)(d) USD 5.904% 20/08/2049 127,485 0.01499,781 Government National Mortgage Association (GNMA)(d) USD 5.954% 20/08/2049 65,390 0.01941,752 Government National Mortgage Association (GNMA)(d) USD 5.954% 20/09/2049 122,116 0.01968,848 Government National Mortgage Association (GNMA)(d) USD 5.954% 20/09/2049 114,269 0.01
7,874,262 Government National Mortgage Association (GNMA) USD 3.500% 20/10/2049 760,504 0.071,486,105 Government National Mortgage Association (GNMA) USD 3.500% 20/10/2049 111,482 0.01729,394 Government National Mortgage Association (GNMA) USD 4.000% 20/10/2049 72,479 0.01
1,621,853 Government National Mortgage Association (GNMA) USD 4.500% 20/10/2049 1,460,266 0.142,827,371 Government National Mortgage Association (GNMA) USD 3.500% 20/12/2049 252,069 0.026,386,096 Government National Mortgage Association (GNMA) USD 4.500% 20/12/2049 5,732,376 0.54647,245 Government National Mortgage Association (GNMA)(d) USD 5.904% 20/01/2050 90,698 0.01
5,500,737 Government National Mortgage Association (GNMA)(d) USD 5.904% 20/02/2050 797,273 0.078,999,606 Government National Mortgage Association (GNMA) USD 4.500% 20/03/2050 8,033,218 0.761,139,462 Government National Mortgage Association (GNMA) USD 3.500% 20/04/2050 88,040 0.0111,221,505 Government National Mortgage Association (GNMA) USD 3.500% 20/04/2050 1,056,182 0.103,941,438 Government National Mortgage Association (GNMA)(d) USD 5.904% 20/04/2050 584,743 0.063,562,074 Government National Mortgage Association (GNMA) USD 4.000% 20/06/2050 392,009 0.041,092,351 Government National Mortgage Association (GNMA)(d) USD 6.004% 20/06/2050 144,712 0.011,595,718 Government National Mortgage Association (GNMA) USD 2.500% 20/10/2050 159,230 0.02788,479 Government National Mortgage Association (GNMA) USD 2.500% 20/10/2050 78,563 0.01
2,734,990 Government National Mortgage Association (GNMA) USD 2.500% 20/10/2050 224,008 0.022,100,000 Government National Mortgage Association (GNMA) USD 2.500% 20/11/2050 115,456 0.0149,000,000 Government National Mortgage Association (GNMA) TBA(g) USD 2.000% 21/12/2050 42,643,472 4.0117,000,000 Government National Mortgage Association (GNMA) TBA(g) USD 2.500% 21/12/2050 14,915,727 1.407,000,000 Government National Mortgage Association (GNMA) TBA(g) USD 3.000% 21/12/2050 6,093,015 0.5731,000,000 Government National Mortgage Association (GNMA) TBA(g) USD 2.000% 21/01/2051 26,916,945 2.535,000,000 Government National Mortgage Association (GNMA) TBA(g) USD 2.500% 21/01/2051 4,377,046 0.41
221,565,518 20.82
TOTAL AGENCIES ASSET BACKED OBLIGATIONS(cost EUR 225,686,377) 221,565,518 20.82
Non-Agencies Asset Backed Obligations – 3.32%Cayman Islands
259,721 ACIS CLO Ltd. 2014-4 �A� 144A(c)(d) USD 1.634% 01/05/2026 216,503 0.022,000,000 AGL CLO 3 Ltd. 2020-3A �A� 144A(c)(d) USD 1.537% 15/01/2033 1,669,369 0.162,650,000 Cedar Funding II CLO Ltd. 2013-1A �A1R� 144A(c)(d) USD 1.472% 09/06/2030 2,210,006 0.213,300,000 ICG US CLO Ltd. 2015-2RA �A1� 144A(c)(d) USD 1.600% 16/01/2033 2,735,574 0.264,300,000 Madison Park Funding XXX Ltd. 2018-30A �A� 144A(c)(d) USD 0.987% 15/04/2029 3,555,542 0.333,000,000 Marble Point CLO XVII Ltd. 2020-1A �A� 144A(c)(d) USD 1.518% 20/04/2033 2,499,843 0.2452,786 WhiteHorse VIII Ltd. 2014-1A �AR� 144A(c)(d) USD 1.114% 01/05/2026 43,964 0.00
12,930,801 1.22
United Kingdom124,884 Eurohome UK Mortgages Plc. 2007-2 �A2�(d) GBP 0.249% 15/09/2044 138,077 0.01
1,015,619 Finsbury Square Plc. 2018-2 �A�(d) GBP 1.010% 12/09/2068 1,133,947 0.10582,120 Harben Finance Plc. 2017-1X �A�(d) GBP 0.851% 20/08/2056 648,729 0.06
1,326,820 Malt Hill No 2 Plc. �A�(d) GBP 0.794% 27/11/2055 1,477,633 0.14261,276 Mortgage Funding Plc. 2008-1 �A1�(d) GBP 1.160% 13/03/2046 291,658 0.03
2,255,121 Stratton Mortgage Funding Plc. 2019-1 �A�(d) GBP 1.254% 25/05/2051 2,519,803 0.241,783,840 Tower Bridge Funding No 2 Plc. �A�(d) GBP 0.957% 20/03/2056 1,988,323 0.19
8,198,170 0.77
United States774,440 American Home Mortgage Assets Trust 2006-2 �1A1�(d) USD 1.703% 25/09/2046 622,659 0.06
1,050,000 BANK 2017-BNK4 �C�(d) USD 4.372% 15/05/2050 941,362 0.09480,000 BANK 2018-BNK15 �D� 144A(c) USD 3.000% 15/11/2061 309,999 0.03500,000 CFCRE Commercial Mortgage Trust 2016-C6 �D� 144A(c)(d) USD 4.345% 10/11/2049 331,496 0.03700,000 Citigroup Commercial Mortgage Trust 2017-P8 �D� 144A(c) USD 3.000% 15/09/2050 423,942 0.04
3,600,000 Ford Credit Auto Owner Trust 2018-1 �A� 144A(c) USD 3.190% 15/07/2031 3,289,265 0.31
Goldman Sachs Funds—Global Fixed Income Portfolio (Hedged)Schedule of InvestmentsAs at 30 November 2020
The accompanying notes are an integral part of these financial statements.
318

Holdings Security Description Currency Interest Rate(a) Maturity Date(b)Market Value
EUR
% ofShareholders’
Equity
Non-Agencies Asset Backed Obligations – (Continued)United States – (Continued)
1,415,952 Higher Education Funding 2014-1 �A� 144A(c)(d) USD 1.257% 25/05/2034 1,188,691 0.11380,000 JPMDB Commercial Mortgage Securities Trust 2017-C7 �D� 144A(c) USD 3.000% 15/10/2050 243,960 0.0256,752 KnowledgeWorks Foundation 2010-1 �A�(d) USD 1.157% 25/02/2042 47,160 0.01181,332 Lehman XS Trust Series 2005-5N �1A1�(d) USD 0.450% 25/11/2035 150,104 0.01537,239 Lehman XS Trust Series 2006-14N �1A1A�(d) USD 0.340% 25/09/2046 419,441 0.04300,000 Morgan Stanley Bank of America Merrill Lynch Trust 2013-C9 �A4� USD 3.102% 15/05/2046 258,931 0.02
2,511,861 Navient Student Loan Trust 2017-2 �A� 144A(c)(d) USD 1.200% 27/12/2066 2,087,748 0.201,433,995 PHEAA Student Loan Trust 2016-1A �A� 144A(c)(d) USD 1.300% 25/09/2065 1,199,371 0.11385,380 RASC 2006-KS7 Trust �A4�(d) USD 0.390% 25/09/2036 318,895 0.03
1,155,413 SLM Student Loan Trust 2005-5 �A4�(d) USD 0.355% 25/10/2028 958,554 0.09245,919 SLM Student Loan Trust 2008-2 �A3�(d) USD 0.965% 25/04/2023 199,191 0.02548,173 SLM Student Loan Trust 2008-4 �A4�(d) USD 1.865% 25/07/2022 456,433 0.04261,311 Soundview Home Loan Trust 2007-NS1 �A3�(d) USD 0.350% 25/01/2037 212,372 0.02900,000 Wells Fargo Commercial Mortgage Trust 2017-C38 �D� 144A(c) USD 3.000% 15/07/2050 545,399 0.05
14,204,973 1.33
TOTAL NON-AGENCIES ASSET BACKED OBLIGATIONS(cost EUR 36,386,272) 35,333,944 3.32
TOTAL TRANSFERABLE SECURITIES DEALT IN ANOTHER REGULATED MARKET(cost EUR 443,691,751) 439,977,481 41.35
Other Transferable Securities
Bonds – 0.26%Canada
1,800,000 Province of British Columbia Canada CAD 2.850% 18/06/2025 1,272,186 0.122,100,000 Province of Ontario Canada CAD 2.600% 02/06/2025 1,464,929 0.14
2,737,115 0.26
TOTAL BONDS(cost EUR 2,750,636) 2,737,115 0.26
TOTAL OTHER TRANSFERABLE SECURITIES(cost EUR 2,750,636) 2,737,115 0.26
MARKET VALUE OF INVESTMENTS EXCLUDING DERIVATIVES(cost EUR 1,089,570,410) 1,101,807,741 103.55
Covered Forward Mortgage Backed Securities – (0.25%)(3,000,000) Government National Mortgage Association (GNMA) TBA(h) USD 4.000% 21/12/2050 (2,659,061) (0.25)
TOTAL COVERED FORWARD MORTGAGE BACKED SECURITIES(cost EUR (2,698,282)) (2,659,061) (0.25)
Futures Contracts – 0.13%
Number ofContracts Security Description
CommitmentMarket Value
EUR
UnrealisedGainEUR
% ofShareholders’
Equity
AUD148 Australian Treasury Bonds 10YR Futures 15/12/2020 Long 13,539,548 40,489 0.01
EUR43 Euro BTP Italian Government Bond Futures 08/12/2020 Long 6,510,200 265,210 0.02133 Euro OAT Futures 08/12/2020 Long 22,599,360 308,050 0.03132 German Federal Republic Bonds 10YR Futures 08/12/2020 Long 23,144,880 101,690 0.0121 German Federal Republic Bonds 30YR Futures 08/12/2020 Long 4,758,180 181,760 0.02313 German Federal Republic Bonds 5Y Futures 08/12/2020 Long 42,383,330 137,250 0.0180 Short Euro Italian Government Bond Futures 08/12/2020 Long 9,120,800 85,200 0.01
108,516,750 1,079,160 0.10
GBP76 UK Long Gilt Bond Futures 29/03/2021 Long 11,387,374 26,901 0.00
JPY12 Japan Government Bonds 10YR Futures 14/12/2020 Long 14,587,985 11,514 0.00
USD450 US Treasury Long Bond Futures 22/03/2021 Long 65,544,114 21,162 0.00
Goldman Sachs Funds—Global Fixed Income Portfolio (Hedged)Schedule of InvestmentsAs at 30 November 2020
The accompanying notes are an integral part of these financial statements.
319

Futures Contracts – (Continued)
Number ofContracts Security Description
CommitmentMarket Value
EUR
UnrealisedGainEUR
% ofShareholders’
Equity
USD – (Continued)1,457 US Treasury Notes 10YR Futures 22/03/2021 Long 167,750,716 302,877 0.0376 US Treasury Ultra Long Bond Futures 22/03/2021 Long 13,663,354 4,483 0.00
246,958,184 328,522 0.03
UNREALISED GAIN ON FUTURES CONTRACTS 1,486,586 0.14
Number ofContracts Security Description
CommitmentMarket Value
EUR
UnrealisedLossEUR
% ofShareholders’
Equity
CAD147 Canadian Government Bond 10YR Futures 22/03/2021 Long 14,090,393 (21,710) (0.00)
EUR207 German Federal Republic Bonds 2YR Futures 08/12/2020 Long 23,252,310 (27,945) (0.00)
USD(114) US Treasury Notes 2YR Futures 31/03/2021 Short (20,986,543) (5,940) (0.00)(98) US Treasury Notes 5YR Futures 31/03/2021 Short (10,293,223) (3,003) (0.00)(534) US Treasury Ultra Long Notes 10YR Futures 22/03/2021 Short (69,891,213) (109,930) (0.01)
(101,170,979) (118,873) (0.01)
UNREALISED LOSS ON FUTURES CONTRACTS (168,528) (0.01)
Forward Currency Contracts – 0.58%
CurrencyAmountBought Currency
AmountSold
MaturityDate
UnrealisedGainEUR
% ofShareholders’
Equity
EUR 117,848,167 JPY 14,694,900,357 23/12/2020 368,747 0.03EUR 511,939,862 USD 607,208,199 21/01/2021 6,513,804 0.62EUR 47,954,686 CNH 377,024,537 24/02/2021 541,858 0.05
UNREALISED GAIN ON FORWARD CURRENCY CONTRACTS 7,424,409 0.70
CurrencyAmountBought Currency
AmountSold
MaturityDate
UnrealisedLossEUR
% ofShareholders’
Equity
EUR 853,313 SEK 8,884,735 10/12/2020 (19,716) (0.00)USD 6,242,313 THB 196,710,878 16/12/2020 (216,527) (0.02)EUR 9,625,599 CAD 15,039,633 21/12/2020 (63,971) (0.01)USD 4,761,991 IDR 69,257,917,491 06/01/2021 (98,352) (0.01)USD 10,913,124 KRW 12,289,705,466 08/01/2021 (159,062) (0.02)EUR 34,595,716 GBP 31,436,054 13/01/2021 (425,947) (0.04)USD 26,319,497 EUR 22,186,033 21/01/2021 (278,293) (0.02)
UNREALISED LOSS ON FORWARD CURRENCY CONTRACTS (1,261,868) (0.12)
Share Class Specific Forward Currency Contracts – (0.21%)
CurrencyAmountBought Currency
AmountSold
MaturityDate
UnrealisedGainEUR
% ofShareholders’
Equity
NOK 602,326,380 EUR 55,376,456 10/12/2020 1,662,799 0.16GBP 95,528,526 EUR 105,273,428 13/01/2021 1,151,117 0.10
UNREALISED GAIN ON FORWARD CURRENCY CONTRACTS HELD FOR HEDGING PURPOSES 2,813,916 0.26
CurrencyAmountBought Currency
AmountSold
MaturityDate
UnrealisedLossEUR
% ofShareholders’
Equity
CHF 11,751,878 EUR 10,933,666 10/12/2020 (94,528) (0.02)EUR 712,991 GBP 641,000 13/01/2021 (1,122) (0.00)USD 451,986,026 EUR 381,134,815 21/01/2021 (4,912,102) (0.45)
UNREALISED LOSS ON FORWARD CURRENCY CONTRACTS HELD FOR HEDGING PURPOSES (5,007,752) (0.47)
Goldman Sachs Funds—Global Fixed Income Portfolio (Hedged)Schedule of InvestmentsAs at 30 November 2020
The accompanying notes are an integral part of these financial statements.
320

Options – (0.07%)
Holdings Security Description
UnrealisedGain/(Loss)
EURMarket Value
EUR
% ofShareholders’
Equity
Purchased OptionsUSD
5,380,000 Call 3 month LIBOR Swaption Expires 15/01/2021 Strike 0.61 (20,452) 4,616 0.005,560,000 Call 3 month LIBOR Swaption Expires 12/02/2021 Strike 0.83 10,413 35,393 0.004,790,000 Call 3 month LIBOR Swaption Expires 16/02/2021 Strike 0.78 4,139 24,344 0.0041,000,000 Call 3 month LIBOR Swaption Expires 17/03/2021 Strike 1.10 (268,555) 148,059 0.0221,500,000 Call 3 month LIBOR Swaption Expires 14/11/2022 Strike 0.70 18,357 202,500 0.02
(256,098) 414,912 0.04
TOTAL PURCHASED OPTIONS(cost EUR 671,010) 414,912 0.04
Written OptionsEUR
(9,610,000) Call 6 month EURIBOR Swaption Expires 30/11/2020 Strike 0.15 (17,365) (99,050) (0.01)(5,160,000) Call 6 month EURIBOR Swaption Expires 30/11/2020 Strike 0.27 23,090 (1) (0.00)(780,000) Call 6 month EURIBOR Swaption Expires 30/11/2020 Strike 0.27 2,369 (0) (0.00)
(3,000,000) Call 6 month EURIBOR Swaption Expires 01/12/2020 Strike 0.15 (4,911) (30,861) (0.00)(2,050,000) Call 6 month EURIBOR Swaption Expires 02/12/2020 Strike 0.15 (1,372) (21,052) (0.00)(8,410,000) Call 6 month EURIBOR Swaption Expires 02/12/2020 Strike 0.20 21,036 (43,578) (0.01)(6,250,000) Call 6 month EURIBOR Swaption Expires 03/12/2020 Strike 0.20 20,714 (32,411) (0.01)(5,940,000) Call 6 month EURIBOR Swaption Expires 07/12/2020 Strike 0.26 13,901 (7,186) (0.00)(5,940,000) Call 6 month EURIBOR Swaption Expires 16/12/2020 Strike 0.21 (8,377) (30,355) (0.00)(5,940,000) Call 6 month EURIBOR Swaption Expires 23/12/2020 Strike 0.24 340 (20,525) (0.00)(4,750,000) Call 6 month EURIBOR Swaption Expires 14/01/2021 Strike 0.25 18,165 (18,647) (0.00)(4,750,000) Call 6 month EURIBOR Swaption Expires 14/01/2021 Strike 0.25 18,403 (18,647) (0.00)(6,570,000) Call 6 month EURIBOR Swaption Expires 15/01/2021 Strike 0.39 18,846 (4,018) (0.00)(6,780,000) Call 6 month EURIBOR Swaption Expires 12/02/2021 Strike 0.26 (8,953) (31,734) (0.01)(5,840,000) Call 6 month EURIBOR Swaption Expires 16/02/2021 Strike 0.29 (2,123) (20,665) (0.00)(9,610,000) Put 6 month EURIBOR Swaption Expires 30/11/2020 Strike 0.10 25,946 (1) (0.00)(5,160,000) Put 6 month EURIBOR Swaption Expires 30/11/2020 Strike 0.27 12,618 (10,473) (0.00)(780,000) Put 6 month EURIBOR Swaption Expires 30/11/2020 Strike 0.27 1,111 (1,561) (0.00)
(3,000,000) Put 6 month EURIBOR Swaption Expires 01/12/2020 Strike 0.10 7,200 (0) (0.00)(2,050,000) Put 6 month EURIBOR Swaption Expires 02/12/2020 Strike 0.10 3,895 (0) (0.00)(5,940,000) Put 6 month EURIBOR Swaption Expires 07/12/2020 Strike 0.26 7,288 (13,799) (0.00)(5,940,000) Put 6 month EURIBOR Swaption Expires 16/12/2020 Strike 0.21 13,755 (8,223) (0.00)(5,940,000) Put 6 month EURIBOR Swaption Expires 23/12/2020 Strike 0.24 2,825 (18,039) (0.00)(4,750,000) Put 6 month EURIBOR Swaption Expires 14/01/2021 Strike 0.00 11,487 (1,338) (0.00)(4,750,000) Put 6 month EURIBOR Swaption Expires 14/01/2021 Strike 0.00 11,487 (1,338) (0.00)
191,375 (433,502) (0.04)
USD(5,960,000) Call 3 month LIBOR Swaption Expires 30/11/2020 Strike 0.82 42,440 (1) (0.00)(5,960,000) Call 3 month LIBOR Swaption Expires 14/12/2020 Strike 0.90 (3,517) (34,659) (0.01)(5,960,000) Call 3 month LIBOR Swaption Expires 21/12/2020 Strike 0.87 4,279 (27,704) (0.00)(5,960,000) Call 3 month LIBOR Swaption Expires 29/12/2020 Strike 0.86 (847) (29,918) (0.00)(41,300,000) Call 3 month LIBOR Swaption Expires 06/01/2021 Strike 0.28 34,116 (4,441) (0.00)(41,310,000) Call 3 month LIBOR Swaption Expires 20/01/2021 Strike 0.31 28,044 (12,150) (0.00)(41,000,000) Call 3 month LIBOR Swaption Expires 17/03/2021 Strike 0.70 123,911 (34,576) (0.01)(41,000,000) Call 3 month LIBOR Swaption Expires 17/03/2021 Strike 0.90 204,554 (73,189) (0.01)(3,900,000) Call 3 month LIBOR Swaption Expires 06/04/2021 Strike 0.51 24,092 (15,854) (0.00)(5,200,000) Call 3 month LIBOR Swaption Expires 12/05/2021 Strike 0.45 34,066 (16,105) (0.00)(3,200,000) Call 3 month LIBOR Swaption Expires 18/05/2021 Strike 0.49 17,071 (12,694) (0.00)(3,400,000) Call 3 month LIBOR Swaption Expires 19/05/2021 Strike 0.48 18,804 (12,808) (0.00)(4,200,000) Call 3 month LIBOR Swaption Expires 14/11/2022 Strike 1.06 (23,869) (208,474) (0.02)(5,960,000) Put 3 month LIBOR Swaption Expires 30/11/2020 Strike 0.82 27,208 (15,233) (0.00)(5,960,000) Put 3 month LIBOR Swaption Expires 14/12/2020 Strike 0.90 19,707 (11,436) (0.00)(5,960,000) Put 3 month LIBOR Swaption Expires 21/12/2020 Strike 0.87 8,224 (23,759) (0.00)(5,960,000) Put 3 month LIBOR Swaption Expires 29/12/2020 Strike 0.86 637 (28,433) (0.00)(41,300,000) Put 3 month LIBOR Swaption Expires 06/01/2021 Strike 0.48 51,326 (37,180) (0.01)(41,310,000) Put 3 month LIBOR Swaption Expires 20/01/2021 Strike 0.51 60,177 (37,685) (0.01)(3,900,000) Put 3 month LIBOR Swaption Expires 06/04/2021 Strike 0.51 28,667 (11,278) (0.00)(5,200,000) Put 3 month LIBOR Swaption Expires 12/05/2021 Strike 0.45 24,345 (25,826) (0.00)
Goldman Sachs Funds—Global Fixed Income Portfolio (Hedged)Schedule of InvestmentsAs at 30 November 2020
The accompanying notes are an integral part of these financial statements.
321

Options – (Continued)
Holdings Security Description
UnrealisedGain/(Loss)
EURMarket Value
EUR
% ofShareholders’
Equity
Written Options – (Continued)USD – (Continued)
(3,200,000) Put 3 month LIBOR Swaption Expires 18/05/2021 Strike 0.49 16,321 (13,444) (0.00)(3,400,000) Put 3 month LIBOR Swaption Expires 19/05/2021 Strike 0.48 16,528 (15,084) (0.00)
756,284 (701,931) (0.07)
TOTAL WRITTEN OPTIONS(cost EUR (2,083,092)) (1,135,433) (0.11)
TOTAL OPTIONS(cost EUR (1,412,082)) (720,521) (0.07)
Swap Contracts – 0.00%Net LocalNotionalAmount Pay Receive Currency Maturity Date
UnrealisedGainEUR
% ofShareholders’
Equity
Interest Rate Swaps27,510,000 Floating (AUD 6 month BBSW) Fixed 0.553% AUD 16/05/2025 97,421 0.0112,760,000 Floating (AUD 6 month BBSW) Fixed 0.500% AUD 25/11/2025 5,200 0.0013,240,000 Floating (AUD 6 month BBSW) Fixed 1.550% AUD 12/11/2030 12,251 0.0044,925,000 Floating (BRL 1 month BRCDI) Fixed 4.120% BRL 03/01/2022 33,273 0.0085,090,000 Floating (CAD 3 month CDOR) Fixed 0.960% CAD 09/11/2024 8,096 0.004,330,000 Floating (CHF 6 month LIBOR) Fixed 0.000% CHF 16/12/2025 1,116 0.007,330,000 Fixed 0.000% Floating (CHF 6 month LIBOR) CHF 17/09/2030 9,562 0.0029,190,000 Floating (EUR 6 month LIBOR) Fixed 0.000% EUR 16/12/2022 33,269 0.0016,940,000 Fixed 0.000% Floating (EUR 6 month EURIBOR) EUR 16/12/2023 12,684 0.0029,690,000 Fixed 0.000% Floating (EUR 12 month LIBOR) EUR 19/11/2024 1,331 0.001,890,000 Floating (EUR 6 month EURIBOR) Fixed 0.080% EUR 15/01/2025 32,708 0.0053,680,000 Fixed 0.000% Floating (EUR 12 month LIBOR) EUR 16/12/2025 38,643 0.0133,100,000 Fixed 0.000% Floating (EUR 12 month LIBOR) EUR 16/12/2027 144,845 0.0121,930,000 Floating (EUR 6 month EURIBOR) Fixed 0.050% EUR 21/05/2030 39,393 0.0110,470,000 Fixed 0.260% Floating (EUR 6 month EURIBOR) EUR 21/05/2040 45,240 0.0110,210,000 Fixed 0.500% Floating (EUR 6 month EURIBOR) EUR 20/06/2050 29,746 0.001,840,000 Fixed 0.750% Floating (GBP 6 month LIBOR) GBP 16/12/2030 7,181 0.002,600,000 Floating (GBP 6 month LIBOR) Fixed 1.500% GBP 19/06/2040 45,229 0.013,280,000 Floating (GBP 6 month LIBOR) Fixed 1.000% GBP 20/06/2050 50,385 0.01
159,835,000 Floating (MXN 1 month TIIE) Fixed 4.500% MXN 14/12/2022 6,163 0.00116,890,000 Floating (MXN 1 month TIIE) Fixed 5.100% MXN 10/12/2025 29,408 0.006,670,000 Floating (MYR 3 month KLIBOR) Fixed 3.565% MYR 14/03/2024 64,940 0.01
157,600,000 Fixed 1.240% Floating (NOK 6 month NIBOR) NOK 29/10/2030 137,222 0.0146,420,000 Floating (NOK 6 month NIBOR) Fixed 1.000% NOK 18/03/2031 1,396 0.0025,310,000 Floating (PLN 6 month WIBOR) Fixed 0.345% PLN 16/06/2023 1,283 0.009,910,000 Floating (PLN 6 month WIBOR) Fixed 0.750% PLN 16/12/2025 14,018 0.00630,000 Floating (SGD 6 month SORF6) Fixed 1.250% SGD 16/09/2030 8,702 0.00
30,330,000 Fixed 0.750% Floating (USD 3 month LIBOR) USD 16/12/2023 27,323 0.0024,810,000 Fixed 1.543% Floating (USD 3 month LIBOR) USD 25/11/2035 24,935 0.002,480,000 Floating (USD 3 month LIBOR) Fixed 1.500% USD 02/12/2050 7,833 0.00
UNREALISED GAIN ON INTEREST RATE SWAPS 970,796 0.09
Credit Default Swaps24,600,000 Floating (The Markit CDX North America
Investment Grade 34 Index)Fixed 1.000% USD 20/06/2023 68,165 0.01
1,840,000 Floating (Colombia GovernmentInternational Bond)
Fixed 1.000% USD 20/06/2024 28,215 0.00
320,000 Floating (Indonesia GovernmentInternational Bond)
Fixed 1.000% USD 20/06/2024 4,369 0.00
120,000 Floating (Mexico GovernmentInternational Bond)
Fixed 1.000% USD 20/06/2024 2,737 0.00
10,000 Floating (Peruvian GovernmentInternational Bond)
Fixed 1.000% USD 20/06/2024 25 0.00
740,000 Floating (Saudi GovernmentInternational Bond)
Fixed 1.000% USD 20/06/2024 9,293 0.00
1,000,000 Floating (Chile Government InternationalBond)
Fixed 1.000% USD 20/12/2024 5,981 0.00
150,000 Floating (Indonesia GovernmentInternational Bond)
Fixed 1.000% USD 20/12/2024 2,089 0.00
520,000 Floating (Russian Foreign Bond -Eurobond)
Fixed 1.000% USD 20/12/2024 9,757 0.00
68,900,000 Floating (The Markit CDX North AmericaInvestment Grade 34 Index)
Fixed 1.000% USD 20/06/2025 357,081 0.03
Goldman Sachs Funds—Global Fixed Income Portfolio (Hedged)Schedule of InvestmentsAs at 30 November 2020
The accompanying notes are an integral part of these financial statements.
322

Swap Contracts – (Continued)
Net LocalNotionalAmount Pay Receive Currency Maturity Date
UnrealisedGainEUR
% ofShareholders’
Equity
Credit Default Swaps – (Continued)2,850,000 Floating (The Markit CMBX North
America BBB- 10 Index)Fixed 3.000% USD 18/11/2054 93,038 0.01
2,950,000 Floating (The Markit CMBX NorthAmerica BBB- 11 Index)
Fixed 3.000% USD 18/11/2054 264,907 0.02
1,550,000 Floating (The Markit CMBX NorthAmerica BBB- 8 Index)
Fixed 3.000% USD 17/10/2057 88,191 0.01
1,500,000 Floating (The Markit CMBX NorthAmerica BBB- 10 Index)
Fixed 3.000% USD 17/11/2059 86,798 0.01
UNREALISED GAIN ON CREDIT DEFAULT SWAPS 1,020,646 0.09
TOTAL UNREALISED GAIN ON SWAP CONTRACTS 1,991,442 0.18
Net LocalNotionalAmount Pay Receive Currency Maturity Date
UnrealisedLossEUR
% ofShareholders’
Equity
Interest Rate Swaps46,330,000 Floating (AUD 6 month BBSW) Fixed 0.920% AUD 04/09/2028 (38,297) (0.00)18,390,000 Floating (AUD 6 month BBSW) Fixed 1.240% AUD 28/10/2030 (114,419) (0.01)28,030,000 Floating (AUD 6 month BBSW) Fixed 1.250% AUD 09/11/2030 (39,360) (0.00)8,160,000 Floating (AUD 6 month BBSW) Fixed 1.000% AUD 16/12/2030 (69,090) (0.01)3,100,000 Floating (BRL 1 month BRCDI) Fixed 4.230% BRL 02/01/2023 (1,148) (0.00)19,425,000 Floating (BRL 1 month BRCDI) Fixed 4.930% BRL 02/01/2024 (44,837) (0.01)64,450,000 Floating (CAD 3 month CDOR) Fixed 0.700% CAD 18/11/2023 (4,781) (0.00)56,890,000 Floating (CAD 3 month CDOR) Fixed 1.250% CAD 16/12/2023 (3,312) (0.00)55,910,000 Floating (CAD 3 month CDOR) Fixed 0.810% CAD 30/09/2024 (68,354) (0.01)36,270,000 Floating (CAD 3 month CDOR) Fixed 0.812% CAD 17/11/2024 (10,163) (0.00)17,120,000 Fixed 1.430% Floating (CAD 3 month CDOR) CAD 09/11/2030 (34,887) (0.00)11,680,000 Floating (CAD 3 month CDOR) Fixed 1.500% CAD 19/03/2031 (22,361) (0.00)33,190,000 Floating (CHF 6 month LIBOR) Fixed 0.000% CHF 16/12/2027 (1,384) (0.00)930,000 Floating (CHF 6 month LIBOR) Fixed 0.000% CHF 16/12/2030 (946) (0.00)
46,390,000 Fixed 2.500% Floating (CNY 3 month LIBOR) CNY 17/03/2023 (6,832) (0.00)17,960,000 Fixed 0.000% Floating (EUR 12 month LIBOR) EUR 18/05/2025 (2,844) (0.00)16,380,000 Fixed 0.000% Floating (EUR 6 month LIBOR) EUR 16/12/2025 (40,306) (0.00)9,380,000 Fixed 0.000% Floating (EUR 6 month LIBOR) EUR 16/12/2027 (37,285) (0.00)46,380,000 Fixed 0.250% Floating (EUR 6 month EURIBOR) EUR 18/06/2030 (224,181) (0.02)33,430,000 Fixed 0.000% Floating (EUR 6 month LIBOR) EUR 16/12/2030 (90,899) (0.01)1,050,000 Fixed 0.000% Floating (EUR 6 month EURIBOR) EUR 16/12/2035 (10,944) (0.00)11,090,000 Fixed 0.750% Floating (EUR 6 month EURIBOR) EUR 19/06/2040 (13,346) (0.00)1,940,000 Fixed 0.250% Floating (EUR 6 month EURIBOR) EUR 16/12/2040 (24,252) (0.00)2,240,000 Fixed 0.100% Floating (EUR 6 month EURIBOR) EUR 02/12/2050 (449) (0.00)3,860,000 Fixed 0.250% Floating (EUR 6 month EURIBOR) EUR 16/12/2050 (13,693) (0.00)1,440,000 Floating (GBP 6 month LIBOR) Fixed 1.750% GBP 20/03/2039 (62,108) (0.01)1,560,000 Floating (GBP 6 month LIBOR) Fixed 0.750% GBP 16/12/2050 (25,410) (0.00)
425,400,000 Fixed 0.250% Floating (JPY 6 month LIBOR) JPY 19/03/2030 (3,439) (0.00)4,937,890,000 Fixed 0.144% Floating (JPY 6 month LIBOR) JPY 13/11/2030 (12,281) (0.00)410,890,000 Fixed 0.500% Floating (JPY 6 month LIBOR) JPY 19/03/2041 (17,726) (0.00)197,430,000 Fixed 0.500% Floating (JPY 6 month LIBOR) JPY 20/06/2050 (11,147) (0.00)166,450,000 Floating (NOK 6 month NIBOR) Fixed 0.750% NOK 16/12/2025 (101,655) (0.01)6,860,000 Floating (NZD 3 month NZDBB) Fixed 1.750% NZD 19/03/2030 (5,230) (0.00)49,300,000 Fixed 0.250% Floating (PLN 3 month WIBOR) PLN 16/12/2021 (4,833) (0.00)317,400,000 Floating (SEK 3 month STIBOR) Fixed 0.000% SEK 16/12/2025 (44,257) (0.01)36,060,000 Fixed 0.750% Floating (SEK 3 month STIBOR) SEK 18/06/2030 (10,191) (0.00)138,530,000 Floating (THB 6 month LIBOR) Fixed 0.750% THB 16/12/2025 (6,334) (0.00)30,600,000 Floating (USD 1 month LIBOR) Floating (USD 3 month LIBOR) USD 25/07/2024 (8,250) (0.00)18,150,000 Floating (USD 3 month SOFR) Floating (USD 3 month LIBOR) USD 10/11/2024 (11,338) (0.00)3,670,000 Fixed 1.000% Floating (USD 3 month LIBOR) USD 16/12/2025 (12,271) (0.00)34,550,000 Floating (USD 3 month LIBOR) Fixed 1.750% USD 18/06/2030 (255,207) (0.03)20,060,000 Fixed 1.190% Floating (USD 3 month LIBOR) USD 10/11/2030 (48,517) (0.01)22,440,000 Floating (USD 3 month LIBOR) Fixed 1.245% USD 24/11/2030 (11,757) (0.00)1,630,000 Fixed 1.000% Floating (USD 3 month LIBOR) USD 16/12/2030 (4,198) (0.00)8,600,000 Floating (USD 3 month LIBOR) Fixed 1.750% USD 19/06/2040 (92,722) (0.01)8,450,000 Floating (USD 3 month LIBOR) Fixed 1.750% USD 20/06/2050 (60,095) (0.01)82,156,898 Floating (ZAR 3 month JIBAR) Fixed 4.000% ZAR 16/06/2023 (31,066) (0.00)123,430,000 Floating (ZAR 3 month JIBAR) Fixed 5.250% ZAR 17/03/2026 (66,779) (0.01)
UNREALISED LOSS ON INTEREST RATE SWAPS (1,825,181) (0.17)
Credit Default Swaps800,000 Floating (Unibail-Rodamco-Westfield
S.E.)Fixed 1.000% EUR 20/06/2024 (16,798) (0.00)
Goldman Sachs Funds—Global Fixed Income Portfolio (Hedged)Schedule of InvestmentsAs at 30 November 2020
The accompanying notes are an integral part of these financial statements.
323

Swap Contracts – (Continued)
Net LocalNotionalAmount Pay Receive Currency Maturity Date
UnrealisedLossEUR
% ofShareholders’
Equity
Credit Default Swaps – (Continued)3,610,000 Fixed 1.000% Floating (China Government
International Bond)USD 20/12/2020 (2,017) (0.00)
500,000 Fixed 1.000% Floating (China GovernmentInternational Bond)
USD 20/12/2020 (323) (0.00)
160,000 Fixed 1.000% Floating (China GovernmentInternational Bond)
USD 20/12/2020 (105) (0.00)
110,000 Fixed 1.000% Floating (China GovernmentInternational Bond)
USD 20/12/2020 (69) (0.00)
160,000 Fixed 1.000% Floating (China GovernmentInternational Bond)
USD 20/12/2020 (94) (0.00)
4,300,000 Fixed 1.000% Floating (China GovernmentInternational Bond)
USD 20/12/2020 (2,957) (0.00)
510,000 Fixed 1.000% Floating (China GovernmentInternational Bond)
USD 20/12/2020 (254) (0.00)
780,000 Fixed 1.000% Floating (China GovernmentInternational Bond)
USD 20/12/2020 (381) (0.00)
100,000 Fixed 1.000% Floating (China GovernmentInternational Bond)
USD 20/06/2021 (537) (0.00)
150,000 Fixed 1.000% Floating (China GovernmentInternational Bond)
USD 20/06/2021 (800) (0.00)
40,000 Fixed 1.000% Floating (China GovernmentInternational Bond)
USD 20/06/2021 (212) (0.00)
290,000 Fixed 1.000% Floating (China GovernmentInternational Bond)
USD 20/06/2021 (1,538) (0.00)
180,000 Fixed 1.000% Floating (China GovernmentInternational Bond)
USD 20/06/2021 (979) (0.00)
10,000 Fixed 1.000% Floating (China GovernmentInternational Bond)
USD 20/06/2021 (57) (0.00)
32,325,000 Floating (The Markit CDX North AmericaInvestment Grade 28 Version 1 Index)
Fixed 1.000% USD 20/06/2022 (117,957) (0.01)
1,400,000 Floating (The Markit CMBX NorthAmerica BBB- 10 Index)
Fixed 3.000% USD 18/11/2054 (1,291) (0.00)
UNREALISED LOSS ON CREDIT DEFAULT SWAPS (146,369) (0.01)
TOTAL UNREALISED LOSS ON SWAP CONTRACTS (1,971,550) (0.18)
MARKET VALUE OF INVESTMENTS(cost EUR 1,085,460,046)
1,103,734,814 103.73
OTHER ASSETS AND LIABILITIES (39,763,944) (3.73)
SHAREHOLDERS’ EQUITY 1,063,970,870 100.00
TOTAL INVESTMENTSMarket Value
EUR
% ofShareholders’
Equity
Total Investments excluding derivatives (cost EUR 1,089,570,410) 1,101,807,741 103.55Market value of covered forward mortgage backed securities (cost EUR (2,698,282)) (2,659,061) (0.25)Unrealised gain on futures contracts 1,486,586 0.14Unrealised loss on futures contracts (168,528) (0.01)Unrealised gain on forward currency contracts 7,424,409 0.70Unrealised loss on forward currency contracts (1,261,868) (0.12)Unrealised gain on forward currency contracts held for hedging purposes 2,813,916 0.26Unrealised loss on forward currency contracts held for hedging purposes (5,007,752) (0.47)Market value of purchased options (cost EUR 671,010) 414,912 0.04Market value of written options (cost EUR (2,083,092)) (1,135,433) (0.11)Unrealised gain on swap contracts 1,991,442 0.18Unrealised loss on swap contracts (1,971,550) (0.18)Other Assets and Liabilities (39,763,944) (3.73)
Shareholders’ Equity 1,063,970,870 100.00
Goldman Sachs Funds—Global Fixed Income Portfolio (Hedged)Schedule of InvestmentsAs at 30 November 2020
The accompanying notes are an integral part of these financial statements.
324

The Futures Commission Merchant was Goldman Sachs & Co. LLC.
The counterparties for forward currency contracts were Bank of America N.A., Barclays Bank Plc., BNP Paribas S.A., Citibank N.A., HSBC Bank Plc., JP Morgan Chase Bank N.A.,Morgan Stanley & Co. International Plc., Natwest Markets Plc., Royal Bank of Canada, Standard Chartered Bank, State Street Bank & Trust, UBS AG and Westpac Banking Corp.
The counterparties for options contracts were Bank of America N.A., Citibank N.A., Deutsche Bank AG, JP Morgan Chase Bank N.A., Morgan Stanley & Co. International Plc. and UBSAG.
The counterparties for swap contracts were Bank of America N.A., Barclays Capital, Inc., Citibank N.A., Credit Suisse, Deutsche Bank AG, HSBC Bank Plc., JP Morgan Chase Bank N.A.and Morgan Stanley & Co. International Plc.
The maximum individual counterparty exposure as at 30 November 2020 is 0.57% of the NAV.
(a) Interest rates represent either the stated coupon rate, annualised discounted yield on date of purchase for discounted securities, or, for floating rate securities, the current reset ratewhich is based upon interest rates indices.
(b) Maturity dates represent either the stated date on the security, or the next interest reset date for floating rate securities or the prerefunded date for those type of securities.(c) 144A: This security is issued to qualified institutional investors, pursuant to private placements, and is transferable as stated in rule 144A of the US Securities Act of 1933.(d) Variable and floating coupon rates are those quoted as of 30 November 2020.(e) A related party to Goldman Sachs Funds.(f) The yield for this fund as at 30 November 2020 was (0.570%).(g) TBA (To Be Announced) Securities are purchased on a forward commitment basis with an approximate (generally +/-2.5%) principal amount and no defined maturity date. The actual
principal amount and maturity date will be determined upon settlement when the specific mortgage pools are assigned.(h) These represent TBA sales covered by long GNMA positions. These amounts are disclosed separately as Covered Forward Mortgage Backed Securities in the Statement of Assets
and Liabilities.
Goldman Sachs Funds—Global Fixed Income Portfolio (Hedged)Schedule of InvestmentsAs at 30 November 2020
The accompanying notes are an integral part of these financial statements.
325

Holdings Security Description Currency Interest Rate(a) Maturity Date(b)Market Value
USD
% ofShareholders’
Equity
Transferable securities admitted to an official exchange listing
Bonds – 23.82%Argentina
718,594 Argentina Government International Bond USD 1.000% 09/07/2029 309,714 0.016,541,845 Argentina Government International Bond(c) USD 0.125% 09/07/2030 2,574,216 0.0811,985,154 Argentina Government International Bond(c) USD 0.125% 09/07/2035 4,284,693 0.14
7,168,623 0.23
Canada646,000 Cenovus Energy, Inc. USD 3.000% 15/08/2022 653,442 0.02
5,621,000 Cenovus Energy, Inc. USD 3.800% 15/09/2023 5,800,366 0.193,335,000 Cenovus Energy, Inc. USD 5.375% 15/07/2025 3,685,242 0.126,170,000 Cenovus Energy, Inc. USD 5.250% 15/06/2037 6,466,468 0.213,100,000 Cenovus Energy, Inc. USD 6.750% 15/11/2039 3,682,335 0.12
20,287,853 0.66
Cayman Islands1,760,000 MGM China Holdings Ltd. USD 5.250% 18/06/2025 1,810,875 0.06
Curacao1,497,000 Teva Pharmaceutical Finance Co. BV—Series 2 USD 3.650% 10/11/2021 1,509,615 0.05
France18,158,000 Altice France S.A. 144A(d) USD 7.375% 01/05/2026 19,133,992 0.62315,000 Altice France S.A. 144A(d) USD 5.500% 15/01/2028 330,750 0.01
1,600,000 Banijay Group SAS EUR 6.500% 01/03/2026 1,939,855 0.07
21,404,597 0.70
Germany2,458,000 Cheplapharm Arzneimittel GmbH 144A(d) USD 5.500% 15/01/2028 2,556,320 0.083,200,000 Commerzbank AG(e) USD 7.000% Perp. 3,386,000 0.111,200,000 IHO Verwaltungs GmbH 144A(d) USD 6.000% 15/05/2027 1,248,000 0.042,747,000 IHO Verwaltungs GmbH 144A(d) USD 6.375% 15/05/2029 2,966,760 0.10
+ 2,850,000 Kirk Beauty One GmbH EUR 8.750% 15/07/2023 2,392,008 0.082,000,000 Schaeffler AG EUR 3.375% 12/10/2028 2,592,119 0.08755,000 Vertical Holdco GmbH 144A(d) USD 7.625% 15/07/2028 813,513 0.03
15,954,720 0.52
Ireland+ 3,045,000 Motion Bondco DAC 144A(d) USD 6.625% 15/11/2027 3,060,225 0.10
2,750,000 Virgin Media Vendor Financing Notes IV DAC 144A(d) USD 5.000% 15/07/2028 2,860,000 0.09
5,920,225 0.19
Italy975,000 Sisal Pay SpA(e) EUR 3.875% 17/12/2026 1,164,620 0.04
Luxembourg6,442,000 Altice Financing S.A. 144A(d) USD 7.500% 15/05/2026 6,788,258 0.224,035,000 ARD Finance S.A. EUR 5.000% 30/06/2027 4,962,689 0.164,800,000 ARD Finance S.A. 144A(d) USD 6.500% 30/06/2027 5,094,000 0.1719,180,000 Intelsat Luxembourg S.A. USD 8.125% 01/06/2023 671,300 0.024,286,000 Lincoln Financing SARL EUR 3.625% 01/04/2024 5,231,243 0.17
22,747,490 0.74
Netherlands4,295,000 AerCap Holdings NV(e) USD 5.875% 10/10/2079 4,101,725 0.131,150,000 Ashland Services BV EUR 2.000% 30/01/2028 1,371,564 0.057,793,000 Nouryon Holding BV 144A(d) USD 8.000% 01/10/2026 8,396,957 0.272,225,000 OCI NV 144A(d) USD 5.250% 01/11/2024 2,325,125 0.082,820,000 OCI NV 144A(d) USD 4.625% 15/10/2025 2,953,950 0.103,100,000 Sigma Holdco BV 144A(d) USD 7.875% 15/05/2026 3,088,375 0.10
3,000 Teva Pharmaceutical Finance Netherlands III BV USD 2.200% 21/07/2021 2,993 0.002,575,000 Trivium Packaging Finance BV 144A(d) USD 5.500% 15/08/2026 2,713,406 0.098,273,000 Trivium Packaging Finance BV 144A(d) USD 8.500% 15/08/2027 9,048,594 0.295,836,000 Ziggo Bond Co. BV EUR 3.375% 28/02/2030 7,083,180 0.232,300,000 Ziggo Bond Co. BV 144A(d) USD 5.125% 28/02/2030 2,435,125 0.08
43,520,994 1.42
Goldman Sachs Funds—Global High Yield PortfolioSchedule of InvestmentsAs at 30 November 2020
The accompanying notes are an integral part of these financial statements.
326

Holdings Security Description Currency Interest Rate(a) Maturity Date(b)Market Value
USD
% ofShareholders’
Equity
Bonds – (Continued)Norway
625,000 Adevinta ASA EUR 2.625% 15/11/2025 764,143 0.02675,000 Adevinta ASA EUR 3.000% 15/11/2027 839,331 0.03
1,603,474 0.05
Panama1,400,000 Carnival Corp. EUR 10.125% 01/02/2026 1,966,442 0.06
Supranationals10,574,000 Ardagh Packaging Finance Plc. Via Ardagh Holdings USA, Inc. 144A(d) USD 5.250% 15/08/2027 11,142,353 0.36940,000 CANPACK S.A. Via Eastern PA Land Investment Holding LLC 144A(d) USD 3.125% 01/11/2025 961,150 0.03
3,090,000 Clarios Global LP Via Clarios US Finance Co. EUR 4.375% 15/05/2026 3,845,607 0.13
15,949,110 0.52
Switzerland1,565,000 Credit Suisse Group AG(e) USD 6.250% Perp. 1,723,456 0.052,850,000 Credit Suisse Group AG 144A(d)(e) USD 5.250% Perp. 3,031,298 0.104,690,000 UBS Group AG 144A(d)(e) USD 7.000% Perp. 5,164,863 0.17
9,919,617 0.32
United Kingdom3,000,000 Algeco Global Finance Plc. 144A(d) USD 8.000% 15/02/2023 3,078,750 0.108,200,000 Barclays Plc.(e) USD 8.000% Perp. 9,204,500 0.302,025,000 Pinewood Finance Co., Ltd. GBP 3.250% 30/09/2025 2,750,401 0.09
+ 2,550,000 Stonegate Pub Co. Financing 2019 Plc. GBP 8.250% 31/07/2025 3,497,416 0.116,960,000 Valaris Plc. USD 5.400% 01/12/2042 447,493 0.013,015,000 Virgin Media Secured Finance Plc. 144A(d) USD 5.500% 15/05/2029 3,275,044 0.11
22,253,604 0.72
United States+ 10,710,000 American Axle & Manufacturing, Inc. USD 6.250% 01/04/2025 11,138,400 0.36
315,000 American Axle & Manufacturing, Inc. USD 6.500% 01/04/2027 329,175 0.013,430,000 American Axle & Manufacturing, Inc. USD 6.875% 01/07/2028 3,661,525 0.1210,215,000 AmeriGas Partners LP Via AmeriGas Finance Corp. USD 5.750% 20/05/2027 11,594,025 0.381,839,000 Anheuser-Busch InBev Worldwide, Inc. USD 4.500% 01/06/2050 2,320,984 0.081,824,000 Antero Resources Corp. USD 5.125% 01/12/2022 1,741,920 0.061,465,000 Apache Corp. USD 4.625% 15/11/2025 1,532,756 0.055,040,000 B&G Foods, Inc. USD 5.250% 01/04/2025 5,229,000 0.17185,000 CenturyLink, Inc. USD 5.625% 01/04/2025 199,338 0.01
7,445,000 CenturyLink, Inc.—Series G USD 6.875% 15/01/2028 8,617,587 0.283,450,000 CenturyLink, Inc.—Series P USD 7.600% 15/09/2039 4,079,625 0.132,425,000 CenturyLink, Inc.—Series W USD 6.750% 01/12/2023 2,697,812 0.09
+ 8,710,000 Chemours Co. USD 7.000% 15/05/2025 9,058,400 0.30320,000 CHS Via Community Health Systems, Inc. USD 6.250% 31/03/2023 327,200 0.01
3,491,000 Cinemark USA, Inc. USD 4.875% 01/06/2023 3,316,450 0.116,836,000 Cleveland-Cliffs, Inc. USD 5.750% 01/03/2025 6,887,270 0.221,332,000 Continental Resources, Inc. USD 4.500% 15/04/2023 1,368,737 0.042,141,000 Continental Resources, Inc. USD 3.800% 01/06/2024 2,167,762 0.073,850,000 Continental Resources, Inc. USD 4.900% 01/06/2044 3,594,937 0.12567,000 Covanta Holding Corp. USD 5.000% 01/09/2030 609,525 0.02
6,270,000 Dana, Inc. USD 5.375% 15/11/2027 6,677,550 0.22110,000 Dana, Inc. USD 5.625% 15/06/2028 119,075 0.00
1,824,000 DCP Midstream Operating LP USD 5.125% 15/05/2029 1,942,560 0.063,500,000 Delta Air Lines, Inc. USD 2.900% 28/10/2024 3,342,500 0.116,831,000 Delta Air Lines, Inc. USD 7.375% 15/01/2026 7,684,875 0.254,848,000 Encompass Health Corp. USD 4.500% 01/02/2028 5,114,640 0.173,390,000 EnLink Midstream LLC USD 5.375% 01/06/2029 3,203,550 0.103,003,000 EnLink Midstream Partners LP USD 4.400% 01/04/2024 2,901,649 0.094,553,000 EnLink Midstream Partners LP USD 5.450% 01/06/2047 3,414,750 0.112,761,000 EQM Midstream Partners LP USD 4.750% 15/07/2023 2,824,531 0.094,040,000 EQM Midstream Partners LP USD 5.500% 15/07/2028 4,312,700 0.142,893,000 EQT Corp. USD 3.000% 01/10/2022 2,900,232 0.093,500,000 EQT Corp. USD 7.875% 01/02/2025 4,025,000 0.132,050,000 FirstEnergy Corp. USD 2.650% 01/03/2030 2,030,546 0.072,045,000 FirstEnergy Corp.—Series C USD 4.850% 15/07/2047 2,495,404 0.087,002,000 Ford Motor Co. USD 9.000% 22/04/2025 8,526,791 0.2810,673,000 Ford Motor Co. USD 4.750% 15/01/2043 10,521,817 0.344,437,000 Ford Motor Credit Co., LLC USD 3.336% 18/03/2021 4,447,840 0.142,989,000 Ford Motor Credit Co., LLC USD 3.813% 12/10/2021 3,025,049 0.103,770,000 Ford Motor Credit Co., LLC USD 3.350% 01/11/2022 3,815,787 0.121,524,000 Ford Motor Credit Co., LLC USD 3.087% 09/01/2023 1,534,077 0.05
Goldman Sachs Funds—Global High Yield PortfolioSchedule of InvestmentsAs at 30 November 2020
The accompanying notes are an integral part of these financial statements.
327

Holdings Security Description Currency Interest Rate(a) Maturity Date(b)Market Value
USD
% ofShareholders’
Equity
Bonds – (Continued)United States – (Continued)
5,358,000 Ford Motor Credit Co., LLC USD 4.140% 15/02/2023 5,519,254 0.188,764,000 Ford Motor Credit Co., LLC USD 4.375% 06/08/2023 9,125,778 0.301,196,000 Ford Motor Credit Co., LLC USD 3.810% 09/01/2024 1,225,413 0.041,800,000 Ford Motor Credit Co., LLC USD 4.687% 09/06/2025 1,914,339 0.067,708,000 Ford Motor Credit Co., LLC USD 5.125% 16/06/2025 8,335,570 0.275,260,000 Ford Motor Credit Co., LLC USD 3.375% 13/11/2025 5,294,721 0.178,365,000 Ford Motor Credit Co., LLC USD 4.125% 17/08/2027 8,643,425 0.284,212,000 Freeport-McMoRan, Inc. USD 4.375% 01/08/2028 4,496,310 0.153,625,000 Freeport-McMoRan, Inc. USD 4.625% 01/08/2030 4,028,281 0.131,306,000 General Electric Co. USD 3.450% 01/05/2027 1,434,615 0.05855,000 General Motors Co. USD 5.400% 02/10/2023 958,472 0.03
5,097,000 Genesis Energy LP Via Genesis Energy Finance Corp. USD 5.625% 15/06/2024 4,816,665 0.16345,000 Genesis Energy LP Via Genesis Energy Finance Corp. USD 6.500% 01/10/2025 319,125 0.01350,000 Genesis Energy LP Via Genesis Energy Finance Corp. USD 6.250% 15/05/2026 325,500 0.01
3,845,000 Global Partners LP Via GLP Finance Corp. USD 7.000% 01/08/2027 4,114,150 0.13500,000 HB Fuller Co. USD 4.000% 15/02/2027 518,125 0.02625,000 HB Fuller Co. USD 4.250% 15/10/2028 645,313 0.02
2,450,000 HCA, Inc. USD 5.875% 01/05/2023 2,682,750 0.097,931,000 HCA, Inc. USD 5.375% 01/02/2025 8,892,634 0.299,850,000 HCA, Inc. USD 3.500% 01/09/2030 10,219,375 0.33944,000 Hillenbrand, Inc. USD 5.750% 15/06/2025 1,019,520 0.03
1,828,000 Howmet Aerospace, Inc. USD 6.875% 01/05/2025 2,121,906 0.071,698,000 Hyatt Hotels Corp. USD 5.750% 23/04/2030 2,035,613 0.077,345,000 L Brands, Inc. USD 5.250% 01/02/2028 7,638,800 0.255,371,000 Laredo Petroleum, Inc. USD 9.500% 15/01/2025 3,685,849 0.12805,000 Lennar Corp. USD 4.750% 15/11/2022 856,319 0.03
4,070,000 Lennar Corp. USD 5.875% 15/11/2024 4,705,937 0.1510,925,000 Level 3 Financing, Inc. USD 5.250% 15/03/2026 11,334,687 0.373,584,000 Macy’s Retail Holdings LLC USD 2.875% 15/02/2023 3,356,570 0.114,000,000 MGM Growth Properties Operating Partnership LP Via MGP Finance
Co-Issuer, Inc. USD 5.625% 01/05/2024 4,310,000 0.144,407,000 MGM Resorts International USD 7.750% 15/03/2022 4,726,507 0.156,085,000 MGM Resorts International USD 6.000% 15/03/2023 6,533,769 0.218,868,000 MGM Resorts International USD 5.500% 15/04/2027 9,510,930 0.311,505,000 MGM Resorts International USD 4.750% 15/10/2028 1,572,725 0.051,482,000 MPT Operating Partnership LP Via MPT Finance Corp. USD 4.625% 01/08/2029 1,580,108 0.057,025,000 MPT Operating Partnership LP Via MPT Finance Corp. USD 3.500% 15/03/2031 7,159,599 0.235,754,000 Navient Corp. USD 5.000% 15/03/2027 5,739,615 0.197,565,000 Newfield Exploration Co. USD 5.625% 01/07/2024 8,072,838 0.267,381,000 Nokia of America Corp. USD 6.450% 15/03/2029 8,229,815 0.274,504,000 NRG Energy, Inc. USD 5.750% 15/01/2028 4,920,620 0.164,010,000 NuStar Logistics LP USD 5.750% 01/10/2025 4,240,575 0.144,659,000 NuStar Logistics LP USD 5.625% 28/04/2027 4,845,360 0.169,792,000 Occidental Petroleum Corp. USD 2.700% 15/08/2022 9,605,169 0.31
+ 12,215,000 Occidental Petroleum Corp. USD 8.000% 15/07/2025 13,436,500 0.443,200,000 Occidental Petroleum Corp. USD 5.875% 01/09/2025 3,244,000 0.1120,469,000 Occidental Petroleum Corp. USD 4.400% 15/04/2046 17,424,236 0.575,910,000 Occidental Petroleum Corp. USD 4.200% 15/03/2048 4,801,875 0.164,747,000 Occidental Petroleum Corp. USD 4.400% 15/08/2049 3,892,540 0.132,838,000 Olin Corp. USD 5.000% 01/02/2030 2,979,900 0.106,429,000 OneMain Finance Corp. USD 8.875% 01/06/2025 7,232,625 0.242,294,000 OneMain Finance Corp. USD 6.625% 15/01/2028 2,666,775 0.094,561,000 Penske Automotive Group, Inc. USD 3.500% 01/09/2025 4,629,415 0.15385,000 PG&E Corp. USD 5.000% 01/07/2028 413,875 0.01
3,150,000 PG&E Corp. USD 5.250% 01/07/2030 3,449,250 0.111,847,000 Plains All American Pipeline LP Via PAA Finance Corp. USD 3.800% 15/09/2030 1,919,975 0.06956,000 Range Resources Corp. USD 5.000% 15/03/2023 939,270 0.03765,000 Service Corp. International USD 3.375% 15/08/2030 787,950 0.03
3,623,000 Southwestern Energy Co. USD 7.750% 01/10/2027 3,831,322 0.123,633,000 Spectrum Brands, Inc. USD 5.750% 15/07/2025 3,764,696 0.122,270,000 Suburban Propane Partners LP Via Suburban Energy Finance Corp. USD 5.500% 01/06/2024 2,326,750 0.082,785,000 Suburban Propane Partners LP Via Suburban Energy Finance Corp. USD 5.875% 01/03/2027 2,896,400 0.0911,601,000 Summit Midstream Holdings LLC Via Summit Midstream Finance Corp. USD 5.750% 15/04/2025 7,395,637 0.244,294,000 Targa Resources Partners LP Via Targa Resources Partners Finance Corp. USD 5.875% 15/04/2026 4,540,905 0.155,835,000 Tenet Healthcare Corp. USD 5.125% 01/05/2025 5,922,525 0.197,100,000 Tenet Healthcare Corp. USD 7.000% 01/08/2025 7,366,250 0.248,260,000 TransDigm, Inc. USD 6.500% 15/05/2025 8,507,800 0.284,870,000 TransDigm, Inc. USD 6.375% 15/06/2026 5,076,975 0.171,455,000 TransDigm, Inc. USD 7.500% 15/03/2027 1,564,125 0.0516,055,000 TransDigm, Inc. USD 5.500% 15/11/2027 16,616,925 0.54989,000 TreeHouse Foods, Inc. USD 4.000% 01/09/2028 1,008,780 0.03
Goldman Sachs Funds—Global High Yield PortfolioSchedule of InvestmentsAs at 30 November 2020
The accompanying notes are an integral part of these financial statements.
328

Holdings Security Description Currency Interest Rate(a) Maturity Date(b)Market Value
USD
% ofShareholders’
Equity
Bonds – (Continued)United States – (Continued)
930,000 TRI Pointe Group, Inc. USD 5.700% 15/06/2028 1,055,550 0.032,451,000 TRI Pointe Group, Inc. Via TRI Pointe Homes, Inc. USD 5.875% 15/06/2024 2,686,909 0.09
+ 250,000 Triumph Group, Inc. USD 7.750% 15/08/2025 219,375 0.011,347,000 United Rentals North America, Inc. USD 4.875% 15/01/2028 1,444,658 0.052,160,000 United Rentals North America, Inc. USD 3.875% 15/02/2031 2,273,400 0.07400,000 Vertical US Newco, Inc. 144A(d) USD 5.250% 15/07/2027 422,000 0.01
1,259,000 VMware, Inc. USD 4.700% 15/05/2030 1,530,591 0.052,150,000 Western Midstream Operating LP USD 5.375% 01/06/2021 2,171,500 0.072,910,000 Western Midstream Operating LP USD 5.050% 01/02/2030 3,118,181 0.10890,000 Western Midstream Operating LP USD 6.250% 01/02/2050 881,100 0.03980,000 Westlake Chemical Corp. USD 3.375% 15/06/2030 1,074,051 0.045,000 WPX Energy, Inc. USD 5.250% 15/09/2024 5,369 0.00
9,072,000 WPX Energy, Inc. USD 5.875% 15/06/2028 9,865,800 0.325,626,000 Xerox Corp. USD 4.375% 15/03/2023 5,902,197 0.19790,000 Yum! Brands, Inc. USD 3.625% 15/03/2031 793,950 0.03
538,727,904 17.54
TOTAL BONDS(cost USD 690,297,067) 731,909,763 23.82
Holdings Security DescriptionMarket Value
USD
% ofShareholders’
Equity
Common Stocks – 0.00%United States
819 Lear Corp. 118,771 0.00
TOTAL COMMON STOCKS(cost USD nil) 118,771 0.00
Holdings Security Description Currency Interest Rate(a)Market Value
USD
% ofShareholders’
Equity
Preferred Stocks – 0.08%
United States89,000 Bank of America Corp.—Series NN—Preferred USD 4.375% 2,320,230 0.08
TOTAL PREFERRED STOCKS(cost USD 2,225,000) 2,320,230 0.08
Holdings Security DescriptionMarket Value
USD
% ofShareholders’
Equity
Mutual Funds – 1.06%Ireland
32,461,621 Goldman Sachs US$ Treasury Liquid Reserves Fund (X Distribution Class)(f)(g) 32,461,621 1.06
TOTAL MUTUAL FUNDS(cost USD 32,461,621) 32,461,621 1.06
TOTAL TRANSFERABLE SECURITIES ADMITTED TO AN OFFICIAL EXCHANGE LISTING(cost USD 724,983,688) 766,810,385 24.96
Holdings Security Description Currency Interest Rate(a) Maturity Date(b)Market Value
USD
% ofShareholders’
Equity
Transferable securities dealt in another regulated market
Bonds – 71.55%Australia
6,972,000 FMG Resources August 2006 Pty Ltd. 144A(d) USD 5.125% 15/03/2023 7,381,605 0.24
Bermuda3,676,111 Digicel Group 0.5 Ltd. 144A(d) USD 8.000% 01/04/2025 1,369,351 0.05607,233 Digicel Group 0.5 Ltd. 144A(d) USD 7.000% Perp. 136,628 0.00
3,600,000 Nabors Industries Ltd. 144A(d) USD 7.250% 15/01/2026 2,038,500 0.074,110,000 NCL Corp., Ltd. 144A(d) USD 10.250% 01/02/2026 4,664,850 0.153,555,000 VOC Escrow Ltd. 144A(d) USD 5.000% 15/02/2028 3,448,350 0.11
11,657,679 0.38
Goldman Sachs Funds—Global High Yield PortfolioSchedule of InvestmentsAs at 30 November 2020
The accompanying notes are an integral part of these financial statements.
329

Holdings Security Description Currency Interest Rate(a) Maturity Date(b)Market Value
USD
% ofShareholders’
Equity
Bonds – (Continued)Canada
3,823,000 1011778 BC ULC Via New Red Finance, Inc. 144A(d) USD 4.375% 15/01/2028 3,956,805 0.139,589,000 1011778 BC ULC Via New Red Finance, Inc. 144A(d) USD 4.000% 15/10/2030 9,660,917 0.3111,445,000 Bausch Health Cos., Inc. 144A(d) USD 6.125% 15/04/2025 11,802,656 0.38930,000 Bausch Health Cos., Inc. 144A(d) USD 5.500% 01/11/2025 963,713 0.0340,000 Bausch Health Cos., Inc. 144A(d) USD 5.000% 30/01/2028 40,400 0.00
7,718,000 Bausch Health Cos., Inc. 144A(d) USD 6.250% 15/02/2029 8,219,670 0.278,310,000 Bausch Health Cos., Inc. 144A(d) USD 5.250% 30/01/2030 8,496,975 0.282,140,000 Bausch Health Cos., Inc. 144A(d) USD 5.250% 15/02/2031 2,182,800 0.073,200,000 Bombardier, Inc. 144A(d) USD 8.750% 01/12/2021 3,280,000 0.11413,000 Bombardier, Inc. 144A(d) USD 5.750% 15/03/2022 410,935 0.01
8,040,000 Bombardier, Inc. 144A(d) USD 6.125% 15/01/2023 7,537,500 0.2570,000 Bombardier, Inc. 144A(d) USD 7.500% 01/12/2024 62,650 0.00
7,855,000 Brookfield Residential Properties, Inc. Via Brookfield Residential US Corp.144A(d) USD 6.375% 15/05/2025 8,080,831 0.26
699,000 Brookfield Residential Properties, Inc. Via Brookfield Residential US Corp.144A(d) USD 4.875% 15/02/2030 691,136 0.02
970,000 Clarios Global LP 144A(d) USD 6.750% 15/05/2025 1,046,388 0.03986,000 GFL Environmental, Inc. 144A(d) USD 4.250% 01/06/2025 1,026,673 0.03
4,350,000 GFL Environmental, Inc. 144A(d) USD 3.750% 01/08/2025 4,469,625 0.155,102,000 GFL Environmental, Inc. 144A(d) USD 8.500% 01/05/2027 5,688,730 0.195,570,000 Hudbay Minerals, Inc. 144A(d) USD 6.125% 01/04/2029 5,966,862 0.193,354,000 Husky III Holding Ltd. 144A(d) USD 13.000% 15/02/2025 3,622,320 0.122,930,000 Masonite International Corp. 144A(d) USD 5.375% 01/02/2028 3,127,775 0.103,375,000 Mattamy Group Corp. 144A(d) USD 5.250% 15/12/2027 3,585,938 0.121,992,000 Mattamy Group Corp. 144A(d) USD 4.625% 01/03/2030 2,106,540 0.072,026,000 MEG Energy Corp. 144A(d) USD 7.000% 31/03/2024 2,036,130 0.075,470,000 MEG Energy Corp. 144A(d) USD 7.125% 01/02/2027 5,415,300 0.184,980,000 Methanex Corp. USD 5.125% 15/10/2027 5,291,250 0.176,151,000 Open Text Corp. 144A(d) USD 3.875% 15/02/2028 6,397,040 0.215,100,000 Precision Drilling Corp. USD 7.750% 15/12/2023 4,080,000 0.13507,000 Telesat Canada Via Telesat LLC 144A(d) USD 4.875% 01/06/2027 524,111 0.02
119,771,670 3.90
Cayman Islands13,208,271 Global Aircraft Leasing Co., Ltd. 144A(d) USD 6.500% 15/09/2024 11,755,361 0.38688,000 Noble Holding International Ltd. USD 7.750% 15/01/2024 5,160 0.00
4,851,000 Noble Holding International Ltd. 144A(d) USD 7.875% 01/02/2026 1,327,040 0.04910,000 Sands China Ltd. USD 4.375% 18/06/2030 988,114 0.03
3,733,200 Transocean Phoenix 2 Ltd. 144A(d) USD 7.750% 15/10/2024 3,546,540 0.124,560,000 Transocean Poseidon Ltd. 144A(d) USD 6.875% 01/02/2027 3,853,200 0.137,115,000 Transocean, Inc. 144A(d) USD 7.500% 15/01/2026 2,098,925 0.075,577,000 Transocean, Inc. 144A(d) USD 11.500% 30/01/2027 2,983,695 0.104,265,000 Transocean, Inc. 144A(d) USD 8.000% 01/02/2027 1,695,338 0.05
28,253,373 0.92
France8,161,000 Altice France S.A. 144A(d) USD 8.125% 01/02/2027 9,048,509 0.292,350,000 Constellium S.E. 144A(d) USD 5.875% 15/02/2026 2,441,532 0.081,350,000 Constellium S.E. 144A(d) USD 5.625% 15/06/2028 1,451,250 0.05480,000 SPCM S.A. 144A(d) USD 4.875% 15/09/2025 497,700 0.02
13,438,991 0.44
Germany7,430,000 Deutsche Bank AG(e) USD 4.875% 01/12/2032 7,717,912 0.252,400,000 Deutsche Bank AG(e) USD 6.000% Perp. 2,382,000 0.083,375,000 IHO Verwaltungs GmbH 144A(d) USD 4.750% 15/09/2026 3,493,125 0.11
13,593,037 0.44
Ireland2,250,000 Virgin Media Vendor Financing Notes III DAC GBP 4.875% 15/07/2028 3,097,254 0.10
Italy3,000,000 Intesa Sanpaolo SpA 144A(d) USD 5.017% 26/06/2024 3,277,500 0.115,465,000 Intesa Sanpaolo SpA 144A(d) USD 5.710% 15/01/2026 6,180,915 0.203,275,000 UniCredit SpA 144A(d)(e) USD 5.459% 30/06/2035 3,549,751 0.11
13,008,166 0.42
Jersey3,085,000 Adient Global Holdings Ltd. 144A(d) USD 4.875% 15/08/2026 3,131,275 0.10
Goldman Sachs Funds—Global High Yield PortfolioSchedule of InvestmentsAs at 30 November 2020
The accompanying notes are an integral part of these financial statements.
330

Holdings Security Description Currency Interest Rate(a) Maturity Date(b)Market Value
USD
% ofShareholders’
Equity
Bonds – (Continued)Liberia
1,654,000 Royal Caribbean Cruises Ltd. 144A(d) USD 10.875% 01/06/2023 1,871,567 0.06137,000 Royal Caribbean Cruises Ltd. 144A(d) USD 4.250% 15/06/2023 191,839 0.01
2,341,000 Royal Caribbean Cruises Ltd. 144A(d) USD 9.125% 15/06/2023 2,507,796 0.08
4,571,202 0.15
Luxembourg6,786,000 Altice France Holding S.A. 144A(d) USD 10.500% 15/05/2027 7,702,110 0.254,843,000 Camelot Finance S.A. 144A(d) USD 4.500% 01/11/2026 5,091,204 0.173,065,000 Dana Financing Luxembourg SARL 144A(d) USD 5.750% 15/04/2025 3,202,925 0.102,095,000 FAGE International S.A. Via FAGE USA Dairy Industry, Inc. 144A(d) USD 5.625% 15/08/2026 2,131,663 0.077,628,000 Intelsat Connect Finance S.A. 144A(d) USD 9.500% 15/02/2023 2,135,840 0.07285,000 Intelsat Jackson Holdings S.A. 144A(d) USD 9.500% 30/09/2022 316,350 0.01
9,165,000 Intelsat Jackson Holdings S.A. 144A(d) USD 8.500% 15/10/2024 6,461,325 0.21+ 22,165,000 Intelsat Jackson Holdings S.A. 144A(d) USD 9.750% 15/07/2025 15,654,031 0.51
6,490,000 Intelsat S.A. USD 4.500% 15/06/2025 2,166,037 0.0714,673,000 Telecom Italia Capital S.A. USD 7.200% 18/07/2036 19,074,900 0.62292,000 Telecom Italia Capital S.A. USD 7.721% 04/06/2038 400,770 0.01
64,337,155 2.09
Netherlands3,090,000 Alcoa Nederland Holding BV 144A(d) USD 7.000% 30/09/2026 3,321,750 0.114,680,000 Alcoa Nederland Holding BV 144A(d) USD 5.500% 15/12/2027 5,066,100 0.16900,000 Alcoa Nederland Holding BV 144A(d) USD 6.125% 15/05/2028 993,375 0.03448,000 Sensata Technologies BV 144A(d) USD 5.000% 01/10/2025 498,400 0.02
9,879,625 0.32
Panama1,430,000 Carnival Corp. 144A(d) USD 7.625% 01/03/2026 1,517,588 0.052,025,000 Carnival Corp. 144A(d) USD 9.875% 01/08/2027 2,389,500 0.08
3,907,088 0.13
Supranationals4,015,000 Ardagh Packaging Finance Plc. Via Ardagh Holdings USA, Inc. 144A(d) USD 5.250% 30/04/2025 4,270,956 0.14372,000 Ardagh Packaging Finance Plc. Via Ardagh Holdings USA, Inc. 144A(d) USD 5.250% 15/08/2027 391,065 0.01
1,340,000 Axalta Coating Systems LLC Via Axalta Coating Systems Dutch Holding BBV 144A(d) USD 4.750% 15/06/2027 1,420,400 0.05
10,225,000 Clarios Global LP Via Clarios US Finance Co. 144A(d) USD 8.500% 15/05/2027 10,940,750 0.362,021,000 Herbalife Nutrition Ltd. Via HLF Financing, Inc. 144A(d) USD 7.875% 01/09/2025 2,223,100 0.073,023,000 JBS USA LUX S.A. Via JBS USA Finance, Inc. 144A(d) USD 5.750% 15/06/2025 3,132,584 0.101,325,000 JBS USA LUX S.A. Via JBS USA Food Co. Via JBS USA Finance, Inc.
144A(d) USD 6.500% 15/04/2029 1,525,406 0.054,069,000 JBS USA LUX S.A. Via JBS USA Food Co. Via JBS USA Finance, Inc.
144A(d) USD 5.500% 15/01/2030 4,613,229 0.159,096,000 Titan Acquisition Ltd. Via Titan Co-Borrower LLC 144A(d) USD 7.750% 15/04/2026 9,505,320 0.31
38,022,810 1.24
United Kingdom3,100,000 Algeco Global Finance 2 Plc. 144A(d) USD 10.000% 15/08/2023 3,131,000 0.103,676,000 EG Global Finance Plc. 144A(d) USD 6.750% 07/02/2025 3,804,660 0.127,530,000 EG Global Finance Plc. 144A(d) USD 8.500% 30/10/2025 8,132,400 0.273,457,000 International Game Technology Plc. 144A(d) USD 5.250% 15/01/2029 3,668,741 0.121,300,000 Natwest Group Plc.—Series U(e) USD 2.540% Perp. 1,233,375 0.04300,000 TransDigm UK Holdings Plc. USD 6.875% 15/05/2026 319,500 0.01
4,170,000 Tronox Finance Plc. 144A(d) USD 5.750% 01/10/2025 4,305,525 0.144,295,000 Valaris Plc. USD 5.750% 01/10/2044 209,381 0.016,100,000 Virgin Media Finance Plc. 144A(d) USD 5.000% 15/07/2030 6,427,875 0.214,372,000 Virgin Media Secured Finance Plc. 144A(d) USD 5.500% 15/08/2026 4,590,600 0.15
35,823,057 1.17
United States780,000 Acadia Healthcare Co., Inc. USD 5.625% 15/02/2023 788,775 0.03439,000 Acadia Healthcare Co., Inc. USD 6.500% 01/03/2024 453,268 0.02
3,352,000 Acadia Healthcare Co., Inc. 144A(d) USD 5.500% 01/07/2028 3,620,160 0.124,450,000 Acrisure LLC Via Acrisure Finance, Inc. 144A(d) USD 8.125% 15/02/2024 4,694,750 0.155,170,000 Acrisure LLC Via Acrisure Finance, Inc. 144A(d) USD 7.000% 15/11/2025 5,350,950 0.171,405,000 AdaptHealth LLC 144A(d) USD 6.125% 01/08/2028 1,517,400 0.056,700,000 Adient US LLC 144A(d) USD 7.000% 15/05/2026 7,286,250 0.246,781,000 ADT Security Corp. USD 4.125% 15/06/2023 7,137,002 0.23
Goldman Sachs Funds—Global High Yield PortfolioSchedule of InvestmentsAs at 30 November 2020
The accompanying notes are an integral part of these financial statements.
331

Holdings Security Description Currency Interest Rate(a) Maturity Date(b)Market Value
USD
% ofShareholders’
Equity
Bonds – (Continued)United States – (Continued)
5,705,000 Albertsons Cos., Inc. Via Safeway, Inc. Via New Albertsons LP ViaAlbertsons LLC USD 5.750% 15/03/2025 5,897,544 0.19
5,175,000 Albertsons Cos., Inc. Via Safeway, Inc. Via New Albertsons LP ViaAlbertsons LLC 144A(d) USD 7.500% 15/03/2026 5,821,875 0.19
4,875,000 Albertsons Cos., Inc. Via Safeway, Inc. Via New Albertsons LP ViaAlbertsons LLC 144A(d) USD 4.625% 15/01/2027 5,130,937 0.17
4,205,000 Albertsons Cos., Inc. Via Safeway, Inc. Via New Albertsons LP ViaAlbertsons LLC 144A(d) USD 5.875% 15/02/2028 4,546,656 0.15
4,725,000 Albertsons Cos., Inc. Via Safeway, Inc. Via New Albertsons LP ViaAlbertsons LLC 144A(d) USD 3.500% 15/03/2029 4,724,338 0.15
3,656,000 Albertsons Cos., Inc. Via Safeway, Inc. Via New Albertsons LP ViaAlbertsons LLC 144A(d) USD 4.875% 15/02/2030 3,998,750 0.13
667,000 Allegheny Technologies, Inc. 144A(d) USD 3.500% 15/06/2025 818,446 0.034,479,000 Allen Media LLC Via Allen Media Co-Issuer, Inc. 144A(d) USD 10.500% 15/02/2028 4,602,172 0.1512,202,000 Alliant Holdings Intermediate LLC Via Alliant Holdings Co-Issuer 144A(d) USD 6.750% 15/10/2027 13,178,160 0.434,932,000 Allied Universal Holdco LLC Via Allied Universal Finance Corp. 144A(d) USD 6.625% 15/07/2026 5,314,230 0.179,924,000 Allied Universal Holdco LLC Via Allied Universal Finance Corp. 144A(d) USD 9.750% 15/07/2027 11,040,450 0.362,532,000 Allison Transmission, Inc. 144A(d) USD 3.750% 30/01/2031 2,547,825 0.08
+ 8,784,000 AMC Entertainment Holdings, Inc. 144A(d) USD 10.500% 15/04/2025 7,027,200 0.235,134,000 American Builders & Contractors Supply Co., Inc. 144A(d) USD 5.875% 15/05/2026 5,365,030 0.17882,000 American Woodmark Corp. 144A(d) USD 4.875% 15/03/2026 901,845 0.03
6,095,000 Amkor Technology, Inc. 144A(d) USD 6.625% 15/09/2027 6,628,312 0.225,371,000 ANGI Group LLC 144A(d) USD 3.875% 15/08/2028 5,350,859 0.172,273,000 Antero Midstream Partners LP Via Antero Midstream Finance Corp. 144A(d) USD 5.750% 01/03/2027 2,091,160 0.074,668,000 Apache Corp. USD 4.375% 15/10/2028 4,714,680 0.153,365,000 Apache Corp. USD 4.250% 15/01/2030 3,339,763 0.114,383,000 APX Group, Inc. 144A(d) USD 6.750% 15/02/2027 4,739,119 0.15823,000 Aramark Services, Inc. 144A(d) USD 6.375% 01/05/2025 880,610 0.03501,000 Arches Buyer, Inc. 144A(d) USD 6.125% 01/12/2028 516,656 0.02412,000 Asbury Automotive Group, Inc. USD 4.500% 01/03/2028 429,510 0.01275,000 Asbury Automotive Group, Inc. USD 4.750% 01/03/2030 292,875 0.01
3,109,000 Avient Corp. 144A(d) USD 5.750% 15/05/2025 3,330,516 0.116,355,000 Axalta Coating Systems LLC 144A(d) USD 3.375% 15/02/2029 6,466,212 0.219,645,000 Banff Merger Sub, Inc. 144A(d) USD 9.750% 01/09/2026 10,380,431 0.341,704,000 Bank of New York Mellon Corp.—Series G(e) USD 4.700% Perp. 1,870,515 0.0618,835,000 Bausch Health Americas, Inc. 144A(d) USD 9.250% 01/04/2026 20,977,481 0.682,375,000 Bausch Health Americas, Inc. 144A(d) USD 8.500% 31/01/2027 2,627,344 0.0916,248,000 Beacon Roofing Supply, Inc. 144A(d) USD 4.875% 01/11/2025 16,654,200 0.544,975,000 Berry Global, Inc. 144A(d) USD 5.625% 15/07/2027 5,329,469 0.174,300,000 Berry Petroleum Co., LLC 144A(d) USD 7.000% 15/02/2026 3,461,500 0.112,243,000 Black Knight InfoServ LLC 144A(d) USD 3.625% 01/09/2028 2,282,253 0.073,092,000 Boeing Co. USD 2.750% 01/02/2026 3,173,010 0.103,092,000 Boeing Co. USD 3.625% 01/02/2031 3,279,561 0.111,492,000 Booz Allen Hamilton, Inc. 144A(d) USD 3.875% 01/09/2028 1,555,485 0.051,632,000 BorgWarner, Inc. 144A(d) USD 5.000% 01/10/2025 1,913,651 0.062,548,000 Boxer Parent Co., Inc. 144A(d) USD 7.125% 02/10/2025 2,758,210 0.091,668,000 Boyd Gaming Corp. USD 6.000% 15/08/2026 1,745,145 0.063,600,000 Boyd Gaming Corp. USD 4.750% 01/12/2027 3,659,422 0.121,199,000 Boyd Gaming Corp. 144A(d) USD 8.625% 01/06/2025 1,336,885 0.042,310,000 Broadcom, Inc. USD 4.300% 15/11/2032 2,741,485 0.09700,000 Buckeye Partners LP USD 4.350% 15/10/2024 708,750 0.02
6,019,000 Buckeye Partners LP USD 3.950% 01/12/2026 5,876,049 0.193,160,000 Buckeye Partners LP 144A(d) USD 4.125% 01/03/2025 3,175,800 0.102,095,000 Buckeye Partners LP 144A(d) USD 4.500% 01/03/2028 2,095,000 0.079,419,000 Builders FirstSource, Inc. 144A(d) USD 6.750% 01/06/2027 10,219,615 0.33812,000 Builders FirstSource, Inc. 144A(d) USD 5.000% 01/03/2030 883,050 0.03
1,593,000 Burlington Stores, Inc. 144A(d) USD 2.250% 15/04/2025 2,004,106 0.071,822,000 BWX Technologies, Inc. 144A(d) USD 4.125% 30/06/2028 1,901,713 0.06489,000 BY Crown Parent LLC Via BY Bond Finance, Inc. 144A(d) USD 4.250% 31/01/2026 504,893 0.02200,000 Cablevision Lightpath LLC 144A(d) USD 3.875% 15/09/2027 202,500 0.01200,000 Cablevision Lightpath LLC 144A(d) USD 5.625% 15/09/2028 210,000 0.01
2,643,000 Caesars Entertainment, Inc. 144A(d) USD 6.250% 01/07/2025 2,841,225 0.095,013,000 Caesars Entertainment, Inc. 144A(d) USD 8.125% 01/07/2027 5,539,365 0.182,175,000 Caesars Resort Collection LLC Via CRC Finco, Inc. 144A(d) USD 5.750% 01/07/2025 2,316,375 0.087,101,000 Caesars Resort Collection LLC Via CRC Finco, Inc. 144A(d) USD 5.250% 15/10/2025 7,154,257 0.238,950,000 Calpine Corp. 144A(d) USD 5.250% 01/06/2026 9,296,812 0.3011,765,000 Calpine Corp. 144A(d) USD 4.500% 15/02/2028 12,235,600 0.404,220,000 Calpine Corp. 144A(d) USD 5.125% 15/03/2028 4,446,825 0.154,717,000 Cars.com, Inc. 144A(d) USD 6.375% 01/11/2028 4,882,095 0.166,160,000 Carvana Co. 144A(d) USD 5.625% 01/10/2025 6,221,600 0.202,640,000 Castle US Holding Corp. 144A(d) USD 9.500% 15/02/2028 2,521,200 0.08
Goldman Sachs Funds—Global High Yield PortfolioSchedule of InvestmentsAs at 30 November 2020
The accompanying notes are an integral part of these financial statements.
332

Holdings Security Description Currency Interest Rate(a) Maturity Date(b)Market Value
USD
% ofShareholders’
Equity
Bonds – (Continued)United States – (Continued)
13,771,000 CCO Holdings LLC Via CCO Holdings Capital Corp. 144A(d) USD 5.750% 15/02/2026 14,304,626 0.4713,817,000 CCO Holdings LLC Via CCO Holdings Capital Corp. 144A(d) USD 5.500% 01/05/2026 14,438,765 0.476,389,000 CCO Holdings LLC Via CCO Holdings Capital Corp. 144A(d) USD 4.750% 01/03/2030 6,804,285 0.222,650,000 CCO Holdings LLC Via CCO Holdings Capital Corp. 144A(d) USD 4.500% 15/08/2030 2,802,375 0.093,105,000 CCO Holdings LLC Via CCO Holdings Capital Corp. 144A(d) USD 4.250% 01/02/2031 3,236,963 0.111,356,000 CD&R Smokey Buyer, Inc. 144A(d) USD 6.750% 15/07/2025 1,457,700 0.052,597,000 Cedar Fair LP Via Canada’s Wonderland Co. Via Magnum Management
Corp. Via Millennium Op 144A(d) USD 5.500% 01/05/2025 2,726,850 0.093,935,000 Centene Corp. USD 4.625% 15/12/2029 4,316,105 0.1410,382,000 Centene Corp. USD 3.375% 15/02/2030 10,935,672 0.363,401,000 Central Garden & Pet Co. USD 4.125% 15/10/2030 3,571,050 0.122,145,000 CenturyLink, Inc. 144A(d) USD 5.125% 15/12/2026 2,244,206 0.072,470,000 Change Healthcare Holdings LLC Via Change Healthcare Finance, Inc.
144A(d) USD 5.750% 01/03/2025 2,516,313 0.082,470,000 Charles Schwab Corp.—Series G(e) USD 5.375% Perp. 2,761,929 0.095,425,000 Chemours Co. 144A(d) USD 5.750% 15/11/2028 5,560,625 0.184,403,000 Cheniere Energy Partners LP USD 5.250% 01/10/2025 4,524,082 0.153,550,000 Cheniere Energy Partners LP USD 4.500% 01/10/2029 3,718,625 0.124,745,000 Cheniere Energy, Inc. 144A(d) USD 4.625% 15/10/2028 4,946,662 0.164,211,000 Chobani LLC Via Chobani Finance Corp., Inc. 144A(d) USD 7.500% 15/04/2025 4,411,022 0.141,725,000 CHS Via Community Health Systems, Inc. 144A(c)(d) USD 9.875% 30/06/2023 1,677,563 0.05310,000 CHS Via Community Health Systems, Inc. 144A(d) USD 8.625% 15/01/2024 324,338 0.01
+ 3,006,000 CHS Via Community Health Systems, Inc. 144A(d) USD 8.125% 30/06/2024 2,806,853 0.094,761,000 CHS Via Community Health Systems, Inc. 144A(d) USD 8.000% 15/03/2026 5,022,855 0.161,395,000 Cinemark USA, Inc. 144A(d) USD 8.750% 01/05/2025 1,499,625 0.058,465,000 Citigroup, Inc.—Series M(e) USD 6.300% Perp. 9,025,806 0.292,496,000 Citigroup, Inc.—Series P(e) USD 5.950% Perp. 2,695,680 0.092,507,000 Clark Equipment Co. 144A(d) USD 5.875% 01/06/2025 2,644,885 0.094,892,000 Cleveland-Cliffs, Inc. 144A(d) USD 6.750% 15/03/2026 5,295,590 0.171,526,000 CNX Resources Corp. 144A(d) USD 7.250% 14/03/2027 1,617,560 0.051,797,000 Colfax Corp. 144A(d) USD 6.000% 15/02/2024 1,880,111 0.063,963,000 CommScope Technologies LLC 144A(d) USD 6.000% 15/06/2025 4,086,844 0.133,000,000 CommScope, Inc. 144A(d) USD 6.000% 01/03/2026 3,180,000 0.102,290,000 CommScope, Inc. 144A(d) USD 8.250% 01/03/2027 2,484,650 0.086,880,000 CommScope, Inc. 144A(d) USD 7.125% 01/07/2028 7,344,400 0.247,060,000 Continental Resources, Inc. 144A(d) USD 5.750% 15/01/2031 7,571,850 0.257,210,000 Core & Main Holdings LP 144A(d) USD 8.625% 15/09/2024 7,399,262 0.243,901,000 Core & Main LP 144A(d) USD 6.125% 15/08/2025 4,027,782 0.139,508,000 Cornerstone Building Brands, Inc. 144A(d) USD 8.000% 15/04/2026 10,007,170 0.33403,000 Cornerstone Building Brands, Inc. 144A(d) USD 6.125% 15/01/2029 428,188 0.01
5,212,000 Cornerstone Chemical Co. 144A(d) USD 6.750% 15/08/2024 4,925,340 0.162,095,000 CP Atlas Buyer, Inc. 144A(d) USD 7.000% 01/12/2028 2,184,038 0.079,960,000 CSC Holdings LLC 144A(d) USD 5.500% 15/05/2026 10,408,200 0.342,615,000 CSC Holdings LLC 144A(d) USD 5.500% 15/04/2027 2,771,900 0.091,941,000 CSC Holdings LLC 144A(d) USD 5.750% 15/01/2030 2,115,690 0.0718,339,000 CSC Holdings LLC 144A(d) USD 4.625% 01/12/2030 18,843,322 0.616,208,000 CSC Holdings LLC 144A(d) USD 3.375% 15/02/2031 6,083,840 0.205,337,000 Cumulus Media New Holdings, Inc. 144A(d) USD 6.750% 01/07/2026 5,243,602 0.173,747,000 Curo Group Holdings Corp. 144A(d) USD 8.250% 01/09/2025 3,208,369 0.104,455,000 DaVita, Inc. 144A(d) USD 4.625% 01/06/2030 4,711,162 0.154,970,000 DaVita, Inc. 144A(d) USD 3.750% 15/02/2031 4,945,150 0.166,125,000 DCP Midstream Operating LP USD 5.375% 15/07/2025 6,615,000 0.225,358,000 Dealer Tire LLC Via DT Issuer LLC 144A(d) USD 8.000% 01/02/2028 5,538,832 0.187,628,000 Dell International LLC Via EMC Corp. 144A(d) USD 7.125% 15/06/2024 7,933,120 0.264,232,000 Delta Air Lines, Inc. 144A(d) USD 7.000% 01/05/2025 4,846,444 0.161,773,000 Diamond Sports Group LLC Via Diamond Sports Finance Co. 144A(d) USD 5.375% 15/08/2026 1,374,075 0.0411,900,000 Diamond Sports Group LLC Via Diamond Sports Finance Co. 144A(d) USD 6.625% 15/08/2027 6,902,000 0.2210,464,000 DISH DBS Corp. USD 5.875% 15/07/2022 10,987,200 0.368,780,000 DISH DBS Corp. USD 5.000% 15/03/2023 9,175,100 0.304,435,000 DISH DBS Corp. USD 7.750% 01/07/2026 5,089,162 0.176,750,000 DISH DBS Corp. USD 7.375% 01/07/2028 7,391,250 0.242,886,000 Dun & Bradstreet Corp. 144A(d) USD 6.875% 15/08/2026 3,102,450 0.102,913,000 Dun & Bradstreet Corp. 144A(d) USD 10.250% 15/02/2027 3,284,408 0.114,890,000 Energizer Holdings, Inc. 144A(d) USD 7.750% 15/01/2027 5,342,325 0.172,590,000 Energizer Holdings, Inc. 144A(d) USD 4.375% 31/03/2029 2,667,700 0.094,020,000 EnPro Industries, Inc. USD 5.750% 15/10/2026 4,306,425 0.144,129,000 Entercom Media Corp. 144A(d) USD 7.250% 01/11/2024 3,994,807 0.1310,791,000 Entercom Media Corp. 144A(d) USD 6.500% 01/05/2027 10,413,315 0.342,083,000 Enviva Partners LP Via Enviva Partners Finance Corp. 144A(d) USD 6.500% 15/01/2026 2,218,395 0.074,005,000 EQM Midstream Partners LP 144A(d) USD 6.500% 01/07/2027 4,435,537 0.145,899,000 ESH Hospitality, Inc. 144A(d) USD 4.625% 01/10/2027 6,016,980 0.20
Goldman Sachs Funds—Global High Yield PortfolioSchedule of InvestmentsAs at 30 November 2020
The accompanying notes are an integral part of these financial statements.
333

Holdings Security Description Currency Interest Rate(a) Maturity Date(b)Market Value
USD
% ofShareholders’
Equity
Bonds – (Continued)United States – (Continued)
2,947,000 EW Scripps Co. 144A(d) USD 5.125% 15/05/2025 2,965,419 0.103,034,000 Expedia Group, Inc. 144A(d) USD 6.250% 01/05/2025 3,468,590 0.111,190,000 Expedia Group, Inc. 144A(d) USD 4.625% 01/08/2027 1,309,214 0.043,842,000 Exterran Energy Solutions LP Via EES Finance Corp. USD 8.125% 01/05/2025 3,169,650 0.102,050,000 FirstEnergy Transmission LLC 144A(d) USD 5.450% 15/07/2044 2,544,743 0.08300,000 Flex Acquisition Co., Inc. 144A(d) USD 6.875% 15/01/2025 306,000 0.01
1,582,000 Forterra Finance LLC Via FRTA Finance Corp. 144A(d) USD 6.500% 15/07/2025 1,692,740 0.066,775,000 Freedom Mortgage Corp. 144A(d) USD 7.625% 01/05/2026 6,927,437 0.23584,000 Frontier Communications Corp. 144A(d) USD 5.875% 15/10/2027 616,120 0.02
1,716,000 Frontier Communications Corp. 144A(d) USD 5.000% 01/05/2028 1,750,320 0.062,210,000 Gartner, Inc. 144A(d) USD 3.750% 01/10/2030 2,303,925 0.084,316,000 Getty Images, Inc. 144A(d) USD 9.750% 01/03/2027 4,510,220 0.155,135,000 Global Medical Response, Inc. 144A(d) USD 6.500% 01/10/2025 5,301,887 0.172,625,000 Global Partners LP Via GLP Finance Corp. 144A(d) USD 6.875% 15/01/2029 2,818,594 0.092,785,000 Go Daddy Operating Co., LLC Via GD Finance Co., Inc. 144A(d) USD 5.250% 01/12/2027 2,948,619 0.102,693,000 Goodyear Tire & Rubber Co. USD 9.500% 31/05/2025 3,032,991 0.104,467,000 Graham Holdings Co. 144A(d) USD 5.750% 01/06/2026 4,735,020 0.151,769,000 Graphic Packaging International LLC 144A(d) USD 3.500% 15/03/2028 1,848,605 0.061,915,000 Gray Television, Inc. 144A(d) USD 7.000% 15/05/2027 2,120,863 0.071,279,000 Griffon Corp. USD 5.750% 01/03/2028 1,362,135 0.041,997,000 Group 1 Automotive, Inc. 144A(d) USD 4.000% 15/08/2028 2,051,918 0.075,938,000 GrubHub Holdings, Inc. 144A(d) USD 5.500% 01/07/2027 6,257,167 0.204,626,000 GTCR AP Finance, Inc. 144A(d) USD 8.000% 15/05/2027 5,013,427 0.162,802,000 H&E Equipment Services, Inc. USD 5.625% 01/09/2025 2,935,095 0.102,848,000 Herc Holdings, Inc. 144A(d) USD 5.500% 15/07/2027 3,011,760 0.103,140,000 Hexion, Inc. 144A(d) USD 7.875% 15/07/2027 3,387,275 0.117,171,000 H-Food Holdings LLC Via Hearthside Finance Co., Inc. 144A(d) USD 8.500% 01/06/2026 7,395,094 0.242,850,000 Hilton Domestic Operating Co., Inc. USD 4.875% 15/01/2030 3,081,563 0.101,775,000 Hilton Domestic Operating Co., Inc. 144A(d) USD 5.375% 01/05/2025 1,885,938 0.06748,000 Hilton Domestic Operating Co., Inc. 144A(d) USD 5.750% 01/05/2028 807,840 0.03
2,624,000 Hilton Domestic Operating Co., Inc. 144A(d) USD 4.000% 01/05/2031 2,771,600 0.097,460,000 HLF Financing SARL LLC Via Herbalife International, Inc. 144A(d) USD 7.250% 15/08/2026 7,879,625 0.261,090,000 Hologic, Inc. 144A(d) USD 3.250% 15/02/2029 1,117,250 0.04880,000 Howard Hughes Corp. 144A(d) USD 5.375% 01/08/2028 933,900 0.03
7,803,000 HUB International Ltd. 144A(d) USD 7.000% 01/05/2026 8,193,150 0.271,235,000 IAA, Inc. 144A(d) USD 5.500% 15/06/2027 1,309,100 0.049,978,000 Icahn Enterprises LP Via Icahn Enterprises Finance Corp. USD 4.750% 15/09/2024 10,339,702 0.344,639,000 iHeartCommunications, Inc. 144A(d) USD 5.250% 15/08/2027 4,778,170 0.161,550,000 iHeartCommunications, Inc. 144A(d) USD 4.750% 15/01/2028 1,569,375 0.051,555,000 Illuminate Buyer LLC Via Illuminate Holdings IV, Inc. 144A(d) USD 9.000% 01/07/2028 1,726,050 0.062,495,000 Ingevity Corp. 144A(d) USD 4.500% 01/02/2026 2,569,850 0.081,240,000 Ingevity Corp. 144A(d) USD 3.875% 01/11/2028 1,264,800 0.041,598,000 Installed Building Products, Inc. 144A(d) USD 5.750% 01/02/2028 1,701,870 0.062,104,000 IRB Holding Corp. 144A(d) USD 7.000% 15/06/2025 2,298,620 0.0811,870,000 IRB Holding Corp. 144A(d) USD 6.750% 15/02/2026 12,315,125 0.405,930,000 Iron Mountain, Inc. 144A(d) USD 5.000% 15/07/2028 6,189,200 0.203,110,000 Iron Mountain, Inc. 144A(d) USD 4.500% 15/02/2031 3,176,119 0.105,185,000 J2 Global, Inc. 144A(d) USD 4.625% 15/10/2030 5,424,806 0.181,850,000 Jaguar Holding Co. II Via PPD Development LP 144A(d) USD 4.625% 15/06/2025 1,942,500 0.061,831,000 Jaguar Holding Co. II Via PPD Development LP 144A(d) USD 5.000% 15/06/2028 1,959,170 0.062,070,000 JELD-WEN, Inc. 144A(d) USD 4.625% 15/12/2025 2,124,338 0.075,394,000 JELD-WEN, Inc. 144A(d) USD 4.875% 15/12/2027 5,717,640 0.192,447,000 KBR, Inc. 144A(d) USD 4.750% 30/09/2028 2,544,880 0.081,030,000 Ken Garff Automotive LLC 144A(d) USD 4.875% 15/09/2028 1,060,900 0.035,444,000 KFC Holding Co. Via Pizza Hut Holdings LLC Via Taco Bell of America LLC
144A(d) USD 5.250% 01/06/2026 5,675,370 0.1922,940,000 Kraft Heinz Foods Co. USD 3.000% 01/06/2026 23,904,432 0.782,501,000 Kraft Heinz Foods Co. USD 4.625% 30/01/2029 2,863,126 0.091,658,000 Kraft Heinz Foods Co. 144A(d) USD 4.250% 01/03/2031 1,846,033 0.0610,704,000 Kraft Heinz Foods Co. 144A(d) USD 4.875% 01/10/2049 12,051,800 0.392,964,000 Kraton Polymers LLC Via Kraton Polymers Capital Corp. 144A(d) USD 7.000% 15/04/2025 3,067,740 0.109,995,000 Kronos Acquisition Holdings, Inc. 144A(d) USD 9.000% 15/08/2023 10,269,862 0.331,430,000 L Brands, Inc. 144A(d) USD 6.875% 01/07/2025 1,549,763 0.055,736,000 LABL Escrow Issuer LLC 144A(d) USD 6.750% 15/07/2026 6,151,860 0.203,817,000 LABL Escrow Issuer LLC 144A(d) USD 10.500% 15/07/2027 4,255,955 0.14179,000 Lamb Weston Holdings, Inc. 144A(d) USD 4.875% 15/05/2028 199,585 0.01
4,030,000 LD Holdings Group LLC 144A(d) USD 6.500% 01/11/2025 4,261,725 0.145,270,000 Lennar Corp. USD 5.375% 01/10/2022 5,685,012 0.1913,177,000 Level 3 Financing, Inc. 144A(d) USD 4.625% 15/09/2027 13,769,965 0.455,487,000 Level 3 Financing, Inc. 144A(d) USD 4.250% 01/07/2028 5,679,045 0.193,035,000 Level 3 Financing, Inc. 144A(d) USD 3.625% 15/01/2029 3,050,175 0.10
Goldman Sachs Funds—Global High Yield PortfolioSchedule of InvestmentsAs at 30 November 2020
The accompanying notes are an integral part of these financial statements.
334

Holdings Security Description Currency Interest Rate(a) Maturity Date(b)Market Value
USD
% ofShareholders’
Equity
Bonds – (Continued)United States – (Continued)
9,360,000 Lions Gate Capital Holdings LLC 144A(d) USD 5.875% 01/11/2024 9,383,400 0.311,280,000 Lithia Motors, Inc. 144A(d) USD 4.375% 15/01/2031 1,359,718 0.043,800,000 Live Nation Entertainment, Inc. 144A(d) USD 2.000% 15/02/2025 3,786,092 0.122,254,000 Live Nation Entertainment, Inc. 144A(d) USD 5.625% 15/03/2026 2,282,175 0.074,572,000 Logan Merger Sub, Inc. 144A(d) USD 5.500% 01/09/2027 4,766,310 0.162,301,000 LPL Holdings, Inc. 144A(d) USD 5.750% 15/09/2025 2,395,916 0.084,069,000 Macy’s, Inc. 144A(d) USD 8.375% 15/06/2025 4,455,555 0.155,788,000 Manitowoc Co., Inc. 144A(d) USD 9.000% 01/04/2026 6,236,570 0.201,372,000 Marriott International, Inc. USD 4.625% 15/06/2030 1,584,386 0.05906,000 Marriott International, Inc.—Series EE USD 5.750% 01/05/2025 1,050,154 0.03649,000 MasTec, Inc. 144A(d) USD 4.500% 15/08/2028 681,450 0.02
5,919,000 Match Group Holdings II LLC 144A(d) USD 4.625% 01/06/2028 6,274,140 0.20267,000 Match Group Holdings II LLC 144A(d) USD 4.125% 01/08/2030 280,684 0.01
3,125,000 Mattel, Inc. USD 3.150% 15/03/2023 3,164,063 0.102,646,000 Mattel, Inc. 144A(d) USD 6.750% 31/12/2025 2,801,453 0.092,085,000 Mattel, Inc. 144A(d) USD 5.875% 15/12/2027 2,303,925 0.0815,401,000 Mauser Packaging Solutions Holding Co. 144A(d) USD 7.250% 15/04/2025 15,593,512 0.513,124,000 MEDNAX, Inc. 144A(d) USD 6.250% 15/01/2027 3,363,142 0.116,265,000 Mercer International, Inc. USD 7.375% 15/01/2025 6,531,262 0.213,140,000 Mercer International, Inc. USD 5.500% 15/01/2026 3,155,700 0.103,663,000 Meredith Corp. USD 6.875% 01/02/2026 3,649,264 0.121,437,000 Meredith Corp. 144A(d) USD 6.500% 01/07/2025 1,537,590 0.051,017,000 Meritor, Inc. 144A(d) USD 6.250% 01/06/2025 1,093,275 0.044,290,000 MGM Growth Properties Operating Partnership LP Via MGP Finance
Co-Issuer, Inc. 144A(d) USD 4.625% 15/06/2025 4,536,675 0.151,954,000 MGM Growth Properties Operating Partnership LP Via MGP Finance
Co-Issuer, Inc. 144A(d) USD 3.875% 15/02/2029 1,975,983 0.061,766,000 Microchip Technology, Inc. 144A(d) USD 4.250% 01/09/2025 1,863,130 0.063,594,833 Mileage Plus Holdings LLC Via Mileage Plus Intellectual Property Assets Ltd.
144A(d) USD 6.500% 20/06/2027 3,898,776 0.135,028,000 Minerals Technologies, Inc. 144A(d) USD 5.000% 01/07/2028 5,241,690 0.172,670,000 Molina Healthcare, Inc. 144A(d) USD 3.875% 15/11/2030 2,830,200 0.094,367,000 Moog, Inc. 144A(d) USD 4.250% 15/12/2027 4,541,680 0.1510,515,000 MPH Acquisition Holdings LLC 144A(d) USD 5.750% 01/11/2028 10,304,700 0.34194,000 MTS Systems Corp. 144A(d) USD 5.750% 15/08/2027 202,730 0.01
3,800,000 Nabors Industries, Inc. USD 0.750% 15/01/2024 1,263,880 0.04783,000 Nabors Industries, Inc. USD 5.750% 01/02/2025 285,795 0.01
2,712,000 National CineMedia LLC 144A(d) USD 5.875% 15/04/2028 2,142,480 0.073,900,000 Nationstar Mortgage Holdings, Inc. 144A(d) USD 6.000% 15/01/2027 4,046,250 0.134,579,000 Nationstar Mortgage Holdings, Inc. 144A(d) USD 5.500% 15/08/2028 4,739,265 0.152,817,000 Navient Corp. USD 7.250% 25/01/2022 2,968,414 0.103,565,000 Navient Corp. USD 5.500% 25/01/2023 3,720,969 0.1211,072,000 Navient Corp. USD 5.875% 25/10/2024 11,653,280 0.384,960,000 Navient Corp. USD 6.750% 15/06/2026 5,375,400 0.183,004,000 Navistar International Corp. 144A(d) USD 6.625% 01/11/2025 3,154,200 0.102,334,000 NCR Corp. 144A(d) USD 8.125% 15/04/2025 2,619,915 0.092,579,000 Netflix, Inc. USD 4.875% 15/04/2028 2,946,508 0.102,704,000 Netflix, Inc. 144A(d) USD 3.625% 15/06/2025 2,873,000 0.093,826,000 New Albertsons LP USD 7.450% 01/08/2029 4,495,550 0.151,629,000 Newell Brands, Inc. USD 4.875% 01/06/2025 1,802,081 0.067,495,000 Newell Brands, Inc. USD 4.700% 01/04/2026 8,128,241 0.263,695,000 Nexstar Broadcasting, Inc. 144A(d) USD 5.625% 15/07/2027 3,962,887 0.131,350,000 Nexstar Broadcasting, Inc. 144A(d) USD 4.750% 01/11/2028 1,397,250 0.054,970,000 NGL Energy Partners LP Via NGL Energy Finance Corp. USD 7.500% 15/04/2026 2,074,975 0.071,679,000 Nielsen Finance LLC Via Nielsen Finance Co. 144A(d) USD 5.000% 15/04/2022 1,689,494 0.0680,000 Nielsen Finance LLC Via Nielsen Finance Co. 144A(d) USD 5.875% 01/10/2030 88,400 0.00
2,625,000 Novelis Corp. 144A(d) USD 5.875% 30/09/2026 2,762,813 0.093,308,000 Novelis Corp. 144A(d) USD 4.750% 30/01/2030 3,514,750 0.112,401,000 NRG Energy, Inc. 144A(d) USD 3.375% 15/02/2029 2,455,023 0.086,402,000 NRG Energy, Inc. 144A(d) USD 3.625% 15/02/2031 6,610,065 0.224,868,000 Nuance Communications, Inc. USD 5.625% 15/12/2026 5,184,420 0.1715,087,000 Occidental Petroleum Corp. USD 6.450% 15/09/2036 14,408,085 0.473,163,000 ON Semiconductor Corp. 144A(d) USD 3.875% 01/09/2028 3,285,566 0.116,135,000 OneMain Finance Corp. USD 5.625% 15/03/2023 6,518,437 0.218,724,000 OneMain Finance Corp. USD 7.125% 15/03/2026 10,076,220 0.331,750,000 Outfront Media Capital LLC Via Outfront Media Capital Corp. 144A(d) USD 6.250% 15/06/2025 1,855,000 0.061,025,000 Outfront Media Capital LLC Via Outfront Media Capital Corp. 144A(d) USD 5.000% 15/08/2027 1,048,063 0.034,369,000 Outfront Media Capital LLC Via Outfront Media Capital Corp. 144A(d) USD 4.625% 15/03/2030 4,369,000 0.145,410,000 Owens-Brockway Glass Container, Inc. 144A(d) USD 5.875% 15/08/2023 5,856,325 0.198,975,000 Par Pharmaceutical, Inc. 144A(d) USD 7.500% 01/04/2027 9,715,437 0.322,451,000 Pattern Energy Operations LP Via Pattern Energy Operations, Inc. 144A(d) USD 4.500% 15/08/2028 2,640,953 0.09
Goldman Sachs Funds—Global High Yield PortfolioSchedule of InvestmentsAs at 30 November 2020
The accompanying notes are an integral part of these financial statements.
335

Holdings Security Description Currency Interest Rate(a) Maturity Date(b)Market Value
USD
% ofShareholders’
Equity
Bonds – (Continued)United States – (Continued)
3,076,000 Penn National Gaming, Inc. 144A(d) USD 5.625% 15/01/2027 3,191,350 0.102,431,000 PennyMac Financial Services, Inc. 144A(d) USD 5.375% 15/10/2025 2,546,473 0.082,676,000 Performance Food Group, Inc. 144A(d) USD 5.500% 01/06/2024 2,706,105 0.091,375,000 Performance Food Group, Inc. 144A(d) USD 6.875% 01/05/2025 1,471,250 0.059,975,000 PetSmart, Inc. 144A(d) USD 7.125% 15/03/2023 9,887,719 0.324,228,000 Pike Corp. 144A(d) USD 5.500% 01/09/2028 4,418,260 0.143,285,000 Post Holdings, Inc. 144A(d) USD 5.000% 15/08/2026 3,416,400 0.1111,262,000 Post Holdings, Inc. 144A(d) USD 5.750% 01/03/2027 11,951,797 0.398,095,000 Post Holdings, Inc. 144A(d) USD 5.625% 15/01/2028 8,621,175 0.281,809,000 Post Holdings, Inc. 144A(d) USD 4.625% 15/04/2030 1,894,928 0.067,536,000 PQ Corp. 144A(d) USD 5.750% 15/12/2025 7,809,180 0.251,782,000 Presidio Holdings, Inc. 144A(d) USD 8.250% 01/02/2028 1,946,835 0.061,889,000 Prestige Brands, Inc. 144A(d) USD 5.125% 15/01/2028 2,007,063 0.075,159,000 Prime Security Services Borrower LLC Via Prime Finance, Inc. 144A(d) USD 5.250% 15/04/2024 5,494,335 0.184,805,000 Prime Security Services Borrower LLC Via Prime Finance, Inc. 144A(d) USD 3.375% 31/08/2027 4,732,925 0.1510,113,000 Prime Security Services Borrower LLC Via Prime Finance, Inc. 144A(d) USD 6.250% 15/01/2028 10,719,780 0.351,197,000 PTC, Inc. 144A(d) USD 3.625% 15/02/2025 1,231,414 0.041,378,000 PTC, Inc. 144A(d) USD 4.000% 15/02/2028 1,436,565 0.052,418,000 PVH Corp. USD 4.625% 10/07/2025 2,646,767 0.094,820,000 Qorvo, Inc. 144A(d) USD 3.375% 01/04/2031 4,940,500 0.167,945,000 Quicken Loans LLC 144A(d) USD 5.250% 15/01/2028 8,423,762 0.272,832,000 Radiate Holdco LLC Via Radiate Finance, Inc. 144A(d) USD 4.500% 15/09/2026 2,966,520 0.108,870,000 Realogy Group LLC Via Realogy Co-Issuer Corp. 144A(d) USD 4.875% 01/06/2023 9,091,750 0.30969,000 Realogy Group LLC Via Realogy Co-Issuer Corp. 144A(d) USD 7.625% 15/06/2025 1,051,365 0.03
2,553,000 Realogy Group LLC Via Realogy Co-Issuer Corp. 144A(d) USD 9.375% 01/04/2027 2,808,300 0.092,135,000 Refinitiv US Holdings, Inc. 144A(d) USD 6.250% 15/05/2026 2,292,456 0.075,011,000 Refinitiv US Holdings, Inc. 144A(d) USD 8.250% 15/11/2026 5,474,517 0.187,430,000 RegionalCare Hospital Partners Holdings, Inc. Via LifePoint Health, Inc.
144A(d) USD 9.750% 01/12/2026 8,210,150 0.276,789,000 Resideo Funding, Inc. 144A(d) USD 6.125% 01/11/2026 7,118,494 0.23341,000 Reynolds Group Issuer, Inc. Via Reynolds Group Issuer LLC Via Reynolds
Group Issuer Lu 144A(d) USD 5.125% 15/07/2023 344,410 0.015,204,000 Reynolds Group Issuer, Inc. Via Reynolds Group Issuer LLC Via Reynolds
Group Issuer Lu 144A(d) USD 4.000% 15/10/2027 5,340,605 0.177,173,000 Sabre GLBL, Inc. 144A(d) USD 5.250% 15/11/2023 7,262,662 0.246,375,000 Science Applications International Corp. 144A(d) USD 4.875% 01/04/2028 6,789,375 0.224,665,000 Scientific Games International, Inc. 144A(d) USD 8.250% 15/03/2026 5,020,706 0.161,616,000 Scientific Games International, Inc. 144A(d) USD 7.000% 15/05/2028 1,696,800 0.065,095,000 Scripps Escrow, Inc. 144A(d) USD 5.875% 15/07/2027 5,171,425 0.174,183,000 SeaWorld Parks & Entertainment, Inc. 144A(d) USD 9.500% 01/08/2025 4,549,012 0.15540,000 SEG Holding LLC Via SEG Finance Corp. 144A(d) USD 5.625% 15/10/2028 570,375 0.02
3,003,000 Select Medical Corp. 144A(d) USD 6.250% 15/08/2026 3,213,210 0.104,775,000 Sensata Technologies, Inc. 144A(d) USD 4.375% 15/02/2030 5,157,000 0.174,050,000 Service Properties Trust USD 4.350% 01/10/2024 3,890,736 0.13800,000 Service Properties Trust USD 7.500% 15/09/2025 891,040 0.03
2,695,000 Shift4 Payments LLC Via Shift4 Payments Finance Sub, Inc. 144A(d) USD 4.625% 01/11/2026 2,792,694 0.092,049,000 Silgan Holdings, Inc. USD 4.125% 01/02/2028 2,128,399 0.07310,000 Sinclair Television Group, Inc. 144A(d) USD 5.500% 01/03/2030 311,938 0.01
4,440,000 Sinclair Television Group, Inc. 144A(d) USD 4.125% 01/12/2030 4,462,200 0.154,310,000 Sirius XM Radio, Inc. 144A(d) USD 3.875% 01/08/2022 4,396,200 0.14732,000 Sirius XM Radio, Inc. 144A(d) USD 4.625% 15/07/2024 759,450 0.02
2,406,000 Sirius XM Radio, Inc. 144A(d) USD 5.000% 01/08/2027 2,553,368 0.086,239,000 Sirius XM Radio, Inc. 144A(d) USD 4.125% 01/07/2030 6,582,145 0.212,402,000 Six Flags Theme Parks, Inc. 144A(d) USD 7.000% 01/07/2025 2,594,160 0.082,120,000 SM Energy Co. 144A(d) USD 10.000% 15/01/2025 2,162,400 0.078,704,000 Solera LLC Via Solera Finance, Inc. 144A(d) USD 10.500% 01/03/2024 9,095,680 0.302,033,000 Specialty Building Products Holdings LLC Via SBP Finance Corp. 144A(d) USD 6.375% 30/09/2026 2,129,568 0.073,985,000 Spirit AeroSystems, Inc. 144A(d) USD 7.500% 15/04/2025 4,293,837 0.141,832,000 Sprint Capital Corp. USD 8.750% 15/03/2032 2,809,830 0.091,909,000 Sprint Communications, Inc. USD 11.500% 15/11/2021 2,090,355 0.077,500,000 Sprint Communications, Inc. USD 6.000% 15/11/2022 8,081,250 0.2616,932,000 Sprint Corp. USD 7.875% 15/09/2023 19,619,955 0.647,587,000 Sprint Corp. USD 7.625% 15/02/2025 9,132,851 0.304,764,000 Sprint Corp. USD 7.625% 01/03/2026 5,937,135 0.194,000,000 SRM Escrow Issuer LLC 144A(d) USD 6.000% 01/11/2028 4,185,000 0.145,497,000 SS&C Technologies, Inc. 144A(d) USD 5.500% 30/09/2027 5,881,790 0.196,616,000 Standard Industries, Inc. 144A(d) USD 5.000% 15/02/2027 6,955,202 0.234,729,000 Standard Industries, Inc. 144A(d) USD 4.375% 15/07/2030 5,002,620 0.1611,397,000 Staples, Inc. 144A(d) USD 7.500% 15/04/2026 11,567,955 0.383,638,000 Staples, Inc. 144A(d) USD 10.750% 15/04/2027 3,428,815 0.116,475,000 Starwood Property Trust, Inc. USD 4.750% 15/03/2025 6,717,812 0.22
Goldman Sachs Funds—Global High Yield PortfolioSchedule of InvestmentsAs at 30 November 2020
The accompanying notes are an integral part of these financial statements.
336

Holdings Security Description Currency Interest Rate(a) Maturity Date(b)Market Value
USD
% ofShareholders’
Equity
Bonds – (Continued)United States – (Continued)
5,251,000 Station Casinos LLC 144A(d) USD 4.500% 15/02/2028 5,185,362 0.172,484,000 Summit Materials LLC Via Summit Materials Finance Corp. 144A(d) USD 6.500% 15/03/2027 2,651,670 0.092,657,000 Summit Materials LLC Via Summit Materials Finance Corp. 144A(d) USD 5.250% 15/01/2029 2,789,850 0.09436,000 Sunoco LP Via Sunoco Finance Corp. USD 6.000% 15/04/2027 465,430 0.02
2,795,000 Sunoco LP Via Sunoco Finance Corp. 144A(d) USD 4.500% 15/05/2029 2,889,331 0.092,521,000 Syneos Health, Inc. 144A(d) USD 3.625% 15/01/2029 2,561,966 0.086,118,000 Talen Energy Supply LLC USD 6.500% 01/06/2025 4,099,060 0.132,550,000 Talen Energy Supply LLC 144A(d) USD 10.500% 15/01/2026 1,938,000 0.065,805,000 Talen Energy Supply LLC 144A(d) USD 7.250% 15/05/2027 6,124,275 0.202,860,000 Talen Energy Supply LLC 144A(d) USD 6.625% 15/01/2028 2,931,500 0.108,150,000 Tallgrass Energy Partners LP Via Tallgrass Energy Finance Corp. 144A(d) USD 4.750% 01/10/2023 8,007,375 0.261,805,000 Tallgrass Energy Partners LP Via Tallgrass Energy Finance Corp. 144A(d) USD 5.500% 15/09/2024 1,800,488 0.065,377,000 Tallgrass Energy Partners LP Via Tallgrass Energy Finance Corp. 144A(d) USD 7.500% 01/10/2025 5,592,080 0.181,730,000 Tallgrass Energy Partners LP Via Tallgrass Energy Finance Corp. 144A(d) USD 5.500% 15/01/2028 1,658,638 0.054,800,000 Targa Resources Partners LP Via Targa Resources Partners Finance Corp. USD 5.375% 01/02/2027 5,064,000 0.172,634,000 Targa Resources Partners LP Via Targa Resources Partners Finance Corp. USD 6.500% 15/07/2027 2,864,475 0.091,260,000 Targa Resources Partners LP Via Targa Resources Partners Finance Corp. USD 5.000% 15/01/2028 1,323,000 0.04835,000 Taylor Morrison Communities, Inc. 144A(d) USD 5.875% 15/06/2027 939,375 0.03
1,845,000 Taylor Morrison Communities, Inc. 144A(d) USD 5.125% 01/08/2030 2,057,175 0.07+ 2,315,000 Team Health Holdings, Inc. 144A(d) USD 6.375% 01/02/2025 1,791,231 0.06
1,092,000 TEGNA, Inc. 144A(d) USD 4.750% 15/03/2026 1,161,615 0.043,681,000 TEGNA, Inc. 144A(d) USD 4.625% 15/03/2028 3,777,626 0.123,400,000 Tenet Healthcare Corp. 144A(d) USD 4.625% 01/09/2024 3,497,750 0.114,450,000 Tenet Healthcare Corp. 144A(d) USD 7.500% 01/04/2025 4,872,750 0.16800,000 Tenet Healthcare Corp. 144A(d) USD 6.250% 01/02/2027 842,000 0.03
4,600,000 Tenet Healthcare Corp. 144A(d) USD 4.625% 15/06/2028 4,784,000 0.162,945,000 Terrier Media Buyer, Inc. 144A(d) USD 8.875% 15/12/2027 3,206,369 0.103,715,000 Tesla, Inc. 144A(d) USD 5.300% 15/08/2025 3,882,175 0.134,775,000 T-Mobile USA, Inc. USD 6.000% 01/03/2023 4,786,937 0.161,790,000 T-Mobile USA, Inc. USD 6.000% 15/04/2024 1,828,038 0.065,983,000 T-Mobile USA, Inc. USD 6.500% 15/01/2026 6,244,756 0.201,209,000 T-Mobile USA, Inc. 144A(d) USD 3.875% 15/04/2030 1,388,113 0.05970,000 T-Mobile USA, Inc. 144A(d) USD 4.500% 15/04/2050 1,209,774 0.04966,000 TransDigm, Inc. 144A(d) USD 8.000% 15/12/2025 1,062,600 0.03
3,076,000 Trident TPI Holdings, Inc. 144A(d) USD 6.625% 01/11/2025 3,114,450 0.101,340,000 Triumph Group, Inc. 144A(d) USD 8.875% 01/06/2024 1,484,050 0.052,955,000 Tronox, Inc. 144A(d) USD 6.500% 01/05/2025 3,161,850 0.10315,000 Tronox, Inc. 144A(d) USD 6.500% 15/04/2026 329,569 0.01
4,216,000 Twitter, Inc. 144A(d) USD 3.875% 15/12/2027 4,432,070 0.149,515,000 Uber Technologies, Inc. 144A(d) USD 7.500% 15/05/2025 10,228,625 0.33310,000 Uber Technologies, Inc. 144A(d) USD 8.000% 01/11/2026 337,125 0.01
1,005,000 Uber Technologies, Inc. 144A(d) USD 6.250% 15/01/2028 1,070,325 0.042,775,000 United Airlines Holdings, Inc. USD 4.250% 01/10/2022 2,788,875 0.094,825,000 United Natural Foods, Inc. 144A(d) USD 6.750% 15/10/2028 5,011,969 0.166,225,000 United Shore Financial Services LLC 144A(d) USD 5.500% 15/11/2025 6,551,812 0.21310,000 Uniti Group LP Via Uniti Fiber Holdings, Inc. Via CSL Capital LLC 144A(d) USD 7.125% 15/12/2024 305,350 0.01
1,770,000 Uniti Group LP Via Uniti Group Finance, Inc. Via CSL Capital LLC USD 8.250% 15/10/2023 1,774,425 0.063,657,000 Uniti Group LP Via Uniti Group Finance, Inc. Via CSL Capital LLC 144A(d) USD 6.000% 15/04/2023 3,752,996 0.121,841,000 Univar Solutions USA, Inc. 144A(d) USD 5.125% 01/12/2027 1,942,255 0.063,500,000 Univision Communications, Inc. 144A(d) USD 6.625% 01/06/2027 3,736,250 0.123,698,000 US Foods, Inc. 144A(d) USD 5.875% 15/06/2024 3,753,470 0.122,885,000 US Foods, Inc. 144A(d) USD 6.250% 15/04/2025 3,083,344 0.1010,748,000 USA Compression Partners LP Via USA Compression Finance Corp. USD 6.875% 01/04/2026 11,204,790 0.363,463,000 USI, Inc. 144A(d) USD 6.875% 01/05/2025 3,579,876 0.12658,000 Vail Resorts, Inc. 144A(d) USD 6.250% 15/05/2025 704,060 0.02
1,085,000 Valvoline, Inc. USD 4.375% 15/08/2025 1,125,688 0.04325,000 Veritas US, Inc. Via Veritas Bermuda Ltd. 144A(d) USD 7.500% 01/02/2023 326,625 0.01
2,829,000 Verscend Escrow Corp. 144A(d) USD 9.750% 15/08/2026 3,104,828 0.102,255,000 Vistra Operations Co., LLC 144A(d) USD 5.500% 01/09/2026 2,373,388 0.081,143,000 Vistra Operations Co., LLC 144A(d) USD 5.625% 15/02/2027 1,215,866 0.049,225,000 Vistra Operations Co., LLC 144A(d) USD 5.000% 31/07/2027 9,778,500 0.32809,000 Vizient, Inc. 144A(d) USD 6.250% 15/05/2027 868,664 0.03
2,428,000 Walgreens Boots Alliance, Inc. USD 4.100% 15/04/2050 2,608,230 0.091,286,000 Waste Pro USA, Inc. 144A(d) USD 5.500% 15/02/2026 1,334,225 0.048,237,000 WESCO Distribution, Inc. 144A(d) USD 7.125% 15/06/2025 9,040,107 0.293,202,000 West Street Merger Sub, Inc. 144A(d) USD 6.375% 01/09/2025 3,310,068 0.112,696,000 Western Digital Corp. USD 4.750% 15/02/2026 2,958,860 0.102,500,000 Western Midstream Operating LP USD 5.300% 01/03/2048 2,250,000 0.071,203,000 White Cap Buyer LLC 144A(d) USD 6.875% 15/10/2028 1,281,195 0.041,221,000 Williams Scotsman International, Inc. 144A(d) USD 4.625% 15/08/2028 1,269,840 0.043,392,000 WMG Acquisition Corp. 144A(d) USD 3.875% 15/07/2030 3,493,760 0.11
Goldman Sachs Funds—Global High Yield PortfolioSchedule of InvestmentsAs at 30 November 2020
The accompanying notes are an integral part of these financial statements.
337

Holdings Security Description Currency Interest Rate(a) Maturity Date(b)Market Value
USD
% ofShareholders’
Equity
Bonds – (Continued)United States – (Continued)
3,085,000 WMG Acquisition Corp. 144A(d) USD 3.000% 15/02/2031 3,007,875 0.101,246,000 WMG Acquisition Corp.—Series NOV 144A(d) USD 3.000% 15/02/2031 1,214,850 0.04315,000 Wolverine Escrow LLC 144A(d) USD 8.500% 15/11/2024 265,388 0.01
13,100,000 WR Grace & Co-Conn 144A(d) USD 5.625% 01/10/2024 14,180,750 0.46858,000 WR Grace & Co-Conn 144A(d) USD 4.875% 15/06/2027 909,480 0.03
2,036,000 Wyndham Destinations, Inc. 144A(d) USD 6.625% 31/07/2026 2,295,590 0.073,295,000 Wyndham Destinations, Inc. 144A(d) USD 4.625% 01/03/2030 3,385,612 0.112,984,000 Wynn Las Vegas LLC Via Wynn Las Vegas Capital Corp. 144A(d) USD 5.500% 01/03/2025 3,058,600 0.105,991,000 Xerox Holdings Corp. 144A(d) USD 5.000% 15/08/2025 6,275,572 0.202,613,000 XPO Logistics, Inc. 144A(d) USD 6.250% 01/05/2025 2,808,975 0.09285,000 Yum! Brands, Inc. 144A(d) USD 7.750% 01/04/2025 317,775 0.01
3,575,000 Yum! Brands, Inc. 144A(d) USD 4.750% 15/01/2030 3,883,344 0.13
1,828,152,290 59.51
TOTAL BONDS(cost USD 2,141,298,899) 2,198,026,277 71.55
Holdings Security Description Currency Interest Rate(a)Market Value
USD
% ofShareholders’
Equity
Preferred Stocks – 0.01%
United States664 Spanish Broadcasting System, Inc.—Series B—Preferred USD 10.750% 298,800 0.01
TOTAL PREFERRED STOCKS(cost USD 641,659) 298,800 0.01
TOTAL TRANSFERABLE SECURITIES DEALT IN ANOTHER REGULATED MARKET(cost USD 2,141,940,558) 2,198,325,077 71.56
Holdings Security Description Currency Interest Rate(a) Maturity Date(b)Market Value
USD
% ofShareholders’
Equity
Other Transferable Securities
Bonds – 0.10%United States
2,809,000 Parsley Energy LLC Via Parsley Finance Corp. 144A(d) USD 5.375% 15/01/2025 2,889,759 0.10
TOTAL BONDS(cost USD 2,790,182) 2,889,759 0.10
TOTAL OTHER TRANSFERABLE SECURITIES(cost USD 2,790,182) 2,889,759 0.10
MARKET VALUE OF INVESTMENTS EXCLUDING DERIVATIVES(cost USD 2,869,714,428) 2,968,025,221 96.62
Futures Contracts – 0.02%
Number ofContracts Security Description
CommitmentMarket Value
USD
UnrealisedGainUSD
% ofShareholders’
Equity
USD819 US Treasury Long Bond Futures 22/03/2021 Long 143,094,656 66,086 0.00
2,818 US Treasury Notes 10YR Futures 22/03/2021 Long 389,192,219 548,261 0.0235 US Treasury Notes 2YR Futures 31/03/2021 Long 7,728,985 2,149 0.00209 US Treasury Notes 5YR Futures 31/03/2021 Long 26,332,367 20,823 0.00(23) US Treasury Ultra Long Bond Futures 22/03/2021 Short (4,960,094) 4,304 0.00
561,388,133 641,623 0.02
UNREALISED GAIN ON FUTURES CONTRACTS 641,623 0.02
Number ofContracts Security Description
CommitmentMarket Value
USD
UnrealisedLossUSD
% ofShareholders’
Equity
EUR(25) German Federal Republic Bonds 10YR Futures 08/12/2020 Short (5,258,227) (51,881) (0.00)(164) German Federal Republic Bonds 5Y Futures 08/12/2020 Short (26,638,693) (82,625) (0.00)
(31,896,920) (134,506) (0.00)
Goldman Sachs Funds—Global High Yield PortfolioSchedule of InvestmentsAs at 30 November 2020
The accompanying notes are an integral part of these financial statements.
338
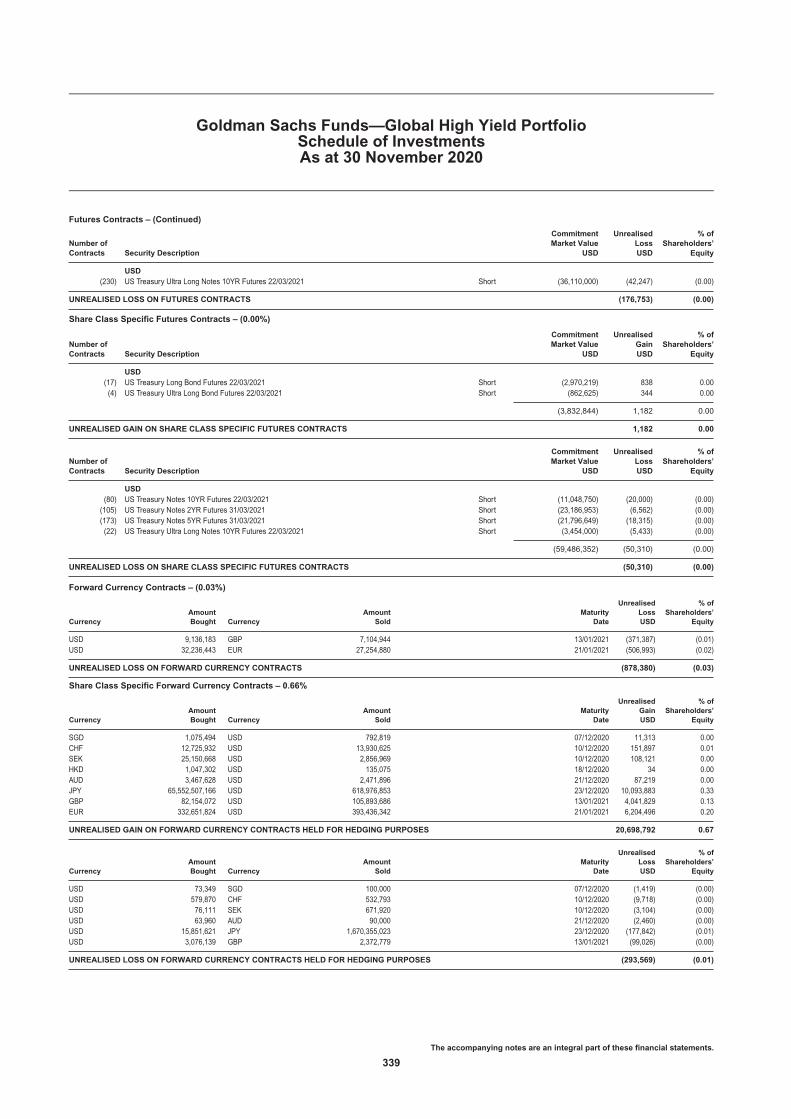
Futures Contracts – (Continued)
Number ofContracts Security Description
CommitmentMarket Value
USD
UnrealisedLossUSD
% ofShareholders’
Equity
USD(230) US Treasury Ultra Long Notes 10YR Futures 22/03/2021 Short (36,110,000) (42,247) (0.00)
UNREALISED LOSS ON FUTURES CONTRACTS (176,753) (0.00)
Share Class Specific Futures Contracts – (0.00%)
Number ofContracts Security Description
CommitmentMarket Value
USD
UnrealisedGainUSD
% ofShareholders’
Equity
USD(17) US Treasury Long Bond Futures 22/03/2021 Short (2,970,219) 838 0.00(4) US Treasury Ultra Long Bond Futures 22/03/2021 Short (862,625) 344 0.00
(3,832,844) 1,182 0.00
UNREALISED GAIN ON SHARE CLASS SPECIFIC FUTURES CONTRACTS 1,182 0.00
Number ofContracts Security Description
CommitmentMarket Value
USD
UnrealisedLossUSD
% ofShareholders’
Equity
USD(80) US Treasury Notes 10YR Futures 22/03/2021 Short (11,048,750) (20,000) (0.00)(105) US Treasury Notes 2YR Futures 31/03/2021 Short (23,186,953) (6,562) (0.00)(173) US Treasury Notes 5YR Futures 31/03/2021 Short (21,796,649) (18,315) (0.00)(22) US Treasury Ultra Long Notes 10YR Futures 22/03/2021 Short (3,454,000) (5,433) (0.00)
(59,486,352) (50,310) (0.00)
UNREALISED LOSS ON SHARE CLASS SPECIFIC FUTURES CONTRACTS (50,310) (0.00)
Forward Currency Contracts – (0.03%)
CurrencyAmountBought Currency
AmountSold
MaturityDate
UnrealisedLossUSD
% ofShareholders’
Equity
USD 9,136,183 GBP 7,104,944 13/01/2021 (371,387) (0.01)USD 32,236,443 EUR 27,254,880 21/01/2021 (506,993) (0.02)
UNREALISED LOSS ON FORWARD CURRENCY CONTRACTS (878,380) (0.03)
Share Class Specific Forward Currency Contracts – 0.66%
CurrencyAmountBought Currency
AmountSold
MaturityDate
UnrealisedGainUSD
% ofShareholders’
Equity
SGD 1,075,494 USD 792,819 07/12/2020 11,313 0.00CHF 12,725,932 USD 13,930,625 10/12/2020 151,897 0.01SEK 25,150,668 USD 2,856,969 10/12/2020 108,121 0.00HKD 1,047,302 USD 135,075 18/12/2020 34 0.00AUD 3,467,628 USD 2,471,896 21/12/2020 87,219 0.00JPY 65,552,507,166 USD 618,976,853 23/12/2020 10,093,883 0.33GBP 82,154,072 USD 105,893,686 13/01/2021 4,041,829 0.13EUR 332,651,824 USD 393,436,342 21/01/2021 6,204,496 0.20
UNREALISED GAIN ON FORWARD CURRENCY CONTRACTS HELD FOR HEDGING PURPOSES 20,698,792 0.67
CurrencyAmountBought Currency
AmountSold
MaturityDate
UnrealisedLossUSD
% ofShareholders’
Equity
USD 73,349 SGD 100,000 07/12/2020 (1,419) (0.00)USD 579,870 CHF 532,793 10/12/2020 (9,718) (0.00)USD 76,111 SEK 671,920 10/12/2020 (3,104) (0.00)USD 63,960 AUD 90,000 21/12/2020 (2,460) (0.00)USD 15,851,621 JPY 1,670,355,023 23/12/2020 (177,842) (0.01)USD 3,076,139 GBP 2,372,779 13/01/2021 (99,026) (0.00)
UNREALISED LOSS ON FORWARD CURRENCY CONTRACTS HELD FOR HEDGING PURPOSES (293,569) (0.01)
Goldman Sachs Funds—Global High Yield PortfolioSchedule of InvestmentsAs at 30 November 2020
The accompanying notes are an integral part of these financial statements.
339

Swap Contracts – 0.50%Net LocalNotionalAmount Pay Receive Currency Maturity Date
UnrealisedGainUSD
% ofShareholders’
Equity
Credit Default Swaps2,975,000 Floating (Nabors Industries, Inc.) Fixed 1.000% USD 20/12/2022 333,397 0.01
107,943,600 Floating (The Markit CDX North AmericaHigh Yield 34 Version 1 Index)
Fixed 5.000% USD 20/06/2025 6,579,948 0.22
169,195,000 Floating (The Markit CDX North AmericaHigh Yield 35 Version 1 Index)
Fixed 5.000% USD 20/12/2025 8,412,963 0.27
UNREALISED GAIN ON CREDIT DEFAULT SWAPS 15,326,308 0.50
TOTAL UNREALISED GAIN ON SWAP CONTRACTS 15,326,308 0.50
MARKET VALUE OF INVESTMENTS(cost USD 2,869,714,428)
3,003,294,114 97.77
OTHER ASSETS AND LIABILITIES 68,704,462 2.23
SHAREHOLDERS’ EQUITY 3,071,998,576 100.00
TOTAL INVESTMENTSMarket Value
USD
% ofShareholders’
Equity
Total Investments excluding derivatives (cost USD 2,869,714,428) 2,968,025,221 96.62Unrealised gain on futures contracts 641,623 0.02Unrealised loss on futures contracts (176,753) (0.00)Unrealised gain on share class specific futures contracts 1,182 0.00Unrealised loss on share class specific futures contracts (50,310) (0.00)Unrealised loss on forward currency contracts (878,380) (0.03)Unrealised gain on forward currency contracts held for hedging purposes 20,698,792 0.67Unrealised loss on forward currency contracts held for hedging purposes (293,569) (0.01)Unrealised gain on swap contracts 15,326,308 0.50Other Assets and Liabilities 68,704,462 2.23
Shareholders’ Equity 3,071,998,576 100.00
The Futures Commission Merchant was Goldman Sachs & Co. LLC.
The counterparties for forward currency contracts were Australia and New Zealand Banking Group Ltd., Bank of America N.A., Barclays Bank Plc., BNP Paribas S.A., Citibank N.A.,Deutsche Bank AG, HSBC Bank Plc., JP Morgan Chase Bank N.A., Merrill Lynch International, Morgan Stanley & Co. International Plc., Natwest Markets Plc., Royal Bank of Canada,Standard Chartered Bank, State Street Bank & Trust, UBS AG and Westpac Banking Corp.
The counterparty for swap contracts was Credit Suisse.
The maximum individual counterparty exposure as at 30 November 2020 is 0.50% of the NAV.
+ A portion of these securities were on loan at 30 November 2020. See Note 6.(a) Interest rates represent either the stated coupon rate, annualised discounted yield on date of purchase for discounted securities, or, for floating rate securities, the current reset rate
which is based upon interest rates indices.(b) Maturity dates represent either the stated date on the security, or the next interest reset date for floating rate securities or the prerefunded date for those type of securities.(c) This security has a step up coupon which moves to the second rate at a set date in the future.(d) 144A: This security is issued to qualified institutional investors, pursuant to private placements, and is transferable as stated in rule 144A of the US Securities Act of 1933.(e) Variable and floating coupon rates are those quoted as of 30 November 2020.(f) A related party to Goldman Sachs Funds.(g) The yield for this fund as at 30 November 2020 was 0.120%.
Goldman Sachs Funds—Global High Yield PortfolioSchedule of InvestmentsAs at 30 November 2020
The accompanying notes are an integral part of these financial statements.
340
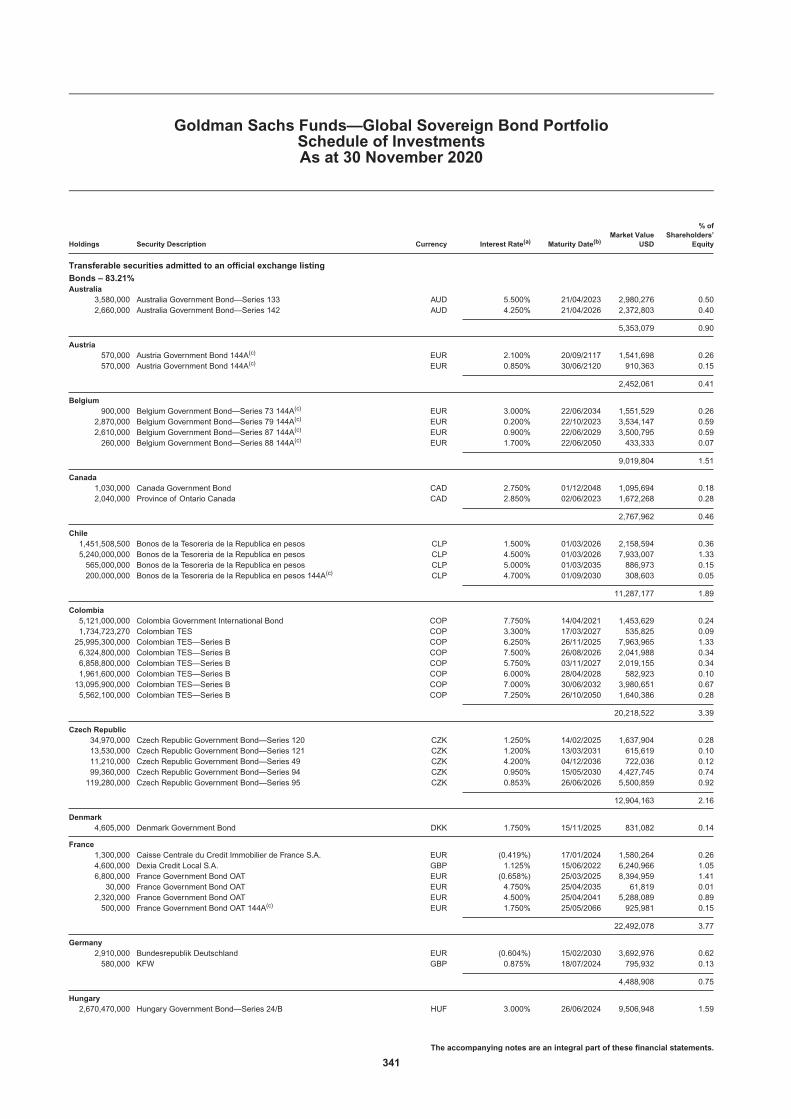
Holdings Security Description Currency Interest Rate(a) Maturity Date(b)Market Value
USD
% ofShareholders’
Equity
Transferable securities admitted to an official exchange listing
Bonds – 83.21%Australia
3,580,000 Australia Government Bond—Series 133 AUD 5.500% 21/04/2023 2,980,276 0.502,660,000 Australia Government Bond—Series 142 AUD 4.250% 21/04/2026 2,372,803 0.40
5,353,079 0.90
Austria570,000 Austria Government Bond 144A(c) EUR 2.100% 20/09/2117 1,541,698 0.26570,000 Austria Government Bond 144A(c) EUR 0.850% 30/06/2120 910,363 0.15
2,452,061 0.41
Belgium900,000 Belgium Government Bond—Series 73 144A(c) EUR 3.000% 22/06/2034 1,551,529 0.26
2,870,000 Belgium Government Bond—Series 79 144A(c) EUR 0.200% 22/10/2023 3,534,147 0.592,610,000 Belgium Government Bond—Series 87 144A(c) EUR 0.900% 22/06/2029 3,500,795 0.59260,000 Belgium Government Bond—Series 88 144A(c) EUR 1.700% 22/06/2050 433,333 0.07
9,019,804 1.51
Canada1,030,000 Canada Government Bond CAD 2.750% 01/12/2048 1,095,694 0.182,040,000 Province of Ontario Canada CAD 2.850% 02/06/2023 1,672,268 0.28
2,767,962 0.46
Chile1,451,508,500 Bonos de la Tesoreria de la Republica en pesos CLP 1.500% 01/03/2026 2,158,594 0.365,240,000,000 Bonos de la Tesoreria de la Republica en pesos CLP 4.500% 01/03/2026 7,933,007 1.33565,000,000 Bonos de la Tesoreria de la Republica en pesos CLP 5.000% 01/03/2035 886,973 0.15200,000,000 Bonos de la Tesoreria de la Republica en pesos 144A(c) CLP 4.700% 01/09/2030 308,603 0.05
11,287,177 1.89
Colombia5,121,000,000 Colombia Government International Bond COP 7.750% 14/04/2021 1,453,629 0.241,734,723,270 Colombian TES COP 3.300% 17/03/2027 535,825 0.0925,995,300,000 Colombian TES—Series B COP 6.250% 26/11/2025 7,963,965 1.336,324,800,000 Colombian TES—Series B COP 7.500% 26/08/2026 2,041,988 0.346,858,800,000 Colombian TES—Series B COP 5.750% 03/11/2027 2,019,155 0.341,961,600,000 Colombian TES—Series B COP 6.000% 28/04/2028 582,923 0.1013,095,900,000 Colombian TES—Series B COP 7.000% 30/06/2032 3,980,651 0.675,562,100,000 Colombian TES—Series B COP 7.250% 26/10/2050 1,640,386 0.28
20,218,522 3.39
Czech Republic34,970,000 Czech Republic Government Bond—Series 120 CZK 1.250% 14/02/2025 1,637,904 0.2813,530,000 Czech Republic Government Bond—Series 121 CZK 1.200% 13/03/2031 615,619 0.1011,210,000 Czech Republic Government Bond—Series 49 CZK 4.200% 04/12/2036 722,036 0.1299,360,000 Czech Republic Government Bond—Series 94 CZK 0.950% 15/05/2030 4,427,745 0.74119,280,000 Czech Republic Government Bond—Series 95 CZK 0.853% 26/06/2026 5,500,859 0.92
12,904,163 2.16
Denmark4,605,000 Denmark Government Bond DKK 1.750% 15/11/2025 831,082 0.14
France1,300,000 Caisse Centrale du Credit Immobilier de France S.A. EUR (0.419%) 17/01/2024 1,580,264 0.264,600,000 Dexia Credit Local S.A. GBP 1.125% 15/06/2022 6,240,966 1.056,800,000 France Government Bond OAT EUR (0.658%) 25/03/2025 8,394,959 1.4130,000 France Government Bond OAT EUR 4.750% 25/04/2035 61,819 0.01
2,320,000 France Government Bond OAT EUR 4.500% 25/04/2041 5,288,089 0.89500,000 France Government Bond OAT 144A(c) EUR 1.750% 25/05/2066 925,981 0.15
22,492,078 3.77
Germany2,910,000 Bundesrepublik Deutschland EUR (0.604%) 15/02/2030 3,692,976 0.62580,000 KFW GBP 0.875% 18/07/2024 795,932 0.13
4,488,908 0.75
Hungary2,670,470,000 Hungary Government Bond—Series 24/B HUF 3.000% 26/06/2024 9,506,948 1.59
Goldman Sachs Funds—Global Sovereign Bond PortfolioSchedule of InvestmentsAs at 30 November 2020
The accompanying notes are an integral part of these financial statements.
341

Holdings Security Description Currency Interest Rate(a) Maturity Date(b)Market Value
USD
% ofShareholders’
Equity
Bonds – (Continued)Hungary – (Continued)
613,810,000 Hungary Government Bond—Series 26/D HUF 2.750% 22/12/2026 2,192,786 0.3796,570,000 Hungary Government Bond—Series 30/A HUF 3.000% 21/08/2030 349,083 0.06
12,048,817 2.02
Indonesia2,905,000 Indonesia Government International Bond EUR 2.625% 14/06/2023 3,704,664 0.621,120,000 Indonesia Government International Bond EUR 3.750% 14/06/2028 1,618,912 0.27
5,323,576 0.89
Ireland1,410,000 Ireland Government Bond EUR 0.900% 15/05/2028 1,862,227 0.31480,000 Ireland Government Bond EUR 0.200% 18/10/2030 603,088 0.10
2,465,315 0.41
Israel54,505,000 Israel Government Bond - Fixed—Series 327 ILS 2.000% 31/03/2027 18,270,781 3.067,320,000 Israel Government Bond - Fixed—Series 825 ILS 1.750% 31/08/2025 2,369,547 0.40
20,640,328 3.46
Italy1,990,000 Italy Buoni Poliennali Del Tesoro EUR 1.350% 15/04/2022 2,446,329 0.412,640,000 Italy Buoni Poliennali Del Tesoro EUR 5.500% 01/11/2022 3,527,765 0.59950,000 Italy Buoni Poliennali Del Tesoro EUR 0.950% 01/03/2023 1,174,010 0.2050,000 Italy Buoni Poliennali Del Tesoro EUR 4.500% 01/03/2024 69,294 0.01
2,040,000 Italy Buoni Poliennali Del Tesoro EUR 2.800% 01/12/2028 2,918,439 0.492,640,000 Italy Buoni Poliennali Del Tesoro 144A(c) EUR 2.950% 01/09/2038 4,108,178 0.697,980,000 Italy Certificati di Credito del Tesoro(d) EUR 1.518% 15/01/2025 10,123,301 1.69
24,367,316 4.08
Japan613,000,000 Japan Government Bond—Series 13 JPY 0.500% 20/03/2060 5,526,790 0.93
1,216,250,000 Japan Government Bond—Series 141 JPY 0.100% 20/09/2024 11,773,552 1.97167,600,000 Japan Government Bond—Series 173 JPY 0.400% 20/06/2040 1,609,719 0.27355,000,000 Japan Government Bond—Series 174 JPY 0.400% 20/09/2040 3,406,474 0.57221,100,000 Japan Government Bond—Series 19 JPY 2.300% 20/06/2035 2,751,794 0.46385,282,680 Japan Government Bond—Series 23 JPY 0.100% 10/03/2028 3,712,506 0.62814,992,358 Japan Government Bond—Series 24 JPY 0.100% 10/03/2029 7,845,596 1.3110,750,000 Japan Government Bond—Series 359 JPY 0.100% 20/06/2030 103,966 0.02
1,314,250,000 Japan Government Bond—Series 418 JPY 0.100% 01/11/2022 12,665,485 2.12746,000,000 Japan Government Bond—Series 68 JPY 0.600% 20/09/2050 7,070,739 1.19
1,717,900,000 Japan Treasury Discount Bill—Series 947 JPY (0.128%) 01/02/2021 16,481,492 2.76
72,948,113 12.22
Mexico2,300 Mexican Bonos—Series M MXN 6.500% 09/06/2022 118 0.00
36,457,700 Mexican Bonos—Series M MXN 8.000% 05/09/2024 2,017,862 0.3418,385,200 Mexican Bonos—Series M MXN 5.750% 05/03/2026 943,755 0.1617,567,800 Mexican Bonos—Series M MXN 7.750% 29/05/2031 1,006,796 0.1738,839,100 Mexican Bonos—Series M MXN 8.000% 07/11/2047 2,176,871 0.36117,366,900 Mexican Bonos—Series M 20 MXN 7.500% 03/06/2027 6,541,696 1.09125,622,100 Mexican Bonos—Series M 20 MXN 8.500% 31/05/2029 7,492,589 1.2657,926,500 Mexican Bonos—Series M 30 MXN 10.000% 20/11/2036 3,922,896 0.66
24,102,583 4.04
Netherlands1,760,000 BNG Bank NV GBP 0.375% 15/12/2025 2,368,783 0.40
Norway1,325,000 Norway Government Bond—Series 477 144A(c) NOK 1.750% 13/03/2025 158,774 0.03
Peru335,000 Peru Government Bond PEN 5.940% 12/02/2029 113,155 0.02
4,580,000 Peru Government Bond PEN 6.150% 12/08/2032 1,501,661 0.258,600,000 Peru Government Bond PEN 5.400% 12/08/2034 2,580,280 0.434,125,000 Peru Government Bond PEN 5.350% 12/08/2040 1,163,804 0.203,317,000 Peruvian Government International Bond PEN 6.950% 12/08/2031 1,162,275 0.19
6,521,175 1.09
Philippines53,200,000 Philippine Government Bond—Series 1063 PHP 6.250% 22/03/2028 1,349,003 0.23
Goldman Sachs Funds—Global Sovereign Bond PortfolioSchedule of InvestmentsAs at 30 November 2020
The accompanying notes are an integral part of these financial statements.
342

Holdings Security Description Currency Interest Rate(a) Maturity Date(b)Market Value
USD
% ofShareholders’
Equity
Bonds – (Continued)Philippines – (Continued)
130,640,000 Philippine Government Bond—Series 1064 PHP 6.875% 10/01/2029 3,492,476 0.58376,000,000 Philippine Government International Bond PHP 4.950% 15/01/2021 7,832,519 1.3110,000,000 Philippine Government International Bond PHP 3.900% 26/11/2022 212,500 0.04243,000,000 Philippine Government International Bond PHP 6.250% 14/01/2036 6,519,658 1.09
19,406,156 3.25
Poland28,320,000 Poland Government Bond—Series 425 PLN 0.750% 25/04/2025 7,705,096 1.2915,240,000 Poland Government Bond—Series 428 PLN 2.750% 25/04/2028 4,616,557 0.7720,560,000 Poland Government Bond—Series 727 PLN 2.500% 25/07/2027 6,117,260 1.03
18,438,913 3.09
Portugal1,540,000 Portugal Obrigacoes do Tesouro OT 144A(c) EUR 1.950% 15/06/2029 2,176,663 0.36
Romania6,390,000 Romania Government Bond—Series 15Y RON 3.650% 24/09/2031 1,594,266 0.278,570,000 Romania Government Bond—Series 5Y RON 3.650% 28/07/2025 2,190,931 0.372,870,000 Romania Government Bond—Series 8Y RON 4.150% 26/01/2028 754,980 0.12
4,540,177 0.76
Russia189,975,000 Russian Federal Bond - OFZ Bonds—Series 6221 RUB 7.700% 23/03/2033 2,843,384 0.48781,060,000 Russian Federal Bond - OFZ Bonds—Series 6228 RUB 7.650% 10/04/2030 11,662,735 1.95121,850,000 Russian Federal Bond - OFZ Bonds—Series 6230 RUB 7.700% 16/03/2039 1,855,434 0.3193,980,000 Russian Federal Bond - OFZ Bonds—Series 6232 RUB 6.000% 06/10/2027 1,270,311 0.21221,350,000 Russian Federal Bond - OFZ Bonds—Series 6235 RUB 5.900% 12/03/2031 2,907,218 0.49
20,539,082 3.44
Singapore1,180,000 Singapore Government Bond SGD 2.375% 01/06/2025 958,946 0.16
South Korea365,850,000 Inflation Linked Korea Treasury Bond—Series 2306 KRW 1.125% 10/06/2023 367,627 0.06200,000,000 Inflation Linked Korea Treasury Bond—Series 2506 KRW 1.750% 10/06/2025 204,182 0.03
2,622,460,000 Inflation Linked Korea Treasury Bond—Series 2606 KRW 0.809% 10/06/2026 2,556,023 0.436,959,500,000 Korea Treasury Bond—Series 2103 KRW 2.000% 10/03/2021 6,316,472 1.066,174,570,000 Korea Treasury Bond—Series 2506 KRW 2.250% 10/06/2025 5,864,377 0.98600,000,000 Korea Treasury Bond—Series 2706 KRW 2.125% 10/06/2027 569,890 0.10371,830,000 Korea Treasury Bond—Series 2806 KRW 2.625% 10/06/2028 366,353 0.06
17,757,180,000 Korea Treasury Bond—Series 2906 KRW 1.875% 10/06/2029 16,508,537 2.7713,714,780,000 Korea Treasury Bond—Series 2912 KRW 1.375% 10/12/2029 12,193,519 2.044,434,600,000 Korea Treasury Bond—Series 3006 KRW 1.375% 10/06/2030 3,932,850 0.66
48,879,830 8.19
Spain2,670,000 Spain Government Bond EUR 0.400% 30/04/2022 3,248,246 0.5490,000 Spain Government Bond 144A(c) EUR 5.900% 30/07/2026 146,687 0.02
5,780,000 Spain Government Bond 144A(c) EUR 1.500% 30/04/2027 7,743,012 1.30700,000 Spain Government Bond 144A(c) EUR 3.450% 30/07/2066 1,528,369 0.26
12,666,314 2.12
Supranationals3,900,000 European Investment Bank SEK 1.750% 12/11/2026 500,455 0.08
Thailand198,150,216 Thailand Government Bond THB 1.200% 14/07/2021 6,536,430 1.09304,457,646 Thailand Government Bond THB 1.250% 12/03/2028 9,783,582 1.6414,410,000 Thailand Government Bond THB 1.600% 17/12/2029 488,300 0.0854,285,000 Thailand Government Bond THB 3.650% 20/06/2031 2,179,361 0.37337,880,000 Thailand Government Bond THB 3.775% 25/06/2032 13,843,914 2.3271,710,000 Thailand Government Bond THB 3.400% 17/06/2036 2,920,676 0.4929,230,000 Thailand Government Bond THB 3.300% 17/06/2038 1,184,239 0.2089,130,000 Thailand Government Bond THB 3.600% 17/06/2067 3,869,918 0.65
40,806,420 6.84
United Kingdom2,490,000 United Kingdom Gilt GBP 0.375% 22/10/2030 3,350,291 0.561,490,000 United Kingdom Gilt GBP 4.500% 07/09/2034 3,048,266 0.512,180,000 United Kingdom Gilt GBP 3.500% 22/01/2045 4,628,559 0.78
Goldman Sachs Funds—Global Sovereign Bond PortfolioSchedule of InvestmentsAs at 30 November 2020
The accompanying notes are an integral part of these financial statements.
343

Holdings Security Description Currency Interest Rate(a) Maturity Date(b)Market Value
USD
% ofShareholders’
Equity
Bonds – (Continued)United Kingdom – (Continued)
870,000 United Kingdom Gilt GBP 1.750% 22/07/2057 1,521,632 0.26540,000 United Kingdom Gilt GBP 3.500% 22/07/2068 1,521,149 0.25
14,069,897 2.36
United States15,860,000 United States Treasury Note/Bond USD 2.375% 31/01/2023 16,618,926 2.785,510,000 United States Treasury Note/Bond USD 2.250% 30/04/2024 5,889,889 0.992,240,000 United States Treasury Note/Bond USD 1.750% 31/07/2024 2,362,937 0.407,990,000 United States Treasury Note/Bond USD 1.625% 31/10/2026 8,519,338 1.4313,190,000 United States Treasury Note/Bond USD 2.625% 15/02/2029 15,195,292 2.541,810,000 United States Treasury Note/Bond USD 3.000% 15/02/2048 2,408,431 0.40
50,994,813 8.54
TOTAL BONDS(cost USD 463,086,447) 496,737,282 83.21
Holdings Security DescriptionMarket Value
USD
% ofShareholders’
Equity
Mutual Funds – 5.14%Ireland
30,654,563 Goldman Sachs US$ Treasury Liquid Reserves Fund (X Distribution Class)(e)(f) 30,654,563 5.14
TOTAL MUTUAL FUNDS(cost USD 30,654,563) 30,654,563 5.14
TOTAL TRANSFERABLE SECURITIES ADMITTED TO AN OFFICIAL EXCHANGE LISTING(cost USD 493,741,010) 527,391,845 88.35
Holdings Security Description Currency Interest Rate(a) Maturity Date(b)Market Value
USD
% ofShareholders’
Equity
Transferable securities dealt in another regulated market
Bonds – 7.67%Indonesia42,900,000,000 Indonesia Treasury Bond—Deutsche Bank AG 144A(c) IDR 7.500% 19/08/2032 3,243,325 0.545,131,000,000 Indonesia Treasury Bond—JPMorgan Chase Bank NA 144A(c) IDR 8.375% 17/09/2026 413,169 0.0734,999,000,000 Indonesia Treasury Bond—JPMorgan Chase Bank NA 144A(c) IDR 7.000% 17/05/2027 2,639,797 0.44109,501,000,000 Indonesia Treasury Bond—JPMorgan Chase Bank NA 144A(c) IDR 9.000% 19/03/2029 9,116,036 1.5312,175,000,000 Indonesia Treasury Bond—JPMorgan Chase Bank NA 144A(c) IDR 8.250% 17/05/2029 979,087 0.1730,493,000,000 Indonesia Treasury Bond—JPMorgan Chase Bank NA 144A(c) IDR 7.000% 18/09/2030 2,289,135 0.3840,307,000,000 Indonesia Treasury Bond—JPMorgan Chase Bank NA 144A(c) IDR 6.500% 15/02/2031 2,940,241 0.4986,125,000,000 Indonesia Treasury Bond—JPMorgan Chase Bank NA 144A(c) IDR 8.750% 17/05/2031 7,182,166 1.2084,217,000,000 Indonesia Treasury Bond—JPMorgan Chase Bank NA 144A(c)(d) IDR 7.500% 17/06/2035 6,426,616 1.0858,716,000,000 Indonesia Treasury Bond—Standard Chartered Bank 144A(c) IDR 8.375% 17/09/2026 4,728,052 0.7957,751,000,000 Indonesia Treasury Bond—Standard Chartered Bank 144A(c) IDR 8.750% 19/05/2031 4,815,992 0.813,123,000,000 Indonesia Treasury Bond—Standard Chartered Bank 144A(c) IDR 7.500% 19/08/2032 236,105 0.04
45,009,721 7.54
United States700,000 Federal Home Loan Banks USD 2.625% 12/09/2025 772,625 0.13
TOTAL BONDS(cost USD 43,460,418) 45,782,346 7.67
TOTAL TRANSFERABLE SECURITIES DEALT IN ANOTHER REGULATED MARKET(cost USD 43,460,418) 45,782,346 7.67
Other Transferable Securities
Bonds – 1.04%Canada
1,520,000 Province of Ontario Canada CAD 2.600% 02/06/2025 1,271,918 0.21
Peru5,026,000 Peruvian Government International Bond PEN 8.200% 12/08/2026 1,878,410 0.311,353,000 Peruvian Government International Bond PEN 6.350% 12/08/2028 466,337 0.08
Goldman Sachs Funds—Global Sovereign Bond PortfolioSchedule of InvestmentsAs at 30 November 2020
The accompanying notes are an integral part of these financial statements.
344
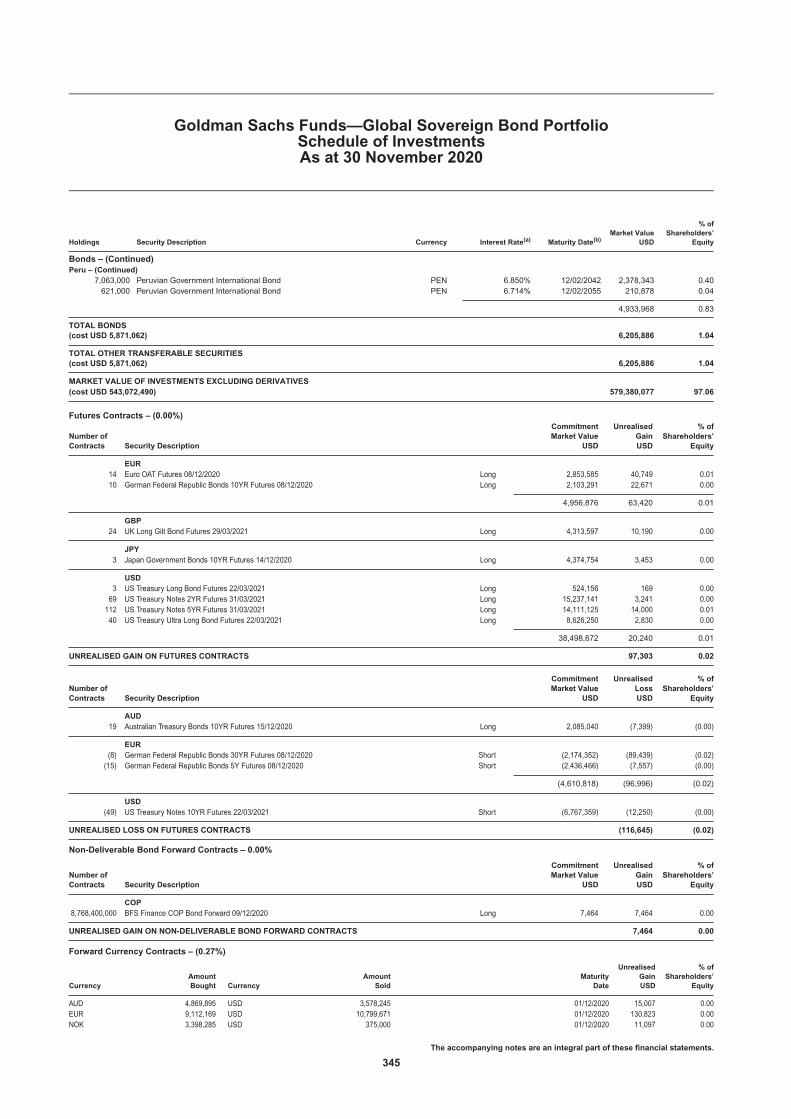
Holdings Security Description Currency Interest Rate(a) Maturity Date(b)Market Value
USD
% ofShareholders’
Equity
Bonds – (Continued)Peru – (Continued)
7,063,000 Peruvian Government International Bond PEN 6.850% 12/02/2042 2,378,343 0.40621,000 Peruvian Government International Bond PEN 6.714% 12/02/2055 210,878 0.04
4,933,968 0.83
TOTAL BONDS(cost USD 5,871,062) 6,205,886 1.04
TOTAL OTHER TRANSFERABLE SECURITIES(cost USD 5,871,062) 6,205,886 1.04
MARKET VALUE OF INVESTMENTS EXCLUDING DERIVATIVES(cost USD 543,072,490) 579,380,077 97.06
Futures Contracts – (0.00%)
Number ofContracts Security Description
CommitmentMarket Value
USD
UnrealisedGainUSD
% ofShareholders’
Equity
EUR14 Euro OAT Futures 08/12/2020 Long 2,853,585 40,749 0.0110 German Federal Republic Bonds 10YR Futures 08/12/2020 Long 2,103,291 22,671 0.00
4,956,876 63,420 0.01
GBP24 UK Long Gilt Bond Futures 29/03/2021 Long 4,313,597 10,190 0.00
JPY3 Japan Government Bonds 10YR Futures 14/12/2020 Long 4,374,754 3,453 0.00
USD3 US Treasury Long Bond Futures 22/03/2021 Long 524,156 169 0.0069 US Treasury Notes 2YR Futures 31/03/2021 Long 15,237,141 3,241 0.00112 US Treasury Notes 5YR Futures 31/03/2021 Long 14,111,125 14,000 0.0140 US Treasury Ultra Long Bond Futures 22/03/2021 Long 8,626,250 2,830 0.00
38,498,672 20,240 0.01
UNREALISED GAIN ON FUTURES CONTRACTS 97,303 0.02
Number ofContracts Security Description
CommitmentMarket Value
USD
UnrealisedLossUSD
% ofShareholders’
Equity
AUD19 Australian Treasury Bonds 10YR Futures 15/12/2020 Long 2,085,040 (7,399) (0.00)
EUR(8) German Federal Republic Bonds 30YR Futures 08/12/2020 Short (2,174,352) (89,439) (0.02)(15) German Federal Republic Bonds 5Y Futures 08/12/2020 Short (2,436,466) (7,557) (0.00)
(4,610,818) (96,996) (0.02)
USD(49) US Treasury Notes 10YR Futures 22/03/2021 Short (6,767,359) (12,250) (0.00)
UNREALISED LOSS ON FUTURES CONTRACTS (116,645) (0.02)
Non-Deliverable Bond Forward Contracts – 0.00%
Number ofContracts Security Description
CommitmentMarket Value
USD
UnrealisedGainUSD
% ofShareholders’
Equity
COP8,768,400,000 BFS Finance COP Bond Forward 09/12/2020 Long 7,464 7,464 0.00
UNREALISED GAIN ON NON-DELIVERABLE BOND FORWARD CONTRACTS 7,464 0.00
Forward Currency Contracts – (0.27%)
CurrencyAmountBought Currency
AmountSold
MaturityDate
UnrealisedGainUSD
% ofShareholders’
Equity
AUD 4,869,895 USD 3,578,245 01/12/2020 15,007 0.00EUR 9,112,169 USD 10,799,671 01/12/2020 130,823 0.00NOK 3,398,285 USD 375,000 01/12/2020 11,097 0.00
Goldman Sachs Funds—Global Sovereign Bond PortfolioSchedule of InvestmentsAs at 30 November 2020
The accompanying notes are an integral part of these financial statements.
345

Forward Currency Contracts – (Continued)
CurrencyAmountBought Currency
AmountSold
MaturityDate
UnrealisedGainUSD
% ofShareholders’
Equity
BRL 1,993,711 USD 374,298 02/12/2020 1,349 0.00IDR 31,672,769,536 USD 2,178,267 04/12/2020 62,783 0.01IDR 11,468,998,441 USD 798,147 07/12/2020 12,240 0.00CZK 145,884,146 USD 6,346,623 09/12/2020 324,566 0.06ILS 11,018,442 USD 3,200,945 09/12/2020 130,527 0.02EUR 3,177,000 USD 3,795,988 10/12/2020 15,729 0.01MXN 718,571,947 USD 33,332,656 10/12/2020 2,424,582 0.42USD 576,091 CLP 439,151,656 14/12/2020 2,249 0.00AUD 1,648,962 EUR 999,657 16/12/2020 17,222 0.00AUD 4,269,264 USD 3,077,679 16/12/2020 72,867 0.00CAD 299,963 CHF 206,359 16/12/2020 3,531 0.00CAD 305,937 JPY 24,500,681 16/12/2020 1,499 0.00CAD 7,984,414 USD 6,061,841 16/12/2020 112,246 0.00CHF 1,431,293 USD 1,570,011 16/12/2020 14,297 0.00CNH 84,099,147 USD 12,437,170 16/12/2020 346,642 0.05COP 703,763,150 USD 187,469 16/12/2020 8,824 0.00CZK 5,240,050 EUR 193,860 16/12/2020 7,036 0.00CZK 53,446,960 USD 2,383,354 16/12/2020 61,300 0.01EUR 187,723 CHF 201,639 16/12/2020 2,082 0.00EUR 787,668 SGD 1,259,540 16/12/2020 3,496 0.00EUR 8,875,442 USD 10,478,112 16/12/2020 172,907 0.04GBP 2,522,427 EUR 2,769,411 16/12/2020 50,437 0.00GBP 2,765,160 USD 3,586,726 16/12/2020 111,821 0.00HUF 332,549,503 USD 1,075,997 16/12/2020 34,551 0.01IDR 6,092,286,962 USD 429,039 16/12/2020 843 0.00ILS 8,791,740 USD 2,570,805 16/12/2020 87,514 0.01JPY 880,669,627 USD 8,369,441 16/12/2020 80,149 0.01MXN 42,391,436 USD 1,971,932 16/12/2020 136,305 0.04NOK 19,284,225 EUR 1,770,104 16/12/2020 66,912 0.00NOK 6,432,770 SEK 6,134,244 16/12/2020 7,589 0.00NOK 22,476,662 USD 2,489,131 16/12/2020 64,736 0.01NZD 339,638 AUD 322,769 16/12/2020 1,108 0.00NZD 342,551 EUR 193,095 16/12/2020 9,625 0.00NZD 4,368,378 USD 2,927,897 16/12/2020 149,921 0.04PLN 2,549,526 EUR 569,442 16/12/2020 266 0.00PLN 59,155,920 USD 15,695,736 16/12/2020 166,290 0.03RON 34,766,617 USD 8,436,969 16/12/2020 118,749 0.03SEK 18,209,692 EUR 1,758,037 16/12/2020 37,465 0.00SEK 7,101,844 USD 808,252 16/12/2020 29,166 0.01SGD 5,021,385 USD 3,708,487 16/12/2020 45,962 0.00THB 299,954,450 USD 9,760,521 16/12/2020 154,290 0.02TRY 7,002,468 USD 838,083 16/12/2020 53,297 0.01USD 424,068 IDR 6,007,586,242 16/12/2020 162 0.00USD 5,599,768 CLP 4,254,327,225 17/12/2020 40,218 0.01ZAR 189,676,303 USD 11,176,696 17/12/2020 1,157,919 0.24IDR 67,268,763,184 USD 4,653,850 06/01/2021 86,098 0.02USD 4,121,997 IDR 58,297,409,808 06/01/2021 14,197 0.00KRW 12,563,995,494 USD 11,166,558 08/01/2021 185,432 0.03TRY 1,979,507 USD 235,256 11/01/2021 14,282 0.00MYR 72,387,206 USD 17,360,707 13/01/2021 395,286 0.07TRY 3,842,268 USD 473,311 19/01/2021 9,577 0.00EUR 39,127,901 USD 46,263,070 21/01/2021 744,360 0.13MYR 72,387,206 USD 17,425,065 26/01/2021 326,049 0.06USD 1,733,285 INR 128,813,753 27/01/2021 1,881 0.00COP 3,197,128,078 USD 872,578 29/01/2021 17,446 0.01INR 36,327,116 USD 482,964 05/02/2021 4,861 0.00USD 626,064 TWD 17,553,391 05/02/2021 5,145 0.00RUB 104,118,017 USD 1,351,470 08/02/2021 7,559 0.00USD 94,712 RUB 7,245,612 08/02/2021 137 0.00NZD 784,679 AUD 730,274 09/02/2021 13,726 0.00USD 3,634,462 PEN 12,838,143 12/07/2021 78,389 0.01
UNREALISED GAIN ON FORWARD CURRENCY CONTRACTS 8,464,621 1.42
CurrencyAmountBought Currency
AmountSold
MaturityDate
UnrealisedLossUSD
% ofShareholders’
Equity
USD 3,558,317 AUD 4,869,894 01/12/2020 (34,933) (0.00)USD 10,823,541 EUR 9,112,166 01/12/2020 (106,956) (0.00)USD 2,641,582 NOK 23,791,522 01/12/2020 (61,492) (0.01)AUD 4,353,661 USD 3,219,653 02/12/2020 (7,304) (0.00)
Goldman Sachs Funds—Global Sovereign Bond PortfolioSchedule of InvestmentsAs at 30 November 2020
The accompanying notes are an integral part of these financial statements.
346

Forward Currency Contracts – (Continued)
CurrencyAmountBought Currency
AmountSold
MaturityDate
UnrealisedLossUSD
% ofShareholders’
Equity
USD 3,207,002 AUD 4,353,661 02/12/2020 (5,348) (0.00)USD 372,035 BRL 1,993,712 02/12/2020 (3,612) (0.00)USD 2,238,865 IDR 31,672,769,536 04/12/2020 (2,186) (0.00)USD 2,080,420 EUR 1,754,494 07/12/2020 (24,421) (0.00)USD 467,692 IDR 6,661,919,837 07/12/2020 (3,032) (0.00)USD 816,491 SGD 1,107,788 07/12/2020 (11,788) (0.00)USD 8,885,970 ZAR 145,921,399 07/12/2020 (615,844) (0.11)USD 2,473,541 HUF 764,444,687 09/12/2020 (79,270) (0.01)USD 3,221,464 EUR 2,701,838 10/12/2020 (20,160) (0.00)USD 742,010 DKK 4,696,714 11/12/2020 (15,245) (0.00)CLP 254,169,524 USD 333,826 14/12/2020 (1,701) (0.00)TWD 20,020,943 USD 705,864 14/12/2020 (3,973) (0.00)USD 887,805 NOK 7,909,945 14/12/2020 (10,933) (0.00)USD 542,644 EUR 455,048 15/12/2020 (3,417) (0.00)USD 304,924 GBP 229,266 15/12/2020 (1,725) (0.00)AUD 313,832 CAD 301,702 16/12/2020 (1,701) (0.00)CHF 606,862 EUR 563,760 16/12/2020 (4,805) (0.00)EUR 196,131 CAD 305,632 16/12/2020 (967) (0.00)EUR 192,721 CZK 5,217,349 16/12/2020 (7,364) (0.00)EUR 914,681 GBP 830,907 16/12/2020 (13,714) (0.00)EUR 192,721 HUF 70,651,599 16/12/2020 (4,665) (0.00)EUR 479,477 NOK 5,318,099 16/12/2020 (28,859) (0.00)EUR 194,260 PLN 881,009 16/12/2020 (3,110) (0.00)EUR 2,450,411 SEK 25,460,615 16/12/2020 (61,574) (0.01)HUF 138,334,169 EUR 388,432 16/12/2020 (4,172) (0.00)JPY 48,208,978 AUD 635,536 16/12/2020 (6,458) (0.00)JPY 192,122,639 EUR 1,561,418 16/12/2020 (30,466) (0.00)USD 4,407,700 AUD 6,129,729 16/12/2020 (115,791) (0.01)USD 7,529,309 CAD 9,881,983 16/12/2020 (112,105) (0.01)USD 1,757,043 CHF 1,592,722 16/12/2020 (5,952) (0.00)USD 11,660,061 CNH 78,466,630 16/12/2020 (267,561) (0.04)USD 284,203 COP 1,032,878,960 16/12/2020 (3,884) (0.00)USD 8,127,851 CZK 183,025,616 16/12/2020 (243,702) (0.05)USD 127,166,888 EUR 107,848,508 16/12/2020 (2,257,224) (0.41)USD 11,400,457 GBP 8,697,887 16/12/2020 (233,424) (0.03)USD 358,335 HUF 109,047,463 16/12/2020 (5,828) (0.00)USD 9,393,280 ILS 31,883,556 16/12/2020 (247,207) (0.03)USD 6,500,165 JPY 682,451,235 16/12/2020 (47,622) (0.00)USD 23,820,168 MXN 519,916,420 16/12/2020 (2,036,643) (0.36)USD 2,686,263 NOK 24,925,945 16/12/2020 (145,900) (0.04)USD 1,269,085 NZD 1,910,421 16/12/2020 (76,937) (0.01)USD 1,356,059 PLN 5,205,986 16/12/2020 (39,872) (0.01)USD 1,271,260 SEK 11,250,703 16/12/2020 (55,372) (0.01)USD 1,874,395 SGD 2,527,815 16/12/2020 (15,632) (0.00)USD 11,258,232 THB 353,307,386 16/12/2020 (420,126) (0.07)USD 93,665 TRY 746,057 16/12/2020 (1,305) (0.00)CLP 549,610,513 USD 725,161 17/12/2020 (6,932) (0.00)USD 2,327,041 ZAR 37,827,020 17/12/2020 (132,843) (0.04)USD 4,378,156 AUD 6,150,305 21/12/2020 (160,778) (0.03)USD 681,928 CAD 906,911 21/12/2020 (19,393) (0.01)USD 8,287,250 PLN 31,711,254 21/12/2020 (216,296) (0.04)USD 4,529,552 RON 18,545,249 21/12/2020 (33,143) (0.01)USD 57,762,211 JPY 6,116,810,159 23/12/2020 (937,394) (0.16)USD 2,320,701 KRW 2,590,769,177 08/01/2021 (20,145) (0.00)USD 188,785 TRY 1,636,101 11/01/2021 (17,464) (0.00)USD 19,983,511 GBP 15,540,595 13/01/2021 (812,334) (0.14)USD 380,852 TRY 3,068,734 19/01/2021 (4,820) (0.00)USD 581,154 EUR 488,631 21/01/2021 (5,877) (0.00)TRY 785,637 USD 99,429 25/01/2021 (916) (0.00)USD 100,577 RUB 7,702,161 25/01/2021 (101) (0.00)USD 540,754 TRY 4,367,952 25/01/2021 (6,953) (0.00)CAD 258,565 NZD 284,450 27/01/2021 (433) (0.00)INR 117,816,351 USD 1,584,351 27/01/2021 (764) (0.00)USD 6,659,570 COP 24,332,449,202 29/01/2021 (114,159) (0.02)USD 16,476,200 JPY 1,718,284,809 01/02/2021 (24,767) (0.01)USD 3,117,993 PHP 151,285,009 04/02/2021 (17,866) (0.01)TWD 26,387,568 USD 940,133 05/02/2021 (6,721) (0.00)AUD 1,138,449 NZD 1,209,295 09/02/2021 (11,555) (0.00)PEN 1,599,786 USD 448,827 12/07/2021 (5,698) (0.00)
UNREALISED LOSS ON FORWARD CURRENCY CONTRACTS (10,070,634) (1.69)
Goldman Sachs Funds—Global Sovereign Bond PortfolioSchedule of InvestmentsAs at 30 November 2020
The accompanying notes are an integral part of these financial statements.
347

Share Class Specific Forward Currency Contracts – 1.39%
CurrencyAmountBought Currency
AmountSold
MaturityDate
UnrealisedGainUSD
% ofShareholders’
Equity
GBP 146,463,000 USD 188,335,454 13/01/2021 7,655,873 1.28EUR 33,456,954 USD 39,561,018 21/01/2021 633,456 0.11
UNREALISED GAIN ON FORWARD CURRENCY CONTRACTS HELD FOR HEDGING PURPOSES 8,289,329 1.39
Options – (0.06%)
Holdings Security Description
UnrealisedGain/(Loss)
USDMarket Value
USD
% ofShareholders’
Equity
Purchased OptionsEUR
3,184,000 Call EUR / Put USD Expires 03/12/2020 Strike 1.19 13,467 22,912 0.003,195,000 Call EUR / Put USD Expires 03/12/2020 Strike 1.19 20,939 28,043 0.011,603,000 Call EUR / Put USD Expires 08/12/2020 Strike 1.19 9,271 12,799 0.001,598,000 Call EUR / Put USD Expires 11/12/2020 Strike 1.20 5,290 9,851 0.00
48,967 73,605 0.01
GBP714,000 Call GBP / Put USD Expires 11/12/2020 Strike 1.35 1,748 4,900 0.00
USD3,980,000 Call 3 month LIBOR Swaption Expires 15/01/2021 Strike 0.61 (17,595) 4,096 0.004,040,000 Call 3 month LIBOR Swaption Expires 12/02/2021 Strike 0.83 9,437 30,850 0.013,470,000 Call 3 month LIBOR Swaption Expires 16/02/2021 Strike 0.78 3,848 21,154 0.00942,000 Put USD / Call NOK Expires 10/12/2020 Strike 8.92 10,595 16,187 0.00
6,285 72,287 0.01
TOTAL PURCHASED OPTIONS(cost USD 93,792) 150,792 0.02
Written OptionsAUD
(2,523,000) Put AUD / Call NZD Expires 05/02/2021 Strike 1.06 (20,121) (29,380) (0.01)
EUR(4,240,000) Call 6 month EURIBOR Swaption Expires 30/11/2020 Strike 0.15 (9,598) (52,422) (0.01)(1,320,000) Call 6 month EURIBOR Swaption Expires 01/12/2020 Strike 0.15 (2,636) (16,288) (0.00)(900,000) Call 6 month EURIBOR Swaption Expires 02/12/2020 Strike 0.15 (864) (11,087) (0.00)
(3,700,000) Call 6 month EURIBOR Swaption Expires 02/12/2020 Strike 0.20 10,635 (22,998) (0.01)(2,760,000) Call 6 month EURIBOR Swaption Expires 03/12/2020 Strike 0.20 10,621 (17,169) (0.00)(3,710,000) Call 6 month EURIBOR Swaption Expires 14/01/2021 Strike 0.25 14,821 (17,471) (0.00)(4,850,000) Call 6 month EURIBOR Swaption Expires 15/01/2021 Strike 0.39 16,184 (3,558) (0.00)(4,930,000) Call 6 month EURIBOR Swaption Expires 12/02/2021 Strike 0.26 (8,139) (27,679) (0.01)(4,230,000) Call 6 month EURIBOR Swaption Expires 16/02/2021 Strike 0.29 (2,075) (17,955) (0.00)(4,240,000) Put 6 month EURIBOR Swaption Expires 30/11/2020 Strike 0.10 13,602 (0) (0.00)(1,320,000) Put 6 month EURIBOR Swaption Expires 01/12/2020 Strike 0.10 3,788 (0) (0.00)(900,000) Put 6 month EURIBOR Swaption Expires 02/12/2020 Strike 0.10 2,023 (0) (0.00)
(3,710,000) Put 6 month EURIBOR Swaption Expires 14/01/2021 Strike 0.00 3,874 (1,254) (0.00)
52,236 (187,881) (0.03)
NZD(1,363,000) Put NZD / Call CAD Expires 25/01/2021 Strike 0.89 592 (3,296) (0.00)
USD(16,490,000) Call 3 month LIBOR Swaption Expires 06/01/2021 Strike 0.28 (2,127) (2,127) (0.00)(16,490,000) Call 3 month LIBOR Swaption Expires 20/01/2021 Strike 0.31 (5,818) (5,818) (0.00)(10,600,000) Call 3 month LIBOR Swaption Expires 18/05/2021 Strike 0.49 56,621 (50,439) (0.01)(10,800,000) Call 3 month LIBOR Swaption Expires 19/05/2021 Strike 0.48 61,005 (48,804) (0.01)(945,000) Call USD / Put RUB Expires 22/01/2021 Strike 82.86 1,976 (4,015) (0.00)
(16,490,000) Put 3 month LIBOR Swaption Expires 06/01/2021 Strike 0.48 7,587 (17,808) (0.00)(16,490,000) Put 3 month LIBOR Swaption Expires 20/01/2021 Strike 0.51 7,844 (18,045) (0.00)(10,600,000) Put 3 month LIBOR Swaption Expires 18/05/2021 Strike 0.49 53,641 (53,419) (0.01)(10,800,000) Put 3 month LIBOR Swaption Expires 19/05/2021 Strike 0.48 52,334 (57,475) (0.01)
233,063 (257,950) (0.04)
TOTAL WRITTEN OPTIONS(cost USD (744,277)) (478,507) (0.08)
TOTAL OPTIONS(cost USD (650,485)) (327,715) (0.06)
Goldman Sachs Funds—Global Sovereign Bond PortfolioSchedule of InvestmentsAs at 30 November 2020
The accompanying notes are an integral part of these financial statements.
348
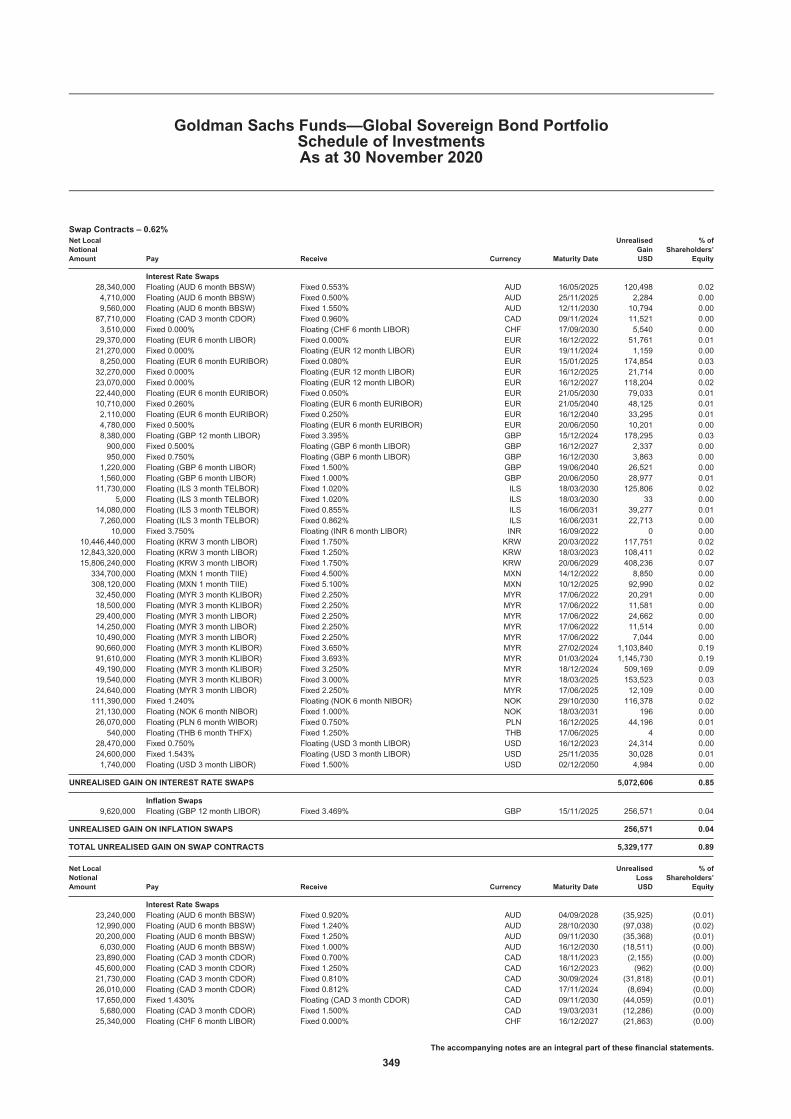
Swap Contracts – 0.62%Net LocalNotionalAmount Pay Receive Currency Maturity Date
UnrealisedGainUSD
% ofShareholders’
Equity
Interest Rate Swaps28,340,000 Floating (AUD 6 month BBSW) Fixed 0.553% AUD 16/05/2025 120,498 0.024,710,000 Floating (AUD 6 month BBSW) Fixed 0.500% AUD 25/11/2025 2,284 0.009,560,000 Floating (AUD 6 month BBSW) Fixed 1.550% AUD 12/11/2030 10,794 0.0087,710,000 Floating (CAD 3 month CDOR) Fixed 0.960% CAD 09/11/2024 11,521 0.003,510,000 Fixed 0.000% Floating (CHF 6 month LIBOR) CHF 17/09/2030 5,540 0.0029,370,000 Floating (EUR 6 month LIBOR) Fixed 0.000% EUR 16/12/2022 51,761 0.0121,270,000 Fixed 0.000% Floating (EUR 12 month LIBOR) EUR 19/11/2024 1,159 0.008,250,000 Floating (EUR 6 month EURIBOR) Fixed 0.080% EUR 15/01/2025 174,854 0.0332,270,000 Fixed 0.000% Floating (EUR 12 month LIBOR) EUR 16/12/2025 21,714 0.0023,070,000 Fixed 0.000% Floating (EUR 12 month LIBOR) EUR 16/12/2027 118,204 0.0222,440,000 Floating (EUR 6 month EURIBOR) Fixed 0.050% EUR 21/05/2030 79,033 0.0110,710,000 Fixed 0.260% Floating (EUR 6 month EURIBOR) EUR 21/05/2040 48,125 0.012,110,000 Floating (EUR 6 month EURIBOR) Fixed 0.250% EUR 16/12/2040 33,295 0.014,780,000 Fixed 0.500% Floating (EUR 6 month EURIBOR) EUR 20/06/2050 10,201 0.008,380,000 Floating (GBP 12 month LIBOR) Fixed 3.395% GBP 15/12/2024 178,295 0.03900,000 Fixed 0.500% Floating (GBP 6 month LIBOR) GBP 16/12/2027 2,337 0.00950,000 Fixed 0.750% Floating (GBP 6 month LIBOR) GBP 16/12/2030 3,863 0.00
1,220,000 Floating (GBP 6 month LIBOR) Fixed 1.500% GBP 19/06/2040 26,521 0.001,560,000 Floating (GBP 6 month LIBOR) Fixed 1.000% GBP 20/06/2050 28,977 0.0111,730,000 Floating (ILS 3 month TELBOR) Fixed 1.020% ILS 18/03/2030 125,806 0.02
5,000 Floating (ILS 3 month TELBOR) Fixed 1.020% ILS 18/03/2030 33 0.0014,080,000 Floating (ILS 3 month TELBOR) Fixed 0.855% ILS 16/06/2031 39,277 0.017,260,000 Floating (ILS 3 month TELBOR) Fixed 0.862% ILS 16/06/2031 22,713 0.0010,000 Fixed 3.750% Floating (INR 6 month LIBOR) INR 16/09/2022 0 0.00
10,446,440,000 Floating (KRW 3 month LIBOR) Fixed 1.750% KRW 20/03/2022 117,751 0.0212,843,320,000 Floating (KRW 3 month LIBOR) Fixed 1.250% KRW 18/03/2023 108,411 0.0215,806,240,000 Floating (KRW 3 month LIBOR) Fixed 1.750% KRW 20/06/2029 408,236 0.07334,700,000 Floating (MXN 1 month TIIE) Fixed 4.500% MXN 14/12/2022 8,850 0.00308,120,000 Floating (MXN 1 month TIIE) Fixed 5.100% MXN 10/12/2025 92,990 0.0232,450,000 Floating (MYR 3 month KLIBOR) Fixed 2.250% MYR 17/06/2022 20,291 0.0018,500,000 Floating (MYR 3 month KLIBOR) Fixed 2.250% MYR 17/06/2022 11,581 0.0029,400,000 Floating (MYR 3 month LIBOR) Fixed 2.250% MYR 17/06/2022 24,662 0.0014,250,000 Floating (MYR 3 month LIBOR) Fixed 2.250% MYR 17/06/2022 11,514 0.0010,490,000 Floating (MYR 3 month LIBOR) Fixed 2.250% MYR 17/06/2022 7,044 0.0090,660,000 Floating (MYR 3 month KLIBOR) Fixed 3.650% MYR 27/02/2024 1,103,840 0.1991,610,000 Floating (MYR 3 month KLIBOR) Fixed 3.693% MYR 01/03/2024 1,145,730 0.1949,190,000 Floating (MYR 3 month KLIBOR) Fixed 3.250% MYR 18/12/2024 509,169 0.0919,540,000 Floating (MYR 3 month KLIBOR) Fixed 3.000% MYR 18/03/2025 153,523 0.0324,640,000 Floating (MYR 3 month LIBOR) Fixed 2.250% MYR 17/06/2025 12,109 0.00111,390,000 Fixed 1.240% Floating (NOK 6 month NIBOR) NOK 29/10/2030 116,378 0.0221,130,000 Floating (NOK 6 month NIBOR) Fixed 1.000% NOK 18/03/2031 196 0.0026,070,000 Floating (PLN 6 month WIBOR) Fixed 0.750% PLN 16/12/2025 44,196 0.01540,000 Floating (THB 6 month THFX) Fixed 1.250% THB 17/06/2025 4 0.00
28,470,000 Fixed 0.750% Floating (USD 3 month LIBOR) USD 16/12/2023 24,314 0.0024,600,000 Fixed 1.543% Floating (USD 3 month LIBOR) USD 25/11/2035 30,028 0.011,740,000 Floating (USD 3 month LIBOR) Fixed 1.500% USD 02/12/2050 4,984 0.00
UNREALISED GAIN ON INTEREST RATE SWAPS 5,072,606 0.85
Inflation Swaps9,620,000 Floating (GBP 12 month LIBOR) Fixed 3.469% GBP 15/11/2025 256,571 0.04
UNREALISED GAIN ON INFLATION SWAPS 256,571 0.04
TOTAL UNREALISED GAIN ON SWAP CONTRACTS 5,329,177 0.89
Net LocalNotionalAmount Pay Receive Currency Maturity Date
UnrealisedLossUSD
% ofShareholders’
Equity
Interest Rate Swaps23,240,000 Floating (AUD 6 month BBSW) Fixed 0.920% AUD 04/09/2028 (35,925) (0.01)12,990,000 Floating (AUD 6 month BBSW) Fixed 1.240% AUD 28/10/2030 (97,038) (0.02)20,200,000 Floating (AUD 6 month BBSW) Fixed 1.250% AUD 09/11/2030 (35,368) (0.01)6,030,000 Floating (AUD 6 month BBSW) Fixed 1.000% AUD 16/12/2030 (18,511) (0.00)23,890,000 Floating (CAD 3 month CDOR) Fixed 0.700% CAD 18/11/2023 (2,155) (0.00)45,600,000 Floating (CAD 3 month CDOR) Fixed 1.250% CAD 16/12/2023 (962) (0.00)21,730,000 Floating (CAD 3 month CDOR) Fixed 0.810% CAD 30/09/2024 (31,818) (0.01)26,010,000 Floating (CAD 3 month CDOR) Fixed 0.812% CAD 17/11/2024 (8,694) (0.00)17,650,000 Fixed 1.430% Floating (CAD 3 month CDOR) CAD 09/11/2030 (44,059) (0.01)5,680,000 Floating (CAD 3 month CDOR) Fixed 1.500% CAD 19/03/2031 (12,286) (0.00)25,340,000 Floating (CHF 6 month LIBOR) Fixed 0.000% CHF 16/12/2027 (21,863) (0.00)
Goldman Sachs Funds—Global Sovereign Bond PortfolioSchedule of InvestmentsAs at 30 November 2020
The accompanying notes are an integral part of these financial statements.
349

Swap Contracts – (Continued)
Net LocalNotionalAmount Pay Receive Currency Maturity Date
UnrealisedLossUSD
% ofShareholders’
Equity
Interest Rate Swaps – (Continued)620,000 Floating (CHF 6 month LIBOR) Fixed 0.000% CHF 16/12/2030 (694) (0.00)
5,728,490,000 Floating (CLP 6 month LIBOR) Fixed 1.500% CLP 16/12/2025 (81,966) (0.01)1,372,830,000 Floating (CLP 6 month LIBOR) Fixed 2.400% CLP 16/12/2030 (50,014) (0.01)10,845,720,000 Fixed 3.400% Floating (COP 3 month LIBOR) COP 16/12/2025 (29,604) (0.01)
2,970,000 Fixed 0.000% Floating (EUR 6 month LIBOR) EUR 16/12/2023 (5,029) (0.00)20,870,000 Fixed 0.000% Floating (EUR 12 month LIBOR) EUR 18/05/2025 (4,567) (0.00)8,190,000 Fixed 0.000% Floating (EUR 6 month LIBOR) EUR 16/12/2025 (28,883) (0.00)22,330,000 Fixed 0.250% Floating (EUR 6 month EURIBOR) EUR 18/06/2030 (158,910) (0.03)5,440,000 Fixed 0.000% Floating (EUR 6 month LIBOR) EUR 16/12/2030 (44,204) (0.01)5,160,000 Fixed 0.750% Floating (EUR 6 month EURIBOR) EUR 19/06/2040 (20,317) (0.00)1,570,000 Fixed 0.100% Floating (EUR 6 month EURIBOR) EUR 02/12/2050 (1,263) (0.00)1,140,000 Fixed 0.250% Floating (EUR 6 month EURIBOR) EUR 16/12/2050 (4,455) (0.00)840,000 Floating (GBP 6 month LIBOR) Fixed 1.750% GBP 20/03/2039 (38,113) (0.01)
207,420,000 Fixed 0.250% Floating (JPY 6 month LIBOR) JPY 19/03/2030 (2,288) (0.00)3,567,070,000 Fixed 0.144% Floating (JPY 6 month LIBOR) JPY 13/11/2030 (11,038) (0.00)193,800,000 Fixed 0.500% Floating (JPY 6 month LIBOR) JPY 19/03/2041 (9,965) (0.00)92,410,000 Fixed 0.500% Floating (JPY 6 month LIBOR) JPY 20/06/2050 (6,043) (0.00)
11,920,880,000 Floating (KRW 3 month LIBOR) Fixed 1.000% KRW 16/09/2030 (226,787) (0.04)110,320,000 Floating (NOK 6 month NIBOR) Fixed 0.750% NOK 16/12/2025 (78,562) (0.01)3,270,000 Floating (NZD 3 month NZDBB) Fixed 1.750% NZD 19/03/2030 (1,945) (0.00)
129,640,000 Fixed 0.250% Floating (PLN 3 month WIBOR) PLN 16/12/2021 (15,258) (0.00)159,080,000 Floating (SEK 3 month STIBOR) Fixed 0.000% SEK 16/12/2025 (17,943) (0.00)17,270,000 Fixed 0.750% Floating (SEK 3 month STIBOR) SEK 18/06/2030 (5,320) (0.00)317,300,000 Floating (THB 6 month LIBOR) Fixed 0.750% THB 16/12/2025 (17,486) (0.00)90,640,000 Floating (THB 6 month LIBOR) Fixed 0.750% THB 17/03/2026 (10,983) (0.00)110,480,000 Floating (USD 1 month LIBOR) Floating (USD 3 month LIBOR) USD 25/07/2024 (35,054) (0.01)65,550,000 Floating (USD 3 month SOFR) Floating (USD 3 month LIBOR) USD 10/11/2024 (49,120) (0.01)4,220,000 Fixed 1.000% Floating (USD 3 month LIBOR) USD 16/12/2025 (18,044) (0.00)16,150,000 Floating (USD 3 month LIBOR) Fixed 1.750% USD 18/06/2030 (129,176) (0.02)14,460,000 Fixed 1.190% Floating (USD 3 month LIBOR) USD 10/11/2030 (40,524) (0.01)22,330,000 Floating (USD 3 month LIBOR) Fixed 1.245% USD 24/11/2030 (14,133) (0.00)4,030,000 Floating (USD 3 month LIBOR) Fixed 1.750% USD 19/06/2040 (51,873) (0.01)3,900,000 Floating (USD 3 month LIBOR) Fixed 1.750% USD 20/06/2050 (31,412) (0.01)
UNREALISED LOSS ON INTEREST RATE SWAPS (1,549,652) (0.26)
Credit Default Swaps440,000 Fixed 1.000% Floating (China Government
International Bond)USD 20/06/2021 (2,764) (0.00)
1,160,000 Fixed 1.000% Floating (China GovernmentInternational Bond)
USD 20/06/2021 (7,494) (0.00)
1,660,000 Fixed 1.000% Floating (China GovernmentInternational Bond)
USD 20/06/2021 (10,859) (0.00)
2,690,000 Fixed 1.000% Floating (China GovernmentInternational Bond)
USD 20/06/2021 (17,006) (0.01)
2,120,000 Fixed 1.000% Floating (China GovernmentInternational Bond)
USD 20/06/2021 (13,515) (0.00)
2,050,000 Fixed 1.000% Floating (China GovernmentInternational Bond)
USD 20/06/2021 (12,937) (0.00)
810,000 Fixed 1.000% Floating (China GovernmentInternational Bond)
USD 20/06/2021 (4,702) (0.00)
1,470,000 Fixed 1.000% Floating (China GovernmentInternational Bond)
USD 20/12/2022 (13,984) (0.00)
50,000 Fixed 1.000% Floating (China GovernmentInternational Bond)
USD 20/12/2022 (523) (0.00)
UNREALISED LOSS ON CREDIT DEFAULT SWAPS (83,784) (0.01)
TOTAL UNREALISED LOSS ON SWAP CONTRACTS (1,633,436) (0.27)
MARKET VALUE OF INVESTMENTS(cost USD 542,422,005)
589,419,541 98.74
OTHER ASSETS AND LIABILITIES 7,531,924 1.26
SHAREHOLDERS’ EQUITY 596,951,465 100.00
Goldman Sachs Funds—Global Sovereign Bond PortfolioSchedule of InvestmentsAs at 30 November 2020
The accompanying notes are an integral part of these financial statements.
350

TOTAL INVESTMENTSMarket Value
USD
% ofShareholders’
Equity
Total Investments excluding derivatives (cost USD 543,072,490) 579,380,077 97.06Unrealised gain on futures contracts 97,303 0.02Unrealised loss on futures contracts (116,645) (0.02)Unrealised gain on non-deliverable bond forward contracts 7,464 0.00Unrealised gain on forward currency contracts 8,464,621 1.42Unrealised loss on forward currency contracts (10,070,634) (1.69)Unrealised gain on forward currency contracts held for hedging purposes 8,289,329 1.39Market value of purchased options (cost USD 93,792) 150,792 0.02Market value of written options (cost USD (744,277)) (478,507) (0.08)Unrealised gain on swap contracts 5,329,177 0.89Unrealised loss on swap contracts (1,633,436) (0.27)Other Assets and Liabilities 7,531,924 1.26
Shareholders’ Equity 596,951,465 100.00
The Futures Commission Merchant was Morgan Stanley & Co., Inc.
The counterparties for forward currency contracts were Bank of America N.A., Barclays Bank Plc., BNP Paribas S.A., Citibank N.A., Credit Suisse International, Deutsche Bank AG, HSBCBank Plc., JP Morgan Chase Bank N.A., Merrill Lynch International, Morgan Stanley & Co. International Plc., Natwest Markets Plc., Royal Bank of Canada, Standard Chartered Bank,State Street Bank & Trust and UBS AG.
The counterparties for options contracts were Bank of America N.A., BNP Paribas S.A., Citibank N.A., JP Morgan Chase Bank N.A., Morgan Stanley & Co. International Plc. and UBS AG.
The counterparties for swap contracts were Bank of America N.A., Barclays Bank Plc., BNP Paribas S.A., Citibank N.A., JP Morgan Chase Bank N.A., Morgan Stanley, Morgan Stanley& Co. International Plc., Morgan Stanley & Co. LLC and UBS AG.
The maximum individual counterparty exposure as at 30 November 2020 is 1.42% of the NAV.
(a) Interest rates represent either the stated coupon rate, annualised discounted yield on date of purchase for discounted securities, or, for floating rate securities, the current reset ratewhich is based upon interest rates indices.
(b) Maturity dates represent either the stated date on the security, or the next interest reset date for floating rate securities or the prerefunded date for those type of securities.(c) 144A: This security is issued to qualified institutional investors, pursuant to private placements, and is transferable as stated in rule 144A of the US Securities Act of 1933.(d) Variable and floating coupon rates are those quoted as of 30 November 2020.(e) A related party to Goldman Sachs Funds.(f) The yield for this fund as at 30 November 2020 was 0.120%.
Goldman Sachs Funds—Global Sovereign Bond PortfolioSchedule of InvestmentsAs at 30 November 2020
The accompanying notes are an integral part of these financial statements.
351

Holdings Security Description Currency Interest Rate(a) Maturity Date(b)Market Value
USD
% ofShareholders’
Equity
Transferable securities admitted to an official exchange listing
Bonds – 16.05%Canada
625,000 Cenovus Energy, Inc. USD 5.375% 15/07/2025 690,638 0.37
Curacao562,000 Teva Pharmaceutical Finance Co. BV USD 2.950% 18/12/2022 564,810 0.31
France1,218,000 Altice France S.A. 144A(c) USD 7.375% 01/05/2026 1,283,468 0.70
Ireland161,000 AerCap Ireland Capital DAC Via AerCap Global Aviation Trust USD 6.500% 15/07/2025 185,617 0.10
Luxembourg950,000 Altice Financing S.A. 144A(c) USD 5.000% 15/01/2028 977,312 0.53500,000 Consolidated Energy Finance S.A. 144A(c) USD 6.875% 15/06/2025 490,000 0.27
1,467,312 0.80
Netherlands250,000 PPF Telecom Group BV EUR 3.250% 29/09/2027 319,630 0.17
2,064,000 Teva Pharmaceutical Finance Netherlands III BV USD 2.800% 21/07/2023 2,038,200 1.11300,000 Ziggo Bond Co. BV 144A(c) USD 5.125% 28/02/2030 317,625 0.17
2,675,455 1.45
Norway150,000 Adevinta ASA EUR 2.625% 15/11/2025 183,395 0.10100,000 Adevinta ASA EUR 3.000% 15/11/2027 124,345 0.07
307,740 0.17
United States533,000 AECOM USD 5.875% 15/10/2024 594,295 0.32
1,943,000 AECOM USD 5.125% 15/03/2027 2,171,302 1.18600,000 Ashtead Capital, Inc. 144A(c) USD 4.375% 15/08/2027 631,896 0.34214,000 Berry Global, Inc. USD 5.125% 15/07/2023 218,280 0.12
1,500,000 CenturyLink, Inc.—Series T USD 5.800% 15/03/2022 1,567,500 0.85300,000 Dana, Inc. USD 5.625% 15/06/2028 324,750 0.18679,000 Encompass Health Corp. USD 4.500% 01/02/2028 716,345 0.39721,000 EnLink Midstream LLC USD 5.375% 01/06/2029 681,345 0.37156,000 Ford Motor Co. USD 9.000% 22/04/2025 189,971 0.10
1,139,000 Ford Motor Credit Co., LLC USD 4.063% 01/11/2024 1,185,494 0.64250,000 Ford Motor Credit Co., LLC USD 4.687% 09/06/2025 265,880 0.14250,000 Ford Motor Credit Co., LLC USD 5.125% 16/06/2025 270,355 0.15915,000 Ford Motor Credit Co., LLC USD 3.375% 13/11/2025 921,040 0.50625,000 Ford Motor Credit Co., LLC USD 4.125% 17/08/2027 645,803 0.35667,000 HCA, Inc. USD 3.500% 01/09/2030 692,012 0.38500,000 Laredo Petroleum, Inc. USD 10.125% 15/01/2028 332,500 0.18280,000 MPT Operating Partnership LP Via MPT Finance Corp. USD 3.500% 15/03/2031 285,365 0.15410,000 NuStar Logistics LP USD 5.750% 01/10/2025 433,575 0.24500,000 Occidental Petroleum Corp. USD 8.000% 15/07/2025 550,000 0.30625,000 Occidental Petroleum Corp. USD 6.625% 01/09/2030 655,469 0.36459,000 OneMain Finance Corp. USD 8.875% 01/06/2025 516,375 0.28859,000 Tenet Healthcare Corp. USD 4.625% 15/07/2024 878,327 0.48864,000 TransDigm, Inc. USD 5.500% 15/11/2027 894,240 0.49141,000 TRI Pointe Group, Inc. USD 5.250% 01/06/2027 154,219 0.08119,000 TRI Pointe Group, Inc. USD 5.700% 15/06/2028 135,065 0.07
1,218,000 Triumph Group, Inc. USD 5.250% 01/06/2022 1,126,650 0.612,000,000 United States Treasury Bill USD 0.084% 15/04/2021 1,999,419 1.08683,000 Verizon Communications, Inc. USD 1.750% 20/01/2031 690,001 0.37865,000 Vertical US Newco, Inc. 144A(c) USD 5.250% 15/07/2027 912,575 0.50300,000 WPX Energy, Inc. USD 5.250% 15/10/2027 316,500 0.17700,000 WPX Energy, Inc. USD 5.875% 15/06/2028 761,250 0.41502,000 WPX Energy, Inc. USD 4.500% 15/01/2030 520,825 0.28168,000 Yum! Brands, Inc. USD 3.625% 15/03/2031 168,840 0.09
22,407,463 12.15
TOTAL BONDS(cost USD 28,549,970) 29,582,503 16.05
Goldman Sachs Funds—Short Duration Opportunistic Corporate Bond PortfolioSchedule of InvestmentsAs at 30 November 2020
The accompanying notes are an integral part of these financial statements.
352

Holdings Security DescriptionMarket Value
USD
% ofShareholders’
Equity
Mutual Funds – 0.00%Ireland
2,207 Goldman Sachs US$ Liquid Reserves Fund (X Distribution Class)(d)(e) 2,207 0.00
TOTAL MUTUAL FUNDS(cost USD 2,207) 2,207 0.00
TOTAL TRANSFERABLE SECURITIES ADMITTED TO AN OFFICIAL EXCHANGE LISTING(cost USD 28,552,177) 29,584,710 16.05
Holdings Security Description Currency Interest Rate(a) Maturity Date(b)Market Value
USD
% ofShareholders’
Equity
Transferable securities dealt in another regulated market
Bonds – 77.51%Bermuda
1,845,000 Nabors Industries Ltd. 144A(c) USD 7.500% 15/01/2028 982,463 0.53
Canada258,000 1011778 BC ULC Via New Red Finance, Inc. 144A(c) USD 4.250% 15/05/2024 264,128 0.14991,000 1011778 BC ULC Via New Red Finance, Inc. 144A(c) USD 4.375% 15/01/2028 1,025,685 0.56
1,035,000 1011778 BC ULC Via New Red Finance, Inc. 144A(c) USD 4.000% 15/10/2030 1,042,762 0.57651,000 Bausch Health Cos., Inc. 144A(c) USD 5.500% 01/03/2023 654,255 0.35
1,075,000 Bausch Health Cos., Inc. 144A(c) USD 5.500% 01/11/2025 1,113,969 0.60298,000 Bausch Health Cos., Inc. 144A(c) USD 6.250% 15/02/2029 317,370 0.17630,000 Bausch Health Cos., Inc. 144A(c) USD 5.250% 15/02/2031 642,600 0.35443,000 Bombardier, Inc. 144A(c) USD 8.750% 01/12/2021 454,075 0.25795,000 Bombardier, Inc. 144A(c) USD 6.000% 15/10/2022 763,200 0.41727,000 Brookfield Residential Properties, Inc. Via Brookfield Residential US Corp.
144A(c) USD 4.875% 15/02/2030 718,821 0.39514,000 GFL Environmental, Inc. 144A(c) USD 5.125% 15/12/2026 546,767 0.30340,000 Hudbay Minerals, Inc. 144A(c) USD 6.125% 01/04/2029 364,225 0.20954,000 Mattamy Group Corp. 144A(c) USD 4.625% 01/03/2030 1,008,855 0.55485,000 Open Text Corp. 144A(c) USD 3.875% 15/02/2028 504,400 0.27267,000 Ritchie Bros Auctioneers, Inc. 144A(c) USD 5.375% 15/01/2025 275,678 0.15
9,696,790 5.26
Cayman Islands458,000 Avolon Holdings Funding Ltd. 144A(c) USD 4.375% 01/05/2026 474,699 0.26489,110 Global Aircraft Leasing Co., Ltd. 144A(c) USD 6.500% 15/09/2024 435,308 0.24
1,054,000 Noble Holding International Ltd. 144A(c) USD 7.875% 01/02/2026 288,332 0.161,163,000 Park Aerospace Holdings Ltd. 144A(c) USD 5.250% 15/08/2022 1,215,847 0.6618,000 Transocean Phoenix 2 Ltd. 144A(c) USD 7.750% 15/10/2024 17,100 0.01182,000 Transocean Poseidon Ltd. 144A(c) USD 6.875% 01/02/2027 153,790 0.0863,700 Transocean Proteus Ltd. 144A(c) USD 6.250% 01/12/2024 59,559 0.03
1,272,875 Transocean Sentry Ltd. 144A(c) USD 5.375% 15/05/2023 997,616 0.54
3,642,251 1.98
France200,000 Altice France S.A. 144A(c) USD 5.125% 15/01/2029 207,500 0.11250,000 Constellium S.E. 144A(c) USD 5.625% 15/06/2028 268,750 0.15
476,250 0.26
Jersey442,000 Adient Global Holdings Ltd. 144A(c) USD 4.875% 15/08/2026 448,630 0.24
Luxembourg2,380,000 Camelot Finance S.A. 144A(c) USD 4.500% 01/11/2026 2,501,975 1.36517,000 Nielsen Co. Luxembourg SARL 144A(c) USD 5.000% 01/02/2025 536,387 0.29
3,038,362 1.65
Netherlands330,000 Alcoa Nederland Holding BV 144A(c) USD 5.500% 15/12/2027 357,225 0.19
Panama380,000 Carnival Corp. 144A(c) USD 7.625% 01/03/2026 403,275 0.22295,000 Carnival Corp. 144A(c) USD 9.875% 01/08/2027 348,100 0.19
751,375 0.41
Goldman Sachs Funds—Short Duration Opportunistic Corporate Bond PortfolioSchedule of InvestmentsAs at 30 November 2020
The accompanying notes are an integral part of these financial statements.
353

Holdings Security Description Currency Interest Rate(a) Maturity Date(b)Market Value
USD
% ofShareholders’
Equity
Bonds – (Continued)Supranationals
1,213,000 Ardagh Packaging Finance Plc. Via Ardagh Holdings USA, Inc. 144A(c) USD 5.250% 15/08/2027 1,275,166 0.69342,000 Axalta Coating Systems LLC Via Axalta Coating Systems Dutch Holding B
BV 144A(c) USD 4.750% 15/06/2027 362,520 0.20
1,637,686 0.89
United Kingdom588,000 Mclaren Finance Plc. 144A(c) USD 5.750% 01/08/2022 565,215 0.31
1,703,000 TransDigm UK Holdings Plc. USD 6.875% 15/05/2026 1,813,695 0.98
2,378,910 1.29
United States1,300,000 Acrisure LLC Via Acrisure Finance, Inc. 144A(c) USD 7.000% 15/11/2025 1,345,500 0.73280,000 AdaptHealth LLC 144A(c) USD 6.125% 01/08/2028 302,400 0.16
1,647,000 Adient US LLC 144A(c) USD 7.000% 15/05/2026 1,791,112 0.971,029,000 Albertsons Cos., Inc. Via Safeway, Inc. Via New Albertsons LP Via
Albertsons LLC 144A(c) USD 4.625% 15/01/2027 1,083,022 0.59653,000 Albertsons Cos., Inc. Via Safeway, Inc. Via New Albertsons LP Via
Albertsons LLC 144A(c) USD 4.875% 15/02/2030 714,219 0.391,338,000 Alliant Holdings Intermediate LLC Via Alliant Holdings Co-Issuer 144A(c) USD 6.750% 15/10/2027 1,445,040 0.781,654,000 Allied Universal Holdco LLC Via Allied Universal Finance Corp. 144A(c) USD 6.625% 15/07/2026 1,782,185 0.97346,000 Allison Transmission, Inc. 144A(c) USD 3.750% 30/01/2031 348,163 0.19439,000 AMC Entertainment Holdings, Inc. 144A(c) USD 10.500% 15/04/2025 351,200 0.19455,000 APX Group, Inc. 144A(c) USD 6.750% 15/02/2027 491,969 0.27571,000 Arches Buyer, Inc. 144A(c) USD 4.250% 01/06/2028 576,710 0.3170,000 Arches Buyer, Inc. 144A(c) USD 6.125% 01/12/2028 72,188 0.04682,000 Archrock Partners LP Via Archrock Partners Finance Corp. 144A(c) USD 6.250% 01/04/2028 704,165 0.3880,000 Asbury Automotive Group, Inc. USD 4.500% 01/03/2028 83,400 0.0550,000 Asbury Automotive Group, Inc. USD 4.750% 01/03/2030 53,250 0.03569,000 Ashtead Capital, Inc. 144A(c) USD 4.000% 01/05/2028 598,338 0.32475,000 Axalta Coating Systems LLC 144A(c) USD 3.375% 15/02/2029 483,312 0.26324,000 Boeing Co. USD 2.750% 01/02/2026 332,489 0.18324,000 Boeing Co. USD 3.625% 01/02/2031 343,654 0.19
1,109,000 Booz Allen Hamilton, Inc. 144A(c) USD 3.875% 01/09/2028 1,156,188 0.63437,000 Boyd Gaming Corp. 144A(c) USD 8.625% 01/06/2025 487,255 0.26828,000 Buckeye Partners LP 144A(c) USD 4.500% 01/03/2028 828,000 0.45394,000 Builders FirstSource, Inc. 144A(c) USD 5.000% 01/03/2030 428,475 0.23369,000 BWX Technologies, Inc. 144A(c) USD 4.125% 30/06/2028 385,144 0.21756,000 Cable One, Inc. 144A(c) USD 4.000% 15/11/2030 790,020 0.43417,000 Cablevision Lightpath LLC 144A(c) USD 3.875% 15/09/2027 422,213 0.23297,000 Caesars Resort Collection LLC Via CRC Finco, Inc. 144A(c) USD 5.750% 01/07/2025 316,305 0.17
1,699,000 Caesars Resort Collection LLC Via CRC Finco, Inc. 144A(c) USD 5.250% 15/10/2025 1,711,742 0.93691,000 Cargo Aircraft Management, Inc. 144A(c) USD 4.750% 01/02/2028 720,367 0.39495,000 Carvana Co. 144A(c) USD 5.875% 01/10/2028 507,375 0.27112,000 Castle US Holding Corp. 144A(c) USD 9.500% 15/02/2028 106,960 0.06548,000 CCO Holdings LLC Via CCO Holdings Capital Corp. 144A(c) USD 4.000% 01/03/2023 553,480 0.30
2,666,000 CCO Holdings LLC Via CCO Holdings Capital Corp. 144A(c) USD 4.750% 01/03/2030 2,839,290 1.54800,000 CCO Holdings LLC Via CCO Holdings Capital Corp. 144A(c) USD 4.500% 15/08/2030 846,000 0.46730,000 CCO Holdings LLC Via CCO Holdings Capital Corp. 144A(c) USD 4.250% 01/02/2031 761,025 0.41354,000 CCO Holdings LLC Via CCO Holdings Capital Corp. 144A(c) USD 4.500% 01/05/2032 374,798 0.20
1,252,000 Centene Corp. USD 4.250% 15/12/2027 1,326,194 0.72375,000 Centene Corp. 144A(c) USD 5.375% 15/08/2026 397,841 0.22390,000 CenturyLink, Inc. 144A(c) USD 5.125% 15/12/2026 408,038 0.22
1,461,000 Charles River Laboratories International, Inc. 144A(c) USD 5.500% 01/04/2026 1,532,224 0.83855,000 Charles River Laboratories International, Inc. 144A(c) USD 4.250% 01/05/2028 903,094 0.49485,000 Chemours Co. 144A(c) USD 5.750% 15/11/2028 497,125 0.27
1,260,000 Cheniere Energy Partners LP USD 4.500% 01/10/2029 1,319,850 0.72650,000 Cheniere Energy, Inc. 144A(c) USD 4.625% 15/10/2028 677,625 0.37220,000 Clearwater Paper Corp. 144A(c) USD 4.750% 15/08/2028 230,725 0.12411,000 Clearway Energy Operating LLC 144A(c) USD 4.750% 15/03/2028 439,256 0.24357,000 Cleveland-Cliffs, Inc. 144A(c) USD 4.875% 15/01/2024 363,248 0.206,000 Cleveland-Cliffs, Inc. 144A(c) USD 9.875% 17/10/2025 7,035 0.00
450,000 Cleveland-Cliffs, Inc. 144A(c) USD 6.750% 15/03/2026 487,125 0.26687,000 CNX Resources Corp. 144A(c) USD 7.250% 14/03/2027 728,220 0.39260,000 CNX Resources Corp. 144A(c) USD 6.000% 15/01/2029 263,575 0.14
1,265,000 CommScope, Inc. 144A(c) USD 5.500% 01/03/2024 1,309,275 0.71470,000 Continental Resources, Inc. 144A(c) USD 5.750% 15/01/2031 504,075 0.27315,000 Core & Main LP 144A(c) USD 6.125% 15/08/2025 325,238 0.18380,000 Cornerstone Building Brands, Inc. 144A(c) USD 6.125% 15/01/2029 403,750 0.22210,000 CP Atlas Buyer, Inc. 144A(c) USD 7.000% 01/12/2028 218,925 0.12
Goldman Sachs Funds—Short Duration Opportunistic Corporate Bond PortfolioSchedule of InvestmentsAs at 30 November 2020
The accompanying notes are an integral part of these financial statements.
354

Holdings Security Description Currency Interest Rate(a) Maturity Date(b)Market Value
USD
% ofShareholders’
Equity
Bonds – (Continued)United States – (Continued)
306,000 Crestwood Midstream Partners LP Via Crestwood Midstream Finance Corp.144A(c) USD 5.625% 01/05/2027 296,820 0.16
1,583,000 CrownRock LP Via CrownRock Finance, Inc. �F� 144A(c) USD 5.625% 15/10/2025 1,618,617 0.882,097,000 CSC Holdings LLC 144A(c) USD 5.750% 15/01/2030 2,285,730 1.24818,000 CSC Holdings LLC 144A(c) USD 4.625% 01/12/2030 840,495 0.46539,000 Cumulus Media New Holdings, Inc. 144A(c) USD 6.750% 01/07/2026 529,567 0.29670,000 DaVita, Inc. 144A(c) USD 3.750% 15/02/2031 666,650 0.36442,000 Dealer Tire LLC Via DT Issuer LLC 144A(c) USD 8.000% 01/02/2028 456,917 0.25925,000 Diamond Sports Group LLC Via Diamond Sports Finance Co. 144A(c) USD 5.375% 15/08/2026 716,875 0.39800,000 DISH DBS Corp. USD 7.375% 01/07/2028 876,000 0.47197,000 Element Solutions, Inc. 144A(c) USD 3.875% 01/09/2028 199,463 0.11738,000 Energizer Holdings, Inc. 144A(c) USD 7.750% 15/01/2027 806,265 0.44515,000 Energizer Holdings, Inc. 144A(c) USD 4.375% 31/03/2029 530,450 0.29320,000 EQM Midstream Partners LP 144A(c) USD 6.500% 01/07/2027 354,400 0.19295,000 Fair Isaac Corp. 144A(c) USD 4.000% 15/06/2028 309,013 0.17
1,250,000 Flex Acquisition Co., Inc. 144A(c) USD 7.875% 15/07/2026 1,325,000 0.72400,000 Freedom Mortgage Corp. 144A(c) USD 7.625% 01/05/2026 409,000 0.22354,000 Frontier Communications Corp. 144A(c) USD 5.000% 01/05/2028 361,080 0.20440,000 Gartner, Inc. 144A(c) USD 4.500% 01/07/2028 466,400 0.25315,000 Gartner, Inc. 144A(c) USD 3.750% 01/10/2030 328,388 0.18649,000 GCI LLC 144A(c) USD 4.750% 15/10/2028 683,072 0.37420,000 Global Partners LP Via GLP Finance Corp. 144A(c) USD 6.875% 15/01/2029 450,975 0.24528,000 Gray Television, Inc. 144A(c) USD 4.750% 15/10/2030 537,240 0.29611,000 Griffon Corp. USD 5.750% 01/03/2028 650,715 0.35210,000 Group 1 Automotive, Inc. 144A(c) USD 4.000% 15/08/2028 215,775 0.12
1,210,000 GrubHub Holdings, Inc. 144A(c) USD 5.500% 01/07/2027 1,275,037 0.69248,000 Hilton Domestic Operating Co., Inc. 144A(c) USD 4.000% 01/05/2031 261,950 0.14260,000 Howard Hughes Corp. 144A(c) USD 5.375% 01/08/2028 275,925 0.15
1,525,000 HUB International Ltd. 144A(c) USD 7.000% 01/05/2026 1,601,250 0.871,000,000 iHeartCommunications, Inc. USD 6.375% 01/05/2026 1,063,750 0.58360,000 Indigo Natural Resources LLC 144A(c) USD 6.875% 15/02/2026 367,200 0.20295,000 Ingevity Corp. 144A(c) USD 3.875% 01/11/2028 300,900 0.16471,000 IRB Holding Corp. 144A(c) USD 7.000% 15/06/2025 514,567 0.28597,000 KBR, Inc. 144A(c) USD 4.750% 30/09/2028 620,880 0.34220,000 Ken Garff Automotive LLC 144A(c) USD 4.875% 15/09/2028 226,600 0.12846,000 LABL Escrow Issuer LLC 144A(c) USD 6.750% 15/07/2026 907,335 0.49500,000 Lamar Media Corp. USD 4.000% 15/02/2030 522,500 0.28335,000 LD Holdings Group LLC 144A(c) USD 6.500% 01/11/2025 354,263 0.19
1,898,000 Lions Gate Capital Holdings LLC 144A(c) USD 5.875% 01/11/2024 1,902,745 1.03120,000 Lithia Motors, Inc. 144A(c) USD 4.375% 15/01/2031 127,474 0.07630,000 Logan Merger Sub, Inc. 144A(c) USD 5.500% 01/09/2027 656,775 0.36269,000 Marriott International, Inc. USD 4.625% 15/06/2030 310,641 0.17195,000 MasTec, Inc. 144A(c) USD 4.500% 15/08/2028 204,750 0.11571,000 Match Group Holdings II LLC 144A(c) USD 5.000% 15/12/2027 606,687 0.33423,000 Match Group Holdings II LLC 144A(c) USD 4.625% 01/06/2028 448,380 0.24497,000 Match Group Holdings II LLC 144A(c) USD 5.625% 15/02/2029 547,321 0.30
1,110,000 Match Group Holdings II LLC 144A(c) USD 4.125% 01/08/2030 1,166,887 0.633,155,000 Mauser Packaging Solutions Holding Co. 144A(c) USD 5.500% 15/04/2024 3,210,212 1.74341,000 Meritor, Inc. 144A(c) USD 6.250% 01/06/2025 366,575 0.20335,000 MGM Growth Properties Operating Partnership LP Via MGP Finance
Co-Issuer, Inc. 144A(c) USD 4.625% 15/06/2025 354,263 0.19359,000 Mileage Plus Holdings LLC Via Mileage Plus Intellectual Property Assets Ltd.
144A(c) USD 6.500% 20/06/2027 389,353 0.21370,000 MPH Acquisition Holdings LLC 144A(c) USD 5.750% 01/11/2028 362,600 0.20394,000 Nationstar Mortgage Holdings, Inc. 144A(c) USD 5.500% 15/08/2028 407,790 0.22
3,329,000 Navistar International Corp. 144A(c) USD 6.625% 01/11/2025 3,495,450 1.90350,000 Netflix, Inc. USD 4.875% 15/04/2028 399,875 0.22408,000 Netflix, Inc. 144A(c) USD 3.625% 15/06/2025 433,500 0.23
1,097,000 Nexstar Broadcasting, Inc. 144A(c) USD 5.625% 15/07/2027 1,176,532 0.64685,000 Nexstar Broadcasting, Inc. 144A(c) USD 4.750% 01/11/2028 708,975 0.38293,000 NFP Corp. 144A(c) USD 6.875% 15/08/2028 305,819 0.17132,000 Nielsen Finance LLC Via Nielsen Finance Co. 144A(c) USD 5.000% 15/04/2022 132,825 0.07442,000 Nielsen Finance LLC Via Nielsen Finance Co. 144A(c) USD 5.625% 01/10/2028 474,045 0.26157,000 NRG Energy, Inc. 144A(c) USD 3.375% 15/02/2029 160,533 0.09419,000 NRG Energy, Inc. 144A(c) USD 3.625% 15/02/2031 432,617 0.23150,000 Outfront Media Capital LLC Via Outfront Media Capital Corp. 144A(c) USD 6.250% 15/06/2025 159,000 0.09957,000 Outfront Media Capital LLC Via Outfront Media Capital Corp. 144A(c) USD 4.625% 15/03/2030 957,000 0.52840,000 Pike Corp. 144A(c) USD 5.500% 01/09/2028 877,800 0.48702,000 Post Holdings, Inc. 144A(c) USD 4.625% 15/04/2030 735,345 0.40476,000 Prestige Brands, Inc. 144A(c) USD 5.125% 15/01/2028 505,750 0.27259,000 PTC, Inc. 144A(c) USD 4.000% 15/02/2028 270,008 0.15
Goldman Sachs Funds—Short Duration Opportunistic Corporate Bond PortfolioSchedule of InvestmentsAs at 30 November 2020
The accompanying notes are an integral part of these financial statements.
355

Holdings Security Description Currency Interest Rate(a) Maturity Date(b)Market Value
USD
% ofShareholders’
Equity
Bonds – (Continued)United States – (Continued)
360,000 Qorvo, Inc. 144A(c) USD 3.375% 01/04/2031 369,000 0.20220,000 QualityTech LP Via QTS Finance Corp. 144A(c) USD 3.875% 01/10/2028 225,500 0.12235,000 Quicken Loans LLC Via Quicken Loans Co-Issuer, Inc. 144A(c) USD 3.625% 01/03/2029 235,824 0.13185,000 Quicken Loans LLC Via Quicken Loans Co-Issuer, Inc. 144A(c) USD 3.875% 01/03/2031 189,446 0.10570,000 Rattler Midstream LP 144A(c) USD 5.625% 15/07/2025 604,513 0.33169,000 Realogy Group LLC Via Realogy Co-Issuer Corp. 144A(c) USD 7.625% 15/06/2025 183,365 0.1082,000 Reynolds Group Issuer, Inc. Via Reynolds Group Issuer LLC Via Reynolds
Group Issuer Lu 144A(c) USD 5.125% 15/07/2023 82,820 0.04316,000 Reynolds Group Issuer, Inc. Via Reynolds Group Issuer LLC Via Reynolds
Group Issuer Lu 144A(c) USD 4.000% 15/10/2027 324,295 0.182,000,000 SBA Communications Corp. USD 4.000% 01/10/2022 2,030,000 1.10290,000 Science Applications International Corp. 144A(c) USD 4.875% 01/04/2028 308,850 0.17128,000 Service Properties Trust USD 7.500% 15/09/2025 142,566 0.08105,000 Shift4 Payments LLC Via Shift4 Payments Finance Sub, Inc. 144A(c) USD 4.625% 01/11/2026 108,806 0.06838,000 Silgan Holdings, Inc. USD 4.125% 01/02/2028 870,472 0.47725,000 Sinclair Television Group, Inc. 144A(c) USD 4.125% 01/12/2030 728,625 0.39765,000 Sirius XM Radio, Inc. 144A(c) USD 5.500% 01/07/2029 842,456 0.46739,000 Sirius XM Radio, Inc. 144A(c) USD 4.125% 01/07/2030 779,645 0.42310,000 Specialty Building Products Holdings LLC Via SBP Finance Corp. 144A(c) USD 6.375% 30/09/2026 324,725 0.18648,000 Sprint Corp. USD 7.625% 01/03/2026 807,570 0.44
1,500,000 SS&C Technologies, Inc. 144A(c) USD 5.500% 30/09/2027 1,605,000 0.87330,000 Standard Industries, Inc. 144A(c) USD 5.000% 15/02/2027 346,919 0.19
1,123,000 Stericycle, Inc. 144A(c) USD 5.375% 15/07/2024 1,176,814 0.64435,000 Stericycle, Inc. 144A(c) USD 3.875% 15/01/2029 454,575 0.25892,000 Summit Materials LLC Via Summit Materials Finance Corp. 144A(c) USD 5.250% 15/01/2029 936,600 0.51215,000 Sunoco LP Via Sunoco Finance Corp. 144A(c) USD 4.500% 15/05/2029 222,256 0.12162,000 Surgery Center Holdings, Inc. 144A(c) USD 6.750% 01/07/2025 165,848 0.09296,000 Syneos Health, Inc. 144A(c) USD 3.625% 15/01/2029 300,810 0.16480,000 Targa Resources Partners LP Via Targa Resources Partners Finance Corp.
144A(c) USD 4.875% 01/02/2031 509,400 0.28229,000 Taylor Morrison Communities, Inc. 144A(c) USD 5.125% 01/08/2030 255,335 0.14
1,726,000 TEGNA, Inc. USD 5.000% 15/09/2029 1,816,615 0.98133,000 TEGNA, Inc. 144A(c) USD 4.750% 15/03/2026 141,479 0.08850,000 TEGNA, Inc. 144A(c) USD 4.625% 15/03/2028 872,312 0.47292,000 Tenet Healthcare Corp. 144A(c) USD 4.625% 01/09/2024 300,395 0.16353,000 Terrier Media Buyer, Inc. 144A(c) USD 8.875% 15/12/2027 384,329 0.21507,000 Tesla, Inc. 144A(c) USD 5.300% 15/08/2025 529,815 0.29959,000 Trident TPI Holdings, Inc. 144A(c) USD 9.250% 01/08/2024 1,029,726 0.56695,000 Twitter, Inc. 144A(c) USD 3.875% 15/12/2027 730,619 0.40580,000 Uber Technologies, Inc. 144A(c) USD 7.500% 15/05/2025 623,500 0.34450,000 Uber Technologies, Inc. 144A(c) USD 6.250% 15/01/2028 479,250 0.26222,000 United Natural Foods, Inc. 144A(c) USD 6.750% 15/10/2028 230,603 0.12375,000 United Shore Financial Services LLC 144A(c) USD 5.500% 15/11/2025 394,688 0.21
7,000,000 United States Treasury Bill USD 0.081% 04/03/2021 6,998,644 3.80223,000 US Foods, Inc. 144A(c) USD 6.250% 15/04/2025 238,331 0.13
1,514,000 ViaSat, Inc. 144A(c) USD 5.625% 15/09/2025 1,549,957 0.84189,000 VICI Properties LP Via VICI Note Co., Inc. 144A(c) USD 3.500% 15/02/2025 193,961 0.10160,000 VICI Properties LP Via VICI Note Co., Inc. 144A(c) USD 3.750% 15/02/2027 164,000 0.09500,000 VICI Properties LP Via VICI Note Co., Inc. 144A(c) USD 4.125% 15/08/2030 520,000 0.28437,000 Vine Oil & Gas LP Via Vine Oil & Gas Finance Corp. 144A(c) USD 8.750% 15/04/2023 353,970 0.19358,000 WESCO Distribution, Inc. 144A(c) USD 7.125% 15/06/2025 392,905 0.21325,000 WMG Acquisition Corp.—Series NOV 144A(c) USD 3.000% 15/02/2031 316,875 0.17719,000 WR Grace & Co-Conn 144A(c) USD 4.875% 15/06/2027 762,140 0.41375,000 XPO Logistics, Inc. 144A(c) USD 6.500% 15/06/2022 377,344 0.20
119,507,475 64.81
TOTAL BONDS(cost USD 138,418,533) 142,917,417 77.51
TOTAL TRANSFERABLE SECURITIES DEALT IN ANOTHER REGULATED MARKET(cost USD 138,418,533) 142,917,417 77.51
Other Transferable Securities
Bonds – 0.77%United States
1,386,000 Parsley Energy LLC Via Parsley Finance Corp. 144A(c) USD 5.375% 15/01/2025 1,425,847 0.77
TOTAL BONDS(cost USD 1,392,461) 1,425,847 0.77
Goldman Sachs Funds—Short Duration Opportunistic Corporate Bond PortfolioSchedule of InvestmentsAs at 30 November 2020
The accompanying notes are an integral part of these financial statements.
356

Holdings Security DescriptionMarket Value
USD
% ofShareholders’
Equity
Common Stocks – 0.01%United States
10,523 Liberty Harbor LLC 14,402 0.01
TOTAL COMMON STOCKS(cost USD 1,052,321) 14,402 0.01
TOTAL OTHER TRANSFERABLE SECURITIES(cost USD 2,444,782) 1,440,249 0.78
Holdings Security Description Currency Interest Rate Maturity DateMarket Value
USD
% ofShareholders’
Equity
Time Deposits – 4.26%
Netherlands7,854,869 ING Bank NV USD 0.050% 01/12/2020 7,854,869 4.26
TOTAL TIME DEPOSITS(cost USD 7,854,869) 7,854,869 4.26
MARKET VALUE OF INVESTMENTS EXCLUDING DERIVATIVES(cost USD 177,270,361) 181,797,245 98.60
Forward Currency Contracts – 0.00%
CurrencyAmountBought Currency
AmountSold
MaturityDate
UnrealisedLossUSD
% ofShareholders’
Equity
USD 588,907 EUR 498,080 21/01/2021 (9,475) (0.00)
UNREALISED LOSS ON FORWARD CURRENCY CONTRACTS (9,475) (0.00)
Share Class Specific Forward Currency Contracts – 0.27%
CurrencyAmountBought Currency
AmountSold
MaturityDate
UnrealisedGainUSD
% ofShareholders’
Equity
GBP 4,462,783 USD 5,750,246 13/01/2021 221,683 0.12EUR 15,192,108 USD 17,968,418 21/01/2021 283,059 0.15
UNREALISED GAIN ON FORWARD CURRENCY CONTRACTS HELD FOR HEDGING PURPOSES 504,742 0.27
CurrencyAmountBought Currency
AmountSold
MaturityDate
UnrealisedLossUSD
% ofShareholders’
Equity
USD 11,016 EUR 9,173 21/01/2021 (5) (0.00)
UNREALISED LOSS ON FORWARD CURRENCY CONTRACTS HELD FOR HEDGING PURPOSES (5) (0.00)
Swap Contracts – 0.05%Net LocalNotionalAmount Pay Receive Currency Maturity Date
UnrealisedGainUSD
% ofShareholders’
Equity
Interest Rate Swaps11,761,000 Fixed 1.000% Floating (USD 3 month LIBOR) USD 16/12/2027 100,393 0.05
UNREALISED GAIN ON INTEREST RATE SWAPS 100,393 0.05
TOTAL UNREALISED GAIN ON SWAP CONTRACTS 100,393 0.05
MARKET VALUE OF INVESTMENTS(cost USD 177,270,361)
182,392,900 98.92
OTHER ASSETS AND LIABILITIES 1,995,393 1.08
SHAREHOLDERS’ EQUITY 184,388,293 100.00
Goldman Sachs Funds—Short Duration Opportunistic Corporate Bond PortfolioSchedule of InvestmentsAs at 30 November 2020
The accompanying notes are an integral part of these financial statements.
357

TOTAL INVESTMENTSMarket Value
USD
% ofShareholders’
Equity
Total Investments excluding derivatives (cost USD 177,270,361) 181,797,245 98.60Unrealised loss on forward currency contracts (9,475) (0.00)Unrealised gain on forward currency contracts held for hedging purposes 504,742 0.27Unrealised loss on forward currency contracts held for hedging purposes (5) (0.00)Unrealised gain on swap contracts 100,393 0.05Other Assets and Liabilities 1,995,393 1.08
Shareholders’ Equity 184,388,293 100.00
The counterparties for forward currency contracts were Barclays Bank Plc., BNP Paribas S.A., Citibank N.A., Deutsche Bank AG, HSBC Bank Plc. and State Street Bank & Trust.
The counterparty for swap contracts was Credit Suisse.
The maximum individual counterparty exposure as at 30 November 2020 is 0.08% of the NAV.
(a) Interest rates represent either the stated coupon rate, annualised discounted yield on date of purchase for discounted securities, or, for floating rate securities, the current reset ratewhich is based upon interest rates indices.
(b) Maturity dates represent either the stated date on the security, or the next interest reset date for floating rate securities or the prerefunded date for those type of securities.(c) 144A: This security is issued to qualified institutional investors, pursuant to private placements, and is transferable as stated in rule 144A of the US Securities Act of 1933.(d) A related party to Goldman Sachs Funds.(e) The yield for this fund as at 30 November 2020 was 0.171%.
Goldman Sachs Funds—Short Duration Opportunistic Corporate Bond PortfolioSchedule of InvestmentsAs at 30 November 2020
The accompanying notes are an integral part of these financial statements.
358

Holdings Security Description Currency Interest Rate(a) Maturity Date(b)Market Value
GBP
% ofShareholders’
Equity
Transferable securities admitted to an official exchange listing
Bonds – 82.73%Australia
150,000 APT Pipelines Ltd. GBP 3.500% 22/03/2030 174,632 0.57100,000 APT Pipelines Ltd. GBP 3.125% 18/07/2031 114,209 0.38150,000 Scentre Group Trust 1 GBP 3.875% 16/07/2026 167,919 0.55
456,760 1.50
Bermuda250,000 Hiscox Ltd. GBP 2.000% 14/12/2022 254,860 0.84100,000 Hiscox Ltd.(c) GBP 6.125% 24/11/2045 114,729 0.38
369,589 1.22
Denmark150,000 Danske Bank AS(c) GBP 2.250% 14/01/2028 156,074 0.51
France100,000 AXA S.A.(c) GBP 5.625% 16/01/2054 129,483 0.43350,000 BNP Paribas S.A. GBP 3.375% 23/01/2026 392,528 1.29100,000 BNP Paribas S.A. GBP 1.875% 14/12/2027 105,347 0.35200,000 BPCE S.A. GBP 5.250% 16/04/2029 255,940 0.84100,000 Compagnie de Saint-Gobain GBP 4.625% 09/10/2029 127,727 0.42100,000 Electricite de France S.A. GBP 5.500% 17/10/2041 154,658 0.51300,000 Electricite de France S.A.(c) GBP 5.875% Perp. 346,500 1.1450,000 Electricite de France S.A. GBP 5.125% 22/09/2050 79,256 0.26100,000 Electricite de France S.A.(c) EUR 4.000% Perp. 97,212 0.32100,000 Loxam SAS EUR 3.250% 14/01/2025 89,917 0.29171,000 Orange S.A. GBP 8.125% 20/11/2028 263,304 0.8761,000 Orange S.A. GBP 5.625% 23/01/2034 91,476 0.30250,000 RCI Banque S.A. GBP 1.875% 08/11/2022 252,530 0.83
2,385,878 7.85
Germany200,000 Allianz S.E.(c) EUR 2.625% Perp. 180,346 0.59100,000 Commerzbank AG GBP 1.750% 22/01/2025 101,409 0.33200,000 Commerzbank AG(c) EUR 6.125% Perp. 189,714 0.63200,000 Deutsche Bank AG GBP 2.625% 16/12/2024 209,572 0.69100,000 Deutsche Telekom AG GBP 3.125% 06/02/2034 119,844 0.40
800,885 2.64
Ireland84,000 GE Capital UK Funding Unlimited Co. GBP 6.250% 05/05/2038 120,526 0.4050,000 GE Capital UK Funding Unlimited Co. GBP 8.000% 14/01/2039 82,550 0.27
203,076 0.67
Italy100,000 Intesa Sanpaolo SpA GBP 2.500% 15/01/2030 105,018 0.34100,000 Intesa Sanpaolo SpA GBP 5.148% 10/06/2030 114,702 0.3878,000 Italy Government International Bond GBP 6.000% 04/08/2028 102,575 0.34200,000 UniCredit SpA(c) EUR 7.500% Perp. 207,206 0.68
529,501 1.74
Jersey100,000 Gatwick Funding Ltd. GBP 6.500% 02/03/2041 156,481 0.51200,000 Glencore Finance Europe Ltd. GBP 3.125% 26/03/2026 214,218 0.71100,000 Heathrow Funding Ltd. EUR 1.500% 12/10/2025 93,998 0.3150,000 Heathrow Funding Ltd. GBP 6.450% 10/12/2031 72,240 0.24117,000 Heathrow Funding Ltd. GBP 5.875% 13/05/2041 179,614 0.5950,000 Porterbrook Rail Finance Ltd. GBP 7.125% 20/10/2026 65,933 0.22
782,484 2.58
Luxembourg100,000 Aroundtown S.A. GBP 3.000% 16/10/2029 108,928 0.36100,000 Aroundtown S.A. GBP 3.625% 10/04/2031 114,912 0.38200,000 Gazprom PJSC Via Gaz Capital S.A. USD 5.150% 11/02/2026 170,072 0.56100,000 Lincoln Financing SARL EUR 3.625% 01/04/2024 91,269 0.30100,000 Logicor Financing SARL GBP 2.750% 15/01/2030 106,678 0.35
591,859 1.95
Goldman Sachs Funds—Sterling Credit PortfolioSchedule of InvestmentsAs at 30 November 2020
The accompanying notes are an integral part of these financial statements.
359

Holdings Security Description Currency Interest Rate(a) Maturity Date(b)Market Value
GBP
% ofShareholders’
Equity
Bonds – (Continued)Mexico
200,000 Mexico City Airport Trust USD 3.875% 30/04/2028 144,227 0.48100,000 Mexico Government International Bond EUR 1.350% 18/09/2027 91,606 0.30200,000 Mexico Government International Bond USD 2.659% 24/05/2031 150,078 0.49
385,911 1.27
Netherlands105,000 Cooperatieve Rabobank UA GBP 5.250% 14/09/2027 131,050 0.43150,000 E.ON International Finance BV GBP 6.375% 07/06/2032 227,247 0.75100,000 Enel Finance International NV GBP 0.912% 20/10/2027 100,720 0.33100,000 Enel Finance International NV GBP 5.750% 14/09/2040 160,453 0.53100,000 ING Groep NV GBP 3.000% 18/02/2026 110,616 0.36155,000 Innogy Finance BV GBP 6.250% 03/06/2030 222,306 0.7350,000 Innogy Finance BV GBP 6.125% 06/07/2039 83,723 0.2810,000 Petrobras Global Finance BV USD 5.999% 27/01/2028 8,756 0.03200,000 Volkswagen Financial Services NV GBP 4.250% 09/10/2025 229,506 0.75
1,274,377 4.19
Peru20,000 Peruvian Government International Bond USD 2.780% 01/12/2060 14,769 0.0520,000 Peruvian Government International Bond USD 3.230% 28/07/2121 14,776 0.05
29,545 0.10
Romania10,000 Romanian Government International Bond EUR 3.624% 26/05/2030 10,618 0.0370,000 Romanian Government International Bond EUR 2.000% 28/01/2032 65,412 0.2220,000 Romanian Government International Bond EUR 3.375% 28/01/2050 19,938 0.07
95,968 0.32
Spain100,000 Abertis Infraestructuras S.A. GBP 3.375% 27/11/2026 109,256 0.36300,000 Banco Santander S.A. GBP 1.750% 17/02/2027 307,323 1.01200,000 Banco Santander S.A.(c) EUR 4.375% Perp. 176,483 0.58150,000 Telefonica Emisiones S.A. GBP 5.445% 08/10/2029 199,656 0.66
792,718 2.61
Supranationals710,000 European Investment Bank GBP 5.000% 15/04/2039 1,206,936 3.97
Switzerland250,000 Credit Suisse Group AG(c) GBP 2.250% 09/06/2028 263,033 0.87
Ukraine110,000 Ukraine Government International Bond EUR 4.375% 27/01/2030 92,749 0.30
United Kingdom250,000 Annington Funding Plc. GBP 2.646% 12/07/2025 268,310 0.88200,000 Annington Funding Plc. GBP 3.184% 12/07/2029 224,644 0.74324,000 Barclays Bank Plc. GBP 10.000% 21/05/2021 337,368 1.11200,000 Barclays Plc.(c) GBP 2.375% 06/10/2023 205,326 0.68200,000 Barclays Plc.(c) GBP 3.750% 22/11/2030 215,864 0.71100,000 Barclays Plc. GBP 3.250% 17/01/2033 115,812 0.38100,000 BAT International Finance Plc. GBP 4.000% 04/09/2026 114,351 0.38100,000 BAT International Finance Plc. GBP 2.250% 26/06/2028 102,521 0.3497,000 BAT International Finance Plc. GBP 6.000% 24/11/2034 132,903 0.44166,000 BP Capital Markets Plc. GBP 2.030% 14/02/2025 176,167 0.58125,000 BP Capital Markets Plc.(c) EUR 3.625% Perp. 122,825 0.40150,000 BP Capital Markets Plc.(c) GBP 4.250% Perp. 161,805 0.5314,230 Broadgate Financing Plc.—Series A2 GBP 4.949% 05/04/2029 16,554 0.05125,000 Bunzl Finance Plc. GBP 1.500% 30/10/2030 127,000 0.42200,000 Cadent Finance Plc. GBP 2.250% 10/10/2035 212,734 0.70199,000 Centrica Plc. GBP 4.375% 13/03/2029 245,536 0.81100,000 Diageo Finance Plc. GBP 2.875% 27/03/2029 115,775 0.38150,000 DWR Cymru Financing UK Plc. GBP 1.625% 31/03/2026 152,523 0.50200,000 Eversholt Funding Plc. GBP 2.742% 30/06/2040 214,228 0.70200,000 GlaxoSmithKline Capital Plc. GBP 1.625% 12/05/2035 206,738 0.68100,000 Heathrow Finance Plc. GBP 6.000% 03/03/2025 107,277 0.35208,000 HSBC Holdings Plc. GBP 5.750% 20/12/2027 260,684 0.86200,000 HSBC Holdings Plc.(c) GBP 3.000% 22/07/2028 221,320 0.7350,000 HSBC Holdings Plc. GBP 7.000% 07/04/2038 77,271 0.2561,000 HSBC Holdings Plc. GBP 6.000% 29/03/2040 87,237 0.29100,000 InterContinental Hotels Group Plc. GBP 2.125% 24/08/2026 100,774 0.33
Goldman Sachs Funds—Sterling Credit PortfolioSchedule of InvestmentsAs at 30 November 2020
The accompanying notes are an integral part of these financial statements.
360

Holdings Security Description Currency Interest Rate(a) Maturity Date(b)Market Value
GBP
% ofShareholders’
Equity
Bonds – (Continued)United Kingdom – (Continued)
100,000 Karbon Homes Ltd. GBP 3.375% 15/11/2047 137,517 0.45150,000 Legal & General Group Plc.(c) GBP 3.750% 26/11/2049 160,022 0.53200,000 Legal & General Group Plc.(c) GBP 5.625% Perp. 219,256 0.72100,000 Liberty Living Finance Plc. GBP 3.375% 28/11/2029 108,357 0.36169,000 Lloyds Bank Plc. GBP 7.625% 22/04/2025 215,051 0.71200,000 Lloyds Banking Group Plc.(c) GBP 1.875% 15/01/2026 206,226 0.68100,000 London & Quadrant Housing Trust GBP 3.125% 28/02/2053 127,973 0.42100,000 M&G Plc.(c) GBP 3.875% 20/07/2049 105,437 0.35190,000 M&G Plc.(c) GBP 6.340% 19/12/2063 246,453 0.81100,000 National Express Group Plc.(c) GBP 4.250% Perp. 102,750 0.34150,000 National Grid Electricity Transmission Plc. GBP 2.000% 17/04/2040 161,572 0.53250,000 Natwest Group Plc.(c) GBP 2.875% 19/09/2026 269,262 0.89200,000 Natwest Group Plc.(c) GBP 5.125% Perp. 206,534 0.6895,000 NatWest Markets Plc.(c) GBP 5.625% Perp. 103,615 0.34150,000 NIE Finance Plc. GBP 2.500% 27/10/2025 162,888 0.54100,000 Notting Hill Genesis GBP 3.250% 12/10/2048 121,976 0.40100,000 Pension Insurance Corp. Plc. GBP 8.000% 23/11/2026 131,783 0.43200,000 Pension Insurance Corp. Plc.(c) GBP 7.375% Perp. 236,850 0.78100,000 Phoenix Group Holdings Plc. GBP 5.625% 28/04/2031 120,012 0.39100,000 Places For People Treasury Plc. GBP 2.875% 17/08/2026 108,739 0.36100,000 Scottish Widows Ltd. GBP 5.500% 16/06/2023 110,571 0.36150,000 Segro Plc. GBP 2.875% 11/10/2037 180,672 0.5950,000 Sky Ltd. GBP 6.000% 21/05/2027 66,505 0.22150,000 SP Transmission Plc. GBP 2.000% 13/11/2031 162,625 0.54150,000 Stagecoach Group Plc. GBP 4.000% 29/09/2025 157,557 0.5295,472 TC Dudgeon Ofto Plc. GBP 3.158% 12/11/2038 112,999 0.37260,895 Telereal Secured Finance Plc. GBP 4.010% 10/12/2031 286,721 0.94111,500 Telereal Securitisation Plc.—Series A8 GBP 4.974% 10/09/2027 125,640 0.4187,710 Telereal Securitisation Plc.—Series B5 GBP 5.425% 10/12/2031 105,506 0.35166,000 Telereal Securitisation Plc.—Series B6(c) GBP 0.800% 10/12/2031 138,992 0.46150,000 Tesco Corporate Treasury Services Plc. GBP 2.750% 27/04/2030 164,188 0.54335,000 Thames Water Utilities Finance Plc. GBP 2.375% 03/05/2023 336,079 1.11184,000 Thames Water Utilities Finance Plc.(c) GBP 5.750% 13/09/2030 195,905 0.64150,000 Thames Water Utilities Finance Plc. GBP 2.375% 22/04/2040 161,258 0.53100,000 Transport for London GBP 3.875% 23/07/2042 141,893 0.47100,000 Virgin Money UK Plc.(c) GBP 4.000% 25/09/2026 108,333 0.36150,000 Vodafone Group Plc. GBP 3.375% 08/08/2049 183,430 0.60150,000 Western Power Distribution Plc. GBP 3.625% 06/11/2023 160,196 0.53100,000 Yorkshire Building Society GBP 3.500% 21/04/2026 112,991 0.37200,000 Yorkshire Water Finance Plc. GBP 1.750% 26/11/2026 208,394 0.69250,000 Zurich Finance UK Plc.(c) GBP 6.625% Perp. 275,087 0.91
11,071,362 36.44
United States350,000 AT&T, Inc. GBP 5.500% 15/03/2027 443,058 1.46152,000 AT&T, Inc. GBP 4.375% 14/09/2029 187,205 0.62100,000 AT&T, Inc. GBP 4.250% 01/06/2043 129,823 0.43150,000 Athene Global Funding GBP 1.750% 24/11/2027 152,018 0.50250,000 Bank of America Corp. GBP 2.300% 25/07/2025 269,137 0.89150,000 Becton Dickinson and Co. GBP 3.020% 24/05/2025 162,159 0.53100,000 Berkshire Hathaway Finance Corp. GBP 2.375% 19/06/2039 115,608 0.38125,000 Boeing Co. USD 5.150% 01/05/2030 110,311 0.36150,000 Citigroup, Inc. GBP 5.875% 01/07/2024 174,709 0.57219,000 Citigroup, Inc. GBP 5.150% 21/05/2026 267,434 0.88100,000 Digital Stout Holding LLC GBP 3.300% 19/07/2029 115,315 0.38100,000 Digital Stout Holding LLC GBP 3.750% 17/10/2030 120,737 0.40100,000 Fidelity National Information Services, Inc. GBP 3.360% 21/05/2031 118,016 0.39100,000 Fiserv, Inc. GBP 2.250% 01/07/2025 107,134 0.35100,000 General Electric Co. GBP 5.250% 07/12/2028 123,745 0.41100,000 Laredo Petroleum, Inc. USD 9.500% 15/01/2025 51,316 0.17100,000 McDonald’s Corp. GBP 5.875% 23/04/2032 147,239 0.48100,000 Metropolitan Life Global Funding I GBP 1.625% 21/09/2029 105,703 0.35100,000 MPT Operating Partnership LP Via MPT Finance Corp. GBP 2.550% 05/12/2023 101,217 0.33100,000 Realty Income Corp. GBP 1.625% 15/12/2030 103,032 0.34100,000 Time Warner Cable LLC GBP 5.250% 15/07/2042 139,189 0.46100,000 Verizon Communications, Inc. GBP 1.875% 19/09/2030 106,281 0.35
Goldman Sachs Funds—Sterling Credit PortfolioSchedule of InvestmentsAs at 30 November 2020
The accompanying notes are an integral part of these financial statements.
361
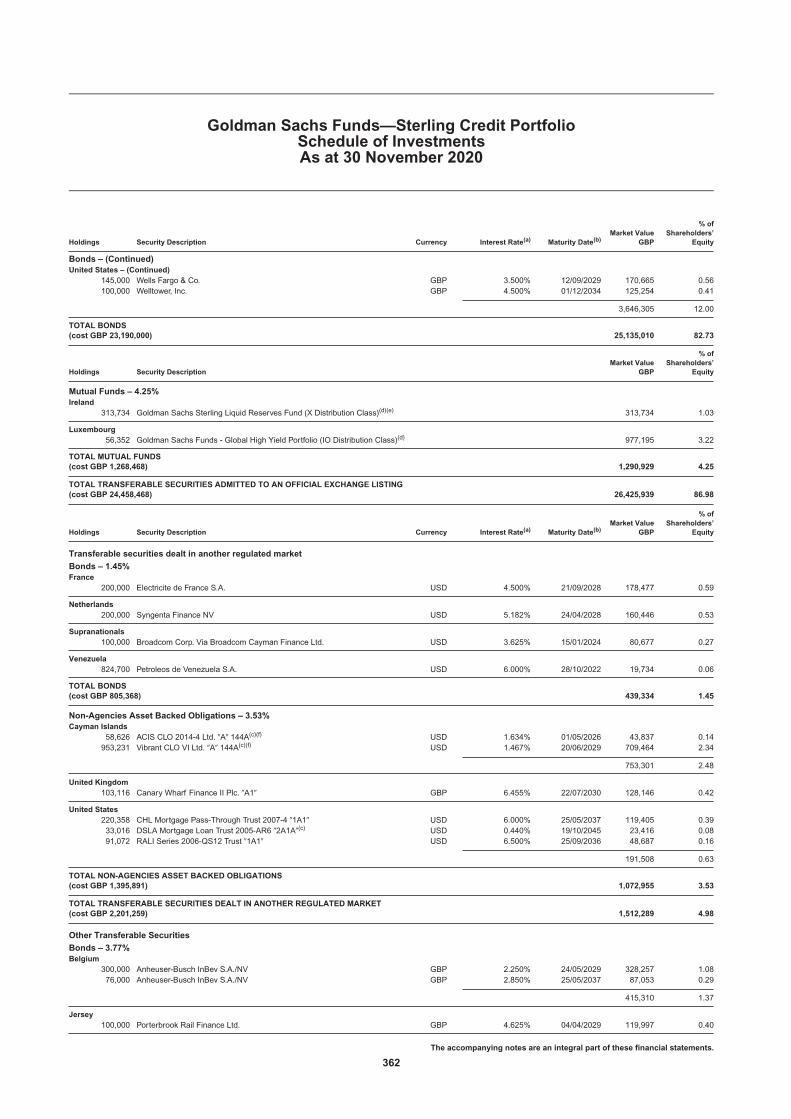
Holdings Security Description Currency Interest Rate(a) Maturity Date(b)Market Value
GBP
% ofShareholders’
Equity
Bonds – (Continued)United States – (Continued)
145,000 Wells Fargo & Co. GBP 3.500% 12/09/2029 170,665 0.56100,000 Welltower, Inc. GBP 4.500% 01/12/2034 125,254 0.41
3,646,305 12.00
TOTAL BONDS(cost GBP 23,190,000) 25,135,010 82.73
Holdings Security DescriptionMarket Value
GBP
% ofShareholders’
Equity
Mutual Funds – 4.25%Ireland
313,734 Goldman Sachs Sterling Liquid Reserves Fund (X Distribution Class)(d)(e) 313,734 1.03
Luxembourg56,352 Goldman Sachs Funds - Global High Yield Portfolio (IO Distribution Class)(d) 977,195 3.22
TOTAL MUTUAL FUNDS(cost GBP 1,268,468) 1,290,929 4.25
TOTAL TRANSFERABLE SECURITIES ADMITTED TO AN OFFICIAL EXCHANGE LISTING(cost GBP 24,458,468) 26,425,939 86.98
Holdings Security Description Currency Interest Rate(a) Maturity Date(b)Market Value
GBP
% ofShareholders’
Equity
Transferable securities dealt in another regulated market
Bonds – 1.45%France
200,000 Electricite de France S.A. USD 4.500% 21/09/2028 178,477 0.59
Netherlands200,000 Syngenta Finance NV USD 5.182% 24/04/2028 160,446 0.53
Supranationals100,000 Broadcom Corp. Via Broadcom Cayman Finance Ltd. USD 3.625% 15/01/2024 80,677 0.27
Venezuela824,700 Petroleos de Venezuela S.A. USD 6.000% 28/10/2022 19,734 0.06
TOTAL BONDS(cost GBP 805,368) 439,334 1.45
Non-Agencies Asset Backed Obligations – 3.53%Cayman Islands
58,626 ACIS CLO 2014-4 Ltd. �A� 144A(c)(f) USD 1.634% 01/05/2026 43,837 0.14953,231 Vibrant CLO VI Ltd. �A� 144A(c)(f) USD 1.467% 20/06/2029 709,464 2.34
753,301 2.48
United Kingdom103,116 Canary Wharf Finance II Plc. �A1� GBP 6.455% 22/07/2030 128,146 0.42
United States220,358 CHL Mortgage Pass-Through Trust 2007-4 �1A1� USD 6.000% 25/05/2037 119,405 0.3933,016 DSLA Mortgage Loan Trust 2005-AR6 �2A1A�(c) USD 0.440% 19/10/2045 23,416 0.0891,072 RALI Series 2006-QS12 Trust �1A1� USD 6.500% 25/09/2036 48,687 0.16
191,508 0.63
TOTAL NON-AGENCIES ASSET BACKED OBLIGATIONS(cost GBP 1,395,891) 1,072,955 3.53
TOTAL TRANSFERABLE SECURITIES DEALT IN ANOTHER REGULATED MARKET(cost GBP 2,201,259) 1,512,289 4.98
Other Transferable Securities
Bonds – 3.77%Belgium
300,000 Anheuser-Busch InBev S.A./NV GBP 2.250% 24/05/2029 328,257 1.0876,000 Anheuser-Busch InBev S.A./NV GBP 2.850% 25/05/2037 87,053 0.29
415,310 1.37
Jersey100,000 Porterbrook Rail Finance Ltd. GBP 4.625% 04/04/2029 119,997 0.40
Goldman Sachs Funds—Sterling Credit PortfolioSchedule of InvestmentsAs at 30 November 2020
The accompanying notes are an integral part of these financial statements.
362

Holdings Security Description Currency Interest Rate(a) Maturity Date(b)Market Value
GBP
% ofShareholders’
Equity
Bonds – (Continued)Switzerland
158,000 Credit Suisse Group Funding Guernsey Ltd. GBP 2.750% 08/08/2025 171,632 0.56
United Kingdom143,724 Tesco Property Finance 3 Plc. GBP 5.744% 13/04/2040 195,822 0.64
United States174,000 Verizon Communications, Inc. GBP 4.750% 17/02/2034 243,344 0.80
TOTAL BONDS(cost GBP 1,035,779) 1,146,105 3.77
TOTAL OTHER TRANSFERABLE SECURITIES(cost GBP 1,035,779) 1,146,105 3.77
MARKET VALUE OF INVESTMENTS EXCLUDING DERIVATIVES(cost GBP 27,695,506) 29,084,333 95.73
Futures Contracts – 0.04%
Number ofContracts Security Description
CommitmentMarket Value
GBP
UnrealisedGainGBP
% ofShareholders’
Equity
AUD3 Australian Treasury Bonds 10YR Futures 15/12/2020 Long 246,180 1,768 0.00
GBP29 UK Long Gilt Bond Futures 29/03/2021 Long 3,897,600 9,210 0.03
USD3 US Treasury Long Bond Futures 22/03/2021 Long 391,951 127 0.0019 US Treasury Notes 10YR Futures 22/03/2021 Long 1,962,220 3,568 0.016 US Treasury Notes 5YR Futures 31/03/2021 Long 565,283 561 0.011 US Treasury Ultra Long Bond Futures 22/03/2021 Long 161,262 53 0.003 US Treasury Ultra Long Notes 10YR Futures 22/03/2021 Long 352,202 499 0.00
3,432,918 4,808 0.02
UNREALISED GAIN ON FUTURES CONTRACTS 15,786 0.05
Number ofContracts Security Description
CommitmentMarket Value
GBP
UnrealisedLossGBP
% ofShareholders’
Equity
AUD(3) Australian Treasury Bonds 3YR Futures 15/12/2020 Short (194,388) (751) (0.00)
EUR(1) German Federal Republic Bonds 30YR Futures 08/12/2020 Short (203,241) (1,758) (0.01)
USD(2) US Treasury Notes 2YR Futures 31/03/2021 Short (330,259) (93) (0.00)
UNREALISED LOSS ON FUTURES CONTRACTS (2,602) (0.01)
Forward Currency Contracts – 0.26%
CurrencyAmountBought Currency
AmountSold
MaturityDate
UnrealisedGainGBP
% ofShareholders’
Equity
JPY 36,512,748 USD 350,128 16/12/2020 145 0.00GBP 3,361,461 USD 4,335,269 13/01/2021 121,744 0.40GBP 1,514,574 EUR 1,678,951 21/01/2021 7,303 0.02
UNREALISED GAIN ON FORWARD CURRENCY CONTRACTS 129,192 0.42
CurrencyAmountBought Currency
AmountSold
MaturityDate
UnrealisedLossGBP
% ofShareholders’
Equity
EUR 231,594 NOK 2,587,899 16/12/2020 (12,051) (0.04)EUR 265,727 SEK 2,770,759 16/12/2020 (5,853) (0.02)USD 238,050 AUD 338,931 16/12/2020 (9,022) (0.03)USD 294,844 CAD 394,154 16/12/2020 (7,431) (0.02)
Goldman Sachs Funds—Sterling Credit PortfolioSchedule of InvestmentsAs at 30 November 2020
The accompanying notes are an integral part of these financial statements.
363

Forward Currency Contracts – (Continued)
CurrencyAmountBought Currency
AmountSold
MaturityDate
UnrealisedLossGBP
% ofShareholders’
Equity
USD 238,201 NZD 359,764 16/12/2020 (11,423) (0.04)USD 285,805 GBP 217,467 13/01/2021 (3,888) (0.01)
UNREALISED LOSS ON FORWARD CURRENCY CONTRACTS (49,668) (0.16)
Options – (0.01%)
Holdings Security Description
UnrealisedGain/(Loss)
GBPMarket Value
GBP
% ofShareholders’
Equity
Purchased OptionsUSD
100,000 Call 3 month LIBOR Swaption Expires 15/01/2021 Strike 0.61 (344) 77 0.00130,000 Call 3 month LIBOR Swaption Expires 12/02/2021 Strike 0.83 218 742 0.01120,000 Call 3 month LIBOR Swaption Expires 16/02/2021 Strike 0.78 93 547 0.00
(33) 1,366 0.01
TOTAL PURCHASED OPTIONS(cost GBP 1,399) 1,366 0.01
Written OptionsEUR
(200,000) Call 6 month EURIBOR Swaption Expires 30/11/2020 Strike 0.15 (329) (1,849) (0.01)(60,000) Call 6 month EURIBOR Swaption Expires 01/12/2020 Strike 0.15 (92) (554) (0.00)(40,000) Call 6 month EURIBOR Swaption Expires 02/12/2020 Strike 0.15 (27) (368) (0.00)(170,000) Call 6 month EURIBOR Swaption Expires 02/12/2020 Strike 0.20 371 (790) (0.01)(130,000) Call 6 month EURIBOR Swaption Expires 03/12/2020 Strike 0.20 380 (605) (0.00)(80,000) Call 6 month EURIBOR Swaption Expires 14/01/2021 Strike 0.25 286 (282) (0.00)(80,000) Call 6 month EURIBOR Swaption Expires 14/01/2021 Strike 0.25 289 (282) (0.00)(130,000) Call 6 month EURIBOR Swaption Expires 15/01/2021 Strike 0.39 338 (71) (0.00)(170,000) Call 6 month EURIBOR Swaption Expires 12/02/2021 Strike 0.26 (201) (714) (0.00)(140,000) Call 6 month EURIBOR Swaption Expires 16/02/2021 Strike 0.29 (46) (444) (0.00)(200,000) Put 6 month EURIBOR Swaption Expires 30/11/2020 Strike 0.10 483 (0) (0.00)(60,000) Put 6 month EURIBOR Swaption Expires 01/12/2020 Strike 0.10 128 (0) (0.00)(40,000) Put 6 month EURIBOR Swaption Expires 02/12/2020 Strike 0.10 68 0 (0.00)(80,000) Put 6 month EURIBOR Swaption Expires 14/01/2021 Strike 0.00 177 (20) (0.00)(80,000) Put 6 month EURIBOR Swaption Expires 14/01/2021 Strike 0.00 177 (20) (0.00)
2,002 (5,999) (0.02)
TOTAL WRITTEN OPTIONS(cost GBP (8,001)) (5,999) (0.02)
TOTAL OPTIONS(cost GBP (6,602)) (4,633) (0.01)
Swap Contracts – 0.02%Net LocalNotionalAmount Pay Receive Currency Maturity Date
UnrealisedGainGBP
% ofShareholders’
Equity
Interest Rate Swaps780,000 Floating (AUD 6 month BBSW) Fixed 0.553% AUD 16/05/2025 2,498 0.01260,000 Floating (AUD 6 month BBSW) Fixed 0.500% AUD 25/11/2025 94 0.00290,000 Floating (AUD 6 month BBSW) Fixed 1.550% AUD 12/11/2030 240 0.00210,000 Fixed 1.000% Floating (AUD 6 month BBSW) AUD 16/12/2030 1,118 0.00360,000 Fixed 1.430% Floating (CAD 3 month CDOR) CAD 09/11/2030 13 0.00790,000 Floating (CHF 6 month LIBOR) Fixed 0.000% CHF 16/12/2027 42 0.00280,000 Floating (EUR 6 month LIBOR) Fixed 0.000% EUR 16/12/2022 375 0.00650,000 Fixed 0.000% Floating (EUR 12 month LIBOR) EUR 19/11/2024 26 0.00
1,230,000 Fixed 0.000% Floating (EUR 12 month LIBOR) EUR 16/12/2025 526 0.00720,000 Fixed 0.000% Floating (EUR 12 month LIBOR) EUR 16/12/2027 1,947 0.01
1,850,000 Floating (GBP 6 month LIBOR) Fixed 0.500% GBP 16/12/2022 298 0.00580,000 Fixed 0.500% Floating (GBP 6 month LIBOR) GBP 16/12/2025 868 0.00460,000 Fixed 0.500% Floating (GBP 6 month LIBOR) GBP 16/12/2027 817 0.00610,000 Fixed 0.750% Floating (GBP 6 month LIBOR) GBP 16/12/2030 1,591 0.01
1,820,000 Fixed 0.750% Floating (GBP 6 month LIBOR) GBP 16/12/2035 11,745 0.041,150,000 Floating (MXN 1 month TIIE) Fixed 4.500% MXN 14/12/2022 22 0.002,720,000 Fixed 1.240% Floating (NOK 6 month NIBOR) NOK 29/10/2030 2,125 0.01250,000 Floating (PLN 6 month WIBOR) Fixed 0.750% PLN 16/12/2025 319 0.00860,000 Fixed 0.750% Floating (USD 3 month LIBOR) USD 16/12/2023 823 0.00
Goldman Sachs Funds—Sterling Credit PortfolioSchedule of InvestmentsAs at 30 November 2020
The accompanying notes are an integral part of these financial statements.
364

Swap Contracts – (Continued)
Net LocalNotionalAmount Pay Receive Currency Maturity Date
UnrealisedGainGBP
% ofShareholders’
Equity
Interest Rate Swaps – (Continued)130,000 Floating (USD 3 month LIBOR) Fixed 2.500% USD 20/05/2029 6,491 0.0250,000 Floating (USD 3 month LIBOR) Fixed 1.500% USD 02/12/2050 145 0.00
UNREALISED GAIN ON INTEREST RATE SWAPS 32,123 0.10
Credit Default Swaps425,000 Floating (iTraxx Europe Crossover
Series 34 Version 1)Fixed 5.000% EUR 20/12/2025 7,147 0.02
850,000 Floating (The Markit CDX North AmericaInvestment Grade 34 Index)
Fixed 1.000% USD 20/06/2023 2,042 0.01
200,000 Floating (AT&T, Inc.) Fixed 1.000% USD 20/06/2024 2,049 0.01250,000 Floating (Indonesia Government
International Bond)Fixed 1.000% USD 20/06/2024 2,511 0.01
150,000 Floating (Prudential Financial, Inc.) Fixed 1.000% USD 20/06/2024 1,652 0.0020,000 Floating (Qatar Government
International Bond)Fixed 1.000% USD 20/06/2024 150 0.00
20,000 Floating (Qatar GovernmentInternational Bond)
Fixed 1.000% USD 20/12/2024 157 0.00
1,200,000 Floating (The Markit CDX North AmericaInvestment Grade 34 Index)
Fixed 1.000% USD 20/06/2025 2,086 0.01
UNREALISED GAIN ON CREDIT DEFAULT SWAPS 17,794 0.06
TOTAL UNREALISED GAIN ON SWAP CONTRACTS 49,917 0.16
Net LocalNotionalAmount Pay Receive Currency Maturity Date
UnrealisedLossGBP
% ofShareholders’
Equity
Interest Rate Swaps1,000,000 Floating (AUD 6 month BBSW) Fixed 0.920% AUD 04/09/2028 (748) (0.00)320,000 Floating (AUD 6 month BBSW) Fixed 1.240% AUD 28/10/2030 (1,783) (0.01)600,000 Floating (AUD 6 month BBSW) Fixed 1.250% AUD 09/11/2030 (650) (0.00)100,000 Floating (BRL 1 month BRCDI) Fixed 4.230% BRL 02/01/2023 (32) (0.00)715,000 Floating (BRL 1 month BRCDI) Fixed 4.930% BRL 02/01/2024 (1,440) (0.01)
1,290,000 Floating (CAD 3 month CDOR) Fixed 0.700% CAD 18/11/2023 (86) (0.00)920,000 Floating (CAD 3 month CDOR) Fixed 1.250% CAD 16/12/2023 (306) (0.00)960,000 Floating (CAD 3 month CDOR) Fixed 0.810% CAD 30/09/2024 (1,054) (0.00)
1,770,000 Floating (CAD 3 month CDOR) Fixed 0.960% CAD 09/11/2024 (689) (0.00)800,000 Floating (CAD 3 month CDOR) Fixed 0.812% CAD 17/11/2024 (200) (0.00)580,000 Fixed 0.000% Floating (EUR 12 month LIBOR) EUR 18/05/2025 (84) (0.00)820,000 Fixed 0.000% Floating (EUR 6 month LIBOR) EUR 16/12/2025 (1,695) (0.01)160,000 Fixed 0.000% Floating (EUR 6 month LIBOR) EUR 16/12/2027 (574) (0.00)160,000 Fixed 0.900% Floating (EUR 6 month EURIBOR) EUR 20/05/2029 (7,543) (0.03)260,000 Fixed 0.000% Floating (EUR 6 month LIBOR) EUR 16/12/2030 (1,826) (0.01)50,000 Fixed 0.100% Floating (EUR 6 month EURIBOR) EUR 02/12/2050 (10) (0.00)90,000 Fixed 0.250% Floating (EUR 6 month EURIBOR) EUR 16/12/2050 (320) (0.00)
1,890,000 Floating (GBP 6 month LIBOR) Fixed 0.500% GBP 16/12/2023 (573) (0.00)1,230,000 Floating (GBP 6 month LIBOR) Fixed 0.750% GBP 16/12/2040 (4,991) (0.02)1,070,000 Floating (GBP 6 month LIBOR) Fixed 0.750% GBP 16/12/2050 (4,209) (0.01)
110,090,000 Fixed 0.144% Floating (JPY 6 month LIBOR) JPY 13/11/2030 (251) (0.00)2,660,000 Floating (NOK 6 month NIBOR) Fixed 0.750% NOK 16/12/2025 (1,439) (0.01)1,240,000 Fixed 0.250% Floating (PLN 3 month WIBOR) PLN 16/12/2021 (109) (0.00)7,160,000 Floating (SEK 3 month STIBOR) Fixed 0.000% SEK 16/12/2025 (492) (0.00)2,020,000 Floating (USD 1 month LIBOR) Floating (USD 3 month LIBOR) USD 25/07/2024 (504) (0.00)1,200,000 Floating (USD 3 month SOFR) Floating (USD 3 month LIBOR) USD 10/11/2024 (672) (0.00)430,000 Fixed 1.190% Floating (USD 3 month LIBOR) USD 10/11/2030 (969) (0.00)
2,465,000 Floating (ZAR 3 month JIBAR) Fixed 5.250% ZAR 17/03/2026 (1,176) (0.00)
UNREALISED LOSS ON INTEREST RATE SWAPS (34,425) (0.11)
Credit Default Swaps150,000 Floating (Unibail-Rodamco-Westfield
S.E.)Fixed 1.000% EUR 20/06/2024 (2,879) (0.01)
Goldman Sachs Funds—Sterling Credit PortfolioSchedule of InvestmentsAs at 30 November 2020
The accompanying notes are an integral part of these financial statements.
365

Swap Contracts – (Continued)
Net LocalNotionalAmount Pay Receive Currency Maturity Date
UnrealisedLossGBP
% ofShareholders’
Equity
Credit Default Swaps – (Continued)625,000 Fixed 1.000% Floating (iTraxx Europe
Series 34 Version 1)EUR 20/12/2025 (2,209) (0.01)
1,800,000 Floating (The Markit CDX North AmericaInvestment Grade 28 Version 1 Index)
Fixed 1.000% USD 20/06/2022 (4,599) (0.01)
UNREALISED LOSS ON CREDIT DEFAULT SWAPS (9,687) (0.03)
TOTAL UNREALISED LOSS ON SWAP CONTRACTS (44,112) (0.14)
MARKET VALUE OF INVESTMENTS(cost GBP 27,688,904)
29,178,213 96.04
OTHER ASSETS AND LIABILITIES 1,204,602 3.96
SHAREHOLDERS’ EQUITY 30,382,815 100.00
TOTAL INVESTMENTSMarket Value
GBP
% ofShareholders’
Equity
Total Investments excluding derivatives (cost GBP 27,695,506) 29,084,333 95.73Unrealised gain on futures contracts 15,786 0.05Unrealised loss on futures contracts (2,602) (0.01)Unrealised gain on forward currency contracts 129,192 0.42Unrealised loss on forward currency contracts (49,668) (0.16)Market value of purchased options (cost GBP 1,399) 1,366 0.01Market value of written options (cost GBP (8,001)) (5,999) (0.02)Unrealised gain on swap contracts 49,917 0.16Unrealised loss on swap contracts (44,112) (0.14)Other Assets and Liabilities 1,204,602 3.96
Shareholders’ Equity 30,382,815 100.00
The Futures Commission Merchant was Goldman Sachs & Co. LLC.
The counterparties for forward currency contracts were Bank of America N.A., Barclays Bank Plc., Citibank N.A., Credit Suisse International, Deutsche Bank AG, HSBC Bank Plc., MorganStanley & Co. International Plc., Royal Bank of Canada, State Street Bank & Trust and UBS AG.
The counterparties for options contracts were Bank of America N.A., Citibank N.A., JP Morgan Chase Bank N.A., Morgan Stanley & Co. International Plc. and UBS AG.
The counterparty for swap contracts was Credit Suisse.
The maximum individual counterparty exposure as at 30 November 2020 is 0.39% of the NAV.
(a) Interest rates represent either the stated coupon rate, annualised discounted yield on date of purchase for discounted securities, or, for floating rate securities, the current reset ratewhich is based upon interest rates indices.
(b) Maturity dates represent either the stated date on the security, or the next interest reset date for floating rate securities or the prerefunded date for those type of securities.(c) Variable and floating coupon rates are those quoted as of 30 November 2020.(d) A related party to Goldman Sachs Funds.(e) The yield for this fund as at 30 November 2020 was 0.048%.(f) 144A: This security is issued to qualified institutional investors, pursuant to private placements, and is transferable as stated in rule 144A of the US Securities Act of 1933.
Goldman Sachs Funds—Sterling Credit PortfolioSchedule of InvestmentsAs at 30 November 2020
The accompanying notes are an integral part of these financial statements.
366

Holdings Security Description Currency Interest Rate(a) Maturity Date(b)Market Value
USD
% ofShareholders’
Equity
Transferable securities admitted to an official exchange listing
Bonds – 28.36%Canada
525,000 Canadian Natural Resources Ltd. USD 2.050% 15/07/2025 540,094 0.16
Colombia870,000 Colombia Government International Bond USD 8.125% 21/05/2024 1,058,355 0.31
Indonesia1,000,000 Indonesia Government International Bond USD 4.450% 11/02/2024 1,110,625 0.33320,000 Perusahaan Penerbit SBSN Indonesia III USD 2.300% 23/06/2025 334,800 0.10
1,445,425 0.43
Ireland1,125,000 AerCap Ireland Capital DAC Via AerCap Global Aviation Trust USD 4.450% 16/12/2021 1,158,536 0.34
Japan1,350,000 Mitsubishi UFJ Financial Group, Inc. USD 3.218% 07/03/2022 1,397,506 0.42650,000 Mitsubishi UFJ Financial Group, Inc. USD 2.623% 18/07/2022 673,537 0.20750,000 Mizuho Financial Group, Inc.(c) USD 1.241% 10/07/2024 760,110 0.23200,000 Mizuho Financial Group, Inc.(c) USD 0.849% 08/09/2024 200,576 0.06
1,200,000 Panasonic Corp. 144A(d) USD 2.536% 19/07/2022 1,235,196 0.37300,000 Sumitomo Mitsui Financial Group, Inc. USD 2.442% 19/10/2021 305,634 0.09425,000 Sumitomo Mitsui Financial Group, Inc. USD 2.348% 15/01/2025 449,994 0.13
1,550,000 Sumitomo Mitsui Trust Bank Ltd. 144A(d) USD 0.800% 12/09/2023 1,559,966 0.46
6,582,519 1.96
Kuwait1,060,000 Kuwait International Government Bond USD 2.750% 20/03/2022 1,090,144 0.32
Luxembourg1,160,000 Gazprom PJSC Via Gaz Capital S.A. USD 5.999% 23/01/2021 1,168,700 0.35
Netherlands650,000 ING Groep NV USD 4.100% 02/10/2023 714,441 0.21
1,010,000 Lukoil International Finance BV USD 4.563% 24/04/2023 1,084,961 0.33
1,799,402 0.54
Qatar1,020,000 Qatar Government International Bond USD 3.375% 14/03/2024 1,105,425 0.33
Spain1,000,000 Banco Santander S.A. USD 2.706% 27/06/2024 1,064,100 0.32
Switzerland2,400,000 Credit Suisse Group AG USD 3.800% 09/06/2023 2,585,352 0.77
United Arab Emirates1,070,000 Abu Dhabi Government International Bond USD 2.125% 30/09/2024 1,123,500 0.33
United Kingdom550,000 Barclays Bank Plc. USD 2.650% 11/01/2021 550,335 0.16600,000 GlaxoSmithKline Capital Plc. USD 0.534% 01/10/2023 601,962 0.18
1,625,000 HSBC Holdings Plc. USD 3.600% 25/05/2023 1,747,021 0.521,025,000 Lloyds Banking Group Plc.(c) USD 2.858% 17/03/2023 1,054,715 0.31450,000 Lloyds Banking Group Plc.(c) USD 1.326% 15/06/2023 454,550 0.14875,000 Nationwide Building Society 144A(d) USD 2.000% 27/01/2023 902,737 0.27400,000 Nationwide Building Society 144A(c)(d) USD 3.622% 26/04/2023 416,016 0.12
1,075,000 NatWest Markets Plc. 144A(d) USD 3.625% 29/09/2022 1,134,093 0.341,100,000 Santander UK Plc. USD 2.100% 13/01/2023 1,137,070 0.34325,000 Standard Chartered Plc. 144A(c)(d) USD 4.247% 20/01/2023 337,405 0.10225,000 Standard Chartered Plc. 144A(c)(d) USD 1.319% 14/10/2023 226,521 0.07825,000 Standard Chartered Plc. 144A(c)(d) USD 3.885% 15/03/2024 877,363 0.26
9,439,788 2.81
United States230,000 AbbVie, Inc. USD 2.300% 14/05/2021 231,654 0.07625,000 Aetna, Inc. USD 2.800% 15/06/2023 657,544 0.20300,000 Air Lease Corp. USD 2.250% 15/01/2023 306,678 0.09
1,075,000 Air Lease Corp. USD 2.750% 15/01/2023 1,101,413 0.33775,000 Altria Group, Inc. USD 3.490% 14/02/2022 803,698 0.24450,000 American Express Co. USD 3.700% 05/11/2021 462,902 0.14825,000 American Tower Corp. USD 0.600% 15/01/2024 826,254 0.25425,000 American Tower Corp. USD 2.400% 15/03/2025 451,822 0.13700,000 AT&T, Inc. USD 3.000% 30/06/2022 725,753 0.22
Goldman Sachs Funds—US Dollar Short Duration Bond PortfolioSchedule of InvestmentsAs at 30 November 2020
The accompanying notes are an integral part of these financial statements.
367

Holdings Security Description Currency Interest Rate(a) Maturity Date(b)Market Value
USD
% ofShareholders’
Equity
Bonds – (Continued)United States – (Continued)
800,000 AT&T, Inc. USD 2.625% 01/12/2022 830,864 0.25324,000 AT&T, Inc. USD 3.950% 15/01/2025 364,244 0.11
1,325,000 Bank of America Corp. USD 3.300% 11/01/2023 1,405,414 0.421,625,000 Becton Dickinson and Co. USD 2.894% 06/06/2022 1,679,925 0.50500,000 Becton Dickinson and Co. USD 3.734% 15/12/2024 551,930 0.16575,000 Capital One NA USD 2.250% 13/09/2021 582,831 0.17175,000 Celanese US Holdings LLC USD 3.500% 08/05/2024 189,492 0.06250,000 CenterPoint Energy, Inc. USD 3.600% 01/11/2021 257,430 0.08775,000 CenterPoint Energy, Inc. USD 2.500% 01/09/2022 801,629 0.24500,000 Chubb INA Holdings, Inc. USD 2.875% 03/11/2022 522,155 0.16
1,600,000 Cigna Corp. USD 3.400% 17/09/2021 1,638,432 0.4950,000 CIT Group, Inc. USD 4.750% 16/02/2024 54,563 0.02870,000 Citigroup, Inc. USD 4.500% 14/01/2022 909,837 0.27
1,475,000 Citigroup, Inc. USD 2.750% 25/04/2022 1,521,153 0.45625,000 Citigroup, Inc. USD 2.700% 27/10/2022 650,962 0.19
1,225,000 Citigroup, Inc. USD 3.875% 25/10/2023 1,345,969 0.40925,000 Constellation Brands, Inc. USD 2.700% 09/05/2022 952,750 0.28250,000 Crown Castle International Corp. USD 5.250% 15/01/2023 274,263 0.08500,000 Crown Castle International Corp. USD 1.350% 15/07/2025 508,230 0.15817,000 CVS Health Corp. USD 3.700% 09/03/2023 873,708 0.26225,000 Dominion Energy, Inc.(e) USD 3.071% 15/08/2024 243,626 0.07300,000 DTE Energy Co.—Series B USD 2.600% 15/06/2022 309,750 0.09400,000 DTE Energy Co.—Series F USD 1.050% 01/06/2025 404,188 0.12750,000 DTE Energy Co.—Series H USD 0.550% 01/11/2022 751,612 0.22
2,150,000 DuPont de Nemours, Inc. USD 4.205% 15/11/2023 2,368,913 0.71425,000 Energy Transfer Operating LP USD 2.900% 15/05/2025 440,279 0.13725,000 Energy Transfer Partners LP Via Regency Energy Finance Corp. USD 4.500% 01/11/2023 778,150 0.23525,000 Entergy Louisiana LLC USD 0.620% 17/11/2023 526,533 0.16175,000 Enterprise Products Operating LLC USD 2.850% 15/04/2021 176,251 0.05475,000 Enterprise Products Operating LLC USD 3.350% 15/03/2023 502,821 0.15415,000 Evergy, Inc.(e) USD 5.292% 15/06/2022 439,605 0.13750,000 Exxon Mobil Corp. USD 2.992% 19/03/2025 818,827 0.24300,000 FirstEnergy Corp. USD 2.050% 01/03/2025 300,975 0.09300,000 General Motors Financial Co., Inc. USD 3.200% 06/07/2021 303,666 0.09300,000 General Motors Financial Co., Inc. USD 4.200% 06/11/2021 309,510 0.09675,000 Georgia Power Co.—Series A USD 2.100% 30/07/2023 704,767 0.21800,000 Hewlett Packard Enterprise Co. USD 4.400% 15/10/2022 852,624 0.25450,000 Hewlett Packard Enterprise Co. USD 2.250% 01/04/2023 466,061 0.14800,000 Hewlett Packard Enterprise Co. USD 4.450% 02/10/2023 881,568 0.26350,000 Intercontinental Exchange, Inc. USD 0.700% 15/06/2023 352,436 0.11340,000 ITC Holdings Corp. USD 2.700% 15/11/2022 353,852 0.11750,000 Jefferies Group LLC USD 5.125% 20/01/2023 821,932 0.25525,000 JPMorgan Chase & Co. USD 4.500% 24/01/2022 550,358 0.16125,000 Kinder Morgan Energy Partners LP USD 3.950% 01/09/2022 131,419 0.04440,000 Marathon Petroleum Corp. USD 4.500% 01/05/2023 475,222 0.14850,000 Marsh & McLennan Cos., Inc. USD 3.500% 03/06/2024 929,279 0.28
1,900,000 Morgan Stanley USD 2.750% 19/05/2022 1,965,417 0.592,000,000 Morgan Stanley USD 3.125% 23/01/2023 2,113,320 0.631,750,000 Morgan Stanley(c) USD 0.560% 10/11/2023 1,751,820 0.52550,000 Morgan Stanley—Series F USD 3.875% 29/04/2024 608,124 0.18
1,200,000 Newfield Exploration Co. USD 5.750% 30/01/2022 1,238,244 0.37650,000 NextEra Energy Capital Holdings, Inc. USD 2.900% 01/04/2022 671,768 0.20700,000 NiSource, Inc. USD 0.950% 15/08/2025 699,790 0.21750,000 Pacific Gas & Electric Co. USD 1.750% 16/06/2022 751,807 0.22
1,150,000 PayPal Holdings, Inc. USD 2.200% 26/09/2022 1,188,226 0.35700,000 PayPal Holdings, Inc. USD 2.400% 01/10/2024 745,136 0.22550,000 Phillips 66 USD 0.900% 15/02/2024 550,842 0.16275,000 Plains All American Pipeline LP Via PAA Finance Corp. USD 3.650% 01/06/2022 282,997 0.08574,000 Plains All American Pipeline LP Via PAA Finance Corp. USD 3.850% 15/10/2023 607,711 0.18450,000 Public Service Enterprise Group, Inc. USD 2.875% 15/06/2024 483,327 0.14450,000 Public Service Enterprise Group, Inc. USD 0.800% 15/08/2025 450,153 0.13225,000 Ralph Lauren Corp. USD 1.700% 15/06/2022 229,439 0.07700,000 Southern Co. USD 2.950% 01/07/2023 742,105 0.22
1,040,000 Southern Copper Corp. USD 3.500% 08/11/2022 1,098,012 0.33100,000 Southern Power Co.—Series E USD 2.500% 15/12/2021 102,065 0.03549,000 Sunoco Logistics Partners Operations LP USD 4.400% 01/04/2021 555,077 0.17
3,300,000 United States Treasury Note/Bond USD 0.125% 30/11/2022 3,298,260 0.982,450,000 Verizon Communications, Inc. USD 2.946% 15/03/2022 2,531,193 0.75475,000 WEC Energy Group, Inc. USD 0.550% 15/09/2023 476,639 0.14400,000 Wells Fargo & Co. USD 3.500% 08/03/2022 415,752 0.12
1,975,000 Wells Fargo & Co. USD 2.625% 22/07/2022 2,046,396 0.61
Goldman Sachs Funds—US Dollar Short Duration Bond PortfolioSchedule of InvestmentsAs at 30 November 2020
The accompanying notes are an integral part of these financial statements.
368
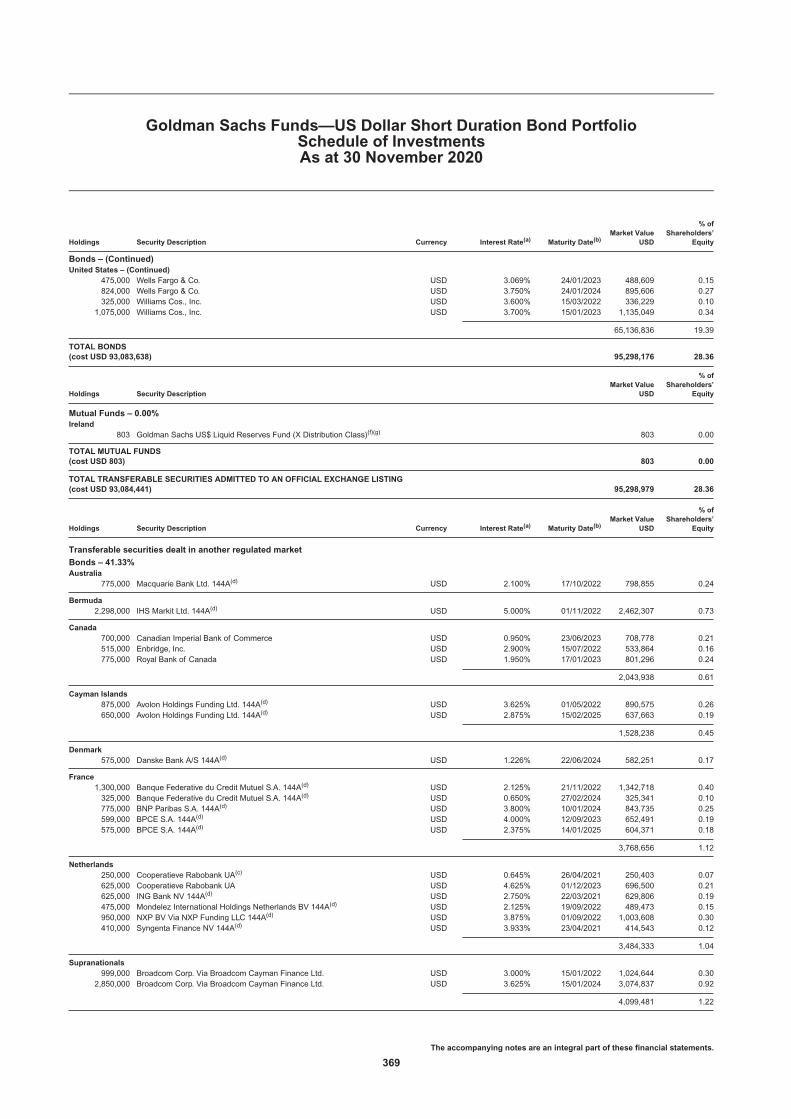
Holdings Security Description Currency Interest Rate(a) Maturity Date(b)Market Value
USD
% ofShareholders’
Equity
Bonds – (Continued)United States – (Continued)
475,000 Wells Fargo & Co. USD 3.069% 24/01/2023 488,609 0.15824,000 Wells Fargo & Co. USD 3.750% 24/01/2024 895,606 0.27325,000 Williams Cos., Inc. USD 3.600% 15/03/2022 336,229 0.10
1,075,000 Williams Cos., Inc. USD 3.700% 15/01/2023 1,135,049 0.34
65,136,836 19.39
TOTAL BONDS(cost USD 93,083,638) 95,298,176 28.36
Holdings Security DescriptionMarket Value
USD
% ofShareholders’
Equity
Mutual Funds – 0.00%Ireland
803 Goldman Sachs US$ Liquid Reserves Fund (X Distribution Class)(f)(g) 803 0.00
TOTAL MUTUAL FUNDS(cost USD 803) 803 0.00
TOTAL TRANSFERABLE SECURITIES ADMITTED TO AN OFFICIAL EXCHANGE LISTING(cost USD 93,084,441) 95,298,979 28.36
Holdings Security Description Currency Interest Rate(a) Maturity Date(b)Market Value
USD
% ofShareholders’
Equity
Transferable securities dealt in another regulated market
Bonds – 41.33%Australia
775,000 Macquarie Bank Ltd. 144A(d) USD 2.100% 17/10/2022 798,855 0.24
Bermuda2,298,000 IHS Markit Ltd. 144A(d) USD 5.000% 01/11/2022 2,462,307 0.73
Canada700,000 Canadian Imperial Bank of Commerce USD 0.950% 23/06/2023 708,778 0.21515,000 Enbridge, Inc. USD 2.900% 15/07/2022 533,864 0.16775,000 Royal Bank of Canada USD 1.950% 17/01/2023 801,296 0.24
2,043,938 0.61
Cayman Islands875,000 Avolon Holdings Funding Ltd. 144A(d) USD 3.625% 01/05/2022 890,575 0.26650,000 Avolon Holdings Funding Ltd. 144A(d) USD 2.875% 15/02/2025 637,663 0.19
1,528,238 0.45
Denmark575,000 Danske Bank A/S 144A(d) USD 1.226% 22/06/2024 582,251 0.17
France1,300,000 Banque Federative du Credit Mutuel S.A. 144A(d) USD 2.125% 21/11/2022 1,342,718 0.40325,000 Banque Federative du Credit Mutuel S.A. 144A(d) USD 0.650% 27/02/2024 325,341 0.10775,000 BNP Paribas S.A. 144A(d) USD 3.800% 10/01/2024 843,735 0.25599,000 BPCE S.A. 144A(d) USD 4.000% 12/09/2023 652,491 0.19575,000 BPCE S.A. 144A(d) USD 2.375% 14/01/2025 604,371 0.18
3,768,656 1.12
Netherlands250,000 Cooperatieve Rabobank UA(c) USD 0.645% 26/04/2021 250,403 0.07625,000 Cooperatieve Rabobank UA USD 4.625% 01/12/2023 696,500 0.21625,000 ING Bank NV 144A(d) USD 2.750% 22/03/2021 629,806 0.19475,000 Mondelez International Holdings Netherlands BV 144A(d) USD 2.125% 19/09/2022 489,473 0.15950,000 NXP BV Via NXP Funding LLC 144A(d) USD 3.875% 01/09/2022 1,003,608 0.30410,000 Syngenta Finance NV 144A(d) USD 3.933% 23/04/2021 414,543 0.12
3,484,333 1.04
Supranationals999,000 Broadcom Corp. Via Broadcom Cayman Finance Ltd. USD 3.000% 15/01/2022 1,024,644 0.30
2,850,000 Broadcom Corp. Via Broadcom Cayman Finance Ltd. USD 3.625% 15/01/2024 3,074,837 0.92
4,099,481 1.22
Goldman Sachs Funds—US Dollar Short Duration Bond PortfolioSchedule of InvestmentsAs at 30 November 2020
The accompanying notes are an integral part of these financial statements.
369

Holdings Security Description Currency Interest Rate(a) Maturity Date(b)Market Value
USD
% ofShareholders’
Equity
Bonds – (Continued)Sweden
800,000 Skandinaviska Enskilda Banken AB 144A(d) USD 0.550% 01/09/2023 800,648 0.24
Switzerland1,750,000 UBS Group AG 144A(d) USD 2.650% 01/02/2022 1,796,970 0.54375,000 UBS Group AG 144A(c)(d) USD 1.008% 30/07/2024 377,951 0.11
2,174,921 0.65
United Kingdom1,975,000 NatWest Markets Plc. 144A(d) USD 2.375% 21/05/2023 2,052,914 0.61850,000 Royalty Pharma Plc. 144A(d) USD 0.750% 02/09/2023 853,425 0.25
2,906,339 0.86
United States1,650,000 AbbVie, Inc. USD 2.150% 19/11/2021 1,678,297 0.501,375,000 AbbVie, Inc. USD 2.300% 21/11/2022 1,424,225 0.42325,000 Adobe, Inc. USD 1.700% 01/02/2023 334,734 0.10150,000 AIG Global Funding 144A(c)(d) USD 0.685% 25/06/2021 150,365 0.05175,000 AIG Global Funding 144A(d) USD 3.350% 25/06/2021 177,917 0.05300,000 AIG Global Funding 144A(d) USD 0.800% 07/07/2023 303,267 0.09925,000 Amazon.com, Inc. USD 0.400% 03/06/2023 927,673 0.28350,000 American Express Co. USD 3.375% 17/05/2021 354,015 0.11550,000 Athene Global Funding 144A(d) USD 1.200% 13/10/2023 551,936 0.16850,000 Bank of America Corp.(c) USD 3.499% 17/05/2022 862,240 0.26
2,400,000 Bank of America Corp.(c) USD 3.004% 20/12/2023 2,520,384 0.75750,000 Bank of America Corp.(c) USD 0.981% 25/09/2025 754,297 0.22325,000 Bank of America NA(c) USD 3.335% 25/01/2023 336,453 0.10575,000 Bayer US Finance II LLC 144A(c)(d) USD 0.855% 25/06/2021 576,403 0.17950,000 Bayer US Finance II LLC 144A(d) USD 3.500% 25/06/2021 963,955 0.29400,000 BBVA USA USD 3.500% 11/06/2021 405,712 0.12250,000 Berkshire Hathaway Energy Co. USD 2.375% 15/01/2021 250,640 0.08
1,675,000 Broadcom, Inc. USD 3.125% 15/10/2022 1,754,780 0.521,200,000 Broadcom, Inc. USD 3.625% 15/10/2024 1,314,684 0.391,475,000 Carrier Global Corp. 144A(d) USD 1.923% 15/02/2023 1,518,380 0.45300,000 Charles Schwab Corp.(c) USD 0.533% 21/05/2021 300,321 0.09
1,875,000 Charter Communications Operating LLC Via Charter CommunicationsOperating Capital USD 4.464% 23/07/2022 1,982,156 0.59
675,000 Charter Communications Operating LLC Via Charter CommunicationsOperating Capital USD 4.500% 01/02/2024 748,366 0.22
275,000 Citibank NA(c) USD 3.165% 19/02/2022 276,752 0.08725,000 Citigroup, Inc.(c) USD 0.776% 30/10/2024 726,994 0.22
1,200,000 Citizens Bank NA Via Providence RI USD 3.250% 14/02/2022 1,238,436 0.37260,000 City of Austin TX Electric Utility Revenue �A� USD 2.425% 15/11/2021 265,383 0.08260,000 City of Austin TX Electric Utility Revenue �A� USD 2.456% 15/11/2022 270,746 0.08260,000 City of Austin TX Electric Utility Revenue �A� USD 2.524% 15/11/2023 276,023 0.08
1,600,000 Constellation Brands, Inc. USD 3.200% 15/02/2023 1,688,720 0.50225,000 Daimler Finance North America LLC 144A(d) USD 3.350% 04/05/2021 227,743 0.07
1,800,000 Dell International LLC Via EMC Corp. 144A(d) USD 5.450% 15/06/2023 1,991,196 0.59800,000 Dell International LLC Via EMC Corp. 144A(d) USD 4.000% 15/07/2024 879,848 0.26775,000 Dominion Energy, Inc. 144A(d) USD 2.450% 15/01/2023 805,961 0.24175,000 Dow Chemical Co. USD 3.150% 15/05/2024 187,579 0.06750,000 Equitable Financial Life Global Funding 144A(d) USD 0.500% 17/11/2023 751,080 0.22425,000 Equitable Financial Life Global Funding 144A(d) USD 1.400% 07/07/2025 435,200 0.13
34,520,000 Federal National Mortgage Association (FNMA) USD 0.375% 25/08/2025 34,390,205 10.24300,000 Fifth Third Bank NA(c) USD 0.655% 26/07/2021 300,747 0.09325,000 Fifth Third Bank NA USD 3.350% 26/07/2021 330,707 0.10525,000 First Republic Bank(c) USD 1.912% 12/02/2024 541,160 0.16500,000 Fiserv, Inc. USD 4.750% 15/06/2021 511,650 0.15600,000 Fiserv, Inc. USD 3.800% 01/10/2023 653,916 0.20
1,425,000 Fiserv, Inc. USD 2.750% 01/07/2024 1,525,904 0.451,000,000 Fox Corp. USD 3.666% 25/01/2022 1,037,570 0.31775,000 General Mills, Inc.(c) USD 0.770% 16/04/2021 776,317 0.23650,000 Georgia-Pacific LLC 144A(d) USD 0.625% 15/05/2024 651,001 0.19350,000 Gilead Sciences, Inc.(c) USD 0.740% 29/09/2023 350,830 0.10100,000 Gilead Sciences, Inc. USD 0.750% 29/09/2023 100,290 0.03150,000 Glencore Funding LLC 144A(d) USD 3.000% 27/10/2022 155,451 0.05300,000 Great-West Lifeco US Finance 2020 LP 144A(d) USD 0.904% 12/08/2025 300,357 0.09675,000 Hewlett Packard Enterprise Co. USD 4.650% 01/10/2024 766,024 0.23425,000 Huntington National Bank USD 3.125% 01/04/2022 439,973 0.13825,000 Huntington National Bank USD 1.800% 03/02/2023 848,034 0.25300,000 Infor, Inc. 144A(d) USD 1.450% 15/07/2023 304,932 0.09
1,550,000 Intercontinental Exchange, Inc.(c) USD 0.903% 15/06/2023 1,555,781 0.46
Goldman Sachs Funds—US Dollar Short Duration Bond PortfolioSchedule of InvestmentsAs at 30 November 2020
The accompanying notes are an integral part of these financial statements.
370

Holdings Security Description Currency Interest Rate(a) Maturity Date(b)Market Value
USD
% ofShareholders’
Equity
Bonds – (Continued)United States – (Continued)
275,000 Intuit, Inc. USD 0.650% 15/07/2023 276,925 0.08300,000 Intuit, Inc. USD 0.950% 15/07/2025 303,486 0.09650,000 JPMorgan Chase & Co.(c) USD 0.843% 18/06/2022 651,781 0.19
1,150,000 JPMorgan Chase & Co.(c) USD 3.514% 18/06/2022 1,170,125 0.351,900,000 JPMorgan Chase & Co.(c) USD 3.207% 01/04/2023 1,970,908 0.59800,000 JPMorgan Chase & Co.(c) USD 1.514% 01/06/2024 818,960 0.24
1,175,000 JPMorgan Chase & Co.(c) USD 0.653% 16/09/2024 1,178,842 0.351,000,000 Keurig Dr Pepper, Inc. USD 3.551% 25/05/2021 1,015,240 0.30575,000 Keurig Dr Pepper, Inc. USD 4.057% 25/05/2023 623,553 0.19575,000 KeyBank NA USD 3.300% 01/02/2022 595,154 0.18975,000 Kinder Morgan, Inc. 144A(d) USD 5.625% 15/11/2023 1,100,473 0.33625,000 Metropolitan Life Global Funding I �I� 144A(d) USD 1.950% 13/01/2023 645,531 0.19450,000 Metropolitan Life Global Funding I �I� 144A(d) USD 0.900% 08/06/2023 455,985 0.14450,000 Morgan Stanley—Series I(c) USD 0.864% 21/10/2025 452,210 0.13675,000 MPLX LP(c) USD 1.342% 09/09/2022 675,932 0.20250,000 MPLX LP USD 3.500% 01/12/2022 262,610 0.08800,000 MPLX LP USD 3.375% 15/03/2023 844,568 0.25700,000 MUFG Union Bank NA USD 3.150% 01/04/2022 724,913 0.22900,000 MUFG Union Bank NA USD 2.100% 09/12/2022 929,916 0.28750,000 NRG Energy, Inc. 144A(d) USD 3.750% 15/06/2024 807,457 0.24475,000 Nutrition & Biosciences, Inc. 144A(d) USD 0.697% 15/09/2022 476,634 0.14625,000 Pacific Life Global Funding II 144A(d) USD 0.500% 23/09/2023 625,956 0.19475,000 Protective Life Global Funding 144A(d) USD 1.082% 09/06/2023 482,553 0.14375,000 Protective Life Global Funding 144A(d) USD 0.631% 13/10/2023 378,116 0.11
1,025,000 Reliance Standard Life Global Funding II 144A(d) USD 2.625% 22/07/2022 1,054,530 0.311,040,000 School District of Philadelphia �D� USD 4.000% 30/06/2021 1,062,856 0.32800,000 State Board of Administration Finance Corp. USD 2.638% 01/07/2021 810,525 0.24
4,920,000 State of Texas USD 4.000% 26/08/2021 5,058,183 1.51474,000 Time Warner Cable LLC USD 4.000% 01/09/2021 482,101 0.14
2,775,000 T-Mobile USA, Inc. 144A(d) USD 3.500% 15/04/2025 3,063,600 0.91200,000 Truist Bank(c) USD 0.804% 02/08/2022 200,952 0.06
1,575,000 Truist Bank USD 1.250% 09/03/2023 1,605,854 0.48225,000 Truist Financial Corp. USD 3.200% 03/09/2021 229,448 0.07
4,119,679 United States Treasury Inflation Indexed Bonds USD 0.125% 15/07/2022 4,224,424 1.261,065,769 Utah State Board of Regents �A�(c) USD 0.900% 26/12/2031 1,062,597 0.32600,000 Vistra Operations Co., LLC 144A(d) USD 3.550% 15/07/2024 645,798 0.19
1,200,000 Volkswagen Group of America Finance LLC 144A(d) USD 0.750% 23/11/2022 1,202,400 0.36300,000 Xcel Energy, Inc. USD 0.500% 15/10/2023 300,639 0.09
114,225,445 34.00
TOTAL BONDS(cost USD 136,737,076) 138,875,412 41.33
Agencies Asset Backed Obligations – 27.21%United States
1,224,777 Federal Home Loan Mortgage Corp. (FHLMC) USD 3.000% 15/06/2041 1,320,582 0.3924,186 Federal Home Loan Mortgage Corp. (FHLMC) USD 2.000% 15/07/2041 24,731 0.01
1,362,490 Federal Home Loan Mortgage Corp. (FHLMC) USD 3.500% 15/11/2042 1,375,600 0.41360,055 Federal Home Loan Mortgage Corp. (FHLMC) USD 3.000% 15/03/2044 385,545 0.11191,092 Federal Home Loan Mortgage Corp. (FHLMC) USD 3.000% 15/08/2046 204,492 0.06190,125 Federal Home Loan Mortgage Corp. (FHLMC) USD 3.000% 15/08/2046 203,241 0.06138,353 Federal Home Loan Mortgage Corp. (FHLMC) USD 5.000% 01/05/2048 153,403 0.05722,631 Federal Home Loan Mortgage Corp. (FHLMC) USD 4.500% 01/10/2048 810,972 0.24
4,907,174 Federal Home Loan Mortgage Corp. (FHLMC) USD 4.500% 01/11/2048 5,404,328 1.6184,750 Federal Home Loan Mortgage Corp. (FHLMC) USD 5.000% 01/07/2049 93,942 0.03
1,717,936 Federal Home Loan Mortgage Corp. (FHLMC) USD 4.000% 15/05/2050 1,886,189 0.561,812,248 Federal Home Loan Mortgage Corp. (FHLMC) USD 4.000% 15/08/2054 1,965,686 0.581,672,302 Federal Home Loan Mortgage Corp. (FHLMC) USD 4.000% 15/11/2054 1,810,550 0.54626,446 Federal National Mortgage Association (FNMA) USD 5.000% 01/07/2024 691,326 0.21961,133 Federal National Mortgage Association (FNMA) USD 5.000% 01/08/2033 1,106,252 0.33311,020 Federal National Mortgage Association (FNMA) USD 5.000% 01/07/2035 360,956 0.1192,932 Federal National Mortgage Association (FNMA) USD 5.000% 01/05/2038 107,659 0.0381,885 Federal National Mortgage Association (FNMA) USD 2.500% 25/04/2043 85,323 0.03172,105 Federal National Mortgage Association (FNMA)(c) USD 0.550% 25/09/2046 173,574 0.05
8,822,535 Federal National Mortgage Association (FNMA) USD 4.500% 01/05/2048 9,586,780 2.85609,293 Federal National Mortgage Association (FNMA) USD 5.000% 01/05/2048 675,569 0.20
1,953,993 Federal National Mortgage Association (FNMA) USD 4.500% 01/07/2048 2,151,345 0.642,069,278 Federal National Mortgage Association (FNMA) USD 4.500% 01/08/2048 2,278,273 0.682,398,605 Federal National Mortgage Association (FNMA) USD 4.500% 01/10/2048 2,691,832 0.801,402,831 Federal National Mortgage Association (FNMA) USD 5.000% 01/02/2049 1,552,295 0.46171,426 Federal National Mortgage Association (FNMA) USD 5.000% 01/03/2049 191,466 0.06
Goldman Sachs Funds—US Dollar Short Duration Bond PortfolioSchedule of InvestmentsAs at 30 November 2020
The accompanying notes are an integral part of these financial statements.
371

Holdings Security Description Currency Interest Rate(a) Maturity Date(b)Market Value
USD
% ofShareholders’
Equity
Agencies Asset Backed Obligations – (Continued)United States – (Continued)
5,177,476 Federal National Mortgage Association (FNMA) USD 4.500% 01/06/2049 5,609,791 1.67783,771 Federal National Mortgage Association (FNMA) USD 5.000% 01/10/2049 866,087 0.26
1,000,000 Federal National Mortgage Association (FNMA) USD 3.500% 14/12/2050 1,055,078 0.312,000,000 Federal National Mortgage Association (FNMA) TBA(h) USD 4.000% 14/12/2050 2,134,141 0.6312,000,000 Federal National Mortgage Association (FNMA) TBA(h) USD 5.000% 14/12/2050 13,276,875 3.951,607,152 Government National Mortgage Association (GNMA) USD 4.500% 20/08/2047 1,753,866 0.521,200,097 Government National Mortgage Association (GNMA) USD 5.000% 20/06/2048 1,321,085 0.39119,195 Government National Mortgage Association (GNMA) USD 5.000% 20/08/2048 131,175 0.04
1,453,213 Government National Mortgage Association (GNMA) USD 4.500% 20/09/2048 1,575,883 0.47563,199 Government National Mortgage Association (GNMA) USD 3.500% 20/10/2048 581,250 0.17420,462 Government National Mortgage Association (GNMA) USD 5.000% 20/11/2048 462,063 0.14
3,387,504 Government National Mortgage Association (GNMA) USD 4.000% 20/12/2048 3,720,743 1.112,519,112 Government National Mortgage Association (GNMA) USD 4.500% 20/12/2048 2,727,624 0.812,657,640 Government National Mortgage Association (GNMA) USD 5.000% 20/12/2048 2,906,011 0.86145,850 Government National Mortgage Association (GNMA) USD 4.500% 20/01/2049 157,602 0.05648,778 Government National Mortgage Association (GNMA) USD 5.000% 20/01/2049 710,794 0.21
2,067,904 Government National Mortgage Association (GNMA) USD 4.500% 20/03/2049 2,238,423 0.673,726,829 Government National Mortgage Association (GNMA) USD 5.000% 20/04/2049 4,084,498 1.224,076,751 Government National Mortgage Association (GNMA) USD 5.000% 20/12/2049 4,455,661 1.33999,901 Government National Mortgage Association (GNMA) USD 4.500% 20/03/2050 1,070,635 0.32
3,000,000 Government National Mortgage Association (GNMA) TBA(h) USD 5.000% 21/12/2050 3,279,844 0.98
91,411,040 27.21
TOTAL AGENCIES ASSET BACKED OBLIGATIONS(cost USD 89,663,435) 91,411,040 27.21
Non-Agencies Asset Backed Obligations – 2.83%Cayman Islands
1,500,000 Cedar Funding II CLO Ltd. 144A(c)(d) USD 1.472% 09/06/2030 1,500,573 0.451,000,000 Madison Park Funding XXX Ltd. 144A(c)(d) USD 0.987% 15/04/2029 991,872 0.29800,000 Marble Point CLO XIV Ltd. 2018-2A �A1� 144A(c)(d) USD 1.548% 20/01/2032 798,571 0.24153,344 OCP CLO Ltd. 2015-8A �A1R� 144A(c)(d) USD 1.068% 17/04/2027 153,325 0.05100,196 Trinitas CLO II Ltd. 2014-2A �A1R� 144A(c)(d) USD 1.417% 15/07/2026 100,196 0.03730,000 Tryon Park CLO Ltd. 144A(c)(d) USD 1.127% 15/04/2029 724,207 0.21
4,268,744 1.27
United Kingdom1,040,825 Stratton Mortgage Funding 2019-1 Plc.(c) GBP 1.254% 25/05/2051 1,395,060 0.42
1,395,060 0.42
United States15,689 Brazos Higher Education Authority, Inc. 2005-2 �A12�(c) USD 0.385% 27/03/2023 15,719 0.0037,053 Educational Funding of the South, Inc. 2011-1 �A2�(c) USD 0.865% 25/04/2035 36,910 0.01
2,050,000 GMF Floorplan Owner Revolving Trust 2018-4 �A1� 144A(d) USD 3.500% 15/09/2023 2,104,255 0.63109,256 Illinois Student Assistance Commission 2010-1 �A3�(c) USD 1.115% 25/07/2045 108,810 0.0317,934 Massachusetts Educational Financing Authority 2008-1 �A1�(c) USD 1.165% 25/04/2038 17,936 0.01124,278 Missouri Higher Education Loan Authority 2010-2 �A1�(c) USD 1.057% 27/08/2029 124,011 0.04262,358 Navient Student Loan Trust 2017-4A �A2� 144A(c)(d) USD 0.650% 27/09/2066 262,326 0.08855,618 Nelnet Student Loan Trust 2012-3A �A� 144A(c)(d) USD 0.850% 25/02/2045 847,037 0.25274,963 Pennsylvania Higher Education Assistance Agency 2006-1 �A3�(c) USD 0.355% 25/10/2035 267,263 0.0850,219 SLM Student Loan Trust 2007-7 �A4�(c) USD 0.545% 25/01/2022 49,639 0.0110,523 South Texas Higher Education Authority, Inc. 2012-1 �A2�(c) USD 1.075% 01/10/2024 10,555 0.00
3,844,461 1.14
TOTAL NON-AGENCIES ASSET BACKED OBLIGATIONS(cost USD 9,426,704) 9,508,265 2.83
TOTAL TRANSFERABLE SECURITIES DEALT IN ANOTHER REGULATED MARKET(cost USD 235,827,215) 239,794,717 71.37
Other Transferable Securities
Bonds – 5.00%Japan1,750,000,000 Japan Treasury Discount Bill—Series 953 JPY (0.109%) 01/03/2021 16,790,298 5.00
TOTAL BONDS(cost USD 16,721,057) 16,790,298 5.00
TOTAL OTHER TRANSFERABLE SECURITIES(cost USD 16,721,057) 16,790,298 5.00
Goldman Sachs Funds—US Dollar Short Duration Bond PortfolioSchedule of InvestmentsAs at 30 November 2020
The accompanying notes are an integral part of these financial statements.
372

Holdings Security Description Currency Interest Rate(a) Maturity Date(b)Market Value
USD
% ofShareholders’
Equity
Commercial Papers – 0.59%
United Kingdom975,000 NatWest Markets Plc. USD 0.000% 01/02/2021 974,647 0.29
United States1,000,000 Intercontinental Exchange, Inc. USD 0.000% 23/09/2021 995,336 0.30
TOTAL COMMERCIAL PAPERS(cost USD 1,967,942) 1,969,983 0.59
MARKET VALUE OF INVESTMENTS EXCLUDING DERIVATIVES(cost USD 347,600,655) 353,853,977 105.32
Futures Contracts – (0.01%)
Number ofContracts Security Description
CommitmentMarket Value
USD
UnrealisedGainUSD
% ofShareholders’
Equity
USD601 US Treasury Notes 2YR Futures 31/03/2021 Long 132,717,704 36,424 0.015 US Treasury Ultra Long Notes 10YR Futures 22/03/2021 Long 785,000 924 0.00
133,502,704 37,348 0.01
UNREALISED GAIN ON FUTURES CONTRACTS 37,348 0.01
Number ofContracts Security Description
CommitmentMarket Value
USD
UnrealisedLossUSD
% ofShareholders’
Equity
AUD13 Australian Treasury Bonds 10YR Futures 15/12/2020 Long 1,426,606 (2,658) (0.00)
EUR(7) German Federal Republic Bonds 10YR Futures 08/12/2020 Short (1,472,304) (14,526) (0.01)
USD(23) US Treasury Notes 10YR Futures 22/03/2021 Short (3,176,516) (3,117) (0.00)(386) US Treasury Notes 5YR Futures 31/03/2021 Short (48,632,984) (42,574) (0.01)
(51,809,500) (45,691) (0.01)
UNREALISED LOSS ON FUTURES CONTRACTS (62,875) (0.02)
Forward Currency Contracts – (0.03%)
CurrencyAmountBought Currency
AmountSold
MaturityDate
UnrealisedGainUSD
% ofShareholders’
Equity
EUR 955,792 USD 1,130,566 21/01/2021 17,702 0.01
UNREALISED GAIN ON FORWARD CURRENCY CONTRACTS 17,702 0.01
CurrencyAmountBought Currency
AmountSold
MaturityDate
UnrealisedLossUSD
% ofShareholders’
Equity
USD 1,366,213 GBP 1,062,465 13/01/2021 (55,537) (0.02)USD 765,202 EUR 646,909 21/01/2021 (11,981) (0.00)USD 16,754,906 JPY 1,750,463,750 01/03/2021 (60,604) (0.02)
UNREALISED LOSS ON FORWARD CURRENCY CONTRACTS (128,122) (0.04)
Goldman Sachs Funds—US Dollar Short Duration Bond PortfolioSchedule of InvestmentsAs at 30 November 2020
The accompanying notes are an integral part of these financial statements.
373

Swap Contracts – 0.02%Net LocalNotionalAmount Pay Receive Currency Maturity Date
UnrealisedGainUSD
% ofShareholders’
Equity
Credit Default Swaps8,750,000 Floating (The Markit CDX North America
Investment Grade 34 Index)Fixed 1.000% USD 20/06/2025 57,615 0.02
UNREALISED GAIN ON CREDIT DEFAULT SWAPS 57,615 0.02
TOTAL UNREALISED GAIN ON SWAP CONTRACTS 57,615 0.02
MARKET VALUE OF INVESTMENTS(cost USD 347,600,655)
353,775,645 105.30
OTHER ASSETS AND LIABILITIES (17,809,094) (5.30)
SHAREHOLDERS’ EQUITY 335,966,551 100.00
TOTAL INVESTMENTSMarket Value
USD
% ofShareholders’
Equity
Total Investments excluding derivatives (cost USD 347,600,655) 353,853,977 105.32Unrealised gain on futures contracts 37,348 0.01Unrealised loss on futures contracts (62,875) (0.02)Unrealised gain on forward currency contracts 17,702 0.01Unrealised loss on forward currency contracts (128,122) (0.04)Unrealised gain on swap contracts 57,615 0.02Other Assets and Liabilities (17,809,094) (5.30)
Shareholders’ Equity 335,966,551 100.00
The Futures Commission Merchant was Credit Suisse Securities (USA) LLC.
The counterparties for forward currency contracts were Barclays Bank Plc., BNP Paribas S.A. and State Street Bank & Trust.
The counterparty for swap contracts was Credit Suisse.
The maximum individual counterparty exposure as at 30 November 2020 is 0.02% of the NAV.
(a) Interest rates represent either the stated coupon rate, annualised discounted yield on date of purchase for discounted securities, or, for floating rate securities, the current reset ratewhich is based upon interest rates indices.
(b) Maturity dates represent either the stated date on the security, or the next interest reset date for floating rate securities or the prerefunded date for those type of securities.(c) Variable and floating coupon rates are those quoted as of 30 November 2020.(d) 144A: This security is issued to qualified institutional investors, pursuant to private placements, and is transferable as stated in rule 144A of the US Securities Act of 1933.(e) This security has a step up coupon which moves to the second rate at a set date in the future.(f) A related party to Goldman Sachs Funds.(g) The yield for this fund as at 30 November 2020 was 0.171%.(h) TBA (To Be Announced) Securities are purchased on a forward commitment basis with an approximate (generally +/-2.5%) principal amount and no defined maturity date. The actual
principal amount and maturity date will be determined upon settlement when the specific mortgage pools are assigned.
Goldman Sachs Funds—US Dollar Short Duration Bond PortfolioSchedule of InvestmentsAs at 30 November 2020
The accompanying notes are an integral part of these financial statements.
374

Holdings Security Description Currency Interest Rate(a) Maturity Date(b)Market Value
USD
% ofShareholders’
Equity
Transferable securities admitted to an official exchange listing
Bonds – 40.45%Bermuda
150,000 IHS Markit Ltd. USD 3.625% 01/05/2024 161,404 0.11125,000 IHS Markit Ltd. USD 4.250% 01/05/2029 147,729 0.11
309,133 0.22
British Virgin Islands430,000 Bluestar Finance Holdings Ltd.(c) USD 3.875% Perp. 425,834 0.30200,000 Huarong Finance 2019 Co., Ltd. USD 3.750% 29/05/2024 209,750 0.15
635,584 0.45
Canada25,000 Canadian Pacific Railway Co. USD 2.050% 05/03/2030 26,180 0.0275,000 Suncor Energy, Inc. USD 2.800% 15/05/2023 78,917 0.05125,000 Suncor Energy, Inc. USD 3.100% 15/05/2025 135,792 0.10
240,889 0.17
Colombia200,000 Colombia Government International Bond USD 4.125% 15/05/2051 219,450 0.16
Croatia100,000 Croatia Government International Bond EUR 1.500% 17/06/2031 129,401 0.09
Indonesia100,000 Indonesia Government International Bond EUR 2.150% 18/07/2024 127,546 0.09
Ireland200,000 AerCap Ireland Capital DAC Via AerCap Global Aviation Trust USD 3.950% 01/02/2022 205,468 0.15175,000 AerCap Ireland Capital DAC Via AerCap Global Aviation Trust USD 4.875% 16/01/2024 188,562 0.13250,000 GE Capital International Funding Co. Unlimited Co. USD 3.373% 15/11/2025 274,080 0.19
668,110 0.47
Japan114,186,843 Japan Government Bond—Series 24 JPY 0.100% 10/03/2029 1,099,230 0.78
200,000 Mitsubishi UFJ Financial Group, Inc. USD 3.751% 18/07/2039 240,506 0.17
1,339,736 0.95
Luxembourg125,000 DH Europe Finance II SARL USD 2.200% 15/11/2024 132,468 0.1050,000 DH Europe Finance II SARL USD 2.600% 15/11/2029 55,100 0.04100,000 DH Europe Finance II SARL USD 3.250% 15/11/2039 115,506 0.08
303,074 0.22
Mexico200,000 Mexico City Airport Trust USD 3.875% 30/04/2028 192,875 0.14200,000 Mexico Government International Bond USD 3.250% 16/04/2030 213,050 0.15200,000 Mexico Government International Bond USD 2.659% 24/05/2031 200,700 0.14200,000 Mexico Government International Bond USD 3.771% 24/05/2061 199,500 0.14
806,125 0.57
Peru10,000 Peruvian Government International Bond USD 2.783% 23/01/2031 10,808 0.0160,000 Peruvian Government International Bond USD 2.780% 01/12/2060 59,250 0.0440,000 Peruvian Government International Bond USD 3.230% 28/07/2121 39,520 0.03
109,578 0.08
Qatar200,000 Qatar Government International Bond USD 4.500% 23/04/2028 242,500 0.17
Romania70,000 Romanian Government International Bond EUR 2.000% 28/01/2032 87,475 0.06
Spain200,000 Banco Santander S.A. USD 2.746% 28/05/2025 212,806 0.15200,000 Banco Santander S.A. USD 3.306% 27/06/2029 223,514 0.16150,000 Telefonica Emisiones S.A. USD 4.665% 06/03/2038 180,626 0.13
616,946 0.44
Supranationals1,540,000 African Development Bank USD 2.625% 22/03/2021 1,551,565 1.10
Goldman Sachs Funds—US Fixed Income PortfolioSchedule of InvestmentsAs at 30 November 2020
The accompanying notes are an integral part of these financial statements.
375

Holdings Security Description Currency Interest Rate(a) Maturity Date(b)Market Value
USD
% ofShareholders’
Equity
Bonds – (Continued)Switzerland
250,000 Credit Suisse Group Funding Guernsey Ltd. USD 4.550% 17/04/2026 293,013 0.21
United Arab Emirates270,000 Abu Dhabi Crude Oil Pipeline LLC USD 4.600% 02/11/2047 335,433 0.24210,000 Abu Dhabi Government International Bond USD 3.125% 11/10/2027 235,725 0.16210,000 Abu Dhabi Government International Bond USD 4.125% 11/10/2047 267,225 0.19
838,383 0.59
United Kingdom250,000 Barclays Plc.(c) USD 4.610% 15/02/2023 261,632 0.18225,000 Barclays Plc.(c) USD 2.852% 07/05/2026 239,065 0.17200,000 Gazprom PJSC Via Gaz Finance Plc. USD 3.250% 25/02/2030 206,188 0.15225,000 HSBC Holdings Plc.(c) USD 3.803% 11/03/2025 244,514 0.17325,000 HSBC Holdings Plc.(c) USD 1.645% 18/04/2026 329,810 0.23200,000 Natwest Group Plc.(c) USD 3.498% 15/05/2023 208,126 0.15200,000 Natwest Group Plc.(c) USD 4.269% 22/03/2025 219,912 0.16250,000 Natwest Group Plc.(c) USD 3.754% 01/11/2029 265,000 0.19200,000 Santander UK Plc. USD 2.875% 18/06/2024 214,594 0.15
2,188,841 1.55
United States200,000 AbbVie, Inc. USD 3.375% 14/11/2021 205,764 0.15150,000 AbbVie, Inc. USD 3.750% 14/11/2023 163,938 0.12900,000 AbbVie, Inc. USD 3.200% 14/05/2026 1,003,167 0.71175,000 AbbVie, Inc. USD 4.300% 14/05/2036 216,158 0.15100,000 AbbVie, Inc. USD 4.700% 14/05/2045 129,895 0.0925,000 Agree LP USD 2.900% 01/10/2030 26,246 0.02150,000 Air Lease Corp. USD 2.300% 01/02/2025 152,499 0.11125,000 Air Lease Corp. USD 3.375% 01/07/2025 132,422 0.09125,000 Air Lease Corp. USD 2.875% 15/01/2026 129,312 0.09125,000 Air Lease Corp. USD 3.750% 01/06/2026 134,625 0.1050,000 Air Products & Chemicals, Inc. USD 2.050% 15/05/2030 53,245 0.0450,000 Alexandria Real Estate Equities, Inc. USD 3.800% 15/04/2026 57,458 0.0475,000 Alexandria Real Estate Equities, Inc. USD 3.375% 15/08/2031 85,939 0.0675,000 Ally Financial, Inc. USD 1.450% 02/10/2023 76,426 0.05150,000 Altria Group, Inc. USD 3.800% 14/02/2024 163,776 0.1225,000 Ameren Corp. USD 3.500% 15/01/2031 28,915 0.0275,000 American Campus Communities Operating Partnership LP USD 3.750% 15/04/2023 79,111 0.0625,000 American Campus Communities Operating Partnership LP USD 3.875% 30/01/2031 27,896 0.0250,000 American Express Co. USD 3.700% 05/11/2021 51,434 0.0440,000 American Express Co. USD 2.500% 01/08/2022 41,365 0.0340,000 American Express Co. USD 2.500% 30/07/2024 42,648 0.0325,000 American Homes 4 Rent LP USD 4.900% 15/02/2029 30,301 0.0250,000 American International Group, Inc. USD 4.875% 01/06/2022 53,311 0.0425,000 American International Group, Inc. USD 4.125% 15/02/2024 27,810 0.02150,000 American International Group, Inc. USD 3.900% 01/04/2026 171,433 0.12200,000 American International Group, Inc. USD 4.200% 01/04/2028 238,024 0.17150,000 American International Group, Inc. USD 3.400% 30/06/2030 170,974 0.12150,000 American Tower Corp. USD 3.375% 15/05/2024 162,855 0.12125,000 American Tower Corp. USD 2.400% 15/03/2025 132,889 0.09450,000 Anheuser-Busch Cos. LLC Via Anheuser-Busch InBev Worldwide, Inc. USD 4.900% 01/02/2046 588,339 0.4275,000 Anheuser-Busch InBev Finance, Inc. USD 4.700% 01/02/2036 94,086 0.07150,000 Anheuser-Busch InBev Finance, Inc. USD 4.900% 01/02/2046 195,124 0.1450,000 Anheuser-Busch InBev Worldwide, Inc. USD 4.750% 23/01/2029 61,422 0.0425,000 Anheuser-Busch InBev Worldwide, Inc. USD 4.950% 15/01/2042 32,639 0.02200,000 Anheuser-Busch InBev Worldwide, Inc. USD 4.600% 15/04/2048 253,922 0.1825,000 Anheuser-Busch InBev Worldwide, Inc. USD 5.550% 23/01/2049 35,941 0.0375,000 Anheuser-Busch InBev Worldwide, Inc. USD 4.500% 01/06/2050 94,657 0.0725,000 Archer-Daniels-Midland Co. USD 3.250% 27/03/2030 29,050 0.0225,000 AT&T, Inc. USD 4.125% 17/02/2026 29,098 0.02325,000 AT&T, Inc. USD 4.250% 01/03/2027 380,942 0.27475,000 AT&T, Inc. USD 2.300% 01/06/2027 503,196 0.3625,000 AT&T, Inc. USD 1.650% 01/02/2028 25,383 0.02600,000 AT&T, Inc. USD 4.350% 01/03/2029 715,278 0.51125,000 AT&T, Inc. USD 2.750% 01/06/2031 132,771 0.0990,000 AT&T, Inc. USD 4.900% 15/08/2037 112,600 0.0850,000 AT&T, Inc. USD 4.850% 01/03/2039 62,835 0.04100,000 AT&T, Inc. USD 3.500% 01/06/2041 107,752 0.0875,000 AutoNation, Inc. USD 4.750% 01/06/2030 90,363 0.0675,000 Avangrid, Inc. USD 3.200% 15/04/2025 82,214 0.06100,000 Bank of America Corp. USD 4.200% 26/08/2024 112,025 0.08
Goldman Sachs Funds—US Fixed Income PortfolioSchedule of InvestmentsAs at 30 November 2020
The accompanying notes are an integral part of these financial statements.
376

Holdings Security Description Currency Interest Rate(a) Maturity Date(b)Market Value
USD
% ofShareholders’
Equity
Bonds – (Continued)United States – (Continued)
400,000 Bank of America Corp.—Series L USD 4.183% 25/11/2027 461,900 0.33175,000 BAT Capital Corp. USD 2.259% 25/03/2028 180,390 0.1325,000 BAT Capital Corp. USD 4.758% 06/09/2049 28,951 0.02225,000 Becton Dickinson and Co. USD 2.894% 06/06/2022 232,605 0.16125,000 Becton Dickinson and Co. USD 3.363% 06/06/2024 135,096 0.10165,000 Becton Dickinson and Co. USD 3.700% 06/06/2027 189,682 0.13175,000 Becton Dickinson and Co. USD 2.823% 20/05/2030 191,404 0.14150,000 Berkshire Hathaway Finance Corp. USD 1.850% 12/03/2030 157,536 0.11175,000 Boeing Co. USD 3.450% 01/11/2028 181,573 0.13175,000 Boeing Co. USD 5.805% 01/05/2050 231,163 0.1625,000 Boston Properties LP USD 4.125% 15/05/2021 25,192 0.02100,000 BP Capital Markets America, Inc. USD 3.224% 14/04/2024 107,800 0.0825,000 BP Capital Markets America, Inc. USD 4.234% 06/11/2028 29,739 0.02200,000 Bristol-Myers Squibb Co. USD 3.250% 01/08/2042 233,422 0.1775,000 Burlington Northern Santa Fe LLC USD 4.050% 15/06/2048 100,049 0.0795,000 Capital One Financial Corp. USD 3.300% 30/10/2024 103,470 0.07125,000 CenterPoint Energy, Inc. USD 3.600% 01/11/2021 128,715 0.0950,000 CenterPoint Energy, Inc. USD 2.950% 01/03/2030 54,869 0.04275,000 Cigna Corp. USD 4.125% 15/11/2025 316,148 0.22125,000 Cigna Corp. USD 2.400% 15/03/2030 132,895 0.09275,000 Cigna Corp. USD 3.400% 15/03/2050 310,425 0.22200,000 Citigroup, Inc. USD 4.600% 09/03/2026 233,564 0.17150,000 Citigroup, Inc. USD 3.400% 01/05/2026 167,887 0.12675,000 Citigroup, Inc. USD 4.450% 29/09/2027 793,287 0.56100,000 Citigroup, Inc. USD 4.125% 25/07/2028 116,730 0.08100,000 Constellation Brands, Inc. USD 4.400% 15/11/2025 116,370 0.0850,000 Constellation Brands, Inc. USD 3.700% 06/12/2026 57,193 0.0475,000 Constellation Brands, Inc. USD 3.150% 01/08/2029 83,443 0.0661,000 Continental Resources, Inc. USD 4.500% 15/04/2023 62,682 0.04250,000 Crown Castle International Corp. USD 3.150% 15/07/2023 266,115 0.1925,000 Crown Castle International Corp. USD 3.300% 01/07/2030 27,962 0.0225,000 Crown Castle International Corp. USD 4.150% 01/07/2050 30,029 0.02200,000 CubeSmart LP USD 4.000% 15/11/2025 225,728 0.16425,000 CVS Health Corp. USD 3.500% 20/07/2022 444,104 0.3163,000 CVS Health Corp. USD 3.700% 09/03/2023 67,373 0.0545,000 CVS Health Corp. USD 2.625% 15/08/2024 48,126 0.03225,000 CVS Health Corp. USD 3.875% 20/07/2025 254,257 0.1850,000 CVS Health Corp. USD 4.780% 25/03/2038 63,470 0.0425,000 CVS Health Corp. USD 5.125% 20/07/2045 33,615 0.0225,000 CVS Health Corp. USD 4.250% 01/04/2050 31,426 0.0258,000 Devon Energy Corp. USD 5.850% 15/12/2025 66,767 0.05125,000 Discover Financial Services USD 3.750% 04/03/2025 137,361 0.10150,000 Dominion Energy, Inc.(d) USD 3.071% 15/08/2024 162,417 0.1150,000 Dominion Energy, Inc.—Series C USD 3.375% 01/04/2030 57,287 0.0479,000 DTE Energy Co. USD 2.250% 01/11/2022 81,825 0.0675,000 Duke Realty LP USD 1.750% 01/07/2030 75,617 0.0575,000 DuPont de Nemours, Inc. USD 4.205% 15/11/2023 82,636 0.0675,000 DuPont de Nemours, Inc. USD 4.493% 15/11/2025 87,538 0.0625,000 DuPont de Nemours, Inc. USD 5.419% 15/11/2048 36,002 0.0340,000 Ecolab, Inc. USD 3.950% 01/12/2047 51,966 0.04150,000 Elanco Animal Health, Inc. USD 4.912% 27/08/2021 153,845 0.11125,000 Energy Transfer Operating LP USD 4.650% 01/06/2021 126,239 0.09125,000 Energy Transfer Operating LP USD 2.900% 15/05/2025 129,494 0.09125,000 Energy Transfer Operating LP USD 5.250% 15/04/2029 141,465 0.1050,000 Energy Transfer Operating LP USD 5.300% 15/04/2047 52,635 0.04100,000 Entergy Corp. USD 2.950% 01/09/2026 110,522 0.0825,000 EQM Midstream Partners LP USD 4.750% 15/07/2023 25,575 0.0250,000 EQM Midstream Partners LP USD 5.500% 15/07/2028 53,375 0.0475,000 Essex Portfolio LP USD 3.000% 15/01/2030 81,956 0.06150,000 FedEx Corp. USD 5.250% 15/05/2050 213,355 0.15175,000 FirstEnergy Corp. USD 2.650% 01/03/2030 173,339 0.1275,000 FirstEnergy Corp.—Series B USD 2.250% 01/09/2030 71,885 0.0525,000 General Electric Co. USD 2.700% 09/10/2022 25,984 0.0275,000 General Electric Co. USD 3.100% 09/01/2023 78,863 0.0625,000 General Electric Co. USD 3.450% 01/05/2027 27,462 0.0250,000 General Electric Co. USD 3.625% 01/05/2030 56,033 0.04100,000 General Electric Co. USD 5.875% 14/01/2038 128,998 0.0950,000 General Electric Co. USD 4.250% 01/05/2040 56,760 0.04125,000 General Electric Co. USD 4.350% 01/05/2050 146,597 0.10125,000 General Motors Co. USD 5.400% 02/10/2023 140,127 0.1025,000 General Motors Co. USD 4.000% 01/04/2025 27,588 0.02
Goldman Sachs Funds—US Fixed Income PortfolioSchedule of InvestmentsAs at 30 November 2020
The accompanying notes are an integral part of these financial statements.
377

Holdings Security Description Currency Interest Rate(a) Maturity Date(b)Market Value
USD
% ofShareholders’
Equity
Bonds – (Continued)United States – (Continued)
50,000 General Motors Financial Co., Inc. USD 4.300% 13/07/2025 55,822 0.0425,000 General Motors Financial Co., Inc. USD 5.650% 17/01/2029 30,956 0.0250,000 Global Payments, Inc. USD 2.650% 15/02/2025 53,530 0.0425,000 Global Payments, Inc. USD 3.200% 15/08/2029 27,774 0.0250,000 Healthcare Realty Trust, Inc. USD 2.050% 15/03/2031 49,986 0.04325,000 Hewlett Packard Enterprise Co. USD 4.450% 02/10/2023 358,137 0.25225,000 Hewlett Packard Enterprise Co. USD 4.900% 15/10/2025 261,664 0.1960,000 Hewlett Packard Enterprise Co. USD 6.350% 15/10/2045 79,298 0.0650,000 Home Depot, Inc. USD 3.900% 06/12/2028 59,904 0.04100,000 Huntsman International LLC USD 5.125% 15/11/2022 106,750 0.08100,000 Intercontinental Exchange, Inc. USD 3.000% 15/06/2050 107,992 0.08175,000 ITC Holdings Corp. USD 3.350% 15/11/2027 195,401 0.1450,000 JM Smucker Co. USD 3.000% 15/03/2022 51,626 0.0450,000 JM Smucker Co. USD 2.375% 15/03/2030 52,575 0.04200,000 JPMorgan Chase & Co. USD 3.625% 01/12/2027 226,532 0.16100,000 JPMorgan Chase & Co.(c) USD 3.509% 23/01/2029 113,515 0.0875,000 Keysight Technologies, Inc. USD 3.000% 30/10/2029 82,699 0.06200,000 Kinder Morgan Energy Partners LP USD 3.450% 15/02/2023 210,830 0.15175,000 Lowe’s Cos., Inc. USD 1.700% 15/10/2030 176,291 0.12100,000 Lowe’s Cos., Inc. USD 3.000% 15/10/2050 107,466 0.08175,000 Marathon Petroleum Corp. USD 4.500% 01/05/2023 189,009 0.1350,000 Marathon Petroleum Corp. USD 3.625% 15/09/2024 53,798 0.04225,000 Marsh & McLennan Cos., Inc. USD 4.375% 15/03/2029 275,373 0.2025,000 McDonald’s Corp. USD 4.450% 01/09/2048 32,893 0.0225,000 McDonald’s Corp. USD 4.200% 01/04/2050 32,135 0.0275,000 Mid-America Apartments LP USD 1.700% 15/02/2031 74,746 0.05100,000 Morgan Stanley USD 4.875% 01/11/2022 108,131 0.08400,000 Morgan Stanley USD 3.700% 23/10/2024 445,072 0.3225,000 Morgan Stanley USD 4.000% 23/07/2025 28,599 0.0275,000 Morgan Stanley USD 3.950% 23/04/2027 86,263 0.06175,000 Morgan Stanley(c) USD 1.794% 13/02/2032 176,396 0.1250,000 Morgan Stanley—Series F USD 3.875% 29/04/2024 55,284 0.04150,000 MPLX LP USD 2.650% 15/08/2030 152,671 0.1150,000 MPLX LP USD 4.500% 15/04/2038 55,361 0.0450,000 MPLX LP USD 5.500% 15/02/2049 62,085 0.0470,000 National Retail Properties, Inc. USD 3.900% 15/06/2024 75,878 0.05150,000 National Retail Properties, Inc. USD 4.000% 15/11/2025 166,171 0.12200,000 Newfield Exploration Co. USD 5.625% 01/07/2024 213,426 0.15250,000 NiSource, Inc. USD 3.490% 15/05/2027 282,525 0.2025,000 NiSource, Inc. USD 3.600% 01/05/2030 28,967 0.02225,000 Occidental Petroleum Corp. USD 2.900% 15/08/2024 210,269 0.1575,000 Oracle Corp. USD 3.600% 01/04/2040 87,670 0.06100,000 Oracle Corp. USD 3.850% 01/04/2060 122,612 0.0975,000 Pacific Gas & Electric Co. USD 2.100% 01/08/2027 75,650 0.0575,000 Pacific Gas & Electric Co. USD 2.500% 01/02/2031 75,500 0.0525,000 Pacific Gas & Electric Co. USD 3.300% 01/08/2040 25,170 0.0250,000 Pacific Gas & Electric Co. USD 3.500% 01/08/2050 50,362 0.04200,000 PayPal Holdings, Inc. USD 2.650% 01/10/2026 218,544 0.1550,000 Pfizer, Inc. USD 2.625% 01/04/2030 55,625 0.04100,000 Phillips 66 USD 3.700% 06/04/2023 107,049 0.0825,000 Phillips 66 USD 3.850% 09/04/2025 27,922 0.0250,000 Phillips 66 USD 1.300% 15/02/2026 50,362 0.04375,000 Plains All American Pipeline LP Via PAA Finance Corp. USD 3.850% 15/10/2023 397,024 0.2850,000 Plains All American Pipeline LP Via PAA Finance Corp. USD 3.800% 15/09/2030 51,976 0.0475,000 Progress Energy, Inc. USD 7.000% 30/10/2031 106,786 0.0825,000 Raymond James Financial, Inc. USD 4.650% 01/04/2030 30,778 0.02100,000 Regency Centers LP USD 2.950% 15/09/2029 105,205 0.0733,000 Regions Financial Corp. USD 3.800% 14/08/2023 35,866 0.03125,000 Republic Services, Inc. USD 2.500% 15/08/2024 133,177 0.09175,000 Republic Services, Inc. USD 1.750% 15/02/2032 176,207 0.12250,000 ServiceNow, Inc. USD 1.400% 01/09/2030 243,517 0.174,000 Sherwin-Williams Co. USD 2.750% 01/06/2022 4,131 0.0075,000 Sherwin-Williams Co. USD 3.450% 01/06/2027 85,178 0.0675,000 Sherwin-Williams Co. USD 2.950% 15/08/2029 83,214 0.0682,000 Simon Property Group LP USD 2.750% 01/06/2023 86,281 0.0675,000 Southern California Edison Co.—Series A USD 4.200% 01/03/2029 87,690 0.06250,000 Southern Co. USD 3.250% 01/07/2026 279,987 0.20175,000 Spirit Realty LP USD 3.400% 15/01/2030 185,887 0.13125,000 Stanley Black & Decker, Inc. USD 4.250% 15/11/2028 152,315 0.11225,000 Stryker Corp. USD 1.950% 15/06/2030 232,436 0.1650,000 Sunoco Logistics Partners Operations LP USD 4.250% 01/04/2024 53,321 0.04
Goldman Sachs Funds—US Fixed Income PortfolioSchedule of InvestmentsAs at 30 November 2020
The accompanying notes are an integral part of these financial statements.
378
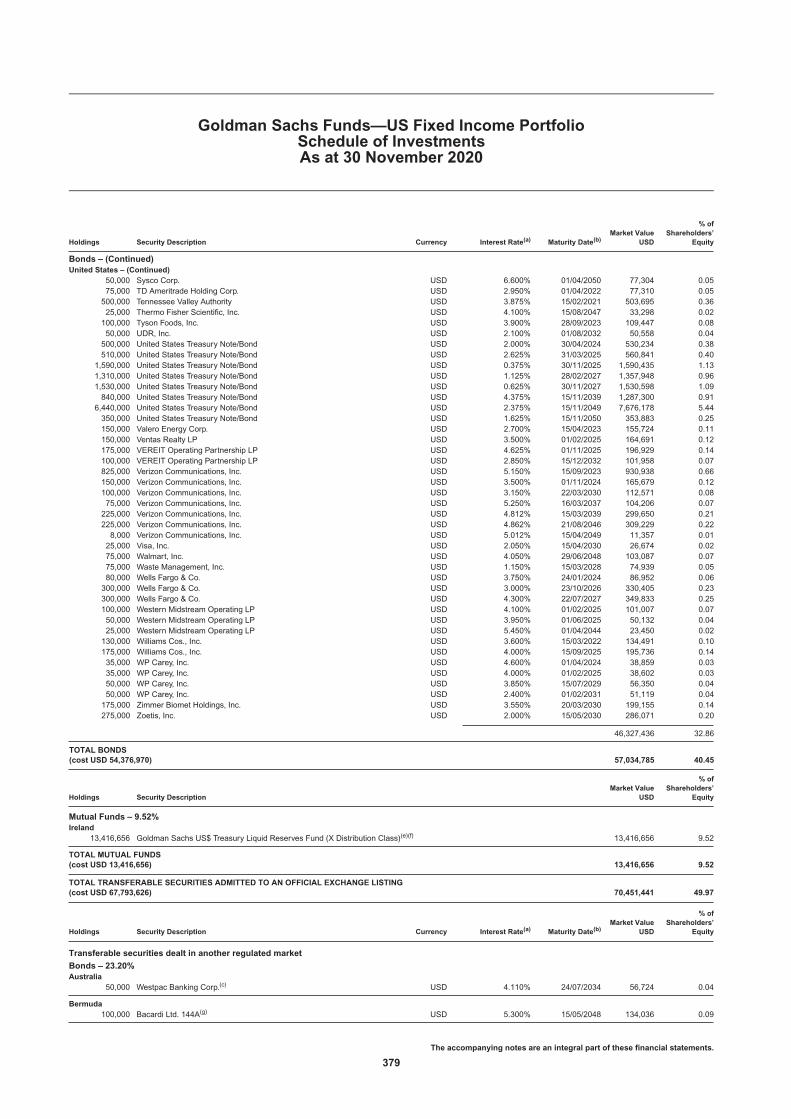
Holdings Security Description Currency Interest Rate(a) Maturity Date(b)Market Value
USD
% ofShareholders’
Equity
Bonds – (Continued)United States – (Continued)
50,000 Sysco Corp. USD 6.600% 01/04/2050 77,304 0.0575,000 TD Ameritrade Holding Corp. USD 2.950% 01/04/2022 77,310 0.05500,000 Tennessee Valley Authority USD 3.875% 15/02/2021 503,695 0.3625,000 Thermo Fisher Scientific, Inc. USD 4.100% 15/08/2047 33,298 0.02100,000 Tyson Foods, Inc. USD 3.900% 28/09/2023 109,447 0.0850,000 UDR, Inc. USD 2.100% 01/08/2032 50,558 0.04500,000 United States Treasury Note/Bond USD 2.000% 30/04/2024 530,234 0.38510,000 United States Treasury Note/Bond USD 2.625% 31/03/2025 560,841 0.40
1,590,000 United States Treasury Note/Bond USD 0.375% 30/11/2025 1,590,435 1.131,310,000 United States Treasury Note/Bond USD 1.125% 28/02/2027 1,357,948 0.961,530,000 United States Treasury Note/Bond USD 0.625% 30/11/2027 1,530,598 1.09840,000 United States Treasury Note/Bond USD 4.375% 15/11/2039 1,287,300 0.91
6,440,000 United States Treasury Note/Bond USD 2.375% 15/11/2049 7,676,178 5.44350,000 United States Treasury Note/Bond USD 1.625% 15/11/2050 353,883 0.25150,000 Valero Energy Corp. USD 2.700% 15/04/2023 155,724 0.11150,000 Ventas Realty LP USD 3.500% 01/02/2025 164,691 0.12175,000 VEREIT Operating Partnership LP USD 4.625% 01/11/2025 196,929 0.14100,000 VEREIT Operating Partnership LP USD 2.850% 15/12/2032 101,958 0.07825,000 Verizon Communications, Inc. USD 5.150% 15/09/2023 930,938 0.66150,000 Verizon Communications, Inc. USD 3.500% 01/11/2024 165,679 0.12100,000 Verizon Communications, Inc. USD 3.150% 22/03/2030 112,571 0.0875,000 Verizon Communications, Inc. USD 5.250% 16/03/2037 104,206 0.07225,000 Verizon Communications, Inc. USD 4.812% 15/03/2039 299,650 0.21225,000 Verizon Communications, Inc. USD 4.862% 21/08/2046 309,229 0.228,000 Verizon Communications, Inc. USD 5.012% 15/04/2049 11,357 0.0125,000 Visa, Inc. USD 2.050% 15/04/2030 26,674 0.0275,000 Walmart, Inc. USD 4.050% 29/06/2048 103,087 0.0775,000 Waste Management, Inc. USD 1.150% 15/03/2028 74,939 0.0580,000 Wells Fargo & Co. USD 3.750% 24/01/2024 86,952 0.06300,000 Wells Fargo & Co. USD 3.000% 23/10/2026 330,405 0.23300,000 Wells Fargo & Co. USD 4.300% 22/07/2027 349,833 0.25100,000 Western Midstream Operating LP USD 4.100% 01/02/2025 101,007 0.0750,000 Western Midstream Operating LP USD 3.950% 01/06/2025 50,132 0.0425,000 Western Midstream Operating LP USD 5.450% 01/04/2044 23,450 0.02130,000 Williams Cos., Inc. USD 3.600% 15/03/2022 134,491 0.10175,000 Williams Cos., Inc. USD 4.000% 15/09/2025 195,736 0.1435,000 WP Carey, Inc. USD 4.600% 01/04/2024 38,859 0.0335,000 WP Carey, Inc. USD 4.000% 01/02/2025 38,602 0.0350,000 WP Carey, Inc. USD 3.850% 15/07/2029 56,350 0.0450,000 WP Carey, Inc. USD 2.400% 01/02/2031 51,119 0.04175,000 Zimmer Biomet Holdings, Inc. USD 3.550% 20/03/2030 199,155 0.14275,000 Zoetis, Inc. USD 2.000% 15/05/2030 286,071 0.20
46,327,436 32.86
TOTAL BONDS(cost USD 54,376,970) 57,034,785 40.45
Holdings Security DescriptionMarket Value
USD
% ofShareholders’
Equity
Mutual Funds – 9.52%Ireland
13,416,656 Goldman Sachs US$ Treasury Liquid Reserves Fund (X Distribution Class)(e)(f) 13,416,656 9.52
TOTAL MUTUAL FUNDS(cost USD 13,416,656) 13,416,656 9.52
TOTAL TRANSFERABLE SECURITIES ADMITTED TO AN OFFICIAL EXCHANGE LISTING(cost USD 67,793,626) 70,451,441 49.97
Holdings Security Description Currency Interest Rate(a) Maturity Date(b)Market Value
USD
% ofShareholders’
Equity
Transferable securities dealt in another regulated market
Bonds – 23.20%Australia
50,000 Westpac Banking Corp.(c) USD 4.110% 24/07/2034 56,724 0.04
Bermuda100,000 Bacardi Ltd. 144A(g) USD 5.300% 15/05/2048 134,036 0.09
Goldman Sachs Funds—US Fixed Income PortfolioSchedule of InvestmentsAs at 30 November 2020
The accompanying notes are an integral part of these financial statements.
379

Holdings Security Description Currency Interest Rate(a) Maturity Date(b)Market Value
USD
% ofShareholders’
Equity
Bonds – (Continued)Canada
50,000 Teck Resources Ltd. USD 3.900% 15/07/2030 54,937 0.04
Cayman Islands175,000 Avolon Holdings Funding Ltd. 144A(g) USD 4.250% 15/04/2026 181,209 0.13250,000 XLIT Ltd. USD 4.450% 31/03/2025 284,442 0.20
465,651 0.33
France250,000 BNP Paribas S.A. 144A(g) USD 3.500% 01/03/2023 266,125 0.19200,000 BNP Paribas S.A. 144A(g) USD 3.375% 09/01/2025 218,204 0.16250,000 BPCE S.A. 144A(g) USD 4.000% 12/09/2023 272,325 0.19
756,654 0.54
Germany200,000 Deutsche Bank AG(c) USD 2.222% 18/09/2024 204,140 0.14150,000 Deutsche Bank AG(c) USD 2.129% 24/11/2026 151,687 0.11
355,827 0.25
Guernsey100,000 Amdocs Ltd. USD 2.538% 15/06/2030 104,336 0.07
Hong Kong200,000 AIA Group Ltd. 144A(g) USD 3.900% 06/04/2028 227,506 0.16
Japan205,000 Takeda Pharmaceutical Co., Ltd. USD 2.050% 31/03/2030 209,451 0.15
Netherlands300,000 ING Groep NV 144A(c)(g) USD 1.400% 01/07/2026 304,146 0.21290,000 Syngenta Finance NV 144A(g) USD 3.933% 23/04/2021 293,213 0.21
597,359 0.42
Supranationals275,000 Broadcom Corp. Via Broadcom Cayman Finance Ltd. USD 3.125% 15/01/2025 295,721 0.21475,000 Broadcom Corp. Via Broadcom Cayman Finance Ltd. USD 3.875% 15/01/2027 532,561 0.3875,000 NXP BV Via NXP Funding LLC Via NXP USA, Inc. 144A(g) USD 3.400% 01/05/2030 84,686 0.06
912,968 0.65
Switzerland250,000 Credit Suisse Group AG 144A(c)(g) USD 4.194% 01/04/2031 294,657 0.21
United Kingdom100,000 Royalty Pharma Plc. 144A(g) USD 1.200% 02/09/2025 100,694 0.07225,000 Vodafone Group Plc. USD 3.750% 16/01/2024 246,078 0.18
346,772 0.25
United States90,000 AbbVie, Inc. USD 2.300% 21/11/2022 93,222 0.07150,000 AbbVie, Inc. USD 4.050% 21/11/2039 182,017 0.13100,000 Adobe, Inc. USD 2.150% 01/02/2027 107,474 0.08125,000 Adobe, Inc. USD 2.300% 01/02/2030 136,167 0.1025,000 AEP Transmission Co., LLC—Series M USD 3.650% 01/04/2050 30,488 0.0225,000 AIG Global Funding 144A(g) USD 2.300% 01/07/2022 25,769 0.0275,000 Alliant Energy Finance LLC 144A(g) USD 3.750% 15/06/2023 80,809 0.0675,000 Amazon.com, Inc. USD 4.800% 05/12/2034 103,928 0.07150,000 Amazon.com, Inc. USD 3.875% 22/08/2037 189,768 0.1450,000 American Electric Power Co., Inc. USD 2.300% 01/03/2030 52,287 0.0475,000 American Express Co.—Series C(c) USD 3.535% Perp. 72,750 0.05175,000 Apple, Inc. USD 2.750% 13/01/2025 189,644 0.13250,000 Apple, Inc. USD 2.450% 04/08/2026 272,027 0.1975,000 Applied Materials, Inc. USD 1.750% 01/06/2030 78,026 0.06125,000 Arch Capital Finance LLC USD 4.011% 15/12/2026 145,410 0.10175,000 Bank of America Corp.(c) USD 3.864% 23/07/2024 189,873 0.14125,000 Bank of America Corp.(c) USD 3.593% 21/07/2028 141,480 0.10100,000 Bank of America Corp.(c) USD 2.884% 22/10/2030 109,262 0.0825,000 Bank of America Corp.(c) USD 2.496% 13/02/2031 26,431 0.02900,000 Bank of America Corp.(c) USD 2.592% 29/04/2031 959,211 0.68300,000 Bank of America Corp.(c) USD 1.898% 23/07/2031 302,091 0.21350,000 Bank of America Corp.(c) USD 1.922% 24/10/2031 353,580 0.25375,000 Bayer US Finance II LLC 144A(g) USD 3.875% 15/12/2023 409,477 0.29175,000 Berkshire Hathaway Energy Co. USD 3.250% 15/04/2028 198,910 0.14
Goldman Sachs Funds—US Fixed Income PortfolioSchedule of InvestmentsAs at 30 November 2020
The accompanying notes are an integral part of these financial statements.
380

Holdings Security Description Currency Interest Rate(a) Maturity Date(b)Market Value
USD
% ofShareholders’
Equity
Bonds – (Continued)United States – (Continued)
25,000 Boeing Co. USD 3.625% 01/03/2048 24,071 0.0250,000 Booking Holdings, Inc. USD 4.100% 13/04/2025 56,539 0.0425,000 Bristol-Myers Squibb Co. USD 4.250% 26/10/2049 33,973 0.02275,000 Broadcom, Inc. USD 4.700% 15/04/2025 314,674 0.22100,000 Broadcom, Inc. USD 4.250% 15/04/2026 113,965 0.08350,000 Carrier Global Corp. 144A(g) USD 2.493% 15/02/2027 373,023 0.26375,000 Carrier Global Corp. 144A(g) USD 2.722% 15/02/2030 399,870 0.28700,000 Charter Communications Operating LLC Via Charter Communications
Operating Capital USD 4.908% 23/07/2025 809,676 0.57200,000 Charter Communications Operating LLC Via Charter Communications
Operating Capital USD 5.375% 01/04/2038 252,074 0.18250,000 CIT Bank NA(c) USD 2.969% 27/09/2025 260,602 0.1925,000 Citigroup, Inc.(c) USD 3.668% 24/07/2028 28,348 0.0275,000 Citigroup, Inc.(c) USD 2.976% 05/11/2030 82,054 0.06200,000 City of San Francisco CA Public Utilities Commission Water Revenue �B� USD 6.000% 01/11/2040 280,111 0.20100,000 Comcast Corp. USD 3.700% 15/04/2024 110,219 0.08100,000 Comcast Corp. USD 3.950% 15/10/2025 114,708 0.08250,000 Comcast Corp. USD 3.150% 01/03/2026 278,635 0.2068,000 Comcast Corp. USD 3.300% 01/02/2027 76,778 0.05100,000 Comcast Corp. USD 3.150% 15/02/2028 112,640 0.08200,000 Comcast Corp. USD 4.150% 15/10/2028 240,566 0.1775,000 Comcast Corp. USD 4.250% 15/10/2030 92,687 0.0725,000 Comcast Corp. USD 3.750% 01/04/2040 30,312 0.02175,000 Comcast Corp. USD 3.400% 15/07/2046 202,807 0.1425,000 Comcast Corp. USD 4.700% 15/10/2048 35,387 0.03170,000 CommonSpirit Health USD 3.910% 01/10/2050 180,872 0.13100,000 Constellation Brands, Inc. USD 3.600% 15/02/2028 113,766 0.08175,000 CoStar Group, Inc. 144A(g) USD 2.800% 15/07/2030 183,667 0.13225,000 Dell International LLC Via EMC Corp. 144A(g) USD 5.450% 15/06/2023 248,899 0.1850,000 Dell International LLC Via EMC Corp. 144A(g) USD 5.850% 15/07/2025 59,581 0.04300,000 Dell International LLC Via EMC Corp. 144A(g) USD 6.020% 15/06/2026 364,188 0.2625,000 Dell International LLC Via EMC Corp. 144A(g) USD 6.200% 15/07/2030 31,702 0.0275,000 Dentsply Sirona, Inc. USD 3.250% 01/06/2030 82,760 0.06200,000 Dollar Tree, Inc. USD 4.000% 15/05/2025 225,770 0.1650,000 Elanco Animal Health, Inc. USD 5.272% 28/08/2023 54,271 0.04150,000 Emera US Finance LP USD 2.700% 15/06/2021 151,551 0.11175,000 Energy Transfer Operating LP—Series 5Y USD 4.200% 15/09/2023 186,457 0.1375,000 Enterprise Products Operating LLC(c) USD 3.003% 01/06/2067 62,126 0.04225,000 Exelon Corp. USD 3.497% 01/06/2022 234,625 0.1750,000 Exelon Corp. USD 4.050% 15/04/2030 59,255 0.04100,000 Expedia Group, Inc. USD 3.800% 15/02/2028 104,270 0.0775,000 Expedia Group, Inc. 144A(g) USD 3.600% 15/12/2023 78,680 0.0650,000 Expedia Group, Inc. 144A(g) USD 4.625% 01/08/2027 55,009 0.04400,000 Federal National Mortgage Association (FNMA) USD 6.250% 15/05/2029 573,020 0.41
5,580,000 Federal National Mortgage Association (FNMA) USD 0.875% 05/08/2030 5,473,422 3.8890,000 Fifth Third Bancorp USD 2.375% 28/01/2025 95,390 0.0750,000 Fiserv, Inc. USD 3.800% 01/10/2023 54,493 0.04175,000 Fiserv, Inc. USD 2.750% 01/07/2024 187,392 0.13125,000 Fiserv, Inc. USD 3.200% 01/07/2026 140,176 0.1075,000 Fiserv, Inc. USD 4.200% 01/10/2028 89,337 0.0675,000 Fox Corp. USD 4.030% 25/01/2024 82,566 0.06178,000 Glencore Funding LLC 144A(g) USD 4.625% 29/04/2024 197,722 0.1475,000 Great-West Lifeco Finance 2018 LP 144A(g) USD 4.047% 17/05/2028 88,508 0.06125,000 Hewlett Packard Enterprise Co. USD 4.650% 01/10/2024 141,856 0.10150,000 Huntington Bancshares, Inc. USD 4.000% 15/05/2025 170,230 0.1250,000 Intuit, Inc. USD 1.350% 15/07/2027 51,174 0.0425,000 Intuit, Inc. USD 1.650% 15/07/2030 25,630 0.0285,000 JPMorgan Chase & Co.(c) USD 3.514% 18/06/2022 86,488 0.0650,000 JPMorgan Chase & Co.(c) USD 3.559% 23/04/2024 53,596 0.0450,000 JPMorgan Chase & Co.(c) USD 3.797% 23/07/2024 54,166 0.04250,000 JPMorgan Chase & Co.(c) USD 4.023% 05/12/2024 275,105 0.20200,000 JPMorgan Chase & Co.(c) USD 3.960% 29/01/2027 228,870 0.1650,000 JPMorgan Chase & Co.(c) USD 4.452% 05/12/2029 60,726 0.0425,000 JPMorgan Chase & Co.(c) USD 4.493% 24/03/2031 30,690 0.02375,000 JPMorgan Chase & Co.(c) USD 2.522% 22/04/2031 401,340 0.2975,000 JPMorgan Chase & Co.(c) USD 2.956% 13/05/2031 81,637 0.06200,000 JPMorgan Chase & Co.—Series HH(c) USD 4.600% Perp. 203,656 0.14125,000 Keurig Dr Pepper, Inc. USD 4.057% 25/05/2023 135,555 0.1050,000 Keurig Dr Pepper, Inc. USD 4.417% 25/05/2025 57,627 0.0425,000 Keurig Dr Pepper, Inc. USD 5.085% 25/05/2048 35,244 0.0325,000 Keurig Dr Pepper, Inc. USD 3.800% 01/05/2050 30,035 0.02
Goldman Sachs Funds—US Fixed Income PortfolioSchedule of InvestmentsAs at 30 November 2020
The accompanying notes are an integral part of these financial statements.
381

Holdings Security Description Currency Interest Rate(a) Maturity Date(b)Market Value
USD
% ofShareholders’
Equity
Bonds – (Continued)United States – (Continued)
100,000 Lam Research Corp. USD 1.900% 15/06/2030 104,201 0.0750,000 Mars, Inc. 144A(g) USD 3.200% 01/04/2030 58,003 0.04200,000 Metropolitan Transportation Authority USD 5.175% 15/11/2049 225,094 0.16100,000 Microchip Technology, Inc. USD 3.922% 01/06/2021 101,658 0.0750,000 Mondelez International, Inc. USD 2.125% 13/04/2023 51,866 0.0475,000 Morgan Stanley(c) USD 3.737% 24/04/2024 80,597 0.0675,000 Morgan Stanley(c) USD 2.720% 22/07/2025 80,213 0.06175,000 Morgan Stanley(c) USD 4.431% 23/01/2030 213,024 0.15600,000 Morgan Stanley(c) USD 2.699% 22/01/2031 651,024 0.46100,000 Morgan Stanley(c) USD 3.622% 01/04/2031 116,397 0.0825,000 Nasdaq, Inc. USD 3.250% 28/04/2050 27,499 0.02150,000 Newmont Corp. USD 2.250% 01/10/2030 157,789 0.11150,000 Nutrition & Biosciences, Inc. 144A(g) USD 1.832% 15/10/2027 152,901 0.11275,000 Nutrition & Biosciences, Inc. 144A(g) USD 2.300% 01/11/2030 282,727 0.2075,000 Nutrition & Biosciences, Inc. 144A(g) USD 3.268% 15/11/2040 81,083 0.0650,000 Ohio Power Co.—Series P USD 2.600% 01/04/2030 54,968 0.0450,000 Otis Worldwide Corp. USD 2.293% 05/04/2027 53,505 0.04300,000 Otis Worldwide Corp. USD 2.565% 15/02/2030 323,271 0.23275,000 PayPal Holdings, Inc. USD 1.650% 01/06/2025 286,107 0.20300,000 Penske Truck Leasing Co. LP Via PTL Finance Corp. 144A(g) USD 4.250% 17/01/2023 322,857 0.23130,000 Port Authority of New York & New Jersey USD 1.086% 01/07/2023 131,498 0.09125,000 Port Authority of New York & New Jersey USD 4.810% 15/10/2065 171,121 0.12175,000 Principal Financial Group, Inc. USD 2.125% 15/06/2030 183,780 0.13100,000 Sabine Pass Liquefaction LLC USD 5.625% 15/04/2023 109,566 0.08125,000 Sabine Pass Liquefaction LLC USD 5.625% 01/03/2025 144,599 0.1050,000 Sabine Pass Liquefaction LLC USD 5.000% 15/03/2027 57,971 0.04150,000 Starbucks Corp. USD 3.800% 15/08/2025 170,257 0.12120,000 State of California USD 7.500% 01/04/2034 197,439 0.1445,000 State of California USD 7.625% 01/03/2040 78,175 0.0670,000 State of Illinois USD 6.630% 01/02/2035 76,650 0.05240,000 State of Illinois USD 7.350% 01/07/2035 268,822 0.1930,000 Steel Dynamics, Inc. USD 2.400% 15/06/2025 31,786 0.0275,000 Steel Dynamics, Inc. USD 1.650% 15/10/2027 76,268 0.0525,000 Time Warner Cable LLC USD 5.875% 15/11/2040 33,122 0.02150,000 T-Mobile USA, Inc. 144A(g) USD 3.500% 15/04/2025 165,600 0.12100,000 T-Mobile USA, Inc. 144A(g) USD 1.500% 15/02/2026 101,816 0.07400,000 T-Mobile USA, Inc. 144A(g) USD 3.750% 15/04/2027 452,128 0.32300,000 T-Mobile USA, Inc. 144A(g) USD 2.050% 15/02/2028 308,334 0.22175,000 T-Mobile USA, Inc. 144A(g) USD 3.875% 15/04/2030 200,926 0.14150,000 T-Mobile USA, Inc. 144A(g) USD 2.550% 15/02/2031 156,261 0.1175,000 T-Mobile USA, Inc. 144A(g) USD 3.000% 15/02/2041 76,916 0.05125,000 Tractor Supply Co. USD 1.750% 01/11/2030 124,973 0.0950,000 VEREIT Operating Partnership LP USD 3.400% 15/01/2028 54,188 0.0480,000 Verizon Communications, Inc. 144A(g) USD 2.987% 30/10/2056 84,190 0.0675,000 Vistra Operations Co., LLC 144A(g) USD 3.550% 15/07/2024 80,725 0.06175,000 Walgreens Boots Alliance, Inc. USD 4.100% 15/04/2050 187,990 0.13575,000 Walt Disney Co. USD 4.000% 01/10/2023 628,808 0.4550,000 Willis North America, Inc. USD 2.950% 15/09/2029 55,272 0.04
28,190,885 20.00
TOTAL BONDS(cost USD 30,704,036) 32,707,763 23.20
Agencies Asset Backed Obligations – 37.12%United States
70 Federal Home Loan Mortgage Corp. (FHLMC) USD 6.500% 01/03/2021 70 0.0013,179 Federal Home Loan Mortgage Corp. (FHLMC) USD 4.500% 01/10/2023 14,259 0.018,966 Federal Home Loan Mortgage Corp. (FHLMC) USD 7.500% 01/03/2027 9,869 0.01
120,154 Federal Home Loan Mortgage Corp. (FHLMC) USD 6.500% 15/12/2028 137,508 0.101,379 Federal Home Loan Mortgage Corp. (FHLMC) USD 5.000% 01/08/2033 1,589 0.007,310 Federal Home Loan Mortgage Corp. (FHLMC) USD 5.000% 01/12/2034 8,483 0.0113,515 Federal Home Loan Mortgage Corp. (FHLMC) USD 5.000% 01/12/2034 15,683 0.01
75 Federal Home Loan Mortgage Corp. (FHLMC) USD 5.000% 01/11/2035 82 0.007,322 Federal Home Loan Mortgage Corp. (FHLMC) USD 5.000% 01/12/2035 8,410 0.016,620 Federal Home Loan Mortgage Corp. (FHLMC) USD 5.000% 01/02/2037 7,687 0.015,022 Federal Home Loan Mortgage Corp. (FHLMC) USD 5.000% 01/06/2039 5,801 0.0015,304 Federal Home Loan Mortgage Corp. (FHLMC) USD 5.000% 01/06/2039 17,704 0.01268,031 Federal Home Loan Mortgage Corp. (FHLMC) USD 4.000% 01/03/2048 287,775 0.20285,629 Federal Home Loan Mortgage Corp. (FHLMC) USD 4.000% 01/04/2048 306,195 0.22618,915 Federal Home Loan Mortgage Corp. (FHLMC) USD 4.500% 01/08/2048 694,738 0.49
1,000,000 Federal Home Loan Mortgage Corp. (FHLMC) USD 4.500% 01/08/2048 1,085,687 0.77
Goldman Sachs Funds—US Fixed Income PortfolioSchedule of InvestmentsAs at 30 November 2020
The accompanying notes are an integral part of these financial statements.
382

Holdings Security Description Currency Interest Rate(a) Maturity Date(b)Market Value
USD
% ofShareholders’
Equity
Agencies Asset Backed Obligations – (Continued)United States – (Continued)
1,916,011 Federal Home Loan Mortgage Corp. (FHLMC) USD 5.000% 01/10/2049 2,119,217 1.501,000,000 Federal Home Loan Mortgage Corp. (FHLMC) USD 5.000% 01/10/2049 1,105,025 0.786,000,000 Federal Home Loan Mortgage Corp. (FHLMC) TBA(h) USD 3.000% 14/12/2050 6,268,594 4.453,000,000 Federal Home Loan Mortgage Corp. (FHLMC) TBA(h) USD 3.500% 14/12/2050 3,165,234 2.251,000,000 Federal Home Loan Mortgage Corp. (FHLMC) TBA(h) USD 4.500% 14/12/2050 1,084,375 0.77
1,462 Federal National Mortgage Association (FNMA) USD 5.500% 01/09/2023 1,514 0.00914 Federal National Mortgage Association (FNMA) USD 5.500% 01/09/2023 947 0.00
1,542 Federal National Mortgage Association (FNMA) USD 5.500% 01/10/2023 1,599 0.004,151 Federal National Mortgage Association (FNMA) USD 7.000% 01/03/2031 4,232 0.0047,545 Federal National Mortgage Association (FNMA) USD 7.000% 25/07/2042 59,826 0.048,671 Federal National Mortgage Association (FNMA) USD 7.000% 25/10/2042 10,673 0.0110,158 Federal National Mortgage Association (FNMA) USD 3.000% 01/01/2043 11,072 0.0122,071 Federal National Mortgage Association (FNMA) USD 3.000% 01/01/2043 24,058 0.0213,163 Federal National Mortgage Association (FNMA) USD 3.000% 01/03/2043 14,347 0.0195,911 Federal National Mortgage Association (FNMA) USD 3.000% 01/03/2043 104,542 0.0730,215 Federal National Mortgage Association (FNMA) USD 3.000% 01/03/2043 32,934 0.0212,084 Federal National Mortgage Association (FNMA) USD 3.000% 01/04/2043 13,172 0.0126,074 Federal National Mortgage Association (FNMA) USD 3.000% 01/04/2043 28,420 0.0222,643 Federal National Mortgage Association (FNMA) USD 3.000% 01/04/2043 24,680 0.0215,736 Federal National Mortgage Association (FNMA) USD 3.000% 01/04/2043 17,152 0.01117,680 Federal National Mortgage Association (FNMA) USD 3.000% 01/04/2043 128,270 0.0915,038 Federal National Mortgage Association (FNMA) USD 3.000% 01/05/2043 16,391 0.0160,221 Federal National Mortgage Association (FNMA) USD 3.000% 01/05/2043 65,640 0.0565,330 Federal National Mortgage Association (FNMA) USD 3.000% 01/05/2043 71,210 0.05152,875 Federal National Mortgage Association (FNMA) USD 4.000% 01/06/2047 167,053 0.12409,480 Federal National Mortgage Association (FNMA) USD 4.000% 01/01/2048 449,632 0.32270,179 Federal National Mortgage Association (FNMA) USD 4.000% 01/02/2048 296,672 0.21285,576 Federal National Mortgage Association (FNMA) USD 4.000% 01/02/2048 311,258 0.22484,522 Federal National Mortgage Association (FNMA) USD 4.000% 01/02/2048 528,095 0.38365,781 Federal National Mortgage Association (FNMA) USD 4.000% 01/03/2048 398,675 0.28558,318 Federal National Mortgage Association (FNMA) USD 5.000% 01/11/2048 636,671 0.45
3,000,000 Federal National Mortgage Association (FNMA) USD 4.500% 01/01/2049 3,253,310 2.312,088 Government National Mortgage Association (GNMA) USD 7.500% 15/12/2028 2,406 0.00635 Government National Mortgage Association (GNMA) USD 7.500% 15/09/2029 677 0.00
6,376 Government National Mortgage Association (GNMA) USD 7.500% 15/12/2029 7,366 0.011,686 Government National Mortgage Association (GNMA) USD 5.500% 15/11/2032 1,875 0.002,486 Government National Mortgage Association (GNMA) USD 5.500% 15/11/2032 2,851 0.002,667 Government National Mortgage Association (GNMA) USD 5.500% 15/01/2033 3,000 0.004,800 Government National Mortgage Association (GNMA) USD 5.500% 15/02/2033 5,532 0.002,918 Government National Mortgage Association (GNMA) USD 5.500% 15/03/2033 3,370 0.002,200 Government National Mortgage Association (GNMA) USD 5.500% 15/03/2033 2,528 0.003,205 Government National Mortgage Association (GNMA) USD 5.500% 15/07/2033 3,743 0.002,819 Government National Mortgage Association (GNMA) USD 5.500% 15/07/2033 3,205 0.002,297 Government National Mortgage Association (GNMA) USD 5.500% 15/08/2033 2,594 0.001,335 Government National Mortgage Association (GNMA) USD 5.500% 15/09/2033 1,501 0.002,967 Government National Mortgage Association (GNMA) USD 5.500% 15/04/2034 3,342 0.001,212 Government National Mortgage Association (GNMA) USD 5.500% 15/05/2034 1,341 0.0019,821 Government National Mortgage Association (GNMA) USD 5.500% 15/09/2034 23,300 0.023,165 Government National Mortgage Association (GNMA) USD 5.500% 15/09/2034 3,718 0.0024,380 Government National Mortgage Association (GNMA) USD 5.500% 15/12/2034 28,663 0.0216,120 Government National Mortgage Association (GNMA) USD 5.500% 15/01/2035 18,940 0.017,022 Government National Mortgage Association (GNMA) USD 5.000% 15/03/2038 7,979 0.01
150,781 Government National Mortgage Association (GNMA) USD 5.000% 15/05/2041 166,706 0.12603,369 Government National Mortgage Association (GNMA) USD 4.000% 20/01/2045 661,786 0.47298,232 Government National Mortgage Association (GNMA) USD 4.000% 20/06/2045 326,449 0.23531,944 Government National Mortgage Association (GNMA) USD 4.000% 20/07/2045 582,449 0.41225,343 Government National Mortgage Association (GNMA) USD 4.000% 20/10/2045 246,033 0.18395,978 Government National Mortgage Association (GNMA) USD 4.500% 20/02/2048 432,126 0.31384,504 Government National Mortgage Association (GNMA) USD 4.500% 20/08/2048 416,961 0.30238,390 Government National Mortgage Association (GNMA) USD 5.000% 20/08/2048 262,349 0.19
1,816,480 Government National Mortgage Association (GNMA) USD 4.500% 20/09/2048 1,969,815 1.40431,961 Government National Mortgage Association (GNMA) USD 5.000% 20/10/2048 474,699 0.34840,925 Government National Mortgage Association (GNMA) USD 5.000% 20/11/2048 924,126 0.66238,668 Government National Mortgage Association (GNMA) USD 5.000% 20/12/2048 260,973 0.19321,984 Government National Mortgage Association (GNMA) USD 5.000% 20/01/2049 352,762 0.25567,487 Government National Mortgage Association (GNMA) USD 4.000% 20/02/2049 607,091 0.43435,495 Government National Mortgage Association (GNMA) USD 4.500% 20/03/2049 471,406 0.33831,968 Government National Mortgage Association (GNMA) USD 5.000% 20/03/2049 910,363 0.65543,604 Government National Mortgage Association (GNMA) USD 4.000% 20/05/2049 580,564 0.41841,547 Government National Mortgage Association (GNMA) USD 4.500% 20/10/2049 908,903 0.65798,342 Government National Mortgage Association (GNMA) USD 4.500% 20/12/2049 859,620 0.61
Goldman Sachs Funds—US Fixed Income PortfolioSchedule of InvestmentsAs at 30 November 2020
The accompanying notes are an integral part of these financial statements.
383

Holdings Security Description Currency Interest Rate(a) Maturity Date(b)Market Value
USD
% ofShareholders’
Equity
Agencies Asset Backed Obligations – (Continued)United States – (Continued)
7,000,000 Government National Mortgage Association (GNMA) TBA(h) USD 2.000% 21/12/2050 7,307,568 5.183,000,000 Government National Mortgage Association (GNMA) TBA(h) USD 2.500% 21/12/2050 3,157,440 2.242,000,000 Government National Mortgage Association (GNMA) TBA(h) USD 3.000% 21/12/2050 2,088,250 1.485,000,000 Government National Mortgage Association (GNMA) TBA(h) USD 2.000% 21/01/2051 5,207,777 3.69
52,320,177 37.12
TOTAL AGENCIES ASSET BACKED OBLIGATIONS(cost USD 51,422,547) 52,320,177 37.12
Non-Agencies Asset Backed Obligations – 3.31%Cayman Islands
300,000 AGL CLO Ltd. 2020-3A �A� 144A(c)(g) USD 1.537% 15/01/2033 300,374 0.21550,000 AGL CLO Ltd. 2020-5A �A1� 144A(c)(g) USD 2.349% 20/07/2030 553,227 0.39373,738 Cutwater Ltd. 2014-1A �A1AR� 144A(c)(g) USD 1.487% 15/07/2026 373,214 0.27500,000 ICG US CLO Ltd. 2015-2RA �A1� 144A(c)(g) USD 1.600% 16/01/2033 497,190 0.35500,000 Marble Point CLO XVII Ltd. 2020-1A �A� 144A(c)(g) USD 1.518% 20/04/2033 499,781 0.36
2,223,786 1.58
United Kingdom97,781 Harben Finance Plc. 2017-1X �A�(c) GBP 0.851% 20/08/2056 130,714 0.09379,091 Malt Hill No 2 Plc. �A�(c) GBP 0.794% 27/11/2055 506,427 0.36346,942 Stratton Mortgage Funding Plc. 2019-1 �A�(c) GBP 1.254% 25/05/2051 465,020 0.33
1,102,161 0.78
United States11,070 Credit Suisse First Boston Mortgage Securities Corp. 2003-AR9 �2A2�(c) USD 2.862% 25/03/2033 11,218 0.01100,000 DBJPM 17-C6 Mortgage Trust �D� 144A(c)(g) USD 3.234% 10/06/2050 87,782 0.06170,000 Freddie Mac STACR REMIC Trust 2020-DNA3 �M2� 144A(c)(g) USD 3.149% 25/06/2050 172,030 0.1274,000 Freddie Mac STACR REMIC Trust 2020-DNA5 �M2� 144A(c)(g) USD 2.888% 25/10/2050 74,697 0.0572,153 GMACM Home Equity Loan Trust 2007-HE3 �2A1�(c) USD 7.000% 25/09/2037 74,429 0.0540,130 HarborView Mortgage Loan Trust 2005-16 �2A1A�(c) USD 0.630% 19/01/2036 38,571 0.0331,988 Impac CMB Trust Series 2004-10 �2A�(c) USD 0.790% 25/03/2035 29,479 0.0235,582 Impac CMB Trust Series 2004-8 �1A�(c) USD 0.870% 25/10/2034 34,451 0.03150,000 Morgan Stanley Bank of America Merrill Lynch Trust 2015-C25 �B�(c) USD 4.675% 15/10/2048 161,290 0.12508,837 PHEAA Student Loan Trust 2016-1 �A� 144A(c)(g) USD 1.300% 25/09/2065 510,509 0.36100,000 Wells Fargo Commercial Mortgage Trust 2017-C38 �D� 144A(g) USD 3.000% 15/07/2050 72,693 0.05100,000 Wells Fargo Commercial Mortgage Trust 2017-RC1 �D� 144A(g) USD 3.250% 15/01/2060 75,184 0.05
1,342,333 0.95
TOTAL NON-AGENCIES ASSET BACKED OBLIGATIONS(cost USD 4,649,386) 4,668,280 3.31
TOTAL TRANSFERABLE SECURITIES DEALT IN ANOTHER REGULATED MARKET(cost USD 86,775,969) 89,696,220 63.63
Time Deposits – 3.97%
United States5,600,517 Rabobank Nederland USD 0.030% 01/12/2020 5,600,517 3.97
TOTAL TIME DEPOSITS(cost USD 5,600,516) 5,600,517 3.97
MARKET VALUE OF INVESTMENTS EXCLUDING DERIVATIVES(cost USD 160,170,111) 165,748,178 117.57
Covered Forward Mortgage Backed Securities – (2.27%)(1,000,000) Federal National Mortgage Association (FNMA) TBA(h)(i) USD 4.000% 14/12/2050 (1,067,070) (0.76)(2,000,000) Government National Mortgage Association (GNMA) TBA(h)(j) USD 4.000% 21/12/2050 (2,126,451) (1.51)
(3,193,521) (2.27)
TOTAL COVERED FORWARD MORTGAGE BACKED SECURITIES(cost USD (3,193,828)) (3,193,521) (2.27)
Futures Contracts – 0.00%
Number ofContracts Security Description
CommitmentMarket Value
USD
UnrealisedGainUSD
% ofShareholders’
Equity
USD29 US Treasury Long Bond Futures 22/03/2021 Long 5,066,844 2,846 0.00
Goldman Sachs Funds—US Fixed Income PortfolioSchedule of InvestmentsAs at 30 November 2020
The accompanying notes are an integral part of these financial statements.
384

Futures Contracts – (Continued)
Number ofContracts Security Description
CommitmentMarket Value
USD
UnrealisedGainUSD
% ofShareholders’
Equity
USD – (Continued)65 US Treasury Notes 10YR Futures 22/03/2021 Long 8,977,109 12,293 0.0121 US Treasury Notes 2YR Futures 31/03/2021 Long 4,637,391 1,271 0.0024 US Treasury Notes 5YR Futures 31/03/2021 Long 3,023,812 2,495 0.00
21,705,156 18,905 0.01
UNREALISED GAIN ON FUTURES CONTRACTS 18,905 0.01
Number ofContracts Security Description
CommitmentMarket Value
USD
UnrealisedLossUSD
% ofShareholders’
Equity
EUR(1) German Federal Republic Bonds 30YR Futures 08/12/2020 Short (271,794) (1,655) (0.00)
JPY(1) Japan Government Bonds 10YR Futures 14/12/2020 Short (1,458,251) (1,055) (0.00)
USD10 US Treasury Ultra Long Bond Futures 22/03/2021 Long 2,156,562 (1,034) (0.00)(65) US Treasury Ultra Long Notes 10YR Futures 22/03/2021 Short (10,205,000) (11,946) (0.01)
(8,048,438) (12,980) (0.01)
UNREALISED LOSS ON FUTURES CONTRACTS (15,690) (0.01)
Forward Currency Contracts – (0.17%)
CurrencyAmountBought Currency
AmountSold
MaturityDate
UnrealisedGainUSD
% ofShareholders’
Equity
AUD 933,893 USD 671,143 16/12/2020 18,032 0.02CAD 774,784 USD 590,796 16/12/2020 8,320 0.01EUR 1,195,375 USD 1,410,688 16/12/2020 23,827 0.01GBP 54,033 EUR 59,621 16/12/2020 723 0.00GBP 560,273 USD 724,814 16/12/2020 24,582 0.02JPY 105,684,670 USD 1,009,292 16/12/2020 4,700 0.00NOK 8,332,190 USD 906,886 16/12/2020 39,842 0.03NZD 429,000 USD 285,060 16/12/2020 17,200 0.01SEK 6,593,167 USD 745,244 16/12/2020 32,193 0.02USD 280,470 JPY 29,220,513 16/12/2020 113 0.00EUR 89,384 USD 105,861 21/01/2021 1,523 0.00
UNREALISED GAIN ON FORWARD CURRENCY CONTRACTS 171,055 0.12
CurrencyAmountBought Currency
AmountSold
MaturityDate
UnrealisedLossUSD
% ofShareholders’
Equity
CAD 866,584 EUR 560,000 16/12/2020 (1,930) (0.00)EUR 709,001 NOK 7,898,996 16/12/2020 (46,667) (0.03)EUR 749,479 SEK 7,808,227 16/12/2020 (21,295) (0.01)NOK 2,674,000 SEK 2,576,848 16/12/2020 (22) (0.00)USD 1,169,885 AUD 1,654,772 16/12/2020 (51,270) (0.04)USD 1,817,848 CAD 2,423,607 16/12/2020 (56,249) (0.04)USD 1,149,911 EUR 978,367 16/12/2020 (24,183) (0.02)USD 883,324 GBP 674,301 16/12/2020 (18,588) (0.02)USD 907,184 NOK 8,533,813 16/12/2020 (62,454) (0.04)USD 779,961 NZD 1,182,411 16/12/2020 (53,128) (0.04)USD 226,000 SEK 2,010,558 16/12/2020 (11,076) (0.01)USD 1,105,496 JPY 117,068,097 23/12/2020 (17,941) (0.01)USD 1,068,214 GBP 830,719 13/01/2021 (43,423) (0.03)USD 392,116 EUR 331,037 21/01/2021 (5,585) (0.00)
UNREALISED LOSS ON FORWARD CURRENCY CONTRACTS (413,811) (0.29)
Options – (0.01%)
Holdings Security Description
UnrealisedGain/(Loss)
USDMarket Value
USD
% ofShareholders’
Equity
Purchased OptionsUSD
290,000 Call 3 month LIBOR Swaption Expires 15/01/2021 Strike 0.61 (1,282) 299 0.00
Goldman Sachs Funds—US Fixed Income PortfolioSchedule of InvestmentsAs at 30 November 2020
The accompanying notes are an integral part of these financial statements.
385

Options – (Continued)
Holdings Security Description
UnrealisedGain/(Loss)
USDMarket Value
USD
% ofShareholders’
Equity
Purchased Options – (Continued)USD – (Continued)
290,000 Call 3 month LIBOR Swaption Expires 12/02/2021 Strike 0.83 677 2,214 0.00240,000 Call 3 month LIBOR Swaption Expires 16/02/2021 Strike 0.78 266 1,463 0.00
(339) 3,976 0.00
TOTAL PURCHASED OPTIONS(cost USD 4,314) 3,976 0.00
Written OptionsEUR
(490,000) Call 6 month EURIBOR Swaption Expires 30/11/2020 Strike 0.15 (1,109) (6,058) (0.01)(150,000) Call 6 month EURIBOR Swaption Expires 01/12/2020 Strike 0.15 (300) (1,851) (0.00)(110,000) Call 6 month EURIBOR Swaption Expires 02/12/2020 Strike 0.15 (106) (1,355) (0.00)(430,000) Call 6 month EURIBOR Swaption Expires 02/12/2020 Strike 0.20 1,236 (2,673) (0.00)(320,000) Call 6 month EURIBOR Swaption Expires 03/12/2020 Strike 0.20 1,232 (1,991) (0.00)(220,000) Call 6 month EURIBOR Swaption Expires 14/01/2021 Strike 0.25 948 (1,036) (0.00)(220,000) Call 6 month EURIBOR Swaption Expires 14/01/2021 Strike 0.25 960 (1,036) (0.00)(340,000) Call 6 month EURIBOR Swaption Expires 15/01/2021 Strike 0.39 1,135 (250) (0.00)(350,000) Call 6 month EURIBOR Swaption Expires 12/02/2021 Strike 0.26 (578) (1,966) (0.00)(290,000) Call 6 month EURIBOR Swaption Expires 16/02/2021 Strike 0.29 (142) (1,231) (0.00)(490,000) Put 6 month EURIBOR Swaption Expires 30/11/2020 Strike 0.10 1,572 (0) (0.00)(150,000) Put 6 month EURIBOR Swaption Expires 01/12/2020 Strike 0.10 430 (0) (0.00)(110,000) Put 6 month EURIBOR Swaption Expires 02/12/2020 Strike 0.10 247 (0) (0.00)(220,000) Put 6 month EURIBOR Swaption Expires 14/01/2021 Strike 0.00 617 (74) (0.00)(220,000) Put 6 month EURIBOR Swaption Expires 14/01/2021 Strike 0.00 617 (74) (0.00)
6,759 (19,595) (0.01)
TOTAL WRITTEN OPTIONS(cost USD (26,352)) (19,595) (0.01)
TOTAL OPTIONS(cost USD (22,038)) (15,619) (0.01)
Swap Contracts – 0.09%Net LocalNotionalAmount Pay Receive Currency Maturity Date
UnrealisedGainUSD
% ofShareholders’
Equity
Interest Rate Swaps1,460,000 Floating (AUD 6 month BBSW) Fixed 0.553% AUD 16/05/2025 6,181 0.01590,000 Floating (AUD 6 month BBSW) Fixed 0.500% AUD 25/11/2025 286 0.00690,000 Floating (AUD 6 month BBSW) Fixed 1.550% AUD 12/11/2030 783 0.00
2,270,000 Floating (CAD 3 month CDOR) Fixed 1.250% CAD 16/12/2023 49 0.00940,000 Fixed 1.430% Floating (CAD 3 month CDOR) CAD 09/11/2030 25 0.00
1,530,000 Fixed 0.000% Floating (EUR 12 month LIBOR) EUR 19/11/2024 81 0.002,820,000 Fixed 0.000% Floating (EUR 12 month LIBOR) EUR 16/12/2025 2,253 0.001,660,000 Fixed 0.000% Floating (EUR 12 month LIBOR) EUR 16/12/2027 8,501 0.01330,000 Fixed 0.260% Floating (EUR 6 month EURIBOR) EUR 21/05/2040 4,124 0.00
7,910,000 Fixed 1.240% Floating (NOK 6 month NIBOR) NOK 29/10/2030 8,262 0.011,680,000 Fixed 0.750% Floating (USD 3 month LIBOR) USD 16/12/2023 1,435 0.001,610,000 Fixed 1.543% Floating (USD 3 month LIBOR) USD 25/11/2035 1,631 0.00130,000 Floating (USD 3 month LIBOR) Fixed 1.500% USD 02/12/2050 490 0.00
UNREALISED GAIN ON INTEREST RATE SWAPS 34,101 0.03
Credit Default Swaps1,775,000 Floating (The Markit CDX North America
Investment Grade 34 Index)Fixed 1.000% USD 20/06/2023 5,896 0.01
280,000 Floating (Colombia GovernmentInternational Bond)
Fixed 1.000% USD 20/06/2024 4,852 0.00
200,000 Floating (General Electric Co.) Fixed 1.000% USD 20/06/2024 3,244 0.00220,000 Floating (Indonesia Government
International Bond)Fixed 1.000% USD 20/06/2024 4,334 0.00
40,000 Floating (Mexico GovernmentInternational Bond)
Fixed 1.000% USD 20/06/2024 1,061 0.00
100,000 Floating (Prudential Financial, Inc.) Fixed 1.000% USD 20/06/2024 1,213 0.00100,000 Floating (General Electric Co.) Fixed 1.000% USD 20/12/2024 1,604 0.0060,000 Floating (Russian Foreign Bond -
Eurobond)Fixed 1.000% USD 20/12/2024 1,315 0.00
2,300,000 Floating (The Markit CDX North AmericaInvestment Grade 33 Version 1 Index)
Fixed 1.000% USD 20/12/2024 2,977 0.00
Goldman Sachs Funds—US Fixed Income PortfolioSchedule of InvestmentsAs at 30 November 2020
The accompanying notes are an integral part of these financial statements.
386

Swap Contracts – (Continued)
Net LocalNotionalAmount Pay Receive Currency Maturity Date
UnrealisedGainUSD
% ofShareholders’
Equity
Credit Default Swaps – (Continued)10,025,000 Floating (The Markit CDX North America
Investment Grade 34 Index)Fixed 1.000% USD 20/06/2025 42,231 0.03
250,000 Floating (The Markit CMBX NorthAmerica BBB- 11 Index)
Fixed 3.000% USD 18/11/2054 47,795 0.03
150,000 Floating (The Markit CMBX NorthAmerica BBB- 11 Index)
Fixed 3.000% USD 18/11/2054 5,848 0.01
200,000 Floating (The Markit CMBX NorthAmerica BBB- 8 Index)
Fixed 3.000% USD 17/10/2057 14,118 0.01
50,000 Floating (The Markit CMBX NorthAmerica BBB- 10 Index)
Fixed 3.000% USD 17/11/2059 6,023 0.01
UNREALISED GAIN ON CREDIT DEFAULT SWAPS 142,511 0.10
Inflation Swaps310,000 Floating (GBP 12 month LIBOR) Fixed 3.395% GBP 15/12/2024 7,661 0.00460,000 Floating (GBP 12 month LIBOR) Fixed 3.469% GBP 15/11/2025 9,516 0.01
UNREALISED GAIN ON INFLATION SWAPS 17,177 0.01
TOTAL UNREALISED GAIN ON SWAP CONTRACTS 193,789 0.14
Net LocalNotionalAmount Pay Receive Currency Maturity Date
UnrealisedLossUSD
% ofShareholders’
Equity
Interest Rate Swaps2,470,000 Floating (AUD 6 month BBSW) Fixed 0.920% AUD 04/09/2028 (2,501) (0.00)920,000 Floating (AUD 6 month BBSW) Fixed 1.240% AUD 28/10/2030 (6,878) (0.01)
1,440,000 Floating (AUD 6 month BBSW) Fixed 1.250% AUD 09/11/2030 (2,534) (0.00)350,000 Floating (AUD 6 month BBSW) Fixed 1.000% AUD 16/12/2030 (1,076) (0.00)
2,950,000 Floating (CAD 3 month CDOR) Fixed 0.700% CAD 18/11/2023 (262) (0.00)2,590,000 Floating (CAD 3 month CDOR) Fixed 0.810% CAD 30/09/2024 (3,792) (0.01)4,690,000 Floating (CAD 3 month CDOR) Fixed 0.960% CAD 09/11/2024 (2,412) (0.00)1,860,000 Floating (CAD 3 month CDOR) Fixed 0.813% CAD 17/11/2024 (622) (0.00)1,810,000 Floating (CHF 6 month LIBOR) Fixed 0.000% CHF 16/12/2027 (2,213) (0.00)900,000 Floating (CHF 6 month LIBOR) Fixed 0.000% CHF 16/12/2030 (1,211) (0.00)
1,420,000 Fixed 0.000% Floating (EUR 12 month LIBOR) EUR 18/05/2025 (311) (0.00)670,000 Fixed 0.000% Floating (EUR 6 month LIBOR) EUR 16/12/2025 (1,708) (0.00)680,000 Floating (EUR 6 month EURIBOR) Fixed 0.050% EUR 21/05/2030 (2,668) (0.00)
1,480,000 Fixed 0.000% Floating (EUR 6 month LIBOR) EUR 16/12/2030 (11,088) (0.01)120,000 Fixed 0.100% Floating (EUR 6 month EURIBOR) EUR 02/12/2050 (24) (0.00)200,000 Fixed 0.250% Floating (EUR 6 month EURIBOR) EUR 16/12/2050 (987) (0.00)
255,030,000 Fixed 0.144% Floating (JPY 6 month LIBOR) JPY 13/11/2030 (793) (0.00)12,810,000 Floating (NOK 6 month NIBOR) Fixed 0.750% NOK 16/12/2025 (9,122) (0.01)15,440,000 Floating (SEK 3 month STIBOR) Fixed 0.000% SEK 16/12/2025 (2,323) (0.00)2,840,000 Floating (USD 1 month LIBOR) Floating (USD 3 month LIBOR) USD 25/07/2024 (917) (0.00)1,680,000 Floating (USD 3 month SOFR) Floating (USD 3 month LIBOR) USD 10/11/2024 (1,259) (0.00)1,030,000 Fixed 1.190% Floating (USD 3 month LIBOR) USD 10/11/2030 (2,841) (0.00)1,460,000 Floating (USD 3 month LIBOR) Fixed 1.245% USD 24/11/2030 (702) (0.00)
UNREALISED LOSS ON INTEREST RATE SWAPS (58,244) (0.04)
Credit Default Swaps2,525,000 Floating (The Markit CDX North America
Investment Grade 28 Version 1 Index)Fixed 1.000% USD 20/06/2022 (8,062) (0.01)
75,000 Floating (Boeing Co.) Fixed 1.000% USD 20/06/2024 (2,484) (0.00)
UNREALISED LOSS ON CREDIT DEFAULT SWAPS (10,546) (0.01)
TOTAL UNREALISED LOSS ON SWAP CONTRACTS (68,790) (0.05)
MARKET VALUE OF INVESTMENTS(cost USD 156,954,245)
162,424,496 115.21
OTHER ASSETS AND LIABILITIES (21,446,756) (15.21)
SHAREHOLDERS’ EQUITY 140,977,740 100.00
Goldman Sachs Funds—US Fixed Income PortfolioSchedule of InvestmentsAs at 30 November 2020
The accompanying notes are an integral part of these financial statements.
387

TOTAL INVESTMENTSMarket Value
USD
% ofShareholders’
Equity
Total Investments excluding derivatives (cost USD 160,170,111) 165,748,178 117.57Market value of covered forward mortgage backed securities (cost USD (3,193,828)) (3,193,521) (2.27)Unrealised gain on futures contracts 18,905 0.01Unrealised loss on futures contracts (15,690) (0.01)Unrealised gain on forward currency contracts 171,055 0.12Unrealised loss on forward currency contracts (413,811) (0.29)Market value of purchased options (cost USD 4,314) 3,976 0.00Market value of written options (cost USD (26,352)) (19,595) (0.01)Unrealised gain on swap contracts 193,789 0.14Unrealised loss on swap contracts (68,790) (0.05)Other Assets and Liabilities (21,446,756) (15.21)
Shareholders’ Equity 140,977,740 100.00
The Futures Commission Merchant was Goldman Sachs & Co. LLC.
The counterparties for forward currency contracts were Bank of America N.A., Barclays Bank Plc., BNP Paribas S.A., Citibank N.A., Credit Suisse International, Deutsche Bank AG,Morgan Stanley & Co. International Plc., Royal Bank of Canada, State Street Bank & Trust and UBS AG.
The counterparties for options contracts were Bank of America N.A., Citibank N.A., JP Morgan Chase Bank N.A., Morgan Stanley & Co. International Plc. and UBS AG.
The counterparties for swap contracts were Citigroup Global Markets Inc., Credit Suisse and JP Morgan Securities Inc.
The maximum individual counterparty exposure as at 30 November 2020 is 0.09% of the NAV.
(a) Interest rates represent either the stated coupon rate, annualised discounted yield on date of purchase for discounted securities, or, for floating rate securities, the current reset ratewhich is based upon interest rates indices.
(b) Maturity dates represent either the stated date on the security, or the next interest reset date for floating rate securities or the prerefunded date for those type of securities.(c) Variable and floating coupon rates are those quoted as of 30 November 2020.(d) This security has a step up coupon which moves to the second rate at a set date in the future.(e) A related party to Goldman Sachs Funds.(f) The yield for this fund as at 30 November 2020 was 0.120%.(g) 144A: This security is issued to qualified institutional investors, pursuant to private placements, and is transferable as stated in rule 144A of the US Securities Act of 1933.(h) TBA (To Be Announced) Securities are purchased on a forward commitment basis with an approximate (generally +/-2.5%) principal amount and no defined maturity date. The actual
principal amount and maturity date will be determined upon settlement when the specific mortgage pools are assigned.(i) These represent TBA sales covered by long FNMA positions. These amounts are disclosed separately as Covered Forward Mortgage Backed Securities in the Statement of Assets
and Liabilities.(j) These represent TBA sales covered by long GNMA positions. These amounts are disclosed separately as Covered Forward Mortgage Backed Securities in the Statement of Assets
and Liabilities.
Goldman Sachs Funds—US Fixed Income PortfolioSchedule of InvestmentsAs at 30 November 2020
The accompanying notes are an integral part of these financial statements.
388

Holdings Security Description Currency Interest Rate(a) Maturity Date(b)Market Value
USD
% ofShareholders’
Equity
Transferable securities admitted to an official exchange listing
Bonds – 13.04%United States
25,000,000 United States Treasury Bill USD 0.069% 21/01/2021 24,997,698 6.2110,000,000 United States Treasury Bill USD 0.089% 25/03/2021 9,997,467 2.4810,000,000 United States Treasury Bill USD 0.076% 02/04/2021 9,998,691 2.497,500,000 United States Treasury Bill USD 0.084% 15/04/2021 7,497,820 1.86
52,491,676 13.04
TOTAL BONDS(cost USD 52,488,803) 52,491,676 13.04
Holdings Security DescriptionMarket Value
USD
% ofShareholders’
Equity
Mutual Funds – 2.30%Ireland
9,244,495 Goldman Sachs US$ Treasury Liquid Reserves Fund (X Distribution Class)(c)(d) 9,244,495 2.30
TOTAL MUTUAL FUNDS(cost USD 9,244,495) 9,244,495 2.30
TOTAL TRANSFERABLE SECURITIES ADMITTED TO AN OFFICIAL EXCHANGE LISTING(cost USD 61,733,298) 61,736,171 15.34
Holdings Security Description Currency Interest Rate(a) Maturity Date(b)Market Value
USD
% ofShareholders’
Equity
Transferable securities dealt in another regulated market
Agencies Asset Backed Obligations – 118.98%United States
60 Federal Home Loan Mortgage Corp. (FHLMC) USD 6.500% 01/03/2021 60 0.0052,711 Federal Home Loan Mortgage Corp. (FHLMC) USD 5.000% 01/04/2023 58,171 0.01430,387 Federal Home Loan Mortgage Corp. (FHLMC) USD 5.000% 01/08/2023 474,970 0.1276,381 Federal Home Loan Mortgage Corp. (FHLMC) USD 4.500% 01/09/2023 82,626 0.0228,230 Federal Home Loan Mortgage Corp. (FHLMC) USD 5.000% 01/02/2024 31,154 0.0163,530 Federal Home Loan Mortgage Corp. (FHLMC) USD 4.500% 01/04/2025 68,753 0.0236,562 Federal Home Loan Mortgage Corp. (FHLMC) USD 5.500% 01/10/2026 40,823 0.0138,861 Federal Home Loan Mortgage Corp. (FHLMC) USD 7.000% 15/07/2027 44,061 0.01163,618 Federal Home Loan Mortgage Corp. (FHLMC) USD 3.000% 15/12/2027 9,221 0.0015,868 Federal Home Loan Mortgage Corp. (FHLMC) USD 4.500% 01/11/2029 17,312 0.00110,207 Federal Home Loan Mortgage Corp. (FHLMC) USD 7.000% 15/09/2030 126,051 0.03103,655 Federal Home Loan Mortgage Corp. (FHLMC) USD 6.500% 15/07/2031 121,661 0.03195,293 Federal Home Loan Mortgage Corp. (FHLMC) USD 6.500% 15/08/2031 227,477 0.06790,128 Federal Home Loan Mortgage Corp. (FHLMC) USD 5.000% 01/09/2031 872,879 0.22
1,161,364 Federal Home Loan Mortgage Corp. (FHLMC) USD 5.000% 01/09/2031 1,288,780 0.3248,951 Federal Home Loan Mortgage Corp. (FHLMC)(e) USD 2.487% 01/08/2033 50,968 0.01140,663 Federal Home Loan Mortgage Corp. (FHLMC)(e) USD 2.625% 01/07/2034 146,137 0.04
428 Federal Home Loan Mortgage Corp. (FHLMC) USD 4.500% 01/08/2035 473 0.001,259 Federal Home Loan Mortgage Corp. (FHLMC) USD 4.500% 01/09/2035 1,401 0.0017,620 Federal Home Loan Mortgage Corp. (FHLMC) USD 4.500% 01/09/2035 19,498 0.0176,876 Federal Home Loan Mortgage Corp. (FHLMC) USD 5.000% 01/12/2035 88,303 0.02142,761 Federal Home Loan Mortgage Corp. (FHLMC) USD 5.000% 01/12/2035 165,994 0.04215,521 Federal Home Loan Mortgage Corp. (FHLMC) USD 5.000% 01/07/2036 250,233 0.06143,179 Federal Home Loan Mortgage Corp. (FHLMC) USD 5.000% 01/01/2037 166,328 0.046,207 Federal Home Loan Mortgage Corp. (FHLMC) USD 4.500% 01/01/2038 6,862 0.0011,154 Federal Home Loan Mortgage Corp. (FHLMC) USD 4.500% 01/09/2038 12,495 0.003,659 Federal Home Loan Mortgage Corp. (FHLMC) USD 4.500% 01/02/2039 4,107 0.00520 Federal Home Loan Mortgage Corp. (FHLMC) USD 4.500% 01/02/2039 584 0.00
1,657 Federal Home Loan Mortgage Corp. (FHLMC) USD 4.500% 01/02/2039 1,860 0.002,175 Federal Home Loan Mortgage Corp. (FHLMC) USD 4.500% 01/03/2039 2,414 0.00
217,122 Federal Home Loan Mortgage Corp. (FHLMC) USD 4.500% 01/04/2039 236,651 0.064,289 Federal Home Loan Mortgage Corp. (FHLMC) USD 4.500% 01/05/2039 4,759 0.007,589 Federal Home Loan Mortgage Corp. (FHLMC) USD 4.500% 01/05/2039 8,486 0.001,218 Federal Home Loan Mortgage Corp. (FHLMC) USD 4.500% 01/05/2039 1,351 0.00248 Federal Home Loan Mortgage Corp. (FHLMC) USD 4.500% 01/05/2039 278 0.00429 Federal Home Loan Mortgage Corp. (FHLMC) USD 4.500% 01/05/2039 482 0.00
1,215 Federal Home Loan Mortgage Corp. (FHLMC) USD 4.500% 01/05/2039 1,363 0.004,773 Federal Home Loan Mortgage Corp. (FHLMC) USD 4.500% 01/06/2039 5,356 0.0017,524 Federal Home Loan Mortgage Corp. (FHLMC) USD 4.500% 01/06/2039 19,584 0.0126,239 Federal Home Loan Mortgage Corp. (FHLMC) USD 4.500% 01/06/2039 29,439 0.013,145 Federal Home Loan Mortgage Corp. (FHLMC) USD 5.000% 01/07/2039 3,624 0.00
Goldman Sachs Funds—US Mortgage Backed Securities PortfolioSchedule of InvestmentsAs at 30 November 2020
The accompanying notes are an integral part of these financial statements.
389

Holdings Security Description Currency Interest Rate(a) Maturity Date(b)Market Value
USD
% ofShareholders’
Equity
Agencies Asset Backed Obligations – (Continued)United States – (Continued)
2,213 Federal Home Loan Mortgage Corp. (FHLMC) USD 4.500% 01/09/2039 2,482 0.0011,327 Federal Home Loan Mortgage Corp. (FHLMC) USD 4.000% 01/06/2040 12,445 0.002,761 Federal Home Loan Mortgage Corp. (FHLMC) USD 4.500% 01/06/2040 3,098 0.0058,763 Federal Home Loan Mortgage Corp. (FHLMC) USD 4.000% 01/02/2041 64,272 0.0233,583 Federal Home Loan Mortgage Corp. (FHLMC) USD 4.000% 01/02/2041 36,519 0.0135,124 Federal Home Loan Mortgage Corp. (FHLMC) USD 4.500% 01/02/2041 38,639 0.012,430 Federal Home Loan Mortgage Corp. (FHLMC) USD 4.500% 01/04/2041 2,699 0.001,331 Federal Home Loan Mortgage Corp. (FHLMC) USD 4.500% 01/05/2041 1,488 0.002,944 Federal Home Loan Mortgage Corp. (FHLMC) USD 4.500% 01/05/2041 3,304 0.0057,186 Federal Home Loan Mortgage Corp. (FHLMC) USD 5.000% 01/05/2041 66,498 0.022,471 Federal Home Loan Mortgage Corp. (FHLMC) USD 4.500% 01/06/2041 2,765 0.004,631 Federal Home Loan Mortgage Corp. (FHLMC) USD 4.500% 01/06/2041 5,182 0.004,237 Federal Home Loan Mortgage Corp. (FHLMC) USD 4.500% 01/08/2041 4,756 0.0015,394 Federal Home Loan Mortgage Corp. (FHLMC) USD 4.500% 01/08/2041 17,238 0.0022,898 Federal Home Loan Mortgage Corp. (FHLMC) USD 4.500% 01/09/2041 25,714 0.016,563 Federal Home Loan Mortgage Corp. (FHLMC) USD 4.000% 01/11/2041 7,276 0.0014,683 Federal Home Loan Mortgage Corp. (FHLMC) USD 4.500% 01/03/2042 16,517 0.002,391 Federal Home Loan Mortgage Corp. (FHLMC) USD 4.500% 01/03/2042 2,687 0.00
160,207 Federal Home Loan Mortgage Corp. (FHLMC) USD 3.500% 01/06/2042 177,332 0.04365,399 Federal Home Loan Mortgage Corp. (FHLMC) USD 4.500% 01/06/2042 409,608 0.10560,553 Federal Home Loan Mortgage Corp. (FHLMC)(e) USD 6.402% 15/06/2042 95,284 0.0233,602 Federal Home Loan Mortgage Corp. (FHLMC) USD 3.000% 01/08/2042 36,479 0.0133,213 Federal Home Loan Mortgage Corp. (FHLMC) USD 3.000% 01/08/2042 36,056 0.0114,635 Federal Home Loan Mortgage Corp. (FHLMC) USD 3.000% 01/08/2042 15,888 0.0071,240 Federal Home Loan Mortgage Corp. (FHLMC) USD 3.500% 01/08/2042 79,256 0.0228,391 Federal Home Loan Mortgage Corp. (FHLMC) USD 3.000% 01/10/2042 30,821 0.0149,880 Federal Home Loan Mortgage Corp. (FHLMC) USD 3.500% 01/10/2042 54,534 0.01114,917 Federal Home Loan Mortgage Corp. (FHLMC) USD 3.500% 01/10/2042 125,638 0.0372,766 Federal Home Loan Mortgage Corp. (FHLMC) USD 3.500% 01/10/2042 79,555 0.0264,579 Federal Home Loan Mortgage Corp. (FHLMC) USD 3.000% 01/11/2042 70,108 0.02178,688 Federal Home Loan Mortgage Corp. (FHLMC) USD 3.000% 01/11/2042 193,987 0.058,742 Federal Home Loan Mortgage Corp. (FHLMC) USD 3.000% 01/11/2042 9,491 0.0023,459 Federal Home Loan Mortgage Corp. (FHLMC) USD 3.000% 01/11/2042 25,467 0.01443,773 Federal Home Loan Mortgage Corp. (FHLMC) USD 3.000% 01/11/2042 481,768 0.12150,143 Federal Home Loan Mortgage Corp. (FHLMC) USD 3.500% 01/11/2042 164,151 0.0450,051 Federal Home Loan Mortgage Corp. (FHLMC) USD 3.000% 01/12/2042 54,336 0.0141,599 Federal Home Loan Mortgage Corp. (FHLMC) USD 3.000% 01/12/2042 45,238 0.0132,587 Federal Home Loan Mortgage Corp. (FHLMC) USD 3.000% 01/12/2042 35,377 0.01176,228 Federal Home Loan Mortgage Corp. (FHLMC) USD 3.000% 01/12/2042 191,317 0.0515,451 Federal Home Loan Mortgage Corp. (FHLMC) USD 3.000% 01/12/2042 16,803 0.0035,556 Federal Home Loan Mortgage Corp. (FHLMC) USD 3.000% 01/12/2042 38,666 0.0125,981 Federal Home Loan Mortgage Corp. (FHLMC) USD 3.000% 01/12/2042 28,254 0.0153,534 Federal Home Loan Mortgage Corp. (FHLMC) USD 3.000% 01/12/2042 58,118 0.0127,103 Federal Home Loan Mortgage Corp. (FHLMC) USD 3.000% 01/12/2042 29,474 0.0116,742 Federal Home Loan Mortgage Corp. (FHLMC) USD 3.000% 01/12/2042 18,207 0.0119,507 Federal Home Loan Mortgage Corp. (FHLMC) USD 3.000% 01/01/2043 21,214 0.0143,213 Federal Home Loan Mortgage Corp. (FHLMC) USD 3.000% 01/01/2043 46,994 0.0113,944 Federal Home Loan Mortgage Corp. (FHLMC) USD 3.000% 01/01/2043 15,164 0.00
1,173,537 Federal Home Loan Mortgage Corp. (FHLMC) USD 3.500% 01/08/2043 1,274,047 0.32441,153 Federal Home Loan Mortgage Corp. (FHLMC) USD 4.000% 01/08/2043 485,927 0.12
2,653,434 Federal Home Loan Mortgage Corp. (FHLMC)(e) USD 5.852% 15/12/2043 435,524 0.11502,822 Federal Home Loan Mortgage Corp. (FHLMC) USD 4.000% 01/01/2044 552,611 0.14686,289 Federal Home Loan Mortgage Corp. (FHLMC)(e) USD 5.902% 15/03/2044 109,499 0.03472,893 Federal Home Loan Mortgage Corp. (FHLMC) USD 3.500% 01/06/2044 520,171 0.1382,136 Federal Home Loan Mortgage Corp. (FHLMC) USD 4.500% 15/10/2044 11,782 0.0014,448 Federal Home Loan Mortgage Corp. (FHLMC) USD 3.500% 01/02/2045 15,907 0.0021,022 Federal Home Loan Mortgage Corp. (FHLMC) USD 3.500% 01/02/2045 23,144 0.0157,197 Federal Home Loan Mortgage Corp. (FHLMC) USD 3.500% 01/03/2045 62,971 0.0215,379 Federal Home Loan Mortgage Corp. (FHLMC) USD 3.500% 01/08/2045 16,633 0.0022,038 Federal Home Loan Mortgage Corp. (FHLMC) USD 3.500% 01/09/2045 23,835 0.0139,769 Federal Home Loan Mortgage Corp. (FHLMC) USD 3.500% 01/11/2045 42,987 0.01
2,993,580 Federal Home Loan Mortgage Corp. (FHLMC) USD 3.000% 01/01/2046 3,258,299 0.81832,746 Federal Home Loan Mortgage Corp. (FHLMC) USD 3.500% 01/03/2046 887,182 0.22218,099 Federal Home Loan Mortgage Corp. (FHLMC) USD 3.500% 01/03/2046 238,744 0.06565,259 Federal Home Loan Mortgage Corp. (FHLMC) USD 3.500% 01/05/2046 614,528 0.15108,044 Federal Home Loan Mortgage Corp. (FHLMC) USD 3.500% 01/05/2046 116,584 0.03826,092 Federal Home Loan Mortgage Corp. (FHLMC)(e) USD 5.852% 15/05/2046 143,455 0.04624,368 Federal Home Loan Mortgage Corp. (FHLMC) USD 3.500% 01/06/2046 673,716 0.17
1,151,974 Federal Home Loan Mortgage Corp. (FHLMC) USD 3.500% 01/06/2046 1,277,987 0.32235,902 Federal Home Loan Mortgage Corp. (FHLMC) USD 3.500% 01/07/2046 254,547 0.0634,663 Federal Home Loan Mortgage Corp. (FHLMC) USD 3.500% 01/10/2046 37,381 0.01
Goldman Sachs Funds—US Mortgage Backed Securities PortfolioSchedule of InvestmentsAs at 30 November 2020
The accompanying notes are an integral part of these financial statements.
390

Holdings Security Description Currency Interest Rate(a) Maturity Date(b)Market Value
USD
% ofShareholders’
Equity
Agencies Asset Backed Obligations – (Continued)United States – (Continued)
55,406 Federal Home Loan Mortgage Corp. (FHLMC) USD 3.500% 01/12/2046 59,750 0.021,246,012 Federal Home Loan Mortgage Corp. (FHLMC) USD 4.000% 01/02/2047 1,340,880 0.339,663,922 Federal Home Loan Mortgage Corp. (FHLMC) USD 3.000% 01/05/2047 10,415,815 2.594,361,120 Federal Home Loan Mortgage Corp. (FHLMC) USD 3.500% 01/06/2047 4,623,293 1.1514,515 Federal Home Loan Mortgage Corp. (FHLMC) USD 4.000% 01/06/2047 15,862 0.00116,232 Federal Home Loan Mortgage Corp. (FHLMC) USD 3.500% 01/12/2047 126,690 0.03169,413 Federal Home Loan Mortgage Corp. (FHLMC) USD 4.000% 01/04/2048 185,125 0.0563,730 Federal Home Loan Mortgage Corp. (FHLMC) USD 4.000% 01/04/2048 69,461 0.02197,908 Federal Home Loan Mortgage Corp. (FHLMC) USD 5.000% 01/04/2048 220,593 0.06
1,377,867 Federal Home Loan Mortgage Corp. (FHLMC) USD 4.000% 01/06/2048 1,491,538 0.371,000,000 Federal Home Loan Mortgage Corp. (FHLMC) USD 4.500% 01/06/2048 1,085,687 0.27412,731 Federal Home Loan Mortgage Corp. (FHLMC) USD 5.000% 01/06/2048 457,111 0.11
1,275,595 Federal Home Loan Mortgage Corp. (FHLMC) USD 4.000% 01/07/2048 1,380,872 0.342,000,000 Federal Home Loan Mortgage Corp. (FHLMC) USD 4.500% 01/08/2048 2,171,373 0.54856,457 Federal Home Loan Mortgage Corp. (FHLMC) USD 4.500% 01/11/2048 928,774 0.23
1,638,429 Federal Home Loan Mortgage Corp. (FHLMC) USD 4.500% 01/11/2048 1,776,772 0.442,010,164 Federal Home Loan Mortgage Corp. (FHLMC) USD 3.500% 01/12/2048 2,128,304 0.532,345,002 Federal Home Loan Mortgage Corp. (FHLMC) USD 4.000% 01/01/2049 2,555,887 0.6445,901 Federal Home Loan Mortgage Corp. (FHLMC) USD 5.000% 01/01/2049 50,747 0.01
1,476,313 Federal Home Loan Mortgage Corp. (FHLMC) USD 5.000% 01/04/2049 1,632,747 0.41698,977 Federal Home Loan Mortgage Corp. (FHLMC) USD 5.000% 01/05/2049 772,562 0.19343,531 Federal Home Loan Mortgage Corp. (FHLMC) USD 3.500% 01/07/2049 374,548 0.09483,254 Federal Home Loan Mortgage Corp. (FHLMC) USD 3.500% 01/08/2049 526,887 0.13
1,437,243 Federal Home Loan Mortgage Corp. (FHLMC) USD 5.000% 01/09/2049 1,591,286 0.401,131,755 Federal Home Loan Mortgage Corp. (FHLMC) USD 5.000% 01/10/2049 1,251,785 0.31398,262 Federal Home Loan Mortgage Corp. (FHLMC) USD 5.000% 01/11/2049 440,090 0.11285,736 Federal Home Loan Mortgage Corp. (FHLMC)(e) USD 5.852% 25/12/2049 35,887 0.01642,714 Federal Home Loan Mortgage Corp. (FHLMC)(e) USD 5.852% 25/12/2049 80,270 0.02
6,255,318 Federal Home Loan Mortgage Corp. (FHLMC) USD 5.000% 01/01/2050 6,918,150 1.722,060,784 Federal Home Loan Mortgage Corp. (FHLMC) USD 3.000% 01/03/2050 2,191,496 0.541,810,771 Federal Home Loan Mortgage Corp. (FHLMC) USD 3.000% 01/03/2050 1,931,284 0.48867,432 Federal Home Loan Mortgage Corp. (FHLMC) USD 5.000% 01/03/2050 959,077 0.24
3,328,468 Federal Home Loan Mortgage Corp. (FHLMC) USD 4.500% 25/06/2050 456,246 0.1190,479 Federal Home Loan Mortgage Corp. (FHLMC) USD 4.500% 01/07/2050 98,147 0.02
1,907,372 Federal Home Loan Mortgage Corp. (FHLMC) USD 5.000% 25/07/2050 242,601 0.062,738,032 Federal Home Loan Mortgage Corp. (FHLMC)(e) USD 5.952% 25/07/2050 508,229 0.135,143,539 Federal Home Loan Mortgage Corp. (FHLMC) USD 2.000% 25/09/2050 441,009 0.11363,409 Federal Home Loan Mortgage Corp. (FHLMC) USD 4.000% 25/09/2050 49,948 0.01348,401 Federal Home Loan Mortgage Corp. (FHLMC)(f) USD 4.000% 15/12/2050 387,374 0.1016,634 Federal National Mortgage Association (FNMA) USD 5.000% 01/05/2023 18,356 0.0142,893 Federal National Mortgage Association (FNMA) USD 5.000% 01/05/2023 47,336 0.0147,056 Federal National Mortgage Association (FNMA) USD 5.000% 01/09/2023 51,929 0.0164,617 Federal National Mortgage Association (FNMA) USD 5.000% 01/12/2023 71,309 0.0235,733 Federal National Mortgage Association (FNMA) USD 5.000% 01/04/2024 39,433 0.01811,432 Federal National Mortgage Association (FNMA) USD 5.000% 01/07/2024 895,486 0.2232,215 Federal National Mortgage Association (FNMA) USD 5.000% 01/07/2027 35,552 0.01103,146 Federal National Mortgage Association (FNMA) USD 8.500% 25/06/2030 125,059 0.03209,404 Federal National Mortgage Association (FNMA) USD 2.500% 01/07/2030 220,262 0.06100,463 Federal National Mortgage Association (FNMA)(e) USD 2.677% 01/06/2033 105,026 0.0332,772 Federal National Mortgage Association (FNMA)(e) USD 3.614% 01/12/2033 34,164 0.01723,790 Federal National Mortgage Association (FNMA) USD 5.500% 25/07/2035 837,466 0.21264,541 Federal National Mortgage Association (FNMA) USD 4.500% 01/07/2036 296,054 0.0727,719 Federal National Mortgage Association (FNMA) USD 4.500% 01/12/2036 30,995 0.012,442 Federal National Mortgage Association (FNMA) USD 4.500% 01/03/2039 2,739 0.002,878 Federal National Mortgage Association (FNMA) USD 4.500% 01/05/2039 3,228 0.0011,481 Federal National Mortgage Association (FNMA) USD 4.500% 01/05/2039 12,842 0.0013,444 Federal National Mortgage Association (FNMA) USD 4.500% 01/05/2039 15,074 0.0021,191 Federal National Mortgage Association (FNMA) USD 4.500% 01/06/2039 23,751 0.018,381 Federal National Mortgage Association (FNMA) USD 4.000% 01/08/2039 9,159 0.0018,678 Federal National Mortgage Association (FNMA) USD 4.500% 01/08/2039 20,935 0.0112,605 Federal National Mortgage Association (FNMA) USD 4.500% 01/08/2039 14,319 0.004,407 Federal National Mortgage Association (FNMA) USD 4.000% 01/09/2039 4,787 0.0012,553 Federal National Mortgage Association (FNMA) USD 4.500% 01/09/2039 14,091 0.0016,135 Federal National Mortgage Association (FNMA) USD 4.500% 01/10/2039 18,087 0.0017,385 Federal National Mortgage Association (FNMA) USD 4.500% 01/02/2040 19,658 0.016,407 Federal National Mortgage Association (FNMA) USD 4.500% 01/03/2040 7,190 0.004,445 Federal National Mortgage Association (FNMA) USD 4.500% 01/04/2040 4,990 0.0090,694 Federal National Mortgage Association (FNMA) USD 4.500% 01/04/2040 101,774 0.0314,764 Federal National Mortgage Association (FNMA) USD 4.500% 01/06/2040 16,694 0.00983,026 Federal National Mortgage Association (FNMA)(e) USD 4.901% 25/10/2040 129,900 0.037,458 Federal National Mortgage Association (FNMA) USD 4.500% 01/12/2040 8,350 0.00
Goldman Sachs Funds—US Mortgage Backed Securities PortfolioSchedule of InvestmentsAs at 30 November 2020
The accompanying notes are an integral part of these financial statements.
391

Holdings Security Description Currency Interest Rate(a) Maturity Date(b)Market Value
USD
% ofShareholders’
Equity
Agencies Asset Backed Obligations – (Continued)United States – (Continued)
86,988 Federal National Mortgage Association (FNMA) USD 4.500% 01/01/2041 97,486 0.0217,303 Federal National Mortgage Association (FNMA) USD 4.500% 01/04/2041 19,391 0.019,590 Federal National Mortgage Association (FNMA) USD 4.500% 01/04/2041 10,733 0.0046,768 Federal National Mortgage Association (FNMA) USD 4.500% 01/06/2041 52,532 0.01450,075 Federal National Mortgage Association (FNMA) USD 5.000% 25/06/2041 515,474 0.1334,969 Federal National Mortgage Association (FNMA) USD 4.500% 01/07/2041 39,135 0.01114,151 Federal National Mortgage Association (FNMA) USD 4.500% 01/08/2041 127,749 0.0317,575 Federal National Mortgage Association (FNMA) USD 4.500% 01/08/2041 19,531 0.01136,403 Federal National Mortgage Association (FNMA) USD 4.500% 01/09/2041 152,652 0.0433,298 Federal National Mortgage Association (FNMA) USD 4.500% 01/09/2041 37,233 0.0153,866 Federal National Mortgage Association (FNMA) USD 3.500% 01/10/2041 59,100 0.02134,128 Federal National Mortgage Association (FNMA) USD 4.500% 01/10/2041 149,980 0.04482,261 Federal National Mortgage Association (FNMA) USD 5.000% 25/10/2041 550,985 0.14117,611 Federal National Mortgage Association (FNMA) USD 4.500% 01/11/2041 131,511 0.0368,760 Federal National Mortgage Association (FNMA) USD 4.500% 01/12/2041 76,373 0.0238,731 Federal National Mortgage Association (FNMA) USD 3.500% 01/01/2042 42,543 0.0117,319 Federal National Mortgage Association (FNMA) USD 3.500% 01/01/2042 19,023 0.0126,547 Federal National Mortgage Association (FNMA) USD 4.500% 01/01/2042 29,591 0.0158,123 Federal National Mortgage Association (FNMA) USD 4.500% 01/01/2042 65,411 0.02388,163 Federal National Mortgage Association (FNMA)(e) USD 5.801% 25/02/2042 65,466 0.02459,676 Federal National Mortgage Association (FNMA) USD 4.000% 01/03/2042 502,789 0.138,783 Federal National Mortgage Association (FNMA) USD 4.500% 01/03/2042 10,010 0.0090,598 Federal National Mortgage Association (FNMA) USD 4.000% 01/04/2042 99,607 0.03418,740 Federal National Mortgage Association (FNMA) USD 4.500% 01/04/2042 472,104 0.128,036 Federal National Mortgage Association (FNMA) USD 4.500% 01/04/2042 9,051 0.005,499 Federal National Mortgage Association (FNMA) USD 3.500% 01/05/2042 5,868 0.0065,135 Federal National Mortgage Association (FNMA) USD 3.500% 01/07/2042 71,209 0.0238,735 Federal National Mortgage Association (FNMA) USD 3.500% 01/07/2042 42,347 0.01274,630 Federal National Mortgage Association (FNMA)(e) USD 6.521% 25/07/2042 46,760 0.01237,727 Federal National Mortgage Association (FNMA) USD 7.000% 25/07/2042 299,130 0.07123,931 Federal National Mortgage Association (FNMA) USD 3.000% 01/09/2042 132,451 0.0314,274 Federal National Mortgage Association (FNMA) USD 3.500% 01/09/2042 15,710 0.0033,047 Federal National Mortgage Association (FNMA) USD 3.500% 01/09/2042 36,118 0.0180,897 Federal National Mortgage Association (FNMA) USD 3.500% 01/10/2042 89,035 0.029,806 Federal National Mortgage Association (FNMA) USD 3.500% 01/10/2042 10,718 0.0052,026 Federal National Mortgage Association (FNMA) USD 7.000% 25/10/2042 64,040 0.0218,357 Federal National Mortgage Association (FNMA) USD 3.500% 01/11/2042 20,063 0.0111,621 Federal National Mortgage Association (FNMA) USD 3.000% 01/12/2042 12,667 0.0014,070 Federal National Mortgage Association (FNMA) USD 3.000% 01/12/2042 15,310 0.0012,717 Federal National Mortgage Association (FNMA) USD 3.000% 01/12/2042 13,861 0.0020,697 Federal National Mortgage Association (FNMA) USD 3.000% 01/12/2042 22,559 0.0141,064 Federal National Mortgage Association (FNMA) USD 3.500% 01/12/2042 45,157 0.0125,563 Federal National Mortgage Association (FNMA) USD 3.000% 01/01/2043 27,863 0.0120,689 Federal National Mortgage Association (FNMA) USD 3.000% 01/01/2043 22,551 0.0155,546 Federal National Mortgage Association (FNMA) USD 3.000% 01/01/2043 60,545 0.0215,273 Federal National Mortgage Association (FNMA) USD 3.000% 01/01/2043 16,647 0.0016,408 Federal National Mortgage Association (FNMA) USD 3.000% 01/01/2043 17,884 0.0010,057 Federal National Mortgage Association (FNMA) USD 3.500% 01/01/2043 10,992 0.0036,408 Federal National Mortgage Association (FNMA) USD 3.000% 01/02/2043 39,685 0.0126,273 Federal National Mortgage Association (FNMA) USD 3.500% 01/02/2043 28,539 0.01208,931 Federal National Mortgage Association (FNMA) USD 3.500% 01/02/2043 228,351 0.06116,894 Federal National Mortgage Association (FNMA) USD 3.500% 01/02/2043 128,653 0.03125,802 Federal National Mortgage Association (FNMA) USD 3.000% 01/03/2043 137,123 0.0312,445 Federal National Mortgage Association (FNMA) USD 3.000% 01/03/2043 13,565 0.0011,485 Federal National Mortgage Association (FNMA) USD 3.000% 01/03/2043 12,518 0.00114,426 Federal National Mortgage Association (FNMA) USD 3.500% 01/03/2043 125,938 0.03145,706 Federal National Mortgage Association (FNMA) USD 3.500% 01/03/2043 160,364 0.0417,628 Federal National Mortgage Association (FNMA) USD 3.500% 01/03/2043 19,148 0.0122,810 Federal National Mortgage Association (FNMA) USD 3.500% 01/03/2043 24,778 0.0130,412 Federal National Mortgage Association (FNMA) USD 3.000% 01/04/2043 33,149 0.0113,940 Federal National Mortgage Association (FNMA) USD 3.000% 01/04/2043 15,195 0.0018,212 Federal National Mortgage Association (FNMA) USD 3.000% 01/04/2043 19,851 0.0165,620 Federal National Mortgage Association (FNMA) USD 3.000% 01/04/2043 71,525 0.0256,983 Federal National Mortgage Association (FNMA) USD 3.000% 01/04/2043 62,111 0.02348,683 Federal National Mortgage Association (FNMA) USD 3.500% 01/04/2043 375,479 0.0956,448 Federal National Mortgage Association (FNMA) USD 3.000% 01/05/2043 61,527 0.02143,725 Federal National Mortgage Association (FNMA) USD 3.000% 01/05/2043 156,659 0.0454,081 Federal National Mortgage Association (FNMA) USD 3.000% 01/05/2043 58,948 0.0227,287 Federal National Mortgage Association (FNMA) USD 3.500% 01/05/2043 29,823 0.0120,427 Federal National Mortgage Association (FNMA) USD 3.500% 01/05/2043 22,178 0.0147,264 Federal National Mortgage Association (FNMA) USD 3.500% 01/05/2043 51,259 0.01
Goldman Sachs Funds—US Mortgage Backed Securities PortfolioSchedule of InvestmentsAs at 30 November 2020
The accompanying notes are an integral part of these financial statements.
392

Holdings Security Description Currency Interest Rate(a) Maturity Date(b)Market Value
USD
% ofShareholders’
Equity
Agencies Asset Backed Obligations – (Continued)United States – (Continued)
26,985 Federal National Mortgage Association (FNMA) USD 3.000% 01/06/2043 29,447 0.0119,401 Federal National Mortgage Association (FNMA) USD 3.000% 01/06/2043 21,171 0.01238,603 Federal National Mortgage Association (FNMA) USD 3.500% 01/06/2043 259,183 0.06193,502 Federal National Mortgage Association (FNMA) USD 3.500% 01/06/2043 212,969 0.0514,857 Federal National Mortgage Association (FNMA) USD 3.000% 01/07/2043 16,212 0.00206,992 Federal National Mortgage Association (FNMA) USD 3.500% 01/07/2043 227,816 0.06230,652 Federal National Mortgage Association (FNMA) USD 3.500% 01/07/2043 248,433 0.06280,697 Federal National Mortgage Association (FNMA) USD 3.500% 01/07/2043 303,443 0.0862,762 Federal National Mortgage Association (FNMA) USD 3.500% 01/07/2043 67,605 0.0268,832 Federal National Mortgage Association (FNMA) USD 3.500% 01/07/2043 75,756 0.0219,760 Federal National Mortgage Association (FNMA) USD 3.500% 01/07/2043 21,464 0.01459,156 Federal National Mortgage Association (FNMA) USD 3.500% 01/07/2043 501,832 0.1311,932 Federal National Mortgage Association (FNMA) USD 3.500% 01/08/2043 12,774 0.00201,621 Federal National Mortgage Association (FNMA) USD 3.500% 01/08/2043 216,319 0.053,272 Federal National Mortgage Association (FNMA) USD 5.000% 01/09/2043 3,676 0.0029,888 Federal National Mortgage Association (FNMA) USD 4.500% 01/03/2044 33,403 0.01
2,971,367 Federal National Mortgage Association (FNMA) USD 3.000% 25/04/2044 3,206,406 0.8013,053 Federal National Mortgage Association (FNMA) USD 3.500% 01/08/2044 13,976 0.0016,597 Federal National Mortgage Association (FNMA) USD 3.500% 01/09/2044 17,766 0.0037,606 Federal National Mortgage Association (FNMA) USD 3.500% 01/10/2044 41,848 0.0120,424 Federal National Mortgage Association (FNMA) USD 3.500% 01/12/2044 22,233 0.0119,708 Federal National Mortgage Association (FNMA) USD 3.500% 01/01/2045 21,690 0.0149,042 Federal National Mortgage Association (FNMA) USD 3.500% 01/03/2045 52,678 0.0113,627 Federal National Mortgage Association (FNMA) USD 3.500% 01/03/2045 14,998 0.0052,679 Federal National Mortgage Association (FNMA) USD 3.500% 01/03/2045 57,978 0.015,882 Federal National Mortgage Association (FNMA) USD 3.500% 01/04/2045 6,208 0.00
268,009 Federal National Mortgage Association (FNMA) USD 3.500% 01/05/2045 297,986 0.0732,094 Federal National Mortgage Association (FNMA) USD 3.500% 01/05/2045 34,378 0.019,883 Federal National Mortgage Association (FNMA) USD 3.500% 01/05/2045 10,442 0.00
1,024,661 Federal National Mortgage Association (FNMA)(e) USD 5.451% 25/05/2045 152,486 0.042,422,213 Federal National Mortgage Association (FNMA) USD 4.500% 01/06/2045 2,697,114 0.671,093,868 Federal National Mortgage Association (FNMA)(e) USD 5.951% 25/06/2045 220,027 0.0629,580 Federal National Mortgage Association (FNMA) USD 3.500% 01/07/2045 31,845 0.0131,081 Federal National Mortgage Association (FNMA) USD 3.500% 01/07/2045 33,397 0.0121,385 Federal National Mortgage Association (FNMA) USD 4.500% 01/08/2045 23,489 0.01440,623 Federal National Mortgage Association (FNMA) USD 4.000% 01/11/2045 480,954 0.12
1,328,845 Federal National Mortgage Association (FNMA) USD 4.500% 01/11/2045 1,461,453 0.36222,182 Federal National Mortgage Association (FNMA) USD 3.500% 01/03/2046 246,686 0.06147,579 Federal National Mortgage Association (FNMA) USD 4.000% 01/03/2046 159,540 0.04127,775 Federal National Mortgage Association (FNMA) USD 4.000% 01/03/2046 138,551 0.0333,147 Federal National Mortgage Association (FNMA) USD 3.500% 01/04/2046 36,761 0.01929,873 Federal National Mortgage Association (FNMA) USD 3.500% 01/05/2046 1,010,634 0.25586,381 Federal National Mortgage Association (FNMA) USD 3.500% 01/06/2046 650,320 0.16171,041 Federal National Mortgage Association (FNMA) USD 4.000% 01/06/2046 184,820 0.05188,828 Federal National Mortgage Association (FNMA) USD 3.000% 01/07/2046 198,028 0.05280,608 Federal National Mortgage Association (FNMA) USD 3.000% 01/07/2046 295,187 0.07782,516 Federal National Mortgage Association (FNMA) USD 4.500% 01/07/2046 857,637 0.21267,341 Federal National Mortgage Association (FNMA) USD 3.000% 01/08/2046 280,311 0.0745,250 Federal National Mortgage Association (FNMA) USD 4.000% 01/08/2046 48,962 0.01111,153 Federal National Mortgage Association (FNMA) USD 3.000% 01/09/2046 116,514 0.0337,122 Federal National Mortgage Association (FNMA) USD 3.000% 01/10/2046 38,950 0.01291,366 Federal National Mortgage Association (FNMA) USD 3.000% 01/10/2046 305,732 0.08240,053 Federal National Mortgage Association (FNMA) USD 4.000% 01/10/2046 257,982 0.0652,842 Federal National Mortgage Association (FNMA) USD 4.000% 01/10/2046 57,146 0.0122,757 Federal National Mortgage Association (FNMA) USD 4.500% 01/10/2046 25,253 0.01
1,407,313 Federal National Mortgage Association (FNMA)(e) USD 5.951% 25/10/2046 300,130 0.08238,640 Federal National Mortgage Association (FNMA) USD 3.000% 01/11/2046 250,071 0.06226,890 Federal National Mortgage Association (FNMA) USD 3.000% 01/11/2046 237,981 0.0621,821 Federal National Mortgage Association (FNMA) USD 3.000% 01/11/2046 22,852 0.01800,686 Federal National Mortgage Association (FNMA) USD 3.000% 01/11/2046 842,813 0.21949,512 Federal National Mortgage Association (FNMA) USD 3.000% 01/12/2046 999,288 0.25146,807 Federal National Mortgage Association (FNMA) USD 3.000% 01/12/2046 154,518 0.04136,372 Federal National Mortgage Association (FNMA) USD 3.000% 01/12/2046 142,994 0.04146,818 Federal National Mortgage Association (FNMA) USD 3.000% 01/12/2046 153,959 0.0422,512 Federal National Mortgage Association (FNMA) USD 4.000% 01/02/2047 24,642 0.01861,202 Federal National Mortgage Association (FNMA) USD 4.500% 01/02/2047 956,527 0.2461,156 Federal National Mortgage Association (FNMA) USD 4.000% 01/03/2047 66,942 0.02263,755 Federal National Mortgage Association (FNMA) USD 4.000% 01/04/2047 288,381 0.0721,752 Federal National Mortgage Association (FNMA) USD 4.000% 01/06/2047 23,770 0.01
1,230,731 Federal National Mortgage Association (FNMA) USD 4.500% 01/07/2047 1,346,958 0.343,508,897 Federal National Mortgage Association (FNMA) USD 3.000% 01/09/2047 3,691,498 0.92
Goldman Sachs Funds—US Mortgage Backed Securities PortfolioSchedule of InvestmentsAs at 30 November 2020
The accompanying notes are an integral part of these financial statements.
393

Holdings Security Description Currency Interest Rate(a) Maturity Date(b)Market Value
USD
% ofShareholders’
Equity
Agencies Asset Backed Obligations – (Continued)United States – (Continued)
49,067 Federal National Mortgage Association (FNMA) USD 4.000% 01/09/2047 53,495 0.01180,715 Federal National Mortgage Association (FNMA) USD 5.000% 01/09/2047 200,598 0.05720,490 Federal National Mortgage Association (FNMA)(e) USD 6.001% 25/09/2047 132,506 0.0369,284 Federal National Mortgage Association (FNMA) USD 4.000% 01/11/2047 75,536 0.02612,351 Federal National Mortgage Association (FNMA)(e) USD 6.001% 25/11/2047 110,227 0.0343,669 Federal National Mortgage Association (FNMA) USD 4.000% 01/01/2048 47,597 0.01656,725 Federal National Mortgage Association (FNMA)(e) USD 6.001% 25/01/2048 112,002 0.03
1,793,139 Federal National Mortgage Association (FNMA) USD 4.000% 01/02/2048 1,954,956 0.4978,937 Federal National Mortgage Association (FNMA) USD 4.000% 01/02/2048 86,036 0.02
2,309,262 Federal National Mortgage Association (FNMA) USD 3.500% 01/06/2048 2,442,834 0.6125,366 Federal National Mortgage Association (FNMA) USD 4.000% 01/06/2048 27,648 0.0130,612 Federal National Mortgage Association (FNMA) USD 5.000% 01/06/2048 34,072 0.01696,825 Federal National Mortgage Association (FNMA) USD 5.000% 01/06/2048 776,599 0.19491,827 Federal National Mortgage Association (FNMA) USD 5.000% 01/08/2048 544,711 0.14905,602 Federal National Mortgage Association (FNMA) USD 4.500% 01/09/2048 983,200 0.2422,411 Federal National Mortgage Association (FNMA) USD 5.000% 01/09/2048 24,807 0.01
1,086,125 Federal National Mortgage Association (FNMA) USD 3.500% 01/11/2048 1,150,187 0.2990,882 Federal National Mortgage Association (FNMA) USD 4.500% 01/11/2048 98,555 0.02
1,994,837 Federal National Mortgage Association (FNMA) USD 5.000% 01/11/2048 2,274,788 0.5741,364 Federal National Mortgage Association (FNMA) USD 5.000% 01/11/2048 45,757 0.0164,714 Federal National Mortgage Association (FNMA) USD 4.500% 01/12/2048 71,533 0.02871,756 Federal National Mortgage Association (FNMA) USD 4.500% 01/12/2048 944,710 0.2467,161 Federal National Mortgage Association (FNMA) USD 4.500% 01/12/2048 72,916 0.02505,163 Federal National Mortgage Association (FNMA) USD 5.000% 01/12/2048 558,501 0.14208,165 Federal National Mortgage Association (FNMA) USD 5.000% 01/01/2049 230,353 0.0678,437 Federal National Mortgage Association (FNMA) USD 5.000% 01/03/2049 86,965 0.02318,677 Federal National Mortgage Association (FNMA) USD 4.000% 01/05/2049 342,854 0.09345,877 Federal National Mortgage Association (FNMA) USD 4.000% 01/05/2049 372,118 0.0918,476 Federal National Mortgage Association (FNMA) USD 5.000% 01/05/2049 20,444 0.01677,835 Federal National Mortgage Association (FNMA) USD 5.000% 01/06/2049 749,531 0.19784,210 Federal National Mortgage Association (FNMA) USD 3.500% 01/07/2049 854,280 0.2162,690 Federal National Mortgage Association (FNMA) USD 5.000% 01/08/2049 69,431 0.02
1,508,135 Federal National Mortgage Association (FNMA) USD 5.000% 01/09/2049 1,668,151 0.41318,236 Federal National Mortgage Association (FNMA) USD 5.000% 01/09/2049 351,957 0.09
1,620,385 Federal National Mortgage Association (FNMA) USD 3.000% 01/10/2049 1,720,627 0.4340,999,984 Federal National Mortgage Association (FNMA) USD 4.500% 01/01/2050 44,461,888 11.051,792,382 Federal National Mortgage Association (FNMA) USD 3.000% 01/02/2050 1,898,788 0.4790,508 Federal National Mortgage Association (FNMA) USD 4.500% 01/02/2050 98,094 0.0289,702 Federal National Mortgage Association (FNMA) USD 4.500% 01/02/2050 97,220 0.0253,911 Federal National Mortgage Association (FNMA) USD 4.500% 01/03/2050 58,416 0.02744,683 Federal National Mortgage Association (FNMA) USD 5.000% 01/03/2050 827,083 0.21
11,681,766 Federal National Mortgage Association (FNMA) USD 5.000% 01/05/2050 12,919,600 3.2140,487 Federal National Mortgage Association (FNMA) USD 4.500% 01/06/2050 43,893 0.01565,396 Federal National Mortgage Association (FNMA) USD 4.000% 25/07/2050 73,010 0.02518,189 Federal National Mortgage Association (FNMA) USD 4.000% 25/07/2050 70,121 0.02
5,646,778 Federal National Mortgage Association (FNMA) USD 2.000% 25/09/2050 484,157 0.12337,500 Federal National Mortgage Association (FNMA) USD 4.000% 25/09/2050 46,479 0.01
1,762,247 Federal National Mortgage Association (FNMA) USD 4.500% 01/06/2051 1,979,634 0.491,789,348 Federal National Mortgage Association (FNMA) USD 4.000% 01/07/2056 1,995,284 0.502,544,323 Federal National Mortgage Association (FNMA) USD 4.000% 01/07/2056 2,849,494 0.712,695,889 Federal National Mortgage Association (FNMA) USD 3.500% 01/10/2056 3,005,432 0.751,000,000 Federal National Mortgage Association (FNMA) TBA(g) USD 5.000% 12/11/2050 1,107,031 0.2851,000,000 Federal National Mortgage Association (FNMA) TBA(g) USD 2.000% 14/12/2050 52,922,560 13.1514,000,000 Federal National Mortgage Association (FNMA) TBA(g) USD 3.000% 14/12/2050 14,626,719 3.631,000,000 Federal National Mortgage Association (FNMA) TBA(g) USD 4.000% 14/12/2050 1,067,070 0.279,000,000 Federal National Mortgage Association (FNMA) TBA(g) USD 5.000% 14/12/2050 9,957,656 2.47
5,341 Government National Mortgage Association (GNMA)(e) USD 2.875% 20/06/2023 5,423 0.002,707 Government National Mortgage Association (GNMA)(e) USD 2.250% 20/07/2023 2,752 0.002,591 Government National Mortgage Association (GNMA)(e) USD 2.250% 20/08/2023 2,636 0.005,901 Government National Mortgage Association (GNMA)(e) USD 2.250% 20/09/2023 5,976 0.002,126 Government National Mortgage Association (GNMA)(e) USD 3.000% 20/03/2024 2,161 0.0012,880 Government National Mortgage Association (GNMA)(e) USD 2.875% 20/04/2024 13,110 0.006,692 Government National Mortgage Association (GNMA)(e) USD 2.875% 20/04/2024 6,845 0.002,735 Government National Mortgage Association (GNMA)(e) USD 2.875% 20/05/2024 2,799 0.005,781 Government National Mortgage Association (GNMA)(e) USD 2.875% 20/06/2024 5,886 0.0012,812 Government National Mortgage Association (GNMA)(e) USD 2.875% 20/06/2024 13,046 0.004,329 Government National Mortgage Association (GNMA)(e) USD 2.875% 20/06/2024 4,417 0.006,258 Government National Mortgage Association (GNMA)(e) USD 2.250% 20/07/2024 6,352 0.007,897 Government National Mortgage Association (GNMA)(e) USD 2.250% 20/07/2024 8,038 0.0013,140 Government National Mortgage Association (GNMA)(e) USD 2.250% 20/08/2024 13,339 0.006,473 Government National Mortgage Association (GNMA)(e) USD 2.250% 20/08/2024 6,591 0.00
Goldman Sachs Funds—US Mortgage Backed Securities PortfolioSchedule of InvestmentsAs at 30 November 2020
The accompanying notes are an integral part of these financial statements.
394

Holdings Security Description Currency Interest Rate(a) Maturity Date(b)Market Value
USD
% ofShareholders’
Equity
Agencies Asset Backed Obligations – (Continued)United States – (Continued)
2,376 Government National Mortgage Association (GNMA)(e) USD 2.250% 20/09/2024 2,412 0.003,730 Government National Mortgage Association (GNMA)(e) USD 2.250% 20/09/2024 3,787 0.007,642 Government National Mortgage Association (GNMA)(e) USD 3.125% 20/11/2024 7,790 0.002,798 Government National Mortgage Association (GNMA)(e) USD 3.125% 20/12/2024 2,853 0.006,127 Government National Mortgage Association (GNMA)(e) USD 3.125% 20/12/2024 6,292 0.005,087 Government National Mortgage Association (GNMA)(e) USD 3.000% 20/01/2025 5,195 0.003,171 Government National Mortgage Association (GNMA)(e) USD 3.000% 20/02/2025 3,239 0.0012,302 Government National Mortgage Association (GNMA)(e) USD 2.875% 20/05/2025 12,595 0.0022,434 Government National Mortgage Association (GNMA) USD 7.000% 15/07/2025 24,217 0.0110,745 Government National Mortgage Association (GNMA)(e) USD 2.250% 20/07/2025 10,977 0.004,473 Government National Mortgage Association (GNMA)(e) USD 3.000% 20/02/2026 4,568 0.001,000 Government National Mortgage Association (GNMA) USD 7.000% 15/04/2026 1,084 0.00240 Government National Mortgage Association (GNMA)(e) USD 2.250% 20/07/2026 245 0.00
1,727 Government National Mortgage Association (GNMA) USD 7.000% 15/10/2026 1,909 0.007,364 Government National Mortgage Association (GNMA)(e) USD 3.000% 20/01/2027 7,534 0.004,650 Government National Mortgage Association (GNMA)(e) USD 3.000% 20/01/2027 4,779 0.004,984 Government National Mortgage Association (GNMA)(e) USD 3.000% 20/02/2027 5,100 0.0017,867 Government National Mortgage Association (GNMA)(e) USD 2.875% 20/04/2027 18,310 0.0120,717 Government National Mortgage Association (GNMA)(e) USD 2.875% 20/04/2027 21,230 0.014,020 Government National Mortgage Association (GNMA)(e) USD 2.875% 20/05/2027 4,120 0.005,760 Government National Mortgage Association (GNMA)(e) USD 2.875% 20/06/2027 5,904 0.002,119 Government National Mortgage Association (GNMA)(e) USD 3.125% 20/11/2027 2,167 0.006,086 Government National Mortgage Association (GNMA)(e) USD 3.125% 20/12/2027 6,225 0.0013,616 Government National Mortgage Association (GNMA)(e) USD 3.000% 20/01/2028 13,955 0.001,805 Government National Mortgage Association (GNMA) USD 7.000% 15/02/2028 1,812 0.004,369 Government National Mortgage Association (GNMA)(e) USD 3.000% 20/02/2028 4,477 0.004,919 Government National Mortgage Association (GNMA)(e) USD 3.000% 20/03/2028 5,043 0.0022,506 Government National Mortgage Association (GNMA)(e) USD 2.250% 20/07/2029 23,060 0.0112,052 Government National Mortgage Association (GNMA)(e) USD 2.250% 20/08/2029 12,338 0.002,766 Government National Mortgage Association (GNMA)(e) USD 2.250% 20/09/2029 2,835 0.007,622 Government National Mortgage Association (GNMA)(e) USD 3.125% 20/10/2029 7,819 0.004,265 Government National Mortgage Association (GNMA)(e) USD 3.125% 20/10/2029 4,376 0.006,053 Government National Mortgage Association (GNMA)(e) USD 3.125% 20/11/2029 6,210 0.0011,346 Government National Mortgage Association (GNMA)(e) USD 3.125% 20/11/2029 11,640 0.002,714 Government National Mortgage Association (GNMA)(e) USD 3.125% 20/12/2029 2,784 0.00551 Government National Mortgage Association (GNMA)(e) USD 3.125% 20/12/2029 565 0.00
4,657 Government National Mortgage Association (GNMA)(e) USD 3.000% 20/01/2030 4,787 0.001,978 Government National Mortgage Association (GNMA)(e) USD 3.000% 20/02/2030 2,034 0.0012,776 Government National Mortgage Association (GNMA)(e) USD 3.000% 20/03/2030 13,138 0.002,985 Government National Mortgage Association (GNMA)(e) USD 2.875% 20/04/2030 3,072 0.0010,676 Government National Mortgage Association (GNMA)(e) USD 2.875% 20/04/2030 10,993 0.0017,552 Government National Mortgage Association (GNMA)(e) USD 2.875% 20/05/2030 18,075 0.0017,817 Government National Mortgage Association (GNMA)(e) USD 2.875% 20/05/2030 18,484 0.011,739 Government National Mortgage Association (GNMA)(e) USD 2.875% 20/05/2030 1,790 0.003,911 Government National Mortgage Association (GNMA)(e) USD 2.875% 20/06/2030 4,026 0.0030,538 Government National Mortgage Association (GNMA)(e) USD 2.250% 20/07/2030 31,576 0.016,297 Government National Mortgage Association (GNMA)(e) USD 2.250% 20/09/2030 6,513 0.0010,239 Government National Mortgage Association (GNMA)(e) USD 3.125% 20/10/2030 10,518 0.001,395 Government National Mortgage Association (GNMA) USD 7.000% 15/06/2031 1,443 0.003,115 Government National Mortgage Association (GNMA) USD 7.000% 15/07/2031 3,760 0.003,004 Government National Mortgage Association (GNMA) USD 7.000% 15/11/2031 3,128 0.00233 Government National Mortgage Association (GNMA) USD 6.500% 15/01/2032 258 0.00664 Government National Mortgage Association (GNMA) USD 6.500% 15/02/2032 755 0.00505 Government National Mortgage Association (GNMA) USD 6.500% 15/02/2032 573 0.00916 Government National Mortgage Association (GNMA) USD 6.500% 15/08/2034 1,073 0.00272 Government National Mortgage Association (GNMA) USD 6.500% 15/10/2035 323 0.00739 Government National Mortgage Association (GNMA) USD 6.500% 15/02/2036 868 0.00
1,644 Government National Mortgage Association (GNMA) USD 6.500% 15/02/2036 1,950 0.001,046 Government National Mortgage Association (GNMA) USD 6.500% 15/02/2036 1,230 0.00618 Government National Mortgage Association (GNMA) USD 6.500% 15/03/2036 726 0.00
1,321 Government National Mortgage Association (GNMA) USD 6.500% 15/03/2036 1,564 0.001,488 Government National Mortgage Association (GNMA) USD 6.500% 15/04/2036 1,767 0.001,396 Government National Mortgage Association (GNMA) USD 6.500% 15/04/2036 1,658 0.00408 Government National Mortgage Association (GNMA) USD 6.500% 15/04/2036 452 0.00782 Government National Mortgage Association (GNMA) USD 6.500% 15/04/2036 930 0.00
1,674 Government National Mortgage Association (GNMA) USD 6.500% 15/04/2036 1,952 0.001,392 Government National Mortgage Association (GNMA) USD 6.500% 15/05/2036 1,643 0.001,777 Government National Mortgage Association (GNMA) USD 6.500% 15/05/2036 2,105 0.001,584 Government National Mortgage Association (GNMA) USD 6.500% 15/05/2036 1,864 0.002,436 Government National Mortgage Association (GNMA) USD 6.500% 15/05/2036 2,900 0.001,260 Government National Mortgage Association (GNMA) USD 6.500% 15/05/2036 1,484 0.00
Goldman Sachs Funds—US Mortgage Backed Securities PortfolioSchedule of InvestmentsAs at 30 November 2020
The accompanying notes are an integral part of these financial statements.
395

Holdings Security Description Currency Interest Rate(a) Maturity Date(b)Market Value
USD
% ofShareholders’
Equity
Agencies Asset Backed Obligations – (Continued)United States – (Continued)
878 Government National Mortgage Association (GNMA) USD 6.500% 15/05/2036 1,034 0.00357 Government National Mortgage Association (GNMA) USD 6.500% 15/05/2036 425 0.00
1,119 Government National Mortgage Association (GNMA) USD 6.500% 15/05/2036 1,317 0.001,632 Government National Mortgage Association (GNMA) USD 6.500% 15/05/2036 1,944 0.00510 Government National Mortgage Association (GNMA) USD 6.500% 15/06/2036 602 0.00
3,872 Government National Mortgage Association (GNMA) USD 6.500% 15/06/2036 4,552 0.00564 Government National Mortgage Association (GNMA) USD 6.500% 15/06/2036 662 0.00425 Government National Mortgage Association (GNMA) USD 6.500% 15/06/2036 500 0.00
1,834 Government National Mortgage Association (GNMA) USD 6.500% 15/06/2036 2,179 0.00393 Government National Mortgage Association (GNMA) USD 6.500% 15/06/2036 462 0.00
1,034 Government National Mortgage Association (GNMA) USD 6.500% 15/07/2036 1,219 0.007,783 Government National Mortgage Association (GNMA) USD 6.500% 15/07/2036 9,150 0.005,691 Government National Mortgage Association (GNMA) USD 6.500% 15/07/2036 6,773 0.009,625 Government National Mortgage Association (GNMA) USD 6.500% 15/07/2036 11,312 0.003,966 Government National Mortgage Association (GNMA) USD 6.500% 15/07/2036 4,397 0.002,285 Government National Mortgage Association (GNMA) USD 6.500% 15/07/2036 2,691 0.001,611 Government National Mortgage Association (GNMA) USD 6.500% 15/07/2036 1,923 0.001,216 Government National Mortgage Association (GNMA) USD 6.500% 15/07/2036 1,347 0.00840 Government National Mortgage Association (GNMA) USD 6.500% 15/08/2036 988 0.00
1,703 Government National Mortgage Association (GNMA) USD 6.500% 15/08/2036 1,888 0.003,658 Government National Mortgage Association (GNMA) USD 6.500% 15/08/2036 4,426 0.001,366 Government National Mortgage Association (GNMA) USD 6.500% 15/08/2036 1,611 0.001,095 Government National Mortgage Association (GNMA) USD 6.500% 15/08/2036 1,289 0.00671 Government National Mortgage Association (GNMA) USD 6.500% 15/08/2036 799 0.00556 Government National Mortgage Association (GNMA) USD 6.500% 15/08/2036 617 0.00743 Government National Mortgage Association (GNMA) USD 6.500% 15/08/2036 879 0.00984 Government National Mortgage Association (GNMA) USD 6.500% 15/08/2036 1,170 0.00
3,506 Government National Mortgage Association (GNMA) USD 6.500% 15/08/2036 4,174 0.002,133 Government National Mortgage Association (GNMA) USD 6.500% 15/08/2036 2,365 0.004,142 Government National Mortgage Association (GNMA) USD 6.500% 15/08/2036 4,870 0.001,460 Government National Mortgage Association (GNMA) USD 6.500% 15/08/2036 1,720 0.001,382 Government National Mortgage Association (GNMA) USD 6.500% 15/08/2036 1,625 0.002,476 Government National Mortgage Association (GNMA) USD 6.500% 15/08/2036 2,873 0.001,081 Government National Mortgage Association (GNMA) USD 6.500% 15/08/2036 1,282 0.00200 Government National Mortgage Association (GNMA) USD 6.500% 15/08/2036 236 0.00
5,749 Government National Mortgage Association (GNMA) USD 6.500% 15/08/2036 6,533 0.00635 Government National Mortgage Association (GNMA) USD 6.500% 15/08/2036 749 0.00
1,806 Government National Mortgage Association (GNMA) USD 6.500% 15/08/2036 2,127 0.00715 Government National Mortgage Association (GNMA) USD 6.500% 15/08/2036 840 0.00
1,112 Government National Mortgage Association (GNMA) USD 6.500% 15/08/2036 1,307 0.00428 Government National Mortgage Association (GNMA) USD 6.500% 15/09/2036 505 0.00
1,768 Government National Mortgage Association (GNMA) USD 6.500% 15/09/2036 2,097 0.002,168 Government National Mortgage Association (GNMA) USD 6.500% 15/09/2036 2,403 0.00890 Government National Mortgage Association (GNMA) USD 6.500% 15/09/2036 1,057 0.00234 Government National Mortgage Association (GNMA) USD 6.500% 15/09/2036 276 0.00
5,387 Government National Mortgage Association (GNMA) USD 6.500% 15/09/2036 6,413 0.009,247 Government National Mortgage Association (GNMA) USD 6.500% 15/09/2036 10,882 0.009,879 Government National Mortgage Association (GNMA) USD 6.500% 15/09/2036 11,636 0.003,755 Government National Mortgage Association (GNMA) USD 6.500% 15/09/2036 4,465 0.001,118 Government National Mortgage Association (GNMA) USD 6.500% 15/09/2036 1,318 0.001,018 Government National Mortgage Association (GNMA) USD 6.500% 15/09/2036 1,199 0.00688 Government National Mortgage Association (GNMA) USD 6.500% 15/09/2036 817 0.00
2,259 Government National Mortgage Association (GNMA) USD 6.500% 15/09/2036 2,686 0.0016,304 Government National Mortgage Association (GNMA) USD 6.500% 15/09/2036 19,380 0.01433 Government National Mortgage Association (GNMA) USD 6.500% 15/09/2036 521 0.00
1,897 Government National Mortgage Association (GNMA) USD 6.500% 15/09/2036 2,235 0.003,304 Government National Mortgage Association (GNMA) USD 6.500% 15/09/2036 3,751 0.003,957 Government National Mortgage Association (GNMA) USD 6.500% 15/09/2036 4,803 0.001,923 Government National Mortgage Association (GNMA) USD 6.500% 15/09/2036 2,272 0.00949 Government National Mortgage Association (GNMA) USD 6.500% 15/09/2036 1,117 0.00
2,409 Government National Mortgage Association (GNMA) USD 6.500% 15/09/2036 2,705 0.001,104 Government National Mortgage Association (GNMA) USD 6.500% 15/10/2036 1,315 0.00767 Government National Mortgage Association (GNMA) USD 6.500% 15/10/2036 850 0.00986 Government National Mortgage Association (GNMA) USD 6.500% 15/10/2036 1,161 0.00
1,208 Government National Mortgage Association (GNMA) USD 6.500% 15/10/2036 1,425 0.00696 Government National Mortgage Association (GNMA) USD 6.500% 15/10/2036 820 0.00
2,351 Government National Mortgage Association (GNMA) USD 6.500% 15/10/2036 2,798 0.001,215 Government National Mortgage Association (GNMA) USD 6.500% 15/10/2036 1,428 0.002,129 Government National Mortgage Association (GNMA) USD 6.500% 15/10/2036 2,502 0.002,484 Government National Mortgage Association (GNMA) USD 6.500% 15/10/2036 3,059 0.00684 Government National Mortgage Association (GNMA) USD 6.500% 15/10/2036 806 0.00
Goldman Sachs Funds—US Mortgage Backed Securities PortfolioSchedule of InvestmentsAs at 30 November 2020
The accompanying notes are an integral part of these financial statements.
396

Holdings Security Description Currency Interest Rate(a) Maturity Date(b)Market Value
USD
% ofShareholders’
Equity
Agencies Asset Backed Obligations – (Continued)United States – (Continued)
5,031 Government National Mortgage Association (GNMA) USD 6.500% 15/10/2036 5,975 0.003,389 Government National Mortgage Association (GNMA) USD 6.500% 15/10/2036 3,942 0.002,033 Government National Mortgage Association (GNMA) USD 6.500% 15/10/2036 2,395 0.002,737 Government National Mortgage Association (GNMA) USD 6.500% 15/10/2036 3,218 0.001,397 Government National Mortgage Association (GNMA) USD 6.500% 15/11/2036 1,548 0.001,472 Government National Mortgage Association (GNMA) USD 6.500% 15/11/2036 1,733 0.001,133 Government National Mortgage Association (GNMA) USD 6.500% 15/11/2036 1,347 0.006,484 Government National Mortgage Association (GNMA) USD 6.500% 15/11/2036 7,658 0.001,178 Government National Mortgage Association (GNMA) USD 6.500% 15/11/2036 1,391 0.0011,438 Government National Mortgage Association (GNMA) USD 6.500% 15/11/2036 13,783 0.003,506 Government National Mortgage Association (GNMA) USD 6.500% 15/11/2036 4,121 0.004,588 Government National Mortgage Association (GNMA) USD 6.500% 15/11/2036 5,408 0.005,594 Government National Mortgage Association (GNMA) USD 6.500% 15/11/2036 6,630 0.00877 Government National Mortgage Association (GNMA) USD 6.500% 15/11/2036 971 0.00
1,712 Government National Mortgage Association (GNMA) USD 6.500% 15/11/2036 1,986 0.007,021 Government National Mortgage Association (GNMA) USD 6.500% 15/12/2036 8,257 0.004,317 Government National Mortgage Association (GNMA) USD 6.500% 15/12/2036 5,088 0.004,048 Government National Mortgage Association (GNMA) USD 6.500% 15/12/2036 4,771 0.001,339 Government National Mortgage Association (GNMA) USD 6.500% 15/12/2036 1,484 0.004,584 Government National Mortgage Association (GNMA) USD 6.500% 15/01/2037 5,391 0.004,049 Government National Mortgage Association (GNMA) USD 6.500% 15/01/2037 4,775 0.001,352 Government National Mortgage Association (GNMA) USD 6.500% 15/01/2037 1,599 0.002,063 Government National Mortgage Association (GNMA) USD 6.500% 15/03/2037 2,457 0.00738 Government National Mortgage Association (GNMA) USD 6.500% 15/04/2037 872 0.00
3,668 Government National Mortgage Association (GNMA) USD 6.500% 15/04/2037 4,322 0.001,747 Government National Mortgage Association (GNMA) USD 6.500% 15/05/2037 1,940 0.002,486 Government National Mortgage Association (GNMA) USD 6.500% 15/08/2037 2,934 0.008,833 Government National Mortgage Association (GNMA) USD 6.500% 15/09/2037 10,415 0.00479 Government National Mortgage Association (GNMA) USD 6.500% 15/09/2037 531 0.00
12,278 Government National Mortgage Association (GNMA) USD 6.500% 15/10/2037 14,285 0.001,937 Government National Mortgage Association (GNMA) USD 6.500% 15/11/2037 2,287 0.00838 Government National Mortgage Association (GNMA) USD 6.500% 15/11/2037 928 0.00826 Government National Mortgage Association (GNMA) USD 6.500% 15/11/2037 976 0.00
2,856 Government National Mortgage Association (GNMA) USD 6.500% 15/05/2038 3,384 0.0066,152 Government National Mortgage Association (GNMA) USD 5.500% 15/01/2039 77,443 0.02573 Government National Mortgage Association (GNMA) USD 6.500% 15/01/2039 667 0.00
2,226 Government National Mortgage Association (GNMA) USD 6.500% 15/02/2039 2,623 0.00166,070 Government National Mortgage Association (GNMA) USD 5.000% 20/01/2040 191,490 0.0528,264 Government National Mortgage Association (GNMA)(e) USD 5.789% 20/07/2040 6,165 0.005,249 Government National Mortgage Association (GNMA) USD 4.000% 20/02/2041 5,802 0.001,268 Government National Mortgage Association (GNMA) USD 4.000% 20/10/2041 1,400 0.008,179 Government National Mortgage Association (GNMA) USD 4.000% 20/11/2041 9,028 0.00
126,268 Government National Mortgage Association (GNMA) USD 3.500% 15/02/2042 135,095 0.034,327 Government National Mortgage Association (GNMA) USD 4.000% 20/04/2042 4,776 0.002,638 Government National Mortgage Association (GNMA) USD 4.000% 20/10/2042 2,903 0.00
101,742 Government National Mortgage Association (GNMA) USD 3.500% 15/11/2042 109,285 0.0378,006 Government National Mortgage Association (GNMA) USD 4.500% 20/12/2042 5,914 0.00
1,694,742 Government National Mortgage Association (GNMA)(e) USD 6.289% 20/07/2043 333,709 0.0844,430 Government National Mortgage Association (GNMA) USD 4.000% 20/08/2043 48,815 0.01351,302 Government National Mortgage Association (GNMA)(e) USD 5.899% 20/08/2043 71,620 0.0251,960 Government National Mortgage Association (GNMA)(e) USD 5.949% 20/09/2043 10,349 0.004,393 Government National Mortgage Association (GNMA) USD 4.000% 20/03/2044 4,826 0.005,321 Government National Mortgage Association (GNMA) USD 4.000% 20/05/2044 5,836 0.00
203,716 Government National Mortgage Association (GNMA) USD 4.000% 20/07/2044 223,439 0.061,007,350 Government National Mortgage Association (GNMA)(e) USD 5.449% 20/08/2044 183,091 0.05213,060 Government National Mortgage Association (GNMA)(e) USD 5.449% 20/09/2044 37,740 0.01471,195 Government National Mortgage Association (GNMA)(e) USD 5.454% 16/10/2044 83,849 0.02369,733 Government National Mortgage Association (GNMA) USD 4.000% 20/11/2044 405,530 0.1035,131 Government National Mortgage Association (GNMA) USD 3.500% 20/04/2045 1,646 0.00
2,269,960 Government National Mortgage Association (GNMA)(e) USD 5.449% 20/04/2045 378,462 0.0937,243 Government National Mortgage Association (GNMA) USD 3.500% 20/05/2045 2,486 0.0056,432 Government National Mortgage Association (GNMA) USD 4.000% 20/05/2045 61,790 0.0271,699 Government National Mortgage Association (GNMA) USD 3.500% 20/06/2045 5,249 0.00770,256 Government National Mortgage Association (GNMA) USD 4.000% 20/06/2045 69,893 0.0293,619 Government National Mortgage Association (GNMA) USD 4.000% 20/07/2045 102,507 0.03
2,587,282 Government National Mortgage Association (GNMA) USD 4.000% 20/08/2045 282,684 0.07266,555 Government National Mortgage Association (GNMA)(e) USD 6.099% 20/08/2045 47,995 0.01313,524 Government National Mortgage Association (GNMA)(e) USD 6.099% 20/09/2045 60,006 0.02633,740 Government National Mortgage Association (GNMA) USD 4.500% 20/03/2046 701,693 0.17
1,947,017 Government National Mortgage Association (GNMA) USD 3.000% 20/06/2046 2,062,093 0.51814,851 Government National Mortgage Association (GNMA) USD 3.000% 20/08/2046 860,565 0.21
Goldman Sachs Funds—US Mortgage Backed Securities PortfolioSchedule of InvestmentsAs at 30 November 2020
The accompanying notes are an integral part of these financial statements.
397

Holdings Security Description Currency Interest Rate(a) Maturity Date(b)Market Value
USD
% ofShareholders’
Equity
Agencies Asset Backed Obligations – (Continued)United States – (Continued)
2,127,635 Government National Mortgage Association (GNMA) USD 3.500% 20/09/2046 2,283,426 0.57721,688 Government National Mortgage Association (GNMA) USD 3.500% 20/10/2046 774,671 0.19919,771 Government National Mortgage Association (GNMA) USD 3.500% 20/12/2046 982,362 0.24937,188 Government National Mortgage Association (GNMA) USD 3.500% 20/01/2047 1,004,758 0.25
1,025,812 Government National Mortgage Association (GNMA) USD 3.500% 20/02/2047 1,102,741 0.2716,144 Government National Mortgage Association (GNMA) USD 3.500% 20/03/2047 17,366 0.00500,530 Government National Mortgage Association (GNMA) USD 4.500% 20/03/2047 549,194 0.14
2,528,237 Government National Mortgage Association (GNMA) USD 3.500% 20/04/2047 2,708,612 0.6727,890 Government National Mortgage Association (GNMA) USD 3.500% 20/05/2047 29,982 0.01
1,697,232 Government National Mortgage Association (GNMA) USD 4.500% 20/05/2047 1,852,845 0.46493,076 Government National Mortgage Association (GNMA) USD 4.500% 20/06/2047 539,937 0.13604,653 Government National Mortgage Association (GNMA)(e) USD 5.509% 20/07/2047 92,384 0.0240,030 Government National Mortgage Association (GNMA) USD 3.500% 20/08/2047 42,838 0.0162,036 Government National Mortgage Association (GNMA) USD 4.500% 20/08/2047 67,699 0.029,763 Government National Mortgage Association (GNMA) USD 3.500% 20/09/2047 10,500 0.0016,071 Government National Mortgage Association (GNMA) USD 3.500% 20/10/2047 17,212 0.00787,437 Government National Mortgage Association (GNMA) USD 3.500% 20/11/2047 842,942 0.21270,600 Government National Mortgage Association (GNMA) USD 3.500% 20/11/2047 288,097 0.0715,010 Government National Mortgage Association (GNMA) USD 3.500% 20/12/2047 16,043 0.00
1,873,123 Government National Mortgage Association (GNMA) USD 3.500% 20/01/2048 2,005,553 0.50803,765 Government National Mortgage Association (GNMA)(e) USD 5.549% 20/01/2048 131,710 0.03431,242 Government National Mortgage Association (GNMA) USD 4.500% 20/05/2048 468,318 0.12921,578 Government National Mortgage Association (GNMA)(e) USD 6.049% 20/06/2048 150,104 0.04
2,241,881 Government National Mortgage Association (GNMA) USD 4.000% 20/07/2048 2,403,330 0.60767,312 Government National Mortgage Association (GNMA) USD 4.500% 20/07/2048 832,083 0.21
2,706,765 Government National Mortgage Association (GNMA) USD 4.500% 20/09/2048 2,935,251 0.73961,815 Government National Mortgage Association (GNMA)(e) USD 6.049% 20/09/2048 176,753 0.04
2,577,756 Government National Mortgage Association (GNMA) USD 5.000% 20/10/2048 2,832,800 0.70741,417 Government National Mortgage Association (GNMA)(e) USD 5.999% 20/10/2048 113,912 0.03
1,261,387 Government National Mortgage Association (GNMA) USD 5.000% 20/11/2048 1,386,189 0.341,597,945 Government National Mortgage Association (GNMA) USD 5.000% 20/12/2048 1,747,282 0.4382,578 Government National Mortgage Association (GNMA) USD 3.500% 20/01/2049 88,054 0.02
2,040,964 Government National Mortgage Association (GNMA) USD 4.500% 20/01/2049 2,205,419 0.554,212,868 Government National Mortgage Association (GNMA) USD 5.000% 20/01/2049 4,615,568 1.15721,922 Government National Mortgage Association (GNMA)(e) USD 5.899% 20/01/2049 110,063 0.03806,395 Government National Mortgage Association (GNMA)(e) USD 5.904% 20/01/2049 130,291 0.03
1,003,809 Government National Mortgage Association (GNMA)(e) USD 3.639% 20/02/2049 88,364 0.022,269,950 Government National Mortgage Association (GNMA) USD 4.000% 20/02/2049 2,428,363 0.601,487,200 Government National Mortgage Association (GNMA) USD 4.000% 20/03/2049 1,589,710 0.401,057,967 Government National Mortgage Association (GNMA) USD 4.500% 20/03/2049 1,145,206 0.282,967,889 Government National Mortgage Association (GNMA) USD 5.000% 20/03/2049 3,247,548 0.811,429,036 Government National Mortgage Association (GNMA) USD 4.000% 20/04/2049 1,526,866 0.381,630,812 Government National Mortgage Association (GNMA) USD 4.000% 20/05/2049 1,741,692 0.431,431,543 Government National Mortgage Association (GNMA)(e) USD 3.119% 20/06/2049 115,887 0.032,331,316 Government National Mortgage Association (GNMA) USD 4.000% 20/06/2049 2,488,366 0.6219,438 Government National Mortgage Association (GNMA) USD 5.000% 20/06/2049 21,275 0.01
5,230,470 Government National Mortgage Association (GNMA) USD 3.000% 20/07/2049 5,458,840 1.36611,661 Government National Mortgage Association (GNMA)(e) USD 5.949% 20/08/2049 95,998 0.02
2,807,462 Government National Mortgage Association (GNMA) USD 3.000% 20/09/2049 2,930,040 0.737,434,751 Government National Mortgage Association (GNMA) USD 3.500% 20/10/2049 669,021 0.172,524,642 Government National Mortgage Association (GNMA) USD 4.500% 20/10/2049 2,726,708 0.681,876,025 Government National Mortgage Association (GNMA) USD 3.500% 20/12/2049 200,629 0.053,193,048 Government National Mortgage Association (GNMA) USD 4.500% 20/12/2049 3,438,136 0.852,385,054 Government National Mortgage Association (GNMA)(e) USD 5.904% 20/01/2050 400,910 0.102,369,439 Government National Mortgage Association (GNMA)(e) USD 5.904% 20/02/2050 411,955 0.106,999,996 Government National Mortgage Association (GNMA) USD 3.500% 20/03/2050 7,474,146 1.86999,999 Government National Mortgage Association (GNMA) USD 4.000% 20/03/2050 1,059,474 0.26
1,000,001 Government National Mortgage Association (GNMA) USD 4.500% 20/04/2050 1,072,226 0.273,245,890 Government National Mortgage Association (GNMA)(e) USD 5.904% 20/04/2050 577,647 0.142,433,111 Government National Mortgage Association (GNMA) USD 4.000% 20/06/2050 321,198 0.081,034,283 Government National Mortgage Association (GNMA) USD 4.000% 20/06/2050 102,681 0.031,229,818 Government National Mortgage Association (GNMA)(e) USD 5.999% 20/06/2050 195,435 0.055,950,787 Government National Mortgage Association (GNMA) USD 3.000% 20/08/2050 6,261,791 1.561,577,879 Government National Mortgage Association (GNMA) USD 2.500% 20/10/2050 155,024 0.041,600,000 Government National Mortgage Association (GNMA) USD 2.500% 20/11/2050 105,520 0.0341,000,000 Government National Mortgage Association (GNMA) TBA(g) USD 2.000% 21/12/2050 42,801,468 10.6322,000,000 Government National Mortgage Association (GNMA) TBA(g) USD 2.500% 21/12/2050 23,154,559 5.757,000,000 Government National Mortgage Association (GNMA) TBA(g) USD 3.000% 21/12/2050 7,308,875 1.825,000,000 Government National Mortgage Association (GNMA) TBA(g) USD 5.000% 21/12/2050 5,466,406 1.36
Goldman Sachs Funds—US Mortgage Backed Securities PortfolioSchedule of InvestmentsAs at 30 November 2020
The accompanying notes are an integral part of these financial statements.
398

Holdings Security Description Currency Interest Rate(a) Maturity Date(b)Market Value
USD
% ofShareholders’
Equity
Agencies Asset Backed Obligations – (Continued)United States – (Continued)
26,000,000 Government National Mortgage Association (GNMA) TBA(g) USD 2.000% 21/01/2051 27,080,442 6.736,000,000 Government National Mortgage Association (GNMA) TBA(g) USD 2.500% 21/01/2051 6,300,583 1.57
478,923,753 118.98
TOTAL AGENCIES ASSET BACKED OBLIGATIONS(cost USD 470,286,288) 478,923,753 118.98
Non-Agencies Asset Backed Obligations – 9.15%Cayman Islands
46,934 ACIS CLO Ltd. 2014-4A �A� 144A(e)(h) USD 1.634% 01/05/2026 46,931 0.012,150,000 Dryden XXVI Senior Loan Fund 2013-26A �AR� 144A(e)(h) USD 1.137% 15/04/2029 2,137,903 0.532,000,000 ICG US CLO Ltd. 2015-2RA �A1� 144A(e)(h) USD 1.600% 16/01/2033 1,988,762 0.493,200,000 Madison Park Funding XXX Ltd. 2018-30A �A� 144A(e)(h) USD 0.987% 15/04/2029 3,173,991 0.794,489,153 Magnetite XVI Ltd. 2015-16A �AR� 144A(e)(h) USD 1.018% 18/01/2028 4,468,094 1.111,000,000 Ocean Trails CLO 8 2020-8A �D� 144A(e)(h) USD 5.175% 15/07/2029 1,002,823 0.25650,000 Pikes Peak CLO 6 2020-6A �C� 144A(e)(h) USD 4.435% 18/08/2030 654,799 0.16
2,150,000 SOUND POINT CLO Ltd. 2013-2RA �A1� 144A(e)(h) USD 1.225% 15/04/2029 2,134,347 0.53450,000 Sound Point CLO XVIII Ltd. 2017-4A �B� 144A(e)(h) USD 2.018% 21/01/2031 429,480 0.11
2,150,000 Tryon Park CLO Ltd. 2013-1A �A1SR� 144A(e)(h) USD 1.127% 15/04/2029 2,132,938 0.53215,671 WhiteHorse IX Ltd. 2014-9A �AR� 144A(e)(h) USD 1.378% 17/07/2026 215,433 0.05
1,000,000 York CLO 1 Ltd. 2014-1A �APR� 144A(e)(h) USD 1.336% 22/10/2029 995,165 0.25
19,380,666 4.81
United States62,433 Bancorp Commercial Mortgage 2018-CRE4 Trust �A� 144A(e)(h) USD 1.048% 15/09/2035 60,892 0.01780,000 Bank 2018-BNK15 �D� 144A(h) USD 3.000% 15/11/2061 604,271 0.15
2,650,000 BBCMS Mortgage Trust 2018-C2 �A4� USD 4.047% 15/12/2051 3,103,020 0.77265,784 Brazos Education Loan Authority, Inc. 2012-1 �A1�(e) USD 0.849% 26/12/2035 263,682 0.06200,857 Brazos Higher Education Authority, Inc. 2011-1 �A2�(e) USD 1.050% 25/02/2030 202,016 0.05300,000 CFCRE Commercial Mortgage Trust 2016-C6 �D� 144A(e)(h) USD 4.205% 10/11/2049 238,587 0.06
1,000,000 Citigroup Commercial Mortgage Trust 2017-P8 �D� 144A(h) USD 3.000% 15/09/2050 726,484 0.18300,000 COMM 2012-CCRE2 Mortgage Trust 2012-CR2 �A4� USD 3.147% 15/08/2045 309,302 0.08
1,317,684 ECMC Group Student Loan Trust 2017-1A �A� 144A(e)(h) USD 1.349% 27/12/2066 1,326,726 0.33174,755 Fannie Mae Connecticut Avenue Securities 2016-C06 �1M2�(e) USD 4.399% 25/04/2029 181,438 0.04
301 FNT Mortgage-Backed Pass-Through Certificate Series Trust 2001-4 �1A1� USD 6.750% 21/09/2031 296 0.00216,000 Freddie Mac STACR Trust 2020-DNA5 �M2� 144A(e)(h) USD 2.887% 25/10/2050 218,035 0.05650,000 Freddie Mac Structured Agency Credit Risk Debt Notes �M3�
2015-HQ2 �M3�(e) USD 3.399% 25/05/2025 658,072 0.161,055,270 Goal Capital Funding Trust 2010-1 �A� 144A(e)(h) USD 0.950% 25/08/2048 1,047,185 0.261,112,534 Higher Education Funding I 2014-1 �A� 144A(e)(h) USD 1.257% 25/05/2034 1,120,345 0.28764,795 Illinois Student Assistance Commission 2010-1 �A3�(e) USD 1.115% 25/07/2045 761,667 0.1926,687 Impac CMB Trust Series 2004-8 �1A�(e) USD 0.869% 25/10/2034 25,839 0.01660,000 JPMDB Commercial Mortgage Securities Trust 2017-C7 �D� 144A(h) USD 3.000% 15/10/2050 508,273 0.13170,256 KnowledgeWorks Foundation 2010-1 �A�(e) USD 1.200% 25/02/2042 169,713 0.04
3,000,000 Morgan Stanley Capital I Trust 2018-L1 �A3� USD 4.139% 15/10/2051 3,487,752 0.87800,000 Morgan Stanley Capital I Trust 2018-L1 �D� 144A(h) USD 3.000% 15/10/2051 709,659 0.18106,975 New Residential Mortgage Loan Trust 2015-1A �A1� 144A(e)(h) USD 3.750% 28/05/2052 114,145 0.03231,289 PHEAA Student Loan Trust 2016-1A�A� 144A(e)(h) USD 1.299% 25/09/2065 232,049 0.06868,637 Structured Asset Mortgage Investments II Trust 2005-AR8 �A2�(e) USD 3.625% 25/02/2036 828,321 0.2197,149 Student Loan Consolidation Center Student Loan Trust I 2011-1 �A�
144A(e)(h) USD 1.368% 25/10/2027 97,735 0.02300,000 Wells Fargo Commercial Mortgage Trust 2017-C38 �D� 144A(h) USD 3.000% 15/07/2050 218,078 0.05300,000 Wells Fargo Commercial Mortgage Trust 2017-RB1 �D� 144A(h) USD 3.401% 15/03/2050 265,464 0.07
17,479,046 4.34
TOTAL NON-AGENCIES ASSET BACKED OBLIGATIONS(cost USD 36,109,553) 36,859,712 9.15
TOTAL TRANSFERABLE SECURITIES DEALT IN ANOTHER REGULATED MARKET(cost USD 506,395,841) 515,783,465 128.13
MARKET VALUE OF INVESTMENTS EXCLUDING DERIVATIVES(cost USD 568,129,139) 577,519,636 143.47
Covered Forward Mortgage Backed Securities – (22.64%)(1,000,000) Federal National Mortgage Association (FNMA) TBA(g)(i) USD 3.500% 14/12/2050 (1,055,078) (0.26)(1,000,000) Federal National Mortgage Association (FNMA) TBA(g)(i) USD 4.000% 14/12/2050 (1,067,070) (0.27)(35,000,000) Federal National Mortgage Association (FNMA) TBA(g)(i) USD 4.500% 14/12/2050 (37,953,127) (9.43)(40,400,000) Federal National Mortgage Association (FNMA) TBA(g)(i) USD 5.000% 14/12/2050 (44,698,813) (11.11)
Goldman Sachs Funds—US Mortgage Backed Securities PortfolioSchedule of InvestmentsAs at 30 November 2020
The accompanying notes are an integral part of these financial statements.
399

Holdings Security Description Currency Interest Rate(a) Maturity Date(b)Market Value
USD
% ofShareholders’
Equity
Covered Forward Mortgage Backed Securities – (Continued)(5,000,000) Government National Mortgage Association (GNMA) TBA(g)(j) USD 3.500% 21/12/2050 (5,282,684) (1.31)(1,000,000) Government National Mortgage Association (GNMA) TBA(g)(j) USD 4.000% 21/12/2050 (1,063,226) (0.26)
(91,119,998) (22.64)
TOTAL COVERED FORWARD MORTGAGE BACKED SECURITIES(cost USD (90,635,313)) (91,119,998) (22.64)
Futures Contracts – 0.01%
Number ofContracts Security Description
CommitmentMarket Value
USD
UnrealisedGainUSD
% ofShareholders’
Equity
USD(22) US Treasury Long Bond Futures 22/03/2021 Short (3,843,812) 800 0.0043 US Treasury Notes 10YR Futures 22/03/2021 Long 5,938,703 9,071 0.00101 US Treasury Notes 5YR Futures 31/03/2021 Long 12,725,211 10,377 0.01(6) US Treasury Ultra Long Bond Futures 22/03/2021 Short (1,293,938) 6,947 0.0042 US Treasury Ultra Long Notes 10YR Futures 22/03/2021 Long 6,594,000 8,740 0.00
20,120,164 35,935 0.01
UNREALISED GAIN ON FUTURES CONTRACTS 35,935 0.01
Number ofContracts Security Description
CommitmentMarket Value
USD
UnrealisedLossUSD
% ofShareholders’
Equity
USD(14) US Treasury Notes 2YR Futures 31/03/2021 Short (3,091,594) (737) (0.00)
UNREALISED LOSS ON FUTURES CONTRACTS (737) (0.00)
Share Class Specific Forward Currency Contracts – 0.15%
CurrencyAmountBought Currency
AmountSold
MaturityDate
UnrealisedGainUSD
% ofShareholders’
Equity
PLN 3,644,658 USD 952,541 21/12/2020 24,795 0.01GBP 78,230 USD 100,749 13/01/2021 3,937 0.00EUR 30,612,708 USD 36,204,195 21/01/2021 573,260 0.14
UNREALISED GAIN ON FORWARD CURRENCY CONTRACTS HELD FOR HEDGING PURPOSES 601,992 0.15
CurrencyAmountBought Currency
AmountSold
MaturityDate
UnrealisedLossUSD
% ofShareholders’
Equity
USD 6,719 PLN 26,024 21/12/2020 (259) (0.00)USD 34,114 EUR 28,854 21/01/2021 (551) (0.00)
UNREALISED LOSS ON FORWARD CURRENCY CONTRACTS HELD FOR HEDGING PURPOSES (810) (0.00)
Options – (0.02%)
Holdings Security Description
UnrealisedGain/(Loss)
USDMarket Value
USD
% ofShareholders’
Equity
Purchased OptionsUSD
8,000,000 Call 3 month LIBOR Swaption Expires 17/03/2021 Strike 1.10 (61,345) 34,654 0.01
TOTAL PURCHASED OPTIONS(cost USD 96,000) 34,654 0.01
Written OptionsUSD
(8,000,000) Call 3 month LIBOR Swaption Expires 06/01/2021 Strike 0.28 7,768 (1,032) (0.00)(8,030,000) Call 3 month LIBOR Swaption Expires 20/01/2021 Strike 0.31 6,401 (2,833) (0.00)(8,000,000) Call 3 month LIBOR Swaption Expires 17/03/2021 Strike 0.70 28,427 (8,092) (0.00)(8,000,000) Call 3 month LIBOR Swaption Expires 17/03/2021 Strike 0.90 46,870 (17,130) (0.01)(4,700,000) Call 3 month LIBOR Swaption Expires 19/05/2021 Strike 0.48 26,548 (21,239) (0.01)(8,000,000) Put 3 month LIBOR Swaption Expires 06/01/2021 Strike 0.48 11,561 (8,639) (0.00)
Goldman Sachs Funds—US Mortgage Backed Securities PortfolioSchedule of InvestmentsAs at 30 November 2020
The accompanying notes are an integral part of these financial statements.
400

Options – (Continued)
Holdings Security Description
UnrealisedGain/(Loss)
USDMarket Value
USD
% ofShareholders’
Equity
Written Options – (Continued)USD – (Continued)
(8,030,000) Put 3 month LIBOR Swaption Expires 20/01/2021 Strike 0.51 13,697 (8,787) (0.00)(4,700,000) Put 3 month LIBOR Swaption Expires 19/05/2021 Strike 0.48 22,775 (25,013) (0.01)
164,047 (92,765) (0.03)
TOTAL WRITTEN OPTIONS(cost USD (256,813)) (92,765) (0.03)
TOTAL OPTIONS(cost USD (160,813)) (58,111) (0.02)
Swap Contracts – (0.06%)Net LocalNotionalAmount Pay Receive Currency Maturity Date
UnrealisedGainUSD
% ofShareholders’
Equity
Interest Rate Swaps2,700,000 Fixed 1.430% Floating (CAD 3 month CDOR) CAD 09/11/2030 73 0.002,980,000 Fixed 1.543% Floating (USD 3 month LIBOR) USD 25/11/2035 3,019 0.00
UNREALISED GAIN ON INTEREST RATE SWAPS 3,092 0.00
Credit Default Swaps2,000,000 Floating (The Markit CMBX North
America A 11 Index)Fixed 2.000% USD 18/11/2054 206,190 0.05
600,000 Floating (The Markit CMBX NorthAmerica BBB- 11 Index)
Fixed 3.000% USD 18/11/2054 36,884 0.01
1,650,000 Floating (The Markit CMBX NorthAmerica BBB- 11 Index)
Fixed 3.000% USD 18/11/2054 64,333 0.02
1,200,000 Floating (The Markit CMBX NorthAmerica BBB- 8 Index)
Fixed 3.000% USD 17/10/2057 70,831 0.02
650,000 Floating (The Markit CMBX NorthAmerica BBB- 10 Index)
Fixed 3.000% USD 17/11/2059 17,993 0.00
UNREALISED GAIN ON CREDIT DEFAULT SWAPS 396,231 0.10
TOTAL UNREALISED GAIN ON SWAP CONTRACTS 399,323 0.10
Net LocalNotionalAmount Pay Receive Currency Maturity Date
UnrealisedLossUSD
% ofShareholders’
Equity
Interest Rate Swaps13,480,000 Floating (CAD 3 month CDOR) Fixed 0.960% CAD 09/11/2024 (6,932) (0.00)9,860,000 Floating (USD 1 month LIBOR) Floating (USD 3 month LIBOR) USD 25/07/2024 (3,128) (0.00)5,850,000 Floating (USD 3 month SOFR) Floating (USD 3 month LIBOR) USD 10/11/2024 (4,384) (0.00)710,000 Fixed 1.000% Floating (USD 3 month LIBOR) USD 16/12/2025 (3,044) (0.00)
2,710,000 Floating (USD 3 month LIBOR) Fixed 1.245% USD 24/11/2030 (1,302) (0.00)
UNREALISED LOSS ON INTEREST RATE SWAPS (18,790) (0.00)
Credit Default Swaps900,000 Floating (The Markit CMBX North
America BBB- 11 Index)Fixed 3.000% USD 18/11/2054 (58) (0.00)
1,600,000 Floating (The Markit CMBX NorthAmerica BBB- 11 Index)
Fixed 3.250% USD 18/11/2054 (166,089) (0.04)
1,200,000 Floating (The Markit CMBX NorthAmerica BBB- 9 Index)
Fixed 3.000% USD 17/09/2058 (215,394) (0.06)
1,550,000 Floating (The Markit CMBX NorthAmerica BBB- 10 Index)
Fixed 3.000% USD 17/11/2059 (246,307) (0.06)
UNREALISED LOSS ON CREDIT DEFAULT SWAPS (627,848) (0.16)
TOTAL UNREALISED LOSS ON SWAP CONTRACTS (646,638) (0.16)
MARKET VALUE OF INVESTMENTS(cost USD 477,333,013)
486,730,592 120.91
OTHER ASSETS AND LIABILITIES (84,203,981) (20.91)
SHAREHOLDERS’ EQUITY 402,526,611 100.00
Goldman Sachs Funds—US Mortgage Backed Securities PortfolioSchedule of InvestmentsAs at 30 November 2020
The accompanying notes are an integral part of these financial statements.
401

TOTAL INVESTMENTSMarket Value
USD
% ofShareholders’
Equity
Total Investments excluding derivatives (cost USD 568,129,139) 577,519,636 143.47Market value of covered forward mortgage backed securities (cost USD (90,635,313)) (91,119,998) (22.64)Unrealised gain on futures contracts 35,935 0.01Unrealised loss on futures contracts (737) (0.00)Unrealised gain on forward currency contracts held for hedging purposes 601,992 0.15Unrealised loss on forward currency contracts held for hedging purposes (810) (0.00)Market value of purchased options (cost USD 96,000) 34,654 0.01Market value of written options (cost USD (256,813)) (92,765) (0.03)Unrealised gain on swap contracts 399,323 0.10Unrealised loss on swap contracts (646,638) (0.16)Other Assets and Liabilities (84,203,981) (20.91)
Shareholders’ Equity 402,526,611 100.00
The Futures Commission Merchant was Goldman Sachs & Co. LLC.
The counterparties for forward currency contracts were Barclays Bank Plc., BNP Paribas S.A., Citibank N.A., HSBC Bank Plc., State Street Bank & Trust and UBS AG.
The counterparties for options contracts were Deutsche Bank AG and JP Morgan Chase Bank N.A.
The counterparties for swap contracts were Citigroup Global Markets Inc., Credit Suisse, JP Morgan Securities Inc. and Morgan Stanley & Co. International Plc.
The maximum individual counterparty exposure as at 30 November 2020 is 0.07% of the NAV.
(a) Interest rates represent either the stated coupon rate, annualised discounted yield on date of purchase for discounted securities, or, for floating rate securities, the current reset ratewhich is based upon interest rates indices.
(b) Maturity dates represent either the stated date on the security, or the next interest reset date for floating rate securities or the prerefunded date for those type of securities.(c) A related party to Goldman Sachs Funds.(d) The yield for this fund as at 30 November 2020 was 0.120%.(e) Variable and floating coupon rates are those quoted as of 30 November 2020.(f) This security has a step up coupon which moves to the second rate at a set date in the future.(g) TBA (To Be Announced) Securities are purchased on a forward commitment basis with an approximate (generally +/-2.5%) principal amount and no defined maturity date. The actual
principal amount and maturity date will be determined upon settlement when the specific mortgage pools are assigned.(h) 144A: This security is issued to qualified institutional investors, pursuant to private placements, and is transferable as stated in rule 144A of the US Securities Act of 1933.(i) These represent TBA sales covered by long FNMA positions. These amounts are disclosed separately as Covered Forward Mortgage Backed Securities in the Statement of Assets
and Liabilities.(j) These represent TBA sales covered by long GNMA positions. These amounts are disclosed separately as Covered Forward Mortgage Backed Securities in the Statement of Assets
and Liabilities.
Goldman Sachs Funds—US Mortgage Backed Securities PortfolioSchedule of InvestmentsAs at 30 November 2020
The accompanying notes are an integral part of these financial statements.
402
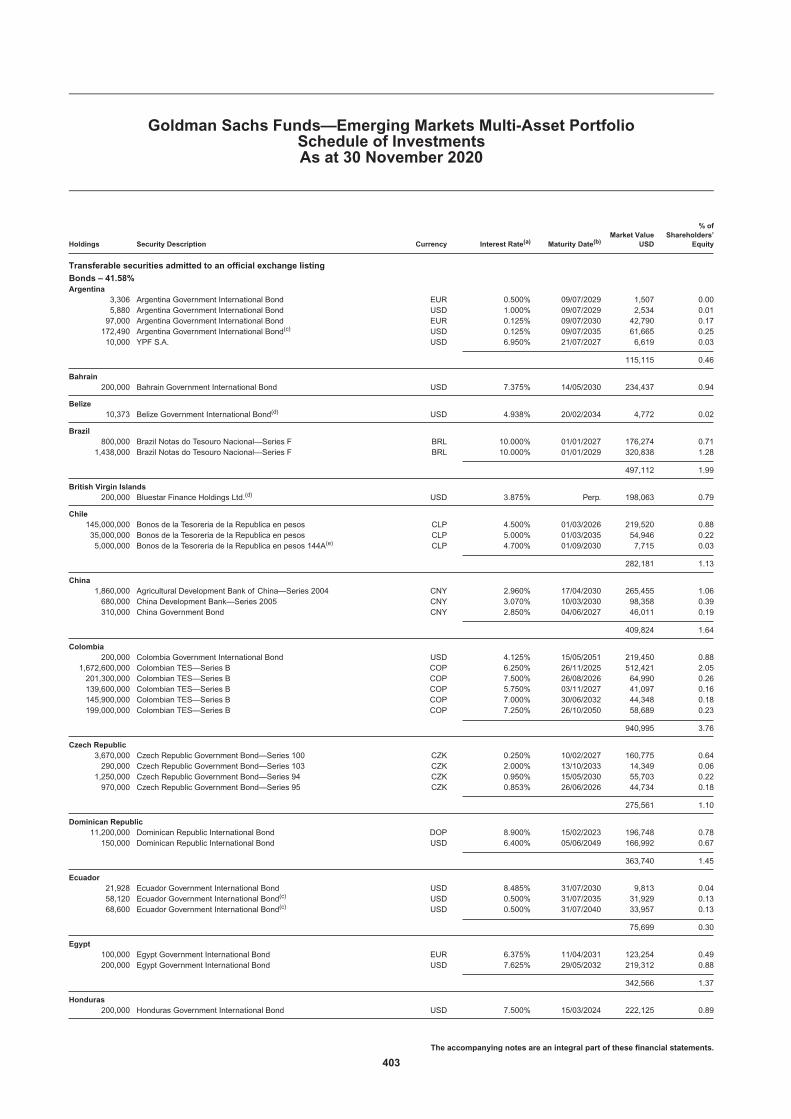
Holdings Security Description Currency Interest Rate(a) Maturity Date(b)Market Value
USD
% ofShareholders’
Equity
Transferable securities admitted to an official exchange listing
Bonds – 41.58%Argentina
3,306 Argentina Government International Bond EUR 0.500% 09/07/2029 1,507 0.005,880 Argentina Government International Bond USD 1.000% 09/07/2029 2,534 0.0197,000 Argentina Government International Bond EUR 0.125% 09/07/2030 42,790 0.17172,490 Argentina Government International Bond(c) USD 0.125% 09/07/2035 61,665 0.2510,000 YPF S.A. USD 6.950% 21/07/2027 6,619 0.03
115,115 0.46
Bahrain200,000 Bahrain Government International Bond USD 7.375% 14/05/2030 234,437 0.94
Belize10,373 Belize Government International Bond(d) USD 4.938% 20/02/2034 4,772 0.02
Brazil800,000 Brazil Notas do Tesouro Nacional—Series F BRL 10.000% 01/01/2027 176,274 0.71
1,438,000 Brazil Notas do Tesouro Nacional—Series F BRL 10.000% 01/01/2029 320,838 1.28
497,112 1.99
British Virgin Islands200,000 Bluestar Finance Holdings Ltd.(d) USD 3.875% Perp. 198,063 0.79
Chile145,000,000 Bonos de la Tesoreria de la Republica en pesos CLP 4.500% 01/03/2026 219,520 0.8835,000,000 Bonos de la Tesoreria de la Republica en pesos CLP 5.000% 01/03/2035 54,946 0.225,000,000 Bonos de la Tesoreria de la Republica en pesos 144A(e) CLP 4.700% 01/09/2030 7,715 0.03
282,181 1.13
China1,860,000 Agricultural Development Bank of China—Series 2004 CNY 2.960% 17/04/2030 265,455 1.06680,000 China Development Bank—Series 2005 CNY 3.070% 10/03/2030 98,358 0.39310,000 China Government Bond CNY 2.850% 04/06/2027 46,011 0.19
409,824 1.64
Colombia200,000 Colombia Government International Bond USD 4.125% 15/05/2051 219,450 0.88
1,672,600,000 Colombian TES—Series B COP 6.250% 26/11/2025 512,421 2.05201,300,000 Colombian TES—Series B COP 7.500% 26/08/2026 64,990 0.26139,600,000 Colombian TES—Series B COP 5.750% 03/11/2027 41,097 0.16145,900,000 Colombian TES—Series B COP 7.000% 30/06/2032 44,348 0.18199,000,000 Colombian TES—Series B COP 7.250% 26/10/2050 58,689 0.23
940,995 3.76
Czech Republic3,670,000 Czech Republic Government Bond—Series 100 CZK 0.250% 10/02/2027 160,775 0.64290,000 Czech Republic Government Bond—Series 103 CZK 2.000% 13/10/2033 14,349 0.06
1,250,000 Czech Republic Government Bond—Series 94 CZK 0.950% 15/05/2030 55,703 0.22970,000 Czech Republic Government Bond—Series 95 CZK 0.853% 26/06/2026 44,734 0.18
275,561 1.10
Dominican Republic11,200,000 Dominican Republic International Bond DOP 8.900% 15/02/2023 196,748 0.78150,000 Dominican Republic International Bond USD 6.400% 05/06/2049 166,992 0.67
363,740 1.45
Ecuador21,928 Ecuador Government International Bond USD 8.485% 31/07/2030 9,813 0.0458,120 Ecuador Government International Bond(c) USD 0.500% 31/07/2035 31,929 0.1368,600 Ecuador Government International Bond(c) USD 0.500% 31/07/2040 33,957 0.13
75,699 0.30
Egypt100,000 Egypt Government International Bond EUR 6.375% 11/04/2031 123,254 0.49200,000 Egypt Government International Bond USD 7.625% 29/05/2032 219,312 0.88
342,566 1.37
Honduras200,000 Honduras Government International Bond USD 7.500% 15/03/2024 222,125 0.89
Goldman Sachs Funds—Emerging Markets Multi-Asset PortfolioSchedule of InvestmentsAs at 30 November 2020
The accompanying notes are an integral part of these financial statements.
403

Holdings Security Description Currency Interest Rate(a) Maturity Date(b)Market Value
USD
% ofShareholders’
Equity
Bonds – (Continued)Hungary
14,620,000 Hungary Government Bond—Series 26/D HUF 2.750% 22/12/2026 52,229 0.2143,590,000 Hungary Government Bond—Series 27/A HUF 3.000% 27/10/2027 158,884 0.63110,000 OTP Bank Nyrt(d) EUR 2.875% 15/07/2029 133,930 0.54
345,043 1.38
Indonesia290,000 Indonesia Government International Bond USD 2.850% 14/02/2030 315,828 1.26
1,636,000,000 Indonesia Treasury Bond—Series FR56 IDR 8.375% 15/09/2026 131,738 0.531,000,000,000 Indonesia Treasury Bond—Series FR70 IDR 8.375% 15/03/2024 78,293 0.31360,000,000 Indonesia Treasury Bond—Series FR73 IDR 8.750% 15/05/2031 30,021 0.12
1,778,000,000 Indonesia Treasury Bond—Series FR80 IDR 7.500% 15/06/2035 135,680 0.542,000,000,000 Indonesia Treasury Bond—Series FR87 IDR 6.500% 15/02/2031 145,892 0.59
837,452 3.35
Lebanon50,000 Lebanon Government International Bond USD 6.200% 26/02/2025 6,750 0.0320,000 Lebanon Government International Bond USD 6.750% 29/11/2027 2,700 0.0150,000 Lebanon Government International Bond USD 6.850% 25/05/2029 6,750 0.0341,000 Lebanon Government International Bond USD 6.650% 26/02/2030 5,535 0.02
21,735 0.09
Mexico371,800 Mexican Bonos—Series M MXN 7.750% 29/05/2031 21,308 0.08
3,759,400 Mexican Bonos—Series M 20 MXN 8.500% 31/05/2029 224,225 0.903,947,400 Mexican Bonos—Series M 30 MXN 10.000% 20/11/2036 267,326 1.071,920,000 Mexican Bonos—Series M 30 MXN 8.500% 18/11/2038 114,187 0.46200,000 Mexico Government International Bond USD 4.750% 27/04/2032 236,500 0.9419,000 Petroleos Mexicanos USD 6.350% 12/02/2048 15,950 0.0615,000 Petroleos Mexicanos USD 6.950% 28/01/2060 12,949 0.05
892,445 3.56
Nigeria200,000 Nigeria Government International Bond USD 7.143% 23/02/2030 211,188 0.84
Panama200,000 Panama Government International Bond USD 2.252% 29/09/2032 203,800 0.8210,000 Panama Notas del Tesoro USD 3.750% 17/04/2026 10,872 0.04
214,672 0.86
Paraguay200,000 Paraguay Government International Bond USD 5.000% 15/04/2026 231,688 0.92
Peru25,000 Peru Government Bond PEN 5.940% 12/02/2029 8,444 0.03300,000 Peru Government Bond PEN 5.400% 12/08/2034 90,010 0.3620,000 Peruvian Government International Bond USD 2.780% 01/12/2060 19,750 0.08
118,204 0.47
Philippines230,000 Philippine Government Bond—Series 1063 PHP 6.250% 22/03/2028 5,832 0.02460,000 Philippine Government Bond—Series 1064 PHP 6.875% 10/01/2029 12,298 0.05
18,130 0.07
Poland790,000 Poland Government Bond—Series 425 PLN 0.750% 25/04/2025 214,937 0.86440,000 Poland Government Bond—Series 428 PLN 2.750% 25/04/2028 133,287 0.5370,000 Poland Government Bond—Series 727 PLN 2.500% 25/07/2027 20,827 0.08
369,051 1.47
Qatar200,000 Qatar Government International Bond USD 5.103% 23/04/2048 286,844 1.15
Romania70,000 Romania Government Bond—Series 15Y RON 3.650% 24/09/2031 17,465 0.07240,000 Romania Government Bond—Series 5Y RON 3.650% 28/07/2025 61,356 0.2580,000 Romania Government Bond—Series 8Y RON 4.150% 26/01/2028 21,045 0.0830,000 Romanian Government International Bond EUR 2.625% 02/12/2040 36,346 0.1540,000 Romanian Government International Bond EUR 3.375% 28/01/2050 53,327 0.21
189,539 0.76
Goldman Sachs Funds—Emerging Markets Multi-Asset PortfolioSchedule of InvestmentsAs at 30 November 2020
The accompanying notes are an integral part of these financial statements.
404

Holdings Security Description Currency Interest Rate(a) Maturity Date(b)Market Value
USD
% ofShareholders’
Equity
Bonds – (Continued)Russia
5,975,000 Russian Federal Bond - OFZ Bonds—Series 6221 RUB 7.700% 23/03/2033 89,429 0.3615,855,000 Russian Federal Bond - OFZ Bonds—Series 6228 RUB 7.650% 10/04/2030 236,746 0.954,920,000 Russian Federal Bond - OFZ Bonds—Series 6230 RUB 7.700% 16/03/2039 74,918 0.302,320,000 Russian Federal Bond - OFZ Bonds—Series 6232 RUB 6.000% 06/10/2027 31,359 0.124,175,000 Russian Federal Bond - OFZ Bonds—Series 6235 RUB 5.900% 12/03/2031 54,834 0.22
487,286 1.95
South Africa1,600,000 South Africa Government Bond—Series 2030 ZAR 8.000% 31/01/2030 97,919 0.392,940,000 South Africa Government Bond—Series 2035 ZAR 8.875% 28/02/2035 166,213 0.676,920,000 South Africa Government Bond—Series 2037 ZAR 8.500% 31/01/2037 368,236 1.47
632,368 2.53
Supranationals200,000 Eastern & Southern African Trade & Development Bank USD 4.875% 23/05/2024 208,934 0.83
Thailand2,060,000 Thailand Government Bond THB 2.400% 17/12/2023 71,754 0.294,102,052 Thailand Government Bond THB 1.250% 12/03/2028 131,817 0.52510,000 Thailand Government Bond THB 3.650% 20/06/2031 20,475 0.08
3,230,000 Thailand Government Bond THB 3.775% 25/06/2032 132,342 0.53310,000 Thailand Government Bond THB 3.400% 17/06/2036 12,626 0.05
2,170,000 Thailand Government Bond THB 3.300% 17/06/2038 87,916 0.35100,000 Thailand Government Bond THB 3.600% 17/06/2067 4,342 0.02
461,272 1.84
Turkey775,000 Turkey Government Bond TRY 12.200% 18/01/2023 97,619 0.39270,000 Turkey Government Bond TRY 11.000% 24/02/2027 33,128 0.13350,000 Turkey Government International Bond USD 4.875% 09/10/2026 342,726 1.37
473,473 1.89
Ukraine100,000 Ukraine Government International Bond USD 7.750% 01/09/2024 109,578 0.44100,000 Ukraine Government International Bond USD 7.750% 01/09/2026 110,766 0.4420,000 Ukraine Government International Bond—Series GDP(d) USD 1.000% 31/05/2040 19,872 0.08
240,216 0.96
United Kingdom200,000 Gazprom PJSC Via Gaz Finance Plc. USD 3.250% 25/02/2030 206,188 0.82
TOTAL BONDS(cost USD 10,555,374) 10,407,918 41.58
Holdings Security DescriptionMarket Value
USD
% ofShareholders’
Equity
Common Stocks – 46.49%Argentina
164 MercadoLibre, Inc. 251,248 1.00
Brazil26,320 Aeris Industria E Comercio De Equipamentos Para Geracao De Energia S.A. 33,623 0.1315,200 Atacadao S.A. 56,563 0.234,800 B3 S.A. - Brasil Bolsa Balcao 51,288 0.2023,060 Banco Bradesco S.A.—Preferred 107,188 0.4327,191 Banco Pan S.A.—Preferred 48,978 0.2023,211 Boa Vista Servicos S.A. 54,798 0.2210,000 Fleury S.A. 50,439 0.208,400 Iochpe Maxion S.A. 24,817 0.103,200 Locaweb Servicos de Internet S.A. 144A(e) 40,342 0.16898 Pagseguro Digital Ltd. �A� 42,377 0.17
6,700 Qualicorp Consultoria e Corretora de Seguros S.A. 42,618 0.1711,387 Wiz Solucoes e Corretagem de Seguros S.A. 19,395 0.08
572,426 2.29
China2,737 Alibaba Group Holding Ltd.—ADR(f) 727,631 2.9110,000 Anhui Conch Cement Co., Ltd. �H� 64,061 0.267,000 ANTA Sports Products Ltd. 95,318 0.38
Goldman Sachs Funds—Emerging Markets Multi-Asset PortfolioSchedule of InvestmentsAs at 30 November 2020
The accompanying notes are an integral part of these financial statements.
405

Holdings Security DescriptionMarket Value
USD
% ofShareholders’
Equity
Common Stocks – (Continued)China – (Continued)
40,500 China Merchants Bank Co., Ltd. �H� 256,605 1.033,400 Contemporary Amperex Technology Co., Ltd. �A� 125,969 0.504,900 Gree Electric Appliances, Inc.�A� 49,784 0.2010,200 Hangzhou Robam Appliances Co., Ltd. �A� 62,096 0.252,409 Huami Corp.—ADR(f) 29,992 0.121,028 Kweichow Moutai Co., Ltd. �A� 268,449 1.076,700 Meituan Dianping �B� 251,090 1.0018,000 Minth Group Ltd. 89,521 0.36371 New Oriental Education & Technology Group, Inc.—ADR(f) 62,495 0.25
20,000 Ping An Insurance Group Co. of China Ltd. �H� 235,753 0.946,100 SF Holding Co., Ltd. �A� 74,355 0.302,000 Silergy Corp. 155,934 0.625,100 Sunny Optical Technology Group Co., Ltd. 100,404 0.401,685 TAL Education Group—ADR(f) 120,461 0.4811,500 Tencent Holdings Ltd. 839,469 3.3536,000 Topsports International Holdings Ltd. 144A(e) 53,655 0.216,964 WuXi AppTec Co., Ltd. �H� 144A(e) 104,332 0.4244,000 Xinyi Solar Holdings Ltd. 80,408 0.321,318 XPeng, Inc.—ADR(f) 79,699 0.3216,868 Zhejiang Sanhua Intelligent Controls Co., Ltd. �A� 60,268 0.24
3,987,749 15.93
Cyprus764 Ozon Holdings Plc.—ADR(f) 30,613 0.12
Czech Republic28,622 Moneta Money Bank AS 144A(e) 86,122 0.34
Greece6,091 Hellenic Exchanges - Athens Stock Exchange S.A. 23,527 0.093,061 JUMBO S.A. 53,976 0.225,013 Sarantis S.A. 55,503 0.22
133,006 0.53
Hong Kong16,400 AIA Group Ltd. 179,906 0.7228,000 Alibaba Health Information Technology Ltd. 82,490 0.3314,000 China Mengniu Dairy Co., Ltd. 70,889 0.282,955 Hong Kong Exchanges & Clearing Ltd. 147,060 0.59
102,000 Sino Biopharmaceutical Ltd. 102,727 0.415,000 Techtronic Industries Co., Ltd. 64,253 0.26
647,325 2.59
India1,964 AIA Engineering Ltd. 49,182 0.202,180 Amber Enterprises India Ltd. 70,456 0.28464 Atul Ltd. 39,534 0.16
2,142 Avenue Supermarts Ltd. 66,213 0.268,885 Bharti Airtel Ltd. 55,547 0.221,980 Computer Age Management Services Ltd. 38,638 0.1510,518 Crompton Greaves Consumer Electricals Ltd. 43,361 0.171,531 Divi’s Laboratories Ltd. 74,414 0.303,634 ICICI Lombard General Insurance Co., Ltd. 144A(e) 71,191 0.282,064 Info Edge India Ltd. 119,968 0.486,994 Infosys Ltd. 104,233 0.422,115 Infosys Ltd.—ADR(f) 31,757 0.135,514 Kotak Mahindra Bank Ltd. 141,755 0.571,094 Larsen & Toubro Infotech Ltd. 144A(e) 47,259 0.19890 Maruti Suzuki India Ltd. 84,348 0.34
2,911 Navin Fluorine International Ltd. 105,523 0.429,796 Prestige Estates Projects Ltd. 35,265 0.143,528 Route Mobile Ltd. 50,224 0.204,147 SBI Life Insurance Co., Ltd. 144A(e) 47,377 0.198,658 Tata Consumer Products Ltd. 62,863 0.251,535 TeamLease Services Ltd. 51,731 0.21
1,390,839 5.56
Indonesia65,800 Bank Central Asia Tbk PT 144,560 0.58
1,095,600 BFI Finance Indonesia Tbk PT 29,618 0.12
Goldman Sachs Funds—Emerging Markets Multi-Asset PortfolioSchedule of InvestmentsAs at 30 November 2020
The accompanying notes are an integral part of these financial statements.
406

Holdings Security DescriptionMarket Value
USD
% ofShareholders’
Equity
Common Stocks – (Continued)Indonesia – (Continued)
82,900 Map Aktif Adiperkasa PT 15,059 0.061,047,900 Pakuwon Jati Tbk PT 37,031 0.1559,100 Semen Indonesia Persero Tbk PT 48,929 0.19
275,197 1.10
Mexico11,992 Arca Continental SAB de CV 58,235 0.2318,100 Bolsa Mexicana de Valores SAB de CV 41,100 0.1616,434 Kimberly-Clark de Mexico SAB de CV �A� 26,643 0.1131,200 Wal-Mart de Mexico SAB de CV 81,273 0.33
207,251 0.83
Peru14,082 Alicorp SAA 27,733 0.112,019 BBVA Banco Continental S.A. Co. 1,288 0.01165 Credicorp Ltd. 25,392 0.10
2,238 Intercorp Financial Services, Inc. 68,033 0.27
122,446 0.49
Philippines13,100 Jollibee Foods Corp. 51,450 0.21
Poland1,318 Dino Polska S.A. 144A(e) 89,331 0.369,827 Powszechna Kasa Oszczednosci Bank Polski S.A. 69,819 0.28
159,150 0.64
Russia46,340 Detsky Mir PJSC 144A(e) 86,031 0.341,547 LUKOIL PJSC 102,700 0.4117,180 Moscow Exchange MICEX-RTS PJSC 34,511 0.1440,250 Sberbank of Russia PJSC 132,185 0.531,802 Yandex NV �A� 125,581 0.50
481,008 1.92
Singapore17,222 Nanofilm Technologies International Ltd. 41,205 0.16361 Sea Ltd.—ADR(f) 64,619 0.26
105,824 0.42
South Africa1,568 Bid Corp., Ltd. 28,503 0.123,323 Clicks Group Ltd. 50,877 0.206,149 JSE Ltd. 48,202 0.191,898 Santam Ltd. 31,006 0.1232,575 Transaction Capital Ltd. 49,688 0.20
208,276 0.83
South Korea1,119 Fila Holdings Corp. 41,911 0.171,660 Hankook Tire & Technology Co., Ltd. 49,146 0.201,095 LG Electronics, Inc. 84,799 0.34532 NAVER Corp. 133,719 0.53198 NCSoft Corp. 145,082 0.58783 Orion Corp. 84,018 0.34216 Pearl Abyss Corp. 40,480 0.16369 Samsung Electro-Mechanics Co., Ltd. 52,186 0.21
11,522 Samsung Electronics Co., Ltd. 696,258 2.782,220 SK Hynix, Inc. 196,142 0.78
1,523,741 6.09
Taiwan15,640 Chailease Holding Co., Ltd. 85,791 0.3478,252 FIT Hon Teng Ltd. 144A(e) 25,666 0.101,000 Largan Precision Co., Ltd. 113,330 0.452,000 momo.com, Inc. 43,505 0.183,000 Nien Made Enterprise Co., Ltd. 35,466 0.1445,000 Taiwan Semiconductor Manufacturing Co., Ltd. 766,410 3.066,000 Taiwan Union Technology Corp. 24,626 0.10
Goldman Sachs Funds—Emerging Markets Multi-Asset PortfolioSchedule of InvestmentsAs at 30 November 2020
The accompanying notes are an integral part of these financial statements.
407

Holdings Security DescriptionMarket Value
USD
% ofShareholders’
Equity
Common Stocks – (Continued)Taiwan – (Continued)
7,945 Tong Hsing Electronic Industries Ltd. 55,470 0.227,000 Win Semiconductors Corp. 82,282 0.33
1,232,546 4.92
Thailand40,200 Airports of Thailand PCL 84,938 0.34
Turkey4,938 Mavi Giyim Sanayi ve Ticaret AS �B� 144A(e) 29,024 0.1217,768 Sok Marketler Ticaret AS 28,621 0.11
57,645 0.23
United States26,000 Nexteer Automotive Group Ltd. 27,649 0.11
TOTAL COMMON STOCKS(cost USD 8,837,759) 11,636,449 46.49
Mutual Funds – 5.64%Luxembourg
12,346 Goldman Sachs Funds - Emerging Markets Corporate Bond Portfolio(g) 1,412,837 5.64
TOTAL MUTUAL FUNDS(cost USD 1,300,692) 1,412,837 5.64
TOTAL TRANSFERABLE SECURITIES ADMITTED TO AN OFFICIAL EXCHANGE LISTING(cost USD 20,693,825) 23,457,204 93.71
Holdings Security Description Currency Interest Rate(a) Maturity Date(b)Market Value
USD
% ofShareholders’
Equity
Transferable securities dealt in another regulated market
Bonds – 0.98%Argentina
10,000 YPF S.A. USD 7.000% 15/12/2047 6,361 0.02
Mexico20,000 Petroleos Mexicanos USD 4.500% 23/01/2026 18,900 0.0860,000 Petroleos Mexicanos USD 5.350% 12/02/2028 56,067 0.22
74,967 0.30
United States1,581,000,000 Indonesia Treasury Bond—JPMorgan Chase Bank NA IDR 8.375% 15/03/2034 127,197 0.51
Venezuela560,000 Petroleos de Venezuela S.A. USD 6.000% 16/05/2024 20,720 0.08440,000 Petroleos de Venezuela S.A. USD 6.000% 15/11/2026 16,500 0.07
37,220 0.15
TOTAL BONDS(cost USD 677,950) 245,745 0.98
TOTAL TRANSFERABLE SECURITIES DEALT IN ANOTHER REGULATED MARKET(cost USD 677,950) 245,745 0.98
Other Transferable Securities
Bonds – 1.14%Peru
97,000 Peruvian Government International Bond PEN 8.200% 12/08/2026 36,253 0.15351,000 Peruvian Government International Bond PEN 6.900% 12/08/2037 118,109 0.4743,000 Peruvian Government International Bond PEN 6.850% 12/02/2042 14,479 0.06
168,841 0.68
Goldman Sachs Funds—Emerging Markets Multi-Asset PortfolioSchedule of InvestmentsAs at 30 November 2020
The accompanying notes are an integral part of these financial statements.
408

Holdings Security Description Currency Interest Rate(a) Maturity Date(b)Market Value
USD
% ofShareholders’
Equity
Bonds – (Continued)United States
760,000 JPMorgan Chase Bank NA CNY 3.290% 23/05/2029 115,889 0.46
TOTAL BONDS(cost USD 284,670) 284,730 1.14
TOTAL OTHER TRANSFERABLE SECURITIES(cost USD 284,670) 284,730 1.14
MARKET VALUE OF INVESTMENTS EXCLUDING DERIVATIVES(cost USD 21,656,445) 23,987,679 95.83
Futures Contracts – 0.00%
Number ofContracts Security Description
CommitmentMarket Value
USD
UnrealisedGainUSD
% ofShareholders’
Equity
EUR(1) German Federal Republic Bonds 5Y Futures 08/12/2020 Short (162,431) 72 0.00
USD8 US Treasury Notes 10YR Futures 22/03/2021 Long 1,104,875 1,552 0.012 US Treasury Notes 5YR Futures 31/03/2021 Long 251,984 205 0.003 US Treasury Ultra Long Bond Futures 22/03/2021 Long 646,969 705 0.00
2,003,828 2,462 0.01
UNREALISED GAIN ON FUTURES CONTRACTS 2,534 0.01
Number ofContracts Security Description
CommitmentMarket Value
USD
UnrealisedLossUSD
% ofShareholders’
Equity
EUR(1) German Federal Republic Bonds 10YR Futures 08/12/2020 Short (210,329) (2,075) (0.01)
USD(2) US Treasury Long Bond Futures 22/03/2021 Short (349,438) (89) (0.00)(1) US Treasury Notes 2YR Futures 31/03/2021 Short (220,828) (50) (0.00)
(570,266) (139) (0.00)
UNREALISED LOSS ON FUTURES CONTRACTS (2,214) (0.01)
Forward Currency Contracts – (0.04%)
CurrencyAmountBought Currency
AmountSold
MaturityDate
UnrealisedGainUSD
% ofShareholders’
Equity
BRL 103,395 USD 17,997 02/12/2020 1,484 0.01CNH 2,071,681 USD 304,929 16/12/2020 9,986 0.04CZK 5,827,858 USD 259,390 16/12/2020 7,175 0.03EUR 584,673 USD 688,067 16/12/2020 13,574 0.06HUF 97,227,810 USD 319,568 16/12/2020 5,124 0.02MXN 16,475,373 USD 774,130 16/12/2020 45,234 0.19PLN 3,119,101 USD 820,794 16/12/2020 15,560 0.05RON 803,843 USD 195,337 16/12/2020 2,481 0.01THB 8,394,508 USD 269,880 16/12/2020 7,595 0.03CLP 99,794,002 USD 130,111 17/12/2020 300 0.00USD 268,170 CLP 202,743,488 17/12/2020 3,226 0.01ZAR 7,235,587 USD 438,834 17/12/2020 31,694 0.13BRL 103,395 USD 19,306 05/01/2021 169 0.00IDR 1,028,950,090 USD 69,580 06/01/2021 2,923 0.01USD 115,782 IDR 1,635,762,286 06/01/2021 521 0.00KRW 230,173,535 USD 204,226 08/01/2021 3,743 0.02MYR 921,973 USD 221,118 13/01/2021 5,035 0.02TRY 456,483 USD 55,339 19/01/2021 2,031 0.01MYR 635,246 USD 152,916 26/01/2021 2,861 0.01RUB 7,540,056 USD 98,374 08/02/2021 44 0.00USD 136,347 PEN 480,925 12/07/2021 3,134 0.01USD 91,426 TRY 784,882 04/08/2021 476 0.00
UNREALISED GAIN ON FORWARD CURRENCY CONTRACTS 164,370 0.66
Goldman Sachs Funds—Emerging Markets Multi-Asset PortfolioSchedule of InvestmentsAs at 30 November 2020
The accompanying notes are an integral part of these financial statements.
409

Forward Currency Contracts – (Continued)
CurrencyAmountBought Currency
AmountSold
MaturityDate
UnrealisedLossUSD
% ofShareholders’
Equity
USD 19,319 BRL 103,395 02/12/2020 (162) (0.00)EUR 51,047 CZK 1,398,939 16/12/2020 (2,728) (0.01)TRY 521,681 USD 66,583 16/12/2020 (176) (0.00)USD 80,456 CNY 542,573 16/12/2020 (1,965) (0.01)USD 221,241 CZK 5,088,861 16/12/2020 (11,522) (0.04)USD 1,091,989 EUR 925,422 16/12/2020 (18,568) (0.08)USD 244,641 HUF 75,316,958 16/12/2020 (6,880) (0.04)USD 38,000 IDR 575,278,960 16/12/2020 (2,593) (0.01)USD 695,138 MXN 15,022,491 16/12/2020 (51,970) (0.21)USD 656,466 PLN 2,501,968 16/12/2020 (14,409) (0.05)USD 126,638 RON 521,503 16/12/2020 (1,698) (0.01)USD 113,484 THB 3,551,448 16/12/2020 (3,907) (0.02)USD 522,812 ZAR 8,765,598 17/12/2020 (47,214) (0.19)USD 93,000 KRW 104,882,825 08/01/2021 (1,765) (0.00)USD 38,573 TRY 316,761 19/01/2021 (1,237) (0.01)INR 16,104,881 USD 216,783 27/01/2021 (316) (0.00)USD 215,640 INR 16,104,881 27/01/2021 (829) (0.00)USD 273,381 COP 1,000,106,463 29/01/2021 (5,031) (0.02)USD 74,880 RUB 5,752,845 08/02/2021 (211) (0.00)USD 321,405 CNH 2,131,093 24/02/2021 (802) (0.00)PEN 119,485 USD 33,524 12/07/2021 (428) (0.00)
UNREALISED LOSS ON FORWARD CURRENCY CONTRACTS (174,411) (0.70)
Share Class Specific Forward Currency Contracts – 0.32%
CurrencyAmountBought Currency
AmountSold
MaturityDate
UnrealisedGainUSD
% ofShareholders’
Equity
AUD 577,000 USD 421,505 16/12/2020 4,297 0.02EUR 135,000 USD 160,004 16/12/2020 2,004 0.01GBP 408,000 USD 543,192 16/12/2020 2,530 0.01SGD 5,123,000 USD 3,757,389 16/12/2020 73,037 0.29
UNREALISED GAIN ON FORWARD CURRENCY CONTRACTS HELD FOR HEDGING PURPOSES 81,868 0.33
CurrencyAmountBought Currency
AmountSold
MaturityDate
UnrealisedLossUSD
% ofShareholders’
Equity
USD 102,501 SGD 140,000 16/12/2020 (2,176) (0.01)
UNREALISED LOSS ON FORWARD CURRENCY CONTRACTS HELD FOR HEDGING PURPOSES (2,176) (0.01)
Swap Contracts – 0.16%Net LocalNotionalAmount Pay Receive Currency Maturity Date
UnrealisedGainUSD
% ofShareholders’
Equity
Interest Rate Swaps1,240,000 Floating (MYR 3 month KLIBOR) Fixed 3.650% MYR 27/02/2024 15,098 0.061,390,000 Floating (MYR 3 month KLIBOR) Fixed 3.693% MYR 01/03/2024 17,384 0.07170,000 Floating (MYR 3 month KLIBOR) Fixed 3.330% MYR 31/05/2024 1,744 0.00250,000 Floating (MYR 3 month KLIBOR) Fixed 3.250% MYR 18/12/2024 2,592 0.01
UNREALISED GAIN ON INTEREST RATE SWAPS 36,818 0.14
Credit Default Swaps80,000 Floating (Russian Foreign Bond -
Eurobond)Fixed 1.000% USD 20/06/2025 1,351 0.01
30,000 Floating (Ukraine GovernmentInternational Bond)
Fixed 5.000% USD 20/06/2025 1,793 0.01
70,000 Floating (Indonesia GovernmentInternational Bond)
Fixed 1.000% USD 20/12/2025 1,317 0.00
UNREALISED GAIN ON CREDIT DEFAULT SWAPS 4,461 0.02
TOTAL UNREALISED GAIN ON SWAP CONTRACTS 41,279 0.16
MARKET VALUE OF INVESTMENTS(cost USD 21,656,445)
24,098,929 96.27
OTHER ASSETS AND LIABILITIES 931,478 3.73
SHAREHOLDERS’ EQUITY 25,030,407 100.00
Goldman Sachs Funds—Emerging Markets Multi-Asset PortfolioSchedule of InvestmentsAs at 30 November 2020
The accompanying notes are an integral part of these financial statements.
410

TOTAL INVESTMENTSMarket Value
USD
% ofShareholders’
Equity
Total Investments excluding derivatives (cost USD 21,656,445) 23,987,679 95.83Unrealised gain on futures contracts 2,534 0.01Unrealised loss on futures contracts (2,214) (0.01)Unrealised gain on forward currency contracts 164,370 0.66Unrealised loss on forward currency contracts (174,411) (0.70)Unrealised gain on forward currency contracts held for hedging purposes 81,868 0.33Unrealised loss on forward currency contracts held for hedging purposes (2,176) (0.01)Unrealised gain on swap contracts 41,279 0.16Other Assets and Liabilities 931,478 3.73
Shareholders’ Equity 25,030,407 100.00
The Futures Commission Merchant was Morgan Stanley & Co., Inc.
The counterparties for forward currency contracts were Australia and New Zealand Banking Group Ltd., Bank of America N.A., Barclays Bank Plc., BNP Paribas S.A., Citibank N.A., CreditSuisse International, Deutsche Bank AG, HSBC Bank Plc., Merrill Lynch International, Morgan Stanley & Co. International Plc., Natwest Markets Plc., Royal Bank of Canada, StandardChartered Bank and State Street Bank & Trust.
The counterparties for swap contracts were Barclays Bank Plc., Citibank N.A., Morgan Stanley and Morgan Stanley & Co. International Plc.
The maximum individual counterparty exposure as at 30 November 2020 is 0.34% of the NAV.
(a) Interest rates represent either the stated coupon rate, annualised discounted yield on date of purchase for discounted securities, or, for floating rate securities, the current reset ratewhich is based upon interest rates indices.
(b) Maturity dates represent either the stated date on the security, or the next interest reset date for floating rate securities or the prerefunded date for those type of securities.(c) This security has a step up coupon which moves to the second rate at a set date in the future.(d) Variable and floating coupon rates are those quoted as of 30 November 2020.(e) 144A: This security is issued to qualified institutional investors, pursuant to private placements, and is transferable as stated in rule 144A of the US Securities Act of 1933.(f) Security holding is traded/held in USD. (ADR: American Depositary Receipt/GDR: Global Depositary Receipt).(g) A related party to Goldman Sachs Funds.
Goldman Sachs Funds—Emerging Markets Multi-Asset PortfolioSchedule of InvestmentsAs at 30 November 2020
The accompanying notes are an integral part of these financial statements.
411

Holdings Security DescriptionMarket Value
USD
% ofShareholders’
Equity
Transferable securities admitted to an official exchange listing
Mutual Funds – 96.62%Ireland
320,817 Goldman Sachs Global Equity Volatility Fund (IO Distribution Class)(a) 3,516,154 3.241,378 Goldman Sachs US$ Liquid Reserves Plus Fund (X Accumulation Class)(a)(b) 14,513,416 13.37
3,665,255 Goldman Sachs US$ Treasury Liquid Reserves Fund (X Distribution Class)(a)(c) 3,665,255 3.3825,257 Invesco Morningstar US Energy Infrastructure MLP UCITS ETF 730,180 0.6735,664 iShares Core S&P 500 UCITS ETF 13,034,835 12.0063,300 iShares Developed Markets Property Yield UCITS ETF 1,529,644 1.4158,637 iShares Global Infrastructure UCITS ETF 1,741,226 1.60171,279 iShares S&P 500 Energy Sector UCITS ETF 568,304 0.52
39,299,014 36.19
Luxembourg547,487 Goldman Sachs Funds - Alternative Trend Portfolio (IO Distribution Class)(a) 5,622,691 5.18250,754 Goldman Sachs Funds - Emerging Markets CORE® Equity Portfolio (IO Distribution Snap Class)(a) 3,056,689 2.81170,078 Goldman Sachs Funds - Emerging Markets Debt Local Portfolio (IO Distribution Class)(a) 1,180,342 1.09153,746 Goldman Sachs Funds - Emerging Markets Debt Portfolio (IO Distribution Class)(a) 1,949,502 1.80155,521 Goldman Sachs Funds - Emerging Markets Equity Portfolio (IO Distribution Class)(a) 2,880,245 2.65804,177 Goldman Sachs Funds - Global CORE® Equity Portfolio (IO Distribution Snap Class)(a) 13,244,798 12.20961,332 Goldman Sachs Funds - Global Credit Portfolio (Hedged) (IO Distribution Snap Class)(a) 11,766,708 10.84421,667 Goldman Sachs Funds - Global Equity Partners Portfolio (IO Distribution Class)(a) 7,362,297 6.78891,142 Goldman Sachs Funds - Global Fixed Income Plus Portfolio (Hedged) (IO Distribution Snap Class)(a) 10,800,641 9.95362,619 Goldman Sachs Funds - Global High Yield Portfolio (IO Distribution Class)(a) 3,100,392 2.85320,469 Goldman Sachs Funds - Global Small Cap CORE® Equity Portfolio (IO Distribution Snap Class)(a) 4,646,805 4.28
65,611,110 60.43
TOTAL MUTUAL FUNDS(cost USD 92,667,924) 104,910,124 96.62
TOTAL TRANSFERABLE SECURITIES ADMITTED TO AN OFFICIAL EXCHANGE LISTING(cost USD 92,667,924) 104,910,124 96.62
MARKET VALUE OF INVESTMENTS EXCLUDING DERIVATIVES(cost USD 92,667,924) 104,910,124 96.62
Futures Contracts – 0.48%
Number ofContracts Security Description
CommitmentMarket Value
USD
UnrealisedGainUSD
% ofShareholders’
Equity
CAD5 S&P TSX 60 Index Futures 17/12/2020 Long 797,000 53,176 0.05
CHF6 Swiss Market Index Futures 18/12/2020 Long 698,905 7,700 0.01
EUR2 Amsterdam Index Futures 18/12/2020 Long 293,842 4,966 0.018 CAC 40 Index Futures 18/12/2020 Long 535,959 11,113 0.012 DAX Index Futures 18/12/2020 Long 804,838 14,305 0.0142 EURO STOXX 50 Index Dividend Futures 17/12/2021 Long 419,674 48,119 0.05164 EURO STOXX Banks Index 18/12/2020 Long 735,756 155,577 0.141 FTSE MIB Index Futures 18/12/2020 Long 133,780 22,102 0.023 IBEX 35 Index Futures 18/12/2020 Long 292,570 7,819 0.01
3,216,419 264,001 0.25
GBP12 FTSE 100 Index Futures 18/12/2020 Long 1,017,579 55,394 0.05
JPY9 TOPIX Index Futures 10/12/2020 Long 1,515,467 132,781 0.12
SEK13 OMX Stockholm 30 Index Futures 18/12/2020 Long 295,186 1,571 0.00
USD102 US Treasury Notes 10YR Futures 22/03/2021 Long 14,087,156 10,468 0.01
UNREALISED GAIN ON FUTURES CONTRACTS 525,091 0.49
Goldman Sachs Funds—Global Multi-Asset Balanced PortfolioSchedule of InvestmentsAs at 30 November 2020
The accompanying notes are an integral part of these financial statements.
412
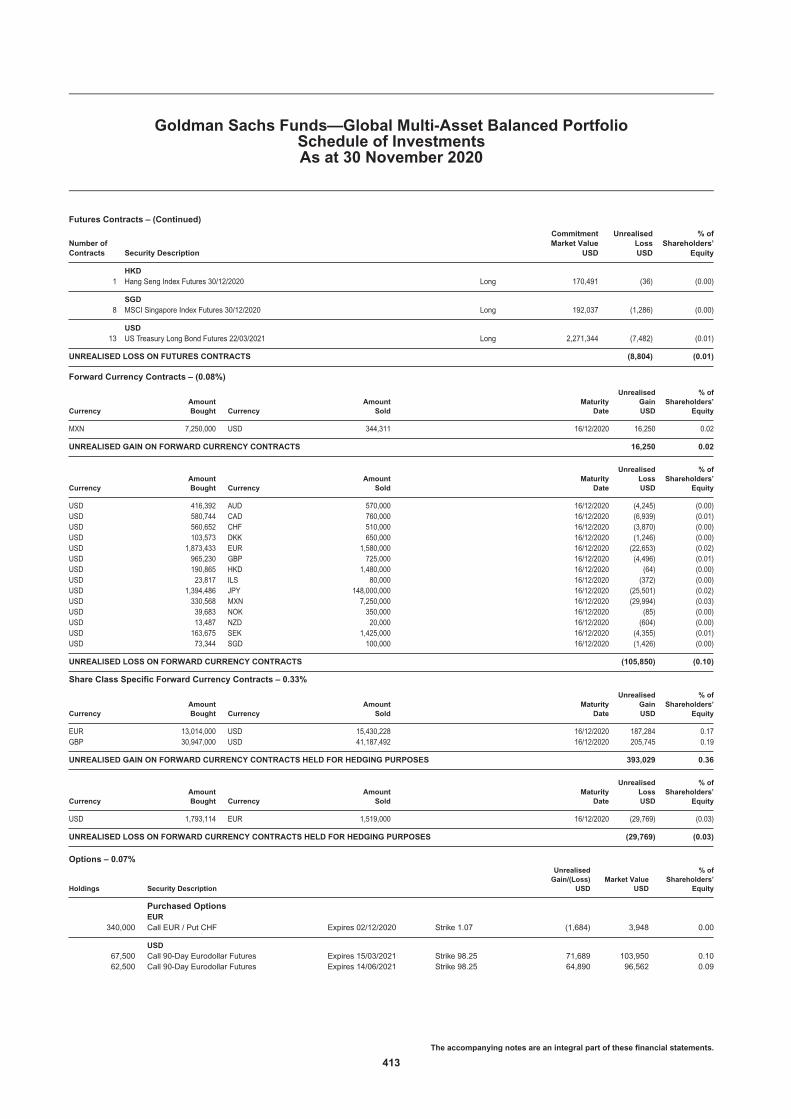
Futures Contracts – (Continued)
Number ofContracts Security Description
CommitmentMarket Value
USD
UnrealisedLossUSD
% ofShareholders’
Equity
HKD1 Hang Seng Index Futures 30/12/2020 Long 170,491 (36) (0.00)
SGD8 MSCI Singapore Index Futures 30/12/2020 Long 192,037 (1,286) (0.00)
USD13 US Treasury Long Bond Futures 22/03/2021 Long 2,271,344 (7,482) (0.01)
UNREALISED LOSS ON FUTURES CONTRACTS (8,804) (0.01)
Forward Currency Contracts – (0.08%)
CurrencyAmountBought Currency
AmountSold
MaturityDate
UnrealisedGainUSD
% ofShareholders’
Equity
MXN 7,250,000 USD 344,311 16/12/2020 16,250 0.02
UNREALISED GAIN ON FORWARD CURRENCY CONTRACTS 16,250 0.02
CurrencyAmountBought Currency
AmountSold
MaturityDate
UnrealisedLossUSD
% ofShareholders’
Equity
USD 416,392 AUD 570,000 16/12/2020 (4,245) (0.00)USD 580,744 CAD 760,000 16/12/2020 (6,939) (0.01)USD 560,652 CHF 510,000 16/12/2020 (3,870) (0.00)USD 103,573 DKK 650,000 16/12/2020 (1,246) (0.00)USD 1,873,433 EUR 1,580,000 16/12/2020 (22,653) (0.02)USD 965,230 GBP 725,000 16/12/2020 (4,496) (0.01)USD 190,865 HKD 1,480,000 16/12/2020 (64) (0.00)USD 23,817 ILS 80,000 16/12/2020 (372) (0.00)USD 1,394,486 JPY 148,000,000 16/12/2020 (25,501) (0.02)USD 330,568 MXN 7,250,000 16/12/2020 (29,994) (0.03)USD 39,683 NOK 350,000 16/12/2020 (85) (0.00)USD 13,487 NZD 20,000 16/12/2020 (604) (0.00)USD 163,675 SEK 1,425,000 16/12/2020 (4,355) (0.01)USD 73,344 SGD 100,000 16/12/2020 (1,426) (0.00)
UNREALISED LOSS ON FORWARD CURRENCY CONTRACTS (105,850) (0.10)
Share Class Specific Forward Currency Contracts – 0.33%
CurrencyAmountBought Currency
AmountSold
MaturityDate
UnrealisedGainUSD
% ofShareholders’
Equity
EUR 13,014,000 USD 15,430,228 16/12/2020 187,284 0.17GBP 30,947,000 USD 41,187,492 16/12/2020 205,745 0.19
UNREALISED GAIN ON FORWARD CURRENCY CONTRACTS HELD FOR HEDGING PURPOSES 393,029 0.36
CurrencyAmountBought Currency
AmountSold
MaturityDate
UnrealisedLossUSD
% ofShareholders’
Equity
USD 1,793,114 EUR 1,519,000 16/12/2020 (29,769) (0.03)
UNREALISED LOSS ON FORWARD CURRENCY CONTRACTS HELD FOR HEDGING PURPOSES (29,769) (0.03)
Options – 0.07%
Holdings Security Description
UnrealisedGain/(Loss)
USDMarket Value
USD
% ofShareholders’
Equity
Purchased OptionsEUR
340,000 Call EUR / Put CHF Expires 02/12/2020 Strike 1.07 (1,684) 3,948 0.00
USD67,500 Call 90-Day Eurodollar Futures Expires 15/03/2021 Strike 98.25 71,689 103,950 0.1062,500 Call 90-Day Eurodollar Futures Expires 14/06/2021 Strike 98.25 64,890 96,562 0.09
Goldman Sachs Funds—Global Multi-Asset Balanced PortfolioSchedule of InvestmentsAs at 30 November 2020
The accompanying notes are an integral part of these financial statements.
413

Options – (Continued)
Holdings Security Description
UnrealisedGain/(Loss)
USDMarket Value
USD
% ofShareholders’
Equity
Purchased Options – (Continued)USD – (Continued)
60,000 Call 90-Day Eurodollar Futures Expires 13/09/2021 Strike 98.25 61,873 92,400 0.08770,000 Call USD / Put CNH Expires 30/12/2020 Strike 7.13 (11,725) 49 0.00
186,727 292,961 0.27
TOTAL PURCHASED OPTIONS(cost USD 111,866) 296,909 0.27
Written OptionsEUR
(8,236) Put iShares EURO STOXX Banks Index Expires 12/11/2021 Strike 68.64 23,911 (64,273) (0.06)
USD(470) Put Russell 2000 Index Expires 31/12/2021 Strike 1,813.95 3,833 (84,619) (0.08)(353) Put S&P 500 Index Expires 31/12/2021 Strike 3,197.16 8,511 (67,983) (0.06)
12,344 (152,602) (0.14)
TOTAL WRITTEN OPTIONS(cost USD (253,130)) (216,875) (0.20)
TOTAL OPTIONS(cost USD (141,264)) 80,034 0.07
MARKET VALUE OF INVESTMENTS(cost USD 92,526,660) 105,780,105 97.42
OTHER ASSETS AND LIABILITIES 2,801,646 2.58
SHAREHOLDERS’ EQUITY 108,581,751 100.00
TOTAL INVESTMENTSMarket Value
USD
% ofShareholders’
Equity
Total Investments excluding derivatives (cost USD 92,667,924) 104,910,124 96.62Unrealised gain on futures contracts 525,091 0.49Unrealised loss on futures contracts (8,804) (0.01)Unrealised gain on forward currency contracts 16,250 0.02Unrealised loss on forward currency contracts (105,850) (0.10)Unrealised gain on forward currency contracts held for hedging purposes 393,029 0.36Unrealised loss on forward currency contracts held for hedging purposes (29,769) (0.03)Market value of purchased options (cost USD 111,866) 296,909 0.27Market value of written options (cost USD (253,130)) (216,875) (0.20)Other Assets and Liabilities 2,801,646 2.58
Shareholders’ Equity 108,581,751 100.00
The Futures Commission Merchant was Morgan Stanley & Co., Inc.
The counterparty for forward currency contracts was Morgan Stanley & Co., Inc.
The counterparties for options contracts were Barclays Bank Plc., Morgan Stanley & Co. International Plc. and Morgan Stanley & Co., Inc.
The maximum individual counterparty exposure as at 30 November 2020 is 0.75% of the NAV.
(a) A related party to Goldman Sachs Funds.(b) The yield for this fund as at 30 November 2020 was 0.489%.(c) The yield for this fund as at 30 November 2020 was 0.120%.
Goldman Sachs Funds—Global Multi-Asset Balanced PortfolioSchedule of InvestmentsAs at 30 November 2020
The accompanying notes are an integral part of these financial statements.
414

Holdings Security DescriptionMarket Value
USD
% ofShareholders’
Equity
Transferable securities admitted to an official exchange listing
Mutual Funds – 97.54%Ireland
886,915 Goldman Sachs Global Equity Volatility Fund (IO Distribution Class)(a) 9,720,585 2.114,119 Goldman Sachs US$ Liquid Reserves Plus Fund (X Accumulation Class)(a)(b) 43,370,416 9.41
2,315,469 Goldman Sachs US$ Treasury Liquid Reserves Fund (X Distribution Class)(a)(c) 2,315,469 0.5086,858 Invesco Morningstar US Energy Infrastructure MLP UCITS ETF 2,511,065 0.55205,952 iShares Developed Markets Property Yield UCITS ETF 4,976,830 1.08168,293 iShares Global Infrastructure UCITS ETF 4,997,461 1.08594,096 iShares S&P 500 Energy Sector UCITS ETF 1,971,211 0.43
69,863,037 15.16
Luxembourg2,367,021 Goldman Sachs Funds - Alternative Trend Portfolio (IO Distribution Class)(a) 24,309,302 5.27707,755 Goldman Sachs Funds - Emerging Markets CORE® Equity Portfolio (IO Distribution Snap Class)(a) 8,627,536 1.87828,125 Goldman Sachs Funds - Emerging Markets Debt Local Portfolio (IO Distribution Class)(a) 5,747,188 1.25
1,766,791 Goldman Sachs Funds - Emerging Markets Debt Portfolio (IO Distribution Class)(a) 22,402,910 4.86497,248 Goldman Sachs Funds - Emerging Markets Equity Portfolio (IO Distribution Class)(a) 9,209,030 2.00
2,693,775 Goldman Sachs Funds - Global CORE® Equity Portfolio (IO Distribution Snap Class)(a) 44,366,469 9.636,675,282 Goldman Sachs Funds - Global Credit Portfolio (Hedged) (IO Distribution Snap Class)(a) 81,705,451 17.731,351,224 Goldman Sachs Funds - Global Equity Partners Portfolio (IO Distribution Class)(a) 23,592,375 5.126,721,995 Goldman Sachs Funds - Global Fixed Income Plus Portfolio (Hedged) (IO Distribution Snap Class)(a) 81,470,576 17.683,233,369 Goldman Sachs Funds - Global Fixed Income Portfolio (Hedged) (IO Distribution Snap Class)(a) 40,029,108 8.682,509,843 Goldman Sachs Funds - Global High Yield Portfolio (IO Distribution Class)(a) 21,459,161 4.651,157,693 Goldman Sachs Funds - Global Small Cap CORE® Equity Portfolio (IO Distribution Snap Class)(a) 16,786,553 3.64
379,705,659 82.38
TOTAL MUTUAL FUNDS(cost USD 400,275,356) 449,568,696 97.54
TOTAL TRANSFERABLE SECURITIES ADMITTED TO AN OFFICIAL EXCHANGE LISTING(cost USD 400,275,356) 449,568,696 97.54
MARKET VALUE OF INVESTMENTS EXCLUDING DERIVATIVES(cost USD 400,275,356) 449,568,696 97.54
Futures Contracts – 0.38%
Number ofContracts Security Description
CommitmentMarket Value
USD
UnrealisedGainUSD
% ofShareholders’
Equity
CAD5 S&P TSX 60 Index Futures 17/12/2020 Long 797,000 53,176 0.01
CHF5 Swiss Market Index Futures 18/12/2020 Long 582,420 6,417 0.00
EUR1 Amsterdam Index Futures 18/12/2020 Long 146,921 2,483 0.004 CAC 40 Index Futures 18/12/2020 Long 267,980 5,556 0.001 DAX Index Futures 18/12/2020 Long 402,419 7,152 0.00
163 EURO STOXX 50 Index Dividend Futures 17/12/2021 Long 1,628,737 186,749 0.04632 EURO STOXX Banks Index 18/12/2020 Long 2,835,352 608,524 0.131 FTSE MIB Index Futures 18/12/2020 Long 133,780 15,624 0.011 IBEX 35 Index Futures 18/12/2020 Long 97,523 1,888 0.00
5,512,712 827,976 0.18
GBP8 FTSE 100 Index Futures 18/12/2020 Long 678,386 35,064 0.01
JPY7 TOPIX Index Futures 10/12/2020 Long 1,178,696 104,853 0.02
SEK9 OMX Stockholm 30 Index Futures 18/12/2020 Long 204,360 1,087 0.00
USD51 E-Mini S&P 500 Index Futures 18/12/2020 Long 9,261,600 689,887 0.15384 US Treasury Notes 10YR Futures 22/03/2021 Long 53,034,000 39,298 0.01
62,295,600 729,185 0.16
UNREALISED GAIN ON FUTURES CONTRACTS 1,757,758 0.38
Goldman Sachs Funds—Global Multi-Asset Conservative PortfolioSchedule of InvestmentsAs at 30 November 2020
The accompanying notes are an integral part of these financial statements.
415

Futures Contracts – (Continued)
Number ofContracts Security Description
CommitmentMarket Value
USD
UnrealisedLossUSD
% ofShareholders’
Equity
HKD1 Hang Seng Index Futures 30/12/2020 Long 170,491 (36) (0.00)
SGD2 MSCI Singapore Index Futures 30/12/2020 Long 48,009 (322) (0.00)
USD40 US Treasury Long Bond Futures 22/03/2021 Long 6,988,750 (23,021) (0.00)
UNREALISED LOSS ON FUTURES CONTRACTS (23,379) (0.00)
Forward Currency Contracts – (0.07%)
CurrencyAmountBought Currency
AmountSold
MaturityDate
UnrealisedGainUSD
% ofShareholders’
Equity
MXN 26,000,000 USD 1,234,313 16/12/2020 58,736 0.01
UNREALISED GAIN ON FORWARD CURRENCY CONTRACTS 58,736 0.01
CurrencyAmountBought Currency
AmountSold
MaturityDate
UnrealisedLossUSD
% ofShareholders’
Equity
USD 1,402,583 AUD 1,920,000 16/12/2020 (14,299) (0.00)USD 2,086,094 CAD 2,730,000 16/12/2020 (24,927) (0.01)USD 2,066,718 CHF 1,880,000 16/12/2020 (14,265) (0.00)USD 492,372 DKK 3,090,000 16/12/2020 (5,922) (0.00)USD 6,497,731 EUR 5,480,000 16/12/2020 (78,568) (0.02)USD 2,802,495 GBP 2,105,000 16/12/2020 (13,053) (0.00)USD 619,023 HKD 4,800,000 16/12/2020 (209) (0.00)USD 59,541 ILS 200,000 16/12/2020 (931) (0.00)USD 5,022,034 JPY 533,000,000 16/12/2020 (91,840) (0.02)USD 1,185,485 MXN 26,000,000 16/12/2020 (107,564) (0.02)USD 113,379 NOK 1,000,000 16/12/2020 (244) (0.00)USD 67,437 NZD 100,000 16/12/2020 (3,020) (0.00)USD 663,314 SEK 5,775,000 16/12/2020 (17,649) (0.01)USD 212,696 SGD 290,000 16/12/2020 (4,134) (0.00)
UNREALISED LOSS ON FORWARD CURRENCY CONTRACTS (376,625) (0.08)
Share Class Specific Forward Currency Contracts – 0.12%
CurrencyAmountBought Currency
AmountSold
MaturityDate
UnrealisedGainUSD
% ofShareholders’
Equity
EUR 14,111,000 USD 16,736,464 16/12/2020 197,508 0.04GBP 67,972,000 USD 90,492,656 16/12/2020 423,462 0.09
UNREALISED GAIN ON FORWARD CURRENCY CONTRACTS HELD FOR HEDGING PURPOSES 620,970 0.13
CurrencyAmountBought Currency
AmountSold
MaturityDate
UnrealisedLossUSD
% ofShareholders’
Equity
USD 341,123 EUR 288,000 16/12/2020 (4,493) (0.00)USD 2,395,115 GBP 1,835,000 16/12/2020 (59,293) (0.01)
UNREALISED LOSS ON FORWARD CURRENCY CONTRACTS HELD FOR HEDGING PURPOSES (63,786) (0.01)
Options – 0.10%
Holdings Security Description
UnrealisedGain/(Loss)
USDMarket Value
USD
% ofShareholders’
Equity
Purchased OptionsEUR
1,290,000 Call EUR / Put CHF Expires 02/12/2020 Strike 1.07 (6,388) 14,979 0.00
USD275,000 Call 90-Day Eurodollar Futures Expires 15/03/2021 Strike 98.25 296,912 423,500 0.09245,000 Call 90-Day Eurodollar Futures Expires 14/06/2021 Strike 98.25 260,453 378,525 0.09
Goldman Sachs Funds—Global Multi-Asset Conservative PortfolioSchedule of InvestmentsAs at 30 November 2020
The accompanying notes are an integral part of these financial statements.
416

Options – (Continued)
Holdings Security Description
UnrealisedGain/(Loss)
USDMarket Value
USD
% ofShareholders’
Equity
Purchased Options – (Continued)USD – (Continued)
240,000 Call 90-Day Eurodollar Futures Expires 13/09/2021 Strike 98.25 255,298 369,600 0.082,830,000 Call USD / Put CNH Expires 30/12/2020 Strike 7.13 (43,092) 178 0.00
769,571 1,171,803 0.26
TOTAL PURCHASED OPTIONS(cost USD 423,600) 1,186,782 0.26
Written OptionsEUR
(28,055) Put iShares EURO STOXX Banks Index Expires 12/11/2021 Strike 68.64 81,448 (218,937) (0.05)
USD(1,601) Put Russell 2000 Index Expires 31/12/2021 Strike 1,813.95 13,059 (288,245) (0.06)(1,205) Put S&P 500 Index Expires 31/12/2021 Strike 3,197.16 29,052 (232,067) (0.05)
42,111 (520,312) (0.11)
TOTAL WRITTEN OPTIONS(cost USD (862,808)) (739,249) (0.16)
TOTAL OPTIONS(cost USD (439,208)) 447,533 0.10
MARKET VALUE OF INVESTMENTS(cost USD 399,836,148) 451,989,903 98.07
OTHER ASSETS AND LIABILITIES 8,903,053 1.93
SHAREHOLDERS’ EQUITY 460,892,956 100.00
TOTAL INVESTMENTSMarket Value
USD
% ofShareholders’
Equity
Total Investments excluding derivatives (cost USD 400,275,356) 449,568,696 97.54Unrealised gain on futures contracts 1,757,758 0.38Unrealised loss on futures contracts (23,379) (0.00)Unrealised gain on forward currency contracts 58,736 0.01Unrealised loss on forward currency contracts (376,625) (0.08)Unrealised gain on forward currency contracts held for hedging purposes 620,970 0.13Unrealised loss on forward currency contracts held for hedging purposes (63,786) (0.01)Market value of purchased options (cost USD 423,600) 1,186,782 0.26Market value of written options (cost USD (862,808)) (739,249) (0.16)Other Assets and Liabilities 8,903,053 1.93
Shareholders’ Equity 460,892,956 100.00
The Futures Commission Merchant was Morgan Stanley & Co., Inc.
The counterparty for forward currency contracts was Morgan Stanley & Co., Inc.
The counterparties for options contracts were Barclays Bank Plc., Morgan Stanley & Co. International Plc. and Morgan Stanley & Co., Inc.
The maximum individual counterparty exposure as at 30 November 2020 is 0.64% of the NAV.
(a) A related party to Goldman Sachs Funds.(b) The yield for this fund as at 30 November 2020 was 0.489%.(c) The yield for this fund as at 30 November 2020 was 0.120%.
Goldman Sachs Funds—Global Multi-Asset Conservative PortfolioSchedule of InvestmentsAs at 30 November 2020
The accompanying notes are an integral part of these financial statements.
417

Holdings Security DescriptionMarket Value
USD
% ofShareholders’
Equity
Transferable securities admitted to an official exchange listing
Mutual Funds – 96.33%Ireland
673,568 Goldman Sachs Global Equity Volatility Fund (IO Distribution Class)(a) 7,382,303 3.752,022 Goldman Sachs US$ Liquid Reserves Plus Fund (X Accumulation Class)(a)(b) 21,297,026 10.80134 Goldman Sachs US$ Treasury Liquid Reserves Fund (X Distribution Class)(a)(c) 134 0.00
56,646 Invesco Morningstar US Energy Infrastructure MLP UCITS ETF 1,637,636 0.8388,960 iShares Core S&P 500 UCITS ETF 32,513,990 16.49208,956 iShares Developed Markets Property Yield UCITS ETF 5,049,422 2.56166,215 iShares Global Infrastructure UCITS ETF 4,935,754 2.51411,971 iShares S&P 500 Energy Sector UCITS ETF 1,366,920 0.69
74,183,185 37.63
Luxembourg1,026,419 Goldman Sachs Funds - Alternative Trend Portfolio (IO Distribution Class)(a) 10,541,326 5.35436,996 Goldman Sachs Funds - Emerging Markets CORE® Equity Portfolio (IO Distribution Snap Class)(a) 5,326,975 2.70408,561 Goldman Sachs Funds - Emerging Markets Debt Local Portfolio (IO Distribution Class)(a) 2,835,414 1.44463,541 Goldman Sachs Funds - Emerging Markets Debt Portfolio (IO Distribution Class)(a) 5,877,699 2.98353,819 Goldman Sachs Funds - Emerging Markets Equity Portfolio (IO Distribution Class)(a) 6,552,732 3.32
2,078,952 Goldman Sachs Funds - Global CORE® Equity Portfolio (IO Distribution Snap Class)(a) 34,240,346 17.37839,483 Goldman Sachs Funds - Global Credit Portfolio (Hedged) (IO Distribution Snap Class)(a) 10,275,271 5.21
1,098,244 Goldman Sachs Funds - Global Equity Partners Portfolio (IO Distribution Class)(a) 19,175,338 9.73375,750 Goldman Sachs Funds - Global High Yield Portfolio (IO Distribution Class)(a) 3,212,665 1.63
1,220,358 Goldman Sachs Funds - Global Small Cap CORE® Equity Portfolio (IO Distribution Snap Class)(a) 17,695,185 8.97
115,732,951 58.70
TOTAL MUTUAL FUNDS(cost USD 164,324,212) 189,916,136 96.33
TOTAL TRANSFERABLE SECURITIES ADMITTED TO AN OFFICIAL EXCHANGE LISTING(cost USD 164,324,212) 189,916,136 96.33
MARKET VALUE OF INVESTMENTS EXCLUDING DERIVATIVES(cost USD 164,324,212) 189,916,136 96.33
Futures Contracts – 0.64%
Number ofContracts Security Description
CommitmentMarket Value
USD
UnrealisedGainUSD
% ofShareholders’
Equity
CAD13 S&P TSX 60 Index Futures 17/12/2020 Long 2,072,200 138,258 0.07
CHF15 Swiss Market Index Futures 18/12/2020 Long 1,747,262 19,250 0.01
EUR8 Amsterdam Index Futures 18/12/2020 Long 1,175,367 19,864 0.0120 CAC 40 Index Futures 18/12/2020 Long 1,339,897 27,782 0.014 DAX Index Futures 18/12/2020 Long 1,609,676 28,609 0.02
110 EURO STOXX 50 Index Dividend Futures 17/12/2021 Long 1,099,147 126,027 0.06416 EURO STOXX Banks Index 18/12/2020 Long 1,866,308 386,723 0.201 FTSE MIB Index Futures 18/12/2020 Long 133,780 15,624 0.019 IBEX 35 Index Futures 18/12/2020 Long 877,711 23,457 0.01
8,101,886 628,086 0.32
GBP30 FTSE 100 Index Futures 18/12/2020 Long 2,543,947 131,490 0.07
JPY24 TOPIX Index Futures 10/12/2020 Long 4,041,245 359,495 0.18
SEK37 OMX Stockholm 30 Index Futures 18/12/2020 Long 840,146 4,471 0.00
USD123 US Treasury Notes 10YR Futures 22/03/2021 Long 16,987,453 12,622 0.01
UNREALISED GAIN ON FUTURES CONTRACTS 1,293,672 0.66
Goldman Sachs Funds—Global Multi-Asset Growth PortfolioSchedule of InvestmentsAs at 30 November 2020
The accompanying notes are an integral part of these financial statements.
418

Futures Contracts – (Continued)
Number ofContracts Security Description
CommitmentMarket Value
USD
UnrealisedLossUSD
% ofShareholders’
Equity
HKD3 Hang Seng Index Futures 30/12/2020 Long 511,471 (109) (0.00)
SGD25 MSCI Singapore Index Futures 30/12/2020 Long 600,116 (4,019) (0.00)
USD45 US Treasury Long Bond Futures 22/03/2021 Long 7,862,344 (25,899) (0.02)
UNREALISED LOSS ON FUTURES CONTRACTS (30,027) (0.02)
Forward Currency Contracts – (0.11%)
CurrencyAmountBought Currency
AmountSold
MaturityDate
UnrealisedGainUSD
% ofShareholders’
Equity
MXN 17,625,000 USD 834,895 16/12/2020 41,643 0.02
UNREALISED GAIN ON FORWARD CURRENCY CONTRACTS 41,643 0.02
CurrencyAmountBought Currency
AmountSold
MaturityDate
UnrealisedLossUSD
% ofShareholders’
Equity
USD 920,445 AUD 1,260,000 16/12/2020 (9,384) (0.00)USD 1,398,370 CAD 1,830,000 16/12/2020 (16,709) (0.01)USD 1,374,147 CHF 1,250,000 16/12/2020 (9,485) (0.01)USD 329,842 DKK 2,070,000 16/12/2020 (3,967) (0.00)USD 4,351,583 EUR 3,670,000 16/12/2020 (52,618) (0.03)USD 1,830,608 GBP 1,375,000 16/12/2020 (8,526) (0.00)USD 416,551 HKD 3,230,000 16/12/2020 (141) (0.00)USD 47,633 ILS 160,000 16/12/2020 (745) (0.00)USD 3,344,882 JPY 355,000,000 16/12/2020 (61,169) (0.03)USD 803,622 MXN 17,625,000 16/12/2020 (72,916) (0.04)USD 73,697 NOK 650,000 16/12/2020 (158) (0.00)USD 40,462 NZD 60,000 16/12/2020 (1,812) (0.00)USD 439,337 SEK 3,825,000 16/12/2020 (11,689) (0.01)USD 139,353 SGD 190,000 16/12/2020 (2,709) (0.00)
UNREALISED LOSS ON FORWARD CURRENCY CONTRACTS (252,028) (0.13)
Share Class Specific Forward Currency Contracts – 0.03%
CurrencyAmountBought Currency
AmountSold
MaturityDate
UnrealisedGainUSD
% ofShareholders’
Equity
EUR 2,131,000 USD 2,527,089 16/12/2020 30,228 0.02GBP 7,420,000 USD 9,865,426 16/12/2020 59,213 0.02
UNREALISED GAIN ON FORWARD CURRENCY CONTRACTS HELD FOR HEDGING PURPOSES 89,441 0.04
CurrencyAmountBought Currency
AmountSold
MaturityDate
UnrealisedLossUSD
% ofShareholders’
Equity
USD 517,579 EUR 440,000 16/12/2020 (10,445) (0.00)USD 384,729 GBP 298,000 16/12/2020 (13,862) (0.01)
UNREALISED LOSS ON FORWARD CURRENCY CONTRACTS HELD FOR HEDGING PURPOSES (24,307) (0.01)
Options – 0.08%
Holdings Security Description
UnrealisedGain/(Loss)
USDMarket Value
USD
% ofShareholders’
Equity
Purchased OptionsEUR
880,000 Call EUR / Put CHF Expires 02/12/2020 Strike 1.07 (4,358) 10,218 0.01
USD145,000 Call 90-Day Eurodollar Futures Expires 15/03/2021 Strike 98.25 154,910 223,300 0.11130,000 Call 90-Day Eurodollar Futures Expires 14/06/2021 Strike 98.25 136,030 200,850 0.10
Goldman Sachs Funds—Global Multi-Asset Growth PortfolioSchedule of InvestmentsAs at 30 November 2020
The accompanying notes are an integral part of these financial statements.
419

Options – (Continued)
Holdings Security Description
UnrealisedGain/(Loss)
USDMarket Value
USD
% ofShareholders’
Equity
Purchased Options – (Continued)USD – (Continued)
127,500 Call 90-Day Eurodollar Futures Expires 13/09/2021 Strike 98.25 132,964 196,350 0.101,980,000 Call USD / Put CNH Expires 30/12/2020 Strike 7.13 (30,150) 125 0.00
393,754 620,625 0.31
TOTAL PURCHASED OPTIONS(cost USD 241,446) 630,843 0.32
Written OptionsEUR
(18,285) Put iShares EURO STOXX Banks Index Expires 12/11/2021 Strike 68.64 53,084 (142,694) (0.07)
USD(1,035) Put Russell 2000 Index Expires 31/12/2021 Strike 1,813.95 8,442 (186,342) (0.09)(808) Put S&P 500 Index Expires 31/12/2021 Strike 3,197.16 19,481 (155,610) (0.08)
27,923 (341,952) (0.17)
TOTAL WRITTEN OPTIONS(cost USD (565,652)) (484,646) (0.24)
TOTAL OPTIONS(cost USD (324,206)) 146,197 0.08
MARKET VALUE OF INVESTMENTS(cost USD 164,000,006) 191,180,727 96.97
OTHER ASSETS AND LIABILITIES 5,976,611 3.03
SHAREHOLDERS’ EQUITY 197,157,338 100.00
TOTAL INVESTMENTSMarket Value
USD
% ofShareholders’
Equity
Total Investments excluding derivatives (cost USD 164,324,212) 189,916,136 96.33Unrealised gain on futures contracts 1,293,672 0.66Unrealised loss on futures contracts (30,027) (0.02)Unrealised gain on forward currency contracts 41,643 0.02Unrealised loss on forward currency contracts (252,028) (0.13)Unrealised gain on forward currency contracts held for hedging purposes 89,441 0.04Unrealised loss on forward currency contracts held for hedging purposes (24,307) (0.01)Market value of purchased options (cost USD 241,446) 630,843 0.32Market value of written options (cost USD (565,652)) (484,646) (0.24)Other Assets and Liabilities 5,976,611 3.03
Shareholders’ Equity 197,157,338 100.00
The Futures Commission Merchant was Morgan Stanley & Co., Inc.
The counterparty for forward currency contracts was Morgan Stanley & Co., Inc.
The counterparties for options contracts were Barclays Bank Plc., Morgan Stanley & Co. International Plc. and Morgan Stanley & Co., Inc.
The maximum individual counterparty exposure as at 30 November 2020 is 0.97% of the NAV.
(a) A related party to Goldman Sachs Funds.(b) The yield for this fund as at 30 November 2020 was 0.489%.(c) The yield for this fund as at 30 November 2020 was 0.120%.
Goldman Sachs Funds—Global Multi-Asset Growth PortfolioSchedule of InvestmentsAs at 30 November 2020
The accompanying notes are an integral part of these financial statements.
420

Holdings Security Description Currency Interest Rate(a) Maturity Date(b)Market Value
USD
% ofShareholders’
Equity
Transferable securities admitted to an official exchange listing
Bonds – 13.56%Austria
435,000 ams AG USD 7.000% 31/07/2025 485,025 0.47
Canada50,000 Bausch Health Cos., Inc. USD 5.250% 30/01/2030 51,138 0.055,000 Cenovus Energy, Inc. USD 3.000% 15/08/2022 5,058 0.0049,000 Cenovus Energy, Inc. USD 3.800% 15/09/2023 50,564 0.0565,000 Cenovus Energy, Inc. USD 5.375% 15/07/2025 71,826 0.07
178,586 0.17
France250,000 Constellium S.E. USD 5.750% 15/05/2024 256,250 0.25200,000 Credit Agricole S.A.(c) USD 8.125% Perp. 241,922 0.24100,000 Electricite de France S.A.(c) EUR 5.000% Perp. 137,499 0.13100,000 Getlink S.E. EUR 3.500% 30/10/2025 124,958 0.12
760,629 0.74
Germany200,000 Cheplapharm Arzneimittel GmbH USD 5.500% 15/01/2028 208,000 0.20200,000 IHO Verwaltungs GmbH USD 6.375% 15/05/2029 216,000 0.21150,000 Techem Verwaltungsgesellschaft 675 mbH EUR 2.000% 15/07/2025 178,363 0.17
602,363 0.58
Ireland200,000 Motion Bondco DAC USD 6.625% 15/11/2027 200,516 0.20
Israel110,000 Leviathan Bond Ltd. 144A(d) USD 5.750% 30/06/2023 116,050 0.11
Italy275,000 Telecom Italia SpA 144A(d) USD 5.303% 30/05/2024 299,159 0.29
Luxembourg200,000 Altice Financing S.A. USD 5.000% 15/01/2028 205,750 0.20400,000 ARD Finance S.A. USD 6.500% 30/06/2027 424,500 0.41100,000 Lincoln Financing SARL EUR 3.625% 01/04/2024 122,054 0.12
752,304 0.73
Netherlands150,000 AerCap Holdings NV(c) USD 5.875% 10/10/2079 143,250 0.14200,000 ING Groep NV(c) USD 6.500% Perp. 221,000 0.22100,000 PPF Telecom Group BV EUR 3.250% 29/09/2027 127,852 0.12100,000 Telefonica Europe BV(c) EUR 5.875% Perp. 134,200 0.13100,000 United Group BV EUR 3.125% 15/02/2026 117,868 0.11100,000 Ziggo Bond Co. BV EUR 3.375% 28/02/2030 121,370 0.12
865,540 0.84
Spain200,000 Banco Santander S.A. USD 3.490% 28/05/2030 223,380 0.21150,000 Telefonica Emisiones S.A. USD 4.103% 08/03/2027 172,434 0.17
395,814 0.38
Switzerland200,000 Credit Suisse Group AG(c) USD 6.250% Perp. 220,250 0.21200,000 Credit Suisse Group AG(c) USD 5.250% Perp. 212,500 0.21
432,750 0.42
United Kingdom200,000 Anglo American Capital Plc. USD 4.750% 10/04/2027 234,404 0.23200,000 Rolls-Royce Plc. USD 5.750% 15/10/2027 216,500 0.21238,000 Vmed O2 UK Financing I Plc. USD 4.250% 31/01/2031 246,033 0.24
696,937 0.68
United States225,000 AbbVie, Inc. USD 4.250% 14/11/2028 271,559 0.26100,000 AECOM USD 5.875% 15/10/2024 111,500 0.11100,000 Air Lease Corp. USD 3.750% 01/06/2026 107,700 0.10100,000 Ally Financial, Inc. USD 8.000% 01/11/2031 143,587 0.1475,000 American International Group, Inc. USD 3.400% 30/06/2030 85,487 0.0875,000 American Tower Corp. USD 3.950% 15/03/2029 87,196 0.08
Goldman Sachs Funds—Global Multi-Asset Income PortfolioSchedule of InvestmentsAs at 30 November 2020
The accompanying notes are an integral part of these financial statements.
421

Holdings Security Description Currency Interest Rate(a) Maturity Date(b)Market Value
USD
% ofShareholders’
Equity
Bonds – (Continued)United States – (Continued)
125,000 AmeriGas Partners LP Via AmeriGas Finance Corp. USD 5.875% 20/08/2026 141,094 0.1475,000 Anheuser-Busch Cos. LLC Via Anheuser-Busch InBev Worldwide, Inc. USD 4.700% 01/02/2036 95,456 0.09200,000 Anheuser-Busch InBev Finance, Inc. USD 4.700% 01/02/2036 250,896 0.2475,000 AT&T, Inc. USD 4.100% 15/02/2028 88,465 0.09150,000 AT&T, Inc. USD 5.250% 01/03/2037 194,265 0.19150,000 B&G Foods, Inc. USD 5.250% 01/04/2025 155,625 0.15175,000 Becton Dickinson and Co. USD 2.823% 20/05/2030 191,404 0.19111,000 Boeing Co. USD 5.150% 01/05/2030 130,997 0.13111,000 Boeing Co. USD 5.805% 01/05/2050 146,623 0.14170,000 Centene Corp. USD 3.000% 15/10/2030 179,149 0.1795,000 CenturyLink, Inc.—Series U USD 7.650% 15/03/2042 112,813 0.1175,000 Cigna Corp. USD 2.400% 15/03/2030 79,737 0.08100,000 CIT Group, Inc. USD 5.250% 07/03/2025 113,250 0.1175,000 Constellation Brands, Inc. USD 2.875% 01/05/2030 82,265 0.0825,000 Covanta Holding Corp. USD 5.000% 01/09/2030 26,875 0.03160,000 CVS Health Corp. USD 3.750% 01/04/2030 185,635 0.1848,000 Ford Motor Co. USD 8.500% 21/04/2023 53,905 0.05200,000 Ford Motor Credit Co., LLC USD 5.125% 16/06/2025 216,284 0.21220,000 Ford Motor Credit Co., LLC USD 3.375% 13/11/2025 221,452 0.21200,000 Ford Motor Credit Co., LLC USD 4.125% 17/08/2027 206,657 0.20125,000 General Motors Co. USD 6.750% 01/04/2046 177,035 0.17145,000 Genesis Energy LP Via Genesis Energy Finance Corp. USD 6.000% 15/05/2023 141,738 0.1445,000 HB Fuller Co. USD 4.250% 15/10/2028 46,463 0.05200,000 HCA, Inc. USD 5.000% 15/03/2024 224,772 0.22125,000 Hewlett Packard Enterprise Co. USD 6.200% 15/10/2035 159,715 0.1540,000 Home Depot, Inc. USD 3.350% 15/04/2050 47,583 0.05200,000 Kinder Morgan Energy Partners LP USD 7.300% 15/08/2033 278,856 0.2755,000 Laredo Petroleum, Inc. USD 9.500% 15/01/2025 37,744 0.04175,000 Lennar Corp. USD 4.125% 15/01/2022 180,031 0.1772,000 MGM Resorts International USD 4.750% 15/10/2028 75,240 0.07175,000 MPT Operating Partnership LP Via MPT Finance Corp. USD 6.375% 01/03/2024 181,097 0.18157,000 MPT Operating Partnership LP Via MPT Finance Corp. USD 4.625% 01/08/2029 167,393 0.16110,000 MPT Operating Partnership LP Via MPT Finance Corp. USD 3.500% 15/03/2031 112,108 0.11159,000 NGL Energy Partners LP Via NGL Energy Finance Corp. USD 7.500% 01/11/2023 80,295 0.0825,000 NRG Energy, Inc. USD 5.750% 15/01/2028 27,313 0.03175,000 NuStar Logistics LP USD 6.375% 01/10/2030 190,312 0.1865,000 Occidental Petroleum Corp. USD 8.000% 15/07/2025 71,500 0.07100,000 Occidental Petroleum Corp. USD 6.625% 01/09/2030 104,875 0.10173,000 OneMain Finance Corp. USD 5.375% 15/11/2029 189,435 0.1848,000 Oracle Corp. USD 3.600% 01/04/2050 55,858 0.0549,000 Pacific Gas & Electric Co. USD 3.500% 01/08/2050 49,355 0.0585,000 Qwest Corp. USD 6.750% 01/12/2021 89,402 0.0950,000 Raymond James Financial, Inc. USD 4.650% 01/04/2030 61,557 0.06125,000 Reynolds American, Inc. USD 5.850% 15/08/2045 159,477 0.1535,000 Service Corp. International USD 3.375% 15/08/2030 36,050 0.04100,000 Spectrum Brands, Inc. EUR 4.000% 01/10/2026 124,194 0.12143,000 Suburban Propane Partners LP Via Suburban Energy Finance Corp. USD 5.500% 01/06/2024 146,575 0.14192,000 Tenet Healthcare Corp. USD 5.125% 01/05/2025 194,880 0.19205,000 TransDigm, Inc. USD 6.500% 15/07/2024 209,356 0.20189,000 TransDigm, Inc. USD 6.375% 15/06/2026 197,032 0.19100,000 TRI Pointe Group, Inc. USD 5.250% 01/06/2027 109,375 0.1113,000 TRI Pointe Group, Inc. USD 5.700% 15/06/2028 14,755 0.01125,000 Verizon Communications, Inc. USD 5.250% 16/03/2037 173,676 0.1774,000 Walt Disney Co. USD 3.800% 22/03/2030 87,981 0.09200,000 Williams Cos., Inc.—Series A USD 7.500% 15/01/2031 262,836 0.2652,000 Yum! Brands, Inc. USD 3.625% 15/03/2031 52,260 0.05
8,198,000 7.95
TOTAL BONDS(cost USD 12,949,910) 13,983,673 13.56
Holdings Security DescriptionMarket Value
USD
% ofShareholders’
Equity
Common Stocks – 30.26%Australia
64,814 Sydney Airport 322,399 0.31
France16,697 BNP Paribas S.A. 872,258 0.852,996 Gecina S.A. 460,013 0.45
Goldman Sachs Funds—Global Multi-Asset Income PortfolioSchedule of InvestmentsAs at 30 November 2020
The accompanying notes are an integral part of these financial statements.
422

Holdings Security DescriptionMarket Value
USD
% ofShareholders’
Equity
Common Stocks – (Continued)France – (Continued)
16,678 Klepierre S.A. 379,115 0.373,067 Sanofi 315,034 0.303,307 Schneider Electric S.E. 468,096 0.456,084 Vinci S.A. 638,143 0.62
3,132,659 3.04
Germany11,498 Vonovia S.E. 791,961 0.77
Ireland816 Accenture Plc. �A� 203,070 0.20
2,709 Medtronic Plc. 308,826 0.30
511,896 0.50
Italy49,865 Enel SpA 506,159 0.4933,831 UniCredit SpA 356,229 0.35
862,388 0.84
Japan13,300 Takeda Pharmaceutical Co., Ltd. 477,929 0.46
Netherlands118,115 Koninklijke KPN NV 357,329 0.3433,186 Royal Dutch Shell Plc. �A� 584,569 0.57
941,898 0.91
Singapore52,660 Singapore Exchange Ltd. 349,875 0.34
Spain10,127 Ferrovial S.A. 285,596 0.2830,125 Iberdrola S.A. 414,665 0.40
700,261 0.68
Switzerland6,428 Nestle S.A. 725,790 0.705,921 Novartis AG 534,783 0.526,118 Swiss Re AG 565,707 0.5534,550 UBS Group AG 497,667 0.481,796 Zurich Insurance Group AG 740,336 0.72
3,064,283 2.97
Taiwan7,270 Taiwan Semiconductor Manufacturing Co., Ltd.—ADR(e) 708,607 0.69
United Kingdom4,833 AstraZeneca Plc. 510,591 0.50
100,898 BP Plc. 344,816 0.334,204 Ferguson Plc. 473,598 0.461,869 Linde Plc. 486,127 0.4724,570 National Grid Plc. 284,217 0.285,849 Reckitt Benckiser Group Plc. 517,651 0.507,393 Rio Tinto Plc. 487,660 0.477,531 Unilever Plc. 461,447 0.45
3,566,107 3.46
United States3,778 Ameren Corp. 296,913 0.291,127 American Tower Corp. 261,971 0.25895 Amgen, Inc. 198,359 0.19
7,461 Apple, Inc. 887,859 0.869,621 Aramark 342,796 0.332,329 AvalonBay Communities, Inc. 389,432 0.389,743 Bristol-Myers Squibb Co. 614,101 0.605,626 Chevron Corp. 509,716 0.507,843 Cisco Systems, Inc. 334,386 0.326,622 Coca-Cola Co. 340,702 0.3312,583 Comcast Corp. �A� 645,948 0.633,094 CVS Health Corp. 210,454 0.20
Goldman Sachs Funds—Global Multi-Asset Income PortfolioSchedule of InvestmentsAs at 30 November 2020
The accompanying notes are an integral part of these financial statements.
423
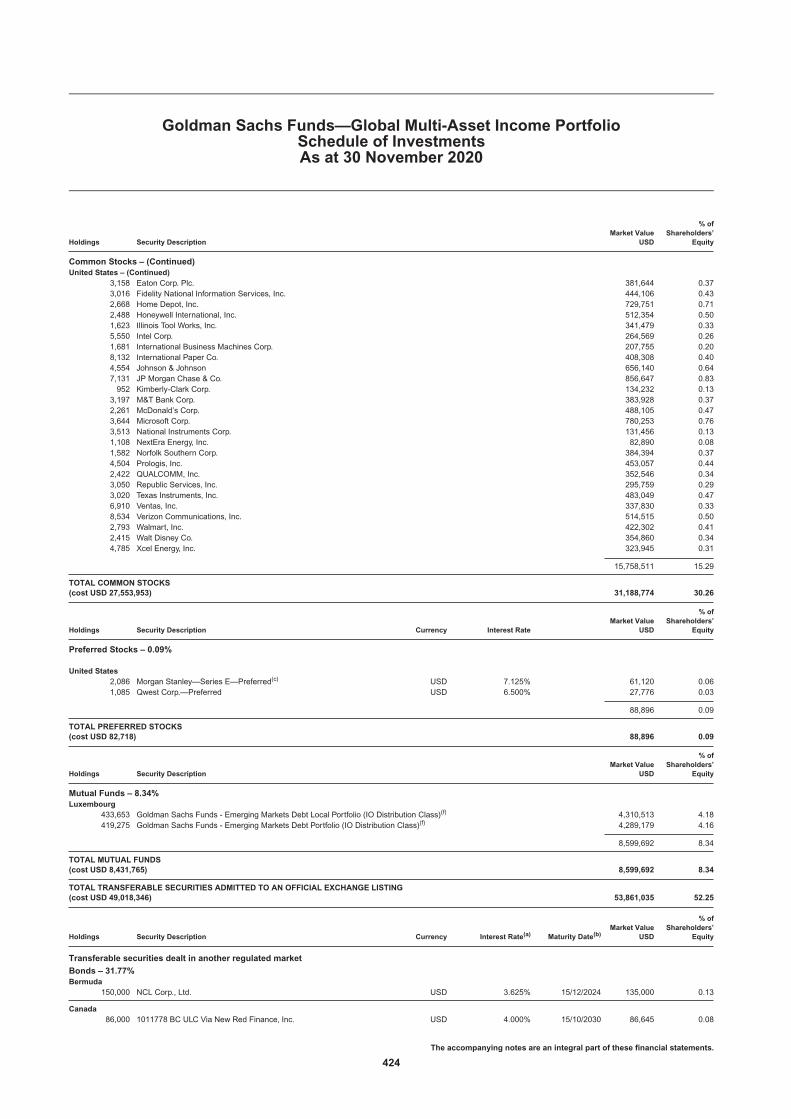
Holdings Security DescriptionMarket Value
USD
% ofShareholders’
Equity
Common Stocks – (Continued)United States – (Continued)
3,158 Eaton Corp. Plc. 381,644 0.373,016 Fidelity National Information Services, Inc. 444,106 0.432,668 Home Depot, Inc. 729,751 0.712,488 Honeywell International, Inc. 512,354 0.501,623 Illinois Tool Works, Inc. 341,479 0.335,550 Intel Corp. 264,569 0.261,681 International Business Machines Corp. 207,755 0.208,132 International Paper Co. 408,308 0.404,554 Johnson & Johnson 656,140 0.647,131 JP Morgan Chase & Co. 856,647 0.83952 Kimberly-Clark Corp. 134,232 0.13
3,197 M&T Bank Corp. 383,928 0.372,261 McDonald’s Corp. 488,105 0.473,644 Microsoft Corp. 780,253 0.763,513 National Instruments Corp. 131,456 0.131,108 NextEra Energy, Inc. 82,890 0.081,582 Norfolk Southern Corp. 384,394 0.374,504 Prologis, Inc. 453,057 0.442,422 QUALCOMM, Inc. 352,546 0.343,050 Republic Services, Inc. 295,759 0.293,020 Texas Instruments, Inc. 483,049 0.476,910 Ventas, Inc. 337,830 0.338,534 Verizon Communications, Inc. 514,515 0.502,793 Walmart, Inc. 422,302 0.412,415 Walt Disney Co. 354,860 0.344,785 Xcel Energy, Inc. 323,945 0.31
15,758,511 15.29
TOTAL COMMON STOCKS(cost USD 27,553,953) 31,188,774 30.26
Holdings Security Description Currency Interest RateMarket Value
USD
% ofShareholders’
Equity
Preferred Stocks – 0.09%
United States2,086 Morgan Stanley—Series E—Preferred(c) USD 7.125% 61,120 0.061,085 Qwest Corp.—Preferred USD 6.500% 27,776 0.03
88,896 0.09
TOTAL PREFERRED STOCKS(cost USD 82,718) 88,896 0.09
Holdings Security DescriptionMarket Value
USD
% ofShareholders’
Equity
Mutual Funds – 8.34%Luxembourg
433,653 Goldman Sachs Funds - Emerging Markets Debt Local Portfolio (IO Distribution Class)(f) 4,310,513 4.18419,275 Goldman Sachs Funds - Emerging Markets Debt Portfolio (IO Distribution Class)(f) 4,289,179 4.16
8,599,692 8.34
TOTAL MUTUAL FUNDS(cost USD 8,431,765) 8,599,692 8.34
TOTAL TRANSFERABLE SECURITIES ADMITTED TO AN OFFICIAL EXCHANGE LISTING(cost USD 49,018,346) 53,861,035 52.25
Holdings Security Description Currency Interest Rate(a) Maturity Date(b)Market Value
USD
% ofShareholders’
Equity
Transferable securities dealt in another regulated market
Bonds – 31.77%Bermuda
150,000 NCL Corp., Ltd. USD 3.625% 15/12/2024 135,000 0.13
Canada86,000 1011778 BC ULC Via New Red Finance, Inc. USD 4.000% 15/10/2030 86,645 0.08
Goldman Sachs Funds—Global Multi-Asset Income PortfolioSchedule of InvestmentsAs at 30 November 2020
The accompanying notes are an integral part of these financial statements.
424

Holdings Security Description Currency Interest Rate(a) Maturity Date(b)Market Value
USD
% ofShareholders’
Equity
Bonds – (Continued)Canada – (Continued)
90,000 Bausch Health Cos., Inc. USD 7.000% 15/03/2024 93,015 0.09250,000 Bausch Health Cos., Inc. USD 5.500% 01/11/2025 258,642 0.25100,000 Bausch Health Cos., Inc. USD 9.000% 15/12/2025 109,961 0.1150,000 Bausch Health Cos., Inc. USD 5.000% 30/01/2028 50,391 0.05171,000 Bausch Health Cos., Inc. USD 5.250% 15/02/2031 174,420 0.17100,000 Bombardier, Inc. USD 7.500% 01/12/2024 89,500 0.0945,000 Bombardier, Inc. USD 7.500% 15/03/2025 39,038 0.04150,000 Bombardier, Inc. USD 7.875% 15/04/2027 127,500 0.1247,000 Brookfield Residential Properties, Inc. Via Brookfield Residential US Corp. USD 4.875% 15/02/2030 46,471 0.05400,000 First Quantum Minerals Ltd. USD 7.250% 01/04/2023 409,000 0.4060,000 GFL Environmental, Inc. USD 5.125% 15/12/2026 63,825 0.0625,000 GFL Environmental, Inc. USD 8.500% 01/05/2027 27,875 0.03140,000 GFL Environmental, Inc. USD 4.000% 01/08/2028 140,175 0.14125,000 Glencore Finance Canada Ltd. 144A(d) USD 6.900% 15/11/2037 168,465 0.1670,000 Hudbay Minerals, Inc. USD 6.125% 01/04/2029 74,988 0.0750,000 Masonite International Corp. USD 5.750% 15/09/2026 52,625 0.05105,000 Masonite International Corp. USD 5.375% 01/02/2028 112,088 0.11207,000 Mattamy Group Corp. USD 4.625% 01/03/2030 218,902 0.2160,000 MEG Energy Corp. USD 7.125% 01/02/2027 59,400 0.06151,000 Telesat Canada Via Telesat LLC USD 4.875% 01/06/2027 155,990 0.15225,000 Videotron Ltd. USD 5.375% 15/06/2024 250,312 0.24
2,809,228 2.73
Cayman Islands120,205 Global Aircraft Leasing Co., Ltd. USD 6.500% 15/09/2024 106,982 0.11100,000 Noble Holding International Ltd. USD 7.875% 01/02/2026 24,500 0.0241,000 Park Aerospace Holdings Ltd. USD 5.250% 15/08/2022 42,863 0.0439,000 Transocean Poseidon Ltd. USD 6.875% 01/02/2027 32,955 0.0325,000 Transocean, Inc. USD 8.000% 01/02/2027 10,000 0.01
217,300 0.21
Italy225,000 Intesa Sanpaolo SpA 144A(d) USD 5.017% 26/06/2024 245,813 0.24200,000 UniCredit SpA(c) USD 5.459% 30/06/2035 216,777 0.21
462,590 0.45
Luxembourg200,000 Intelsat Jackson Holdings S.A. 144A(d) USD 8.000% 15/02/2024 204,750 0.20
Mexico200,000 Cemex SAB de CV USD 5.200% 17/09/2030 217,692 0.21
Netherlands100,000 Mylan NV USD 3.950% 15/06/2026 114,173 0.11
Supranationals275,000 Broadcom Corp. Via Broadcom Cayman Finance Ltd. USD 3.875% 15/01/2027 308,324 0.30113,000 Clarios Global LP Via Clarios US Finance Co. USD 8.500% 15/05/2027 120,590 0.1242,000 Herbalife Nutrition Ltd. Via HLF Financing, Inc. USD 7.875% 01/09/2025 46,200 0.04164,000 JBS USA LUX S.A. Via JBS USA Food Co. Via JBS USA Finance, Inc. USD 5.500% 15/01/2030 185,935 0.1819,000 Titan Acquisition Ltd. Via Titan Co-Borrower LLC USD 7.750% 15/04/2026 19,855 0.02
680,904 0.66
United States139,000 Acadia Healthcare Co., Inc. USD 6.500% 01/03/2024 143,517 0.1430,000 Acadia Healthcare Co., Inc. USD 5.000% 15/04/2029 31,950 0.03154,000 Acrisure LLC Via Acrisure Finance, Inc. USD 10.125% 01/08/2026 174,982 0.1745,000 AdaptHealth LLC USD 6.125% 01/08/2028 48,600 0.05125,000 ADT Security Corp. USD 4.125% 15/06/2023 131,562 0.1320,000 Albertsons Cos., Inc. Via Safeway, Inc. Via New Albertsons LP Via
Albertsons LLC USD 5.875% 15/02/2028 21,625 0.0225,000 Albertsons Cos., Inc. Via Safeway, Inc. Via New Albertsons LP Via
Albertsons LLC USD 4.875% 15/02/2030 27,344 0.03124,000 Albertsons Cos., Inc. Via Safeway, Inc. Via New Albertsons LP Via
Albertsons LLC—Series JAN USD 4.625% 15/01/2027 130,510 0.1375,000 Alliant Holdings Intermediate LLC Via Alliant Holdings
Co-Issuer—Series OCT USD 6.750% 15/10/2027 80,732 0.0887,000 Allied Universal Holdco LLC Via Allied Universal Finance Corp. USD 6.625% 15/07/2026 93,743 0.0935,000 Allied Universal Holdco LLC Via Allied Universal Finance Corp. USD 9.750% 15/07/2027 38,938 0.0465,000 Allison Transmission, Inc. USD 3.750% 30/01/2031 65,406 0.06121,000 AMC Networks, Inc. USD 4.750% 01/08/2025 124,932 0.12
Goldman Sachs Funds—Global Multi-Asset Income PortfolioSchedule of InvestmentsAs at 30 November 2020
The accompanying notes are an integral part of these financial statements.
425

Holdings Security Description Currency Interest Rate(a) Maturity Date(b)Market Value
USD
% ofShareholders’
Equity
Bonds – (Continued)United States – (Continued)
117,000 American Builders & Contractors Supply Co., Inc. USD 5.875% 15/05/2026 122,265 0.1258,000 ANGI Group LLC USD 3.875% 15/08/2028 57,783 0.0621,000 Aramark Services, Inc. USD 6.375% 01/05/2025 22,470 0.0216,000 Arches Buyer, Inc. USD 6.125% 01/12/2028 16,500 0.02140,000 Avaya, Inc. USD 6.125% 15/09/2028 147,350 0.14169,000 Axalta Coating Systems LLC USD 3.375% 15/02/2029 171,957 0.1750,000 Banff Merger Sub, Inc. USD 9.750% 01/09/2026 53,813 0.0550,000 Bank of America Corp.(c) USD 4.083% 20/03/2051 63,888 0.06125,000 Bank of America Corp.—Series X(c) USD 6.250% Perp. 139,017 0.13146,000 Beacon Roofing Supply, Inc. USD 4.875% 01/11/2025 149,650 0.15150,000 Berry Global, Inc. USD 5.625% 15/07/2027 160,687 0.1665,000 Black Knight InfoServ LLC USD 3.625% 01/09/2028 66,138 0.0693,000 Booking Holdings, Inc. USD 4.625% 13/04/2030 114,501 0.1185,000 Booz Allen Hamilton, Inc. USD 3.875% 01/09/2028 88,474 0.09100,000 BorgWarner, Inc. USD 5.000% 01/10/2025 117,258 0.11173,000 Boyd Gaming Corp. USD 4.750% 01/12/2027 175,856 0.17103,000 Broadcom, Inc. USD 5.000% 15/04/2030 124,916 0.12160,000 Buckeye Partners LP USD 4.350% 15/10/2024 162,000 0.1660,000 Buckeye Partners LP USD 3.950% 01/12/2026 58,575 0.0620,000 Buckeye Partners LP USD 4.125% 01/12/2027 18,850 0.0223,000 Builders FirstSource, Inc. USD 6.750% 01/06/2027 24,955 0.02102,000 Builders FirstSource, Inc. USD 5.000% 01/03/2030 110,925 0.1140,000 Burlington Coat Factory Warehouse Corp. USD 6.250% 15/04/2025 43,000 0.0434,000 BWX Technologies, Inc. USD 4.125% 30/06/2028 35,488 0.0375,000 Castle US Holding Corp. USD 9.500% 15/02/2028 71,625 0.0790,000 CCO Holdings LLC Via CCO Holdings Capital Corp.—Series DEC USD 4.750% 01/03/2030 95,850 0.0948,000 CDW LLC Via CDW Finance Corp. USD 4.125% 01/05/2025 50,160 0.05270,000 Centene Corp. USD 4.250% 15/12/2027 286,000 0.2855,000 Central Garden & Pet Co. USD 4.125% 15/10/2030 57,750 0.0660,000 Charles Schwab Corp.—Series E(c) USD 4.625% Perp. 60,970 0.06300,000 Charter Communications Operating LLC Via Charter Communications
Operating Capital USD 6.384% 23/10/2035 416,619 0.40182,000 Cheniere Energy Partners LP USD 4.500% 01/10/2029 190,645 0.1950,000 Chobani LLC Via Chobani Finance Corp., Inc. USD 7.500% 15/04/2025 52,375 0.05155,000 Cincinnati Bell, Inc. USD 7.000% 15/07/2024 161,200 0.1650,000 Citigroup, Inc.(c) USD 4.412% 31/03/2031 60,475 0.06100,000 Citigroup, Inc.—Series T(c) USD 6.250% Perp. 114,625 0.11100,000 CoBank ACB—Series I(c) USD 6.250% Perp. 108,961 0.1191,000 Comcast Corp. USD 2.800% 15/01/2051 95,596 0.0960,000 CommScope Technologies LLC USD 6.000% 15/06/2025 61,875 0.0670,000 CommScope, Inc. USD 7.125% 01/07/2028 74,725 0.07110,000 Continental Resources, Inc. USD 5.750% 15/01/2031 117,837 0.11100,000 Core & Main LP USD 6.125% 15/08/2025 103,250 0.10115,000 Cornerstone Building Brands, Inc. USD 8.000% 15/04/2026 121,037 0.1248,000 Cornerstone Building Brands, Inc. USD 6.125% 15/01/2029 51,000 0.0550,000 CP Atlas Buyer, Inc. USD 7.000% 01/12/2028 52,125 0.05200,000 CSC Holdings LLC USD 5.500% 15/05/2026 209,000 0.2050,000 Curo Group Holdings Corp. USD 8.250% 01/09/2025 42,813 0.0450,000 DaVita, Inc. USD 4.625% 01/06/2030 52,875 0.05135,000 DaVita, Inc. USD 3.750% 15/02/2031 134,325 0.1380,000 DCP Midstream Operating LP USD 5.625% 15/07/2027 87,200 0.08124,000 Dealer Tire LLC Via DT Issuer LLC USD 8.000% 01/02/2028 128,340 0.12125,000 Dell International LLC Via EMC Corp. 144A(d) USD 8.100% 15/07/2036 179,617 0.17100,000 Diamond Sports Group LLC Via Diamond Sports Finance Co. USD 5.375% 15/08/2026 77,500 0.0855,000 Diamond Sports Group LLC Via Diamond Sports Finance Co. USD 6.625% 15/08/2027 31,900 0.0333,000 Diamondback Energy, Inc. USD 4.750% 31/05/2025 36,785 0.04132,000 DISH DBS Corp. USD 5.875% 15/07/2022 138,600 0.13125,000 DISH DBS Corp. USD 7.750% 01/07/2026 143,437 0.1445,000 Element Solutions, Inc. USD 3.875% 01/09/2028 45,563 0.04150,000 Energizer Holdings, Inc. USD 4.750% 15/06/2028 157,042 0.15176,000 Entercom Media Corp. USD 7.250% 01/11/2024 170,280 0.17113,000 Enviva Partners LP Via Enviva Partners Finance Corp. USD 6.500% 15/01/2026 120,345 0.12150,000 Equinix, Inc. USD 5.375% 15/05/2027 163,770 0.16100,000 EW Scripps Co. USD 5.125% 15/05/2025 100,625 0.1050,000 Expedia Group, Inc. USD 4.625% 01/08/2027 55,009 0.05121,000 Fair Isaac Corp. USD 4.000% 15/06/2028 126,747 0.12
2,500,000 Federal Home Loan Bank Discount Notes USD 0.056% 13/01/2021 2,499,791 2.43111,000 Fidelity & Guaranty Life Holdings, Inc. USD 5.500% 01/05/2025 128,760 0.12150,000 Freedom Mortgage Corp. USD 7.625% 01/05/2026 153,375 0.1528,000 Frontier Communications Corp. USD 5.875% 15/10/2027 29,540 0.0337,000 Frontier Communications Corp. USD 5.000% 01/05/2028 37,740 0.04
Goldman Sachs Funds—Global Multi-Asset Income PortfolioSchedule of InvestmentsAs at 30 November 2020
The accompanying notes are an integral part of these financial statements.
426

Holdings Security Description Currency Interest Rate(a) Maturity Date(b)Market Value
USD
% ofShareholders’
Equity
Bonds – (Continued)United States – (Continued)
160,000 Gartner, Inc. USD 4.500% 01/07/2028 169,600 0.16100,000 Gartner, Inc. USD 3.750% 01/10/2030 104,250 0.10182,000 General Electric Co.—Series D(c) USD 5.000% 29/12/2049 164,091 0.1655,000 Getty Images, Inc. USD 9.750% 01/03/2027 57,475 0.0680,000 Global Partners LP Via GLP Finance Corp. USD 6.875% 15/01/2029 85,600 0.08139,000 Go Daddy Operating Co., LLC Via GD Finance Co., Inc. USD 5.250% 01/12/2027 147,166 0.14100,000 Goodyear Tire & Rubber Co. USD 5.125% 15/11/2023 100,500 0.1020,000 Graphic Packaging International LLC USD 3.500% 15/03/2028 21,000 0.02130,000 Griffon Corp. USD 5.750% 01/03/2028 138,450 0.13204,000 GrubHub Holdings, Inc. USD 5.500% 01/07/2027 214,965 0.21106,000 Harley-Davidson Financial Services, Inc. USD 3.350% 08/06/2025 113,881 0.11140,000 Herc Holdings, Inc. USD 5.500% 15/07/2027 148,050 0.14142,000 Hill-Rom Holdings, Inc. USD 4.375% 15/09/2027 148,212 0.1443,000 Hilton Domestic Operating Co., Inc. USD 4.000% 01/05/2031 45,374 0.04292,000 HLF Financing SARL LLC Via Herbalife International, Inc. USD 7.250% 15/08/2026 308,425 0.3054,000 Howard Hughes Corp. USD 5.375% 01/08/2028 57,308 0.06100,000 HUB International Ltd. USD 7.000% 01/05/2026 105,000 0.10115,000 IAA, Inc. USD 5.500% 15/06/2027 121,900 0.12243,000 Icahn Enterprises LP Via Icahn Enterprises Finance Corp. USD 4.750% 15/09/2024 251,809 0.2450,000 iHeartCommunications, Inc. USD 5.250% 15/08/2027 51,500 0.0550,000 iHeartCommunications, Inc. USD 4.750% 15/01/2028 50,625 0.05134,000 Ingevity Corp. USD 4.500% 01/02/2026 138,020 0.13166,000 IRB Holding Corp. USD 6.750% 15/02/2026 172,225 0.17234,000 Iron Mountain, Inc. USD 5.250% 15/07/2030 250,380 0.24115,000 J2 Global, Inc. USD 4.625% 15/10/2030 120,319 0.12100,000 Jaguar Holding Co. II Via PPD Development LP USD 4.625% 15/06/2025 105,000 0.1050,000 Jaguar Holding Co. II Via PPD Development LP USD 5.000% 15/06/2028 53,500 0.0515,000 JPMorgan Chase & Co.(c) USD 2.956% 13/05/2031 16,327 0.02125,000 JPMorgan Chase & Co.—Series X(c) USD 6.100% Perp. 135,460 0.1375,000 JPMorgan Chase & Co.—Series Z(c) USD 4.014% Perp. 74,910 0.0745,000 KBR, Inc. USD 4.750% 30/09/2028 46,800 0.0534,000 Keurig Dr Pepper, Inc. USD 3.200% 01/05/2030 38,614 0.0410,000 Keurig Dr Pepper, Inc. USD 3.800% 01/05/2050 12,014 0.01186,000 Kraft Heinz Foods Co. USD 5.000% 15/07/2035 219,262 0.21145,000 Kraft Heinz Foods Co. USD 4.375% 01/06/2046 154,846 0.1527,000 L Brands, Inc. USD 6.875% 01/07/2025 29,159 0.03115,000 LABL Escrow Issuer LLC USD 6.750% 15/07/2026 123,337 0.1247,000 Ladder Capital Finance Holdings LLLP Via Ladder Capital Finance Corp. USD 4.250% 01/02/2027 43,475 0.0475,000 LD Holdings Group LLC USD 6.500% 01/11/2025 79,313 0.08120,000 M/I Homes, Inc. USD 4.950% 01/02/2028 126,900 0.1253,000 Marriott International, Inc. USD 4.625% 15/06/2030 61,204 0.06189,000 Marriott Ownership Resorts, Inc. USD 4.750% 15/01/2028 191,835 0.1910,000 Match Group Holdings II LLC USD 4.625% 01/06/2028 10,600 0.01110,000 Match Group Holdings II LLC USD 4.125% 01/08/2030 115,638 0.11117,000 Mattel, Inc. USD 3.150% 15/03/2023 118,462 0.12120,000 Mauser Packaging Solutions Holding Co. USD 7.250% 15/04/2025 121,500 0.1215,000 Meritor, Inc. USD 6.250% 01/06/2025 16,125 0.0235,000 MGM Growth Properties Operating Partnership LP Via MGP Finance
Co-Issuer, Inc. USD 4.625% 15/06/2025 37,013 0.0457,000 Minerals Technologies, Inc. USD 5.000% 01/07/2028 59,423 0.06100,000 Mohegan Gaming & Entertainment USD 7.875% 15/10/2024 99,625 0.1035,000 Molina Healthcare, Inc. USD 3.875% 15/11/2030 37,100 0.0488,000 Morgan Stanley—Series H(c) USD 3.847% Perp. 87,120 0.08145,000 MPH Acquisition Holdings LLC USD 5.750% 01/11/2028 142,100 0.1494,000 Nationstar Mortgage Holdings, Inc. USD 5.500% 15/08/2028 97,290 0.09101,000 Navient Corp. USD 5.500% 25/01/2023 105,419 0.10139,000 Newell Brands, Inc. USD 4.700% 01/04/2026 150,744 0.15111,000 Nexstar Broadcasting, Inc. USD 5.625% 15/07/2027 119,047 0.12195,000 NFP Corp.—Series SEP USD 6.875% 15/08/2028 203,650 0.20150,000 NortonLifeLock, Inc. USD 5.000% 15/04/2025 153,937 0.1550,000 Novelis Corp. USD 4.750% 30/01/2030 53,125 0.0520,000 NRG Energy, Inc. USD 3.375% 15/02/2029 20,450 0.0250,000 NRG Energy, Inc. USD 3.625% 15/02/2031 51,625 0.05112,000 Nuance Communications, Inc. USD 5.625% 15/12/2026 119,280 0.12100,000 OneMain Finance Corp. USD 7.125% 15/03/2026 115,500 0.11110,000 Outfront Media Capital LLC Via Outfront Media Capital Corp. USD 5.000% 15/08/2027 112,475 0.11100,000 Owens-Brockway Glass Container, Inc. USD 5.875% 15/08/2023 108,250 0.11166,000 Pattern Energy Operations LP Via Pattern Energy Operations, Inc. USD 4.500% 15/08/2028 178,865 0.17160,000 PennyMac Financial Services, Inc. USD 5.375% 15/10/2025 167,600 0.16122,000 PetSmart, Inc. USD 5.875% 01/06/2025 123,830 0.1255,000 Pike Corp. USD 5.500% 01/09/2028 57,475 0.06
Goldman Sachs Funds—Global Multi-Asset Income PortfolioSchedule of InvestmentsAs at 30 November 2020
The accompanying notes are an integral part of these financial statements.
427

Holdings Security Description Currency Interest Rate(a) Maturity Date(b)Market Value
USD
% ofShareholders’
Equity
Bonds – (Continued)United States – (Continued)
200,000 Post Holdings, Inc. USD 5.000% 15/08/2026 208,000 0.2064,000 Post Holdings, Inc. USD 4.625% 15/04/2030 67,025 0.07119,000 Presidio Holdings, Inc. USD 8.250% 01/02/2028 129,710 0.13100,000 Prime Security Services Borrower LLC Via Prime Finance, Inc. USD 5.250% 15/04/2024 106,500 0.1055,000 Prime Security Services Borrower LLC Via Prime Finance, Inc. USD 3.375% 31/08/2027 54,175 0.0530,000 Providence Service Corp. USD 5.875% 15/11/2025 32,100 0.03150,000 Prudential Financial, Inc.(c) USD 5.625% 15/06/2043 161,554 0.1679,000 PTC, Inc. USD 3.625% 15/02/2025 81,173 0.0885,000 Quicken Loans LLC Via Quicken Loans Co-Issuer, Inc. USD 3.875% 01/03/2031 87,043 0.0846,000 Radiate Holdco LLC Via Radiate Finance, Inc. USD 6.500% 15/09/2028 49,163 0.05175,000 Realogy Group LLC Via Realogy Co-Issuer Corp. USD 4.875% 01/06/2023 179,375 0.1721,000 Realogy Group LLC Via Realogy Co-Issuer Corp. USD 7.625% 15/06/2025 22,705 0.0250,000 Refinitiv US Holdings, Inc. USD 6.250% 15/05/2026 53,688 0.0550,000 Refinitiv US Holdings, Inc. USD 8.250% 15/11/2026 54,625 0.05197,000 Resideo Funding, Inc. USD 6.125% 01/11/2026 206,560 0.2056,000 Reynolds Group Issuer, Inc. Via Reynolds Group Issuer LLC Via Reynolds
Group Issuer Lu USD 4.000% 15/10/2027 57,470 0.0675,000 Sabine Pass Liquefaction LLC USD 4.200% 15/03/2028 84,417 0.0812,000 Sabre GLBL, Inc. USD 9.250% 15/04/2025 14,025 0.0165,000 SBA Communications Corp. USD 3.875% 15/02/2027 67,275 0.07110,000 Scientific Games International, Inc. USD 8.250% 15/03/2026 118,387 0.1150,000 Sealed Air Corp. USD 4.000% 01/12/2027 53,750 0.05101,000 Sealed Air Corp. 144A(d) USD 6.875% 15/07/2033 133,320 0.1338,000 SeaWorld Parks & Entertainment, Inc. USD 9.500% 01/08/2025 41,325 0.0430,000 SEG Holding LLC Via SEG Finance Corp. USD 5.625% 15/10/2028 31,688 0.03111,000 Select Medical Corp. USD 6.250% 15/08/2026 118,770 0.12108,000 Sempra Energy(c) USD 4.875% Perp. 114,385 0.1170,000 Sensata Technologies, Inc. USD 3.750% 15/02/2031 70,788 0.0720,000 Service Properties Trust USD 7.500% 15/09/2025 22,276 0.0270,000 Service Properties Trust USD 4.750% 01/10/2026 65,909 0.0643,000 Service Properties Trust USD 4.950% 01/10/2029 40,281 0.0430,000 Shift4 Payments LLC Via Shift4 Payments Finance Sub, Inc. USD 4.625% 01/11/2026 31,088 0.03150,000 Sinclair Television Group, Inc. USD 5.125% 15/02/2027 148,687 0.14170,000 Sirius XM Radio, Inc. USD 4.625% 15/07/2024 176,375 0.17249,000 Six Flags Entertainment Corp. USD 5.500% 15/04/2027 252,112 0.24136,000 Specialty Building Products Holdings LLC Via SBP Finance Corp. USD 6.375% 30/09/2026 142,460 0.1460,000 Sprint Capital Corp. USD 8.750% 15/03/2032 92,025 0.0955,000 Sprint Communications, Inc. USD 11.500% 15/11/2021 60,225 0.06150,000 Sprint Communications, Inc. USD 6.000% 15/11/2022 161,625 0.1675,000 Sprint Corp. USD 7.875% 15/09/2023 86,906 0.08100,000 Standard Industries, Inc. USD 5.000% 15/02/2027 105,127 0.10125,000 Starwood Property Trust, Inc. USD 4.750% 15/03/2025 129,687 0.1384,000 Station Casinos LLC USD 4.500% 15/02/2028 82,950 0.0842,000 Summit Materials LLC Via Summit Materials Finance Corp. USD 5.250% 15/01/2029 44,100 0.0465,000 Sunoco LP Via Sunoco Finance Corp. USD 4.500% 15/05/2029 67,194 0.0735,000 Tallgrass Energy Partners LP Via Tallgrass Energy Finance Corp. USD 4.750% 01/10/2023 34,388 0.03100,000 Tallgrass Energy Partners LP Via Tallgrass Energy Finance Corp. USD 5.500% 15/09/2024 96,125 0.09125,000 Targa Resources Partners LP Via Targa Resources Partners Finance Corp. USD 5.125% 01/02/2025 128,750 0.1265,000 Targa Resources Partners LP Via Targa Resources Partners Finance Corp. USD 4.875% 01/02/2031 68,981 0.0763,000 Taylor Morrison Communities, Inc. USD 5.125% 01/08/2030 70,245 0.07123,000 TEGNA, Inc. USD 4.625% 15/03/2028 125,921 0.1225,000 Tenet Healthcare Corp. USD 6.250% 01/02/2027 26,313 0.03177,000 Terrier Media Buyer, Inc. USD 8.875% 15/12/2027 192,709 0.19467,000 T-Mobile USA, Inc. USD 6.500% 15/01/2026 487,431 0.4763,000 T-Mobile USA, Inc. USD 4.500% 15/04/2050 78,573 0.0874,000 Truist Financial Corp.—Series Q(c) USD 5.100% Perp. 83,664 0.08175,000 Twitter, Inc. USD 3.875% 15/12/2027 183,969 0.18100,000 Uber Technologies, Inc. USD 7.500% 15/05/2025 107,500 0.10145,000 Uber Technologies, Inc. USD 6.250% 15/01/2028 154,425 0.1558,000 United Natural Foods, Inc. USD 6.750% 15/10/2028 60,248 0.06500,000 United States Treasury Bill USD 0.063% 17/12/2020 499,989 0.49750,000 United States Treasury Bill USD 0.071% 14/01/2021 749,943 0.73
1,000,000 United States Treasury Bill USD 0.085% 29/04/2021 999,679 0.97169,000 Univar Solutions USA, Inc. USD 5.125% 01/12/2027 178,295 0.17100,000 Universal Health Services, Inc. USD 5.000% 01/06/2026 104,015 0.1091,000 USA Compression Partners LP Via USA Compression Finance Corp. USD 6.875% 01/04/2026 94,868 0.0950,000 Valvoline, Inc. USD 4.250% 15/02/2030 53,000 0.05125,000 VeriSign, Inc. USD 5.250% 01/04/2025 141,800 0.1475,000 VICI Properties LP Via VICI Note Co., Inc. USD 3.500% 15/02/2025 76,969 0.0747,000 WESCO Distribution, Inc. USD 7.250% 15/06/2028 52,875 0.0535,000 Williams Scotsman International, Inc. USD 4.625% 15/08/2028 36,575 0.04
Goldman Sachs Funds—Global Multi-Asset Income PortfolioSchedule of InvestmentsAs at 30 November 2020
The accompanying notes are an integral part of these financial statements.
428

Holdings Security Description Currency Interest Rate(a) Maturity Date(b)Market Value
USD
% ofShareholders’
Equity
Bonds – (Continued)United States – (Continued)
129,000 WR Grace & Co-Conn USD 4.875% 15/06/2027 136,338 0.1321,000 Wyndham Destinations, Inc. USD 6.625% 31/07/2026 23,654 0.0275,000 Xerox Holdings Corp. USD 5.000% 15/08/2025 78,563 0.0850,000 Xerox Holdings Corp. USD 5.500% 15/08/2028 52,000 0.052,000 Yum! Brands, Inc. USD 7.750% 01/04/2025 2,230 0.00
198,000 Yum! Brands, Inc. USD 4.750% 15/01/2030 215,077 0.21
27,900,320 27.07
TOTAL BONDS(cost USD 31,575,188) 32,741,957 31.77
Holdings Security Description Currency Interest RateMarket Value
USD
% ofShareholders’
Equity
Preferred Stocks – 0.08%
United States3,746 Delphi Financial Group, Inc.—Preferred(c) USD 3.411% 81,663 0.08
TOTAL PREFERRED STOCKS(cost USD 83,349) 81,663 0.08
TOTAL TRANSFERABLE SECURITIES DEALT IN ANOTHER REGULATED MARKET(cost USD 31,658,537) 32,823,620 31.85
Holdings Security Description Currency Interest Rate(a) Maturity Date(b)Market Value
USD
% ofShareholders’
Equity
Other Transferable Securities
Bonds – 0.09%United States
50,000 Ingevity Corp. USD 3.875% 01/11/2028 51,000 0.0540,000 Unisys Corp. USD 6.875% 01/11/2027 43,400 0.04
94,400 0.09
TOTAL BONDS(cost USD 90,000) 94,400 0.09
TOTAL OTHER TRANSFERABLE SECURITIES(cost USD 90,000) 94,400 0.09
MARKET VALUE OF INVESTMENTS EXCLUDING DERIVATIVES(cost USD 80,766,883) 86,779,055 84.19
Futures Contracts – 1.36%
Number ofContracts Security Description
CommitmentMarket Value
USD
UnrealisedGainUSD
% ofShareholders’
Equity
EUR171 Euro STOXX 50 Index Futures 18/12/2020 Long 7,240,844 489,410 0.482 German Federal Republic Bonds 10YR Futures 08/12/2020 Long 420,658 4,534 0.005 German Federal Republic Bonds 2YR Futures 08/12/2020 Long 673,727 510 0.004 German Federal Republic Bonds 5Y Futures 08/12/2020 Long 649,724 1,391 0.00
8,984,953 495,845 0.48
GBP2 UK Long Gilt Bond Futures 29/03/2021 Long 359,466 843 0.00
USD13 E-Mini S&P 500 Index Futures 18/12/2020 Long 2,360,800 173,012 0.1756 E-Mini S&P 500 Index Futures 18/12/2020 Long 10,169,600 732,543 0.714 US Treasury Long Bond Futures 22/03/2021 Long 698,875 488 0.0086 US Treasury Notes 10YR Futures 22/03/2021 Long 11,877,406 8,925 0.018 US Treasury Notes 2YR Futures 31/03/2021 Long 1,766,625 485 0.00
26,873,306 915,453 0.89
UNREALISED GAIN ON FUTURES CONTRACTS 1,412,141 1.37
Goldman Sachs Funds—Global Multi-Asset Income PortfolioSchedule of InvestmentsAs at 30 November 2020
The accompanying notes are an integral part of these financial statements.
429
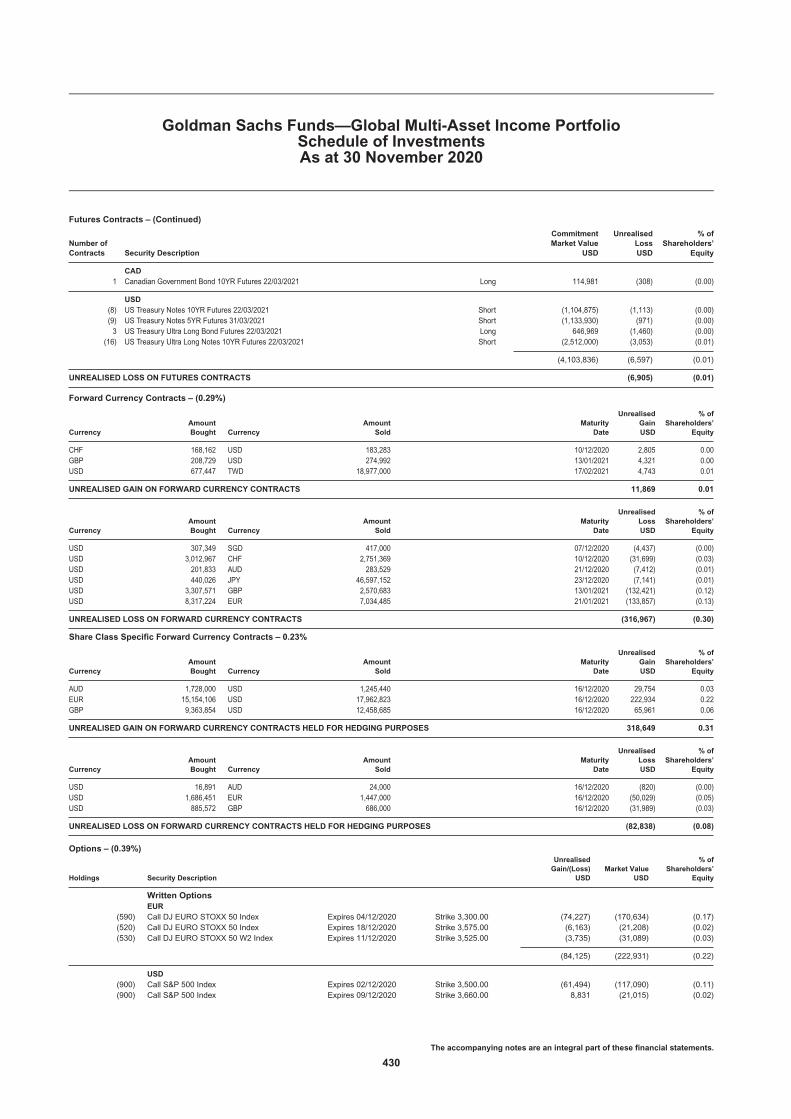
Futures Contracts – (Continued)
Number ofContracts Security Description
CommitmentMarket Value
USD
UnrealisedLossUSD
% ofShareholders’
Equity
CAD1 Canadian Government Bond 10YR Futures 22/03/2021 Long 114,981 (308) (0.00)
USD(8) US Treasury Notes 10YR Futures 22/03/2021 Short (1,104,875) (1,113) (0.00)(9) US Treasury Notes 5YR Futures 31/03/2021 Short (1,133,930) (971) (0.00)3 US Treasury Ultra Long Bond Futures 22/03/2021 Long 646,969 (1,460) (0.00)
(16) US Treasury Ultra Long Notes 10YR Futures 22/03/2021 Short (2,512,000) (3,053) (0.01)
(4,103,836) (6,597) (0.01)
UNREALISED LOSS ON FUTURES CONTRACTS (6,905) (0.01)
Forward Currency Contracts – (0.29%)
CurrencyAmountBought Currency
AmountSold
MaturityDate
UnrealisedGainUSD
% ofShareholders’
Equity
CHF 168,162 USD 183,283 10/12/2020 2,805 0.00GBP 208,729 USD 274,992 13/01/2021 4,321 0.00USD 677,447 TWD 18,977,000 17/02/2021 4,743 0.01
UNREALISED GAIN ON FORWARD CURRENCY CONTRACTS 11,869 0.01
CurrencyAmountBought Currency
AmountSold
MaturityDate
UnrealisedLossUSD
% ofShareholders’
Equity
USD 307,349 SGD 417,000 07/12/2020 (4,437) (0.00)USD 3,012,967 CHF 2,751,369 10/12/2020 (31,699) (0.03)USD 201,833 AUD 283,529 21/12/2020 (7,412) (0.01)USD 440,026 JPY 46,597,152 23/12/2020 (7,141) (0.01)USD 3,307,571 GBP 2,570,683 13/01/2021 (132,421) (0.12)USD 8,317,224 EUR 7,034,485 21/01/2021 (133,857) (0.13)
UNREALISED LOSS ON FORWARD CURRENCY CONTRACTS (316,967) (0.30)
Share Class Specific Forward Currency Contracts – 0.23%
CurrencyAmountBought Currency
AmountSold
MaturityDate
UnrealisedGainUSD
% ofShareholders’
Equity
AUD 1,728,000 USD 1,245,440 16/12/2020 29,754 0.03EUR 15,154,106 USD 17,962,823 16/12/2020 222,934 0.22GBP 9,363,854 USD 12,458,685 16/12/2020 65,961 0.06
UNREALISED GAIN ON FORWARD CURRENCY CONTRACTS HELD FOR HEDGING PURPOSES 318,649 0.31
CurrencyAmountBought Currency
AmountSold
MaturityDate
UnrealisedLossUSD
% ofShareholders’
Equity
USD 16,891 AUD 24,000 16/12/2020 (820) (0.00)USD 1,686,451 EUR 1,447,000 16/12/2020 (50,029) (0.05)USD 885,572 GBP 686,000 16/12/2020 (31,989) (0.03)
UNREALISED LOSS ON FORWARD CURRENCY CONTRACTS HELD FOR HEDGING PURPOSES (82,838) (0.08)
Options – (0.39%)
Holdings Security Description
UnrealisedGain/(Loss)
USDMarket Value
USD
% ofShareholders’
Equity
Written OptionsEUR
(590) Call DJ EURO STOXX 50 Index Expires 04/12/2020 Strike 3,300.00 (74,227) (170,634) (0.17)(520) Call DJ EURO STOXX 50 Index Expires 18/12/2020 Strike 3,575.00 (6,163) (21,208) (0.02)(530) Call DJ EURO STOXX 50 W2 Index Expires 11/12/2020 Strike 3,525.00 (3,735) (31,089) (0.03)
(84,125) (222,931) (0.22)
USD(900) Call S&P 500 Index Expires 02/12/2020 Strike 3,500.00 (61,494) (117,090) (0.11)(900) Call S&P 500 Index Expires 09/12/2020 Strike 3,660.00 8,831 (21,015) (0.02)
Goldman Sachs Funds—Global Multi-Asset Income PortfolioSchedule of InvestmentsAs at 30 November 2020
The accompanying notes are an integral part of these financial statements.
430

Options – (Continued)
Holdings Security Description
UnrealisedGain/(Loss)
USDMarket Value
USD
% ofShareholders’
Equity
Written Options – (Continued)USD – (Continued)
(900) Call S&P 500 Index Expires 16/12/2020 Strike 3,710.00 8,011 (17,055) (0.02)(900) Call S&P 500 Index Expires 23/12/2020 Strike 3,725.00 3,231 (20,430) (0.02)
(41,421) (175,590) (0.17)
TOTAL WRITTEN OPTIONS(cost USD (272,976)) (398,521) (0.39)
TOTAL OPTIONS(cost USD (272,976)) (398,521) (0.39)
MARKET VALUE OF INVESTMENTS(cost USD 80,493,907) 87,716,483 85.10
OTHER ASSETS AND LIABILITIES 15,363,307 14.90
SHAREHOLDERS’ EQUITY 103,079,790 100.00
TOTAL INVESTMENTSMarket Value
USD
% ofShareholders’
Equity
Total Investments excluding derivatives (cost USD 80,766,883) 86,779,055 84.19Unrealised gain on futures contracts 1,412,141 1.37Unrealised loss on futures contracts (6,905) (0.01)Unrealised gain on forward currency contracts 11,869 0.01Unrealised loss on forward currency contracts (316,967) (0.30)Unrealised gain on forward currency contracts held for hedging purposes 318,649 0.31Unrealised loss on forward currency contracts held for hedging purposes (82,838) (0.08)Market value of written options (cost USD (272,976)) (398,521) (0.39)Other Assets and Liabilities 15,363,307 14.90
Shareholders’ Equity 103,079,790 100.00
The Futures Commission Merchant was Credit Suisse Securities (USA) LLC.
The counterparties for forward currency contracts were Citibank N.A. and Morgan Stanley & Co., Inc.
The counterparty for options contracts was Morgan Stanley & Co., Inc.
The maximum individual counterparty exposure as at 30 November 2020 is 1.37% of the NAV.
(a) Interest rates represent either the stated coupon rate, annualised discounted yield on date of purchase for discounted securities, or, for floating rate securities, the current reset ratewhich is based upon interest rates indices.
(b) Maturity dates represent either the stated date on the security, or the next interest reset date for floating rate securities or the prerefunded date for those type of securities.(c) Variable and floating coupon rates are those quoted as of 30 November 2020.(d) 144A: This security is issued to qualified institutional investors, pursuant to private placements, and is transferable as stated in rule 144A of the US Securities Act of 1933.(e) Security holding is traded/held in USD. (ADR: American Depositary Receipt/GDR: Global Depositary Receipt).(f) A related party to Goldman Sachs Funds.
Goldman Sachs Funds—Global Multi-Asset Income PortfolioSchedule of InvestmentsAs at 30 November 2020
The accompanying notes are an integral part of these financial statements.
431

Holdings Security Description Currency Interest Rate(a) Maturity Date(b)Market Value
USD
% ofShareholders’
Equity
Transferable securities admitted to an official exchange listing
Bonds – 16.62%United States
3,000,000 Beazer Homes USA, Inc. USD 5.875% 15/10/2027 3,176,250 1.49750,000 CalAtlantic Group, Inc. USD 6.250% 15/12/2021 770,205 0.36
1,000,000 Kennedy-Wilson, Inc. USD 5.875% 01/04/2024 1,017,500 0.482,000,000 M/I Homes, Inc. USD 5.625% 01/08/2025 2,092,500 0.981,398,000 Masco Corp. USD 7.750% 01/08/2029 1,924,067 0.9054,000 Masco Corp. USD 6.500% 15/08/2032 69,974 0.03
2,000,000 MDC Holdings, Inc. USD 3.850% 15/01/2030 2,180,000 1.022,000,000 Meritage Homes Corp. USD 5.125% 06/06/2027 2,230,000 1.051,000,000 MPT Operating Partnership LP Via MPT Finance Corp. USD 5.000% 15/10/2027 1,060,780 0.503,000,000 PulteGroup, Inc. USD 7.875% 15/06/2032 4,511,250 2.112,050,000 Toll Brothers Finance Corp. USD 4.375% 15/04/2023 2,185,813 1.022,650,000 Toll Brothers Finance Corp. USD 4.875% 15/11/2025 2,994,500 1.403,000,000 Toll Brothers Finance Corp. USD 3.800% 01/11/2029 3,268,659 1.531,100,000 TRI Pointe Group, Inc. USD 5.250% 01/06/2027 1,203,125 0.56517,000 TRI Pointe Group, Inc. USD 5.700% 15/06/2028 586,795 0.28
2,900,000 TRI Pointe Group, Inc. Via TRI Pointe Homes, Inc. USD 5.875% 15/06/2024 3,179,125 1.493,000,000 WESCO Distribution, Inc. USD 5.375% 15/12/2021 3,022,500 1.42
35,473,043 16.62
TOTAL BONDS(cost USD 31,532,625) 35,473,043 16.62
Holdings Security DescriptionMarket Value
USD
% ofShareholders’
Equity
Common Stocks – 31.55%United States
35,221 Americold Realty Trust 1,198,923 0.5618,482 AvalonBay Communities, Inc. 3,090,375 1.4527,850 Camden Property Trust 2,739,047 1.2810,561 CoreSite Realty Corp. 1,321,815 0.6229,013 CubeSmart 922,323 0.4317,353 CyrusOne, Inc. 1,196,663 0.5688,135 DR Horton, Inc. 6,603,956 3.0942,808 Duke Realty Corp. 1,645,111 0.7712,808 EastGroup Properties, Inc. 1,793,504 0.843,893 Equinix, Inc. 2,747,835 1.2925,980 Equity LifeStyle Properties, Inc. 1,523,727 0.7112,592 Essex Property Trust, Inc. 3,129,238 1.4711,907 Extra Space Storage, Inc. 1,311,675 0.6220,344 Gibraltar Industries, Inc. 1,343,721 0.636,663 Home Depot, Inc. 1,822,464 0.8544,403 Hudson Pacific Properties, Inc. 1,177,568 0.5558,625 Invitation Homes, Inc. 1,686,641 0.7988,742 Lennar Corp. �A� 6,782,551 3.1814,159 Life Storage, Inc. 1,528,747 0.725,131 Martin Marietta Materials, Inc. 1,365,513 0.6411,995 Meritage Homes Corp. 1,074,992 0.5048,607 MGM Growth Properties LLC �A� 1,477,653 0.691,210 NVR, Inc. 4,900,476 2.3044,208 Prologis, Inc. 4,446,883 2.08104,582 PulteGroup, Inc. 4,581,737 2.15117,593 RLJ Lodging Trust 1,481,672 0.6922,854 Ryman Hospitality Properties, Inc. 1,472,940 0.6928,122 Taylor Morrison Home Corp. 722,173 0.3448,113 Toll Brothers, Inc. 2,263,236 1.06
67,353,159 31.55
TOTAL COMMON STOCKS(cost USD 46,554,561) 67,353,159 31.55
Goldman Sachs Funds—US Real Estate Balanced PortfolioSchedule of InvestmentsAs at 30 November 2020
The accompanying notes are an integral part of these financial statements.
432
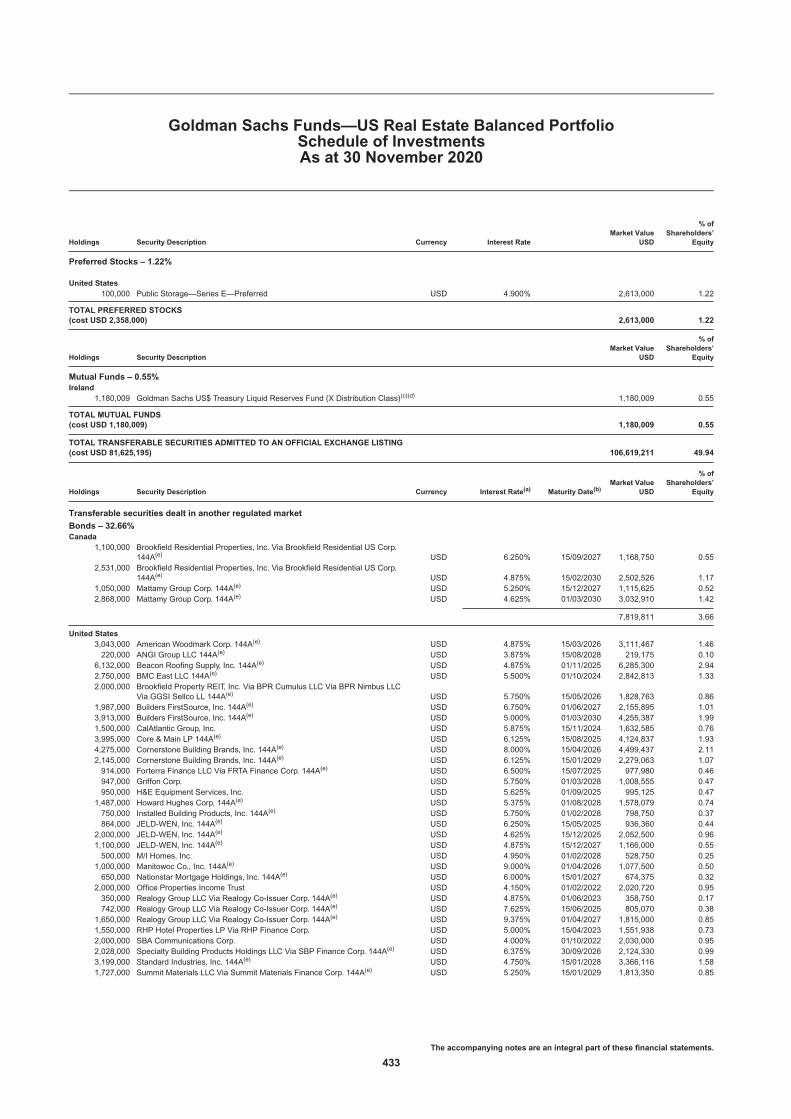
Holdings Security Description Currency Interest RateMarket Value
USD
% ofShareholders’
Equity
Preferred Stocks – 1.22%
United States100,000 Public Storage—Series E—Preferred USD 4.900% 2,613,000 1.22
TOTAL PREFERRED STOCKS(cost USD 2,358,000) 2,613,000 1.22
Holdings Security DescriptionMarket Value
USD
% ofShareholders’
Equity
Mutual Funds – 0.55%Ireland
1,180,009 Goldman Sachs US$ Treasury Liquid Reserves Fund (X Distribution Class)(c)(d) 1,180,009 0.55
TOTAL MUTUAL FUNDS(cost USD 1,180,009) 1,180,009 0.55
TOTAL TRANSFERABLE SECURITIES ADMITTED TO AN OFFICIAL EXCHANGE LISTING(cost USD 81,625,195) 106,619,211 49.94
Holdings Security Description Currency Interest Rate(a) Maturity Date(b)Market Value
USD
% ofShareholders’
Equity
Transferable securities dealt in another regulated market
Bonds – 32.66%Canada
1,100,000 Brookfield Residential Properties, Inc. Via Brookfield Residential US Corp.144A(e) USD 6.250% 15/09/2027 1,168,750 0.55
2,531,000 Brookfield Residential Properties, Inc. Via Brookfield Residential US Corp.144A(e) USD 4.875% 15/02/2030 2,502,526 1.17
1,050,000 Mattamy Group Corp. 144A(e) USD 5.250% 15/12/2027 1,115,625 0.522,868,000 Mattamy Group Corp. 144A(e) USD 4.625% 01/03/2030 3,032,910 1.42
7,819,811 3.66
United States3,043,000 American Woodmark Corp. 144A(e) USD 4.875% 15/03/2026 3,111,467 1.46220,000 ANGI Group LLC 144A(e) USD 3.875% 15/08/2028 219,175 0.10
6,132,000 Beacon Roofing Supply, Inc. 144A(e) USD 4.875% 01/11/2025 6,285,300 2.942,750,000 BMC East LLC 144A(e) USD 5.500% 01/10/2024 2,842,813 1.332,000,000 Brookfield Property REIT, Inc. Via BPR Cumulus LLC Via BPR Nimbus LLC
Via GGSI Sellco LL 144A(e) USD 5.750% 15/05/2026 1,828,763 0.861,987,000 Builders FirstSource, Inc. 144A(e) USD 6.750% 01/06/2027 2,155,895 1.013,913,000 Builders FirstSource, Inc. 144A(e) USD 5.000% 01/03/2030 4,255,387 1.991,500,000 CalAtlantic Group, Inc. USD 5.875% 15/11/2024 1,632,585 0.763,995,000 Core & Main LP 144A(e) USD 6.125% 15/08/2025 4,124,837 1.934,275,000 Cornerstone Building Brands, Inc. 144A(e) USD 8.000% 15/04/2026 4,499,437 2.112,145,000 Cornerstone Building Brands, Inc. 144A(e) USD 6.125% 15/01/2029 2,279,063 1.07914,000 Forterra Finance LLC Via FRTA Finance Corp. 144A(e) USD 6.500% 15/07/2025 977,980 0.46947,000 Griffon Corp. USD 5.750% 01/03/2028 1,008,555 0.47950,000 H&E Equipment Services, Inc. USD 5.625% 01/09/2025 995,125 0.47
1,487,000 Howard Hughes Corp. 144A(e) USD 5.375% 01/08/2028 1,578,079 0.74750,000 Installed Building Products, Inc. 144A(e) USD 5.750% 01/02/2028 798,750 0.37864,000 JELD-WEN, Inc. 144A(e) USD 6.250% 15/05/2025 936,360 0.44
2,000,000 JELD-WEN, Inc. 144A(e) USD 4.625% 15/12/2025 2,052,500 0.961,100,000 JELD-WEN, Inc. 144A(e) USD 4.875% 15/12/2027 1,166,000 0.55500,000 M/I Homes, Inc. USD 4.950% 01/02/2028 528,750 0.25
1,000,000 Manitowoc Co., Inc. 144A(e) USD 9.000% 01/04/2026 1,077,500 0.50650,000 Nationstar Mortgage Holdings, Inc. 144A(e) USD 6.000% 15/01/2027 674,375 0.32
2,000,000 Office Properties Income Trust USD 4.150% 01/02/2022 2,020,720 0.95350,000 Realogy Group LLC Via Realogy Co-Issuer Corp. 144A(e) USD 4.875% 01/06/2023 358,750 0.17742,000 Realogy Group LLC Via Realogy Co-Issuer Corp. 144A(e) USD 7.625% 15/06/2025 805,070 0.38
1,650,000 Realogy Group LLC Via Realogy Co-Issuer Corp. 144A(e) USD 9.375% 01/04/2027 1,815,000 0.851,550,000 RHP Hotel Properties LP Via RHP Finance Corp. USD 5.000% 15/04/2023 1,551,938 0.732,000,000 SBA Communications Corp. USD 4.000% 01/10/2022 2,030,000 0.952,028,000 Specialty Building Products Holdings LLC Via SBP Finance Corp. 144A(e) USD 6.375% 30/09/2026 2,124,330 0.993,199,000 Standard Industries, Inc. 144A(e) USD 4.750% 15/01/2028 3,366,116 1.581,727,000 Summit Materials LLC Via Summit Materials Finance Corp. 144A(e) USD 5.250% 15/01/2029 1,813,350 0.85
Goldman Sachs Funds—US Real Estate Balanced PortfolioSchedule of InvestmentsAs at 30 November 2020
The accompanying notes are an integral part of these financial statements.
433

Holdings Security Description Currency Interest Rate(a) Maturity Date(b)Market Value
USD
% ofShareholders’
Equity
Bonds – (Continued)United States – (Continued)
416,000 VICI Properties LP Via VICI Note Co., Inc. 144A(e) USD 3.500% 15/02/2025 426,920 0.20540,000 Waste Pro USA, Inc. 144A(e) USD 5.500% 15/02/2026 560,250 0.26
61,901,140 29.00
TOTAL BONDS(cost USD 66,877,890) 69,720,951 32.66
Non-Agencies Asset Backed Obligations – 15.89%United States
142,494 Alternative Loan Trust 2006-23CB �1A6� USD 6.000% 25/08/2036 148,136 0.07882,806 Alternative Loan Trust 2006-OA1(f) USD 0.357% 20/03/2046 705,873 0.33655,639 Banc of America Funding 2006-H Trust �6A1�(f) USD 0.337% 20/10/2036 577,352 0.27500,000 Bank 2018-BNK13 USD 3.000% 15/08/2061 364,355 0.17828,015 CHL Mortgage Pass-Through Trust 2006-HYB3 �2A1A�(f) USD 3.591% 20/05/2036 816,220 0.38
1,385,669 CHL Mortgage Pass-Through Trust 2007-14 �A19� USD 6.000% 25/09/2037 1,123,054 0.531,002,886 Connecticut Avenue Securities Trust 2018-R07 �1M2� 144A(e)(f) USD 2.550% 25/04/2031 1,000,354 0.4747,241 Connecticut Avenue Securities Trust 2019-R03 144A(e)(f) USD 2.300% 25/09/2031 47,174 0.02113,000 Connecticut Avenue Securities Trust 2020-R01 144A(e)(f) USD 2.200% 25/01/2040 112,028 0.05500,000 CSMC 2014-USA OA LLC �E� 144A(e) USD 4.373% 15/09/2037 332,042 0.16500,000 DBJPM 17-C6 Mortgage Trust(f) USD 3.375% 10/06/2050 438,911 0.21279,843 Fannie Mae Connecticut Avenue Securities(f) USD 4.550% 25/01/2024 267,176 0.12716,284 Fannie Mae Connecticut Avenue Securities 2016-C01 �1M2�(f) USD 6.900% 25/08/2028 761,535 0.36501,892 Fannie Mae Connecticut Avenue Securities 2016-C03 �1M2�(f) USD 5.450% 25/10/2028 529,788 0.25740,000 Freddie Mac STACR REMIC Trust 2020-DNA3(f) USD 5.249% 25/06/2050 764,945 0.36898,000 Freddie Mac STACR REMIC Trust 2020-DNA5(f) USD 4.888% 25/10/2050 928,347 0.4365,000 Freddie Mac STACR REMIC Trust 2020-HQA4(f) USD 3.300% 25/09/2050 65,759 0.03500,000 Freddie Mac STACR Trust 2019-DNA3(f) USD 3.400% 25/07/2049 487,599 0.23661,000 Freddie Mac STACR Trust 2020-DNA1 �M2� 144A(e)(f) USD 1.850% 25/01/2050 655,979 0.31239,200 Freddie Mac Structured Agency Credit Risk Debt Notes(f) USD 3.950% 25/03/2029 247,748 0.1246,000 Freddie Mac Structured Agency Credit Risk Debt Notes(f) USD 4.091% 25/11/2050 46,411 0.02502,684 GreenPoint Mortgage Funding Trust Series 2007-AR1 �3A2�(f) USD 0.310% 25/02/2037 541,997 0.25
3,044,866 GSAMP Trust 2007-H1 �A2C�(f) USD 0.450% 25/01/2047 2,025,064 0.95436,480 Impac Secured Assets Trust 2006-5 �1A1B�(f) USD 0.350% 25/02/2037 438,905 0.21984,729 IndyMac INDX Mortgage Loan Trust 2005-AR11 �A4�(f) USD 3.206% 25/08/2035 818,005 0.38
1,554,320 JP Morgan Alternative Loan Trust 2006-A2 �2A1�(f) USD 3.417% 25/05/2036 1,235,374 0.582,758,722 JP Morgan Alternative Loan Trust 2006-A7 �1A1�(f) USD 0.310% 25/12/2036 2,633,739 1.237,013,755 Lehman XS Trust Series 2007-2N �3A3�(f) USD 0.320% 25/02/2037 6,559,984 3.07652,247 Luminent Mortgage Trust 2007-2 �1A2�(f) USD 0.430% 25/05/2037 604,567 0.28356,918 MASTR Adjustable Rate Mortgages Trust 2006-OA2 �1A1�(f) USD 1.543% 25/12/2046 597,158 0.2860,350 MASTR Adjustable Rate Mortgages Trust 2006-OA2 �4A1A�(f) USD 1.593% 25/12/2046 108,969 0.05
3,155,618 Mastr Asset Backed Securities Trust 2006-HE5 �A2�(f) USD 0.250% 25/11/2036 2,227,205 1.043,986,297 Morgan Stanley ABS Capital I Inc Trust 2007-NC3 �A2B�(f) USD 0.290% 25/05/2037 3,319,447 1.55820,227 RALI Series 2006-QO7 Trust �3A2�(f) USD 0.355% 25/09/2046 781,337 0.37
1,364,249 Structured Adjustable Rate Mortgage Loan Trust Series 2005-22 �1A4�(f) USD 3.007% 25/12/2035 1,210,264 0.57550,000 Wells Fargo Commercial Mortgage Trust 2017-RC1 USD 3.250% 15/01/2060 413,512 0.19
33,936,313 15.89
TOTAL NON-AGENCIES ASSET BACKED OBLIGATIONS(cost USD 28,229,132) 33,936,313 15.89
TOTAL TRANSFERABLE SECURITIES DEALT IN ANOTHER REGULATED MARKET(cost USD 95,107,022) 103,657,264 48.55
MARKET VALUE OF INVESTMENTS EXCLUDING DERIVATIVES(cost USD 176,732,217) 210,276,475 98.49
Futures Contracts – 0.01%
Number ofContracts Security Description
CommitmentMarket Value
USD
UnrealisedGainUSD
% ofShareholders’
Equity
USD6 US Treasury Long Bond Futures 22/03/2021 Long 1,048,313 726 0.0056 US Treasury Notes 10YR Futures 22/03/2021 Long 7,734,125 12,004 0.0067 US Treasury Notes 2YR Futures 31/03/2021 Long 14,795,484 4,065 0.00131 US Treasury Notes 5YR Futures 31/03/2021 Long 16,504,977 13,646 0.01
40,082,899 30,441 0.01
UNREALISED GAIN ON FUTURES CONTRACTS 30,441 0.01
Goldman Sachs Funds—US Real Estate Balanced PortfolioSchedule of InvestmentsAs at 30 November 2020
The accompanying notes are an integral part of these financial statements.
434
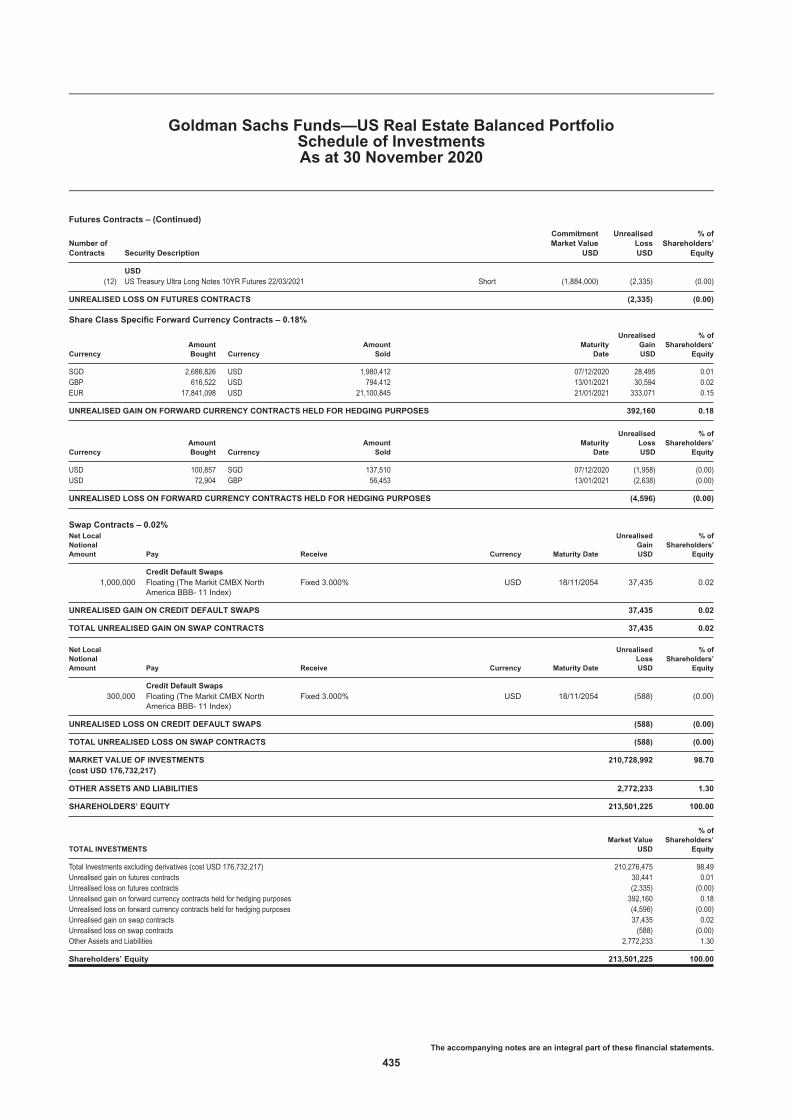
Futures Contracts – (Continued)
Number ofContracts Security Description
CommitmentMarket Value
USD
UnrealisedLossUSD
% ofShareholders’
Equity
USD(12) US Treasury Ultra Long Notes 10YR Futures 22/03/2021 Short (1,884,000) (2,335) (0.00)
UNREALISED LOSS ON FUTURES CONTRACTS (2,335) (0.00)
Share Class Specific Forward Currency Contracts – 0.18%
CurrencyAmountBought Currency
AmountSold
MaturityDate
UnrealisedGainUSD
% ofShareholders’
Equity
SGD 2,686,826 USD 1,980,412 07/12/2020 28,495 0.01GBP 616,522 USD 794,412 13/01/2021 30,594 0.02EUR 17,841,098 USD 21,100,845 21/01/2021 333,071 0.15
UNREALISED GAIN ON FORWARD CURRENCY CONTRACTS HELD FOR HEDGING PURPOSES 392,160 0.18
CurrencyAmountBought Currency
AmountSold
MaturityDate
UnrealisedLossUSD
% ofShareholders’
Equity
USD 100,857 SGD 137,510 07/12/2020 (1,958) (0.00)USD 72,904 GBP 56,453 13/01/2021 (2,638) (0.00)
UNREALISED LOSS ON FORWARD CURRENCY CONTRACTS HELD FOR HEDGING PURPOSES (4,596) (0.00)
Swap Contracts – 0.02%Net LocalNotionalAmount Pay Receive Currency Maturity Date
UnrealisedGainUSD
% ofShareholders’
Equity
Credit Default Swaps1,000,000 Floating (The Markit CMBX North
America BBB- 11 Index)Fixed 3.000% USD 18/11/2054 37,435 0.02
UNREALISED GAIN ON CREDIT DEFAULT SWAPS 37,435 0.02
TOTAL UNREALISED GAIN ON SWAP CONTRACTS 37,435 0.02
Net LocalNotionalAmount Pay Receive Currency Maturity Date
UnrealisedLossUSD
% ofShareholders’
Equity
Credit Default Swaps300,000 Floating (The Markit CMBX North
America BBB- 11 Index)Fixed 3.000% USD 18/11/2054 (588) (0.00)
UNREALISED LOSS ON CREDIT DEFAULT SWAPS (588) (0.00)
TOTAL UNREALISED LOSS ON SWAP CONTRACTS (588) (0.00)
MARKET VALUE OF INVESTMENTS(cost USD 176,732,217)
210,728,992 98.70
OTHER ASSETS AND LIABILITIES 2,772,233 1.30
SHAREHOLDERS’ EQUITY 213,501,225 100.00
TOTAL INVESTMENTSMarket Value
USD
% ofShareholders’
Equity
Total Investments excluding derivatives (cost USD 176,732,217) 210,276,475 98.49Unrealised gain on futures contracts 30,441 0.01Unrealised loss on futures contracts (2,335) (0.00)Unrealised gain on forward currency contracts held for hedging purposes 392,160 0.18Unrealised loss on forward currency contracts held for hedging purposes (4,596) (0.00)Unrealised gain on swap contracts 37,435 0.02Unrealised loss on swap contracts (588) (0.00)Other Assets and Liabilities 2,772,233 1.30
Shareholders’ Equity 213,501,225 100.00
Goldman Sachs Funds—US Real Estate Balanced PortfolioSchedule of InvestmentsAs at 30 November 2020
The accompanying notes are an integral part of these financial statements.
435

The Futures Commission Merchant was Goldman Sachs & Co. LLC.
The counterparties for forward currency contracts were Bank of America N.A., Barclays Bank Plc., BNP Paribas S.A., Citibank N.A., JP Morgan Chase Bank N.A., Royal Bank of Canada,Standard Chartered Bank, State Street Bank & Trust, UBS AG and Westpac Banking Corp.
The counterparty for swap contracts was Morgan Stanley & Co. International.
The maximum individual counterparty exposure as at 30 November 2020 is 0.08% of the NAV.
(a) Interest rates represent either the stated coupon rate, annualised discounted yield on date of purchase for discounted securities, or, for floating rate securities, the current reset ratewhich is based upon interest rates indices.
(b) Maturity dates represent either the stated date on the security, or the next interest reset date for floating rate securities or the prerefunded date for those type of securities.(c) A related party to Goldman Sachs Funds.(d) The yield for this fund as at 30 November 2020 was 0.120%.(e) 144A: This security is issued to qualified institutional investors, pursuant to private placements, and is transferable as stated in rule 144A of the US Securities Act of 1933.(f) Variable and floating coupon rates are those quoted as of 30 November 2020.
Goldman Sachs Funds—US Real Estate Balanced PortfolioSchedule of InvestmentsAs at 30 November 2020
The accompanying notes are an integral part of these financial statements.
436

Holdings Security Description Currency Interest Rate(a) Maturity Date(b)Market Value
USD
% ofShareholders’
Equity
Transferable securities admitted to an official exchange listing
Bonds – 75.65%Argentina
180,000 Arcor SAIC USD 6.000% 06/07/2023 177,919 0.1183,113 Argentina Government International Bond USD 1.000% 09/07/2029 35,822 0.02524,031 Argentina Government International Bond(c) USD 0.125% 09/07/2030 206,206 0.13
1,365,865 Argentina Government International Bond(d) USD 0.125% 09/07/2035 488,297 0.30114,000 Cia General de Combustibles S.A. USD 9.500% 08/03/2025 84,110 0.05270,000 IRSA Propiedades Comerciales S.A. USD 8.750% 23/03/2023 210,389 0.13
1,202,743 0.74
Australia260,000 Santos Finance Ltd. USD 4.125% 14/09/2027 273,388 0.17600,000 Santos Finance Ltd. USD 5.250% 13/03/2029 666,985 0.41
940,373 0.58
Bermuda270,000 Bermuda Government International Bond USD 3.375% 20/08/2050 287,381 0.18200,000 Star Energy Geothermal Darajat II Via Star Energy Geothermal Salak USD 4.850% 14/10/2038 218,313 0.13
505,694 0.31
Brazil1,130,000 Banco do Brasil S.A.(e) USD 6.250% Perp. 1,138,701 0.70270,000 BRF S.A. USD 5.750% 21/09/2050 284,133 0.17400,000 Samarco Mineracao S.A. USD 5.750% 24/10/2023 244,375 0.15
1,667,209 1.02
British Virgin Islands1,110,000 Central American Bottling Corp. USD 5.750% 31/01/2027 1,181,630 0.73200,000 Easy Tactic Ltd. USD 8.625% 27/02/2024 176,219 0.11320,000 Elect Global Investments Ltd.(e) USD 4.100% Perp. 316,480 0.19270,000 Fortune Star BVI Ltd. USD 6.850% 02/07/2024 284,513 0.17200,000 Fortune Star BVI Ltd. USD 5.950% 19/10/2025 205,000 0.13250,000 FPC Resources Ltd. USD 4.375% 11/09/2027 259,531 0.16200,000 HKT Capital No 5 Ltd. USD 3.250% 30/09/2029 215,531 0.13830,000 Huarong Finance 2019 Co., Ltd. USD 3.750% 29/05/2024 870,462 0.53350,000 Huarong Finance 2019 Co., Ltd. USD 3.375% 24/02/2030 358,367 0.22440,000 Huarong Finance 2019 Co., Ltd. USD 3.625% 30/09/2030 457,667 0.28770,000 Huarong Finance II Co., Ltd. USD 4.625% 03/06/2026 848,564 0.52200,000 Nuoxi Capital Ltd. USD 5.350% 24/01/2023 25,000 0.02200,000 Peak RE Bvi Holding Ltd.(e) USD 5.350% Perp. 207,525 0.13200,000 Studio City Finance Ltd. USD 6.000% 15/07/2025 211,000 0.13
5,617,489 3.45
Cayman Islands290,000 21Vianet Group, Inc. USD 7.875% 15/10/2021 296,525 0.18200,000 Aldar Sukuk Ltd. USD 4.750% 29/09/2025 223,219 0.14400,000 DP World Crescent Ltd. USD 4.848% 26/09/2028 457,000 0.28
1,280,000 DP World Salaam(e) USD 6.000% Perp. 1,392,800 0.86490,000 Dubai DOF Sukuk Ltd. USD 2.763% 09/09/2030 496,737 0.30270,000 Fantasia Holdings Group Co., Ltd. USD 9.875% 19/10/2023 269,663 0.17420,000 Grupo Aval Ltd. USD 4.375% 04/02/2030 435,015 0.27230,000 JD.com, Inc. USD 3.375% 14/01/2030 250,863 0.15330,000 Kaisa Group Holdings Ltd.(e) USD 10.875% Perp. 318,450 0.20400,000 Meituan Dianping �B� USD 3.050% 28/10/2030 414,718 0.25200,000 Mumtalakat Sukuk Holding Co. USD 4.100% 21/01/2027 202,656 0.12200,000 NagaCorp Ltd. USD 7.950% 06/07/2024 207,344 0.13310,000 New Oriental Education & Technology Group, Inc. USD 2.125% 02/07/2025 307,061 0.19750,000 Sharjah Sukuk Program Ltd.—Series NOV USD 3.234% 23/10/2029 787,031 0.48210,000 Sunac China Holdings Ltd. USD 8.350% 19/04/2023 220,172 0.14200,000 Tingyi Cayman Islands Holding Corp. USD 1.625% 24/09/2025 198,730 0.12200,000 Yuzhou Group Holdings Co., Ltd. USD 7.700% 20/02/2025 208,875 0.13260,000 Zhenro Properties Group Ltd.(e) USD 10.250% Perp. 267,434 0.16
6,954,293 4.27
Chile1,161,206,800 Bonos de la Tesoreria de la Republica en pesos CLP 1.500% 01/03/2026 1,726,875 1.0695,000,000 Bonos de la Tesoreria de la Republica en pesos 144A(f) CLP 4.700% 01/09/2030 146,586 0.09
Goldman Sachs Funds—Emerging Markets Total Return Bond PortfolioSchedule of InvestmentsAs at 30 November 2020
The accompanying notes are an integral part of these financial statements.
437

Holdings Security Description Currency Interest Rate(a) Maturity Date(b)Market Value
USD
% ofShareholders’
Equity
Bonds – (Continued)Chile – (Continued)
220,000 Enel Americas S.A. USD 4.000% 25/10/2026 244,097 0.15800,000 GNL Quintero S.A. USD 4.634% 31/07/2029 881,750 0.54
2,999,308 1.84
China230,000 Bank of China Ltd. USD 5.000% 13/11/2024 256,737 0.16
Colombia590,000 Banco de Bogota S.A. USD 5.375% 19/02/2023 628,719 0.39
1,430,000 Banco de Bogota S.A. USD 6.250% 12/05/2026 1,627,555 1.00400,000 Colombia Government International Bond USD 4.125% 15/05/2051 438,900 0.27
2,934,600,000 Colombian TES—Series B COP 6.250% 26/11/2025 899,049 0.554,174,300,000 Colombian TES—Series B COP 7.500% 26/08/2026 1,347,690 0.83238,700,000 Colombian TES—Series B COP 6.000% 28/04/2028 70,934 0.04
1,012,300,000 Colombian TES—Series B COP 7.250% 18/10/2034 311,209 0.19420,000 Grupo Energia Bogota S.A. ESP USD 4.875% 15/05/2030 490,350 0.30
5,814,406 3.57
Cyprus980,000 MHP S.E. USD 7.750% 10/05/2024 1,072,487 0.66
Dominican Republic1,900,000 Dominican Republic Bond DOP 12.000% 05/03/2032 39,966 0.038,350,000 Dominican Republic International Bond DOP 8.900% 15/02/2023 146,682 0.092,120,000 Dominican Republic International Bond USD 6.600% 28/01/2024 2,361,150 1.451,360,000 Dominican Republic International Bond USD 5.950% 25/01/2027 1,535,525 0.94
4,083,323 2.51
Ecuador214,414 Ecuador Government International Bond USD 8.485% 31/07/2030 95,950 0.06867,140 Ecuador Government International Bond(d) USD 0.500% 31/07/2040 429,234 0.26
525,184 0.32
Egypt600,000 Egypt Government International Bond EUR 5.625% 16/04/2030 727,040 0.45590,000 Egypt Government International Bond USD 8.875% 29/05/2050 658,126 0.40
1,385,166 0.85
Guatemala760,000 Guatemala Government Bond USD 5.750% 06/06/2022 804,175 0.49
1,890,000 Guatemala Government Bond USD 4.900% 01/06/2030 2,173,795 1.34400,000 Guatemala Government Bond USD 6.125% 01/06/2050 512,313 0.31
3,490,283 2.14
Honduras280,000 Honduras Government International Bond USD 8.750% 16/12/2020 280,686 0.17
Hong Kong250,000 Bank of East Asia Ltd.(e) USD 5.825% Perp. 261,000 0.16300,000 CNAC HK Finbridge Co., Ltd. USD 3.000% 22/09/2030 285,439 0.17340,000 Far East Horizon Ltd. USD 3.375% 18/02/2025 340,903 0.21200,000 Far East Horizon Ltd.(e) USD 4.350% Perp. 198,000 0.12290,000 MTR Corp., Ltd. USD 1.625% 19/08/2030 288,022 0.18
1,373,364 0.84
Hungary1,340,000 OTP Bank Nyrt(e) EUR 2.875% 15/07/2029 1,631,508 1.00
India200,000 Adani Green Energy UP Ltd. Via Prayatna Developers Pvt Ltd. Via
Parampujya Solar Energy Pvt Ltd. USD 6.250% 10/12/2024 220,594 0.13450,000 Reliance Industries Ltd. USD 3.667% 30/11/2027 502,172 0.31
722,766 0.44
Indonesia200,000 ABM Investama Tbk PT USD 7.125% 01/08/2022 144,094 0.09200,000 Alam Sutera Realty Tbk PT USD 6.250% 02/11/2025 147,000 0.09290,000 Delta Merlin Dunia Tekstil PT USD 8.625% 12/03/2024 25,013 0.01
Goldman Sachs Funds—Emerging Markets Total Return Bond PortfolioSchedule of InvestmentsAs at 30 November 2020
The accompanying notes are an integral part of these financial statements.
438

Holdings Security Description Currency Interest Rate(a) Maturity Date(b)Market Value
USD
% ofShareholders’
Equity
Bonds – (Continued)Indonesia – (Continued)
720,000 Indonesia Government International Bond USD 4.450% 15/04/2070 893,362 0.55230,000 Tower Bersama Infrastructure Tbk PT USD 4.250% 21/01/2025 237,870 0.15
1,447,339 0.89
Ireland770,000 Alfa Bank AO Via Alfa Bond Issuance Plc.(e) USD 5.950% 15/04/2030 805,011 0.49200,000 Credit Bank of Moscow Via CBOM Finance Plc. USD 4.700% 29/01/2025 205,375 0.13
1,080,000 Credit Bank of Moscow Via CBOM Finance Plc.(e) USD 7.500% 05/10/2027 1,085,400 0.67200,000 Eurotorg LLC Via Bonitron DAC USD 9.000% 22/10/2025 212,000 0.13210,000 Phosagro OAO Via Phosagro Bond Funding DAC USD 3.949% 24/04/2023 220,040 0.13
1,250,000 Phosagro OAO Via Phosagro Bond Funding DAC USD 3.050% 23/01/2025 1,302,500 0.80
3,830,326 2.35
Isle Of Man840,000 Gohl Capital Ltd. USD 4.250% 24/01/2027 882,000 0.54800,000 Sasol Financing International Ltd. USD 4.500% 14/11/2022 809,000 0.50
1,691,000 1.04
Israel1,280,000 Bank Leumi Le-Israel BM 144A(e)(f) USD 3.275% 29/01/2031 1,318,400 0.81630,000 Leviathan Bond Ltd. 144A(f) USD 5.750% 30/06/2023 664,650 0.41320,000 Leviathan Bond Ltd. 144A(f) USD 6.750% 30/06/2030 352,000 0.22
2,335,050 1.44
Ivory Coast110,000 Ivory Coast Government International Bond EUR 4.875% 30/01/2032 131,950 0.08200,000 Ivory Coast Government International Bond USD 6.125% 15/06/2033 220,531 0.14100,000 Ivory Coast Government International Bond EUR 6.625% 22/03/2048 129,102 0.08
481,583 0.30
Japan350,000 SoftBank Group Corp.(e) USD 6.000% Perp. 343,000 0.21
Jersey270,000 Galaxy Pipeline Assets Bidco Ltd. USD 2.625% 31/03/2036 279,788 0.17490,000 Galaxy Pipeline Assets Bidco Ltd. USD 3.250% 30/09/2040 508,681 0.32
788,469 0.49
Luxembourg1,110,000 Altice Financing S.A. USD 7.500% 15/05/2026 1,169,663 0.72100,000 Gazprom PJSC Via Gaz Capital S.A. USD 7.288% 16/08/2037 145,078 0.09
1,314,741 0.81
Macedonia720,000 North Macedonia Government International Bond EUR 2.750% 18/01/2025 910,908 0.56690,000 North Macedonia Government International Bond EUR 3.675% 03/06/2026 916,149 0.56
1,827,057 1.12
Malaysia200,000 Axiata Spv5 Labuan Ltd. USD 3.064% 19/08/2050 201,344 0.12
Mauritius200,000 Greenko Investment Co. USD 4.875% 16/08/2023 203,594 0.13200,000 Greenko Solar Mauritius Ltd. USD 5.950% 29/07/2026 214,750 0.13320,000 HTA Group Ltd. USD 7.000% 18/12/2025 344,700 0.21200,000 MTN Mauritius Investments Ltd. USD 5.373% 13/02/2022 205,875 0.13950,000 MTN Mauritius Investments Ltd. USD 6.500% 13/10/2026 1,079,437 0.66260,000 Network i2i Ltd.(e) USD 5.650% Perp. 272,512 0.17370,000 UPL Corp., Ltd. USD 4.625% 16/06/2030 397,230 0.24200,000 UPL Corp., Ltd.(e) USD 5.250% Perp. 199,094 0.12
2,917,192 1.79
Mexico480,000 Banco Mercantil del Norte S.A.(e) USD 5.750% 04/10/2031 507,900 0.31670,000 Banco Mercantil del Norte S.A.(e) USD 6.750% Perp. 707,688 0.44200,000 Banco Mercantil del Norte S.A.(e) USD 7.625% Perp. 217,500 0.13420,000 Banco Santander Mexico S.A. Institucion de Banca Multiple Grupo
Financiero Santander(e) USD 5.950% 01/10/2028 456,028 0.28640,000 Becle SAB de CV USD 3.750% 13/05/2025 691,900 0.43
Goldman Sachs Funds—Emerging Markets Total Return Bond PortfolioSchedule of InvestmentsAs at 30 November 2020
The accompanying notes are an integral part of these financial statements.
439

Holdings Security Description Currency Interest Rate(a) Maturity Date(b)Market Value
USD
% ofShareholders’
Equity
Bonds – (Continued)Mexico – (Continued)
680,000 Gruma SAB de CV USD 4.875% 01/12/2024 763,831 0.4712,152,700 Mexican Bonos—Series M MXN 5.750% 05/03/2026 623,826 0.3820,288,600 Mexican Bonos—Series M 20 MXN 8.500% 31/05/2029 1,210,091 0.741,650,000 Mexico City Airport Trust USD 4.250% 31/10/2026 1,649,227 1.01600,000 Mexico City Airport Trust USD 3.875% 30/04/2028 578,625 0.36800,000 Mexico City Airport Trust USD 5.500% 31/07/2047 776,750 0.48970,000 Mexico Government International Bond USD 2.659% 24/05/2031 973,395 0.60
1,060,000 Mexico Government International Bond USD 3.771% 24/05/2061 1,057,350 0.65300,000 Petroleos Mexicanos USD 6.875% 16/10/2025 312,969 0.19
10,527,080 6.47
Mongolia200,000 Mongolia Government International Bond USD 5.125% 07/04/2026 211,750 0.13
Netherlands200,000 First Bank of Nigeria Ltd. Via FBN Finance Co. BV USD 8.625% 27/10/2025 213,000 0.13200,000 Greenko Dutch BV USD 4.875% 24/07/2022 202,250 0.12200,000 IHS Netherlands Holdco BV USD 8.000% 18/09/2027 217,125 0.13
1,100,000 Lukoil International Finance BV USD 4.750% 02/11/2026 1,251,078 0.77210,000 Lukoil Securities BV USD 3.875% 06/05/2030 227,062 0.14200,000 Metinvest BV USD 7.650% 01/10/2027 209,469 0.13200,000 Minejesa Capital BV USD 4.625% 10/08/2030 214,250 0.13420,000 Mong Duong Finance Holdings BV USD 5.125% 07/05/2029 444,150 0.27838,620 MV24 Capital BV USD 6.748% 01/06/2034 894,572 0.55100,000 NE Property BV EUR 2.625% 22/05/2023 123,254 0.08740,000 NE Property BV EUR 3.375% 14/07/2027 927,612 0.57550,000 Petrobras Global Finance BV USD 7.375% 17/01/2027 682,000 0.4240,000 Petrobras Global Finance BV USD 5.999% 27/01/2028 46,840 0.0340,000 Petrobras Global Finance BV USD 6.850% 05/06/2115 46,860 0.03200,000 PPF Telecom Group BV EUR 2.125% 31/01/2025 244,375 0.15240,000 PPF Telecom Group BV EUR 3.250% 29/09/2027 306,845 0.19820,000 Prosus NV USD 3.680% 21/01/2030 895,686 0.55390,000 Prosus NV USD 4.027% 03/08/2050 416,325 0.26200,000 Vivo Energy Investments BV USD 5.125% 24/09/2027 214,219 0.13
7,776,972 4.78
Nigeria550,000 Nigeria Government International Bond USD 6.500% 28/11/2027 577,930 0.35320,000 Nigeria Government International Bond USD 7.143% 23/02/2030 337,900 0.21
915,830 0.56
Norway1,360,000 DNO ASA 144A(f) USD 8.375% 29/05/2024 1,258,000 0.77
Panama400,000 Panama Notas del Tesoro USD 3.750% 17/04/2026 434,875 0.27
Paraguay270,000 Paraguay Government International Bond USD 5.000% 15/04/2026 312,778 0.19
1,120,000 Paraguay Government International Bond USD 6.100% 11/08/2044 1,485,750 0.91200,000 Paraguay Government International Bond USD 5.600% 13/03/2048 254,282 0.16200,000 Paraguay Government International Bond USD 5.400% 30/03/2050 250,156 0.16
2,302,966 1.42
Peru260,688 ABY Transmision Sur S.A. USD 6.875% 30/04/2043 350,381 0.21
15,350,000 Banco de Credito del Peru PEN 4.650% 17/09/2024 4,538,484 2.791,810,000 Peru Government Bond PEN 5.400% 12/08/2034 543,059 0.332,150,000 Peru Government Bond PEN 5.350% 12/08/2040 606,588 0.37310,000 Peruvian Government International Bond USD 2.780% 01/12/2060 306,125 0.19290,000 Peruvian Government International Bond USD 3.230% 28/07/2121 286,520 0.18
6,631,157 4.07
Philippines310,000 International Container Terminal Services, Inc. USD 4.750% 17/06/2030 333,638 0.21200,000 San Miguel Corp.(e) USD 5.500% Perp. 200,875 0.12270,000 SMC Global Power Holdings Corp.(e) USD 7.000% Perp. 277,931 0.17
812,444 0.50
Romania50,000 Romanian Government International Bond EUR 2.875% 11/03/2029 67,044 0.04
Goldman Sachs Funds—Emerging Markets Total Return Bond PortfolioSchedule of InvestmentsAs at 30 November 2020
The accompanying notes are an integral part of these financial statements.
440

Holdings Security Description Currency Interest Rate(a) Maturity Date(b)Market Value
USD
% ofShareholders’
Equity
Bonds – (Continued)Romania – (Continued)
120,000 Romanian Government International Bond EUR 2.500% 08/02/2030 155,889 0.09780,000 Romanian Government International Bond EUR 3.624% 26/05/2030 1,107,574 0.68300,000 Romanian Government International Bond USD 3.000% 14/02/2031 321,703 0.2040,000 Romanian Government International Bond EUR 2.124% 16/07/2031 50,478 0.03270,000 Romanian Government International Bond EUR 2.000% 28/01/2032 337,404 0.21270,000 Romanian Government International Bond EUR 2.625% 02/12/2040 327,117 0.20650,000 Romanian Government International Bond USD 4.000% 14/02/2051 712,461 0.44
3,079,670 1.89
Russia150,870,000 Russian Federal Bond - OFZ Bonds—Series 6221 RUB 7.700% 23/03/2033 2,258,094 1.39156,525,000 Russian Federal Bond - OFZ Bonds—Series 6235 RUB 5.900% 12/03/2031 2,055,805 1.26
200,000 Russian Foreign Bond - Eurobond USD 5.250% 23/06/2047 272,437 0.17
4,586,336 2.82
Saudi Arabia200,000 Saudi Government International Bond USD 3.750% 21/01/2055 223,000 0.14
Serbia420,000 Serbia International Bond EUR 3.125% 15/05/2027 564,898 0.35100,000 Serbia International Bond EUR 1.500% 26/06/2029 121,604 0.07
686,502 0.42
Singapore250,000 AEV International Pte Ltd. USD 4.200% 16/01/2030 255,547 0.1511,534 Innovate Capital Pte Ltd.—Series MCB(e) USD 6.000% 11/12/2024 1,445 0.00441,330 LLPL Capital Pte Ltd. USD 6.875% 04/02/2039 516,908 0.32260,000 Theta Capital Pte Ltd. USD 8.125% 22/01/2025 257,440 0.16280,000 Trafigura Group Pte Ltd.(e) USD 6.875% Perp. 275,012 0.17
1,306,352 0.80
South Africa500,000 Growthpoint Properties International Pty Ltd. USD 5.872% 02/05/2023 527,344 0.32
26,200,000 South Africa Government Bond—Series 2030 ZAR 8.000% 31/01/2030 1,603,430 0.9918,365,000 South Africa Government Bond—Series 2035 ZAR 8.875% 28/02/2035 1,038,267 0.6417,830,000 South Africa Government Bond—Series 2044 ZAR 8.750% 31/01/2044 928,984 0.576,570,000 South Africa Government Bond—Series 2048 ZAR 8.750% 28/02/2048 342,636 0.2117,340,000 South Africa Government Bond—Series R186 ZAR 10.500% 21/12/2026 1,316,771 0.81
5,757,432 3.54
Spain299,305 International Airport Finance S.A. USD 12.000% 15/03/2033 294,067 0.18
Supranationals1,280,000 Black Sea Trade & Development Bank USD 3.500% 25/06/2024 1,346,739 0.831,980,000 Eastern & Southern African Trade & Development Bank USD 4.875% 23/05/2024 2,068,447 1.27400,000 Mongolian Mining Corp. Via Energy Resources LLC USD 9.250% 15/04/2024 356,000 0.22
3,771,186 2.32
Thailand350,000 Kasikornbank PCL(e) USD 3.343% 02/10/2031 353,828 0.22470,000 PTT Treasury Center Co., Ltd. USD 3.700% 16/07/2070 491,224 0.30350,000 PTTEP Treasury Center Co., Ltd. USD 2.993% 15/01/2030 372,039 0.23
1,217,091 0.75
Turkey460,000 Anadolu Efes Biracilik ve Malt Sanayii AS USD 3.375% 01/11/2022 467,475 0.29
1,260,000 Coca-Cola Icecek AS USD 4.215% 19/09/2024 1,316,897 0.81660,000 Global Liman Isletmeleri AS USD 8.125% 14/11/2021 485,100 0.30660,000 Mersin Uluslararasi Liman Isletmeciligi AS USD 5.375% 15/11/2024 694,341 0.43400,000 Turkiye Vakiflar Bankasi TAO USD 8.125% 28/03/2024 424,250 0.26930,000 Turkiye Vakiflar Bankasi TAO USD 5.250% 05/02/2025 900,356 0.55880,000 Yapi ve Kredi Bankasi AS USD 8.250% 15/10/2024 950,400 0.58
5,238,819 3.22
Ukraine180,000 Ukraine Government International Bond USD 7.750% 01/09/2026 199,378 0.1299,000 Ukraine Government International Bond—Series GDP(e) USD 1.000% 31/05/2040 98,366 0.06
297,744 0.18
Goldman Sachs Funds—Emerging Markets Total Return Bond PortfolioSchedule of InvestmentsAs at 30 November 2020
The accompanying notes are an integral part of these financial statements.
441

Holdings Security Description Currency Interest Rate(a) Maturity Date(b)Market Value
USD
% ofShareholders’
Equity
Bonds – (Continued)United Arab Emirates
200,000 Abu Dhabi Crude Oil Pipeline LLC USD 4.600% 02/11/2047 248,469 0.15200,000 DP World Plc. USD 5.625% 25/09/2048 244,594 0.15100,000 DP World Plc. 144A(f) USD 6.850% 02/07/2037 132,797 0.08400,000 Emirate of Dubai Government International Bonds USD 3.900% 09/09/2050 393,000 0.24820,000 Finance Department Government of Sharjah USD 4.000% 28/07/2050 848,700 0.52980,000 National Central Cooling Co. PJSC USD 2.500% 21/10/2027 985,512 0.61
1,570,000 NBK Tier 1 Financing 2 Ltd.(e) USD 4.500% Perp. 1,577,359 0.97
4,430,431 2.72
United Kingdom1,150,000 Gazprom PJSC Via Gaz Finance Plc.(e) USD 4.599% Perp. 1,206,781 0.74200,000 Vedanta Resources Finance II Plc. USD 9.250% 23/04/2026 132,250 0.08200,000 Vedanta Resources Ltd. USD 7.125% 31/05/2023 134,600 0.08200,000 Vedanta Resources Ltd. USD 6.125% 09/08/2024 128,000 0.08
1,601,631 0.98
United States1,020,000 Kosmos Energy Ltd. USD 7.125% 04/04/2026 923,100 0.57510,000 Sasol Financing USA LLC USD 5.875% 27/03/2024 528,089 0.32
1,451,189 0.89
Uzbekistan200,000 Republic of Uzbekistan Bond USD 3.700% 25/11/2030 203,500 0.13
Venezuela1,620,000 Venezuela Government International Bond USD 7.650% 21/04/2025 153,900 0.10
Vietnam330,000 Viet Nam Debt & Asset Trading Corp. USD 1.000% 10/10/2025 279,314 0.17
TOTAL BONDS(cost USD 118,213,570) 123,149,358 75.65
Holdings Security DescriptionMarket Value
USD
% ofShareholders’
Equity
Mutual Funds – 2.93%Ireland
4,777,062 Goldman Sachs US$ Treasury Liquid Reserves Fund (X Distribution Class)(g)(h) 4,777,062 2.93
TOTAL MUTUAL FUNDS(cost USD 4,777,062) 4,777,062 2.93
TOTAL TRANSFERABLE SECURITIES ADMITTED TO AN OFFICIAL EXCHANGE LISTING(cost USD 122,990,632) 127,926,420 78.58
Holdings Security Description Currency Interest Rate(a) Maturity Date(b)Market Value
USD
% ofShareholders’
Equity
Transferable securities dealt in another regulated market
Bonds – 11.38%Argentina
103,000 Telecom Argentina S.A. USD 8.500% 06/08/2025 95,001 0.06
Bermuda410,000 Credicorp Ltd. USD 2.750% 17/06/2025 424,965 0.26240,000 Geopark Ltd. USD 5.500% 17/01/2027 234,450 0.14
1,240,000 Tengizchevroil Finance Co. International Ltd. USD 2.625% 15/08/2025 1,281,540 0.79630,000 Tengizchevroil Finance Co. International Ltd. USD 3.250% 15/08/2030 658,350 0.41
2,599,305 1.60
Brazil620,000 BRF S.A. USD 4.875% 24/01/2030 660,688 0.40920,000 Itau Unibanco Holding S.A.(e) USD 4.625% Perp. 861,350 0.53
1,522,038 0.93
Cayman Islands520,000 Grupo Aval Ltd. USD 4.750% 26/09/2022 543,530 0.3360,000 iQIYI, Inc. USD 2.000% 01/04/2025 56,850 0.04
600,380 0.37
Goldman Sachs Funds—Emerging Markets Total Return Bond PortfolioSchedule of InvestmentsAs at 30 November 2020
The accompanying notes are an integral part of these financial statements.
442

Holdings Security Description Currency Interest Rate(a) Maturity Date(b)Market Value
USD
% ofShareholders’
Equity
Bonds – (Continued)Chile
300,000 Sociedad Quimica y Minera de Chile S.A. USD 4.250% 22/01/2050 336,797 0.21
Colombia720,000 Empresas Publicas de Medellin ESP USD 4.250% 18/07/2029 767,588 0.47650,000 Transportadora de Gas Internacional S.A. ESP USD 5.550% 01/11/2028 767,711 0.47
1,535,299 0.94
Israel40,000 ICL Group Ltd. 144A(f) USD 6.375% 31/05/2038 52,700 0.03
Luxembourg340,000 JSM Global SARL USD 4.750% 20/10/2030 357,000 0.22670,000 Rede D’or Finance SARL USD 4.500% 22/01/2030 693,450 0.42
1,050,450 0.64
Mexico340,000 Alpha Holding S.A. de CV USD 9.000% 10/02/2025 258,240 0.16
1,120,000 BBVA Bancomer S.A.(e) USD 5.125% 18/01/2033 1,173,200 0.72200,000 Cemex SAB de CV USD 7.375% 05/06/2027 225,222 0.14200,000 Cemex SAB de CV USD 5.450% 19/11/2029 219,125 0.13400,000 Cemex SAB de CV USD 5.200% 17/09/2030 435,384 0.27230,000 Industrias Penoles SAB de CV USD 4.750% 06/08/2050 254,150 0.16
2,565,321 1.58
Netherlands200,000 Metinvest BV USD 7.750% 23/04/2023 212,406 0.13
Panama890,000 AES Panama Generation Holdings SRL USD 4.375% 31/05/2030 963,286 0.59520,000 Banco Latinoamericano de Comercio Exterior S.A. USD 2.375% 14/09/2025 533,738 0.33420,000 Banco Nacional de Panama USD 2.500% 11/08/2030 419,475 0.26
1,040,000 Cable Onda S.A. USD 4.500% 30/01/2030 1,137,500 0.70200,000 Cable Onda S.A. 144A(f) USD 4.500% 30/01/2030 218,750 0.13
3,272,749 2.01
Paraguay730,000 Telefonica Celular del Paraguay S.A. USD 5.875% 15/04/2027 782,469 0.48
Peru850,000 Consorcio Transmantaro S.A. USD 4.700% 16/04/2034 1,011,766 0.62780,000 Corp Lindley S.A. USD 4.625% 12/04/2023 814,612 0.50590,000 Hunt Oil Co. of Peru LLC Sucursal Del Peru USD 6.375% 01/06/2028 623,003 0.38770,000 Inretail Pharma S.A. USD 5.375% 02/05/2023 802,003 0.49380,000 Transportadora de Gas del Peru S.A. USD 4.250% 30/04/2028 428,450 0.27
3,679,834 2.26
Turkey200,000 Yapi ve Kredi Bankasi AS(e) USD 13.875% Perp. 224,000 0.14
TOTAL BONDS(cost USD 17,836,126) 18,528,749 11.38
TOTAL TRANSFERABLE SECURITIES DEALT IN ANOTHER REGULATED MARKET(cost USD 17,836,126) 18,528,749 11.38
Other Transferable Securities
Bonds – 3.97%Dominican Republic
10,000,000 Dominican Republic Central Bank Notes DOP 11.000% 15/09/2023 186,878 0.12
Peru4,092,000 Peruvian Government International Bond PEN 8.200% 12/08/2026 1,529,338 0.942,796,000 Peruvian Government International Bond PEN 6.350% 12/08/2028 963,694 0.59142,000 Peruvian Government International Bond PEN 6.850% 12/02/2042 47,816 0.03
2,540,848 1.56
United Kingdom23,000,000 HSBC Bank Plc. 144A(f) EGP 0.000% 07/01/2021 1,447,717 0.89
Goldman Sachs Funds—Emerging Markets Total Return Bond PortfolioSchedule of InvestmentsAs at 30 November 2020
The accompanying notes are an integral part of these financial statements.
443

Holdings Security Description Currency Interest Rate(a) Maturity Date(b)Market Value
USD
% ofShareholders’
Equity
Bonds – (Continued)United States
18,100,000 JPMorgan Chase Bank NA 144A(f) EGP 0.000% 08/07/2021 1,069,671 0.6620,950,000 JPMorgan Chase Bank NA 144A(f) EGP 0.000% 02/09/2021 1,215,282 0.74
2,284,953 1.40
TOTAL BONDS(cost USD 6,408,015) 6,460,396 3.97
TOTAL OTHER TRANSFERABLE SECURITIES(cost USD 6,408,015) 6,460,396 3.97
MARKET VALUE OF INVESTMENTS EXCLUDING DERIVATIVES(cost USD 147,234,773) 152,915,565 93.93
Futures Contracts – 0.04%
Number ofContracts Security Description
CommitmentMarket Value
USD
UnrealisedGainUSD
% ofShareholders’
Equity
USD72 US Treasury Long Bond Futures 22/03/2021 Long 12,579,750 4,062 0.00292 US Treasury Notes 10YR Futures 22/03/2021 Long 40,327,937 65,942 0.0465 US Treasury Notes 5YR Futures 31/03/2021 Long 8,189,492 5,883 0.0122 US Treasury Ultra Long Bond Futures 22/03/2021 Long 4,744,438 1,556 0.00
65,841,617 77,443 0.05
UNREALISED GAIN ON FUTURES CONTRACTS 77,443 0.05
Number ofContracts Security Description
CommitmentMarket Value
USD
UnrealisedLossUSD
% ofShareholders’
Equity
USD(16) US Treasury Notes 2YR Futures 31/03/2021 Short (3,533,250) (1,000) (0.00)(21) US Treasury Ultra Long Notes 10YR Futures 22/03/2021 Short (3,297,000) (5,186) (0.01)
(6,830,250) (6,186) (0.01)
UNREALISED LOSS ON FUTURES CONTRACTS (6,186) (0.01)
Non-Deliverable Bond Forward Contracts – 0.05%
Number ofContracts Security Description
CommitmentMarket Value
USD
UnrealisedGainUSD
% ofShareholders’
Equity
COP13,529,100,000 BFS Finance COP Bond Forward 06/01/2021 Long 51,426 51,426 0.033,538,000,000 BFS Finance COP Bond Forward 06/01/2021 Long 22,320 22,320 0.02
73,746 73,746 0.05
UNREALISED GAIN ON NON-DELIVERABLE BOND FORWARD CONTRACTS 73,746 0.05
Forward Currency Contracts – (0.15%)
CurrencyAmountBought Currency
AmountSold
MaturityDate
UnrealisedGainUSD
% ofShareholders’
Equity
AUD 8,009,614 USD 5,885,209 01/12/2020 24,682 0.01EUR 14,883,842 USD 17,640,792 01/12/2020 213,120 0.07NOK 5,591,312 USD 617,000 01/12/2020 18,257 0.01BRL 4,301,656 USD 806,811 02/12/2020 3,690 0.00IDR 10,283,250,866 USD 699,396 04/12/2020 28,210 0.02IDR 18,760,191,115 USD 1,305,603 07/12/2020 19,971 0.01ZAR 67,876,816 USD 4,179,408 07/12/2020 240,456 0.15EUR 5,219,000 USD 6,235,839 10/12/2020 25,839 0.02MXN 71,799,731 USD 3,388,549 10/12/2020 184,315 0.12USD 856,785 CLP 653,073,323 14/12/2020 3,410 0.00AUD 2,678,228 EUR 1,623,647 16/12/2020 27,958 0.01AUD 8,707,862 USD 6,291,023 16/12/2020 135,023 0.06CAD 488,939 CHF 336,366 16/12/2020 5,756 0.00CAD 503,897 JPY 40,354,063 16/12/2020 2,470 0.00CAD 14,247,315 USD 10,824,032 16/12/2020 192,959 0.10CHF 2,318,835 USD 2,543,590 16/12/2020 23,143 0.01
Goldman Sachs Funds—Emerging Markets Total Return Bond PortfolioSchedule of InvestmentsAs at 30 November 2020
The accompanying notes are an integral part of these financial statements.
444

Forward Currency Contracts – (Continued)
CurrencyAmountBought Currency
AmountSold
MaturityDate
UnrealisedGainUSD
% ofShareholders’
Equity
CNH 132,300,101 USD 19,577,756 16/12/2020 533,021 0.36COP 1,145,513,620 USD 305,761 16/12/2020 13,743 0.01CZK 8,454,307 EUR 312,774 16/12/2020 11,353 0.01CZK 27,715,101 USD 1,232,783 16/12/2020 34,899 0.02EUR 306,132 CHF 328,827 16/12/2020 3,395 0.00EUR 1,281,959 SGD 2,049,949 16/12/2020 5,690 0.00EUR 15,123,554 USD 17,821,366 16/12/2020 327,728 0.22GBP 2,514,319 EUR 2,751,836 16/12/2020 60,680 0.05GBP 4,497,409 USD 5,834,168 16/12/2020 181,356 0.13HUF 264,117,713 USD 864,865 16/12/2020 17,155 0.00IDR 10,028,613,601 USD 706,252 16/12/2020 1,387 0.00ILS 8,876,850 USD 2,592,123 16/12/2020 91,930 0.07JPY 1,103,101,976 USD 10,511,167 16/12/2020 72,559 0.04MXN 77,523,833 USD 3,604,507 16/12/2020 250,955 0.16NOK 31,356,437 EUR 2,878,280 16/12/2020 108,721 0.08NOK 10,495,625 SEK 10,008,559 16/12/2020 12,381 0.01NOK 32,525,138 USD 3,601,671 16/12/2020 93,935 0.07NZD 566,764 AUD 538,614 16/12/2020 1,849 0.00NZD 553,761 EUR 312,154 16/12/2020 15,560 0.01NZD 7,554,152 USD 5,063,445 16/12/2020 258,965 0.17PLN 4,190,249 EUR 935,788 16/12/2020 572 0.00PLN 9,453,867 USD 2,507,509 16/12/2020 27,445 0.01SEK 29,609,383 EUR 2,858,649 16/12/2020 60,871 0.05SEK 20,090,229 USD 2,285,306 16/12/2020 83,643 0.05SGD 8,205,028 USD 6,060,121 16/12/2020 74,715 0.03THB 146,723,043 USD 4,711,934 16/12/2020 137,906 0.09TRY 11,465,408 USD 1,372,283 16/12/2020 87,207 0.05USD 701,110 IDR 9,932,411,832 16/12/2020 261 0.00ZAR 68,069,879 USD 4,135,092 17/12/2020 291,480 0.19IDR 18,072,345,632 USD 1,273,156 06/01/2021 272 0.00KRW 4,146,351,079 USD 3,709,784 08/01/2021 36,583 0.02TRY 3,226,176 USD 383,417 11/01/2021 23,277 0.01TRY 6,300,292 USD 776,063 19/01/2021 15,744 0.01EUR 461,413 USD 545,524 21/01/2021 8,809 0.01USD 2,843,512 INR 211,324,422 27/01/2021 3,069 0.00INR 58,688,384 USD 780,254 05/02/2021 7,853 0.01USD 997,351 TWD 27,968,433 05/02/2021 8,018 0.01RUB 43,077,629 USD 553,049 08/02/2021 9,234 0.00NZD 1,268,611 AUD 1,180,653 09/02/2021 22,190 0.01USD 8,944,376 PEN 31,566,043 12/07/2021 200,809 0.12
UNREALISED GAIN ON FORWARD CURRENCY CONTRACTS 4,346,479 2.67
CurrencyAmountBought Currency
AmountSold
MaturityDate
UnrealisedLossUSD
% ofShareholders’
Equity
USD 5,852,432 AUD 8,009,613 01/12/2020 (57,459) (0.02)USD 17,678,797 EUR 14,883,838 01/12/2020 (175,111) (0.08)USD 4,346,282 NOK 39,144,982 01/12/2020 (101,179) (0.05)AUD 7,160,553 USD 5,295,428 02/12/2020 (12,013) (0.01)USD 5,274,619 AUD 7,160,553 02/12/2020 (8,795) (0.01)USD 790,264 BRL 4,301,656 02/12/2020 (20,238) (0.01)USD 726,896 IDR 10,283,250,866 04/12/2020 (710) (0.00)USD 3,435,470 EUR 2,897,258 07/12/2020 (40,328) (0.02)USD 763,497 IDR 10,875,441,716 07/12/2020 (4,950) (0.00)USD 6,883,603 ZAR 113,196,647 07/12/2020 (487,307) (0.30)USD 709,266 CZK 16,303,270 09/12/2020 (36,272) (0.02)USD 5,354,852 EUR 4,491,322 10/12/2020 (33,770) (0.02)USD 4,811,034 MXN 104,226,725 10/12/2020 (375,447) (0.23)CLP 416,334,421 USD 545,855 14/12/2020 (1,829) (0.00)TWD 32,782,427 USD 1,155,777 14/12/2020 (6,495) (0.00)USD 1,459,805 NOK 13,006,072 14/12/2020 (17,959) (0.01)USD 901,238 EUR 755,755 15/12/2020 (5,676) (0.00)USD 506,072 GBP 380,505 15/12/2020 (2,863) (0.00)AUD 508,727 CAD 489,065 16/12/2020 (2,758) (0.00)CHF 986,151 EUR 916,110 16/12/2020 (7,806) (0.00)EUR 318,213 CAD 495,873 16/12/2020 (1,569) (0.00)EUR 311,549 CZK 8,434,263 16/12/2020 (11,905) (0.01)EUR 1,484,695 GBP 1,348,742 16/12/2020 (22,297) (0.01)EUR 311,549 HUF 114,213,984 16/12/2020 (7,541) (0.01)EUR 773,158 NOK 8,575,301 16/12/2020 (46,521) (0.03)
Goldman Sachs Funds—Emerging Markets Total Return Bond PortfolioSchedule of InvestmentsAs at 30 November 2020
The accompanying notes are an integral part of these financial statements.
445

Forward Currency Contracts – (Continued)
CurrencyAmountBought Currency
AmountSold
MaturityDate
UnrealisedLossUSD
% ofShareholders’
Equity
EUR 314,421 PLN 1,425,963 16/12/2020 (5,034) (0.00)EUR 3,989,424 SEK 41,446,328 16/12/2020 (99,639) (0.08)HUF 226,973,099 EUR 637,323 16/12/2020 (6,845) (0.00)JPY 78,311,075 AUD 1,032,372 16/12/2020 (10,492) (0.01)JPY 310,389,949 EUR 2,522,550 16/12/2020 (49,157) (0.03)USD 7,156,696 AUD 9,951,757 16/12/2020 (187,295) (0.13)USD 7,395,801 CAD 9,729,730 16/12/2020 (127,883) (0.05)USD 2,851,586 CHF 2,584,900 16/12/2020 (9,655) (0.00)USD 17,898,883 CNH 120,480,928 16/12/2020 (415,280) (0.30)USD 472,339 COP 1,719,484,438 16/12/2020 (7,255) (0.00)USD 367,397 CZK 8,486,359 16/12/2020 (20,767) (0.01)USD 10,995,013 EUR 9,378,714 16/12/2020 (259,955) (0.17)USD 6,338,179 GBP 4,866,343 16/12/2020 (170,812) (0.12)USD 587,626 HUF 178,810,995 16/12/2020 (9,512) (0.00)USD 4,094,291 ILS 13,982,981 16/12/2020 (133,679) (0.11)USD 10,607,713 JPY 1,113,672,991 16/12/2020 (77,437) (0.02)USD 2,391,624 MXN 50,550,279 16/12/2020 (122,376) (0.08)USD 4,409,613 NOK 40,912,416 16/12/2020 (238,980) (0.15)USD 2,057,444 NZD 3,097,066 16/12/2020 (124,647) (0.08)USD 1,088,582 PLN 4,141,895 16/12/2020 (22,022) (0.01)USD 2,057,580 SEK 18,209,497 16/12/2020 (89,602) (0.06)USD 3,071,648 SGD 4,142,433 16/12/2020 (25,616) (0.01)USD 3,412,381 THB 105,425,418 16/12/2020 (72,391) (0.05)USD 791,642 TRY 6,440,652 16/12/2020 (28,221) (0.02)CLP 1,030,545,454 USD 1,360,653 17/12/2020 (13,938) (0.00)USD 1,767,842 CLP 1,364,619,532 17/12/2020 (15,441) (0.02)USD 5,640,376 ZAR 92,646,787 17/12/2020 (384,429) (0.26)USD 204,523 CAD 272,000 21/12/2020 (5,816) (0.00)USD 1,433,357 PLN 5,484,757 21/12/2020 (37,410) (0.02)USD 260,519 BRL 1,394,713 05/01/2021 (2,180) (0.00)USD 2,573,103 KRW 2,852,802,042 08/01/2021 (4,500) (0.00)USD 326,900 TRY 2,833,075 11/01/2021 (30,240) (0.02)USD 625,029 TRY 5,036,209 19/01/2021 (7,911) (0.00)USD 13,091,943 EUR 11,071,668 21/01/2021 (209,324) (0.13)TRY 1,287,107 USD 162,894 25/01/2021 (1,501) (0.00)USD 166,138 RUB 12,722,828 25/01/2021 (166) (0.00)USD 306,479 TRY 2,475,587 25/01/2021 (3,941) (0.00)CAD 430,056 NZD 473,109 27/01/2021 (721) (0.00)INR 237,380,510 USD 3,192,644 27/01/2021 (1,978) (0.00)USD 1,127,816 COP 4,130,382,529 29/01/2021 (22,011) (0.01)TWD 43,231,221 USD 1,540,218 05/02/2021 (10,991) (0.01)USD 4,330,912 RUB 332,396,468 08/02/2021 (7,786) (0.01)AUD 1,960,893 NZD 2,082,920 09/02/2021 (19,902) (0.01)PEN 1,140,252 USD 319,577 12/07/2021 (3,736) (0.00)
UNREALISED LOSS ON FORWARD CURRENCY CONTRACTS (4,587,272) (2.82)
Share Class Specific Forward Currency Contracts – 3.41%
CurrencyAmountBought Currency
AmountSold
MaturityDate
UnrealisedGainUSD
% ofShareholders’
Equity
AUD 150,602 USD 107,342 21/12/2020 3,802 0.00GBP 111,896,396 USD 144,187,730 13/01/2021 5,547,856 3.41EUR 112,603 USD 133,179 21/01/2021 2,100 0.00
UNREALISED GAIN ON FORWARD CURRENCY CONTRACTS HELD FOR HEDGING PURPOSES 5,553,758 3.41
Options – 0.06%
Holdings Security Description
UnrealisedGain/(Loss)
USDMarket Value
USD
% ofShareholders’
Equity
Purchased OptionsEUR
5,257,000 Call EUR / Put USD Expires 03/12/2020 Strike 1.19 22,236 37,830 0.025,277,000 Call EUR / Put USD Expires 03/12/2020 Strike 1.19 34,584 46,317 0.032,659,000 Call EUR / Put USD Expires 08/12/2020 Strike 1.19 15,378 21,230 0.012,654,000 Call EUR / Put USD Expires 11/12/2020 Strike 1.20 8,785 16,360 0.01
80,983 121,737 0.07
GBP1,185,000 Call GBP / Put USD Expires 11/12/2020 Strike 1.35 2,901 8,133 0.01
Goldman Sachs Funds—Emerging Markets Total Return Bond PortfolioSchedule of InvestmentsAs at 30 November 2020
The accompanying notes are an integral part of these financial statements.
446

Options – (Continued)
Holdings Security Description
UnrealisedGain/(Loss)
USDMarket Value
USD
% ofShareholders’
Equity
Purchased Options – (Continued)USD
1,547,000 Put USD / Call NOK Expires 10/12/2020 Strike 8.92 17,399 26,583 0.02
TOTAL PURCHASED OPTIONS(cost USD 55,171) 156,453 0.10
Written OptionsAUD
(4,079,000) Put AUD / Call NZD Expires 05/02/2021 Strike 1.06 (32,530) (47,499) (0.03)
NZD(2,267,000) Put NZD / Call CAD Expires 25/01/2021 Strike 0.89 985 (5,481) (0.00)
USD(1,561,000) Call USD / Put RUB Expires 22/01/2021 Strike 82.86 3,264 (6,633) (0.01)
TOTAL WRITTEN OPTIONS(cost USD (31,333)) (59,613) (0.04)
TOTAL OPTIONS(cost USD 23,838) 96,840 0.06
Swap Contracts – (0.02%)Net LocalNotionalAmount Pay Receive Currency Maturity Date
UnrealisedGainUSD
% ofShareholders’
Equity
Interest Rate Swaps61,150,000 Floating (BRL 1 month BRCDI) Fixed 4.120% BRL 03/01/2022 56,420 0.0419,780,000 Floating (EUR 6 month LIBOR) Fixed 0.000% EUR 16/12/2022 34,862 0.021,425,000 Floating (ILS 3 month TELBOR) Fixed 1.405% ILS 18/12/2029 30,439 0.028,730,000 Floating (ILS 3 month TELBOR) Fixed 0.995% ILS 17/06/2030 84,748 0.056,370,000 Floating (ILS 3 month TELBOR) Fixed 0.855% ILS 16/06/2031 17,770 0.015,270,000 Floating (ILS 3 month TELBOR) Fixed 0.862% ILS 16/06/2031 16,488 0.01
630,100,000 Floating (INR 6 month LIBOR) Fixed 3.750% INR 16/09/2022 7,553 0.00280,130,000 Floating (MXN 1 month TIIE) Fixed 4.500% MXN 14/12/2022 10,814 0.0144,600,000 Floating (MXN 1 month TIIE) Fixed 5.100% MXN 10/12/2025 13,460 0.0136,550,000 Floating (MXN 1 month TIIE) Fixed 5.400% MXN 08/12/2027 16,345 0.0129,880,000 Floating (PLN 6 month WIBOR) Fixed 0.345% PLN 16/06/2023 1,864 0.0017,560,000 Floating (PLN 6 month WIBOR) Fixed 0.750% PLN 16/12/2025 29,771 0.021,200,000 Floating (THB 6 month THFX) Fixed 1.250% THB 17/06/2025 292 0.00830,000 Fixed 1.000% Floating (USD 3 month LIBOR) USD 16/12/2030 12,423 0.01
UNREALISED GAIN ON INTEREST RATE SWAPS 333,249 0.21
Credit Default Swaps120,000 Floating (Colombia Government
International Bond)Fixed 1.000% USD 20/06/2024 1,787 0.00
1,580,000 Floating (Abu Dhabi GovernmentInternational Bond)
Fixed 1.000% USD 20/12/2024 12,784 0.01
1,440,000 Floating (Colombia GovernmentInternational Bond)
Fixed 1.000% USD 20/12/2024 17,678 0.01
180,000 Floating (Indonesia GovernmentInternational Bond)
Fixed 1.000% USD 20/12/2025 3,383 0.00
2,050,000 Floating (Markit CDX Emerging Markets34 Version 1 Index)
Fixed 1.000% USD 20/12/2025 47,027 0.03
UNREALISED GAIN ON CREDIT DEFAULT SWAPS 82,659 0.05
TOTAL UNREALISED GAIN ON SWAP CONTRACTS 415,908 0.26
Net LocalNotionalAmount Pay Receive Currency Maturity Date
UnrealisedLossUSD
% ofShareholders’
Equity
Interest Rate Swaps24,750,000 Floating (BRL 1 month BRCDI) Fixed 4.230% BRL 02/01/2023 (24,304) (0.01)18,930,000 Floating (BRL 1 month BRCDI) Fixed 4.930% BRL 02/01/2024 (53,455) (0.03)
5,335,750,000 Floating (CLP 6 month LIBOR) Fixed 1.500% CLP 16/12/2025 (76,346) (0.05)49,950,000 Fixed 2.500% Floating (CNY 3 month LIBOR) CNY 17/03/2023 (8,446) (0.01)
22,915,680,000 Floating (COP 3 month LIBOR) Fixed 2.100% COP 16/12/2022 (6,976) (0.00)8,201,720,000 Fixed 3.400% Floating (COP 3 month LIBOR) COP 16/12/2025 (25,595) (0.02)35,860,000 Floating (CZK 6 month PTIBOR) Fixed 0.620% CZK 16/06/2023 (5,193) (0.00)1,000,000 Fixed 0.000% Floating (EUR 6 month LIBOR) EUR 16/12/2023 (1,693) (0.00)10,230,000 Fixed 0.000% Floating (EUR 6 month LIBOR) EUR 16/12/2025 (43,830) (0.03)
Goldman Sachs Funds—Emerging Markets Total Return Bond PortfolioSchedule of InvestmentsAs at 30 November 2020
The accompanying notes are an integral part of these financial statements.
447

Swap Contracts – (Continued)
Net LocalNotionalAmount Pay Receive Currency Maturity Date
UnrealisedLossUSD
% ofShareholders’
Equity
Interest Rate Swaps – (Continued)1,180,000 Fixed 0.000% Floating (EUR 6 month LIBOR) EUR 16/12/2027 (6,166) (0.00)1,430,000 Fixed 0.000% Floating (EUR 6 month LIBOR) EUR 16/12/2030 (12,456) (0.01)120,000 Fixed 0.250% Floating (EUR 6 month EURIBOR) EUR 16/12/2050 (512) (0.00)
87,320,000 Fixed 0.250% Floating (PLN 3 month WIBOR) PLN 16/12/2021 (10,278) (0.01)214,580,000 Floating (THB 6 month LIBOR) Fixed 0.750% THB 16/12/2025 (11,820) (0.01)116,240,000 Floating (ZAR 3 month JIBAR) Fixed 4.000% ZAR 16/06/2023 (52,519) (0.03)85,070,000 Floating (ZAR 3 month JIBAR) Fixed 5.250% ZAR 17/03/2026 (66,438) (0.04)
UNREALISED LOSS ON INTEREST RATE SWAPS (406,027) (0.25)
Credit Default Swaps3,940,000 Fixed 1.000% Floating (China Government
International Bond)USD 20/12/2022 (43,746) (0.03)
1,000,000 Floating (Brazilian GovernmentInternational Bond)
Fixed 1.000% USD 20/12/2024 (6,036) (0.00)
1,190,000 Fixed 1.000% Floating (Russian Foreign Bond -Eurobond)
USD 20/06/2025 (277) (0.00)
UNREALISED LOSS ON CREDIT DEFAULT SWAPS (50,059) (0.03)
TOTAL UNREALISED LOSS ON SWAP CONTRACTS (456,086) (0.28)
MARKET VALUE OF INVESTMENTS(cost USD 147,258,611)
158,430,195 97.32
OTHER ASSETS AND LIABILITIES 4,365,910 2.68
SHAREHOLDERS’ EQUITY 162,796,105 100.00
TOTAL INVESTMENTSMarket Value
USD
% ofShareholders’
Equity
Total Investments excluding derivatives (cost USD 147,234,773) 152,915,565 93.93Unrealised gain on futures contracts 77,443 0.05Unrealised loss on futures contracts (6,186) (0.01)Unrealised gain on non-deliverable bond forward contracts 73,746 0.05Unrealised gain on forward currency contracts 4,346,479 2.67Unrealised loss on forward currency contracts (4,587,272) (2.82)Unrealised gain on forward currency contracts held for hedging purposes 5,553,758 3.41Market value of purchased options (cost USD 55,171) 156,453 0.10Market value of written options (cost USD (31,333)) (59,613) (0.04)Unrealised gain on swap contracts 415,908 0.26Unrealised loss on swap contracts (456,086) (0.28)Other Assets and Liabilities 4,365,910 2.68
Shareholders’ Equity 162,796,105 100.00
The Futures Commission Merchant was Bank of America N.A.
The counterparties for forward currency contracts were Bank of America N.A., Barclays Bank Plc., BNP Paribas S.A., Citibank N.A., Credit Suisse International, Deutsche Bank AG, HSBCBank Plc., JP Morgan Chase Bank N.A., Merrill Lynch International, Morgan Stanley & Co. International Plc., Royal Bank of Canada, Standard Chartered Bank, State Street Bank & Trustand UBS AG.
The counterparties for options contracts were BNP Paribas S.A., Citibank N.A., JP Morgan Chase Bank N.A., Morgan Stanley & Co. International Plc. and UBS AG.
The counterparties for swap contracts were Bank of America N.A., Deutsche Bank AG, Morgan Stanley, Morgan Stanley & Co. International Plc., Morgan Stanley & Co. LLC and UBS AG.
The maximum individual counterparty exposure as at 30 November 2020 is 2.07% of the NAV.
(a) Interest rates represent either the stated coupon rate, annualised discounted yield on date of purchase for discounted securities, or, for floating rate securities, the current reset ratewhich is based upon interest rates indices.
(b) Maturity dates represent either the stated date on the security, or the next interest reset date for floating rate securities or the prerefunded date for those type of securities.(c) This security has a step up coupon which moves to the second rate at a set date in the future.(d) This security has a step up coupon which moves to the second rate at a set date in the future.(e) Variable and floating coupon rates are those quoted as of 30 November 2020.(f) 144A: This security is issued to qualified institutional investors, pursuant to private placements, and is transferable as stated in rule 144A of the US Securities Act of 1933.(g) A related party to Goldman Sachs Funds.(h) The yield for this fund as at 30 November 2020 was 0.120%.
Goldman Sachs Funds—Emerging Markets Total Return Bond PortfolioSchedule of InvestmentsAs at 30 November 2020
The accompanying notes are an integral part of these financial statements.
448

Holdings Security Description Currency Interest Rate(a) Maturity Date(b)Market Value
USD
% ofShareholders’
Equity
Transferable securities admitted to an official exchange listing
Bonds – 13.02%Austria
215,000 ams AG 144A(c) USD 7.000% 31/07/2025 239,725 0.11
Canada225,000 Cenovus Energy, Inc. USD 5.375% 15/07/2025 248,629 0.1175,000 Suncor Energy, Inc. USD 3.600% 01/12/2024 82,621 0.04
331,250 0.15
Colombia430,000 Colombia Government International Bond USD 3.125% 15/04/2031 452,467 0.21
Egypt200,000 Egypt Government International Bond USD 4.550% 20/11/2023 205,281 0.09
France215,000 Altice France S.A. 144A(c) USD 7.375% 01/05/2026 226,556 0.11200,000 Credit Agricole S.A. USD 4.375% 17/03/2025 224,264 0.10200,000 Credit Agricole S.A. 144A(c)(d) USD 6.875% Perp. 221,788 0.10
672,608 0.31
Indonesia490,000 Perusahaan Penerbit SBSN Indonesia III USD 4.400% 01/03/2028 574,984 0.26
Ireland150,000 AerCap Ireland Capital DAC Via AerCap Global Aviation Trust USD 4.875% 16/01/2024 161,625 0.07200,000 GE Capital International Funding Co. Unlimited Co. USD 3.373% 15/11/2025 219,264 0.10200,000 GE Capital International Funding Co. Unlimited Co. USD 4.418% 15/11/2035 230,710 0.11
611,599 0.28
Japan200,000 Mitsubishi UFJ Financial Group, Inc. USD 3.751% 18/07/2039 240,506 0.11
Luxembourg150,000 DH Europe Finance II SARL USD 2.600% 15/11/2029 165,300 0.08
Mexico200,000 Mexico City Airport Trust USD 4.250% 31/10/2026 199,906 0.09260,000 Mexico Government International Bond USD 3.250% 16/04/2030 276,965 0.13200,000 Mexico Government International Bond USD 2.659% 24/05/2031 200,700 0.0910,000 Petroleos Mexicanos USD 6.875% 16/10/2025 10,433 0.01
688,004 0.32
Netherlands200,000 Lukoil Securities BV USD 3.875% 06/05/2030 216,250 0.1025,000 LYB International Finance BV USD 4.875% 15/03/2044 31,593 0.01
247,843 0.11
Peru30,000 Peruvian Government International Bond USD 2.780% 01/12/2060 29,625 0.0130,000 Peruvian Government International Bond USD 3.230% 28/07/2121 29,640 0.02
59,265 0.03
Switzerland200,000 Credit Suisse AG 144A(c) USD 6.500% 08/08/2023 226,154 0.11290,000 Credit Suisse Group AG 144A(c)(d) USD 5.250% Perp. 308,448 0.14
534,602 0.25
Turkey200,000 Turkiye Vakiflar Bankasi TAO USD 5.250% 05/02/2025 193,625 0.09
Ukraine100,000 Ukraine Government International Bond USD 7.750% 01/09/2024 109,578 0.05
United Kingdom200,000 Barclays Plc.(d) USD 4.610% 15/02/2023 209,306 0.10200,000 HSBC Holdings Plc.(d) USD 3.803% 11/03/2025 217,346 0.10200,000 HSBC Holdings Plc.(d) USD 1.645% 18/04/2026 202,960 0.09200,000 Natwest Group Plc. USD 3.875% 12/09/2023 216,692 0.10200,000 Natwest Group Plc.(d) USD 4.519% 25/06/2024 217,648 0.10200,000 Santander UK Plc. USD 2.875% 18/06/2024 214,594 0.10
1,278,546 0.59
Goldman Sachs Funds—Global Absolute Return PortfolioSchedule of InvestmentsAs at 30 November 2020
The accompanying notes are an integral part of these financial statements.
449

Holdings Security Description Currency Interest Rate(a) Maturity Date(b)Market Value
USD
% ofShareholders’
Equity
Bonds – (Continued)United States
475,000 AbbVie, Inc. USD 3.200% 21/11/2029 538,213 0.25175,000 Air Lease Corp. USD 3.375% 01/07/2025 185,391 0.09150,000 Air Lease Corp. USD 3.750% 01/06/2026 161,550 0.0750,000 Ally Financial, Inc. USD 1.450% 02/10/2023 50,951 0.02100,000 Altria Group, Inc. USD 3.800% 14/02/2024 109,184 0.05100,000 Altria Group, Inc. USD 4.400% 14/02/2026 115,994 0.05100,000 American Campus Communities Operating Partnership LP USD 3.875% 30/01/2031 111,584 0.05150,000 American International Group, Inc. USD 3.900% 01/04/2026 171,433 0.08150,000 American International Group, Inc. USD 3.400% 30/06/2030 170,974 0.0850,000 American International Group, Inc. USD 4.500% 16/07/2044 64,301 0.03125,000 American Tower Corp. USD 5.000% 15/02/2024 141,672 0.07125,000 American Tower Corp. USD 3.375% 15/05/2024 135,712 0.06125,000 American Tower Corp. USD 2.100% 15/06/2030 128,645 0.06200,000 Anheuser-Busch Cos. LLC Via Anheuser-Busch InBev Worldwide, Inc. USD 4.700% 01/02/2036 254,550 0.12375,000 Anheuser-Busch Cos. LLC Via Anheuser-Busch InBev Worldwide, Inc. USD 4.900% 01/02/2046 490,282 0.23200,000 Anheuser-Busch InBev Worldwide, Inc. USD 4.750% 23/01/2029 245,686 0.11225,000 Anheuser-Busch InBev Worldwide, Inc. USD 5.550% 23/01/2049 323,469 0.15108,000 Antero Resources Corp. USD 5.125% 01/12/2022 103,140 0.05675,000 AT&T, Inc. USD 2.300% 01/06/2027 715,068 0.33250,000 AT&T, Inc. USD 2.750% 01/06/2031 265,542 0.12125,000 AT&T, Inc. USD 4.850% 01/03/2039 157,086 0.0775,000 AT&T, Inc. USD 3.500% 01/06/2041 80,814 0.0475,000 AT&T, Inc. USD 5.150% 15/11/2046 97,682 0.0575,000 AutoNation, Inc. USD 4.750% 01/06/2030 90,363 0.0475,000 Bank of America Corp. USD 4.000% 01/04/2024 83,085 0.04400,000 Bank of America Corp. USD 4.200% 26/08/2024 448,100 0.21575,000 Bank of America Corp.—Series L USD 3.950% 21/04/2025 645,581 0.30150,000 BAT Capital Corp. USD 2.259% 25/03/2028 154,620 0.07300,000 Becton Dickinson and Co. USD 3.700% 06/06/2027 344,877 0.1625,000 Becton Dickinson and Co. USD 4.669% 06/06/2047 32,710 0.02175,000 Becton Dickinson and Co. USD 3.794% 20/05/2050 206,883 0.10150,000 Berkshire Hathaway Energy Co. USD 6.125% 01/04/2036 224,157 0.1075,000 Boeing Co. USD 1.875% 15/06/2023 75,610 0.0450,000 Boeing Co. USD 3.250% 01/02/2035 49,365 0.0250,000 Boeing Co. USD 3.375% 15/06/2046 46,560 0.0225,000 Boeing Co. USD 3.850% 01/11/2048 24,805 0.01225,000 Boeing Co. USD 5.805% 01/05/2050 297,209 0.1475,000 BP Capital Markets America, Inc. USD 3.119% 04/05/2026 83,007 0.0475,000 Burlington Northern Santa Fe LLC USD 5.750% 01/05/2040 111,815 0.05280,000 CenturyLink, Inc.—Series U USD 7.650% 15/03/2042 332,500 0.15550,000 Cigna Corp. USD 4.125% 15/11/2025 632,296 0.29125,000 Cigna Corp. USD 2.400% 15/03/2030 132,895 0.06100,000 CIT Group, Inc. USD 4.750% 16/02/2024 109,125 0.05450,000 Citigroup, Inc. USD 3.875% 26/03/2025 501,817 0.23100,000 Citigroup, Inc. USD 4.750% 18/05/2046 134,229 0.06300,000 Constellation Brands, Inc. USD 4.400% 15/11/2025 349,110 0.16125,000 Constellation Brands, Inc. USD 3.700% 06/12/2026 142,982 0.0775,000 Crown Castle International Corp. USD 4.000% 15/11/2049 88,063 0.04325,000 CVS Health Corp. USD 3.875% 20/07/2025 367,260 0.1750,000 CVS Health Corp. USD 5.125% 20/07/2045 67,231 0.03100,000 CVS Health Corp. USD 4.250% 01/04/2050 125,703 0.06250,000 Devon Energy Corp. USD 5.850% 15/12/2025 287,790 0.13100,000 Dominion Energy, Inc. USD 3.900% 01/10/2025 113,613 0.05100,000 DuPont de Nemours, Inc. USD 4.493% 15/11/2025 116,718 0.0575,000 DuPont de Nemours, Inc. USD 4.725% 15/11/2028 91,639 0.04125,000 Energy Transfer Operating LP USD 5.200% 01/02/2022 129,813 0.06125,000 Energy Transfer Operating LP USD 2.900% 15/05/2025 129,494 0.06200,000 Energy Transfer Operating LP USD 4.200% 15/04/2027 215,604 0.10125,000 Energy Transfer Operating LP USD 5.150% 15/03/2045 129,645 0.06160,000 EQT Corp. USD 7.875% 01/02/2025 184,000 0.0975,000 FedEx Corp. USD 5.250% 15/05/2050 106,678 0.05125,000 First Horizon National Corp. USD 4.000% 26/05/2025 138,262 0.06125,000 FirstEnergy Corp. USD 2.650% 01/03/2030 123,814 0.0650,000 Florida Power & Light Co. USD 3.950% 01/03/2048 65,320 0.03325,000 Ford Motor Credit Co., LLC USD 5.125% 16/06/2025 351,461 0.1675,000 General Electric Co. USD 5.875% 14/01/2038 96,749 0.04100,000 General Electric Co. USD 4.350% 01/05/2050 117,278 0.05200,000 General Motors Co. USD 5.400% 02/10/2023 224,204 0.1025,000 General Motors Co. USD 5.200% 01/04/2045 30,339 0.01125,000 General Motors Financial Co., Inc. USD 5.650% 17/01/2029 154,780 0.07170,000 Genesis Energy LP Via Genesis Energy Finance Corp. USD 6.000% 15/05/2023 166,175 0.08
Goldman Sachs Funds—Global Absolute Return PortfolioSchedule of InvestmentsAs at 30 November 2020
The accompanying notes are an integral part of these financial statements.
450

Holdings Security Description Currency Interest Rate(a) Maturity Date(b)Market Value
USD
% ofShareholders’
Equity
Bonds – (Continued)United States – (Continued)
100,000 Global Payments, Inc. USD 2.650% 15/02/2025 107,060 0.0555,000 HB Fuller Co. USD 4.250% 15/10/2028 56,788 0.0325,000 Healthcare Realty Trust, Inc. USD 2.050% 15/03/2031 24,993 0.01100,000 Hewlett Packard Enterprise Co. USD 4.450% 02/10/2023 110,196 0.05550,000 Hewlett Packard Enterprise Co. USD 4.900% 15/10/2025 639,622 0.30210,000 Hillenbrand, Inc. USD 5.750% 15/06/2025 226,800 0.1050,000 Home Depot, Inc. USD 4.500% 06/12/2048 69,686 0.03125,000 Huntsman International LLC USD 4.500% 01/05/2029 143,819 0.07125,000 Intercontinental Exchange, Inc. USD 2.650% 15/09/2040 129,723 0.06325,000 JPMorgan Chase & Co. USD 3.875% 10/09/2024 362,404 0.17200,000 JPMorgan Chase & Co. USD 3.625% 01/12/2027 226,532 0.1050,000 Kinder Morgan, Inc. USD 5.550% 01/06/2045 63,304 0.0350,000 Lowe’s Cos., Inc. USD 1.700% 15/10/2030 50,369 0.02125,000 Lowe’s Cos., Inc. USD 3.000% 15/10/2050 134,332 0.06125,000 Marsh & McLennan Cos., Inc. USD 4.375% 15/03/2029 152,985 0.0795,000 MGM Resorts International USD 4.750% 15/10/2028 99,275 0.05125,000 Morgan Stanley USD 4.100% 22/05/2023 135,504 0.06475,000 Morgan Stanley USD 3.950% 23/04/2027 546,331 0.25100,000 MPLX LP USD 2.650% 15/08/2030 101,781 0.0550,000 MPLX LP USD 4.700% 15/04/2048 56,075 0.0375,000 MPT Operating Partnership LP Via MPT Finance Corp. USD 4.625% 01/08/2029 79,965 0.04150,000 Newfield Exploration Co. USD 5.625% 01/07/2024 160,069 0.0750,000 NiSource, Inc. USD 3.950% 30/03/2048 61,567 0.0375,000 Occidental Petroleum Corp. USD 6.625% 01/09/2030 78,656 0.0450,000 Oracle Corp. USD 4.000% 15/11/2047 61,382 0.0375,000 Oracle Corp. USD 3.600% 01/04/2050 87,278 0.04125,000 Pacific Gas & Electric Co. USD 2.500% 01/02/2031 125,833 0.0625,000 Pacific Gas & Electric Co. USD 3.500% 01/08/2050 25,181 0.01200,000 PayPal Holdings, Inc. USD 2.850% 01/10/2029 222,156 0.10100,000 PerkinElmer, Inc. USD 3.300% 15/09/2029 112,016 0.0525,000 Phillips 66 USD 1.300% 15/02/2026 25,181 0.01175,000 Plains All American Pipeline LP Via PAA Finance Corp. USD 3.850% 15/10/2023 185,278 0.09100,000 Plains All American Pipeline LP Via PAA Finance Corp. USD 3.800% 15/09/2030 103,951 0.0575,000 Progress Energy, Inc. USD 7.000% 30/10/2031 106,787 0.05125,000 Public Service Electric and Gas Co. USD 3.950% 01/05/2042 155,497 0.0775,000 Republic Services, Inc. USD 1.750% 15/02/2032 75,518 0.04100,000 Santander Holdings USA, Inc. USD 4.500% 17/07/2025 111,911 0.05100,000 Sempra Energy USD 3.800% 01/02/2038 116,813 0.05100,000 ServiceNow, Inc. USD 1.400% 01/09/2030 97,407 0.0525,000 Sherwin-Williams Co. USD 3.125% 01/06/2024 27,054 0.0125,000 Sherwin-Williams Co. USD 3.300% 15/05/2050 28,155 0.01150,000 Southern Co. USD 3.250% 01/07/2026 167,992 0.08125,000 Spirit Realty LP USD 4.000% 15/07/2029 139,124 0.06175,000 Stryker Corp. USD 1.950% 15/06/2030 180,784 0.0875,000 Thermo Fisher Scientific, Inc. USD 4.497% 25/03/2030 94,214 0.04305,000 TransDigm, Inc. USD 5.500% 15/11/2027 315,675 0.15205,000 TRI Pointe Group, Inc. USD 5.700% 15/06/2028 232,675 0.11100,000 Valero Energy Corp. USD 2.700% 15/04/2023 103,816 0.0525,000 VEREIT Operating Partnership LP USD 2.850% 15/12/2032 25,490 0.018,000 Verizon Communications, Inc. USD 5.012% 15/04/2049 11,357 0.01
125,000 Walt Disney Co. USD 4.700% 23/03/2050 174,092 0.0825,000 Waste Management, Inc. USD 2.500% 15/11/2050 25,276 0.01250,000 Wells Fargo & Co. USD 4.100% 03/06/2026 287,467 0.13300,000 Wells Fargo & Co. USD 4.300% 22/07/2027 349,833 0.1675,000 Wells Fargo & Co. USD 3.900% 01/05/2045 93,472 0.0450,000 WP Carey, Inc. USD 2.400% 01/02/2031 51,119 0.0275,000 Zimmer Biomet Holdings, Inc. USD 3.550% 20/03/2030 85,352 0.04125,000 Zoetis, Inc. USD 2.000% 15/05/2030 130,032 0.06
21,647,261 9.98
TOTAL BONDS(cost USD 27,631,619) 28,252,444 13.02
Holdings Security DescriptionMarket Value
USD
% ofShareholders’
Equity
Common Stocks – 18.32%Argentina
378 MercadoLibre, Inc. 579,096 0.27
Goldman Sachs Funds—Global Absolute Return PortfolioSchedule of InvestmentsAs at 30 November 2020
The accompanying notes are an integral part of these financial statements.
451

Holdings Security DescriptionMarket Value
USD
% ofShareholders’
Equity
Common Stocks – (Continued)Australia
10,145 Goodman Group 140,272 0.0752,288 Ingenia Communities Group 182,410 0.0828,357 Mirvac Group 54,216 0.035,968 NEXTDC Ltd. 49,574 0.02
426,472 0.20
Belgium2,817 Warehouses De Pauw CVA 96,305 0.04
Brazil28,700 Atacadao S.A. 106,799 0.058,300 B3 S.A. - Brasil Bolsa Balcao 88,686 0.0446,232 Banco Bradesco S.A.—Preferred 214,897 0.102,895 Pagseguro Digital Ltd. �A� 136,615 0.06
546,997 0.25
Canada1,982 Allied Properties Real Estate Investment Trust 62,340 0.032,304 Canadian Apartment Properties REIT 90,817 0.044,548 Chartwell Retirement Residences 40,088 0.028,184 Summit Industrial Income REIT 83,779 0.04
277,024 0.13
China4,080 Alibaba Group Holding Ltd.—ADR(e) 1,084,668 0.5014,500 Anhui Conch Cement Co., Ltd. �H� 92,888 0.0410,000 ANTA Sports Products Ltd. 136,168 0.0665,000 China Merchants Bank Co., Ltd. �H� 411,835 0.196,100 Contemporary Amperex Technology Co., Ltd. �A� 226,003 0.101,024 GDS Holdings Ltd.—ADR(e) 92,733 0.046,700 Gree Electric Appliances, Inc.�A� 68,072 0.0316,400 Hangzhou Robam Appliances Co., Ltd. �A� 99,840 0.052,000 Kweichow Moutai Co., Ltd. �A� 522,274 0.2410,300 Meituan Dianping �B� 386,005 0.189,531 Minth Group Ltd. 47,402 0.02698 New Oriental Education & Technology Group, Inc.—ADR(e) 117,578 0.06
34,500 Ping An Insurance Group Co. of China Ltd. �H� 406,674 0.197,000 SF Holding Co., Ltd. �A� 85,326 0.042,000 Silergy Corp. 155,934 0.079,400 Sunny Optical Technology Group Co., Ltd. 185,057 0.092,516 TAL Education Group—ADR(e) 179,869 0.0818,000 Tencent Holdings Ltd. 1,313,951 0.6149,000 Topsports International Holdings Ltd. 144A(c) 73,031 0.039,724 WuXi AppTec Co., Ltd. �H� 144A(c) 145,682 0.0776,000 Xinyi Solar Holdings Ltd. 138,886 0.061,913 XPeng, Inc.—ADR(e) 115,679 0.0527,112 Zhejiang Sanhua Intelligent Controls Co., Ltd. �A� 96,869 0.05
6,182,424 2.85
Czech Republic37,723 Moneta Money Bank AS 144A(c) 113,506 0.05
Finland2,077 Neste OYJ 140,718 0.06
France1,049 Gecina S.A. 161,066 0.073,322 Klepierre S.A. 75,514 0.031,831 Safran S.A. 270,813 0.13
507,393 0.23
Germany7,081 alstria office REIT-AG 116,538 0.051,175 Deutsche Wohnen S.E. 58,986 0.031,777 Instone Real Estate Group AG 144A(c) 45,936 0.025,550 Vonovia S.E. 382,274 0.18
603,734 0.28
Greece10,430 JUMBO S.A. 183,916 0.08
Goldman Sachs Funds—Global Absolute Return PortfolioSchedule of InvestmentsAs at 30 November 2020
The accompanying notes are an integral part of these financial statements.
452

Holdings Security DescriptionMarket Value
USD
% ofShareholders’
Equity
Common Stocks – (Continued)Hong Kong
27,200 AIA Group Ltd. 298,380 0.1438,000 Alibaba Health Information Technology Ltd. 111,950 0.0518,000 China Mengniu Dairy Co., Ltd. 91,143 0.0419,000 CK Asset Holdings Ltd. 104,119 0.055,133 Hong Kong Exchanges & Clearing Ltd. 255,452 0.1223,500 Link REIT 206,212 0.10194,000 Shangri-La Asia Ltd. 177,321 0.08106,000 Sino Biopharmaceutical Ltd. 106,756 0.0545,400 Swire Properties Ltd. 138,692 0.069,000 Techtronic Industries Co., Ltd. 115,656 0.05
1,605,681 0.74
India2,982 Avenue Supermarts Ltd. 92,178 0.0415,426 Bharti Airtel Ltd. 96,439 0.043,872 Divi’s Laboratories Ltd. 188,199 0.099,028 ICICI Lombard General Insurance Co., Ltd. 144A(c) 176,861 0.083,998 Info Edge India Ltd. 232,379 0.1115,771 Infosys Ltd. 235,038 0.115,185 Infosys Ltd.—ADR(e) 77,853 0.038,820 Kotak Mahindra Bank Ltd. 226,746 0.102,881 Larsen & Toubro Infotech Ltd. 144A(c) 124,456 0.062,000 Maruti Suzuki India Ltd. 189,547 0.098,819 SBI Life Insurance Co., Ltd. 144A(c) 100,752 0.0511,626 Tata Consumer Products Ltd. 84,413 0.04
1,824,861 0.84
Indonesia99,500 Bank Central Asia Tbk PT 218,597 0.1090,500 Semen Indonesia Persero Tbk PT 74,926 0.04
293,523 0.14
Ireland1,700 Accenture Plc. �A� 423,062 0.1912,365 Dalata Hotel Group Plc. 55,473 0.03
478,535 0.22
Italy19,997 Davide Campari-Milano NV 233,397 0.11
Japan30 Comforia Residential REIT, Inc. 83,317 0.0492 ESCON Japan Reit Investment Corp. 99,789 0.05
3,000 Hoya Corp. 401,108 0.19600 Keyence Corp. 307,520 0.14
2,500 Kyoritsu Maintenance Co., Ltd. 87,538 0.0412,800 Mitsubishi Estate Co., Ltd. 222,413 0.10
34 Mitsui Fudosan Logistics Park, Inc. 161,912 0.073,400 Nidec Corp. 435,098 0.2023 Nippon Prologis REIT, Inc. 72,251 0.0374 Sankei Real Estate, Inc. 69,493 0.03
4,400 Sumitomo Realty & Development Co., Ltd. 144,211 0.0798 United Urban Investment Corp. 111,164 0.05
2,195,814 1.01
Mexico20,606 Arca Continental SAB de CV 100,067 0.0553,762 Kimberly-Clark de Mexico SAB de CV �A� 87,160 0.0445,100 Wal-Mart de Mexico SAB de CV 117,481 0.05
304,708 0.14
Netherlands1,685 Koninklijke DSM NV 277,820 0.13
Norway2,781 Entra ASA 144A(c) 56,147 0.03
Peru5,067 BBVA Banco Continental S.A. Co. 3,233 0.00
Goldman Sachs Funds—Global Absolute Return PortfolioSchedule of InvestmentsAs at 30 November 2020
The accompanying notes are an integral part of these financial statements.
453

Holdings Security DescriptionMarket Value
USD
% ofShareholders’
Equity
Common Stocks – (Continued)Peru – (Continued)
341 Credicorp Ltd. 52,476 0.023,214 Intercorp Financial Services, Inc. 97,623 0.05
153,332 0.07
Philippines15,390 Jollibee Foods Corp. 60,444 0.03
Poland2,165 Dino Polska S.A. 144A(c) 146,739 0.0716,618 Powszechna Kasa Oszczednosci Bank Polski S.A. 118,068 0.05
264,807 0.12
Russia2,011 LUKOIL PJSC 133,503 0.0626,290 Moscow Exchange MICEX-RTS PJSC 52,811 0.0358,360 Sberbank of Russia PJSC 191,660 0.094,100 Yandex NV �A� 285,729 0.13
663,703 0.31
Singapore21,101 CapitaLand Ltd. 49,373 0.0255,700 Keppel DC REIT 117,114 0.0660,200 Mapletree Logistics Trust 88,638 0.04836 Sea Ltd.—ADR(e) 149,644 0.07
404,769 0.19
South Africa3,539 Bid Corp., Ltd. 64,330 0.037,905 Clicks Group Ltd. 121,031 0.055,219 Santam Ltd. 85,259 0.04
270,620 0.12
South Korea3,045 Hankook Tire & Technology Co., Ltd. 90,150 0.041,724 LG Electronics, Inc. 133,511 0.06842 NAVER Corp. 211,638 0.10320 NCSoft Corp. 234,476 0.11
1,058 Orion Corp. 113,527 0.05336 Pearl Abyss Corp. 62,969 0.03678 Samsung Electro-Mechanics Co., Ltd. 95,886 0.04
17,148 Samsung Electronics Co., Ltd. 1,036,229 0.483,112 SK Hynix, Inc. 274,952 0.13
2,253,338 1.04
Spain101,367 Banco Bilbao Vizcaya Argentaria S.A. 481,759 0.221,069 Cellnex Telecom S.A. 144A(c) 67,424 0.038,276 Merlin Properties Socimi S.A. 78,427 0.04
627,610 0.29
Sweden6,081 Castellum AB 153,330 0.073,142 Hexagon AB �B� 264,154 0.12
417,484 0.19
Switzerland27,946 UBS Group AG 402,541 0.19
Taiwan27,440 Chailease Holding Co., Ltd. 150,519 0.071,000 Largan Precision Co., Ltd. 113,330 0.054,000 Nien Made Enterprise Co., Ltd. 47,288 0.0275,000 Taiwan Semiconductor Manufacturing Co., Ltd. 1,277,349 0.594,106 Taiwan Semiconductor Manufacturing Co., Ltd.—ADR(e) 400,212 0.1910,000 Win Semiconductors Corp. 117,546 0.05
2,106,244 0.97
Thailand62,000 Airports of Thailand PCL 130,999 0.06
Goldman Sachs Funds—Global Absolute Return PortfolioSchedule of InvestmentsAs at 30 November 2020
The accompanying notes are an integral part of these financial statements.
454

Holdings Security DescriptionMarket Value
USD
% ofShareholders’
Equity
Common Stocks – (Continued)Turkey
53,981 Sok Marketler Ticaret AS 86,952 0.04
United Kingdom3,507 AstraZeneca Plc. 370,503 0.175,029 Big Yellow Group Plc. 76,063 0.0327,427 Capital & Counties Properties Plc. 49,809 0.022,009 Derwent London Plc. 82,963 0.043,955 Ferguson Plc. 445,547 0.215,945 InterContinental Hotels Group Plc. 372,946 0.173,607 Reckitt Benckiser Group Plc. 319,229 0.1539,619 Rentokil Initial Plc. 264,542 0.1214,153 Segro Plc. 172,045 0.0859,641 Tritax EuroBox Plc. 144A(c) 78,697 0.048,383 UNITE Group Plc. 111,826 0.05
2,344,170 1.08
United States1,200 Alexandria Real Estate Equities, Inc. 195,168 0.09419 Alphabet, Inc. �A� 740,323 0.34
2,072 American Tower Corp. 481,636 0.222,018 Americold Realty Trust 68,693 0.03933 AvalonBay Communities, Inc. 156,007 0.07
3,340 Ball Corp. 323,011 0.15592 Boston Properties, Inc. 60,337 0.03
15,489 Boston Scientific Corp. 514,545 0.241,449 Burlington Stores, Inc. 319,186 0.151,982 Camden Property Trust 194,930 0.097,239 Cheniere Energy, Inc. 426,956 0.206,090 Columbia Property Trust, Inc. 86,113 0.04833 CoreSite Realty Corp. 104,258 0.05
2,502 CubeSmart 79,539 0.043,024 Cushman & Wakefield Plc. 46,237 0.022,235 CyrusOne, Inc. 154,126 0.07898 Digital Realty Trust, Inc. 121,670 0.06
4,359 Duke Realty Corp. 167,516 0.08992 EastGroup Properties, Inc. 138,910 0.06
13,815 Elanco Animal Health, Inc. 431,719 0.20114 Equinix, Inc. 80,466 0.04
2,000 Equity LifeStyle Properties, Inc. 117,300 0.051,729 Equity Residential 101,665 0.05765 Essex Property Trust, Inc. 190,110 0.09
1,108 Extra Space Storage, Inc. 122,057 0.06724 Federal Realty Investment Trust 63,632 0.03
3,660 Fidelity National Information Services, Inc. 538,935 0.252,309 Healthcare Realty Trust, Inc. 69,616 0.034,981 Healthpeak Properties, Inc. 148,683 0.071,821 Honeywell International, Inc. 374,999 0.177,227 Host Hotels & Resorts, Inc. 104,141 0.053,469 Hudson Pacific Properties, Inc. 91,998 0.041,432 Intuit, Inc. 507,343 0.236,096 Invitation Homes, Inc. 175,382 0.081,192 Kilroy Realty Corp. 74,065 0.03661 Life Storage, Inc. 71,368 0.03
3,553 Marsh & McLennan Cos., Inc. 405,113 0.191,618 Martin Marietta Materials, Inc. 430,598 0.2031,000 Nexteer Automotive Group Ltd. 32,966 0.023,462 NIKE, Inc. �B� 463,908 0.214,206 Northern Trust Corp. 402,472 0.193,349 Pebblebrook Hotel Trust 64,602 0.034,273 Procter & Gamble Co. 588,648 0.274,445 Prologis, Inc. 447,123 0.21236 Public Storage 52,118 0.02
1,455 Realty Income Corp. 89,090 0.041,581 Regency Centers Corp. 73,026 0.035,671 RLJ Lodging Trust 71,455 0.031,165 Ryman Hospitality Properties, Inc. 75,084 0.03789 S&P Global, Inc. 275,448 0.13278 SBA Communications Corp. 79,772 0.04
3,054 Simon Property Group, Inc. 261,483 0.12928 Sun Communities, Inc. 128,732 0.06
1,136 Terreno Realty Corp. 65,979 0.03
Goldman Sachs Funds—Global Absolute Return PortfolioSchedule of InvestmentsAs at 30 November 2020
The accompanying notes are an integral part of these financial statements.
455
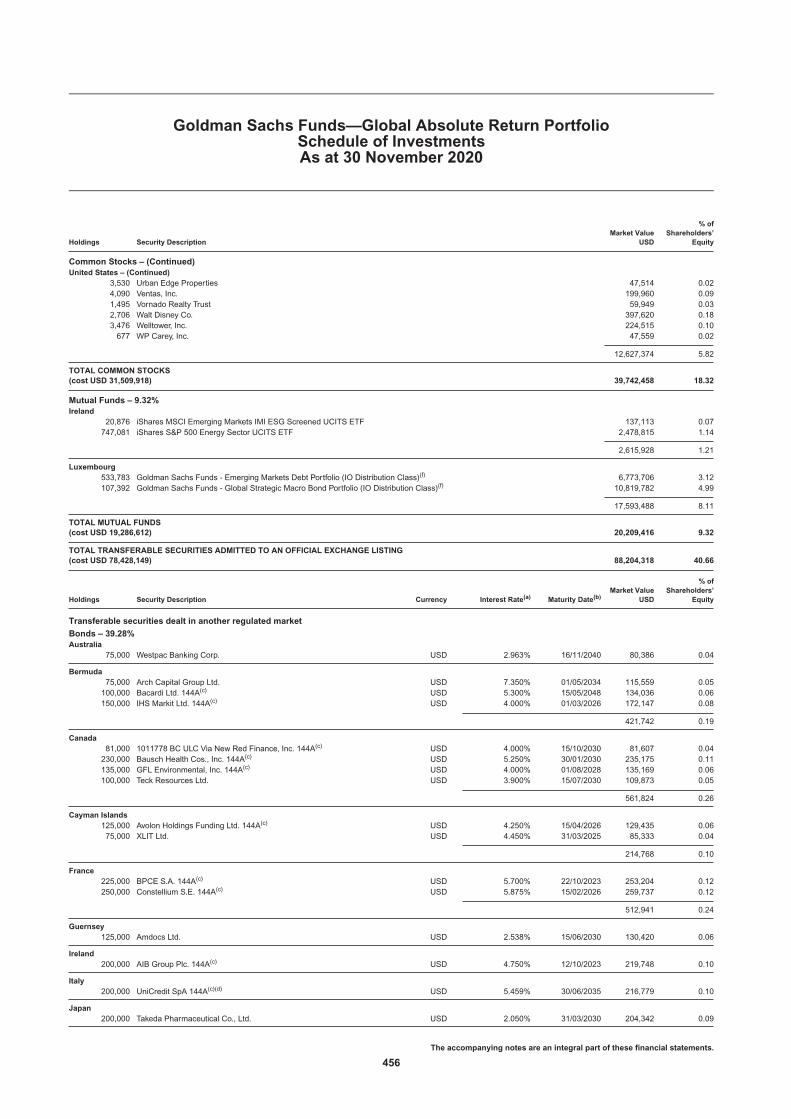
Holdings Security DescriptionMarket Value
USD
% ofShareholders’
Equity
Common Stocks – (Continued)United States – (Continued)
3,530 Urban Edge Properties 47,514 0.024,090 Ventas, Inc. 199,960 0.091,495 Vornado Realty Trust 59,949 0.032,706 Walt Disney Co. 397,620 0.183,476 Welltower, Inc. 224,515 0.10677 WP Carey, Inc. 47,559 0.02
12,627,374 5.82
TOTAL COMMON STOCKS(cost USD 31,509,918) 39,742,458 18.32
Mutual Funds – 9.32%Ireland
20,876 iShares MSCI Emerging Markets IMI ESG Screened UCITS ETF 137,113 0.07747,081 iShares S&P 500 Energy Sector UCITS ETF 2,478,815 1.14
2,615,928 1.21
Luxembourg533,783 Goldman Sachs Funds - Emerging Markets Debt Portfolio (IO Distribution Class)(f) 6,773,706 3.12107,392 Goldman Sachs Funds - Global Strategic Macro Bond Portfolio (IO Distribution Class)(f) 10,819,782 4.99
17,593,488 8.11
TOTAL MUTUAL FUNDS(cost USD 19,286,612) 20,209,416 9.32
TOTAL TRANSFERABLE SECURITIES ADMITTED TO AN OFFICIAL EXCHANGE LISTING(cost USD 78,428,149) 88,204,318 40.66
Holdings Security Description Currency Interest Rate(a) Maturity Date(b)Market Value
USD
% ofShareholders’
Equity
Transferable securities dealt in another regulated market
Bonds – 39.28%Australia
75,000 Westpac Banking Corp. USD 2.963% 16/11/2040 80,386 0.04
Bermuda75,000 Arch Capital Group Ltd. USD 7.350% 01/05/2034 115,559 0.05100,000 Bacardi Ltd. 144A(c) USD 5.300% 15/05/2048 134,036 0.06150,000 IHS Markit Ltd. 144A(c) USD 4.000% 01/03/2026 172,147 0.08
421,742 0.19
Canada81,000 1011778 BC ULC Via New Red Finance, Inc. 144A(c) USD 4.000% 15/10/2030 81,607 0.04230,000 Bausch Health Cos., Inc. 144A(c) USD 5.250% 30/01/2030 235,175 0.11135,000 GFL Environmental, Inc. 144A(c) USD 4.000% 01/08/2028 135,169 0.06100,000 Teck Resources Ltd. USD 3.900% 15/07/2030 109,873 0.05
561,824 0.26
Cayman Islands125,000 Avolon Holdings Funding Ltd. 144A(c) USD 4.250% 15/04/2026 129,435 0.0675,000 XLIT Ltd. USD 4.450% 31/03/2025 85,333 0.04
214,768 0.10
France225,000 BPCE S.A. 144A(c) USD 5.700% 22/10/2023 253,204 0.12250,000 Constellium S.E. 144A(c) USD 5.875% 15/02/2026 259,737 0.12
512,941 0.24
Guernsey125,000 Amdocs Ltd. USD 2.538% 15/06/2030 130,420 0.06
Ireland200,000 AIB Group Plc. 144A(c) USD 4.750% 12/10/2023 219,748 0.10
Italy200,000 UniCredit SpA 144A(c)(d) USD 5.459% 30/06/2035 216,779 0.10
Japan200,000 Takeda Pharmaceutical Co., Ltd. USD 2.050% 31/03/2030 204,342 0.09
Goldman Sachs Funds—Global Absolute Return PortfolioSchedule of InvestmentsAs at 30 November 2020
The accompanying notes are an integral part of these financial statements.
456

Holdings Security Description Currency Interest Rate(a) Maturity Date(b)Market Value
USD
% ofShareholders’
Equity
Bonds – (Continued)Netherlands
200,000 ING Groep NV 144A(c)(d) USD 1.400% 01/07/2026 202,764 0.09
Supranationals550,000 Broadcom Corp. Via Broadcom Cayman Finance Ltd. USD 3.875% 15/01/2027 616,649 0.29100,000 NXP BV Via NXP Funding LLC Via NXP USA, Inc. 144A(c) USD 3.400% 01/05/2030 112,915 0.05
729,564 0.34
Switzerland250,000 Credit Suisse Group AG 144A(c) USD 4.282% 09/01/2028 288,268 0.13250,000 Credit Suisse Group AG 144A(c)(d) USD 4.194% 01/04/2031 294,657 0.14
582,925 0.27
United States275,000 AbbVie, Inc. USD 4.050% 21/11/2039 333,699 0.15400,000 AbbVie, Inc. USD 4.250% 21/11/2049 504,964 0.23215,000 AdaptHealth LLC 144A(c) USD 6.125% 01/08/2028 232,200 0.11100,000 Allison Transmission, Inc. 144A(c) USD 3.750% 30/01/2031 100,625 0.0575,000 Amazon.com, Inc. USD 4.950% 05/12/2044 110,578 0.05100,000 American Tower Corp. USD 4.000% 01/06/2025 112,646 0.0575,000 Amgen, Inc. USD 4.400% 01/05/2045 95,221 0.04335,000 ANGI Group LLC 144A(c) USD 3.875% 15/08/2028 333,744 0.15125,000 Apple, Inc. USD 3.850% 04/05/2043 160,775 0.07215,000 Aramark Services, Inc. 144A(c) USD 6.375% 01/05/2025 230,050 0.11175,000 Bank of America Corp.(d) USD 3.970% 05/03/2029 203,730 0.09100,000 Bank of America Corp.(d) USD 4.271% 23/07/2029 119,101 0.06225,000 Berkshire Hathaway Energy Co. 144A(c) USD 3.700% 15/07/2030 267,073 0.12230,000 Boyd Gaming Corp. USD 4.750% 01/12/2027 233,796 0.11150,000 Broadcom, Inc. USD 3.625% 15/10/2024 164,335 0.08150,000 Broadcom, Inc. USD 4.700% 15/04/2025 171,640 0.08175,000 Broadcom, Inc. USD 4.250% 15/04/2026 199,439 0.09225,000 Buckeye Partners LP 144A(c) USD 4.500% 01/03/2028 225,000 0.10275,000 Burlington Coat Factory Warehouse Corp. 144A(c) USD 6.250% 15/04/2025 295,625 0.14220,000 BY Crown Parent LLC Via BY Bond Finance, Inc. 144A(c) USD 4.250% 31/01/2026 227,150 0.11250,000 Carrier Global Corp. 144A(c) USD 2.493% 15/02/2027 266,445 0.12375,000 Carrier Global Corp. 144A(c) USD 2.722% 15/02/2030 399,870 0.19250,000 Charter Communications Operating LLC Via Charter Communications
Operating Capital USD 4.908% 23/07/2025 289,170 0.13250,000 Charter Communications Operating LLC Via Charter Communications
Operating Capital USD 3.750% 15/02/2028 280,440 0.1325,000 Charter Communications Operating LLC Via Charter Communications
Operating Capital USD 6.484% 23/10/2045 35,436 0.0275,000 Citigroup, Inc.(d) USD 2.976% 05/11/2030 82,054 0.04100,000 Citrix Systems, Inc. USD 3.300% 01/03/2030 107,481 0.05125,000 Comcast Corp. USD 4.700% 15/10/2048 176,932 0.0875,000 Comcast Corp. USD 3.999% 01/11/2049 95,988 0.04215,000 CommScope, Inc. 144A(c) USD 7.125% 01/07/2028 229,512 0.11220,000 Core & Main Holdings LP 144A(c) USD 8.625% 15/09/2024 225,775 0.10100,000 CoStar Group, Inc. 144A(c) USD 2.800% 15/07/2030 104,952 0.0550,000 CSX Corp. USD 4.750% 15/11/2048 69,422 0.03400,000 Dell International LLC Via EMC Corp. 144A(c) USD 5.450% 15/06/2023 442,488 0.20350,000 Dell International LLC Via EMC Corp. 144A(c) USD 6.020% 15/06/2026 424,886 0.2025,000 Dell International LLC Via EMC Corp. 144A(c) USD 4.900% 01/10/2026 29,226 0.0125,000 Dell International LLC Via EMC Corp. 144A(c) USD 5.300% 01/10/2029 30,193 0.0125,000 Dell International LLC Via EMC Corp. 144A(c) USD 6.200% 15/07/2030 31,702 0.02125,000 Diamondback Energy, Inc. USD 4.750% 31/05/2025 139,338 0.06100,000 Diamondback Energy, Inc. USD 3.500% 01/12/2029 104,928 0.05280,000 DISH DBS Corp. USD 7.375% 01/07/2028 306,600 0.14100,000 Dollar Tree, Inc. USD 4.000% 15/05/2025 112,885 0.0550,000 Duquesne Light Holdings, Inc. 144A(c) USD 2.532% 01/10/2030 51,494 0.02350,000 Enterprise Products Operating LLC(d) USD 3.003% 01/06/2067 289,919 0.13150,000 Expedia Group, Inc. USD 3.250% 15/02/2030 152,043 0.07200,000 Expedia Group, Inc. 144A(c) USD 3.600% 15/12/2023 209,812 0.10200,000 Federal Farm Credit Banks Funding Corp.(d) USD 0.180% 16/12/2020 200,000 0.09200,000 Federal Farm Credit Banks Funding Corp.(d) USD 0.096% 13/01/2021 200,002 0.09300,000 Federal Farm Credit Banks Funding Corp.(d) USD 0.275% 26/02/2021 300,141 0.14200,000 Federal Farm Credit Banks Funding Corp.(d) USD 0.227% 09/09/2021 200,246 0.09200,000 Federal Farm Credit Banks Funding Corp.(d) USD 0.231% 13/09/2021 200,232 0.09600,000 Federal Farm Credit Banks Funding Corp.(d) USD 0.171% 15/09/2021 600,414 0.28400,000 Federal Farm Credit Banks Funding Corp.(d) USD 0.280% 29/11/2021 400,692 0.19400,000 Federal Farm Credit Banks Funding Corp.(d) USD 0.290% 13/12/2021 400,812 0.19200,000 Federal Farm Credit Banks Funding Corp.(d) USD 0.290% 13/12/2021 200,370 0.09
Goldman Sachs Funds—Global Absolute Return PortfolioSchedule of InvestmentsAs at 30 November 2020
The accompanying notes are an integral part of these financial statements.
457

Holdings Security Description Currency Interest Rate(a) Maturity Date(b)Market Value
USD
% ofShareholders’
Equity
Bonds – (Continued)United States – (Continued)
100,000 Federal Farm Credit Banks Funding Corp.(d) USD 0.210% 11/02/2022 100,095 0.05200,000 Federal Farm Credit Banks Funding Corp.(d) USD 0.195% 14/02/2022 200,168 0.09
5,700,000 Federal Farm Credit Banks Funding Corp.(d) USD 0.231% 18/04/2022 5,712,654 2.632,800,000 Federal Home Loan Bank Discount Notes USD 0.057% 02/12/2020 2,799,996 1.292,500,000 Federal Home Loan Bank Discount Notes USD 0.064% 09/12/2020 2,499,972 1.156,500,000 Federal Home Loan Bank Discount Notes USD 0.053% 30/12/2020 6,499,738 3.005,400,000 Federal Home Loan Bank Discount Notes USD 0.055% 04/01/2021 5,399,643 2.494,400,000 Federal Home Loan Bank Discount Notes USD 0.054% 06/01/2021 4,399,692 2.032,500,000 Federal Home Loan Bank Discount Notes USD 0.056% 13/01/2021 2,499,791 1.152,800,000 Federal Home Loan Bank Discount Notes USD 0.075% 20/01/2021 2,799,728 1.297,500,000 Federal Home Loan Bank Discount Notes USD 0.055% 27/01/2021 7,499,169 3.463,300,000 Federal Home Loan Bank Discount Notes USD 0.059% 24/02/2021 3,299,377 1.522,800,000 Federal Home Loan Bank Discount Notes USD 0.060% 03/03/2021 2,799,428 1.294,000,000 Federal Home Loan Bank Discount Notes USD 0.062% 14/04/2021 3,998,809 1.84200,000 Federal Home Loan Banks(d) USD 0.165% 24/03/2021 200,068 0.09200,000 Federal Home Loan Banks(d) USD 0.190% 24/06/2021 200,136 0.09700,000 Federal Home Loan Banks(d) USD 0.370% 06/10/2021 701,534 0.32200,000 Federal Home Loan Banks(d) USD 0.200% 28/02/2022 200,224 0.09100,000 Fiserv, Inc. USD 3.200% 01/07/2026 112,141 0.0575,000 Fiserv, Inc. USD 4.400% 01/07/2049 99,278 0.05150,000 Freedom Mortgage Corp. 144A(c) USD 7.625% 01/05/2026 153,375 0.07130,000 Gartner, Inc. 144A(c) USD 3.750% 01/10/2030 135,525 0.06105,000 Global Partners LP Via GLP Finance Corp. 144A(c) USD 6.875% 15/01/2029 112,744 0.05215,000 Go Daddy Operating Co., LLC Via GD Finance Co., Inc. 144A(c) USD 5.250% 01/12/2027 227,631 0.11280,000 HLF Financing SARL LLC Via Herbalife International, Inc. 144A(c) USD 7.250% 15/08/2026 295,750 0.14225,000 Howard Hughes Corp. 144A(c) USD 5.375% 01/08/2028 238,781 0.11180,000 HUB International Ltd. 144A(c) USD 7.000% 01/05/2026 189,000 0.09165,000 iHeartCommunications, Inc. 144A(c) USD 4.750% 15/01/2028 167,062 0.0870,000 Ingevity Corp. 144A(c) USD 3.875% 01/11/2028 71,400 0.03100,000 JPMorgan Chase & Co.(d) USD 3.960% 29/01/2027 114,435 0.0575,000 JPMorgan Chase & Co.(d) USD 2.522% 22/04/2031 80,268 0.04175,000 JPMorgan Chase & Co.—Series HH(d) USD 4.600% Perp. 178,199 0.08200,000 JPMorgan Chase & Co.—Series Z(d) USD 4.014% Perp. 199,760 0.09350,000 Keurig Dr Pepper, Inc. USD 4.597% 25/05/2028 425,211 0.20295,000 Kraft Heinz Foods Co. USD 5.000% 15/07/2035 347,755 0.16100,000 LD Holdings Group LLC 144A(c) USD 6.500% 01/11/2025 105,750 0.05102,000 LPL Holdings, Inc. 144A(c) USD 4.625% 15/11/2027 105,443 0.05150,000 Marathon Petroleum Corp. USD 3.800% 01/04/2028 164,060 0.08150,000 Microchip Technology, Inc. 144A(c) USD 2.670% 01/09/2023 157,466 0.0775,000 Morgan Stanley(d) USD 2.720% 22/07/2025 80,213 0.04275,000 Morgan Stanley(d) USD 4.431% 23/01/2030 334,752 0.1675,000 Morgan Stanley(d) USD 3.622% 01/04/2031 87,298 0.04185,000 MPH Acquisition Holdings LLC 144A(c) USD 5.750% 01/11/2028 181,300 0.08104,000 Navient Corp. USD 5.500% 25/01/2023 108,550 0.05125,000 Newmont Corp. USD 2.250% 01/10/2030 131,491 0.06125,000 NRG Energy, Inc. 144A(c) USD 4.450% 15/06/2029 142,956 0.07225,000 Nutrition & Biosciences, Inc. 144A(c) USD 2.300% 01/11/2030 231,322 0.1175,000 Nutrition & Biosciences, Inc. 144A(c) USD 3.268% 15/11/2040 81,083 0.04250,000 Otis Worldwide Corp. USD 2.565% 15/02/2030 269,392 0.12175,000 Outfront Media Capital LLC Via Outfront Media Capital Corp. 144A(c) USD 6.250% 15/06/2025 185,500 0.0939,000 Providence Service Corp. 144A(c) USD 5.875% 15/11/2025 41,730 0.02230,000 Realogy Group LLC Via Realogy Co-Issuer Corp. 144A(c) USD 4.875% 01/06/2023 235,750 0.11150,000 Sabine Pass Liquefaction LLC USD 6.250% 15/03/2022 158,382 0.07375,000 Sabine Pass Liquefaction LLC USD 5.625% 01/03/2025 433,796 0.20205,000 Sabre GLBL, Inc. 144A(c) USD 9.250% 15/04/2025 239,594 0.11215,000 SeaWorld Parks & Entertainment, Inc. 144A(c) USD 9.500% 01/08/2025 233,812 0.11295,000 Sensata Technologies, Inc. 144A(c) USD 3.750% 15/02/2031 298,319 0.14180,000 Service Properties Trust USD 4.750% 01/10/2026 169,479 0.0840,000 Shift4 Payments LLC Via Shift4 Payments Finance Sub, Inc. 144A(c) USD 4.625% 01/11/2026 41,450 0.02236,000 Six Flags Entertainment Corp. 144A(c) USD 5.500% 15/04/2027 238,950 0.11100,000 Starbucks Corp. USD 3.500% 15/11/2050 114,158 0.0550,000 Steel Dynamics, Inc. USD 1.650% 15/10/2027 50,846 0.0275,000 Teachers Insurance & Annuity Association of America 144A(c) USD 4.900% 15/09/2044 100,250 0.05230,000 TEGNA, Inc. 144A(c) USD 4.625% 15/03/2028 236,037 0.11150,000 T-Mobile USA, Inc. 144A(c) USD 3.500% 15/04/2025 165,600 0.08500,000 T-Mobile USA, Inc. 144A(c) USD 3.750% 15/04/2027 565,160 0.26150,000 T-Mobile USA, Inc. 144A(c) USD 2.050% 15/02/2028 154,167 0.07200,000 T-Mobile USA, Inc. 144A(c) USD 3.875% 15/04/2030 229,630 0.11175,000 T-Mobile USA, Inc. 144A(c) USD 2.550% 15/02/2031 182,304 0.08100,000 T-Mobile USA, Inc. 144A(c) USD 3.000% 15/02/2041 102,555 0.0575,000 T-Mobile USA, Inc. 144A(c) USD 4.500% 15/04/2050 93,539 0.04
Goldman Sachs Funds—Global Absolute Return PortfolioSchedule of InvestmentsAs at 30 November 2020
The accompanying notes are an integral part of these financial statements.
458

Holdings Security Description Currency Interest Rate(a) Maturity Date(b)Market Value
USD
% ofShareholders’
Equity
Bonds – (Continued)United States – (Continued)
1,046,000 United States Cash Management Bill USD 0.076% 23/02/2021 1,045,854 0.484,000,000 United States Treasury Bill USD 0.071% 14/01/2021 3,999,694 1.841,000,000 United States Treasury Bill USD 0.076% 11/03/2021 999,799 0.46100,000 VEREIT Operating Partnership LP USD 3.400% 15/01/2028 108,376 0.05375,000 Verizon Communications, Inc. USD 4.329% 21/09/2028 454,890 0.21200,000 Verizon Communications, Inc. USD 4.016% 03/12/2029 239,102 0.1177,000 Verizon Communications, Inc. 144A(c) USD 2.987% 30/10/2056 81,033 0.04175,000 Vistra Operations Co., LLC 144A(c) USD 4.300% 15/07/2029 196,135 0.09125,000 Walgreens Boots Alliance, Inc. USD 4.100% 15/04/2050 134,279 0.06100,000 Wells Fargo & Co.(d) USD 2.188% 30/04/2026 104,792 0.05200,000 Wells Fargo & Co.(d) USD 3.196% 17/06/2027 220,666 0.10172,000 WR Grace & Co-Conn 144A(c) USD 4.875% 15/06/2027 182,320 0.08210,000 Wyndham Destinations, Inc. 144A(c) USD 6.625% 31/07/2026 236,775 0.11
81,127,627 37.40
TOTAL BONDS(cost USD 84,750,619) 85,205,830 39.28
Agencies Asset Backed Obligations – 4.39%United States
2,800,000 Federal Home Loan Mortgage Corp. (FHLMC)(d) USD 0.175% 19/08/2022 2,803,528 1.296,700,000 Federal National Mortgage Association (FNMA)(d) USD 0.380% 07/01/2022 6,722,311 3.10
9,525,839 4.39
TOTAL AGENCIES ASSET BACKED OBLIGATIONS(cost USD 9,500,000) 9,525,839 4.39
TOTAL TRANSFERABLE SECURITIES DEALT IN ANOTHER REGULATED MARKET(cost USD 94,250,619) 94,731,669 43.67
Other Transferable Securities
Bonds – 1.74%United States
425,000 Bank of America Corp.(d) USD 3.419% 20/12/2028 478,355 0.223,300,000 Federal Farm Credit Discount Notes USD 0.058% 17/02/2021 3,299,428 1.52
3,777,783 1.74
TOTAL BONDS(cost USD 3,773,278) 3,777,783 1.74
TOTAL OTHER TRANSFERABLE SECURITIES(cost USD 3,773,278) 3,777,783 1.74
MARKET VALUE OF INVESTMENTS EXCLUDING DERIVATIVES(cost USD 176,452,046) 186,713,770 86.07
Futures Contracts – 0.18%
Number ofContracts Security Description
CommitmentMarket Value
USD
UnrealisedGainUSD
% ofShareholders’
Equity
CAD1 Canadian Government Bond 10YR Futures 22/03/2021 Long 114,981 139 0.002 S&P TSX 60 Index Futures 17/12/2020 Long 318,800 8,093 0.00
433,781 8,232 0.00
EUR3 Amsterdam Index Futures 18/12/2020 Long 440,763 9,793 0.004 CAC 40 Index Futures 18/12/2020 Long 267,979 4,027 0.002 DAX Index Futures 18/12/2020 Long 804,838 12,130 0.0110 Euro BTP Italian Government Bond Futures 08/12/2020 Long 1,816,119 50,363 0.0212 Euro OAT Futures 08/12/2020 Long 2,445,930 10,345 0.0118 Euro STOXX 50 Index Futures 18/12/2020 Long 762,194 14,315 0.01647 Euro STOXX Banks Index 18/12/2020 Long 2,902,647 560,931 0.262 FTSE MIB Index Futures 18/12/2020 Long 267,560 9,159 0.001 IBEX 35 Index Futures 18/12/2020 Long 97,523 2,087 0.00
9,805,553 673,150 0.31
GBP2 UK Long Gilt Bond Futures 29/03/2021 Long 359,466 227 0.00
Goldman Sachs Funds—Global Absolute Return PortfolioSchedule of InvestmentsAs at 30 November 2020
The accompanying notes are an integral part of these financial statements.
459

Futures Contracts – (Continued)
Number ofContracts Security Description
CommitmentMarket Value
USD
UnrealisedGainUSD
% ofShareholders’
Equity
JPY(1) Japan Government Bonds 10YR Futures 14/12/2020 Short (1,458,252) 691 0.004 TOPIX Index Futures 10/12/2020 Long 673,541 34,868 0.02
(784,711) 35,559 0.02
KRW6 KOSPI 200 Index Futures 10/12/2020 Long 470,720 29,450 0.01
SEK15 OMX Stockholm 30 Index Futures 18/12/2020 Long 340,600 1,326 0.00
USD2 90-Day Eurodollar Futures 14/03/2022 Long 498,800 384 0.003 90-Day Eurodollar Futures 19/12/2022 Long 747,750 213 0.002 E-Mini NASDAQ 100 Index Futures 18/12/2020 Long 490,700 22,737 0.0119 E-Mini S&P 500 Index Futures 18/12/2020 Long 3,450,400 66,828 0.0316 E-Mini S&P 500 Index Futures 18/12/2020 Long 2,905,600 123,369 0.061 E-Mini S&P MidCap 400 Index Futures 18/12/2020 Long 219,050 20,368 0.014 Mini-Russell 2000 Index Futures 18/12/2020 Long 367,980 39,873 0.023 MSCI EAFE Index Futures 18/12/2020 Long 311,370 25,845 0.013 US Treasury Long Bond Futures 22/03/2021 Long 524,156 1,953 0.005 US Treasury Long Bond Futures 22/03/2021 Long 873,594 220 0.00
100 US Treasury Notes 10YR Futures 22/03/2021 Long 13,810,938 25,266 0.0111 US Treasury Notes 2YR Futures 31/03/2021 Long 2,429,109 666 0.00
26,629,447 327,722 0.15
UNREALISED GAIN ON FUTURES CONTRACTS 1,075,666 0.49
Number ofContracts Security Description
CommitmentMarket Value
USD
UnrealisedLossUSD
% ofShareholders’
Equity
AUD38 Australian Treasury Bonds 10YR Futures 15/12/2020 Long 4,170,080 (18,562) (0.01)
CAD6 Canadian Bank Acceptance Bill Futures 13/09/2021 Long 1,153,864 (454) (0.00)
EUR153 EURO STOXX 50 Index Dividend Futures 17/12/2021 Long 1,528,815 (294,418) (0.14)(10) German Federal Republic Bonds 10YR Futures 08/12/2020 Short (2,103,291) (5,274) (0.00)3 German Federal Republic Bonds 30YR Futures 08/12/2020 Long 815,382 (421) (0.00)24 German Federal Republic Bonds 5Y Futures 08/12/2020 Long 3,898,345 (7,808) (0.00)
4,139,251 (307,921) (0.14)
GBP2 FTSE 100 Index Futures 18/12/2020 Long 169,596 (107) (0.00)
HKD3 Hang Seng Index Futures 30/12/2020 Long 511,472 (4,179) (0.00)6 HSCEI Index Futures 30/12/2020 Long 409,378 (928) (0.00)
920,850 (5,107) (0.00)
THB1 SET50 Index Futures 29/12/2020 Long 6,011 (118) (0.00)
USD(56) MSCI Emerging Markets Index Futures 18/12/2020 Short (3,403,960) (324,450) (0.15)(39) US Treasury Notes 10YR Futures 22/03/2021 Short (5,386,266) (5,203) (0.01)(19) US Treasury Notes 2YR Futures 31/03/2021 Short (4,195,734) (1,128) (0.00)(26) US Treasury Notes 5YR Futures 31/03/2021 Short (3,275,797) (3,272) (0.00)(27) US Treasury Notes 5YR Futures 31/03/2021 Short (3,401,789) (2,983) (0.00)32 US Treasury Ultra Long Bond Futures 22/03/2021 Long 6,901,000 (4,196) (0.00)(10) US Treasury Ultra Long Notes 10YR Futures 22/03/2021 Short (1,570,000) (1,725) (0.00)
(14,332,546) (342,957) (0.16)
UNREALISED LOSS ON FUTURES CONTRACTS (675,226) (0.31)
Goldman Sachs Funds—Global Absolute Return PortfolioSchedule of InvestmentsAs at 30 November 2020
The accompanying notes are an integral part of these financial statements.
460

Forward Currency Contracts – 0.07%
CurrencyAmountBought Currency
AmountSold
MaturityDate
UnrealisedGainUSD
% ofShareholders’
Equity
BRL 2,240,000 USD 414,721 01/12/2020 7,332 0.00CLP 510,170,000 USD 664,709 01/12/2020 1,834 0.00COP 1,867,450,000 USD 492,126 01/12/2020 29,049 0.02IDR 13,207,690,000 USD 909,786 01/12/2020 25,604 0.01KRW 913,590,000 USD 807,286 01/12/2020 18,334 0.01USD 671,011 CLP 510,170,000 01/12/2020 4,467 0.00USD 114,286 PEN 410,000 01/12/2020 561 0.00PHP 65,890,000 USD 1,356,671 02/12/2020 13,753 0.01MXN 20,875,000 USD 962,156 16/12/2020 76,013 0.04AUD 2,230,000 USD 1,631,211 23/12/2020 14,570 0.01CAD 2,610,000 USD 1,997,585 23/12/2020 20,790 0.01CHF 1,250,000 USD 1,372,805 23/12/2020 11,273 0.01CZK 8,930,000 USD 401,805 23/12/2020 6,744 0.00EUR 1,710,000 USD 2,029,133 23/12/2020 23,499 0.01GBP 1,260,000 USD 1,675,491 23/12/2020 10,079 0.00HUF 134,030,000 USD 441,900 23/12/2020 5,702 0.00ILS 2,060,000 USD 616,848 23/12/2020 6,048 0.00MXN 20,880,000 USD 1,035,328 23/12/2020 2,386 0.00NOK 3,330,000 USD 370,063 23/12/2020 8,324 0.01NZD 2,280,000 USD 1,584,196 23/12/2020 22,235 0.01PLN 2,270,000 USD 602,849 23/12/2020 5,879 0.00SEK 10,290,000 USD 1,195,095 23/12/2020 18,528 0.01BRL 2,400,000 USD 445,596 30/12/2020 6,479 0.00COP 1,789,520,000 USD 490,193 30/12/2020 8,642 0.01INR 100,540,000 USD 1,352,925 30/12/2020 2,310 0.00KRW 985,270,000 USD 883,608 30/12/2020 6,653 0.00RUB 12,030,000 USD 157,411 30/12/2020 242 0.00PHP 64,880,000 USD 1,343,077 05/01/2021 3,078 0.00IDR 10,141,780,000 USD 710,602 07/01/2021 3,957 0.00
UNREALISED GAIN ON FORWARD CURRENCY CONTRACTS 364,365 0.17
CurrencyAmountBought Currency
AmountSold
MaturityDate
UnrealisedLossUSD
% ofShareholders’
Equity
PEN 410,000 USD 113,990 01/12/2020 (265) (0.00)TWD 29,810,000 USD 1,048,944 01/12/2020 (3,071) (0.00)USD 416,127 BRL 2,240,000 01/12/2020 (5,926) (0.01)USD 512,151 COP 1,867,450,000 01/12/2020 (9,025) (0.01)USD 928,074 IDR 13,207,690,000 01/12/2020 (7,315) (0.00)USD 819,444 KRW 913,590,000 01/12/2020 (6,176) (0.01)USD 1,045,644 TWD 29,810,000 01/12/2020 (229) (0.00)INR 140,170,000 USD 1,897,197 02/12/2020 (4,446) (0.00)USD 1,884,053 INR 140,170,000 02/12/2020 (8,698) (0.00)USD 1,365,674 PHP 65,890,000 02/12/2020 (4,750) (0.00)USD 248,374 AUD 340,000 16/12/2020 (2,532) (0.00)USD 359,144 CAD 470,000 16/12/2020 (4,291) (0.00)USD 340,789 CHF 310,000 16/12/2020 (2,352) (0.00)USD 63,738 DKK 400,000 16/12/2020 (767) (0.00)USD 1,173,860 EUR 990,000 16/12/2020 (14,194) (0.01)USD 652,362 GBP 490,000 16/12/2020 (3,038) (0.00)USD 123,805 HKD 960,000 16/12/2020 (42) (0.00)USD 11,908 ILS 40,000 16/12/2020 (186) (0.00)USD 942,220 JPY 100,000,000 16/12/2020 (17,231) (0.01)USD 951,808 MXN 20,875,000 16/12/2020 (86,361) (0.04)USD 28,345 NOK 250,000 16/12/2020 (61) (0.00)USD 6,744 NZD 10,000 16/12/2020 (302) (0.00)USD 94,759 SEK 825,000 16/12/2020 (2,521) (0.00)USD 51,340 SGD 70,000 16/12/2020 (998) (0.00)JPY 195,570,000 USD 1,884,222 23/12/2020 (7,446) (0.01)USD 398,745 THB 12,070,000 23/12/2020 (213) (0.00)ZAR 21,360,000 USD 1,392,139 23/12/2020 (4,216) (0.00)CLP 627,790,000 USD 825,918 30/12/2020 (5,268) (0.00)PEN 610,000 USD 169,995 30/12/2020 (798) (0.00)TWD 23,230,000 USD 817,462 30/12/2020 (1,994) (0.00)
UNREALISED LOSS ON FORWARD CURRENCY CONTRACTS (204,712) (0.10)
Goldman Sachs Funds—Global Absolute Return PortfolioSchedule of InvestmentsAs at 30 November 2020
The accompanying notes are an integral part of these financial statements.
461

Share Class Specific Forward Currency Contracts – 0.66%
CurrencyAmountBought Currency
AmountSold
MaturityDate
UnrealisedGainUSD
% ofShareholders’
Equity
EUR 32,449,000 USD 38,472,008 16/12/2020 468,567 0.21GBP 2,112,000 USD 2,811,040 16/12/2020 13,871 0.01JPY 6,091,491,000 USD 57,434,719 16/12/2020 1,010,149 0.47SEK 724,000 USD 83,158 16/12/2020 2,213 0.00
UNREALISED GAIN ON FORWARD CURRENCY CONTRACTS HELD FOR HEDGING PURPOSES 1,494,800 0.69
CurrencyAmountBought Currency
AmountSold
MaturityDate
UnrealisedLossUSD
% ofShareholders’
Equity
USD 1,911,311 EUR 1,637,000 16/12/2020 (53,178) (0.03)USD 187,844 GBP 146,000 16/12/2020 (7,439) (0.00)
UNREALISED LOSS ON FORWARD CURRENCY CONTRACTS HELD FOR HEDGING PURPOSES (60,617) (0.03)
Options – (0.64%)
Holdings Security Description
UnrealisedGain/(Loss)
USDMarket Value
USD
% ofShareholders’
Equity
Purchased OptionsEUR
1,290,000 Call EUR / Put CHF Expires 02/12/2020 Strike 1.07 (6,388) 14,979 0.00
USD122,500 Call 90-Day Eurodollar Futures Expires 15/03/2021 Strike 98.25 131,747 188,650 0.09107,500 Call 90-Day Eurodollar Futures Expires 14/06/2021 Strike 98.25 113,235 166,087 0.08105,000 Call 90-Day Eurodollar Futures Expires 13/09/2021 Strike 98.25 111,489 161,700 0.07
3,040,000 Call USD / Put CNH Expires 30/12/2020 Strike 7.13 (46,290) 192 0.00
310,181 516,629 0.24
TOTAL PURCHASED OPTIONS(cost USD 227,815) 531,608 0.24
Written OptionsEUR
(32,997) Put iShares EURO STOXX Banks Index Expires 12/11/2021 Strike 68.64 95,796 (257,503) (0.12)
USD(700) Call S&P 500 Index Expires 30/11/2020 Strike 3,455.00 (99,384) (121,625) (0.06)(700) Call S&P 500 Index Expires 30/11/2020 Strike 3,460.00 (96,813) (118,125) (0.06)(700) Call S&P 500 Index Expires 30/11/2020 Strike 3,465.00 (94,256) (114,590) (0.05)(700) Call S&P 500 Index Expires 30/11/2020 Strike 3,470.00 (91,373) (110,985) (0.05)(700) Call S&P 500 Index Expires 30/11/2020 Strike 3,475.00 (89,172) (107,555) (0.05)(200) Call S&P 500 Index Expires 30/11/2020 Strike 3,510.00 (14,019) (23,720) (0.01)(300) Call S&P 500 Index Expires 30/11/2020 Strike 3,530.00 (12,261) (29,655) (0.01)(200) Call S&P 500 Index Expires 30/11/2020 Strike 3,545.00 (5,594) (16,830) (0.01)(100) Call S&P 500 Index Expires 30/11/2020 Strike 3,565.00 857 (6,450) (0.00)(100) Call S&P 500 Index Expires 30/11/2020 Strike 3,595.00 274 (3,515) (0.00)(100) Call S&P 500 Index Expires 30/11/2020 Strike 3,605.00 2,794 (2,590) (0.00)(100) Call S&P 500 Index Expires 30/11/2020 Strike 3,665.00 3,632 (37) (0.00)(900) Call S&P 500 Index Expires 02/12/2020 Strike 3,500.00 (61,494) (117,090) (0.05)(900) Call S&P 500 Index Expires 09/12/2020 Strike 3,660.00 8,831 (21,015) (0.01)(800) Call S&P 500 Index Expires 16/12/2020 Strike 3,710.00 7,121 (15,160) (0.01)(800) Call S&P 500 Index Expires 23/12/2020 Strike 3,725.00 2,872 (18,160) (0.01)(300) Call S&P 500 Index Expires 31/12/2020 Strike 3,555.00 (16,284) (36,855) (0.02)(200) Call S&P 500 Index Expires 31/12/2020 Strike 3,590.00 (12,918) (19,580) (0.01)(100) Call S&P 500 Index Expires 31/12/2020 Strike 3,600.00 (2,500) (9,130) (0.01)(200) Call S&P 500 Index Expires 31/12/2020 Strike 3,645.00 (3,193) (12,800) (0.01)(200) Call S&P 500 Index Expires 31/12/2020 Strike 3,695.00 34 (7,980) (0.00)(100) Call S&P 500 Index Expires 31/12/2020 Strike 3,715.00 1,535 (3,230) (0.00)(100) Call S&P 500 Index Expires 31/12/2020 Strike 3,740.00 646 (2,445) (0.00)(100) Call S&P 500 Index Expires 31/12/2020 Strike 3,750.00 313 (2,180) (0.00)(100) Call S&P 500 Index Expires 29/01/2021 Strike 3,745.00 (310) (5,310) (0.00)(100) Call S&P 500 Index Expires 29/01/2021 Strike 3,790.00 514 (3,800) (0.00)(200) Call S&P 500 Index Expires 29/01/2021 Strike 3,800.00 420 (7,040) (0.00)
(1,890) Put Russell 2000 Index Expires 31/12/2021 Strike 1,813.95 15,416 (340,277) (0.16)(100) Put S&P 500 Index Expires 30/11/2020 Strike 3,140.00 9,071 (3) (0.00)(200) Put S&P 500 Index Expires 30/11/2020 Strike 3,145.00 19,807 (5) (0.00)(700) Put S&P 500 Index Expires 30/11/2020 Strike 3,155.00 66,040 (17) (0.00)(700) Put S&P 500 Index Expires 30/11/2020 Strike 3,160.00 66,352 (17) (0.00)(700) Put S&P 500 Index Expires 30/11/2020 Strike 3,165.00 68,216 (18) (0.00)(700) Put S&P 500 Index Expires 30/11/2020 Strike 3,170.00 69,461 (17) (0.00)
Goldman Sachs Funds—Global Absolute Return PortfolioSchedule of InvestmentsAs at 30 November 2020
The accompanying notes are an integral part of these financial statements.
462

Options – (Continued)
Holdings Security Description
UnrealisedGain/(Loss)
USDMarket Value
USD
% ofShareholders’
Equity
Written Options – (Continued)USD – (Continued)
(1,000) Put S&P 500 Index Expires 30/11/2020 Strike 3,175.00 94,610 (25) (0.00)(200) Put S&P 500 Index Expires 30/11/2020 Strike 3,210.00 14,885 (5) (0.00)(100) Put S&P 500 Index Expires 30/11/2020 Strike 3,235.00 9,601 (3) (0.00)(100) Put S&P 500 Index Expires 30/11/2020 Strike 3,315.00 7,598 (3) (0.00)(100) Put S&P 500 Index Expires 30/11/2020 Strike 3,390.00 7,027 (3) (0.00)(900) Put S&P 500 Index Expires 02/12/2020 Strike 3,230.00 29,141 (135) (0.00)(900) Put S&P 500 Index Expires 09/12/2020 Strike 3,450.00 28,450 (5,985) (0.00)(800) Put S&P 500 Index Expires 16/12/2020 Strike 3,525.00 14,073 (20,840) (0.01)(800) Put S&P 500 Index Expires 23/12/2020 Strike 3,550.00 5,064 (33,360) (0.02)(100) Put S&P 500 Index Expires 31/12/2020 Strike 3,175.00 9,165 (895) (0.00)(300) Put S&P 500 Index Expires 31/12/2020 Strike 3,195.00 14,707 (2,925) (0.00)(200) Put S&P 500 Index Expires 31/12/2020 Strike 3,215.00 28,766 (2,120) (0.00)(200) Put S&P 500 Index Expires 31/12/2020 Strike 3,275.00 18,070 (2,770) (0.00)(100) Put S&P 500 Index Expires 31/12/2020 Strike 3,355.00 7,575 (1,990) (0.00)(200) Put S&P 500 Index Expires 31/12/2020 Strike 3,425.00 7,137 (5,480) (0.00)(100) Put S&P 500 Index Expires 31/12/2020 Strike 3,505.00 1,590 (4,010) (0.00)(100) Put S&P 500 Index Expires 31/12/2020 Strike 3,545.00 620 (4,890) (0.00)(100) Put S&P 500 Index Expires 29/01/2021 Strike 3,395.00 3,430 (5,310) (0.00)(100) Put S&P 500 Index Expires 29/01/2021 Strike 3,470.00 1,405 (6,740) (0.00)(200) Put S&P 500 Index Expires 29/01/2021 Strike 3,505.00 1,080 (15,080) (0.01)
(1,407) Put S&P 500 Index Expires 31/12/2021 Strike 3,197.16 33,923 (270,969) (0.13)
82,552 (1,661,344) (0.76)
TOTAL WRITTEN OPTIONS(cost USD (2,097,195)) (1,918,847) (0.88)
TOTAL OPTIONS(cost USD (1,869,380)) (1,387,239) (0.64)
Swap Contracts – (1.69%)Net LocalNotionalAmount Pay Receive Currency Maturity Date
UnrealisedGainUSD
% ofShareholders’
Equity
Credit Default Swaps250,000 Floating (iTraxx Europe Crossover
Series 34 Version 1)Fixed 5.000% EUR 20/12/2025 3,881 0.00
2,300,000 Floating (iTraxx EuropeSeries 34 Version 1)
Fixed 1.000% EUR 20/12/2025 7,057 0.01
1,100,000 Floating (The Markit CDX North AmericaInvestment Grade 34 Index)
Fixed 1.000% USD 20/06/2023 3,026 0.00
2,990,000 Floating (The Markit CDX North AmericaHigh Yield 34 Version 1 Index)
Fixed 5.000% USD 20/06/2025 85,596 0.04
5,750,000 Floating (The Markit CDX North AmericaInvestment Grade 34 Index)
Fixed 1.000% USD 20/06/2025 11,732 0.01
300,000 Floating (The Markit CDX North AmericaHigh Yield 35 Version 1 Index)
Fixed 5.000% USD 20/12/2025 4,076 0.00
1,250,000 Floating (The Markit CDX North AmericaInvestment Grade 35 Version 1 Index)
Fixed 1.000% USD 20/12/2025 1,620 0.00
UNREALISED GAIN ON CREDIT DEFAULT SWAPS 116,988 0.06
Total Return Swaps17,016 Floating (USD 1 month LIBOR) Floating (JP Morgan Chase EMEA
Bespoke Baskets Index)USD 26/11/2021 64,186 0.03
UNREALISED GAIN ON TOTAL RETURN SWAPS 64,186 0.03
TOTAL UNREALISED GAIN ON SWAP CONTRACTS 181,174 0.09
Goldman Sachs Funds—Global Absolute Return PortfolioSchedule of InvestmentsAs at 30 November 2020
The accompanying notes are an integral part of these financial statements.
463

Swap Contracts – (Continued)
Net LocalNotionalAmount Pay Receive Currency Maturity Date
UnrealisedLossUSD
% ofShareholders’
Equity
Total Return Swaps5,719 Floating (S&P 500 Total Return Index) Floating (USD 1 month LIBOR) USD 02/09/2021 (3,771,846) (1.74)
357,012 Floating (USD 1 month LIBOR) Floating (JPGSRPUS Index) USD 02/09/2021 (83,470) (0.04)
UNREALISED LOSS ON TOTAL RETURN SWAPS (3,855,316) (1.78)
TOTAL UNREALISED LOSS ON SWAP CONTRACTS (3,855,316) (1.78)
MARKET VALUE OF INVESTMENTS(cost USD 174,582,666)
183,646,665 84.65
OTHER ASSETS AND LIABILITIES 33,288,810 15.35
SHAREHOLDERS’ EQUITY 216,935,475 100.00
TOTAL INVESTMENTSMarket Value
USD
% ofShareholders’
Equity
Total Investments excluding derivatives (cost USD 176,452,046) 186,713,770 86.07Unrealised gain on futures contracts 1,075,666 0.49Unrealised loss on futures contracts (675,226) (0.31)Unrealised gain on forward currency contracts 364,365 0.17Unrealised loss on forward currency contracts (204,712) (0.10)Unrealised gain on forward currency contracts held for hedging purposes 1,494,800 0.69Unrealised loss on forward currency contracts held for hedging purposes (60,617) (0.03)Market value of purchased options (cost USD 227,815) 531,608 0.24Market value of written options (cost USD (2,097,195)) (1,918,847) (0.88)Unrealised gain on swap contracts 181,174 0.09Unrealised loss on swap contracts (3,855,316) (1.78)Other Assets and Liabilities 33,288,810 15.35
Shareholders’ Equity 216,935,475 100.00
The Futures Commission Merchant were Credit Suisse Securities (USA) LLC, Morgan Stanley & Co., Inc. and Newedge Group.
The counterparties for forward currency contracts were BNP Paribas S.A. and Morgan Stanley & Co., Inc.
The counterparties for options contracts were Barclays Bank Plc., Credit Suisse Securities (USA) LLC, Morgan Stanley & Co. International Plc. and Morgan Stanley & Co., Inc.
The counterparties for swap contracts were Credit Suisse, JP Morgan Chase Bank N.A. and Morgan Stanley.
The maximum individual counterparty exposure as at 30 November 2020 is 0.73% of the NAV.
(a) Interest rates represent either the stated coupon rate, annualised discounted yield on date of purchase for discounted securities, or, for floating rate securities, the current reset ratewhich is based upon interest rates indices.
(b) Maturity dates represent either the stated date on the security, or the next interest reset date for floating rate securities or the prerefunded date for those type of securities.(c) 144A: This security is issued to qualified institutional investors, pursuant to private placements, and is transferable as stated in rule 144A of the US Securities Act of 1933.(d) Variable and floating coupon rates are those quoted as of 30 November 2020.(e) Security holding is traded/held in USD. (ADR: American Depositary Receipt/GDR: Global Depositary Receipt).(f) A related party to Goldman Sachs Funds.
Goldman Sachs Funds—Global Absolute Return PortfolioSchedule of InvestmentsAs at 30 November 2020
The accompanying notes are an integral part of these financial statements.
464

Holdings Security Description Currency Interest Rate(a) Maturity Date(b)Market Value
EUR
% ofShareholders’
Equity
Transferable securities admitted to an official exchange listing
Bonds – 58.85%Australia
500,000 APT Pipelines Ltd. EUR 2.000% 15/07/2030 565,650 0.03950,000 Origin Energy Finance Ltd. EUR 1.037% 17/09/2029 948,727 0.06
1,514,377 0.09
Austria1,010,000 Austria Government Bond 144A(c) EUR 2.100% 20/09/2117 2,277,338 0.141,020,000 Austria Government Bond 144A(c) EUR 0.850% 30/06/2120 1,358,069 0.09600,000 Erste Group Bank AG(d) EUR 6.500% Perp. 671,022 0.04
4,306,429 0.27
Belgium1,300,000 Anheuser-Busch InBev S.A./NV EUR 3.700% 02/04/2040 1,824,888 0.11100,000 Belgium Government Bond—Series 60 144A(c) EUR 4.250% 28/03/2041 182,833 0.01620,000 Belgium Government Bond—Series 80 144A(c) EUR 2.150% 22/06/2066 1,060,497 0.07350,000 Belgium Government Bond—Series 83 144A(c) EUR 2.250% 22/06/2057 573,258 0.03
1,000,000 Belgium Government Bond—Series 88 144A(c) EUR 1.700% 22/06/2050 1,389,410 0.09
5,030,886 0.31
Brazil1,050,000 Banco do Brasil S.A.(d) USD 6.250% Perp. 882,068 0.06200,000 BRF S.A. USD 5.750% 21/09/2050 175,457 0.01
1,057,525 0.07
British Virgin Islands1,780,000 Bluestar Finance Holdings Ltd.(d) USD 3.875% Perp. 1,469,515 0.09200,000 Easy Tactic Ltd. USD 8.625% 27/02/2024 146,904 0.01310,000 Fortune Star BVI Ltd. USD 5.950% 19/10/2025 264,891 0.02510,000 Huarong Finance 2019 Co., Ltd. USD 3.750% 29/05/2024 445,886 0.03280,000 Huarong Finance 2019 Co., Ltd. USD 3.875% 13/11/2029 247,426 0.02250,000 Huarong Finance 2019 Co., Ltd. USD 3.375% 24/02/2030 213,394 0.01250,000 Huarong Finance 2019 Co., Ltd. USD 3.625% 30/09/2030 216,779 0.01340,000 Huarong Finance II Co., Ltd. USD 5.500% 16/01/2025 317,803 0.02400,000 Huarong Finance II Co., Ltd. USD 4.625% 03/06/2026 367,482 0.02230,000 Huarong Finance II Co., Ltd. USD 4.875% 22/11/2026 215,706 0.01
3,905,786 0.24
Canada19,120,000 Canada Government Bond CAD 0.500% 01/09/2025 12,361,886 0.764,860,000 Canada Government Bond CAD 2.750% 01/12/2048 4,309,926 0.27300,000 Province of British Columbia Canada CAD 4.300% 18/06/2042 273,929 0.02
3,000,000 Province of British Columbia Canada—Series BCCD CAD 4.950% 18/06/2040 2,907,767 0.1816,210,000 Province of Ontario Canada CAD 2.850% 02/06/2023 11,077,468 0.681,500,000 Province of Ontario Canada CAD 4.650% 02/06/2041 1,407,185 0.09300,000 Province of Quebec Canada CAD 4.250% 01/12/2043 273,294 0.02
1,950,000 Province of Quebec Canada CAD 3.500% 01/12/2045 1,616,673 0.102,150,000 Suncor Energy, Inc. USD 3.100% 15/05/2025 1,947,089 0.12
36,175,217 2.24
Cayman Islands290,000 Country Garden Holdings Co., Ltd. USD 3.875% 22/10/2030 244,477 0.01630,000 DP World Crescent Ltd. USD 4.848% 26/09/2028 600,038 0.04200,000 DP World Crescent Ltd. USD 3.875% 18/07/2029 179,025 0.01360,000 Kaisa Group Holdings Ltd. USD 11.250% 16/04/2025 300,066 0.02200,000 Sunac China Holdings Ltd. USD 8.350% 19/04/2023 174,805 0.01178,000 Vale Overseas Ltd. USD 6.250% 10/08/2026 182,637 0.0110,000 Vale Overseas Ltd. USD 3.750% 08/07/2030 9,162 0.00200,000 Yuzhou Group Holdings Co., Ltd. USD 7.700% 20/02/2025 174,128 0.01
1,864,338 0.11
China24,620,000 Agricultural Development Bank of China—Series 1906 CNY 3.740% 12/07/2029 3,126,322 0.1991,330,000 Agricultural Development Bank of China—Series 2004 CNY 2.960% 17/04/2030 10,866,076 0.67240,000 China Cinda Finance 2017 I Ltd. USD 4.750% 21/02/2029 231,587 0.01
12,560,000 China Development Bank—Series 1710 CNY 4.040% 10/04/2027 1,637,474 0.1044,860,000 China Development Bank—Series 1909 CNY 3.500% 13/08/2026 5,685,789 0.3540,610,000 China Development Bank—Series 1915 CNY 3.450% 20/09/2029 5,051,629 0.31124,410,000 China Development Bank—Series 2010 CNY 3.090% 18/06/2030 14,985,773 0.93
Goldman Sachs Funds—Global Fixed Income Plus Portfolio (Hedged)Schedule of InvestmentsAs at 30 November 2020
The accompanying notes are an integral part of these financial statements.
465

Holdings Security Description Currency Interest Rate(a) Maturity Date(b)Market Value
EUR
% ofShareholders’
Equity
Bonds – (Continued)China – (Continued)
68,270,000 China Government Bond CNY 2.850% 04/06/2027 8,447,227 0.5219,950,000 China Government Bond—Series 1824 CNY 4.080% 22/10/2048 2,617,368 0.1639,130,000 China Government Bond—Series 1827 CNY 3.250% 22/11/2028 4,966,117 0.3139,550,000 China Government Bond—Series 1906 CNY 3.290% 23/05/2029 5,027,540 0.3133,490,000 China Government Bond—Series 1907 CNY 3.250% 06/06/2026 4,282,740 0.2744,270,000 China Government Bond—Series 1910 CNY 3.860% 22/07/2049 5,600,586 0.35
72,526,228 4.48
Colombia200,000 Colombia Government International Bond USD 4.500% 15/03/2029 190,462 0.01420,000 Colombia Government International Bond USD 4.125% 15/05/2051 384,182 0.03
574,644 0.04
Croatia1,490,000 Croatia Government International Bond EUR 1.500% 17/06/2031 1,607,337 0.10
Denmark1,550,000 Danske Bank A/S(d) EUR 1.375% 12/02/2030 1,573,064 0.104,450,000 Denmark Government Bond DKK 4.500% 15/11/2039 1,147,913 0.07
2,720,977 0.17
Dominican Republic410,000 Dominican Republic International Bond USD 4.500% 30/01/2030 360,326 0.02990,000 Dominican Republic International Bond USD 6.400% 05/06/2049 918,802 0.06
1,010,000 Dominican Republic International Bond USD 5.875% 30/01/2060 882,108 0.05
2,161,236 0.13
Ecuador112,950 Ecuador Government International Bond(e) USD 0.500% 31/07/2030 59,909 0.0192,929 Ecuador Government International Bond USD 8.485% 31/07/2030 34,668 0.00107,715 Ecuador Government International Bond(e) USD 0.500% 31/07/2035 49,332 0.00351,850 Ecuador Government International Bond(e) USD 0.500% 31/07/2040 145,193 0.01
289,102 0.02
Egypt1,200,000 Egypt Government International Bond USD 4.550% 20/11/2023 1,026,791 0.06100,000 Egypt Government International Bond EUR 4.750% 11/04/2025 101,656 0.01
1,810,000 Egypt Government International Bond USD 8.875% 29/05/2050 1,683,130 0.10
2,811,577 0.17
Finland650,000 Stora Enso OYJ EUR 0.625% 02/12/2030 654,664 0.04
France1,800,000 Aeroports de Paris EUR 0.233% 05/01/2029 1,911,528 0.121,600,000 Aeroports de Paris EUR 2.750% 02/04/2030 1,939,632 0.121,600,000 AXA S.A.(d) EUR 3.250% 28/05/2049 1,852,288 0.114,000,000 BNP Paribas S.A. EUR 1.125% 22/11/2023 4,148,520 0.261,600,000 BNP Paribas S.A.(d) EUR 0.375% 14/10/2027 1,617,200 0.10600,000 BNP Paribas S.A.(d) EUR 2.625% 14/10/2027 625,800 0.04
2,100,000 BNP Paribas S.A.(d) EUR 0.500% 01/09/2028 2,117,955 0.133,500,000 BNP Paribas S.A. EUR 0.625% 03/12/2032 3,495,485 0.222,200,000 Caisse Centrale du Credit Immobilier de France S.A. EUR (0.419%) 17/01/2024 2,229,414 0.141,900,000 Capgemini S.E. EUR 2.375% 15/04/2032 2,269,170 0.141,500,000 Credit Agricole S.A.(d) EUR 1.625% 05/06/2030 1,562,910 0.101,300,000 Electricite de France S.A. EUR 2.000% 02/10/2030 1,515,514 0.093,200,000 Electricite de France S.A.(d) EUR 2.875% Perp. 3,360,000 0.212,600,000 Engie S.A.(d) EUR 1.500% Perp. 2,606,734 0.163,200,000 EssilorLuxottica S.A. USD 2.500% 30/06/2022 2,741,908 0.172,000,000 Firmenich Productions Participations SAS EUR 1.375% 30/10/2026 2,147,300 0.131,500,000 Firmenich Productions Participations SAS EUR 1.750% 30/04/2030 1,667,940 0.1024,570,000 France Government Bond OAT EUR 0.500% 25/05/2029 26,592,602 1.644,660,000 France Government Bond OAT EUR 4.500% 25/04/2041 8,854,792 0.551,180,000 France Government Bond OAT EUR 3.250% 25/05/2045 2,044,303 0.131,670,000 France Government Bond OAT 144A(c) EUR 1.750% 25/05/2066 2,578,280 0.16900,000 La Mondiale SAM EUR 0.750% 20/04/2026 908,496 0.06900,000 La Mondiale SAM EUR 2.125% 23/06/2031 938,682 0.06700,000 La Poste S.A. EUR 1.375% 21/04/2032 775,985 0.05
1,700,000 La Poste S.A. EUR 0.440% 17/09/2034 1,831,376 0.111,550,000 Loxam SAS EUR 3.250% 14/01/2025 1,553,767 0.09
Goldman Sachs Funds—Global Fixed Income Plus Portfolio (Hedged)Schedule of InvestmentsAs at 30 November 2020
The accompanying notes are an integral part of these financial statements.
466

Holdings Security Description Currency Interest Rate(a) Maturity Date(b)Market Value
EUR
% ofShareholders’
Equity
Bonds – (Continued)France – (Continued)
500,000 Loxam SAS EUR 3.750% 15/07/2026 505,820 0.031,700,000 Orange S.A. EUR (0.131%) 04/09/2026 1,713,022 0.10600,000 Orange S.A. EUR 1.625% 07/04/2032 690,216 0.04
1,100,000 Sanofi EUR (0.362%) 21/03/2022 1,105,071 0.07700,000 Sanofi EUR 1.500% 01/04/2030 803,621 0.05
1,100,000 Societe Generale S.A.(d) EUR 0.875% 22/09/2028 1,128,457 0.07700,000 Total Capital International S.A. USD 3.461% 12/07/2049 678,204 0.04
90,511,992 5.59
Germany2,200,000 Allianz S.E.(d) EUR 2.625% Perp. 2,211,616 0.14900,000 Bayer AG EUR 1.125% 06/01/2030 948,987 0.06
17,890,000 Bundesobligation—Series 181 EUR (0.760%) 11/04/2025 18,499,154 1.142,110,000 Bundesobligation—Series 182 EUR (0.757%) 10/10/2025 2,189,505 0.144,510,000 Bundesrepublik Deutschland EUR (0.641%) 15/08/2029 4,769,325 0.301,100,000 Commerzbank AG(d) EUR 4.000% 05/12/2030 1,183,875 0.074,800,000 Commerzbank AG(d) EUR 6.125% Perp. 5,076,000 0.31200,000 Deutsche Bank AG USD 3.125% 13/01/2021 167,108 0.01700,000 Deutsche Bank AG EUR 4.500% 19/05/2026 769,328 0.05
2,700,000 Deutsche Bank AG(d) EUR 1.750% 19/11/2030 2,787,372 0.171,100,000 Deutsche Telekom AG EUR 0.500% 05/07/2027 1,144,770 0.071,350,000 Deutsche Telekom AG EUR 1.375% 05/07/2034 1,518,763 0.092,300,000 E.ON S.E. EUR 0.375% 29/09/2027 2,370,242 0.1513,540,000 KFW EUR (0.639%) 04/07/2024 13,854,670 0.86950,000 Landesbank Baden-Wuerttemberg EUR 3.625% 16/06/2025 1,045,684 0.06600,000 Schaeffler AG EUR 2.750% 12/10/2025 629,787 0.04900,000 Schaeffler AG EUR 3.375% 12/10/2028 972,410 0.06400,000 Volkswagen Bank GmbH EUR 1.875% 31/01/2024 422,140 0.03
1,300,000 ZF Finance GmbH EUR 3.000% 21/09/2025 1,342,789 0.08200,000 ZF Finance GmbH EUR 2.750% 25/05/2027 200,814 0.01
62,104,339 3.84
Guernsey1,200,000 Credit Suisse Group Funding Guernsey Ltd. EUR 1.250% 14/04/2022 1,224,132 0.08
Honduras360,000 Honduras Government International Bond USD 8.750% 16/12/2020 300,848 0.02
Hong Kong720,000 CNAC HK Finbridge Co., Ltd. USD 3.000% 22/09/2030 571,092 0.04200,000 Lenovo Group Ltd. USD 3.421% 02/11/2030 177,757 0.01
748,849 0.05
Indonesia1,610,000 Indonesia Government International Bond USD 5.875% 15/01/2024 1,548,529 0.10530,000 Indonesia Government International Bond EUR 2.150% 18/07/2024 563,539 0.03220,000 Indonesia Government International Bond EUR 0.900% 14/02/2027 223,162 0.01
1,930,000 Indonesia Government International Bond USD 3.850% 18/07/2027 1,841,981 0.11240,000 Indonesia Government International Bond USD 2.850% 14/02/2030 217,894 0.01440,000 Indonesia Government International Bond USD 3.850% 15/10/2030 430,021 0.03360,000 Indonesia Government International Bond USD 3.500% 14/02/2050 330,218 0.02270,000 Indonesia Government International Bond USD 4.450% 15/04/2070 279,280 0.02
24,999,000,000 Indonesia Treasury Bond—Series FR73 IDR 8.750% 15/05/2031 1,737,923 0.11
7,172,547 0.44
Ireland2,400,000 Abbott Ireland Financing DAC EUR 0.875% 27/09/2023 2,477,256 0.152,300,000 AerCap Ireland Capital DAC Via AerCap Global Aviation Trust USD 3.500% 26/05/2022 1,978,148 0.123,000,000 AerCap Ireland Capital DAC Via AerCap Global Aviation Trust USD 4.625% 01/07/2022 2,622,559 0.161,150,000 AIB Group Plc.(d) EUR 1.875% 19/11/2029 1,167,906 0.071,750,000 AIB Group Plc.(d) EUR 2.875% 30/05/2031 1,851,867 0.122,100,000 Dell Bank International DAC EUR 0.625% 17/10/2022 2,121,483 0.133,550,000 Dell Bank International DAC EUR 1.625% 24/06/2024 3,670,132 0.231,550,000 GE Capital International Funding Co. Unlimited Co. USD 3.373% 15/11/2025 1,416,611 0.091,400,000 GE Capital International Funding Co. Unlimited Co. USD 4.418% 15/11/2035 1,346,313 0.081,850,000 Ireland Government Bond EUR 0.900% 15/05/2028 2,036,887 0.13540,000 Ireland Government Bond EUR 2.400% 15/05/2030 680,956 0.04
1,550,000 Ireland Government Bond EUR 0.200% 18/10/2030 1,623,501 0.10
22,993,619 1.42
Goldman Sachs Funds—Global Fixed Income Plus Portfolio (Hedged)Schedule of InvestmentsAs at 30 November 2020
The accompanying notes are an integral part of these financial statements.
467

Holdings Security Description Currency Interest Rate(a) Maturity Date(b)Market Value
EUR
% ofShareholders’
Equity
Bonds – (Continued)Isle Of Man
600,000 Sasol Financing International Ltd. USD 4.500% 14/11/2022 505,815 0.03
Israel2,030,000 Israel Government International Bond USD 3.800% 13/05/2060 2,005,906 0.12
Italy1,275,000 Aeroporti di Roma SpA EUR 1.625% 02/02/2029 1,282,255 0.081,350,000 Intesa Sanpaolo SpA(d) EUR 5.875% Perp. 1,483,312 0.093,230,000 Italy Buoni Poliennali Del Tesoro EUR 0.950% 01/08/2030 3,360,492 0.217,360,000 Italy Buoni Poliennali Del Tesoro 144A(c) EUR 3.750% 01/08/2021 7,569,907 0.477,400,000 Italy Buoni Poliennali Del Tesoro 144A(c) EUR 2.950% 01/09/2038 9,599,724 0.59810,000 Italy Buoni Poliennali Del Tesoro 144A(c) EUR 2.800% 01/03/2067 1,076,830 0.07
5,070,000 Italy Certificati di Credito del Tesoro(d) EUR 1.518% 15/01/2025 5,361,778 0.331,150,000 Telecom Italia SpA EUR 4.000% 11/04/2024 1,241,891 0.08975,000 UniCredit SpA(d) EUR 2.200% 22/07/2027 1,034,875 0.06
1,375,000 UniCredit SpA EUR 1.800% 20/01/2030 1,440,464 0.091,150,000 UniCredit SpA(d) EUR 2.731% 15/01/2032 1,165,813 0.071,250,000 UniCredit SpA(d) EUR 7.500% Perp. 1,443,750 0.09
36,061,091 2.23
Japan2,875,000 Asahi Group Holdings Ltd. EUR 0.541% 23/10/2028 2,920,137 0.18
2,311,000,000 Japan Government Bond—Series 13 JPY 0.500% 20/03/2060 17,369,771 1.074,310,450,000 Japan Government Bond—Series 141 JPY 0.100% 20/09/2024 34,784,754 2.15924,200,000 Japan Government Bond—Series 162 JPY 0.600% 20/09/2037 7,745,202 0.48
1,349,150,000 Japan Government Bond—Series 174 JPY 0.400% 20/09/2040 10,792,417 0.661,783,832,256 Japan Government Bond—Series 24 JPY 0.100% 10/03/2029 14,315,552 0.88147,850,000 Japan Government Bond—Series 28 JPY 2.500% 20/03/2038 1,615,355 0.10
1,148,800,000 Japan Government Bond—Series 41 JPY 1.700% 20/12/2043 11,633,867 0.724,747,250,000 Japan Government Bond—Series 418 JPY 0.100% 01/11/2022 38,138,851 2.36243,150,000 Japan Government Bond—Series 45 JPY 1.500% 20/12/2044 2,385,147 0.15
3,465,500,000 Japan Government Bond—Series 56 JPY 2.000% 20/06/2022 28,624,809 1.772,822,000,000 Japan Government Bond—Series 68 JPY 0.600% 20/09/2050 22,297,936 1.38
534,000 Mitsubishi UFJ Financial Group, Inc. USD 2.950% 01/03/2021 448,065 0.031,550,000 Mitsubishi UFJ Financial Group, Inc. EUR 0.339% 19/07/2024 1,571,762 0.101,500,000 Mitsubishi UFJ Financial Group, Inc. USD 3.751% 18/07/2039 1,503,726 0.09600,000 Nissan Motor Co., Ltd. EUR 1.940% 15/09/2023 620,826 0.04200,000 SoftBank Group Corp. USD 5.125% 19/09/2027 174,024 0.01
1,250,000 Takeda Pharmaceutical Co., Ltd. EUR 1.375% 09/07/2032 1,341,238 0.081,150,000 Takeda Pharmaceutical Co., Ltd. EUR 2.000% 09/07/2040 1,299,224 0.08
199,582,663 12.33
Jersey210,000 Galaxy Pipeline Assets Bidco Ltd. USD 2.625% 31/03/2036 181,412 0.01380,000 Galaxy Pipeline Assets Bidco Ltd. USD 3.250% 30/09/2040 328,863 0.02
510,275 0.03
Luxembourg2,200,000 ADLER Group S.A. EUR 3.250% 05/08/2025 2,282,137 0.141,150,000 Blackstone Property Partners Europe Holdings SARL EUR 2.000% 15/02/2024 1,206,373 0.081,150,000 Blackstone Property Partners Europe Holdings SARL EUR 1.750% 12/03/2029 1,206,114 0.07400,000 DH Europe Finance II SARL EUR 0.450% 18/03/2028 408,260 0.03450,000 DH Europe Finance II SARL USD 2.600% 15/11/2029 413,405 0.03
1,500,000 DH Europe Finance II SARL EUR 0.750% 18/09/2031 1,548,045 0.091,490,000 Gazprom PJSC Via Gaz Capital S.A. USD 5.150% 11/02/2026 1,412,538 0.09550,000 Gazprom PJSC Via Gaz Capital S.A. USD 7.288% 16/08/2037 665,191 0.04
1,150,000 Helvetia Europe S.A.(d) EUR 2.750% 30/09/2041 1,238,228 0.081,800,000 Lincoln Financing SARL EUR 3.625% 01/04/2024 1,831,500 0.111,600,000 Logicor Financing SARL EUR 0.750% 15/07/2024 1,634,000 0.101,700,000 Logicor Financing SARL EUR 1.625% 15/07/2027 1,801,405 0.113,600,000 Medtronic Global Holdings S.C.A. EUR 0.375% 07/03/2023 3,648,816 0.23850,000 Medtronic Global Holdings S.C.A. EUR 0.250% 02/07/2025 863,481 0.05
1,550,000 Medtronic Global Holdings S.C.A. EUR 0.286% 02/07/2031 1,666,281 0.10350,000 Medtronic Global Holdings S.C.A. EUR 1.500% 02/07/2039 384,468 0.02
1,450,000 Richemont International Holding S.A. EUR 1.625% 26/05/2040 1,693,005 0.11
23,903,247 1.48
Mexico400,000 Mexico City Airport Trust USD 4.250% 31/10/2026 333,302 0.02200,000 Mexico City Airport Trust USD 3.875% 30/04/2028 160,790 0.01618,000 Mexico City Airport Trust USD 5.500% 31/07/2047 500,220 0.03
Goldman Sachs Funds—Global Fixed Income Plus Portfolio (Hedged)Schedule of InvestmentsAs at 30 November 2020
The accompanying notes are an integral part of these financial statements.
468

Holdings Security Description Currency Interest Rate(a) Maturity Date(b)Market Value
EUR
% ofShareholders’
Equity
Bonds – (Continued)Mexico – (Continued)
210,000 Mexico City Airport Trust 144A(c) USD 4.250% 31/10/2026 174,984 0.01880,000 Mexico City Airport Trust 144A(c) USD 3.875% 30/04/2028 707,474 0.04250,000 Mexico City Airport Trust 144A(c) USD 5.500% 31/10/2046 201,834 0.01350,000 Mexico City Airport Trust 144A(c) USD 5.500% 31/07/2047 283,296 0.02220,000 Mexico Government International Bond USD 3.250% 16/04/2030 195,369 0.01670,000 Mexico Government International Bond USD 3.771% 24/05/2061 557,146 0.04
3,114,415 0.19
Netherlands2,800,000 Abertis Infraestructuras Finance BV(d) EUR 3.248% Perp. 2,870,000 0.181,600,000 ABN AMRO Bank NV(d) EUR 2.875% 18/01/2028 1,684,032 0.102,500,000 Airbus S.E. EUR 2.000% 07/04/2028 2,799,475 0.171,700,000 Airbus S.E. EUR 2.375% 07/04/2032 1,992,638 0.123,100,000 Airbus S.E. EUR 2.375% 09/06/2040 3,571,138 0.221,600,000 BAT Netherlands Finance BV EUR 3.125% 07/04/2028 1,870,688 0.111,800,000 Bayer Capital Corp. BV EUR 1.500% 26/06/2026 1,935,396 0.121,970,000 BNG Bank NV GBP 0.375% 15/12/2025 2,210,347 0.141,500,000 Cooperatieve Rabobank UA EUR 3.875% 25/07/2023 1,656,975 0.101,850,000 CRH Funding BV EUR 1.625% 05/05/2030 2,083,100 0.13900,000 Enel Finance International NV EUR 0.375% 17/06/2027 920,151 0.06
2,250,000 Fiat Chrysler Automobiles NV EUR 3.875% 05/01/2026 2,540,340 0.161,350,000 Fiat Chrysler Automobiles NV EUR 4.500% 07/07/2028 1,619,798 0.10600,000 Givaudan Finance Europe BV EUR 1.625% 22/04/2032 684,258 0.04
1,100,000 ING Groep NV EUR (0.216%) 20/09/2023 1,137,510 0.07300,000 ING Groep NV(d) EUR 0.786% 13/11/2030 302,565 0.02700,000 ING Groep NV(d) EUR 2.125% 26/05/2031 746,711 0.05850,000 Innogy Finance BV GBP 6.125% 06/07/2039 1,586,726 0.10
2,200,000 JAB Holdings BV EUR 1.000% 20/12/2027 2,272,754 0.142,700,000 JAB Holdings BV EUR 3.375% 17/04/2035 3,352,050 0.21700,000 Koninklijke Philips NV EUR 1.375% 30/03/2025 743,638 0.05
1,070,000 Lukoil Securities BV USD 3.875% 06/05/2030 964,476 0.0670,000 Petrobras Global Finance BV USD 5.999% 27/01/2028 68,334 0.0036,000 Petrobras Global Finance BV USD 5.093% 15/01/2030 32,967 0.00830,000 Prosus NV USD 3.680% 21/01/2030 755,791 0.05280,000 Prosus NV USD 4.027% 03/08/2050 249,177 0.01
2,150,000 Upjohn Finance BV EUR 1.908% 23/06/2032 2,382,802 0.152,400,000 Volkswagen International Finance NV(d) EUR 3.500% Perp. 2,540,760 0.16700,000 Wintershall Dea Finance BV EUR 0.840% 25/09/2025 715,799 0.04
1,900,000 Wintershall Dea Finance BV EUR 1.332% 25/09/2028 1,949,647 0.122,300,000 WPC Eurobond BV EUR 1.350% 15/04/2028 2,388,803 0.15
50,628,846 3.13
Nigeria200,000 Nigeria Government International Bond USD 6.500% 28/11/2027 175,196 0.01
Norway275,000 Adevinta ASA EUR 2.625% 15/11/2025 280,291 0.02225,000 Adevinta ASA EUR 3.000% 15/11/2027 233,235 0.01
513,526 0.03
Peru980,000 Peruvian Government International Bond USD 2.780% 01/12/2060 806,761 0.05370,000 Peruvian Government International Bond USD 3.230% 28/07/2121 304,747 0.02
1,111,508 0.07
Portugal5,270,000 Portugal Obrigacoes do Tesouro OT 144A(c) EUR 4.950% 25/10/2023 6,126,428 0.382,890,000 Portugal Obrigacoes do Tesouro OT 144A(c) EUR 1.950% 15/06/2029 3,405,258 0.21
9,531,686 0.59
Qatar370,000 Qatar Government International Bond USD 4.000% 14/03/2029 365,512 0.02340,000 Qatar Government International Bond USD 3.750% 16/04/2030 332,333 0.02610,000 Qatar Government International Bond USD 4.400% 16/04/2050 673,477 0.04
1,371,322 0.08
Romania260,000 Romanian Government International Bond EUR 2.875% 11/03/2029 290,631 0.02
1,990,000 Romanian Government International Bond EUR 3.624% 26/05/2030 2,355,663 0.14380,000 Romanian Government International Bond USD 3.000% 14/02/2031 339,703 0.02
Goldman Sachs Funds—Global Fixed Income Plus Portfolio (Hedged)Schedule of InvestmentsAs at 30 November 2020
The accompanying notes are an integral part of these financial statements.
469

Holdings Security Description Currency Interest Rate(a) Maturity Date(b)Market Value
EUR
% ofShareholders’
Equity
Bonds – (Continued)Romania – (Continued)
130,000 Romanian Government International Bond EUR 2.000% 28/01/2032 135,429 0.01810,000 Romanian Government International Bond EUR 3.375% 28/01/2050 900,239 0.06
1,220,000 Romanian Government International Bond USD 4.000% 14/02/2051 1,114,780 0.07
5,136,445 0.32
Saudi Arabia490,000 Saudi Government International Bond USD 3.250% 22/10/2030 450,356 0.03420,000 Saudi Government International Bond USD 4.500% 22/04/2060 446,418 0.03
896,774 0.06
South Korea3,710,730,000 Inflation Linked Korea Treasury Bond—Series 2606 KRW 0.809% 10/06/2026 3,015,066 0.197,218,240,000 Korea Treasury Bond—Series 2906 KRW 1.875% 10/06/2029 5,594,324 0.3413,693,520,000 Korea Treasury Bond—Series 2912 KRW 1.375% 10/12/2029 10,149,321 0.63
18,758,711 1.16
Spain800,000 Abertis Infraestructuras S.A. EUR 2.375% 27/09/2027 886,904 0.05900,000 Banco Bilbao Vizcaya Argentaria S.A. EUR 0.750% 11/09/2022 916,497 0.06
1,800,000 Banco Bilbao Vizcaya Argentaria S.A.—Series 9(d) USD 6.500% Perp. 1,609,354 0.101,100,000 Banco de Sabadell S.A. EUR 0.875% 05/03/2023 1,119,646 0.07600,000 Banco de Sabadell S.A. EUR 1.750% 10/05/2024 619,038 0.04
1,000,000 Banco de Sabadell S.A. EUR 1.125% 27/03/2025 1,012,490 0.061,400,000 Banco Santander S.A. USD 2.706% 27/06/2024 1,241,916 0.081,100,000 Banco Santander S.A. EUR 1.375% 05/01/2026 1,165,274 0.07800,000 Banco Santander S.A. USD 3.306% 27/06/2029 745,326 0.05800,000 Banco Santander S.A. USD 3.490% 28/05/2030 744,879 0.05
1,900,000 Banco Santander S.A. EUR 1.625% 22/10/2030 1,966,006 0.122,600,000 Banco Santander S.A.(d) EUR 4.375% Perp. 2,557,750 0.161,200,000 Bankinter S.A. EUR 0.625% 06/10/2027 1,222,716 0.082,700,000 CaixaBank S.A.(d) EUR 0.375% 18/11/2026 2,711,097 0.171,200,000 CaixaBank S.A.(d) EUR 5.875% Perp. 1,311,000 0.081,950,000 FCC Aqualia S.A. EUR 2.629% 08/06/2027 2,129,263 0.13400,000 FCC Servicios Medio Ambiente Holding SAU EUR 1.661% 04/12/2026 419,932 0.03
6,100,000 Spain Government Bond EUR (0.567%) 30/04/2023 6,184,668 0.387,040,000 Spain Government Bond 144A(c) EUR 5.900% 30/07/2026 9,565,389 0.599,610,000 Spain Government Bond 144A(c) EUR 1.500% 30/04/2027 10,732,160 0.662,240,000 Spain Government Bond 144A(c) EUR 1.250% 31/10/2030 2,501,990 0.152,170,000 Spain Government Bond 144A(c) EUR 3.450% 30/07/2066 3,949,769 0.242,900,000 Telefonica Emisiones S.A. EUR 1.201% 21/08/2027 3,105,146 0.191,150,000 Telefonica Emisiones S.A. EUR 1.957% 01/07/2039 1,329,527 0.08
59,747,737 3.69
Supranationals945,000 CANPACK S.A. Via Eastern PA Land Investment Holding LLC EUR 2.375% 01/11/2027 973,462 0.06
8,900,000 European Investment Bank SEK 1.750% 12/11/2026 952,077 0.066,040,000 European Investment Bank EUR 0.875% 14/01/2028 6,660,489 0.411,930,000 European Investment Bank EUR (0.060%) 14/11/2042 2,381,273 0.15790,000 European Union EUR (0.187%) 04/07/2035 812,057 0.05
11,779,358 0.73
Sweden800,000 Heimstaden Bostad AB EUR 1.125% 21/01/2026 825,928 0.05800,000 Svenska Handelsbanken AB(d) USD 4.375% Perp. 695,874 0.04
2,900,000 Volvo Treasury AB EUR 0.125% 17/09/2024 2,917,777 0.18
4,439,579 0.27
Switzerland2,300,000 Credit Suisse AG USD 2.950% 09/04/2025 2,099,729 0.131,550,000 Credit Suisse Group AG(d) EUR 3.250% 02/04/2026 1,754,957 0.113,150,000 Credit Suisse Group AG(d) EUR 0.650% 14/01/2028 3,218,575 0.201,850,000 Credit Suisse Group AG 144A(c)(d) USD 5.250% Perp. 1,640,353 0.10
8,713,614 0.54
Thailand182,300,000 Thailand Government Bond THB 1.875% 17/06/2022 5,127,949 0.32
Goldman Sachs Funds—Global Fixed Income Plus Portfolio (Hedged)Schedule of InvestmentsAs at 30 November 2020
The accompanying notes are an integral part of these financial statements.
470

Holdings Security Description Currency Interest Rate(a) Maturity Date(b)Market Value
EUR
% ofShareholders’
Equity
Bonds – (Continued)Thailand – (Continued)
160,680,000 Thailand Government Bond THB 2.400% 17/12/2023 4,665,733 0.2940,660,000 Thailand Government Bond THB 3.650% 20/06/2031 1,360,813 0.08
11,154,495 0.69
Turkey200,000 Turkey Government International Bond USD 5.250% 13/03/2030 161,884 0.01970,000 Turkiye Vakiflar Bankasi TAO USD 5.250% 05/02/2025 782,861 0.05
944,745 0.06
Ukraine1,780,000 Ukraine Government International Bond EUR 4.375% 27/01/2030 1,673,200 0.10920,000 Ukraine Government International Bond USD 7.253% 15/03/2033 817,405 0.05
2,490,605 0.15
United Arab Emirates2,200,000 Abu Dhabi Government International Bond USD 3.875% 16/04/2050 2,280,491 0.14100,000 DP World Plc. 144A(c) USD 6.850% 02/07/2037 110,705 0.01
2,391,196 0.15
United Kingdom1,050,000 Aviva Plc.(d) GBP 6.125% 14/11/2036 1,430,199 0.09650,000 Aviva Plc.(d) EUR 6.125% 05/07/2043 743,646 0.05
1,340,000 Barclays Bank Plc. GBP 10.000% 21/05/2021 1,555,517 0.101,150,000 Barclays Bank Plc. USD 10.179% 12/06/2021 1,004,777 0.06250,000 Barclays Plc. USD 3.684% 10/01/2023 215,191 0.01
2,300,000 Barclays Plc.(d) EUR 3.375% 02/04/2025 2,535,267 0.163,250,000 Barclays Plc.(d) GBP 3.750% 22/11/2030 3,910,608 0.241,100,000 BAT International Finance Plc. GBP 2.250% 26/06/2028 1,257,234 0.08400,000 BP Capital Markets Plc. USD 3.814% 10/02/2024 365,751 0.02900,000 BP Capital Markets Plc.(d) EUR 3.250% Perp. 961,722 0.06
1,100,000 BP Capital Markets Plc.(d) EUR 3.625% Perp. 1,204,984 0.07960,000 Gazprom PJSC Via Gaz Finance Plc. USD 3.250% 25/02/2030 825,059 0.05250,000 HSBC Bank Plc. 144A(c) USD 4.750% 19/01/2021 209,641 0.01
4,800,000 HSBC Holdings Plc.(d) USD 3.803% 11/03/2025 4,348,551 0.271,050,000 HSBC Holdings Plc. USD 4.950% 31/03/2030 1,090,528 0.071,550,000 Informa Plc. EUR 2.125% 06/10/2025 1,616,511 0.10850,000 Legal & General Group Plc.(d) GBP 3.750% 26/11/2049 1,010,920 0.06
2,100,000 Lloyds Banking Group Plc.(d) EUR 3.500% 01/04/2026 2,392,740 0.15200,000 M&G Plc.(d) GBP 6.340% 19/12/2063 289,215 0.02
1,600,000 National Express Group Plc.(d) GBP 4.250% Perp. 1,832,789 0.11450,000 Nationwide Building Society 144A(c)(d) USD 3.622% 26/04/2023 390,161 0.02
1,100,000 Nationwide Building Society 144A(c)(d) USD 3.960% 18/07/2030 1,060,495 0.071,600,000 Natwest Group Plc.(d) USD 3.498% 15/05/2023 1,388,027 0.09400,000 Natwest Group Plc. USD 3.875% 12/09/2023 361,289 0.02
2,675,000 Natwest Group Plc.(d) GBP 5.125% Perp. 3,079,613 0.19850,000 Pension Insurance Corp. Plc. GBP 4.625% 07/05/2031 1,101,293 0.07
2,700,000 Santander UK Group Holdings Plc.(d) USD 1.532% 21/08/2026 2,268,919 0.141,200,000 Swiss Re Finance UK Plc.(d) EUR 2.714% 04/06/2052 1,319,700 0.081,950,000 Thames Water Utilities Finance Plc.(d) GBP 5.750% 13/09/2030 2,314,582 0.141,640,000 United Kingdom Gilt GBP 4.500% 07/09/2034 2,796,997 0.17660,000 United Kingdom Gilt GBP 3.500% 22/01/2045 1,168,194 0.07
7,510,000 United Kingdom Gilt GBP 4.250% 07/12/2046 15,100,401 0.932,670,000 United Kingdom Gilt GBP 1.750% 22/07/2057 3,892,990 0.241,410,000 United Kingdom Gilt GBP 3.500% 22/07/2068 3,311,151 0.21200,000 Vedanta Resources Ltd. USD 7.125% 31/05/2023 112,209 0.01200,000 Vedanta Resources Ltd. USD 6.125% 09/08/2024 106,707 0.01
68,573,578 4.24
United States900,000 AbbVie, Inc. USD 3.750% 14/11/2023 819,998 0.05
2,700,000 AbbVie, Inc. USD 2.950% 21/11/2026 2,490,334 0.152,450,000 AbbVie, Inc. USD 3.200% 21/11/2029 2,314,240 0.14350,000 AbbVie, Inc. USD 4.450% 14/05/2046 368,767 0.02
1,425,000 AbbVie, Inc. USD 4.875% 14/11/2048 1,618,148 0.101,225,000 Air Lease Corp. USD 2.875% 15/01/2026 1,056,448 0.07950,000 Alexandria Real Estate Equities, Inc. USD 3.375% 15/08/2031 907,480 0.06250,000 Ameren Corp. USD 2.500% 15/09/2024 221,804 0.01
2,450,000 American International Group, Inc. USD 3.400% 30/06/2030 2,328,026 0.14650,000 American Water Capital Corp. USD 3.450% 01/05/2050 648,727 0.04
Goldman Sachs Funds—Global Fixed Income Plus Portfolio (Hedged)Schedule of InvestmentsAs at 30 November 2020
The accompanying notes are an integral part of these financial statements.
471

Holdings Security Description Currency Interest Rate(a) Maturity Date(b)Market Value
EUR
% ofShareholders’
Equity
Bonds – (Continued)United States – (Continued)
1,300,000 Anheuser-Busch Cos. LLC Via Anheuser-Busch InBev Worldwide, Inc. USD 4.900% 01/02/2046 1,416,903 0.091,100,000 Anheuser-Busch InBev Worldwide, Inc. USD 4.150% 23/01/2025 1,041,018 0.062,500,000 Anheuser-Busch InBev Worldwide, Inc. USD 4.750% 23/01/2029 2,560,189 0.161,700,000 Anheuser-Busch InBev Worldwide, Inc. USD 4.600% 15/04/2048 1,799,289 0.113,200,000 Anthem, Inc. USD 2.250% 15/05/2030 2,802,064 0.17500,000 AT&T, Inc. USD 3.000% 30/06/2022 432,158 0.03
2,400,000 AT&T, Inc. USD 4.100% 15/02/2028 2,359,945 0.153,200,000 AT&T, Inc. USD 2.750% 01/06/2031 2,833,516 0.181,200,000 AT&T, Inc. EUR 1.800% 14/09/2039 1,275,003 0.08550,000 AT&T, Inc. USD 4.350% 15/06/2045 542,767 0.03
1,200,000 AT&T, Inc. USD 5.450% 01/03/2047 1,337,452 0.081,550,000 AT&T, Inc. USD 3.650% 01/06/2051 1,366,256 0.08100,000 Bank of America Corp. USD 5.000% 13/05/2021 85,136 0.01
2,500,000 Bank of America Corp. USD 3.500% 19/04/2026 2,361,365 0.151,700,000 Bank of America Corp.(d) EUR 3.648% 31/03/2029 2,113,185 0.131,300,000 BAT Capital Corp. USD 5.282% 02/04/2050 1,351,055 0.082,850,000 Becton Dickinson and Co. USD 2.894% 06/06/2022 2,456,196 0.153,550,000 Becton Dickinson and Co. USD 3.363% 06/06/2024 3,198,478 0.201,650,000 Centene Corp. USD 3.000% 15/10/2030 1,449,546 0.091,429,000 Cigna Corp. USD 3.750% 15/07/2023 1,289,632 0.08500,000 Cigna Corp. USD 2.400% 15/03/2030 443,150 0.03
3,180,000 Citigroup Global Markets Holdings, Inc.(d) USD 3.977% 20/09/2023 2,612,820 0.16300,000 CVS Health Corp. USD 5.050% 25/03/2048 337,597 0.02
1,375,000 CVS Health Corp. USD 4.250% 01/04/2050 1,440,887 0.09250,000 Devon Energy Corp. USD 5.850% 15/12/2025 239,915 0.02250,000 Devon Energy Corp. USD 4.750% 15/05/2042 222,381 0.01
2,050,000 Dominion Energy, Inc.—Series C USD 3.375% 01/04/2030 1,958,023 0.121,600,000 DuPont de Nemours, Inc. USD 4.493% 15/11/2025 1,556,824 0.102,450,000 DuPont de Nemours, Inc. USD 4.725% 15/11/2028 2,495,546 0.151,050,000 Enterprise Products Operating LLC USD 2.850% 15/04/2021 881,587 0.05500,000 Enterprise Products Operating LLC USD 3.750% 15/02/2025 464,870 0.03300,000 Enterprise Products Operating LLC USD 4.150% 16/10/2028 296,104 0.02350,000 EQM Midstream Partners LP USD 4.750% 15/07/2023 298,490 0.02850,000 Fidelity National Information Services, Inc. EUR 0.750% 21/05/2023 868,802 0.05600,000 Fidelity National Information Services, Inc. GBP 2.602% 21/05/2025 727,383 0.05
1,000,000 Fidelity National Information Services, Inc. EUR 0.625% 03/12/2025 1,033,490 0.06150,000 Fidelity National Information Services, Inc. EUR 1.500% 21/05/2027 162,431 0.01125,000 Ford Motor Credit Co., LLC EUR 3.250% 15/09/2025 130,875 0.01250,000 General Electric Co. USD 2.700% 09/10/2022 216,612 0.01700,000 General Electric Co. USD 3.100% 09/01/2023 613,611 0.04
2,450,000 General Electric Co. USD 3.625% 01/05/2030 2,288,873 0.142,200,000 General Electric Co. USD 4.350% 01/05/2050 2,150,903 0.13550,000 General Electric Co.—Series MTNA USD 6.750% 15/03/2032 623,787 0.04
1,150,000 General Mills, Inc. USD 2.875% 15/04/2030 1,065,319 0.071,450,000 General Motors Co. USD 5.400% 02/10/2023 1,355,074 0.08350,000 General Motors Financial Co., Inc. USD 5.650% 17/01/2029 361,289 0.02
2,300,000 HCA, Inc. USD 5.375% 01/02/2025 2,149,869 0.138,000 Healthpeak Properties, Inc. USD 4.250% 15/11/2023 7,310 0.00
300,000 Healthpeak Properties, Inc. USD 3.250% 15/07/2026 279,047 0.021,450,000 Hewlett Packard Enterprise Co. USD 4.450% 02/10/2023 1,332,035 0.08700,000 Hewlett Packard Enterprise Co. USD 6.350% 15/10/2045 771,240 0.05
3,050,000 Intercontinental Exchange, Inc. USD 1.850% 15/09/2032 2,569,394 0.162,150,000 JPMorgan Chase & Co.(d) EUR 1.001% 25/07/2031 2,276,957 0.1450,000 Kinder Morgan Energy Partners LP USD 4.300% 01/05/2024 46,061 0.00625,000 Kroger Co. USD 3.950% 15/01/2050 637,552 0.04
2,900,000 Laredo Petroleum, Inc. USD 9.500% 15/01/2025 1,659,060 0.10400,000 McDonald’s Corp. USD 4.200% 01/04/2050 428,631 0.03160,000 MetLife, Inc. USD 3.600% 10/04/2024 146,932 0.01850,000 MetLife, Inc.—Series D USD 4.368% 15/09/2023 784,228 0.05
1,450,000 Morgan Stanley EUR 2.375% 31/03/2021 1,463,615 0.09500,000 Morgan Stanley EUR 1.750% 30/01/2025 536,235 0.03900,000 MPLX LP USD 4.500% 15/04/2038 830,719 0.05900,000 NiSource, Inc. USD 3.600% 01/05/2030 869,329 0.05600,000 Pacific Gas & Electric Co. USD 2.500% 01/02/2031 503,519 0.03250,000 Pacific Gas & Electric Co. USD 3.300% 01/08/2040 209,825 0.01500,000 Pacific Gas & Electric Co. USD 3.500% 01/08/2050 419,841 0.03600,000 Phillips 66 USD 3.850% 09/04/2025 558,645 0.03500,000 Phillips 66 USD 1.300% 15/02/2026 419,841 0.03
1,175,000 Prologis Euro Finance LLC EUR 1.000% 06/02/2035 1,236,170 0.08380,000 Sasol Financing USA LLC USD 5.875% 27/03/2024 328,021 0.02500,000 Sunoco Logistics Partners Operations LP USD 5.300% 01/04/2044 435,038 0.03
Goldman Sachs Funds—Global Fixed Income Plus Portfolio (Hedged)Schedule of InvestmentsAs at 30 November 2020
The accompanying notes are an integral part of these financial statements.
472
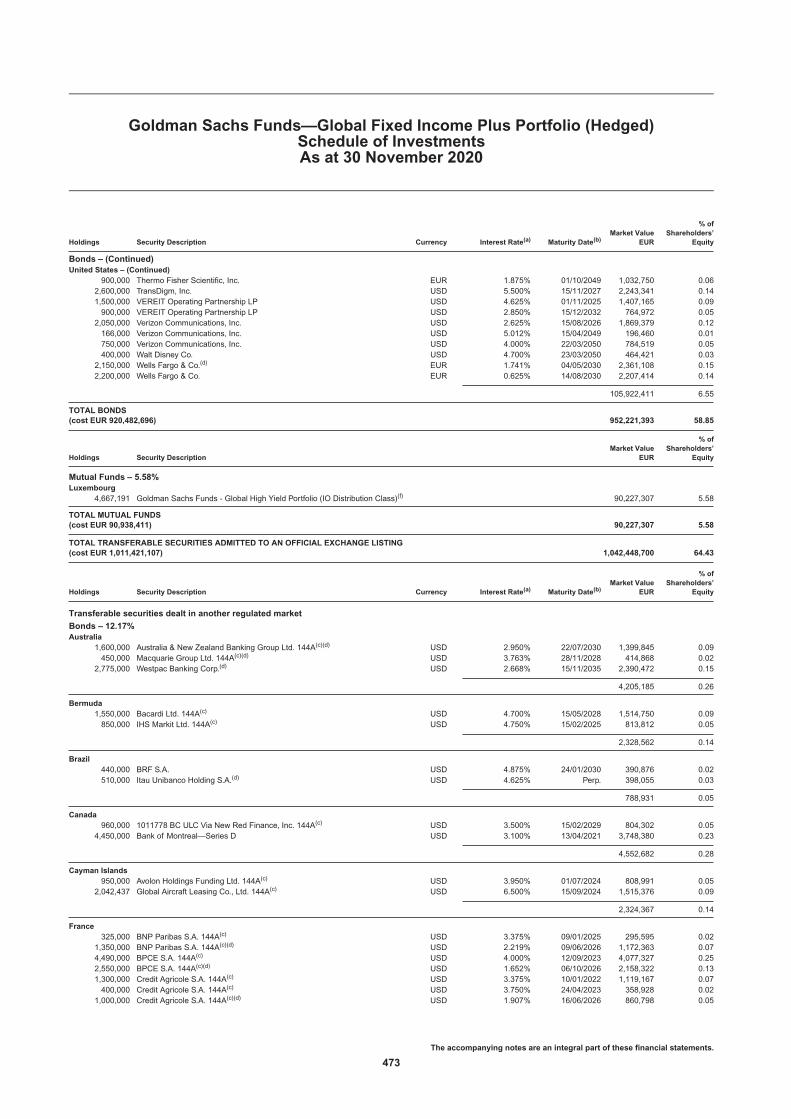
Holdings Security Description Currency Interest Rate(a) Maturity Date(b)Market Value
EUR
% ofShareholders’
Equity
Bonds – (Continued)United States – (Continued)
900,000 Thermo Fisher Scientific, Inc. EUR 1.875% 01/10/2049 1,032,750 0.062,600,000 TransDigm, Inc. USD 5.500% 15/11/2027 2,243,341 0.141,500,000 VEREIT Operating Partnership LP USD 4.625% 01/11/2025 1,407,165 0.09900,000 VEREIT Operating Partnership LP USD 2.850% 15/12/2032 764,972 0.05
2,050,000 Verizon Communications, Inc. USD 2.625% 15/08/2026 1,869,379 0.12166,000 Verizon Communications, Inc. USD 5.012% 15/04/2049 196,460 0.01750,000 Verizon Communications, Inc. USD 4.000% 22/03/2050 784,519 0.05400,000 Walt Disney Co. USD 4.700% 23/03/2050 464,421 0.03
2,150,000 Wells Fargo & Co.(d) EUR 1.741% 04/05/2030 2,361,108 0.152,200,000 Wells Fargo & Co. EUR 0.625% 14/08/2030 2,207,414 0.14
105,922,411 6.55
TOTAL BONDS(cost EUR 920,482,696) 952,221,393 58.85
Holdings Security DescriptionMarket Value
EUR
% ofShareholders’
Equity
Mutual Funds – 5.58%Luxembourg
4,667,191 Goldman Sachs Funds - Global High Yield Portfolio (IO Distribution Class)(f) 90,227,307 5.58
TOTAL MUTUAL FUNDS(cost EUR 90,938,411) 90,227,307 5.58
TOTAL TRANSFERABLE SECURITIES ADMITTED TO AN OFFICIAL EXCHANGE LISTING(cost EUR 1,011,421,107) 1,042,448,700 64.43
Holdings Security Description Currency Interest Rate(a) Maturity Date(b)Market Value
EUR
% ofShareholders’
Equity
Transferable securities dealt in another regulated market
Bonds – 12.17%Australia
1,600,000 Australia & New Zealand Banking Group Ltd. 144A(c)(d) USD 2.950% 22/07/2030 1,399,845 0.09450,000 Macquarie Group Ltd. 144A(c)(d) USD 3.763% 28/11/2028 414,868 0.02
2,775,000 Westpac Banking Corp.(d) USD 2.668% 15/11/2035 2,390,472 0.15
4,205,185 0.26
Bermuda1,550,000 Bacardi Ltd. 144A(c) USD 4.700% 15/05/2028 1,514,750 0.09850,000 IHS Markit Ltd. 144A(c) USD 4.750% 15/02/2025 813,812 0.05
2,328,562 0.14
Brazil440,000 BRF S.A. USD 4.875% 24/01/2030 390,876 0.02510,000 Itau Unibanco Holding S.A.(d) USD 4.625% Perp. 398,055 0.03
788,931 0.05
Canada960,000 1011778 BC ULC Via New Red Finance, Inc. 144A(c) USD 3.500% 15/02/2029 804,302 0.05
4,450,000 Bank of Montreal—Series D USD 3.100% 13/04/2021 3,748,380 0.23
4,552,682 0.28
Cayman Islands950,000 Avolon Holdings Funding Ltd. 144A(c) USD 3.950% 01/07/2024 808,991 0.05
2,042,437 Global Aircraft Leasing Co., Ltd. 144A(c) USD 6.500% 15/09/2024 1,515,376 0.09
2,324,367 0.14
France325,000 BNP Paribas S.A. 144A(c) USD 3.375% 09/01/2025 295,595 0.02
1,350,000 BNP Paribas S.A. 144A(c)(d) USD 2.219% 09/06/2026 1,172,363 0.074,490,000 BPCE S.A. 144A(c) USD 4.000% 12/09/2023 4,077,327 0.252,550,000 BPCE S.A. 144A(c)(d) USD 1.652% 06/10/2026 2,158,322 0.131,300,000 Credit Agricole S.A. 144A(c) USD 3.375% 10/01/2022 1,119,167 0.07400,000 Credit Agricole S.A. 144A(c) USD 3.750% 24/04/2023 358,928 0.02
1,000,000 Credit Agricole S.A. 144A(c)(d) USD 1.907% 16/06/2026 860,798 0.05
Goldman Sachs Funds—Global Fixed Income Plus Portfolio (Hedged)Schedule of InvestmentsAs at 30 November 2020
The accompanying notes are an integral part of these financial statements.
473

Holdings Security Description Currency Interest Rate(a) Maturity Date(b)Market Value
EUR
% ofShareholders’
Equity
Bonds – (Continued)France – (Continued)
1,850,000 Electricite de France S.A. 144A(c) USD 4.500% 21/09/2028 1,840,500 0.121,625,000 Societe Generale S.A. 144A(c)(d) USD 5.375% Perp. 1,404,647 0.09
13,287,647 0.82
Germany1,600,000 Deutsche Bank AG(d) USD 2.222% 18/09/2024 1,361,444 0.08700,000 Deutsche Bank AG(d) USD 2.129% 24/11/2026 590,117 0.04
1,951,561 0.12
Indonesia81,161,000,000 Indonesia Treasury Bond—JPMorgan Chase Bank NA 144A(c)(d) IDR 7.500% 17/06/2035 5,163,113 0.32
Ireland1,700,000 AIB Group Plc. 144A(c) USD 4.750% 12/10/2023 1,557,133 0.10
Mexico200,000 Cemex SAB de CV USD 7.375% 05/06/2027 187,755 0.01200,000 Cemex SAB de CV USD 5.450% 19/11/2029 182,673 0.01270,000 Cemex SAB de CV USD 5.200% 17/09/2030 244,995 0.02390,000 Trust Fibra Uno USD 5.250% 15/12/2024 359,209 0.02
974,632 0.06
Netherlands600,000 Deutsche Telekom International Finance BV 144A(c) USD 4.750% 21/06/2038 644,732 0.04
3,700,000 NXP BV Via NXP Funding LLC 144A(c) USD 3.875% 01/09/2022 3,258,548 0.201,550,000 Syngenta Finance NV 144A(c) USD 4.441% 24/04/2023 1,365,442 0.091,600,000 Syngenta Finance NV 144A(c) USD 4.892% 24/04/2025 1,444,795 0.09
6,713,517 0.42
Supranationals750,000 Broadcom Corp. Via Broadcom Cayman Finance Ltd. USD 3.625% 15/01/2024 674,559 0.04
1,100,000 NXP BV Via NXP Funding LLC Via NXP USA, Inc. 144A(c) USD 3.400% 01/05/2030 1,035,443 0.07
1,710,002 0.11
Switzerland3,100,000 Credit Suisse Group AG 144A(c)(d) USD 2.997% 14/12/2023 2,700,002 0.17750,000 Credit Suisse Group AG 144A(c)(d) USD 7.250% Perp. 708,202 0.04
3,408,204 0.21
United Kingdom2,000,000 Vodafone Group Plc. USD 3.750% 16/01/2024 1,823,484 0.11
United States2,700,000 AbbVie, Inc. USD 2.600% 21/11/2024 2,409,079 0.151,200,000 AbbVie, Inc. USD 4.050% 21/11/2039 1,213,905 0.073,550,000 AbbVie, Inc. USD 4.250% 21/11/2049 3,736,031 0.23350,000 AEP Transmission Co., LLC—Series M USD 3.650% 01/04/2050 355,821 0.02
3,750,000 Air Lease Corp. USD 3.875% 03/07/2023 3,307,334 0.201,020,000 Allison Transmission, Inc. 144A(c) USD 3.750% 30/01/2031 855,633 0.052,000,000 American International Group, Inc. USD 4.375% 30/06/2050 2,166,529 0.131,425,000 Axalta Coating Systems LLC 144A(c) USD 3.375% 15/02/2029 1,208,735 0.072,050,000 Bank of America Corp.(d) USD 3.499% 17/05/2022 1,733,584 0.115,100,000 Bank of America Corp.(d) USD 2.592% 29/04/2031 4,531,307 0.281,850,000 Bank of America Corp.(d) USD 1.922% 24/10/2031 1,558,022 0.101,450,000 Bank of America Corp.(d) USD 4.083% 20/03/2051 1,544,527 0.102,450,000 BBVA USA USD 3.500% 11/06/2021 2,071,599 0.13150,000 Berkshire Hathaway Energy Co. 144A(c) USD 4.250% 15/10/2050 164,173 0.01250,000 Bristol-Myers Squibb Co. USD 4.250% 26/10/2049 283,217 0.02
4,200,000 Broadcom, Inc. USD 3.625% 15/10/2024 3,835,934 0.242,350,000 Broadcom, Inc. USD 4.700% 15/04/2025 2,241,703 0.143,100,000 Broadcom, Inc. USD 4.250% 15/04/2026 2,945,200 0.185,097,000 Broadcom, Inc. USD 3.459% 15/09/2026 4,694,314 0.291,200,000 Carrier Global Corp. 144A(c) USD 2.722% 15/02/2030 1,066,720 0.071,700,000 CCO Holdings LLC Via CCO Holdings Capital Corp. 144A(c) USD 4.250% 01/02/2031 1,477,429 0.092,100,000 Charter Communications Operating LLC Via Charter Communications
Operating Capital USD 4.908% 23/07/2025 2,024,949 0.121,300,000 Charter Communications Operating LLC Via Charter Communications
Operating Capital USD 4.800% 01/03/2050 1,298,223 0.081,425,000 Chemours Co. 144A(c) USD 5.750% 15/11/2028 1,217,644 0.086,425,000 Citigroup, Inc.(d) USD 0.776% 30/10/2024 5,370,905 0.333,950,000 Citigroup, Inc.(d) USD 3.106% 08/04/2026 3,576,322 0.22
Goldman Sachs Funds—Global Fixed Income Plus Portfolio (Hedged)Schedule of InvestmentsAs at 30 November 2020
The accompanying notes are an integral part of these financial statements.
474

Holdings Security Description Currency Interest Rate(a) Maturity Date(b)Market Value
EUR
% ofShareholders’
Equity
Bonds – (Continued)United States – (Continued)
1,700,000 Citigroup, Inc.(d) USD 4.412% 31/03/2031 1,714,087 0.111,575,000 CMS Energy Corp.(d) USD 3.750% 01/12/2050 1,324,796 0.082,700,000 Comcast Corp. USD 3.700% 15/04/2024 2,480,858 0.152,100,000 Comcast Corp. USD 3.950% 15/10/2025 2,008,143 0.121,450,000 Comcast Corp. USD 4.250% 15/10/2030 1,493,843 0.093,475,000 Comcast Corp. USD 3.750% 01/04/2040 3,512,486 0.221,200,000 Comcast Corp. USD 4.700% 15/10/2048 1,415,991 0.091,650,000 Dell International LLC Via EMC Corp. 144A(c) USD 6.020% 15/06/2026 1,669,821 0.10400,000 Dell International LLC Via EMC Corp. 144A(c) USD 4.900% 01/10/2026 389,823 0.02
1,325,000 Dell International LLC Via EMC Corp. 144A(c) USD 5.300% 01/10/2029 1,334,036 0.08250,000 Dell International LLC Via EMC Corp. 144A(c) USD 6.200% 15/07/2030 264,278 0.02500,000 Dentsply Sirona, Inc. USD 3.250% 01/06/2030 459,952 0.03
1,150,000 Diamond Sports Group LLC Via Diamond Sports Finance Co. 144A(c) USD 5.375% 15/08/2026 742,987 0.051,500,000 Dollar Tree, Inc. USD 4.000% 15/05/2025 1,411,592 0.09500,000 East Ohio Gas Co. 144A(c) USD 3.000% 15/06/2050 452,741 0.03700,000 Elanco Animal Health, Inc. USD 5.272% 28/08/2023 633,404 0.04650,000 Energy Transfer Operating LP USD 5.500% 01/06/2027 625,312 0.04
2,150,000 Expedia Group, Inc. USD 3.250% 15/02/2030 1,816,751 0.11700,000 Federal Home Loan Banks USD 2.625% 12/09/2025 644,096 0.04400,000 Federal Home Loan Banks USD 5.625% 14/03/2036 519,472 0.03
1,300,000 Fiserv, Inc. USD 3.200% 01/07/2026 1,215,317 0.07950,000 GE Capital Funding LLC 144A(c) USD 4.400% 15/05/2030 912,881 0.06
2,900,000 Glencore Funding LLC 144A(c) USD 4.125% 30/05/2023 2,603,146 0.161,575,000 Glencore Funding LLC 144A(c) USD 4.125% 12/03/2024 1,431,044 0.09750,000 Hewlett Packard Enterprise Co. USD 4.650% 01/10/2024 709,547 0.04
3,400,000 JPMorgan Chase & Co.(d) USD 3.797% 23/07/2024 3,070,558 0.194,250,000 JPMorgan Chase & Co.(d) USD 2.522% 22/04/2031 3,791,856 0.231,700,000 JPMorgan Chase & Co.(d) USD 2.956% 13/05/2031 1,542,606 0.10950,000 JPMorgan Chase & Co.—Series HH(d) USD 4.600% Perp. 806,441 0.05150,000 Keurig Dr Pepper, Inc. USD 5.085% 25/05/2048 176,286 0.01500,000 Keurig Dr Pepper, Inc. USD 3.800% 01/05/2050 500,771 0.03
1,600,000 Marriott International, Inc.—Series AA USD 4.650% 01/12/2028 1,506,032 0.093,200,000 Mondelez International, Inc. USD 2.750% 13/04/2030 2,926,644 0.184,650,000 Morgan Stanley(d) USD 3.622% 01/04/2031 4,512,076 0.282,725,000 Morgan Stanley(d) USD 5.597% 24/03/2051 3,653,824 0.23950,000 New York Life Insurance Co. 144A(c) USD 3.750% 15/05/2050 939,657 0.06
1,250,000 Nutrition & Biosciences, Inc. 144A(c) USD 1.230% 01/10/2025 1,053,416 0.06500,000 Nutrition & Biosciences, Inc. 144A(c) USD 1.832% 15/10/2027 424,884 0.03900,000 Nutrition & Biosciences, Inc. 144A(c) USD 2.300% 01/11/2030 771,364 0.05300,000 Nutrition & Biosciences, Inc. 144A(c) USD 3.268% 15/11/2040 270,379 0.02
1,050,000 Nutrition & Biosciences, Inc. 144A(c) USD 3.468% 01/12/2050 961,627 0.06650,000 Occidental Petroleum Corp. USD 5.550% 15/03/2026 540,515 0.03450,000 Occidental Petroleum Corp. USD 6.450% 15/09/2036 358,259 0.02
1,150,000 Otis Worldwide Corp. USD 3.112% 15/02/2040 1,051,926 0.06900,000 PepsiCo, Inc. USD 3.625% 19/03/2050 949,143 0.06
2,050,000 Sabine Pass Liquefaction LLC USD 5.625% 01/03/2025 1,976,924 0.12300,000 State of California USD 7.625% 01/03/2040 434,467 0.03200,000 State of Illinois USD 6.725% 01/04/2035 182,722 0.01100,000 Time Warner Cable LLC USD 4.125% 15/02/2021 83,563 0.01500,000 T-Mobile USA, Inc. USD 4.750% 01/02/2028 449,127 0.03
1,150,000 T-Mobile USA, Inc. 144A(c) USD 3.500% 15/04/2025 1,058,397 0.073,600,000 T-Mobile USA, Inc. 144A(c) USD 3.750% 15/04/2027 3,392,232 0.212,800,000 T-Mobile USA, Inc. 144A(c) USD 3.875% 15/04/2030 2,680,022 0.172,500,000 T-Mobile USA, Inc. 144A(c) USD 2.550% 15/02/2031 2,171,106 0.131,350,000 T-Mobile USA, Inc. 144A(c) USD 3.000% 15/02/2041 1,154,177 0.072,000,000 Truist Bank USD 2.250% 11/03/2030 1,752,941 0.11600,000 VEREIT Operating Partnership LP USD 3.400% 15/01/2028 542,083 0.03
1,855,000 Verizon Communications, Inc. USD 4.329% 21/09/2028 1,875,861 0.121,771,000 Verizon Communications, Inc. 144A(c) USD 2.987% 30/10/2056 1,553,720 0.101,525,000 Wells Fargo & Co.(d) USD 5.013% 04/04/2051 1,817,427 0.116,900,000 Wells Fargo Bank NA USD 3.550% 14/08/2023 6,223,604 0.38
145,831,880 9.01
Venezuela11,170,000 Petroleos de Venezuela S.A. USD 6.000% 28/10/2022 297,979 0.02
TOTAL BONDS(cost EUR 197,633,742) 196,918,879 12.17
Goldman Sachs Funds—Global Fixed Income Plus Portfolio (Hedged)Schedule of InvestmentsAs at 30 November 2020
The accompanying notes are an integral part of these financial statements.
475