Embed Size (px)
Citation preview
Journal of Physics Conference Series
OPEN ACCESS
CMS conditions database web application serviceTo cite this article Katarzyna Maria Dziedziniewicz et al 2010 J Phys Conf Ser 219 072048
View the article online for updates and enhancements
You may also likeUsing TAGs to speed up the ATLASanalysis processW Ehrenfeld R Buckingham J Cranshawet al
-
A Tool for Conditions Tag Management inATLASA Sharmazanashvili G Batiashvili GGvaberidze et al
-
Development of Ionic Liquid-TaggedCarbohydrate Building Block forElectrochemical GlycosylationToshiki Nokami Norihiko Sasaki YutaIsoda et al
-
This content was downloaded from IP address 188148149154 on 17122021 at 1455
CMS conditions database web application service
Katarzyna Maria Dziedziniewicz1 Domenico Giordano12 VincenzoInnocente1 Anne-Catherine Le Bihan3 Antonio Pierro2 Zhen XIE4
1 CERN2 INFN-Bari - Bari University Via Orabona 4 Bari 70126 Italy3 Institut Pluridisciplinaire Hubert Curien Strasbourg4 Princeton University
E-mail KatarzynaMariaDziedziniewiczcernch domenicogiordanocernch
vincenzoinnocentecernch alebihanmailcernch antoniopierrocernchi
ZhenXiecernch
Abstract The web application service is part of the condition database system of the CMSexperiment
The application server is built upon condition python API in the CMS offline softwareframework and serves applications and users not involved in the event-processing
The main client of the application server is the condition database web GUI which currentlyexposes three main services the Tag Browser the Global Tag the Historic Chart condition datein terms of their version (TAG) and the interval of validity (IOV)
The global tag component is used by physicists to inspect the organization of the tags ina given data taking or data production while production managers use the web service toproduce such tag hierarchy The History chart plotting service creates dynamic summary anddistribution charts of the payload data in the database Fast graphical overview of differentinformation greatly contributes in monitoring and validating the calibration data stored in thecondition database
1 IntroductionIn order to reconstruct the physical events of CMS experiment[1] the physicists use quantitiesnot changing from event to event and for that reason they are called Not-Event Data TheNot-Event Data also called Condition Data produced by CMS detector are stored in the CMScondition database and can be roughly divided in three groups
bull Configuration data the data needed to bring the detector in running modebull Detector state data the data from any detector subsystem describing its statebull Calibration data the data describing the calibration and alignment of the single pieces of
different subdetector
Calibration Configuration and Detector state data coming from the sub-detectorsrsquocomputers from network devices and from different sources are packed as C++ objects andmoved to the Online condition database hence using ORACLE streaming to the Offline conditiondatabase called ORCOFF (Offline Reconstruction Condition DB Offiline subset) which is themain condition database for the CMS T0 (tier 0)[2]
17th International Conference on Computing in High Energy and Nuclear Physics (CHEP09) IOP PublishingJournal of Physics Conference Series 219 (2010) 072048 doi1010881742-65962197072048
ccopy 2010 IOP Publishing Ltd 1
Each conditions data which is stored in the offline database as POOL-ORA1 objects is alsocalled payload object Each payload object is indexed by its interval of validity (IOV) whilethe payload objects themselves do not contain any time validity related information A IOVsequence can be indexed with another metadata information know as TAG which is a human-readable label describing the version of condition data The IOV index and the TAGs can bedeleted and recreated since it is independent of the data object it points to
When processing large quantity of calibrationalignment data the production manager needsto organize collections of IOV TAGs coming from different data sources ie databases In orderto help the user to manage these collections of IOV and TAGs the concept of Global TAGs wasintroduced It defines the scope of a collection of basic IOV TAGs An ensemble of Global TAGscan be organized in a hierarchy Typically Global TAGs and the TAG hierarchy are used by theproduction manager to organize collections of basic IOV TAGs collected from different sources
In this scenario the CMS condition database web application server is used for back-endpurpose to serve application and users for accessing monitoring and handling these objects
The main client of this application server is the condition database web GUI that exposesthree main services IOV Tag browsing Global tag management and Historical data qualitymonitoring
The organization of this paper is the following In section 2 the architecture of this webapplication service is described in the following three sections the IOV Tag Browsing GlobalTag Management and the History Data Quality Monitoring are described finally last sectionsums up the conclusions
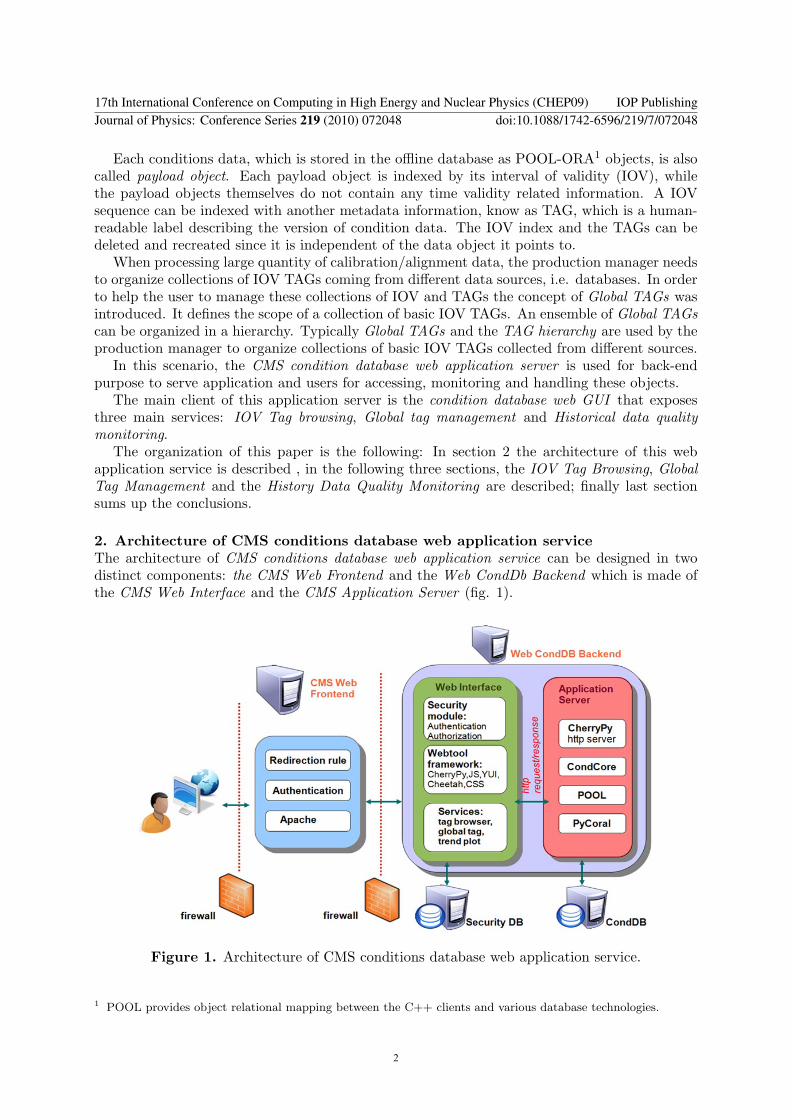
2 Architecture of CMS conditions database web application serviceThe architecture of CMS conditions database web application service can be designed in twodistinct components the CMS Web Frontend and the Web CondDb Backend which is made ofthe CMS Web Interface and the CMS Application Server (fig 1)
Figure 1 Architecture of CMS conditions database web application service
1 POOL provides object relational mapping between the C++ clients and various database technologies
17th International Conference on Computing in High Energy and Nuclear Physics (CHEP09) IOP PublishingJournal of Physics Conference Series 219 (2010) 072048 doi1010881742-65962197072048
2
21 CMS Web FrontendThe front end servers are accessible to the outside world while the Web ConDB Backendmachines are firewalled off from remote access The CMS Web Frontend provides a consistentinterface to logging by showing different pages according to the role the user has inside theCMS collaboration thanks to redirection-rule attribute
This component is shared by all CMS web applications For further details and informationabout the CMS Web Fronted refer to CMS Offline Web Tools[3]
22 Web CondDB BackendThe Web CondDB Backend consists of two layers the web service and the application serverThe web service forwards the user HTTP requests to the application server
All the web services rely heavily on backend databases Oracle (Security database andConditions databases) and layers CMSSW (CondCore) POOL PyCoral2 and CherryPy3Database access is made using POOL and PyCoral that generate SQL queries from CMSSWC++ objects[4]
The HTTP request goes through Application server that converts the HTTP request in ascript run by CMSSW framework and sends that to the oracle server The results go back tothe Web Service in the reverse direction into an HTTP formatted stream Finally the WebService manages the HTTP response displaying the data to the end-users in required format(lists tables or chart reports)
The application server and the web service may be deployed on different hosts They aredeployed with distinct RPM packages4
23 CMS Web InterfaceThe design of the CMS Web Interface is based on a the central class which is called ldquoControllerrdquofrom which these three web service derive from
The webtools framework relies on a very simple plug-in mechanism that allows a separatedevelopment of the components without any central component list
When the application server is run the framework will look up in each entry of python pathfor directories called respectively ldquoModulesrdquo ldquoControllersrdquo or ldquoApplicationsrdquo If any is found itwill attempt to (python) import every file in those directory
The CMS Web Interface is completely implemented in python The reason of webdevelopment using python was driven by strong support for integration with other languages andtools coming with extensive standard libraries Moreover Python combines remarkable powerwith very clear syntax It has modules classes exceptions high level dynamic data types anddynamic typing5 Python had a great set of tools to accommodate our tasks Among a largenumber of possibilities we choose the following components
bull CherryPy an object-oriented HTTP framework in Python with flexible configuration andextension
bull Cheetah template framework6 written in python for presentation layer of web pages
2 The PyCoral package provides a python module named coral exposing the user-level interfaces of CORAL ina native python style Its implementation is based on the C++ CORAL libraries3 CherryPy a pythonic object-oriented HTTP framework4 An RPM package is a single file containing all of the components necessary to install one feature such as asoftware application a group of related utilities a driver or a set or fonts or artwork files5 A dynamic type system is a mechanism by which a compiler generates code to keep track of the sort of data(incidentally still called rdquotyperdquo) used by the program6 Cheetah is an open source template engine and code generation tool
17th International Conference on Computing in High Energy and Nuclear Physics (CHEP09) IOP PublishingJournal of Physics Conference Series 219 (2010) 072048 doi1010881742-65962197072048
3
bull Python decorator7 for Authentication and Authorisation This python-decorator can beused to create a web site that behaves differently according to whether a user is authorizedor not and according to hisher roleThe task that can be performed are
ndash Authentication it means a user is known to the Security database (eg have ahypernews account or are listed in SiteDB for some other reason)
ndash Authorisation it means that a given user is known to the database and has somerole associated to a group or site (for example a Production Operator in thePRODREQUEST region or the Data Manager)
bull Boost-Python a C++ library which enables seamless interoperability between C++ andthe Python programming language
bull PyOFC2 (Python Open Flash Chart 2) a python library to generate JSON 8 data that canbe consumed by Adobe Flash Player9 Charts
The front-end of this python-based framework is a GUI that implements technologies like
bull Cascading Style Sheets (CSS)10 technologies makes web page flexible user friendly andmost important easy to develop and change the design of the web page so that a user feelscomfortable with a standard style for all web pages
bull Cache technologies for instant querying to Data Base if up-to-date data are not neededbull Yahoo Interface Library YUI a set of utilities and controls written in JavaScript for
building richly interactive web applications using techniques such as DOM scriptingDHTML where possible these are reused to provide identical functionality across differentcomponents so that a user learns a single interface to all web tools
bull jQuery a fast and concise JavaScript Library that simplifies event handling animating andAjaj interactions for rapid web development One example among many Javascript Libraryis (Javascript validation) used to assist the users to fill the forms out correctly and simplifythe process of filling out
24 Application ServerThe Application Server is a linux daemon that delivers conditions database query results fromCondCore software (selectively packaged CMSSW) on request
The back-end of this python-based framework contains a python plug-in binding a templateclass that wraps the condition objects and declare a set of methods to be used to inspect thatobjects This approach has several advantages such as being independent from schema changesproviding a common syntax and behaviour to inspect payload class using generic code and beingtransparent to the DB back-end
In the following paragraphs we will describe the web services that can exploit independentlythe application server to inspect the Condition Objects through HTTP requests
3 IOV TAG Browsing ServiceThe IOV TAG Browsing Service allows to discover the version (TAG) and the interval of validity(IOV) of each of set of conditions
7 A Python decorator is a specific change to the Python syntax that allows us to more conveniently alter functionsand methods (and possibly classes in a future version)8 JSON (JavaScript Object Notation) is a lightweight data-interchange format9 Adobe Flash Player is the standard for delivering high-impact rich Web content Designs animation andapplication user interfaces are deployed immediately across all browsers and platforms attracting and engagingusers with a rich Web experience10 Cascading Style Sheets (CSS) is a simple mechanism for adding style (eg fonts colours spacing) to Webdocuments
17th International Conference on Computing in High Energy and Nuclear Physics (CHEP09) IOP PublishingJournal of Physics Conference Series 219 (2010) 072048 doi1010881742-65962197072048
4
A basic IOV tag is produced by calibration or alignment process which uniquely identifiesan IOV sequence It is the lowest level entry point to retrieve time-dependent data from thedatabase It is stored together with the data which can be used directly to retrieve calibrationand alignment data The IOV tag concept is explained here In the tag DB a collection ofbasic IOV tags is stored in the tag inventory Each entry in the basic tag inventory contains thefollowing summary information basic tag name source database(in the format of connectionstring) EventSetup record name payload object name record run time label name timetype ofthe record This service allows a user to view the tags and Interval of Validity (IOV) informationconcerning the conditions data it is like a web interface to CMSSW command line toolseffectively a web interface to CMSSW command line tools The IOV Tag Browsing Serviceconsists of 4 parts
bull The menu header this menu is common to all web service in CMS Condition Database andallows to navigate with the same style between all web services The tabs for the conditiondatabase service (CondDB) are blue while the other CMS services are greyed out (Figure2)
Figure 2 Horizontal tab menu used to navigate between different web service
bull CondDBIOV tag management section it is a menu-driven approach which guides usersthrough their selection of tag eg Task (Detector) Service (service name used to connectto the remote database) Schema (accountrsquos database) To the user is given the possibility tochoose to read data directly from ORACLE database or via Frontier-cache[5] that provideshigh performance data access since given object may be used by thousands of users andby decree data in condition IOV cannot change So caching such information providessignificant performance gains (Figure 3)
Figure 3 IOVTAG Browsing Service section
bull Available tags section it allows a user to browse condition data in terms of IOV and theversion (TAG) In details clicking on a TAG will allow user to view IOV in terms of twointeger values since and till (Figure 4)
bull Export selected data with optional parameters section it allows users to export the selecteddata from production databases to private SQLite file filtering the data choosing the TAGname and the IOV in the form of two integers (the first since and the last till) (Figure 5)
17th International Conference on Computing in High Energy and Nuclear Physics (CHEP09) IOP PublishingJournal of Physics Conference Series 219 (2010) 072048 doi1010881742-65962197072048
5
Figure 4 IOV Tag Browsing Service For each TAG the user can display IOV in terms of twointeger values since and till
4 Global Tag Management ServiceThe global tag component is used by physicists to inspect the organization of the tags in a givendata taking or data production while production managers use the web service to produce suchtag hierarchy
Figure 5 This section of IOVTag Browsing Service allows users to export selected data withoptional parameters The file can be exported by clicking on download button below
The GUI6 allows to select database account and for each database account it is possible tobrowse three section
bull Tree list It shows the list of tag trees for the selected accountbull Tag inventory it shows IOV tags for a selected account in a Select multiple form field with
an internal scroll barbull Tag tree it can be used in two ways to select a tag tree and browse it and for the production
managers to edit the tag tree and its node In details the actions that production managerscan perform are add child node edit node label delete node delete node with childrenview TAG info and view IOV info
5 History Data Quality Monitoring serviceHistory DQM is designed to follow the time evolution of relevant quantities monitored by theDQM tasks The service creates dynamic summaries and distribution charts of these quantitiesstored as condition objects This tool provides the monitoring monitoring of the detectorperformance with reference to time and gives prompt feedback about the stability of data taking
51 Architecture and design of the history DQM toolThe main steps of history DQM are sketched on Figure 7
bull extraction of summary information from DQM and population of the condition databasebull extraction of the summary information from the condition databasebull creation and visualisation of the trend charts by means of the application service described
above
17th International Conference on Computing in High Energy and Nuclear Physics (CHEP09) IOP PublishingJournal of Physics Conference Series 219 (2010) 072048 doi1010881742-65962197072048
6
Figure 6 GUI of Global Tag Management Service
Figure 7 Architecture and design of History DQM
52 The web form of Historical Data Quality MonioringThe web form of Historical Data Quality Monitoring provides access to the summary quantitiesextracted from the Condition DB
The dynamic web form integrated in the web interface (fig 8) guides and aides the userto fill the fields required to get trend charts checking the consistency of given arguments (egit warns the user if some information is missing or incorrect) and suggesting the quantitiesavailable for inspection For example it prompts the corresponding mathematical quantities
17th International Conference on Computing in High Energy and Nuclear Physics (CHEP09) IOP PublishingJournal of Physics Conference Series 219 (2010) 072048 doi1010881742-65962197072048
7
Figure 8 The Web form of Historical Data Quality Monitoring
(mean RMS Landau Gauss etc) for each physical quantities (number of tracks number ofhits etc)
For a given set of summary data through the web form (fig 8) the user can query thefollowing information
(i) the full collection of timestamps(ii) the quantities which have been stored in the database(iii) the corresponding sub-detector regions for which the stored information are available
Dynamic drop down list helps the user to navigate through all the Subdetector regionsinto a dynamic menu tree
As points are concerned (ii) and (iii) each sub detector could have different quantities Thesequantities are retrieved by means of python plugins which provide a flexible way to inspect thedata stored in database by calling methods that access interfaces supported by CMSSW[6]
Besides the basic retrieval of the summary informations from the database are the possibilityto apply preselection cuts on the stored quantities and to remove undesired entries by mean ofblack list field
53 Trend plotsFor the graphics report a web-based plug-in has been chosen since it is more efficient and lesstime consuming than a server-side application like ROOT-CERN11
The ROOT CERN application works well locally but it is not so good for remote operationslike a web server
As the web-based plug-in chart is concerned we chose PyOFC2 (Python Open Flash Chart2) for three reasons
bull it is entirely based on Python like our web servicebull it can read JSON data source generally smaller than a XML document and works faster
with itbull as the user moves the mouse over the chart it displays the values for each line series along
vertical tracking line allowing the users to quickly identify the exact value (run and time)
As an example of chart the figure 9 shows the average number of tracks in the CMS Trackeras a function of time created during the Cosmic Data taking of CMS in Autumn of 2008
11 ROOT is an object-oriented program and library developed by CERN and designed for particle physics dataanalysis
17th International Conference on Computing in High Energy and Nuclear Physics (CHEP09) IOP PublishingJournal of Physics Conference Series 219 (2010) 072048 doi1010881742-65962197072048
8
Figure 9 Mean number of reconstructed tracks per event as a function of run-numbers(progressive number given to a set of contiguous Physics events caraterised by the sameconditions for operation and detector status) This chart is an example of trend plot extractedfrom the Cosmic Data taking of CMS in Autumn of 2008 With the help of the mouse userscan interact directly with the chart Users can point the cursor to the part of chart and see theinformation about the run
6 ConclusionWe discussed the Conditions database web application service for the CMS experiment usingemerging techniques commonly called web 20
The use of standard software such as Cheetah template and various python modules makesthe system reliable highly configurable and easily maintainable
The History-DQM web service has recently been adopted by the CMS DQM System toprovide history for both online and offline monitoring during the last Cosmic Data taking ofCMS in Autumn of 2008
In the future these web services will become more sophisticated incorporating role basedviews of the production system and more complex queries and plots supporting the needs of thewhole CMS DQM community The tool must quickly provide access to hundreds of thousandsof histograms and be tuned to each userrsquos needs The average GUI HTTP response time isaround 10 seconds without cache and usually less 1 second with cache a performance consideredacceptable to the practical needs of the experiment
The development cycle of these web services pointed out the benefits coming from the useof both python and template engine However since a fast turnaround with user requirementsis necessary especially for a huge collaboration like CMS their interfaces could have somemodification
References[1] The CMS Collaboration CMS Physics TDR Volume I Detector Performance and Software Technical Report
CERN-LHCC-2006-001 CMSTDR-008-1 CERN Geneva 2006[2] First experience in operating the population of the condition database for the CMS experiment - CHEP09[3] CMS Offline Web Tools - CHEP 07 J Physics Conference Series 119 (2008) 082007[4] CMS Offline Conditions Framework and Services - CHEP 09[5] CMS Conditions Data access using FronNTier J Phys Conference Series 119 (2008) 072007[6] CMS Computing TDR CERN-LHCC-2005-023 iexclhttpcdswebcernchrecord838359iquest 20 June 2005
17th International Conference on Computing in High Energy and Nuclear Physics (CHEP09) IOP PublishingJournal of Physics Conference Series 219 (2010) 072048 doi1010881742-65962197072048
9
[7] Cond DB web application service httpstwikicernchtwikibinviewCMSCondDBWebDeployment
17th International Conference on Computing in High Energy and Nuclear Physics (CHEP09) IOP PublishingJournal of Physics Conference Series 219 (2010) 072048 doi1010881742-65962197072048
10
CMS conditions database web application service
Katarzyna Maria Dziedziniewicz1 Domenico Giordano12 VincenzoInnocente1 Anne-Catherine Le Bihan3 Antonio Pierro2 Zhen XIE4
1 CERN2 INFN-Bari - Bari University Via Orabona 4 Bari 70126 Italy3 Institut Pluridisciplinaire Hubert Curien Strasbourg4 Princeton University
E-mail KatarzynaMariaDziedziniewiczcernch domenicogiordanocernch
vincenzoinnocentecernch alebihanmailcernch antoniopierrocernchi
ZhenXiecernch
Abstract The web application service is part of the condition database system of the CMSexperiment
The application server is built upon condition python API in the CMS offline softwareframework and serves applications and users not involved in the event-processing
The main client of the application server is the condition database web GUI which currentlyexposes three main services the Tag Browser the Global Tag the Historic Chart condition datein terms of their version (TAG) and the interval of validity (IOV)
The global tag component is used by physicists to inspect the organization of the tags ina given data taking or data production while production managers use the web service toproduce such tag hierarchy The History chart plotting service creates dynamic summary anddistribution charts of the payload data in the database Fast graphical overview of differentinformation greatly contributes in monitoring and validating the calibration data stored in thecondition database
1 IntroductionIn order to reconstruct the physical events of CMS experiment[1] the physicists use quantitiesnot changing from event to event and for that reason they are called Not-Event Data TheNot-Event Data also called Condition Data produced by CMS detector are stored in the CMScondition database and can be roughly divided in three groups
bull Configuration data the data needed to bring the detector in running modebull Detector state data the data from any detector subsystem describing its statebull Calibration data the data describing the calibration and alignment of the single pieces of
different subdetector
Calibration Configuration and Detector state data coming from the sub-detectorsrsquocomputers from network devices and from different sources are packed as C++ objects andmoved to the Online condition database hence using ORACLE streaming to the Offline conditiondatabase called ORCOFF (Offline Reconstruction Condition DB Offiline subset) which is themain condition database for the CMS T0 (tier 0)[2]
17th International Conference on Computing in High Energy and Nuclear Physics (CHEP09) IOP PublishingJournal of Physics Conference Series 219 (2010) 072048 doi1010881742-65962197072048
ccopy 2010 IOP Publishing Ltd 1
Each conditions data which is stored in the offline database as POOL-ORA1 objects is alsocalled payload object Each payload object is indexed by its interval of validity (IOV) whilethe payload objects themselves do not contain any time validity related information A IOVsequence can be indexed with another metadata information know as TAG which is a human-readable label describing the version of condition data The IOV index and the TAGs can bedeleted and recreated since it is independent of the data object it points to
When processing large quantity of calibrationalignment data the production manager needsto organize collections of IOV TAGs coming from different data sources ie databases In orderto help the user to manage these collections of IOV and TAGs the concept of Global TAGs wasintroduced It defines the scope of a collection of basic IOV TAGs An ensemble of Global TAGscan be organized in a hierarchy Typically Global TAGs and the TAG hierarchy are used by theproduction manager to organize collections of basic IOV TAGs collected from different sources
In this scenario the CMS condition database web application server is used for back-endpurpose to serve application and users for accessing monitoring and handling these objects
The main client of this application server is the condition database web GUI that exposesthree main services IOV Tag browsing Global tag management and Historical data qualitymonitoring
The organization of this paper is the following In section 2 the architecture of this webapplication service is described in the following three sections the IOV Tag Browsing GlobalTag Management and the History Data Quality Monitoring are described finally last sectionsums up the conclusions
2 Architecture of CMS conditions database web application serviceThe architecture of CMS conditions database web application service can be designed in twodistinct components the CMS Web Frontend and the Web CondDb Backend which is made ofthe CMS Web Interface and the CMS Application Server (fig 1)
Figure 1 Architecture of CMS conditions database web application service
1 POOL provides object relational mapping between the C++ clients and various database technologies
17th International Conference on Computing in High Energy and Nuclear Physics (CHEP09) IOP PublishingJournal of Physics Conference Series 219 (2010) 072048 doi1010881742-65962197072048
2
21 CMS Web FrontendThe front end servers are accessible to the outside world while the Web ConDB Backendmachines are firewalled off from remote access The CMS Web Frontend provides a consistentinterface to logging by showing different pages according to the role the user has inside theCMS collaboration thanks to redirection-rule attribute
This component is shared by all CMS web applications For further details and informationabout the CMS Web Fronted refer to CMS Offline Web Tools[3]
22 Web CondDB BackendThe Web CondDB Backend consists of two layers the web service and the application serverThe web service forwards the user HTTP requests to the application server
All the web services rely heavily on backend databases Oracle (Security database andConditions databases) and layers CMSSW (CondCore) POOL PyCoral2 and CherryPy3Database access is made using POOL and PyCoral that generate SQL queries from CMSSWC++ objects[4]
The HTTP request goes through Application server that converts the HTTP request in ascript run by CMSSW framework and sends that to the oracle server The results go back tothe Web Service in the reverse direction into an HTTP formatted stream Finally the WebService manages the HTTP response displaying the data to the end-users in required format(lists tables or chart reports)
The application server and the web service may be deployed on different hosts They aredeployed with distinct RPM packages4
23 CMS Web InterfaceThe design of the CMS Web Interface is based on a the central class which is called ldquoControllerrdquofrom which these three web service derive from
The webtools framework relies on a very simple plug-in mechanism that allows a separatedevelopment of the components without any central component list
When the application server is run the framework will look up in each entry of python pathfor directories called respectively ldquoModulesrdquo ldquoControllersrdquo or ldquoApplicationsrdquo If any is found itwill attempt to (python) import every file in those directory
The CMS Web Interface is completely implemented in python The reason of webdevelopment using python was driven by strong support for integration with other languages andtools coming with extensive standard libraries Moreover Python combines remarkable powerwith very clear syntax It has modules classes exceptions high level dynamic data types anddynamic typing5 Python had a great set of tools to accommodate our tasks Among a largenumber of possibilities we choose the following components
bull CherryPy an object-oriented HTTP framework in Python with flexible configuration andextension
bull Cheetah template framework6 written in python for presentation layer of web pages
2 The PyCoral package provides a python module named coral exposing the user-level interfaces of CORAL ina native python style Its implementation is based on the C++ CORAL libraries3 CherryPy a pythonic object-oriented HTTP framework4 An RPM package is a single file containing all of the components necessary to install one feature such as asoftware application a group of related utilities a driver or a set or fonts or artwork files5 A dynamic type system is a mechanism by which a compiler generates code to keep track of the sort of data(incidentally still called rdquotyperdquo) used by the program6 Cheetah is an open source template engine and code generation tool
17th International Conference on Computing in High Energy and Nuclear Physics (CHEP09) IOP PublishingJournal of Physics Conference Series 219 (2010) 072048 doi1010881742-65962197072048
3
bull Python decorator7 for Authentication and Authorisation This python-decorator can beused to create a web site that behaves differently according to whether a user is authorizedor not and according to hisher roleThe task that can be performed are
ndash Authentication it means a user is known to the Security database (eg have ahypernews account or are listed in SiteDB for some other reason)
ndash Authorisation it means that a given user is known to the database and has somerole associated to a group or site (for example a Production Operator in thePRODREQUEST region or the Data Manager)
bull Boost-Python a C++ library which enables seamless interoperability between C++ andthe Python programming language
bull PyOFC2 (Python Open Flash Chart 2) a python library to generate JSON 8 data that canbe consumed by Adobe Flash Player9 Charts
The front-end of this python-based framework is a GUI that implements technologies like
bull Cascading Style Sheets (CSS)10 technologies makes web page flexible user friendly andmost important easy to develop and change the design of the web page so that a user feelscomfortable with a standard style for all web pages
bull Cache technologies for instant querying to Data Base if up-to-date data are not neededbull Yahoo Interface Library YUI a set of utilities and controls written in JavaScript for
building richly interactive web applications using techniques such as DOM scriptingDHTML where possible these are reused to provide identical functionality across differentcomponents so that a user learns a single interface to all web tools
bull jQuery a fast and concise JavaScript Library that simplifies event handling animating andAjaj interactions for rapid web development One example among many Javascript Libraryis (Javascript validation) used to assist the users to fill the forms out correctly and simplifythe process of filling out
24 Application ServerThe Application Server is a linux daemon that delivers conditions database query results fromCondCore software (selectively packaged CMSSW) on request
The back-end of this python-based framework contains a python plug-in binding a templateclass that wraps the condition objects and declare a set of methods to be used to inspect thatobjects This approach has several advantages such as being independent from schema changesproviding a common syntax and behaviour to inspect payload class using generic code and beingtransparent to the DB back-end
In the following paragraphs we will describe the web services that can exploit independentlythe application server to inspect the Condition Objects through HTTP requests
3 IOV TAG Browsing ServiceThe IOV TAG Browsing Service allows to discover the version (TAG) and the interval of validity(IOV) of each of set of conditions
7 A Python decorator is a specific change to the Python syntax that allows us to more conveniently alter functionsand methods (and possibly classes in a future version)8 JSON (JavaScript Object Notation) is a lightweight data-interchange format9 Adobe Flash Player is the standard for delivering high-impact rich Web content Designs animation andapplication user interfaces are deployed immediately across all browsers and platforms attracting and engagingusers with a rich Web experience10 Cascading Style Sheets (CSS) is a simple mechanism for adding style (eg fonts colours spacing) to Webdocuments
17th International Conference on Computing in High Energy and Nuclear Physics (CHEP09) IOP PublishingJournal of Physics Conference Series 219 (2010) 072048 doi1010881742-65962197072048
4
A basic IOV tag is produced by calibration or alignment process which uniquely identifiesan IOV sequence It is the lowest level entry point to retrieve time-dependent data from thedatabase It is stored together with the data which can be used directly to retrieve calibrationand alignment data The IOV tag concept is explained here In the tag DB a collection ofbasic IOV tags is stored in the tag inventory Each entry in the basic tag inventory contains thefollowing summary information basic tag name source database(in the format of connectionstring) EventSetup record name payload object name record run time label name timetype ofthe record This service allows a user to view the tags and Interval of Validity (IOV) informationconcerning the conditions data it is like a web interface to CMSSW command line toolseffectively a web interface to CMSSW command line tools The IOV Tag Browsing Serviceconsists of 4 parts
bull The menu header this menu is common to all web service in CMS Condition Database andallows to navigate with the same style between all web services The tabs for the conditiondatabase service (CondDB) are blue while the other CMS services are greyed out (Figure2)
Figure 2 Horizontal tab menu used to navigate between different web service
bull CondDBIOV tag management section it is a menu-driven approach which guides usersthrough their selection of tag eg Task (Detector) Service (service name used to connectto the remote database) Schema (accountrsquos database) To the user is given the possibility tochoose to read data directly from ORACLE database or via Frontier-cache[5] that provideshigh performance data access since given object may be used by thousands of users andby decree data in condition IOV cannot change So caching such information providessignificant performance gains (Figure 3)
Figure 3 IOVTAG Browsing Service section
bull Available tags section it allows a user to browse condition data in terms of IOV and theversion (TAG) In details clicking on a TAG will allow user to view IOV in terms of twointeger values since and till (Figure 4)
bull Export selected data with optional parameters section it allows users to export the selecteddata from production databases to private SQLite file filtering the data choosing the TAGname and the IOV in the form of two integers (the first since and the last till) (Figure 5)
17th International Conference on Computing in High Energy and Nuclear Physics (CHEP09) IOP PublishingJournal of Physics Conference Series 219 (2010) 072048 doi1010881742-65962197072048
5
Figure 4 IOV Tag Browsing Service For each TAG the user can display IOV in terms of twointeger values since and till
4 Global Tag Management ServiceThe global tag component is used by physicists to inspect the organization of the tags in a givendata taking or data production while production managers use the web service to produce suchtag hierarchy
Figure 5 This section of IOVTag Browsing Service allows users to export selected data withoptional parameters The file can be exported by clicking on download button below
The GUI6 allows to select database account and for each database account it is possible tobrowse three section
bull Tree list It shows the list of tag trees for the selected accountbull Tag inventory it shows IOV tags for a selected account in a Select multiple form field with
an internal scroll barbull Tag tree it can be used in two ways to select a tag tree and browse it and for the production
managers to edit the tag tree and its node In details the actions that production managerscan perform are add child node edit node label delete node delete node with childrenview TAG info and view IOV info
5 History Data Quality Monitoring serviceHistory DQM is designed to follow the time evolution of relevant quantities monitored by theDQM tasks The service creates dynamic summaries and distribution charts of these quantitiesstored as condition objects This tool provides the monitoring monitoring of the detectorperformance with reference to time and gives prompt feedback about the stability of data taking
51 Architecture and design of the history DQM toolThe main steps of history DQM are sketched on Figure 7
bull extraction of summary information from DQM and population of the condition databasebull extraction of the summary information from the condition databasebull creation and visualisation of the trend charts by means of the application service described
above
17th International Conference on Computing in High Energy and Nuclear Physics (CHEP09) IOP PublishingJournal of Physics Conference Series 219 (2010) 072048 doi1010881742-65962197072048
6
Figure 6 GUI of Global Tag Management Service
Figure 7 Architecture and design of History DQM
52 The web form of Historical Data Quality MonioringThe web form of Historical Data Quality Monitoring provides access to the summary quantitiesextracted from the Condition DB
The dynamic web form integrated in the web interface (fig 8) guides and aides the userto fill the fields required to get trend charts checking the consistency of given arguments (egit warns the user if some information is missing or incorrect) and suggesting the quantitiesavailable for inspection For example it prompts the corresponding mathematical quantities
17th International Conference on Computing in High Energy and Nuclear Physics (CHEP09) IOP PublishingJournal of Physics Conference Series 219 (2010) 072048 doi1010881742-65962197072048
7
Figure 8 The Web form of Historical Data Quality Monitoring
(mean RMS Landau Gauss etc) for each physical quantities (number of tracks number ofhits etc)
For a given set of summary data through the web form (fig 8) the user can query thefollowing information
(i) the full collection of timestamps(ii) the quantities which have been stored in the database(iii) the corresponding sub-detector regions for which the stored information are available
Dynamic drop down list helps the user to navigate through all the Subdetector regionsinto a dynamic menu tree
As points are concerned (ii) and (iii) each sub detector could have different quantities Thesequantities are retrieved by means of python plugins which provide a flexible way to inspect thedata stored in database by calling methods that access interfaces supported by CMSSW[6]
Besides the basic retrieval of the summary informations from the database are the possibilityto apply preselection cuts on the stored quantities and to remove undesired entries by mean ofblack list field
53 Trend plotsFor the graphics report a web-based plug-in has been chosen since it is more efficient and lesstime consuming than a server-side application like ROOT-CERN11
The ROOT CERN application works well locally but it is not so good for remote operationslike a web server
As the web-based plug-in chart is concerned we chose PyOFC2 (Python Open Flash Chart2) for three reasons
bull it is entirely based on Python like our web servicebull it can read JSON data source generally smaller than a XML document and works faster
with itbull as the user moves the mouse over the chart it displays the values for each line series along
vertical tracking line allowing the users to quickly identify the exact value (run and time)
As an example of chart the figure 9 shows the average number of tracks in the CMS Trackeras a function of time created during the Cosmic Data taking of CMS in Autumn of 2008
11 ROOT is an object-oriented program and library developed by CERN and designed for particle physics dataanalysis
17th International Conference on Computing in High Energy and Nuclear Physics (CHEP09) IOP PublishingJournal of Physics Conference Series 219 (2010) 072048 doi1010881742-65962197072048
8
Figure 9 Mean number of reconstructed tracks per event as a function of run-numbers(progressive number given to a set of contiguous Physics events caraterised by the sameconditions for operation and detector status) This chart is an example of trend plot extractedfrom the Cosmic Data taking of CMS in Autumn of 2008 With the help of the mouse userscan interact directly with the chart Users can point the cursor to the part of chart and see theinformation about the run
6 ConclusionWe discussed the Conditions database web application service for the CMS experiment usingemerging techniques commonly called web 20
The use of standard software such as Cheetah template and various python modules makesthe system reliable highly configurable and easily maintainable
The History-DQM web service has recently been adopted by the CMS DQM System toprovide history for both online and offline monitoring during the last Cosmic Data taking ofCMS in Autumn of 2008
In the future these web services will become more sophisticated incorporating role basedviews of the production system and more complex queries and plots supporting the needs of thewhole CMS DQM community The tool must quickly provide access to hundreds of thousandsof histograms and be tuned to each userrsquos needs The average GUI HTTP response time isaround 10 seconds without cache and usually less 1 second with cache a performance consideredacceptable to the practical needs of the experiment
The development cycle of these web services pointed out the benefits coming from the useof both python and template engine However since a fast turnaround with user requirementsis necessary especially for a huge collaboration like CMS their interfaces could have somemodification
References[1] The CMS Collaboration CMS Physics TDR Volume I Detector Performance and Software Technical Report
CERN-LHCC-2006-001 CMSTDR-008-1 CERN Geneva 2006[2] First experience in operating the population of the condition database for the CMS experiment - CHEP09[3] CMS Offline Web Tools - CHEP 07 J Physics Conference Series 119 (2008) 082007[4] CMS Offline Conditions Framework and Services - CHEP 09[5] CMS Conditions Data access using FronNTier J Phys Conference Series 119 (2008) 072007[6] CMS Computing TDR CERN-LHCC-2005-023 iexclhttpcdswebcernchrecord838359iquest 20 June 2005
17th International Conference on Computing in High Energy and Nuclear Physics (CHEP09) IOP PublishingJournal of Physics Conference Series 219 (2010) 072048 doi1010881742-65962197072048
9
[7] Cond DB web application service httpstwikicernchtwikibinviewCMSCondDBWebDeployment
17th International Conference on Computing in High Energy and Nuclear Physics (CHEP09) IOP PublishingJournal of Physics Conference Series 219 (2010) 072048 doi1010881742-65962197072048
10
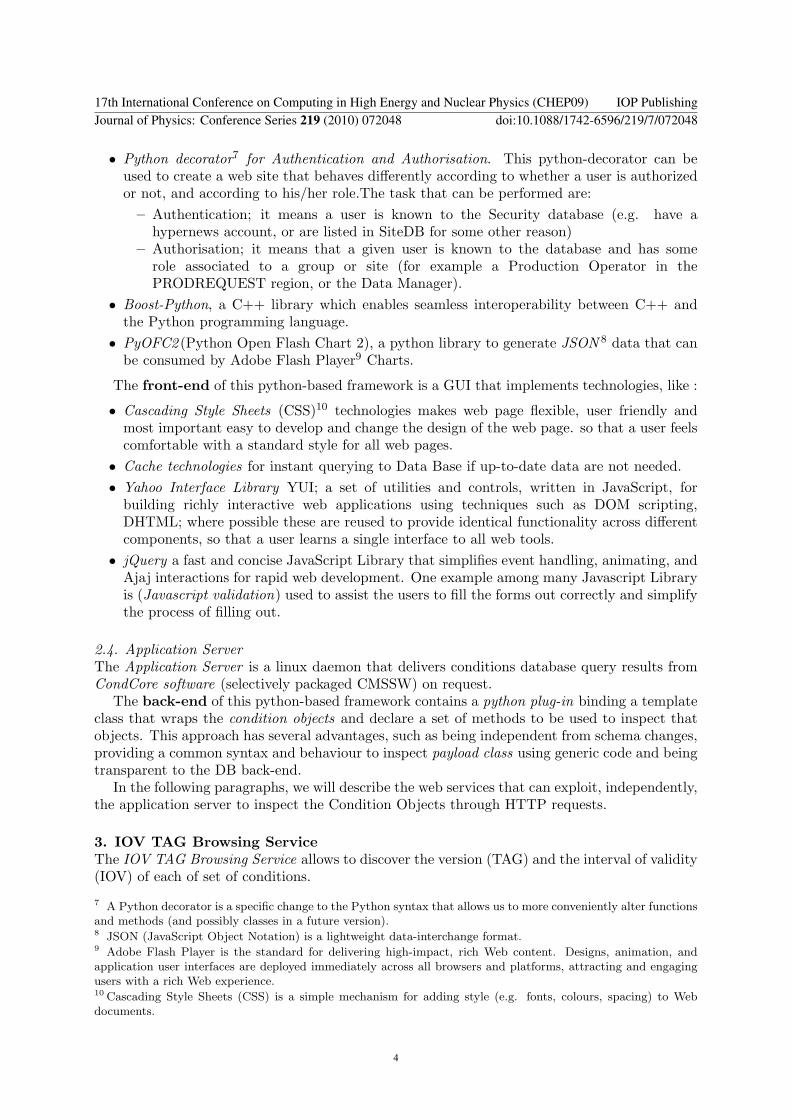
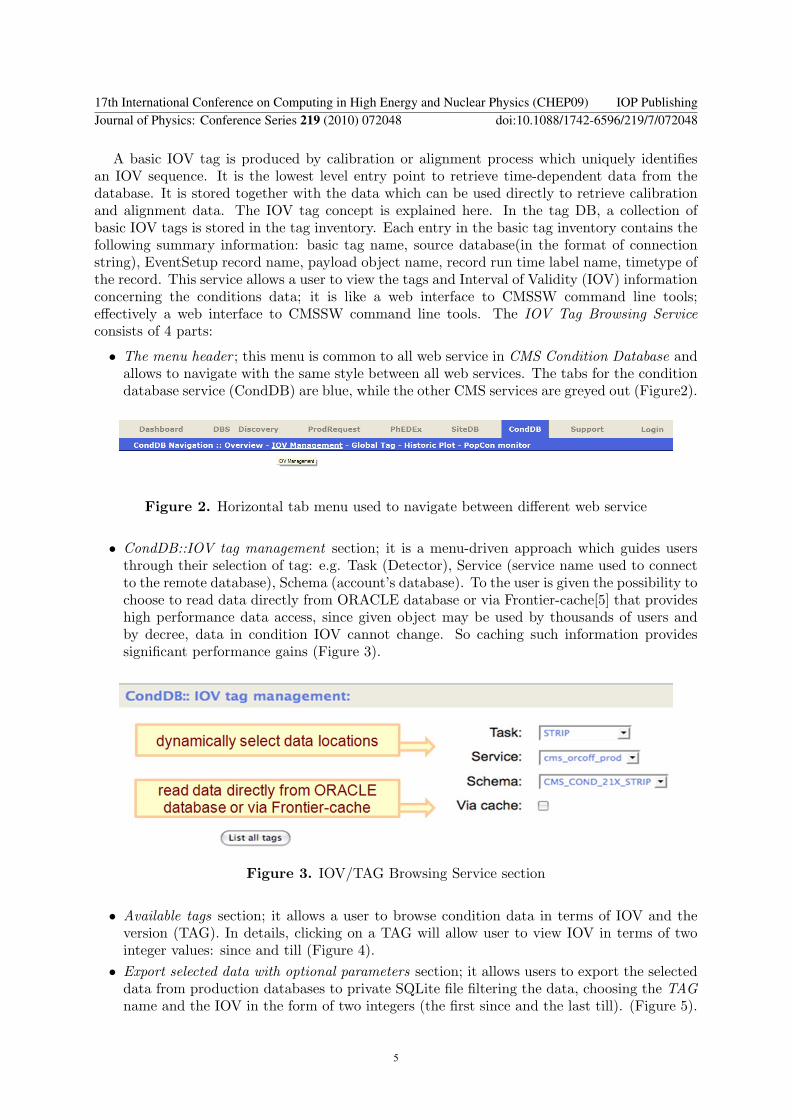
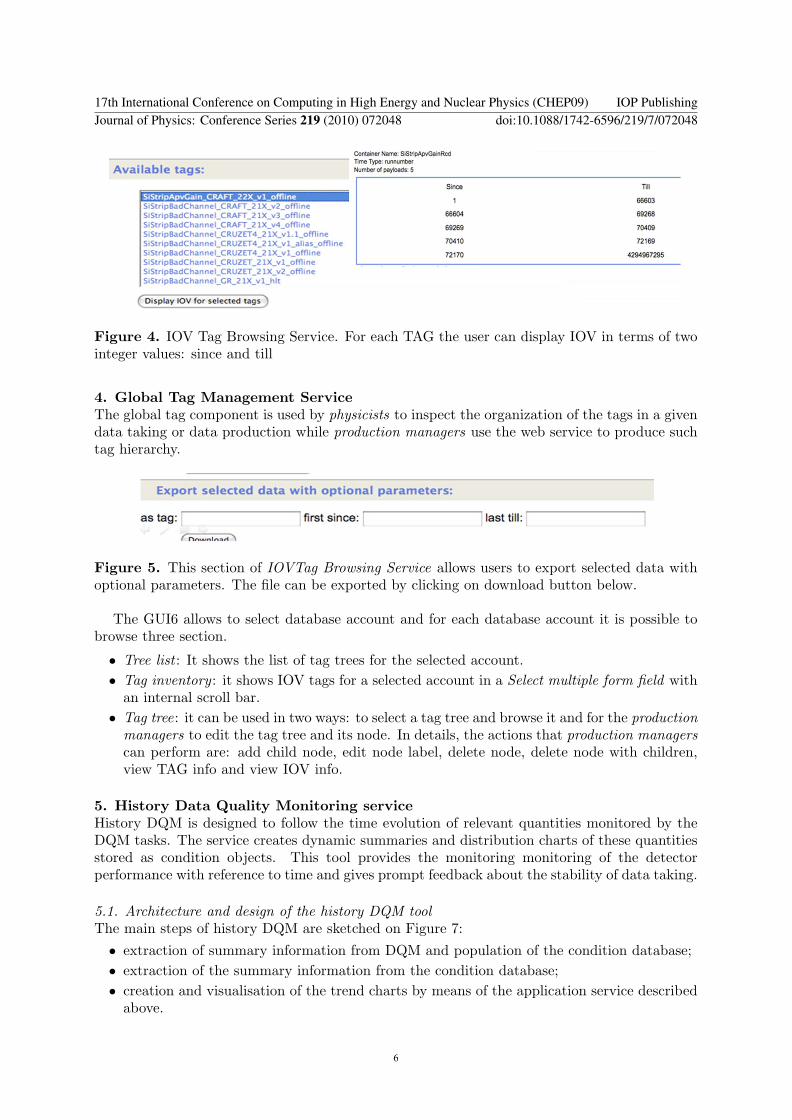
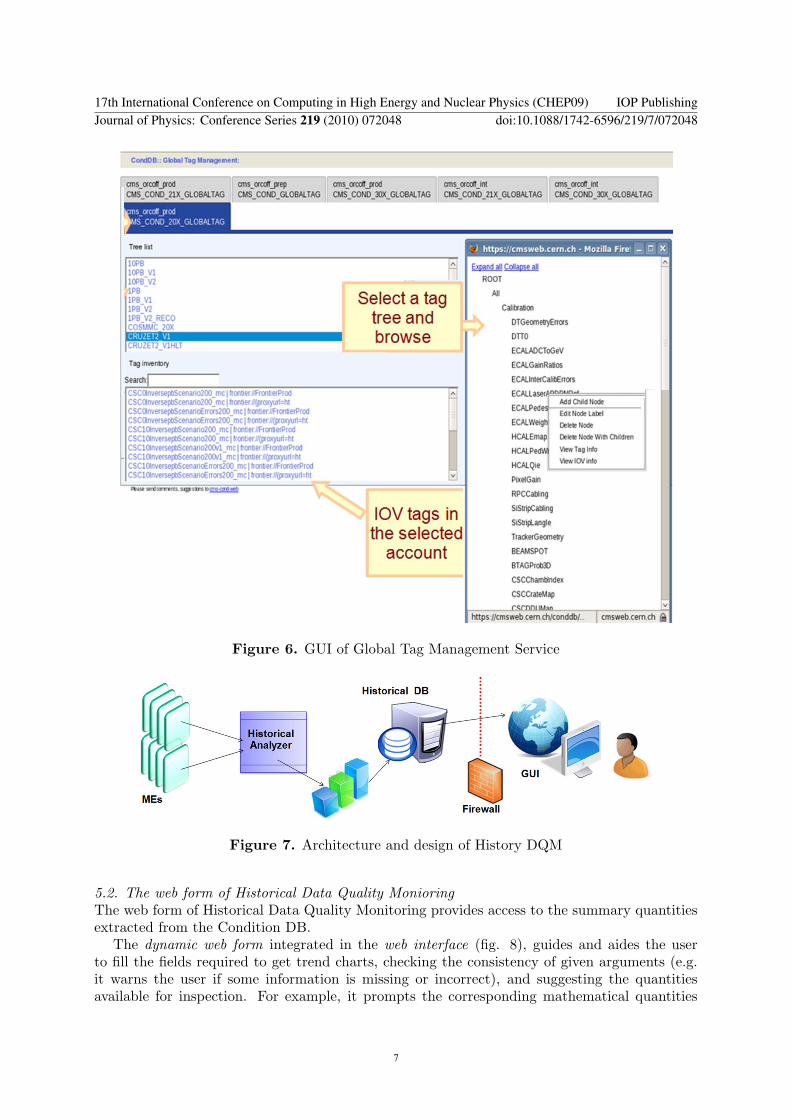
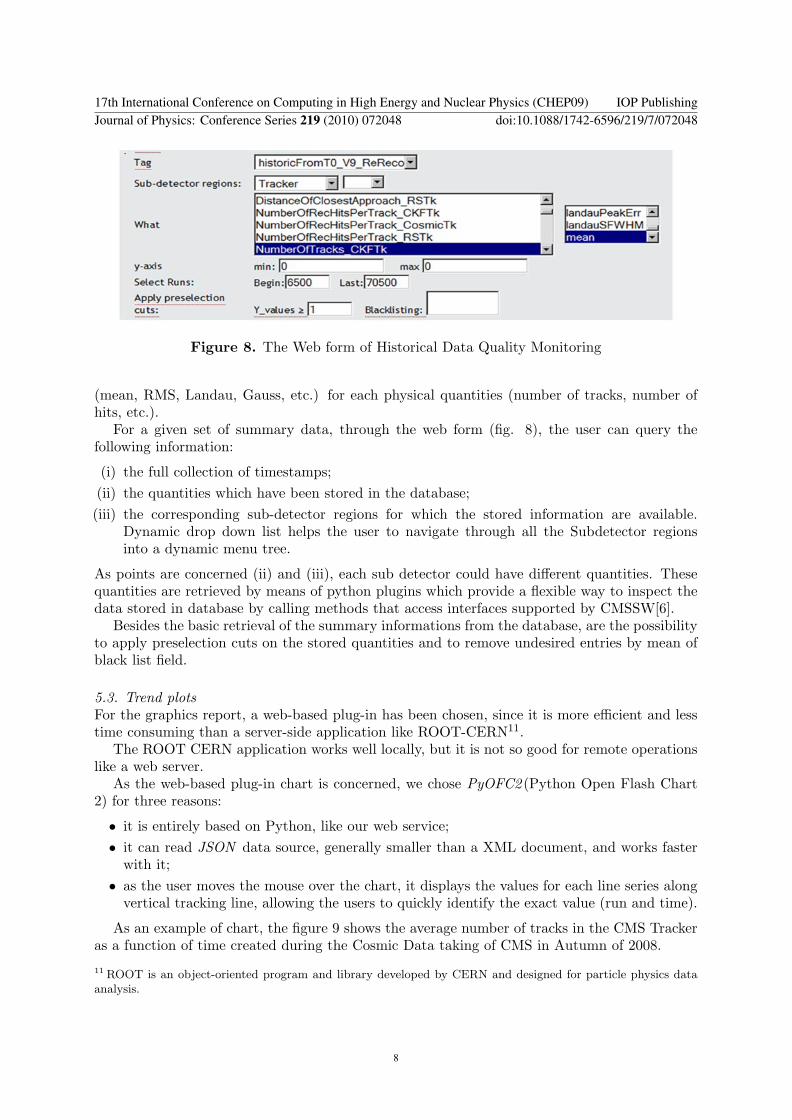
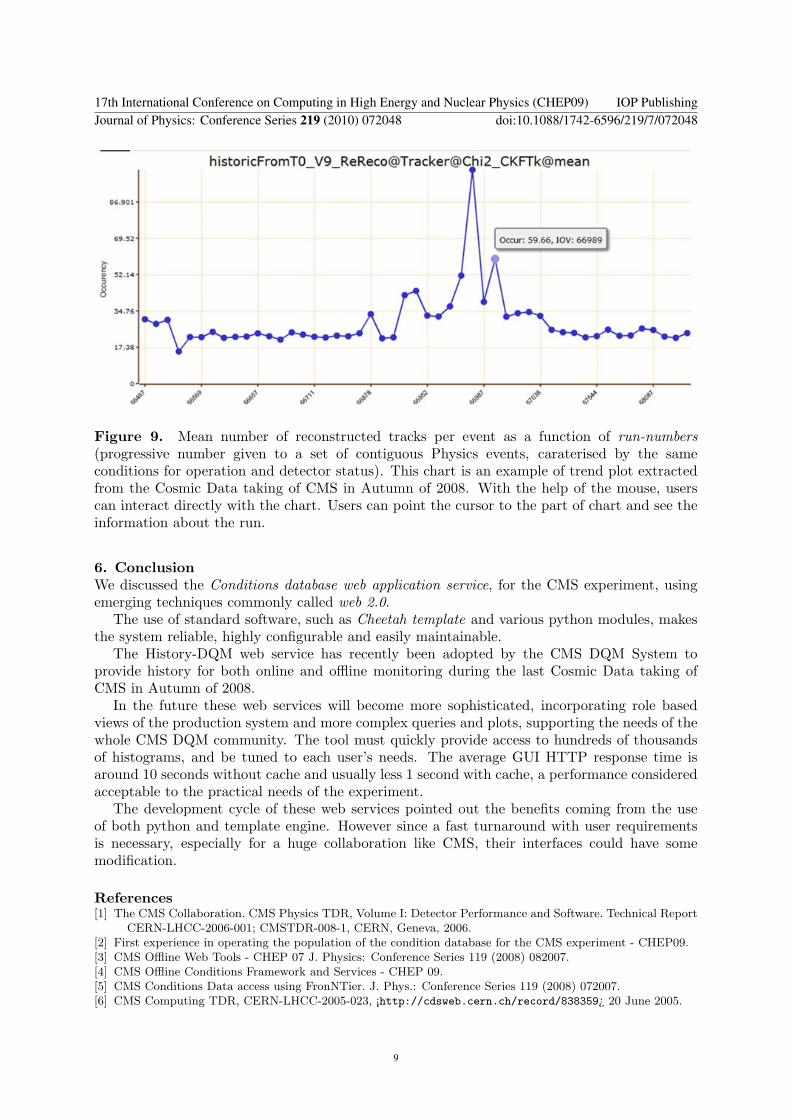

[7] Cond DB web application service httpstwikicernchtwikibinviewCMSCondDBWebDeployment
17th International Conference on Computing in High Energy and Nuclear Physics (CHEP09) IOP PublishingJournal of Physics Conference Series 219 (2010) 072048 doi1010881742-65962197072048
10