Embed Size (px)
Citation preview
Journal of Physics Conference Series
OPEN ACCESS
An Evaluation Quality Framework for AnalysingSchool-Based Learning (SBL) to Work-BasedLearning (WBL) Transition ModuleTo cite this article M Alseddiqi et al 2012 J Phys Conf Ser 364 012118
View the article online for updates and enhancements
You may also likeProcessing synthetic seabed logging(SBL) data using Gaussian ProcessregressionMuhammad Naeim Mohd Aris HanitaDaud and Sarat Chandra Dass
-
Temperature DependentPhotoluminescence of Self-OrganizedInAs Quantum Dots on an InGaAs StrainBuffer Layer Grown by MOCVDKun-Fu Huang Feng-Ming Lee Chih-WeiHu et al
-
Wind-turbine wakes responding to stablystratified flow over complex terrainAntonia Englberger and AndreasDoumlrnbrack
-
This content was downloaded from IP address 93157158162 on 05122021 at 0226
An Evaluation Quality Framework for Analysing School-Based
Learning (SBL) to Work-Based Learning (WBL) Transition
Module
M Alseddiqi R Mishra and C Pislaru
School of Computing and Engineering University of Huddersfield
Huddersfield HD1 3DH UK
E-mail malseddiqihudacuk
Abstract The paper presents the results from a quality framework to measure the effectiveness of
a new engineering course entitled lsquoschool-based learning (SBL) to work-based learning (WBL)
transition modulersquo in the Technical and Vocational Education (TVE) system in Bahrain The
framework is an extended version of existing information quality frameworks with respect to
pedagogical and technological contexts It incorporates specific pedagogical and technological
dimensions as per the Bahrain modern industry requirements Usersrsquo views questionnaire on the
effectiveness of the new transition module was distributed to various stakeholders including TVE
teachers and students The aim was to receive critical information in diagnosing monitoring and
evaluating different views and perceptions about the effectiveness of the new module The analysis
categorised the quality dimensions by their relative importance This was carried out using the
principal component analysis available in SPSS The analysis clearly identified the most important
quality dimensions integrated in the new module for SBL-to-WBL transition It was also apparent
that the new module contains workplace proficiencies prepares TVE students for work placement
provides effective teaching and learning methodologies integrates innovative technology in the
process of learning meets modern industrial needs and presents a cooperative learning
environment for TVE students From the principal component analysis finding to calculate the
percentage of relative importance of each factor and its quality dimensions was significant The
percentage comparison would justify the most important factor as well as the most important
quality dimensions Also the new re-arranged quality dimensions from the finding with an
extended number of factors tended to improve the extended version of the quality information
framework to a revised quality framework
1 Introduction
The Quality Assurance Authority for Education and Training (QAAET) examined the quality of TVE in
Bahrain [1] and the audit was conducted by QAAETrsquos own team of reviewers The main focus was to
monitor the educational system and measure the effectiveness of the TVE system with respect to four
quality indicators
25th International Congress on Condition Monitoring and Diagnostic Engineering IOP PublishingJournal of Physics Conference Series 364 (2012) 012118 doi1010881742-65963641012118
Published under licence by IOP Publishing Ltd 1
A- Studentsrsquo participation
It was found that most students were unable to participate sufficiently in the theoretical modules They
were not motivated or encouraged by teachers to practise various employability skills in the class
However there were some good lessons in the practical modules where students worked together
effectively when given the chance to experience the workplace It was obvious that most TVE students
were not able to practise analytical thinking skills communicate effectively with others feel confident or
show awareness and responsibility in their behaviour [1]
B- Teaching and learning strategy
The existing teaching and learning strategy gave little attention to motivation and feedback processes The
team could not identify any strategy for teaching and learning and teaching and learning were mainly
based on the teachersrsquo experience
C- TVE curricula
Few of the employability skills required by industry were integrated in either theoretical or practical
learning modules For example in practical modules students acquired applied skills satisfactorily most
of them dealt with ICT skills adequately and gained specific technical skills such as machine operation
However teachers tended to give instructions which did not give the students opportunity to expand their
knowledge and understanding
D- TVE career guidance services
Career guidance services provided important information to students during the transition period from
SBL to WBL delivering an induction programme prior to WBL However this induction programme was
short and did not include details of the employability skills required by industry In addition to the
limitations identified by the QAAET study the authors claimed that further quality indicators should be
used to measure the effectiveness of the entire TVE system They proposed the development of a new
framework for measuring the effectiveness of the system and reviewed existing quality models from the
literature in order to select ones that might be modified to make them suitable for the Bahraini TVE
systemrsquos specific needs
2 Information Quality Frameworks
Richard Wang and Diana Strong in 1996 [2] initiated original work for setting standards for information
quality frameworks Their purpose was to critically evaluate usersrsquo viewpoints towards the content of e-
learning systems and give priority to quality as an evaluation of excellence [3] For example in TVE
developmental projects in Bahrain top priority was given to restructuring the learning content adopting
new teaching and learning methods and integrating technology in the learning environment On the other
hand less attention was given to evaluating the effectiveness of the newly developed projects and their
characteristics It was also indicated that a specific framework for evaluating e-learning systems in TVE
was essential in evaluating their effectiveness
It was obvious that pedagogical and technological aspects could not continually improve without a
quality evaluation process An information quality framework would assist TVE people to measure the
effectiveness of e-learning content and motivate them to create innovative content that meets modern and
local industrial needs [4]
Table 1 presents various information quality frameworks which grew from the original work of Wang
and Strong [2] It is apparent that the frameworks have the same four quality factors as presented by Wang
and Strong however differences appear in the quality dimensions The justification was that each
framework was formulated to meet specific requirements In total 19 quality dimensions were found in
25th International Congress on Condition Monitoring and Diagnostic Engineering IOP PublishingJournal of Physics Conference Series 364 (2012) 012118 doi1010881742-65963641012118
2
the literature The authors believe that these frameworks are generic and could be used for any e-learning
systems content For the purpose of the SBL-to-WBL transition module some specific elements should be
added to measure pedagogical issues related to specific industrial needs A closer study of the existing
models found that they did not include quality of the e-learning content corresponding to pedagogical and
industrial workplace requirements At best the model is generic and cannot be used for specific
engineering application-based courses
Table 1 Comparison among Information Quality Frameworks
DataInform
ation
Quality
Framework
Quality Factors
Intrinsic Quality
Dimensions Contextual Quality Dimensions
Representational Quality
Dimensions
Accessibility Quality
Dimensions
Bel
iev
abil
ity
Acc
ura
cy
Ob
ject
ivit
y
Rep
uta
tio
n
Con
sist
ency
Val
ue-
added
Rel
evan
cy
Tim
elin
ess
Co
mp
lete
nes
s
Am
oun
t o
f In
form
atio
n
Ver
ifia
bil
ity
Inte
rpre
tab
ilit
y
Eas
e o
f U
nder
stan
din
g
Rep
rese
nta
tional
Con
sist
ency
Con
cise
Rep
rese
nta
tion
Acc
essi
bil
ity
Acc
ess
Sec
uri
ty
Res
pon
se T
ime
Av
aila
bil
ity
Wang amp
Strong (1996) Х Х Х Х Х Х Х Х Х Х Х Х Х Х Х
Gertz (1996) Х Х Х Х Х
Redman
(1996) Х Х Х Х Х Х Х Х Х Х
Zeist amp
Hendriks
(1996)
Х Х Х Х Х Х Х
Jarke amp Vassiliou
(1997) Х Х Х Х Х Х Х Х Х Х Х
Chen et al
(1998) Х Х Х Х Х Х
Alexander amp
Tate (1999) Х Х Х Х Х Х Х Х Х
Dedeke (2000)
Х Х Х Х Х Х Х Х Х
Zhu amp Gauch
(2000) Х Х Х Х Х Х
Leung (2001) Х Х Х Х Х Х Х Х
Khahn et al
(2002) Х Х Х Х Х Х Х Х Х Х
Klein (2002) Х Х Х Х Х Х
Mecell et al
(2002) Х Х Х Х
Liu amp Han (2005)
Х Х Х Х Х Х Х Х Х
Besiki et al
(2007) Х Х Х Х Х Х Х
Alkhattabi et
al (2010) Х Х Х Х Х Х Х Х Х Х Х Х Х Х
25th International Congress on Condition Monitoring and Diagnostic Engineering IOP PublishingJournal of Physics Conference Series 364 (2012) 012118 doi1010881742-65963641012118
3
3 The Extended Information Quality Framework
The authors proposed an extended information quality framework as shown in figure 1 It includes 25
quality dimensions divided between quality of pedagogical context and quality of technological context
- Quality of pedagogical context The quality dimensions used in the evaluation are divided equally
among the following indexes intrinsic content quality contextual content quality integration content
quality and representation content quality In total there are 20 quality dimensions in this context 13
identified from the existing quality models (believability accuracy objectivity reputation
consistency value-added relevancy timeliness completeness amount of information verifiability
interpretability and ease of understanding) and seven from the skills requirements of Bahraini industry
(integration of skills cultural awareness personal and social attributes emotional intelligence
reflection skills depth of knowledge and motivation) [5]
- Quality of technological context There are five quality dimensions to assess the effectiveness of the
technological context accessibility security response time availability and interactivity These
dimensions were incorporated from quality frameworks available in the existing information quality
frameworks
Figure 1 The extended quality framework
4 The Questionnaire
A questionnaire is a set of questions to elicit responses aimed to achieve certain research objectives [6]
The questionnaire was designed in such a way as to engage the respondentsrsquo interest encourage co-
operation and extract reliable and accurate data
25th International Congress on Condition Monitoring and Diagnostic Engineering IOP PublishingJournal of Physics Conference Series 364 (2012) 012118 doi1010881742-65963641012118
4
From the above figure an extended information quality framework was designed on the basis of the
information quality frameworks [3] and the identified skills needs from modern industry [5] The
questionnairersquos main objective was to receive critical information in evaluating different perceptions about
the effectiveness of the new SBL-to-WBL transition module The respondents were asked to give brief
information and to categorise 25 different quality dimensions in terms of their importance in the new
module The respondents were the users of the new module (TVE teachers and TVE students)
Regarding this questionnaire development process it has seen that the questionnaire was drafted and
constructed for different users However the clarity of the questionnaire was examined to eliminate
overlapping ideas evaluate the validity of the questions and ensure that important elements are reflected
in the questionnaires [7]
The questionnaire questions were generated from the extended information quality framework
identified earlier in this paper There were 25 questions each one represents a quality dimension The
questions here were accommodated with opinions and attributes data variables (Saunders et al 2003)
Each question was designed in such a way that it would engage the respondentsrsquo interest encourage co-
operation and extract reliable and accurate data The questions were carefully selected to test a variety of
conditions Moreover the questions were grouped and classified according to the purpose of this
questionnaire Moreover the questions were designed with simple words to avoid ambiguity and to be
easily understood and followed [8] A clear sequence was followed to structure the questions with an
accurate plan to avoid confusion [9] The sample size was 48 teachers and 30 students They were the
users of the new SBL-to-WBL transition module The above clarified that it was convenient that the
research sought data from stakeholders who would be informative It was decided to use purposive
sampling In terms of rating scales the questions were adopted with a 5-point Likert Response Scale [10]
The respondents were asked to record the degree of their perception of each question on the 5-point scale
1- Strongly agree 2- Agree 3- Neither agree nor disagree 4- Disagree and 5- Strongly disagree
5 Data Analysis
The next section is an analysis which categorised the quality dimensions by their relative importance This
was carried out using the principal component analysis available in SPSS It should clearly identify the
most important quality dimensions integrated in the new module for SBL-to-WBL transition The
principal component analysis began with the descriptive statistics It was based on the mean and standard
deviation for all the variables from the investigation The mean value was identified as the central
tendency value for average value of distribution and the standard deviation was the dispersion value for
the total respondents of 67 [11] Table 2 presents the descriptive statistics for the variables The highest
mean values were 455 and 454 for response time and integration of skills respectively In addition all
the dimensions were of vital importance it was obvious that the average scores of all the evaluative items
are above the mid-point (3) of the 5-point Likert scale The descriptive statistics were more meaningful as
they showed that all the dimensions are important from the usersrsquo point of view Therefore this output
gives the necessary information of the variablesrsquo distribution
25th International Congress on Condition Monitoring and Diagnostic Engineering IOP PublishingJournal of Physics Conference Series 364 (2012) 012118 doi1010881742-65963641012118
5
Table 2 Descriptive statistics for the variables
No Dimension Mean Std
Deviation
Analys
is N
1 Believability 393 1283 67
2 Accuracy 384 979 67
3 Objectivity 387 1153 67
4 Reputation 401 992 67
5 Consistency 412 640 67
6 Value-added 421 1067 67
7 Relevancy 446 745 67
8 Timeliness 361 778 67
9 Completeness 445 658 67
10 Amount of information 364 1322 67
11 Integration of skills 454 502 67
12 Cultural awareness 416 881 67
13 Personal and social attributes 439 549 67
14 Emotional intelligence 400 718 67
15 Reflection skills 437 546 67
16 Interpretability 436 690 67
17 Ease of understanding 373 1038 67
18 Depth of knowledge 430 739 67
19 Representational Verifiability 433 533 67
20 Motivation 419 764 67
21 Accessibility 376 955 67
22 Security 409 1083 67
23 Response time 455 558 67
24 Availability 394 756 67
25 Interactivity 433 705 67
Once the descriptive statistics have been introduced it is important to identify correlations among
them Here the analysis measures two variables namely strength and direction This analysis has an
important implication for correlation among the various factors Table 3 presents an example of the R-
matrix correlations table for only four variables of the analysis According to Sinn [12] the first
correlation is the Pearson correlation which specifies that the larger value is the better with either (-) or (+)
direction this is called r-value The second correlation is the p-value which indicates that the correlation
is significant at the 005 level (2-tailed) N is the total number of respondents in this case 67
25th International Congress on Condition Monitoring and Diagnostic Engineering IOP PublishingJournal of Physics Conference Series 364 (2012) 012118 doi1010881742-65963641012118
6
Table 3 An example of correlation
It was obvious that all the values of the Pearson correlation with () must reject the hypothesis Ho
This ensures accurate correlation with the test score For example Figure 2 shows the correlation between
the objectivity dimension and the accuracy dimension
Figure 2 An example of correlation
The example indicates that the p-value is below the 005 level therefore this gives confidence that
there is an actual correlation with the test score [12]
Table 4 shows the output measures for all the dimensions before and after extractions The initial
statement is that all the variables are ordinary with the value of 1 [11] This value is assumed before
extraction After extraction each dimension is converted to an accurate value For example 86 of the
variance of the scores for lsquoamount of informationrsquo in explanation for the common factors is extracted by
this analysis For measuring the reliability of factor analysis two tests are illustrated in table 5 namely
the Kaiser-Meyer-Olkin (KMO) test and Bartlettrsquos Test of Sphericity
Kaiser-Meyer-Olkin measures sampling accuracy KMO value is recommended to be between 0 and 1
The reliability of factors is increased when the value is close to 1 [3] In this case table 5 displays the
value of 0738 which indicates that this analysis had and adequate sample size
Bartlettrsquos test measures how significant the factor analysis is with respect to the null hypothesis The
significant value tends to be less than 005 [3] With regard to the correlation coefficient value of zero
this indicates that the test is significant with an appropriate factor analysis The tests indicated that the
sample size is suitable to analyse this set of data
25th International Congress on Condition Monitoring and Diagnostic Engineering IOP PublishingJournal of Physics Conference Series 364 (2012) 012118 doi1010881742-65963641012118
7
Table 4 Variable communalities
No Dimension Initial Extracti
on
1 Believability 1000 634
2 Accuracy 1000 692
3 Objectivity 1000 667
4 Reputation 1000 677
5 Consistency 1000 566
6 Value-added 1000 697
7 Relevancy 1000 780
8 Timeliness 1000 785
9 Completeness 1000 636
10 Amount of information 1000 859
11 Integration of skills 1000 811
12 Cultural awareness 1000 630
13 Personal and social attributes 1000 600
14 Emotional intelligence 1000 511
15 Reflection skills 1000 716
16 Interpretability 1000 654
17 Ease of understanding 1000 709
18 Depth of knowledge 1000 792
19 Representational Verifiability 1000 681
20 Motivation 1000 610
21 Accessibility 1000 726
22 Security 1000 772
23 Response time 1000 712
24 Availability 1000 771
25 Interactivity 1000 590
Extraction Method Principal Component Analysis
Table 5 KMO and Bartlettrsquos Test
Kaiser-Meyer-Olkin Measure of Sampling Adequacy 738
Bartletts Test of Sphericity Approx Chi-Square 685912
df 300
Sig 000
Table 6 presents the extracted factors for the data analysed Specifically it displays the initial
proportion of variance accounted for each factor followed by the proportion of variance accounted before
rotation and finally the proportion of variance accounted after rotation [11] Bear in mind the 25 factors
accounted for all the variance in the test of the principal component analysis
It appeared that the initial eigenvalues incorporated the total variance for each dimension then the
percentage of variance and the cumulative percentage were obtained for each individual factor For
example factor one has a total variance of 6809 Then the factor variance percentage is equal to 27235
by dividing the factor total variance by the total number of tests 25
25th International Congress on Condition Monitoring and Diagnostic Engineering IOP PublishingJournal of Physics Conference Series 364 (2012) 012118 doi1010881742-65963641012118
8
Table 6 Total Variance Explained
Co
mp
on
en
t
Initial Eigenvalues Extraction Sums of Squared
Loadings Rotation Sums of Squared Loadings
To
tal
o
f V
ari
an
ce
Cu
mu
lati
ve
To
tal
o
f V
ari
an
ce
Cu
mu
lati
ve
To
tal
o
f V
ari
an
ce
Cu
mu
lati
ve
1 6809 27235 27235 6809 27235 27235 5716 22866 22866
2 2355 9419 36655 2355 9419 36655 2270 9078 31944
3 1760 7040 43694 1760 7040 43694 1727 6908 38852
4 1528 6112 49806 1528 6112 49806 1609 6437 45289
5 1373 5492 55297 1373 5492 55297 1597 6387 51676
6 1268 5071 60369 1268 5071 60369 1515 6061 57737
7 1171 4685 65053 1171 4685 65053 1508 6032 63770
8 1016 4065 69119 1016 4065 69119 1337 5349 69119
9 925 3701 72820
10 793 3173 75993
11 780 3118 79111
12 727 2909 82020
13 626 2505 84525
14 557 2228 86753
15 540 2162 88915
16 472 1887 90801
17 449 1797 92599
18 391 1563 94162
19 321 1284 95445
20 299 1196 96641
21 259 1034 97676
22 195 780 98456
23 157 628 99084
24 125 499 99583
25 104 417 100000
Extraction Method Principal Component Analysis
Based on Kaiserrsquos criterion the factors with eigenvalues less than one were excluded With reference
to Table 6 factors 9-25 were not counted The table also shows that the eight factors that meet the
criterion value of Kaiser were given the cumulative percentage of 692
The second part of the table concerned the extraction sums of squared loadings It contained the same
output for initial eigenvalues however only the first eight factors were included The final part of the
table represents the rotation sums of squared loadings showing the rotated values for the eight factors
which met the Kaiserrsquos criterion value
Figure 3 presents the scree plot The x-axis gives the total number of factors extracted and the y-axis
represents the eigenvalues
It was noticed that the factors with an eigenvalue above the value of 1 appeared sharply in the above
figure Then the curve started to flatten out from component nine where the eigenvalues were below the
value of 1 The figure clearly shows that the only retained components are the ones with eigenvalues
greater than 1
25th International Congress on Condition Monitoring and Diagnostic Engineering IOP PublishingJournal of Physics Conference Series 364 (2012) 012118 doi1010881742-65963641012118
9
Figure 3 The scree plot
Table 7 shows the rotated components matrix It is defined as a matrix of the factor loading for each
variable onto each factor Therefore the table assists in categorising factors into eight components through
their loading values In this analysis the loadings value of factors less than 05 would not be displayed
In component one there are seven factors from the 25 quality dimensions namely believability
reputation consistency value-added relevancy timeliness and amount of information Component two
comprises accuracy accessibility security and availability component three completeness
interpretability and depth of knowledge and component four ease of understanding representational
verifiability and response time component five the integration of skills and personal and social attributes
component six objectivity and interactivity and the last component has two quality dimensions reflection
skills and motivation
SPSS attempts to correlate the most significant factors with high variance According to total variance
explained in Table 6 there are eight factors with higher variance than the remaining factors The scree plot
in Figure 3 confirmed this finding the eight factors with eigenvalue above being sharply delineated Table
8 shows the output from SPSS after grouping the quality dimensions into eight factors
25th International Congress on Condition Monitoring and Diagnostic Engineering IOP PublishingJournal of Physics Conference Series 364 (2012) 012118 doi1010881742-65963641012118
10
Table 7 Rotated component matrix
Dimension Component
1 2 3 4 5 6 7 8
Believability 716
Accuracy 782
Objectivity 564
Reputation 744
Consistency 609
Value-added 695
Relevancy 779
Timeliness 540
Completeness 548
Amount of information
734
Integration of skills 865
Cultural awareness 708
Personal and social
attributes 520
Emotional intelligence 513
Reflection skills 828
Interpretability 714
Ease of understanding 819
Depth of knowledge 752
Representational
Verifiability 586
Motivation 608
Accessibility 759
Security 749
Response time 794
Availability 776
Interactivity 612
Extraction Method Principal Component Analysis
Rotation Method Varimax with Kaiser Normalization
Table 8 The SPSS output Factor
Number Quality Dimensions
1 Believability Reputation Consistency Value-added Relevancy Timeliness Amount of information
2 Accuracy Accessibility Security Availability
3 Completeness Interpretability Depth of
knowledge
4 Ease of
understanding
Representational
Verifiability
Response
time
5 Integration of
skills
Personal and social
attributes
6 Cultural
awareness Emotional intelligence
7 Objectivity Interactivity
8 Reflection skills Motivation
25th International Congress on Condition Monitoring and Diagnostic Engineering IOP PublishingJournal of Physics Conference Series 364 (2012) 012118 doi1010881742-65963641012118
11
6 The Revised Quality Framework
This principal component analysis finding to calculate the percentage of relative importance of each
factor and its quality dimensions is significant The percentage comparison would justify the most
important factor as well as the most important quality dimensions Also the new re-arranged quality
dimensions from the finding with an extended number of factors tended to improve the extended version
of the quality information framework to a revised quality framework
Table 9 shows that the most important component is number five with a percentage of 141 It
comprises two quality dimensions namely integration of skills and personal and social attributes The
most important dimension is integration of skills with a value of 625 Other important quality
dimensions are cultural awareness reflection skills interactivity objectivity motivation emotional
intelligence personal and social attributes depth of knowledge and ease of understanding with
percentages of 58 577 52 48 423 42 375 373 and 372 respectively
Table 9 Percentage of relative importance
Dimension
Component
1 2 3 4 5 6 7 8
122 128 123 134 141 116 10 136
Believability 149
Accuracy 255
Objectivity 48
Reputation 154
Consistency 126
Value-added 144
Relevancy 162
Timeliness 112
Completeness 272
Amount of
information 152
Integration of skills
625
Cultural
awareness 58
Personal and
social attributes 375
Emotional intelligence
42
Reflection skills 577
Interpretability 355
Ease of
understanding 372
Depth of
knowledge 373
Representational Verifiability
266
Motivation 423
Accessibility 248
Security 244
Response time 361
Availability 253
Interactivity 52
The principal component analysis calculated the relative importance of each quality dimension from
the extended quality framework The 25 quality dimensions were divided among eight factors instead of
25th International Congress on Condition Monitoring and Diagnostic Engineering IOP PublishingJournal of Physics Conference Series 364 (2012) 012118 doi1010881742-65963641012118
12
five as proposed in the extended quality framework Figure 4 shows that the authors made some changes
in order to categorise the eight factors into three main groups group one for the highly important quality
dimensions group two for medium importance quality dimensions and the low level dimensions
Figure 4 The revised quality framework
The figure presents the revised framework It shows the three groups of quality dimensions that affect
the SBL-to-WBL transition module The groups were ranked in accordance with their importance The
authors believe that the new revised quality framework verified the findings from the usersrsquo effectiveness
questionnaire
7 Conclusion
Usersrsquo views were quantitatively analysed using a questionnaire as a tool to diagnose monitor and
evaluate the effectiveness of the new SBL-to-WBL transition module The questionnaire questions were
produced from an extended quality information framework It was found that the most important quality
dimensions had been integrated well into the content of the new module The impact of those quality
dimensions reflected how well the work preparation skills were integrated in the learning content of the
new module A revised quality information framework was validated and ranked the quality dimensions
by their importance in the new module for SBL-to-WBL transition
25th International Congress on Condition Monitoring and Diagnostic Engineering IOP PublishingJournal of Physics Conference Series 364 (2012) 012118 doi1010881742-65963641012118
13
References
[1] Quality Assurance Authority for Education amp Training (QAAET) (2010) Review Reports-
Educational and Vocational Education Available from httpenqaabhreviewreportsaspx
[Accessed May 26 2011]
[2] Wang R Y amp Strong D M (1996) Beyond Accuracy What data quality means to data consumers
Total Data Quality Management Programme
[3] Alkhattabi M Neagu D amp Cullen A (2010) Information Quality Framework for e-Learning
Systems Knowledge Management and E-Learning An International Journal vol 2 no 4
[4] Alseddiqi M amp Mishra R (2011) Measuring the effectiveness of an on-line school-to-work
transition module The International Conference on E-Learning in the Workplace 2011
wwwicelworg June 8th-10th New York USA
[5] Alseddiqi M Mishra R amp Pislaru C (2009) Identification of skills gap between school-based
learning and work-based learning in Technical and Vocational Education in Bahrain Computing
and Engineering Researchersrsquo Conference University of Huddersfield Huddersfield UK
[6] Oppenheim A (2001) Questionnaire design interviewing and attitude measurement Continuum
London
[7] Cooper D amp Schindler P (2006) Business Research Methods9th edition McGraw-Hill International
USA
[8] Oppenheim A N (1992) Questionnaire design interviewing and attitude measurement Continuum
London
[9] Saunders M N Thornhill A amp Lewis P (2003) Research Methods for Business Students Prentice
Hall London
[10] Cooper D amp Schindler P (2008) Business Research Methods10th edition McGraw-Hill
International USA
[11] Kinnear P amp Gray C (2010) PASW 17 Statistics Made Simple Replaces SPSS Statistics 17 East
Sussex Psychology Press
[12] Sinn J (2011) SPSS Guide Correlation and Regression Available from
httpmathcsucieduocspssCorrelationRegressionpdf [Accessed October 21 2011]
25th International Congress on Condition Monitoring and Diagnostic Engineering IOP PublishingJournal of Physics Conference Series 364 (2012) 012118 doi1010881742-65963641012118
14
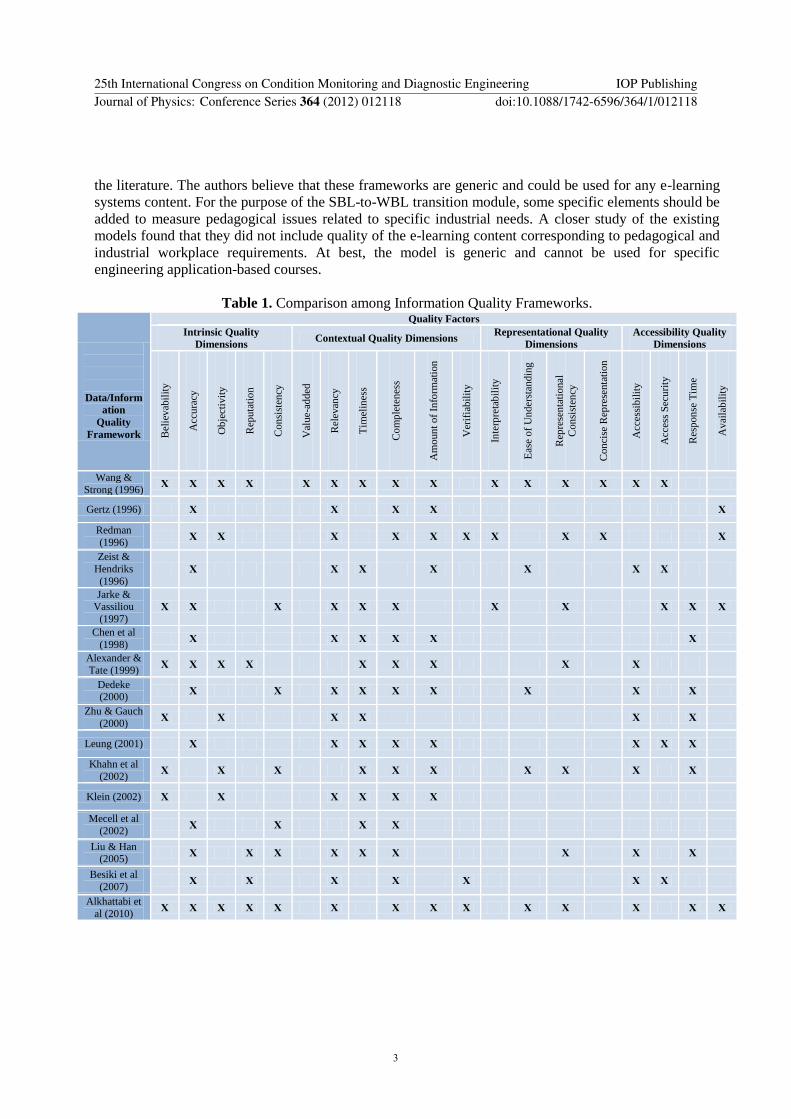
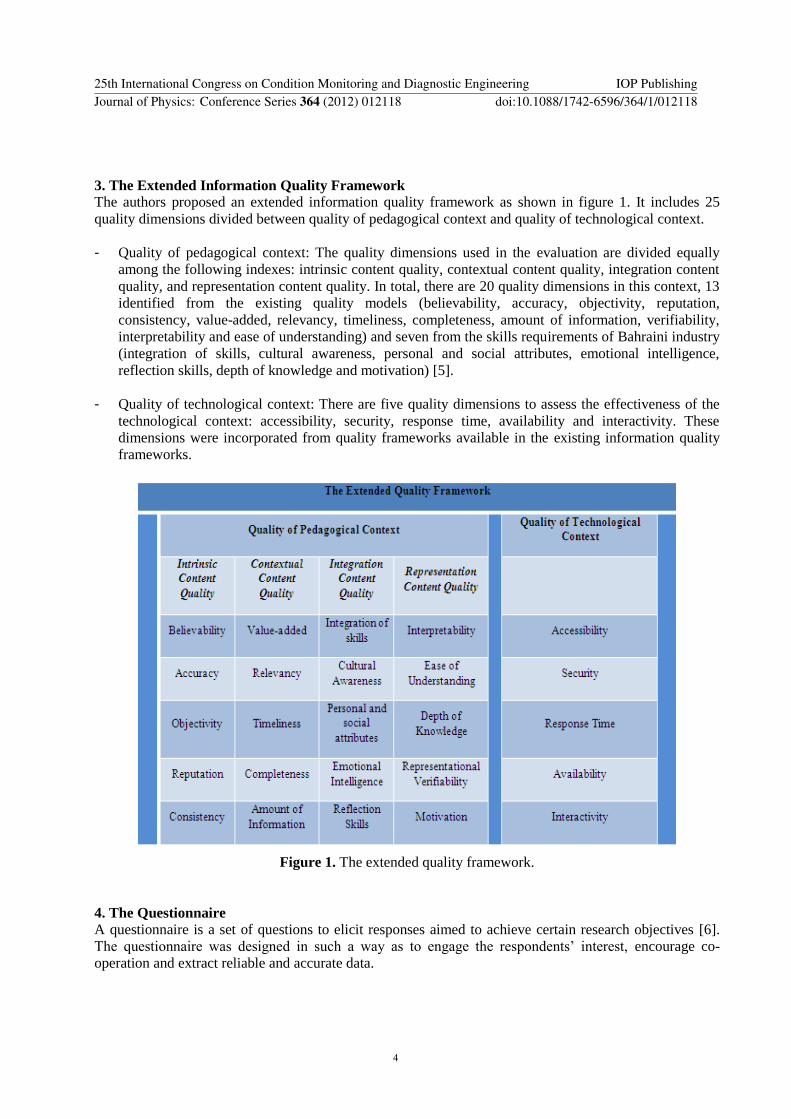
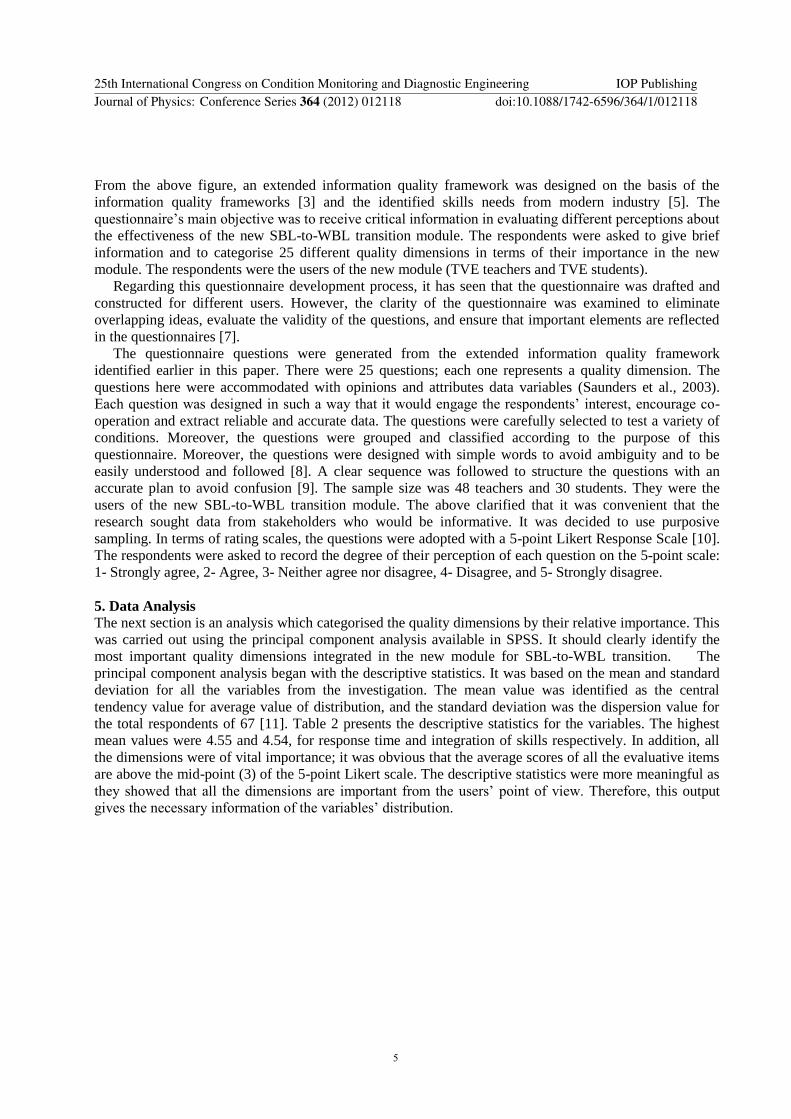
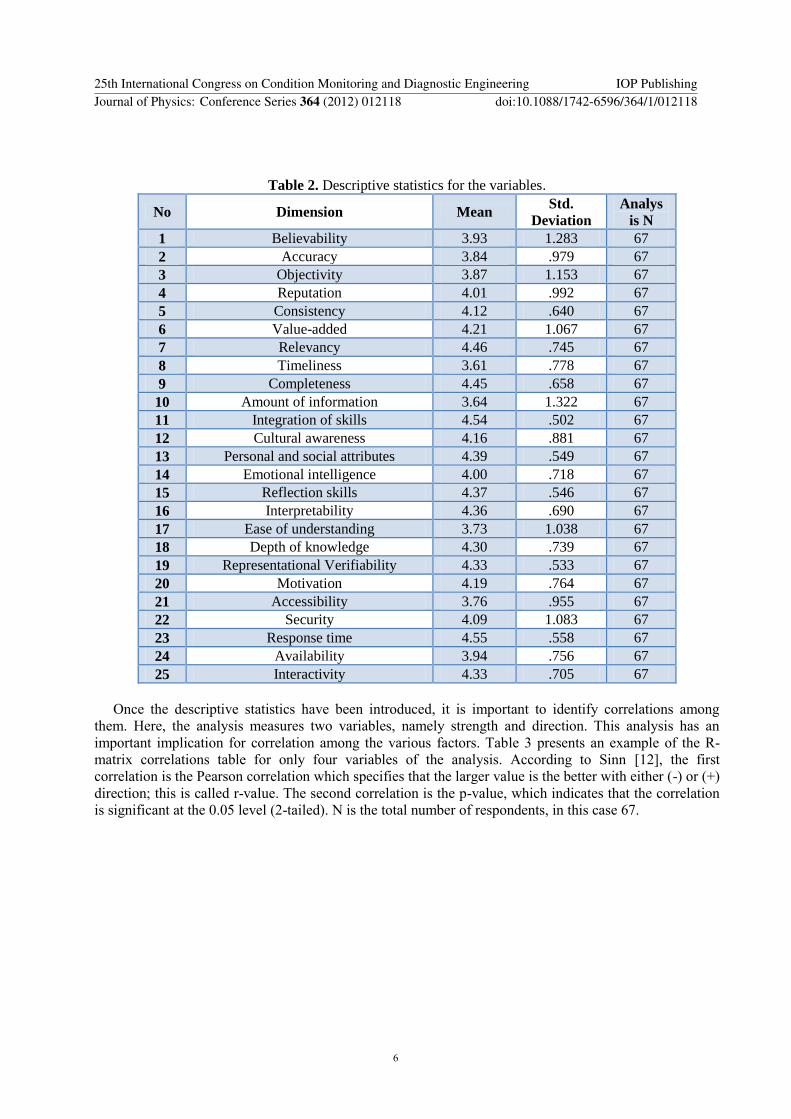
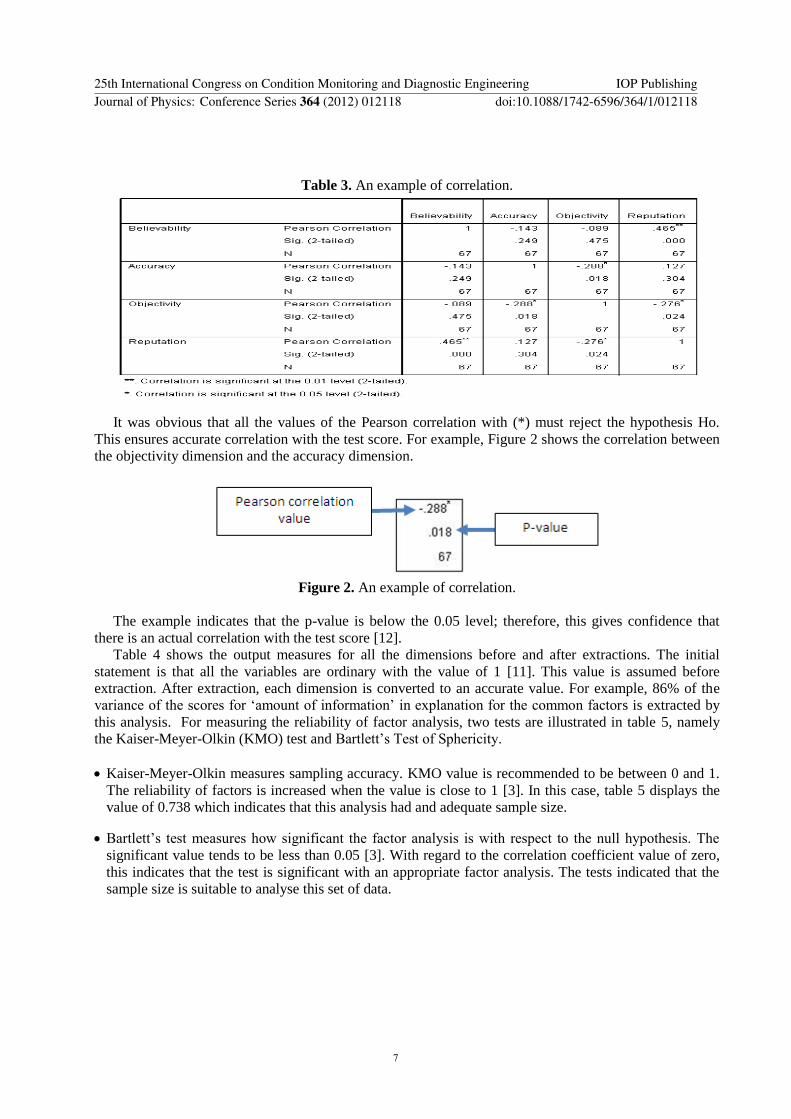
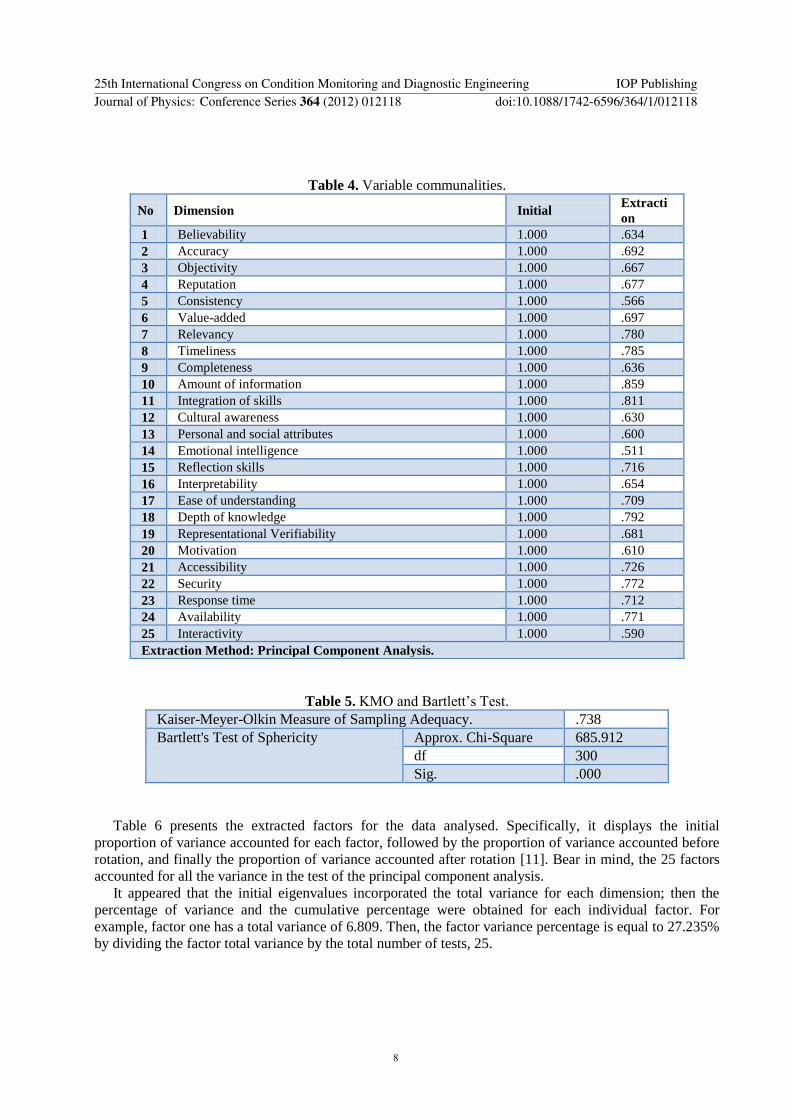
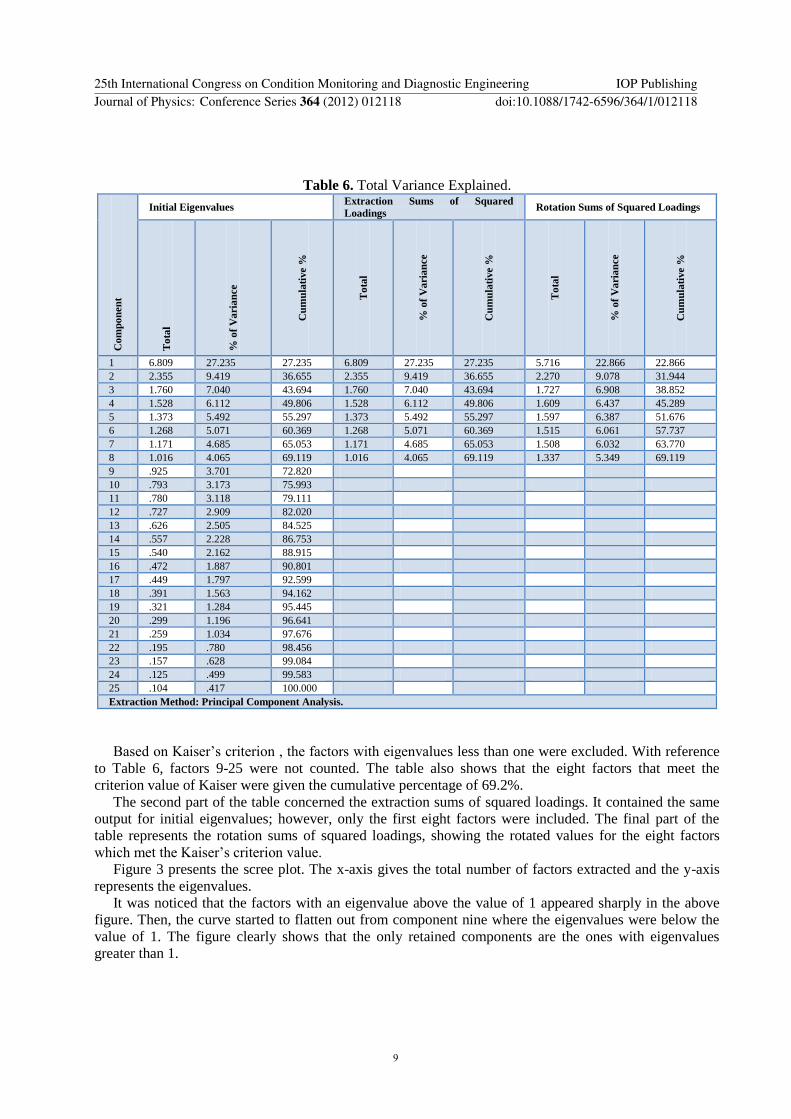
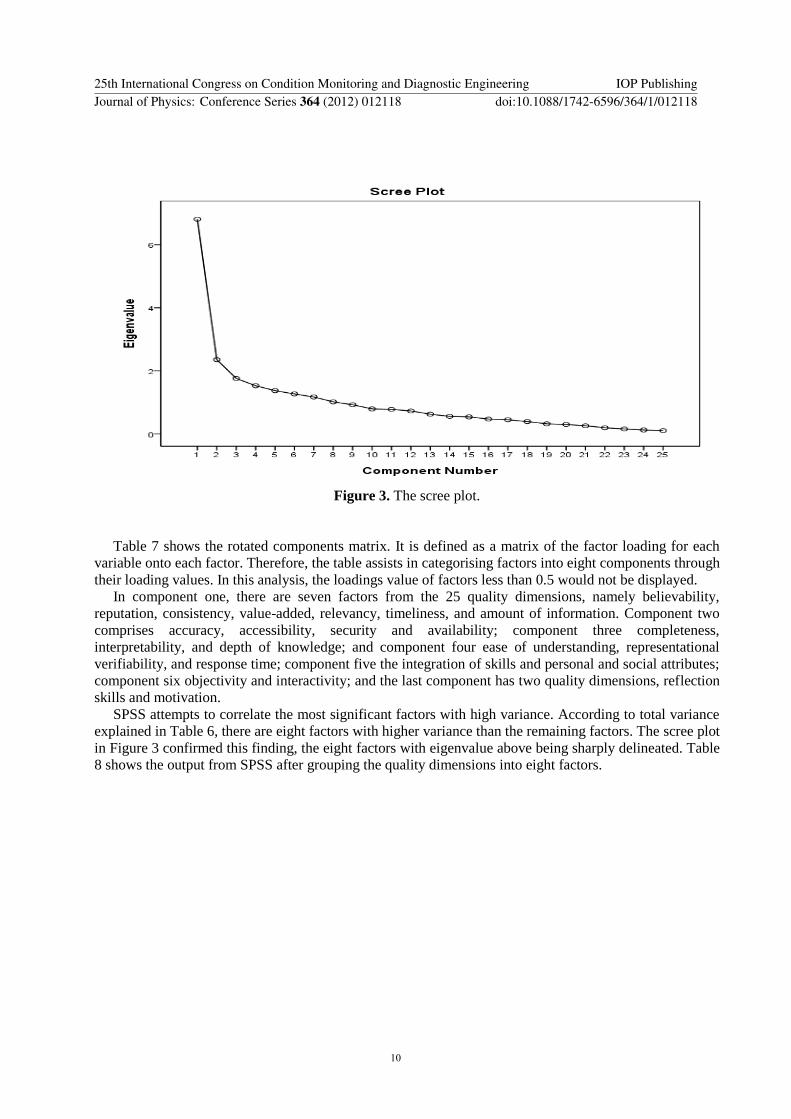
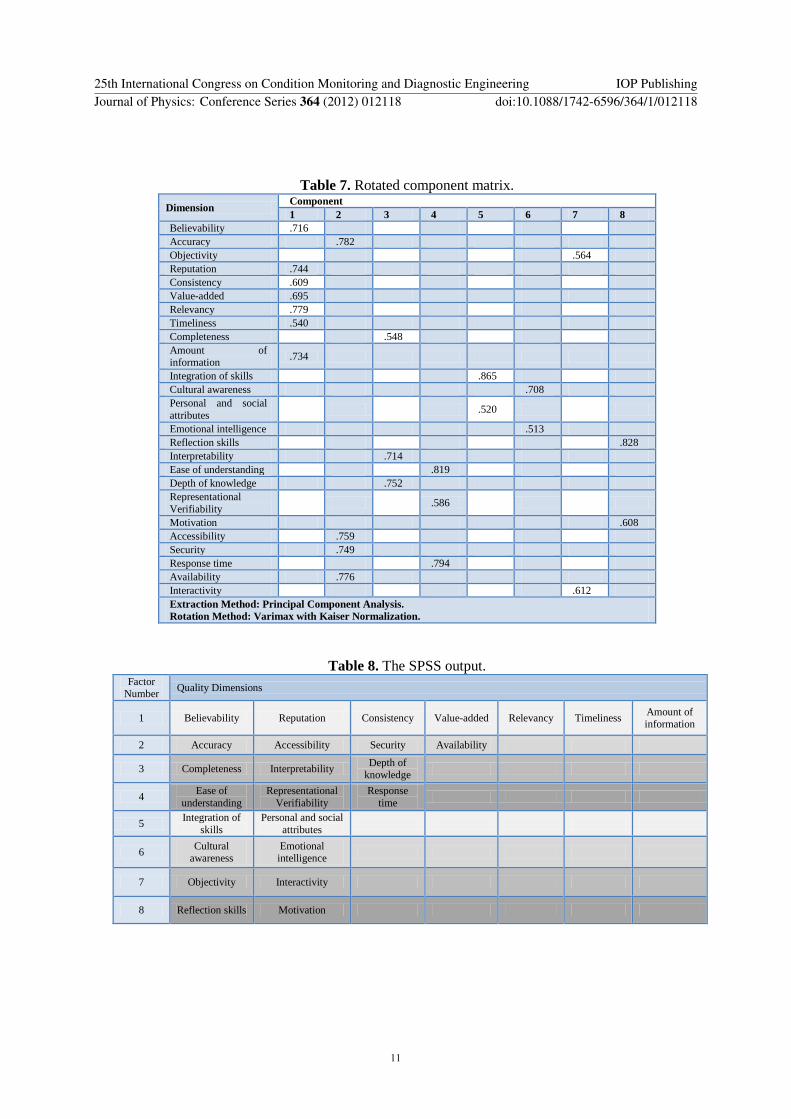
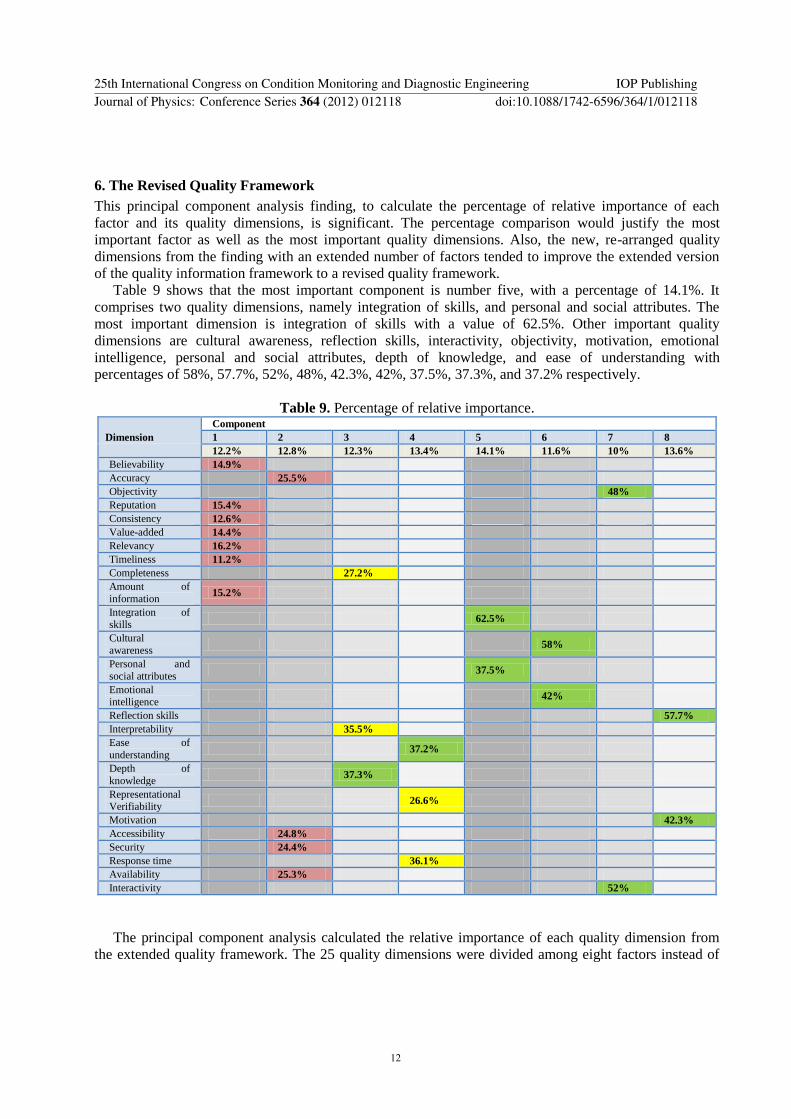
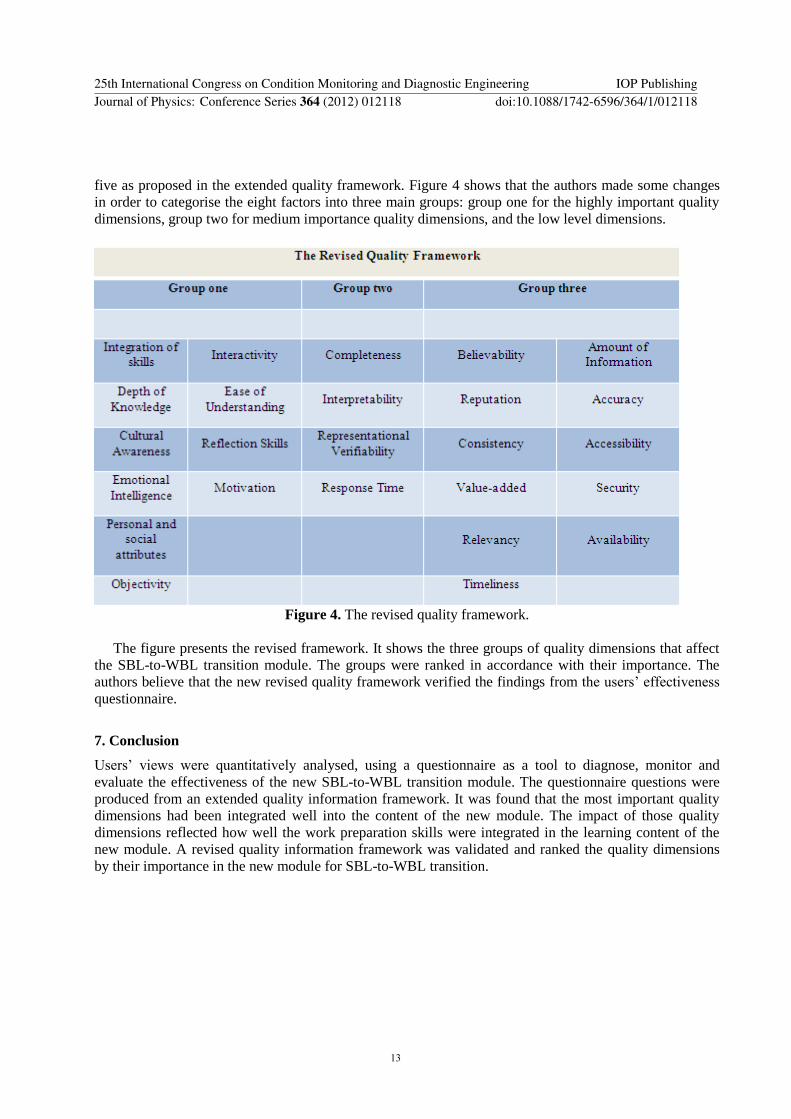