Embed Size (px)
Citation preview
Indonesia
Spending more or spending better:Improving education financing in Indonesia
East Asia and Pacific Region
AVA
*TF King UUKEMENTERRAN PSC ED
_ K"U= -NEUROPEAN UNION THEWORLDBANK
Pub
lic D
iscl
osur
e A
utho
rized
Pub
lic D
iscl
osur
e A
utho
rized
Pub
lic D
iscl
osur
e A
utho
rized
Pub
lic D
iscl
osur
e A
utho
rized
Pub
lic D
iscl
osur
e A
utho
rized
Pub
lic D
iscl
osur
e A
utho
rized
Pub
lic D
iscl
osur
e A
utho
rized
Pub
lic D
iscl
osur
e A
utho
rized
THE WORLD BANK OFFICE JAKARTAIndonesia Stock Exchange Building,Tower Il/1 2-13th Fl.JI. Jend. Sudirman Kay. 52-53Jakarta 12910Tel: (6221) 5299-3000Fax: (6221) 5299-3111
March 2013
Spending More or Spending Better: Improving education financing in Indonesia is a product of staff of the World Bank. The findings,interpretation and conclusion expressed herein do not necessarily reflect the views of the Board of Executive Directors of the World Bank orthe government they represent.
The World Bank does not guarantee the accuracy of the data included in this work. The boundaries, colors, denomination and otherinformation shown on any map in this work do not imply any judgment on the part of the World Bank concerning the legal status of anyterritory or the endorsement of acceptance of such boundaries.
Photo credit left to right: World Bank, Ratna Kesuma, World Bank.
Report No. 73050-ID
Spending more or spending better:Improving education financing in Indonesia
East Asia and Pacific Region
Spending more or spending better: Improving education financing in Indonesia
0 Table of Contents
Acknowledgements viiList of Abbreviations viiiExecutive Summary 11
Chapter 1: How is the Indonesian Education System Financed and Managed? 21A description of the National Education System in Indonesia 22Who manages what in Indonesia's decentralized education system? 24Who pays for what in Indonesia's education system? 25
Chapter 2: The"20 percent rule": Where did resources go? 29Implications of the 20 percent rule 30Is Indonesia spending too much on education after the 20 percent rule? 34Where did the 20 percent go? 36A simple costing of government objectives using current spending patterns 52
Chapter 3: How Have Outcomes Changed? The Unfinished Agenda for Equity andQuality of Education 55
Access 55Equity 58
Who are out-of-school children? 60Learning Outcomes 64
Linking resources to outcomes: Is it only a matter of time before resources improve quality of education? 68
Chapter 4: Improving the Quality of Spending on Basic Education 75Improving and expanding existing programs: Scholarships for the poor 76Improving Teacher Management 80Improving the allocation of teachers: Policy Options 85Improving district management and school discretion: effects from BOSDA pilots 92Improving district performance using performance-based transfers to support BOSDA 99
Chapter 5: A Framework for Action: Policy options for improving the quality of spending 101Objectives and main policy areas 102Strategic Reallocation of Resources 103Effective use of transfer mechanisms 104Improving Teacher Management 105
Improving School and District Management 107Improving Budget Planning, Transparency and Accountability. 108
References 111
U
List of Figures
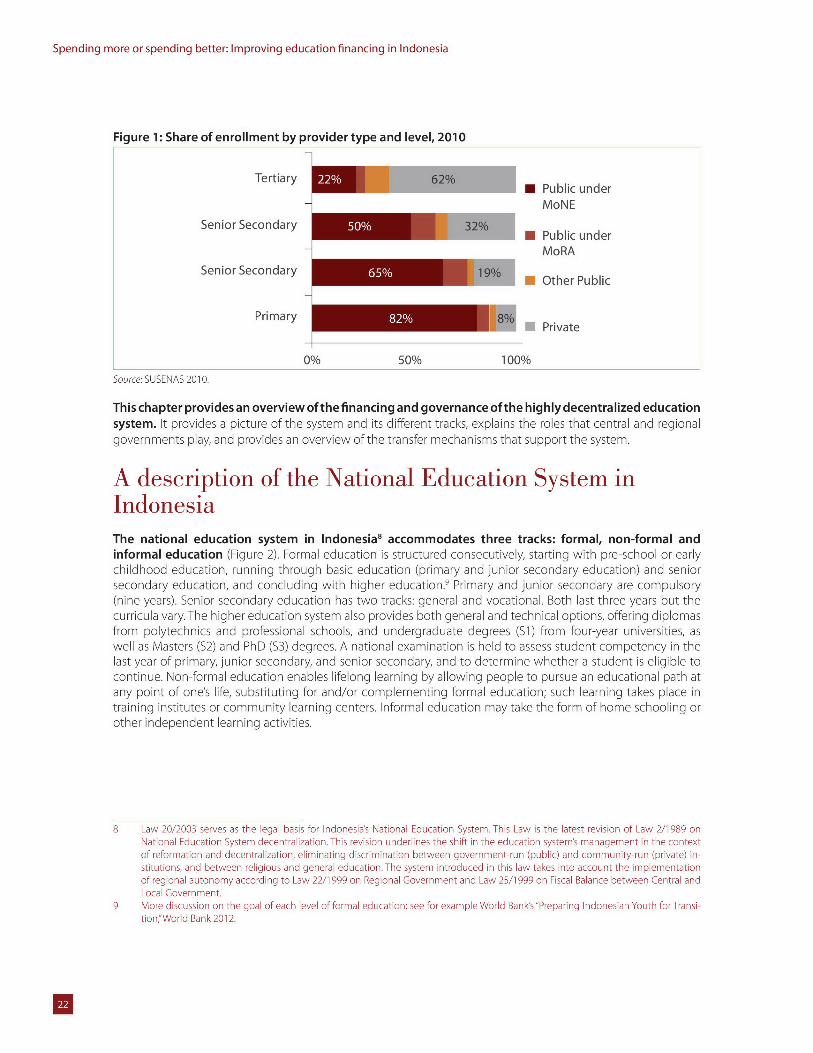
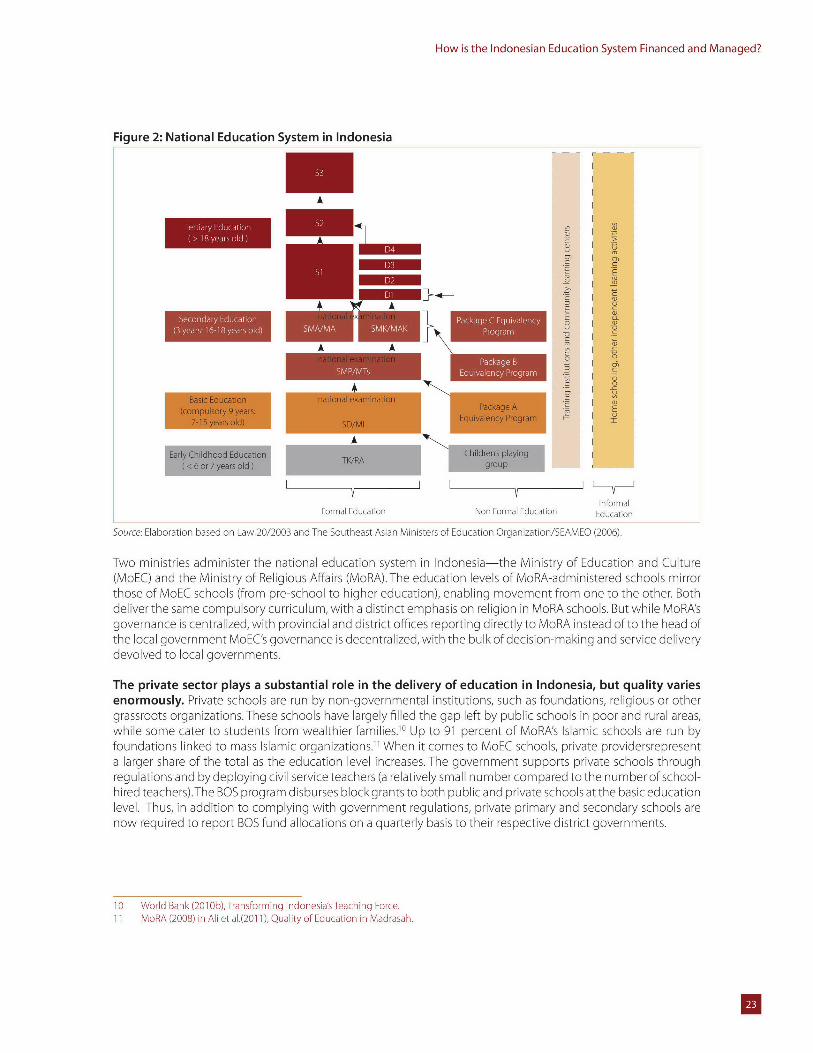
Figure 1: Share of enrollment by provider type and level, 2010 22Figure 2: National Education System in Indonesia 23Figure 3: An overview of the complexity of transfers and fund flows, 2012 26Figure 4: Public Expenditure on Education, 2001-2010 30Figure 5: Windfalls Allocation by program, 2010 33Figure 6: Public expenditure on education as a share of total government expenditure and as a share
of GDP, selected countries in 2009 35Figure 7: Per pupil spending on primary education as a share of per capita GDP, selected countries 35Figure 8: Total education spending by level of education and as a share of the total education
budget, 2008 and 2009 36Figure 9: Share of education spending by level, selected East Asia countries, 2009 37Figure 10: Spending on ECD, Central and Local Governments, 2008-2009 37Figure 11: Total public and household spending and share of public and private spending by
level of education 38Figure 12: Spending by level of government, 2001-2009 38Figure 13: Non-salary education expenditure by programs and level of government, 2009 39Figure 14: Public spending by level of education, 2008-2009 39Figure 15: Public spending by level of education, 2008-2009 40Figure 16: Scholarship programs by level of education, 2008-2010 41Figure 17: District spending by economic classification, 2001-2009 41Figure 18: Real capital and recurrent spending by level of government, 2006-2009 42Figure 19: Real spending by economic classification (total education budget), 2006-2009 43Figure 20: Spending increase distribution after the "20 percent rule,"2009 43Figure 21: Distribution of education funds by direct recipient, 2009 44Figure 22: Share of total education budget spent on salaries, selected countries 44Figure 23: Growth in number of students and number of teachers by level and student-teacher ratio,
2004-2010 45Figure 24: Student-teacher ratio by level, 2010 46Figure 25: Evolution of the number of civil servant (PNS) and non-civil servant teachers by level,
2006-2010 46Figure 26: Teacher salary scale and distribution of real wages for teachers, 2010 47Figure 27: Evolution of the percent of non-civil servant teachers by level, 2006-2010 47Figure 28: Share of teachers with a university degree, by type of contract and level of education,
2006-2010 48Figure 29: Percentage of non-PNS Teachers, 2010 49Figure 30: Share of non-PNS teachers by province, 2010 49
U
Spending more or spending better: Improving education financing in Indonesia
Figure 31: Share of budget spent on contract teachers vs school size and STR, 2010 50Figure 32: Estimated cost of converting all contract teachers to PNS, and of certifying all teachers 51Figure 33: Estimated cost of achieving government goals 53Figure 34: Gross and Net Enrollment Rates by Level, 2001-2009 56Figure 35: International comparison of Gross Enrollment Rates, 2009 56Figure 36: Share of children enrolled in appropriate level, out of age enrollment and out of school by age,
2010 57
Figure 37: Attainment profile of 27 year olds, 2010 57
Figure 38: Gross Enrollment Rates by Level of Education, 2010 58Figure 39: Share of children enrolled in school by age and quintile, 2006 and 2010 59Figure 40: Share of children enrolled by age in urban and rural areas in 2010 59Figure 41: NER of females relative to males by level, 2006-2010 59Figure 42: Possible supply constraints for expanding secondary education: distance and students per 9 60Figure 43: Share of out-of-school children by urban-rural and quintile, 2010 61Figure 44: Total household expenditure on education and as a share of household per capita
consumption, by level and income quintile 61Figure 45: District ECD enrollment rates, 2009 62
Figure 46: District SMP enrollment rates, 2009 62
Figure 47: District disparities in junior secondary enrollment rates, 2001-2009 63Figure 48: Enrollment rates for 18-20 year olds by district poverty quintile 63Figure 49: Indonesian 4th-Grader performance in 2006 PIRLS 64
Figure 50: Indonesian 8th-Grader math performance in 2007TIMSS 65Figure 51: 2009 PISA results in reading and mathematics 65
Figure 52: PISA math score vs. GDP per capita 66Figure 53: Distribution of math test scores Indonesia, Thailand and OECD, 2009 66Figure 54: Indonesia PISA scores in mathematics, reading and science, 2000-2009 67Figure 55: Indonesia PISA scores in science and math by socioeconomic deciles, 2000-2009 67Figure 56: Summary of progress, challenges and highlighted Gol objectives in education, 2010 68Figure 57: Change in public education spending and change in education outcomes at the district level 69Figure 58: Student-teacher ratio, per student spending and Bahasa Indonesia test scores in public
primary schools 71Figure 59: Average test scores for teachers in primary and junior secondary 72Figure 60: Student learning gains by teacher competency in subject knowledge 74Figure 61: Education costs vs BSM amount, 2009 77
Figure 62: Targeting of BSM 77
U
Figure 63: Education cost profile vs BSM benefits 78Fig ure 64: Estimated cost of expanding coverage of BSM to all poor, for 100 percent of education costs,
2012-2015 79Fig ure 65: Estimated cost of expanding coverage of BSM to all poor, for 100 percent of education costs,
2012-2015 79Figure 66: Share of teachers with senior secondary or less as their highest education by province, 2010 81Figure 67: Per student spending and student-teacher ratios at the school level, 2010 81Figure 68: Estimates of government spending on basic education teachers for different student-
teacher ratios, 2009 82Figure 69: The estimated teacher requirements to fulfill the standards outlined in the joint decree, 2010 85Figure 70: Percentage of primary school teachers that would need to be transferred to comply with joint
decree 87Figure 71: Population density, proportion of small schools and number of teachers in each province,
2010 89Figure 72: Percentage of districts and provinces that report having BOSDA in primary and junior
secondary schools, 2009 93Figure 73: BOS per-student grant and median regional per-student grants in primary and junior
secondary schools, 2010/11 93Figure 74: Per student amount by sources of income at the school level, 2010 94Figure 75: Income per student by source and school size, 2010 94Figure 76: Per student expenditure by type at the school level, 2010 95Figure 77: Per student school income and share of expenditure by category for BOSDA and non-BOSDA
schools, 2010 95Figure 78: Average test scores for Grade 6 students in Mathematics and Indonesian, 2010 96Figure 79: Change due to BOSDA funding formula allocations to small and remote schools 98Figure 80: Incentives by pilot district to improve school performance 98Figure 81: Consequences of the different transfer mechanisms on education 100Figure 82: Options for reform and main result for the education sector 100Figure 83: Objectives and critical policy areas for Indonesia's education system 103Figure 84: Strategic reallocation of expenditures: who and what? 104Figure 85: Effective use of transfer mechanisms: who and what? 105Figure 86: Improving Teacher Management 107Figure 87: School and District Management 108Figure 88: Budget planning, transparency and accountability 109
B
Spending more or spending better: Improving education financing in Indonesia
List of Tables
Table 1: Decentralized education management by level of education 24Table 2: Size and distribution of budget windfalls from the 20 percent rule 32Table 3. Budget realization, 2010-2011 32Table 4: Target Gross Enrollment Rate by level of education 2010-2014 52Table 5: Local average treatment effect of teacher certification - selected variables 73Table 6: Causal effects of certification on student learning outcomes 73Table 7: Teacher characteristics by location 80Table 8: Recent teacher staffing regulations 83Table 9: Primary and Junior Secondary School Size, 2010 88
List of Boxes
Box 1: An overview of current transfer mechanisms in the Indonesian education system from the
central to sub-national governments 28Box 2: The joint decree for teacher management 84Box 3: The BOSDA improvement pilot program 97
U
* Acknowledgements
The team is grateful to officials and staff in the Ministry of Education and Culture and Bappenas for their overallsupport of this study. Special thanks go to lbu Nina Sardjunani (Deputy for Human Resource and Culture,Bappenas), Pak Taufik Hanafi (Expert Staff for Social Economy, Ministry of Education and Culture) and Pak FasliJalal (former Vice-Minister of Ministry of National Education when the report was started) for their overall supportand extremely helpful conversations and comments throughout the process.
This report also benefited greatly from inputs and comments by the participants at consultation workshops aspart of the Thematic Education Dialogue supported by the BEC-TF and including officials from the Ministry ofEducation and Culture, National Planning Agency (Bappenas), Ministry of Religious Affairs, Ministry of Finance,Ministry of Home Affairs, as well as other development partners.
The core team responsible for the content of the report included Pedro Cerdan-Infantes (Task Team Leader,Education Economist, EASHE); Yulia Makarova (co-Task Team Leader, Public Finance Economist, EASPR), SamerAl-Samarrai (Senior Economist, EASHE), Dandan Chen (Senior Economist, EASHE), Yus Medina, Research Analyst(EASPR), Imam Setiawan (Research Analyst, EASHE) and Steisianasari Mileiva (Research Analyst, EASHE); districtbudget data and significant portions of the district analysis were contributed by Cut Dian Agustina (Economist,EASPR) and Dhanie Nugroho (Research Analyst, EASPR). Hassan Noura (former co-TTL Public Finance Specialist,EASPR) was fundamental in developing the concept and the early stages of the study and contributed withextremely useful discussions about the challenges of education financing in Indonesia. Vivi Alatas (EASPR) andJon Jellema (EASID) kindly contributed sections of their social assistance PER to be included in this report. Finally,the team is grateful for very useful comments from Bill Wallace (Senior Advisor), Enrique Blanco Armas (SeniorEconomist, EASPR), Anna Gueorguieva (Economist, EASPR), Erita Nurhalim (Senior Operations Officer, EASHE),Blane Lewis (Senior Consultant, EASPR), Gregorius Pattinasarany (Senior Economist, EASPR) and Ashley Taylor(Economist, EASPR). Dyah Kelasworo Negraheni and Irene E. Bouwmeester provided the most efficient teamsupport.
The report is a joint effort between HD and PREM units at the World Bank and as such it was prepared under theoverall guidance of Luis Benveniste (Sector Manager, EASHE) and Mae Chu Chang (Lead Education Specialistand HD Sector Coordinator for Indonesia) from HD, and Shubham Chaudhuri (Indonesia Lead Economist, EASPR)from PREM. EduardoVelez Bustillo (former Sector Manager, EASHE) oversaw the concept development and initialstages of the report.
Peer reviewers were Hanna Birdsey (AusAid, Indonesia), Juan Diego Alonso (Education Economist, LCSHE), SorenNellemann (Country Sector Coordinator, ECSH2), Blane Lewis (Senior Consultant, EASPR) and Ashley Taylor(Economist, EASPR).
The production of this report was made possible through the generous support of the Basic Education CapacityTrust Fund.
U
Spending more or spending better: Improving education financing in Indonesia
a List of Abbreviations
APBD Anggaran Pendapatan dan Belanja Daerah Provincial or District Government Budget
APBN Anggaran Pendapatan dan Belanja Negara National Budget
ASEAN Perhimpunan Bangsa-Bangsa Asia Tenggara Association of Southeast Asian Nations
AusAid Badan Kerjasama Pembangunan Australian Agency for InternationalInternasional Australia Development
BAPPENAS Badan Perencanaan Pembangunan Nasional National Development Planning Agency
BEC -TF Dana Program Pengembangan Kapasitas Basic Education CapacityTrust Fund (WorldPendidikan Dasar (Bank Dunia) Bank)
BERMUTU Pendidikan Lebih Baik Melalui Reformasi Better Education through ReformedManagemen dan Peningkatan Menyeluruh Management and Universal TeacherGuru Upgrading
BKD Badan Kepegawaian Daerah Regional Civil Service Board
BKN Badan Kepegawaian Negara National Civil Service Board
BLU Badan Layanan Umum General Services Agency
BOMM Bantuan Operasional Manajemen Mutu Operational Assistance for QualityManagement
BOS Bantuan Operasional Sekolah School Operation Fund (Provided by theCentral Government)
BOSDA Bantuan Operasional Sekolah Daerah Local BOS/Local School Grants
BOS-KITA Peningkatan Pengetahuan untukTransparansi BOS Knowledge Improvement fordan Akuntabilitas BOS Transparency and Accountability
BPS Biro Pusat Statistik Central Bureau of Statistics
BSM Bantuan Siswa Miskin Scholarship for Poor Students
BSNP Badan Standar Nasional Pendidikan National Education Standards Agency
D1,2,3,4 Diploma Tingkat (1 -tahun), (2-tahun), (3- Post Secondary Diploma Level (I-year), (2-year), (4-tahun) year), (3-year), (4-year)
DAK Dana Alokasi Khusus Special Allocation Fund
DAU Dana Alokasi Umum General Allocation Fund (Central Transferto Regional Budgets in the form of anUnrestricted Block Grant)
Dekon Dekonsentrasi De-concentration (budget and decision-making transfer from the central to theprovincial government)
ECD Pendidikan Anak Usia Dini Early Childhood Education
ESWG Kelompok Kerja Sektor Pendidikan Education SectorWorking Group
EU Uni Eropa European Union
GDP Produk Domestik Bruto Gross Domestic ProductGER Angka Partisipasi Kasar Gross Enrollment Rate
UainlBde
Gol Pemerintah Republik Indonesia Government of Indonesia
IDR Rupiah Indonesian Rupiah
JSS Sekolah Menengah Pertama (SMP) Junior Secondary School
MA Madrasah Aliyah Islamic Senior Secondary School
MBS Manajemen Berbasis Sekolah School Based Management
MDG Tujuan Pembangunan Milenium Millennium Development Goals
MenPAN Kementerian Pendayagunaan Aparatur Ministry of State Personnel and BureaucracyNegara dan Reformasi Birokrasi Reform
MGMP Musyawarah Guru Mata Pelajaran Secondary School SubjectTeacher's WorkingGroup
MI Madrasah lbtidaiyah Islamic Primary School
MoF Kementerian Keuangan Ministry of Finance
MoHA Kementerian Dalam Negeri Ministry of Home Affairs
MoEC Kementerian Pendidikan dan Kebudayaan Ministry of Education and Culture
MoRA Kementerian Agama Ministry of Religious Affairs
MoU Nota Kesepahaman Memorandum of Understanding
MTs Madrasah Tsanawiyah Islamic Junior Secondary School
NER Angka Partisipasi Murni Net Enrollment Rate
NUPTK Nomor Unik Pendidik dan Tenaga Unique Identification Number forTeachers andKependidikan Teaching Personnel
OECD Organisasi untuk Kerjasama Ekonomi dan Organization for Economic Cooperation andPembangunan Development
PAD Pendapatan Asli Daerah Regional Own Source Revenues
PAUD Pendidikan Anak Usia Dini Early Childhood Education
PER Kajian Belanja Publik Public Expenditure Review
PIRLS Studi Internasional tentang Literasi Membaca Progress in International Reading LiteracyStudy
PISA Program Penilaian Siswa Internasional Program for International Student Assessment
PNS Pegawai Negeri Sipil Civil Servant
PP Peraturan Pemerintah Government Regulation
PT Perguruan Tinggi Higher Education Institution
PTAI PerguruanTinggi Agama Islam Islamic Higher Education Institution
PTK PerguruanTinggi Kedinasan Higher Education Institution held by otherTechnical Ministries besides MoEC dan MoRA
Puspendik Pusat Penilaian Pendidikan, Kementrian Center for Education Assesment, Ministry ofPendidikan dan Kebudayaan Education and Culture
RA Raudhatul Atfal Islamic Kindergarten/Early Childhood Center
RENSTRA Rencana Strategis S-year Strategic PlanRKP Rencana Keuangan Pendidikan Education Financial Plan
Indoesin Rpia
Spending more or spending better: Improving education financing in Indonesia
RPJMN Rencana Pembangunan Jangka Menengah Medium-term National GovernmentNasional Development Plan
Si, S2, 53 Sarjana 1, Sarjana 2, Sarjana 3 Degree equivalent to Bachelor's Degree,Master's Degree and PhD respectively
SBM Manajemen Berbasis Sekolah (MBS) School Based Management
SD Sekolah Dasar Primary School
SIKD Sistem Informasi Keuangan Daerah Regional Financial Information System
Sisdiknas Sistem Pendidikan Nasional National Education System
SK Surat Keputusan Decree
SKPD Satuan Kerja Perangkat Daerah Local GovernmentTechnical Department (orRegional Government's Working Unit)
SMA Sekolah Menengah Atas Senior Secondary School
SMK Sekolah Menengah Kejuruan Vocational Secondary School
SMP Sekolah Menengah Pertama Junior Secondary School
SNP Standar Nasional Pendidikan National Education Standards
SPM Standar Pelayanan Minimal Minimum Service Standards (MSS)
STR Rasio Siswa Guru Student-Teacher Ratio
SUSENAS Survei Sosial Ekonomi Nasional National Socio Economic Survey
TIMSS Studi Internasional tentang Matematika dan Trends in International Mathematics andlImu Pengetahuan Alam Science Study (TIMSS)
TP Tugas Pembantuan Co-administered Task
TK Taman Kanak-Kanak Kindergarten (PreSchool)
UKP4 Unit Kerja Presiden bidang Pengawasan dan Presidential Working Unit of Supervision andPengendalian Pembangunan Control of Development
UKMP3 Unit Kegiatan Menteri Pengawasan dan Ministerial Working Unit of Supervision andPengendalian Pembangunan Control of Development
UNESCO Organisasi Pendidikan, lImu Pengetahuan, United Nations Educational, Scientific, anddan Kebudayaan PBB Cultural Organization
UT Universitas Terbuka Open University
UU Undang Undang National Law
UUD Undang-Undang Dasar Basic Law
WB Bank Dunia World Bank
Dinas A Provincial, District, Sub-District Office withsectorol responsibilities
Kabupaten District (Regency)
Kota Autonomous City
Komite Sekolah School CommitteeMadrasah Islamic School
Re in lFn n ilIfr ainSse
IExecutive Summary
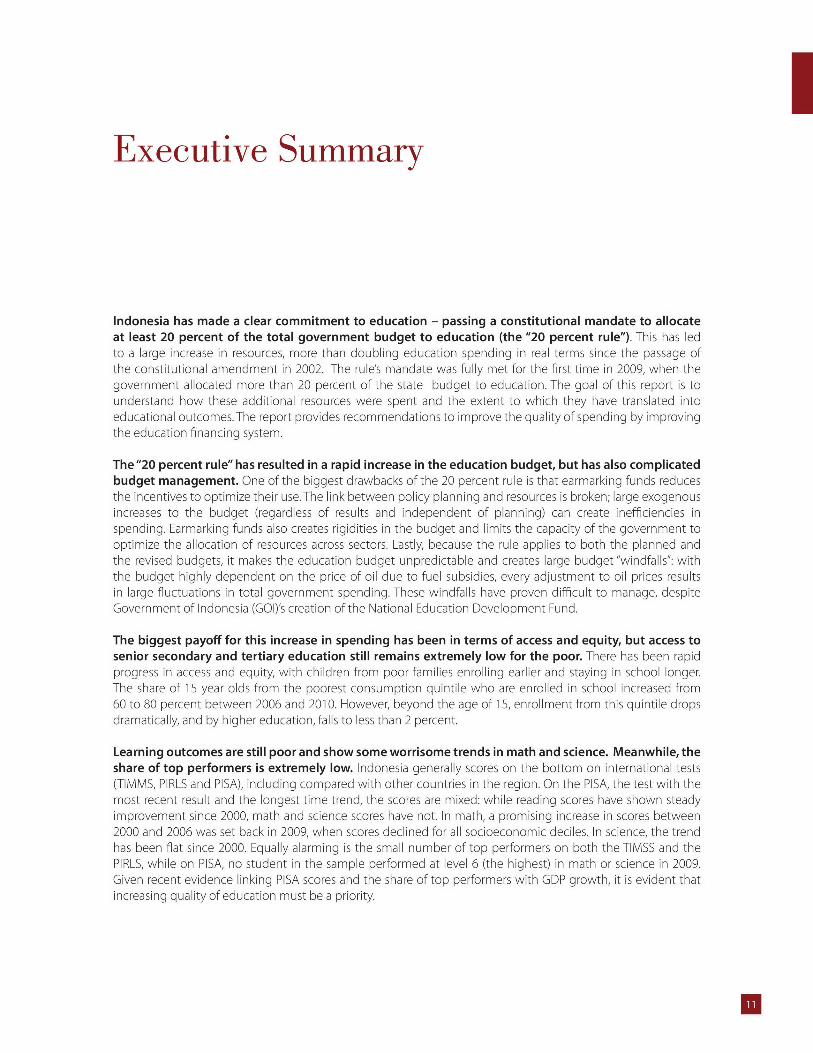
Indonesia has made a clear commitment to education - passing a constitutional mandate to allocateat least 20 percent of the total government budget to education (the "20 percent rule"). This has ledto a large increase in resources, more than doubling education spending in real terms since the passage ofthe constitutional amendment in 2002. The rule's mandate was fully met for the first time in 2009, when thegovernment allocated more than 20 percent of the state budget to education. The goal of this report is tounderstand how these additional resources were spent and the extent to which they have translated intoeducational outcomes.The report provides recommendations to improve the quality of spending by improvingthe education financing system.
The"20 percent rule" has resulted in a rapid increase in the education budget, but has also complicatedbudget management. One of the biggest drawbacks of the 20 percent rule is that earmarking funds reducesthe incentives to optimize their use.The link between policy planning and resources is broken; large exogenousincreases to the budget (regardless of results and independent of planning) can create inefficiencies inspending. Earmarking funds also creates rigidities in the budget and limits the capacity of the government tooptimize the allocation of resources across sectors. Lastly, because the rule applies to both the planned andthe revised budgets, it makes the education budget unpredictable and creates large budget "windfalls": withthe budget highly dependent on the price of oil due to fuel subsidies, every adjustment to oil prices resultsin large fluctuations in total government spending. These windfalls have proven difficult to manage, despiteGovernment of Indonesia (GOI)'s creation of the National Education Development Fund.
The biggest payoff for this increase in spending has been in terms of access and equity, but access tosenior secondary and tertiary education still remains extremely low for the poor. There has been rapidprogress in access and equity, with children from poor families enrolling earlier and staying in school longer.The share of 15 year olds from the poorest consumption quintile who are enrolled in school increased from60 to 80 percent between 2006 and 2010. However, beyond the age of 15, enrollment from this quintile dropsdramatically, and by higher education, falls to less than 2 percent.
Learning outcomes are still poor and show some worrisome trends in math and science. Meanwhile, theshare of top performers is extremely low. Indonesia generally scores on the bottom on international tests(TIMMS, PIRLS and PISA), including compared with other countries in the region. On the PISA, the test with themost recent result and the longest time trend, the scores are mixed: while reading scores have shown steadyimprovement since 2000, math and science scores have not. In math, a promising increase in scores between2000 and 2006 was set back in 2009, when scores declined for all socioeconomic deciles. In science, the trendhas been flat since 2000. Equally alarming is the small number of top performers on both the TIMSS and thePIRLS, while on PISA, no student in the sample performed at level 6 (the highest) in math or science in 2009.Given recent evidence linking PISA scores and the share of top performers with GDP growth, it is evident thatincreasing quality of education must be a priority.
U
Spending more or spending better: Improving education financing in Indonesia
Part of these trends is explained by patterns in spending: most of the additional resources went to basiceducation, for teacher salaries and teacher certification. Two-thirds of the additional resources went forteacher salaries and certification, yet as we shall see, studies have shown that adding teachers does not correlatewith improved educational results. Higher education also received a significant increase in resources, as didscholarship programs after 2009. Capital spending also increased in the last decade, especially at the districtlevel (presumably on schools). The Gol's focus on expanding access to 9 years of basic education was reflectedin the budget, but there are signs the government is putting more emphasis on expanding access and qualityto senior secondary and beyond.
The increase in spending on teacher salaries was driven both by increases in the total number ofteachers and by "regularizing" contract teachers to civil servant status. The patterns were different acrosslevels. Conversions occurred mostly in early childhood education (ECD), and at the junior and senior secondarylevels, while the increase in teachers in primary education was due mainly to the addition of contract teachers.Whereas 60 percent of the additional teachers were contract teachers, the trends in regularization and the Gol'simplicit policy to have all teachers converted to civil servant status and certified are worrisome. What keepsthe salary bill low in Indonesia despite the extremely low student-teacher ratio (STR) is the high prevalence ofcontract teachers. Estimates of the cost of conversion and certification suggest it would lead to an unsustainabledoubling of the salary bill.
It is unlikely that the observed patterns of spending will translate into increased quality of education.At the current student-teacher ratios, there is no correlation between increasing the number of teachers andlearning outcomes. At 17-1 in primary and 13-1 in secondary schools, STRs in Indonesia are low by internationalstandards; given these ratios, adding more teachers is unlikely to lead to improved outcomes. Moreover, theteacher certification program, which absorbed a large chunkof additional funds, is not (yet) showing the expectedimpact. An early evaluation of the teacher certification program shows that while the program improved thelivelihoods of teachers, it did not lead to improvements in learning outcomes for students.
Indonesia needs to alter its education spending patterns to ensure that resources produce improvedoutcomes. Judging by international comparisons, ECD and senior secondary education are underfunded.Scholarships received only 1 percent of the total budget in 2009. While the planned budget for scholarshipsincreased significantly between 2009 and 2011, there is room for expansion and improvement of the program.However beyond these broad indications, improving the quality of spending is not straightforward. Within eachlevel of education, it implies different adjustments. Given the importance of basic education in the budget andas the basis for future learning, this report goes into detail on improving the quality of spending in this area.Some on-going studies have looked at senior secondary education in detail. Future work should examine otherlevels.
What does "spending better" mean in basic education?
Spending better means ensuring resources are allocated more effectively to produce better outcomeswith regard to access and learning. Given the complexity of the governance of the system in Indonesia, this isa difficult task, and one that should focus on the districts'capacity to manage the system. Districts own schoolsand manage teachers, the two main inputs in the learning process. But since districts rely on central governmenttransfers for the majority of their budgets, spending is influenced by the incentives embedded in the transferformulas. A look at these incentive structures goes a long way to explaining why districts spend mostly on one ofthese inputs (teachers) while their support for schools is still very limited. Improving spending in basic educationwill mean achieving more balanced spending at the district level and ensuring that incentives are in line with theobjective of improving the quality of education.
U
Executive Summary
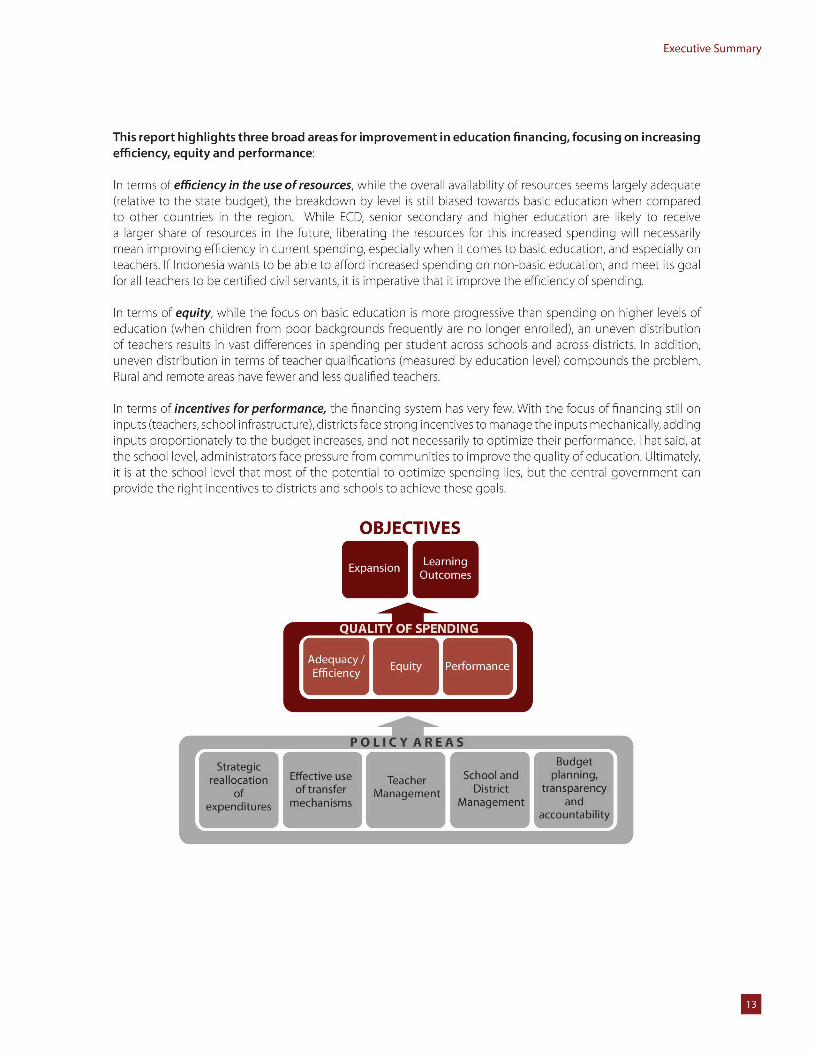
This report highlights three broad areas for improvement in education financing, focusing on increasingefficiency, equity and performance:
In terms of efficiency in the use of resources, while the overall availability of resources seems largely adequate(relative to the state budget), the breakdown by level is still biased towards basic education when comparedto other countries in the region. While ECD, senior secondary and higher education are likely to receivea larger share of resources in the future, liberating the resources for this increased spending will necessarilymean improving efficiency in current spending, especially when it comes to basic education, and especially onteachers. If Indonesia wants to be able to afford increased spending on non-basic education, and meet its goalfor all teachers to be certified civil servants, it is imperative that it improve the efficiency of spending.
In terms of equity, while the focus on basic education is more progressive than spending on higher levels ofeducation (when children from poor backgrounds frequently are no longer enrolled), an uneven distributionof teachers results in vast differences in spending per student across schools and across districts. In addition,uneven distribution in terms of teacher qualifications (measured by education level) compounds the problem.Rural and remote areas have fewer and less qualified teachers.
In terms of incentives for performance, the financing system has very few. With the focus of financing still oninputs (teachers, school infrastructure), districts face strong incentives to manage the inputs mechanically, addinginputs proportionately to the budget increases, and not necessarily to optimize their performance. That said, atthe school level, administrators face pressure from communities to improve the quality of education. Ultimately,it is at the school level that most of the potential to optimize spending lies, but the central government canprovide the right incentives to districts and schools to achieve these goals.
OBJECTIVES
Expasion LearningOutcomes
Strategic Effciencyude
realocaion eacer Shooand laningU.otase aaeet itit tasaec
U,,,,ue mcaissMaaeen naccunabiit
Spending more or spending better: Improving education financing in Indonesia
The key to improving quality of spending in basic education is to improve district performance inmanaging budgets - however, the central government's role is fundamental. As noted, districts managetwo of the most important inputs in basic education, schools and teachers, but they receive most of theirfunds from central government transfers and are subject to central government regulations. As a consequence,the first tool the government has at its disposal to improve the quality of spending is a strategic reallocationof spending towards underfunded programs and levels of education, including scholarship programs and earlychildhood as well as post-basic education. However, given that the funds are managed locally, improving thequality of spending has to occur at the district and, ultimately, the school level, and districts must be incentivizedto make good decisions. We recommend the following areas for central government action to improve districtperformance: first, setting up the right incentives through a more effective use of transfers mechanisms; providingtools for districts to improve teacher management, and increasing the role of districts in managing and fundingschools. Improving transparency and accountability in budget management can support all these reforms.
Strategic reallocation of resources
Indonesia can reallocate resources strategically towards programs that are underfunded, such asexpanding access to ECD or senior secondary. However, increasing resources is not sufficient. It is importantto keep in mind that additional resources do not always result in improvements in outcomes, so drasticallyexpanding access requires careful planning to ensure sustainability and efficiency. While this report does notgo into these sub-sector issues because they are beyond its scope, estimates of the cost of expanding access tosenior secondary education show that the model chosen for expansion can have dramatic effects on the cost.Small changes in per student spending have big effects on the budget. Different financing mechanisms havedifferent effects on equity and access.
ECD and senior secondary education are clear candidates for more resources. The evidence supportingECD internationally is overwhelming. Given the current low level of spending on ECD, increasing resources in thisarea seems desirable. Senior secondary education, which still relies largely on student fees, should also receiveincreased funding; the Gol's plans to expand compulsory education to this level demonstrates its commitment toexpanded access. Whether the expansion is carried out by providing free senior secondary or through targetedscholarships will have serious budget implications.
Expanding and improving the Scholarship for Poor Students program (Bantuan Siswa Miskin) is criticalfor supporting expansion and equity: this will require increasing funding and coverage, improving thetargeting of the program, aligning the disbursement of the benefit with the timing of expendituresand possibly providing a transition bonus. The ideal scenario would cover 100 percent of the cost for allpoor students from SD to SMU, providing a transition bonus for those moving from SD to SMP and from SMP toSMU. This would ensure that cost is not a reason for dropping out, and provide incentives for students who aredeciding whether to continue their education.
Improving district spending
A key element in improving the quality of spending on education is improving teacher management.Districts face incentives to overstaff from two sources: i) the sub-national General Allocation Fundtransfer formula (Dana Alokasi Umum, DAU) and ii) the guidelines for teacher distribution. The BasicAllocation component of the DAU formula (the main transfer from central to sub-national governments) is basedpartly on the number of civil servants in a district, which provides an incentive to hire teachers rather thanredistribute them when needed. In addition, the guidelines for teacher entitlement formulas, which establishthe minimum number of teachers a school should have depending on its characteristics, tend to support highteacher numbers, especially in small schools, as they are based on teaching groups rather than on student-
Executive Summary
teacher ratios. The combination of these two factors results in schools requesting additional teachers basedon entitlement formulas, and districts preferring to hire before redistributing teachers from overstaffed tounderstaffed schools. If there is one message to take away from this report, it is that tackling these two issues iscrucial to meeting Indonesia's goals.
a) Effective use of transfer mechanismsBreaking the link between transfers and hiring.The consequences of the DAU have been studied extensively,and there seems to be a consensus in this body of research that the revisions of Laws no. 32 and 33 governingdecentralization ought to eliminate incentives for overstaffing by removing the Basic Allocation element fromthe DAU formula. This would go a long way towards making future teacher hiring more efficient by reducingincentives to overstaff, but this change would not rationalize teacher management instantly. Teachers alreadyhired need to be managed more efficiently. Most importantly, while it would eliminate one of the clearestincentives for districts to overstaff, changing the transfer formula alone may not guarantee the elimination of theproblem of overstaffing completely. Faced with the obligation to spend on education and the lack of alternativeways to allocate resources, districts may still choose to hire additional teachers, even if the DAU formula ischanged.
Increase performance-based transfers. In order to further incentivize districts to focus on performance, theperformance component of central government transfers, such as the incentive grant to local and provinicialgovernments earmarked for education (Dana Insentif Daerah, DID), should be expanded. These performance-based incentives can be linked to either specific policies (for example, to the provision of local school grants(Bantuan Operasional Sekolah Daerah, BOSDA) by the district orto enrollments and/or other outcome indicators.
Both of these changes are largely out of the control of Ministry of Education and Culture (MoEC) - lyinginstead under the responsibility of the Ministry of Finance and Ministry of Home Affairs. These changesby themselves will not solve the problems with the quality of spending on education, but they have importantimplications for education. Regardless of whether they occur, the problems with teacher management still needto be addressed.
b) Improving Teacher ManagementTeacher management is critical to improving the efficiency and equity of spending in education. Thecurrent low STR would be fiscally unaffordable if it were not for the high prevalence of contract teachers.Continuing the trend of converting contract teachers to civil servants in secondary education will drive up thesalary bill up ifthe allocation ofteachers is not improved. Finding a sustainable way to deal with contract teacherswill be crucial in the future. On equity, despite the low STR, there are massive differences in the availability andqualifications of teachers across schools and regions, with a clear disadvantage for rural and remote areas, butlarge variability even within districts.
The estimated efficiency gains from reallocating teachers are substantial. Small improvements in theefficiency of teacher allocation can have large budget implications: increasing STRs by five students can result in aone-third reduction of in per student spending. Increasing STRs can be the key to liberating resources to achievethe desired results for the future. However, existing efforts to increase STRs have had limited success. Currently,the guidelines are based on learning groups (rombels) and not on student-teacher ratios. Thus if schools breakdown students into smaller learning groups, it can lead to an overestimation of the number of teachers needed.
The magnitude of the reallocation needed to improve efficiency and equity in the allocation of teachersis massive. Using the latest government guidelines for teacher allocation, which came out of a joint decree forteacher management and establish the minimum number of students in a school, about 340,000 teachers or 17percent of the teaching force would need to be reallocated to ensure that all schools have at least the minimum
U
Spending more or spending better: Improving education financing in Indonesia
number of teachers. While most of this reallocation can occur within districts, which is logistically simpler, thereis still a need to reallocate teachers across districts and even across provinces. The sheer size of the reallocation,and the lack of clear mechanisms for these transfers, make realizing these efficiency and equity gains difficult toachieve in the short period of the decree's validity.
A large constraint in Indonesia's education system is the high number of small schools. The highprevalence of small schools increases the need for teachers. Revisiting school planning should be considered asa medium-term strategy, but more immediate measures (some already underway) could be expanded. Multi-grade teaching can be an effective way to deal with small schools, but there need to be provisions in place tosupport districts in its implementation. In senior secondary, cluster teaching (whereby teachers are allowed toteach more than one subject) can go a long a long way to improving efficiency. Lastly, incentives for teaching inremote areas should be elaborated and expanded.
In order to adapt more quickly, contract teachers could be used more strategically, but their workingconditions and career prospects need to be improved. Ideally, teachers would be fungible and flexible,available for assignment where they are most needed. However in the absence of this mobility across subjects,levels of education and schools, contract teachers can be used to deal with shortages. In many countries contractteachers have proven to be effective at supporting expansion, and they are significantly easier to move acrossschools. However, without effective regulations on contract teachers, defined career prospects and improvedworking conditions, there is a risk that high turnover and the use of unqualified teachers may harm the qualityof education.
The teacher certification program needs to be reassessed, since it is not delivering the expected results.Studies have shown that while certified teachers are less likely to hold second jobs, students of certifiedteachers do not perform significantly better on tests. To a large extent, the creation of a simplified procedure forcertification (based on submitting a "portfolio" of teaching experience, training courses or workshops) seems tohave weakened the effects of the program, but the introduction of recertification requirements may improvethe outlook. A promising step in 2012 is the inclusion of a competency test to determine eligibility for thecertification process.
c) Improving School and District ManagementWhile districts are responsible for both teachers and schools, 80 percent of their spending goes tosalaries. School budgets, therefore, are left with only a small portion, if any, of district funds. Almost half ofschools report receiving no funds from district or provincial governments.
Still many districts and provinces do support schools directly by providing (small) discretionary fundsthrough the BOSDA program. More than half of local governments receive BOSDA, and a majority of themprovide top-up funds using the same per student formula as the central government's School Assistance Program(BOS). A few are experimenting with alternative formulas (per school, per teacher, equity-based formulas andeven some performance-based formulas).
Additional discretionary funds from BOSDA are associated with better learning outcomes. Using detailedbudget data, the report shows that schools that get BOSDA do not shift their big categories of spending inmajor ways.The additional funds, however, have a positive effect on learning outcomes both in math and BahasaIndonesian.
Expanding the BOSDA program offers a promising format for increased district support to schools. Byexperimenting with different formulas, BOSDA has the potential to play a stronger role in improving districtmanagement by allocating resources in a more equitable way and by introducing a more active districtinvolvement in school management.
U
Executive Summary
Improving Budget Planning,Transparency and Accountability.
In addition to the specific measures above, ensuring accountability and transparency in the process ofplanning and allocating resources is crucial to improving the quality of spending. The 20 percent rulemakes it more challenging to hold spending agencies accountable because budgetary decisions are divorcedfrom educational results (ie. the funding for education is guaranteed regardless of results). The 20 percentfunding should not be taken for granted, however, but rather viewed as an opportunity to improve educationaloutcomes and access. Every effort should be made to ensure that funds are spent in a transparent manner,based on long-term development objectives and linked to specific program needs.
Improving budget transparency requires improved education budget reporting at the sub-nationallevels and improved reporting on budget priorities for mid-year windfalls at the national level. Thisreport mentions several problematic areas in the current education data reporting, particularly when it comesto sub-national data, which lags two years behind, covers only 70 percent of districts and does not providebasic data breakdowns. Encouraging more up-to-date and detailed sub-national data reporting and providingreporting guidelines to districts and provinces to ensure consistency in methodology and calculations is animportant element in improving education budget transparency. Also, given the recent large windfalls resultingfrom the 20 percent rule, it is important to renew and expand the education line ministries' 2010 practice ofproviding detailed budget plans describing windfall allocations to specific programs and activities.
Ensuring the link between program planning and budgeting, and linking these to performance islikely to result in better quality spending. MoEC has led the way by measuring outcomes and evaluatingperformance and using this information to inform its budgeting. Since 2010, MoEC has been collaboratingwith the Vice President's Office to report on improvements in the government's priority programs and ensureconsistency between program planning and implementation. Expanding and improving the current Monitoringand Evaluation (M&E) effort and moving towards performance-informed budgeting should allow MoEC to reapfurther rewards in terms of improved quality of spending and improved outcomes.
Moreover, given the constraints and challenges associated with the 20 percent rule, it will be importantto develop better contingency planning strategies in education budget management. As previouslymentioned, the 20 percent rule makes the education budget unpredictable, especially as it also applies tothe revised budget. High volatility in the education budget should be mitigated by better use of the NationalEducation Development Fund; this will require the development of clear guidelines and a mid-term expenditureframework on windfall allocations to the Fund, as well as instructions on how and under what scenarios theFund's resources can be used.
Going forward...
Implementing all of these reforms will be a major challenge: the political economy of these reformsis complex. Reforms that involve one stakeholder can be relatively easy to implement given the will and theproper resources. Some of these reforms, such as expanding BSM or funding for higher education, are relativelystraightforward. However reforms that involve multiple stakeholders, each with their own interests, can proveimpossible if the interests are not aligned. Reforming the transfer system is outside of the control of MoEC, andhas consequences for many sectors, not only education. Balancing the various interests and incentives will becomplex, requiring better coordination among stakeholders.
The sequencing of reforms is important. Some issues are more pressing than others. One of the mostimportant is teacher management, which must be dealt with urgently in order to liberate resources and stop thetrend of excessive hiring. Improving budget planning and transparency are also key. These two reforms wouldset the stage for a more sustainable expansion in the future. Other reforms require careful reflection. For example,
U
Spending more or spending better: Improving education financing in Indonesia
while increasing spending in ECD seems desirable, current funding sources need to be evaluated and a moresustainable financing scheme developed.
Reforming transfer mechanisms is notoriously difficult-but even in the absence of such reforms, MoECcan still improve the system significantly. Expanding and improving strategic programs such as BSM, andincentivizing and supporting districts, would be major steps in the right direction. Providing districts with clearguidelines for teacher management and extending multi-grade teaching in small schools would improve theefficiency and equity of the system, even if the current DAU formula remains. Such reforms would liberateresources to fund key programs, including to improve teacher quality. Modifying the teacher certificationprogram to ensure that it results in improved outcomes is also a priority. Exploiting the BOSDA model to expanddistrict support and accountability can also have a major effect on the quality of education, as can the expansionof national programs for accountability and transparency.
It is time to translate the strong commitment to education into higher quality education and betteroutcomes. Indonesia is ready for that qualitative leap. It will require the collaboration and coordinationof many actors, but the potential gains are plentiful. As Indonesia consolidates its status as a middle-incomecountry, the skills of its labor force will be crucial. Improving the quality of education by improving the quality ofspending would be a major step toward ensuring the labor force is prepared.
U
Executive Summary
* Introduction: Why another public expenditurereview?
Few countries in the world have increased public expenditure on education by over 60 percent in realterms over a five-year period, as Indonesia did between 2005 and 2009. During that time, a constitutionallymandated allocation of 20 percent of government expenditure to education (hereafter"the 20 percent rule") wasdefined and implemented. The rule led to a massive increase in resources for education, making education thelargest government expenditure after energy subsidies.' This rapid and significant increase in resources, and theneed to evaluate where resources went and whether they translated into better educational outcomes, are themotivation for this report.
The large increase in expenditures addressed one of the main concerns of the last Education PublicExpenditure Review (PER) 2 - the lackof resources for education - but the problems with the distributionof resources persist. That PER, carried out in 2007 using 2006 data, highlighted that Indonesia's spending oneducation was lower than would be expected for the country's level of development. As this report shows,the massive increase in spending has brought Indonesia closer to other middle income countries in termsof spending as a share of the total government budget. The second challenge identified in the last PER hasnot yet been addressed however: the distribution of resources. The structural inconsistencies between centraland district spending and responsibilities are still present. Districts control the largest share of the budget, butthey spend mainly on salaries. Problems with teacher management are more serious now, as the number ofteachers has continued to increase since 2006.The high cost of certification anticipated in the previous PER andin subsequent World Bank reports on teacher management' has materialized and promises to become moresevere if the problems with teacher oversupply and distribution are not addressed.
As a consequence, improving the quality of spending in the education sector is now critical. Educationis crucial for Indonesia's plans to consolidate as a middle-income country and to accelerate its transformationinto a high-income country. Human resource development is a pillar of the recently approved Masterplan forEconomic Transformation4 , and as the country integrates with ASEAN and other trading partners, improving thequality of human resources must be central to its development strategy. It is also key to avoiding the middle-income trap, whereby countries fail to transition from middle-income to higher-income status because theyremain specialized in lower value-added activities. However, after the rapid increase in resources in recent years,total spending on education is unlikely to increase at a faster pace than the overall government budget. In thiscontext, it is all the more important to examine how resources are currently spent and to ensure they are usedefficiently and effectively to meet the remaining challenges in the sector.
This report focuses on how changes to the financing and governance systems can improve equity inaccess to education and the quality of education, and provides recommendations to improve governmentspending. Analyzing the consequences of the 20 percent rule for education budget management, this reportdescribes where the additional resources went and highlights the main challenges in the sector - continuingto expand access, especially for the poor, and improving quality. With those two problems being too complexto tackle comprehensively in a Public Expenditure Review, the report focuses on the effects of the currentfinancing and governance systems on access and quality. When it comes to teachers and teacher management,
1 Indonesia Economic Quarterly, World Bank (2012a)2 World Bank (2007) Investing in Indonesia's Education, Allocation, Equity and Efficiency of Public Expenditures3 See Transforming Indonesia's Teaching Force, World Bank (201 Ob)4 Masterplan for the Acceleration and Expansion of Indonesia Economic Development 2011-2025, retrieved from http://www.ekon.
go.id/media/filemanager/2011/05/27/p/d/pdf_mp3e.pdf
U
Spending more or spending better: Improving education financing in Indonesia
for example, the report examines how transfer mechanisms and differences in district capacity lead to a poordistribution of teachers, which eventually has a negative effect on learning. This ignores, for example, problemswith pre-service teacher training, or ineffective teacher career management.This compromise is necessary giventhe nature of this report. Other work from the World Bank does cover these issues.'
While the analysis of the trends in spending span over all levels of education and includes the variousministries involved in education, the specific analysis on quality of spending is focused mainly on basiceducation. This, for two reasons: basic education absorbs most of the budget and, being managed by districtgovernments and with school autonomy, basic education has the most complex financing and governancestructure in the sector. In addition, a high-quality basic education is critical both for economic growth andemployability. Ensuring good quality basic education is a necessary condition for the development of the restof the education system.
The report is divided into two parts. The first three chapters show that the vast increase in educationresources has not been accompanied by a similar increase in learning outcomes, and thus highlight theurgent need to improve the quality of spending. Chapter 1 starts by describing the complex financing andgovernance systems. With this policy framework in mind, Chapter 2 focuses on the 20 percent rule, analyzingits consequences for budget planning and management and examining where resources went after this vastincrease in spending. The chapter also provides some estimates of the cost of meeting future governmentobjectives, in the context of discussions on expanding compulsory education, and broadening teachercertification. Chapter 3 looks at education outcomes, reviewing the significant improvements in access andequity, as well as the worrisome trends in learning outcomes. It points to improving the quality of educationand expanding access to secondary and above (especially for the poor) as the main challenges in the sector.Given the cost of achieving these goals, and the fact that current expenditure patterns are unlikely to lead toimprovements in learning outcomes, the chapter concludes that improving the quality of spending in educationis now critical.
The second part of the report focuses on how to improve the quality of spending in order to continueexpansion and improve learning outcomes. In chapter 4, the quality of spending issue is divided into twoareas: i) reassigning or improving programs at the central level, and ii) improving management at the districtand school levels. At the central level, this chapter analyzes the Scholarships for the Poor program (BSM) andrecommends that it be expanded and improved. At the sub-national level, the report explores how a combinationof more efficient teacher management and stronger support for schools can improve efficiency and learningoutcomes, and what the central government's role should be in ensuring that these changes occur. Finally,chapter 5 summarizes these recommendations, providing a framework for improving the quality of spendingand, ultimately, ensuring that this spending leads to an improvement in the quality of the Indonesian educationsystem.
5 A comprehensive report on teacher policies is currently under preparation.
U
IChapter 1:
How is the Indonesian EducationSystem Financed and Managed?
The education system in Indonesia is a very large, highly decentralized system, with over 500 districtgovernments playing a strong role in its management. This role includes the managing the system's mostimportant assets: 59 million students, 330,000 schools and close to 3 million teachers.6 While many ministriesregister spending on education in their budgets,7 the Ministry of Education and Culture (MoEC) and theMinistry of Religious Affairs (MoRA) are responsible for setting policies and managing the system. Under bothministries, public and private provision co-exist and receive public support in the form of civil service teachers(at all levels) and direct school grants (in basic education). While the nine years of basic education (primary andjunior secondary) are compulsory and heavily subsidized, household contributions are high in senior secondaryeducation and very high in higher education. This is partly related to the greater reliance on private provisionand limited public support for these levels. While public MoEC schools cover a majority of enrollment in basiceducation, private provision is more prevalent in senior secondary and higher education (Figure 1).
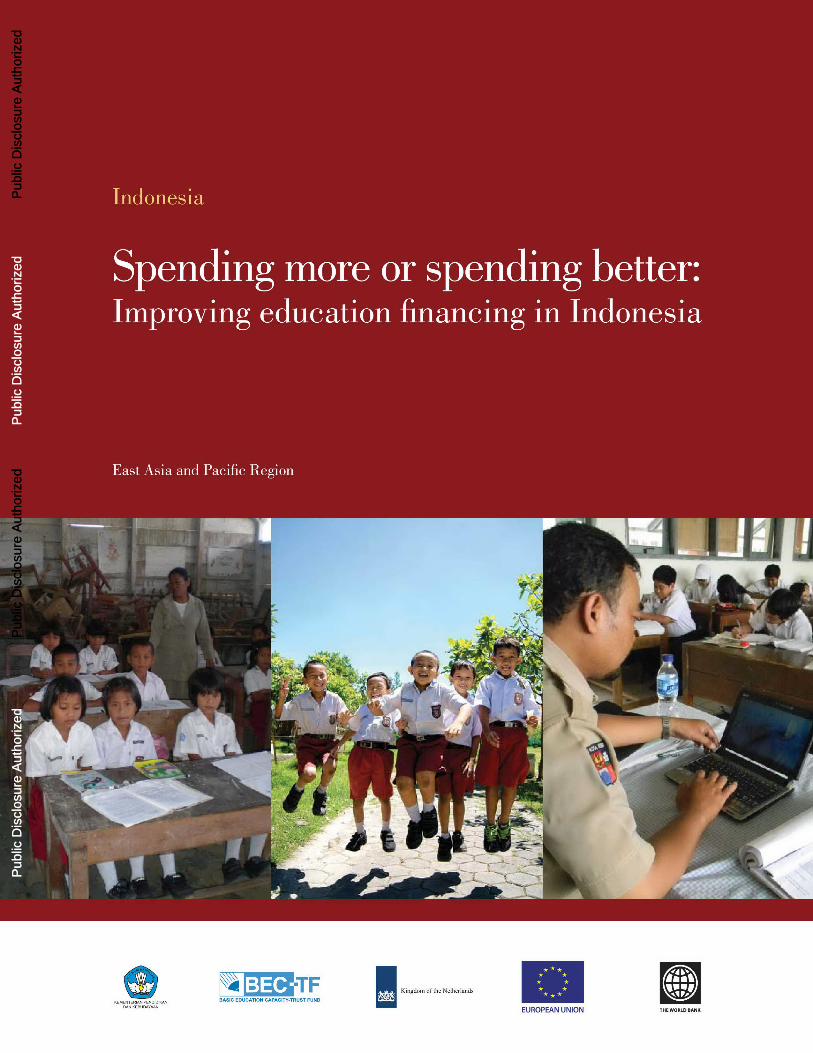
The system's institutional complexity is matched by complexity in financing mechanisms. Despite effortsto simplify school budgets by providing per student block grants to all schools in Indonesia (BOS), schools stillreceive funds from seven different budget sources: some come directly from the central government, somefrom local governments (mainly districts).This complicates school planning. District and provincial governmentsalso receive funds from different transfer mechanisms, each with specific associated incentives. Meanwhile, thehigher education system is centralized and support is limited to public universities, except in the case of civilservice lecturers placed in private universities.
To further complicate financing and management, a constitutional amendment passed in 2002establishes that at least 20 percent of the total state budget has to be spent on education. Both centraland local government budgets are subject to the rule, which includes budget revisions. This rigidity createssignificant distortions in decision-making.
6 The number of students and schools mentioned includes all levels of education (from early childhood/ECD to higher education), pub-lic and private. The number of teachers is from ECD up to senior secondary, including inclusive education civil servant and non-civilservant, permanent and contract teachers (MoEC, 2010 and NUPTK, 2011).
7 The Ministries of Finance, Agriculture, Industry, Energy and Mineral Resources, Transportation, Health, Forestry, Marine Affairs and Fish-eries, Tourism and Creative Economy, Youth and Sport, Defense, and Manpower and Transmigration, the National Land Agency, theMeteorological-Climatological and Geophysical Agency, the National Nuclear Energy Agency, the Ministry ofYouth and Sport, Ministryof Defense, Ministry of Manpower and Transmigration, National Library, and Ministry of Cooperatives and Small & Medium Enterprises.
U
Spending more or spending better: Improving education financing in Indonesia
Figure 1: Share of enrollment by provider type and level, 2010
Tertiary 62 Public underMoNE
Senior Secondary 3 N cU Public underMoRA
Senior Secondary 1 1 Other Public
PrimaryPrivate
0% 50% 100%
Source: SUSENAS 2010.
This chapter provides an overview of the financing and governance of the hig hly decentralized educationsystem. It provides a picture of the system and its different tracks, explains the roles that central and regionalgovernments play, and provides an overview of the transfer mechanisms that support the system.
A description of the National Education System inIndonesiaThe national education system in Indonesia' accommodates three tracks: formal, non-formal andinformal education (Figure 2). Formal education is structured consecutively, starting with pre-school or earlychildhood education, running through basic education (primary and junior secondary education) and seniorsecondary education, and concluding with higher education.9 Primary and junior secondary are compulsory(nine years). Senior secondary education has two tracks: general and vocational. Both last three years but thecurricula vary. The higher education system also provides both general and technical options, offering diplomasfrom polytechnics and professional schools, and undergraduate degrees (Si) from four-year universities, aswell as Masters (S2) and PhD (S3) degrees. A national examination is held to assess student competency in thelast year of primary, junior secondary, and senior secondary, and to determine whether a student is eligible tocontinue. Non-formal education enables lifelong learning by allowing people to pursue an educational path atany point of one's life, substituting for and/or complementing formal education; such learning takes place intraining institutes or community learning centers. Informal education may take the form of home schooling orother independent learning activities.
8 Law 20/2003 serves as the legal basis for Indonesia's National Education System. This Law is the latest revision of Law 2/1989 onNational Education System decentralization. This revision under ines the shift in the education system's management in the contextof reformation and decentralization, eliminating discrimination between government-run (pub ic) and community-run (private) in-stitutions, and between religious and general education. The system introduced in this law takes into account the implementationof regional autonomy according to Law 22/1999 on Regional Government and Law 25/1999 on Fisca Balance between Centra andLocal Government.
9 More discussion on the goal of each level of formal education; see for example World Bank's "Preparing Indonesian Youth forTransi-tion,"World Bank 2012.
B
How is the Indonesian Education System Financed and Managed?
Figure 2: National Education System in Indonesia
Seonary EducatoiD
(3 years: 16-18 years old) SM /AM /M sM /A
or 7 yeInformalj
Formal Education Non Formal Education Education
Source: Elaboration based on Law 20/2003 and The Southeast Asian Ministers of Education Organization/SEAMEO (2006).
Two ministries administer the national education system in Indonesia-the Ministry of Education and Culture(MoEC) and the Ministry of Religious Affairs (MoRA). The education levels of MoRA-administered schools mirrorthose of MoEC schools (from pre-school to higher education), enabling movement from one to the other. Bothdeliver the same compulsory curriculum, with a distinct emphasis on religion in MoRA schools. But while MoRA'sgovernance is centralized, with provincial and district offices reporting directly to MoRA instead of to the head ofthe local government MoEC's governance is decentralized, with the bulk of decision-making and service deliverydevolved to local governments.
The private sector plays a substantial role in the delivery of education in Indonesia, but quality variesenormously. Private schools are run by non-governmental institutions, such as foundations, religious or othergrassroots organizations. These schools have largely filled the gap left by public schools in poor and rural areas,while some cater to students from wealthier families.10 Up to 91 percent of MoRA's Islamic schools are run byfoundations linked to mass Islamic organizations." When it comes to MoEC schools, private providers representa larger share of the total as the education level increases. The government supports private schools throughregulations and bycdeploying civil service teachers (a relatively small number compared to the number of school-hired teachers).The BOS program disburses blockgrantsto both public and private schools at the basic educationlevel. Thus, in addition to complying with government regulations, private primary and secondary schools arenow required to report BOS fund allocations on a quarterly basis to their respective district governments.
10 World Bank (2010Ob), Transforming Indonesia's Teaching Force.11 MoRA (2008) in Ali et al.(201 1), Quality of Education in Madrasah.
- C,
Spending more or spending better: Improving education financing in Indonesia
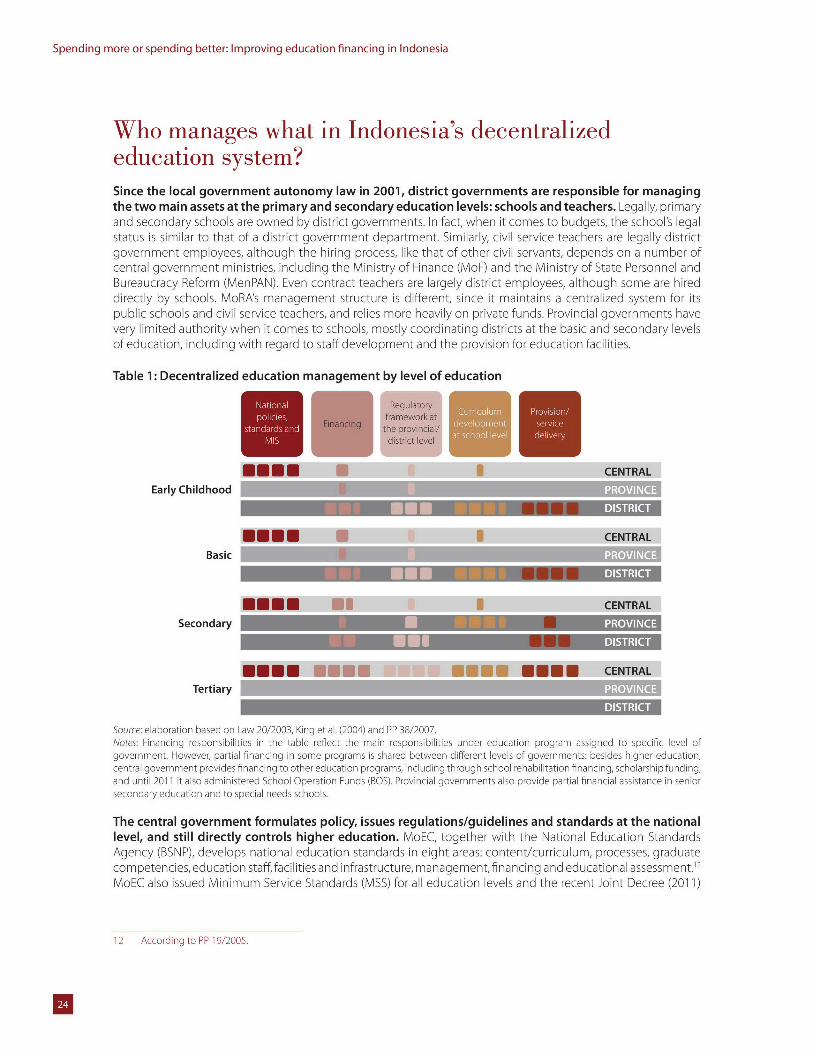
Who manages what in Indonesia's decentralizededucation system?Since the local government autonomy law in 2001, district governments are responsible for managingthe two main assets at the primary and secondary education levels: schools and teachers. Legally, primaryand secondary schools are owned by district governments. In fact, when it comes to budgets, the school's legalstatus is similar to that of a district government department. Similarly, civil service teachers are legally districtgovernment employees, although the hiring process, like that of other civil servants, depends on a number ofcentral government ministries, including the Ministry of Finance (MoF) and the Ministry of State Personnel andBureaucracy Reform (MenPAN). Even contract teachers are largely district employees, although some are hireddirectly by schools. MoRA's management structure is different, since it maintains a centralized system for itspublic schools and civil service teachers, and relies more heavily on private funds. Provincial governments havevery limited authority when it comes to schools, mostly coordinating districts at the basic and secondary levelsof education, including with regard to staff development and the provision for education facilities.
Table 1: Decentralized education management by level of education
poliies,tor Curriculum Provision/standards and deveop ent service
MIS atschoolleve delivery
NOON U CENTRAL
Early Childhood
MEN DISTRICT
EUOM I CENTRAL
Basic
MEN DISTRICT
NOON e I CENTRAL
Secondary P
MEN DISTRICT
agag agag MgNg Sggg CENTRALTertiary
Source: elaboration based on Law 20/2003, King et al. (2004) and PP 38/2007.Notes: Financing responsibilities in the table reflect the main responsibilities under education program assigned to specific level ofgovernment. However, partial financing in some programs is shared between different levels of governments: besides higher education,central government provides financing to other education programs, including through school rehabilitation financing, scholarship funding,and until 2011 it also administered School Operation Funds (BOS). Provincial governments also provide partial financial assistance in seniorsecondary education and to special needs schools.
The central government formulates policy, issues regulations/guidelines and standards at the nationallevel, and still directly controls higher education. MoEC, together with the National Education StandardsAgency (BSNP), develops national education standards in eight areas: content/curriculum, processes, graduatecompetencies, education staff, facilities and infrastructure, management, financing and educational assessment."MoEC also issued Minimum Service Standards (MSS) for all education levels and the recent Joint Decree (2011)
12 According to PP 19/2005.
How is the Indonesian Education System Financed and Managed?
on redistribution of civil service teachers." When it comes to higher education, the Directorate General of HigherEducation within MoEC has a key role, with authority to issue and revoke permits for institutions of higher learningand tight control over the public higher education system. Salaries for civil servant lecturers in both public andprivate universities are disbursed by the central government. However, few higher education institutions havesome autonomy, as long as they are in compliance with the norms and quality assurance standards developedby MoEC.
Both central and district governments are responsible for developing and managing the teaching force.The current teacher certification program, for instance, is led by MoEC in coordination with district governments.The ongoing scheme to redistribute civil service teachers provides another example: regulations and technicalguidelines are introduced by MoEC, while the analysis of teacher needs and redistribution are led by districts(for redistribution within districts) and by provincial governments (for redistribution across districts). The centralgovernment also sets quotas for professional certification.
Other central government agencies remain in charge of setting pay rates for civil servants andtransferring district government budgets. MenPAN, MoF and the National Civil Service Board (BKN) play keyroles in the hiring of civil service teachers and determining civil service quotas, while the selection, deploymentand management of civil service teachers are handled by district governments.
Schools have considerable autonomy over operational, budgetary and programmatic decisions. Since2003, School Based Management (SBM) has applied to all stages of formal education. A degree of decision-making power and management have thereby devolved to the school level, taking account of local norms andencouraging community involvement. Evidence of SBM is seen in the joint role principals, teachers and schoolcommittees 4 play in the allocation of BOS funds, and in the development of school budgets and school workplans.
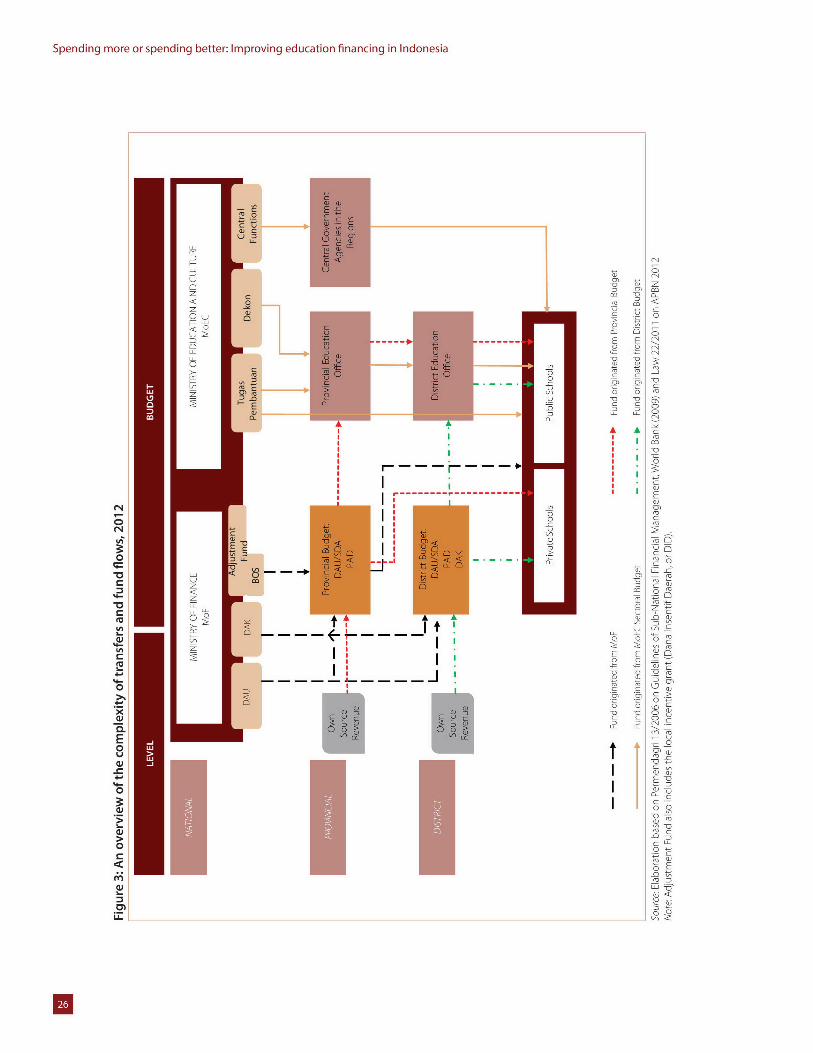
Who pays for what in Indonesia's education system?The funding system for the education sector is complex, involving multiple sources and transfers acrossvarious levels of government. Expenditures for education come from central government funds, transfers tosub-national governments, sub-national governments'own-source revenues, and central government spendingat the sub-national level that is not recorded in sub-national budgets. Currently, schools receive funds fromeight different sources and four different budgets, including the national, provincial, district and school budgets(Figure 3).
Central government transfers are the main source of revenue for district government budgets (APBD).Central government transfers to sub-national governments have more than doubled in real terms sincedecentralization, accounting for 88 percent of district budgets and 44 percent of provincial budgets in 2009.While the majority of transfers are not earmarked - making it impossible to determine exactly what they arespent on - transfers are estimated to finance about 90 percent of sub-national spending on education, and 60percent of the total national education budget." Sub-national governments receive many types of transfers foreducation spending, including the General Allocation Fund (Dana Alokasi Umum, DAU), the Specific AllocationFund (Dana Alokasi Khusus, DAK), Special Adjustment Funds (Dana Penyesuaian), Co-administered Tasks (TugasPembantuan), De-concentration (Dekonsentrasi/Dekon) Funds, as well as BOS for elementary and juniorsecondary schools."6
13 MoEC put together technical guidelines as a reference for district and provincial governments during the mapping of teacher needsand eventually the redistribution process.
14 School committee representatives include parents, members of the community and education experts and/or practitioners, andshould be chosen via a democratic and transparent election process (as regulated in the PP 17/2010 on Management and Implemen-tation of Education),
15 2009 Revised Planned Budget (APBN-P) includes planned total education budget and estimates of regional transfers allocated foreducation, 2009 realized regional budget data (SIKD), MoF.
16 BOS program was initially designed as a direct transfer from central budgets to schools, but was rerouted through districts in 2011 andprovinces in 2012.
B
Spending more or spending better: Improving education financing in Indonesia
- E.0O
0 r-- - -- -- E E zz c
Ou0
E CD
--------- r-----
CMQ
7DD7
So 0 w2)C
uC
G)J
E
G) G
OO
2c
o 'o,
cIIi ZCE
.5" 8 ~Isu.. C CD
26 DC
How is the Indonesian Education System Financed and Managed?
The main transfer to sub-national governments is the DAU block grant, which provides funding for thesalaries of district civil servants, including civil service (PNS) teachers. DAU transfers represented about60 percent of district and 20 percent of provincial budgets in 2009.17 The DAU is allocated through a two-partformula consisting of the"Basic Allocation"and the"Fiscal Gap"(See Box 1 for details on each transfer type).TheBasic Allocation, which is calculated largely based on the salary bill for civil servants in the district or province,implicitly incentivizes civil service hiring. Covering about 72 percent of the salary bill, it accounts for about 45percent of the total DAU.11
An earmarked transfer, the Specific Allocation Fund (DAK) is also allocated yearly through no specificformula,and coversa significantportion ofschool andclassroom reconstruction and school improvement.Although relatively small - about 8 percent of district and 1 percent of provincial revenues in 2009 - the DAKis an important financing mechanism for school improvement projects. De-concentrated funds (Dekon) play asimilar role, but may also cover other functions, such as social assistance and capacity-building programs. De-concentrated funds and co-administered tasks contribute about 9 percent of total sub-national revenues but arenot typical transfers - although disbursed at the sub-national level and administered by provincial and districteducation offices (Dinas), they are not recorded in sub-national budgets (APBD). At the school level, the BOS andBOMM (Operational Assistance for Quality Management or Bantuan Operasional Manajemen Mutu) programsconstitute the majority of funds at the school level and are fundamental for operational assistance and qualitymanagement.
Managing such a large and complex system is clearly a challenge. The decentralized system means thecentral government has limited influence over district decisions. In this context, regulations may prove difficultto enforce. Incentives, on the other hand, can have great influence over district decisions, as evidenced in thisreport by the issue of teacher hiring. Thus with the right incentives, transfer mechanisms can be powerful toolsto guide district spending. However, this may not be sufficient. Additional support from the central governmentmay be needed for low-capacity districts or schools. As we will see in this report, neither the right incentives northe additional support are currently in place, so given the vast increase in resources following implementationof the "20 percent rule," defining roles and providing the right incentives for each actor is crucial to ensure thatresources are spent effectively. This will be a key subject of this report.
17 Total sub-national revenues include Dekon/TP transfers spent at the sub-national level but recorded in the central government bud-get.
18 Until 2008, Basic Allocation covered 100 percent of civil servant salaries (at both the provincial and district levels). It was reduced to 89and 87 percent coverage for provinces and districts respectively, and further reduced in 2009 to 80 and 72 percent.
U
Spending more or spending better: Improving education financing in Indonesia
Box 1: An overview of current transfer mechanisms in the Indonesian education system from thecentral to sub-national governments
This box provides a brief description of the objectives and means by which the various transfer mechanisms from thecentral government to sub-national governments within Indonesia are determined. These transfers represent the majorsource of financing for sub-national governments and thus, to a large extent, explain the level and composition of theirspending.
General Allocation Fund (Dana Alokasi Umum, DAU)The DAU, according to Law No. 33/2004 Article 1 (21), is a discretionary block grant sourced from the Central Budget(APBN) and aims to equalize the fiscal capacities of sub-national governments. It is transferred monthly and directlyfrom central to sub-national governments. The DAU is allocated based on a national formula and is the sum of a basicallocation (a portion of the sub-national budget for public servant salaries) and the"fiscal gap" (the difference betweenthe estimated fiscal needs and fiscal capacity) of the sub-national government. The basic allocation accounted for about45.5 percent of the DAU in 2010. Fiscal needs are based on regional variables such as population, area, GDP per capita,and the human development index. Fiscal capacity is measured by a region's own-source revenue and a fraction of totalrevenue-sharing. Based on Government Regulation No.55/2005, provinces only receive 10 percent of the total DAU, whiledistricts receive 90 percent.
Specific Allocation Fund (Dana Alokasi Khusus, DAK)DAK is an earmarked grant allocated to finance specific investment expenditures that are aligned with national prioritiesand carried out under the jurisdiction of sub-national governments. The DAK cannot be used for research, training,administration, or official travel. In 2011, 19 economic sectors received DAK allocations including education, health,agriculture, forestry, trade and various infrastructure sectors (road, irrigation, water, sanitation, rural electricity, housing andlocal government and remote areas infrastructure). Education is a key priority for DAK spending, with about 40 percentof DAK transfers allocated for education and used primarily for school rehabilitation and quality improvement. The DAKallocation has a formula component that takes into account the fiscal gap and has a 10 percent matching requirement.DAK is transferred in three tranches: the first is allocated after the budget is submitted to the central government; thenext two depend on the depletion of the previous tranche. Although DAK is earmarked to fund capital spending, thegovernment allowed some routine maintenance expenditures.
Revenue Sharing Fund (Dana Bagi Hasil, DBH)Unlike DAU, which is a horizontal equalization grant, DBH is a vertical equalization grant which consists of revenue sharingfrom natural resources and taxes. Local governments are obliged to use 0.5 percent of their receipts from the naturalresources part of DBH on basic education." DBH represented approximately 20 percent of total sub-national governmentrevenues in 2009.
Special Autonomy and Adjustment FundsSpecial Autonomy Funds include specific grants for Papua, Papua Barat and Aceh (Dana Otsus) and Special AdjustmentFunds (Dana Penyesuaian) which include additional allowances for teachers, such as professional benefits for certifiedteachers and for uncertified civil service teachers, a School Operational Assistance program (Bantuan Operasional Sekolah,or BOS), and local incentive grants (Dana Insentif Daerah, or DID) for education.
Central government spending at the sub-national level not recorded in sub-national budgets (APBD)
De-concentration (Dekon) and Co-Administered Tasks (Tugas Pembantuan, TP)Dekon and TP funds originate from the central government's budget (APBN), and are administered by the provincialDinas. The funds cover a variety of projects and activities, including school and classroom reconstruction and schoolquality improvements, social assistance programs (which included BOS until 2011) and capacity building programs forcivil servants.
Sources: MoF and various laws
19 MoF on DBH at http://www.djpk.depkeu.go.id/information/22/.
U
IChapter 2:
The "20 percent rule": Where didresources go?
The evolution of public spending on education over the last decade has been impressive. From 2001 to2009 the Gol's education budget increased by over 120 percent in real terms, with most of the increase takingplace in 2009, when the budget increased by 20 percent in real terms over the previous year. What drove thisrapid increase in resources was, to a large extent, the constitutional amendment passed in 2002 that mandatedthe government to spend 20 percent of its total budget on education. The 20 percent rule was first met in2009, after the rule was clarified, bringing education spending to over 20 percent of the total state budget. Therule, however, has had some negative implications, complicating budget management and potentially creatingdistortions when it comes to spending decisions.
This chapter looks at the consequences of the 20 percent rule and at where the additional resources wentin 2009, examining the total education budget as well as changes in the central budget in 2010-2011. Inaddition to breaking down expenditure by level of education, level of government and economic classification,the chapter identifies the programs and policies that absorbed the majority of the increase in resources. Dueto the fact that sub-national data are available only until 2009, we look at budget trends by program only untilthat year, revealing the impact of 20 percent rule on the total education budget the first year after it was met.However, we also examine changes in the composition of the central budget for which more recent data areavailable (until 2011) to understand whether any significant changes occurred in the central education budgetafter 2009, both as a result of the 20 percent rule and of periodic windfalls - as we will see in the next section,the majority of the windfalls have been allocated to the central budget through the MoEC or MoRA budgets.
It is important to keep in mind the limitations of the data, especially when it comes to sub-nationalgovernment budgets, when looking at the results in this chapter. A simple look at the budget does notallow some of the basic breakdowns shown in this chapter. The biggest problem is with detailed sub-nationalbudget data, which is notoriously difficult to obtain. In fact, until the end of 2011, it was not possible to obtainsub-national budget data broken down by program (equivalent to level of education). Even now, these dataare only available for 2008 and 2009, and only for 413 out of 500 districts. Although the central budget data ismore up-to-date and detailed by program and activity of expenditure (2010 realized expenditures and 2011partial breakdown realized expenditures are available), it has no consistent methodology for recording salaryspending across years. In both central budget and regional data, it is impossible to distinguish between teacherand non-teacher (administrative) salaries. In regional data, civil service teacher and staff salaries are reportedat the aggregate level as part of"indirect spending" (or non-program), while non-civil service teacher and staffsalaries are reported as part of "direct spending" (or specific program expenditure). In addition, a change in theclassification of central government teachers in 2008 makes comparisons across years difficult when looking atcentral budget data, since non-teacher salaries (reported as"others" before 2008) are broken down by educationprogram sub-function starting only that year.
U
Spending more or spending better: Improving education financing in Indonesia
We are therefore forced to use the share of teachers by level of education to estimate sub-national salaryspending. This has two caveats. First, it assumes that teacher salaries are uniform by level of education, whichmay not be accurate if teacher characteristics between basic and secondary education differ significantly. Ineffect, since primary school teachers tend to possess fewer qualifications than secondary school teachers, wemay be overestimating primary teacher salaries and hence the share of sub-national spending that goes toprimary education. A second assumption we are forced to make is that the breakdown of administrative staffby level follows that of teachers. Since we cannot distinguish teachers from adiminstrative staff in the data, weuse the share of teachers by level to break down all salaries. While we lack information to check the accuracy ofthis assumption, its effect on the overall picture is likely very small. Even if the supervision structure of differentlevels is significantly different, the number of teachers relative to other district office staff is so large that thisassumption is unlikely to affect the overall picture.
We first look at the importance of the 20 percent rule for the education budget and budget management.
Implications of the 20 percent ruleThe "20 percent rule" was originally introduced in a 2002 amendment to the Constitution, establishingthat a minimum of 20 percent of the total state budget must be spent on the education sector. Sinceeducation stood at 15 percent of government spending at the time, the rule was not implemented immediately,and was met only in 2009, after the Constitutional Court defined and clarified it. While there was considerabledebate for many years over how to interpret it, since 2009 the 20 percent rule has been interpreted such thatit: (1) applies to both the planned and revised budgets (APBN and APBNP, respectively); (2) includes salaries andestimates of subnational spending on education funded from central transfers; and (3) is calculated as a ratio oftotal state expenditures including subsidies, interest payments and transfers to the regions. The rule applies toboth central and sub-national governments. 20 At the central government level this requirement has been met,and while in the majority of districts, spending on education exceeds the mandated 20 percent, there is a widerange of district spending on education as a share of total budgets (from 11 percent to 48 percent).
However well-intentioned the rule was, its effects have been mixed. On the one hand, the 20 percent rulehas resulted in a massive increase in resources - adding 6 percenttothe state budget for education between 2008and 2009. The rule clearly ensures political commitment to investing in education and prevents opportunismby policy makers, thus insulating priority education expenditures. On the other hand, it has complicated budgetmanagement and introduced perverse incentives.
Figure 4: Public Expenditure on Education, 2001-2010DR trillion Percent
350 25
21.9 21.1
280 16.4 21.7 20.9 20 mReal spending,
15.0 159 16.3 2009 prices (LHS)
210 14.15 15.6 15 Nominal spending (LHS)14.5 -realized education expenditure
11.4 as% total national expenditure140 10 -planned education expenditure
as% total national expenditure
70
4 5
0 02001 2002 2003 2004 2005 2006 2007 2008 2009 2010
Source: World Bank staff estimates based on MoF, APBD and BPS data.Notes: Realized expenditure data are unavailable after 2009 as sub-nationa realized data after that year are unavailable. Planned educationexpenditures reflect calculations of the budget including central government and regional transfers in the planned revised budget laws(APBN-P). Unlike planned data, realized data also includes sub-national own-source revenues allocated for education, which explains theslightly higher realized expenditure amount compared to planned expenditure in the graph.
20 Law No.20/2003 on National Education System
U
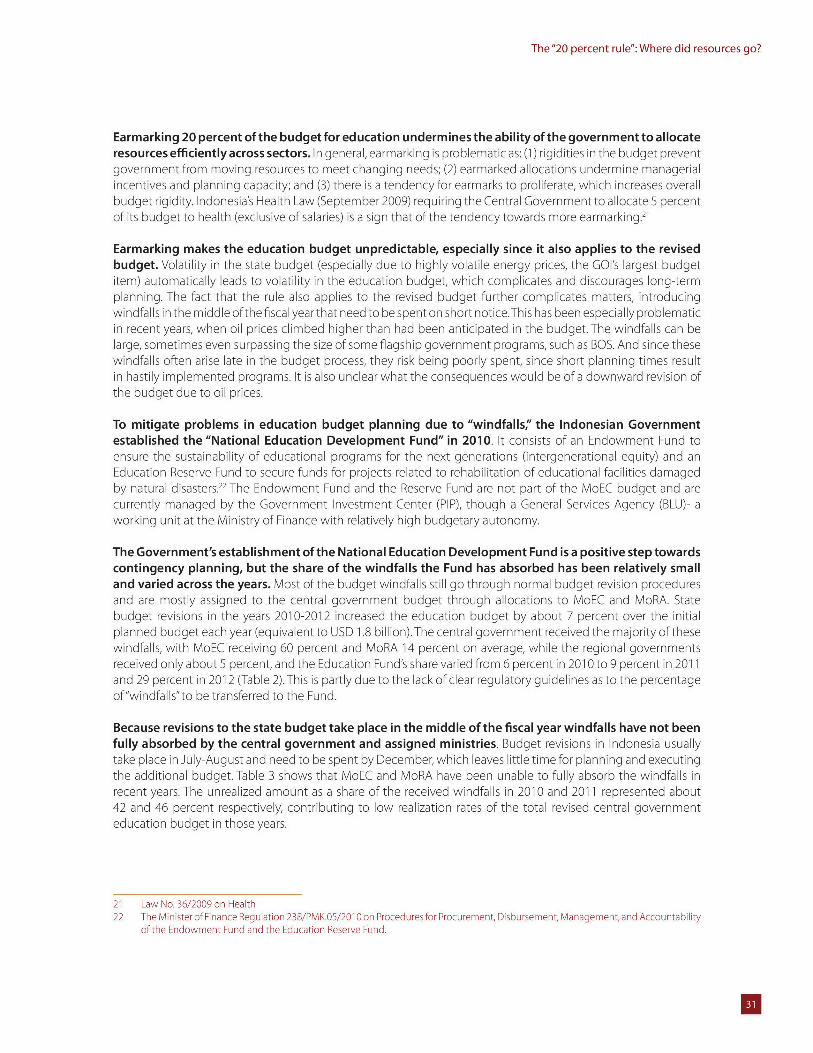
The"20 percent rule": Where did resources go?
Earmarking 20 percent of the budget for education undermines the ability of the government to allocateresources efficiently across sectors. In general, earmarking is problematic as: (1) rigidities in the budget preventgovernment from moving resources to meet changing needs; (2) earmarked allocations undermine managerialincentives and planning capacity; and (3) there is a tendency for earmarks to proliferate, which increases overallbudget rigidity. Indonesia's Health Law (September 2009) requiring the Central Government to allocate 5 percentof its budget to health (exclusive of salaries) is a sign that of the tendency towards more earmarking."
Earmarking makes the education budget unpredictable, especially since it also applies to the revisedbudget. Volatility in the state budget (especially due to highly volatile energy prices, the GOI's largest budgetitem) automatically leads to volatility in the education budget, which complicates and discourages long-termplanning. The fact that the rule also applies to the revised budget further complicates matters, introducingwindfalls in the middle ofthefiscal yearthat need to be spent on short notice.This has been especially problematicin recent years, when oil prices climbed higher than had been anticipated in the budget. The windfalls can belarge, sometimes even surpassing the size of some flagship government programs, such as BOS. And since thesewindfalls often arise late in the budget process, they risk being poorly spent, since short planning times resultin hastily implemented programs. It is also unclear what the consequences would be of a downward revision ofthe budget due to oil prices.
To mitigate problems in education budget planning due to "windfalls;' the Indonesian Governmentestablished the "National Education Development Fund" in 2010. It consists of an Endowment Fund toensure the sustainability of educational programs for the next generations (intergenerational equity) and anEducation Reserve Fund to secure funds for projects related to rehabilitation of educational facilities damagedby natural disasters." The Endowment Fund and the Reserve Fund are not part of the MoEC budget and arecurrently managed by the Government Investment Center (PIP), though a General Services Agency (BLU)- aworking unit at the Ministry of Finance with relatively high budgetary autonomy.
The Government's establishment of the National Education Development Fund is a positive step towardscontingency planning, but the share of the windfalls the Fund has absorbed has been relatively smalland varied across the years. Most of the budget windfalls still go through normal budget revision proceduresand are mostly assigned to the central government budget through allocations to MoEC and MoRA. Statebudget revisions in the years 2010-2012 increased the education budget by about 7 percent over the initialplanned budget each year (equivalent to USD 1.8 billion).The central government received the majority of thesewindfalls, with MoEC receiving 60 percent and MoRA 14 percent on average, while the regional governmentsreceived only about 5 percent, and the Education Fund's share varied from 6 percent in 2010 to 9 percent in 2011and 29 percent in 2012 (Table 2).This is partly due to the lack of clear regulatory guidelines as to the percentageof"windfalls"to be transferred to the Fund.
Because revisions to the state budget take place in the middle of the fiscal year windfalls have not beenfully absorbed by the central government and assigned ministries. Budget revisions in Indonesia usuallytake place in July-August and need to be spent by December, which leaves little time for planning and executingthe additional budget. Table 3 shows that MoEC and MoRA have been unable to fully absorb the windfalls inrecent years. The unrealized amount as a share of the received windfalls in 2010 and 2011 represented about42 and 46 percent respectively, contributing to low realization rates of the total revised central governmenteducation budget in those years.
21 Law No. 36/2009 on Health22 The Minister of finance Regulation 238/PMK.05/2010 on Procedures for Procurement, Disbursement, Management, and Accountability
of the Endowment Fund and the Education Reserve Fund,
U
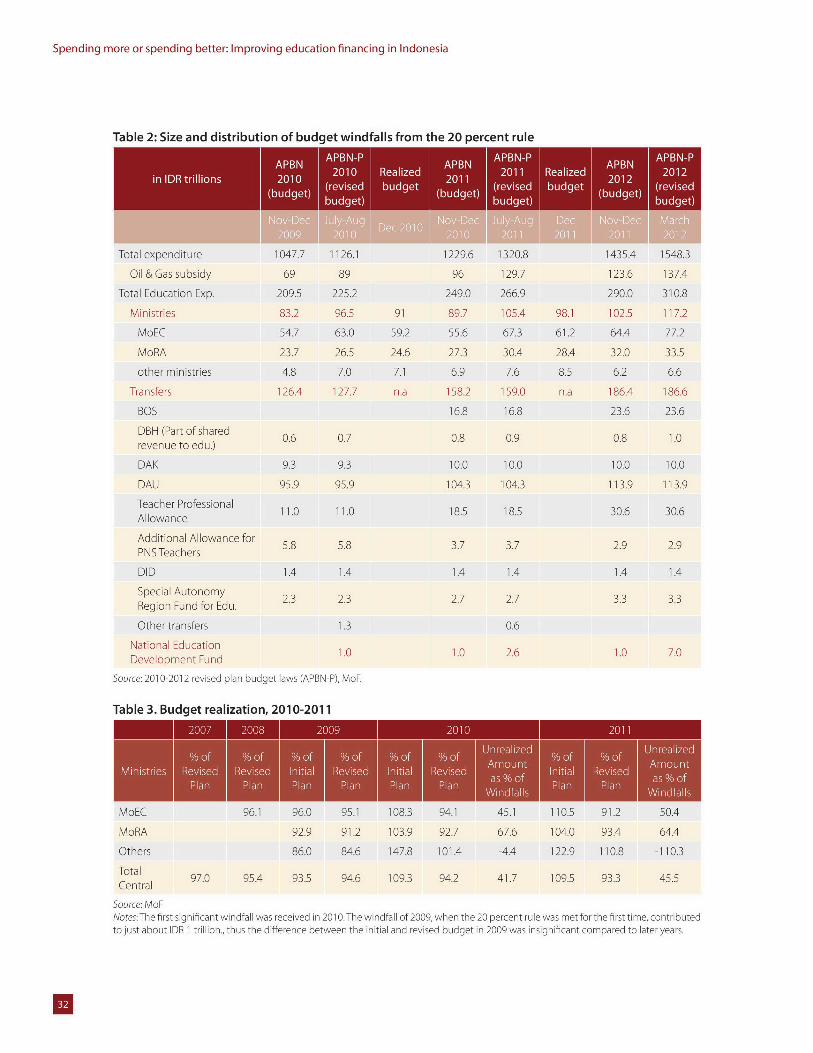
Spending more or spending better: Improving education financing in Indonesia
Table 2: Size and distribution of budget windfalls from the 20 percent rule
APNAPBN APBN AP3-2010 Realized 2011 Realized2
(budget) (rvsd buclget (revsedgudge (budget) (eiebudget)ubudget
Total expenditure 1047.7 1126.1 1229.6 1320.8 1435.4 1548.3
Oil & Gas subsidy 69 89 96 129.7 123.6 137.4
Total Education Exp. 209.5 225.2 249.0 266.9 290.0 310.8
Ministries 83.2 96.5 91 89.7 105.4 98.1 102.5 117.2
MoEC 54.7 63.0 59.2 55.6 67.3 61.2 64.4 77.2
MoRA 23.7 26.5 24.6 27.3 30.4 28.4 32.0 33.5
other ministries 4.8 7.0 7.1 6.9 7.6 8.5 6.2 6.6
Transfers 126.4 127.7 n.a 158.2 159.0 n.a 186.4 186.6
BOS 16.8 16.8 23.6 23.6
D3H (Part of shared 0.6 0.7 0.8 0.9 0.8 1.0revenue to edu.)
DAK 9.3 9.3 10.0 10.0 10.0 10.0
DAU 95.9 95.9 104.3 104.3 113.9 113.9
Teacher Professional 11.0 11.0 18.5 18.5 30.6 30.6Allowance
Additional Allowance for 5.8 5.8 3.7 3.7 2.9 2.9PNSTeachers
DID 1.4 1.4 1.4 1.4 1.4 1.4
Special AutonomyRpein Futnfory 2.3 2.3 2.7 2.7 3.3 3.3Region Fund for Edu.
Other transfers 1.3 0.6
National EducationDeveopntl und 1.0 1.0 2.6 1.0 7.0Development Fund
Source: 2010-2012 revised plan budget laws (APBN-P), MoF.
Table 3. Budget realization, 2010-2011
% Unrealfized%of % f o % o Unrealized
E. Amount l Amount
Pln la Pan Pln la Pan as % of Pa Pln as % ofWindfalls Windfalls
MoEC 96.1 96.0 95.1 108.3 94.1 45.1 110.5 91.2 50.4
MoRA 92.9 91.2 103.9 92.7 67.6 104.0 93.4 64.4
Others 86.0 84.6 147.8 101.4 -4.4 122.9 110.8 -110.3
TotalCeta 97.0 95.4 93.5 94.6 109.3 94.2 41.7 109.5 93.3 45.5Central
Source: MoFNotes:The first significant windfall was received in 201 O.The windfall of 2009, when the 20 percent rule was met for the first time, contributedto just about DR 1 trillion., thus the difference between the initial and revised budget in 2009 was insignificant compared to later years.
B
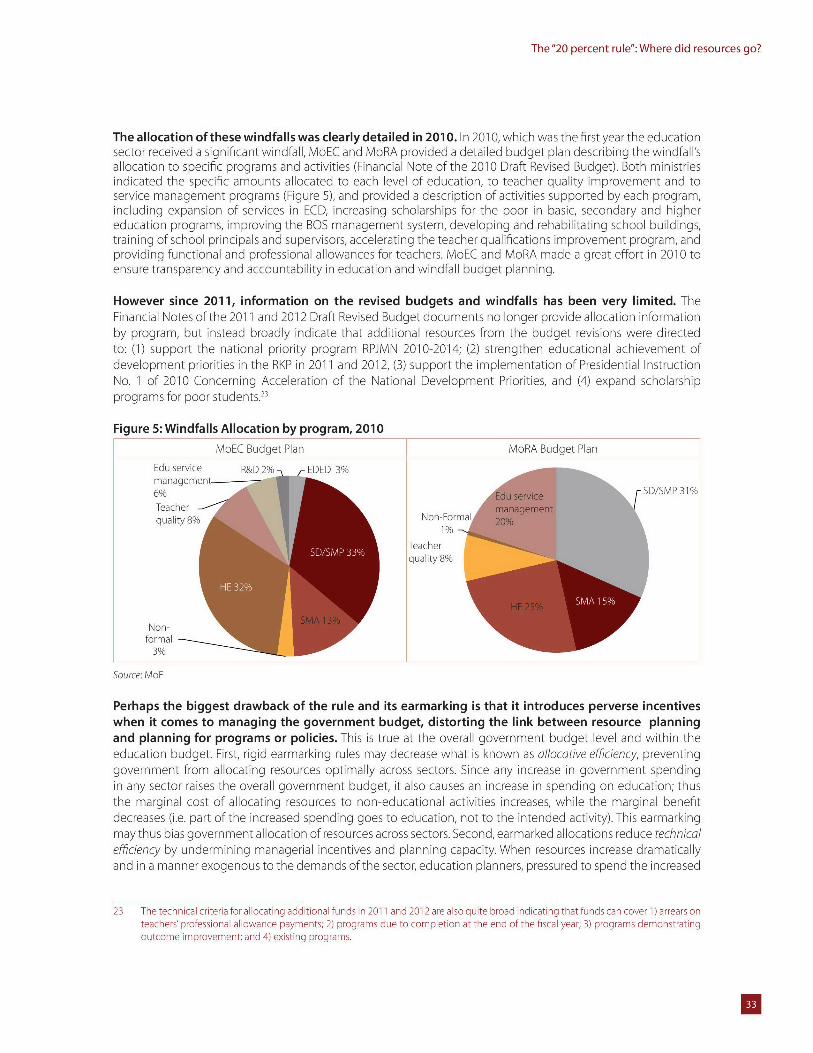
The"20 percent rule": Where did resources go?
The allocation of these windfalls was clearly detailed in 2010. In 2010, which was the first year the educationsector received a significant windfall, MoEC and MoRA provided a detailed budget plan describing the windfall'sallocation to specific programs and activities (Financial Note of the 2010 Draft Revised Budget). Both ministriesindicated the specific amounts allocated to each level of education, to teacher quality improvement and toservice management programs (Figure 5), and provided a description of activities supported by each program,including expansion of services in ECD, increasing scholarships for the poor in basic, secondary and highereducation programs, improving the BOS management system, developing and rehabilitating school buildings,training of school principals and supervisors, accelerating the teacher qualifications improvement program, andproviding functional and professional allowances for teachers. MoEC and MoRA made a great effort in 2010 toensure transparency and accountability in education and windfall budget planning.
However since 2011, information on the revised budgets and windfalls has been very limited. TheFinancial Notes of the 2011 and 2012 Draft Revised Budget documents no longer provide allocation informationby program, but instead broadly indicate that additional resources from the budget revisions were directedto: (1) support the national priority program RPJMN 2010-2014; (2) strengthen educational achievement ofdevelopment priorities in the RKP in 2011 and 2012, (3) support the implementation of Presidential InstructionNo. I of 2010 Concerning Acceleration of the National Development Priorities, and (4) expand scholarshipprograms for poor students.23
Figure 5: Windfalls Allocation by program, 2010
MoEC Budget Plan MoRA Budget Plan
Edu service R&D 2% EDED 3%management6% SD/SMP 31%
TeacherIIquality 8% Non-Formal
1%
TeacherSD/SMP 33%9 quality 8%
HE 32%
Non-formal
3%
Source: MoF
Perhaps the biggest drawback of the rule and its earmarking is that it introduces perverse incentiveswhen it comes to managing the government budget, distorting the link between resource planningand planning for programs or policies. This is true at the overall government budget level and within theeducation budget. First, rigid earmarking rules may decrease what is known as allocotive efficiency, preventinggovernment from allocating resources optimally across sectors. Since any increase in government spendingin any sector raises the overall government budget, it also causes an increase in spending on education; thusthe marginal cost of allocating resources to non-educational activities increases, while the marginal benefitdecreases (i.e. part of the increased spending goes to education, not to the intended activity). This earmarkingmay thus bias government allocation of resources across sectors. Second, earmarked allocations reduce technicalefficiency by undermining managerial incentives and planning capacity. When resources increase dramaticallyand in a manner exogenous to the demands of the sector, education planners, pressured to spend the increased
23 The technical criteria for allocating additional funds in 2011 and 2012 are also quite broad indicating that funds can cover 1) arrears onteachers' professiona allowance payments; 2) programs due to completion at the end of the fiscal year; 3) programs demonstratingoutcome improvement; and 4) existing programs.
U
Spending more or spending better: Improving education financing in Indonesia
resources, may not face the right incentives. For example, they may choose activities that easily absorb additionalbudget (i.e. adding staff), or short-term programs over long-term programs that may require more planning.Thismay have lasting consequences on the budget and on educational outcomes; if a large share of the additionalbudget is committed to wages, for instance, it can be difficult to make adjustments in the future.
Going forward, the 20 percent rule will also limit the growth of the education budget. The rule willbe interpreted as both a "floor" and a "ceiling" for education expenditure. As a consequence, expenditure oneducation is unlikely to grow higher than 20 percent of the government budget in the foreseeable future,regardless of need. Education is considered to be well-funded by both the government and parliament. Givenpressing demands to allocate more resources to currently underfunded sectors, including infrastructure andsocial assistance programs, it is unlikely the education budget will continue to increase at the rate it has in recentyears over the next decade.
Nonetheless, it is important to recognize the contribution the rule has made to increasing the educationbudget. It is equally important to assess the quality and efficiency of spending to ensure that theincrease in resources improves access to and the quality of education. The big jump in resources allocatedto education between 2008 and 2009 offers an opportunity to evaluate the results of such a drastic increase inspending, and to examine the incentives built into the current system and how they affected that spending.
We will therefore analyze what happened to the education budget during this period of rapid growth.But first we should ask: is 20 percent of the budget an appropriate amount to spend on education? Thenext section provides some international comparisons.
Is Indonesia spending too much on education after the20 percent rule?By all international measures, Indonesia does not spend too much on education. Indonesia is one of thetop spenders on education if we consider the educational budget as a share of total government spending. Of itsregional peers, onlyThailand allocates a higher share of the government budget to this sector. That said, budgetallocation is a central element in education financing, and an allocation of 20 percent of the national budgetis widely considered to be an indicative threshold for a strong commitment to education. Indonesia is nowamong the low- or middle-income countries that have met that threshold - only about one third of low-incomecountries have either achieved or surpassed the 20 percent threshold.24
As a share of GDP Indonesia still spends less than other middle-income countries, both in East Asiaand in other regions. At 3.7 percent of GDP, Indonesia spends less than Thailand, Vietnam or Malaysia in theregion, and spends half as much as high-income, high-performing countries such as Norway. Yet Indonesia fareswell when compared to other countries in the region, spending a higher share of GDP on education than Lao,Cambodia, the Philippines or even Singapore.
Relative to its wealth, therefore, Indonesia's per student spending is still low, especially when it comesto secondary education. As a share of per capita GDP, Indonesia spends less per student than most developedcountries and its regional comparators. In both primary and secondary education, Indonesia is at the lower endof the distribution.That said, when it comes to primary education, it is positioned above the Philippines or Chile,and only slightly below Mexico or Malaysia, yet it lags behind not only high-income countries but also someother middle-income countries such as Vietnam orThailand. In secondary education, the differences are greater.Only the Philippines and Thailand fall below Indonesia on the graph.
24 UNESCO(2011)
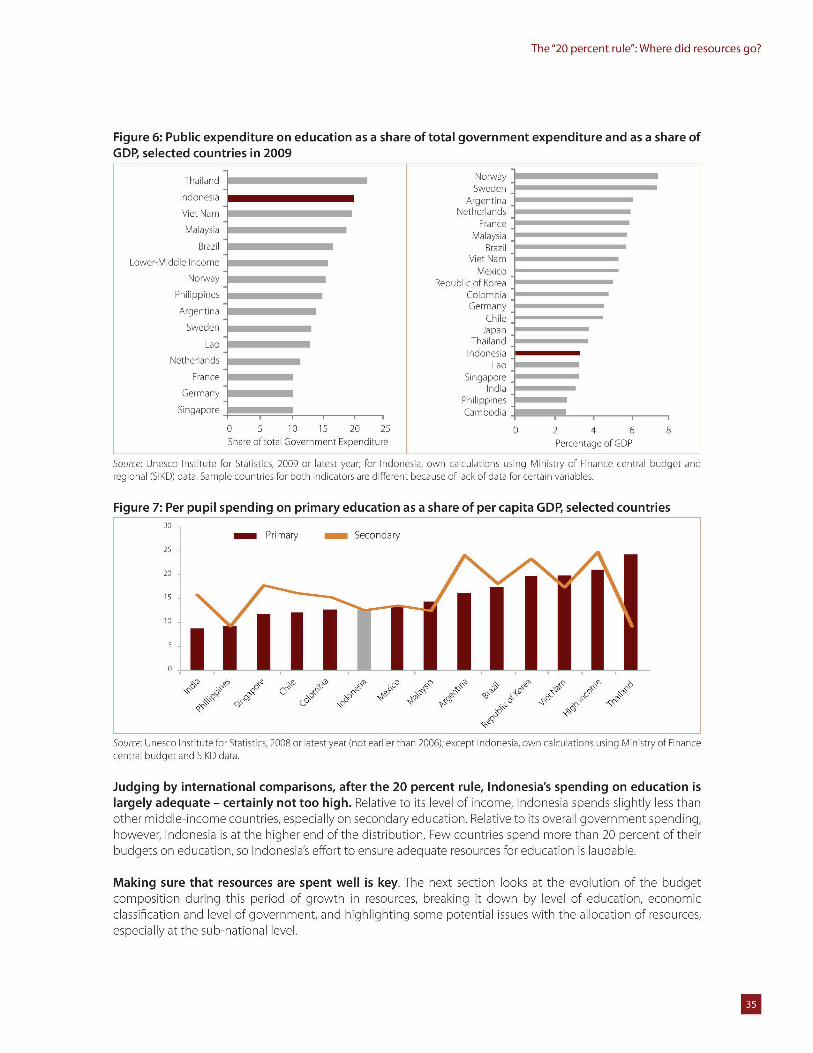
The"20 percent rule": Where did resources go?
Figure 6: Public expenditure on education as a share of total government expenditure and as a share ofGDP, selected countries in 2009
Thailand NorwaySweden
Indonesia ArgentinaViet Nam Netherlands
Malaysia FranceMa aysia
Brazil BraziLower-Middle Income Viet Nam
MexicoNorway Republic of Korea
Philippines Colombia
Argentina GermanyChile
Sweden JapanLao Thailand
IndonesiaNether ands Lao
France Singapore
Germany IdiaPhilippines
Singapore ________________Cambodia_______________
0 5 10 15 20 25 0 2 4 6 8Share of total Government Expenditure Percentage of GDP
Source: Unesco Institute for Statistics, 2009 or latest year; for Indonesia, own calculations using Ministry of Pinance central budget andregional (SIKD) data. Sample countries for both indicators are different because of lack of data for certain variables.
Figure 7: Per pupil spending on primary education as a share of per capita GDP, selected countries
Primary Secondary25
0100 15 2 50
25
Source: Unesco Institute for Statistics, 2008 or latest year (notearlierthan 2006); except Indonesia, own caculations usng Ministry of Financecentral budget and SIKD data.
Judging by international comparisons, after the 20 percent rule, Indonesia's spending on education islargely adequate - certainly not too high. Relative to its level of income, Indonesia spends slightly less thanother middle-income countries, especially on secondary education. Relative to its overall governmert spending,however, Indonesia is at the higher end of the distribution. Few countries spend more than 20 percent of their
budgets on education, so Indonesia's effort to ensure adequate resources for education is laudable.
Making sure that resources are spent well is key. The next section looks at the evolution of the budgetcomposition during this period of growth in resources, breaking it down by level of education, economicclassification and level of government, and highlighting some potential issues with the allocation of resources,especially at the sub-national level.
B
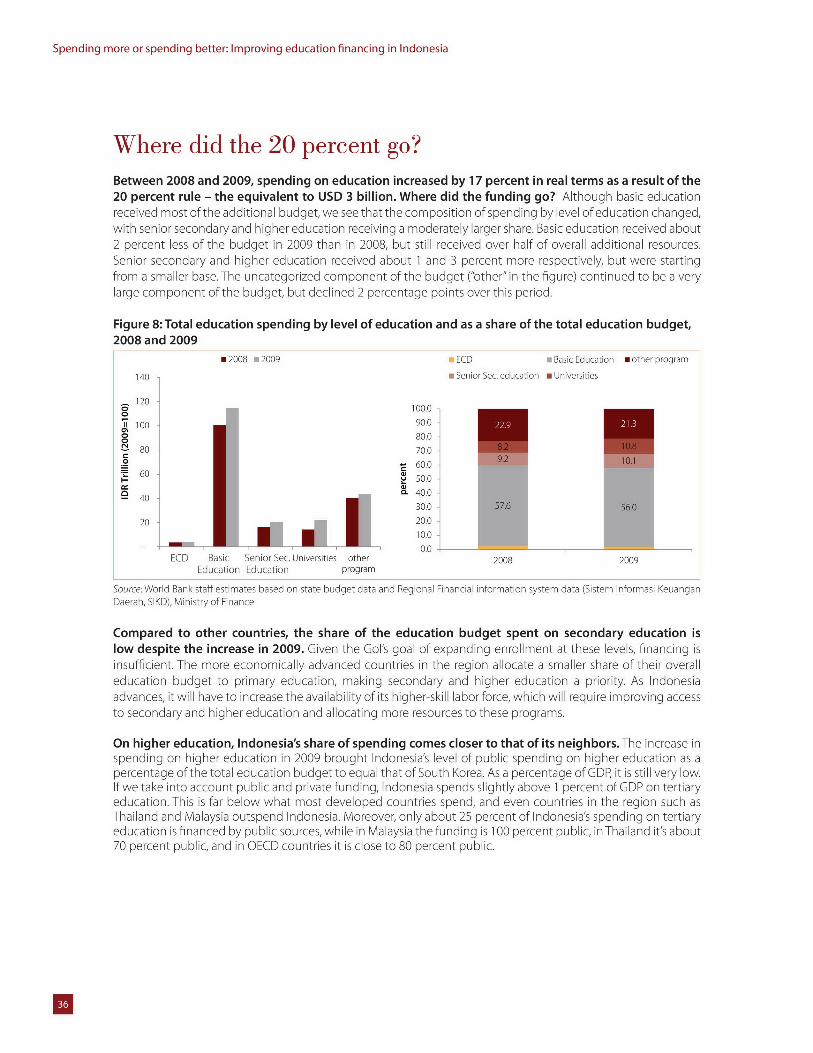
Spending more or spending better: Improving education financing in Indonesia
Where did the 20 percent go?Between 2008 and 2009, spending on education increased by 17 percent in real terms as a result of the20 percent rule - the equivalent to USD 3 billion. Where did the funding go? Although basic educationreceived most of the additional budget, we see that the composition of spending by level of education changed,with senior secondary and higher education receiving a moderately larger share. Basic education received about2 percent less of the budget in 2009 than in 2008, but still received over half of overall additional resources.Senior secondary and higher education received about 1 and 3 percent more respectively, but were startingfrom a smaller base. The uncategorized component of the budget ("other" in the figure) continued to be a verylarge component of the budget, but declined 2 percentage points over this period.
Figure 8: Total education spending by level of education and as a share of the total education budget,2008 and 2009
m2008 n2009 ECD m Basic Education mother program
140 m Senior Sec. education a Universities
120200
a1100 90.080.0
C! 80 70.0
EC0asc SnirSe.Uivriie8thr20820
60 50.0
_ 40 0.40.0
30.020 20.0
10.0- 0.0
ECD Basic Senior sec. Universities other 2008 2009Education Education program
Source: World Bank staff estimates based on state budget data and Regional Financial information system data (Sistem Informasi KeuanganDaerah, SIKD), Ministry of Finance
Compared to other countries, the share of the education budget spent on secondary education islow despite the increase in 2009. Given the Gol's goal of expanding enrollment at these levels, financing isinsufficient. The more economically advanced countries in the region allocate a smaller share of their overalleducation budget to primary education, making secondary and higher education a priority. As Indonesiaadvances, it will have to increase the availability of its higher-skill labor force, which will require improving accessto secondary and higher education and allocating more resources to these programs.
On higher education, Indonesia's share of spending comes closer to that of its neighbors.The increase inspending on higher education in 2009 brought Indonesia's level of public spending on higher education as apercentage of the total education budget to equal that of South Korea. As a percentage of GDP, it is still very low.If we take into account public and private funding, Indonesia spends slightly above 1 percent of GDP on tertiaryeducation. This is far below what most developed countries spend, and even countries in the region such asThailand and Malaysia outspend Indonesia. Moreover, only about 25 percent of Indonesia's spending on tertiaryeducation is financed by public sources, while in Malaysia the funding is 100 percent public, in Thailand it's about70 percent public, and in OECD countries it is close to 80 percent public.
B
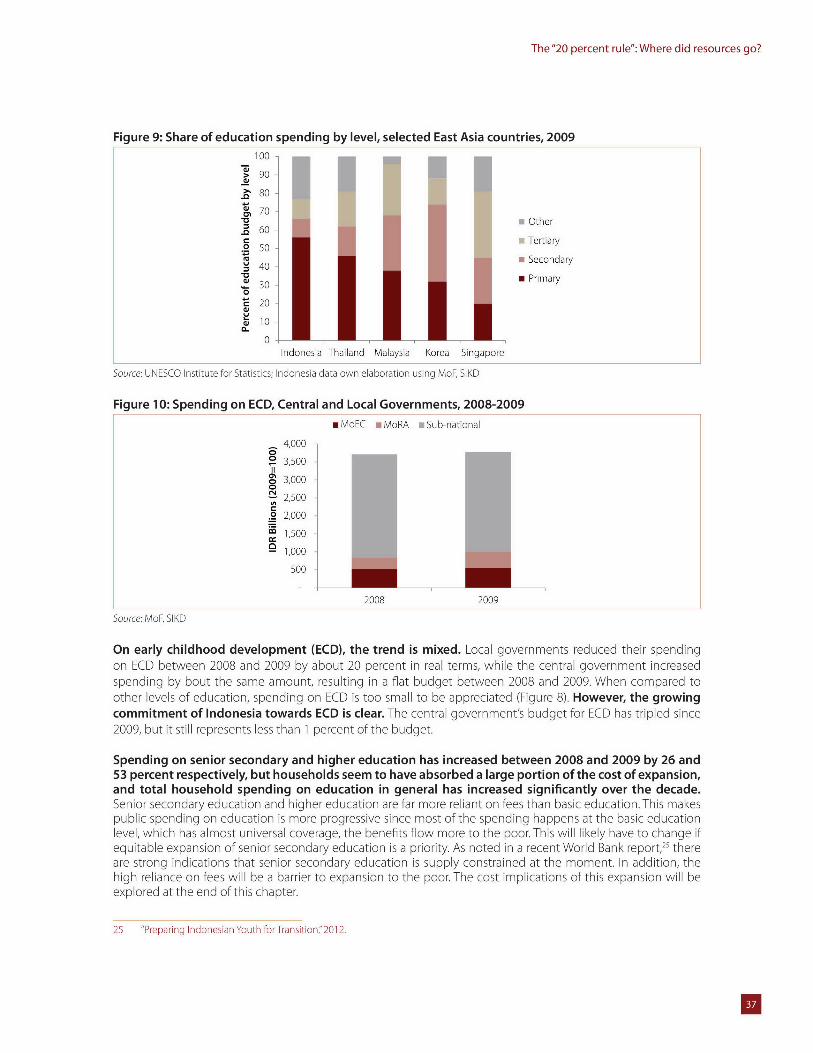
The"20 percent rule": Where did resources go?
Figure 9: Share of education spending by level, selected East Asia countries, 2009100
> 90 -
> 80 -
70 -Other
60r oTertiary2 50
4 Secondary
40 ,
30 m Primary
0
a,10
0
Indonesia Thailand Malaysia Korea Singapore
Source: UNESCO Institute for Statistics; ndonesia data own elaboration using MoF, SIKD
Figure 10: Spending on ECD, Central and Local Governments, 2008-2009mMoEC mMoRA wSub-national
4,000o
3,500
3,000
2,500
.0 2,000
1,500
- 1,000
500
2008 2009
Source: MoF, SIKD
On early childhood development (ECD), the trend is mixed. Local governments reduced their spendingon ECD between 2008 and 2009 by about 20 percent in real terms, while the central government increasedspending by bout the same amount, resulting in a flat budget between 2008 and 2009. When compared toother levels of education, spending on ECD is too small to be appreciated (Figure 8). However, the growingcommitment of Indonesia towards ECD is clear. The central government's budget for ECD has tripled since2009, but it still represents less than 1 percent of the budget.
Spending on senior secondary and higher education has increased between 2008 and 2009 by 26 and53 percent respectively, but households seem to have absorbed a large portion of the cost of expansion,and total household spending on education in general has increased significantly over the decade.Senior secondary education and higher education are far more reliant on fees than basic education. This makespublic spending on education is more progressive since most of the spending happens at the basic educationlevel, which has almost universal coverage, the benefits flow more to the poor. This will likely have to change ifequitable expansion of senior secondary education is a priority. As noted in a recent World Bank report," thereare strong indications that senior secondary education is supply constrained at the moment. In addition, thehigh reliance on fees will be a barrier to expansion to the poor. The cost implications of this expansion will beexplored at the end of this chapter.
25 "Preparing ndonesian Youth for Transition," 2012.
U
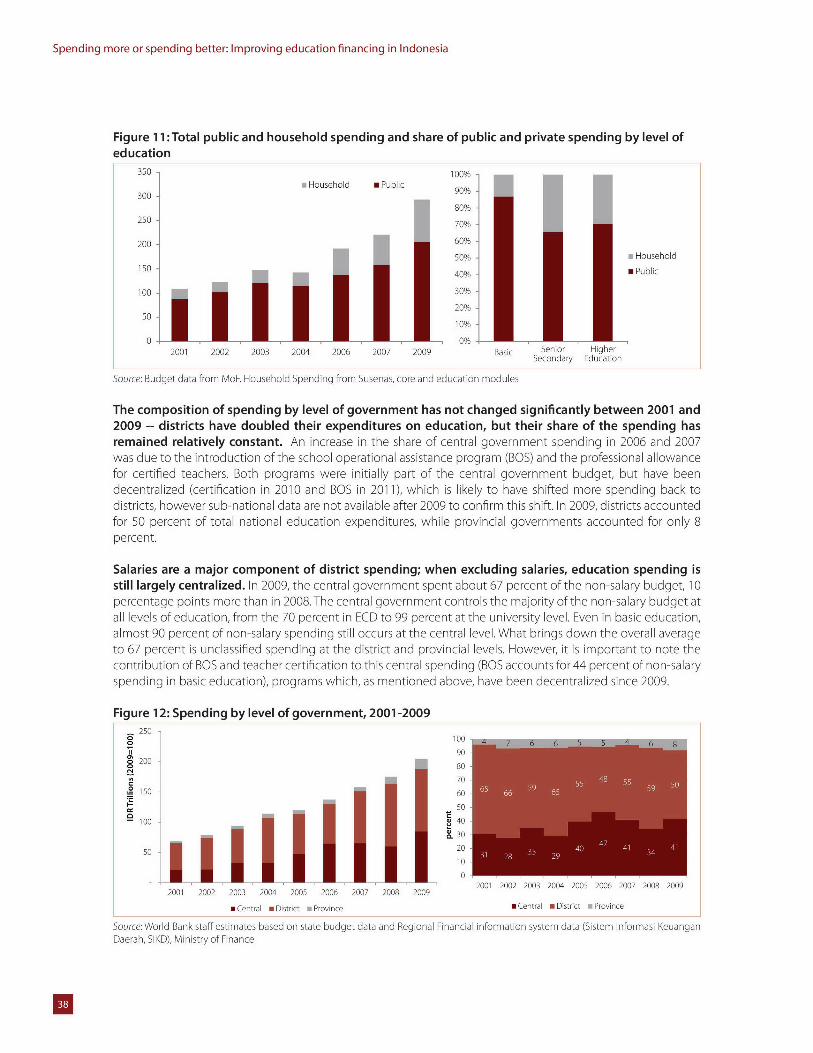
Spending more or spending better: Improving education financing in Indonesia
Figure 11:Total public and household spending and share of public and private spending by level ofeducation
350 - 100% -a Household a Public 90%
300-80%
250 70%
200 60%
50% . Household150 40% - Public
100 30%-
20%-50
100%
0 0%2001 2002 2003 2004 2006 2007 2009 Basic Senior Higher
Secondary Education
Source: Budget data from MoF, Household Spending from Susenas, core and education modules
The composition of spending by level of government has not changed significantly between 2001 and2009 -- districts have doubled their expenditures on education, but their share of the spending hasremained relatively constant. An increase in the share of central government spending in 2006 and 2007was due to the introduction of the school operational assistance program (BOS) and the professional allowancefor certified teachers. Both programs were initially part of the central government budget, but have beendecentralized (certification in 2010 and BOS in 2011), which is likely to have shifted more spending back todistricts, however sub-national data are not available after 2009 to confirm this shift. In 2009, districts accountedfor 50 percent of total national education expenditures, while provincial governments accounted for only 8percent.
Salaries are a major component of district spending; when excluding salaries, education spending isstill largely centralized. In 2009, the central government spent about 67 percent of the non-salary budget, 10percentage points more than in 2008.The central government controls the majority of the non-salary budget atall levels of education, from the 70 percent in ECD to 99 percent at the university level. Even in basic education,almost 90 percent of non-salary spending still occurs at the central level. What brings down the overall averageto 67 percent is unclassified spending at the district and provincial levels. However, it is important to note thecontribution of BOS and teacher certification to this central spending (BOS accounts for 44 percent of non-salaryspending in basic education), programs which, as mentioned above, have been decentralized since 2009.
Figure 12: Spending by level of government, 2001-2009250
90200 80
7070 48 55 5
150 60 65 66 59 65 3 9 5
50
100 40
~.3050 20 1 40 4/ 4 34 41
02001 2002 2003 2004 2005 2006 2007 2008 2009
2001 2002 2003 2004 2005 2006 2007 2008 2009
N Central w District Province a Central oDistrict nProvince
Source: World Bank staff estimates based on state budget data and Regional Financial information system data (Sistem Informasi KeuanganDaerah, SIKD), Ministry of Finance
U
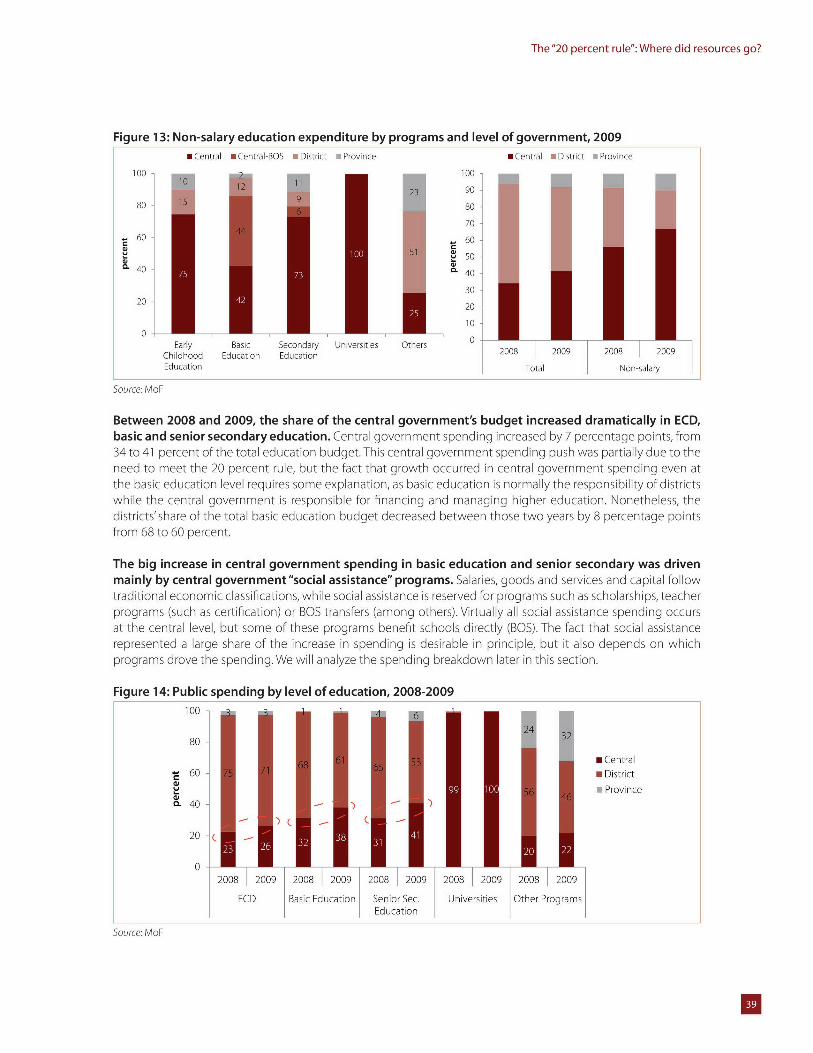
The"20 percent rule": Where did resources go?
Figure 13: Non-salary education expenditure by programs and level of government, 2009m Central m Central-BOS n District m Province * Central m District Province
100 100
90
80 80
70
60 60
50r 40 40
3020 20
10-
Early Basic Secondary Universities Otners 0Childhood Education Education 2008 2009 2008 2009
Education Total Non-salary
Source: MoF
Between 2008 and 2009, the share of the central government's budget increased dramatically in ECD,basic and senior secondary education. Central government spending increased by 7 percentage points, from34 to 41 percent of the total education budget. This central government spending push was partially due to theneed to meet the 20 percent rule, but the fact that growth occurred in central government spending even atthe basic education level requires some explanation, as basic education is normally the responsibility of districtswhile the central government is responsible for financing and managing higher education. Nonetheless, thedistricts'share of the total basic education budget decreased between those two years by 8 percentage pointsfrom 68 to 60 percent.
The big increase in central government spending in basic education and senior secondary was drivenmainly by central government"social assistance" programs. Salaries, goods and services and capital followtraditional economic classifications, while social assistance is reserved for programs such as scholarships, teacherprograms (such as certification) or BOS transfers (among others). Virtually all social assistance spending occursat the central level, but some of these programs benefit schools directly (BOS). The fact that social assistancerepresented a large share of the increase in spending is desirable in principle, but it also depends on whichprograms drove the spending. We will analyze the spending breakdown later in this section.
Figure 14: Public spending by level of education, 2008-2009100 -
80 -
m Central60 m District
i Province0.40 - -
20 C
02008 2009 2008 2009 2008 2009 2008 2009 2008 2009
ECD Basic Ed ucation Senior Sec. Universities Other Program SEducation
Source: MoF
U
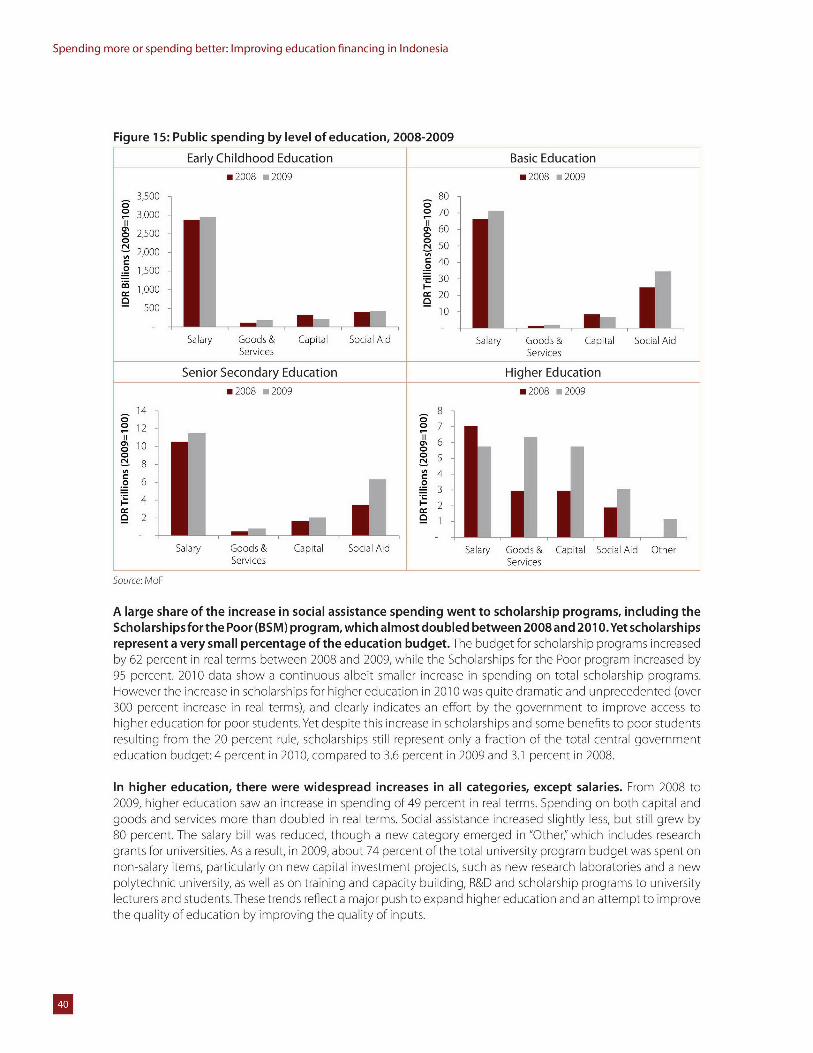
Spending more or spending better: Improving education financing in Indonesia
Figure 15: Public spending by level of education, 2008-2009
Early Childhood Education Basic Educationm2008 m2009 m 2008 m2009
3,500 - 80o o- 3,000 70II II
2,500 60
2,000 5040
.= 1,500 . 3-- 30
1,000 -2~ _ 20
500 -10 -
Salary Goods & Capital Social Aid Salary Goods & Capital Social AidServices Services
Senior Secondary Education Higher Educationm2008 n2009 m2008 z2009
14 8o oa 12 7
10 6
Sa ary Goods & Capital Social Aid Salary Goods & Capital Social Aid OtherServices Services
Source: MoF
A large share of the increase in social assistance spending went to scholarship programs, including theScholarships for the Poor (BSM) program, which almost doubled between 2008 and 201 0.Yet scholarshipsrepresent a very small percentage of the education budget. The budget for scholarship programs increasedby 62 percent in real terms between 2008 and 2009, while the Scholarships for the Poor program increased by95 percent. 2010 data show a continuous albeit smaller increase in spending on total scholarship programs.However the increase in scholarships for higher education in 2010 was quite dramatic and unprecedented (over300 percent increase in real terms), and clearly indicates an effort by the government to improve access tohigher education for poor students. Yet despite this increase in scholarships and some benefits to poor studentsresulting from the 20 percent rule, scholarships still represent only a fraction of the total central governmenteducation budget: 4 percent in 2010, compared to 3.6 percent in 2009 and 3.1 percent in 2008.
In higher education, there were widespread increases in all categories, except salaries. From 2008 to2009, higher education saw an increase in spending of 49 percent in real terms. Spending on both capital andgoods and services more than doubled in real terms. Social assistance increased slightly less, but still grew by80 percent. The salary bill was reduced, though a new category emerged in "Other," which includes researchgrants for universities. As a result, in 2009, about 74 percent of the total university program budget was spent onnon-salary items, particularly on new capital investment projects, such as new research laboratories and a newpolytechnic university, as well as on training and capacity building, R&D and scholarship programs to universitylecturers and students.These trends reflect a major push to expand higher education and an attempt to improvethe quality of education by improving the quality of inputs.
5
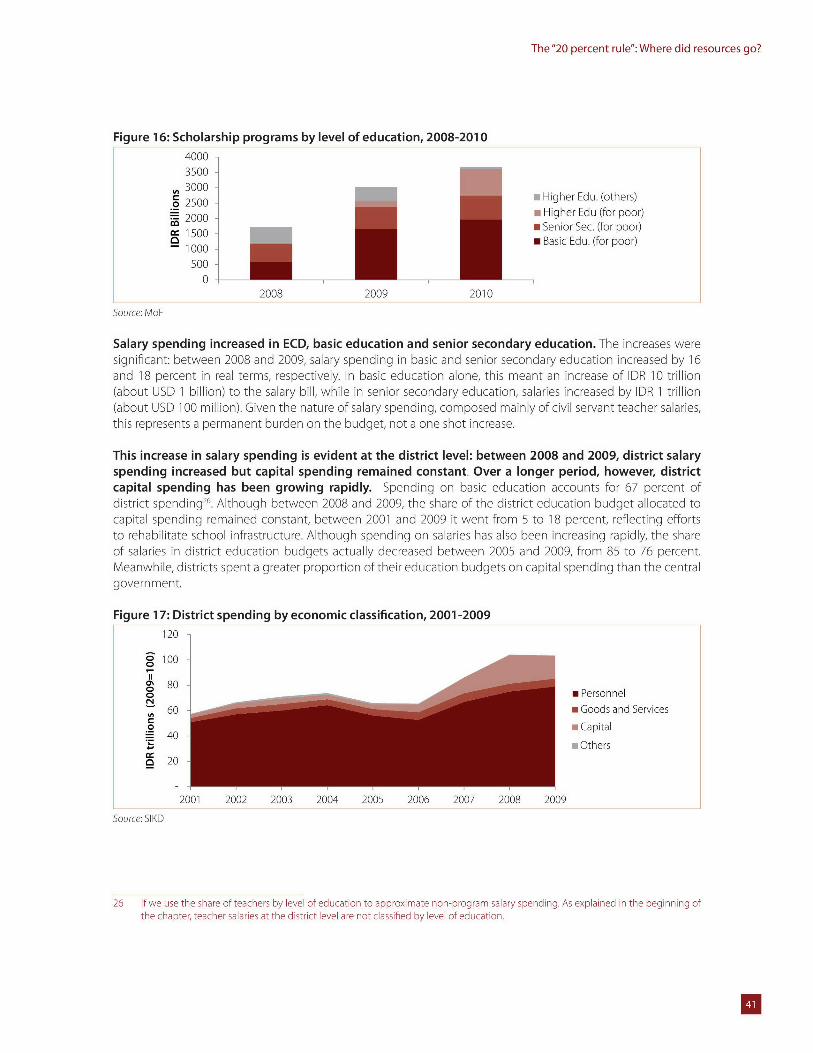
The"20 percent rule": Where did resources go?
Figure 16: Scholarship programs by level of education, 2008-2010400035003000-
a 2500 a Higher Edu. (others)
2000 Higher Edu (for poor)1 Senior Sec. (for poor)S1500m Basic Edu. (for poor)
1000500
02008 2009 2010
Source: MoF
Salary spending increased in ECD, basic education and senior secondary education. The increases weresignificant: between 2008 and 2009, salary spending in basic and senior secondary education increased by 16and 18 percent in real terms, respectively. In basic education alone, this meant an increase of DR 10 trillion(about USD 1 billion) to the salary bill, while in senior secondary education, salaries increased by IDR I trillion(about USD 100 million). Given the nature of salary spending, composed mainly of civil servant teacher salaries,this represents a permanent burden on the budget, not a one shot increase.
This increase in salary spending is evident at the district level: between 2008 and 2009, district salaryspending increased but capital spending remained constant. Over a longer period, however, districtcapital spending has been growing rapidly. Spending on basic education accounts for 67 percent ofdistrict spending26 .Although between 2008 and 2009, the share of the district education budget allocated tocapital spending remained constant, between 2001 and 2009 it went from 5 to 18 percent, reflecting effortsto rehabilitate school infrastructure. Although spending on salaries has also been increasing rapidly, the shareof salaries in district education budgets actually decreased between 2005 and 2009, from 85 to 76 percent.Meanwhile, districts spent a greater proportion of their education budgets on capital spending than the centralgovernment.
Figure 17: District spending by economic classification, 2001-2009120
0 100
C 80o m Personnel' 60 m Goods and Services
o a Capital40
n Others20
2001 2002 2003 2004 2005 2006 2007 2008 2009
Source: SIKD
26 If we use the share of teachers by evel of education to approximate non-program salary spending. As explained in the beginning ofthe chapter, teacher salaries at the district level are not classified by level of education.
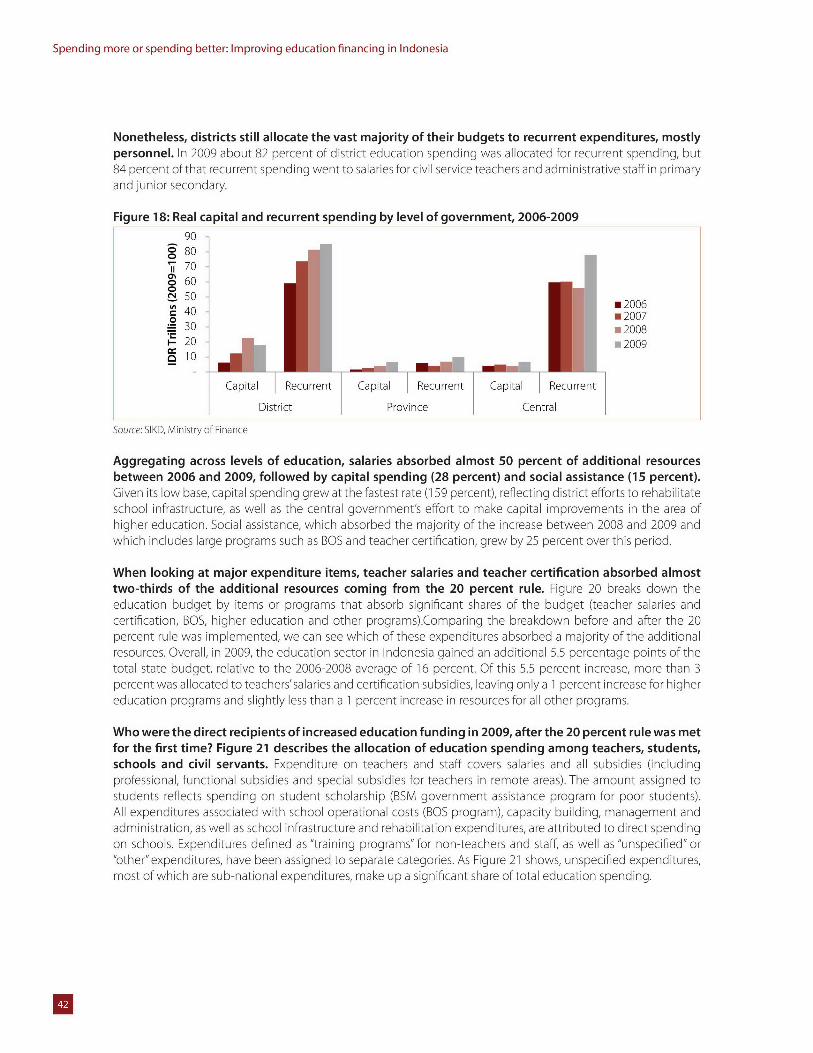
Spending more or spending better: Improving education financing in Indonesia
Nonetheless, districts still allocate the vast majority of their budgets to recurrent expenditures, mostlypersonnel. In 2009 about 82 percent of district education spending was allocated for recurrent spending, but84 percent of that recurrent spending went to salaries for civil service teachers and administrative staff in primaryand junior secondary.
Figure 18: Real capital and recurrent spending by level of government, 2006-2009908070
600CL 50 m2006
40 - 200730 m2008
-- 20 i 200910
Capital Recurrent Capital Recurrent Capital Recurrent
District Province Central
Source: SIKD, Ministry of Finance
Aggregating across levels of education, salaries absorbed almost 50 percent of additional resourcesbetween 2006 and 2009, followed by capital spending (28 percent) and social assistance (15 percent).Given its low base, capital spending grew at the fastest rate (159 percent), reflecting district efforts to rehabilitateschool infrastructure, as well as the central government's effort to make capital improvements in the area ofhigher education. Social assistance, which absorbed the majority of the increase between 2008 and 2009 andwhich includes large programs such as BOS and teacher certification, grew by 25 percent over this period.
When looking at major expenditure items, teacher salaries and teacher certification absorbed almosttwo-thirds of the additional resources coming from the 20 percent rule. Figure 20 breaks down theeducation budget by items or programs that absorb significant shares of the budget (teacher salaries andcertification, BOS, higher education and other programs).Comparing the breakdown before and after the 20percent rule was implemented, we can see which of these expenditures absorbed a majority of the additionalresources. Overall, in 2009, the education sector in Indonesia gained an additional 5.5 percentage points of thetotal state budget, relative to the 2006-2008 average of 16 percent. Of this 5.5 percent increase, more than 3percent was allocated to teachers'salaries and certification subsidies, leaving only a 1 percent increase for highereducation programs and slightly less than a 1 percent increase in resources for all other programs.
Who were the direct recipients of increased education funding in 2009, after the 20 percent rule was metfor the first time? Figure 21 describes the allocation of education spending among teachers, students,schools and civil servants. Expenditure on teachers and staff covers salaries and all subsidies (includingprofessional, functional subsidies and special subsidies for teachers in remote areas). The amount assigned tostudents reflects spending on student scholarship (BSM government assistance program for poor students).All expenditures associated with school operational costs (BOS program), capacity building, management andadministration, as well as school infrastructure and rehabilitation expenditures, are attributed to direct spendingon schools. Expenditures defined as "training programs" for non-teachers and staff, as well as "unspecified" or"other" expenditures, have been assigned to separate categories. As Figure 21 shows, unspecified expenditures,most of which are sub-national expenditures, make up a significant share of total education spending.
U
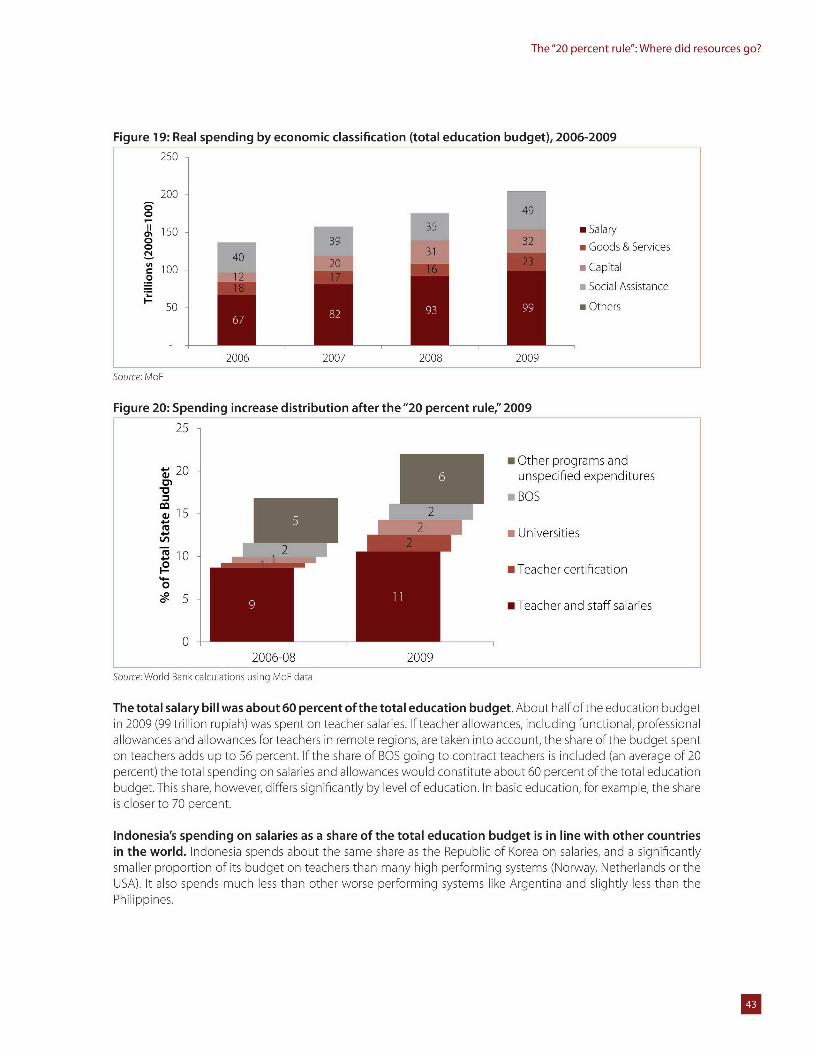
The"20 percent rule": Where did resources go?
Figure 19: Real spending by economic classification (total education budget), 2006-2009250
2000
150 35 m SalarySm Goods & Services
100 a Capital10Social Assistance
50 m Others
2006 2007 2008 2009
Source: MoF
Figure 20: Spending increase distribution after the "20 percent rule," 2009
25
m Other programs andW20 - unspecified expenditures
a BOSe 15
a Universities
S10a Teacher certification
# -0
5 Teacher and staff salaries
0 d2006-08 2009
Source: World Bank calculations using MoF data
The total salary bill was about 60 percent of the total education budget. About half of the education budgetin 2009 (99 trillion rupiah) was spent on teacher salaries. If teacher allowances, including functional, professionalallowances and allowances for teachers in remote regions, are taken into account, the share of the budget spenton teachers adds up to 56 percent. If the share of BOS going to contract teachers is included (an average of 20percent) the total spending on salaries and allowances would constitute about 60 percent of the total educationbudget. This share, however, differs significantly by level of education. In basic education, for example, the shareis closer to 70 percent.
Indonesia's spending on salaries as a share of the total education budget is in line with other countriesin the world. Indonesia spends about the same share as the Republic of Korea on salaries, and a significantlysmaller proportion of its budget on teachers than many high performing systems (Norway, Netherlands or theUSA). It also spends much less than other worse performing systems like Argentina and slightly less than thePhilippines.
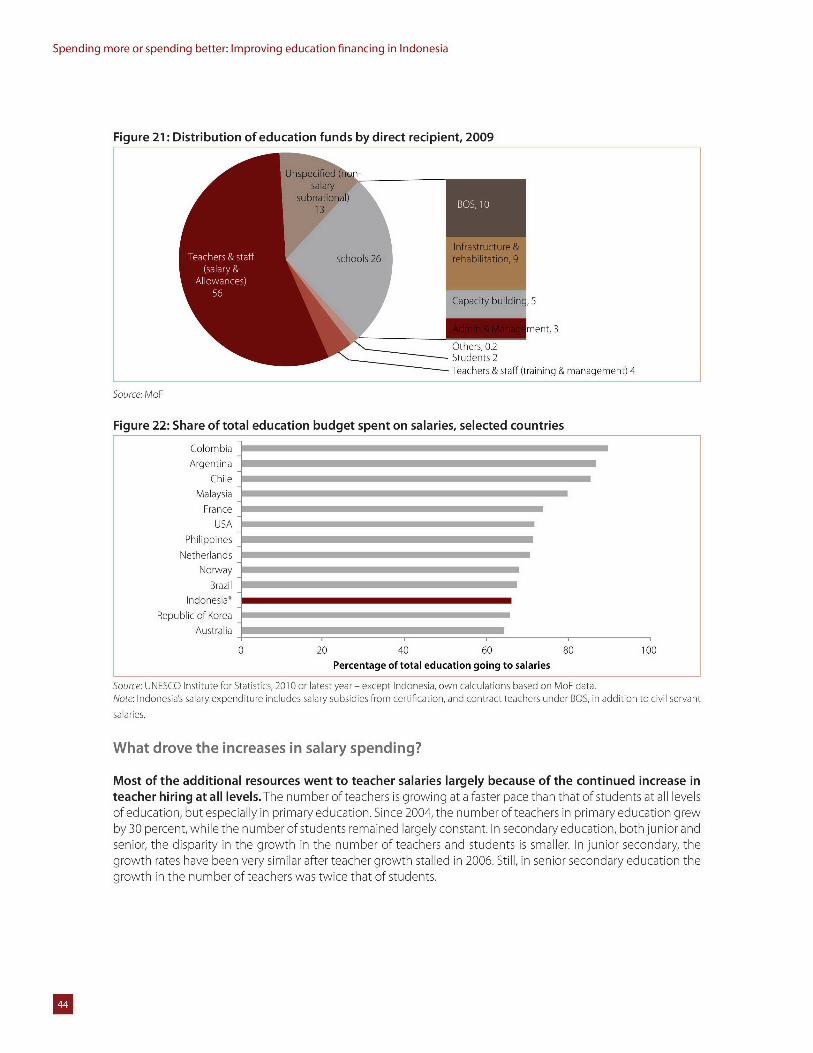
Spending more or spending better: Improving education financing in Indonesia
Figure 21: Distribution of education funds by direct recipient, 2009
Teachers & staff ( m(salary &
Allowances)56
ment, 3
LOthers, 0.2Students 2Teachers & staff (training & management) 4
Source: MoF
Figure 22: Share of total education budget spent on salaries, selected countries
Colombia
Argentina
Chile 1Malaysia
France
USA
Philippines
NetherlandsNorway
Brazil
Indonesia*
Republic of KoreaAustralia -
0 20 40 60 80 100
Percentage of total education going to salaries
Source: UNESCO I nstitute for Statistics, 2010 or latest year - except Indonesia, own calculations based on MoF data.Note: Indonesias salary expenditure includes salary subsidies from certification, and contract teachers under BOS, in addition to civil servant
salaries.
What drove the increases in salary spending?
Most of the additional resources went to teacher salaries largely because of the continued increase inteacher hiring at all levels.The number of teachers is growing at a faster pace than that of students at all levelsof education, but especially in primary education. Since 2004, the number of teachers in primary education grewby 30 percent, while the number of students remained largely constant. In secondary education, both junior andsenior, the disparity in the growth in the number of teachers and students is smaller. In junior secondary, thegrowth rates have been very similar after teacher growth stalled in 2006. Still, in senior secondary education thegrowth in the number of teachers was twice that of students.
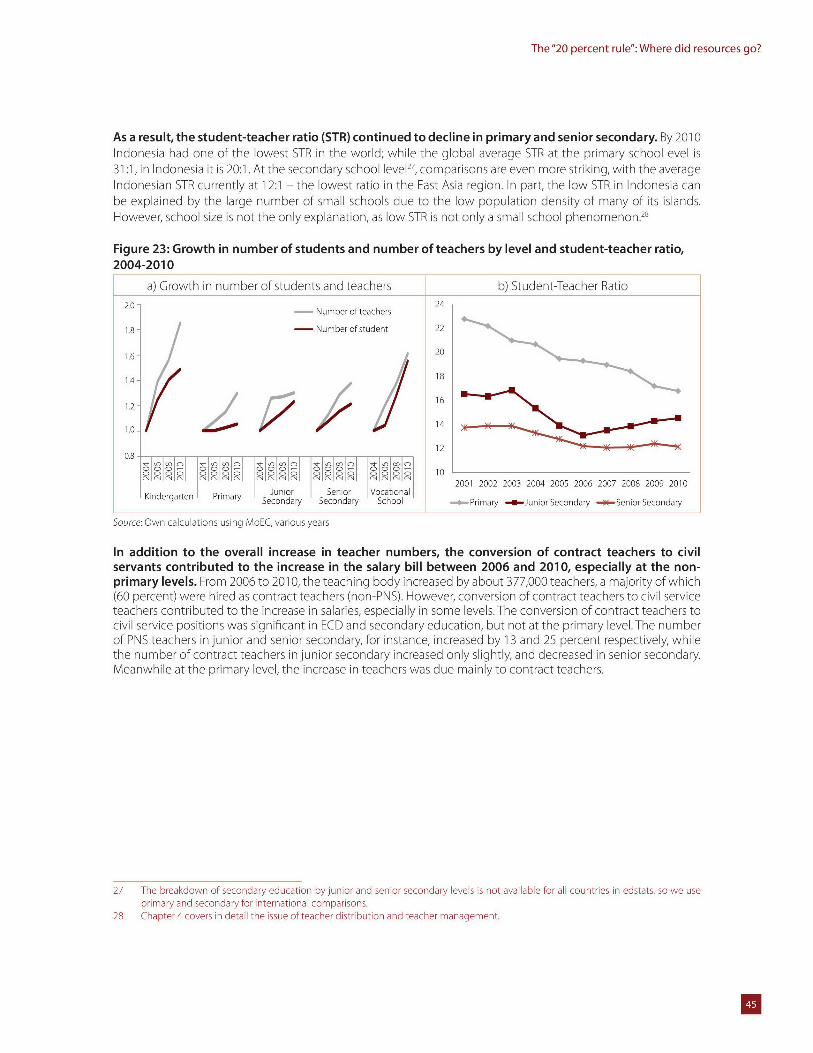
The"20 percent rule": Where did resources go?
As a result, the student-teacher ratio (STR) continued to decline in primary and senior secondary. By 2010Indonesia had one of the lowest STR in the world; while the global average STIR at the primary school evel is31:1, in Indonesia it is 20:1. At the secondary school level", comparisons are even more striking, with the averageIndonesian STR currently at 12:1 - the lowest ratio in the East Asia region. In part, the low STR in Indonesia canbe explained by the large number of small schools due to the low population density of many of its islands.However, school size is not the only explanation, as low STIR is not only a small school phenomenon."
Figure 23: Growth in number of students and number of teachers by level and student-teacher ratio,2004-2010
a) Growth in number of students and teachers b) Student-Teacher Ratio20 - Number of teachers 24
1 8 - Number of student 22
1 6 20
14 -18
1.2-4 1
12141 .0 -1 2120.8--
- - - - - 1000 000 C C D0 000 000 000D1
2001 2002 2003 2004 2005 2006 2007 2008 2009 2010Junior Senior VocationalKindergarten Secondary Secondary School -+-Primary --- Junior Secondary -)-Senior Secondary
Source: Own calculations using MoEC, various years
In addition to the overall increase in teacher numbers, the conversion of contract teachers to civilservants contributed to the increase in the salary bill between 2006 and 2010, especially at the non-primary levels. From 2006 to 2010, the teaching body increased by about 377,000 teachers, a majority of which(60 percent) were hired as contract teachers (non-PNS). However, conversion of contract teachers to civil serviceteachers contributed to the increase in salaries, especially in some levels. The conversion of contract teachers tocivil service positions was significant in ECD and secondary education, but not at the primary level.The numberof PNS teachers in junior and senior secondary, for instance, increased by 13 and 25 percent respectively, whilethe number of contract teachers in junior secondary increased only slightly, and decreased in senior secondary.Meanwhile at the primary level, the increase in teachers was due mainly to contract teachers.
27 The breakdown of secondary education by junior and senior secondary levels is not available for all countries in edstats, so we useprimary and secondary for international comparisons.
28 Chapter 4 covers in detail the issue of teacher distribution and teacher management.
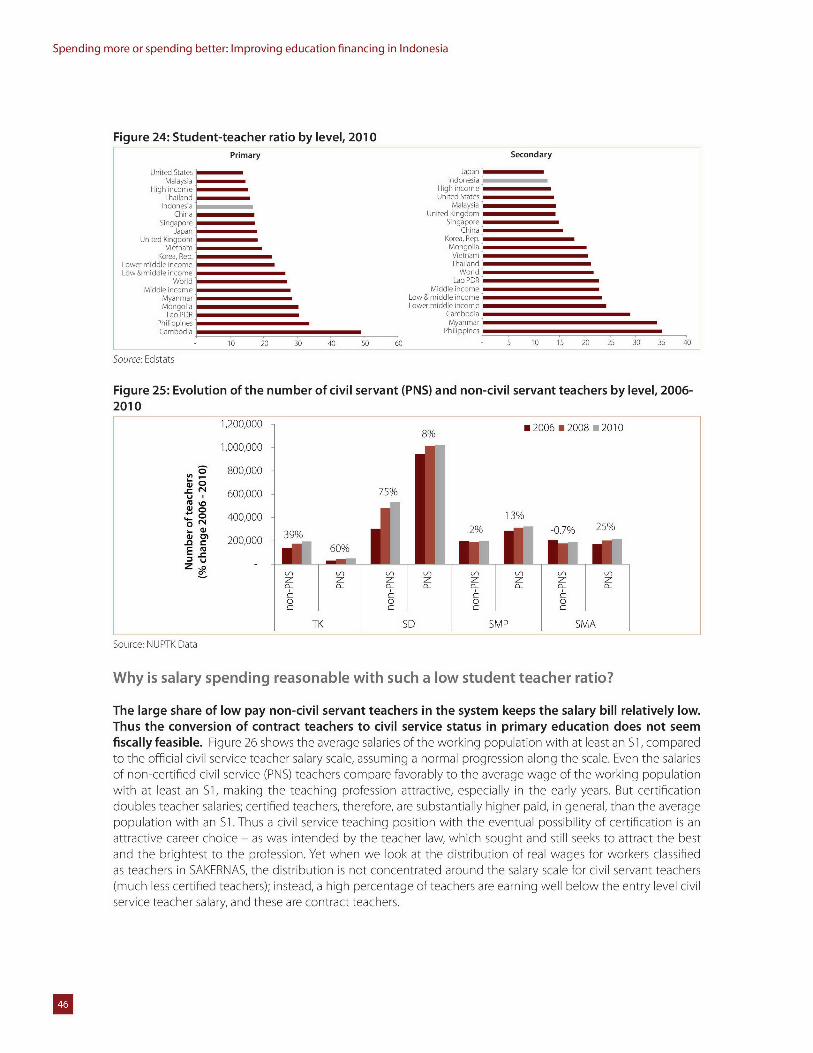
Spending more or spending better: Improving education financing in Indonesia
Figure 24: Student-teacher ratio by level, 2010Primary Secondary
United States JapanMalaysia ndonesia
Highincome High n o-eThailand ed States
Indonesia Malays aChina ,ied Kingoom
Si ngapore SingaporeJapan China
United Kingdom Korea Rep.Vietnam Mongola
Korea, Rep. VietnamLower middle Income haiandLow & middle income Word
WorldMiddle ncome Midin come
Myanmar ow & middle incomeMongolia Lower middle icome
Lao PDR CambodiaPhilippines Myan arCambodia Pnilppies
10 20 30 40 50 60 5 10 iS 20 25 30 35 40
SourceU EdSttts
Figure 25: Evolution of the number of civil servant (PNS) and non-civil servant teachers by level, 2006-2010
1,200,000 8%m2006 m2008 is2010
1,000,000
.A 800,000
U 600,000 75%
0 400,000 13%0V 2% -0.7% 25%
S200,00000060/o
Malysi
Ln In L u-)Mongo ona
0-t at af0at f at aft at
0 0 0 0C C C C
TK SD SMP SMA
Source: NUPTK Data
Why is salary spending reasonable with such a low student teacher ratio?
The large share of low pay non-civil servant teachers in the system keeps the salary bill relatively low.Thus the conversion of contract teachers to civil service status in primary education does not seemfiscally feasible. Figure 26 shows the average salaries of the working population with at least an Si1, comparedto the official civil service teacher salary scale, assuming a normal progression along the scale. Even the salariesof non-certified civil service (PNS) teachers compare favorably to the average wage of the working populationwith at least an S1, making the teaching profession attractive, especially in the early years. But certificationdoubles teacher salaries; certified teachers, therefore, are substantially higher paid, in general, than the averagepopulation with an S1. Thus a civil service teaching position with the eventual possibility of certification is anattractive career choice - as was intended by the teacher law, which sought and still seeks to attract the bestand the brightest to the profession. Yet when we look at the distribution of real wages for workers classifiedas teachers in SAKERNAS, the distribution is not concentrated around the salary scale for civil servant teachers(much less certified teachers); instead, a high percentage of teachers are earning well below the entry level civilservice teacher salary, and these are contract teachers.
Wol
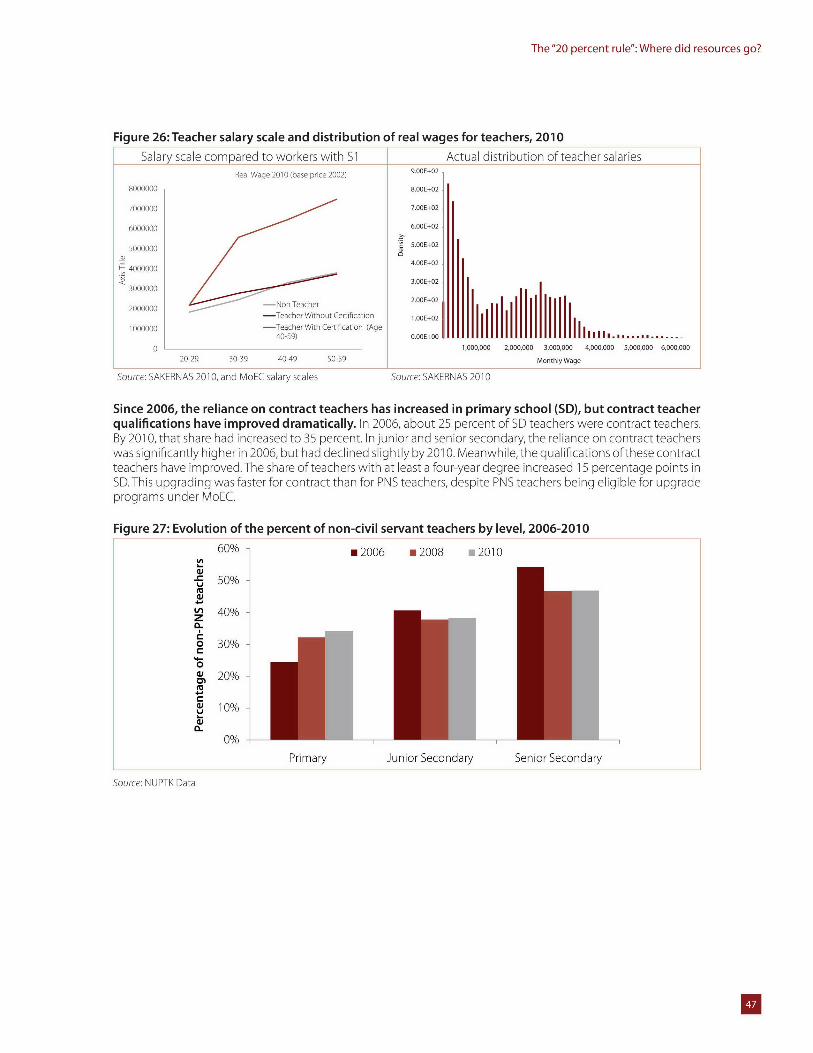
The"20 percent rule": Where did resources go?
Figure 26: Teacher salary scale and distribution of real wages for teachers, 2010Salary scale compared to workers with Si Actual distribution of teacher salaries
Real Wage 2010 (base price 2002) 9.OOE+02
8000000 8.O0E+02
7000000 7.00E+02
6000000 6.O0E+02
5000000 8 5.OOE+02
4.OOE+024000000
3.00E+02
2000000 Non Teacher 2.00E+02
- Teacher Without Certiication 1.OOE+021000000 - Teacher With Certification (Age
40-59) 0.0E+00 ----- . * . . .
0 1,000,000 2,000,000 3,000,000 4,000,000 5,000,000 6,000,00020-29 30-39 40-49 50-59 Monthly Wage
Source: SAKERNAS 2010, and MoEC sa ary scales Source: SAKERNAS 2010
Since 2006, the reliance on contract teachers has increased in primary school (SD), but contract teacherqualifications have improved dramatically. In 2006, about 25 percent of SD teachers were contract teachers.By 2010, that share had increased to 35 percent. In junior and senior secondary, the reliance on contract teacherswas significantly higher in 2006, but had declined slightly by 2010. Meanwhile,the qualifications of these contractteachers have improved.The share of teachers with at least a four-year degree increased 15 percentage points inSD.This upgrading was faster for contract than for PNS teachers, despite PNS teachers being eligible for upgradeprograms under MoEC.
Figure 27: Evolution of the percent of non-civil servant teachers by level, 2006-2010
60% m2006 m2008 2010
50%
40%
o 30%
0S20%
S10%
0%Primary Junior Secondary Senior Secondary
Source: NUPTK Data
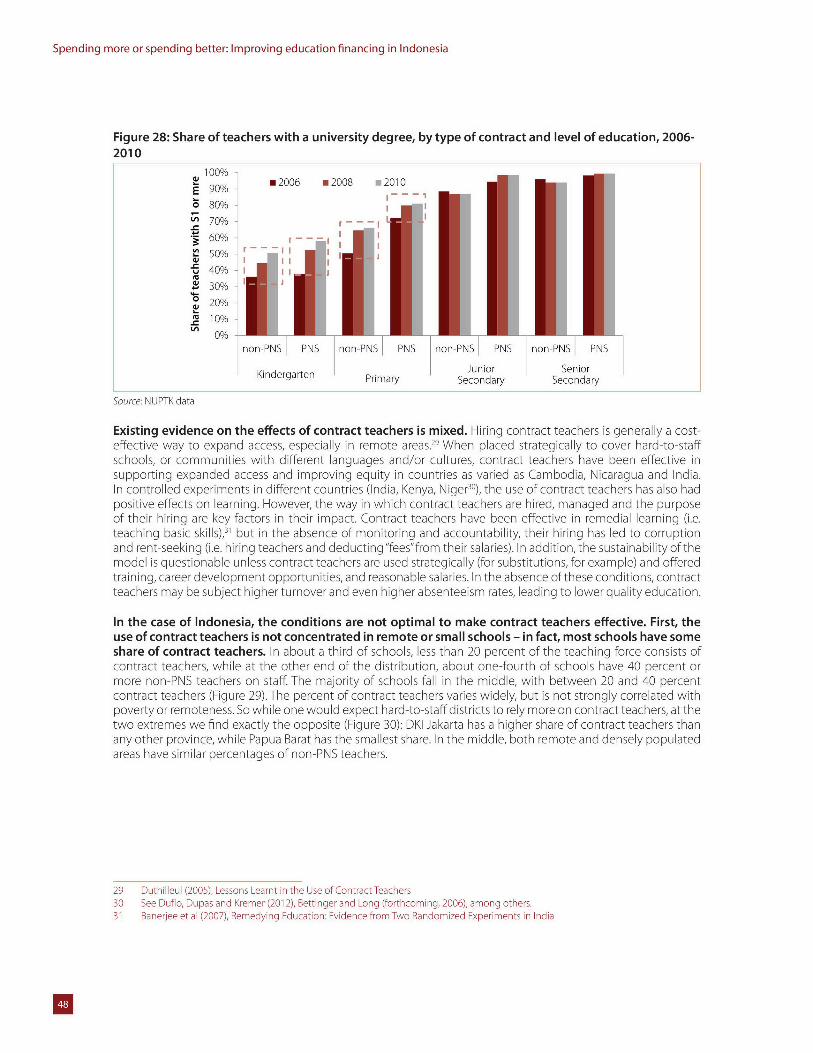
Spending more or spending better: Improving education financing in Indonesia
Figure 28: Share of teachers with a university degree, by type of contract and level of education, 2006-2010
100% -m2006 m2008 m 2010
E 90%80% -
v 70%
60% - r50% -
40%
~30%S20%
0%
non-PNS PNS non-PNS PNS non-PNS PNS non-PNS PNS
Junior SeniorKindergarten Primary Secondary Secondary
Source: NUPTK data
Existing evidence on the effects of contract teachers is mixed. Hiring contract teachers is generally a cost-effective way to expand access, especially in remote areas." When placed strategically to cover hard-to-staffschools, or communities with different languages and/or cultures, contract teachers have been effective insupporting expanded access and improving equity in countries as varied as Cambodia, Nicaragua and India.In controlled experiments in different countries (India, Kenya, Niger"), the use of contract teachers has also hadpositive effects on learning. However, the way in which contract teachers are hired, managed and the purposeof their hiring are key factors in their impact. Contract teachers have been effective in remedial learning (i.e.teaching basic skills)," but in the absence of monitoring and accountability, their hiring has led to corruptionand rent-seeking (i.e. hiring teachers and deducting "fees"from their salaries). In addition, the sustainability of themodel is questionable unless contract teachers are used strategically (for substitutions, for example) and offeredtraining, career development opportunities, and reasonable salaries. In the absence of these conditions, contractteachers may be subject higher turnover and even higher absenteeism rates, leading to lower quality education.
In the case of Indonesia, the conditions are not optimal to make contract teachers effective. First, theuse of contract teachers is not concentrated in remote or small schools - in fact, most schools have someshare of contract teachers. In about a third of schools, less than 20 percent of the teaching force consists ofcontract teachers, while at the other end of the distribution, about one-fourth of schools have 40 percent ormore non-PNS teachers on staff. The majority of schools fall in the middle, with between 20 and 40 percentcontract teachers (Figure 29). The percent of contract teachers varies widely, but is not strongly correlated withpoverty or remoteness. So while one would expect hard-to-staff districts to rely more on contract teachers, at thetwo extremes we find exactly the opposite (Figure 30): DKI Jakarta has a higher share of contract teachers thanany other province, while Papua Barat has the smallest share. In the middle, both remote and densely populatedareas have similar percentages of non-PNS teachers.
29 Duthilleul (2005), Lessons Learnt in the Use of Contract Teachers30 See Duflo, Dupas and Kremer (2012), Bettinger and Long (forthcoming, 2006), among others.31 Banerjee et al (2007), Remedying Education: Evidence from Two Randomized Experiments in India
U
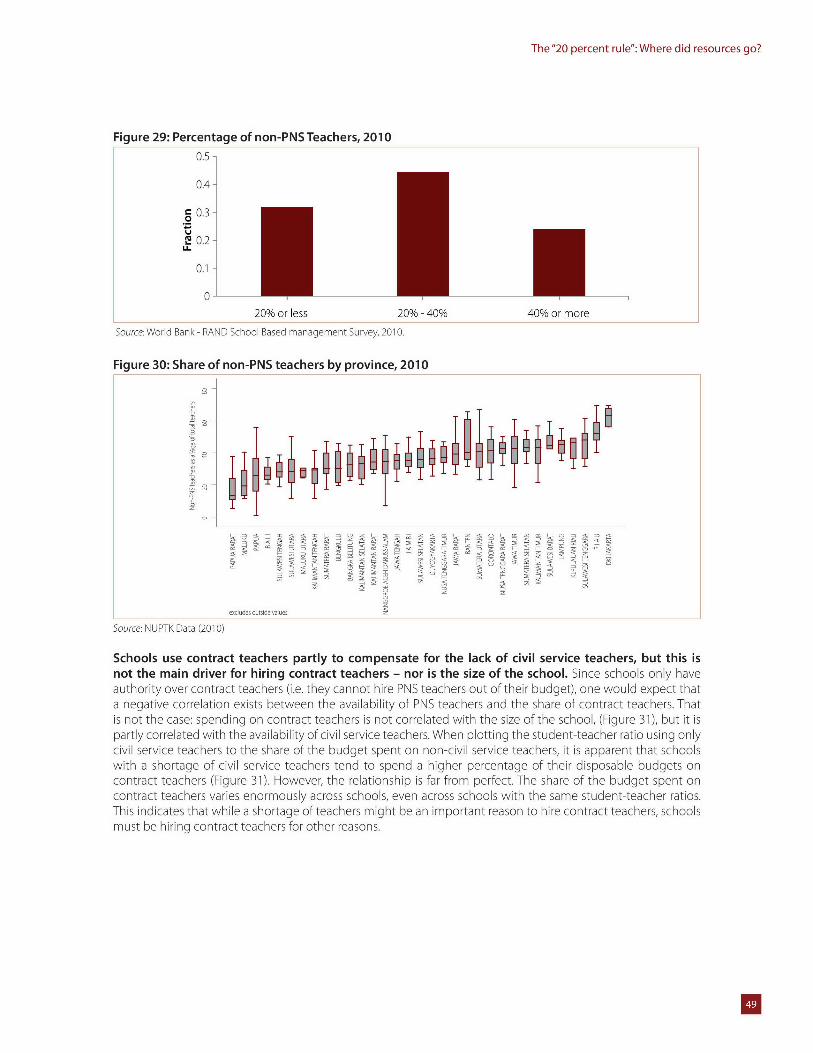
The"20 percent rule": Where did resources go?
Figure 29: Percentage of non-PNS Teachers, 20100.5-
0.4-
C 0.3-0 . -
U
0.1-
0-
20% or less 20% - 40% 40% or more
Source: World Bank - RAND School Based management Survey, 2010.
Figure 30: Share of non-PNS teachers by province, 2010
exdludes outs[de values
Source: NUPTK Data (2010)
Schools use contract teachers partly to compensate for the lack of civil service teachers, but this isnot the main driver for hiring contract teachers - nor is the size of the school. Since schools only haveauthority over contract teachers (i.e. they cannot hire PINS teachers out of their budget), one would expect thata negative correlation exists between the availability of PNS teachers and the share of contract teachers. Thatis not the case: spending on contract teachers is not correlated with the size of the school, (Figure 31), but it ispartly correlated with the availability of civil service teachers. When plotting the student-teacher ratio using onlycivil service teachers to the share of the budget spent on non-civil service teachers, it is apparent that schoolswith a shortage of civil service teachers tend to spend a higher percentage of their disposable budgets oncontract teachers (Figure 31). However, the relationship is far from perfect. The share of the budget spent oncontract teachers varies enormously across schools, even across schools with the same student-teacher ratios.This indicates that while a shortage of teachers might be an important reason to hire contract teachers, schoolsmust be hiring contract teachers for other reasons.
Ae0<e~~y ee<=~5
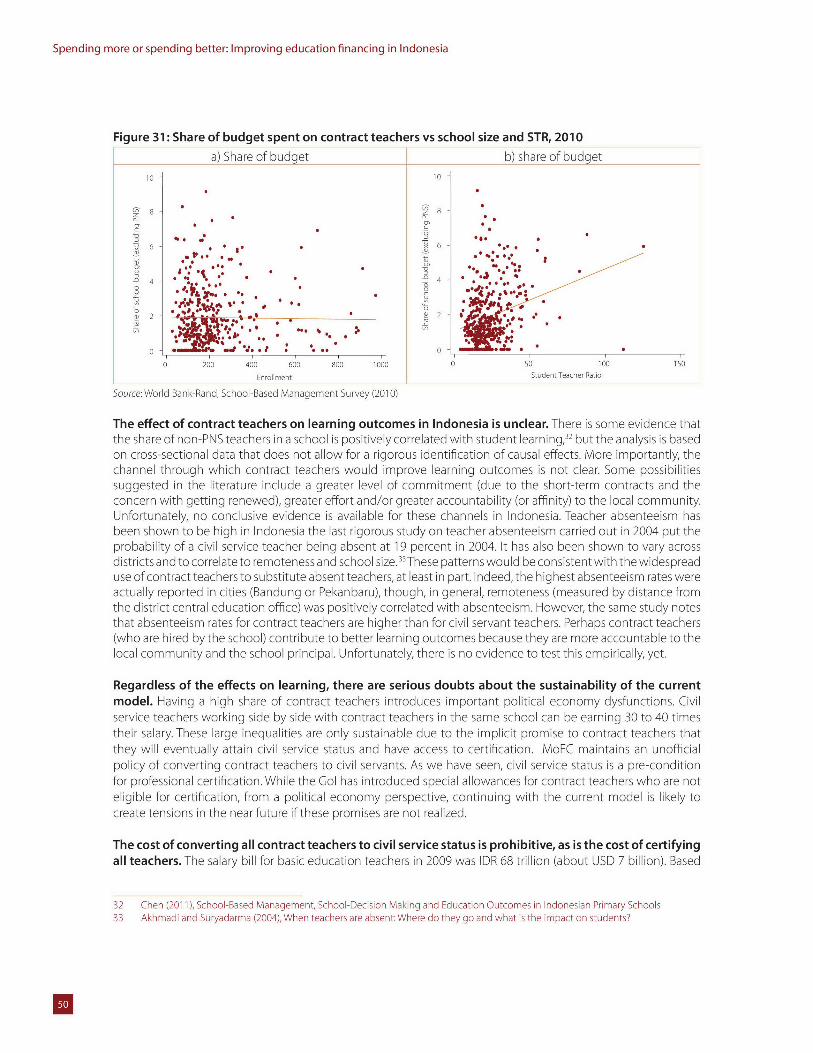
Spending more or spending better: Improving education financing in Indonesia
Figure 31: Share of budget spent on contract teachers vs school size and STR, 2010a) Share of budget b) share of budget
10 10
- 4 -
6 %
* *
8O ***
* ,* *.
. .* ..
0 . . . . 0 * .
0 200 400 600 800 1000 0 50 100 150
Enrollment Student Teacher Ratio
Source: World Bank-Rand, School-Based Management Survey (2010)
The effect of contract teachers on learning outcomes in Indonesia is unclear. There is some evidence thatthe share of non-PNS teachers in a school is positively correlated with student learning," but the analysis is basedon cross-sectional data that does not allow for a rigorous identification of causal effects. More importantly, thechannel through which contract teachers would improve learning outcomes is not clear. Some possibilitiessuggested in the literature include a greater level of commitment (due to the short-term contracts and theconcern with getting renewed), greater effort and/or greater accountability (or affinity) to the local community.Unfortunately, no conclusive evidence is available for these channels in Indonesia. Teacher absenteeism hasbeen shown to be high in Indonesia the last rigorous study on teacher absenteeism carried out in 2004 put theprobability of a civil service teacher being absent at 19 percent in 2004. It has also been shown to vary acrossdistricts and to correlate to remoteness and school size.l"These patterns would be consistent with the widespreaduse of contract teachers to substitute absent teachers, at least in part. Indeed, the highest absenteeism rates wereactually reported in cities (Bandung or Pekanbaru), though, in general, remoteness (measured by distance fromthe district central education office) was positively correlated with absenteeism. However, the same study notesthat absenteeism rates for contract teachers are higher than for civil servant teachers. Perhaps contract teachers(who are hired by the school) contribute to better learning outcomes because they are more accountable to thelocal community and the school principal. Unfortunately, there is no evidence to test this empirically, yet.
Regardless of the effects on learning, there are serious doubts about the sustainability of the currentmodel. Having a high share of contract teachers introduces important political economy dysfunctions. Civilservice teachers working side by side with contract teachers in the same school can be earning 30 to 40 timestheir salary. These large inequalities are only sustainable due to the implicit promise to contract teachers thatthey will eventually attain civil service status and have access to certification. MoEC maintains an unofficialpolicy of converting contract teachers to civil servants. As we have seen, civil service status is a pre-conditionfor professional certification. While the Gol has introduced special allowances for contract teachers who are noteligible for certification, from a political economy perspective, continuing with the current model is likely tocreate tensions in the near future if these promises are not realized.
The cost of converting all contract teachers to civil service status is prohibitive, as is the cost of certifyingall teachers. The salary bill for basic education teachers in 2009 was IDR 68 trillion (about USD 7 billion). Based
32 Chen (2011), School-Based Management, School-Decision Making and Education Outcomes in Indonesian Primary Schools33 Akhmadi and Suryadarma (2004), When teachers are absent: Where do they go and what is the impact on students?
U
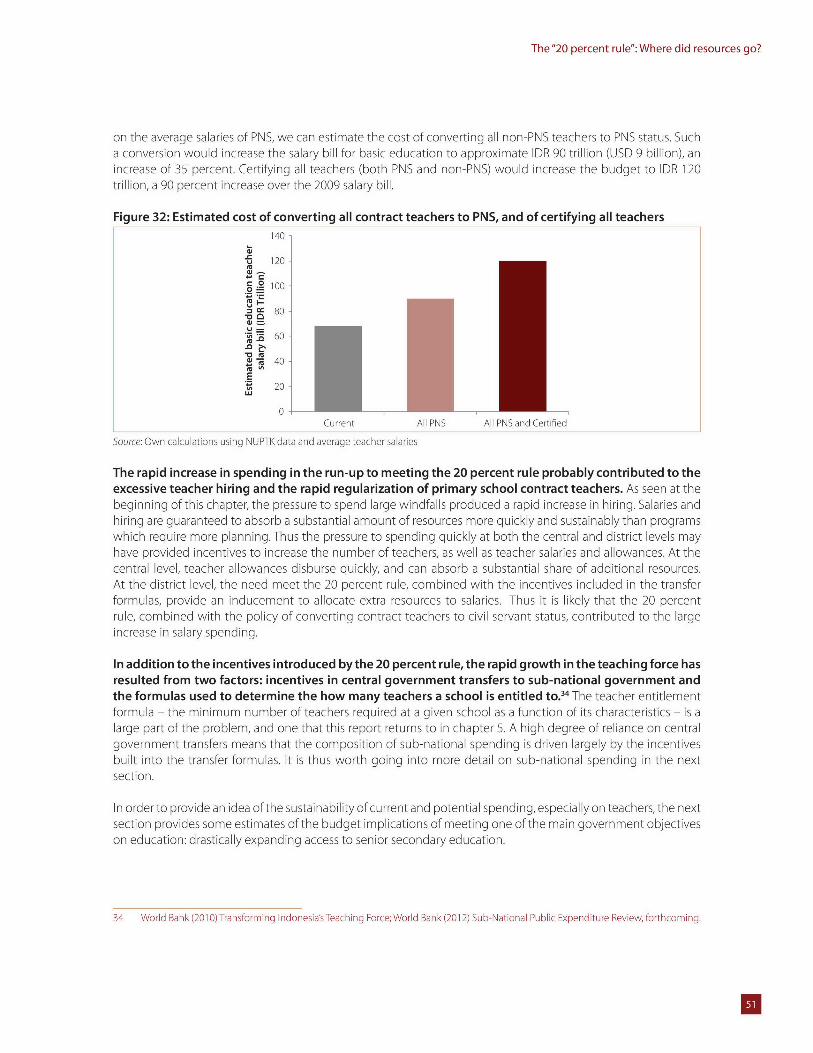
The"20 percent rule": Where did resources go?
on the average salaries of PNS, we can estimate the cost of converting all non-PNS teachers to PNS status. Sucha conversion would increase the salary bill for basic education to approximate IDR 90 trillion (USD 9 billion), anincrease of 35 percent. Certifying all teachers (both PNS and non-PNS) would increase the budget to IDR 120trillion, a 90 percent increase over the 2009 salary bill.
Figure 32: Estimated cost of converting all contract teachers to PNS, and of certifying all teachers140
S120-
80
0 -
S40-E'- 20 -
Current All PNS All PNS and Certified
Source: Own calculations using NUPTK data and average teacher salaries
The rapid increase in spending in the run-up to meeting the 20 percent rule probably contributed to theexcessive teacher hiring and the rapid regularization of primary school contract teachers. As seen at thebeginning of this chapter, the pressure to spend large windfalls produced a rapid increase in hiring. Salaries andhiring are guaranteed to absorb a substantial amount of resources more quickly and sustainably than programswhich require more planning. Thus the pressure to spending quickly at both the central and district levels mayhave provided incentives to increase the number of teachers, as well as teacher salaries and allowances. At thecentral level, teacher allowances disburse quickly, and can absorb a substantial share of additional resources.At the district level, the need meet the 20 percent rule, combined with the incentives included in the transferformulas, provide an inducement to allocate extra resources to salaries. Thus it is likely that the 20 percentrule, combined with the policy of converting contract teachers to civil servant status, contributed to the largeincrease in salary spending.
In addition to the incentives introduced bythe 20 percent rule, the rapid growth in the teaching force hasresulted from two factors: incentives in central government transfers to sub-national government andthe formulas used to determine the how many teachers a school is entitled to.34 The teacher entitlementformula - the minimum number of teachers required at a given school as a function of its characteristics - is alarge part of the problem, and one that this report returns to in chapter 5. A high degree of reliance on centralgovernment transfers means that the composition of sub-national spending is driven largely by the incentivesbuilt into the transfer formulas. It is thus worth going into more detail on sub-national spending in the nextsection.
In order to provide an idea of the sustainability of current and potential spending, especially on teachers, the nextsection provides some estimates of the budget implications of meeting one of the main government objectiveson education: drastically expanding access to senior secondary education.
34 World Bank (2010) Transforming Indonesia's Teaching Force; World Bank (2012) Sub-National Public Expenditure Review, forthcoming.
U
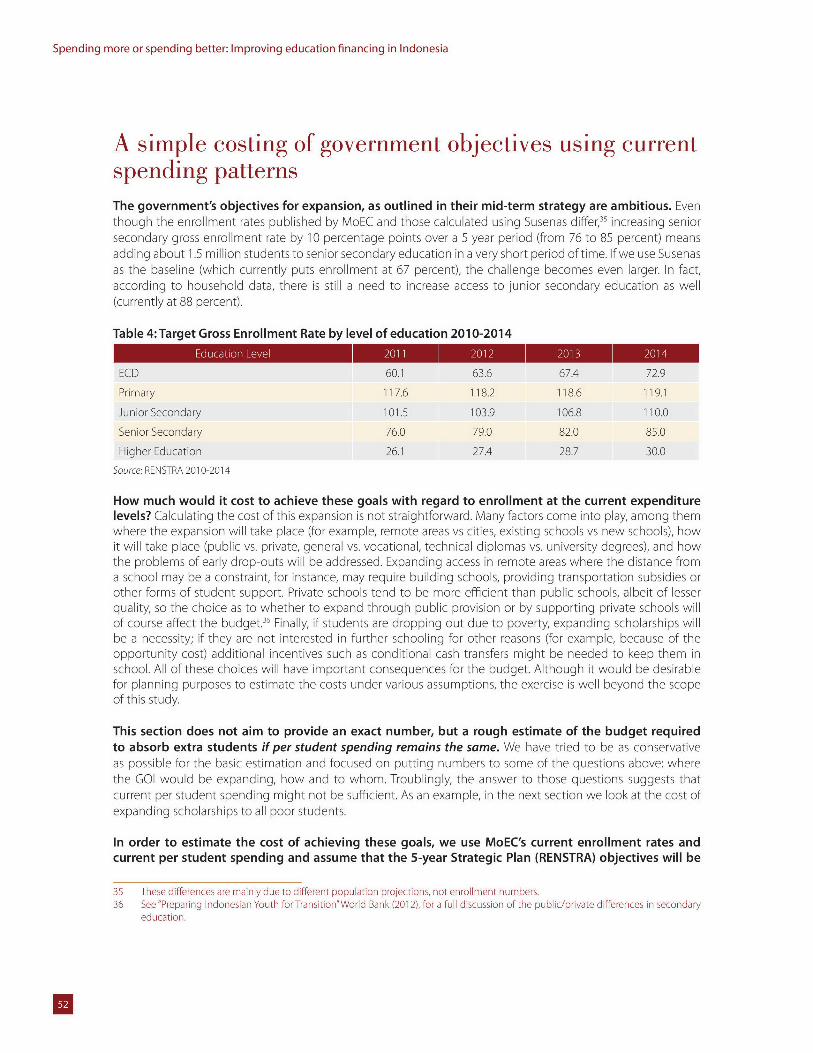
Spending more or spending better: Improving education financing in Indonesia
A simple costing of government objectives using currentspending patternsThe government's objectives for expansion, as outlined in their mid-term strategy are ambitious. Eventhough the enrollment rates published by MoEC and those calculated using Susenas differ," increasing seniorsecondary gross enrollment rate by 10 percentage points over a 5 year period (from 76 to 85 percent) meansadding about 1.5 million students to senior secondary education in a very short period of time. If we use Susenasas the baseline (which currently puts enrollment at 67 percent), the challenge becomes even larger. In fact,according to household data, there is still a need to increase access to junior secondary education as well(currently at 88 percent).
Table 4: Target Gross Enrollment Rate by level of education 2010-2014Education LevelHH MMM
ECD 60.1 63.6 67.4 72.9
Primary 117.6 118.2 118.6 119.1
Junior Secondary 101.5 103.9 106.8 110.0
Senior Secondary 76.0 79.0 82.0 85.0
Higher Education 26.1 27.4 28.7 30.0
Source: RENSTRA 2010-2014
How much would it cost to achieve these goals with regard to enrollment at the current expenditurelevels? Calculating the cost of this expansion is not straightforward. Many factors come into play, among themwhere the expansion will take place (for example, remote areas vs cities, existing schools vs new schools), howit will take place (public vs. private, general vs. vocational, technical diplomas vs. university degrees), and howthe problems of early drop-outs will be addressed. Expanding access in remote areas where the distance froma school may be a constraint, for instance, may require building schools, providing transportation subsidies orother forms of student support. Private schools tend to be more efficient than public schools, albeit of lesserquality, so the choice as to whether to expand through public provision or by supporting private schools willof course affect the budget.6 Finally, if students are dropping out due to poverty, expanding scholarships willbe a necessity; if they are not interested in further schooling for other reasons (for example, because of theopportunity cost) additional incentives such as conditional cash transfers might be needed to keep them inschool. All of these choices will have important consequences for the budget. Although it would be desirablefor planning purposes to estimate the costs under various assumptions, the exercise is well beyond the scopeof this study.
This section does not aim to provide an exact number, but a rough estimate of the budget requiredto absorb extra students if per student spending remains the same. We have tried to be as conservativeas possible for the basic estimation and focused on putting numbers to some of the questions above: wherethe GOI would be expanding, how and to whom. Troublingly, the answer to those questions suggests thatcurrent per student spending might not be sufficient. As an example, in the next section we look at the cost ofexpanding scholarships to all poor students.
In order to estimate the cost of achieving these goals, we use MoEC's current enrollment rates andcurrent per student spending and assume that the 5-year Strategic Plan (RENSTRA) objectives will be
35 These differences are mainly due to different population projections, not enrollment numbers.36 See"Preparing Indonesian Youth for Transition"World Bank (2012), for a full discussion of the public/private differences in secondary
education.
B
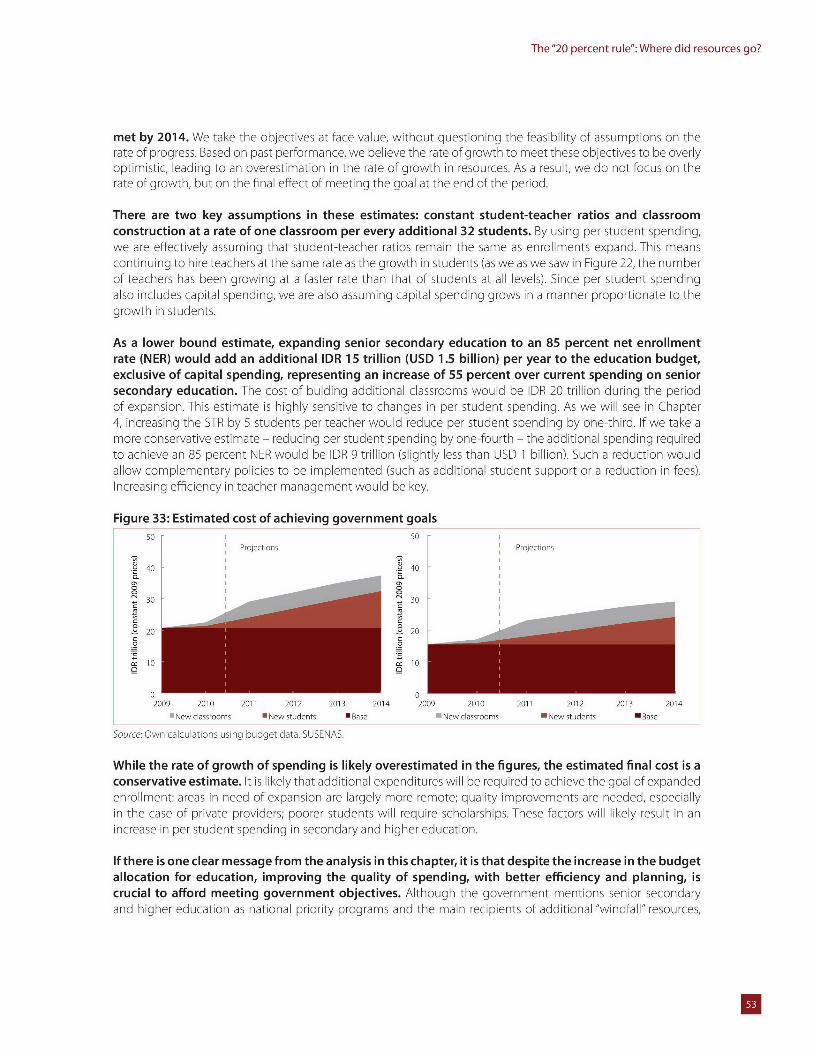
The"20 percent rule": Where did resources go?
met by 2014. We take the objectives at face value, without questioning the feasibility of assumptions on therate of progress. Based on past performance, we believe the rate of growth to meet these objectives to be overlyoptimistic, leading to an overestimation in the rate of growth in resources. As a result, we do not focus on therate of growth, but on the final effect of meeting the goal at the end of the period.
There are two key assumptions in these estimates: constant student-teacher ratios and classroomconstruction at a rate of one classroom per every additional 32 students. By using per student spending,we are effectively assuming that student-teacher ratios remain the same as enrollments expand. This meanscontinuing to hire teachers at the same rate as the growth in students (as we as we saw in Figure 22, the numberof teachers has been growing at a faster rate than that of students at all levels). Since per student spendingalso includes capital spending, we are also assuming capital spending grows in a manner proportionate to thegrowth in students.
As a lower bound estimate, expanding senior secondary education to an 85 percent net enrollmentrate (NER) would add an additional IDR 15 trillion (USD 1.5 billion) per year to the education budget,exclusive of capital spending, representing an increase of 55 percent over current spending on seniorsecondary education. The cost of bulding additional classrooms would be IDR 20 trillion during the periodof expansion. This estimate is highly sensitive to changes in per student spending. As we will see in Chapter4, increasing the STR by 5 students per teacher would reduce per student spending by one-third. If we take amore conservative estimate - reducing per student spending by one-fourth - the additional spending requiredto achieve an 85 percent NER would be IDR 9 trillion (slightly less than USD 1 billion). Such a reduction wouldallow complementary policies to be implemented (such as additional student support or a reduction in fees).Increasing efficiency in teacher management would be key.
Figure 33: Estimated cost of achieving government goals50 50
Projections Projections
40 40 II. I
I I
2 20 3 0
O 10 10
0 02009 2010 2011 2012 2013 2014 2009 2010 2011 2012 2013 2014
I New classrooms *New students U Base 0 New classrooms U New students U Base
Source: Own calculations using budget data, SUSENAS.
While the rate of growth of spending is likely overestimated in the figures, the estimated final cost is aconservative estimate. It is likely that additional expenditures will be required to achieve the goal of expandedenrollment: areas in need of expansion are largely more remote; quality improvements are needed, especiallyin the case of private providers; poorer students will require scholarships. These factors will likely result in anincrease in per student spending in secondary and higher education.
If there is one clear message from the analysis in this chapter, it is that despite the increase in the budgetallocation for education, improving the quality of spending, with better efficiency and planning, iscrucial to afford meeting government objectives. Although the government mentions senior secondaryand higher education as national priority programs and the main recipients of additional "windfall" resources,
B
Spending more or spending better: Improving education financing in Indonesia
currently there is limited information available to understand or evaluate the government's budget planningor actual spending processes after 2010. What the available realized expenditure data show is that the 2009increase in education resources was mainly allocated to teacher salaries and certification subsidies, and althoughgovernment spending on senior and higher education grew at twice the rate of basic education, spending onthese programs remains low compared to other countries in the region. All of which reinforces the notion thatthe quality of spending needs to improve.
What is Indonesia getting out of the increase in spending? The next chapter looks at how outcomes haveevolved over this period, and examines the link between increased resources and educational results.

IChapter 3:
How Have Outcomes Changed? TheUnfinished Agenda for Equity andQuality of Education
Following such a large increase in resources over the decade, one would expect outcomes to haveimproved significantly. As the previous chapter shows, growth in spending across levels of education hasbeen fairly similar over the decade, but senior secondary and higher education started to grow faster than otherlevels between 2008 and 2009. It also showed that most of the increase in basic education spending went forteachers' salaries. Capital spending has also grown very quickly in recent years, both at the central level (forhigher education) and at the district level.
Has this increase in spending led to significant improvements in access, equity and learning outcomes?This chapter seeks to answer these questions by presenting an overview of education indicators andpinpointing where challenges remain. Using mostly household survey data, the chapter first looks at trendsin net and gross enrollment rates, as well as out-of-age enrollment. Noting the significant improvements inenrollment rates, the equity section shows that the improvements in access are largely driven by improvementsin equity. However, despite improvements in access and equity, this chapter notes that two key issues remain.First, equity is still low in senior secondary and higher education, so expansion of access to these levels for thepoor remains a challenge. Second, the quality of education (measured by learning outcomes) has not improved,and in some cases has declined. Addressing the quality issue should be a priority, as it establishes the base forfuture learning. Expansion without quality may not yield the expected results for the poorer segments of thepopulation.
The last section of this chapter links resources to learning outcomes more explicitly. Internationalexperience shows clearly that it is easier to translate resources into access than into quality of education. So haveadditional resources improved learning outcomes in Indonesia? Taking advantage of differences in spendingacross districts and schools, the section analyzes the correlation between resources and learning outcomes,and considers whether it may be a matter of time until resources produce better outcomes, especially quality ofeducation. Given current spending patterns, unfortunately, this chapter concludes that the short answer is no.Spending better will thus be crucial.
AccessThe progress in enrollment rates in the last decade has been impressive. Indonesia has achieved universalprimary education and has made great advances in secondary and higher education, with an increase of 10 and7 percentage points in the gross enrollment rates (GER) respectively. Perhaps the most impressive achievementhas been in early childhood education and development (ECED), which now reaches half of 4 to 6 year olds (upfrom 25 percent a decade earlier).
U
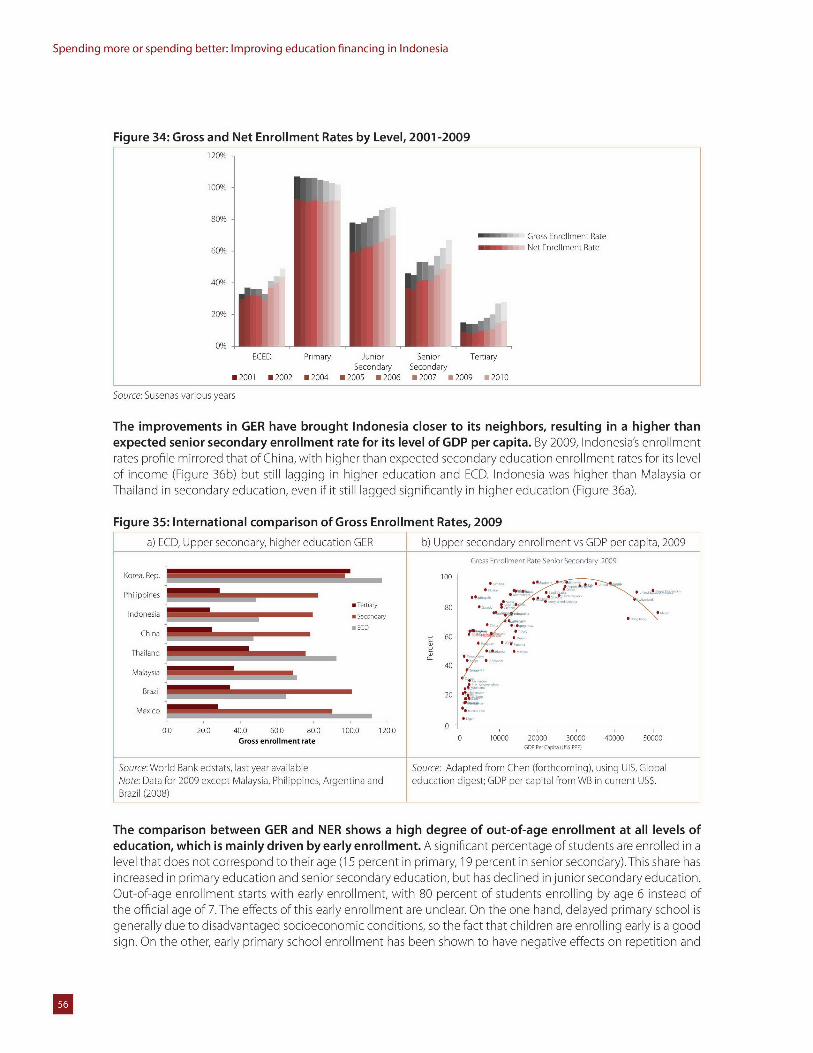
Spending more or spending better: Improving education financing in Indonesia
Figure 34: Gross and Net Enrollment Rates by Level, 2001-2009120%
100%
80%
Gross Enrollment Rate
60% Net Enrollment Rate
40%
20%
0%ECED Primary Junior Senior Tertiary
Secondary Secondarym2001 m2002 m2004 m2005 m2006 *2007 *2009 m2010
Source: Susenas various years
The improvements in GER have brought Indonesia closer to its neighbors, resulting in a higher thanexpected senior secondary enrollment rate for its level of GDP per capita. By 2009, Indonesia's enrollmentrates profile mirrored that of China, with higher than expected secondary education enrollment rates for its levelof income (Figure 36b) but still lagging in higher education and ECD. Indonesia was higher than Malaysia orThailand in secondary education, even if it still lagged significantly in higher education (Figure 36a).
Figure 35: International comparison of Gross Enrollment Rates, 2009
a) ECD, Upper secondary, higher education GER b) Upper secondary enrollment vs GDP per capita, 2009Gross Enrollment Rate Senior Secondary 2000
Korea, Rep. 100-
Philippines
0Tertiany, 80o *
Indonesia aSecondaryChna ECD
Thai and
40-Malaysia
Brazil2 R 20
Mexico
00 200 400 600 800 1000 120.0 0Gross enrollment rate 0 10000 20000 30000 40000 50000
GDP Pe Capita (US$ PPP)
Source: World Bank edstats, ast year available Source: Adapted from Chen (forthcoming), using UIS, GlobalNote: Data for 2009 except Malaysia, Philippines, Argentina and education digest; GDP per capital from WB in current US$.Brazil (2008)
The comparison between GER and NER shows a high degree of out-of-age enrollment at all levels ofeducation, which is mainly driven by early enrollment. A significant percentage of students are enrolled in alevel that does not correspond to their age (15 percent in primary, 19 percent in senior secondary).This share hasincreased in primary education and senior secondary education, but has declined in junior secondary education.Out-of-age enrollment starts with early enrollment, with 80 percent of students enrolling by age 6 instead ofthe official age of 7.The effects of this early enrollment are unclear. On the one hand, delayed primary school isgenerally due to disadvantaged socioeconomic conditions, so the fact that children are enrolling early is a goodsign. On the other, early primary school enrollment has been shown to have negative effects on repetition and
B
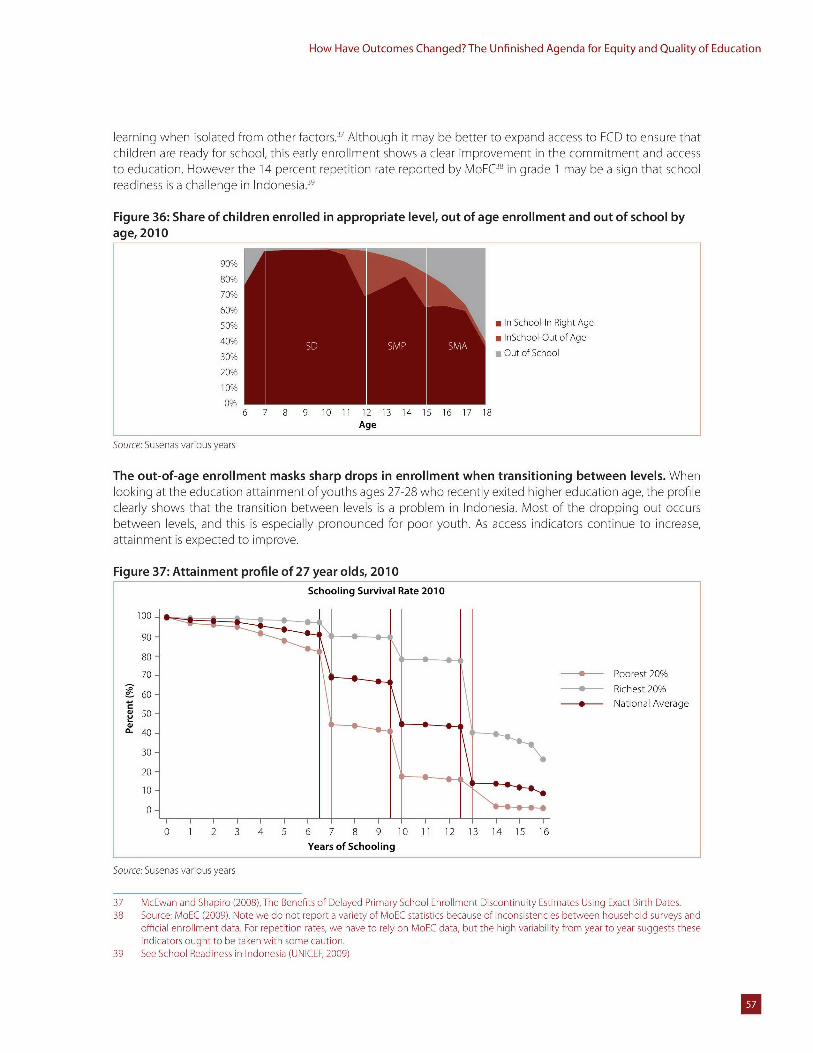
How Have Outcomes Changed? The Unfinished Agenda for Equity and Quality of Education
learning when isolated from other factors." Although it may be better to expand access to ECD to ensure thatchildren are ready for school, this early enrollment shows a clear improvement in the commitment and accessto education. However the 14 percent repetition rate reported by MoEC11 in grade 1 may be a sign that schoolreadiness is a challenge in Indonesia."
Figure 36: Share of children enrolled in appropriate level, out of age enrollment and out of school byage, 2010
90%
80%70%
60%50% m In School-In Right Age
40% 0 InSchool-Out of Age
30% , Out of School
20%
10%
0%6 7 8 9 10 11 12 13 14 15 16 17 18
Age
Source: Susenas various years
The out-of-age enrollment masks sharp drops in enrollment when transitioning between levels. Whenlooking at the education attainment of youths ages 27-28 who recently exited higher education age, the profileclearly shows that the transition between levels is a problem in Indonesia. Most of the dropping out occursbetween levels, and this is especially pronounced for poor youth. As access indicators continue to increase,attainment is expected to improve.
Figure 37: Attainment profile of 27 year olds, 2010Schooling Survival Rate 2010
80-
70 - - Poorest 20%
-* Richest 20%60 -
---- National Average50 -
0 40-
30 -
20-
10-
0-
0 1 2 3 4 5 6 7 8 9 10 11 12 13 14 15 16Years of Schooling
Source: Susenas various years
37 McEwan and Shapiro (2008),The Benefits of Delayed Primary School Enrollment Discontinuity Estimates Using Exact Birth Dates.38 Source: MoEC (2009). Note we do not report a variety of MoEC statistics because of inconsistencies between household surveys and
official enrollment data. For repetition rates, we have to rely on MoEC data, but the high variability from year to year suggests theseindicators ought to be taken with some caution.
39 See School Readiness in Indonesia (UNICEF, 2009)
U
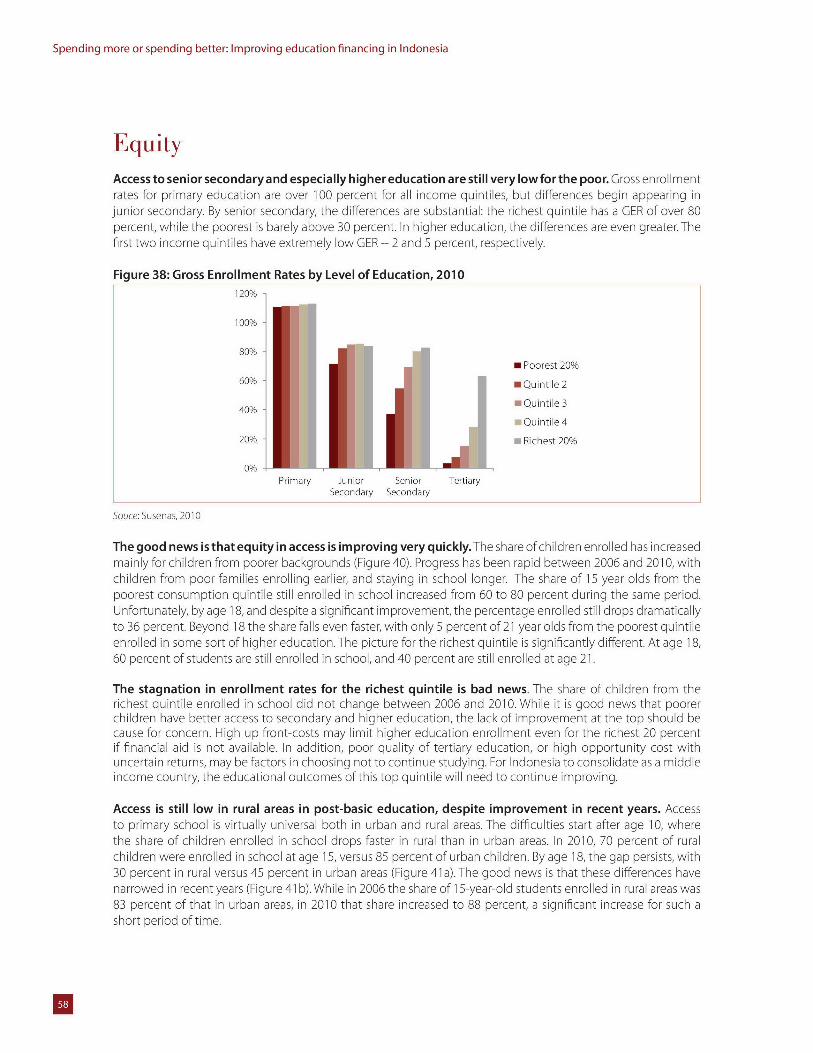
Spending more or spending better: Improving education financing in Indonesia
EquityAccess to senior secondary and especially higher education are still very lowfor the poor. Gross enrollmentrates for primary education are over 100 percent for all income quintiles, but differences begin appearing injunior secondary. By senior secondary, the differences are substantial: the richest quintile has a GER of over 80percent, while the poorest is barely above 30 percent. In higher education, the differences are even greater. Thefirst two income quintiles have extremely low GER -- 2 and 5 percent, respectively.
Figure 38: Gross Enrollment Rates by Level of Education, 2010120% -
100%
80%m Poorest 20%
60% m Quintile 2
40% M Quintile 3
Quintile 4
20% u Richest 20%
0%Primary Junior Senior Tertiary
Secondary Secondary
Souce: Susenas, 2010
The good news is that equity in access is improving very quickly.The share of children enrolled has increasedmainly for children from poorer backgrounds (Figure 40). Progress has been rapid between 2006 and 2010, withchildren from poor families enrolling earlier, and staying in school longer. The share of 15 year olds from thepoorest consumption quintile still enrolled in school increased from 60 to 80 percent during the same period.Unfortunately, by age 18, and despite a significant improvement, the percentage enrolled still drops dramaticallyto 36 percent. Beyond 18 the share falls even faster, with only 5 percent of 21 year olds from the poorest quintileenrolled in some sort of higher education. The picture for the richest quintile is significantly different. At age 18,60 percent of students are still enrolled in school, and 40 percent are still enrolled at age 21.
The stagnation in enrollment rates for the richest quintile is bad news. The share of children from therichest quintile enrolled in school did not change between 2006 and 2010. While it is good news that poorerchildren have better access to secondary and higher education, the lack of improvement at the top should because for concern. High up front-costs may limit higher education enrollment even for the richest 20 percentif financial aid is not available. In addition, poor quality of tertiary education, or high opportunity cost withuncertain returns, may be factors in choosing not to continue studying. For Indonesia to consolidate as a middleincome country, the educational outcomes of this top quintile will need to continue improving.
Access is still low in rural areas in post-basic education, despite improvement in recent years. Accessto primary school is virtually universal both in urban and rural areas. The difficulties start after age 10, wherethe share of children enrolled in school drops faster in rural than in urban areas. In 2010, 70 percent of ruralchildren were enrolled in school at age 15, versus 85 percent of urban children. By age 18, the gap persists, with30 percent in rural versus 45 percent in urban areas (Figure 41 a). The good news is that these differences havenarrowed in recent years (Figure 41 b). While in 2006 the share of 15-year-old students enrolled in rural areas was83 percent of that in urban areas, in 2010 that share increased to 88 percent, a significant increase for such ashort period of time.
U
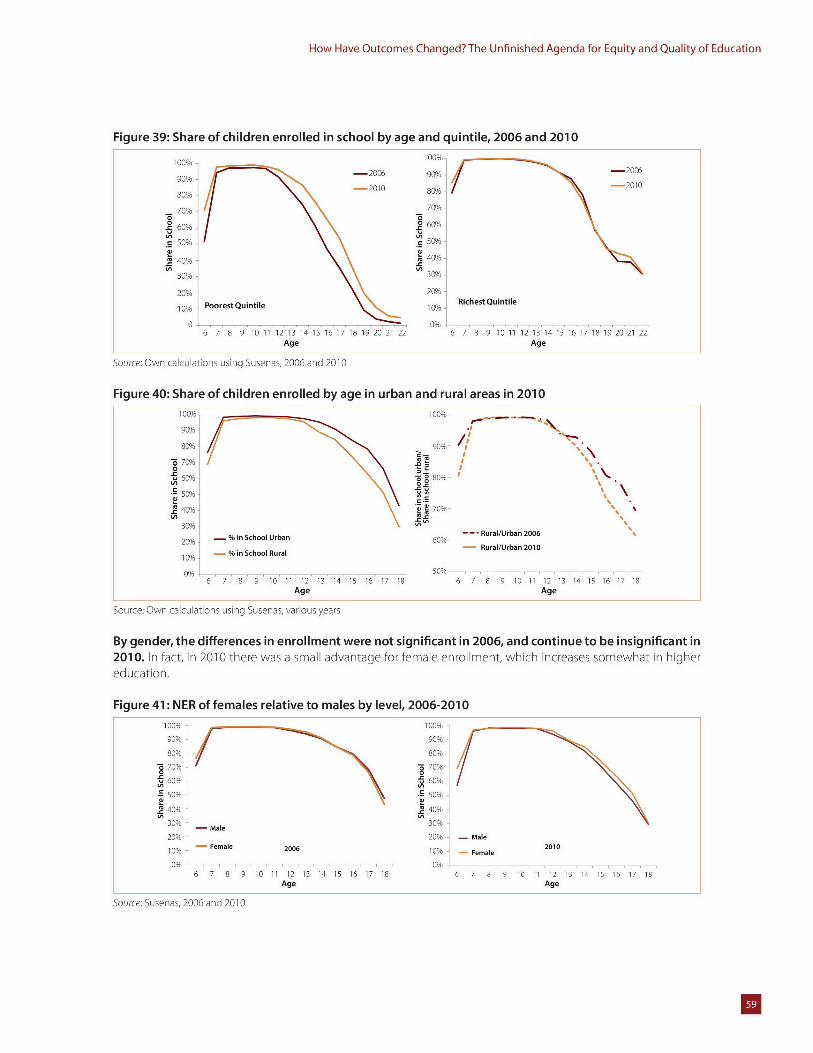
How Have Outcomes Changed? The Unfinished Agenda for Equity and Quality of Education
Figure 39: Share of children enrolled in school by age and quintile, 2006 and 2010
100% 100%
90% -2006 90o -200
80% -2010 80%-
70% 70%o o
60% 60%
a 50% 50%
40% m 40%
30% 30%
20% 20%
10% PoorestQuintile 10% RichestQuintile
0 . 0% i
6 7 8 9 10 11 12 13 14 15 16 17 18 19 20 21 22 6 7 8 9 10 11 12 13 14 15 16 17 18 19 20 21 22Age Age
Source: Own ca culations using Susenas, 2006 and 2010
Figure 40: Share of children enrolled by age in urban and rural areas in 2010
10(o 100%-
90% .t
8Po 90% ;
/ 70% N %
60% - *ul 8000 %
1.~ ~ ,70%-
-Rural/Urban 2010
20% % in School Urban 6000 Rrl/ra 201Po % in School Rural
6 7 8 9 10 11 12 13 14 15 16 17 18 6 7 8 9 10 11 12 13 14 15 16 17 18Age Age
Source: Own ca culations using Susenas, various years
By gender, the differences in enrollment were not significant in 2006, and continue to be insignificant in2010. In fact, in 2010 there was a small advantage for female enrollment, which increases somewhat in highereducation.
Figure 41: NER of females relative to males by level, 2006-2010
100% 100%
90%6 90%
80% 80%
-70% 70%7o 0
60% 60%
*S 50% -E 50%
40% - 40%
30%- - Male 30%
20%- 20% - Male
10% - Female 2006 10% - Female 2010
0% 0%6 7 8 9 10 11 12 13 14 15 16 17 18 6 7 8 9 10 11 12 13 14 15 16 17 18
Age Age
Source: Susenas, 2006 and 2010
U
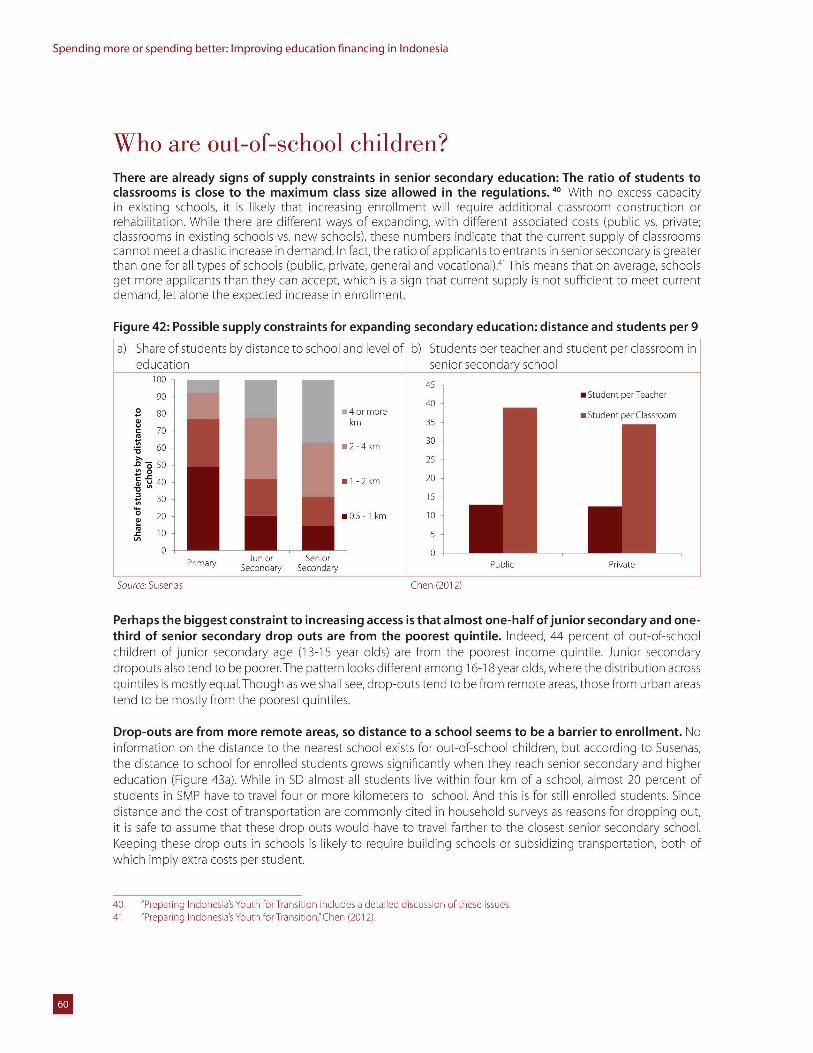
Spending more or spending better: Improving education financing in Indonesia
Who are out-of-school children?There are already signs of supply constraints in senior secondary education: The ratio of students toclassrooms is close to the maximum class size allowed in the regulations.40 With no excess capacityin existing schools, it is likely that increasing enrollment will require additional classroom construction orrehabilitation. While there are different ways of expanding, with different associated costs (public vs. private;classrooms in existing schools vs. new schools), these numbers indicate that the current supply of classroomscannot meet a drastic increase in demand. In fact, the ratio of applicants to entrants in senior secondary is greaterthan one for all types of schools (public, private, general and vocational).41 This means that on average, schoolsget more applicants than they can accept, which is a sign that current supply is not sufficient to meet currentdemand, let alone the expected increase in enrollment.
Figure 42: Possible supply constraints for expanding secondary education: distance and students per 9
a) Share of students by distance to school and level of b) Students per teacher and student per classroom ineducation senior secondary school
100 - 4590 m Student per Teacher
402 80 4 or more * Student per Classroom
km 35c 70
V 30-- 60 - 2-4km
- 5 525
U 40 11 -2km 20
S30 15
0 20 .mO5-1km 10
MC 10 5
Primary Junior Senior 0PrvtSecondary Secondary Public Private
Source: Susenas Chen (2012)
Perhaps the biggest constraint to increasing access is that almost one-half of junior secondary and one-third of senior secondary drop outs are from the poorest quintile. Indeed, 44 percent of out-of-schoolchildren of junior secondary age (13-15 year olds) are from the poorest income quintile. Junior secondarydropouts also tend to be poorer.The pattern looks different among 16-18 year olds, where the distribution acrossquintiles is mostly equal.Though as we shall see, drop-outs tend to be from remote areas, those from urban areastend to be mostly from the poorest quintiles.
Drop-outs are from more remote areas, so distance to a school seems to be a barrier to enrollment. Noinformation on the distance to the nearest school exists for out-of-school children, but according to Susenas,the distance to school for enrolled students grows significantly when they reach senior secondary and highereducation (Figure 43a). While in SD almost all students live within four km of a school, almost 20 percent ofstudents in SMP have to travel four or more kilometers to school. And this is for still enrolled students. Sincedistance and the cost of transportation are commonly cited in household surveys as reasons for dropping out,it is safe to assume that these drop outs would have to travel farther to the closest senior secondary school.Keeping these drop outs in schools is likely to require building schools or subsidizing transportation, both ofwhich imply extra costs per student.
40 "Preparing Indonesia's Youth forTransition includes a detailed discussion of these issues.41 "Preparing Indonesia's Youth for Transition,"Chen (2012).
U
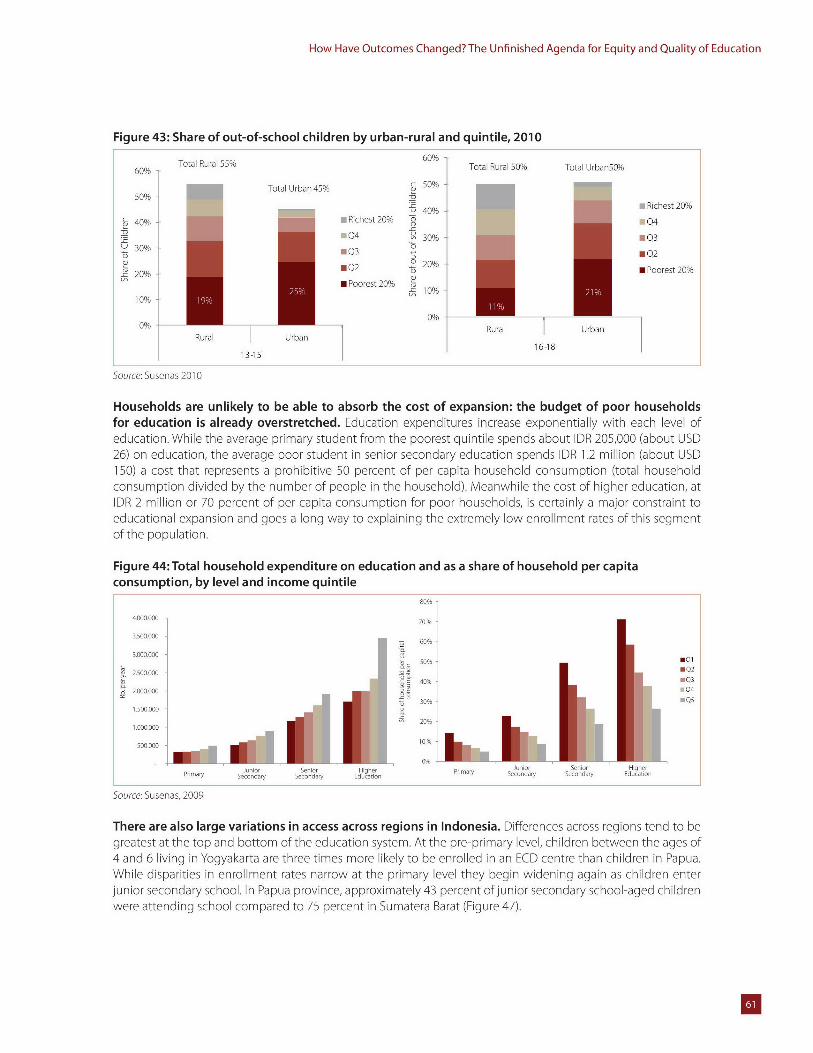
How Have Outcomes Changed? The Unfinished Agenda for Equity and Quality of Education
Figure 43: Share of out-of-school children by urban-rural and quintile, 2010
60% - Total Rural 55% 60% Total Rural 50% Total Urban51/
Total Urban45% 50%50% -
40% - Richest 20%
c 40% Richest 20% 0 Q404 u 30% NQ3
30% -E2Q30
Q2 Poorest 20%SrPooreste20%20%10
10%%
0% a U0%0%Rural 1 Urban
16-18
Source: Susenas 2010
Households are unlikely to be able to absorb the cost of expansion: the budget of poor householdsfor education is already overstretched. Education expenditures increase exponentially with each level ofeducation. While the average primary student from the poorest quintile spends about DR 205,000 (about USD26) on education, the average poor student in senior secondary education spends IDR 1.2 million (about USD150) a cost that represents a prohibitive 50 percent of per capita household consumption (total householdconsumption divided by the number of people in the household). Meanwhile the cost of higher education, atIDR 2 million or 70 percent of per capita consumption for poor households, is certainly a major constraint toeducational expansion and goes a long way to explaining the extremely low enrollment rates of this segmentof the population.
Figure 44: Total household expenditure on education and as a share of household per capitaconsumption, by level and income quintile
80%
4.000.000 70%
3.500.00060%
3.000.00050%HQ
2.500.000 mOQE40% mQ3
S2.000.000 Q4
30% mQ51.500J000 3
20%1.000.000
50000 10%
Junio, Senior Hgher Pri aenio Senior Higher
. c.. Sc ary Sec ry Eduatin Priecma n y S o ry Edu atin
Source: Susenas, 2009
There are also large variations in access across regions in Indonesia. Differences across regions tend to begreatest at the top and bottom of the education system. At the pre-primary level, children between the ages of4 and 6 living in Yogyakarta are three times more likely to be enrolled in an ECD centre than children in Papua.While disparities in enrollment rates narrow at the primary level they begin widening again as children enterjunior secondary school. In Papua province, approximately 43 percent ofjunior secondary school-aged childrenwere attending school compared to 75 percent in Sumatera Barat (Figure 47).
U
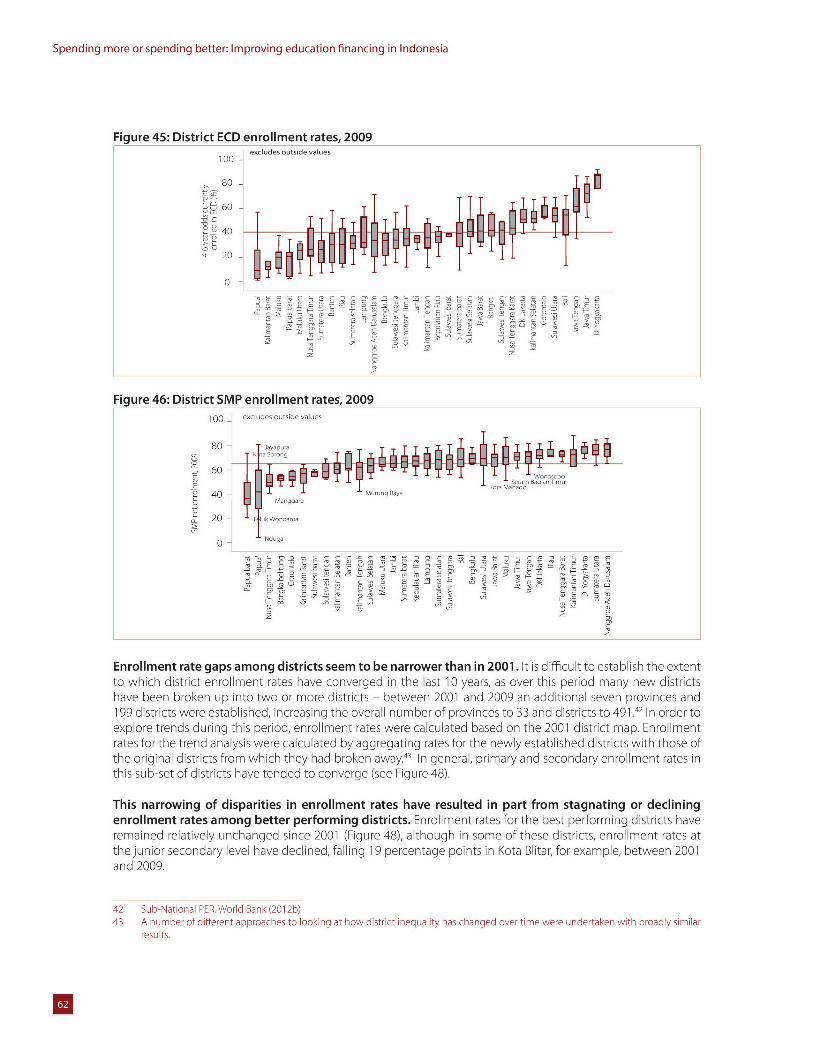
Spending more or spending better: Improving education financing in Indonesia
Figure 45: District ECD enrollment rates, 2009excludes outside values
100 _
80 -
u60 -
40-
0
IIFigure 46: District SMP enrollment rates, 2009100 _ excludes outside values
80 -J"asya'pur
60 - WnsbKoaMae 1o-aga Tim-
240 - Murung RayaManggarai
20 - Tl Wondamna
0 _Nduga
Ov F 43a A22 ~
Enrollment rate gaps among districts seem to be narrower than in 2001. It is difficult to establish the extentto which district enrollment rates have converged in the last 10 years, as over this period many new districtshave been broken up into two or more districts - between 2001 and 2009 an additional seven provinces and199 districts were established, increasing the overall number of provinces to 33 and districts to 491 .42 In order toexplore trends during this period, enrollment rates were calculated based on the 2001 district map. Enrollmentrates for the trend analysis were calculated by aggregating rates for the newly established districts with those ofthe original districts from which they had broken away.43 In general, primary and secondary enrollment rates inthis sub-set of districts have tended to converge (see Figure 48).
This narrowing of disparities in enrollment rates have resulted in part from stagnating or decliningenrollment rates among better performing districts. Enrollment rates for the best performing districts haveremained relatively unchanged since 2001 (Figure 48), although in some of these districts, enrollment rates atthe junior secondary level have declined, failing 19 percentage points in Kota Blitar, for example, between 2001and 2009.
42 Sub-National PER, World Bank (201 2b)43 A number of different approaches to looking at how district inequality has changed over time were undertaken with broadly similar
results.
U
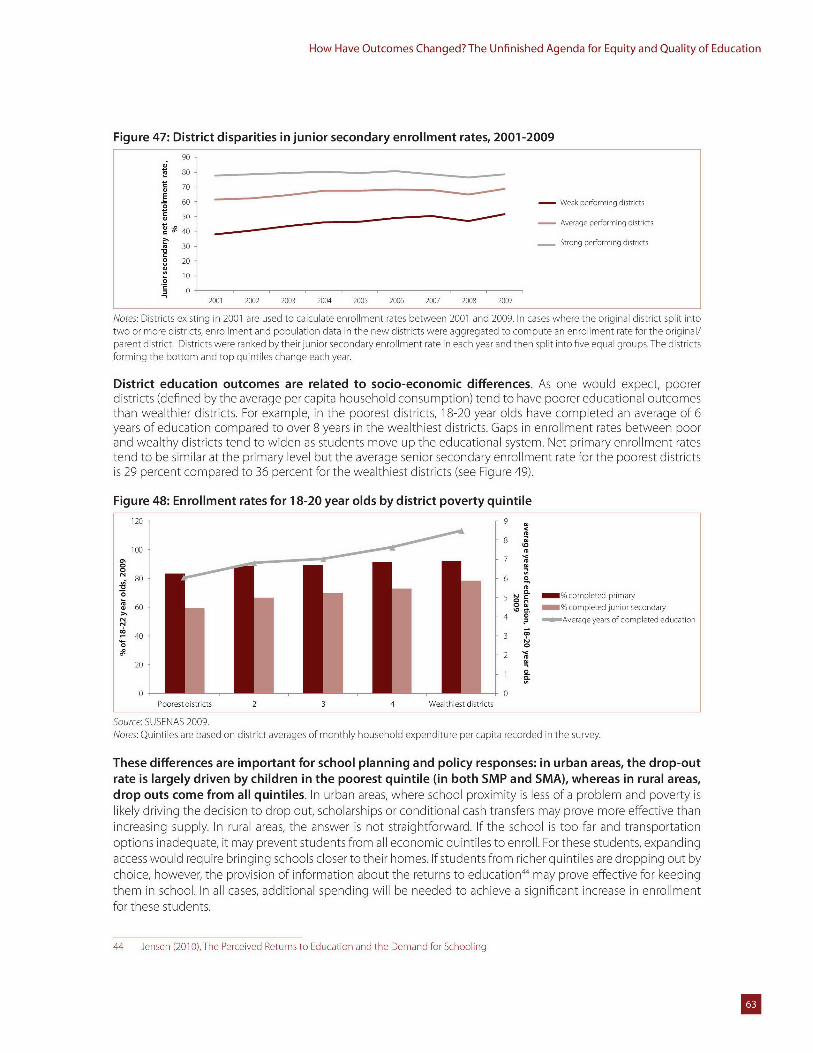
How Have Outcomes Changed? The Unfinished Agenda for Equity and Quality of Education
Figure 47: District disparities in junior secondary enrollment rates, 2001-2009
90
80
70
60 - Weak performing districts0
50 - Average performing districts
40
30 Strong performing districts
0 20
00 10-
2001 2002 2003 2004 2005 2006 2007 2008 2009
Notes: Districts existing in 2001 are used to calculate enrollment rates between 2001 and 2009. In cases where the original district split intotwo or more districts, enrollment and population data in the new districts were aggregated to compute an enrollment rate for the original/parent district. Districts were ranked by their junior secondary enrollment rate in each year and then sp it into five equal groups.The districtsforming the bottom and top quintiles change each year.
District education outcomes are related to socio-economic differences. As one would expect, poorerdistricts (defined by the average per capita household consumption) tend to have poorer educational outcomesthan wealthier districts. For example, in the poorest districts, 18-20 year olds have completed an average of 6years of education compared to over 8 years in the wealthiest districts. Gaps in enrollment rates between poorand wealthy districts tend to widen as students move up the educational system. Net primary enrollment ratestend to be similar at the primary level but the average senior secondary enrollment rate for the poorest districtsis 29 percent compared to 36 percent for the wealthiest districts (see Figure 49).
Figure 48: Enrollment rates for 18-20 year olds by district poverty quintile
120 9
1007
80 6 o
5 L m%completed primary
W 60 %completed juniorsecondary
4 Average years of completed education
40 0
220 2
0 i0Poorestdistricts 2 3 4 Wealthiest districts
Source: SUSENAS 2009.Notes: Quintiles are based on district averages of monthly household expenditure per capita recorded in the survey.
These differences are important for school planning and policy responses: in urban areas, the drop-outrate is largely driven by children in the poorest quintile (in both SMP and SMA), whereas in rural areas,drop outs come from all quintiles. In urban areas, where school proximity is less of a problem and poverty islikely driving the decision to drop out, scholarships or conditional cash transfers may prove more effective thanincreasing supply. In rural areas, the answer is not straightforward. If the school is too far and transportationoptions inadequate, it may prevent students from all economic quintiles to enroll. For these students, expandingaccess would require bringing schools closer to their homes. If students from richer quintiles are dropping out bychoice, however, the provision of information about the returns to education44 may prove effective for keepingthem in school. In all cases, additional spending will be needed to achieve a significant increase in enrollmentfor these students.
44 Jensen (2010),The Perceived Returns to Education and the Demand for Schooling
U
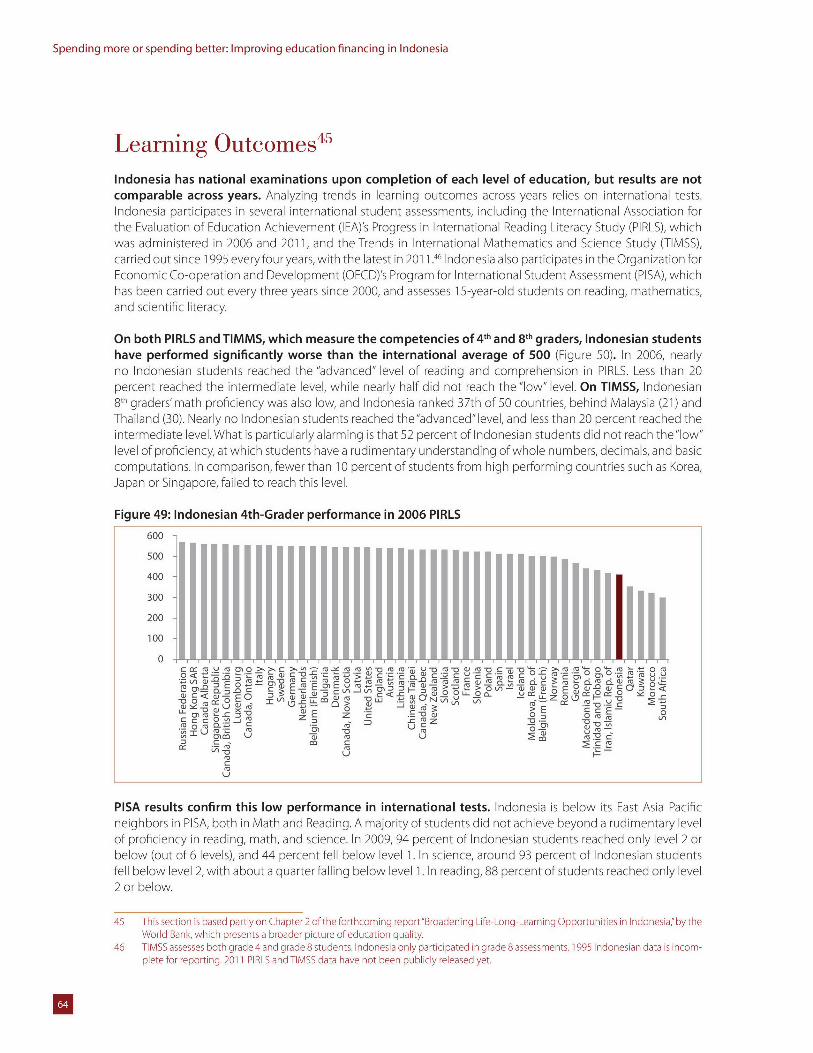
Spending more or spending better: Improving education financing in Indonesia
Learning Outcomes 5
Indonesia has national examinations upon completion of each level of education, but results are notcomparable across years. Analyzing trends in learning outcomes across years relies on international tests.Indonesia participates in several international student assessments, including the International Association forthe Evaluation of Education Achievement (IEA)'s Progress in International Reading Literacy Study (PIRLS), whichwas administered in 2006 and 2011, and the Trends in International Mathematics and Science Study (TIMSS),carried out since 1995 every four years, with the latest in 2011 .46 Indonesia also participates in the Organization forEconomic Co-operation and Development (OECD)'s Program for International Student Assessment (PISA), whichhas been carried out every three years since 2000, and assesses 15-year-old students on reading, mathematics,and scientific literacy.
On both PIRLS and TIMMS, which measure the competencies of 4th and 81h graders, Indonesian studentshave performed significantly worse than the international average of 500 (Figure 50). In 2006, nearlyno Indonesian students reached the "advanced" level of reading and comprehension in PIRLS. Less than 20percent reached the intermediate level, while nearly half did not reach the "low" level. On TIMSS, Indonesian8th graders'math proficiency was also low, and Indonesia ranked 37th of 50 countries, behind Malaysia (21) andThailand (30). Nearly no Indonesian students reached the"advanced" level, and less than 20 percent reached theintermediate level. What is particularly alarming is that 52 percent of Indonesian students did not reach the"low"level of proficiency, at which students have a rudimentary understanding of whole numbers, decimals, and basiccomputations. In comparison, fewer than 10 percent of students from high performing countries such as Korea,Japan or Singapore, failed to reach this level.
Figure 49: Indonesian 4th-Grader performance in 2006 PIRLS
600
500
400
300
200
100111 10
0Z. CL <~c)O u
C, Ln U J 0U
u
PISA results confirm this low performance in international tests. Indonesia is below its East Asia Pacificneighbors in PISA, both in Math and Reading. A majority of students did not achieve beyond a rudimentary levelof proficiency in reading, math, and science. In 2009, 94 percent of Indonesian students reached only level 2 orbelow (out of 6 levels), and 44 percent fell below level 1. In science, around 93 percent of Indonesian studentsfell below level 2, with about a quarter falling below level 1. In reading, 88 percent of students reached only level2 or below.
45 This section is based partly on Chapter 2 oftthe forthcoming report"'Broadening Life-Long-Learning Opportunities in Indonesia'"by theWorld Bank, which presents a broader picture ofteducation quality.
46 TIMSS assesses both grade 4 and grade 8 students. Indonesia only participated in grade 8 assessments. 1995 Indonesian data is incom-plete for reporting. 201l1 PIBLS and TIMSS data have not been publicly released yet.
UZ U0,>C
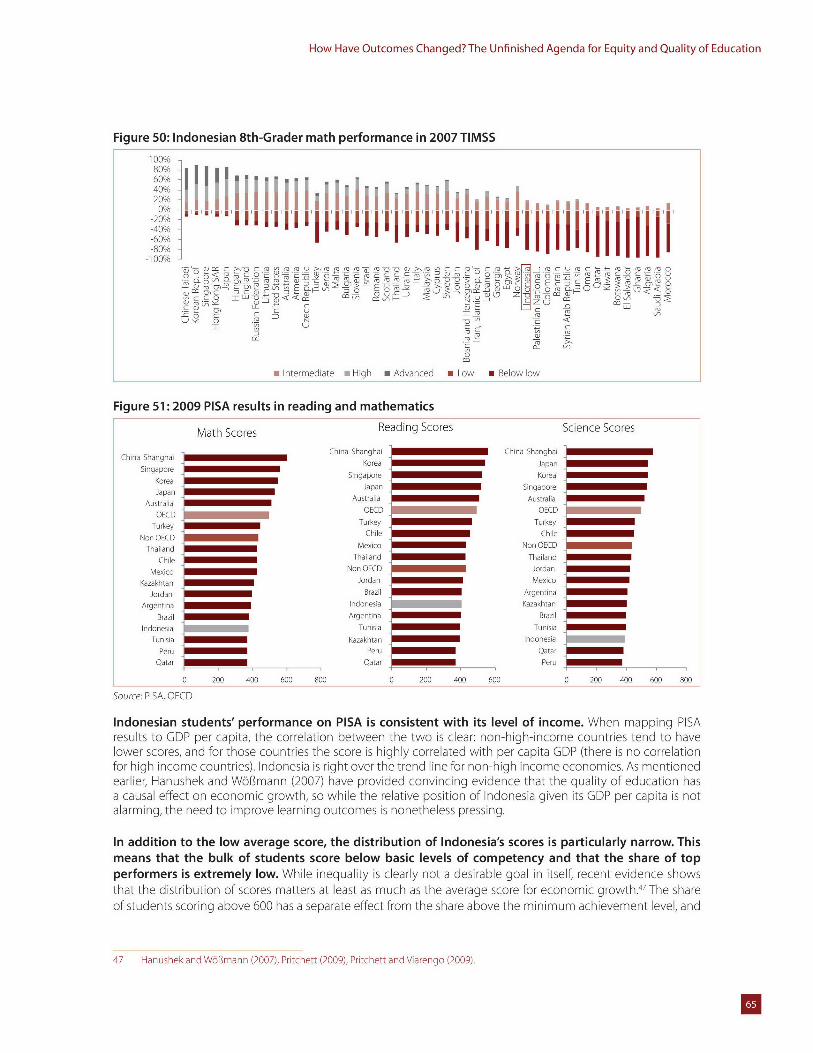
How Have Outcomes Changed? The Unfinished Agenda for Equity and Quality of Education
Figure 50: Indonesian 8th-Grader math performance in 2007 TIMSS
100% -80% -60% -E i40% .... i I |1 111 I20% hff I-40%-
-100% -
om '- I e Hg m Avc a Low - B eo low
Chin Shnga Chin Shanghai
90 0
)
Urs Q No0
Chi a ha gh i K re J paSin ap re in apoe orea r
0
m Intermediate aHgh * Advanced m Low m Below low
Figure 51:2009 PISA results in reading and mathematics
Math Scores Reading Scores Science ScoresChina Shangnai Cnina Shanghai
China Shanghai KoreaJpn
Kigaore Singapore Koreaa Japan Singapore
apan Australia AustraliaAustralia
OECD OECD OECD
Turkey Turkey Turkey
Non OECD Chile Chile
Thailand Mexico Non OECD
Chile Thailand Thailand
Mexico Non OECD Jordan
Kazakhtan Jordan Mexico
Jordan Brazil Argentina
Argentina Indonesia Kazakhtan
Brazil Argentina Brazil
Indonesia Tunisia Tunisia
Tunisia Kazakhtan Indonesia
Peru Peru QatarQatar Qatar Peru
0 200 400 600 800 0 200 400 600 c 200 400 600 800
Source: PISA, OECD
Indonesian students' performance on PISA is consistent with its level of income. When mapping PISAresults to GDP per capita, the correlation between the two is clear: non-high-income countries tend to havelower scores, and for those countries the score is highly correlated with per capita GDP (there is no correlationfor high income countries). Indonesia is right over the trend line for non-high income economies. As mentionedearlier, Hanushek and WbGmann (2007) have provided convincing evidence that the quality of education hasa causal effect on economic growth, so while the relative position of Indonesia given its GDP per capita is notalarming, the need to improve learning outcomes is nonetheless pressing.
In addition to the low average score, the distribution of Indonesia's scores is particularly narrow. Thismeans that the bulk of students score below basic levels of competency and that the share of topperformers is extremely low. While inequality is clearly not a desirable goal in itself, recent evidence showsthat the distribution of scores matters at least as much as the average score for economic growth.47 The shareof students scoring above 600 has a separate effect from the share above the minimum achievement level, and
47 Hanushek and WObmann (2007), Pritchett (2009), Pritchett and Viarengo (2009).
U
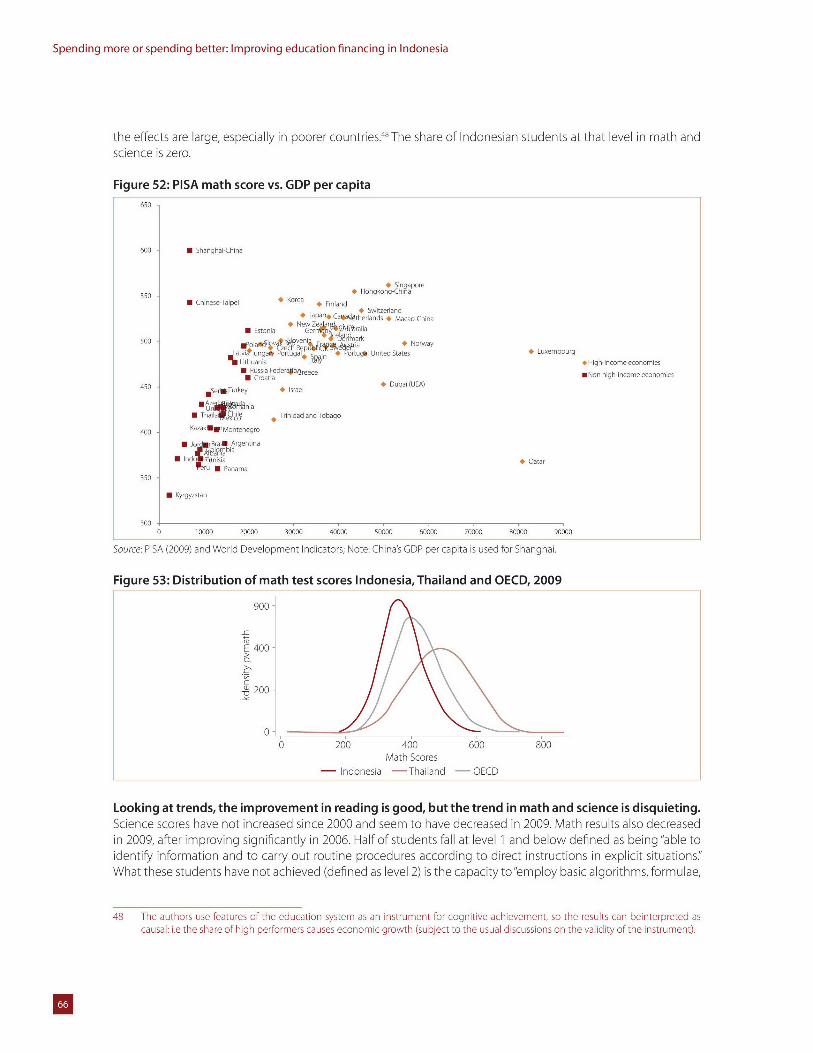
Spending more or spending better: Improving education financing in Indonesia
the effects are large, especially in poorer countries. 48 The share of Indonesian students at that level in math andscience is zero.
Figure 52: PISA math score vs. GDP per capita650
600 U Shanghal-China
* Singapore550 * Hongkong-Chia
5 Chinese Taipei Korea * Finland o# Switzerland
* Japan* CaWo@therlands * Macao-China* New Zea~ri
* Estonia NeeuAsai,
500 11olaor e F Norway
atvi unga#y PortugaT ,# Portugl United States LuxemourgLithuania M#gh-IncomeeconomesN Russia FeaderaoGreece *Non high-Icome economes
0 Croatia450 Ser- Turkey * Israel Dubal(UEA)
STha n aei * Trinidad and Tobago
400 KazakErMontenegro
0 Jord BAN Argentina
0ru Panama350
g Kyrgyzstan
300 10 10000 20000 30000 40000 50000 60000 70000 80000 90000
Source: PISA (2009) and World Development Indicators; Note: China's GDP per capita is used for Shanghai.
Figure 53: Distribution of math test scores Indonesia, Thailand and OECD, 2009
900
E 400
20
0
0 200 400 600 800Math Scores
- Indonesia -Thailand - OECD
Looking at trends, the improvement in reading is good, but the trend in math and science is disquieting.Science scores have not increased since 2000 and seem to have decreased in 2009. Math results also decreasedin 2009, after improving significantly in 2006. Half of students fall at level I and below defined as being "able toidentify information and to carry out routine procedures according to direct instructions in explicit situations."What these students have not achieved (defined as level 2) is the capacity to"employ basic algorithms, formulae,
48 The authors use features of the education system as an instrument for cognitive achievement, so the results can beinterpreted ascausal: i.e the share of high performers causes economic growth (subject to the usual discussions on the validity of the instrument).
U
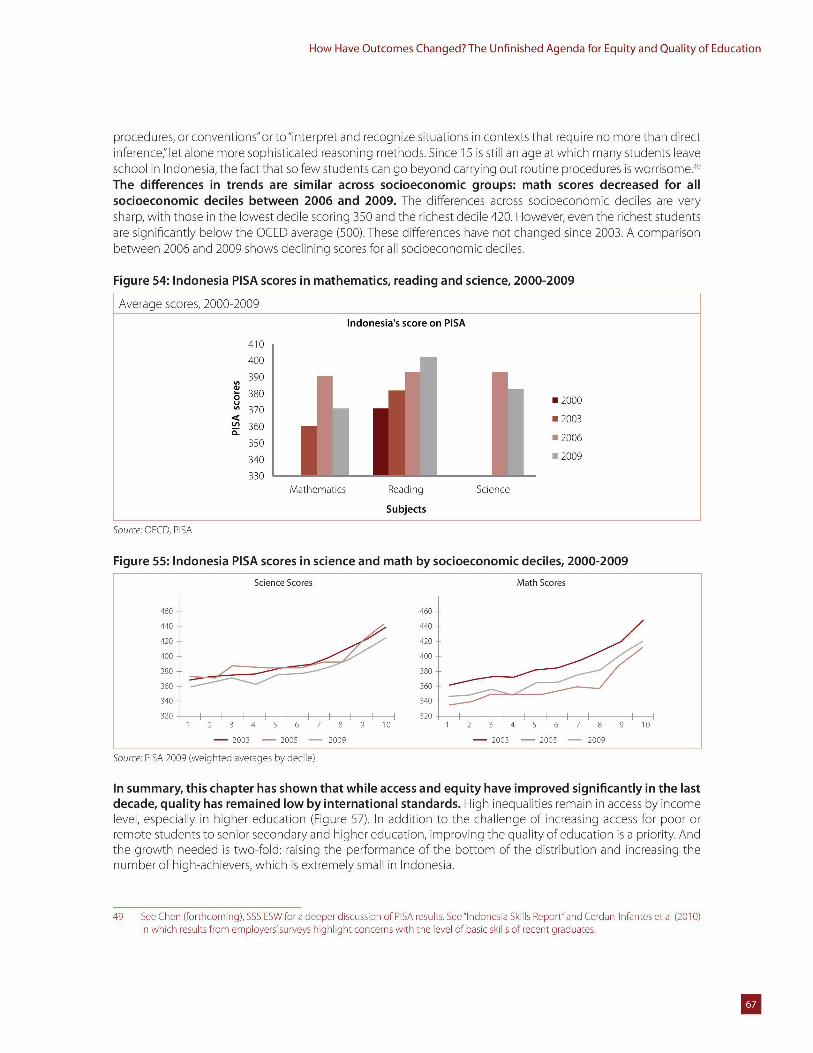
How Have Outcomes Changed? The Unfinished Agenda for Equity and Quality of Education
procedures, or conventions"or to "interpret and recognize situations in contexts that require no more than directinference,' let alone more sophisticated reasoning methods. Since 15 is still an age at which many students leaveschool in Indonesia, the fact that so few students can go beyond carrying out routine procedures is worrisome.49The differences in trends are similar across socioeconomic groups: math scores decreased for allsocioeconomic deciles between 2006 and 2009. The differences across socioeconomic deciles are verysharp, with those in the lowest decile scoring 350 and the richest decile 420. However, even the richest studentsare significantly below the OCED average (500). These differences have not changed since 2003. A comparisonbetween 2006 and 2009 shows declining scores for all socioeconomic deciles.
Figure 54: Indonesia PISA scores in mathematics, reading and science, 2000-2009
Average scores, 2000-2009Indonesia's score on PISA
410
400390
380 0 20000370
< 02003S360
350 02006
340 n 2009
330Mathematics Reading Science
Subjects
Source: OECD, PISA
Figure 55: Indonesia PISA scores in science and math by socioeconomic deciles, 2000-2009
Science Scores Math Scores
460 -- 460 -
440 - - 440
420 4 | |20 I
400 -- 400-
380 -- 380
360 360
340 340
320 i 3201 2 3 4 5 6 7 8 9 10 1 2 3 4 5 6 7 8 9 10
- 2003 - 2005 - 2009 - 2003 - 2005 - 2009
Source: PISA 2009 (weighted averages by decile)
In summary, this chapter has shown that while access and equity have improved significantly in the lastdecade, quality has remained low by international standards. High inequalities remain in access by incomelevel, especially in higher education (Figure 57). In addition to the challenge of increasing access for poor orremote students to senior secondary and higher education, improving the quality of education is a priority. Andthe growth needed is two-fold: raising the performance of the bottom of the distribution and increasing thenumber of high-achievers, which is extremely small in Indonesia.
49 See Chen (forthcoming), SSS ESW for a deeper discussion of PISA results. See"Indonesia Skills Report"and Cerdan-Infantes et al (2010)in which results from employers'surveys highlight concerns with the level of basic skills of recent graduates.
U
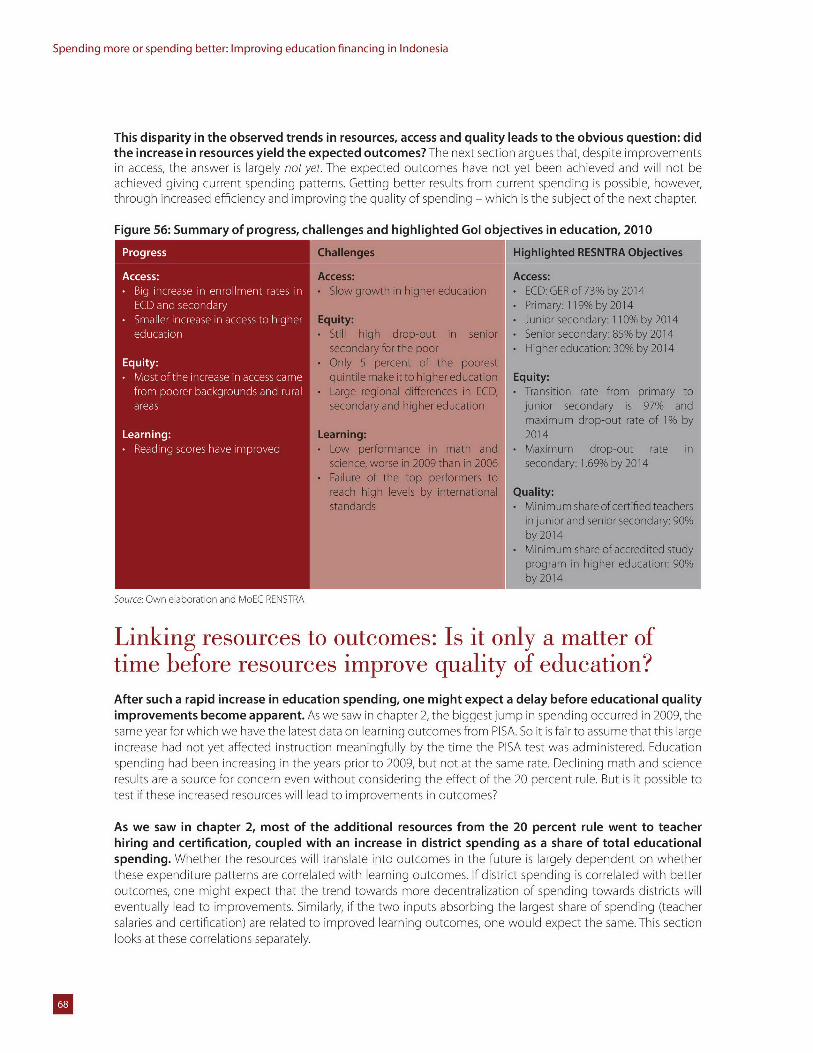
Spending more or spending better: Improving education financing in Indonesia
This disparity in the observed trends in resources, access and quality leads to the obvious question: didthe increase in resources yield the expected outcomes? The next section argues that, despite improvementsin access, the answer is largely not yet. The expected outcomes have not yet been achieved and will not beachieved giving current spending patterns. Getting better results from current spending is possible, however,through increased efficiency and improving the quality of spending - which is the subject of the next chapter.
Figure 56: Summary of progress, challenges and highlighted Gol objectives in education, 2010
Sourceghigte OwnTR eOabjecntndivcesNTR
Access: A m terotBig increase in enroment rates in qualiy of cti
FECD and secondary ncrease in euai s d one miSmaller increase in access to higher become apparent. A we s i cat 2n 209 th
ed nangfl Se ni sered Education
Equity:teMost of the increase in access came tm esi ce
from poorer backgrounds and rural arnt rule wen to t
spening hte resources wiltaaeito outcome s it fuueon lgly dependte onfhtethese endtre resorces aecrltdwithlerovequit outoffdsrc sednuscoratedwion? te
outcomsharpdicesineuainsnig, one might expect tha delaynd beforeoredeeducliational pninoad districtyil
eventuallyoleadtoimprovements. sia i tht 2,pt abige mphin spending 9tache
salaresn eartification hare thelatest to ipove learning outcomes, one PISAulS expectai th sasme. tahis laeto
speninghad eeninceasig i th yeas piorto 209,butnot t te smatexcimnng mpfuat and scienc
testif g hsicreaeores wilaeaet improvementsimin outcomes?tei
As e sw i chpte 2,mos oftheaddtioal esorce frmte i2nprceint shre wf(etfto techer
loouratm tes oeio epatend ors r
sndold e c ther a tion
lookrsu at these correansnsearat o pnig.n ih epc ea eoe dctoault
imrvmnsbcm paet sw a ncatr2 h igsjm nsedn curdi 09 h
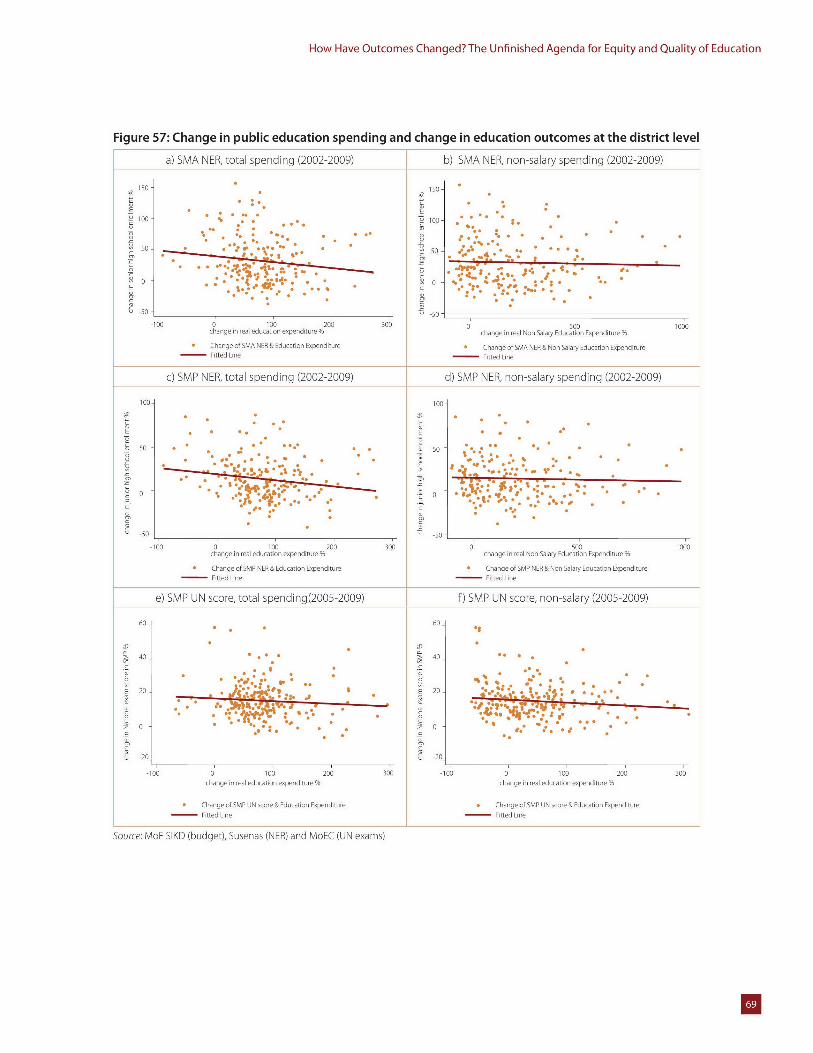
How Have Outcomes Changed? The Unfinished Agenda for Equity and Quality of Education
Figure 57: Change in public education spending and change in education outcomes at the district level
a) SMA NER, total spending (2002-2009) b) SMA NER, non-salary spending (2002-2009)
150 150
00 :*00
o. . * * . .
05
-50 -50*
100 0 100 200 300 05change in lea ecucation expenditure% change in real Non Salary Education Expenditure%
Change of SMA NER & Education Expenditure * Change of MA NER & Non Salary Education ExpenditureFitted Line - Fitted Line
c) SMP NER, total spending (2002-2009) d) SMP NER, non-salary spending (2002-2009)
100- 100
*2 * .*
-* *
so - .* . * ** . . **.* **. **
.''** * :**
* * * * ~ : *
u-50 - -50-
10 0 100 200 300 0 500 1000change in real education expenditure % change in real Non Salary Education Expenditure%
* Change of SMP NER & Education Expenditure * Change of SMP NER & Non Salary Education ExpenditureFitted Line - Fitted Line
e) SMP UN score, total spending(2005-2009) f) SMP UN score, non-salary (2005-2009)
60 60
40 . * 40* 8*
40* * *. * 0 ** * *
* .*. ****..
20 4 20
.* * . I = 0 .*
2-0
100 0 100 200 300 100 0 100 200 300change In real education expenditure % change in real education expenditure%
Change of SMP UN score & Education Expenditure * Change of SMP UN score & Education Expenditure
Fitted Line - Fitted Line
Source: MoF S KD (budget), Susenas (NER) and MoEC (UN exams)
U
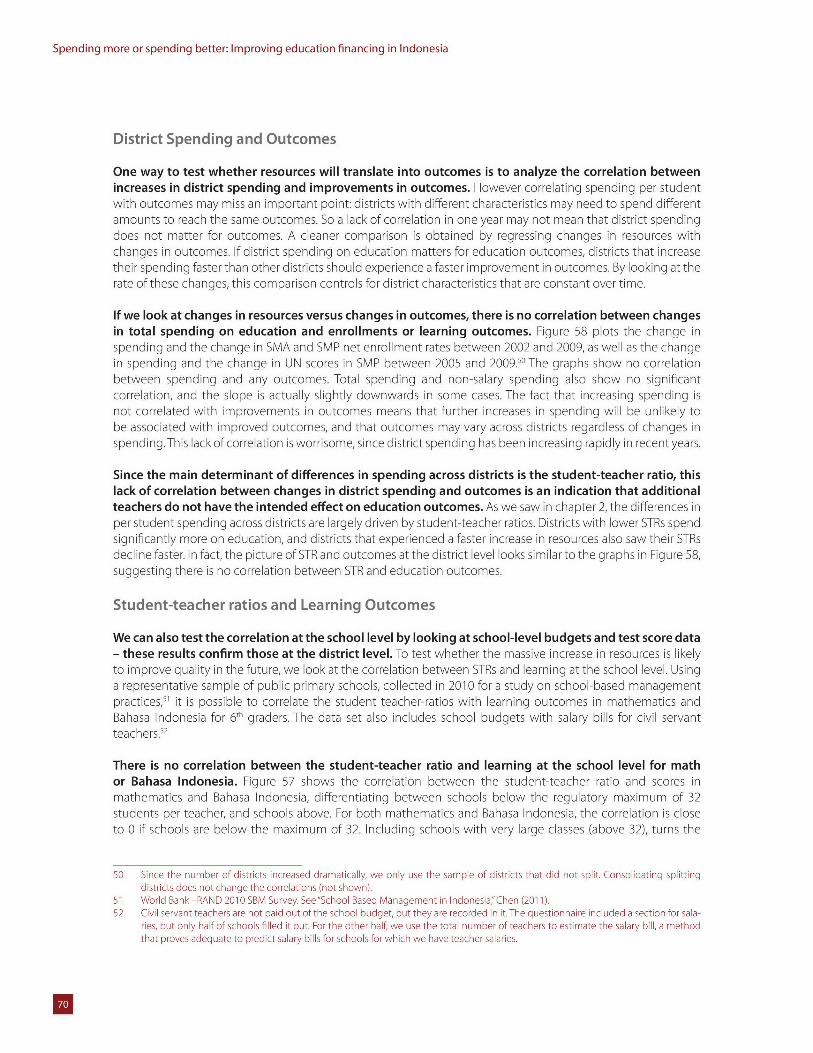
Spending more or spending better: Improving education financing in Indonesia
District Spending and Outcomes
One way to test whether resources will translate into outcomes is to analyze the correlation betweenincreases in district spending and improvements in outcomes. However correlating spending per studentwith outcomes may miss an important point: districts with different characteristics may need to spend differentamounts to reach the same outcomes. So a lack of correlation in one year may not mean that district spendingdoes not matter for outcomes. A cleaner comparison is obtained by regressing changes in resources withchanges in outcomes. If district spending on education matters for education outcomes, districts that increasetheir spending faster than other districts should experience a faster improvement in outcomes. By looking at therate of these changes, this comparison controls for district characteristics that are constant over time.
If we look at changes in resources versus changes in outcomes, there is no correlation between changesin total spending on education and enrollments or learning outcomes. Figure 58 plots the change inspending and the change in SMA and SMP net enrollment rates between 2002 and 2009, as well as the changein spending and the change in UN scores in SMP between 2005 and 2009.so The graphs show no correlationbetween spending and any outcomes. Total spending and non-salary spending also show no significantcorrelation, and the slope is actually slightly downwards in some cases. The fact that increasing spending isnot correlated with improvements in outcomes means that further increases in spending will be unlikely tobe associated with improved outcomes, and that outcomes may vary across districts regardless of changes inspending.This lack of correlation is worrisome, since district spending has been increasing rapidly in recent years.
Since the main determinant of differences in spending across districts is the student-teacher ratio, thislack of correlation between changes in district spending and outcomes is an indication that additionalteachers do not have the intended effect on education outcomes. As we saw in chapter 2, the differences inper student spending across districts are largely driven by student-teacher ratios. Districts with lower STRs spendsignificantly more on education, and districts that experienced a faster increase in resources also saw their STRsdecline faster. In fact, the picture of STR and outcomes at the district level looks similar to the graphs in Figure 58,suggesting there is no correlation between STR and education outcomes.
Student-teacher ratios and Learning Outcomes
We can also test the correlation at the school level by looking at school-level budgets and test score data- these results confirm those at the district level. To test whether the massive increase in resources is likelyto improve quality in the future, we look at the correlation between STRs and learning at the school level. Usinga representative sample of public primary schools, collected in 2010 for a study on school-based managementpractices," it is possible to correlate the student teacher-ratios with learning outcomes in mathematics andBahasa Indonesia for 6 th graders. The data set also includes school budgets with salary bills for civil servantteachers.12
There is no correlation between the student-teacher ratio and learning at the school level for mathor Bahasa Indonesia. Figure 57 shows the correlation between the student-teacher ratio and scores inmathematics and Bahasa Indonesia, differentiating between schools below the regulatory maximum of 32students per teacher, and schools above. For both mathematics and Bahasa Indonesia, the correlation is closeto 0 if schools are below the maximum of 32. Including schools with very large classes (above 32), turns the
50 Since the number of districts increased dramatically, we only use the sample of districts that did not split. Consolidating splittingdistricts does not change the correlations (not shown).
51 World Bank -RAND 2010 SBM Survey. See"School Based Management in Indonesia,"Chen (2011).52 Civil servant teachers are not paid out of the school budget, but they are recorded in it.The questionnaire included a section for sala-
ries, but only half of schools filled it out. For the other half, we use the total number of teachers to estimate the salary bill, a methodthat proves adequate to predict salary bills for schools for which we have teacher salaries.
U
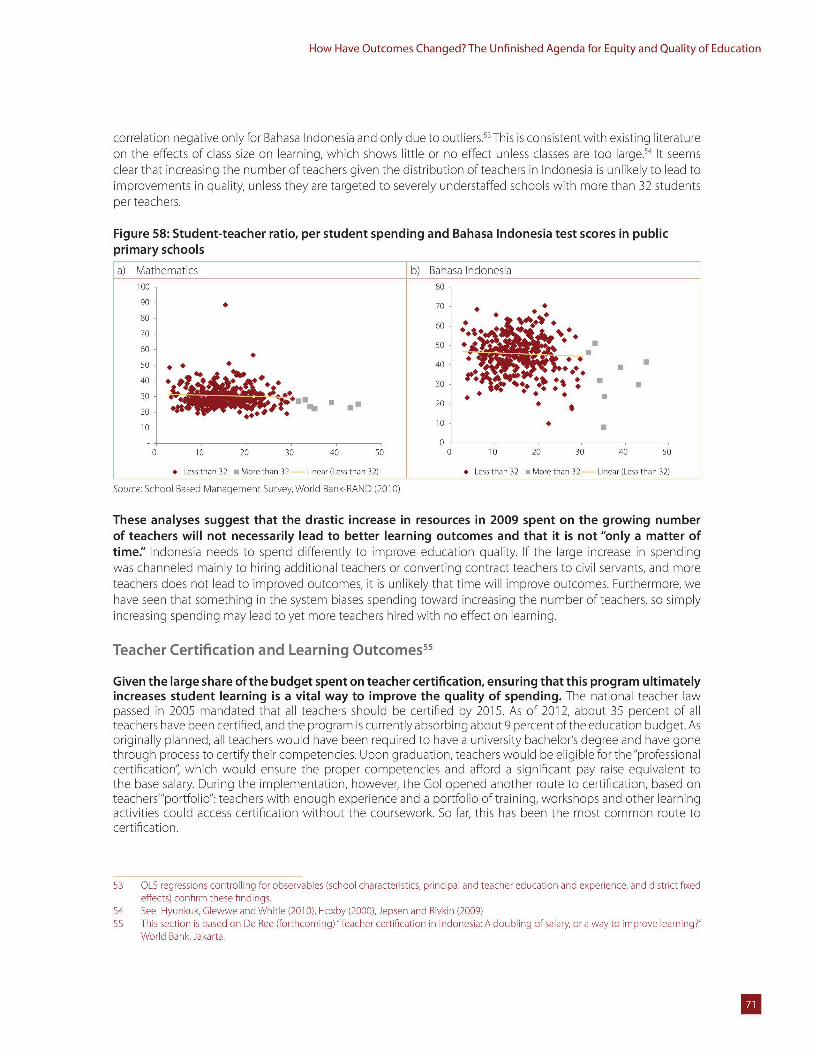
How Have Outcomes Changed? The Unfinished Agenda for Equity and Quality of Education
correlation negative only for Bahasa Indonesia and only due to outliers." This is consistent with existing literatureon the effects of class size on learning, which shows little or no effect unless classes are too large.54 It seemsclear that increasing the number of teachers given the distribution of teachers in Indonesia is unlikely to lead toimprovements in quality, unless they are targeted to severely understaffed schools with more than 32 studentsper teachers.
Figure 58: Student-teacher ratio, per student spending and Bahasa Indonesia test scores in publicprimary schools
a) MathematicsIndonesia100 80
90 7080
6070 - t 460 -5 0
50 - * 40
30 -
10 -10 *
00 10 20 30 40 50 0 10 20 30 40 50
* Less than 32 a More than 32 Lnear (Less than 32) # Less than 32 m More than 32 Linear (Less than 32)
Source: School Based Management Survey, World Bank-RAND (2010)
These analyses suggest that the drastic increase in resources in 2009 spent on the growing numberof teachers will not necessarily lead to better learning outcomes and that it is not "only a matter oftime." Indonesia needs to spend differently to improve education quality. If the large increase in spendingwas channeled mainly to hiring additional teachers or converting contract teachers to civil servants, and moreteachers does not lead to improved outcomes, it is unlikely that time will improve outcomes. Furthermore, wehave seen that something in the system biases spending toward increasing the number of teachers, so simplyincreasing spending may lead to yet more teachers hired with no effect on learning.
Teacher Certification and Learning Outcomes5
Given the large share of the budget spent on teacher certification, ensuring that this program ultimatelyincreases student learning is a vital way to improve the quality of spending. The national teacher lawpassed in 2005 mandated that all teachers should be certified by 2015. As of 2012, about 35 percent of allteachers have been certified, and the program is currently absorbing about 9 percent of the education budget. Asoriginally planned, all teachers would have been required to have a university bachelor's degree and have gonethrough process to certify their competencies. Upon graduation, teachers would be eligible for the"professionalcertification', which would ensure the proper competencies and afford a significant pay raise equivalent tothe base salary. During the implementation, however, the Gol opened another route to certification, based onteachers'"portfolio": teachers with enough experience and a portfolio of training, workshops and other learningactivities could access certification without the coursework. So far, this has been the most common route tocertification.
53 OLS regressions controlling for observables (school characteristics, principal and teacher education and experience, and district fixedeffects) confirm these findings.
54 See Hyunkuk, Glewwe and Whitle (2010), Hoxby (2000), Jepsen and Rivkin (2009)55 This section is based on De Bee (forthcoming)"Teacher certification in Indonesia: A doubling of salary, or a way to improve learning?"
World Bank, Jakarta.
U
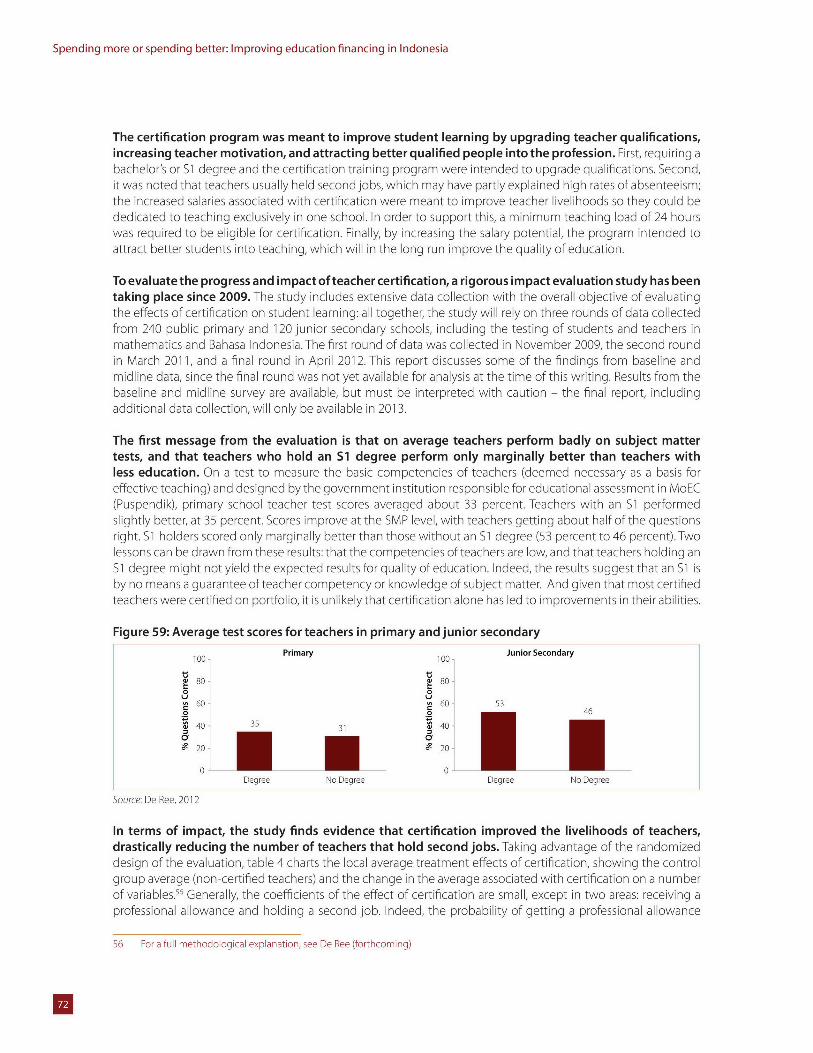
Spending more or spending better: Improving education financing in Indonesia
The certification program was meant to improve student learning by upgrading teacher qualifications,increasing teacher motivation, and attracting better qualified people into the profession. First, requiring abachelor's or Si degree and the certification training program were intended to upgrade qualifications. Second,it was noted that teachers usually held second jobs, which may have partly explained high rates of absenteeism;the increased salaries associated with certification were meant to improve teacher livelihoods so they could bededicated to teaching exclusively in one school. In order to support this, a minimum teaching load of 24 hourswas required to be eligible for certification. Finally, by increasing the salary potential, the program intended toattract better students into teaching, which will in the long run improve the quality of education.
To evaluate the progress and impactof teacher certification, a rigorous impact evaluation study has beentaking place since 2009. The study includes extensive data collection with the overall objective of evaluatingthe effects of certification on student learning: all together, the study will rely on three rounds of data collectedfrom 240 public primary and 120 junior secondary schools, including the testing of students and teachers inmathematics and Bahasa Indonesia. The first round of data was collected in November 2009, the second roundin March 2011, and a final round in April 2012. This report discusses some of the findings from baseline andmidline data, since the final round was not yet available for analysis at the time of this writing. Results from thebaseline and midline survey are available, but must be interpreted with caution - the final report, includingadditional data collection, will only be available in 2013.
The first message from the evaluation is that on average teachers perform badly on subject mattertests, and that teachers who hold an S1 degree perform only marginally better than teachers withless education. On a test to measure the basic competencies of teachers (deemed necessary as a basis foreffective teaching) and designed by the government institution responsible for educational assessment in MoEC(Puspendik), primary school teacher test scores averaged about 33 percent. Teachers with an S1 performedslightly better, at 35 percent. Scores improve at the SMP level, with teachers getting about half of the questionsright. S1 holders scored only marginally better than those without an S1 degree (53 percent to 46 percent).Twolessons can be drawn from these results: that the competencies of teachers are low, and that teachers holding an51 degree might not yield the expected results for quality of education. Indeed, the results suggest that an S1 isby no means a guarantee of teacher competency or knowledge of subject matter. And given that most certifiedteachers were certified on portfolio, it is unlikely that certification alone has led to improvements in their abilities.
Figure 59: Average test scores for teachers in primary and junior secondary
100 Primary 100 Junior Secondary
E 80 E 80o aU vr 60 2 60 53
.2 .2 46
2 40 35 31 2 40
20 20
0- 0 1Degree No Degree Degree No Degree
Source: De Ree, 2012
In terms of impact, the study finds evidence that certification improved the livelihoods of teachers,drastically reducing the number of teachers that hold second jobs. Taking advantage of the randomizeddesign of the evaluation, table 4 charts the local average treatment effects of certification, showing the controlgroup average (non-certified teachers) and the change in the average associated with certification on a numberof variables. 6 Generally, the coefficients of the effect of certification are small, except in two areas: receiving aprofessional allowance and holding a second job. Indeed, the probability of getting a professional allowance
56 For a full methodological explanation, see De Ree (forthcoming)
U
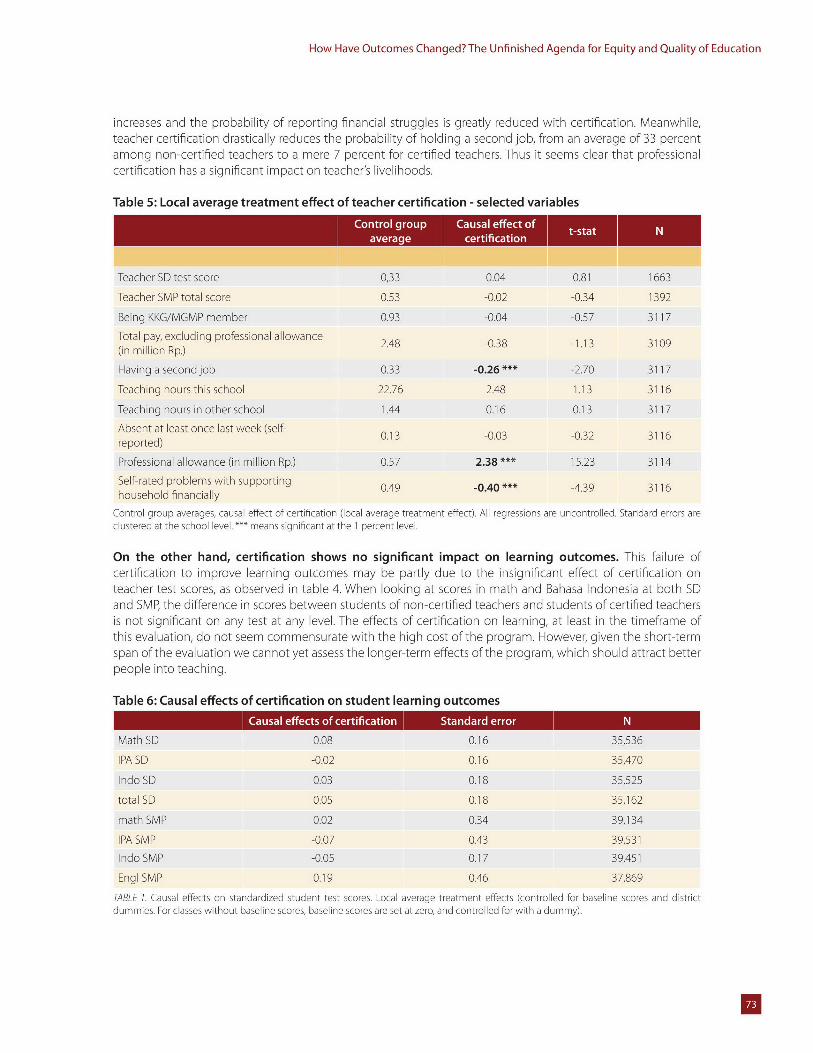
How Have Outcomes Changed? The Unfinished Agenda for Equity and Quality of Education
increases and the probability of reporting financial struggles is greatly reduced with certification. Meanwhile,teacher certification drastically reduces the probability of holding a second job, from an average of 33 percentamong non-certified teachers to a mere 7 percent for certified teachers. Thus it seems clear that professionalcertification has a significant impact on teacher's livelihoods.
Table 5: Local average treatment effect of teacher certification - selected variables
Control group Causal effect ofaverage certification
Teacher SD test score 0,33 0.04 0.81 1663
Teacher SMP total score 0.53 -0.02 -0.34 1392
Being KKG/MGMP member 0.93 -0.04 -0.57 3117
Total pay, excluding professional allowance 2.48 -0.38 -1.13 3109(in million Rp.)
Having a second job 0.33 -0.26*** -2.70 3117
Teaching hours this school 22.76 2.48 1.13 3116
Teaching hours in other school 1.44 0.16 0.13 3117
Absent at least once last week (self- 0.13 -0.03 -0.32 3116reported)
Professional allowance (in million Rp.) 0.57 2.38 15.23 3114
Self-rated problems with supporting 0.49 -0.40 -4.39 3116household financially
Control group averages, causal effect of certification (local average treatment effect). All regressions are uncontrolled. Standard errors areclustered at the school level.*** means significant at the 1 percent level.
On the other hand, certification shows no significant impact on learning outcomes. This failure ofcertification to improve learning outcomes may be partly due to the insignificant effect of certification onteacher test scores, as observed in table 4. When looking at scores in math and Bahasa Indonesia at both SDand SMP, the difference in scores between students of non-certified teachers and students of certified teachersis not significant on any test at any level. The effects of certification on learning, at least in the timeframe ofthis evaluation, do not seem commensurate with the high cost of the program. However, given the short-termspan of the evaluation we cannot yet assess the longer-term effects of the program, which should attract betterpeople into teaching.
Table 6: Causal effects of certification on student learning outcomes
SStandard error
Math SD 0.08 0.16 35,536
IPA SD -0.02 0.16 35,470
Indo SD 0.03 0.18 35,525
total SD 0.05 0.18 35,162
math SMP 0.02 0.34 39,134
IPA SMP -0.07 0.43 39,531
Indo SMP -0.05 0.17 39,451
Engl SMP 0.19 0.46 37,869
TABLE 7. Causal effects on standardized student test scores. Local average treatment effects (controlled for baseline scores and districtdummies. For classes without baseline scores, baseline scores are set at zero, and controlled for with a dummy).
U
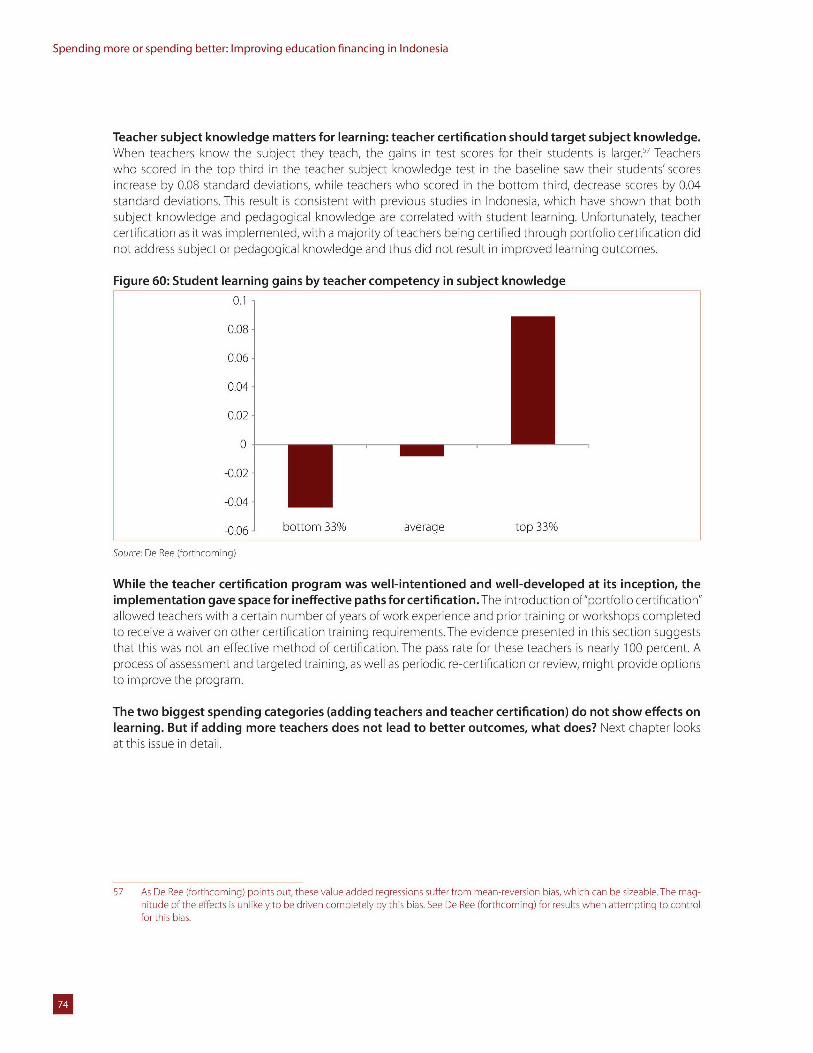
Spending more or spending better: Improving education financing in Indonesia
Teacher subject knowledge matters for learning: teacher certification should target subject knowledge.When teachers know the subject they teach, the gains in test scores for their students is larger." Teacherswho scored in the top third in the teacher subject knowledge test in the baseline saw their students' scoresincrease by 0.08 standard deviations, while teachers who scored in the bottom third, decrease scores by 0.04standard deviations. This result is consistent with previous studies in Indonesia, which have shown that bothsubject knowledge and pedagogical knowledge are correlated with student learning. Unfortunately, teachercertification as it was implemented, with a majority of teachers being certified through portfolio certification didnot address subject or pedagogical knowledge and thus did not result in improved learning outcomes.
Figure 60: Student learning gains by teacher competency in subject knowledge0.1 -
0.08-
0.06-
0.04-
0.02-
0-
-0.02-
-0.04-
-0.06- bottom 33% average top 33%
Source: De Ree (forthcoming)
While the teacher certification program was well-intentioned and well-developed at its inception, theimplementation gave space for ineffective paths for certification. The introduction of"portfolio certification"allowed teachers with a certain number of years of work experience and prior training or workshops completedto receive a waiver on other certification training requirements.The evidence presented in this section suggeststhat this was not an effective method of certification. The pass rate for these teachers is nearly 100 percent. Aprocess of assessment and targeted training, as well as periodic re-certification or review, might provide optionsto improve the program.
The two biggest spending categories (adding teachers and teacher certification) do not show effects onlearning. But if adding more teachers does not lead to better outcomes, what does? Next chapter looksat this issue in detail.
57 As De Ree (forthcoming) points out, these value added regressions suffer from mean-reversion bias, which can be sizeable The mag-nitude of the effects is unlikely to be driven completely by this bias. See De Ree (forthcoming) for results when attempting to controlfor this bias.
IChapter 4:
Improving the Quality of Spending onBasic Education
Improving the quality of spending means turning resources into outcomes more efficiently. For a certainlevel of spending, this means increasing access to schooling and improving the quality of education.International experience shows that this is easier to do for access than for quality. Indeed, this has been the casein Indonesia. As resources have increased, equity and access have improved but quality of education has not. Ineffect, in Indonesia, improving the quality of spending means improving learning outcomes without necessarilyincreasing resources.
Countries have proven to be successful at keeping children in school through a variety of policies(school building, scholarships, conditional cash transfers). As we have seen, Indonesia has successfullyimplemented many of these policies. Access to basic education has been made virtually universal through amassive expansion in school building and the provision of block grants to schools to lower the cost of education.At the same time, the country also provides scholarships to the poor and a small conditional cash transfer (PKH).However, access to senior secondary and higher education remain a challenge. The low level of resourcesallocated to senior secondary education seems to indicate that access could be improved at that level. Similarly,the scholarships for the poor program (BSM), as we will see, suffers from problems that limit its effectiveness.Thus there is still room for improvement when it comes to increasing access by improving existing policies in arelatively straightforward manner.
Learning outcomes, on the other hand, are more elusive. This is true not only in Indonesia, but aroundthe world. A recent World Bank-UNESCO joint publication on "Strengthening Education Quality in East Asia"notes that "Low- and middle-income countries in East Asia have made considerable progress toward achievinguniversal primary education, but quality remains a challenge:" As has been the case in Indonesia, the study showsthat increasing spending has not systematically resulted in improvements in learning outcomes, but that "inmany countries, it has coincided with a decrease in quality." Indonesia is not alone in its elusive quest for quality.
Recent evidence shows that system reforms have the strongest impact on educational quality.There is nostraightforward answer on how to improve the quality of education. Countries that have made rapid advances inlearning outcomes do so through systemic educational reforms. The financing of the system, the managementof teachers and the promotion of school-base management, among other dimensions, all have impacts onlearning outcomes.
This chapter focuses on three critical systemic issues that can improve how spending translates intoaccess and educational quality: strategic expansion of the centrally-administered Scholarships for thePoor program (BSM), improving district-level teacher management and improving district spending.Chapter 2 highlighted the need to increase spending on ECD and senior secondary education: one way to
U
Spending more or spending better: Improving education financing in Indonesia
achieve this goal is through strategic expansion of the BSM program (Scholarships for the Poor), the first focusof this chapter. Next, as seen in chapters 1 and 2, despite being formally in charge of managing both teachersand schools, district governments spend most of their resources on salaries. Improving teacher management istherefore crucial to liberating the necessary resources for districts to support schools more intensely. Thus thesecond and third sections focus on improving teacher management.
On teacher management, this chapter provides evidence of the magnitude of the inefficiency andinequality introduced by the current distribution of the teaching force, as well as its consequences forequity and quality of schooling. Teacher management is the direct responsibility of district governments but isto a large extent influenced by central government regulations and the incentives associated with transfers. Ourfocus, therefore, is on the overall financing system. While recommendations on general teacher management(from pre-service to career management) are beyond the scope of this report, this chapter provides someconsiderations for how to improve teacher management in terms of efficiency and distribution.
With regard to district management and support of schools," this chapter looks at one of the mostinnovative government programs in education: the provision of funding from district governmentsto schools in block grants. The "BOSDA" (Bantuan Operasional Sekolah Daerah, local school grants) programis one of the main tools districts have to support schools; it is similar to BOS, but experiments with differentformulas and provides more intensive support and supervision.Taking advantage of a rich dataset for a nationallyrepresentative cross section of schools, this section draws some conclusions about the effectiveness of theprogram and the implications for improving school-based management. The last section seeks to tie togethervarious lessons to offer possibilities for improving district management.
Improving and expanding existing programs:Scholarships for the poor5 9
Scholarships for the poor are critical to increasing enrollment. Poor household education expendituresare larger than expected and are particularly expensive for junior and senior secondary students, resulting inalarmingly high drop-out rates, mostly during transition years. Currently, the Bontuon Siswo Miskin (BSM) programis limited in its ability to provide real protection or incentives for continuous education to poor and vulnerablehouseholds.
Problems with BSM are related to the amount of the scholarship, the timing of disbursement and its poortargeting. BSM amounts are not commensurate with the true costs of education, especially in senior secondaryeducation (Figure 62). BSM cash benefits are typically received one year or more after a child has enrolled in andattended a grade; BSM is unavailable to most eligible students who are making the transition from primary tojunior secondary or from junior to senior secondary; and BSM is one of the least-progressively targeted socialassistance programs in Indonesia, meaning that non-poor and non-vulnerable households have received nearlyan equal share of total BSM benefits as poor and vulnerable households. Furthermore, only a very small portionof total BSM expenditures are used for safeguarding and support operations, such as targeting, socialization,facilitation, monitoring and evaluation, and complaints and grievances, leading to under-provision of most ofthe activities and services that could help more households and educators use the BSM system more effectively.
58 Bruns, Filmer and Patrinos (2011), Making Schools Work: New Evidence on Accountability Reforms59 This section is based on the executive summary of Alatas and Jellema (2012), "Cash Transfers for Poor Students,' background paper for
the report on Protecting Poor and Vulnerable Households in Indonesia (World Bank 2011). The cost calculations, not included in thecited paper, were carried out in conjunction with the authors of the background paper.
U
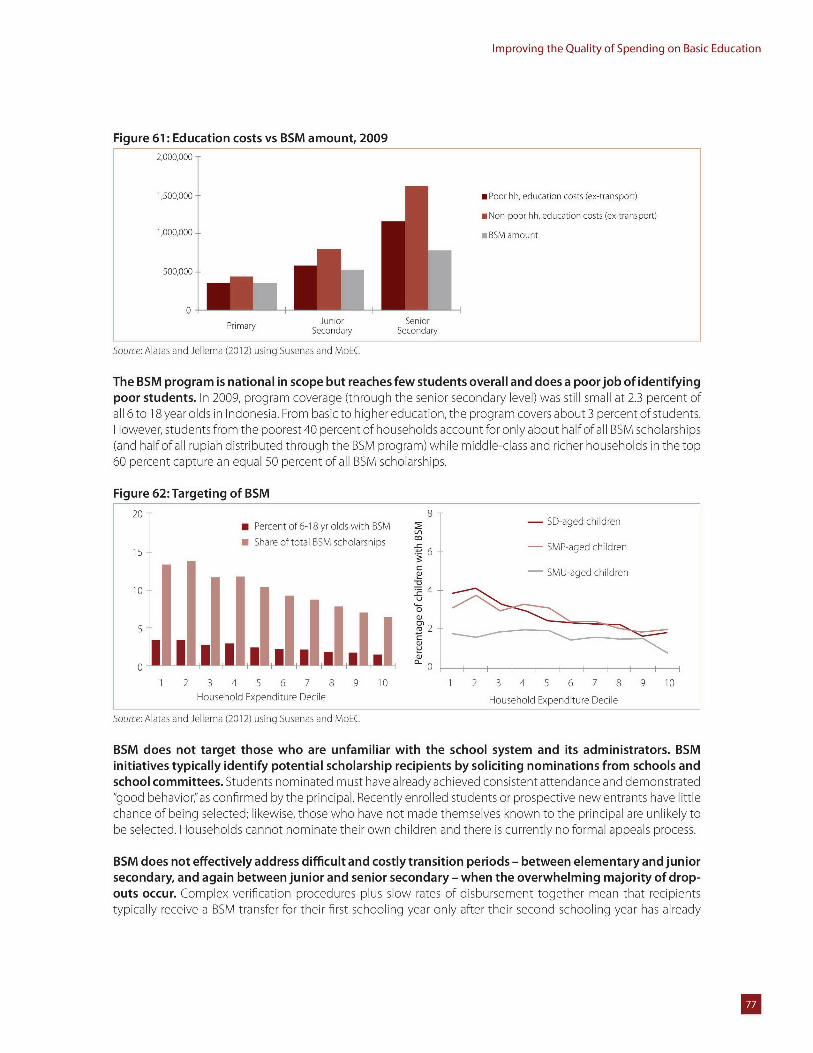
Improving the Quality of Spending on Basic Education
Figure 61: Education costs vs BSM amount, 20092,000,000
1,500,000 H Poor hh, education costs (ex-transport)
H Non-poor hh, education costs (ex-trans port)
1,000,000 BSM amount
500,000
0
Primary Junior SeniorSecondary Secondary
Source: Alatas and Jel ema (2012) using Susenas and MoEC
The BSM program is national in scope but reaches few students overall and does a poor job of identifyingpoor students. In 2009, program coverage (through the senior secondary level) was still small at 2.3 percent ofall 6to I8 year olds in Indonesia. From basic to higher education, the program covers about 3 percent of students.However, students from the poorest 40 percent of households account for only about half of all BSM scholarships(and half of all rupiah distributed through the BSM program) while middle-class and richer households in the top60 percent capture an equal 50 percent of all BSM scholarships.
Figure 62:Targeting of BSM20 -- 8 --
2 Percent of6-18 yr olds with BSM 8 - SD-aged children
15 -U- a Share of tota BSM scholarships M6 - SMP-aged chidrenIl SMU-aged children
Houseo d EpendiureDcileousehld-Exendr Dciden
10-4
0
0- 111, Ul a. 0 1 ,
1 2 3 4 5 6 7 8 9 10 1 2 3 4 5 6 7 8 9 10Household Expenditure Decile Household Expenditure Decile
Source: Alatas and Jel ema (2012) using Susenas and MoEC
BSM does not target those who are unfamiliar with the school system and its administrators. BSMinitiatives typically identify potential scholarship recipients by soliciting nominations from schools andschool committees. Students nominated must have already achieved consistent attendance and demonstrated"good behavior,"as confirmed by the principal. Recently enrolled students or prospective new entrants have littlechance of being selected; likewise, those who have not made themselves known to the principal are unlikely tobe selected. Households cannot nominate their own children and there is currently no formal appeals process.
BSM does not effectively address difficult and costly transition periods - between elementary and juniorsecondary, and again between junior and senior secondary - when the overwhelming majority of drop-outs occur. Complex verification procedures plus slow rates of disbursement together mean that recipientstypically receive a BSM transfer for their first schooling year only after their second schooling year has already
U
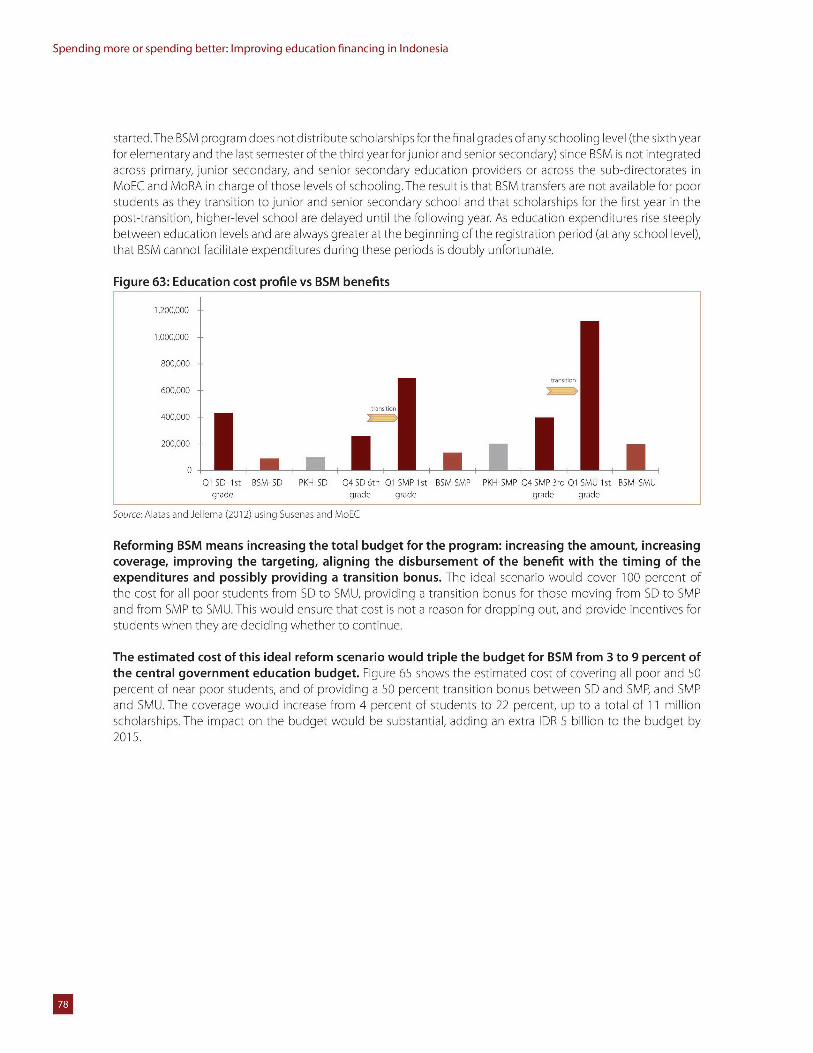
Spending more or spending better: Improving education financing in Indonesia
started.The BSM program does not distribute scholarships forthe final grades of any schooling level (the sixth yearfor elementary and the last semester of the third year forjunior and senior secondary) since BSM is not integratedacross primary, junior secondary, and senior secondary education providers or across the sub-directorates inMoEC and MoRA in charge of those levels of schooling.The result is that BSM transfers are not available for poorstudents as they transition to junior and senior secondary school and that scholarships for the first year in thepost-transition, higher-level school are delayed until the following year. As education expenditures rise steeplybetween education levels and are always greater at the beginning of the registration period (at any school level),that BSM cannot facilitate expenditures during these periods is doubly unfortunate.
Figure 63: Education cost profile vs BSM benefits
1,200,000
1,000,000
800,000
transition
600,000
trans iin
400,000
200,000
0
01 SD- 1st BSM-SD PKH-SD Q4 SD 6th 01 SMP 1st BSM-SMP PKH-5MP Q4 SMP 3rd Q1 SMU 1st BSM-SMUgrade grade grade grade grade
Source: Alatas and Jellema (2012) using Susenas and MoEC
Reforming BSM means increasing the total budget for the program: increasing the amount, increasingcoverage, improving the targeting, aligning the disbursement of the benefit with the timing of theexpenditures and possibly providing a transition bonus. The ideal scenario would cover 100 percent ofthe cost for all poor students from SD to SMU, providing a transition bonus for those moving from SD to SMPand from SMP to SMU. This would ensure that cost is not a reason for dropping out, and provide incentives forstudents when they are deciding whether to continue.
The estimated cost of this ideal reform scenario would triple the budget for BSM from 3 to 9 percent ofthe central government education budget. Figure 65 shows the estimated cost of covering all poor and 50percent of near poor students, and of providing a 50 percent transition bonus between SD and SMP, and SMPand SMU. The coverage would increase from 4 percent of students to 22 percent, up to a total of 11 millionscholarships. The impact on the budget would be substantial, adding an extra IDR 5 billion to the budget by2015.
U
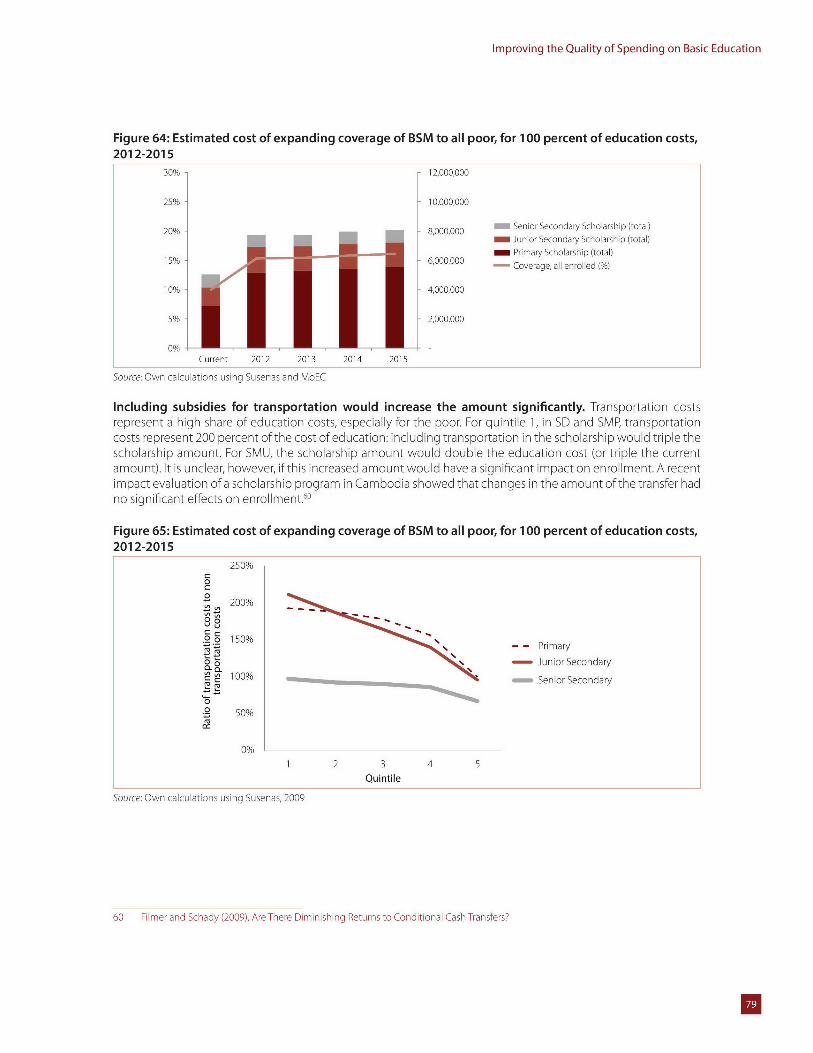
Improving the Quality of Spending on Basic Education
Figure 64: Estimated cost of expanding coverage of BSM to all poor, for 100 percent of education costs,2012-2015
30% - 12,000,000
25% 10,000,000
20% -8,000,000 IIIII Senior Secondary Scholarship (total)M Junior Secondary Scholarship (total)
Primary Scholarship (total)15% 6,000,000 - Coverage, all enrolled (%)
10% 4,000,000
5% 2,000,000
0%Current 2012 2013 2014 2015
Source: Own calculations using Susenas and MoEC
Including subsidies for transportation would increase the amount significantly. Transportation costsrepresent a high share of education costs, especially for the poor. For quintile 1, in SD and SMP, transportationcosts represent 200 percent of the cost of education: including transportation in the scholarship would triple thescholarship amount. For SMU, the scholarship amount would double the education cost (or triple the currentamount). It is unclear, however, if this increased amount would have a significant impact on enrollment. A recentimpact evaluation ofa scholarship program in Cambodia showed that changes in the amount ofthe transfer hadno significant effects on enrollment.60
Figure 65: Estimated cost of expanding coverage of BSM to all poor, for 100 percent of education costs,2012-2015
250%
0C0
200%
00
208 150%'- - Primary
o0 - Junior Secondary
y 100% . - Senior Secondary
0
0 50%
0%
1 2 3 4 5Quintile
Source: Own calculations using Susenas, 2009
60 Filmer and Schady (2009), Are There Diminishing Returns to Conditional Cash Transfers?
U
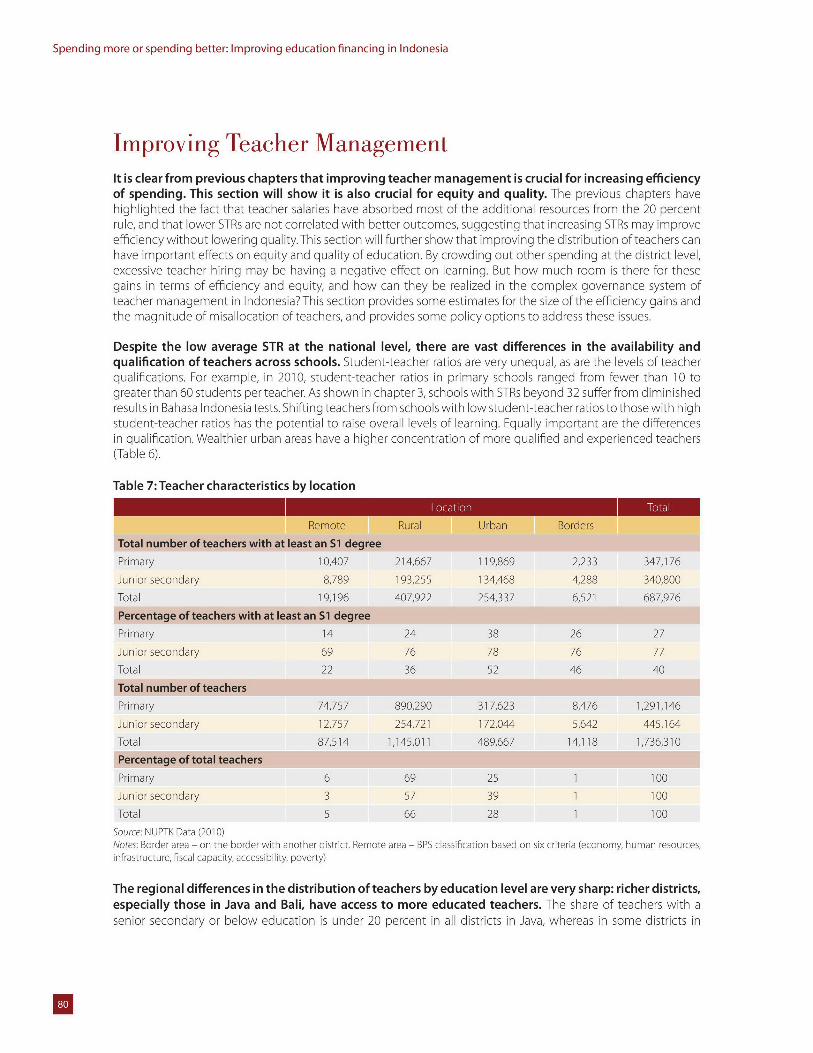
Spending more or spending better: Improving education financing in Indonesia
Improving Teacher ManagementIt is clear from previous chapters that improving teacher management is crucial for increasing efficiencyof spending. This section will show it is also crucial for equity and quality. The previous chapters havehighlighted the fact that teacher salaries have absorbed most of the additional resources from the 20 percentrule, and that lower STRs are not correlated with better outcomes, suggesting that increasing STRs may improveefficiency without lowering quality.This section will further show that improving the distribution of teachers canhave important effects on equity and quality of education. By crowding out other spending at the district level,excessive teacher hiring may be having a negative effect on learning. But how much room is there for thesegains in terms of efficiency and equity, and how can they be realized in the complex governance system ofteacher management in Indonesia? This section provides some estimates for the size of the efficiency gains andthe magnitude of misallocation of teachers, and provides some policy options to address these issues.
Despite the low average STR at the national level, there are vast differences in the availability andqualification of teachers across schools. Student-teacher ratios are very unequal, as are the levels of teacherqualifications. For example, in 2010, student-teacher ratios in primary schools ranged from fewer than 10 togreater than 60 students per teacher. As shown in chapter 3, schools with STRs beyond 32 suffer from diminishedresults in Bahasa Indonesia tests. Shifting teachers from schools with low student-teacher ratios to those with highstudent-teacher ratios has the potential to raise overall levels of learning. Equally important are the differencesin qualification. Wealthier urban areas have a higher concentration of more qualified and experienced teachers(Table 6).
Table 7: Teacher characteristics by location
Remote Rural Urban Borders
Total number of teachers with at least an S1 degree
Primary 10,407 214,667 119,869 2,233 347,176
Junior secondary 8,789 193,255 134,468 4,288 340,800
Total 19,196 407,922 254,337 6,521 687,976Percentage of teachers with at least an S1 degree
Primary 14 24 38 26 27
Junior secondary 69 76 78 76 77
Total 22 36 52 46 40
Total number of teachers
Primary 74,757 890,290 317,623 8,476 1,291,146
Junior secondary 12,757 254,721 172,044 5,642 445,164
Total 87,514 1,145,011 489,667 14,118 1,736,310Percentage of total teachers
Primary 6 69 25 1 100
Junior secondary 3 57 39 1 100
Total 5 66 28 1 100Source: NUPTK Data (2010)Notes: Border area - on the border with another district, Remote area - BPS classification based on six criteria (economy, human resources,infrastructure, fiscal capacity, accessibility, poverty)
The regional differences in the distribution of teachers by education level are very sharp: richer districts,especially those in Java and Bali, have access to more educated teachers. The share of teachers with asenior secondary or below education is under 20 percent in all districts in Java, whereas in some districts in
U
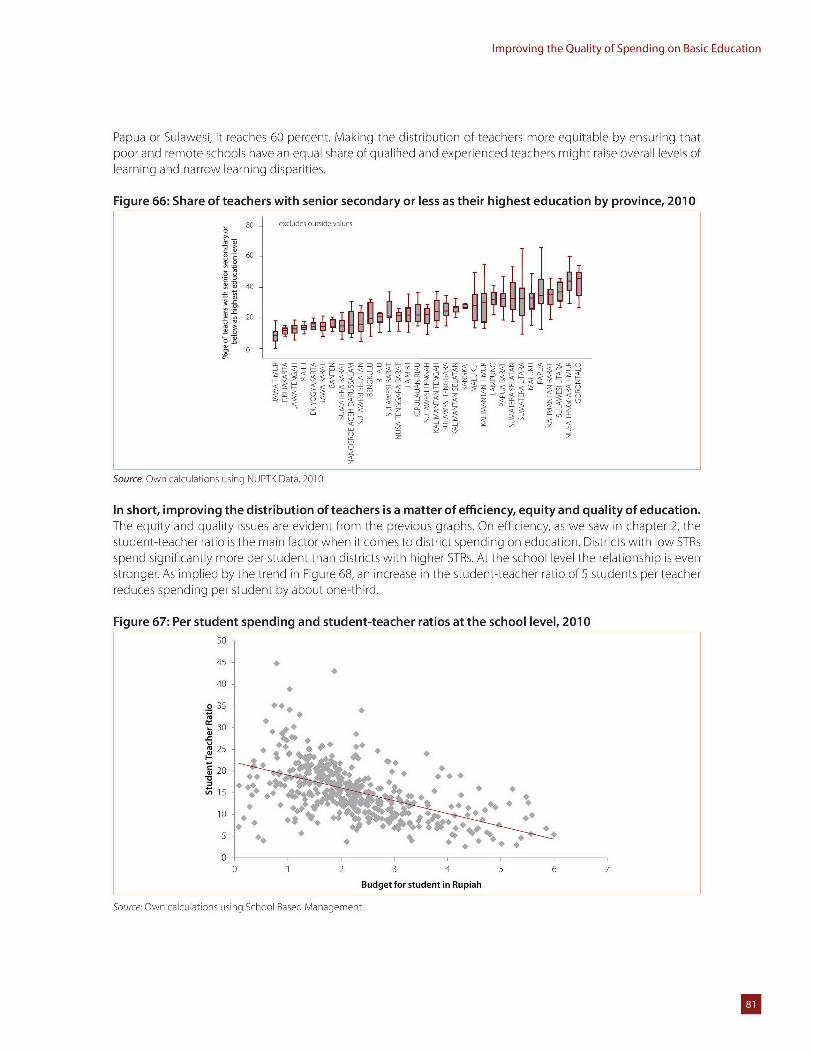
Improving the Quality of Spending on Basic Education
Papua or Sulawesi, it reaches 60 percent. Making the distribution of teachers more equitable by ensuring thatpoor and remote schools have an equal share of qualified and experienced teachers might raise overall levels oflearning and narrow learning disparities.
Figure 66: Share of teachers with senior secondary or less as their highest education by province, 2010
80 _ excludes outsidevalues
0 60
40
o
Source:< ~ Ow acuainsuigNUT at,21
400
:it E OZ o
In short, improving the distribution of teachers is a matter of efficiency, equity and quality of education.The equity and quality issues are evident from the previous graphs. On efficiency, as we saw in chapter 2, thestudent-teacher ratio is the main factor when it comes to district spending on education. Districts with low STRsspend significantly more per student than districts with higher STRs. At the school level the relationship is evenstronger. As implied by the trend in Figure 68, an increase in the student-teacher ratio of 5 students per teacherreduces spending per student by about one-third.
Figure 67: Per student spending and student-teacher ratios at the school level, 201050
45 -
40
.o 35
-30
5
310 < t:5
00 1 2 3 4 5 6 7
Budget for student in Rupiah
Source: Own calculations using School Based Management.
U
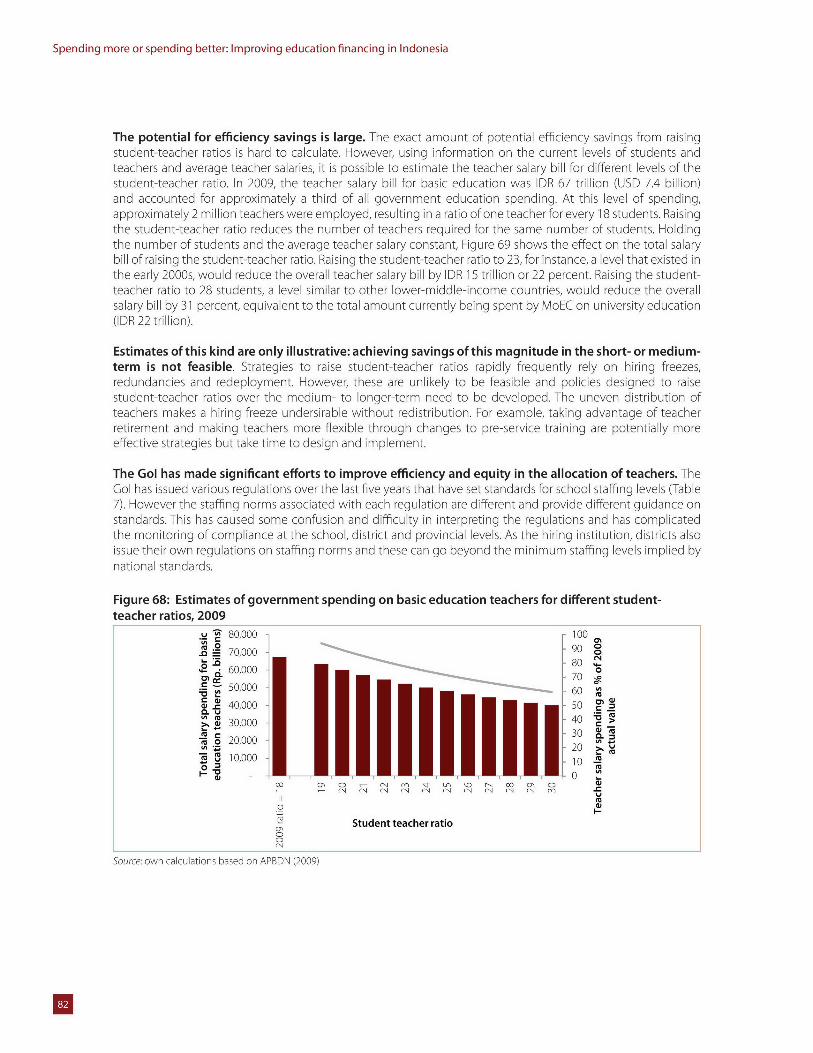
Spending more or spending better: Improving education financing in Indonesia
The potential for efficiency savings is large. The exact amount of potential efficiency savings from raisingstudent-teacher ratios is hard to calculate. However, using information on the current levels of students andteachers and average teacher salaries, it is possible to estimate the teacher salary bill for different levels of thestudent-teacher ratio. In 2009, the teacher salary bill for basic education was IDR 67 trillion (USD 7.4 billion)and accounted for approximately a third of all government education spending. At this level of spending,approximately 2 million teachers were employed, resulting in a ratio of one teacher for every 18 students. Raisingthe student-teacher ratio reduces the number of teachers required for the same number of students. Holdingthe number of students and the average teacher salary constant, Figure 69 shows the effect on the total salarybill of raising the student-teacher ratio. Raising the student-teacher ratio to 23, for instance, a level that existed inthe early 2000s, would reduce the overall teacher salary bill by DR 15 trillion or 22 percent. Raising the student-teacher ratio to 28 students, a level similar to other lower-middle-income countries, would reduce the overallsalary bill by 31 percent, equivalent to the total amount currently being spent by MoEC on university education(IDR 22 trillion).
Estimates of this kind are only illustrative: achieving savings of this magnitude in the short- or medium-term is not feasible. Strategies to raise student-teacher ratios rapidly frequently rely on hiring freezes,redundancies and redeployment. However, these are unlikely to be feasible and policies designed to raisestudent-teacher ratios over the medium- to longer-term need to be developed. The uneven distribution ofteachers makes a hiring freeze undersirable without redistribution. For example, taking advantage of teacherretirement and making teachers more flexible through changes to pre-service training are potentially moreeffective strategies but take time to design and implement.
The Gol has made significant efforts to improve efficiency and equity in the allocation of teachers. TheGol has issued various regulations over the last five years that have set standards for school staffing levels (Table7). However the staffing norms associated with each regulation are different and provide different guidance onstandards. This has caused some confusion and difficulty in interpreting the regulations and has complicatedthe monitoring of compliance at the school, district and provincial levels. As the hiring institution, districts alsoissue their own regulations on staffing norms and these can go beyond the minimum staffing levels implied bynational standards.
Figure 68: Estimates of government spending on basic education teachers for different student-teacher ratios, 2009
80,000 100
IIIIIIIIo,oo80 !
. 60,000 8070
50000w ~40,000 50 r
40 *S30,00030
7i 0 20,000
0
I-_ CD 0' M ,-0 r 0 ' Cr1 1 N _ 1 C11 r _
C Student teacher ratio0
Source: own calculations based on APBDN 120091
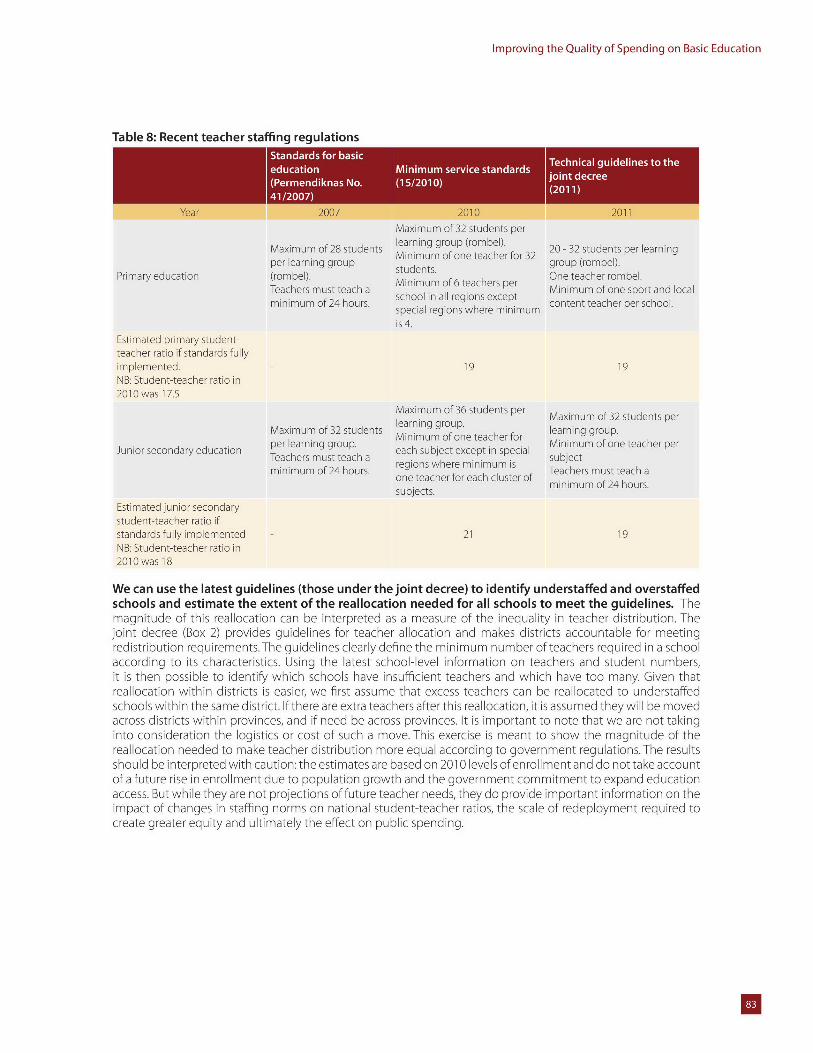
Improving the Quality of Spending on Basic Education
Table 8: Recent teacher staffing regulations
MStandards for basicTeh iagudln st t e
(Permendiknas No. (521)(0141/2007)
Year 2007 2010 2011
Maximum of 32 students per
Maximum of 28 students learning group (rombel). 20-3stdnsprlaigper learning group group (rombel).
Primary education (rombel). students. One teacher rombel.Teachers must teach a Minimum of6 teachers per Minimum ofone sport and local
minimu of 24hours. school in all regions 'except cotntehrprsholminimumspecial regions where minimum
is4.Estimated primary student-teacher ratio if standards fullyimplemented. 19 19NB: Student-teacher ratio in2010 was 17.5
Maximum of 36 students per Maximum of 32 students per
Juniorsecondry edcatilnparninrninggroupMaximum of 32 students Merinmumrofunptahe. o learning group.per learning group. Miimmecet ece fo Minimum of one teacher per
Junior secondary education Teachers must teach a regionsubwheep inu speislsbjcminimum of24 hours. Teachers must teach a
one teacher for each cluster of mnmmo 4hussubjects.m
Estimated junior secondarystudent-teacher ratio ifstandards fully implemented - 21 19NB: Student-teacher ratio in2010Owas 18
We can use the latest guidelines (those under the joint decree) to identify understaffed and overstaffedschools and estimate the extent of the reallocation needed for all schools to meet the guidelines. Themagnitude of this reallocation can be interpreted as a measure of the inequality in teacher distribution. Thejoint decree (Box 2) provides guidelines for teacher allocation and makes districts accountable for meetingredistribution requirements. The guidelines clearly define the minimum number of teachers required in a schoolaccording to its characteristics. Using the latest school-level information on teachers and student numbers,it is then possible to identify which schools have insufficient teachers and which have too many. Given thatreallocation within districts is easier, we first assume that excess teachers can be reallocated to understaffedschools within the same district. If there are extra teachers after this reallocation, it is assumed they will be movedacross districts within provinces, and if need be across provinces, It is important to note that we are not takinginto consideration the logistics or cost of such a move. This exercise is meant to show the magnitude of thereallocation needed to make teacher distribution more equal according to government regulations. The resultsshould be interpreted with caution: the estimates are based on 2010 levels of enrollment and do not take accountof a future rise in enrollment due to population growth and the government commitment to expand educationaccess. But while they are not projections of future teacher needs, they do provide important information on theimpact of changes in staffing norms on national student-teacher ratios, the scale of redeployment required tocreate greater equity and ultimately the effect on public spending.
regon whreminmu i
Spending more or spending better: Improving education financing in Indonesia
Box 2: The joint decree for teacher management
In late 2011, a joint regulation was issued that provided guidelines to provinces and districts on restructuring and redistributinggovernment-employed teachers. The decree was designed to exert some control over civil service teacher recruitment andimprove the current distribution of teachers. The regulation was issued by five ministries collectively responsible for settingguidelines for the management of government teachers.
The decree and accompanying guidelines provide a set of staffing standards to apply to the allocation of government teachersacross schools. The decree instructs districts and provinces to collect the data necessary to identify the degree of redistributionand hiring required to achieve the standards, develop a detailed plan on how to redistribute teachers and finally to implementthis plan. Where redistribution requires teacher transfer across districts or provinces, the Ministry of Education and Culture isresponsible for coordination among local governments. The Ministries of Education and of Religious Affairs evaluate district andprovincial plans for teacher redistribution.These evaluations are then passed on to key central ministries (e.g. Ministry of Finance,MenPAN) to help determine hiring levels for government teachers and consequently the size of intergovernmental budgetarytransfers.
Local governments failing to adhere to their obligations under the joint decree face a number of sanctions. The Ministry ofEducation and Culture can withhold education assistance (e.g. BOS) as well as make recommendations to other joint decreeministries to:* Refuse to issue 'formasi' to allow the recruitment of new government teachers (Ministry for Government Apparatus
Empowerment and Bureaucratic Reforms or MenPAN)* Delay intergovernmental budget transfers (Ministry of Finance)* Issue a poor local government performance assessment (Ministry of Home Affairs)
Challenges in redeploying teachers under the joint decree
Local governments need to make plans to ensure that all schools meet the staffing standards outlined in the joint decree. Thereare two main strategies:* employ more teachers to fill posts in schools with teacher deficits.* transfer teachers to teacher deficit schools from schools that have an excess according to the standards.
Clearly employing more teachers will further increase the size of the teaching force and lead to greater inefficiencies in educationspending. The joint decree is able to influence local government hiring decisions for civil servant (PNS) teachers through theannual quota set by MenPAN and MoF.6 1 Where districts already have sufficient teachers to cover the standards outlined, thedecree could be used to restrict further hiring of PNS teachers and encourage local governments to address inequalities in teacherdistribution from their current teaching force. What would the implication be for teacher redistribution if local governmentstransfer teachers in order to comply with national standards rather than resorting to increased hiring?
Under the technical guidelines of the joint decree, the number of teachers necessary for current levelsof provision is smaller than the existing teaching force. There are large mismatches in the existing stockof teachers in primary and junior secondary schools. At the primary level, the number of teachers required isapproximately 100,000 less than existing levels. Breaking down primary school teacher requirements by subjecthighlights large surpluses in class-based teachers and shortages in physical education and religion teachers.For example, fulfilling the joint decree would require only 1.1 million class-based teachers compared to the 1.3million currently teaching in the system. On the other hand, the estimates point to a deficit of approximately60,000 sports teachers. A similar picture emerges at the junior secondary level: based on the joint decree, thereis a large surplus of Bahasa Indonesia and religion teachers and a deficit of computer, local content and civicsteachers.
61 Kluyskens and Firdaus (2009), Teacher management: Recruitment, Selection and Data, Probation and Transfer.
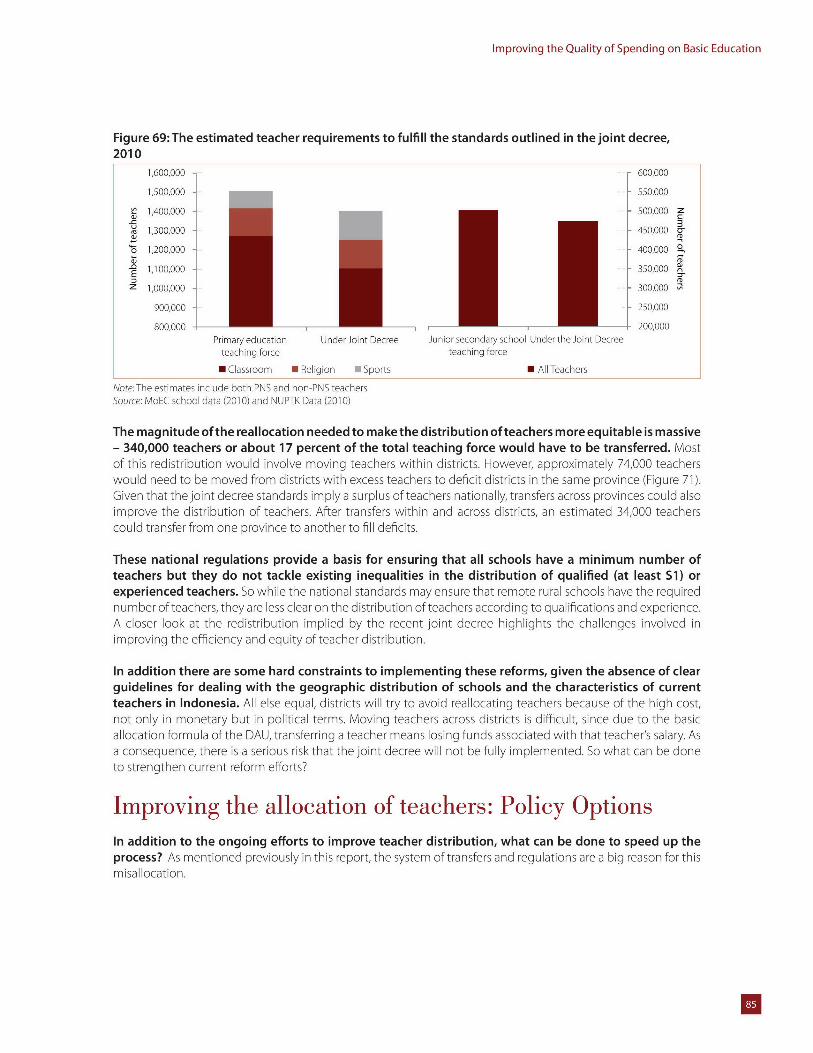
Improving the Quality of Spending on Basic Education
Figure 69:The estimated teacher requirements to fulfill the standards outlined in the joint decree,2010
1,600,000 600,000
1,500,000 550,000
S1,400,000 500,000 z
1,300,000 450,000
16 1,200,000 400,000 0,
-0 1,100,000 350,000EZ 1,000,000 300,000
900,000 250,000
800,000 ________ 200,000Primary education Under Joint Decree Junior secondary school Under the Joint Decree
teaching force teaching force
0 Classroom 0 Religion * Sports m All Teachers
Note:The estimates include both PNS and non-PNS teachersSource: MoEC school data (2010) and NUPTK Data (2010)
The magnitude of the reallocation needed to make the distribution of teachers more equitable is massive- 340,000 teachers or about 17 percent of the total teaching force would have to be transferred. Mostof this redistribution would involve moving teachers within districts. However, approximately 74,000 teacherswould need to be moved from districts with excess teachers to deficit districts in the same province (Figure 71).Given that the joint decree standards imply a surplus of teachers nationally, transfers across provinces could alsoimprove the distribution of teachers. After transfers within and across districts, an estimated 34,000 teacherscould transfer from one province to another to fill deficits.
These national regulations provide a basis for ensuring that all schools have a minimum number ofteachers but they do not tackle existing inequalities in the distribution of qualified (at least S1) orexperienced teachers. So while the national standards may ensure that remote rural schools have the requirednumber of teachers, they are less clear on the distribution of teachers according to qualifications and experience.A closer look at the redistribution implied by the recent joint decree highlights the challenges involved inimproving the efficiency and equity of teacher distribution.
In addition there are some hard constraints to implementing these reforms, given the absence of clearguidelines for dealing with the geographic distribution of schools and the characteristics of currentteachers in Indonesia. All else equal, districts will try to avoid reallocating teachers because of the high cost,not only in monetary but in political terms. Moving teachers across districts is difficult, since due to the basicallocation formula of the DAU, transferring a teacher means losing funds associated with that teacher's salary. Asa consequence, there is a serious risk that the joint decree will not be fully implemented. So what can be doneto strengthen current reform efforts?
Improving the allocation of teachers: Policy OptionsIn addition to the ongoing efforts to improve teacher distribution, what can be done to speed up theprocess? As mentioned previously in this report, the system of transfers and regulations are a big reason for thismisallocation.
U
Spending more or spending better: Improving education financing in Indonesia
Breaking the link between central government transfers and teacher hiring
The current system for hiring PNS teachers creates strong incentives for local governments to continueto increase the size of their teaching force and accelerate the conversion of contract teachers to PNSstatus. At present, intergovernmental resource transfers are partly determined by the size of a local government'spayroll. Districts with larger numbers of civil servants receive more from the transfer system. Professional andfunctional allowances for teachers are also paid from the center and not out of local government budgets. It hasbeen estimated that central government transfers cover approximately 75 percent of the salary of an additionalcivil servant or PNS teacher. This in effect subsidizes the cost of additional teachers and creates incentives forincreased hiring.These incentives combine with strong political motivations at the local level to increase the sizeof the civil service.
Controlling the demand for increased civil service employment are MenPAN and the Ministry of Finance,which set quotas for civil service hiring. Quotas are set annually by considering local government requestsfor additional staff and the current budget situation. MenPAN's actual process for determining quotas remainsunclear.62 However, the process usually results in provincial and district governments receiving fewer posts thanthey requested. This creates incentives for local governments to exaggerate their actual needs, knowing thatthey will receive only a fraction of their initial request.
In order to contain the growth of the teaching force, local governments must face the true cost of hiringteachers. The joint decree provides a reporting mechanism to contain teacher hiring excesses. Combining thisreporting mechanism with a transparent and improved system of setting quotas for civil service hiring couldgo some way to improving teacher hiring decisions.63 However, improving transparency and evaluating localgovernment staffing plans effectively at the central level is likely to be difficult. MoEC will need to evaluatestaffing plans from 33 provinces covering over 500 districts, more than 300,000 schools and over 2 millionteachers. Attempting to contain hiring in this way is also a second-best solution, in that it attempts to allocatenew teaching posts more effectively from the center rather relying on district governments to address thecomplications of determining the size of the national teaching force.
A more direct approach to eliminating incentives for over-hiring would be to break the link betweenintergovernmental transfers and teacher hiring. Key to this would be the elimination of the link betweenthe size of the civil service and the size of a local government's DAU allocation. However, removing the BasicAllocation element from the DAU formula may not guarantee an automatic change in district behavior when itcomes to teacher hiring decisions. During the last decade, districts have opted mainly to use additional resourcesto hire more teachers, motivated not only by financial consideratons (the majority of salary expenses beingcovered by the DAU transfer) but also by political reasons. DAU reform should not be viewed as a panacea forimproving teacher hiring practices at the district level, however addressing the existing DAU issue is an importantstep toward holding districts accountable for their decisions and improving overall education spendingefficiency. Transferring responsibility for paying professional and functional allowances from the central to localgovernments would be an additional step toward improving efficiency, allowing local governments to bear thereal cost of teacher employment.
62 Kluyskens and Firdaus (2009), Teacher management: Recruitment, Selection and Data, Probation and Transfer.63 For example, quotas for teachers could be based on national staffing standards and district school age populations rather than local
government assessments of teacher need.
U
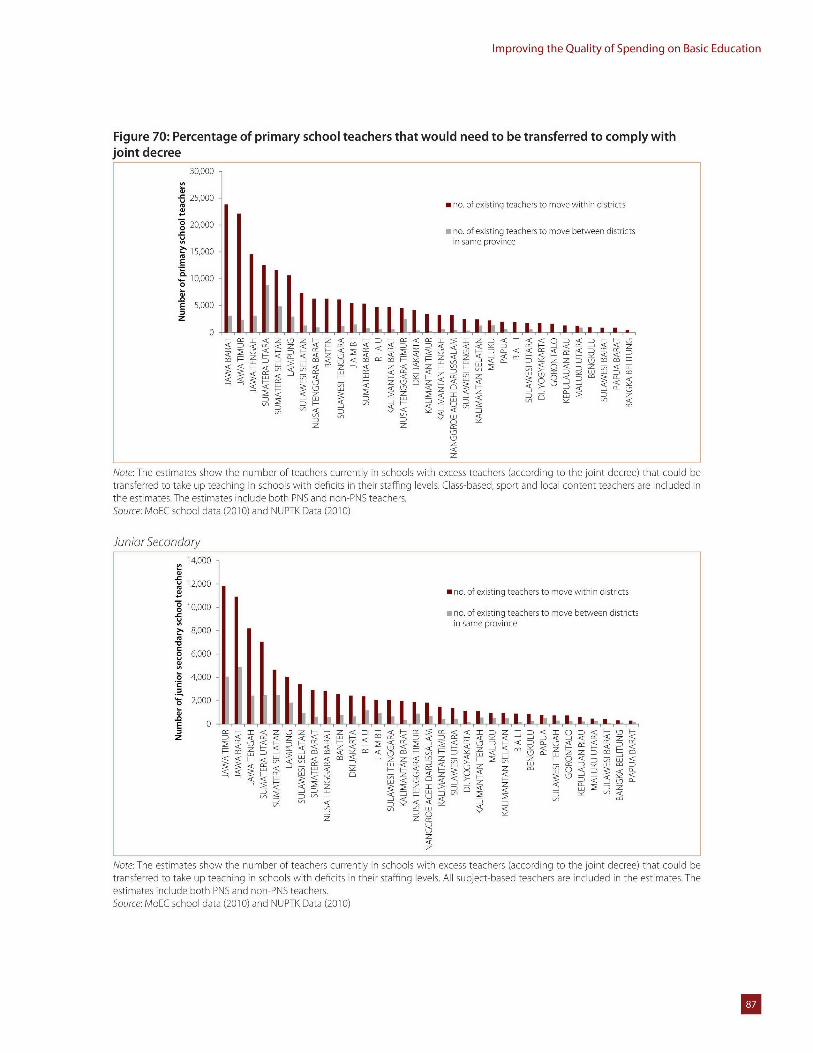
Improving the Quality of Spending on Basic Education
Figure 70: Percentage of primary school teachers that would need to be transferred to comply withjoint decree
30,000 -
.- 25,000 -2 no. of existing teachers to move with n districts
0 S20,000 no. of exist ng teachers to move between districtsin same province
15,000
10,0000
5,000 I< L.hLI...l< <.....
< < < < < <
Z Z< <
D < m < ~a tam D <
DD <tz z
Note: The estimates show the number of teachers currently in schools with excess teachers (according to the joint decree) that could betransferred to take up teaching in schools with deficits in their staffing levels. Class-based, sport and local content teachers are included inthe estimates.The estimates inc ude both PNS and non-PNS teachers.Source: MoEC school data (2010) and NUPTK Data (2010)
Junior Secondary14,000
12,000m no. of existing teachers to move within districts
10,000- no. ofexisting teachers to move between districtsin same province
8,000
o 6,000
4,000
2,000
L
CZ <ZDatZ
E.0' 200 LLIiL L L LL L LL LIL L LXLso< < -zo~ z < H
esimte icldeboh NSan nn-NStechrs
:5-<< 0 <zD< H D 16at <
- 5 ma: 0m F. a '-t - ' 1
: C s t ( 1 a N (2010)Z<c
so< F- Jz -0
U-- _ O O<z o at< < < <t
Note: Th esiae shwtenme<ftahr urnl col ihecsstaor acrigt h on ere htcudhtransferred~~<: to taeuzecignshoswt eiisi hi tfigees uic-ae ecesaeicue nteetmts h
Nt:estimates nluehothe nme non-N teacherscretyi col ihecs eces(acrigt h on ere htcudb
Soucce: MoEC school data (2010) and NUPTK Data (2010)
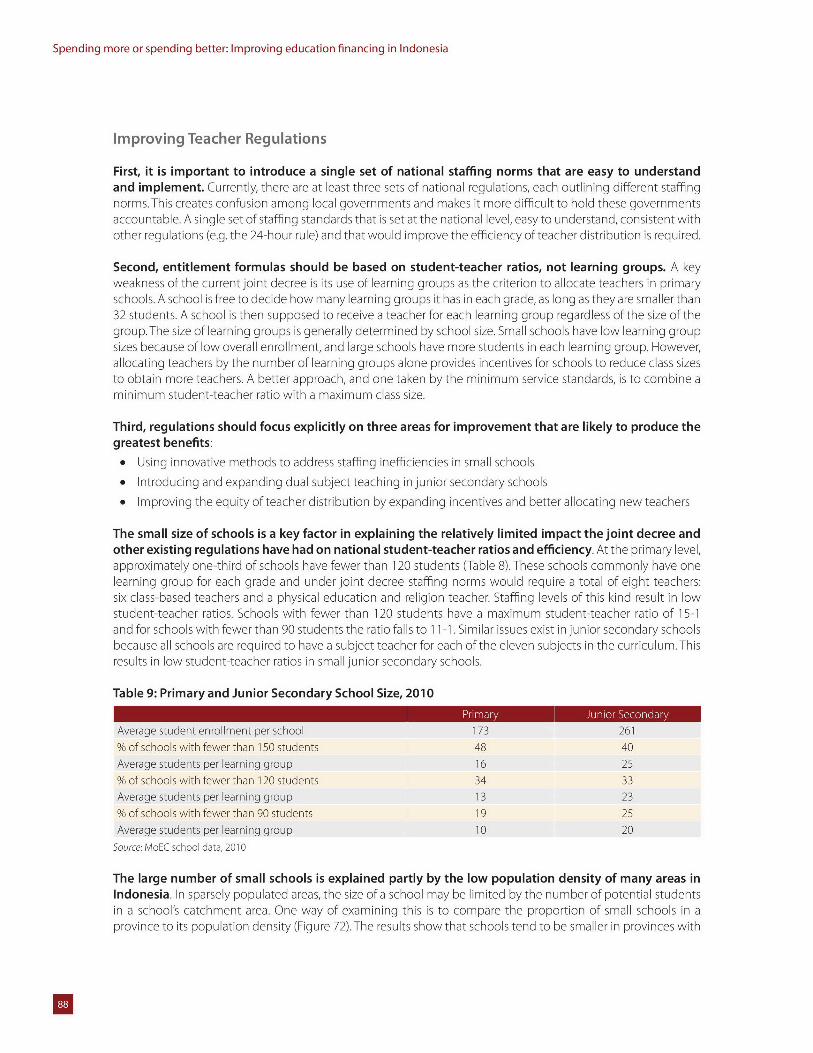
Spending more or spending better: Improving education financing in Indonesia
Improving Teacher Regulations
First, it is important to introduce a single set of national staffing norms that are easy to understandand implement. Currently, there are at least three sets of national regulations, each outlining different staffingnorms.This creates confusion among local governments and makes it more difficult to hold these governmentsaccountable. A single set of staffing standards that is set at the national level, easy to understand, consistent withother regulations (e.g. the 24-hour rule) and that would improve the efficiency of teacher distribution is required.
Second, entitlement formulas should be based on student-teacher ratios, not learning groups. A keyweakness of the current joint decree is its use of learning groups as the criterion to allocate teachers in primaryschools. A school is free to decide how many learning groups it has in each grade, as long as they are smaller than32 students. A school is then supposed to receive a teacher for each learning group regardless of the size of thegroup.The size of learning groups is generally determined by school size. Small schools have low learning groupsizes because of low overall enrollment, and large schools have more students in each learning group. However,allocating teachers by the number of learning groups alone provides incentives for schools to reduce class sizesto obtain more teachers. A better approach, and one taken by the minimum service standards, is to combine aminimum student-teacher ratio with a maximum class size.
Third, regulations should focus explicitly on three areas for improvement that are likely to produce thegreatest benefits:* Using innovative methods to address staffing inefficiencies in small schools* Introducing and expanding dual subject teaching in junior secondary schools* Improving the equity of teacher distribution by expanding incentives and better allocating new teachers
The small size of schools is a key factor in explaining the relatively limited impact the joint decree andother existing regulations have had on national student-teacher ratios and efficiency. At the primary level,approximately one-third of schools have fewer than 120 students (Table 8). These schools commonly have onelearning group for each grade and under joint decree staffing norms would require a total of eight teachers:six class-based teachers and a physical education and religion teacher. Staffing levels of this kind result in lowstudent-teacher ratios. Schools with fewer than 120 students have a maximum student-teacher ratio of 15-1and for schools with fewer than 90 students the ratio falls to 11-1. Similar issues exist in junior secondary schoolsbecause all schools are required to have a subject teacher for each of the eleven subjects in the curriculum. Thisresults in low student-teacher ratios in small junior secondary schools.
Table 9: Primary and Junior Secondary School Size, 2010Junior Secondary
Average student enrollment per school 173 261% of schools with fewer than 150 students 48 40Average students per learning group 16 25% of schools with fewer than 120 students 34 33Average students per learning group 13 23% of schools with fewer than 90 students 19 25Average students per learning group 10 20
Source: MoEC school data, 2010
The large number of small schools is explained partly by the low population density of many areas inIndonesia. In sparsely populated areas, the size of a school may be limited by the number of potential studentsin a school's catchment area. One way of examining this is to compare the proportion of small schools in aprovince to its population density (Figure 72).The results show that schools tend to be smaller in provinces with
U
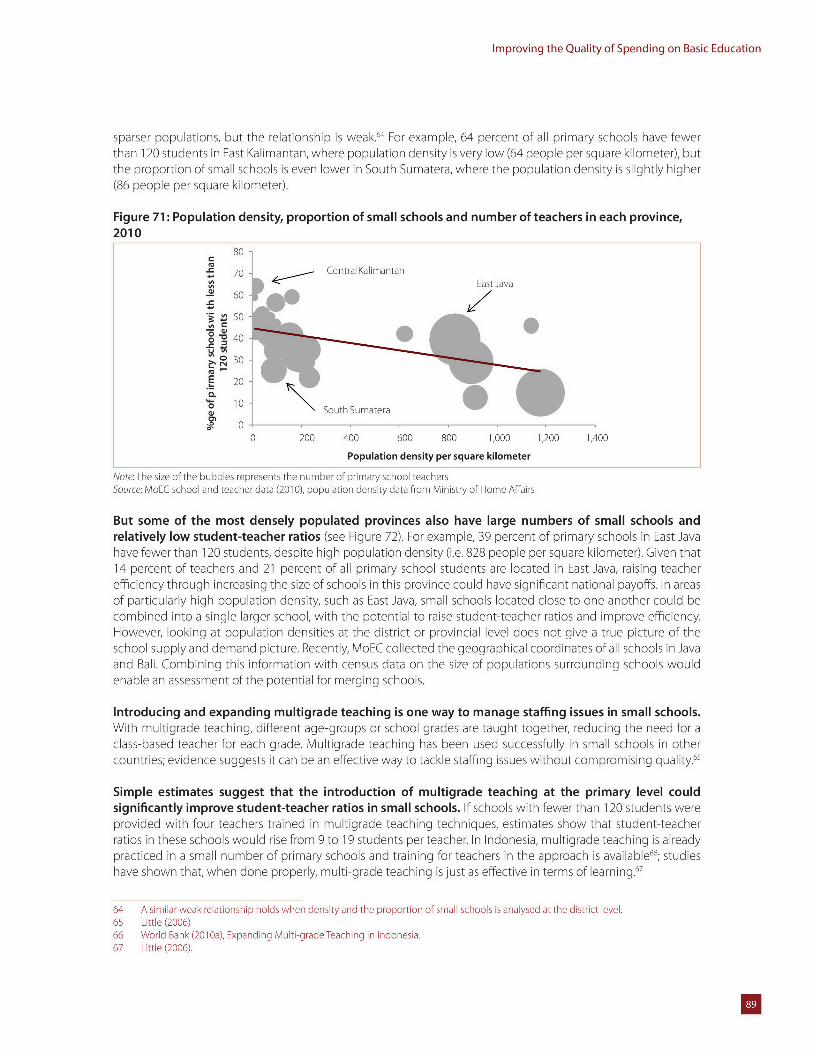
Improving the Quality of Spending on Basic Education
sparser populations, but the relationship is weak.64 For example, 64 percent of all primary schools have fewerthan 120 students in East Kalimantan, where population density is very low (64 people per square kilometer), butthe proportion of small schools is even lower in South Sumatera, where the population density is slightly higher(86 people per square kilometer).
Figure 71: Population density, proportion of small schools and number of teachers in each province,2010
80-
070 Central Kalimantan
60
50
0 ' 400
30
E 20
10South Sumatera
00 200 400 600 800 1,000 1,200 1,400
Population density per square kilometer
Note:The size of the bubbles represents the number of primary school teachersSource: MoEC school and teacher data (2010), population density data from Ministry of Home Affairs
But some of the most densely populated provinces also have large numbers of small schools andrelatively low student-teacher ratios (see Figure 72). For example, 39 percent of primary schools in East Javahave fewer than 120 students, despite high population density (i.e. 828 people per square kilometer). Given that14 percent of teachers and 21 percent of all primary school students are located in East Java, raising teacherefficiency through increasing the size of schools in this province could have significant national payoffs. In areasof particularly high population density, such as East Java, small schools located close to one another could becombined into a single larger school, with the potential to raise student-teacher ratios and improve efficiency.However, looking at population densities at the district or provincial level does not give a true picture of theschool supply and demand picture. Recently, MoEC collected the geographical coordinates of all schools in Javaand Bali. Combining this information with census data on the size of populations surrounding schools wouldenable an assessment of the potential for merging schools.
Introducing and expanding multigrade teaching is one way to manage staffing issues in small schools.With multigrade teaching, different age-groups or school grades are taught together, reducing the need for aclass-based teacher for each grade. Multigrade teaching has been used successfully in small schools in othercountries; evidence suggests it can be an effective way to tackle staffing issues without compromising quality.65
Simple estimates suggest that the introduction of multigrade teaching at the primary level couldsignificantly improve student-teacher ratios in small schools. If schools with fewer than 120 students wereprovided with four teachers trained in multigrade teaching techniques, estimates show that student-teacherratios in these schools would rise from 9 to 19 students per teacher. In Indonesia, multigrade teaching is alreadypracticed in a small number of primary schools and training for teachers in the approach is available 66; studieshave shown that, when done properly, multi-grade teaching is just as effective in terms of learning.67
64 A similar weak relationship holds when density and the proportion of small schools is analysed at the district level.65 Little (2006)66 World Bank (2010a), Expanding Multi-grade Teaching in Indonesia.67 Little (2006).
U
Spending more or spending better: Improving education financing in Indonesia
In junior secondary schools, the introduction of dual or cluster subject teachers could improve theefficiency of staffing. Current staffing norms require junior secondary schools to have one teacher for eachsubject, and teachers can only be accredited in one subject. In small schools, these standards result in lowstudent-teacher ratios, and also make it difficult for teachers to fulfill their commitment to teach 24 hoursper week. Allowing teachers to be accredited in more than one subject would be a significant step towardimproving staffing, particularly in small schools.To ensure that the quality of education is not adversely affected,appropriate training opportunities and accreditation procedures would be required to facilitate the conversionof teachers into dual subject teachers.
In addition, any measures to improve teacher distribution must address existing inequities byexpandingefforts on behalf of hard-to-staff schools. Inequalities in teacher distribution reinforce existing patterns ofdisadvantage and must be addressed if disparities in education outcomes are to narrow. The underlying causeof this unequal distribution is that many teachers do not want to teach in poor and remote communities. Thisreluctance is driven by concerns regarding the schooling of their own children, accommodations and living inunfamiliar areas. The result is that poor remote areas frequently have fewer teachers than required and teacherswho are less well qualified than those in urban areas. Salary allowances and other incentives do exist to attractteachers to more remote areas, however despite the size of these allowances (which effectively double the basesalary), take up is low and inequality in the distribution of teachers persists.68 Complementary policies may beneeded to deal with these shortages.
International experience with incentives for remote areas is mixed, and there is no strong evidencethat supports their effectiveness.6" This may be due to lack of clarity regarding the length of theassignment or the rules for returning to one's former region. Clarifying these rules may help. In addition,MoEC is introducing new programs to attract high-performing senior secondary students from areas with a lowavailability of teachers into the teaching profession. One program heavily subsidizes the cost of their teachingdegrees if they agree to return to their place of origin to teach. Another provides the opportunity for younghigh-performing higher education graduates to teach in remote areas for two years. Many of these initiativesare promising, but they are still small and uncoordinated. In addition, as central government programs, theyrun into the usual coordination problems between central and regional governments. However, if shown to besuccessful, they may well be worth expanding.
There are also positive experiences with teacher management and redistribution at the district level.Gorantalo district, for instance, introduced a successful policy in 2006, employing only teachers who agreed tobe posted to schools that required their particular skill set.Teachers were also offered an eight-year contract thatstipulated they could be redeployed within the district based on staffing needs.70This allowed new teachers tobe assigned to schools with the greatest need and gave the local education office the flexibility to move teacherswhere required. Local governments need to assess whether teacher distribution across schools is equitable;while it may be difficult to move existing teachers, it is possible to improve distribution over time by assigningnew qualified teachers to schools with the greatest need.
It is important to recognize that improvements to the current distribution of teachers will take time toimplement - but the joint decree, plans for expansion and the expected wave of teacher retirementsoffer good opportunities to accelerate these improvements. Many of the reforms require changes to theway teachers are trained and assigned. To this end, training opportunities and revised regulations on howteaching is organized need to be developed. Determining the feasibility of merging schools will also requireadditional planning and discussion with the local communities that would be affected.
68 SMERU (2010), Remote Area Allowance and Absentee Levels for Teachers in Remote Areas.69 Rogers and Vegas (2009), Zafeirakou (2007)70 Kluyskens and Rawlinson (2008), Improving Efficiency and Equity in Teacher Employment and Deployment.
U
Improving the Quality of Spending on Basic Education
Government plansforfurther expansion of secondary education present opportunities for reassignmentacross levels. The natural expansion of the education system due to population growth as well as governmentplans to expand access to secondary education will mean that more teachers will be required in some areas.Thisprovides an opportunity to improve teacher distribution by reassigning existing teachers rather than hiring newones. Teachers could be offered training and support to upgrade their skills in order to teach at a higher schoollevel.
Attrition also presents opportunities to improve efficiency. Over the next five years, approximately 10percent (150,000 primary and 30,000 junior secondary school teachers) of the civil service teaching force willreach retirement age. This represents a terrific opportunity to adjust the size of the teaching force without theneed to reassign teachers across levels. However, it will require constraining new hiring and redeploying teachersto replace retiring teachers where necessary.
The reallocation of teachers is not a substitute for improving the overall qualifications of the teachingforce, a task teacher certification was intended to do. Absorbing now more than 2 percent of the total statebudget (about 9 percent of the education budget), teacher certification is an expensive program that promisedto deliver significant improvements in teacher quality. Drawing on an on-going impact evaluation, the nextsection explores whether the program is having the intended effects on the quality of education.
Improving the Teacher Certification Program"
MoEC is introducing changes to the certification program. While still in an experimental phase, startingin 2012, teachers who want to access the certification process must first pass a competency test. Inaddition, there are plans to design specific training programs for teachers who fail the test, and who after thetraining would be able to reapply. While not yet in effect, the experimental introduction of this assessmentencountered a great deal of resistance, yet our analysis indicates that competency testing is likely to improvethe quality of teachers into the certification program. Competency tests including subject knowledge andpedagogical competencies prior to certification provide incentives to upgrade competencies, rather than onlyacademic qualifications. If this mechanism can be adequately enforced, certification is likely to produce betterteachers in the medium term.
An additional measure to ensure teacher competence would be the reassessment and recertification ofteachers after a certain period of time. In the absence of recertification, skills may become outdated, sinceteachers who receive certification have no incentives to continue upgrading their skills.The government shouldalso consider reevaluating and potentially recertifying teachers who passed through the certification processbefore competency tests were introduced.
Improving the teacher certification program and addressing inefficiencies in the allocation of teacherswould go a long way toward improving the quality of basic education. As we have seen, the teachercertification program as currently enforced is not delivering on expectations - instead it serves to doubleteacher salaries without ensuring quality teaching. But if, as originally intended, certification ensured that teachercompetencies would be assessed and upgraded, and if the objective of having all teachers certified were met,one would expect the quality of the teaching force to improve in the medium run. And by attracting betterstudents into the teaching profession, this relatively expensive program could deliver fully on its promises in thelong run. But making this program affordable will require improved efficiency and equity in teacher management.
71 This section is based on the forthcoming policy note and World Bank working paper,"Teacher certification in Indonesia: a doubling ofsalary, or a way to improve learning?" De Ree (forthcoming).
U
Spending more or spending better: Improving education financing in Indonesia
Improving district management and school discretion:effects from BOSDA pilotsIf efficiency gains are realized through improved teacher management, districts could play a strongerrole in supporting schools. By liberating resources from salary spending, districts could support schoolsthrough different channels. In the context of Indonesia's system of significant school-based management, thiscould mean providing additional, more equitable funding to schools, as well as stronger management andtechnical support.
Many regional governments already use their own resources to supplement school grants provided bythe national BOS program - mostly in the form of additional funds per student. In 2009, a survey foundthat 60 percent of districts provided additional support in the form of BOS Daerah (BOSDA). Like the nationalBOS program, the majority of districts allocate BOSDA to schools based on the number of students enrolled(Figure 73). While the amount provided for each student differs across districts, it tends to be lower than amountsprovided under the BOS program (i.e. between DR 575,000 and DR 710,000 per student in 2012). Survey datashow that schools in districts or provinces with BOSDA get an average of IDR 150,000 more per student thannon-BOSDA schools, mainly from district governments. Some regional governments consider the number ofclasses and teachers in determing the size of the allocation. In a small number of cases, BOSDA is not providedto schools but to teachers and principals as allowances and to teacher clusters (KKG, MGMP) for professionaldevelopment activities. In most cases, regional governments follow the BOS national guidelines in allocatingBOSDA. For example, many BOSDA guidelines include the same 14 eligible expenditure categories as the BOSprogram.
Allocating BOSDA using a per-student formula does not take account of differences in operating costsschools face due to the particular populations they serve and their locations. Schools in remote areasserving poor households are likely to require additional resources (e.g. more teaching time, remedial coaching,etc.) to provide a level of education similar to a school in a wealthier area. The cost of school supplies can alsovary significantly between accessible and more remote areas because of the associated transportation costs:with the same amount of BOSDA, a school in a remote part of Papua will be able to purchase fewer textbooksand other supplies than a school in Jayapura.
Some school operating expenses do not vary with levels of enrollment and this can further disadvantagesmall schools. For example, electricity usage does not vary according to student numbers but with the physicalsize of the school and the number of classrooms. A per-student formula allocates more to a large school withhigher levels of enrollment than to a smaller school, even if both have the same number of classrooms and similarelectricity usage. Ensuring that smaller schools have sufficient resources to cover fixed costs is a significant issue;as we have seen, nearly half of all primary schools in Indonesia have fewer than 150 students.
U
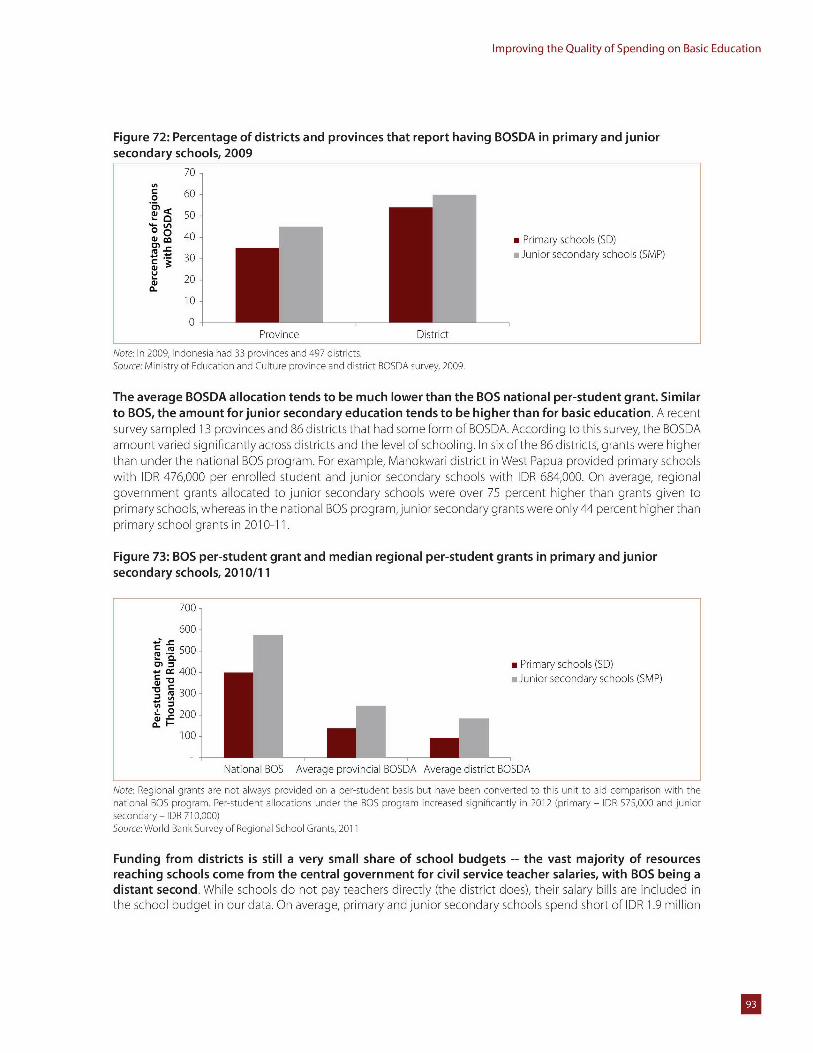
Improving the Quality of Spending on Basic Education
Figure 72: Percentage of districts and provinces that report having BOSDA in primary and juniorsecondary schools, 2009
70 -
0 60 -
50 -
40 -m Primary schools (SD)
30 - Junior secondary schools (SMP)
20-
10
0 LProvince District
Note: In 2009, Indonesia had 33 provinces and 497 districts.Source: Ministry of Education and Culture province and district BOSDA survey, 2009.
The average BOSDA allocation tends to be much lower than the BOS national per-student grant. Similarto BOS, the amount for junior secondary education tends to be higher than for basic education. A recentsurvey sampled 13 provinces and 86 districts that had some form of BOSDA. According to this survey, the BOSDAamount varied significantly across districts and the level of schooling. In six of the 86 districts, grants were higherthan under the national BOS program. For example, Manokwari district in West Papua provided primary schoolswith IDR 476,000 per enrolled student and junior secondary schools with IDR 684,000. On average, regionalgovernment grants allocated to junior secondary schools were over 75 percent higher than grants given toprimary schools, whereas in the national BOS program,junior secondary grants were only 44 percent higher thanprimary school grants in 2010-11.
Figure 73: BOS per-student grant and median regional per-student grants in primary and juniorsecondary schools, 2010/11
700-
600-
15. 500-m Primary schools (SD)
ce400 -- 400 Junior secondary schools (SMP)
300-
0 . 200-
100-
National BOS Average provincial BOSDA Average district BOSDA
Note: Regional grants are not a ways provided on a per-student basis but have been converted to this unit to aid comparison with thenational BOS program. Per-student a locations under the BOS program increased significantly in 2012 (primary - IDR 575,000 and juniorsecondary - IDR 710,000)Source: World Bank Survey of Regional School Grants, 2011
Funding from districts is still a very small share of school budgets -- the vast majority of resourcesreaching schools come from the central government for civil service teacher salaries, with BOS being adistant second. While schools do not pay teachers directly (the district does), their salary bills are included inthe school budget in our data. On average, primary and junior secondary schools spend short of IDR 1.9 million
U
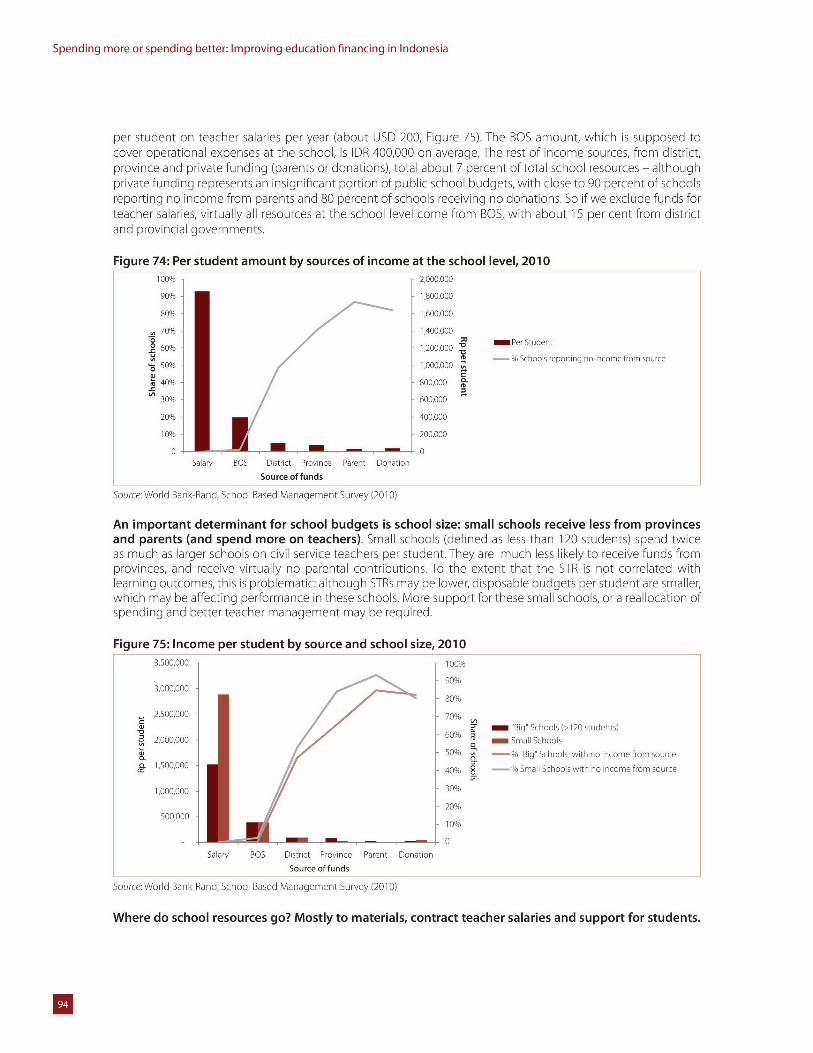
Spending more or spending better: Improving education financing in Indonesia
per student on teacher salaries per year (about USD 200, Figure 75). The BOS amount, which is supposed tocover operational expenses at the school, is IDR 400,000 on average. The rest of income sources, from district,province and private funding (parents or donations), total about 7 percent of total school resources - althoughprivate funding represents an insignificant portion of public school budgets, with close to 90 percent of schoolsreporting no income from parents and 80 percent of schools receiving no donations. So if we exclude funds forteacher salaries, virtually all resources at the school level come from BOS, with about 15 per cent from districtand provincial governments.
Figure 74: Per student amount by sources of income at the school level, 2010100% 2,000,000
90% 1,800,000
80% 1,600,000
2 70% 1,400,0000 Per Student0 60% 1,200,000
S -% Schools reporting no income from source50% 1,000,000
; 40% 800,000 r
30% 600,000
20% 400,000
10% 200,000
0 0Salary BOS District Province Parent Donation
Source of funds
Source: World Bank-Rand, School Based Management Survey (2010)
An important determinant for school budgets is school size: small schools receive less from provincesand parents (and spend more on teachers). Small schools (defined as less than 120 students) spend twiceas much as larger schools on civil service teachers per student. They are much less likely to receive funds fromprovinces, and receive virtually no parental contributions. To the extent that the STR is not correlated withlearning outcomes, this is problematic: although STRs may be lower, disposable budgets per student are smaller,which may be affecting performance in these schools. More support for these small schools, or a reallocation ofspending and better teacher management may be required.
Figure 75: Income per student by source and school size, 20103,500,000 100%
90%3,000,000
80%
2,500,000 70%
6 2,000,000 60% m0 ( Small Schools50% - % 'Big" Schools with no income from source
0.0e.1,500,000 -40% 8 .- % Small Scnoolsmwith no encome from source
1,000,000 30%
20%500,000
10%
0
Salary BOS District Province Parent Donation
Source of funds
Source: World Bank-Rand, School Based Management Survey (2010)
Where do school resources go? Mostly to materials, contract teacher salaries and support for students.
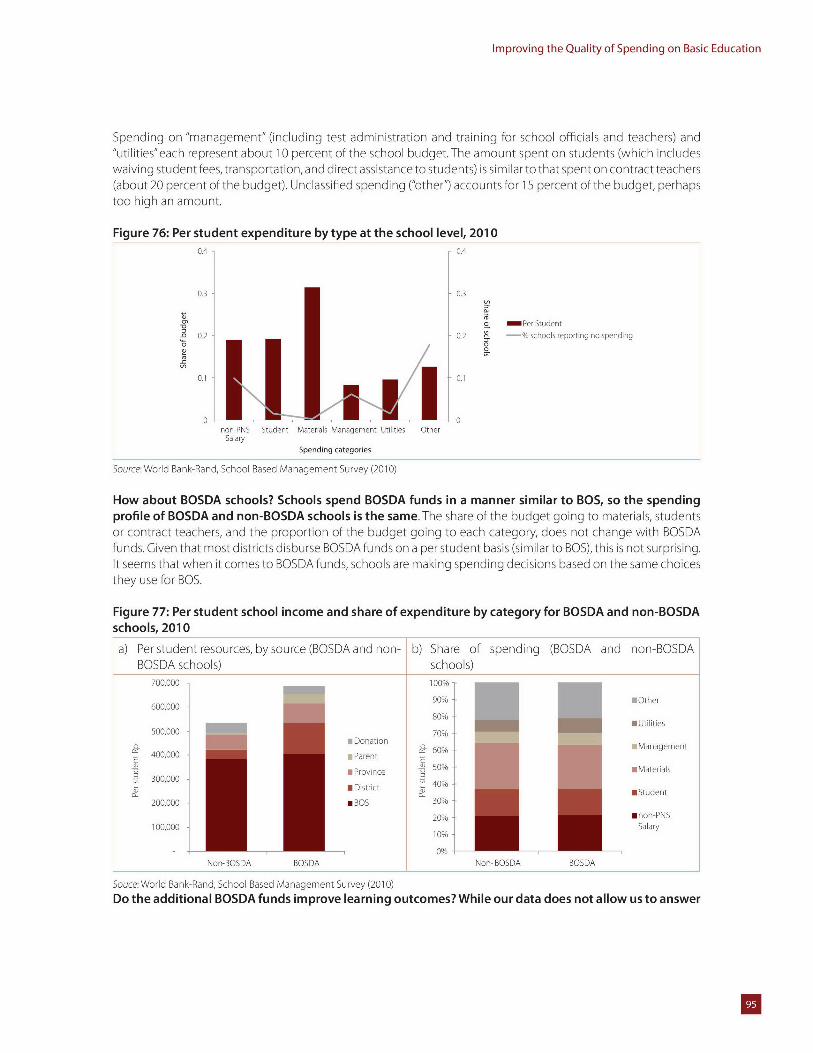
Improving the Quality of Spending on Basic Education
Spending on "management" (including test administration and training for school officials and teachers) and"utilities" each represent about 10 percent of the school budget. The amount spent on students (which includeswaiving student fees, transportation, and direct assistance to students) is similar to that spent on contract teachers(about 20 percent of the budget). Unclassified spending ("other") accounts for 15 percent of the budget, perhapstoo high an amount.
Figure 76: Per student expenditure by type at the school level, 20100.4 0.4
0.3 0.3
P er Student-0.2 0.2 schools reporting no spending
o 00) 0
0.1 0.1
0 0non-PNS Student Materials Management Utilities Other
Salary
Spending categories
Source: World Bank-Rand, School Based Management Survey (2010)
How about BOSDA schools? Schools spend BOSDA funds in a manner similar to BOS, so the spendingprofile of BOSDA and non-BOSDA schools is the same.The share of the budget going to materials, studentsor contract teachers, and the proportion of the budget going to each category, does not change with BOSDAfunds. Given that most districts disburse BOSDAfunds on a per student basis (similar to BOS), this is not surprising.It seems that when it comes to BOSDA funds, schools are making spending decisions based on the same choicesthey use for BOS.
Figure 77: Per student school income and share of expenditure by category for BOSDA and non-BOSDAschools, 2010
a) Per student resources, by source (BOSDA and non- b) Share of spending (BOSDA and non-BOSDABOSDA schools) schools)
700,000 100%
90% IImOther600,000
80%
500,000 70%
aa Donation 60% Management400,000 Parent
g Province a 50% Materials300,000 4
2 District 30%m Student200,000 me30S 30%-
20% E non-PNS100,000 Salary
10%
0%Non-BOSDA BOSDA Non-BOSDA BOSDA
Souce: World Bank-Rand, School Based Management Survey (2010)
Do the additional BOSDA funds improve learning outcomes? While our data does not allow us to answer
U
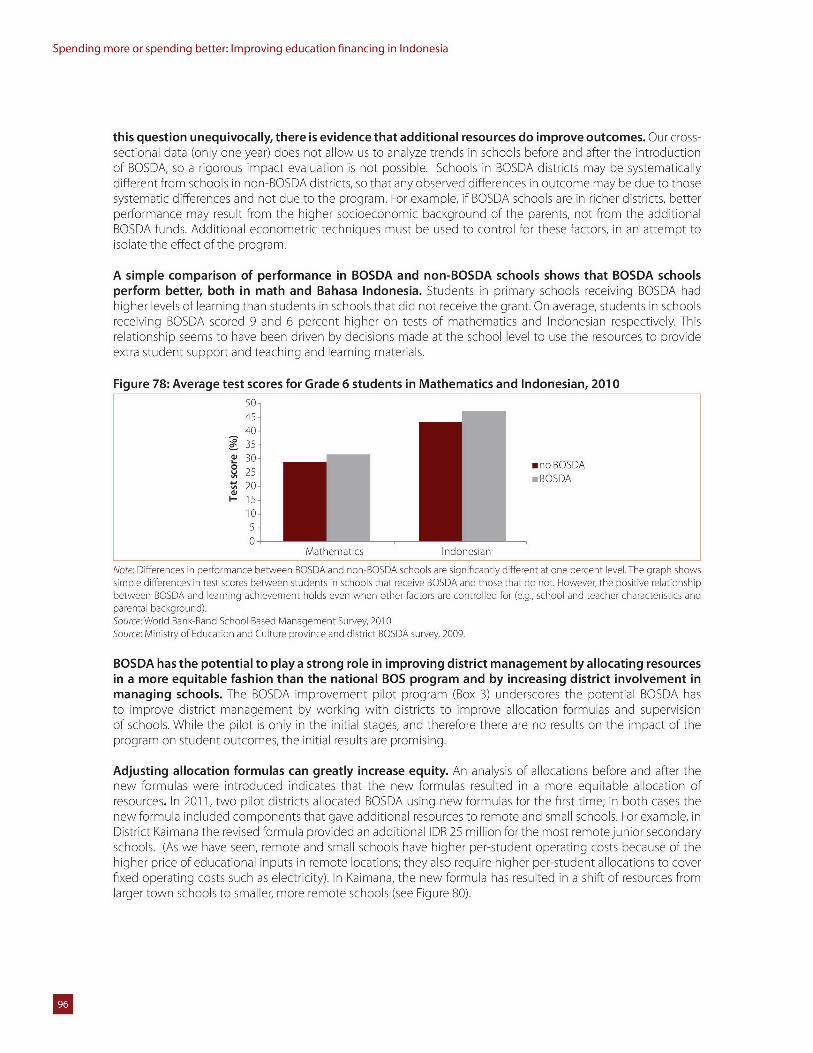
Spending more or spending better: Improving education financing in Indonesia
this question unequivocally, there is evidence that additional resources do improve outcomes. Our cross-sectional data (only one year) does not allow us to analyze trends in schools before and after the introductionof BOSDA, so a rigorous impact evaluation is not possible. Schools in BOSDA districts may be systematicallydifferent from schools in non-BOSDA districts, so that any observed differences in outcome may be due to thosesystematic differences and not due to the program. For example, if BOSDA schools are in richer districts, betterperformance may result from the higher socioeconomic background of the parents, not from the additionalBOSDA funds. Additional econometric techniques must be used to control for these factors, in an attempt toisolate the effect of the program.
A simple comparison of performance in BOSDA and non-BOSDA schools shows that BOSDA schoolsperform better, both in math and Bahasa Indonesia. Students in primary schools receiving BOSDA hadhigher levels of learning than students in schools that did not receive the grant. On average, students in schoolsreceiving BOSDA scored 9 and 6 percent higher on tests of mathematics and Indonesian respectively. Thisrelationship seems to have been driven by decisions made at the school level to use the resources to provideextra student support and teaching and learning materials.
Figure 78: Average test scores for Grade 6 students in Mathematics and Indonesian, 2010504540-
R 35-2 30n
25 moBOSDA25- mBCSDA
I-15-
0-Mathematics Indonesian
Note: Differences in performance between BOSDA and non-BOSDA schools are significantly different at one percent level.The graph showssimple differences in test scores between students in schools that receive BOSDA and those that do not. However, the positive relationshipbetween BOSDA and learning achievement holds even when other factors are controlled for (e.g., school and teacher characteristics andparental background).Source: World Bank-Rand School Based Management Survey, 2010Source: Ministry of Education and Culture province and district BOSDA survey, 2009.
BOSDA has the potential to play a strong role in improving district management by allocating resourcesin a more equitable fashion than the national BOS program and by increasing district involvement inmanaging schools. The BOSDA improvement pilot program (Box 3) underscores the potential BOSDA hasto improve district management by working with districts to improve allocation formulas and supervisionof schools. While the pilot is only in the initial stages, and therefore there are no results on the impact of theprogram on student outcomes, the initial results are promising.
Adjusting allocation formulas can greatly increase equity. An analysis of allocations before and after thenew formulas were introduced indicates that the new formulas resulted in a more equitable allocation ofresources. In 2011, two pilot districts allocated BOSDA using new formulas for the first time; in both cases thenew formula included components that gave additional resources to remote and small schools. For example, inDistrict Kaimana the revised formula provided an additional IDR 25 million for the most remote junior secondaryschools. (As we have seen, remote and small schools have higher per-student operating costs because of thehigher price of educational inputs in remote locations; they also require higher per-student allocations to coverfixed operating costs such as electricity). In Kaimana, the new formula has resulted in a shift of resources fromlarger town schools to smaller, more remote schools (see Figure 80).
U
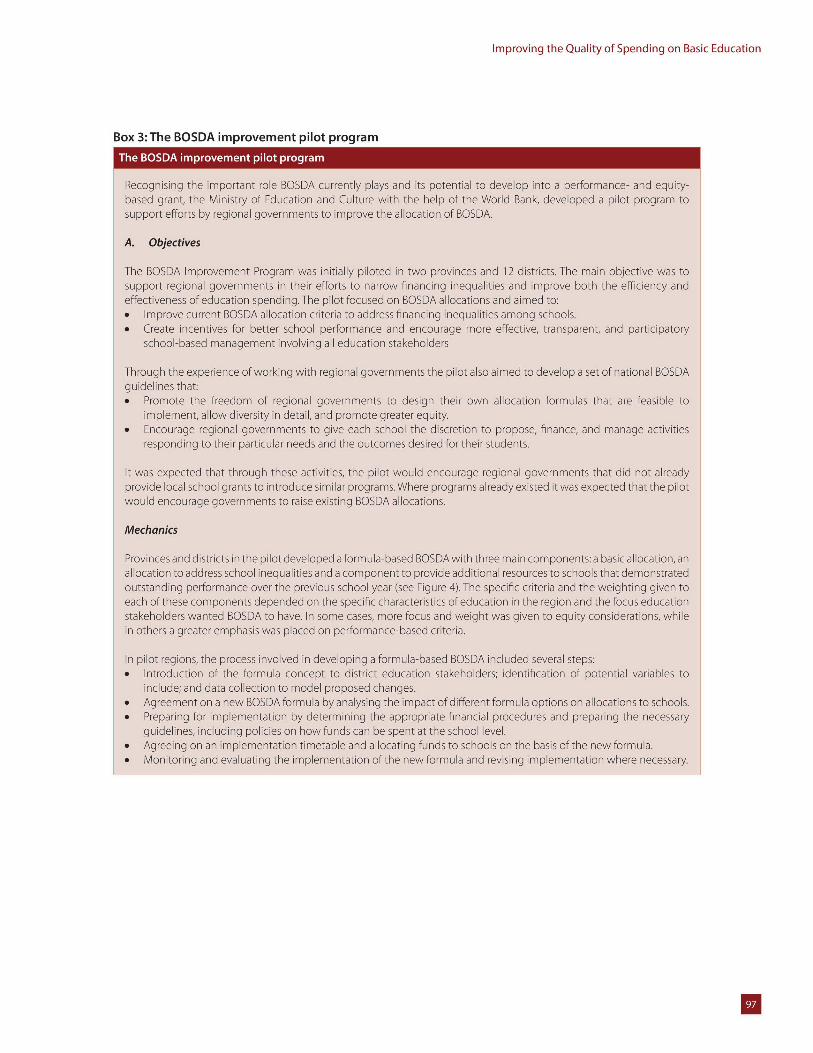
Improving the Quality of Spending on Basic Education
Box 3:The BOSDA improvement pilot program
Recognising the important role BOSDA currently plays and its potential to develop into a performance- and equity-based grant, the Ministry of Education and Culture with the help of the World Bank, developed a pilot program tosupport efforts by regional governments to improve the allocation of BOSDA.
A. Objectives
The BOSDA Improvement Program was initially piloted in two provinces and 12 districts. The main objective was tosupport regional governments in their efforts to narrow financing inequalities and improve both the efficiency andeffectiveness of education spending.The pilot focused on BOSDA allocations and aimed to:* Improve current BOSDA allocation criteria to address financing inequalities among schools.* Create incentives for better school performance and encourage more effective, transparent, and participatory
school-based management involving all education stakeholders
Through the experience of working with regional governments the pilot also aimed to develop a set of national BOSDAguidelines that:* Promote the freedom of regional governments to design their own allocation formulas that are feasible to
implement, allow diversity in detail, and promote greater equity.* Encourage regional governments to give each school the discretion to propose, finance, and manage activities
responding to their particular needs and the outcomes desired for their students.
It was expected that through these activities, the pilot would encourage regional governments that did not alreadyprovide local school grants to introduce similar programs. Where programs already existed it was expected that the pilotwould encourage governments to raise existing BOSDA allocations.
Mechanics
Provinces and districts in the pilot developed a formula-based BOSDA with three main components: a basic allocation, anallocation to address school inequalities and a component to provide additional resources to schools that demonstratedoutstanding performance over the previous school year (see Figure 4). The specific criteria and the weighting given toeach of these components depended on the specific characteristics of education in the region and the focus educationstakeholders wanted BOSDA to have. In some cases, more focus and weight was given to equity considerations, whilein others a greater emphasis was placed on performance-based criteria.
In pilot regions, the process involved in developing a formula-based BOSDA included several steps:* Introduction of the formula concept to district education stakeholders; identification of potential variables to
include; and data collection to model proposed changes.* Agreement on a new BOSDA formula by analysing the impact of different formula options on allocations to schools.* Preparing for implementation by determining the appropriate financial procedures and preparing the necessary
guidelines, including policies on how funds can be spent at the school level.* Agreeing on an implementation timetable and allocating funds to schools on the basis of the new formula.* Monitoring and evaluating the implementation of the new formula and revising implementation where necessary.
U
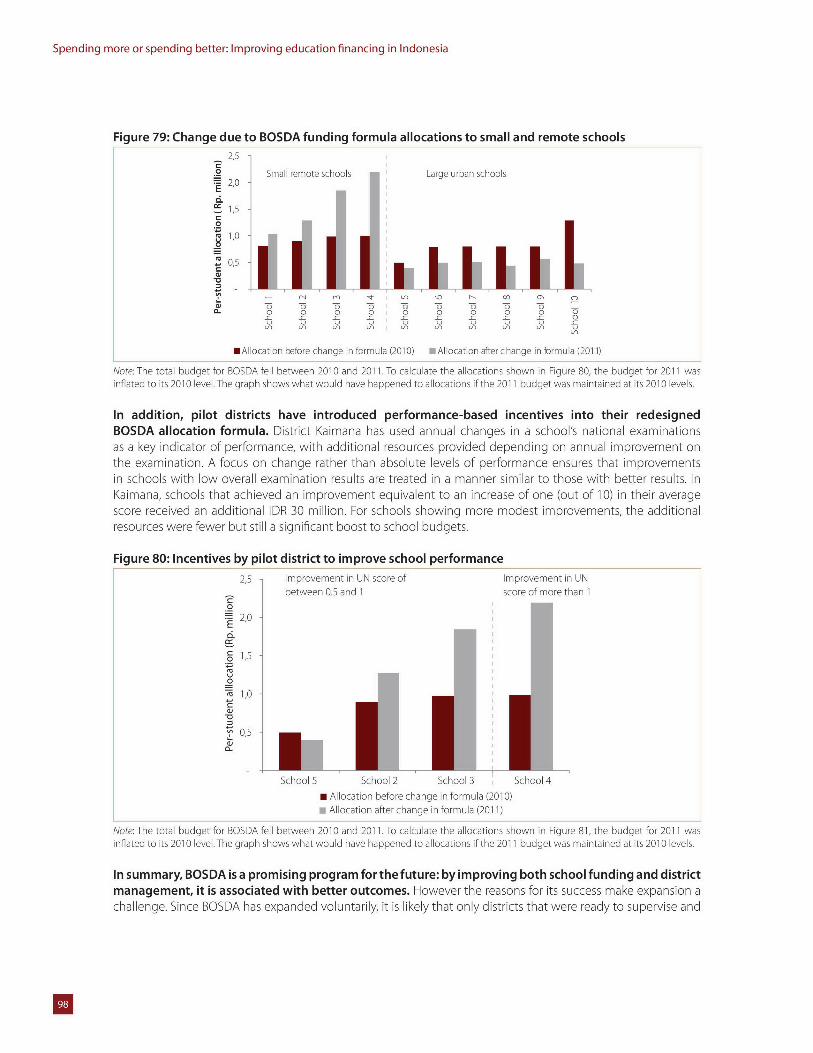
Spending more or spending better: Improving education financing in Indonesia
Figure 79: Change due to BOSDA funding formula allocations to small and remote schools2,5
.2 Small remote schools Large urban schools= 2,0E'
~.1,50
~1'0
S0,5
- 1m a 0 -0 '0 '0
00 0 0I0 0 0 0 0 001 0 '0 -0 0 '0 '0 '0 0LU U U LU LU U LU U LU
MAllocation before change in formula (2010) MAllocation after change in formu a (2011)
Note: The total budget for BOSDA fell between 2010 and 2011. To calcu ate the allocations shown in Figure 80, the budget for 2011 wasinflated to its 2010 level.The graph shows what would have happened to allocations if the 2011 budget was maintained at its 2010 evels.
In addition, pilot districts have introduced performance-based incentives into their redesignedBOSDA allocation formula. District Kaimana has used annual changes in a school's national examinationsas a key indicator of performance, with additional resources provided depending on annual improvement onthe examination. A focus on change rather than absolute levels of performance ensures that improvementsin schools with low overall examination results are treated in a manner similar to those with better results. InKaimana, schools that achieved an improvement equivalent to an increase of one (out of 10) in their averagescore received an additional DR 30 million. For schools showing more modest improvements, the additionalresources were fewer but still a significant boost to school budgets.
Figure 80: Incentives by pilot district to improve school performance2,5 Improvement in UN score of Improvement in UN
between 0.5 and 1 score of more than 1
20E
S1,5
1U 1'0
05
School 5 School 2 School 3 School4
m Allocation before change in formula (2010)a Allocation after change in formula (2011)
Note: The total budget for BOSDA fell between 2010 and 2011. To calcu ate the allocations shown in Figure 81, the budget for 2011 wasinflated to its 2010 level. The graph shows what would have happened to allocations if the 2011 budget was maintained at its 2010 evels.
In summary, BOSDA is a promising program for the future: by improving both school funding and districtmanagement, it is associated with better outcomes. However the reasons for its success make expansion achallenge. Since BOSDA has expanded voluntarily, it is likely that only districts that were ready to supervise and
U
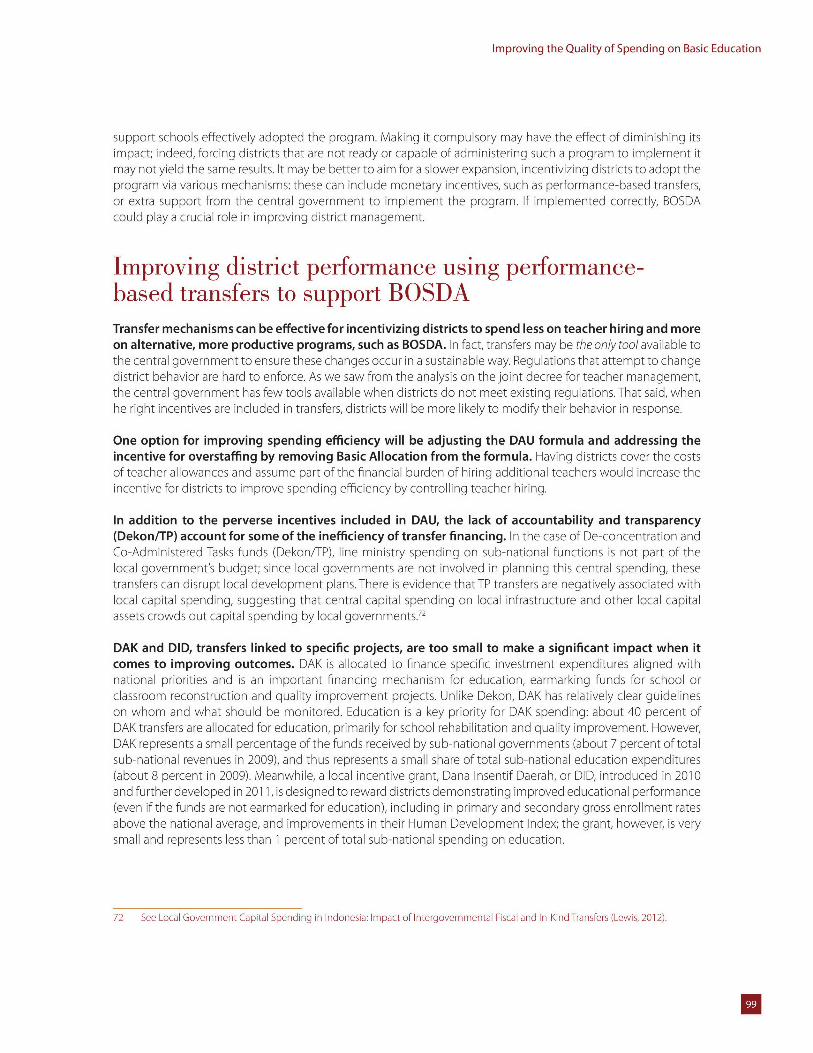
Improving the Quality of Spending on Basic Education
support schools effectively adopted the program. Making it compulsory may have the effect of diminishing itsimpact; indeed, forcing districts that are not ready or capable of administering such a program to implement itmay not yield the same results. It may be better to aim for a slower expansion, incentivizing districts to adopt theprogram via various mechanisms: these can include monetary incentives, such as performance-based transfers,or extra support from the central government to implement the program. If implemented correctly, BOSDAcould play a crucial role in improving district management.
Improving district performance using performance-based transfers to support BOSDATransfer mechanisms can be effective for incentivizing districts to spend less on teacher hiring and moreon alternative, more productive programs, such as BOSDA. In fact, transfers may be the only tool available tothe central government to ensure these changes occur in a sustainable way. Regulations that attempt to changedistrict behavior are hard to enforce. As we saw from the analysis on the joint decree for teacher management,the central government has few tools available when districts do not meet existing regulations. That said, whenhe right incentives are included in transfers, districts will be more likely to modify their behavior in response.
One option for improving spending efficiency will be adjusting the DAU formula and addressing theincentive for overstaffing by removing Basic Allocation from the formula. Having districts cover the costsof teacher allowances and assume part of the financial burden of hiring additional teachers would increase theincentive for districts to improve spending efficiency by controlling teacher hiring.
In addition to the perverse incentives included in DAU, the lack of accountability and transparency(Dekon/TP) account for some of the inefficiency of transfer financing. In the case of De-concentration andCo-Administered Tasks funds (Dekon/TP), line ministry spending on sub-national functions is not part of thelocal government's budget; since local governments are not involved in planning this central spending, thesetransfers can disrupt local development plans. There is evidence that TP transfers are negatively associated withlocal capital spending, suggesting that central capital spending on local infrastructure and other local capitalassets crowds out capital spending by local governments.72
DAK and DID, transfers linked to specific projects, are too small to make a significant impact when itcomes to improving outcomes. DAK is allocated to finance specific investment expenditures aligned withnational priorities and is an important financing mechanism for education, earmarking funds for school orclassroom reconstruction and quality improvement projects. Unlike Dekon, DAK has relatively clear guidelineson whom and what should be monitored. Education is a key priority for DAK spending: about 40 percent ofDAK transfers are allocated for education, primarily for school rehabilitation and quality improvement. However,DAK represents a small percentage of the funds received by sub-national governments (about 7 percent of totalsub-national revenues in 2009), and thus represents a small share of total sub-national education expenditures(about 8 percent in 2009). Meanwhile, a local incentive grant, Dana Insentif Daerah, or DID, introduced in 2010and further developed in 2011, is designed to reward districts demonstrating improved educational performance(even if the funds are not earmarked for education), including in primary and secondary gross enrollment ratesabove the national average, and improvements in their Human Development Index; the grant, however, is verysmall and represents less than 1 percent of total sub-national spending on education.
72 See Local Government Capital Spending in Indonesia: Impact of Intergovernmental Fiscal and In-Kind Transfers (Lewis, 2012).
U
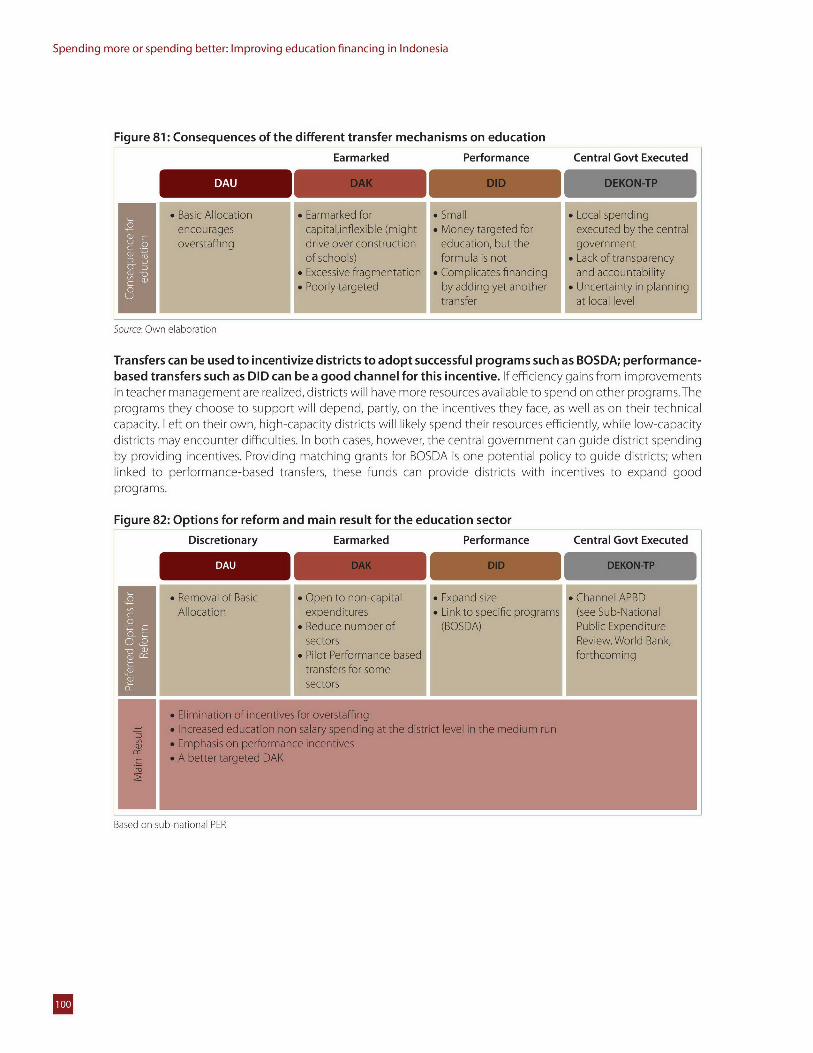
Spending more or spending better: Improving education financing in Indonesia
Figure 81: Consequences of the different transfer mechanisms on education
Earmarked Performance Central Govt Executed
Sore *w BlnoacAation
T sica be dto * Earmarked for * Small * Local spendingencouagescapital,inflexible (rnight * Money targeted for executed by the centraloverstffingdrive over construction education, but the government
based transfers such as DID can be a good channel for this incentive. If efficiency gains from improvementsin teacher management are realized, districts will have more resources available to spend on other programs.Theprograms they choose to support will depend, partly, on the incentives they face, as well as on their technicalcapacity. Left on their own, high-capacity districts will likely spend their resources efficiently, while low-capacitydistricts may encounter difficulties. In both cases, however, the central government can guide district spendingby providing incentives. Providing matching grants for BOSDA is one potential policy to guide districts; whenlinked to performance-based transfers, these funds can provide districts with incentives to expand goodprogram s.
Figure 82: Options for reform and main result for the education sector
Discretionary Earmarked Performance Central Govt Executed
* II
Based on sub-national PER
U
IChapter 5:
A Framework for Action: Policyoptions for improving the quality ofspending
This report has explored the consequences of the 20 percent rule, has looked at where the massiveincrease in spending has gone and how it has translated into outcomes. By constitutional mandate,Indonesia has ensured an adequate level of resources for education relative to its government budget, and thecommitment of Indonesia to its education system is evident and laudable. The 20 percent rule has led to a rapidincrease in resources over the last decade; compared to other middle-income countries, Indonesia is now above-average in terms of share of the budget devoted to education.
The increase in spending has led to a sizeable improvement in equitable access to education, especiallyin basic education, but quality is a concern. The Gol has focused on expanding access to 9 years of basiceducation, but has also begun putting more emphasis on expanding access and quality when it comes tosenior secondary and beyond. Higher education has also received a significant increase in resources, as didscholarship programs after 2009 and capital spending over the last decade. That said, results are mixed: whilebasic education is now near universal, access to senior secondary and higher education remains a challenge forthe poor (especially in higher education). And the results of all this investment in terms of quality of educationare not encouraging. Indonesia performs at the bottom end ofthe distribution in international tests, and learningoutcomes declined in math and science in PISA between 2006 and 2009.
Part of these trends can be explained by patterns in spending: two-thirds of the additional resourceswent to teacher salaries and certification. Given the preponderance of spending in these areas, it is unlikelythat with time, the added resources will result in better learning outcomes. Studies have shown that at thecurrent level of STR, there is no correlation between adding teachers and improving outcomes; thus, theseexpenditures are unlikely to produce the desired results. Spending better is crucial for the future.
Given the complex governance and financing system, few decisions can be made at the central level todirectly improve the quality of spending. Improvements are needed in the governance and financingof the system (from intergovernmental transfers, to school and district management, to the criticalrole of teacher management). Indonesia has a highly decentralized system, which is largely dependenton intergovernmental transfers and district management, and in which school-based management plays astrong role. Change. Since direct influence from MoEC is limited to regulations and direct program spending(like scholarships); the central government's most effective tool is providing the right incentives, not enforcingregulations.These incentives will determine the quality of spending in the future, and hence the GOI's realizationof its goals of expanded access and improved quality and outcomes.
U
Spending more or spending better: Improving education financing in Indonesia
This chapter brings together the challenges and recommendations for policy options to improve thequality of spending into one coherent framework for action. The framework attempts to make senseof the complexity of the objectives and policy areas, defining the main decision makers and providingspecific actions for each area. At the risk of being repetitive, actions are included in all the policy areas that theyaffect, thereby enabling the reader to take account of the existing complex interrelationships. To ensure therelevance of these policy options, the level of specificity provided is based on the existing evidence to supportthe recommendations. As is evident from this chapter, the main challenges cannot be addressed by MoEC alone,and will require prioritization and coordination among key stakeholders.
This section first discusses the overall objectives of the education system (access and quality) andthe three main paths to achieve these goals through improved efficiency, equity and performance ineducation spending. It then discusses the four policy areas identified as priorities, outlines the mainactions needed and identifies the stakeholders in each area.
Objectives and main policy areasImproving the quality of spending means increasing efficiency, improving equity and bolstering thecapacity of the system to turn resources into performance. The three areas are mapped to objectives inFigure 84. The 20 percent rule has ensured that resources are largely adequate as a share of the total governmentbudget. The problem lies in how resources are spent. To ensure expansion, it is important that resources areallocated equitably: this does not mean uniformly, as certain students, teachers, schools or districts need moreresources per student to achieve the same objectives. It is also important that resources are allocated in a mannerthat delegates decisionmaking to those actors with the greatest information and capacity, while providing themwith the right incentives. This is perhaps the biggest challenge in education in Indonesia.
In orderto increase efficiency, improve equityand bolster the capacity of the system to turn resources intoperformance, this report has identified five main policy areas for improvement: i) strategic reallocationof expenditures; ii) effective use of transfer mechanisms, iii) improvements in teacher management,iv) improvements in the district management of schools and v) improvements in budget planning andtransparency. All these areas will affect the three objectives of efficiency, equity and performance to varyingdegrees (Figure 84). In targeting the strategic reallocation of expenditures, for instance, we refer to decisions thatcan be made by the Ministry of Education to improve spending, such as expanding and reforming scholarships,which will affect equity directly and quality indirectly. The effective use of transfer mechanisms should focus notonly on transfers to district and provincial governments, but also to schools (BOSDA).Teacher management willalso be crucial to increase the efficiency and equity of the system, by reducing spending and improving learningoutcomes. The key role of districts and schools in the education system needs to be reinforced with guidancefrom the central government. Finally, accountability and transparency in the process of budget planning andreporting is crucial.
Given the complexity of the system's governance, each policy area has a number of stakeholders. Somedecisions can be made by MoEC alone, but for others, different ministries or district governments may playa bigger role. Improving the transfer system, teacher management, budget planning and transparency, orschool and district management require actors beyond MoEC to succeed. The next section outlines these keystakeholders and the recommendations for each area.
U
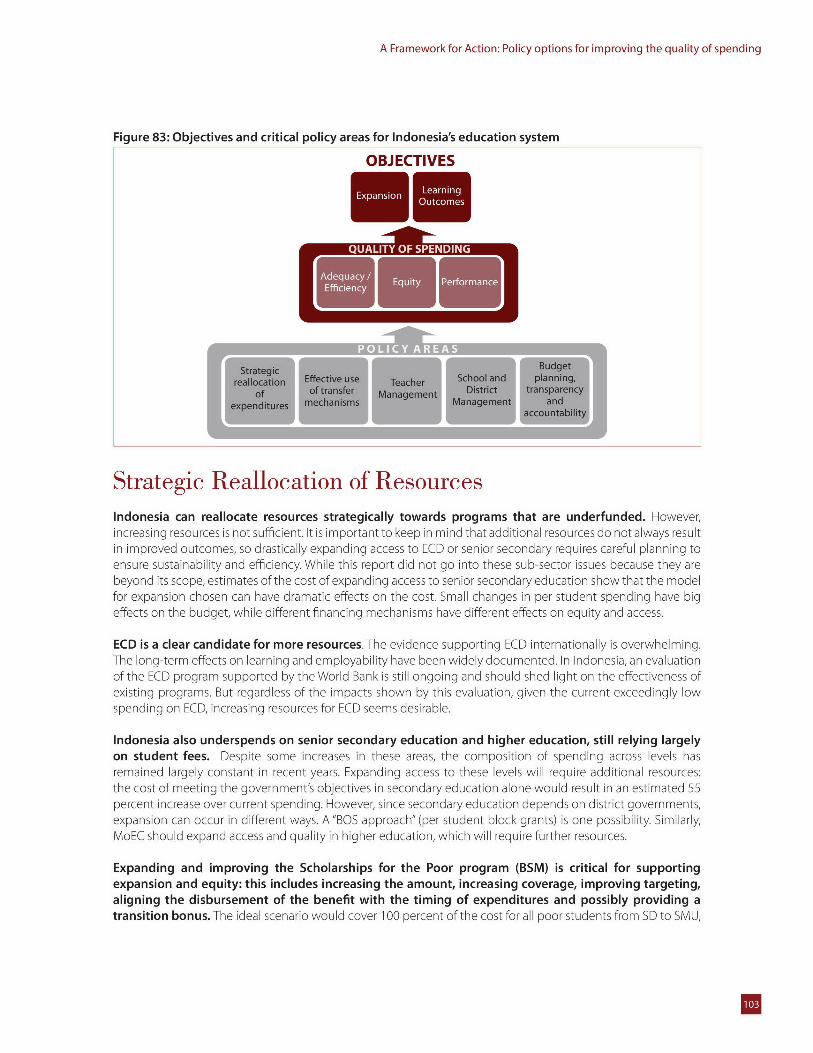
A Framework for Action: Policy options for improving the quality of spending
Figure 83: Objectives and critical policy areas for Indonesia's education system
OBJECTIVES
U.
Strategic Reallocation of ResourcesIndonesia can reallocate resources strategically towards programs that are underfunded. However,increasing resources is not sufficient. It is important to keep in mind that additional resources do not always resultin improved outcomes, so drastically expanding access to ECD or senior secondary requires careful planning toensure sustainability and efficiency. While this report did not go into these sub-sector issues because they arebeyond its scope, estimates of the cost of expanding access to senior secondary education show that the modelfor expansion chosen can have dramatic effects on the cost. Small changes in per student spending have bigeffects on the budget, while different financing mechanisms have different effects on equity and access.
ECD is a clear candidate for more resources. The evidence supporting ECD internationally is overwhelming.The long-term effects on learning and employability have been widely documented. In Indonesia, an evaluationof the ECD program supported by the World Bank is still ongoing and should shed light on the effectiveness ofexisting programs. But regardless of the impacts shown by this evaluation, given the current exceedingly lowspending on ECD, increasing resources for ECD seems desirable.
Indonesia also underspends on senior secondary education and higher education, still relying largelyon student fees. Despite some increases in these areas, the composition of spending across levels hasremained largely constant in recent years. Expanding access to these levels will require additional resources:the cost of meeting the government's objectives in secondary education alone would result in an estimated 55percent increase over current spending. However, since secondary education depends on district governments,expansion can occur in different ways. A"BOS approach" (per student block grants) is one possibility. Similarly,MoEC should expand access and quality in higher education, which will require further resources.
Expanding and improving the Scholarships for the Poor program (BSM) is critical for supportingexpansion and equity: this includes increasing the amount, increasing coverage, improving targeting,aligning the disbursement of the benefit with the timing of expenditures and possibly providing atransition bonus. The ideal scenario would cover 100 percent of the cost for all poor students from SD to SMU,
U
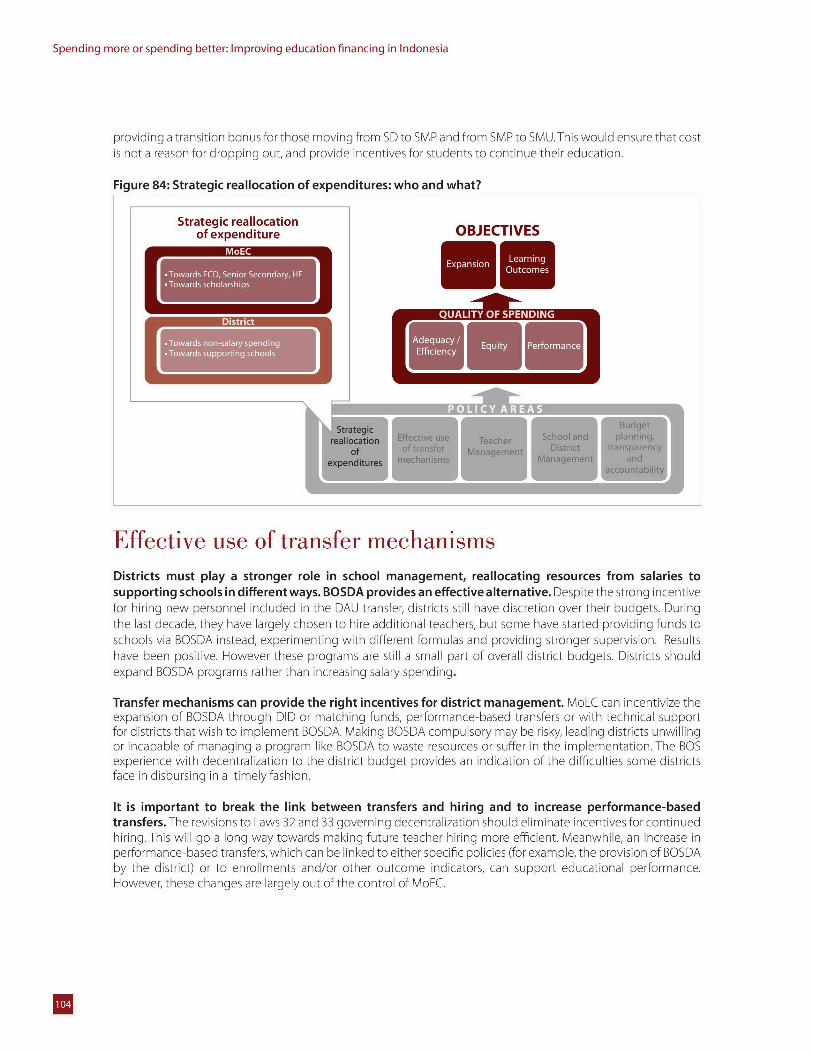
Spending more or spending better: Improving education financing in Indonesia
providing a transition bonus for those moving from SD to SMP and from SMP to SMU.This would ensure that costis not a reason for dropping out, and provide incentives for students to continue their education.
Figure 84: Strategic reallocation of expenditures: who and what?
Strategic reallocationof expenditure OBJECTIVES
Towards ECD, Senior Secondary, HEu
* Towards scholarships L 41Wg AL 9 -
' :N*Towardsnnslrsed g*Twads supprting schools
Effective use of transfer mechanisms
Districts must play a stronger role in school management, reallocating resources from salaries tosupporting schools in different ways. BOSDA provides an effective alternative. Despite the strong incentivefor hiring new personnel included in the DAU transfer, districts still have discretion over their budgets. Duringthe last decade, they have largely chosen to hire additional teachers, but some have started providing funds toschools via BOSDA instead, experimenting with different formulas and providing stronger supervision. Resultshave been positive. However these programs are still a small part of overall district budgets. Districts shouldexpand BOSDA programs rather than increasing salary spending.
Transfer mechanisms can provide the right incentives for district management. MoEC can incentivize theexpansion of BOSDA through DID or matching funds, performance-based transfers or with technical supportfor districts that wish to implement BOSDA. Making BOSDA compulsory may be risky, leading districts unwillingor incapable of managing a program like BOSDA to waste resources or suffer in the implementation. The BOSexperience with decentralization to the district budget provides an indication of the difficulties some districtsface in disbursing in a timely fashion.
It is important to break the link between transfers and hiring and to increase performance-basedtransfers. The revisions to Laws 32 and 33 governing decentralization should eliminate incentives for continuedhiring. This will go a long way towards making future teacher hiring more efficient. Meanwhile, an increase inperformance-based transfers, which can be linked to either specific policies (for example, the provision of BOSDAby the district) or to enrollments and/or other outcome indicators, can support educational performance.However, these changes are largely out of the control of MoEC.
U
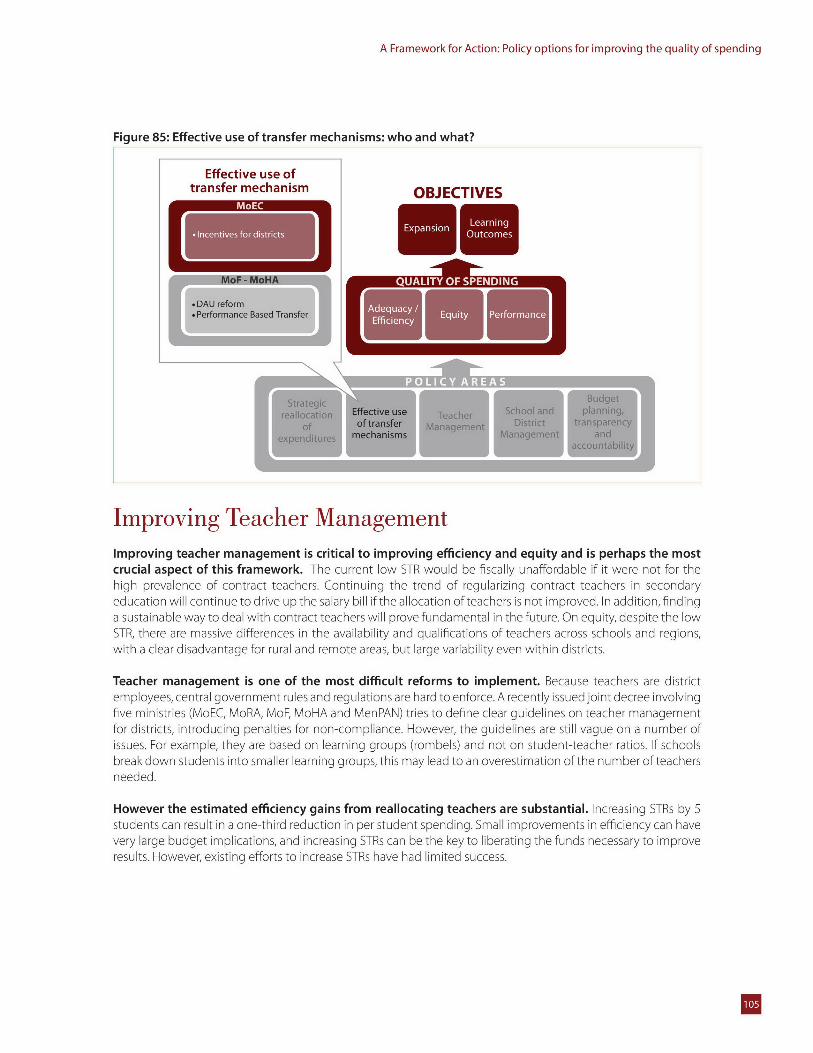
A Framework for Action: Policy options for improving the quality of spending
Figure 85: Effective use of transfer mechanisms: who and what?
Effective use oftransfer mechanism OBJECTIVES
* netvsfor districtsExaso
I DAU reformPerformance Based Transfer
Improving Teacher Management
Improving teacher management is critical to improving efficiency and equity and is perhaps the mostcrucial aspect of this framework. The current low STR would be fiscally unaffordable if it were not for thehigh prevalence of contract teachers. Continuing the trend of regularizing contract teachers in secondaryeducation will continue to drive up the salary bill if the allocation of teachers is not improved. In addition, findinga sustainable way to deal with contract teachers will prove fundamental in the future. On equity, despite the lowSTR, there are massive differences in the availability and qualifications of teachers across schools and regions,with a clear disadvantage for rural and remote areas, but large variability even within districts.
Teacher management is one of the most difficult reforms to implement. Because teachers are districtemployees, central government rules and regulations are hard to enforce. A recently issued joint decree involvingfive ministries (MoEC, MoRA, MoF, MoHA and MenPAN) tries to define clear guidelines on teacher managementfor districts, introducing penalties for non-compliance. However, the guidelines are still vague on a number ofissues. For example, they are based on learning groups (rombels) and not on student-teacher ratios. If schoolsbreak down students into smaller learning groups, this may lead to an overestimation of the number of teachersneeded.
However the estimated efficiency gains from reallocating teachers are substantial. Increasing STRs by 5students can result in a one-third reduction in per student spending. Small improvements in efficiency can havevery large budget implications, and increasing STRs can be the key to liberating the funds necessary to improveresults. However, existing efforts to increase STRs have had limited success.
U
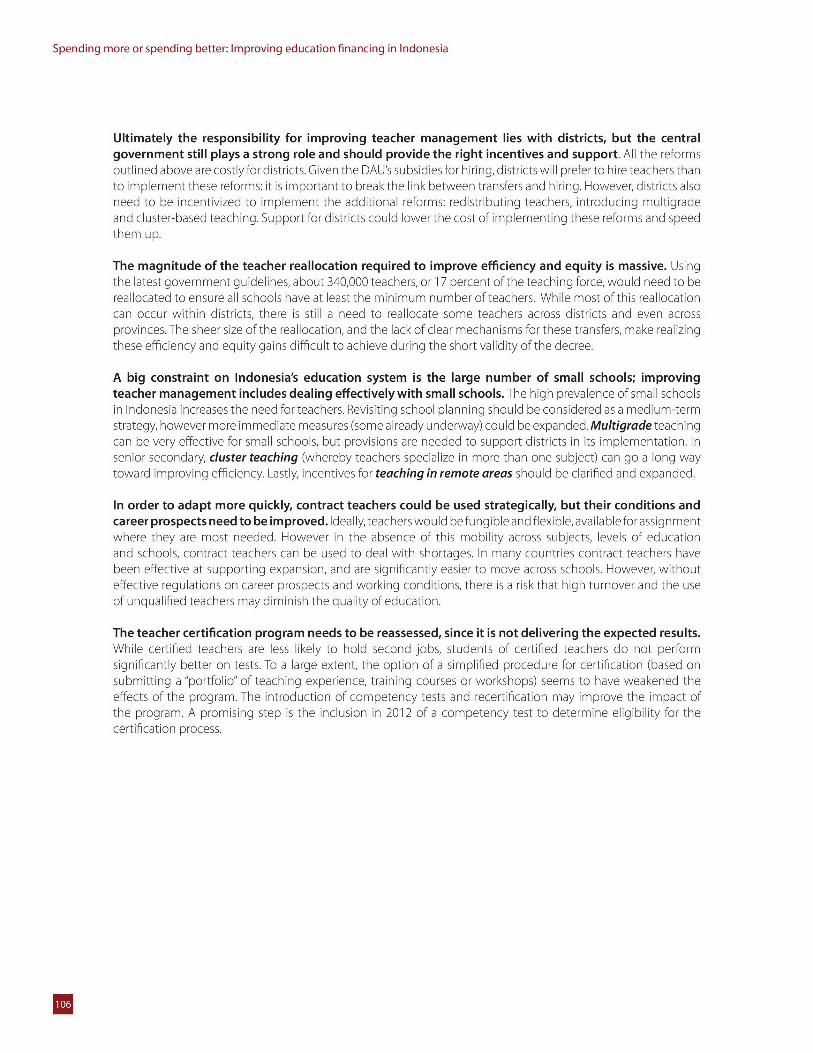
Spending more or spending better: Improving education financing in Indonesia
Ultimately the responsibility for improving teacher management lies with districts, but the centralgovernment still plays a strong role and should provide the right incentives and support. All the reformsoutlined above are costly for districts. Given the DAU's subsidies for hiring, districts will prefer to hire teachers thanto implement these reforms: it is important to breakthe link between transfers and hiring. However, districts alsoneed to be incentivized to implement the additional reforms: redistributing teachers, introducing multigradeand cluster-based teaching. Support for districts could lower the cost of implementing these reforms and speedthem up.
The magnitude of the teacher reallocation required to improve efficiency and equity is massive. Usingthe latest government guidelines, about 340,000 teachers, or 17 percent of the teaching force, would need to bereallocated to ensure all schools have at least the minimum number of teachers. While most of this reallocationcan occur within districts, there is still a need to reallocate some teachers across districts and even acrossprovinces. The sheer size of the reallocation, and the lack of clear mechanisms for these transfers, make realizingthese efficiency and equity gains difficult to achieve during the short validity of the decree.
A big constraint on Indonesia's education system is the large number of small schools; improvingteacher management includes dealing effectively with small schools. The high prevalence of small schoolsin Indonesia increases the need for teachers. Revisiting school planning should be considered as a medium-termstrategy, however more immediate measures (some already underway) could be expanded. Multigrade teachingcan be very effective for small schools, but provisions are needed to support districts in its implementation. Insenior secondary, cluster teaching (whereby teachers specialize in more than one subject) can go a long waytoward improving efficiency. Lastly, incentives for teaching in remote areas should be clarified and expanded.
In order to adapt more quickly, contract teachers could be used strategically, but their conditions andcareer prospects need to be improved. Ideally, teachers would befungible and flexible, available for assignmentwhere they are most needed. However in the absence of this mobility across subjects, levels of educationand schools, contract teachers can be used to deal with shortages. In many countries contract teachers havebeen effective at supporting expansion, and are significantly easier to move across schools. However, withouteffective regulations on career prospects and working conditions, there is a risk that high turnover and the useof unqualified teachers may diminish the quality of education.
The teacher certification program needs to be reassessed, since it is not delivering the expected results.While certified teachers are less likely to hold second jobs, students of certified teachers do not performsignificantly better on tests. To a large extent, the option of a simplified procedure for certification (based onsubmitting a "portfolio" of teaching experience, training courses or workshops) seems to have weakened theeffects of the program. The introduction of competency tests and recertification may improve the impact ofthe program. A promising step is the inclusion in 2012 of a competency test to determine eligibility for thecertification process.
U
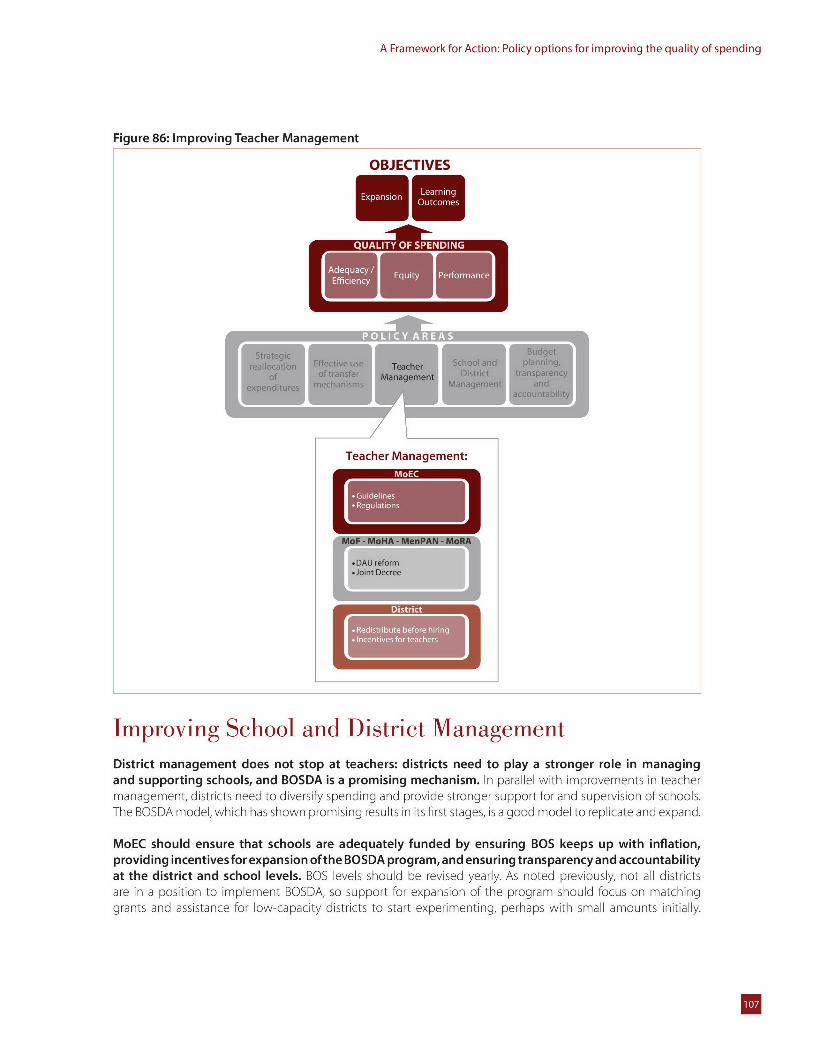
A Framework for Action: Policy options for improving the quality of spending
Figure 86: Improving Teacher Management
OBJECTIVES
EmmTeacher Management:
*A In etvfor tahr
Jit cree
Improving School and District ManagementDistrict management does not stop at teachers: districts need to play a stronger role in managingand supporting schools, and BOSDA is a promising mechanism. In parallel with improvements in teachermanagement, districts need to diversify spending and provide stronger support for and supervision of schools.The BOSDA model, which has shown promising results in its first stages, is a good model to replicate and expand.
MoEC should ensure that schools are adequately funded by ensuring BOS keeps up with inflation,providing incentives for expansion of the BOSDA program, and ensuring transparency and accountabilityat the district and school levels. BOS levels should be revised yearly. As noted previously, not all districtsare in a position to implement BOSDA, so support for expansion of the program should focus on matchinggrants and assistance for low-capacity districts to start experimenting, perhaps with small amounts initially.
U
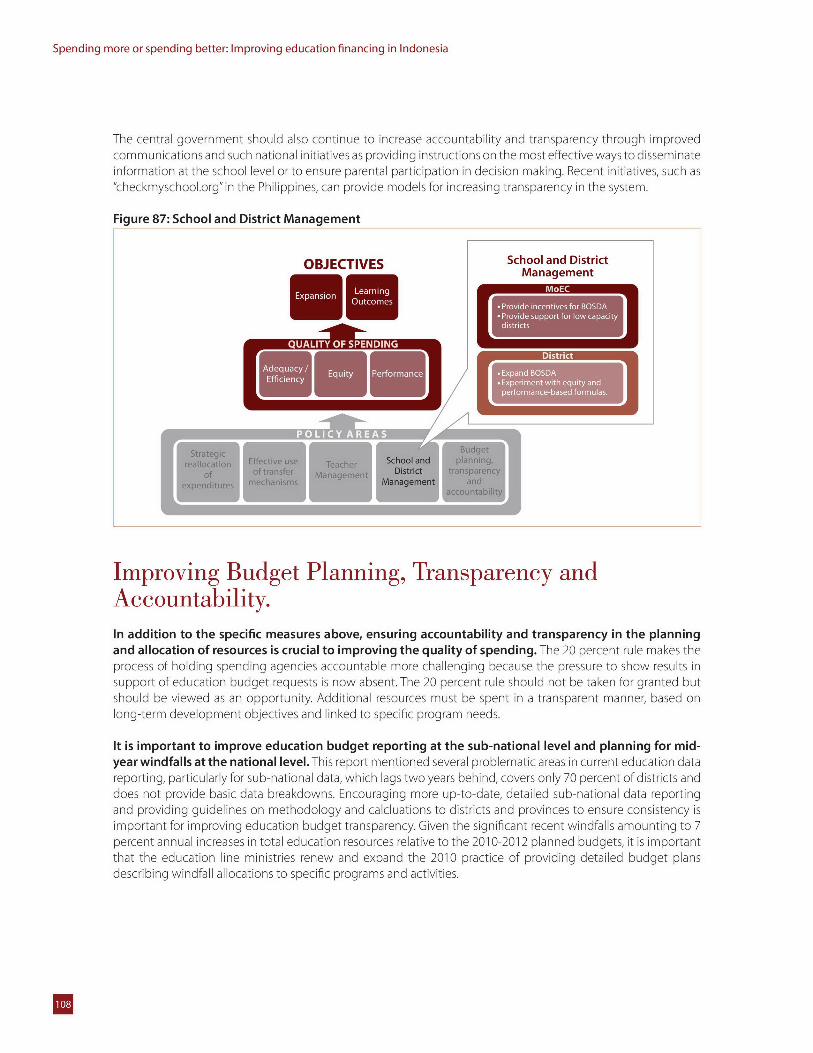
Spending more or spending better: Improving education financing in Indonesia
The central government should also continue to increase accountability and transparency through improvedcommunications and such national initiatives as providing instructions on the most effective ways to disseminateinformation at the school level or to ensure parental participation in decision making. Recent initiatives, such as"checkmyschool.org" in the Philippines, can provide models for increasing transparency in the system.
Figure 87: School and District Management
OBJECTIVES School and District
I r M a n a g e m e n t
*uco e Poieicntives for BOSDA
m*nPrecyort for low capacitydistricts
AMr * ExpandBO5DDA
Experimentwith equityandperformance-based formulas.
reallcatin Ffectie us Teaher chooland ln ng
of of tran5f Management District tasaec
exp,editurs mehani rs Mnagement an
Improving Budget Planning, Transparency andAccountability.In addition to the specific measures above, ensuring accountability and transparency in the planningand allocation of resources is crucial to improving the quality of spending. The 20 percent rule makes theprocess of holding spending agencies accountable more challenging because the pressure to show results insupport of education budget requests is now absent. The 20 percent rule should not be taken for granted butshould be viewed as an opportunity. Additional resources must be spent in a transparent manner, based onlong-term development objectives and linked to specific program needs.
It is important to improve education budget reporting at the sub-national level and planning for mid-year windfalls at the national level.This report mentioned several problematic areas in current education datareporting, particularly for sub-national data, which lags two years behind, covers only 70 percent of districts anddoes not provide basic data breakdowns. Encouraging more up-to-date, detailed sub-national data reportingand providing guidelines on methodology and calcluations to districts and provinces to ensure consistency isimportant for improving education budget transparency. Given the significant recent windfalls amounting to 7percent annual increases in total education resources relative to the 2010-2012 planned budgets, it is importantthat the education line ministries renew and expand the 2010 practice of providing detailed budget plansdescribing windfall allocations to specific programs and activities.
U
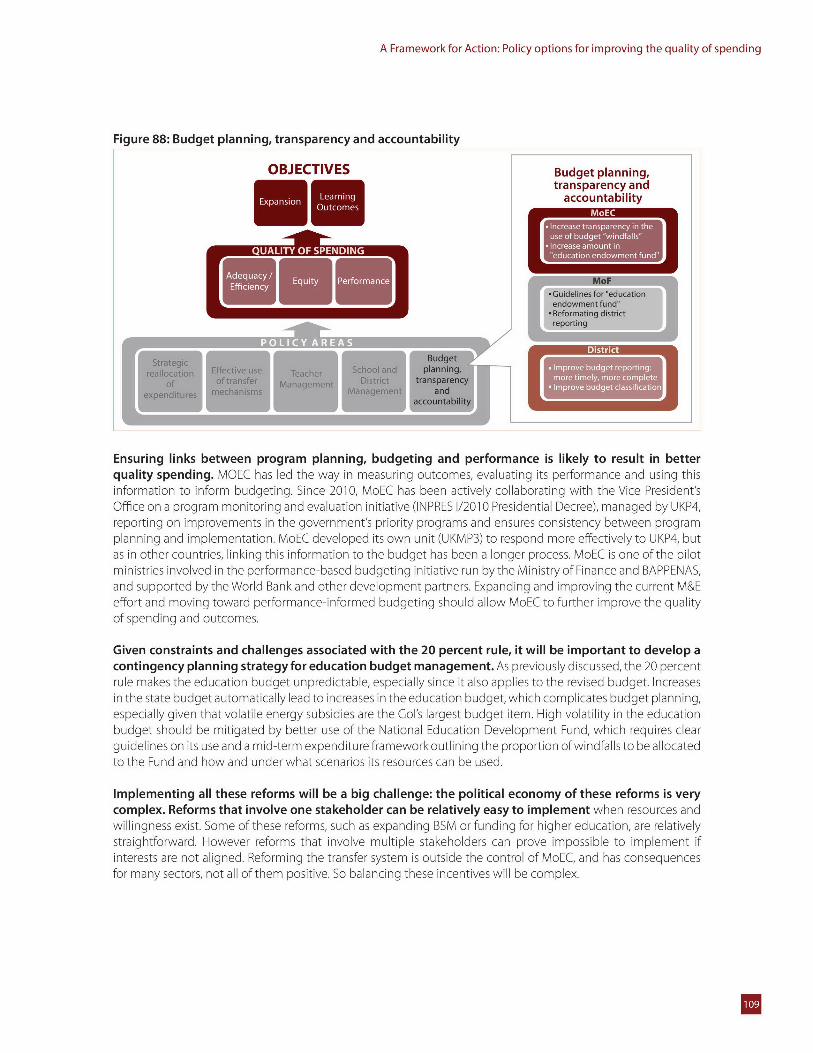
A Framework for Action: Policy options for improving the quality of spending
Figure 88: Budget planning, transparency and accountability
OBJECTIVES Budget planning,transparency and
accountability
L -A * Increase transparency in theuse of budget "windfalls"increase amount in
-Guidelines for educationU endowment fuind" E
* Reformatln distrctreporting
Straegi Effctic ue ScoDland laning Improve budget reporting:ccmore timely, morecmltf Impov budgete classificationric
Ensuring links between program planning, budgeting and performance is likely to result in betterquality spending. MOEC has led the way in measuring outcomes, evaluating its performance and using thisinformation to inform budgeting. Since 2010, MoEC has been actively collaborating with the Vice President'sOffice on a program monitoring and evaluation initiative (INPRES 1/2010 Presidential Decree), managed by UKP4,reporting on improvements in the government's priority programs and ensures consistency between programplanning and implementation. MoEC developed its own unit (UKMP3) to respond more effectively to UKP4, butas in other countries, linking this information to the budget has been a longer process. MoEC is one of the pilotministries involved in the performance-based budgeting initiative run by the Ministry of Finance and BAPPENAS,and supported by the World Bank and other development partners. Expanding and improving the current M&Eeffort and moving toward performance-informed budgeting should allow MoEC to further improve the qualityof spending and outcomes.
Given constraints and challenges associated with the 20 percent rule, it will be important to develop acontingency planning strategy for education budget management. As previously discussed, the 20 percentrule makes the education budget unpredictable, especially since it also applies to the revised budget. Increasesin the state budget automatically lead to increases in the education budget, which complicates budget planning,especially given that volatile energy subsidies are the Gol's largest budget item. High volatility in the educationbudget should be mitigated by better use of the National Education Development Fund, which requires clearguidelines on its use and a mid-term expenditure framework outlining the proportion of windfalls to be allocatedto the Fund and how and under what scenarios its resources can be used.
Implementing all these reforms will be a big challenge: the political economy of these reforms is verycomplex. Reforms that involve one stakeholder can be relatively easy to implement when resources andwillingness exist. Some of these reforms, such as expanding BSM or funding for higher education, are relativelystraightforward. However reforms that involve multiple stakeholders can prove impossible to implement ifinterests are not aligned. Reforming the transfer system is outside the control of MoEC, and has consequencesfor many sectors, not all of them positive. So balancing these incentives will be complex.
U
Spending more or spending better: Improving education financing in Indonesia
Even in the absence of big reforms to transfer mechanisms, MoEC can still improve the systemsignificantly. In addition to supporting some strategic programs such as BSM, incentivizing and supportingdistricts would be a big step in the right direction. As noted earlier, this includes supporting districts in teachermanagement through clear guidelines, and supporting implementation of multigrade teaching and otherreforms. All of this would improve efficiency and equity in the system, even if the DAU retains its current formula.Exploiting the BOSDA model to expand district support and accountability, and expanding national programsfor accountability and transparency, can also have a big effect on the quality of education.
It is time to translate the strong commitment to education into higher quality education. Indonesia isready for that qualitative leap. Although it will require the collaboration and coordination of many actors, thepotential gains are plentiful. As Indonesia consolidates as a middle-income country, ensuring the presence of ahighly-skilled labor force will be crucial. Improving the quality of education by improving the quality of spendingwould be a big step toward making sure the labor force is ready.
U
IReferences
Akhmadi, S.U. and D. Suryadarma. 2004. "When teachers are absent: Where do they go and what is the impacton students?"SMERU Field Report. SMERU Research Institute, Jakarta, Indonesia.
Alatas, V. and J. R. Jellema. 2012."Cash Transfers for Poor Students' "Background paper for the report on ProtectingPoor and Vulnerable Households in Indonesia. World Bank, Jakarta, Indonesia.
Ali, M., J. Kos, P. Lietz, D. Nugroho, Furqon, A. Zainul and E. Emiliea. 2011. "Quality of Education in Madrasah:Main Study" Final Report: Indonesia's Ministry of Religious Affairs, CSAS AusAID, the Australian Council forEducational Research (ACER), Universitas Pendidikan Indonesia (UPI) and the World BankJakarta, Indonesia.
Banerjee, A., Cole, S., Duflo, E. and Linden, L. 2007. "Remedying Education: Evidence from Two RandomizedExperiments in India." Quarterly Journal of Economics. Volume 122:3, pp: 1235-1264
Bettinger and Long. Forthcoming.
Bettinger, E. and B. Long. 2006. "Does Cheaper Mean Better? The Impact of Adjunct Instructors on StudentOutcomes." Mimeo, Harvard University.
Bruns, B., D. Filmer and H. A. Patrinos. 2011. "Making Schools Work: New Evidence on Accountability Reforms'World Bank, Washington, DC.
Cerdan-Infantes, P. et al. 2010. "Education, Training and Labor Market Outcomes for Youth in Indonesia."WorldBank, Jakarta, Indonesia.
Chen, D. 2012, forthcoming. "Broadening Life-Long-Learning Opportunities in Indonesia."World Bank, Jakarta,Indonesia.
Chen, D. 2012, forthcoming. "Preparing Indonesian Youth for Transition."World Bank, Jakarta, Indonesia.
Chen, D. 2011. "School-Based Management, School-Decision Making and Education Outcomes in IndonesianPrimary Schools." Policy Research Working Paper 5809. World Bank, Washington, DC.
De Ree, J. 2012, forthcoming. "Teacher certification in Indonesia: A doubling of salary, or a way to improvelearning?"World Bank, Jakarta, Indonesia.
Duflo, E. 2004. "The medium run effects of educational expansion: evidence from a large school constructionprogram in Indonesia."Journal of Development Economics, Vol. 74(1): 163-197.
Duflo, E., P. Dupas and M. Kremer. 2012. "School Governance, Teacher Incentives, and Pupil-Teacher Ratios:Experimental Evidence from Kenyan Primary Schools." NBER Working Paper 17939. Available at: http://www.nber.org/papers/wl 7939.pdf
Duthilleul, Y, 2005. "Lessons Learnt in the Use of Contract Teachers" Synthesis Report. UNESCO, InternationalInstitute for Educational Planning, Paris, France.
Filmer, D. and N. Schady. 2009. "Are There Diminishing Returns to Transfer Size in Conditional Cash Transfers?"Policy Research Working Paper 4999, Impact Evaluation Series No. 35. World Bank, Washington, DC.
Government of Indonesia. Badan Pengembangan Sumber Daya Manusia Pendidikan dan Kebudayaan danPenjaminan Mutu Pendidikan. 2010-2011."Teacher Data and Statistics (NUPTK)."Jakarta.
U
Spending more or spending better: Improving education financing in Indonesia
Government of Indonesia. Indonesia Central Bureau of Statistics (BPS). 2010. "National Labor Force Survey(SAKERNAS)"Jakarta.
Government of Indonesia. Indonesia Central Bureau of Statistics (BPS). 2001-2010. "National SocioeconomicHousehold Survey (SUSENAS)."Jakarta.
Government of Indonesia. Ministry of Education and Culture (MoEC). 2010. "khtisar Data Pendidikan NasionalTahun 2009/2010."Jakarta.
Government of Indonesia. Ministry of Finance (MoF). 2001-2011."Sistem Informasi Keuangan Daerah (SIKD):"
Hanushek, E. A., and L. WoBmann. 2007. "Education Quality and Economic Growth." Policy Research WorkingPaper 4122. World Bank, Washington, DC.
Hoxby, C. M. 2000."The Effects of Class Size on Student Achievement: New Evidence from Population Variation."The Quarterly Journal of Economics, 115(4): 1239-1285.
Hyunkuk, C., P. Glewwe, and M.Whitler. 201 0."Do Reductions in Class Size Raise Students'Test Schores? Evidencefrom Population Variation in Minnesota's Elementary Schools.' Department of Applied Economics,University of Minnesota.
Jensen, R. 2010."The (Perceived) Returns to Education and the Demand for Schooling."The Quarterly Journal ofEconomics, Vol. 125(2): 515-548.
Jepsen, C.and S. Rivkin. 2009."Class Size Reduction and Student Achievement: The Potential Tradeoff BetweenTeacher Quality and Class Size."Journal of Human Resources, Vol.44(1): 223-250.
King, E., A. Aarons, L. Crouch, S. Iskandar, J. Larrison, H. Moegiadi, F. Munger, J. Strudwick, and S. Muljoatmodjo.2004."Education in Indonesia: Managing theTransition to Decentralization." Report 29506, Vol. I of 3. EAPRegion, Human Development Sector Department, World Bank, Washington, DC.
Kluyskens, J. and M. Firdaus. 2009. "Teacher management: Recruitment, Selection and Data, Probation andTransfer." Backgound paper for the ESW study - Formulation of the medium term strategy (RENSTRA) forthe education sector (2009-2014). World Bank, Jakarta, Indonesia.
Kluyskens, J. and R. Rawlinson. 2008."Improving Efficiency and Equity inTeacher Employment and Deployment."World Bank, Jakarta, Indonesia.
Lewis, B. D. 2012. "Local Government Capital Spending in Indonesia: Impact of Intergovernmental Fiscal andIn-Kind Transfers." Research Report. World Bank, Jakarta, Indonesia.
Little, A. 2006. "Education for All and Multi-grade Teaching: Challenges and Opportunities." Springer, London.
McEwan, P. J. and J. S. Shapiro. 2008."The Benefits of Delayed Primary School Enrollment Discontinuity EstimatesUsing Exact Birth Dates."Journal of Human Resources, Vol.43(1):1-29.
Mulyran-Kyne, C. 2007."The Preparation ofTeachers for Multigrade Teaching." Teaching and Teacher Education,Vol. 23(2007): 501-514.
Patrinos, H. A. (Ed). 2012. "Strengthening Education Quality in East Asia."UNESCO - World Bank.
Pritchett, L. 2009."Long-Term Global Challenges in education: AreThere Feasible StepsToday?"Chapter Three in"Shaping Tomorrow Today: Near-Term Steps towards Long-Term Goals." Lempert, R.J. et. al. (eds).The RANDCorporation, Santa Monica, Arlington, Pittsburgh.
Pritchett, L. and M. Viarengo. 2009."Producing Superstars for the Economic Mundial:The Mexican Predicamentwith Quality of Education." Cambridge, Mass: John F. Kennedy School of Government, Harvard University,Program on Education Policy and Governance working paper 09-01, January 2009. As of June 18, 2009:http://www.hks.harvard.edu/pepg/PDF/Papers/Pritchett_Viarengo_PEPGO9-01.pdf
U
Reference
Rogers, F. H. and E. Vegas. 2009. "No More Cutting Class? Reducing Teacher Absence and Providing Incentives forPerformance." Policy Research Working Paper 4847. Retrieved from http://libraryl.nida.ac.th/worldbankf/fulltext/wps04847.pdf in April 2012.
SEAMEO.(2006)."Indonesia: National Education System' South East Asian Ministers of Education Organization.Retrieved from www.seameo.org/index.php?option=com_content&task=view&id=62<emid=85 inMarch 2012.
Shaeffer, S. 201 1."Multi-grade Teaching in Indonesia: Situational Analysis and Implementation Framework'Background paper prepared for Ministry of Education and Culture and World Bank Office, Jakarta,Indonesia. Unpublished.
SMERU. 2010. "Remote Area Allowance and Absentee Levels for Teachers in Remote Areas." SMERU ResearchInstitute, Jakarta.
UNESCO Institute for Statistics. 2006 - 2009 data. UNICEF. 2009. "School Readiness in Indonesia." UNICEF, Jakarta,Indonesia.
World Bank. 2012a. "Indonesia Economic Quarterly: Redirecting Spending."World Bank, Jakarta, Indonesia.
World Bank. 2012b, forthcoming. "Sub-national Public Expenditure Review (SNPER)." World Bank, Jakarta,Indonesia.
World Bank. 2010a."Investing in Multi-gradeTeaching in Indonesia"Policy Note.World Bank,Jakarta, Indonesia.
World Bank. 2010b."Transforming Indonesia's Teaching Force."World Bank, Jakarta, Indonesia.
World Bank. 2009. "Investing in Indonesia's Education at the District Level: An Analysis of Regional PublicExpenditure and Financial Management."World Bank, Jakarta, Indonesia.
World Bank - RAND. 2010. "School Based Management Survey."World Bank - RAND, Jakarta, Indonesia.
World Bank. Edstats Online Education Database. 2001 - 2010 Online Query:
Zafeirakou, A. 2007. "Education for All by 2015: Will We Make It?" Paper commissioned for the EFA GlobalMonitoring Report 2008.
U

Spending more or spending better: Improving education financing in Indonesia
U


![Electric fields and currents [118 marks] - GitHub Pages · Electric fields and currents [118 marks] 1. Three resistors are connected as shown. What is the value of the total resistance](https://img.pdfslide.us/doc/110x75/5f5225781b71730791374994/electric-fields-and-currents-118-marks-github-pages-electric-fields-and-currents.jpg)