Embed Size (px)
Citation preview

NCHRP 14-20AConsequences of
Delayed Maintenance of
Highway Assets
Carlos M. Chang, Ph.D., P.E.
2
Topics
1. Research Objectives
2. Research Approach
3. Procedure to Quantify the Consequences of
Delayed Maintenance
4. Step-by-Step Example for Pavements
5. Summary of the Main Research Contributions
6. Recommendations for Implementation.
3
Research Objectives
To provide a set of procedures to quantify
the consequences of delayed maintenance to
the highway infrastructure.
The ultimate goal is to integrate the
procedures developed for individual asset
groups into the asset management process to
support better maintenance funding decisions and
improve the communication across management
levels.

4
What is Delayed Maintenance?
Delayed maintenance is defined as the work
needed to preserve the highway system, but
postponed in the agency maintenance
program.
This definition applies to all the highway asset groups.
However, each asset group has unique characteristics in
terms of maintenance policies, condition assessment,
deterioration rates, service life, and life-cycle costs.

5
Research Approach
Task 1: Information review and on-line surveys
Task 2: Focused phone interviews with selected DOTs
Task 3: Perform delayed maintenance scenarios
The methods and analytical tools described in
the procedures can be adapted to the agency
preservation policies, maintenance resources,
and performance standards.

6
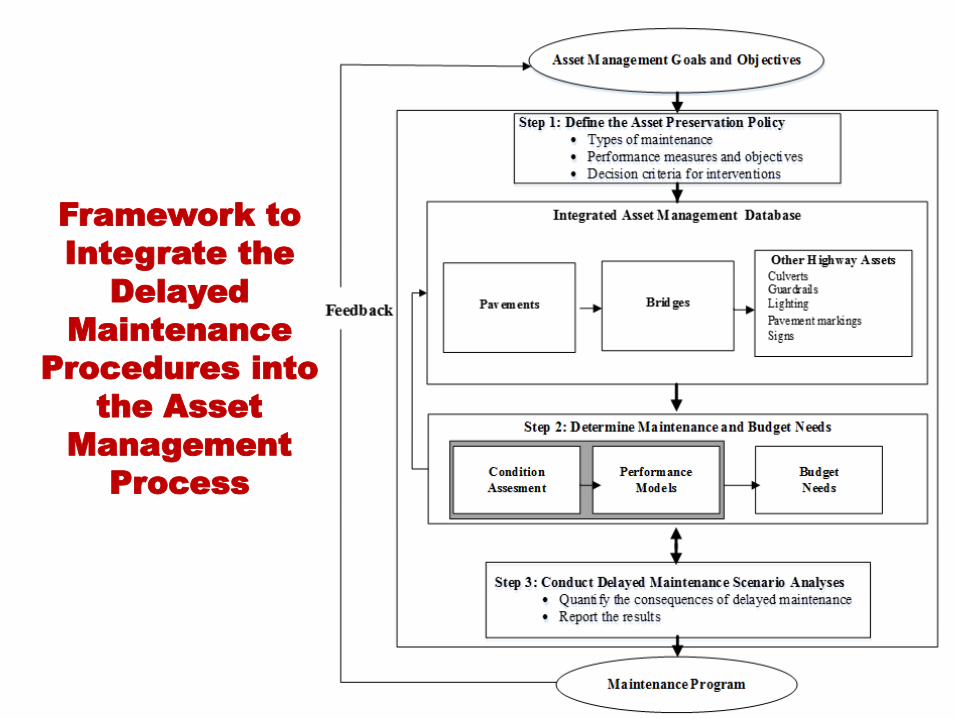
Step 1: Define the asset preservation policy
Step 2: Determine maintenance and budget
needs for the asset group
Step 3: Conduct delayed maintenance scenarios
analyses
Main Steps of the Procedure to Quantify the
Consequences of Delayed Maintenance
Pavements, Bridges, Culverts, Guardrails,
Lighting, Pavement Markings, and Signs.
7
Framework to
Integrate the
Delayed
Maintenance
Procedures into
the Asset
Management
Process

Step-by-Step
Example for Pavements
9
1.1 Identify the types of maintenance for the asset
group
Step 1
Define the Asset Preservation Policy
1.2 Establish performance objectives for the asset
group
1.3 Formulate decision criteria for maintenance
activities

10
1.1 Identify the Types of Maintenance
AASHTO 2007, Peshkin et al. 2011
11
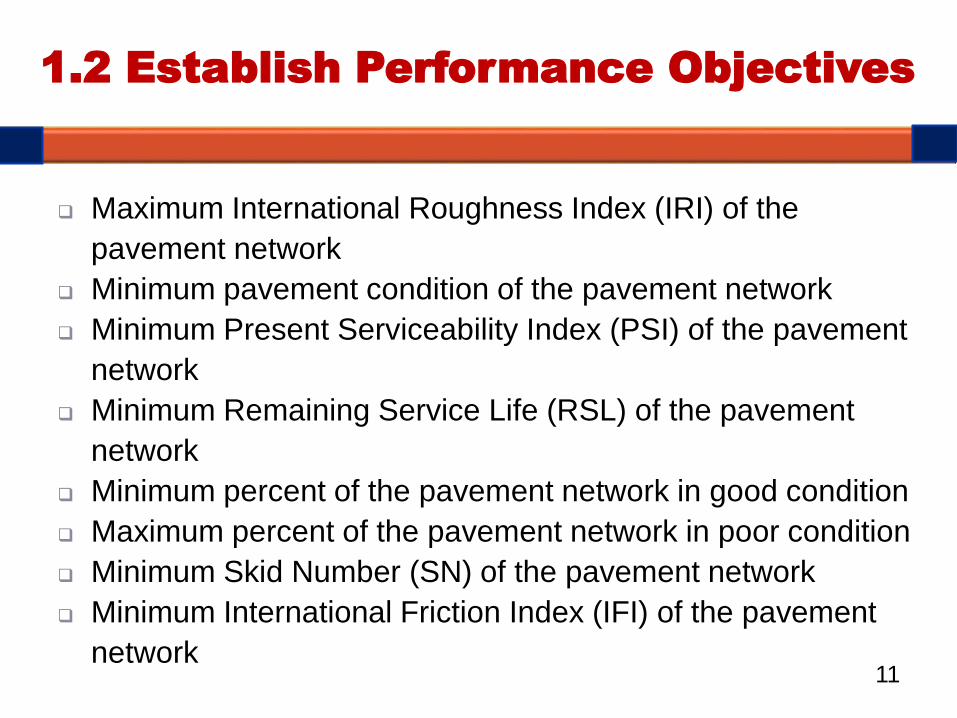
1.2 Establish Performance Objectives
Maximum International Roughness Index (IRI) of the
pavement network
Minimum pavement condition of the pavement network
Minimum Present Serviceability Index (PSI) of the pavement
network
Minimum Remaining Service Life (RSL) of the pavement
network
Minimum percent of the pavement network in good condition
Maximum percent of the pavement network in poor condition
Minimum Skid Number (SN) of the pavement network
Minimum International Friction Index (IFI) of the pavement
network
12
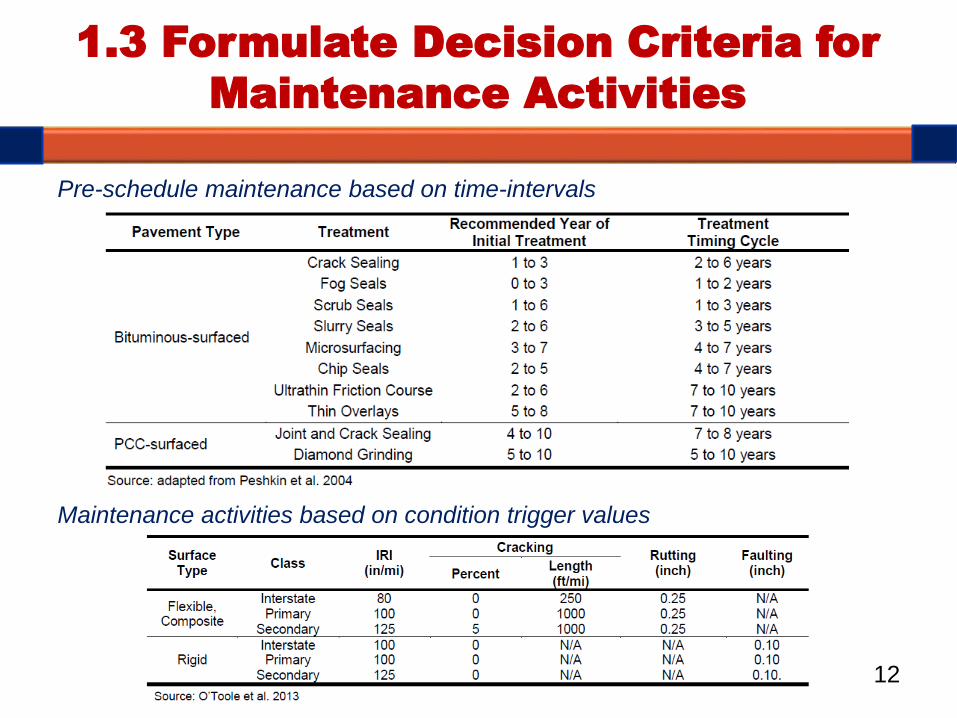
1.3 Formulate Decision Criteria for
Maintenance Activities
Pre-schedule maintenance based on time-intervals
Maintenance activities based on condition trigger values
13
2.1 Asses the asset group condition
Step 2Determine Maintenance and Budget Needs
2.2 Select performance models to forecast the
asset group condition and/or remaining life
2.3 Perform the needs analysis
14
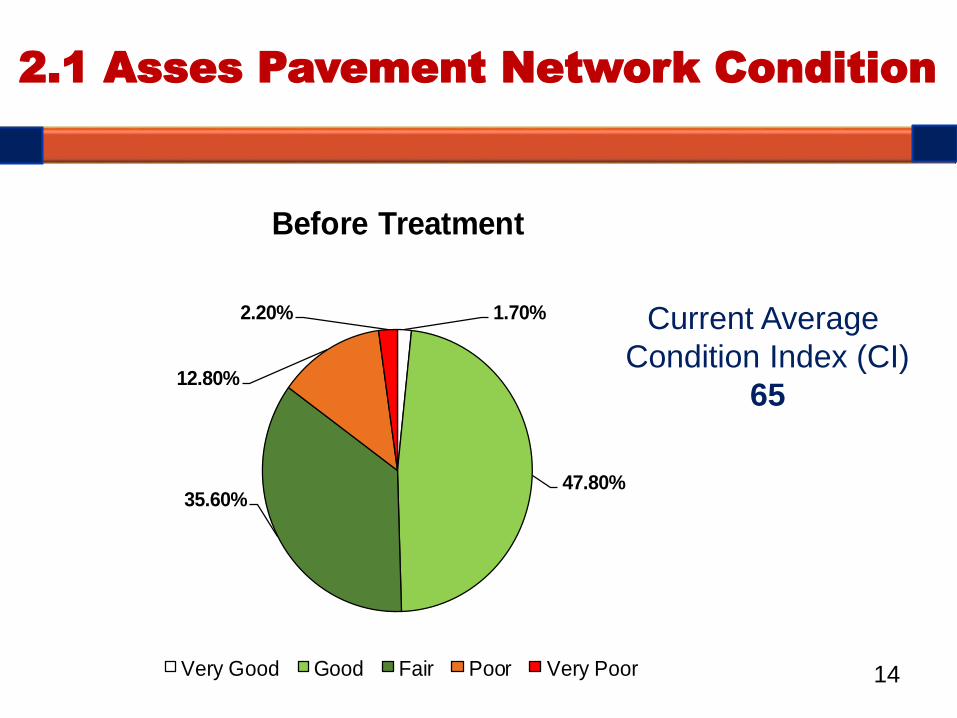
2.1 Asses Pavement Network Condition
1.70%
47.80%35.60%
12.80%
2.20%
Before Treatment
Very Good Good Fair Poor Very Poor
Current Average
Condition Index (CI)
65
15
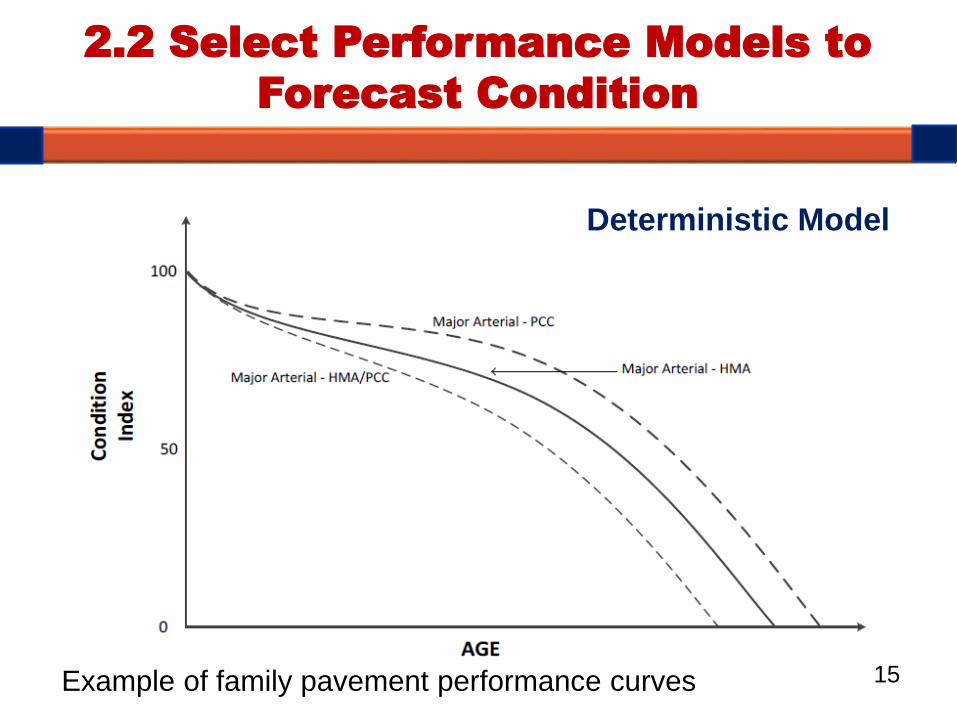
2.2 Select Performance Models to
Forecast Condition
Deterministic Model
Example of family pavement performance curves
16
2.3 Perform the Needs Analysis to Identify
Maintenance Activities to Meet the Objectives
To identify maintenance activities needed to
meet the established goals over the period of
analysis.
This analysis should be based on applying the
right treatment, to the right asset, and the right
time; in other words, it should reflect applying the
“best engineering” practices related to
maintenance treatments.

17
3.1 Formulate delayed asset maintenance
scenarios
Step 3
Maintenance Scenarios Analyses
3.2 Perform the delayed maintenance scenarios
analyses
3.3 Determine the impact and report the
consequences of delayed maintenance
18
3.1 Formulate Delayed Maintenance Scenarios
1. All needs includes the agency-preferred
maintenance policy with no funding constraints. A
baseline budget is estimated from this scenario
2. Do nothing in which no treatments are applied over
the analysis period.
3. Delayed maintenance by a given number of years
that varies for each highway asset group due to their
expected service life, decision criteria, and
consequences of postponing maintenance activities.
4. Budget-driven with limited funds for maintenance
activities.
19
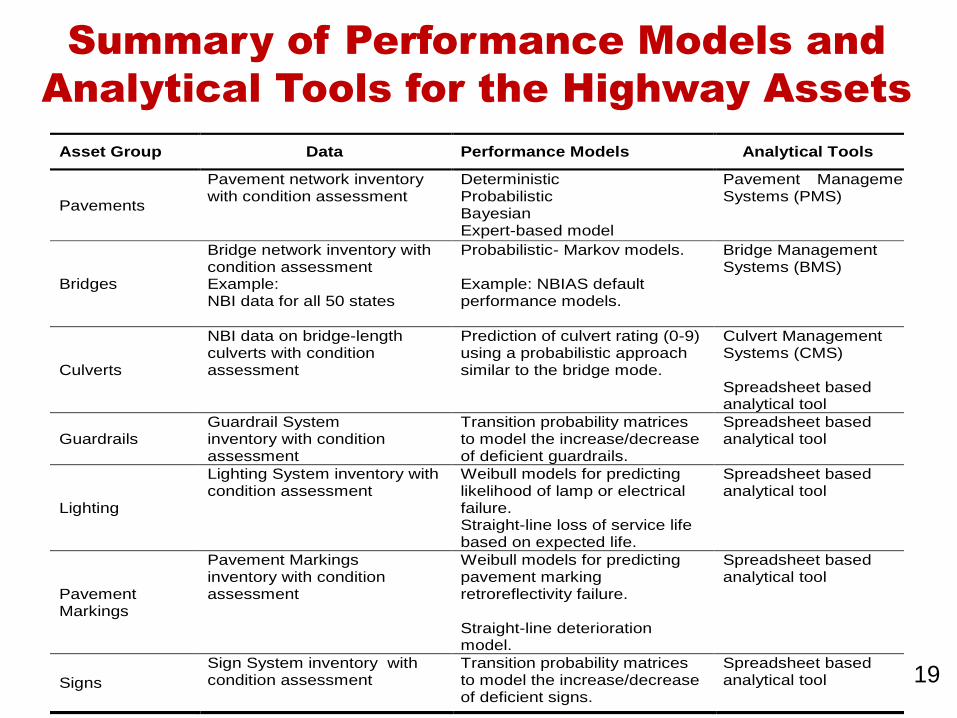
Summary of Performance Models and
Analytical Tools for the Highway Assets
Asset Group Data Performance Models Analytical Tools
Pavements
Pavement network inventory with condition assessment
Deterministic Probabilistic Bayesian Expert-based model
Pavement Management Systems (PMS)
Bridges
Bridge network inventory with condition assessment Example: NBI data for all 50 states
Probabilistic- Markov models. Example: NBIAS default performance models.
Bridge Management Systems (BMS)
Culverts
NBI data on bridge-length culverts with condition assessment
Prediction of culvert rating (0-9) using a probabilistic approach similar to the bridge mode.
Culvert Management Systems (CMS) Spreadsheet based analytical tool
Guardrails Guardrail System inventory with condition assessment
Transition probability matrices to model the increase/decrease of deficient guardrails.
Spreadsheet based analytical tool
Lighting
Lighting System inventory with condition assessment
Weibull models for predicting likelihood of lamp or electrical failure. Straight-line loss of service life based on expected life.
Spreadsheet based analytical tool
Pavement Markings
Pavement Markings inventory with condition assessment
Weibull models for predicting pavement marking retroreflectivity failure. Straight-line deterioration model.
Spreadsheet based analytical tool
Signs
Sign System inventory with condition assessment
Transition probability matrices to model the increase/decrease of deficient signs.
Spreadsheet based analytical tool

20
3.2 Delayed Maintenance Scenarios Analyses
Summary of Results
20-year analysis period
21
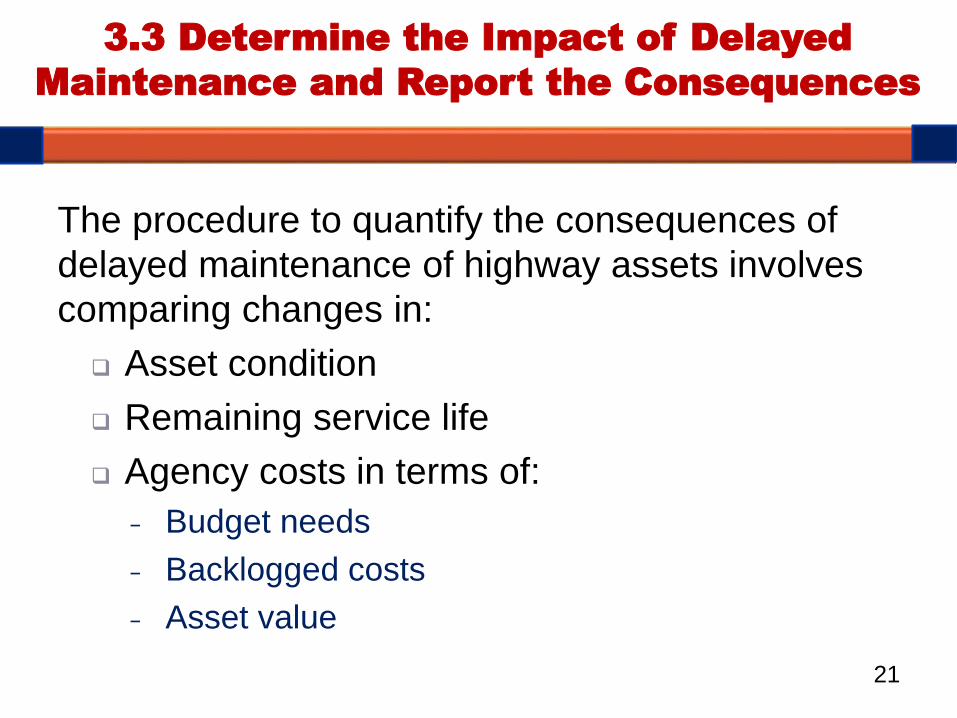
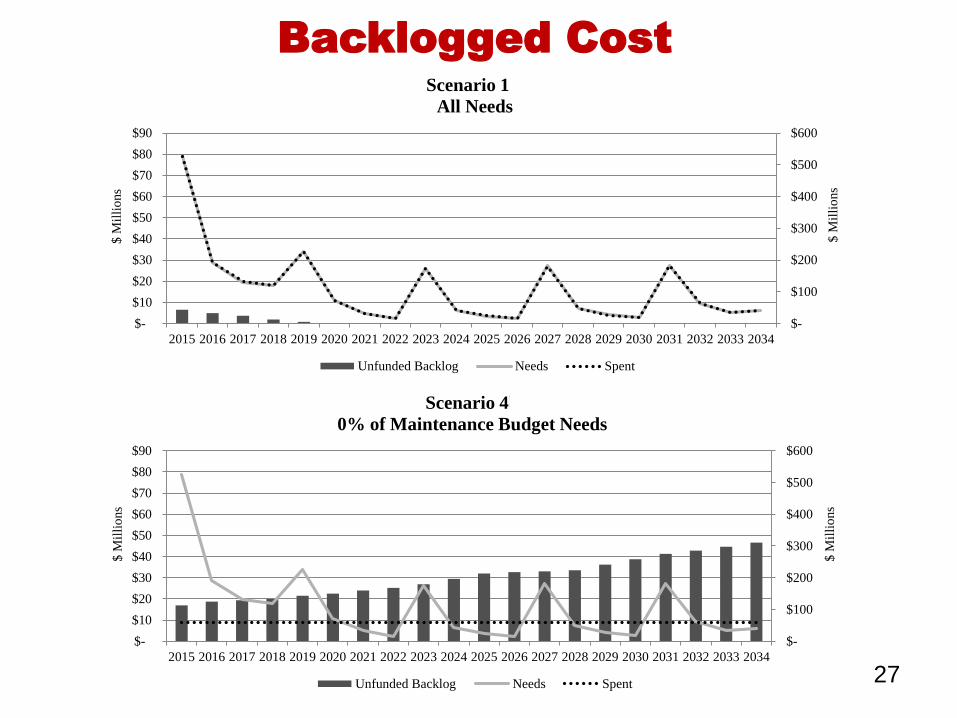
The procedure to quantify the consequences of
delayed maintenance of highway assets involves
comparing changes in:
Asset condition
Remaining service life
Agency costs in terms of:
− Budget needs
− Backlogged costs
− Asset value
3.3 Determine the Impact of Delayed
Maintenance and Report the Consequences
How to Report the
Consequences of Delayed
Maintenance?
23
0
10
20
30
40
50
60
70
80
90
100
Co
nd
itio
n I
nd
ex
Year
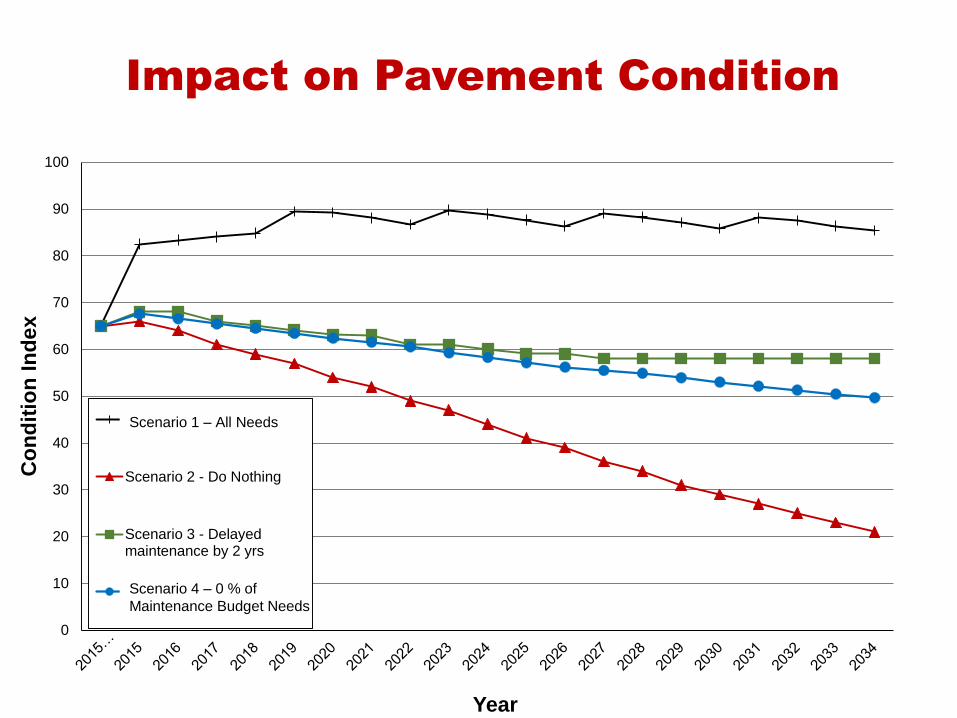
Scenario 1.a - All Needs
Scenario 2 - Do Nothing
Scenario 3 - Delayedmaintenance by 2 yrs
Scenario 4.b - 0 % ofMaintenance Budget Needs
Scenario 1 – All Needs
Scenario 4 – 0 % of
Maintenance Budget Needs
Impact on Pavement Condition
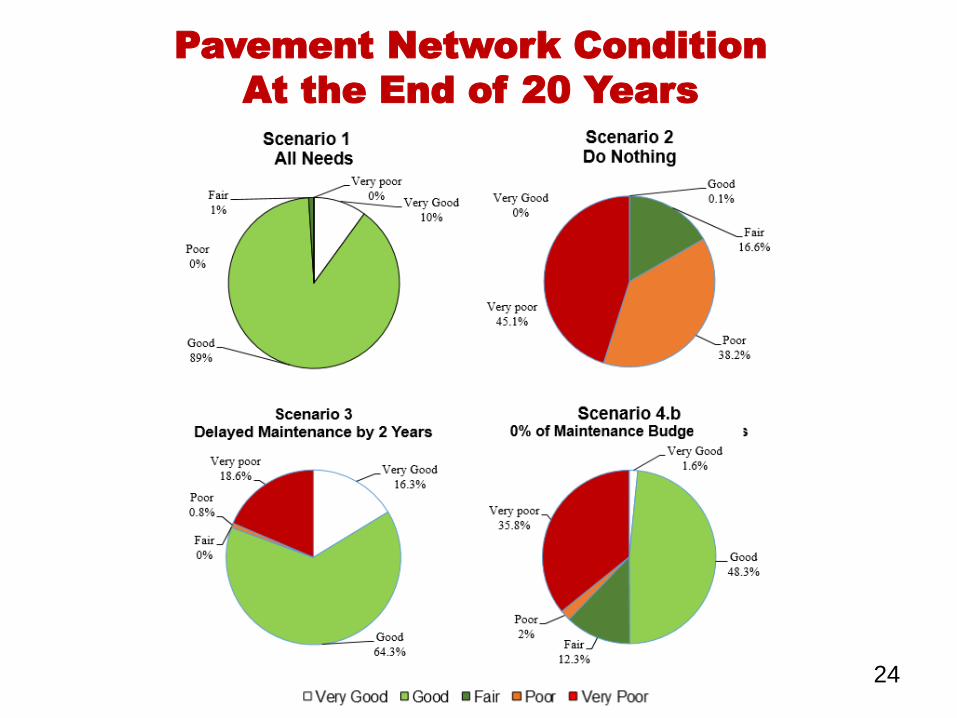
24
Pavement Network Condition
At the End of 20 Years

25
Remaining Service Life
0
10
20
30
40
50
60
70
80
90
100
<2 years 2-5 years 5-10 years 10-15 years 15-20 years >20 years
Rem
ain
ing
Lif
e C
ate
go
ry (
%)
Remaining Life at the End of Analysis (year 2034)
Before Treatment Scenario 1.a - All Needs
Scenario 2 - Do Nothing Scenario 3 - Delayed Maintenance by 2 Years
Scenario 4.b - 0% of Maintenance Budget Needs
20-year analysis period
26
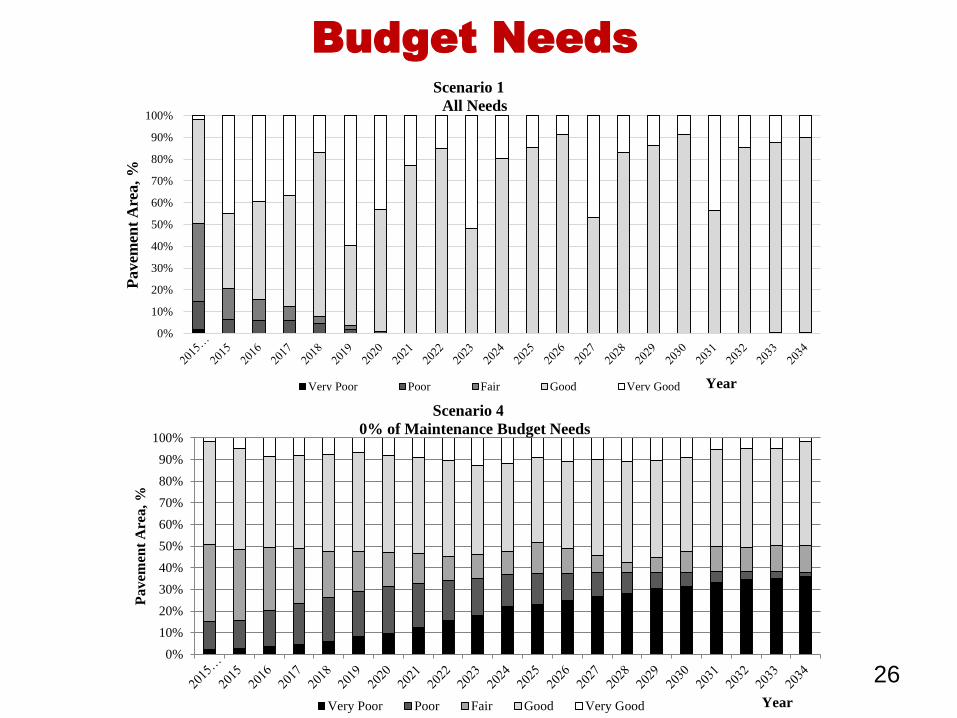
Budget Needs
0%
10%
20%
30%
40%
50%
60%
70%
80%
90%
100%
Pavem
ent
Are
a,
%
Year
Scenario 1.a
All Needs
Very Poor Poor Fair Good Very Good
0%
10%
20%
30%
40%
50%
60%
70%
80%
90%
100%
Pav
em
en
t A
rea
, %
Year
Scenario 4.b
0% of Maintenance Budget Needs
Very Poor Poor Fair Good Very Good
27
Backlogged Cost
$-
$100
$200
$300
$400
$500
$600
$-
$10
$20
$30
$40
$50
$60
$70
$80
$90
2015 2016 2017 2018 2019 2020 2021 2022 2023 2024 2025 2026 2027 2028 2029 2030 2031 2032 2033 2034
$ M
illi
ons
$ M
illi
ons
Scenario 1.a
All Needs
Unfunded Backlog Needs Spent
$-
$100
$200
$300
$400
$500
$600
$-
$10
$20
$30
$40
$50
$60
$70
$80
$90
2015 2016 2017 2018 2019 2020 2021 2022 2023 2024 2025 2026 2027 2028 2029 2030 2031 2032 2033 2034
$ M
illi
ons
$ M
illi
ons
Scenario 4b
0% of Maintenance Budget Needs
Unfunded Backlog Needs Spent

28
Pavement Network Value
1 2 3 4 5 6 7 8 9 10 11 12 13 14 15 16 17 18 19 20
Network Value (US $ million) $621 $631 $640 $651 $658 $662 $664 $664 $664 $664 $664 $664 $664 $664 $664 $664 $664 $664 $664 $664
Sustainability Ratio 0.65 0.47 0.45 0.58 0.86 0.89 1.00 1.00 1.00 1.00 1.00 1.00 1.00 1.00 1.00 1.00 1.00 1.00 1.00 1.00
-
0.10
0.20
0.30
0.40
0.50
0.60
0.70
0.80
0.90
1.00
$-
$100
$200
$300
$400
$500
$600
$700
PS
R
$ M
illi
on
s
Scenario 1.a - All Needs
1 2 3 4 5 6 7 8 9 10 11 12 13 14 15 16 17 18 19 20
Network Value (US $ million) $551 $539 $534 $530 $521 $514 $504 $496 $484 $467 $451 $446 $444 $440 $423 $406 $389 $378 $366 $353
Sustainability Ratio 0.07 0.07 0.07 0.06 0.06 0.06 0.05 0.05 0.05 0.04 0.04 0.04 0.04 0.04 0.04 0.03 0.03 0.03 0.03 0.03
0.00
0.10
0.20
0.30
0.40
0.50
0.60
0.70
0.80
0.90
1.00
$-
$100
$200
$300
$400
$500
$600
PS
R
$ M
illi
on
s
Scenario 4.b - 0% of Maintenance Budget Needs
29
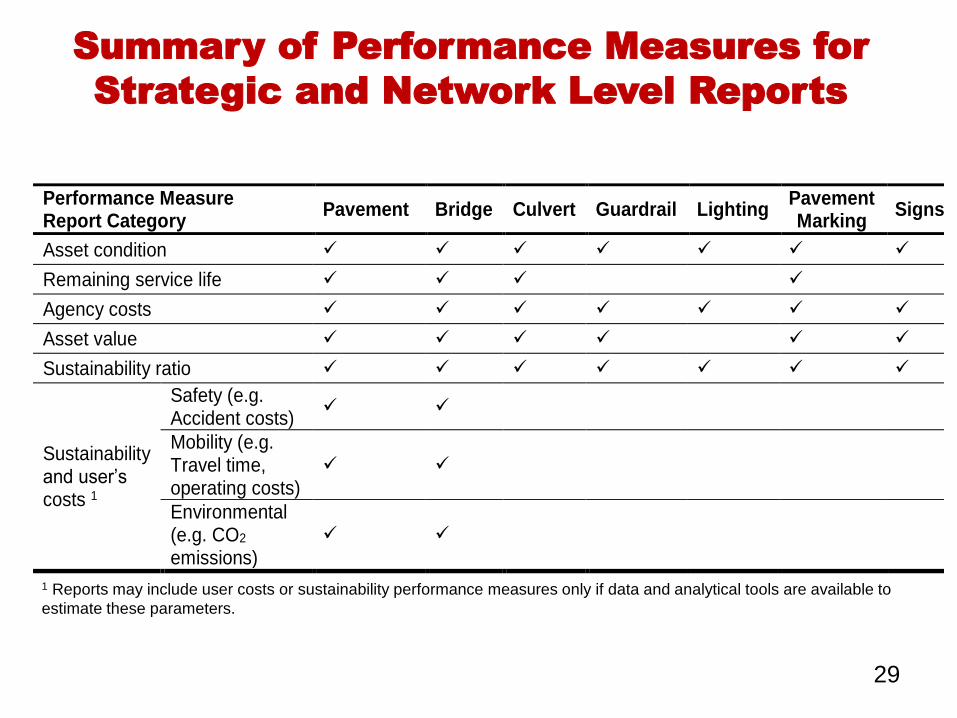
Summary of Performance Measures for
Strategic and Network Level Reports
Performance Measure Report Category
Pavement Bridge Culvert Guardrail Lighting Pavement Marking
Signs
Asset condition
Remaining service life
Agency costs
Asset value
Sustainability ratio
Sustainability and user’s costs 1
Safety (e.g. Accident costs)
Mobility (e.g. Travel time, operating costs)
Environmental (e.g. CO2 emissions)
1 Reports may include user costs or sustainability performance measures only if data and analytical tools are available to
estimate these parameters.
30
1. The procedures describe preservation policies,
maintenance practices, inventory data, condition
assessment methods, analytical tools for analyses,
and reports to assist agencies in quantifying the
consequences of delayed maintenance.
2. The procedures have been prepared in a practical,
adaptable, and easy-to-follow format with focus on
implementation. Therefore, the procedures can be
implemented using agency-specific analysis tools from
existing management systems
Summary of Main
Research Contributions
31
1. Make the decision to proceed with the implementation
2. Integrate the preservation policies into an overall asset
management process
3. Periodic update of the asset group inventory, condition
assessment, and service life data. The procedures rely
on up-to-date records with reliable maintenance and
inspection data to develop or calibrate performance
models
4. Select appropriate analytical tools to perform the needs
and scenario analyses
5. Select reports to facilitate the interpretation of the results
from the scenario analyses
Recommendations for Implementation
32
Acknowledgments
We are thankful to the National Cooperative Highway
Research Program for the opportunity to work on the
NCHRP 14-20-A research project.
We also want to acknowledge the Project Coordinator
Dr. Amir Hanna for his advice along this project, the panel
members, and the DOTs and cities for their valuable input
on maintenance practices.

33
Research Team
The University of Texas at El Paso
Carlos M. Chang, Ph.D., P.E.
Soheil Nazarian, Ph.D., P.E.
Marketa Vavrova, Ph.D., E.I.T.
Research Assistants
Luis Valdez
Erick Munoz
John Padilla
Sandra Gutierrez
Shahrouz J. Ghadimi
Oscar Ortega
Edgar Rodriguez
Nichols Consulting Engineers, Chtd
Margot T. Yapp, P.E.
Linda M. Pierce, Ph.D., P.E.
Timin Punnackal, E.IT.
Jason Puccinelli, P.E.
Mei-Hui Lee, Ph.D.
Spy Pond Partners, LLC
William Robert
Consultant
Roger E. Smith, Ph.D., P.E.