Embed Size (px)
Citation preview

PD-L1: Immune checkpoint blockade in cancer
Kenneth J. Bloom, MD, FCAP President, Human Longevity, Inc Head of Oncology and Immunotherapy
Nov 3, 2016

Webinar Host
• This series is sponsored by the Personalized Healthcare (PHC) Committee
• Today’s webinar host is Jordan Laser, MD, FCAP
© 2016 College of American Pathologists. All rights reserved.

Housekeeping
• This presentation will be recorded. The recording and PDF will go out to all registrants in several weeks
• All lines are muted during the presentation
• Please send in your questions as you think of them via the “Question box” in your control panel
© 2016 College of American Pathologists. All rights reserved.

Kenneth J. Bloom, MD, FCAP
• President and Head of oncology and immunotheraphy at Human Longevity, Inc
• Has published over 50 peer-reviewed articles, more than 100 abstracts, and several book chapters
© 2016 College of American Pathologists. All rights reserved.

Disclosures
• Human Longevity, Inc. – Employee and Shareholder
• Bristol-Myers Squibb – Advisory Board and Consultant
• Genentech – Advisory Board
• Roche – Advisory Board
• Ventana – Consultant
© 2016 College of American Pathologists. All rights reserved.

Disclaimer
• The CAP does not permit reproduction of any substantial portion of the material in this Webinar without its written authorization. The CAP hereby authorizes attendees of the CAP Webinar to use the PDF presentation solely for educational purposes within their own institutions. The CAP prohibits use of the material in the Webinar – and any unauthorized use of the CAP’s name or logo – in connection with promotional efforts by marketers of laboratory equipment, reagents, materials, or services.
6 © 2016 College of American Pathologists. All rights reserved.

Disclaimer, continued
• Opinions expressed by the speaker are the speaker’s own and do not necessarily reflect an endorsement by the CAP of any organizations, equipment, reagents, materials, or services used by participating laboratories.
© 2016 College of American Pathologists. All rights reserved.

Your Immune System has two main ways to respond to foreign invaders:
Innate versus adaptive
Innate Immunity (rapid response)
Adaptive Immunity (slower response)
Dranoff G. Cytokines in cancer pathogenesis and cancer therapy. Nat Rev Cancer. 2004;4(1):11-22.

The Cells of Our Immune System Are Constantly Monitoring Our Tissues
© 2016 College of American Pathologists. All rights reserved.
Stress-Associated Molecule
NKG2D
Natural Killer cells or NK cells sense stress associated molecules on the surface of cancerous and damaged cells

CD8 Cell
Tumor Mutations Create Neoantigen T-Cell Targets
© 2016 College of American Pathologists. All rights reserved.
Endoplasmic Reticulum
Protein
Proteasome
Mutations
Peptides
TAP
MHC1 Neoantigen TCR
• The proteasome degrades intracellular proteins into short peptides that will be transported to the ER via TAP transport. Most peptides won’t bind to MHC class 1 molecules but if a peptide binds with high affinity, the stable complex will be transported to the membrane surface.

Dendritic Cells Activate Cytotoxic T-Cells
MHC 2 TCR
CD80/ CD86 CD28
T-Helper Cell MHC 1
Cytotoxic T-Cell
CD8
CD4
Blausen.com staff. "Blausen gallery 2014". Wikiversity Journal of Medicine. DOI:10.15347/wjm/2014.010. ISSN 20018762. License CC BY 3.0

The Cancer-immunity Cycle
Modified from Chen and Mellman. Immunity 2013
Accessing the tumor
Active T cell
TUMOUR MICROENVIRONMENT
3 Priming and activation
2 Cancer antigen presentation
1 Release of cancer cell antigens
7 Killing of cancer cells
6 Recognition of cancer cells by T cells
5 Infiltration of T cells into tumors
4 Trafficking of T cells to tumors
Apoptotic tumor cell
Cancer-cell recognition and initiation of cytotoxicity
Antigens
Initiating and propagating anti-cancer immunity
Dendritic cell
Active T cell
Tumor cell

From theory to practice
Pardoll. Nat Rev Cancer 2012
Lymph node Tumour microenvironment
MHC
T cell
Tumour cell
Antigen presenting cell
TCR
B7.1/ B7.2
CTLA-4
T cell
TCR MHC
PD-1 PD-L1/ PD-L2
CTLA-4 pathway PD-1 pathway

Baseline
Post C2 (Week 6)
Baseline
23 months
Baseline
Day 90
CD8
CD8
Immunotherapies targeting PD-L1 and PD-1 are having a dramatic impact in the clinic
1. Chaft et al. WCLC 2015; 2. McDermott et al. J Clin Oncol 2015; 3. Hamid et al. N Engl J Med 2013
Patient with NSCLC treated with atezolizumab (FIR study)1
Patient with RCC treated with nivolumab (NCT00730639)2
Patient with melanoma treated with pembrolizumab (KEYNOTE-001)3

Key Differences Between Targeted Therapy and Immunotherapy
© 2016 College of American Pathologists. All rights reserved.
Targeted Therapy Immunotherapy
Tends to be organ specific Pan tumor potential
Patients negative for biomarker get no benefit
Patients negative for biomarker still get benefit
Benefits seen early
Benefit not always seen early
Duration of benefit limited Extended duration of benefit
Impact on survival limited Impact on overall survival
Biomarker in tumor cells Tumor cells + TME

Broad pan-tumor potential with anti-PDL1/PD1 inhibitors: approximate ORR in all-comers with monotherapy
Modified from Chen. BioScience Forum 2015

Durable responses for PD-L1/PD-1 inhibitors
1. Petrylak et al. ASCO 2015; 2. Plimack et al. ASCO 2015; 3. Motzer et al. ASCO 2014; 4. Spigel et al. ASCO 2015
Durable responses have been seen across a range of tumour types
Nivolumab in RCC3
0.3mg/kg (n=12) 2mg/kg (n=12) 10mg/kg (n=11) Time to response Ongoing response
0 3 6 9 12 15 18 21 24 27 30 Time (months)
Resp
onde
rs
Atezolizumab in UBC1
Patients with UBC and CR or PR as best response
0 50 100 150 200 250 300 350 400 450 500 550 600 Time (days)
Treatment duration (IC2/3) Treatment duration (IC0/1) First CR/PR First PD Treatment discontinuationa Ongoing responsea
1 year
Pembrolizumab in UBC2
Onoing treatment CR PR PD as best response PD after non-PD Last pembrolizumab dose
0 20 40 60 80 Time (weeks)
Durvalumab in NSCLC4
0 6 18 24 30 36 42 54 60 66 72 Weeks since treatment initiation
48 12
Time to and on-treatment response Off treatment response Time to response D/C treatment ongoing response *
* * *
*
* *
Resp
onde
rs
Resp
onde
rs
Resp
onde
rs

How can we realise the promise of cancer immunotherapy?
Pathology
Science Clinic
More comprehensive analysis of tumor and tumor microenvironment
Better understand the underlying
immune response to tumor cells
Personalize cancer immunotherapy to
improve patient outcomes

The Tumor Microenvironment (TME) Shapes Tumor Evolution
© 2016 College of American Pathologists. All rights reserved.
• The immune system naturally identifies and eliminates cancerous cells
Normal fibroblasts
Ag recognition
Type I cytokines
Ag
NK cells

The TME Aids T-Cell Tolerance Contributing to Uncontrolled Tumor Growth
© 2016 College of American Pathologists. All rights reserved.
Dendritic cell CTL
Macrophage
B cell
Mast cell Granulocyte
Eosinophil NK cell
Treg MDSC
Platelet
Tumor microenvironment
Mesenchymal origin Pericyte Fibroblast
Vascular endothelium
Tumor cell
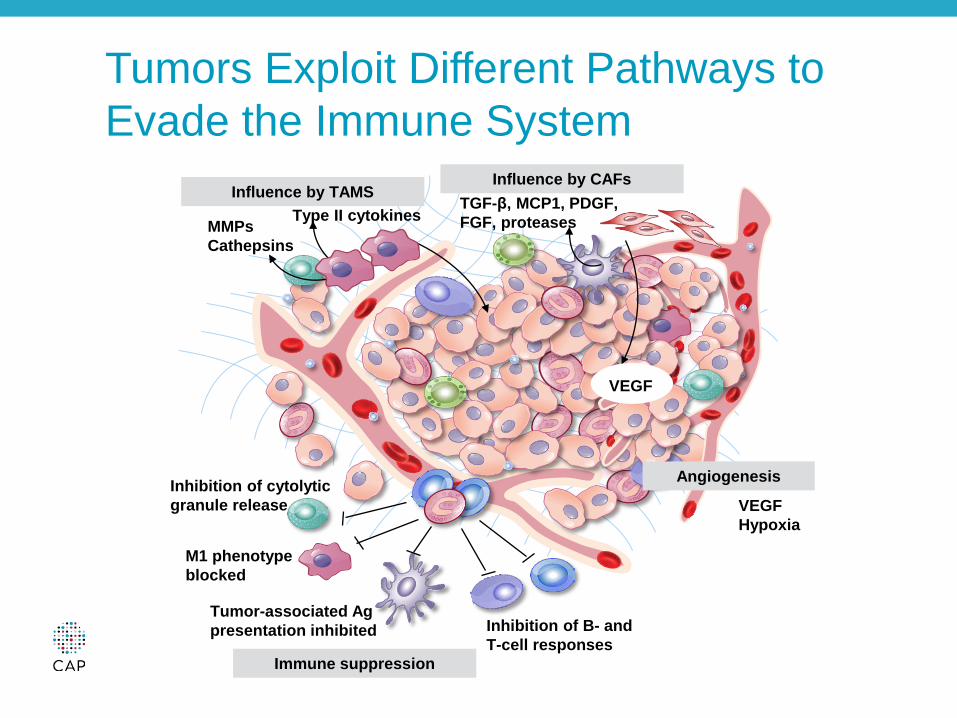
Tumors Exploit Different Pathways to Evade the Immune System
Influence by TAMS
MMPs Cathepsins
Type II cytokines
Influence by CAFs TGF-β, MCP1, PDGF, FGF, proteases
Angiogenesis
Inhibition of B- and T-cell responses
Tumor-associated Ag presentation inhibited
M1 phenotype blocked
Inhibition of cytolytic granule release
Immune suppression
VEGF Hypoxia
VEGF

Checkpoint pathways
Pardoll. Nat Rev Cancer 2012
Inhibitory interactions
APC/tumour APC/tumour
CTLA-4
PD-1
PD-L1
B7.1
BTLA
LAG-3
HVEM
MHC
B7.1
PD-L2
B7.2
Activating interactions
CD137
CD28
OX40
GITR
CD27
CD70
CD137L
GITRL
OX40L
B7.1
TCR
B7.2
MHC
T cell

Why do some patients not respond?
Stable disease (SD)
Monotherapy durable responses (PR/CR)
Non-response
Atezolizumab phase II data: UC IC2/3 patients
100
0
–100
*
Max
imum
SLD
redu
ctio
n fro
m b
asel
ine
(%)
SLD, sum of longest diameters. * >100% increase. Per RECIST v1.1 (independent review). Data cutoff September 14, 2015. Patients without post-baseline tumor assessments included those who discontinued before the first tumour assessment and are not plotted. Several patients with CR had <100% reduction due to lymph node target lesions. All lymph nodes returned to normal size per RECIST v1.1. Rosenberg et al. Lancet 2016

Pathology assessment for anti-PDL1/PD1 therapy
Topalian SL, Taube JM, Anders RA, Pardoll DM. Mechanism-driven biomarkers to guide immune checkpoint blockade in cancer therapy. Nat Rev Cancer. 2016;16(5):275-87.
NO YES
No recognizable antigen Immune compromised Lack of presentation
Lack of priming Trafficking of CD8 cells
Infiltration of T cells Other TME issues
Is there evidence of an adaptive immune response? ?PD-L1 expression
Is the tumor inflamed?

TILs and TIL clonality as a predictor of response in melanoma patients receiving PD-1 therapy
Tumeh PC, Harview CL, Yearley JH, et al. PD-1 blockade induces responses by inhibiting adaptive immune resistance. Nature. 2014;515(7528):568-71.

Inflamed versus non-inflamed tumors
Schmid et al. ECC 2015; Herbst et al. Nature 2014 Tumeh et al. Nature 2014; Ji et al. Cancer Immunol Immunother 2012
Non-inflamed Inflamed
Respond favourably to checkpoint inhibition
Least likely to respond to checkpoint inhibition
How can we convert these tumours to
become inflamed?
Respond poorly to checkpoint inhibition
How can we further enhance T cell function?
Inflamed

Why do some patients not respond?
Atezolizumab phase II data: UC IC2/3 patients
Complete response Partial response Progressive disease Stable disease
100
0
–100
52/85 (61%)
*
Max
imum
SLD
redu
ctio
n fro
m b
asel
ine
(%)
Unknown
Stable disease (SD)
Monotherapy durable responses (PR/CR)
PD-L1 expression?
Tumour infiltrating lymphocytes?
Mutational load?
Non-response

Presence of tumor infiltrating lymphocytes influences outcome
The association of immune cell infiltrates with prognosis in cancer1
Patients with a pre-existing immune response derive the most benefit from checkpoint inhibitors2
100
Artic
les
publ
ishe
d (%
)
80
60
40
20
0
Good None Poor
CD8+
CD45RO+ TH1 cell
TH2 cell
TH17 cell
TReg cell
58/60 14/15
4/8 4/8
14/33
Effects on prognosis
OS association for IFNγ-signature for atezolizumab in NSCLC (POPLAR)2
Teff /IFN-γ gene signature subgroups
Teff /IFN-γ high HR 0.43 (95% CI 0.24–0.77)
Teff /IFN-γ low HR 1.10 (95% CI 0.68–1.76)
0 2 4 6 8 10 12 14 16 18 20
0
20
40
60
80
100
Atezolizumab (Teff /IFNγ high) Atezolizumab (Teff /IFNγ low) Docetaxel (Teff /IFNγ high) Docetaxel (Teff /IFNγ low)
Follow-up (months)
OS
(%)
Teff/IFN-γ: CD8A, GZMA, GZMB, CXCL9, EOMES, IFNg, CXCL10, T-bet 1. Fridman et al. Nat Rev Cancer 2012; 2. Fehrenbacher et al. Lancet 2016

Higher levels of PD-L1 expression associated with improved OS
OS in KEYNOTE-010 (2L+ NSCLC; pembrolizumab)2
OS in POPLAR (2L+ NSCLC; atezolizumab)1
OS in CheckMate 057 (2L Non-Squamous NSCLC; nivolumab)3
n (%) HR* 95% Cl p value
TC3 or IC3 47 (16%) 0.49 0.22–1.07 0.068
TC2/3 or IC2/3 105 (37%) 0.54 0.33–0.89 0.014
TC1/2/3 or IC1/2/3 195 (68%) 0.59 0.40–0.85 0.005
TC0 and IC0 92 (32%) 1.04 0.62–1.75 0.871
Intention to treat 287 0.73 0.53–0.99 0.040
Favours atezolizumab Docetaxel
0.2 1 2
Favours pembrolizumab
Favours docetaxel
0.1 1 10
PD-L1 expression level
Nivolumab n
Docetaxel N
Unstratified HR (95% Cl)
Interaction P-value
≥1% 123 123 0.59 (0.43–0.82) 0.06
<1% 108 101 0.90 (0.66–1.24)
≥5% 95 86 0.43 (0.30–0.63) <0.001
<5% 136 138 1.01 (0.77–1.34)
≥10% 86 79 0.40 (0.26–0.59) <0.001
<10% 45 145 1.00 (0.76–1.31)
Events/patients (n) HR 95% Cl
≥50% 204/442 0.53 0.40–0.70
1–49% 317/591 0.76 0.60–0.96
0.2 1 2 0.5 Nivolumab
1. Fahrenbacher et al. Lancet 2016; 2. Herbst et al. Lancet 2015 3. Borghaei et al. N Engl J Med 2015 (suppl)

Mutational load may influence outcomes
For a given tumor type, mutations/neo-antigens
correlate with clinical benefits
MSIhigh CRC1
Months
0 3 6 9 12 15 0
0.2
0.4
0.6
0.8
1.0
Pro
babi
lity
of o
vera
ll su
rviv
al
Mismatch repair-proficient Mismatch repair-deficient
P=0.03 by log-rank test
NSCLC3
Months
0 4 8 12
20 24 0
50
100
Per
cent
age
prog
ress
ion-
free
Low neoantigen burden High neoantigen burden
16
Melanoma2
Months
0 20 40 60 80 100 0
20
40
60
80
100
Sur
viva
l (%
of p
atie
nts)
Without neoepitope signature (n=23) With neoepitope signature (n=16)
*p=0.017 1. Le et al. N Engl J Med 2015; 2. Snyder et al. N Engl J Med 2014; 3. Rizvi et al. Science 2015; 4. Madore et al. Clin Cancer Res 2016; 5 Hugo et al. Cell 2016
1.0
0.8
0.6
0.4
0.2
0 0 1 2 3 4 5 6
Survival (years)
Frac
tion
surv
ivin
g
nsSNV count Top third Bottom third p=0.005
4
3
2
1
0
Som
atic
nsS
NV
s (1
,000
s)
p=4.6e-5

Likelihood of neoantigen expression by human cancer
Schumacher TN, Schreiber RD. Neoantigens in cancer immunotherapy. Science. 2015;348(6230):69-74.
Mel
anom
a Lu
ng s
quam
ous
Lung
ade
no
Sto
mac
h E
soph
agus
Lu
ng s
mal
l cel
l C
olor
ecta
l B
ladd
er
Ute
rus
Cer
vix
Live
r H
ead
and
neck
K
idne
y, c
lear
cel
l B
-Cel
l lym
phom
a K
idne
y, p
apilla
ry
Bre
ast
Pan
crea
s M
yelo
ma
Ova
ry
Pro
stat
e G
liobl
asto
ma
Glio
ma
Neu
robl
asto
ma
CLL
K
idne
y, c
hrom
opho
be
Thyr
oid
ALL
A
ML
Pilo
cytic
ast
rocy
tom
a
Med
ullo
blas
tom
a
0.01
0.1
1.0
10.0
100
1000 Formation of neoantigens
Frequently
Regularly
Occasionally
Som
atic
mut
atio
n pr
eval
ence
m
utat
ions
per
meg
abas
e
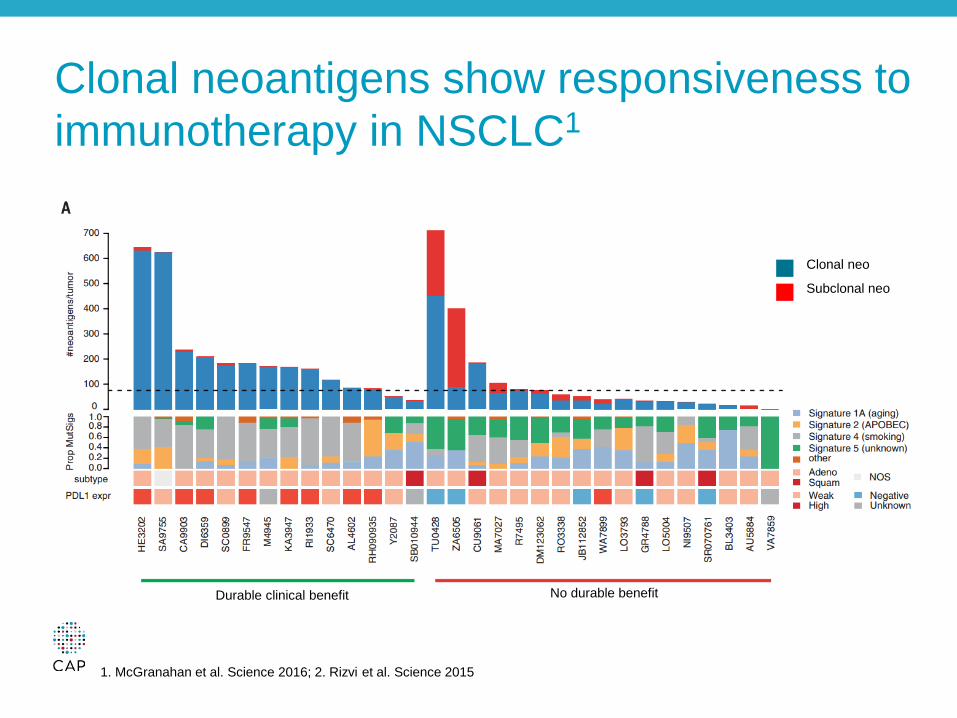
Clonal neoantigens show responsiveness to immunotherapy in NSCLC1
1. McGranahan et al. Science 2016; 2. Rizvi et al. Science 2015
Clonal neo
Subclonal neo
No durable benefit Durable clinical benefit

PD-L1 is not good enough
Non-sq.=non-squamous; sq.=squamous 1. Weber et al. Lancet 2015; 2. Robert et al. Lancet 2015; 3. Larkin et al. N Engl J Med 2015; 4. Borghaei et al. N Engl J Med 2015 5. Brahmer et al. N Engl J Med 2015; 6. Antonia et al. ASCO 2015; 7. Motzer et al. J Clin Oncol 2015; 8. Le et al. ASCO GI 2016 9. Kefford et al. ASCO 2014; 10. Garon et al. N Engl J Med 2015; 11. Plimack et al. ASCO 2015; 12. Vansteenkiste et al. ECC 2015 13. Rosenberg et al. Lancet 2016; 14. McDermott et al. J Clin Oncol 2015; 15. Rizvi et al. ASCO 2015; 16. Segal et al. ASCO 2015 17. Gulley et al. ASCO 2015; 18. Apolo et al. ASCO GU 2016; 19. Dirix et al. SABCS 2015; 20. Chung et al. ASCO GI 2016
0
20
40
60
80ITTPD-L1+PD-L1-
Nivolumab Pembrolizumab Durvalumab Avelumab Atezolizumab
ORR
(%)
~50%
~20%
~30%

What are the limitations of PD-L1 as a biomarker?
34
Agent Atezolizumab1,2
(Genentech/Roche) Nivolumab3,4
(BMS) Pembrolizumab5,6
(Merck) Durvalumab7
(AZ/MedImmune)
Therapeutic Target PD-L1 PD-1 PD-1 PD-L1
PD-L1 IHC Assay Ventana SP142 Dako 28-8 Dako 22C3 Ventana SP263
Class III IVD in the market
No (RUO available) Yes Yes No
(Class I available)
Cell types scored NSCLC – TC/IC UBC – IC NSCLC - TC NSCLC – TC
UBC – TC/IC NSCLC - TC
Cut-off definitions (NSCLC)
TC or IC≥1% TC or IC≥5%
TC≥50% or IC≥10%
TC≥1% TC≥5%
TC≥10%
TC=1%-49% TC≥50% TC≥25%
Cut-off definitions (UBC)
IC≥10%; IC≥5%; IC≥1% NA ≥1% TC or any
stromal staining NA
1. Fehrenbacher, et al. Lancet 2016; 2. Rosenberg, et al. Lancet 2016; 3. Borghaei, et al. N Engl J Med 2015 4. Brahmer, et al. N Engl J Med 2015; 5. Herbst, et al. N Engl J Med 2015; 6. Plimack, et al. ASCO 2015; 7. Rebelatto, et al. ASCO 2015
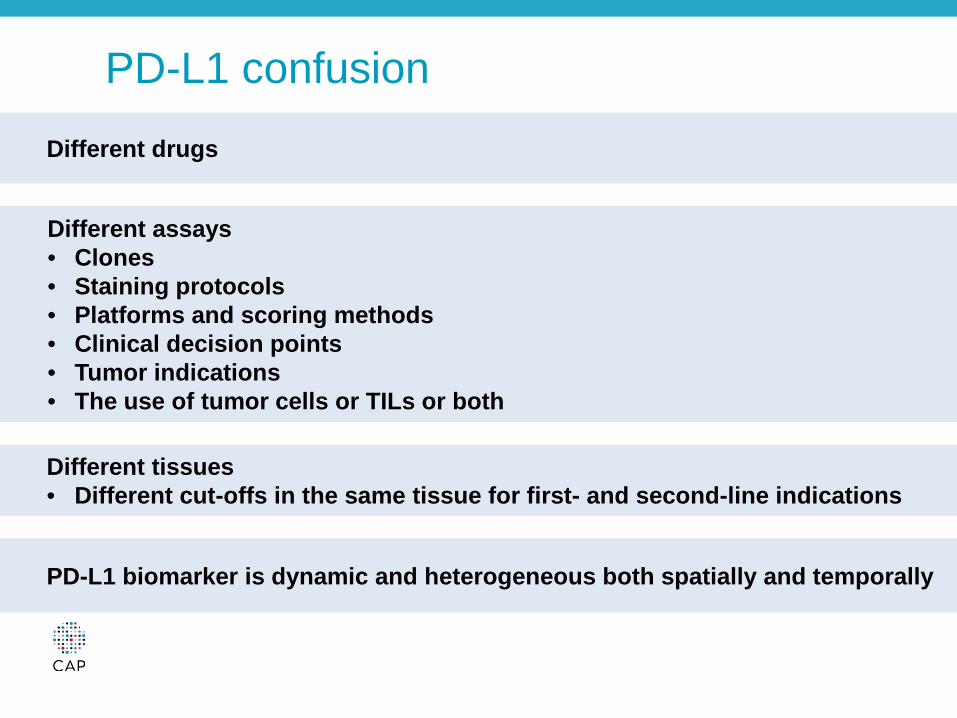
PD-L1 confusion
Different drugs
Different assays • Clones • Staining protocols • Platforms and scoring methods • Clinical decision points • Tumor indications • The use of tumor cells or TILs or both
Different tissues • Different cut-offs in the same tissue for first- and second-line indications
PD-L1 biomarker is dynamic and heterogeneous both spatially and temporally

Differences in Scoring IHC assays
Staining pattern Result
<1% of the viable tumor cells exhibit complete circumferential or partial linear plasma membrane staining at any intensity
PD-L1 expression <1%
>1% of the viable tumor cells exhibit complete circumferential or partial linear plasma membrane staining at any intensity
PD-L1 expression ≥1%
>5% of the viable tumor cells exhibit complete circumferential or partial linear plasma membrane staining at any intensity
PD-L1 expression ≥5%
>10% of the viable tumor cells exhibit complete circumferential or partial linear plasma membrane staining at any intensity
PD-L1 expression ≥10%
Staining pattern Result Partial or complete membrane staining (≥1+) in <1% of viable tumor cells
No PD-L1 expression
Partial or complete membrane staining (≥1+) in 1-49% of viable tumor cells
Low PD-L1 expression
Partial or complete membrane staining (≥1+) in ≥50% of viable tumor cells
High PD-L1 expression
Staining pattern Result
IC ≥10% IC3 IC ≥5% and <10% IC2
IC ≥1% and <5% IC1
Staining pattern
Result
TC ≥50% TC3 TC ≥5% and <50% TC2
IC ≥1% and <5% TC1
Dako 28-8/Ventana SP263 Dako 22C3
Ventana SP142
IC = Immune cells TC = Tumor cells

Appropriate Training is Essential for Proper Interpretation
• Staining patterns can be difficult to interpret • Must distinguish tumor cells from tumor associated
immune cells • Some assays score only tumor cells while other
assays score tumor cells + immune cells • Weak staining can be difficult to interpret
37

Staining Patterns Can be Difficult to Interpret
Moderate to strong circumferential Weak circumferential
Basolateral Granular membrane

Examples of weak expression

Tumor cells (TCs)
Immune cells (ICs)
Tumor and immune cells (TCs and ICs)
PD-L1 staining can be observed in tumor cells, immune cells or both
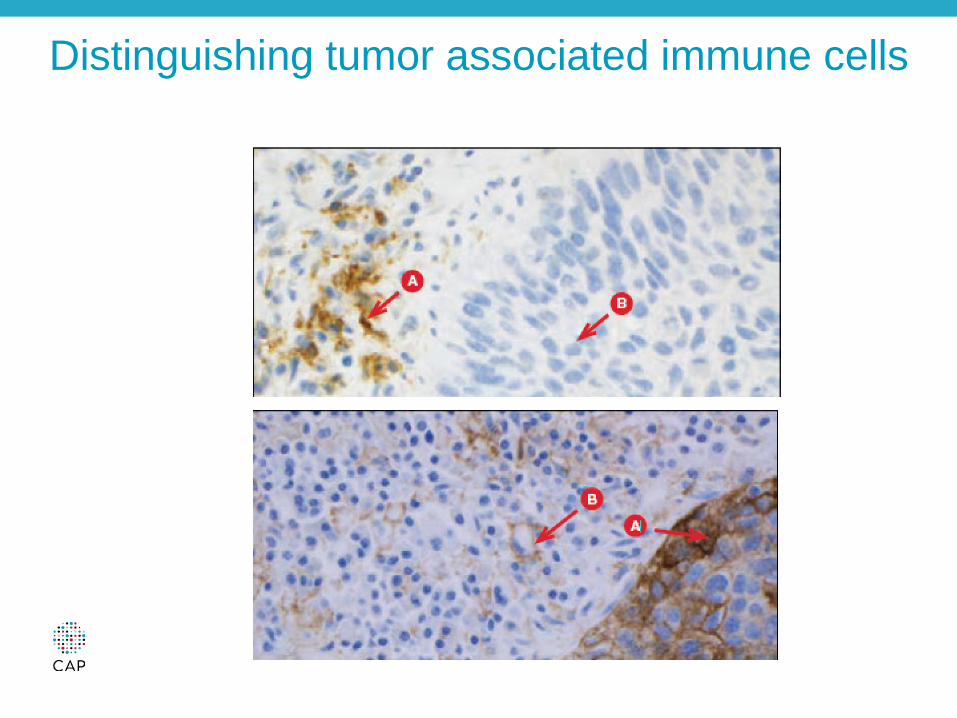
Distinguishing tumor associated immune cells

PD-L1 Positive Lung Cancer
© 2016 College of American Pathologists. All rights reserved.

PD-L1 Negative Lung Cancer
© 2016 College of American Pathologists. All rights reserved.
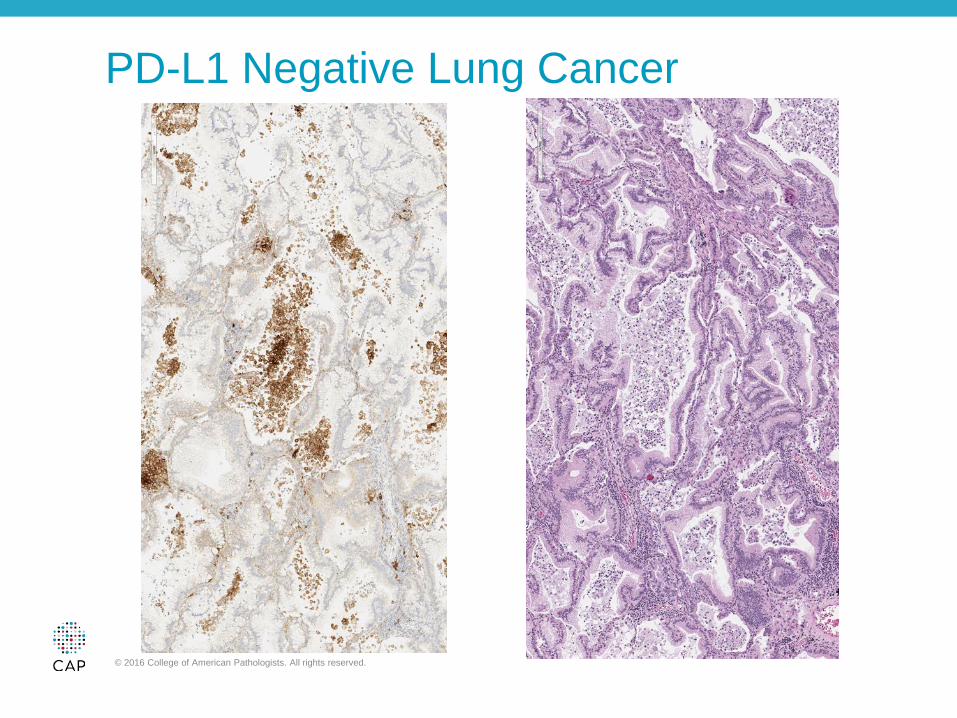
PD-L1 Negative Lung Cancer
© 2016 College of American Pathologists. All rights reserved.

IC Scoring Unique for SP142 and New for Pathologists Underscores need for pathologist training
“Scoring of the tumor-associated immune cells yielded low concordance levels.
Given that the SP142 assay has been used reproducibly in published clinical trials, we assume that specific instructions and training may raise concordance of immune cell scoring.”
German Harmonization Study Immune Cell Scoring
% Im
mun
e C
ell S
tain
ing
Blueprint study Immune Cell Scoring
Hirsch F. Presented at AACR New Orleans 2016 Scheel AH, Dietel M, Heukamp LC, et al. Harmonized PD-L1 immunohistochemistry for pulmonary squamous-cell and adenocarcinomas. Mod Pathol. 2016;29(10):1165-72.

Structured Pathologist Training Produces Excellent Results
47
Indication Proficiency Test Score
UC 97.0%
NSCLC 95.0%
Pathologist Training Proficiency Test Scores Results from 129 pathologists
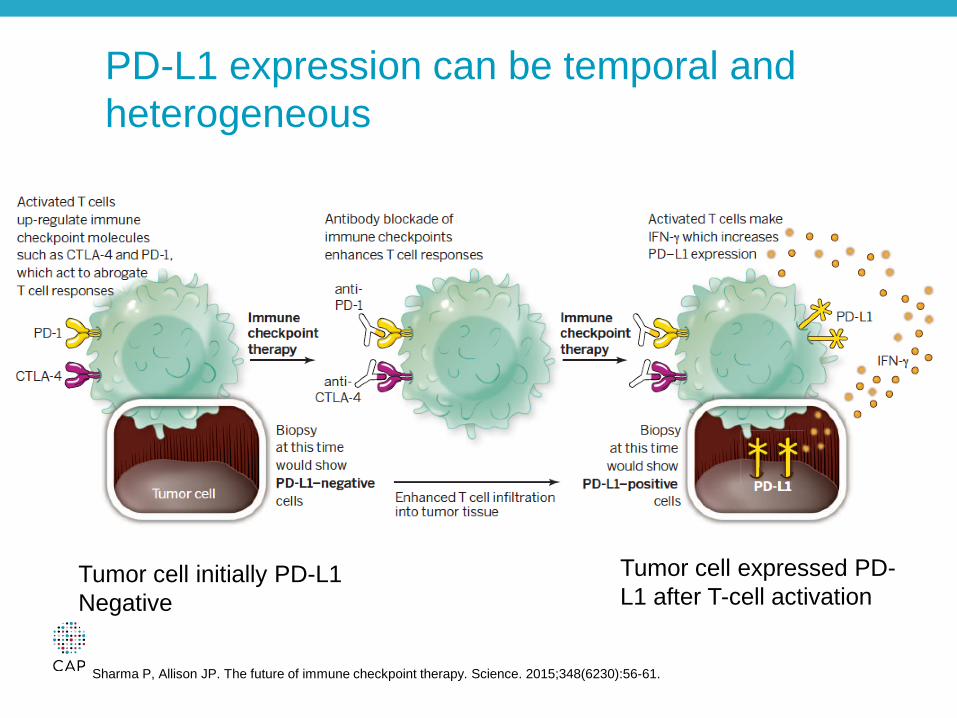
PD-L1 expression can be temporal and heterogeneous
Sharma P, Allison JP. The future of immune checkpoint therapy. Science. 2015;348(6230):56-61.
Tumor cell initially PD-L1 Negative
Tumor cell expressed PD-L1 after T-cell activation

Side effects of cancer immunotherapy may impact prognosis
Melero I, Grimaldi AM, Perez-gracia JL, Ascierto PA. Clinical development of immunostimulatory monoclonal antibodies and opportunities for combination. Clin Cancer Res. 2013;19(5):997-1008.
In general, the side effect profile of PD-L1 therapy is favorable compared to chemotherapy

The ORR for 2nd line PD-L1 negative patients is similar to chemotherapy
Non-sq.=non-squamous; sq.=squamous 1. Weber et al. Lancet 2015; 2. Robert et al. Lancet 2015; 3. Larkin et al. N Engl J Med 2015; 4. Borghaei et al. N Engl J Med 2015 5. Brahmer et al. N Engl J Med 2015; 6. Antonia et al. ASCO 2015; 7. Motzer et al. J Clin Oncol 2015; 8. Le et al. ASCO GI 2016 9. Kefford et al. ASCO 2014; 10. Garon et al. N Engl J Med 2015; 11. Plimack et al. ASCO 2015; 12. Vansteenkiste et al. ECC 2015 13. Rosenberg et al. Lancet 2016; 14. McDermott et al. J Clin Oncol 2015; 15. Rizvi et al. ASCO 2015; 16. Segal et al. ASCO 2015 17. Gulley et al. ASCO 2015; 18. Apolo et al. ASCO GU 2016; 19. Dirix et al. SABCS 2015; 20. Chung et al. ASCO GI 2016
0
20
40
60
80ITTPD-L1+PD-L1-
Nivolumab Pembrolizumab Durvalumab Avelumab Atezolizumab
ORR
(%)
~50%
~20%
~30%

Pembrolizumab in Front-line NSCLC
© 2016 College of American Pathologists. All rights reserved. DOI: 10.1056/NEJMoa1606774
PD-L1 expression in >50% of tumor cells
Reck M, Rodríguez-Abreu D, Robinson AG, Hui R, Csőszi T, Fülöp A, Gottfried M, Peled N, Tafreshi A, Cuffe S, O'Brien M, Rao S, Hotta K, Leiby MA, Lubiniecki GM, Shentu Y, Rangwala R, Brahmer JR; KEYNOTE-024 Investigators.. Pembrolizumab versus Chemotherapy for PD-L1-Positive Non-Small-Cell Lung Cancer. N Engl J Med. 2016 Oct 8.

Not Much Progress with Traditional Chemotherapy: 1975–2011
Response Rate
1-Year Survival
2-Year Survival
No Chemotherapy
0% 10% 0%
Single Agent 15% 20% 10%
2 Agents 25% 35% 20%
3 Agents 35% 35% 20%
2 Agents + Bevacizumab
35% 50% 22%
Current regimens: Squamous: Gemcitabine with cisplatin/carboplatin; paclitaxel with carboplatin Adenocarcinoma: Pemetrexed with cisplatin/carboplatin

Addition of Pembrolizumab to Carboplatin and Pemetrexed Improves Efficacy in NSCLC
http://dx.doi.org/10.1016/S1470-2045(16)30498-3
Langer CJ, Gadgeel SM, Borghaei H, et al. Carboplatin and pemetrexed with or without pembrolizumab for advanced, non-squamous non-small-cell lung cancer: a randomised, phase 2 cohort of the open-label KEYNOTE-021 study. Lancet Oncol. 2016; S1470-2045(16)30498-3

The Opportunity for Pathologists: How do we use our understanding of the tumor microenvironment to choose the right therapy?
We need to understand causes of failure and convert them to clinical benefit
We need to better understand immune response and tumor biology
We need to personalize cancer immunotherapy treatment

Save the Date for Upcoming Complimentary CAP PHC Webinars
DATE TOPIC SPEAKER Dec 14, 2016 11 AM CT
Preanalytics and Biospecimen Quality Imperative
Carolyn Compton, MD, PhD, FCAP
Register for upcoming webinars: www.CAP.org > Calendar > Webinars
© 2016 College of American Pathologists. All rights reserved.

• The CAP has created the Pathology Resource Guides to assist pathologists in understanding key emerging technologies.
– Printed guides are now available for members ($39) and non-members ($69)
– The digital copy of the Resource Guides are a complimentary member benefit
– Access them www.cap.org > Resources and Publications
CAP’s Pathology Resource Guide: Precision Medicine
© 2015 College of American Pathologists. All rights reserved.

Short Presentations on Emerging Concepts (SPECS)
• Pathology SPECs are: – short PowerPoints, created for
pathologists
– Focused on diseases where molecular tests play a key role in patient management
• New topics are Renal Tumors, cell free DNA (cfDNA), and PD-L1 as well as other emerging topics
• Access them www.cap.org > Resources and Publications

New Survey for 2017 Cancer Biomarker and Companion Diagnostic Testing
• PD-L1 Immunohistochemistry (PDL1) – Program includes one 10-core tissue microarray slide
– One shipment per year
– Program ships November 13, 2017
Order by December 1, 2016 to ensure material availability

© 2016 College of American Pathologists. All rights reserved.

• Thank you for attending our webinar, “PD-L1: Immune Checkpoint Blockade in Cancer” by Kenneth J. Bloom, MD, FCAP.
• For comments about this webinar or suggestions for upcoming webinars, please contact [email protected].
• NOTE: There is no CME/CE credit available for today’s free webinar. The PDF
of the presentation will be sent out in a week.
THANK YOU!
© 2016 College of American Pathologists. All rights reserved.