Embed Size (px)
Citation preview
8/4/2019 pcra- E&P
http://slidepdf.com/reader/full/pcra-ep 1/15
217
Notes Chapter - 5
Exploration and Production
5. 1 Introduction
India's GDP is growing at about 8-9% annually. Current projections are that this
trend will continue. High growth rate demands enhanced energy inputs, particularly
for a country like India where the per capita oil and gas consumption is almost one-
fifth of the global average. At the present rate of consumption, it is expected that
India's crude oil reserves will exhaust in less than 20 years from now while its
natural gas reserves will last for about 40 years. An additional strain is placed by the
fluctuating price of crude. Currently, we import over 73% of our crude oil
requirements.
5.1.1 Sedimentary Basins of India
India has 26 sedimentary basins of which only about 20% are moderately to well
explored. The remaining sedimentary area remains to be intensively explored.
Judging by the spate of recent discoveries, the areas that are yet to be explored hold
enormous promise.
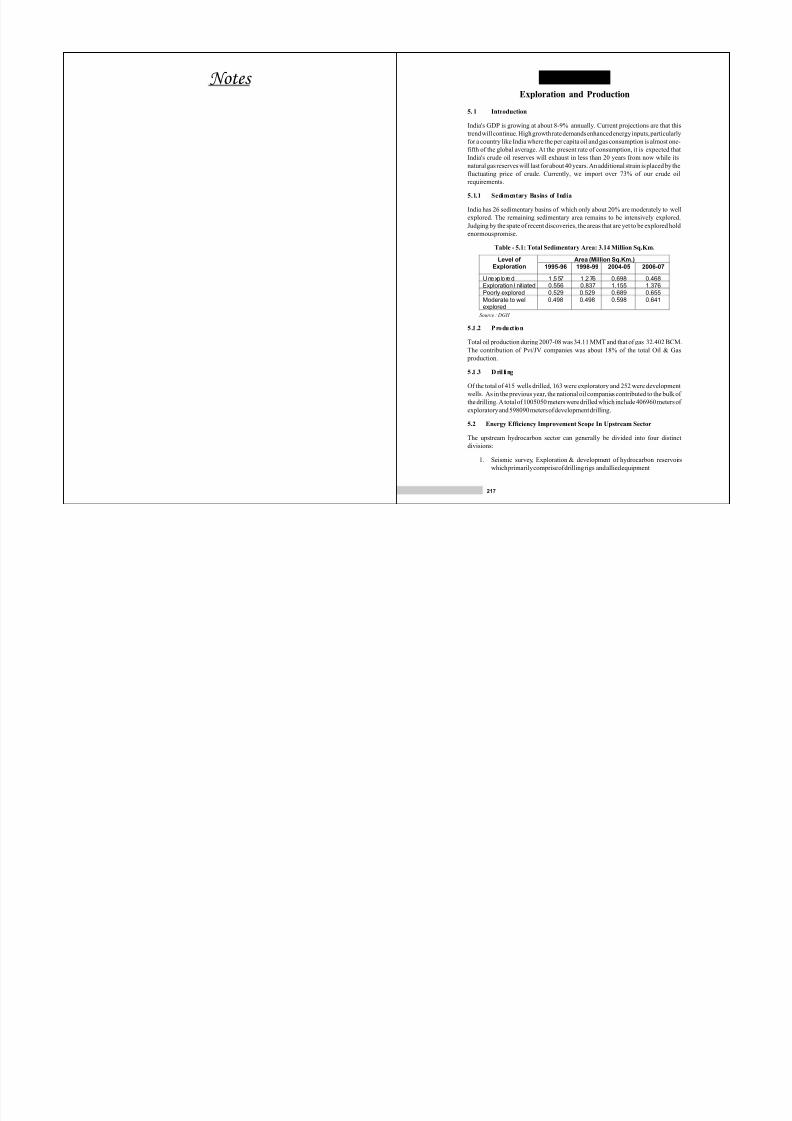
Table - 5.1: Total Sedimentary Area: 3.14 Million Sq.Km.
Source : DGH
5.1 .2 Product ion
Total oil production during 2007-08 was 34.11 MMT and that of gas 32.402 BCM.
The contribution of Pvt/JV companies was about 18% of the total Oil & Gas
production.
5 .1 .3 Dril li ng
Of the total of 415 wells drilled, 163 were exploratory and 252 were development
wells. As in the previous year, the national oil companies contributed to the bulk of
the drilling. A total of 1005050 meters were drilled which include 406960 meters of
exploratory and 598090 meters of development drilling.
5.2 Energy Efficiency Improvement Scope In Upstream Sector
The upstream hydrocarbon sector can generally be divided into four distinct
divisions:
1. Seismic survey, Exploration & development of hydrocarbon reservoirs
which primarily comprise of drilling rigs and allied equipment
Area (Million Sq.Km.)
Level of Exploration 1995-96
1998-99
2004-05
2006-07
Une xp lo re d 1 .5 57 1 .2 76 0.698 0.468Exploration I nitiated 0.556 0.837 1.155 1.376Poorly explored 0.529 0.529 0.689 0.655Moderate to wellexplored
0.498 0.498 0.598 0.641
8/4/2019 pcra- E&P
http://slidepdf.com/reader/full/pcra-ep 2/15
219218
Each of these techniques has been hampered by its relatively high cost and in some
cases, by the unpredictability of its effectiveness.
5 .2 .2 CO I nj ect io n2
The EOR technique that is attracting the most new market interest is carbon dioxide
(CO )-EOR. First tried in 1972 in Scurry County, Texas, CO injection has been2 2
used successfully at number of locations today.
The presence of an oil bearing transition zone beneath the traditionally defined base
(oil-water contact) of an oil reservoir is well established. What is now clear is that,
under certain geologic and hydrodynamic conditions, an additional residual oil
zone (ROZ) exists below this transition zone and this resource could add further to
oil resource in place and could be recoverable with state-of-the-art CO -EOR 2
technologies.
Until recently, most of the CO used for EOR has come from naturally occurring2
reservoirs. But new technologies are being developed to produce CO from2
industrial applications such as natural gas processing, fertilizer, ethanol, and
hydrogen plants in locations where naturally occurring reservoirs are not available.
One demonstration at the Dakota Gasification Company's plant in Beulah, North
Dakota is producing CO and delivering it by a new 204-mile pipeline to the2
Weyburn oil field in Saskatchewan, Canada. Encana, the field's operator, is
injecting the CO to extend the field's productive life, hoping to add another 252
years and as much as 130 million barrels of oil that might otherwise have been
abandoned.
A turning point in CO-EOR advances is a project funded by US DOE in the Hall-2
Gurney field in Kansas that seeks to demonstrate this technology's time has come -
providing energy, economic and environmental benefits. A companion project
underway in the Hall-Gurney field involves testing the feasibility of 4-D high
resolution seismic monitoring of CO injection in thin, relatively shallow mature2
carbonate reservoirs. Incorporating such time-lapsed monitoring data into CO-2EOR programs could dramatically improve the efficiency and economics of using
the technology in many Mid-continent fields.
Additional work has examined potential improvements in CO -EOR technologies2
beyond the state-of-the-art that can further increase this potential. This work
evaluating the potential of "game changing" improvements in oil recovery
efficiency for CO -EOR illustrates that the wide-scale implementation of next2
generation CO -EOR technology advances have the potential to increase oil2
recovery efficiency from about one-third to over 60 percent.
5.2 .3 Other Areas
Crude Oil exploration is the most energy intensive operation and is explained in
detail in this chapter. The other major areas where energy is consumed and
opportunities for conservation exists are listed below:
5.2.3.1 Pumping Stations
The major energy consuming equipments generally are:
2. Production of Oil & Gas which may comprise of
a. Oil collection stations b. Gas Compressor stationc. Sucker Rod Pumpsd. Water supply stationse. Power Station
3. Transportation of Oil & Gas which may comprise of
a. Crude Oil Pumping Stations b. Gas Compressor Stations
4. Gas Based Petrochemical Complexes
a. Petrochemical Plant b. LPG Recovery Plantsc. LPG Bottling Plants
Effective and result oriented conservation methods adopted by the upstream
undertakings include reduction of gas flaring by re-injection of gas to underground
reservoir, installation of waste heat recovery systems, utilization of non-
conventional energy sources, undertaking energy audits & efficiency up gradation
of equipment & appliances, substitution of diesel with natural gas, deployment of
solar-powered illumination panels, battery operated vehicles, bio-gas etc.
5.2.1 Enhanced Oil Recovery
Crude oil development and production in oil reservoirs can include up to threedistinct phases: primary, secondary and tertiary (or enhanced) recovery. During
primary recovery, the natural pressure of the reservoir or gravity, drive oil into the
wellbore combined with artificial lift techniques (such as pumps), which bring the
oil to the surface. But only about 10 percent of a reservoir's original oil in place is
typically produced during primary recovery. Secondary recovery techniques to the
field's productive life generally by injecting water or gas to displace oil and drive it
to a production wellbore, resulting in the recovery of 20 to 40 percent of the original
oil in place.However, with much of the easy-to-produce oil already recovered from oil fields,
producers have attempted several tertiary, or Enhanced Oil Recovery (EOR),
techniques that offer prospects for ultimately producing 30 to 60 percent or more of
the reservoir's original oil in place. Three major categories of EOR have been found
to be commercially successful to varying degrees:
• Thermal recovery, which involves the introduction of heat such as the
injection of steam to lower the viscosity or thin the heavy viscous oil and
improve its ability to flow through the reservoir.
• Gas injection, which uses gases such as natural gas, nitrogen, or carbon
dioxide that expand in a reservoir to push additional oil to a production
wellbore or other gases that dissolve in the oil to lower its viscosity and
improves its flow rate.
• Chemical injection, which can involve the use of long-chained molecules
called polymers to increase the effectiveness of waterfloods or the use of
detergent-like surfactants to help lower the surface tension that often
prevents oil droplets from moving through a reservoir.
8/4/2019 pcra- E&P
http://slidepdf.com/reader/full/pcra-ep 3/15
221220
Consumption vs. Power Generated and by improving performance with reduced
specific electrical energy consumption.
The major equipments are electrical system network, motors, air compressors,
Cooling Towers, Illumination systems, where energy conservation opportunities
can be explored.
Electrical System Network: Improvement opportunity can be explored by study of
all the Transformer operations of various Ratings / Capacities, their Operational
Pattern, Loading, No Load Losses, Power Factor Measurement on the Main Power Distribution Boards and possible improvements in energy metering systems for
better control and monitoring.
5.2.3.5 Sucker Rod Pumps
The major equipments are motors, DG Sets, Illumination systems, etc.
5.2.3.6 Gas Processing Plants
The major equipments consists of motors, pumps, steam systems, HRSGs, Boilers,
Captive Power houses, Gas Turbines, Steam turbines, Gas Compressors, Air
Compressors, Steam Traps, Illumination, Heaters, distillation/ separation columns,
cooling towers, transformers, electrical system networks, air conditioning etc.
Case Study 1: Energy Audit of a major Gas based Petrochemical Complex
Brief
The Petrochemical Complex is designed to process 12 million metric standard
cubic meter per day (MMSCMD) of natural gas to produce 440,000 TPA of Ethylene in the first phase and down stream products, such as the various grades of
high density polyethylene (HDPE) and linear low density polyethylene (LLDPE). A
LPG recovery unit is being installed and successfully producing 258250 TPA of
LPG and 71,000 TPA of Propane from the natural gas.
The main energy sources of the plant are electricity and Natural gas. The plant
consumes about 42 Million kWh electrical units per annum (from the grid), around 3
240 Million from in-house and natural gas quantity of 363 Million sm per annum.
Energy savings
Summary of Energy Savings
6 * MMSCM = 10 Standard Cubic Metre
Annual savings : Rs. 246.3 Million Investment required : Rs. 124.7 Million Payback period : 6 months
Thermal Energy Systems
The Plant has three utility boilers UB#1, UB#2 & UB#3, each designed to generate2 o
VHP steam at 105 kg/cm and 515 C. The VHP steam generated in the utility boilers
Description Unit Quantity Electricity @ Rs. 4.5/kWh
Million kWh/annum
25.8 Lean Gas @ Rs. 10/SCM MMSCM*/annum 13.0
Electrical Motors: Improvement opportunity can be explored in appropriate
Loading Pattern, Power Factor improvement, Mechanical Power Transmission
Systems and other operational parameters.
Pumping System: Improvement opportunity can be explored by optimising the
pumping and allied system pressures, RPM of the engines, engine efficiencies and
other operational parameters for crude oil driven engines for pumping of crude oil
or product and fire fighting pumps (Engine or Motor Driven) and feasibility of
reduction in the Power Consumption.
Air Compressors: Improvement opportunity can be explored by analysis of
various parameters like intake receiver capacity, operational Free Air Delivery
(FAD) of the Air Compressors, leakages in the system, evaluation of the feasibility
of Pressure Optimisation etc.
Illumination System: Improvement opportunity can be explored by use of energy
efficient lighting systems.
DG Sets Performance: Improvement opportunity can be explored by operation of
DG Sets to evaluate their average cost of Power Generation and subsequently
identify areas wherein energy savings could be achieved after analysing the
operational practices.
Specific Energy Consumption: SEC per throughput of each station and
comparison of SEC of each station should be found out and benchmarked.
Diesel & Crude Oil Handling System: Improvement opportunity can be explored
by monitoring energy consumption in heater in centrifuge unit, fuel forwarding
modules, etc. and study the feasibility of energy conservation.
5.2.3.2 Gas Compressor Stations (GCS)
Study of Gas Compressors in GCS (Motor / Gas Engine Driven Unit):
Improvement opportunity can be explored by Studying the Operational practices
being adopted, Monitoring the Specific Energy Consumption, Scheduling of the
Gas / Motor Driven Compressors, Formulation of specific recommendations for
reduction in the overall Electrical energy/Gas Consumption. The major equipments
are Motors, Air Compressors, Cooling Towers, Illumination systems.
Cooling Towers: Improvement opportunity can be explored by studying the
operational performance of the Cooling towers through measurements of
temperature differential, air/ water flow rate and then evaluate specific performance
parameters like approach, efficiency etc.
5.2.3.3 Water Supply Station
The major equipments are motors, pumps and Illumination systems
5.2.3.4 Power Station
Improvement opportunity can be explored by evaluating the operational efficiency
of turbines & alternators, Evaluation of the Specific Energy Consumption pattern of
the Gas/Steam Turbine as well as allied equipment, Load rationalization & overall
reduction in the Specific Energy Consumption, Evaluation of Specific Gas/Steam
8/4/2019 pcra- E&P
http://slidepdf.com/reader/full/pcra-ep 4/15
Annual savings : Rs. 3.7 Million Investment required : Rs. 3.5 Million Payback period : 11 months
• Boiler feed water pump (Utility boiler#2)
The feed water pump operating efficiency was much below (38%) the desired
pump efficiency level (60%) for efficient operation. By replacing the existing
pump with an energy efficient pump, a saving of 0.42 Million kWh per year can
be achieved.
Annual savings : Rs. 1.9 Million
Investment required : Rs. 5.0 Million
Payback period : 32 months
• Utility Steam Turbines
The plant has installed two nos. of Steam Turbo Generators (STG#1 &
STG#2); one is extraction type having a capacity of 15.5 MW and the other is
condensing type of 25.5 MW, to meet the plant's electricity requirements.
STG# 1
• The observations and measurements showed that, the specific steam
consumption per MW power generation is higher than the rated/design
condition. This may be due to leakage in labyrinth-gland packing
between two stages or any other maintenance reason like
corrosion/erosion in turbine blade surface. Hence it was recommended toconsult the manufacturer to ascertain the possible reasons.
After rectifying the same the steam consumption may be reduced nearer
to the designed requirement. The steam consumption (T/MW) in the HP and
LP side is 21.23 and 12.21.
• The measurements and analysis showed that Steam Turbine efficiency in
both H.P. & L.P. stage was lower i.e. 61.8 % and 61.5 % than expected.
• The loading of the turbine was 59%.
• By enhancing the loading of the turbine, reducing the leakages, the
operating efficiency of the turbine can be enhanced to 65% with an annual
savings of 1.2 MMSCM per year.
Annual savings : Rs. 11.9 Million Investment required : Rs. 5.0 Million Payback period : 5 months
STG#2
• The turbine was running at low operating efficiency of 57.8 % because of
operation of turbine at part load of 59 %.
• By enhancing the loading of the turbine, reducing the leakages, the
operating efficiency of the turbine can be enhanced to 65 % with an annual
saving of 0.3 MMSCM per year
is used in utility steam turbines for power generation and subsequently for driving
the boiler auxiliaries and for process heat applications. The recommendations
pertaining to the operation of the two boilers (UB#1 & UB#3), which were in
operation during the field visit of the audit are as follows:
• Optimization of excess air in Utility Boiler UB#2
The boiler was operating at a high excess air level of 68%, whereas the
recommended level is 10%, resulting in high flue gas losses. As a result, the
boiler efficiency dropped by 4 percent points to 91% (NCV basis) as against the
design value of 95%. By maintaining the O % in flue gases always below 3%2
(in order to keep excess air level below 15%) by continuous monitoring of O %2
in flue gases and thereby regulating the combustion airflow to the boiler, a
saving of 1 MMSCM of gas per year can be achieved.
Annual savings : Rs. 10.0 Million Investment required : Rs. 5.0 Million Payback period : 6 months
• Optimization of excess air in Utility Boiler UB#3
The boiler was operating at a high excess air level of 46%, whereas the
recommended level is 10%, resulting in high flue gas losses. As a result, the
boiler efficiency dropped by 6 percent points to 80% (GCV basis) as against the
design value of 86%. By maintaining the O % in flue gases always below 3%2
(in order to keep excess air level below 15%) by continuous monitoring of O %2
in flue gases and thereby regulating the combustion airflow to the boiler, a saving of 0.9 MMSCM of gas per year can be achieved.
Annual savings : Rs. 9.1 Million Investment required : Rs. 5.0 Million Payback period : 6 months
• Replacement of inefficient UB#2 FD Fan with that of energy efficient fan
It was found that the efficiency of the steam turbine driven UB#2 FD fan
was much below (23%) the desirable efficiency level (60%). Hence, by
replacing the existing FD Fan of UB#2 with an energy efficient fan, a saving
of 0.3 Million kWh per year can be achieved.
Annual savings : Rs. 1.4 Million Investment required : Rs. 3.5 Million Payback period : 29 months
• Replacement of inefficient UB#3 FD Fan with that of energy efficient
fan
The operational efficiency of UB#3 FD fan was poor (13%) compared to the
desirable efficiency level (60%). Hence, by replacing the existing FD Fan with
an energy efficient FD Fan, a saving of 0.82 Million kWh per year can be
achieved.
223222
8/4/2019 pcra- E&P
http://slidepdf.com/reader/full/pcra-ep 5/15
225224
Payback period : 3 months
• Maintenance of faulty steam traps
By repairing the traps which are chocked and let the condensate flow
smoothly out of the system to ensure effective heat transfer, a saving of 0.1
MMSCM of natural gas per year can be achieved.
Annual savings : Rs. 1.0 Million
Investment required : R s. 1.0 Million approx Payback period : 12 months
• Performance evaluation of all steam traps
The savings estimated above was based on the survey conducted on 170 traps,
which form less than 20% of the total traps installed in the plant. The actual
energy savings that can be achieved by steam traps maintenance would be
several times higher than what has been estimated above. Therefore, it was
recommended to get a survey done for all the steam traps in the plant and
replace / repair the faulty traps immediately to arrest energy losses in the steam
system.
• Steam Distribution System
- Condensate recovery
A total of 7 TPH of condensate can be recovered and reused as boiler feed
water from HDPE and LPG Plants. The investment required would be in termsof additional condensate pipes, condensate pump, and insulation of the
network. In addition to the fuel savings, the other benefits would be reduced
costs of water treatment of 7 TPH water. The net savings would be the
0.6 MMSCM of natural gas per year.
Annual savings : Rs. 6.2 Million Investment required : Rs. 3.0 Million Payback period : 6 months
- Arresting steam leakages
The plant had steam leakages at a number of areas. By arresting the steam
leakages from the identified areas (by replacing the damaged valves,
pipefittings, flanges, traps, etc), a saving of 0.09 MMSCM of natural gas per
year can be achieved.
Annual savings : Rs. 0.9 Million Investment required : Rs. 0.5 Million
Payback period : 7 months
- Improve insulation of pipes
A number of areas in the steam lines had high surface temperatures. The high
surface temperatures of insulated steam headers / pipes indicate the damaged
or inadequate insulation. It was recommended to replace the insulation to
arrest the heat losses thereby saving 0.04 MMSCM of natural gas per year.
Annual savings : Rs. 3.3 Million Investment required : Rs. 2.5 Million Payback period : 9 months
• Heat Recovery Steam Generators
By improving the efficiency of HRSG - I & II by de-scaling the water side
surface, changing the layout of different components of the HRSG from the
existing to the proposed i.e. in the sequence of Super Heater-II, Super Heater-I,
Evaporator-II, Evaporator-I & Economizer, a saving of around 2% on a very
conservative estimate can be achieved. The modifications will lead to
increased steam generation. This increase will reduce the load on utility
boilers, which will ultimately reduce the natural gas consumption by 1.8
MMSCM of natural gas per year.
Annual savings : Rs. 17.8 Million Investment required : Rs. 2.0 Million Payback period : 2 months
• Cracked Gas (CG) Compressor
The specific steam consumption per KW shaft power in H.P. Stage was higher
with respect to the rated designed condition because of low efficiency of steam
turbine. By increasing the efficiency of HP as well as LP steam turbine a
saving of 1 MMSCM fo natural gas can be achieved.
Annual savings : Rs. 10.2 Million
Investment required : Rs. 3.0 Million Payback period : 4 months
• Condensing Steam Turbine of Propylene (CR )Refrigeration Compressor 3
The condensing steam turbine of CR compressor was running at poor 3
efficiency. This was due to leakage in labyrinth-gland packing between two
stages or any other maintenance reason like corrosion/erosion in turbine blade
surface. Hence it was recommended to consult the manufacturer to ascertain
the possible reasons. After rectifying the same, a saving of 0.17 MMSCM of
natural gas per year can be achieved.
Annual savings : Rs. 1.7 Million Investment required : Not ascertained Payback period : NA
• Replacement of damaged traps
The plant had 44 faulty steam traps. By immediate replacement of these traps
to arrest steam leakage and losses, a saving of 0.2 MMSCM of natural gas per year can be achieved.
Annual savings : Rs. 2.1 Million Investment required : Rs. 0.45 Million
8/4/2019 pcra- E&P
http://slidepdf.com/reader/full/pcra-ep 6/15
227226
becomes imperative for the plant to keep a good power factor on the main
incomer. For this, the plant has installed capacitors. The average PF being
maintained was very close to unity, which is a good practice.
• Motor Load Study:
A complete motor load survey was carried out during the energy audit so as to
assess the motor loading pattern and assess the potential for motor down-sizing,
application of VFD, soft starter etc. In all about 170 motors above 25kW were
studied and the basis for categorising the motors as under-loaded was loading
less than 50%. In all 44 motors were found to be under-loaded (26% of the motors
studied). For the motors loaded less than 50%, an exercise was done to analyze
the feasibility of replacement of these motors by suitably sized energy efficient
motors (EEM). Few motors where the payback was less than 5 years are being
recommended for such replacement. For motors tha t offer a payback of 5 years or
less, the reduction in motor los ses will be to the tune of 38 .5 kW. An annual saving
of 0.31 Million kWh per year can be achieved by replacing the under loaded
motors.
Annual savings : Rs. 1.4 Million Investment required : Rs. 0.5 Million Payback period : 5 months
• Power Factor Study:
During the audit of the electrical motors, the PF profiling was also done. For
most of the motors it was found that the PF was quite healthy but for a few
motors (20 in number out of a total of 170 studied), the PF was below 0.7,
which may be due to the low loading at the point of measurements. It was
advised that, for all motors, the PF should be kept as high as possible (ideally
0.95) so as to have reduced line losses, to ensure better voltage regulation at
the motor end & healthy motor load performance, to take proper care
regarding theloading pattern, over-hauling and re-winding practices.
• C ompr es so rs :
• It was recommended to operate 3 HT compressors in place of operating 2
LP air and 2 nitrogen compressors. The maximum air requirement for the plant 2
is around 18400 CFM at a pressure of around 8 kg/cm. Since three HT
compressors alone can meet this requirement if scheduled properly, it is
advised to operate only three HT compressors. This will save 5.7 Million
kWh electrical units annually.
Annual savings : Rs. 25.7 Million per annum Investment required : Rs. 4.0 Million
Payback period : 2 months
2• Presently, the Khosla compressors are being used to supply air at 8 kg/cm to the
boiler/instrumentation. During the audit it was found that the LP air 2
compressors were also operating at 8 kg/cm and since there was surplus capacity
of these compressors, seldom the excess air compressed by these air
compressors is vented out at high pressure. It was recommended that instead of
venting this high-pressure air, which represents energy loss, this air should be used to
Annual savings : Rs. 0.35 Million Investment required : Rs. 0.03 Million Payback period : 1 months
- Installation of back pressure steam turbine in place of PRDS
To meet HP steam requirement, a PRDS was installed to convert VHP steam to
HP steam. It was recommended to install a backpressure steam turbine in
place of the PRDS. The turbine would facilitate power extraction to the extent
of 2 MW and simultaneously expand the steam to the required level of 2
40 kg/cm . A saving of 9.1 Million kWh per year can be achieved.
Annual savings : Rs. 40.9 Million Investment required : Rs. 37 Million Payback period : 11 months
• Furnaces
- Improve the furnace insulation
The surface temperature at various portions of the operating furnaces were
found to be high. By improving the insulation at hot spots, a saving of 0.22
MMSCM of natural gas per can be achieved.
Annual savings : Rs. 22.3 Million Investment required : Rs. 1.75 Million Payback period : 1 month
- Reduce blow down from Furnace # 3 and # 4
The blow down rate of Furnace#3 and Furnace#4 was high compared to that
of Furnace#1 & 2. The excess blow down from these two furnaces is
estimated to be 6 TPH. By reducing the blow down rate of these two
furnaces to the optimum level, a saving of 0.3 MMSCM of natural gas per year
can be achieved.
Annual savings : Rs. 3.3 Million Investment required : NIL Payback period : Immediate
Electrical Systems
• Transformers
A complete loading analysis of the transformers was carried out. The
loading pattern showed that in most of the cases, the loading was on the
lower side. For most of the transformers the best efficiency point was in
the loading range of 40-50%, but the transformers were found to be
operating at a lesser load. This has basically been done so as to have high
plant operating reliability. For the sake of reliability, the plant has
compromised on higher transformer losses, which is justified owing to the
critical & continuous operating schedule of the plant.
• C ap ac ito rs :
The billing from the state electricity board was based on kVAh and hence it
8/4/2019 pcra- E&P
http://slidepdf.com/reader/full/pcra-ep 7/15
229228
kWh per year.
Annual savings : Rs. 5.3 Million Investment required : Nominal Payback period : Immediate
• Installation of variable speed drives for pumps in DM plant and CPU plant
Recirculation valves are installed to degasser water pump, condensate
feed pump and polished condensate transfer pump. It was recommended toinstall VSD to these pumps to avoid recirculation thereby saving 0.33 Million
kWh per year.
Annual savings : Rs. 1.5 Million Investment required : Rs. 2.1 Million Payback period : 17 months
• Replacement of DM water transfer pumps with one large pump coupled
with VSD
DM water transfer pumps were operating at poor efficiency and recirculation
was observed across the valve. It was recommended to replace the present
pumps with one large pump coupled with VSD, saving 0.34 Million kWh per
year.
Annual savings : Rs. 1.52 Million Investment required : Rs. 1.5 Million Payback period : 12 months
• Replacement of raw water transfer pumps
Raw water collected in Reservoir # 3 is transferred to Reservoir # 1 with the aid
of two pumps. It was found that the actual head was too high compared to rated
head and efficiency was low. It was recommended to replace the present
pumps with required head pump (32 m) and thereby achieve energy savings of
0.2 Million kWh per year.
Annual savings : Rs. 0.9 Million Investment required : Rs. 0.6 Million Payback period : 8 months
• Installation of variable speed drive to the cooling water make up pump
During the audit study it was observed that there is wide variation in flow
and pressure of cooling water make up pump. It was suggested to install
variable speed drive to the motor and control the speed by monitoring the
pressure, thereby saving 0.12 Million kWh per year of energy.
Annual savings : Rs. 0.54 Million Investment required : Rs. 0.7 Million Payback period : 16 months
supply boiler/instrumentation purposes & thus avoid the operation of the Khosla
compressor. This will save 0.13 Million kWh electrical energy per year.
Annual savings : Rs. 0.6 Million Investment required : Rs. 0.1 Million Payback period : 2 months
• As service air application require air at low pressures, it was recommended to
use transvector nozzles for cleaning & service air requirements. This
exercise will help save 0.09 Million kWh electrical units per annum.
Annual savings : Rs. 0.42 Million Investment required : Rs. 0.2 Million Payback period : 6 months
• L ighting:
• It was found that lighting transformers were all under-loaded. It was advised to
explore the possibility of supplying adjacent areas by a single lighting
transformer so as to improve the transformer loading.
• Replacement of the conventional tube-lights, presently operating with
copper chokes, around 3500 in number, by the energy efficient T-5 tube
-lights and with electronic ballast was recommended. This measure will save
0.23 Million kWh units of electrical units annually.
Annual savings : Rs. 1.04 Million Investment required : Rs. 1.93 Million Payback period : 22 months
Water Pumping System & Cooling Towers
The Plant has several water pumping systems such as cooling water
supply, raw water supply, DM water system in addition to three large
cooling towers.
• Rationalisation of CT # 1 water pumps operation
GCU (Gas Cracker Unit) section has a separate set of pumps while GPU (Gas
Processing Unit) & IOP (Integrated Oxide Plant) has different set of pumps
with dedicated headers. It was recommended to replace the impellers of pumps
and operate as a common system thereby resulting in reduction of power
consumption by 5.0 Million kWh per year.
Annual savings : Rs. 22.64 Million Investment required : Rs. 10.0 Million
Payback period : 5 months
• Reduce the discharge pressure of pumps (or) replace the pumps with
suitable capacity (head and flow) for CT# 2
It was recommended to verify the actual water pressure requirement and
accordingly initiate the steps either to reduce the water pressure or replace the
pumps with suitable head, resulting in an annual energy saving of 1.2 Million
kWh per year.
8/4/2019 pcra- E&P
http://slidepdf.com/reader/full/pcra-ep 8/15
231230
takes around 20 days. For offshore operation rig moves from one location to
another location either by towing or self propelled. Time taken depends on the
distance to be moved.
Spudding / Drilling phase: During this phase, almost all the machineries of the
Rig are run and this phase consumes the maximum energy in terms of HSD.
This phase continues for a period of about 100 to 120 days depending upon the
depth of the well.
Production Testing phase: During this phase, the samples of the well are tested
and then Rig is dismantled. This stage takes about 60 days.
5.3.1 Energy Consumption
Energy used in a Drilling rig is Electrical energy. This electrical energy is
produced using captive mobile power generation units. In very rare cases, grid
power is also used. The fuel for these power generation units is either HSD or
Natural gas.
The primary source of energy in a Drilling Rig is the Diesel Oil for DG sets.
Most of the DGs in the exploration rigs in India are old and de-rated and are
expected to consume higher fuel as compared to the design.
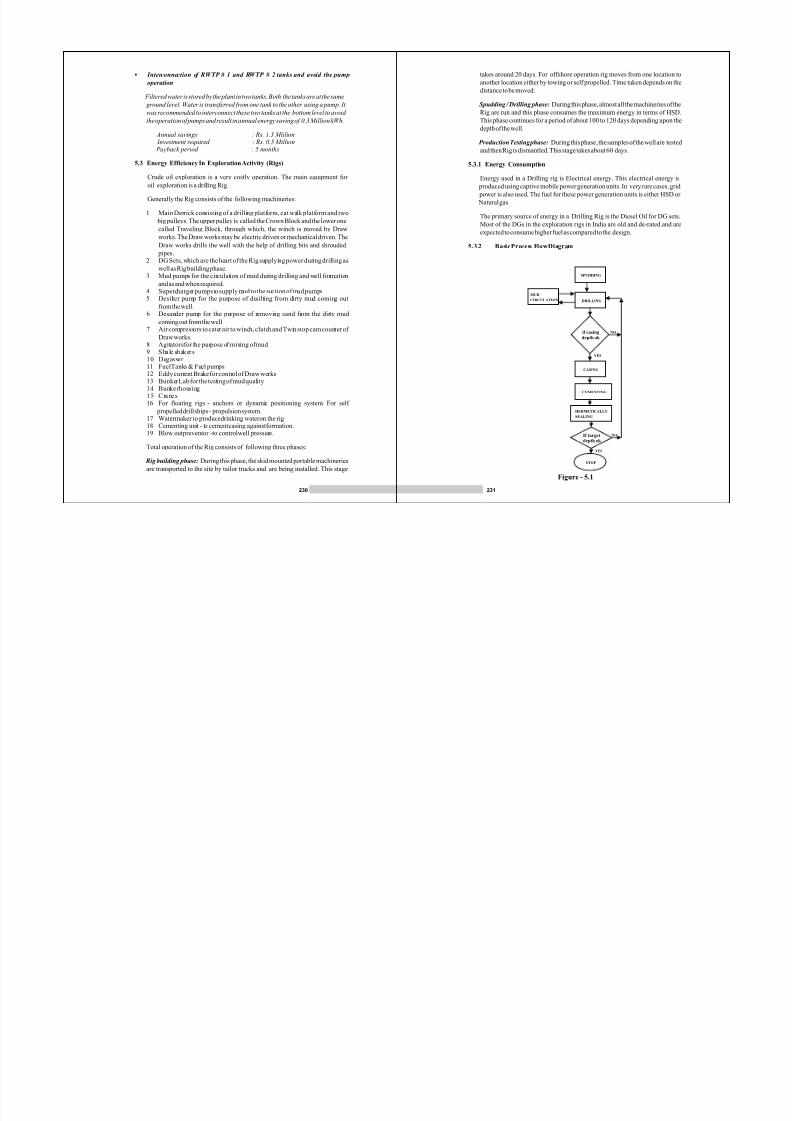
5.3.2 Basic Process Flow Diagram
SPUDDING
DRILLING
MUD
CIRCULATION
if casingdepth ok
CASING
CEMENTING
HERMETICALLY
SEALING
If targetdepth ok
STOP
YES
NO
NO
YES
Figure - 5.1
• Interconnection of RWTP # 1 and RWTP # 2 tanks and avoid the pump
operation
Filtered water is stored by the plant in two tanks. Both the tanks are at the same
ground level. Water is transferred from one tank to the other using a pump. It
was recommended to interconnect these two tanks at the bottom level to avoid
the operation of pumps and result in annual energy saving of 0.3 Million kWh.
Annual savings : Rs. 1.3 Million Investment required : Rs. 0.5 Million Payback period : 5 months
5.3 Energy Efficiency In Exploration Activity (Rigs)
Crude oil exploration is a very costly operation. The main equipment for
oil exploration is a drilling Rig.
Generally the Rig consists of the following machineries:
1 Main Derrick consisting of a drilling platform, cat walk platform and two
big pulleys. The upper pulley is called the Crown Block and the lower one
called Traveling Block, through which, the winch is moved by Draw
works. The Draw works may be electric driven or mechanical driven. The
Draw works drills the well with the help of drilling bits and shrouded
pipes.2 DG Sets, which are the heart of the Rig supplying power during drilling as
well as Rig building phase.
3 Mud pumps for the circulation of mud during drilling and well formationand as and when required.
4 Supercharger pumps to supply mud to the suction of mud pumps5 Desilter pump for the purpose of desilting from dirty mud coming out
from the well.6 Desander pump for the purpose of removing sand from the dirty mud
coming out from the well7 Air compressors to cater air to winch, clutch and Twin stop cam counter of
Draw works.8 Agitators for the purpose of mixing of mud9 Shale shakers10 Degasser 11 Fuel Tanks & Fuel pumps12 Eddy current Brake for control of Draw works13 Bunker Lab for the testing of mud quality14 Bunker housing15 Cranes16 For floating rigs - anchors or dynamic positioning system. For self
propelled drill ships - propulsion system.17 Water maker to produce drinking water on the rig18 Cementing unit - to cement casing against formation.19 Blow out preventor - to control well pressure.
Total operation of the Rig consists of following three phases:
Rig building phase: During this phase, the skid mounted portable machineries
are transported to the site by tailor trucks and are being installed. This stage
8/4/2019 pcra- E&P
http://slidepdf.com/reader/full/pcra-ep 9/15
233232
5.3.4.2 Efficient Operation of Mud Pumps
This is the single largest load on a Rig consuming 50 to 60% of total energy
consumed on a rig.These have an operating pressure of 5000 to 7000 psi and hydraulic efficiency
is normally more than 90%.Reciprocating Pump operates at constant efficiency levels and hence has
constant losses. Below are some general measures for energy conservation in a
mud pump operation:
• The biggest culprit for energy wastage in mud pump is idling during lunch
& shift changeover and higher discharge rate.• Under loading of the prime mover is another fuel wasting situation.• Suction starvation can cause performance loss and failure of pump.• Entrained gas may reduce suction Efficiency• Each pump should feed Separate Mud Processing Equipment.
0• Mud temperatures of 66 C can present critical suction problems• A poorly designed discharge manifold can cause shock waves and
excessive pressure peaks• Excessive solids can:
1) cause wears on drilling equipment2) reduce ROP (Rate of Penetration)3) cause a thick and permeable filter cake and fluid loss4) cause unwanted pump exertion
5.3.4.3 Efficient Operation of Agitator
The following information must be known to properly size an agitator system:• Tank and compartment dimensions• Compartment shape• Compartment duty (solids removal, testing, suction, storage, or pill/slug)• Maximum mud density expected• Coupling of multiple agitators to one motor • Agitator & mud gun combination gives better agitation
5.3.4.4 Efficient Operation of Air compressors
• In a rig, compressed air is used for pneumatic control; start up operation of
DG sets etc.• Regular maintenance should be undertaken as per schedule• All air leakages must be plugged• In many installations, the compressors are manually switched on/off at the
required pressure. Installation of automatic pressure switch with
predetermined setting can save wastage of energy.• Use of automatic drain valve in the air receiver. By using the auto drain
valve, water would only be allowed to pass intermittently depending on
the water level in the air receiver, thereby minimising the wastage of compressed air.
5.3.4.5 "Deep Trek" and Other Drilling R&D
The U.S. Department of Energy's Office of Fossil Energy kicked off the 'Deep
Trek' Program in 2002 to help develop high-tech drilling tools that industry
needs to explore the deeper deposits of hydrocarbons. The goal was to develop
a "smart" drilling system tough enough to withstand the extreme temperatures,
5.3.3 Energy Management Plan
The measures identified may be short term, medium term or long term
requiring nil to high investments. Medium & Long term efforts are
structured and normally implemented without much efforts. One example
of long-term efforts is the replacement of outdated, energy inefficient DG
engines like D 399 by new energy efficient models like CAT 3516
requiring high investment of the tune of Rs 250 Crores.
However short term programs are basically voluntary and needs to be push
forwarded by:
• Awareness generation• Leadership demonstration• Top management support
A good energy management plan for a Rig should generally comprise of:
- Fuel consumption to be compared with specific energy generation.- Proper log sheet for regular energy monitoring- Instrumentation / software to facilitate energy logging and evaluation
of specific energy generation.- Energy monitoring based on norms developed.- Energy monitoring to be based on drilling depth and soil condition.- Segregation of AC and DC loads and have power packs dedicated
to AC and DC operation.
5.3.4 Best Operation Practices in Rigs
Best Operating Practices (BOP) is referred to operating procedures and
good house keeping habits for reducing the wastage of energy, reducing &
preventing environmental pollution. The overall philosophy of BOP is to
conduct every day activity in more efficient, safe and environmentally
sound manner.
5.3.4.1 Efficient Operation of DG sets
• When the total running load during non-drilling days is small (in the range
of 50 KVA), a smaller rating ( say 63 KVA) DG set should be used during
non-drilling days• Monitoring of specific energy generation ratio (SEGR). SEGR of a DG set
is a performance indicator, which is proportional to the extent of loading of
the set. At part load operation, the efficiency of the DG set drops with
consequent decrease in the SEGR value. Proper monitoring of SEGR will
help in conserving energy.• Monitoring of Lube oil quality. The drain interval of lube oil specified by
the manufacturer is based on worst operating conditions and a high factor
of safety.By follow of good operating and maintenance practices, there is a distinct
possibility that the condition of the lube oil remains good and usable even
after the specified period.• Testing of lube oil for certain physicochemical properties like viscosity,
total base number, water content, insoluble build up etc, may extend the
drain interval for lube oil.
8/4/2019 pcra- E&P
http://slidepdf.com/reader/full/pcra-ep 10/15
235234
horizontally.
e) The Microhole Technology
The Microhole Technology drills small diameter boreholes (approximately
two-inch diameter), using smaller sized equipments to complete microholes,
and advanced diagnostic tools to measure important reservoir characteristics.
The cost reduction using this technology is estimated to be nearly one-half the
cost of traditional drilling rigs. The feasibility of microhole technology has
been demonstrated by pioneering work conducted by Los Alamos National
Laboratory (LANL) in collaboration with Maurer Technology. The team has
successfully used coiled-tubing-deployed micro drilling to drill wells as small
as 1-3/4-inch in diameter and as deep as 800 ft.
5.3.5 Energy Conservation Measures In Drilling Rigs
The heart of the drilling rig is the Power Packs i.e., the DG sets which are
generating power for the entire Rig by using HSD in diesel engines .The
consumption of HSD in the DG sets varies between 500 lits per day to 2500 lits
per day depending upon the following factors:
1. Location (formation type)2. Drilling hole diameter 3. Drill ing depth4. Health of the DG engines5. Pull out practice (operation of drillers foot, pull out time per pipe)
The most important factor out of the above points is the health of the DGengines. The health of engine plays the major role in the oil (HSD)
consumption in the Rig. For example one of the Rigs operating in India in the
north east part of India is being operated with maximum 3 nos. of DG sets for a
drilling depth of about 2500 Meter and at the same time with almost same
formation and same drilling depth the other Rig is being operated with 4 nos. of
DG sets (both the places the ages of the engines are almost same). The reason
for the same is better maintenance prevailing in the first site.
Good Maintenance Practices
Checking schedule
1. Name of the parts Checking after
Liner 200 HrsPiston 200 HrsValve insert 24-36 HrsValve spring 24-36 Hrs
Valve cover gasket 24-36 HrsWater Valve 24-36 HrsValve Sheet 24-36 Hrs
pressures and corrosive conditions of deep reservoirs, yet economical enough
to make the hydrocarbons affordable to produce. The projects include
advancing drilling performance, developing "smart" communication systems,
instrumentation, novel drill bits and fluids, and novel pipe systems that are ableo
to withstand the severe temperatures (over 400F) and pressures in deep
horizons.
These "smart" drilling systems can report key measurements - temperature,
pressure, fluid content, geology, etc. - as a well is drilled. Sophisticatedelectronic systems can identify potential trouble spots on a real-time basis,
allowing operators to make adjustments without interruption or costly work
stoppages.
5.3.4.6 Other Drilling Advancements
a) Mud Pulse
It is the first system to transmit drill bit location by sending pressure pulses
through drilling mud, which was developed by the US Energy Department and
Teleco, Inc. Today, this "mud pulse" measurement-while-drilling telemetry has
become standard in the industry.
b) IntelliPipe
A new technology system in downhole telemetry, sponsored by US DOE called
IntelliPipe turns an oil and gas drill pipe into a high-speed data transmission
tool capable of sending data from the bottom of a well up to 200,000 times
faster than mud pulse and other downhole telemetry technology in commonuse today. Potential benefits include decreased costs, improved
safety, and reduced environmental impacts from drilling.
c) New drill bits
The polycrystalline diamond (PDC) drill bit, now the industry standard for
drilling into difficult formations, is a Revolutionary new drill bit developed by
US Energy Department's research program. Scientists at the Energy
Department's Sandia National Laboratories have successfully developed a
"diffusion bonding" approach. More recently, Penn State University, working
under an Office of Fossil Energy contract, developed a way to use microwaves
to harden the tungsten carbide of deep drilling bits, resulting in a 30 percent
increase in strength.
d) Advanced composite drill pipe materials (Carbon fiber)
The drilling system of the future may also employ new advances in drill pipe
materials as a result of the Energy Department's research program. In mid2004, the Department announced the development of a new "composite" drill
pipe that is lighter, stronger and more flexible than steel, which could
significantly alter the ability to drain substantially more oil and gas from rock
than traditional vertical wells.
The carbon fiber drill pipe is likely to weigh less than half the
weight of steel drill pipe, and the lighter the pipe, the less torque and drag is
created, and the greater distance a well can be drilled both vertically and
8/4/2019 pcra- E&P
http://slidepdf.com/reader/full/pcra-ep 11/15
237236
advantage of this is that at a time 3 strands can be put together for drilling
operation. Hence the total time for drilling can be reduced considerably. But at the
same time fuel consumption will increase during drilling phase because of
additional load of electrical TOP DRIVE in place of conventional mechanical
Rotary Drive. However overall energy saving is envisaged to be less in such rig
operation due to less no of days required for drilling. As per GTO (Geo Technical
Order) the total number of days envisaged was 368 days but as per actual status this
rig operation has been estimated to be 300 days that too including 45 days of idling
due to problem in the newly installed TOP DRIVE system.
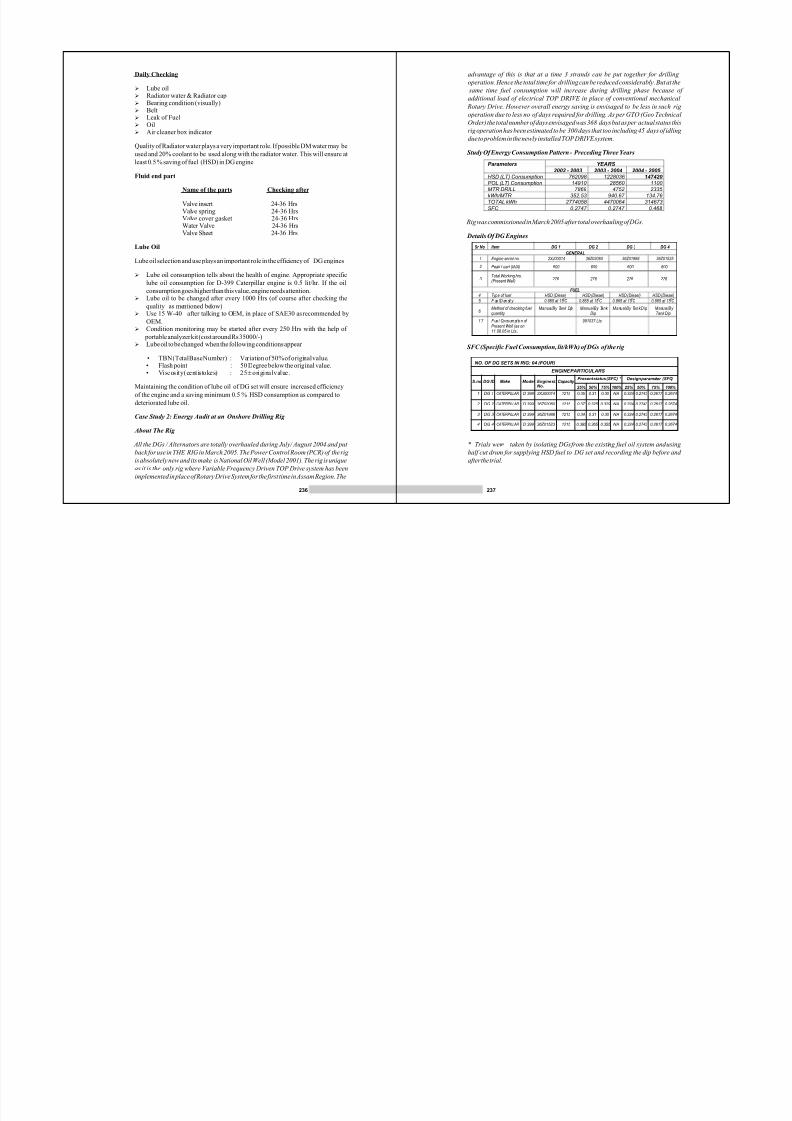
Study Of Energy Consumption Pattern - Preceding Three Years
Rig was commissioned in March 2005 after total overhauling of DGs.
Details Of DG Engines
* Trials were taken by isolating DGs from the existing fuel oil system and using
half cut drum for supplying HSD fuel to DG set and recording the dip before and
after the trial.
SFC (Specific Fuel Consumption, lit/kWh) of DGs of the rig
YEARS Parameters
2002 - 2003 2003 - 2004 2004 - 2005 HSD (LT) Consumption 762098 1228036 147420 POL (LT) Consumption 14910 28560 1100 MTR DRILL 7869 4752 2335 kWh/MTR 352.53 940.67 134.76 TOTAL kWh 2774058 4470064 314673
SFC 0.2747 0.2747 0.468
Sr No
Item
DG 1
DG 2
DG 3
DG 4
GENERAL
1 Engine serial no. 2XJ00014 36Z02060 36Z01988 36Z01525
2
3
Peak Load (kVA) 600 600 600 600
Total Working hrs.(Present Well) 276 276 276 276
FUEL
4 Type of fuel
HSD (Diesel)
HSD (Diesel)
HSD (Diesel)
HSD (Diesel)
5 F ue l D en sit y
0.865 at 15 0 C
0.865 at 15 0 C
0.865 at 15 0 C
0.865 at 15 0 C
6 Method of checking fuel
quantity Manual By Tank Dip Manual By Tank
DipManual By Tank Dip Manual By
Tank Dip
17 F ue l Consumpt ion of Present Well (as on11.08.05 in Lts.)
991037 Lts
NO. OF DG SETS IN RIG: 04 (FOUR)
ENGINE PARTICULARS
Present status (SFC) * Design parameter (SFC)S.no. Make
Capacity
1
2
3
4
DG ID
DG 1
DG 2
DG 3
DG 4
CATERPILLAR
CATERPILLAR
CATERPILLAR
CATERPILLAR
Model
D 399
D 399
D 399
D 399
Engine sl.No.
2XJ00014
36Z02060
36Z01988
36Z01523
1215
1215
1215
1215
25%
0.35
0.37
0.34
0.385
50%
0.31
0.325
0.31
0.365
75%
0.30
0.329
0.30
0.355
100% NA
NA
NA NA
25%
0.324
0.324
0.324
0.324
50%
0.2743
0.2743
0.2743
0.2743
75% 0.2617
0.2617
0.2617 0.2617
100% 0.2674
0.2674
0.2674 0.2674
Daily Checking
ØLube oilØRadiator water & Radiator capØBearing condition (visually)ØBeltØLeak of FuelØOilØAir cleaner box indicator
Quality of Radiator water plays a very important role. If possible DM water may be
used and 20% coolant to be used along with the radiator water. This will ensure at
least 0.5 % saving of fuel (HSD) in DG engine
Fluid end part
Name of the parts Checking after
Valve insert 24-36 HrsValve spring 24-36 HrsValve cover gasket 24-36 HrsWater Valve 24-36 HrsValve Sheet 24-36 Hrs
Lube Oil
Lube oil selection and use plays an important role in the efficiency of DG engines
ØLube oil consumption tells about the health of engine. Appropriate specificlube oil consumption for D-399 Caterpillar engine is 0.5 lit/hr. If the oil
consumption goes higher than this value, engine needs attention.ØLube oil to be changed after every 1000 Hrs (of course after checking the
quality as mentioned below)ØUse 15 W-40 after talking to OEM, in place of SAE30 as recommended by
OEM.ØCondition monitoring may be started after every 250 Hrs with the help of
portable analyzer kit (cost around Rs 35000/-)ØLube oil to be changed when the following conditions appear
• TBN (Total Base Number) : Variation of 50% of original value.• Flash point : 50 Degree below the original value.• Viscosity (centistokes) : 25 ± original value.
Maintaining the condition of lube oil of DG set will ensure increased efficiency
of the engine and a saving minimum 0.5 % HSD consumption as compared to
deteriorated lube oil.
Case Study 2: Energy Audit at an Onshore Drilling Rig
About The Rig
All the DGs / Alternators are totally overhauled during July/ August 2004 and put
back for use in THE RIG in March 2005. The Power Control Room (PCR) of the rig
is absolutely new and its make is National Oil Well (Model 2001). The rig is unique
as it is the only rig where Variable Frequency Driven TOP Drive system has been
implemented in place of Rotary Drive System for the first time in Assam Region. The
8/4/2019 pcra- E&P
http://slidepdf.com/reader/full/pcra-ep 12/15
239238
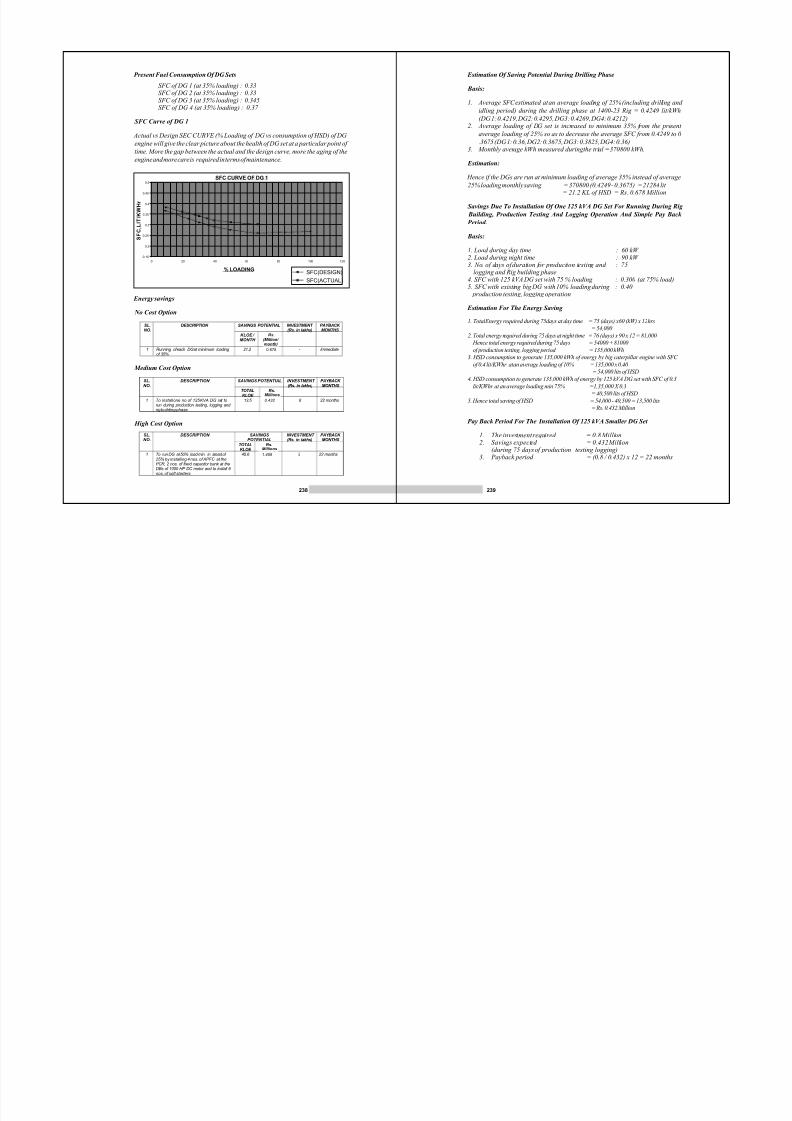
Present Fuel Consumption Of DG Sets
SFC of DG 1 (at 35% loading) : 0.33SFC of DG 2 (at 35% loading) : 0.33SFC of DG 3 (at 35% loading) : 0.345SFC of DG 4 (at 35% loading) : 0.37
SFC Curve of DG 1
Actual vs Design SEC CURVE (% Loading of DG vs consumption of HSD) of DG
engine will give the clear picture about the health of DG set at a particular point of
time. More the gap between the actual and the design curve, more the aging of the
engine and more care is required in terms of maintenance.
Energy savings
No Cost Option
Medium Cost Option
High Cost Option
SFC CURVE OF DG 1
0.15
0.2
0.25
0.3
0.35
0.4
0.45
0.5
0 20 40 60 80 100 120
% LOADING
S F C , L
I T / K W H r
SFC(DESIGN)
SFC(ACTUAL)
SAVINGS POTENTIAL INVESTMENT (Rs. in lakhs)
PAYBACK MONTHS
SL.NO.
DESCRIPTION
KLOE / MONTH
Rs.(Lakhs/m
onth)1 Running of each DG at minimum loading
of 35%21.2 6.78 - Immediate
(Million/ month)
0.678
SAVINGS POTENTIAL INVESTMENT (Rs. in lakhs)
PAYBACK MONTHS
SL.NO.
DESCRIPTION
TOTALKLOE
Rs.(Lakhs)
1 To install one no. of 125 KVA DG set torun during production testing, logging and rig building phase
13.5 4.32 8 22 months
Millions
0.432
SAVINGS POTENTIAL
INVESTMENT (Rs. in lakhs)
PAYBACK MONTHS
SL.NO.
DESCRIPTION
TOTALKLOE
Rs.(Lakhs)
1 To run DG at 50% load min. in stead of 25% by installing 4 nos. of APFC at thePCR, 2 nos. of fixed capacitor bank at theDBs of 1000 HP DC motor and to install 6 nos. of soft starters
45.6 14.59 9 22 months
Millions
1.459
Estimation Of Saving Potential During Drilling Phase
Basis:
1. Average SFC estimated at an average loading of 25% (including drilling and
idling period) during the drilling phase at 1400-23 Rig = 0.4249 lit/kWh
(DG 1: 0.4219, DG2: 0.4295, DG3: 0.4269, DG4: 0.4212)2. Average loading of DG set is increased to minimum 35% from the present
average loading of 25% so as to decrease the average SFC from 0.4249 to 0
.3675 (DG 1: 0.36, DG2: 0.3675, DG3: 0.3825, DG4: 0.36)3. Monthly average kWh measured during the trial = 370800 kWh.
Estimation:
Hence if the DGs are run at minimum loading of average 35% instead of average
25% loading monthly saving = 370800 (0.4249 - 0.3675) = 21284 lit = 21.2 KL of HSD = Rs. 0.678 Million
Savings Due To Installation Of One 125 kVA DG Set For Running During Rig
Building, Production Testing And Logging Operation And Simple Pay Back
Period.
Basis:
1. Load during day time : 60 kW 2. Load during night time : 90 kW 3. No. of days of duration for production testing and : 75
logging and Rig building phase
4. SFC with 125 kVA DG set with 75 % loading : 0.300 (at 75% load)5. SFC with existing big DG with 10% loading during : 0.40
production testing, logging operation
Estimation For The Energy Saving
1. Total Energy required during 75 days at day time = 75 (days) x 60 (kW) x 12 hrs
= 54,000
2. Total energy required during 75 days at night time = 76 (days) x 90 x 12 = 81,000
Hence total energy required during 75 days = 54000 + 81000
of production testing, logging period = 135,000 kWh
3. HSD consumption to generate 135,000 kWh of energy by big caterpillar engine with SFC
of 0.4 lit/KWhr at an average loading of 10% = 135,000 x 0.40
= 54,000 lits of HSD
4. HSD consumption to generate 135,000 kWh of energy by 125 kVA DG set with SFC of 0.3
lit/KWhr at an average loading min 75% =1,35,000 X 0.3
= 40,500 lits of HSD
5. Hence total saving of HSD = 54,000 - 40,500 = 13,500 lits
= Rs. 0.432 Million
Pay Back Period For The Installation Of 125 kVA Smaller DG Set
1. The investment required = 0.8 Million2. Savings expected = 0.432 Million
(during 75 days of production testing logging)3. Payback period = (0.8 / 0.432) x 12 = 22 months
8/4/2019 pcra- E&P
http://slidepdf.com/reader/full/pcra-ep 13/15
241240
Installation Of Capacitor Bank
The main problem of a drilling RIG is the power factor of power generated by the
DG engines. Due to sudden change of load in the RIG due various reasons the DC
load of Draw works and mud pump (AC load of DG is getting changed to DC with
the help of SCRs to supply DC power to Draw works and Mud pump). As the DC
load increases or decreases the power fluctuates from as low as 0.2 to 0.65 resulting
KVA demand (KW/PF) fluctuation. The poor factor actually force the electrical
man in the RIG to run additional engines for safety factor so as to avoid black out situation. This results in poor loading of individual DGs resulting high
consumption of HSD at poor loading.
One solution for improving and sustaining the power can be installation of
automated power factor controller. But globally there is no instance for adopting
such APFC. However efforts can be made in this direction on experimental basis.
Estimation Of kVAr Requirement For The Capacitor Banks
Calculation of KVAR for APFC (for installation at the common outlet of all the
DGs)-1 -1
kVAr requirement = Maximum load (kW) [tan (cos Ø 1) - tan (cos Ø 2)]Where Ø1 = 0.4 (av. PF of the system)
Ø2 = 0.7 (max. PF that can be achieved)-1 -1
= 1250 [ tan (Cos 0.4) - tan (Cos 0.7)]= 1250 [tan (66.42) - tan (45.57)]= 1250 [2.29 - 1.02]= 1587 1600
Hence four nos. of APFCs of each 400 kVAr capacity in series can be put at the PCR
(Power Control Room) to improve upon the PF.
Estimation Of Savings Potential By Improving The Power Factor (From 0.4 To
0.7) And Reducing The kVA Demand Of The Rig
Basis:
1. Existing avg. PF of Rig = 0.42. Improved PF of Rig after installation of APFCs and fixed type Capacitor Bank = 0.653. Present average loading of DGs is 25%
Estimation For Saving
1. One DG can be stopped by reducing the peak demand from 1250 kW max
(3125 kVA) to 1925 kVA with the help of capacitor (Automated and fixed). By
this in extreme situation, instead of running 4 DGs (each DG can take care 970
kVA max (80% of 1215 kVA limited to alternator). 2 DGs can cater the same
load.2. On the safer side if 3 DGs run in place of 4 DGs during the entire period of the
rig operation, operation of 1 DG can be stopped.3. Considering stopping of one DG throughout the rig operation thereby
increasing the loading by around 25% (from 25% loading to 50% loading) the
SFC can be reduced from 0.3220 to 0.3025 (refer actual SFC curves of DGs)4. Considering the total power requirement of 2340200 kWh (estimated earlier)
during the entire period of Rig Operation and a reduction of SFC by 0.0195
lit/kWh.
Total Saving = 45634 lit/kWh of HSD= 45.6 KL/HSD = Rs 1.459 Million
5. The payback period for the above investment = 0.9 Million (investment) x 12 = 7 months
1.459 Million5.4 Activities of Conservation of Oil and Gas in ONGC
ONGC has taken many steps for conservation of energy. One of the examples of its
long-term efforts is the plan for replacement of all D-399 engines by new energy
efficient engines model CAT 3516 at a cost of about Rs. 250 Crores. These CAT3516 engines are 5% more efficient.
5.4.1 Year wise consumption in ONGC
5.4.2 Steps initiated to conserve Petroleum products
ONGC's program of oil conservation is briefly summarized as below:
(A) Action Taken In-house For Conservation
a) Awareness Program is held every year under OGCF (Oil & Gas Conservation
Fortnight)
b) Seminar / Conference is organized for deliberation of issues on petroleumconservation.
c) ONGC Energy policy is already framedd) Energy Conservation tips are continuously scrolled on ONGC's house portal.e) E.C. Committee has issued two policies on conservation as under • Use of Solar Water Heating Systems in ONGC• Use of Energy Efficient Lighting System in ONGCf) On line quiz being held every year for ONGC employees and their wards.g) Three booklets are issued on conservation of Oil & Gas.• Urja Udai• Energy Conservation Techniques• Quest
h) A company wide training drive as "Energy Conservation Techniques
Training" has been taken up with the help of PCRA for training about 20000
officials of ONGC.
i) All models of engines have been audited and corrected for their running
efficiency.
j) 285 CAT D-399 Engines being replaced in phased manner by CAT D-3816Energy Efficient Engines.
k) Solar Water Heating Systems of different capacity has already been installed
on following locations in ONGC.1. 1300 Litres Per Day (LPD) at ONGC Guest House Tel Bhawan, Dehradun.2. 9000LPD at ONGC Hospital Dehradun.3. 7200LPD at GT Hostel in ONGC Academy.4. 7200LPD at ONGC Colony Dehradun.
Year 2006-07 2007-08
HSD in KL 196440.7 215419.4
Natural Gas in
MMSCM 1602.5 1739.6
8/4/2019 pcra- E&P
http://slidepdf.com/reader/full/pcra-ep 14/15
243242
5. 800LPD at Officers Club ONGC Dehradun.
l) 50MW Wind Power Project has been installed in Gujarat, near Bhuj. With a
saving potential of Rs. 29.86 Crores/Year.
m) More then 200 Energy Audits Carry outs on the different ONGC Installations.
(B) Expected reduction in consumption (from major initiatives)
1. "Energy Conservation Techniques Training" 3- 5%2 . Sol ar Wa te r H ea ting Sys te ms in ON GC 5-10%
3. Wind Power Projects 10-15%4. By Energy Efficient Engines (Caterpiller) 14-17%5. By Energy Eff ic ient Engines (Cummins) 3-7%
(C) Strategies for Conservation In Future
II. Additional awareness program in the organization to be taken up.III. More policies of Energy Conservation are to be put up for application.IV. Additional Solar/Thermal systems to be installed on more areas.V. Additional new Wind Power Plants to be set up in future.VI. First time Geothermal Energy project to be taken up.VII. Replacement of inefficient equipments.VIII. Tapping up waste heat recovery from exhaust of engines.IX. Waste heat recovery from Engines Jacket Water/Radiator X. Solar Electric SystemXI. Ocean Energy
5.5 Energy conservation measures in Oil India Limited (OIL)
5.5.1 Present Level Of Energy Consumption By OIL(During 2007-08)
5.5.2 Various Measures Adopted By OIL For Conservation Of Energy
During The Year 2007-08
5.5.2.1 Conservation Of Crude Oil
A total quantity of 4431 kL of Crude oil has been saved/retrieved from different
operational activities during the year under review by adopting the following
measures:
Energy Unit Qty Eqvt.kWh Approx.Monetary value(Rs. in Lakh)
Crude Oil Consumed for
Transportation of OIL’s &
ONGC’s crude Oil torefineries, etc.
kL
8069.00 78.269 × 10⁶
1690.50
Natural Gas (industrial &
domestic uses) MMSCUM
370.07
4266.90 × 10
6
11842.24
Diesel oil (HSD) (Drilling &W.O. operations, primemover operations, power generation, transport fleet,etc.)
kL 13397.64 107.964 × 10⁶
4342.175
L.D.O. kL
7.20 0.07 × 10⁶
2.70
Petrol kL
68.77 0.65 ×10⁶
32.72K.Oil kL
0.942 0.09 ×10⁶
0.015Lube Oil kL 771.061 *** 652.93Electricity kWh - 111.00 ×10
62053.50
TOTAL 4564.947× 106
20616.78
• Use of Aluminium paint in all crude oil storage tanks to minimize
evaporation loss.• Use of Oil Soluble De-emulsifier (OSD).• Use of dual fuel (Natural Gas and Crude Oil as fuel) engine in Crude Oil
Dispatch Pumps in PS-1 & PS-2 since natural gas is available.• Regular & proper maintenance of Crude Oil Transportation Trunk/ Branch
Pipelines to minimize pumping power requirement. This is further reduced by
treating the crude oil with flow improver chemical / heat treatment.• Water Clarification Plant and use of De-Oiler.• Retrieved from various pits and sumps.
5.5.2.2 Recovery of Condensate
Total volume of condensate recovered during the year was about 65604 kL, which
in terms of money amounts to Rs. 13744 lakhs (approx.)• By the operation of condensate recovery plant (CRP) at Moran, a total
quantity of 3957 kL condensate recovered.• Condensate recovered from Duliajan field -61236 kL• Condensate recovered from Rajasthan project- 356 kL
5.5.2.3 Conservation Of Natural Gas
Reduction in natural gas consumption in COCP's at Duliajan and Moran
During the year, the crude oil of both OIL & ONGC was treated with Flow Improver
chemical instead of thermal conditioning and thereby the consumption of natural
gas in COCPs at Duliajan has been reduced considerably and as a result the total
saving of natural gas was around 6.84 MMSCM (amounts to Rs.218.8 lakhs
approx.) during the year 2007-08.
Reduction of Gas flare
The following steps were taken for the reduction of natural gas flare during
2007-08.
1 Gas flare in Moran field has been reduced to 0.05 %.2
2 A total of 1.1 MMSCM very low pressure gas (about 0.7 kg / cm stabilizer
gas which is normally being flared in many OCSs) is being utilized from
Moran OCS as domestic fuel in housing area.3 After commissioning of stabilizer compressor and water seal system at OCS-5,
2utilized 1.1 MMSCM low pressure stabilizer gas (0.7 kg / cm ) as housing
fuel which otherwise would have been flared.4 After commissioning of two nos. gas distribution pipeline to utilize associated
gas produced at Brekuri EPS and NKL/NKL QPS, resulted in reduced gas
flaring and saving of 2102500 SCM of natural gas.5 During the year 160392 SCM low-pressure gas (30 psig) of Deroi EPS sold
to Moran Gas Grid. When there is no demand of gas from Moran Gas Grid,
20892 SCM of 30 psig low pressure gas from Deroi EPS was diverted to
Moran GCS-2, which otherwise would have been flared.6 Gas Holder: With the commissioning of the 30 psig Gas Holder the gas flaring
caused by surging effect of the gas lift has been restrained.7 Setting of Flare Controller: Periodic (weekly) flare controller setting at 35 psig
is being carried out to avoid flaring of 30 psig gas at various OCSs.
8/4/2019 pcra- E&P
http://slidepdf.com/reader/full/pcra-ep 15/15
245244
5.5.2.4 Supervisory Control And Data Acquisition (SCADA)
The SCADA project commissioned on 15 March 1998 is presently being used to
control the gas flare, accurate gas measurement, monitor consumption of gas as fuel
in both Oil Collecting Station (OCS) and Gas Compressor Station (GCS) and for
maximum utilization of produced gas, etc.
5.5.2.5 Conservation Of Diesel (HSD) And Petrol
Total quantity of about 406 kL (amounts to about Rs. 132 lakhs) of diesel has beenconserved during the year under review by adopting the following measures:
1 By installation of Gas Engine driven Crude Oil Dispatch (COD) pump in
place ofDieselEngine Driven Bowser loading pump at Barekuri EPS about
25.55 kL of HSD are being saved.
2 Eight nos. of work over wells were provided with electrical power from nearest
available source, resulted in saving of 9.6 kL of HSD.
3 Use of solar lighting at Tanot-GGS (Rajasthan) & Pilot Plant at Baghewala
(Rajasthan), resulted in saving of 2.84 kL of HSD
4 In pipeline operation 45 Nos. of old Dorman engines of generating sets having
fuel (HSD) consumption in the range 3.6 to 4.0 Ltr/Hr, at various repeater
stations have been replaced by Koel engines having fuel consumption rate of
2.6 to 2.8 Ltr/Hr., which resulted in saving of about 150 kL of HSD.
5 By using PDC Bits that cuts down the round trip time and resulting in reduction
of the rig hours consequently there is considerable reduction in HSD
consumption.
6 By adopting and continuing cluster-drilling techniques, consumption of fuel
(particularly HSD) is reduced considerably. Rig dragging were carried out at
five different locations whereby a rig was moved onto next cluster location
without any rigging down operation. This additionally eliminates rig
movements, which resulted in considerable saving in HSD consumption.
7 By adopting Horizontal Drilling technique, three full plus three part horizontal
well were completed. Production from a horizontal well is three times than of a
conventional well thereby saving in construction cost of two well as well as
considerable saving in HSD consumption.
8 By using motor driven hydraulic power unit instead of engine driven hydraulic
power unit for torque up casings during drilling operation resulted in
considerable saving in HSD consumption.
9 Minimized workover and swabbing operation wherever feasible by using Coil
Tubing Units (CTU) - Nitrogen Pumping Units (NPU). During the year
2007-08 total 129 nos. of work-over equivalent job were carried out by
deploying CTUs & NPUs, resulted in saving of 218.4 kL of HSD
10 By replacing diesel engine driven centrifugal pump by motor driven pump in
drilling rig for pumping gauging water, considerable amount of HSD was
saved.
5.5.2.6 Conservation Of Lube Oil
1 By using Lube oil analysis kit, carrying out Chemical analysis from time to
time and revising and setting up of lube oil standard, the lube oil consumption
has been optimized which in fact contributed to the conservation of lube oil.
The lube oil change period for caterpillar engine has been re-scheduled from
500 Hrs. (manufacturer's recommendation) to around 1000 Hrs. (OIL's
practice) without any adverse affect on the engine, which resulted considerable
saving of lube oil.2. Due to use of improved quality of gland packing of the plungers of the injection
pumps in Water Injection operations the consumption of lube oil was reduced
considerably.
5.5.2.7 Utilisation Of Non-Conventional Energy
I. A total of about 244 nos. of Multi Access Radio Telephone (MART) terminals
were provided with Solar Photo Voltaic Panels to achieve energy saving and
cost reduction. By adopting these measures about 0.61 kL of HSD was saved
during 2007-08.II. Use of solar lighting at TANOT Gas Gathering Station and at Pilot plant,
Baghewala resulted in saving of 2.84 kL of HSD.
References
1. Petroleum exploration and production activities, 2006-07, Directorate General
of Hydrocarbons, Ministry of Petroleum & Natural Gas, GoI2. Annual Report (2007-08) of Ministry of Petroleum & Natural Gas, GoI
3. World Energy Outlook 20074. TERI Energy Directory and Yearbook 20075. Statistical Abstract 2007-CSO6. Report from Technical Services & Energy Conservation Cell of ONGC7. Report from Technical Audit Department, OIL INDIA LIMITED8. Energy Audit Reports of ONGC & OIL conducted by PCRA9. BP Statistical Review, June 200810. PPAC Ready Recokner, April 200811. www.netl.doe.gov12. www.fossil.energy.gov


![PCRA Report II From Intro[1]](https://img.pdfslide.us/doc/110x75/55cf8a9f55034654898c674f/pcra-report-ii-from-intro1.jpg)