Embed Size (px)
Citation preview

Journal of Inorganic Biochemistry 115 (2012) 186–197
Contents lists available at SciVerse ScienceDirect
Journal of Inorganic Biochemistry
j ourna l homepage: www.e lsev ie r .com/ locate / j inorgb io
PcoE — A metal sponge expressed to the periplasm of copper resistanceEscherichia coli. Implication of its function role in copper resistance☆
Matthias Zimmermann a, Saumya R. Udagedara a, Chak Ming Sze a, Timothy M. Ryan b, Geoffrey J. Howlett b,Zhiguang Xiao a,⁎, Anthony G. Wedd a,⁎a School of Chemistry, Bio21 Molecular Science and Biotechnology Institute, University of Melbourne, Parkville, Victoria 3010, Australiab Department of Biochemistry and Molecular Biology, Bio21 Molecular Science and Biotechnology Institute, University of Melbourne, Parkville, Victoria 3010, Australia
☆ Dedication: in Memorial Issue for H. C. Freeman; wehis memory.⁎ Corresponding authors. Fax: +61 3 9347 5180.
E-mail addresses: [email protected] (Z. Xiao), a(A.G. Wedd).
0162-0134/$ – see front matter © 2012 Elsevier Inc. Alldoi:10.1016/j.jinorgbio.2012.04.009
a b s t r a c t
a r t i c l e i n f oArticle history:Received 13 February 2012Received in revised form 10 April 2012Accepted 11 April 2012Available online 27 April 2012
Keywords:Copper transportCopper binding proteinSilver transportSilver binding proteinE. coli
Expression of the periplasmic protein PcoE of Escherichia coli is induced strongly by cupric salts under thecontrol of the chromosomal copper tolerance system cusRS. Its isolation and study were complicated byde-amidation of Asn 54 and 103 at alkaline pH. Its apo form is essentially unstructured in solution and can belikened to a large unstructured multidentate ligand carrying multiple metal binding sites (15 Met; 10 His; 13Asp, Glu; 10 Asn; 6 Lys). As expected, it binds multiple soft metal ions Cu+ and Ag+ non-cooperatively withthe highest affinity for CuI in the picomolar range (KD~10
−12 M). Binding ofmultiple soft ions induced dimeriza-tion and formation of some α-helical structure. PcoE also binds the harder metal ions Cu2+ or Zn2+ but withlower affinities and in smaller numbers. CuII bound in PcoE is reduced readily tomore tightly bound CuI. Overall,these properties mean that it is difficult to characterize individual species of definedmetal content. Similar prop-erties and difficulties have been reported for the homologous silver-binding protein SilE from Salmonella. How-ever, the properties are consistent with a role for PcoE as a ‘metal sponge’ acting as a first line of defence againstmetal toxicity (under the control of the copper tolerance system cusRS) until the copper resistance operonpcoABCD is expressed.
© 2012 Elsevier Inc. All rights reserved.
1. Introduction
Copper is required as a redox-active cofactor by most organisms. Itis essential for critical processes such as photosynthesis, respiration,electron transport, free radical detoxification and neurotransmitteraction [1]. However, if unconstrained by the appropriate biologicalsite, CuII/CuI redox cycling can catalyse production of damaging reac-tive oxygen species or the ions can substitute for native metals. Con-sequently, evolution has developed sophisticated systems to ensurethe safe transport of copper along its distribution network. Thesesystems include extracellular acquisition, cellular uptake and deliveryto cupro-enzymes, plus recycling and clearance [1].
Bacteria modulate nutrient copper concentrations (~1 μM) by ex-pressing chromosomally-encoded copper tolerance operons. Thereare two key systems in Escherichia coli [2]. The first involves two en-zymes: CopA, a P-type ATPase which transports excess CuI from thecytoplasm to the periplasm where it is oxidized by CueO, a multi-copper oxidase. Expression of these two enzymes is under the control
wish to dedicate this article to
rights reserved.
of the cytosolic metalloregulatory protein CueR [3]. The second,CusCFBA, comprises a tripartite protein complex CusCBA that spansthe complete cell wall as a proton-substrate antiporter and a fourthmember CusF that binds both CuI and AgI [4–6]. This system conferscopper tolerance by expelling CuI directly from the periplasm, a roleperformed primarily under anaerobic conditions [7]. Its expressionis regulated by the two-component sensor system cusRS [8].
Some bacteria can survive environmental concentrations of copperin the millimolar concentration range by expressing plasmid-encodedresistance operons [9–14]. The plasmid pRJ1004 of E. coli carries acopper resistance pco gene cluster that features seven pco genespcoABCDRSE, arranged in two operons, pcoABCD and pcoRS, plus aseparate pcoE gene. Copper resistance relies on expression of thesePco proteins [8,11,15,16]. Both PcoA and PcoC have been expressedand characterized. PcoC is a copper chaperone with separated bindingsites specific for CuI and CuII [17]. PcoA is a multicopper oxidasewhich is able to oxidise PcoC-bound CuI to less toxic CuII [18,19].
Homologous copper-resistance cop determinants copABCDRS havebeen found in copper resistant strains of Pseudomonas syringae pathovartomato isolated from plants exposed to high levels of copper com-pounds and in strains of Ralstoniametallidurans isolated from sedimentsof a zinc decantation basin in Belgium [10,14]. The operon structures ofthese cop gene cluster are similar to their pco counterparts, as are theprotein sequences, suggesting a conserved mechanism of copper resis-tance. However, the pcoE gene in the pco cluster has no counterpart in

187M. Zimmermann et al. / Journal of Inorganic Biochemistry 115 (2012) 186–197
cop systems and this suggests that the operation of the Pco determinantmay be somewhat different from those of the cop systems.
Expression of PcoE is induced strongly by cupric salts under thecontrol of the chromosomal two-component tolerance systemcusRS, whereas expression of PcoABCD appears to be regulated pri-marily by the resistance system pcoRS [8,16]. Overexpression ofPcoE alone has little effect on overall copper resistance, but does re-duce the time required for E. coli strains to recover from copper stress[8,13]. Consequently, PcoE does not seem to be strictly required forcopper resistance, but may provide a rapid response via initial se-questration of copper in the periplasm while the remaining genes ofthe pco system are being fully induced.
A protein SilE (123 residues) is homologous to PcoE with 48% se-quence identity (Fig. 1). It was discovered in the AgI resistance plasmidpMG101 from a Salmonella strain isolated in a hospital burn ward. Theinfection caused septicaemia, killing three patients and leading toclosure of the burn unit [20]. The conferred resistance allowed growthin standard Luria–Bertani broth containing AgI (0.6 mM) but no addedchloride. This is more than six times the silver concentration that canbe tolerated by a normal E. coli strain.
Both native SilE and PcoE proteins feature a leader sequence and areexported to the bacterial periplasm after their expression. Both proteinsare rich in potential metal ligands: Met (9% and 12%, respectively) andHis (both 8%). Notably, primary sequence identity between the twoproteins is >50% formethionine residues and 100% for the ten histidineresidues (Fig. 1), implying the potential role of these residues in metalbinding, especially for those soft metal ions such as CuI and AgI.
The research laboratory of Simon Silver has communicated someinitial characteristics of isolated SilE samples [12,20–26]. As monitoredvia CD andNMR spectroscopy, apo-SilE exhibited essentially no second-ary structure but binding of AgI inducedα-helical structure and changesin the chemical shifts of the C2 and C4 imidazole protons of some of theHis residues [24]. Metal analysis indicated that SilE could bind 5, 6, 10 oreven 38 silver ions, depending on the experimental conditions [23]. CuI
binding experiments were not considered since these authors assumedthat CuII only would be available in the periplasm [24].
The PcoE protein has not been isolated so far. In this work, we reportits expression and characterization. The apo form ismonomeric and un-structured in solution. It is able to bindmultiplemetal ionswith varyingaffinities, but the highest affinity for CuI is still somewhat lower thanthat of PcoC, a potential protein partner. A copper resistance model in-cluding the potential role of PcoE is proposed and discussed.
2. Experimental procedure
2.1. Materials and general methods
Chemicals and reagents (analytical grade) were purchased fromSigma. Standards for inductively coupled plasma optical emission spec-troscopy (ICP-OES) were from CHOICE Analytical Pty Ltd. CuI probe CS1(copper sensor 1) was prepared according to a reported procedure andwas provided kindly by Drs James Hickey and Paul Donnelly of theUniversity of Melbourne [27]. PcoC protein (potential partner of PcoE)was purified as reported [17]. Unless otherwise stated, characterization
Fig. 1. Sequence alignment of PcoE from E. coli and SilE from Salmonella. The potential metsequence motifs prone to deamidation at positions 54–55 and 103–104 are highlighted inthe C-terminus of the expressed PcoE protein to provide suitable spectroscopic probes.
and manipulation of all protein samples were carried out anaerobicallyin deoxygenated buffers in a glovebox ([O2]b2 ppm). The samplesweretransferred in sealed containers for characterization.
2.2. Construction of expression plasmids
The DNA sequences encoding PcoE was amplified, without the 20AA-leader sequence, by PCR from the E. coli plasmid pRJ1004 [9].The sequences of the two primers are: 5′-TCTAGACATATGAA-AAAGATTCTCGTATCATTTGT-3′ for the forward primer and 5′-TCTA-GAGGATCCTTACCAATTCTGGGTGATCTG-3′ for the reverse primer.An NdeI restriction site was incorporated in the forward primer anda BamHI site and a stop codon incorporated in the reverse primer tofacilitate DNA cloning and protein expression. An extra codon (TGG)was incorporated before the stop codon in the reverse primer to in-troduce an extra Trp residue at the C-terminus to increase the molarabsorptivity ε280 and provide a potential fluorescence probe. EachPCR product was doubly digested with NdeI and BamHI and cloned intothe expression vector pET11a (Novagen) which was pre-digested withthe same restriction enzymes. DNA sequencing analysis confirmed thatthe gene sequence was inserted correctly into the expression vector.
2.3. Protein expression and purification
The expression plasmid was maintained in E. coli DH5α cells andtransformed into E. coli BL21(DE3) CodonPlus cells (Stratagene) forprotein expression. Each liter of 2YT medium (ampicillin, 100 mg;chloramphenicol, 34 mg) was inoculated with an overnight culture(10 mL) of the transformed E. coli cells. The cells were grown aerobi-cally with vigorous shaking at 37 °C to OD600~1 and isopropyl-β-o-thiogalactopyranoside (IPTG) was added to a final concentration of0.5 mM to induce protein expression. The culture was grown furtherat ~30 °C for 3–4 h or at room temperature (~22 °C) overnight beforebeing harvested by centrifugation. A clarified cell lysate was preparedin Tris–HCl buffer (20 mM; pH 8.0; Edta, 1.0 mM).
The PcoE protein was purified by two methods. In method 1, theclarified cell lysate was diluted and adjusted to pH 6.0 with Mes buff-er and loaded onto a cation-exchange Source 15S column (1×10 cm)that had been equilibrated with Mes buffer (20 mM; pH 6.0; Edta,1.0 mM). Weakly bound PcoE protein was eluted with a NaCl gradientof 0–100 mM. Apo-PcoE eluted as a single sharp peak at [NaCl]~50 mM. The final purification step used a Superdex-75 gel filtrationcolumn with eluent buffer Mops (20 mM; pH 7.0; NaCl, 100 mM) toremove Edta and contaminating proteins. The purity and identity ofthe isolated PcoE protein were confirmed by SDS-PAGE and ESI-MS.The isolated protein contained no detectable metal content. However,the purification efficiency of this method was compromised by theweak binding of the target protein on the Source 15S resin. At thispH, the PcoE protein is difficult to bind on other cation-exchangeresins such as CM-52 (Whatman) and S-Sepharose-Fast Flow (GEHealthcare).
In method 2, cell lysate was adjusted to pH=9.0 with Tris base topromote binding to an anion-exchange DE-52 column (Whatman).The lysate was loaded onto the column that had been pre-equilibrated
al ligands His and Met residues are coloured in cyan and yellow, respectively. Asn-Glyred italics. A single tryptophan residue (highlighted in blue italics) was introduced in

188 M. Zimmermann et al. / Journal of Inorganic Biochemistry 115 (2012) 186–197
with Tris–HCl buffer (50 mM, pH 9.0). PcoE eluted as a dominant pro-tein peak in the range [NaCl]=50–80 mM. The PcoE-containingfractions were pooled and exchanged into a glycine-acetate buffer(50 mM, pH 2.5). A small amount of precipitate was formed whichwas removed by filtration. The clear solution was applied onto a S-Sepharose Fast Flow column (1.5×10 cm) that had been equilibratedwith glycine-acetate buffer (50 mM; 1.0 mM Edta; pH 2.5). The boundproteinwas elutedwith a NaCl gradient of 0.1–0.8 M in the same buffer.PcoE eluted as a sharp peak at [NaCl]~0.4 M. The protein fractionswerepooled and the pH adjusted to 8 with Tris base. The solution was con-centrated with addition of ~15% glycerol and the protein purifiedfurther on a Superdex-75 fast protein liquid chromatography (FPLC)gel-filtration column in Tris–HCl buffer (50 mM; pH 8.0; NaCl,100 mM; 15% glycerol; 1 mM Edta). Partial deamidation is evident forthe PcoE samples purified by this method.
A sample of PcoE enrichedwith 15Nwas produced similarly from cellsgrown in a minimal M9 medium supplemented with 15N–NH4Cl. Thepurity and identity of the isolated PcoE protein were confirmed by SDS-PAGE and electrospray ionisation mass spectrometry (ESI-MS). Theisolated protein was in its apo form with no detectable metal content.
2.4. Concentration assays
The concentration of apo-PcoE was estimated from ε280=4800 M−1 cm−1, as determined by quantitative drying of protein sam-ples in the volatile bufferNH4HCO3. This value varies from that calculatedfrom the protein amino acid content (ε280 of 5500 M−1 cm−1).
Stock solutions of [CuI(MeCN)4]+, Cu2+aq, ligands N,N,N′,N′-
ethylenediaminetetraacetic acid (Edta) and bicinchoninic anion(Bca) were standardized according to protocols described previously[28,29]. A Zn(NO3)2 standard (15.3 mM) was purchased from Aldrich.The Cu contents in the isolated protein samples were determinedsimilarly to a published procedure with Bcs reagent [29,30]. Allother metals were quantified, and the copper content verified, by in-dependent analysis of selected protein samples with ICP-OES.
2.5. Analytical gel filtration
The aggregation state was examined with an analytical Superdex-75 gel-filtration column (HR10/30; Pharmacia) at a flow rate of0.7 mL/min in Mops buffer (20 mM; pH 7.3; NaCl, 100 mM). The col-umn was calibrated with Blue Dextran (2000 kDa), albumin (67 kDa),ovalbumin (43 kDa), chymotrypsinogen A (25 kDa) and ribonucleaseA (13.7 kDa) as standards (Amersham Pharmacia).
2.6. Sedimentation velocity and equilibrium analysis
Measurements were carried out at 20 °C using a Beckman OptimaXL-1 analytical ultracentrifugewith anAn-Ti60 rotor. The apo-PcoE pro-tein was studied as a 60 μM solution in Mops buffer (20 mM; pH 6.0)containing glycerol (10% v/v) and weak reductant NH2OH (1.0 mM).Metal-loaded samples contained 0–6 equiv of CuSO4 or AgNO3. Sedi-mentation velocity data was obtained at 60,000 rpm. The data wereanalysed using the sedimentation coefficient distribution c(s) modelin SEDFIT 9.4 to provide sedimentation coefficients and estimates ofmolar mass [31,32]. The c(s) distributions were corrected for densityand viscosity and expressed as s20w values (i.e., equivalent to the sedi-mentation coefficient of this species in H2O). Sedimentation equilibri-um experiments were performed at 20,000 and 35,000 rpm and thedata analyzed using the program SEDPHAT [33].
2.7. Other spectroscopic studies
Fluorescence emission spectra were obtained on a Varian CaryEclipse spectrophotometer. The excitation wavelength was 280 nmwith a band pass of 10 nm for both excitation and emission spectra.
Spectra were recorded between 290 and 600 nm at a scale rate of600 nm/min. The absorbance of protein solutions was maintainedbelow A280=0.1 to minimise resorption effects.
UV–visible spectra were recorded on a Varian Cary 300 spectro-photometer in dual beam mode with quartz cuvettes of 1.0 cm pathlength. All metal titrations of PcoE were performed in Mops Buffer(20 mM; 100 mM NaCl; pH 7.0) and corrected for baseline and dilu-tion. A metal stock of 5.0 mM (Ag+, Cu2+) was titrated into the pro-tein solution (25 μM) in 0.5 equiv aliquots in the absence or presenceof weak reductant NH2OH and the spectrum recorded from 800 to220 nm after mixing and incubation for 5 min.
Circular dichroism experiments were performed on a Jasco 810spectropolarimeter using a 1.0 mm path quartz cell. The general sam-ple conditions were 5.0 μM PcoE in 5 mM KPi buffer at pH 7.0. Allspectra were corrected for buffer background and analysed using Dic-howeb [34,35].
1H–15N heteronuclear single quantum coherence (HSQC) NMR ex-periments were conducted on samples (0.6–0.8 mM; ~90% 15N) whichwere prepared in Mops buffer (20 mM, pH 7.3; Na2SO4, 50 mM) con-taining D2O (~5%) and NaN3 (0.05%). Spectra were recorded at 25 °Con a Bruker-Biospin Avance 800 MHz spectrometer, equipped with acryogenically cooled probe and processed using TOPSPIN (Bruker AG).
2.8. Quantification of high affinity CuI-binding
Three approaches were used to quantify the high affinity CuI-binding. The first was via analysis on chromatography elution usinga Mono S cation exchange column [17]. Apo-PcoE samples loadedwith a varying amount of CuSO4 (0–5 equiv) in the presence or ab-sence of reductant NH2OH were applied onto the column and elutedwith a NaCl salt gradient in Mes buffer (20 mM, pH 6.0). The elutedprotein fractions were compared for their elution positions andanalysed for their metal content.
The second approach was by competition with the reported CuI-probe CS1 [27]. The experiments were conducted under anaerobic con-dition by monitoring the change in the probe fluorescence intensity at560 nm (excitation at 540 nm) upon titration of [CuI(CH3CN)4]+ intoa series of CS1 solutions (2.0 μM) in Mops buffer (50 mM, pH 7.3) con-taining various molar ratios of apo-PcoE (0, 2.0, 4.0 equiv). The CuI oxi-dation state was ensured by including ascorbate (2.0 mM) in thereaction buffer.
The third approach was by competition with another CuI-probeBca. The experiments were performed in an anaerobic glove-box byreaction of apo-PcoE with [CuI(Bca)2]3− in deoxygenated Mops buffer(20 mM; pH 7.0; NaCl, 100 mM), as described previously [29,36].Briefly, apo-PcoE was titrated into solutions of [CuI(Bca)2]3− ofdefined molar ratio Bca:CuI=3.0 (to ensure the presence of the 1:2complex [CuI(Bca)2]3− with negligible contribution from the 1:1complex [CuI(Bca)]−). The reaction mixtures were diluted to a fixedvolume to provide a series of solutions with constant total concentra-tions of CuI and ligand Bca but varying concentrations of PcoE protein.Transfer of CuI from [CuI(Bca)2]3− to PcoE was established by thechange in absorbance at 562 nm. Assuming a single site bindingmodel of effective competition according to Eq. (1), the dissociationconstant KD for CuI-PcoE may be estimated from Eq. (2) [37].
PcoEþ CuI Bcað Þ2h i3−
⇌CuI−PcoEþ 2 Bca2− ð1Þ
KDβ2 ¼PcoE½ �total= CuI−PcoE
h i� �−1
Bca½ �total= CuI Bcað Þ2� �� �
−2� 2 CuI Bcað Þ2
� � ð2Þ
The ion charges are omitted for clarity in Eq. (2) and the parameterβ2=1017.2 M−2 is the known formation constant for [CuI(Bca)2]3−
[36].

189M. Zimmermann et al. / Journal of Inorganic Biochemistry 115 (2012) 186–197
2.9. Electrospray mass spectrometry
Spectra were recorded on an Agilent time-of-flight mass spec-trometer (TOF-MS) (model 6220, Palo Alto, CA) equipped with anAgilent dual spray (Z-spray) electrospray ionisation source, operatedin positive-ion high-resolution mode (4 GHz). Samples were injectedvia continuous infusion from a syringe (Hamilton, 250 μL) at 5 μL/minto one of the spray needles of the dual spray with nebulizer operatedat 30 psig. Optimum conditions for native sprays of apo and metal-loaded PcoE samples corresponded to a capillary voltage of 3500 V,a fragmentor voltage of 430 V, a slimmer voltage of 65 V and anoctapole voltage of 300 V. The dry gas and the gas temperaturewere held at 7 L/min and 100 °C, respectively. A lower fragmentorvoltage at 175 V provided a bimodal distribution of charge states innative sprays. A high fragmentor voltage of 430 V was applied tomaintain the low charge-state distribution with enhanced absolutesignal intensities and improved resolution but with little effect onthe identities of species detected and their relative intensities.
ESI-L Low Concentration Tuning Mix (Agilent, G1969-85000) wasdiluted 50 times in NH4OAc solution (20 mM; pH 7.0) and was thesource of the three detected calibrants with m/z values 622.028960,922.009798 and 1221.990637 in the positive-ion mode. It was co-injected with the samples via continuous infusion from a separate sy-ringe at 3 μL/min to another spray needle of the dual spray with neb-ulizer operated at 10 psig. When the signals of a sample on the totalion chromatogram and the instantaneous m/z spectrum became sta-ble, m/z spectra were recorded at the slowest scan rate of 0.63 m/zspectrum per second from 100 to 3200 m/z for 3 to 5 min and werethen averaged. Mass corrections based on the 3 calibrants were car-ried out on average every 3 scans.
Data analysis was performed using the software package Mas-sHunter Qualitative Analysis (Agilent, version B.03.01). Simulationsof isotopic patterns for proteins and peptides were performed usingthe software package Xcalibur (Thermo Electron, version 1.4).
Apo-PcoE was suspended in NH4OAc solution (50 mM; pH 7.0) bycentrifugal ultrafiltration through a high flux polyethersulphone (PES)membrane with cut-off at 3000 Da on a Vivaspin2 device (SartoriusStedim Biotech) or by dialysis against NH4OAc solution (100 mM; pH7.0) at 4 °C overnight using dialysis membranes with cut-off at 3500 Da(Spectrum Laboratories Inc., Spectra/Por®3 Regenerated CelluloseDialysis Membrane). Various metal ions (CuSO4, NH2OH, ZnCl2, AgNO3,AuCl3, CdCl2 and HgCl2) were added to give samples containing 5 or15 μM apo-PcoE with defined metal loading in NH4OAc solution (50 or100 mM; pH 7.0) prior to mass spectrometric analyses. Samples of apo-PcoE added with excess AgI and excess AuIII with sodium ascorbatewere dialysed in the same way as apo-PcoE prior to mass spectrometricanalyses. Samples were diluted to give 5 μM PcoE in 50 mM NH4OAc atpH 7.0 for mass spectrometric analyses.
2.10. Proteolytic digestions of apo-PcoE
Modified trypsin (with acetylated lysines and TPCK-treatment)and endoproteinase GluC (Staphylococcus aureus Protease V8) werepurchased from New England Biolabs. The buffer of purified apo-PcoE was exchanged to KPi (2 mM, pH 7.8). Reaction mixtures(100–250 μL) containing trypsin (5 μg), GluC (5 μg) and apo-PcoE(100 μg) in KPi (2 mM, pH 7.8) were incubated at 37 °C for 18 h.The mixtures were then diluted to give 5 μM PcoE units in 0.1% aceticacid plus 50% methanol prior to mass spectrometric analyses.
3. Results and discussion
3.1. Protein expression and purification
PcoE protein with an extra Trp residue in the C-terminus wasexpressed at high level in E. coli from a constructed expression
plasmid pET11a-PcoE (see Section 2.2). Two methods were devel-oped for PcoE purification. In method 1, the clarified cell lysate wasapplied directly to a strong cation-exchange column (Source-15S) inMes buffer (10 mM, pH 6.0). PcoE bound weakly on the resin andwas eluted with a shallow NaCl gradient (0–200 mM), followed by afurther purification step via size exclusion chromatography in thesame buffer. The purified protein contained no detectable metalions and eluted as a single peak at ~10 mM Na2SO4 on an analyticalcation-exchange Mono-S column (Fig. 2a). Protein identity was con-firmed by ESI-MS (Fig. 2b). However, at pH 6.0, apo-PcoE binds weak-ly to the Source 15S resin, consistent with its predicted pI of 6.0. Thisprevented large-scale isolation by this method. Attempts to increaseits affinity for the cation-exchange resin by lowering the pH of thecrude lysate led to co-precipitation of PcoE with other proteins. Con-sequently, an alternative purification procedure of method 2 wasdeveloped.
In method 2, PcoE protein was firstly partially purified via NaClgradient elution from an anion-exchange DE52 column at pH 9.0 inTris–HCl buffer, followed by a reduction in pH to 2.5 in glycine-acetate buffer. At pH 2.5, the PcoE protein binds strongly to acation-exchange column (S-Sepharose-Fast Flow; presumably dueto protonation of multiple His residues) and was purified readily byNaCl gradient elution (0.1–0.8 M) in the glycine-acetate buffer. SDS-PAGE confirmed isolation of high purity protein. However, analysison the Mono-S column revealed that the isolated PcoE protein wasa mixture of four components (Fig. 2c). The elution positions andESI-MS experiments confirmed that component (i) is the intact apo-PcoE as isolated by method 1 (Fig. 2a–c) and that component (iv) isa variant with lower affinity for the cation-exchange resin and slight-ly higher molar mass (Fig. 2c,e).
Each of the four protein components was stable at pH 6.0 andcould be re-eluted from the Mono-S column (Fig. 2d). Apo-PcoE iso-lated by method 1 remained intact upon incubation at pH 2.5, butconverted to components (ii)–(iv) at pH 9.0.
The source of such conversion was traced to de-amidation of 1 or 2Asn residues at alkaline pH. This process converts Asn into Asp withintroduction of an additional negative charge and an increase inmolar mass of 1 Da. It is a non-enzymatic post-translational modifi-cation and, in vivo, has been assigned a regulatory role [38–40].The mechanism usually proposed is β-elimination: the main chainamide of the succeeding residue attacks the Asn side chain amide toform succinimide and ammonia. In model peptides, hydrolysis ofthe former yields iso-Asp:Asp~3:1 [41]. The susceptibility of individ-ual Asn residues to deamidation is dependent on multiple factors.However, Asn followed by Gly is the most susceptible fragment[42,43]. The two residues Asn54,103 in the PcoE sequence arefollowed by Gly (Fig. 1). Peptide mapping of the proteolytic digests ofthe isolated PcoE component (iv) confirmed double de-amidation ofAsn54,103 (Fig. S1). Plausibly, protein components (ii) and (iii) canbe assigned to the products of single de-amidation at one or theother of those positions. Control experiments demonstrated that allforms of the PcoE proteins isolated here behaved indistinguishablyin the metal binding and molecular conformation experiments de-scribed below.
3.2. Interaction with metal ions
Binding of certain metal ions by apo-PcoE protein was detectedconveniently by ESI-MS under non-denaturing conditions in volatileNH4OAc solution at neutral pH. Titration of CuSO4 solution into apo-PcoE in the presence of weak reductant NH2OH allowed observationof a series of metal–protein adducts Cux-PcoE (x=0–9). The relativeproportions depended on the [Cu]/[PcoE] ratio and at [Cu]/[PcoE]>3,little apo-PcoE was detected (Fig. 3). On the other hand, the sametitration in the absence of NH2OH led to detection of Cux-PcoE(x=0–2) only, along with the metal-free apo-form (Fig. S2a). For

Fig. 2. Identification of the isolated apo-PcoE proteins. (a) Elution profile of apo-PcoE isolated by method 1 on a Mono-S HR5/5 cation exchange column (0.5×5 cm) in Mes buffer(20 mM; pH 6.0) (see text); (b) ESI-MS isotopic distribution pattern for the 8+ charge ion of the apo-PcoE isolated by method 1 or of the protein component (i) isolated by method2, with reference to theoretical simulation pattern (dotted line) of the same ion of intact apo-PcoE (C562H894N182O200S15; MW 13881.2 Da); (c) elution profile of apo-PcoE isolatedby method 2; (d) individual profiles of the four protein components (i)–(iv) separated in (c) and re-applied to the column; (e) ESI-MS isotopic distribution pattern for the 8+charge ions of the PcoE protein component (iv) isolated by method 2.
190 M. Zimmermann et al. / Journal of Inorganic Biochemistry 115 (2012) 186–197
those protein ions with same charge and same copper content, theion masses of samples with NH2OH were slightly higher than thoseof samples without NH2OH (for example, the 8+ ions shown inFig. S3). This confirms the copper oxidation state as CuI in the formersamples and as CuII in the latter samples (also by reference to thecorresponding ions of the ZnII species; see Fig. S3), since CuI speciesrequire an extra H+ per Cu atom to make up the ion charge differenceto their CuII counterparts.
Titrations with Zn2+ ions provided equivalent results (Fig. S2b).However, when the apo-PcoE was titrated with 10 equiv of Ag+ orAu3+ in the presence of NH2OH, adducts AgIx-PcoE (x=2–7) andAuI
x-PcoE (x=6–12) were detected cleanly without any apo-form(Fig. S4). These experiments suggest that the protein can bind multi-ple monovalent soft metal ions (CuI, AgI, AuI) non-cooperatively withvarying affinities. On the other hand, binding of harder divalent metalions (Cu2+, Zn2+) is intrinsically weaker and less efficient. These gen-eral conclusions are supported by further experiments.
A single tryptophan residue was introduced at the C-terminus toprovide an extra spectroscopic probe that was unlikely to perturb themolecular structure and the copper binding properties (Fig. 1). Apo-PcoEwith such amodificationfluoresces atλem 362 nmupon excitationat λex 280 nm. Titration with Cu2+ quenched the fluorescence intensitybut with no endpoint (Fig. 4, empty circles), consistent with dynamicquenching by paramagnetic Cu2+ in solution and/or inner filter effectsdue to increasing absorbance at 280 nm. However, the presence ofweak reductant NH2OH led to a change in behaviour.Minor fluctuationsin fluorescence intensity occurred upon addition of four equiv of copperand significant quenching occurred thereafter (Fig. 4, solid circles). Theresults are consistent with the presence of at least 4 CuI sites per mono-mer that promote reductive trapping of labile Cu2+ as bound CuI. Thecopper resistance protein CopK from Cupriavidus metallidurans CH34exhibits related behaviour [44].
Equivalent experiments monitored by UV–visible spectroscopyled to similar conclusions. No endpoints are detected for titrationwith Cu2+ alone but the presence of NH2OH allowed detection of
apparent endpoints at Cu/PcoE~4 at three different wavelengths(Fig. S5). Similar titrations with AgNO3 suggested that PcoE maytake up to 6 equiv of AgI before precipitation sets in at the seventhequiv of Ag+ ion (Fig. S6).
3.3. Dimerization occurs upon binding of monovalent, but not divalent,metal ions
Apo-PcoE eluted from an analytical gel-filtration column at a positionindicative of a dimer (Fig. S7). However, both sedimentation velocity andsedimentation equilibrium experiments demonstrated unequivocallythat the apo-PcoE is amonomer in solution: sedimentation velocity anal-ysis produces a homogenous sedimenting population with a sedimenta-tion coefficient of 1.21 S, (frictional ratio (f/f0) 1.42) (Figs. S8a, S9).Sedimentation equilibrium analysis indicated that this population has amolar mass of 13.6 kDa in comparison with the calculated monomervalue of 13.9 kDa (Fig. 5a; Table 1).
PcoE remained monomeric upon titration of Cu2+ into apo-PcoE insolution (Fig. 6a). However, titration of Cu2+ in the presence of re-ductant NH2OH or of Ag+ alone induced a progressive conversion todimeric forms and that conversion was complete after addition ofsix equiv of either metal ion (Fig. 6b,c). The sedimentation velocitydata for samples containing six equiv of CuI or AgI showed thatthere was a homogenous population with sedimentation coefficientsof 1.65 S (f/f0=1.51) and 1.85 S (f/f0=1.53), respectively (Figs. S8b,c, S9). Sedimentation equilibrium analysis indicated molar masses of25.5±1.5 kDa (Cu) and 26.4±1.0 kDa (Ag), suggesting the presenceof a dimeric PcoE species (theory, 27.76 kDa; Fig. 5b,c; Table 1). Ap-parently, binding of multiple soft monovalent metal ions leads toprotein dimerization, likely due to somemetal ions being sequesteredas metal-bridges between the two PcoE molecules. Since ESI-MSdetected monomeric protein species only with multiple metal bind-ing (Figs. 3, S4), such metal-bridging binding may be relativelyweak and does not survive in the gas phase.

Fig. 3. Detection of CuI-binding. Native ESI-MS for the 8+ charge ions of PcoE (5 μM in50 mM NH4OAc, pH 6.7) after incubation with CuSO4 (1, 3, 5 and 10 equiv, from top tobottom) in the presence of NH2OH. The digits provide the number of copper atomspresent in the labelled peak.
Fig. 4. Detection of CuI-binding. Variation of fluorescence intensity at 362 nm of PcoE(10 μM) in KPi buffer (25 mM, pH 7.0, 50 mM Na2SO4) upon titration with CuSO4 in theabsence (empty circles) and presence (solid circles) of the weak reductant NH2OH(5 mM).
191M. Zimmermann et al. / Journal of Inorganic Biochemistry 115 (2012) 186–197
3.4. Partial folding upon binding of CuI, AgI and AuI
CD spectroscopy indicates that apo-PcoE is essentially unstructuredin solution (Fig. 7a, red trace). A simple analysis via Dichoweb [34,35]suggests that the protein is disordered. Addition of Cu2+ has little effecton the spectrum (Fig. 7a, blue trace), but titration of Cu2+ or Au3+ inthe presence of NH2OH or with Ag+ alone produced changes that indi-cate increased secondary structural order (significant proportion ofα-helix) (Fig. 7a (green trace), S10). The changes are complete uponaddition of about six equiv of metal ions. Similar titrations with variousdivalent metal ions (Hg2+, Cd2+, Co2+, Mn2+, Ni2+) did not inducesuch changes, except for Hg2+ which can exhibit metal binding behav-iour intermediate between ‘semi-soft’ divalent and ‘soft’ monovalentions (Fig. S10d).
The conclusions are supported by NMR spectroscopy. The ‘finger-print’ 1H–15N HSQC spectrum for apo-PcoE is typical of an unfoldedprotein (Fig. 7b). However, α-helical elements appear upon titrationof four equiv of Cu2+ in the presence of reductant ascorbate(Fig. 7c). Precipitation occurred for higher proportions of copper atthe protein concentrations (mM) required for NMR spectroscopy.
It is apparent that apo-PcoE is disordered in solution. Addition ofmultiple equiv (4–6) of soft metal ions (Cu+, Ag+, Au+) induced di-merization and a partial folding of some α-helical structure.
3.5. Quantification of high affinity CuI binding
Binding of metal ions usually affects the affinity of a protein forion-exchange resins. Consequently ion-exchange chromatographycan be a convenient and effective approach for qualitative estimationof metal–protein affinities [17,28,44]. Apo-PcoE was eluted cleanly asa single protein peak at ~80 mM NaCl in Mes buffer at pH 6.0 from aMono-S cation-exchange column (Fig. 8a(i)). After titration with twoequiv of CuSO4, the protein eluted at the same position and was con-firmed to contain no copper. Apparently, the affinity of PcoE for CuII istoo weak to compete with the Mono-S resin. On the other hand, thesame titration in the presence of weak reductant NH2OH led to thePcoE protein being eluted at a slightly lower NaCl concentration(~65 mM) (Fig. 8a(ii)). Copper content analysis revealed that theeluted PcoE protein contained 1.2±0.2 equiv of CuI. Consequently,PcoE can retain at least one equiv of CuI against the competition ofthe Mono-S resin and its affinity for this first equiv of CuI must behigher than that for CuII. Notably, the affinity of CuI-PcoE on theMono-S resin at pH 6.0 is slightly weaker than that of apo-PcoE, insteadof stronger, as would be expected from the added positive charge of theintroduced CuI ion. This suggested that at least one histidine side-chainmust be involved in the CuI binding and is deprotonated upon metalbinding.
Interestingly, titration with increasing amounts of Cu2+ up to fiveequiv in the presence of NH2OH had no effect on the identity of theeluted CuI-PcoE, suggesting that although PcoE appears to bind 4–6equiv of CuI (Figs. 3, 4, 6, 7, S5), the affinities of these metal ions aredifferent (i.e., non-cooperative binding) and only the binding for thefirst equiv of CuI is tight enough to survive the Mono-S resin. Thisconclusion is supported by more quantitative estimations via compe-tition for CuI with two CuI probes CS1 and Bca.
The CS1 probe binds CuI specifically with a reported KD=3.6(3)×10−12 M and this process is characterized by a large enhancement ofCS1 fluorescence intensity at λmax~560 nm (F560) upon excitation at540 nm [27]. Consequently, the potential of CuI-binding on PcoE maybe probed by titration of CuI into a series of solutions containing CS1and apo-PcoE at various molar ratios. As a control, titration of CuI intoa CS1 solution (2.0 μM) in Mops buffer (50 mM, pH 7.3) containingascorbate (2.0 mM) induces a stepwise increase in F560 with an endpointat Cu:CS1=1.0 (Fig. 8b(i)). Equivalent titration in the presence of 2.0and 4.0 equiv apo-PcoE shifts the endpoint to Cu:CS1=3.0 and 5.0, re-spectively, indicating that PcoE is able to bind one equiv CuI with affinity

Fig. 5. Sedimentation equilibrium analysis. (a) apo-PcoE with or without 6 equiv of Cu2+; (b) apo-PcoE plus 6 equiv of Cu2+ and 20 equiv of NH2OH; (c) apo-PcoE plus 6 equiv of Ag+. The data were acquired at 20,000 and 35,000 rpm,respectively and were fitted to a two-species model from Sedphat 4.3 to obtain the masses of the sedimenting species observed in Figs. S8–9. The fitted parameters are provided in Table 1.
192M.Zim
merm
annet
al./JournalofInorganic
Biochemistry
115(2012)
186–197

Table 1Parameters from analysis of the sedimentation velocity and equilibrium experimentsfor PcoE samples.
apo +6 eqCu2+
+6 eqAg+
+6 eqCu+,a
Sedimentation coefficient (S)b 1.21 1.32 1.85 1.65Molar mass 1 (kDa)c 13.6 (0.9) 13.2 (1.3) 12.5 (1.2) 13.0 (1.0)Molar mass 2 (kDa)c – 24.3 (1.4) 26.4 (1.0) 25.5 (1.5)Baseline 0.02 0.05 0.04 0.08RMSDd 0.003 0.004 0.002 0.007
a 6 Cuaq2+ plus NH2OH (1.0 mM).
b Sedimentation coefficients are S20W values, corrected for buffer viscosity, densityand temperature.
c Values in the bracket indicate the +/− error.d Root-mean-square deviation.
193M. Zimmermann et al. / Journal of Inorganic Biochemistry 115 (2012) 186–197
high enough to be detected by the probe CS1 (Fig. 8b(ii, iii)). Notably,plots of F560 versus Cu:CS1 in the latter two titrations produce two slight-ly curved-down curves, suggesting that the CuI binding affinity for thishigh affinity site in PcoE is slightly stronger than that of CS1, i.e.,KD≤3.6×10⁻¹² M for CuI-PcoE.
This conclusion is supported by further experiments with the secondCuI probe Bca. Bca reacts with Cu+ to yield a purple complex anion[CuI(Bca)2]3− (λmax 562 nm, ε 7900 M−1 cm−1, β2 1017.2 M−2) [37]. Ti-tration of apo-PcoE into a solution of [CuI(Bca)2]3− led to a stepwisedecrease in absorbance at 562 nm, indicative of transfer of CuI from theanion to the protein. The decrease was not linearly proportional tothe total protein concentration, suggesting that PcoE was in an effec-tive competition for CuI with the ligand Bca (Eq. (1); Fig. 8c). A bestfit of the experimental data (Table S1) to Eq. (2) (with the[CuI(Bca)2]3− concentration expressed in terms of A562) based on a sin-gle binding site model provided KD=1.21(2)×10−12 M, a value in anexcellent agreement with the value estimated with the CS1 probe(KD≤3.6×10⁻¹² M). The data in Table S1 confirmed that the numberof CuI bound by PcoE varied between 0.07 and 0.24 under the experi-mental conditions. Hence, the derived KD value represents the affinityfor the first equiv of CuI bound by PcoE.
3.6. Transfer of copper from PcoE to PcoC
As outlined in the Introduction, PcoE may act as a first line of de-fence against copper toxicity in the periplasm and then pass the se-questered copper ions to copper resistance proteins PcoABCD forsafe disposal. Both PcoA and PcoC co-exist with PcoE in the periplasmand we have demonstrated that CuI bound by PcoC can be oxidizedsafely by multi-copper oxidase PcoA (with dioxygen being the termi-nal oxidant) [19]. Consequently, PcoC is plausibly the physiologicalpartner of PcoE, accepting copper ions from PcoE. This is feasible ther-modynamically, since the affinities of PcoC for CuI and CuII (both~10−13 M [17,37]) are higher than those of PcoE (KD~10−12 M;Section 3.5). To confirm the possibility, experiments on copper trans-fer between these two proteins were designed and conducted.
PcoE bound with one equiv CuI (i.e., CuI-PcoE) was isolated clean-ly by elution from the Mono S column at pH 6.0 (Fig. 8a(ii)). Reactionof CuI-PcoE with CuII–PcoC led to complete transfer of CuI betweenthe two proteins:
CuI−PcoEþ CuII−PcoC→apo−PcoEþ CuICuII−PcoC ð3Þ
At pH 7.0, all forms of PcoE were detected in the Mono S columnflow-through, but both reactant CuII-PcoC and product CuICuII–PcoCwere retained on the column and eluted distinctly at different NaClsalt concentrations (Fig. 9) [17].
4. Conclusions and a model of copper resistance
PcoE from E. coli was expressed and characterized. Its isolation atneutral pH was handicapped by its low affinities for either cation-or anion-exchange resins. Isolation at alkaline pH improved theaffinity for the anion-exchange column, but was complicated bydeamidation of Asn 54,103, leading to four forms being present inthe isolated samples (Fig. 2). However, the metal-binding propertiesof these four forms were indistinguishable under the conditions ofthe present work.
Apo-PcoE is unfolded in vitro: it can be likened to a large unstruc-tured multidentate ligand carrying multiple metal binding sites (15Met; 10 His; 13 Asp, Glu; 10 Asn; 6 Lys; Fig. 1). Many proteins are un-folded under physiological conditions but may fold when performingtheir biological functions [45]. Indeed, PcoE was detected in solutionto bind multiple equiv of soft metal ions such as Cu+ and Ag+
(Figs. 3, 4, S4, S5). Binding of these metal ions induced dimerization(Figs. 5, 6) and partial structural folding (Fig. 7). PcoE binds multipleCu+ and Ag+ ions non-cooperatively with varying affinities. Thehighest affinity for CuI was determined at picomolar concentrationrange (KD=1.21×10⁻¹² M; Fig. 8). The CuI bound by PcoE can betransferred readily to the potential protein partner PcoC (Fig. 9).
PcoE also binds harder divalent metal ions Cu2+ or Zn2+ but withlower affinities and in smaller numbers. The ready redox switchingbetween CuI and CuII means that the weakly bound CuII in PcoE canbe reduced readily to more tightly bound CuI. In this work, the air-stable weak reductant NH2OH was used routinely to accelerate theCuII reduction. It was difficult to characterize quantitatively theseweakly bound and redox unstable divalent metal complexes. Similarproperties and difficulties have been reported for the homologoussilver-binding protein SilE [23,24].
Copper resistance in E. coli is conferred primarily by a plasmid-borne pco gene cluster comprising seven pco genes, pcoABCDRSE,and expression of their protein products PcoABCDRSE is induced bycopper salts [8,11,15,16]. It is now known that three soluble Pco pro-teins (PcoA, PcoC, PcoE) are expressed to the periplasm and two cop-per pumps (PcoB, PocD) are incorporated in the outer and innermembranes, respectively. PcoRS is a two-component system whichregulates the expression of the pco operon proteins PcoABCD [11].
Knowledge how these Pco proteins confer copper resistance is accu-mulating. Expression of all four pco proteins PcoABCD is required for fullcopper resistance and disruption of any one of these genes leads to ei-ther loss of copper resistance or an increase in copper sensitivity[13,18]. PcoC and PcoD may function cooperatively to facilitate copperuptake, as suggested by the observation that co-expression of their pro-tein homologues CopC and CopD from P. syringaemakes cells hypersen-sitive to copper but not if just one is expressed [46].We and others havedemonstrated that PcoC is a periplasmic copper carrier that featurestwo separated binding sites specific for CuI and CuII with sub-picomolar affinities (both KD~10−13 M) and that PcoA is a multicopperoxidase that is able to oxidize PcoC-bound CuI to less toxic CuII [17–19].The leader sequence of PcoA features a twin-argininemotif and so PcoAmust be exported to the periplasm via the Tat pathway. The proteinsexported by this pathway are usually folded and assembled with theirenzyme cofactors prior to translocation [47]. So the newly synthesizedPcoA is likely folded and inserted with copper ions in the cytosol. In-deed, we have recently expressed a PcoA gene without the leader se-quence in E. coli and found that the expressed protein (which cannotbe exported to the periplasm) is folded and can be activated readilyby copper ions. In contrast, urea-denatured PcoA is both difficult to re-fold in vitro and to activate with copper ions [48].
The pcoE gene has no homologue in other similar copper resis-tance determinants. Its expression is not strictly required for full cop-per resistance but does help to reduce the time required for the cellsto recover from the copper stress [8]. The pcoE gene displays codonusage typical of highly expressed proteins and is induced robustly

Fig. 6. Dimerization upon binding multiple monovalent soft metal ions. Relative content of monomeric and dimeric forms of PcoE as a function of metal ion to protein ratio estimated via sedimentation equilibrium experiments on individualsamples (Ο = monomer; ● = dimer). Conditions: protein (60 μM) in Mops buffer (20 mM; pH 6.0; Na2SO4, 50 mM; glycerol, 10%). (a) CuSO4; (b) CuSO4 in the presence of NH2OH (1.0 mM); (c) Ag(OAc).
194M.Zim
merm
annet
al./JournalofInorganic
Biochemistry
115(2012)
186–197
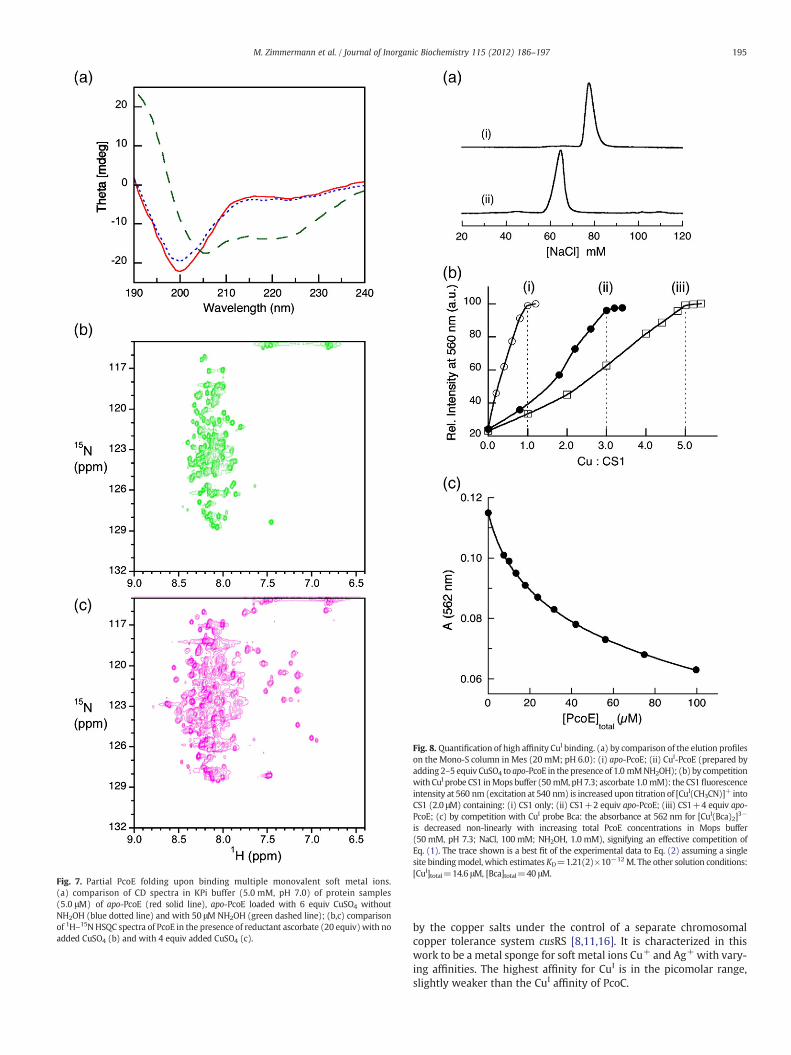
Fig. 8. Quantification of high affinity CuI binding. (a) by comparison of the elution profileson the Mono-S column in Mes (20 mM; pH 6.0): (i) apo-PcoE; (ii) CuI-PcoE (prepared byadding 2–5 equiv CuSO4 to apo-PcoE in the presence of 1.0 mMNH2OH); (b) by competitionwith CuI probe CS1 inMops buffer (50 mM, pH7.3; ascorbate 1.0 mM): the CS1fluorescenceintensity at 560 nm (excitation at 540 nm) is increased upon titration of [CuI(CH3CN)]+ intoCS1 (2.0 μM) containing: (i) CS1 only; (ii) CS1+2 equiv apo-PcoE; (iii) CS1+4 equiv apo-PcoE; (c) by competition with CuI probe Bca: the absorbance at 562 nm for [CuI(Bca)2]3−
is decreased non-linearly with increasing total PcoE concentrations in Mops buffer(50 mM, pH 7.3; NaCl, 100 mM; NH2OH, 1.0 mM), signifying an effective competition ofEq. (1). The trace shown is a best fit of the experimental data to Eq. (2) assuming a singlesite bindingmodel, which estimates KD=1.21(2)×10−12 M. The other solution conditions:[CuI]total=14.6 μM, [Bca]total=40 μM.
Fig. 7. Partial PcoE folding upon binding multiple monovalent soft metal ions.(a) comparison of CD spectra in KPi buffer (5.0 mM, pH 7.0) of protein samples(5.0 μM) of apo-PcoE (red solid line), apo-PcoE loaded with 6 equiv CuSO4 withoutNH2OH (blue dotted line) and with 50 μM NH2OH (green dashed line); (b,c) comparisonof 1H–15N HSQC spectra of PcoE in the presence of reductant ascorbate (20 equiv)with noadded CuSO4 (b) and with 4 equiv added CuSO4 (c).
195M. Zimmermann et al. / Journal of Inorganic Biochemistry 115 (2012) 186–197
by the copper salts under the control of a separate chromosomalcopper tolerance system cusRS [8,11,16]. It is characterized in thiswork to be a metal sponge for soft metal ions Cu+ and Ag+ with vary-ing affinities. The highest affinity for CuI is in the picomolar range,slightly weaker than the CuI affinity of PcoC.

Fig. 9. Transfer of CuI from CuI-PcoE to CuII-PcoC. Analysis of protein products byelution from Mono-S column in Mops (20 mM, pH 7.0): (a) CuII-PcoC control; (b) amixture of CuII-PcoC and CuI-PcoE (isolated in Fig. 8a(ii)) in 1:2 molar ratio. The proteineluted at 120 mM NaCl was confirmed to be CuICuII-PcoC. Note: at pH 7.0, all forms ofPcoE are not be retained on the column and were detected in the column flow-throughfractions only.
196 M. Zimmermann et al. / Journal of Inorganic Biochemistry 115 (2012) 186–197
On the other hand, expression of the intact pco gene clusterpcoABCDRSE is not able to rescue the copper sensitivity of copA-disrupted E. coli cells [13]. This CopA is a CuI-translocating enzymeresponsible for efflux of excess copper across the cytoplasmic mem-brane and a disruption of the copA gene generates copper sensitivity[49]. This suggests that Pco proteins are responsible mainly for peri-plasmic copper handling [13].
On the basis of the in vitro and in vivo evidence, a plausible model ofcopper resistance for these Pco proteins is emerging (Fig. 10). Undercopper stress, PcoE is expressed rapidly, in response to the cusRS sys-tem, as a ‘sponge’ that sequesters toxic copper ions in the periplasmicspace, while the remaining genes of the pco system are being inducedunder pcoRS. Then PcoE passes the sequestered CuI to PcoC for twotasks: import of copper into the cytosol via inner membrane pump
Fig. 10. Proposed model for copper resistance in E. coli. om = outer membrane, im =inner membrane, blue dot = CuII, red dot = CuI.
PcoD to provide nutrient copper for activation of newly synthesizedPcoA or for safe oxidation of CuI to CuII by the partner cuprous oxidasePcoA. Product CuII may be removed subsequently by the outer mem-brane protein PcoB. In this model, PcoE acts as a first line of defenceagainst metal toxicity while expression of the other resistance proteinsPcoABCD proceeds. Toxic copper ions are sequestered in the periplas-mic space in the first instance with minimum invasion into the cytosol.
Abbreviations
OAc acetateBca bicinchoninic anionBcs bathocupröine disulfonateCD circular dichroismCS1 copper sensor 1Edta N,N,N′,N′-ethylenediaminetetraacetic acidequiv equivalent(s)ESI-MS electrospray ionisation mass spectrometryIPTG isopropyl-β-o-thiogalactopyranosideKPi potassium phosphateMes 2-(N-morpholino)ethanesulfonic acidMops 3-(N-morpholino)propanesulfonic acidPi phosphateTris tris(hydroxymethyl)aminoethaneAcknowledgements
We thank the Australian Research Council for financial supportunder grant A29930204. We also thank Drs James Hickey and PaulDonnelly of the University of Melbourne for providing the CuI probeCS1 used in this work.
Appendix A. Supplementary data
Supporting information available: Figs. S1–4 (ESI-MS spectra);Figs. S5–6 (metal titration monitored via UV–visible); Fig. S7 (gel-filtration); Figs. S8–9 (sedimentation analysis); Fig. S10 (changes inCD during metal titration); Table S1 (conditions for CuI affinity estima-tion). Supplementary data to this article can be found online at http://dx.doi.org/10.1016/j.jinorgbio.2012.04.009.
References
[1] B.-E. Kim, T. Nevitt, D.J. Thiele, Nat. Chem. Biol. 4 (2008) 176–185.[2] C. Rensing, G. Grass, FEMS Microbiol. Rev. 27 (2003) 197–213.[3] F.W. Outten, C.E. Outten, J. Hale, T.V. O'Halloran, J. Biol. Chem. 275 (2000)
31024–31029.[4] C.C. Su, F. Long, M.T. Zimmermann, K.R. Rajashankar, R.L. Jernigan, E.W. Yu, Nature
470 (2011) 558–562.[5] I.R. Loftin, S. Franke, N.J. Blackburn, M.M. McEvoy, Protein Sci. 16 (2007)
2287–2293.[6] Y. Xue, A.V. Davis, G. Balakrishnan, J.P. Stasser, B.M. Staehlin, P. Focia, T.G. Spiro,
J.E. Penner-Hahn, T.V. O'Halloran, Nat. Chem. Biol. 4 (2008) 107–109.[7] S. Franke, G. Grass, C. Rensing, D.H. Nies, J. Bacteriol. 185 (2003) 3804–3812.[8] G.P. Munson, D.L. Lam, W. Outten, T.V. O'Halloran, J. Bacteriol. 182 (2000)
5864–5871.[9] T.J. Tetaz, R.K.J. Luke, J. Bacteriol. 154 (1983) 1263–1268.
[10] D.A. Cooksey, FEMS Microbiol. Rev. 14 (1994) 381–386.[11] N.L. Brown, S.R. Barrett, J. Camakaris, B.T. Lee, D.A. Rouch, Mol. Microbiol. 17
(1995) 1153–1166.[12] S. Silver, L.T. Phung, Annu. Rev. Microbiol. 50 (1996) 753–789.[13] S.M. Lee, G. Grass, C. Rensing, S.R. Barrett, C.J.D. Yates, J.V. Stoyanov, N.L. Brown,
Biochem. Biophys. Res. Commun. 295 (2002) 616–620.[14] M. Mergeay, S. Monchy, T. Vallaeys, V. Auquier, A. Benotmane, P. Bertin, S.
Taghavi, J. Dunn, D. van der Lelie, R. Wattiez, FEMS Microbiol. Rev. 27 (2003)385–410.
[15] D.A. Rouch, J. Camakaris, B.T. Lee, R.K. Luke, J. Gen. Microbiol. 131 (1985)939–943.
[16] D.A. Rouch, N.L. Brown, Microbiology 143 (1997) 1191–1202.[17] K.Y. Djoko, Z. Xiao, D.L. Huffman, A.G. Wedd, Inorg. Chem. 46 (2007) 4560–4568.[18] D.L. Huffman, J. Huyett, F.W. Outten, P.E. Doan, L.A. Finney, B.M. Hoffman, T.V.
O'Halloran, Biochemistry 41 (2002) 10046–10055.[19] K.Y. Djoko, Z. Xiao, A.G. Wedd, ChemBioChem 9 (2008) 1579–1582.

197M. Zimmermann et al. / Journal of Inorganic Biochemistry 115 (2012) 186–197
[20] A. Gupta, K. Matsui, J.-F. Lo, S. Silver, Nat. Med. 5 (1999) 183–188.[21] S. Silver, G. Ji, Environ. Health Perspect. 102 (Suppl. 3) (1994) 107–113.[22] S. Silver, Gene 179 (1996) 9–19.[23] S. Silver, A. Gupta, K. Matsui, J.-F. Lo, Met.-Based Drugs 6 (1999) 315–320.[24] S. Silver, FEMS Microbiol. Rev. 27 (2003) 341–353.[25] S. Silver, L.T. Phung, J. Ind. Microbiol. Biotechnol. 32 (2005) 587–605.[26] S. Silver, L.T. Phung, G. Silver, J. Ind. Microbiol. Biotechnol. 33 (2006) 627–634.[27] L. Zeng, E.W. Miller, A. Pralle, E.Y. Isacoff, C.J. Chang, J. Am. Chem. Soc. 128 (2006)
10–11.[28] L. Zhang, M. Koay, M.J. Maher, Z. Xiao, A.G. Wedd, J. Am. Chem. Soc. 128 (2006)
5834–5850.[29] M. Zimmermann, O. Clarke, J.M. Gulbis, D.W. Keizer, R.S. Jarvis, C.S. Cobbett, M.G.
Hinds, Z. Xiao, A.G. Wedd, Biochemistry 48 (2009) 11640–11654.[30] D. Blair, H. Diehl, Talanta 7 (1961) 163–174.[31] P. Schuck, Biophys. J. 78 (2000) 1606–1619.[32] P. Schuck, Anal. Biochem. 320 (2003) 104–124.[33] J. Vistica, J. Dam, A. Balbo, E. Yikilmaz, R.A. Mariuzza, T.A. Rouault, P. Schuck, Anal.
Biochem. 326 (2004) 234–256.[34] L. Whitmore, B.A. Wallace, Biopolymers 89 (2008) 392–400.[35] L. Whitmore, B.A. Wallace, Nucleic Acids Res. 32 (2004) W668–W673.
[36] Z. Xiao, P.S. Donnelly, M. Zimmermann, A.G. Wedd, Inorg. Chem. 47 (2008)4338–4347.
[37] Z. Xiao, A.G. Wedd, Nat. Prod. Rep. 27 (2010) 768–789.[38] A.B. Robinson, J.W. Scotchler, J.H. McKerrow, J. Am. Chem. Soc. 95 (1973)
8156–8159.[39] S.J. Weintraub, S.R. Manson, Mech. Ageing Dev. 125 (2004) 255–257.[40] S.J. Weintraub, B.E. Deverman, Sci. STKE 2007 (2007) re7.[41] T. Geiger, S. Clarke, J. Biol. Chem. 262 (1987) 785–794.[42] R.C. Stephenson, S. Clarke, J. Biol. Chem. 264 (1989) 6164–6170.[43] N.E. Robinson, A.B. Robinson, Proc. Natl. Acad. Sci. U. S. A. 98 (2001) 4367–4372.[44] L.X. Chong, M.R. Ash, M.J. Maher, M.G. Hinds, Z. Xiao, A.G. Wedd, J. Am. Chem. Soc.
131 (2009) 3549–3564.[45] P. Radivojac, M. Iakoucheva Lilia, J. Oldfield Christopher, Z. Obradovic, N. Uversky
Vladimir, A.K. Dunker, Biophys. J. 92 (2007) 1439–1456.[46] J.S. Cha, D.A. Cooksey, Appl. Environ. Microbiol. 59 (1993) 1671–1674.[47] B.C. Berks, F. Sargent, T. Palmer, Mol. Microbiol. 35 (2000) 260–274.[48] K.Y. Djoko, Z. Xiao, A.G. Wedd, unpublished observations.[49] C. Rensing, B. Fan, R. Sharma, B. Mitra, B.P. Rosen, Proc. Natl. Acad. Sci. U. S. A. 97
(2000) 652–656.