Embed Size (px)
Citation preview
1
Pancontinental Oil & Gas NL ACN 003 029 543
Financial Report
for the
Half-Year ended 31 December 2012
This interim financial report does not include all the notes of the type normally included in an annual financial report. Accordingly, this report is to be read in conjunction with the Annual Report for the year ended 30 June 2012 and any public announcements made by Pancontinental Oil & Gas NL during the Half-Year in accordance with the continuous disclosure requirements of the Corporations Act 2001. F
or p
erso
nal u
se o
nly
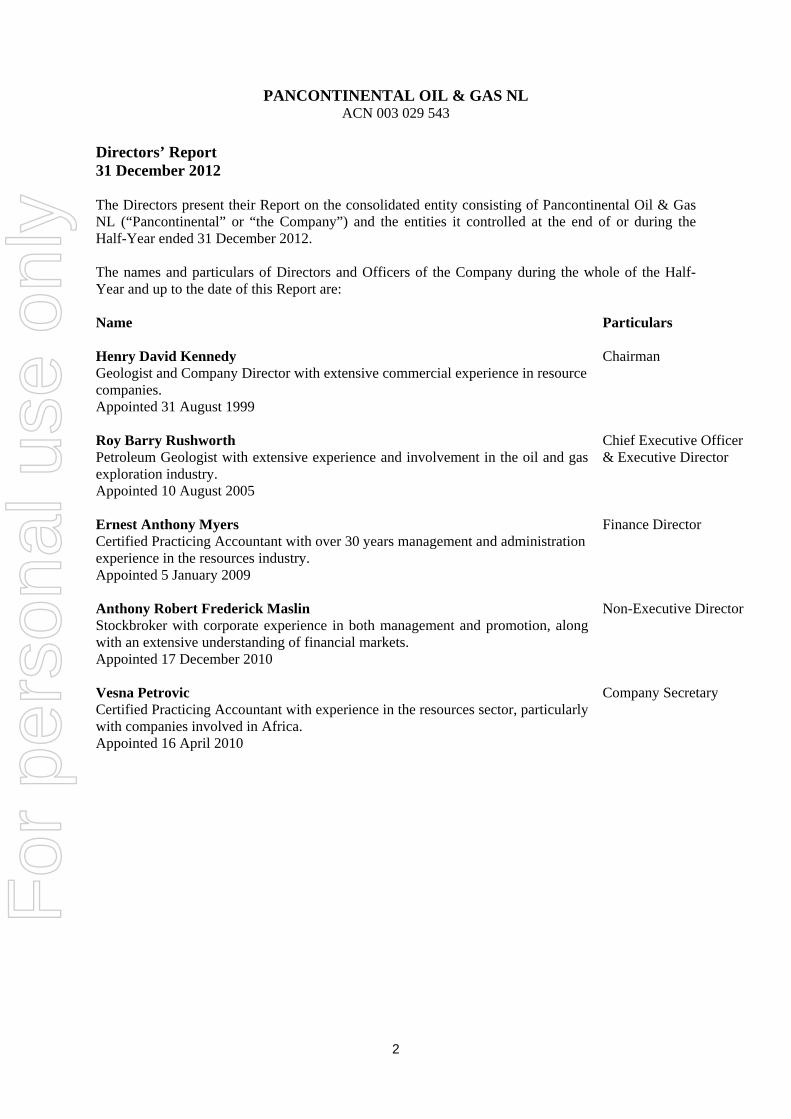
PANCONTINENTAL OIL & GAS NL ACN 003 029 543
2
Directors’ Report 31 December 2012 The Directors present their Report on the consolidated entity consisting of Pancontinental Oil & Gas NL (“Pancontinental” or “the Company”) and the entities it controlled at the end of or during the Half-Year ended 31 December 2012. The names and particulars of Directors and Officers of the Company during the whole of the Half-Year and up to the date of this Report are: Name Particulars Henry David Kennedy Chairman Geologist and Company Director with extensive commercial experience in resource companies. Appointed 31 August 1999 Roy Barry Rushworth Chief Executive Officer Petroleum Geologist with extensive experience and involvement in the oil and gas exploration industry.
& Executive Director
Appointed 10 August 2005 Ernest Anthony Myers Finance Director Certified Practicing Accountant with over 30 years management and administration experience in the resources industry. Appointed 5 January 2009 Anthony Robert Frederick Maslin Non-Executive Director Stockbroker with corporate experience in both management and promotion, along with an extensive understanding of financial markets.
Appointed 17 December 2010 Vesna Petrovic Company Secretary Certified Practicing Accountant with experience in the resources sector, particularly with companies involved in Africa. Appointed 16 April 2010
For
per
sona
l use
onl
y

PANCONTINENTAL OIL & GAS NL ACN 003 029 543
3
Directors’ Report 31 December 2012 Review and Results of Operations The review of the Consolidated Entity’s operations during the Half-Year ended 31 December 2012 is as follows. Financial $Revenue 545,395 Expenses (1,020,230)Operating profit/(loss) (474,835)Income Tax - Operating profit/(loss) for Half-Year (474,835) Review of Operations During the Half-Year Pancontinental maintained its focus on oil and gas exploration in Kenya and Namibia. The activities undertaken during the period are detailed as follows: KENYA OFFSHORE BLOCK L8
Pancontinental Oil & Gas NL – 15%
The Mbawa 1 exploration well was spudded by the drillship Deepsea Metro 1 on 10 August 2012 and drilled to a TD of 3,150m MD. This is the first well on the large Mbawa Prospect in area L8 offshore Kenya The well was plugged and abandoned according to the drilling programme and has been left in a state that allows re-entry.
Operator Apache Corporation (“Apache”) completed well operations in 47 days, being 13 days ahead of schedule. Mbawa 1 tested a faulted four- way dip closure at the southern end of the larger north-south trending four-way closed sub-regional Mbawa Prospect of 160 sq km (40,000 acre). The primary target was the Upper Cretaceous turbidite sandstone interval. Secondary objectives were Eocene and Middle Cretaceous turbidite reservoirs. At the primary target level, 51.8 net metres (~170 feet) of natural gas pay were encountered in three zones of Upper Cretaceous channel and turbidite sandstones. Porosities were very favourable at an average of approximately 24%. The discovery was on a single localised structural culmination on the southern extremity of the overall Mbawa Prospect and the potential of the remainder of the structure remains to be assessed in the light of the Mbawa results.
For
per
sona
l use
onl
y

PANCONTINENTAL OIL & GAS NL ACN 003 029 543
4
The well was designed to optimally test the shallower Upper Cretaceous discovery target, however it was not possible to also optimally test the deeper secondary Middle Cretaceous target. The deeper target remains to be properly tested and Pancontinental believes that this, as well as other prospects of this play type, and the Mbawa discovery play type itself still hold considerable potential in the Mbawa vicinity, elsewhere in the L8 area, and regionally. The large amount of technical data gathered during Mbawa drilling is now being processed and assessed. It will be integrated into previous exploration models.
The Mbawa 1 discovery well has proven a working hydrocarbon system offshore Kenya in the Cretaceous; this has opened a new hydrocarbon region offshore East Africa.
The Kenya L8 joint venture consists of:
Apache Corporation (Operator) 50% Origin Energy Limited 20% Pancontinental Oil & Gas NL 15% Tullow Kenya B.V. 15%
Pancontinental’s 15% interest through Mbawa drilling was “free-carried” under farmout to Tullow Oil plc up to a “cap” of US$ 9 million (as reduced by other exploration expenditure). After the first earning phase Tullow has an option to earn a further 5% (thereby reducing Pancontinental to 10%) by providing funding on Pancontinental’s behalf to a cap of US$ 6 million in any second well.
KENYA OFFSHORE BLOCKS L10A & L10B
Pancontinental Oil & Gas NL – 15% L10A and L10B have respective areas of 4,962.03 sq km and 5,585.35 sq km in water depths of 200 to 1,900m. The L10 projects are operated by BG Group in a joint venture including Premier Oil and PTTEP (following the takeover of Cove Energy plc). New 3D Seismic Survey Completed The L10A and L10B joint venture completed a new 3D survey in the western portion of the licence areas in January 2013. The acquisition was supervised by operator BG Group. Previous 2D and 3D seismic surveys were undertaken late 2011 / early 2012. The new 3D survey covers a cluster of large Miocene reefs and the large Crombec Lead. These leads are possible drilling targets. F
or p
erso
nal u
se o
nly

PANCONTINENTAL OIL & GAS NL ACN 003 029 543
5
KENYA ONSHORE / OFFSHORE BLOCK L6
Pancontinental Oil & Gas NL – 40% The L6 licence covers approximately 3,100 sq km, with about one quarter onshore and the rest offshore to 400 meters water depth. L6 is areally and geologically continuous to L8. Area L6 off the Kenyan coast lies in the Lamu Basin and within the Tana River delta, north of recent world-scale natural gas discoveries off the coasts of Mozambique and Tanzania. The L6 joint venture is operated by FAR Limited (ASX: FAR), with a 60% interest. The L6 joint venture group intends to seek a farminee for drilling in 2013. Kifaru 3D Seismic Survey Completion The Kifaru 3D seismic survey of 778 sq km was completed in July over the Kifaru and Tembo Prospects in the southern offshore portion of L6. The Prospects are in water depths of 80m to 150m in the south of the L6 area. Pancontinental expects that the 3D survey will lead to the identification of one or more locations for drilling in 2013. Following encouraging studies, the joint venture is exploring the offshore portion of the area. A deep central graben is considered to be an oil and gas “source kitchen” and prospects have been identified immediately adjacent to this area. Initial 3D results The L6 operator, FAR Limited has mapped the “fast track” results from the July 2012 Kifaru 3D Seismic Survey. The results are very encouraging and the Joint Venture is continuing to map prospects for a first exploration well planned for later in 2013. Final drill site decisions will be made when the fully processed 3D data have been interpreted in early 2013. The Kifaru and Tembo Prospects are the main drilling candidates.
New 3D Area Acquisition Jan 13
For
per
sona
l use
onl
y

PANCONTINENTAL OIL & GAS NL ACN 003 029 543
6
NAMIBIA OFFSHORE WALVIS BASIN EL 0037
Pancontinental Oil & Gas NL - 95% In July 2011 Pancontinental announced that it had executed a Petroleum Agreement (“PA”) for Petroleum Exploration Licence No. 0037 (“EL”) with the Ministry of Mines and Energy of the Republic of Namibia, effective 28 June 2011. The EL area is located in the Walvis Basin offshore northern Namibia. The location of the EL was selected over approximately 17,295 sq km from an earlier Reconnaissance Licence held by Pancontinental. The EL gives exclusive rights to the holders for a first exploration period of four years followed by two additional periods of two years each and also provisions for the continuation of the exclusive rights under any oil or gas development. Pancontinental holds the PA and EL (95% interest) with Namibian participant Paragon Holdings (Pty) Ltd. In exchange for certain rights under a Joint Venture Agreement with Paragon, Pancontinental has agreed to “free carry” Paragon until the commencement of the development of any oil or gas discovery. Offshore Namibia is the plate tectonic “conjugate” of offshore Brazil, where world-scale oil and gas discoveries have been made in recent years and it lies on the West African continental margin adjacent to Angola, where there have also been major oil discoveries. Pancontinental will explore the ponded basin floor turbidites, slope fans and channels seen under the company’s earlier Reconnaissance Licence. These targets are associated with a restricted graben trough interpreted to hold the rich and mature oil source rocks seen in regional wells. Pancontinental has completed a study of the oil and gas prospectivity of the EL 0037 area and is proceeding to gather further data for mapping and additional studies.
For
per
sona
l use
onl
y
PANCONTINENTAL OIL & GAS NL ACN 003 029 543
7
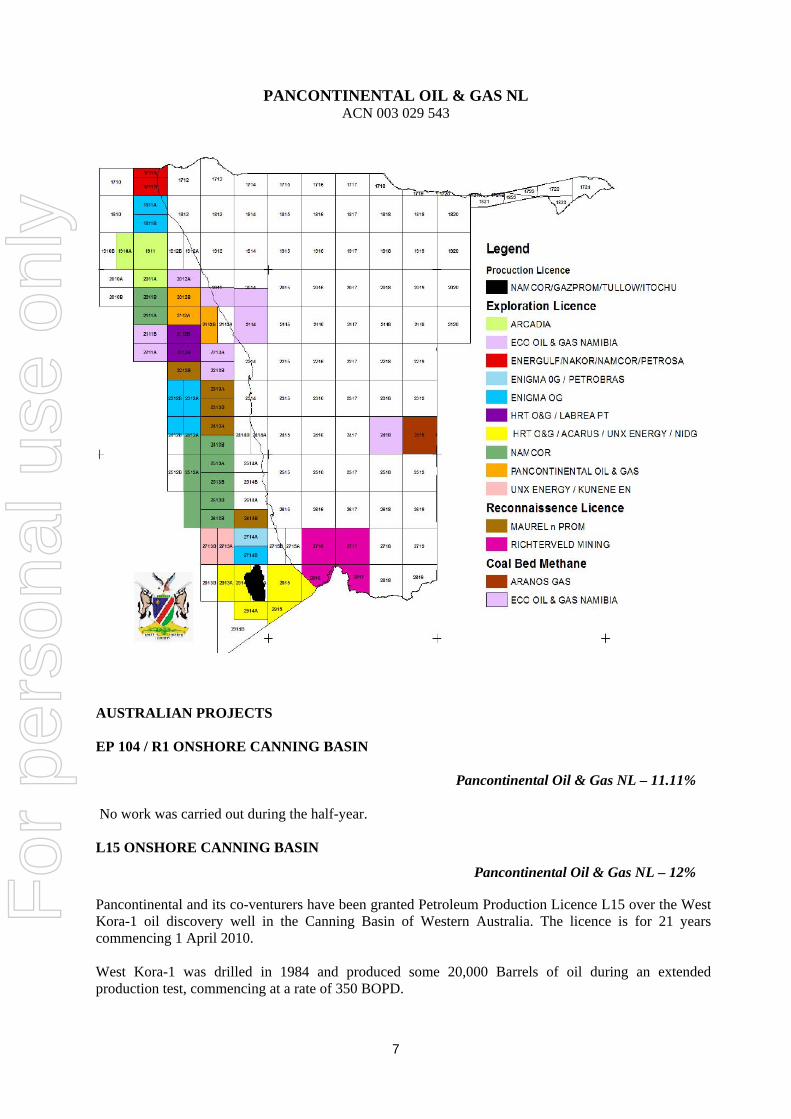
AUSTRALIAN PROJECTS EP 104 / R1 ONSHORE CANNING BASIN
Pancontinental Oil & Gas NL – 11.11% No work was carried out during the half-year. L15 ONSHORE CANNING BASIN
Pancontinental Oil & Gas NL – 12% Pancontinental and its co-venturers have been granted Petroleum Production Licence L15 over the West Kora-1 oil discovery well in the Canning Basin of Western Australia. The licence is for 21 years commencing 1 April 2010. West Kora-1 was drilled in 1984 and produced some 20,000 Barrels of oil during an extended production test, commencing at a rate of 350 BOPD.
For
per
sona
l use
onl
y
PANCONTINENTAL OIL & GAS NL ACN 003 029 543
8
The L15 Joint Venture is considering the viability of upgrading the existing production facility to restore oil production from West Kora -1. EP 424 OFFSHORE CARNARVON BASIN
Pancontinental Oil & Gas NL – 38.462% EP 424 contains the Baniyas prospect which straddles the adjoining acreage. Commercial negotiations to gain access to the entire Baniyas prospect have reached a point where there is little likelihood that the adjoining acreage can be secured. This project is under review. The EP 424 joint venture consists of:
Strike Energy (Operator) 61.538% Pancontinental Oil & Gas NL 38.462%
EP 110 ONSHORE CARNARVON BASIN
Pancontinental Oil & Gas NL – 38.462% This permit is operated in conjunction with EP-424. The parties in EP-110 have identical equities to those in permit EP-424. CORPORATE Shares During the Half-Year, the Company issued 25,300,002 shares at $0.175 as the shortfall to the Share Purchase Plan completed earlier in the year. The shortfall raised $4,427,500 before costs. Options During the Half-Year:
2,250,000 options due to expire were exercised at $0.059, raising $132,750 for the Company; 2,750,000 options exercisable at $0.123 were issued to Directors; and No options expired.
Changes In State of Affairs During the Half-Year ended 31 December 2012, there was no significant change in the entity’s state of affairs other than that referred to in the Half-Year Financial Statements or Notes thereto. This Report is made in accordance with a Resolution of the Directors.
E A Myers Director PERTH, 22nd day of February 2013
For
per
sona
l use
onl
y

PANCONTINENTAL OIL & GAS NL ACN 003 029 543
9
Directors’ Report 31 December 2012 The Directors Pancontinental Oil & Gas NL 288 Stirling St Perth WA 6000 Dear Sirs, In accordance with Section 307C of the Corporations Act 2001 (the “Act”) I hereby declare that to the best of my knowledge and belief there have been: i) no contraventions of the auditor independence requirements of the Act in relation to the audit review of the 31 December 2012 Half-Yearly financial statements; and ii) no contraventions of any applicable code of professional conduct in relation to the audit. Graham R Swan (Lead auditor) Rothsay Chartered Accountants 22 February 2013 This Report is made in accordance with a Resolution of the Directors.
E A Myers Director PERTH, 22nd day of February 2013
For
per
sona
l use
onl
y

For
per
sona
l use
onl
y
PANCONTINENTAL OIL & GAS NL ACN 003 029 543
11
Directors’ Declaration
For The Half-Year Ended 31 December 2012 The Directors declare that:
(a) The attached Financial Statements and Notes thereto comply with Accounting Standards; (b) The attached Financial Statements and Notes thereto give a true and fair view of the financial
position and performance of the consolidated entity;
(c) In the Directors’ opinion, the attached Financial Statements and Notes thereto are in accordance with the Corporations Act, 2001; and
(d) In the Directors’ opinion, there are reasonable grounds to believe that Pancontinental Oil & Gas NL will be able to pay its debts as and when they become due and payable.
This declaration is made in accordance with a Resolution of the Directors pursuant to section 303(5) of the Corporations Act, 2001. On behalf of the Directors
E A Myers Director PERTH, 22nd day of February 2013
For
per
sona
l use
onl
y

PANCONTINENTAL OIL & GAS NL ACN 003 029 543
12
Condensed Consolidated Statement of Comprehensive Income For the Half-Year Ended 31 December 2012 Continuing Operations
Note
Half-Year Ended
31-Dec-12
Half-Year Ended
31-Dec-11 Revenue from Operating Activities $ $ Interest received 545,395 63,458 Total Revenues from Operating Activities 545,395 63,458 Depreciation (851) (734) Director remuneration and benefits expense (278,768) (229,063) Director issue of options (154,000) - Audit fees (4,500) (3,500) Generative exploration expenditure (12,526) (13,201) Annual report costs (16,591) (6,828) ASX fees (54,004) (31,639) Administration, accounting and secretarial fees (151,546) (145,583) Insurance (1,566) (625) Legal fees (16,420) (873) Share registry costs (42,625) (19,422) Rent and outgoings (40,280) (43,731) Travel (50,079) (62,729) Other (196,474) (208,517)Profit/(Loss) before Income Tax Expense (474,835) (702,987) Income Tax Expense - - Profit/(Loss) for the Period (474,835) (702,987) Other Comprehensive Income /(Loss) Other comprehensive income - - Other Comprehensive Income/(Loss) for the Period, Net of Income Tax - - Total Comprehensive Income/(Loss) for the Period (474,835) (702,987) Basic Loss per share (cents per share)
5
(0.04)
(0.11)
Diluted loss per share (cents per share) (0.04) (0.11)
The above Condensed Consolidated Statement of Comprehensive Income should be read in conjunction with the accompanying Notes.
For
per
sona
l use
onl
y

PANCONTINENTAL OIL & GAS NL ACN 003 029 543
13
Condensed Consolidated Statement of Financial Position As at 31 December 2012
Note
Half-Year Ended
31-Dec-12
Annual Report
30-Jun-12 $ $ Current Assets Cash and cash equivalents 3 40,963,819 47,722,233 Trade and other receivables 60,850 98,582 Total Current Assets 41,024,669 47,820,815 Non-Current Assets Plant and equipment 3,540 3,598 Deferred exploration and evaluation expenditure 33,850,894 23,211,960 Total Non-Current Assets 33,854,434 23,215,558 Total Assets 74,879,103 71,036,373 Current Liabilities Trade and other payables 119,478 235,805 Total Current Liabilities 119,478 235,805 Total Liabilities 119,478 235,805 Net Assets 74,759,625 70,800,568 Equity Contributed equity 4 99,411,998 95,132,106 Reserves 345,180 298,956 Accumulated losses 2 (24,997,553) (24,630,494)Total Equity 74,759,625 70,800,568
The above Condensed Consolidated Statement of Financial Position should be read in conjunction with the accompanying notes.
For
per
sona
l use
onl
y

PANCONTINENTAL OIL & GAS NL ACN 003 029 543
14
Consolidated Statement of Changes in Equity For the Half-Year ended 31 December 2012
Consolidated Share
Capital Retained Earnings
Option Reserve
Total Equity
$ $ $ $ Balance at 1 July 2011 38,166,253 (23,481,202) 764,258 15,449,309 Profit or loss - (702,987) - (702,987)Other comprehensive income/(loss) - - - - Shares issued (net of costs) 6,979,320 - - 6,979,320 Share options - 548,706 (548,707) (1) Balance at 31 December 2011 45,145,573 (23,635,483) 215,551 21,725,641 Balance at 1 July 2012 95,132,106 (24,630,494) 298,956 70,800,568 Profit or loss - (474,835) - (474,835)Other comprehensive income/(loss) - - - - Shares issued (net of costs) 4,279,892 - - 4,279,892 Share options - 107,776 46,224 154,000 Balance at 31 December 2012 99,411,998 (24,997,553) 345,180 74,759,625
The above Consolidated Statement of Changes in Equity should be read in conjunction with the accompanying notes.
For
per
sona
l use
onl
y
PANCONTINENTAL OIL & GAS NL ACN 003 029 543
15
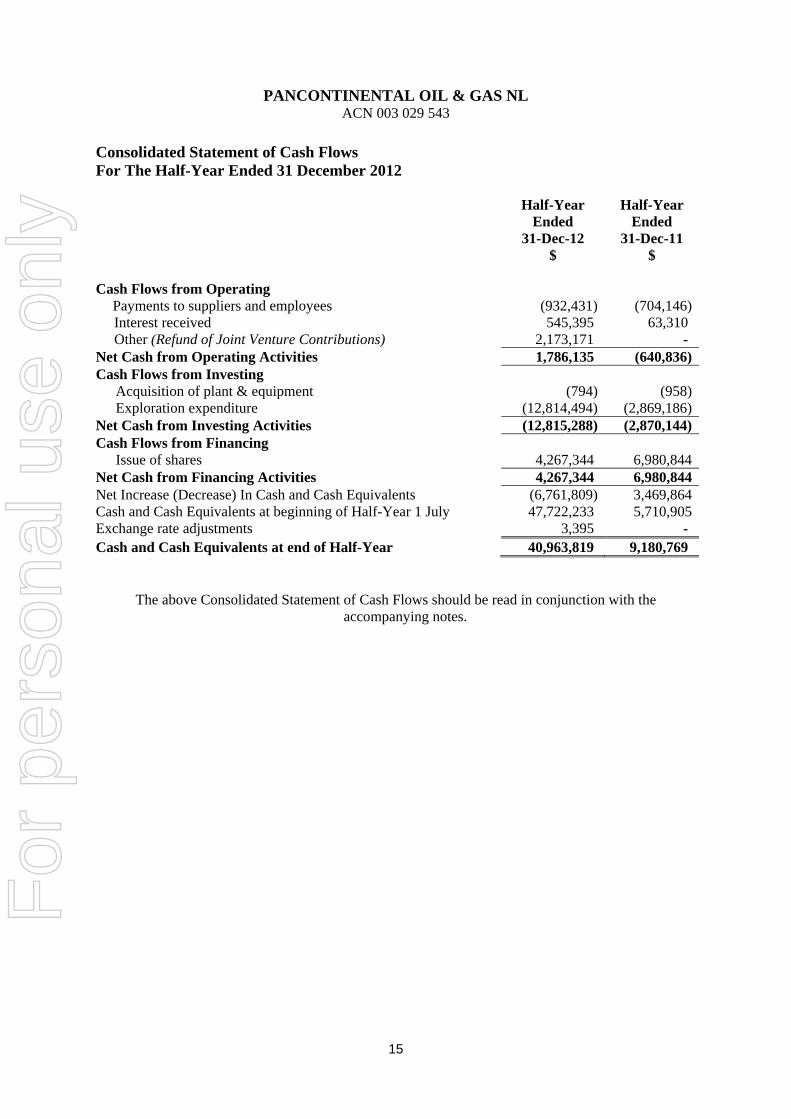
Consolidated Statement of Cash Flows For The Half-Year Ended 31 December 2012 Half-Year
Ended 31-Dec-12
Half-Year Ended
31-Dec-11 $ $ Cash Flows from Operating Payments to suppliers and employees (932,431) (704,146) Interest received 545,395 63,310 Other (Refund of Joint Venture Contributions) 2,173,171 - Net Cash from Operating Activities 1,786,135 (640,836)Cash Flows from Investing Acquisition of plant & equipment (794) (958) Exploration expenditure (12,814,494) (2,869,186)Net Cash from Investing Activities (12,815,288) (2,870,144)Cash Flows from Financing Issue of shares 4,267,344 6,980,844Net Cash from Financing Activities 4,267,344 6,980,844Net Increase (Decrease) In Cash and Cash Equivalents (6,761,809) 3,469,864Cash and Cash Equivalents at beginning of Half-Year 1 July 47,722,233 5,710,905Exchange rate adjustments 3,395 - Cash and Cash Equivalents at end of Half-Year 40,963,819 9,180,769
The above Consolidated Statement of Cash Flows should be read in conjunction with the accompanying notes.
For
per
sona
l use
onl
y
PANCONTINENTAL OIL & GAS NL ACN 003 029 543
16
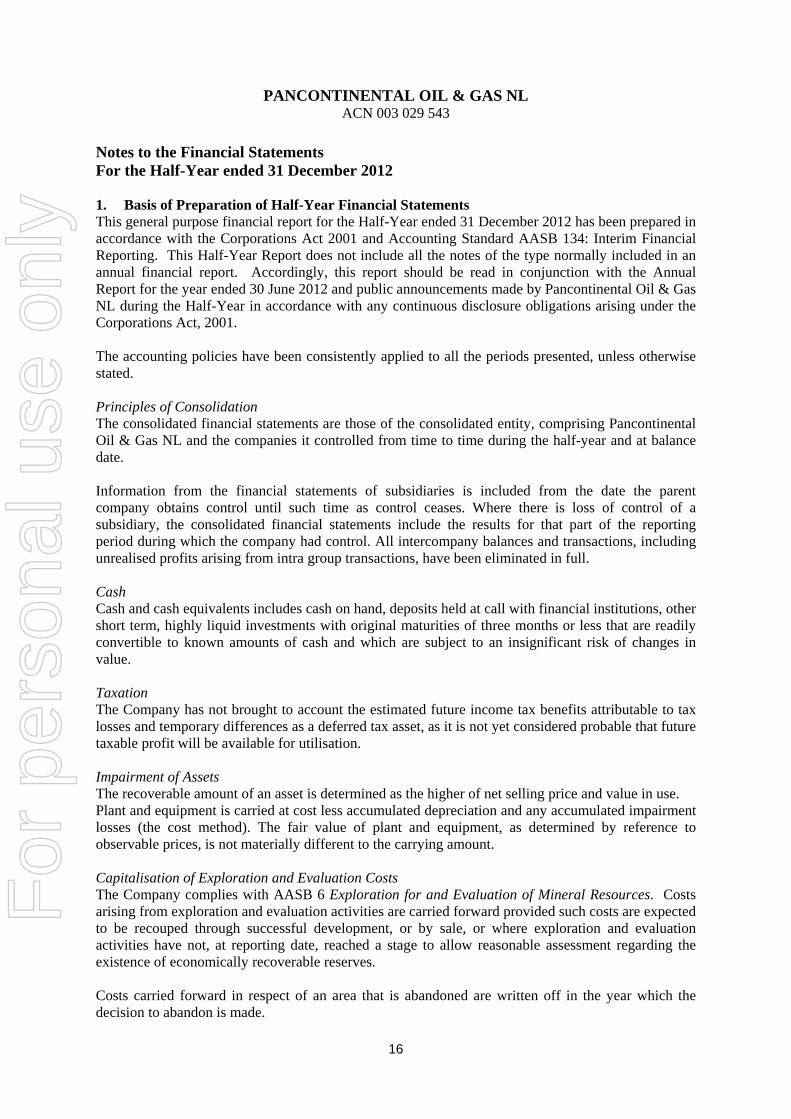
Notes to the Financial Statements For the Half-Year ended 31 December 2012 1. Basis of Preparation of Half-Year Financial Statements This general purpose financial report for the Half-Year ended 31 December 2012 has been prepared in accordance with the Corporations Act 2001 and Accounting Standard AASB 134: Interim Financial Reporting. This Half-Year Report does not include all the notes of the type normally included in an annual financial report. Accordingly, this report should be read in conjunction with the Annual Report for the year ended 30 June 2012 and public announcements made by Pancontinental Oil & Gas NL during the Half-Year in accordance with any continuous disclosure obligations arising under the Corporations Act, 2001. The accounting policies have been consistently applied to all the periods presented, unless otherwise stated. Principles of Consolidation The consolidated financial statements are those of the consolidated entity, comprising Pancontinental Oil & Gas NL and the companies it controlled from time to time during the half-year and at balance date. Information from the financial statements of subsidiaries is included from the date the parent company obtains control until such time as control ceases. Where there is loss of control of a subsidiary, the consolidated financial statements include the results for that part of the reporting period during which the company had control. All intercompany balances and transactions, including unrealised profits arising from intra group transactions, have been eliminated in full. Cash Cash and cash equivalents includes cash on hand, deposits held at call with financial institutions, other short term, highly liquid investments with original maturities of three months or less that are readily convertible to known amounts of cash and which are subject to an insignificant risk of changes in value. Taxation The Company has not brought to account the estimated future income tax benefits attributable to tax losses and temporary differences as a deferred tax asset, as it is not yet considered probable that future taxable profit will be available for utilisation. Impairment of Assets The recoverable amount of an asset is determined as the higher of net selling price and value in use. Plant and equipment is carried at cost less accumulated depreciation and any accumulated impairment losses (the cost method). The fair value of plant and equipment, as determined by reference to observable prices, is not materially different to the carrying amount. Capitalisation of Exploration and Evaluation Costs The Company complies with AASB 6 Exploration for and Evaluation of Mineral Resources. Costs arising from exploration and evaluation activities are carried forward provided such costs are expected to be recouped through successful development, or by sale, or where exploration and evaluation activities have not, at reporting date, reached a stage to allow reasonable assessment regarding the existence of economically recoverable reserves. Costs carried forward in respect of an area that is abandoned are written off in the year which the decision to abandon is made.
For
per
sona
l use
onl
y
PANCONTINENTAL OIL & GAS NL ACN 003 029 543
17
Notes to the Financial Statements For the Half-Year ended 31 December 2012 1. Basis of Preparation of Half-Year Financial Statements Continued Significant Accounting Policies & Changes in Accounting Policies The accounting policies applied by the consolidated entity in this consolidated interim financial report are the same as those applied by the consolidated entity in its consolidated financial report as at and for the year ended 30 June 2012.
In the half-year ended 31 December 2012, the Group has reviewed all of the new and revised Standards and Interpretations issued by the AASB that are relevant to its operations and effective for annual reporting periods beginning on or after 1 July 2012.
It has been determined by the Group that there is no impact, material or otherwise, of the new and revised Standards and Interpretations on its business and, therefore, no change is necessary to Group accounting policies.
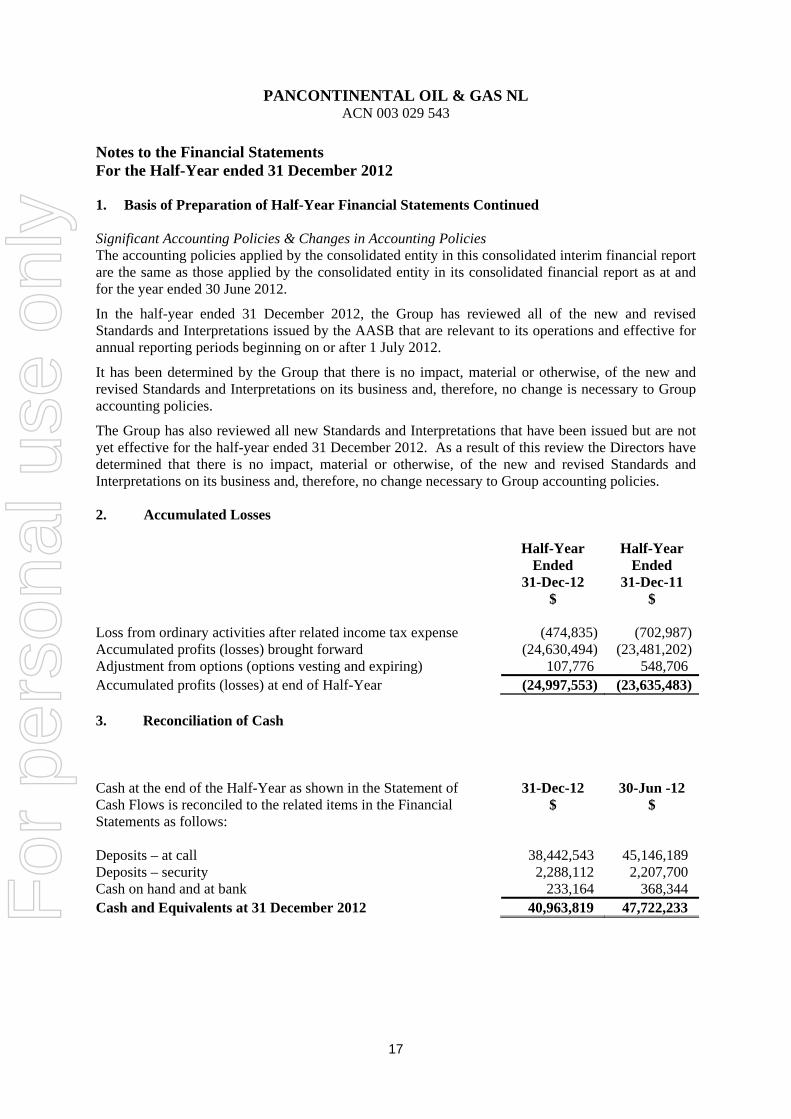
The Group has also reviewed all new Standards and Interpretations that have been issued but are not yet effective for the half-year ended 31 December 2012. As a result of this review the Directors have determined that there is no impact, material or otherwise, of the new and revised Standards and Interpretations on its business and, therefore, no change necessary to Group accounting policies. 2. Accumulated Losses Half-Year
Ended 31-Dec-12
Half-Year Ended
31-Dec-11 $ $ Loss from ordinary activities after related income tax expense (474,835) (702,987)Accumulated profits (losses) brought forward (24,630,494) (23,481,202)Adjustment from options (options vesting and expiring) 107,776 548,706 Accumulated profits (losses) at end of Half-Year (24,997,553) (23,635,483) 3. Reconciliation of Cash Cash at the end of the Half-Year as shown in the Statement of
31-Dec-12
30-Jun -12 Cash Flows is reconciled to the related items in the Financial $ $ Statements as follows: Deposits – at call 38,442,543 45,146,189 Deposits – security 2,288,112 2,207,700 Cash on hand and at bank 233,164 368,344 Cash and Equivalents at 31 December 2012 40,963,819 47,722,233
For
per
sona
l use
onl
y
PANCONTINENTAL OIL & GAS NL ACN 003 029 543
18
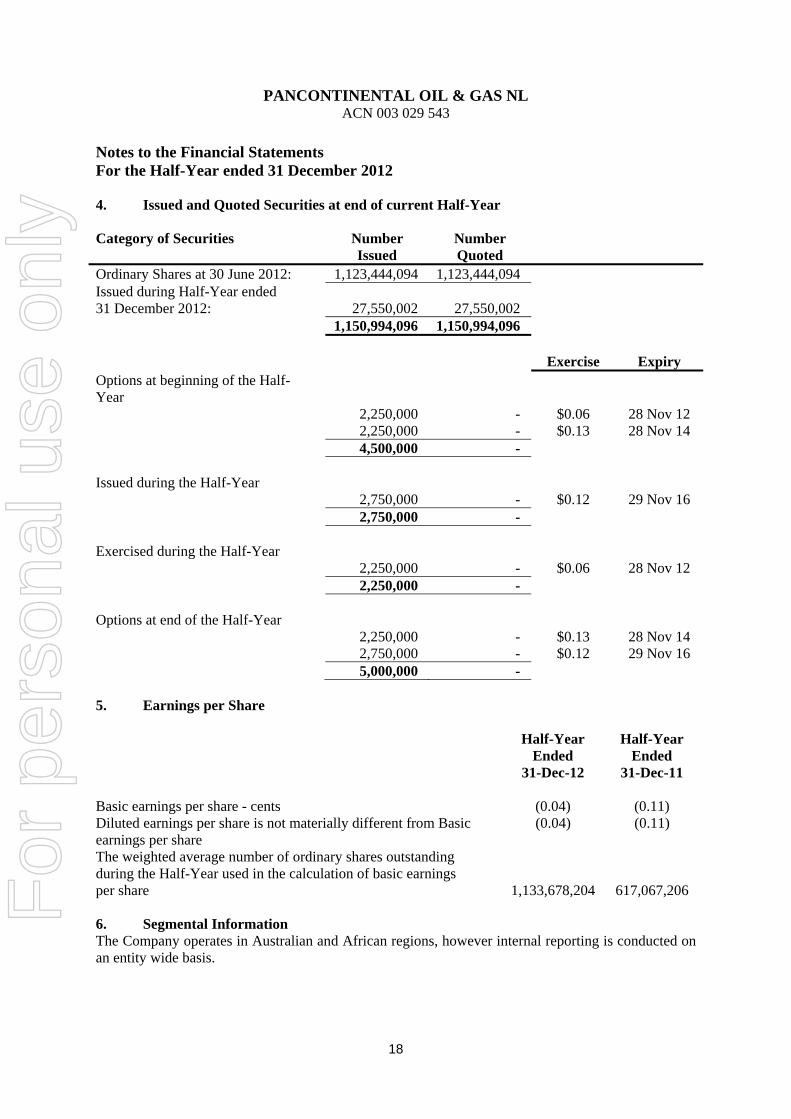
Notes to the Financial Statements For the Half-Year ended 31 December 2012 4. Issued and Quoted Securities at end of current Half-Year Category of Securities Number
Issued Number Quoted
Ordinary Shares at 30 June 2012: 1,123,444,094 1,123,444,094 Issued during Half-Year ended 31 December 2012:
27,550,002
27,550,002
1,150,994,096 1,150,994,096 Exercise Expiry Options at beginning of the Half-Year
2,250,000 - $0.06 28 Nov 12 2,250,000 - $0.13 28 Nov 14 4,500,000 - Issued during the Half-Year 2,750,000 - $0.12 29 Nov 16 2,750,000 - Exercised during the Half-Year 2,250,000 - $0.06 28 Nov 12 2,250,000 - Options at end of the Half-Year 2,250,000 - $0.13 28 Nov 14 2,750,000 - $0.12 29 Nov 16 5,000,000 - 5. Earnings per Share
Half-Year Ended
31-Dec-12
Half-Year Ended
31-Dec-11 Basic earnings per share - cents (0.04) (0.11) Diluted earnings per share is not materially different from Basic (0.04) (0.11) earnings per share The weighted average number of ordinary shares outstanding during the Half-Year used in the calculation of basic earnings per share 1,133,678,204 617,067,206 6. Segmental Information The Company operates in Australian and African regions, however internal reporting is conducted on an entity wide basis.
For
per
sona
l use
onl
y

PANCONTINENTAL OIL & GAS NL ACN 003 029 543
19
Notes to the Financial Statements For the Half-Year ended 31 December 2012 7. Subsequent Events No matters or circumstances have arisen since the end of the Half-Year which significantly affected or may significantly affect the operations of the Consolidated Entity, the results of the Consolidated Entity, or the state of affairs of the Consolidated Entity as reported to the Half-Year ended 31 December 2012. 8. Commitments for Expenditure (Contingent Liability) Oil Leases and Permits In order to maintain current rights of tenure to permits, the Consolidated Entity is required to perform minimum expenditure requirements of various authorities and pay fees. The Consolidated Entity may be required to outlay an amount of approximately $31,871,276 in the next year with respect to permit lease rentals and exploration expenditures to meet these minimum expenditure requirements. The balance of these obligations will be fulfilled in the normal course of operations, which may include farmout, joint venture and direct exploration expenditure.
For
per
sona
l use
onl
y