Embed Size (px)
Citation preview

Ware NIH Lecture Handouts 12/3/2012
1
For more information:[email protected]@jwrginc.com
Health-Related Quality of Life (HRQoL) - 2013
Introduction to the Principles and Practice of Clinical ResearchNational Institutes of Health - Warren G. Magnuson Clinical Center Building 10
Lipsett Amphitheater, Bethesda, MD, December 3, 2012
John E. Ware, Jr., PhD, Professor and Division Chief
Department of Quantitative Health Sciences, Umass Medical School
Chief Science Officer, John Ware Research Group, Worcester, MA
Quality of Life (QoL)
•Community•Education
•Family LifeF i d hi
•Marriage•Nation•Neighborhood•Self
22
•Friendships•Health
•Housing
•Self•Standard of Living•Work
Source: Campbell, 1981
World Health Organization Definition of Health
“Health is a state of complete physical, mental, and social well-being and not
3
, gmerely the absence of disease or infirmity”
WHO, 1948

Ware NIH Lecture Handouts 12/3/2012
2
For more information:[email protected]@jwrginc.com
Health is Measured in Terms of:
• Bodily structure & function
• Specific symptoms
44
• What you do/are able to do – functioning
• How you feel – subjective ill- and well-being (+ and -)
• What you say it is – personal evaluation
Sources: Understanding Health Outcomes Educational Series
Arthritis SymptomsHave you had the following symptoms: Joint pain, swelling, burning sensation:
• Almost every day• Several days a week• A few days a month• Not at all
X-ray, Disease Progression
Continuum of Disease-specific and Generic Health Measures - Arthritis
GenericHealth
In general, would you say your health is:
• Excellent• Very good• Good• Fair• Poor
How much does your arthritis limit your usual activities or enjoyment of everyday life?
• Not at all• A little• Moderately• Extremely
ArthritisImpact
55555
Clinical Markers
(1)
Specific Symptoms
(2)
Impact of Disease-specific
Problems
(3)
• Not at all
(4)
Generic Functioning, Well-being
and Evaluation
Health-related QOL(HRQoL)
Extremely
Adapted from: Wilson and Cleary, JAMA, 1995Ware, Annual Rev. Pub. Health, 1995
There is More to the Continuum
6
Clinical Markers
Specific Symptoms
(1) (2) (4)
Generic Functioning, Well-being
and Evaluation
Impact of Disease-specific
Problems
(3)
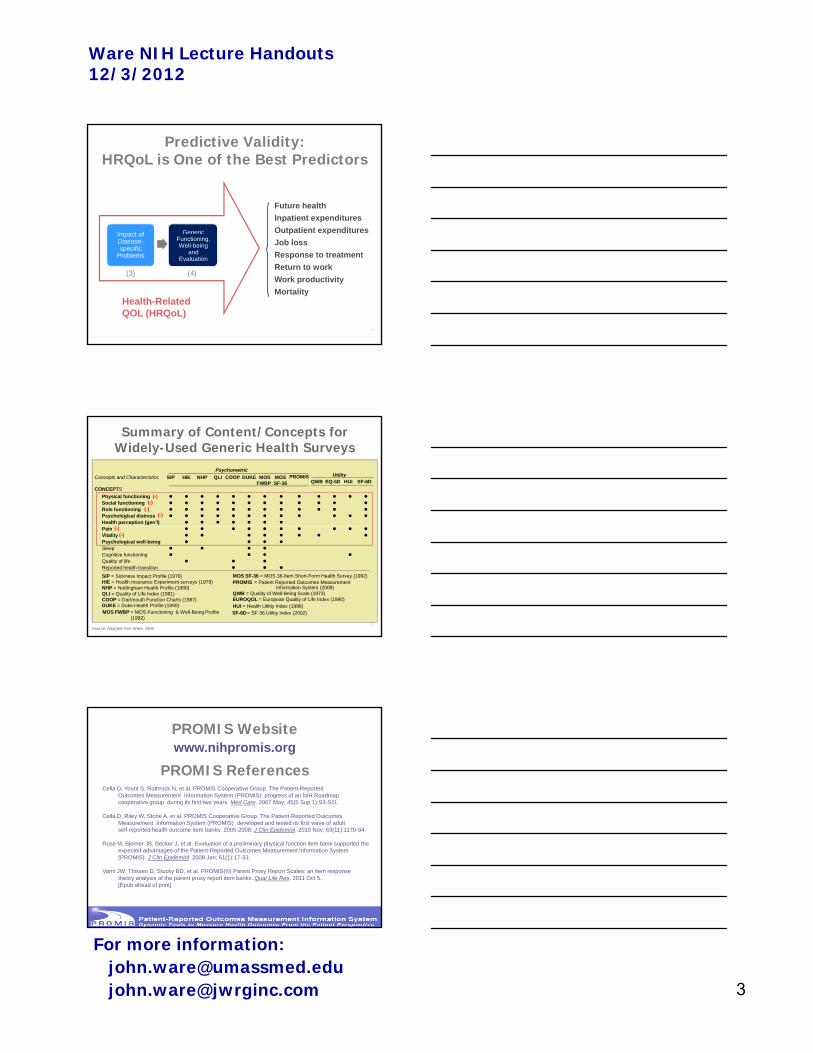
Ware NIH Lecture Handouts 12/3/2012
3
For more information:[email protected]@jwrginc.com
Predictive Validity:HRQoL is One of the Best Predictors
Future health
Inpatient expenditures
Outpatient expendituresImpact of Generic
7
Health-Related QOL (HRQoL)
p p
Job loss
Response to treatment
Return to work
Work productivity
Mortality
(3) (4)
Impact of Disease-specific
Problems
Functioning, Well-being
and Evaluation
Summary of Content/Concepts for Widely-Used Generic Health Surveys
PsychometricUtility Concepts and Characteristics SIP HIE NHP QLI COOP DUKE MOS
FWBPMOSSF-36 QWB EQ-5D HUI SF-6D
CONCEPTS
Physical functioning Social functioning Role functioning Psychological distress Health perception (gen’l)
PROMIS
(-)(-)
(-)
( )
(-)
8Source: Adapted from Ware, 1995
Reported health transition
SIP = Sickness Impact Profile (1976)HIE = Health Insurance Experiment surveys (1979)NHP = Nottingham Health Profile (1980)QLI = Quality of Life Index (1981)COOP = Dartmouth Function Charts (1987)DUKE = Duke Health Profile (1990)MOS FWBP = MOS Functioning & Well-Being Profile
(1992)
MOS SF-36 = MOS 36-Item Short-Form Health Survey (1992)
QWB = Quality of Well-Being Scale (1973)EUROQOL = European Quality of Life Index (1990)HUI = Health Utility Index (1996)SF-6D= SF-36 Utility Index (2002)
Pain Vitality Psychological well-being Sleep Cognitive functioning Quality of life
PROMIS = Patient Reported Outcomes Measurement Information System (2008)
(-)(-)
www.nihpromis.orgPROMIS Website
Cella D, Yount S, Rothrock N, et al. PROMIS Cooperative Group. The Patient-Reported Outcomes Measurement Information System (PROMIS): progress of an NIH Roadmap cooperative group during its first two years. Med Care. 2007 May; 45(5 Sup 1):S3-S11.
Cella D, Riley W, Stone A, et al. PROMIS Cooperative Group. The Patient-Reported Outcomes
PROMIS References
9
Cella D, Riley W, Stone A, et al. PROMIS Cooperative Group. The Patient Reported Outcomes Measurement Information System (PROMIS) developed and tested its first wave of adult self-reported health outcome item banks: 2005-2008. J Clin Epidemiol. 2010 Nov; 63(11):1179-94.
Rose M, Bjorner JB, Becker J, et al. Evaluation of a preliminary physical function item bank supported the expected advantages of the Patient-Reported Outcomes Measurement Information System (PROMIS). J Clin Epidemiol. 2008 Jan; 61(1):17-33.
Varni JW, Thissen D, Stucky BD, et al. PROMIS(®) Parent Proxy Report Scales: an item responsetheory analysis of the parent proxy report item banks. Qual Life Res. 2011 Oct 5.[Epub ahead of print]

Ware NIH Lecture Handouts 12/3/2012
4
For more information:[email protected]@jwrginc.com
Medical Outcomes Study 36-Item Health Survey (SF-36)
Physical
1010
Utility Index(Brazier et al., 2002)
(Lam, Brazier, McGhee 2008)
Mental
Generic Health Profiles: Before & After Medication
Best Health
45
50
55
60
45
50
55
60
Arthritis
Norm45
50
55
60
45
50
55
60
Depression
11
Poorest Health
Component Summaries
SF-36 Subscales
Treatment
Baseline
25
30
35
40
45
25
30
35
40
45
Physical Mental P M25
30
35
40
30
35
40
Component Summaries
SF-36 Subscales
Physical Mental P M
Treatment
Baseline
Poorest Health
-
Next Step: Integrate and Standardize Disease-specific and Generic Measures
Best Health
+
45
50
55
60
45
50
55
60
US Norms(Mean=50
SD=10)
Best Health
Poorest Health
2530
35
40
Disease-SpecificImpact Scale
(QDIS)
2530
35
40
Example: Osteoarthritis
Physical HealthGeneric Summary
(PHGS)
)

Ware NIH Lecture Handouts 12/3/2012
5
For more information:[email protected]@jwrginc.com
Comparison of Content of Generic And Disease-Specific Measures
Health Domains
Physical functioning
Social functioning
Role functioning
Psychological distress
Health perceptions (general)
Pain (bodily)
Energy/fatigue
SIP
PROMIS
Generic*
MOSFWBP
WO‐
MAC
Disease‐Specific*
SAQKD
QOL
StGeorg
DQOL
ML‐
HFQ
13
Health transition (B/S/W)
Energy/fatigue
Psychological well‐being
Sleep
Cognitive functioning
Quality of life
Sexual functioning
Specific symptomsSpecific treatments
DQOL ‐ Diabetes Quality of Life Measure
KDQOL ‐ Kidney Disease Quality of Life Questionnaire
MLHFQ ‐ Minnesota Living with Heart Failure Questionnaire
SAQ ‐ Seattle Angina Questionnaire
St. George's Respiratory Questionnaire
WOMAC ‐ Western Ontario and Mac Master's Arthritis Index
SIP ‐ Sickness Impact Profile, 136 items (1976)
MOS FWBP ‐MOS Functioning and Well‐Being Profile, 149 items (1992)
PROMIS ‐ Patient Reported Outcomes MeasurementInformation System (2007‐on)
*Source: Comparison adapted fromWare 1987; Ware, 1995
Content Areas* QOL Disease Impact Scale (QDIS)
1. Global (“activity” and “QOL”)2. Physical Functioning3. Mobility4. General Health 5 Fatigue5. Fatigue6. Cognitive7. Emotional8. Sleep9. Role Functioning 10. Social Functioning
*Note: Bank of 49 items reduced to 25 items with attribution to specific condition
Generic
During the past 4 weeks, how often did your healthlimit your ability to do your everyday activities?
• Very often
Anatomy of a Survey Item:QDIS Changes Attribution from Health
to Specific Disease
health
Disease-Specific Att ib ti
arthritis
Attribution
15
• Very often
• Often
• Sometimes• Rarely
• Never
Attribution
Early Reference: Patrick DL, Deyo RA. Generic and Disease-specific Measures in Assessing Health Status and Quality of Life. Medical Care. 1989;27(3):S217-S232.
QDIS Reference: QOL Disease Impact Scale (QDIS); Ware JE, Guyer R, Harrington M, Boulanger R. Quality of Life Research, 2012.

Ware NIH Lecture Handouts 12/3/2012
6
For more information:[email protected]@jwrginc.com
• Standardized Metrics
• Adaptive survey administrations
Better Measures Are Being ConstructedSource:
Business Week
11/26/01
1616
Adaptive survey administrations
• Norm-based scoring
• Internet and mobile data collection
50 NormVigorous Activities, Not limited
Improving the Physical Function “Ruler”
1980 Old “Ruler”
> 75%@ Ceiling
1990 NEW “Ruler”
> 30%@ Ceiling
2008BETTER “Ruler”< 3 % @ Ceiling
50
70
60
1717
100
0
20
30
40
Mean = 50SD = 10
Climbing several flights of stairs
Walk one hundred yards
Bathing or dressing, Limited a little
00.2
0.4
0.6
10 20 30 40 50 60
.76
.24
.01a b
Limiteda little
Limiteda lot0.8
1.0 NotLimited
20
30
40
We Need the Health Equivalent of a Two-Sided Tape Measure
52 centimeters = 20.5 inches
18
and Public-Private Partnerships Meetingthe Needs of Research and Business

Ware NIH Lecture Handouts 12/3/2012
7
For more information:[email protected]@jwrginc.com
Short-Form Surveysand Ceiling Effects
7
Measuring Too Low -CeilingEffect
19
1
3
1
3
1
3
5
Some Thermometers Focus on a Very Narrow Range
130–190 °F54–88 °C
20Cooking Thermometer
Temperature
F° = 98.6 C° = 37.0
WaterFreezes
NormalHumanBlood
ShirtSleeve
Weather
21Example: Cross-Calibrating Celsius and Fahrenheit

Ware NIH Lecture Handouts 12/3/2012
8
For more information:[email protected]@jwrginc.com
CAT
Solution: Adaptive Survey Methods
Patient scores here
22
CAT = Computerized Adaptive Testing
Adaptive Assessments of Disease ImpactMatch Questions to Each Patient’s Level
70
80
Severe60
23
Moderate
10
30
40
Mild
50
40
20
Higher is worse.Mean = 50SD = 10
First QuestionNoisy Score Estimate (+/- 15)
70
80
60
Score estimate,1st response = 62+/ 15
Severe
2410
30
40
50
40
20
+/- 15
Moderate
MildHigher is worse.Mean = 50SD = 10

Ware NIH Lecture Handouts 12/3/2012
9
For more information:[email protected]@jwrginc.com
Second Question: Standard Error Reduced by One Third
Score estimate,2 responses = 64+/- 10
80
70
60
Severe
25
/ 10
10
30
40
50
40
20
Moderate
MildHigher is worse.Mean = 50SD = 10
Third Question: Standard ErrorCut in Half
80
70
60
Severe Score estimate,3 responses = 63
/ 7
2610
30
40
50
40
20
Moderate
Mild
+/- 7
Higher is worse.Mean = 50SD = 10
Fourth Question: Standard ErrorCut by Two Thirds
80
70
60
Severe Score estimate,4 responses = 62
/ 5
2710
30
40
50
40
20
Moderate
Mild
+/- 5
Higher is worse.Mean = 50SD = 10

Ware NIH Lecture Handouts 12/3/2012
10
For more information:[email protected]@jwrginc.com
Practical Implications of CATin Health Assessment
28
“Ceiling Effect”
r = 0.536N = 1016
r = 0.938N = 1016
CriterionScore
CriterionScore
A Promising Solution in 1999: CAT-Based Health Assessment
3 SD units
29
Reference: Ware JE, Jr., Bjorner JB, Kosinski M: Practical implications of item response theory and computerized adaptive testing: A brief summary of ongoing studies of widely used headache impact scales. Medical Care 2000;38:II73-82.
Static 5-Item Headache Pain Measure
Dynamic 5-Item HeadachePain Measure
ScoreScore
NoNoDisabilityDisability
Performance of 5-item CAT Scores Confirmed in NIH-Sponsored Studies
r = 0.98N = 2,753
r = 0.94N = 1,016
20 30 40 50 60 70
r = 0.96N = 263
10
20
30
40
50
60
70
30
Mental Health Headache Disability
-2
-1
0
1
2
3
-2 -1 0 1 2 3
DiabetesImpact
r = 0.93N = 100
Pediatric Disability
Chronic Kidney Disease
-3
-2
-1
0
1
2
-4-3 -2 -1 0 1 2
r = 0.95N = 1,846
Post AcuteRehabilitation
15
20
25
30
35
40
45
50
20 25 30 35 40 45
r = 0.95N = 485

Ware NIH Lecture Handouts 12/3/2012
11
For more information:[email protected]@jwrginc.com
What are the Advantages of Dynamic Assessments?
• More accurate risk screening
• Reliable enough to monitor individual outcomes
• Brevity of a short form –
3131
90% reduction in respondent burden
• Elimination of “ceiling” & “floor” effects
• Can be administered using various data collection technologies
• Markedly reduced data collection costs
• Monitor data quality in real time
Matching Methods to Applications
5
6
7
5
7
5
PopulationSurveys
Group-LevelStudies
Patient-LevelAssessments
7
6
32
1
2
3
4
1
3
Single-Item
1
2
3
4
Multi-ItemScale
“Item Bank” (CAT Dynamic)
Most Functionally Impaired
NoisyIndividual
Classification
Very AccurateIndividual
Classification
Adaptive Survey Logic (ASLX ®) Flow Chart
ASLX® Screen Estimate Score & CI from Screen
NEG
POS
ConditionPresent?
Follow‐upAssessmentModules
GenericAssessment
Survey ContentAnd User
Interface (UI)
GenericHealth
Assessments
QDISAssessments(QOLIX® CCC)
YES
NONext Condition
33
SupplementalDomain
Assessment(CAT/Static)*
Repeat Cycle for Each Generic Domain
Repeat Cycle for Each Chronic Condition
Pos
SupplementalDisease ImpactAssessment
(CAT/Static)*
ASLX® Screen
Abbreviations: QOLIX® DIS; Chronic condition checklist QOLIX® CCC), Computer adaptive test (CAT), Confidence interval (CI), Diagnosis (Dx), Electronic data capture (EDC), User interface (UI); Follow-up assessment modules vary across
applications.
Impact Estimated
From Screening
Neg

Ware NIH Lecture Handouts 12/3/2012
12
For more information:[email protected]@jwrginc.com
• Diagnosis
• Disease severityHR QOL
GoldStandard
• Work productivity• Costs of care
Mortality
• Diagnosis
• Disease severity
• Work productivity• Costs of care
M t lit
GoldStandard
Clinical CausesEconomic & Social
Consequences
HRQoL Validation Strategies
343434
• Responders
• Treatments
HR-QOL • Mortality• Self- evaluated
health
OtherMeasures& Methods
y
• Clinical endpoint
• Treatment
• Mortality• Self-evaluated
health
OtherMeasures& Methods
Adapted from: Ware JE, Jr. and Keller SD: Interpreting general health measures, in: Quality of Life and Pharmacoeconomics in Clinical Trials. Philadelphia, PA: Lippincott-Raven Publishers; 1995: Chapter 47.
Interpreting HRQoL Scores
Chronic Lung A th
PopulationHealth Surveys
Chronic Disease Registry
General Population Health SurveysChronic Disease Registry
353535
30 40 50
Lung Disease
55
Average Well Adult
MOS Physical Component Summary (PCS)(Mean = 50, SD = 10)
DiabetesType II
Congestive Heart
Failure
Asthma
Average Adult
45
ChronicKidneyDisease
35
Interpreting HRQoL Scores
Chronic Lung A th
General Population Health SurveysChronic Disease RegistryClinical Trials
RAAfterRx
RABefore
Rx
PopulationHealth Surveys
ClinicalTrials
Chronic Disease Registry
• Content of questionnaire items
• Statistically significant change
• Important reduction in disease burden
• Reduction in subsequent expenditures
• Substantial increase in work productivity
36363636
30 40 50
Lung Disease
55
Average Well Adult
MOS Physical Component Summary (PCS)(Mean = 50, SD = 10)
DiabetesType II
Congestive Heart
Failure
Asthma
Average Adult
45
ChronicKidneyDisease
35
RxRx
TreatmentEffect (net)
Strand etal Arth & Rheum, 1999;42(9): 1870-78

Ware NIH Lecture Handouts 12/3/2012
13
For more information:[email protected]@jwrginc.com
Are Generic HRQoL Measures Responsive?
How much does your arthritis limit your usual activities or enjoyment of everyday life?
• Not at all• A little• Moderately• Extremely
ArthritisImpact
In general, would you say your health is:
• Excellent• Very good• Good• Fair• Poor
GenericHealth
Arthritis SymptomsHave you had the following symptoms: Joint pain, swelling, burning sensation:
• Almost every day• Several days a week• A few days a month• Not at all
X-ray, Disease Progression
SF-36 agreed with primary endpoint (across Rx):
• 219 of 253 RCTs• 86.6%
37373737
Clinical Markers
Specific Symptoms
Impact of Disease-specific
Problems
Reference: Ware JE and Frendl D “Systematic review of the responsiveness of SF-36 HealthSurvey measures to efficacious pharmaceutical therapies in published double-blind randomized controlled trials.” Presentation at the 13th Annual ISPOR Congress, Prague CzechRepublic, 11/6/2010; Value in Health, Vol 13, (7): A239–A250.
(1) (2) (3) (4)
SF-36 RCTs
Generic Functioning, Well-being
and Evaluation
Internet Sampling and Data Collection
383838
Reference – Headache Impact: MS Bayliss, JE Dewey, R Cady etal., A.Study of the Feasibility of Internet Administration of a computerizedhealth survey: The Headache Impact Test (HIT), Quality of Life Research, 2003, 12: 953-961
References – Asthma Control: Nathan RA, Sorkness CA, Kosinski M et al., “Development of the Asthma Control Test: A survey for assessing asthma control. Journal of Allergy and Clinical Immunology. 2004;113: 59-65.
Health Outcomes Research UsingHandhelds –Mobile Metrics

Ware NIH Lecture Handouts 12/3/2012
14
For more information:[email protected]@jwrginc.com
Thank You!
For more information: [email protected]