Embed Size (px)
Citation preview
This paper is included in the Proceedings of the 14th USENIX Conference on
File and Storage Technologies (FAST ’16).February 22–25, 2016 • Santa Clara, CA, USA
ISBN 978-1-931971-28-7
Open access to the Proceedings of the 14th USENIX Conference on
File and Storage Technologies is sponsored by USENIX
PCAP: Performance-aware Power Capping for the Disk Drive in the Cloud
Mohammed G. Khatib and Zvonimir Bandic, WDC Research
https://www.usenix.org/conference/fast16/technical-sessions/presentation/khatib
USENIX Association 14th USENIX Conference on File and Storage Technologies (FAST ’16) 227
PCAP: Performance-Aware Power Capping for the Disk Drive in the Cloud
Mohammed G. Khatib and Zvonimir BandicWDC Research
{mohammed.khatib,zvonimir.bandic}@hgst.com
Abstract
Power efficiency is pressing in today’s cloud systems.Datacenter architects are responding with various strate-gies, including capping the power available to comput-ing systems. Throttling bandwidth has been proposed tocap the power usage of the disk drive. This work revis-its throttling and addresses its shortcomings. We showthat, contrary to the common belief, the disk’s power us-age does not always increase as the disk’s throughput in-creases. Furthermore, throttling unnecessarily sacrificesI/O response times by idling the disk. We propose a tech-nique that resizes the queues of the disk to cap its power.Resizing queues not only imposes no delays on servicingrequests, but also enables performance differentiation.
We present the design and implementation of PCAP,an agile performance-aware power capping system forthe disk drive. PCAP dynamically resizes the disk’squeues to cap power. It operates in two performance-aware modes, throughput and tail-latency, making it vi-able for cloud systems with service-level differentiation.We evaluate PCAP for different workloads and diskdrives. Our experiments show that PCAP reduces powerby up to 22%. Further, under PCAP, 60% of the re-quests observe service times below 100 ms compared tojust 10% under throttling. PCAP also reduces worst-case latency by 50% and increases throughput by 32%relative to throttling.
1 Introduction
The widespread adoption of on-line services has been fu-eling the demand for more and denser datacenters. Thedesign of such warehouse-sized computing systems [12]is not at all trivial. Architects have to deal not onlywith computing, storage and networking equipment, butalso with cooling and power infrastructures [13]. In fact,power and energy are first-order concerns for architectsas new high-performing hardware is likely to require
more power, while the cost of hardware has remainedstable. With these trends continuing, Barroso [11] ar-gues that the cost of the energy to operate a server duringits lifetime could surpass the cost of the hardware itself.
Power is more concerning since the cost of buildinga datacenter is mainly dictated by the costs of its powerinfrastructure. These costs typically range between $10and $20 per deployed Watt of peak critical power [29].Hence, a datacenter with a provisioned 10 MW peakpower capacity costs $100M to $200M (excluding cool-ing and ancillary costs), a significant amount of money.Contrast the $10/W building cost with an average of$0.80/Watt-hour for electricity in the U.S. Still, while en-ergy costs vary with the usage of the datacenter, buildingcosts are fixed and based on the peak power capacity.Consequently, it becomes very important to fully utilizea datacenter’s power capacity. If a facility is operated at85% of its maximum capacity, the cost of building thefacility surpasses the energy costs for ten years of opera-tion [29].
Recent studies have addressed maximizing the powerutilization in datacenters [26, 36]. Researchers havecharacterized the power usage at different levels in thedatacenter (e.g., machine and cluster) and investigatedpower provisioning strategies. One especially promis-ing strategy is power over-subscription [12], that over-subscribes a datacenter with more machines (and thusmore work) to ensure near 100% power utilization. Theincentive to fully utilize the power budget is, however,offset by the risk of overloading the power trains and in-frastructure of the datacenter. Such overloading couldresult in long service downtimes (due to power outages)and/or costly contractual fines (due to service agreementviolations). To prevent overloading, power capping tech-niques are deployed as a safety mechanism, thus allow-ing maximum utilization while preventing costly penal-ties.
Power capping is a mechanism that ensures that thepower drawn by a datacenter stays below a predefined
228 14th USENIX Conference on File and Storage Technologies (FAST ’16) USENIX Association
power limit or cap. At the core of power capping isa monitoring loop, which takes in power readings, andcomputes the amount of power capping needed. Cappingitself is done in a variety of techniques depending on thescale and type of the hardware component under ques-tion. On a datacenter level, capping is an aggregate num-ber that trickles down to clusters, racks, machines andcomponents. Suspending low-priority tasks in a clusterand adapting the clock frequency of a CPU componentare two example techniques.
This work focuses on capping the power usage of thestorage component of the datacenter. We address the 3.5-inch high-capacity enterprise hard disk drives (HDDs)common in today’s cloud deployments. This paper tack-les the question of: How can the HDD power consump-tion be capped in a performance-aware manner?
To this end, we revisit the throttling technique pro-posed for power capping [40] and address its shortcom-ings in a new technique we propose. We show that throt-tling unnecessarily sacrifices timing performance to cappower. Throttling limits disk throughput by stopping ser-vicing and delaying all outstanding requests. It is pred-icated on the assumption that low throughputs result inless power usage by the disk. Our power measurementsreveal that, contrary to the common belief, the power us-age of the disk does not always increase with the increasein throughput but declines for high throughputs. We findno strict positive correlation between the power usageand the throughput of the disk.
To enable power capping for the disk drive, we pro-pose a technique that resizes the I/O queues. We showthat resizing queues not only reduces the impact on per-formance, unlike throttling, but also enables two differ-ent performance-oriented operation modes: throughputand tail-latency. This is important given the various ser-vices offered by today’s datacenters. For instance, websearch is sensitive to latency, whereas Map-reduce isthroughput-oriented [22, 35]. By I/O queues we meanboth the disk’s queue as well as its respective OS queue.We investigate the interplay between both queues andtheir influence on the disk’s power usage.
We present PCAP, an agile performance-aware powercapping system for the disk drive. PCAP dynamicallyadapts the queues of a disk drive to cap its power. It per-forms power capping in two different operation modes:throughput and tail-latency. Under PCAP, 60% of therequests exhibit latencies less than 100 ms as opposed tojust 10% under throttling. Also, PCAP reduces worst-case latency by 50% and increases throughput by 32%compared to throttling. PCAP has three goals:1. Agile power capping that reacts quickly to workloadvariations to prevent power overshooting as well as per-formance degradation.2. Graceful power control to prevent oscillations in
power and better adhere to service level agreements.3. Maximized disk performance for enhanced perfor-mance of applications.
This paper makes the following contributions:• Revisiting the throttling technique for HDDs andstudying the throughput–power relationship (section 4).• Investigating the impact of the HDD’s and OS queueson the HDD’s power and performance (section 5).• Designing and evaluating the PCAP system that is ag-ile, graceful, and performance-aware (section 6).
This paper is structured as follows. The next sectionoffers a brief refresher of the basics of HDDs. Sec-tion 3 evaluates the merit of power capping for HDDsand presents our experimental setup. Section 4 revisitsthrottling and its impact on power. Section 5 investigatesthe influence of the queue size on HDD’s power con-sumption. Section 6 presents the design of PCAP andSection 7 evaluates it. Section 8 studies PCAP for dif-ferent workloads. Section 9 discusses related work andSection 10 concludes.
2 Background
2.1 Power capping vs. Energy efficiencyThis work focuses on power capping to maximize theutilization in the datacenter, where peak power predom-inates costs of ownership. We do not address energy ef-ficiency, where machines are powered down in underuti-lized datacenters to save energy. While the latter receivedample attention in the literature [43, 44, 45, 48, 41], theformer received relatively little [40, 26, 36].
Addressing power capping, we measure power dissi-pation. Power is the rate at which electricity is con-sumed. It is measured at an instant in time as Watts (W).To contrast, energy is a total quantity and is power inte-grated over time. It is measured as Wh (Watt-hour), orjoules. We focus on power usage here.
2.2 HDD power cappingThe active read/write mode of the HDD is of a primaryinterest for power capping. This is because the HDDdraws most of the power in the active mode (e.g., com-pare 11 W during activity to 6 W during idleness). Also,in cloud systems, HDDs spend most of the time in theactive mode [17]. Generally speaking, power cappingmay transition the HDD between the active mode andone or more of its low power modes to reduce the averagepower drawn in a period of time. Throttling for instancetransitions the disk between the active and idle modes.This transitioning comes at a performance penalty, whichscales with the depth and frequency the low-power mode
2
USENIX Association 14th USENIX Conference on File and Storage Technologies (FAST ’16) 229
being visited. In contrast, in this work we avoid tran-sitioning between power modes and propose the adjust-ment of the queue size to achieve power capping for thedisk drive in the active mode.
2.3 HDD’s IOQ and NCQ queuesAny block storage device, that is managed by an Operat-ing System (OS), has a respective queue as a part of theOS [14]. The queue serves as space for the I/O schedulerto reorder I/O requests for increased throughputs. Forexample, the Linux OS maintains a queue depth of 128requests by default (in the current Ubuntu distributions).Requests are reordered to optimize for sequentiality onthe HDD. The queue size is adjustable with a minimumsize of 4. We refer to this queue as IOQ in this work.
NCQ stands for Native Command Queuing [5]. It isan extension to the Serial ATA protocol that allows theHDD to internally optimize the order in which requestsare serviced. For instance, the HDD may reorder re-quests depending on its rotational positioning in orderto serve all of them with fewer rotations and thus lesstime. NCQ typically ranges from 1 to 32, where NCQ=1means disabled NCQ.
2.4 Scope of this workWe focus on the storage component of the datacen-ter. Making storage power-aware enables better over-all power provisioning and capping. The share inpower consumption due to storage varies. For exam-ple, in storage-heavy systems, such as the HGST ActiveArchive System [3], 80% of the power is due to the 600HDDs it hosts, whereas in a computing-heavy system,such as the Dell PowerEdge R720 Server, 5-10%. Wepropose a technique to cap power at the disk level. Othertechniques exist that may operate at different levels. Weenvision our technique complementing other techniquesto achieve datacenter-wide power capping. Our tech-nique has potentially wide applicability, since it (1) hasno influence on data availability, (2) works under heavyworkloads (i.e., no idle periods), (3) has no impact onHDD reliability, and (4) enables fine-tuned Watt-ordercapping. It offers three key properties: sensitive to per-formance, non-invasive to the I/O software stack, andsimple to understand and implement (see Section 6).
3 The case for HDD power capping
In this section, we address a merit question: How muchpower can be saved by power capping the HDD?
To this end, we quantify the range of power an HDDdraws when servicing requests, called dynamic power.We discuss the setup we prepared for our studies first.
3.1 Hardware setup
We chose a JBOD setup (Just a Bunch of Disks) to hosta set of HDDs, which are exercised and their poweris measured. The JBOD setup consists of a Dell Pow-erEdge R720 Server connected via LSI 9207-8e HBA toa Supermicro JBOD. It holds 16 3.5” SATA HDDs. Weselected HGST Ultrastar 7K4000 of 4 TB capacity [2],commonly found in cloud storage systems today.
Besides the HGST Ultrastar 7K4000, we have ob-tained a sample HDD from two other HDD vendors.We selected a Seagate 4TB HDD [6] and a WD 4TBHDD [8]. All disks have the same capacity and num-ber of platters, since they share the same storage density(i.e., same generation). We use different disks to ensurethe commonality of our observations as well as the appli-cability of our techniques across different vendors, gen-erations and technologies.
We profile power using WattsUp .NET power me-ters [7]. We use one meter for the JBOD and another forthe server. We interpose between the power supply andthe mains. Since the JBOD is dual corded for high avail-ability, we connect both to an electric strip which in turngoes into the power meter. The meters are connected viaUSB to the server, on which we collect power read-outsfor later analysis. The meters sample power once persecond. This rate should be enough for power capping,since capping is performed on higher time scales [12].
3.2 Software
Our server runs a 64-bit 12.02 Ubuntu Server distribu-tion with the 3.0.8 Linux kernel. No OS data were storedon the disks in the JBODs. Instead, we used a separatedisk for that purpose, which is housed in the server it-self. Unless pointed out otherwise, the default settingsof the I/O stack were kept intact. For example, the filesystems on our disks (XFS in this case) were formattedwith the default settings. The I/O scheduler was kept atthe deadline default scheduler.
We used existing Linux utilities and implemented ourown when needed. Utilities were used to generate work-loads and collect logs of timing performance and power.We installed a WattsUp utility that communicates withthe power meter and logs power read-outs. As for bench-marking, we use the FIO benchmark [10] to generatedifferent workloads. We use FIO for design space ex-ploration. To generate real workloads, we use Mon-goDB [4]. Because the usage of a benchmark varies de-pending on the goal of the experiment, we defer talk-ing about the setup to each individual discussion of ourstudies. For timing performance profiling, we use theiostat Linux utility and benchmark-specific statistics.The collected performance and power logs are then fed
3
230 14th USENIX Conference on File and Storage Technologies (FAST ’16) USENIX Association
(a) Sequential
0
5
10
HDD-A HDD-B HDD-C HDD-D
Pow
er [W
]
Static Dynamic(b) Random
0
5
10
HDD-A HDD-B HDD-C HDD-D
Pow
er [W
]
Static Dynamic
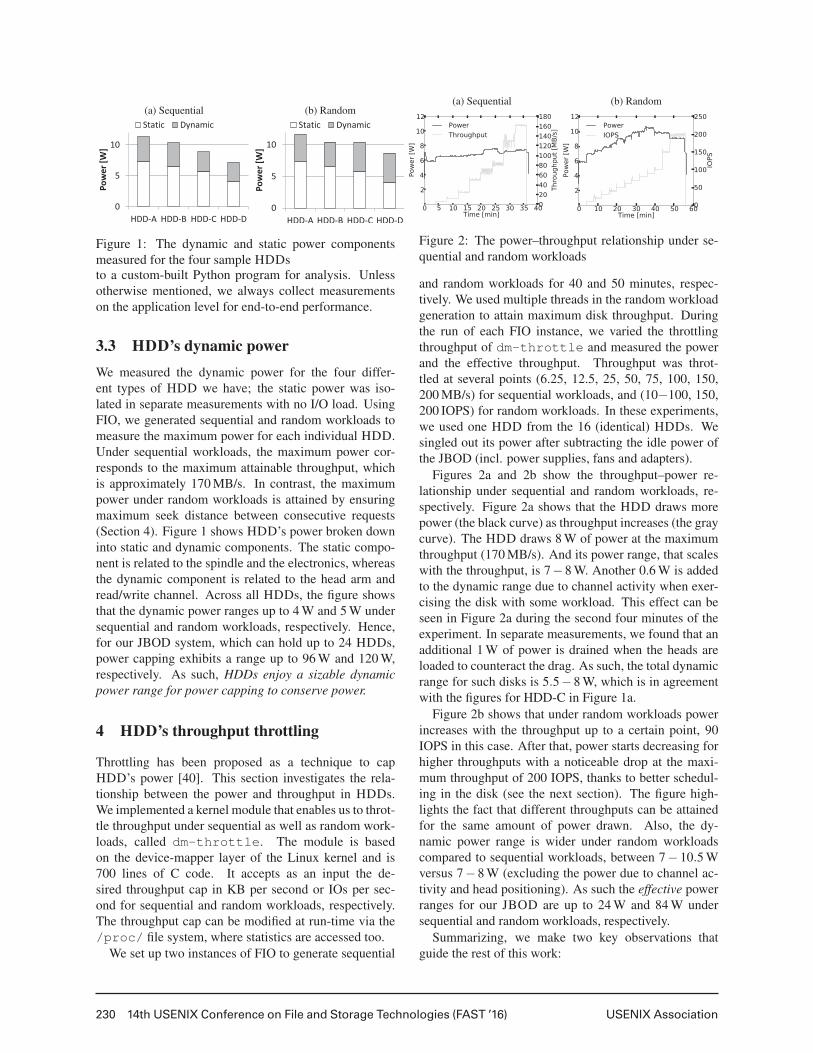
Figure 1: The dynamic and static power componentsmeasured for the four sample HDDsto a custom-built Python program for analysis. Unlessotherwise mentioned, we always collect measurementson the application level for end-to-end performance.
3.3 HDD’s dynamic powerWe measured the dynamic power for the four differ-ent types of HDD we have; the static power was iso-lated in separate measurements with no I/O load. UsingFIO, we generated sequential and random workloads tomeasure the maximum power for each individual HDD.Under sequential workloads, the maximum power cor-responds to the maximum attainable throughput, whichis approximately 170 MB/s. In contrast, the maximumpower under random workloads is attained by ensuringmaximum seek distance between consecutive requests(Section 4). Figure 1 shows HDD’s power broken downinto static and dynamic components. The static compo-nent is related to the spindle and the electronics, whereasthe dynamic component is related to the head arm andread/write channel. Across all HDDs, the figure showsthat the dynamic power ranges up to 4 W and 5 W undersequential and random workloads, respectively. Hence,for our JBOD system, which can hold up to 24 HDDs,power capping exhibits a range up to 96 W and 120 W,respectively. As such, HDDs enjoy a sizable dynamicpower range for power capping to conserve power.
4 HDD’s throughput throttling
Throttling has been proposed as a technique to capHDD’s power [40]. This section investigates the rela-tionship between the power and throughput in HDDs.We implemented a kernel module that enables us to throt-tle throughput under sequential as well as random work-loads, called dm-throttle. The module is basedon the device-mapper layer of the Linux kernel and is700 lines of C code. It accepts as an input the de-sired throughput cap in KB per second or IOs per sec-ond for sequential and random workloads, respectively.The throughput cap can be modified at run-time via the/proc/ file system, where statistics are accessed too.
We set up two instances of FIO to generate sequential
(a) Sequential (b) Random
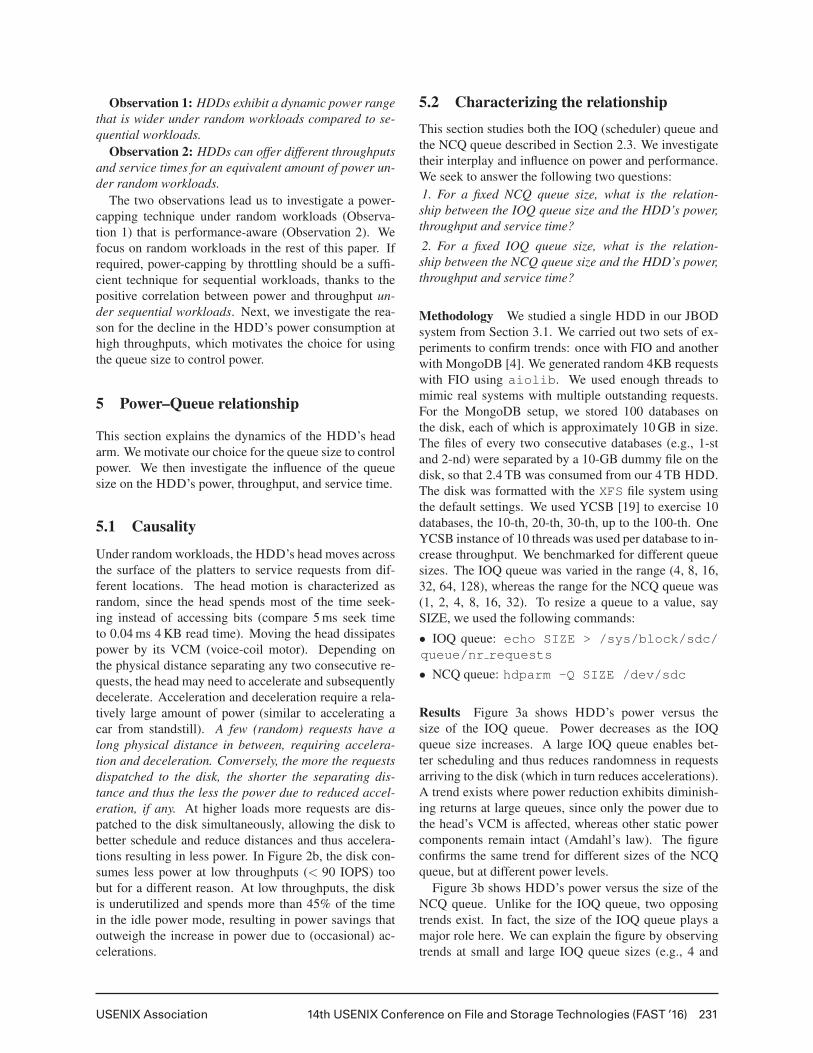
Figure 2: The power–throughput relationship under se-quential and random workloads
and random workloads for 40 and 50 minutes, respec-tively. We used multiple threads in the random workloadgeneration to attain maximum disk throughput. Duringthe run of each FIO instance, we varied the throttlingthroughput of dm-throttle and measured the powerand the effective throughput. Throughput was throt-tled at several points (6.25, 12.5, 25, 50, 75, 100, 150,200 MB/s) for sequential workloads, and (10−100, 150,200 IOPS) for random workloads. In these experiments,we used one HDD from the 16 (identical) HDDs. Wesingled out its power after subtracting the idle power ofthe JBOD (incl. power supplies, fans and adapters).
Figures 2a and 2b show the throughput–power re-lationship under sequential and random workloads, re-spectively. Figure 2a shows that the HDD draws morepower (the black curve) as throughput increases (the graycurve). The HDD draws 8 W of power at the maximumthroughput (170 MB/s). And its power range, that scaleswith the throughput, is 7−8 W. Another 0.6 W is addedto the dynamic range due to channel activity when exer-cising the disk with some workload. This effect can beseen in Figure 2a during the second four minutes of theexperiment. In separate measurements, we found that anadditional 1 W of power is drained when the heads areloaded to counteract the drag. As such, the total dynamicrange for such disks is 5.5−8 W, which is in agreementwith the figures for HDD-C in Figure 1a.
Figure 2b shows that under random workloads powerincreases with the throughput up to a certain point, 90IOPS in this case. After that, power starts decreasing forhigher throughputs with a noticeable drop at the maxi-mum throughput of 200 IOPS, thanks to better schedul-ing in the disk (see the next section). The figure high-lights the fact that different throughputs can be attainedfor the same amount of power drawn. Also, the dy-namic power range is wider under random workloadscompared to sequential workloads, between 7− 10.5 Wversus 7− 8 W (excluding the power due to channel ac-tivity and head positioning). As such the effective powerranges for our JBOD are up to 24 W and 84 W undersequential and random workloads, respectively.
Summarizing, we make two key observations thatguide the rest of this work:
4
USENIX Association 14th USENIX Conference on File and Storage Technologies (FAST ’16) 231
Observation 1: HDDs exhibit a dynamic power rangethat is wider under random workloads compared to se-quential workloads.
Observation 2: HDDs can offer different throughputsand service times for an equivalent amount of power un-der random workloads.
The two observations lead us to investigate a power-capping technique under random workloads (Observa-tion 1) that is performance-aware (Observation 2). Wefocus on random workloads in the rest of this paper. Ifrequired, power-capping by throttling should be a suffi-cient technique for sequential workloads, thanks to thepositive correlation between power and throughput un-der sequential workloads. Next, we investigate the rea-son for the decline in the HDD’s power consumption athigh throughputs, which motivates the choice for usingthe queue size to control power.
5 Power–Queue relationship
This section explains the dynamics of the HDD’s headarm. We motivate our choice for the queue size to controlpower. We then investigate the influence of the queuesize on the HDD’s power, throughput, and service time.
5.1 Causality
Under random workloads, the HDD’s head moves acrossthe surface of the platters to service requests from dif-ferent locations. The head motion is characterized asrandom, since the head spends most of the time seek-ing instead of accessing bits (compare 5 ms seek timeto 0.04 ms 4 KB read time). Moving the head dissipatespower by its VCM (voice-coil motor). Depending onthe physical distance separating any two consecutive re-quests, the head may need to accelerate and subsequentlydecelerate. Acceleration and deceleration require a rela-tively large amount of power (similar to accelerating acar from standstill). A few (random) requests have along physical distance in between, requiring accelera-tion and deceleration. Conversely, the more the requestsdispatched to the disk, the shorter the separating dis-tance and thus the less the power due to reduced accel-eration, if any. At higher loads more requests are dis-patched to the disk simultaneously, allowing the disk tobetter schedule and reduce distances and thus accelera-tions resulting in less power. In Figure 2b, the disk con-sumes less power at low throughputs (< 90 IOPS) toobut for a different reason. At low throughputs, the diskis underutilized and spends more than 45% of the timein the idle power mode, resulting in power savings thatoutweigh the increase in power due to (occasional) ac-celerations.
5.2 Characterizing the relationship
This section studies both the IOQ (scheduler) queue andthe NCQ queue described in Section 2.3. We investigatetheir interplay and influence on power and performance.We seek to answer the following two questions:1. For a fixed NCQ queue size, what is the relation-ship between the IOQ queue size and the HDD’s power,throughput and service time?
2. For a fixed IOQ queue size, what is the relation-ship between the NCQ queue size and the HDD’s power,throughput and service time?
Methodology We studied a single HDD in our JBODsystem from Section 3.1. We carried out two sets of ex-periments to confirm trends: once with FIO and anotherwith MongoDB [4]. We generated random 4KB requestswith FIO using aiolib. We used enough threads tomimic real systems with multiple outstanding requests.For the MongoDB setup, we stored 100 databases onthe disk, each of which is approximately 10 GB in size.The files of every two consecutive databases (e.g., 1-stand 2-nd) were separated by a 10-GB dummy file on thedisk, so that 2.4 TB was consumed from our 4 TB HDD.The disk was formatted with the XFS file system usingthe default settings. We used YCSB [19] to exercise 10databases, the 10-th, 20-th, 30-th, up to the 100-th. OneYCSB instance of 10 threads was used per database to in-crease throughput. We benchmarked for different queuesizes. The IOQ queue was varied in the range (4, 8, 16,32, 64, 128), whereas the range for the NCQ queue was(1, 2, 4, 8, 16, 32). To resize a queue to a value, saySIZE, we used the following commands:
• IOQ queue: echo SIZE > /sys/block/sdc/queue/nr requests
• NCQ queue: hdparm -Q SIZE /dev/sdc
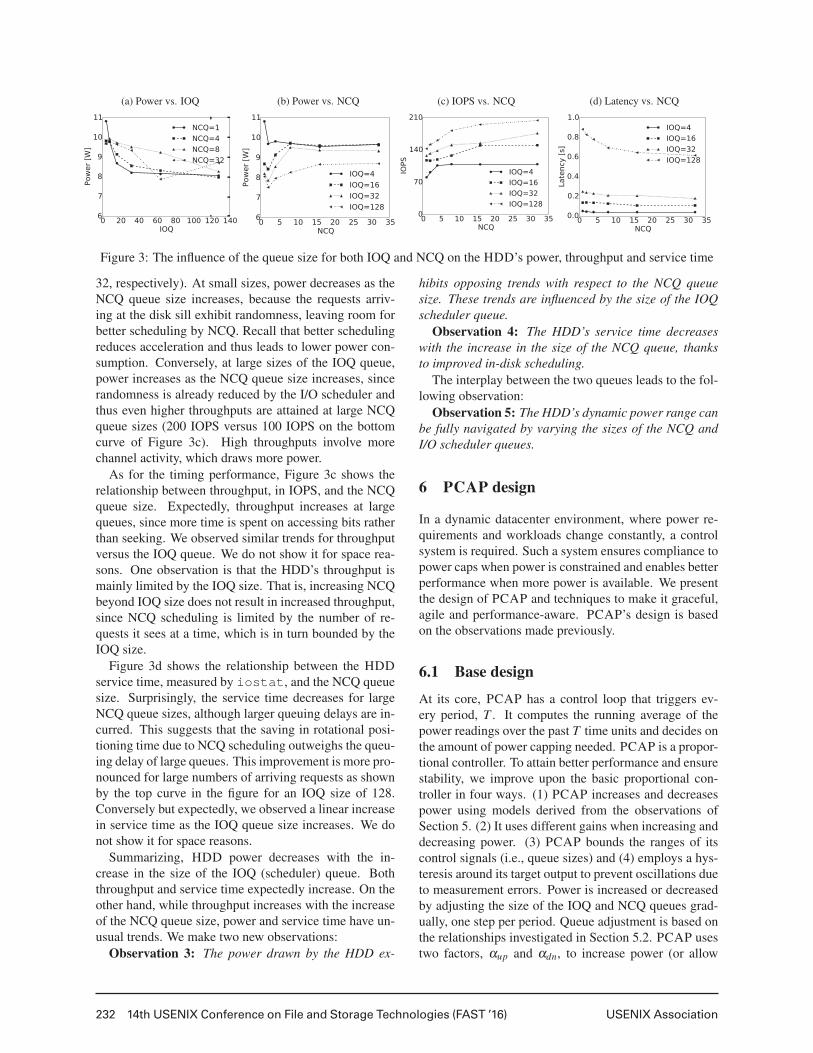
Results Figure 3a shows HDD’s power versus thesize of the IOQ queue. Power decreases as the IOQqueue size increases. A large IOQ queue enables bet-ter scheduling and thus reduces randomness in requestsarriving to the disk (which in turn reduces accelerations).A trend exists where power reduction exhibits diminish-ing returns at large queues, since only the power due tothe head’s VCM is affected, whereas other static powercomponents remain intact (Amdahl’s law). The figureconfirms the same trend for different sizes of the NCQqueue, but at different power levels.
Figure 3b shows HDD’s power versus the size of theNCQ queue. Unlike for the IOQ queue, two opposingtrends exist. In fact, the size of the IOQ queue plays amajor role here. We can explain the figure by observingtrends at small and large IOQ queue sizes (e.g., 4 and
5
232 14th USENIX Conference on File and Storage Technologies (FAST ’16) USENIX Association
(a) Power vs. IOQ (b) Power vs. NCQ (c) IOPS vs. NCQ (d) Latency vs. NCQ
Figure 3: The influence of the queue size for both IOQ and NCQ on the HDD’s power, throughput and service time
32, respectively). At small sizes, power decreases as theNCQ queue size increases, because the requests arriv-ing at the disk sill exhibit randomness, leaving room forbetter scheduling by NCQ. Recall that better schedulingreduces acceleration and thus leads to lower power con-sumption. Conversely, at large sizes of the IOQ queue,power increases as the NCQ queue size increases, sincerandomness is already reduced by the I/O scheduler andthus even higher throughputs are attained at large NCQqueue sizes (200 IOPS versus 100 IOPS on the bottomcurve of Figure 3c). High throughputs involve morechannel activity, which draws more power.
As for the timing performance, Figure 3c shows therelationship between throughput, in IOPS, and the NCQqueue size. Expectedly, throughput increases at largequeues, since more time is spent on accessing bits ratherthan seeking. We observed similar trends for throughputversus the IOQ queue. We do not show it for space rea-sons. One observation is that the HDD’s throughput ismainly limited by the IOQ size. That is, increasing NCQbeyond IOQ size does not result in increased throughput,since NCQ scheduling is limited by the number of re-quests it sees at a time, which is in turn bounded by theIOQ size.
Figure 3d shows the relationship between the HDDservice time, measured by iostat, and the NCQ queuesize. Surprisingly, the service time decreases for largeNCQ queue sizes, although larger queuing delays are in-curred. This suggests that the saving in rotational posi-tioning time due to NCQ scheduling outweighs the queu-ing delay of large queues. This improvement is more pro-nounced for large numbers of arriving requests as shownby the top curve in the figure for an IOQ size of 128.Conversely but expectedly, we observed a linear increasein service time as the IOQ queue size increases. We donot show it for space reasons.
Summarizing, HDD power decreases with the in-crease in the size of the IOQ (scheduler) queue. Boththroughput and service time expectedly increase. On theother hand, while throughput increases with the increaseof the NCQ queue size, power and service time have un-usual trends. We make two new observations:
Observation 3: The power drawn by the HDD ex-
hibits opposing trends with respect to the NCQ queuesize. These trends are influenced by the size of the IOQscheduler queue.
Observation 4: The HDD’s service time decreaseswith the increase in the size of the NCQ queue, thanksto improved in-disk scheduling.
The interplay between the two queues leads to the fol-lowing observation:
Observation 5: The HDD’s dynamic power range canbe fully navigated by varying the sizes of the NCQ andI/O scheduler queues.
6 PCAP design
In a dynamic datacenter environment, where power re-quirements and workloads change constantly, a controlsystem is required. Such a system ensures compliance topower caps when power is constrained and enables betterperformance when more power is available. We presentthe design of PCAP and techniques to make it graceful,agile and performance-aware. PCAP’s design is basedon the observations made previously.
6.1 Base design
At its core, PCAP has a control loop that triggers ev-ery period, T . It computes the running average of thepower readings over the past T time units and decides onthe amount of power capping needed. PCAP is a propor-tional controller. To attain better performance and ensurestability, we improve upon the basic proportional con-troller in four ways. (1) PCAP increases and decreasespower using models derived from the observations ofSection 5. (2) It uses different gains when increasing anddecreasing power. (3) PCAP bounds the ranges of itscontrol signals (i.e., queue sizes) and (4) employs a hys-teresis around its target output to prevent oscillations dueto measurement errors. Power is increased or decreasedby adjusting the size of the IOQ and NCQ queues grad-ually, one step per period. Queue adjustment is based onthe relationships investigated in Section 5.2. PCAP usestwo factors, αup and αdn, to increase power (or allow
6
USENIX Association 14th USENIX Conference on File and Storage Technologies (FAST ’16) 233
(a) PCAP base
0 10 20 30 40 50Time [min]
2
4
6
8
10
12
Pow
er [W
]
Power capActual power1-min power
De lay
(b) Unbounded IOQ (c) Agile PCAP (d) Bounded IOQ
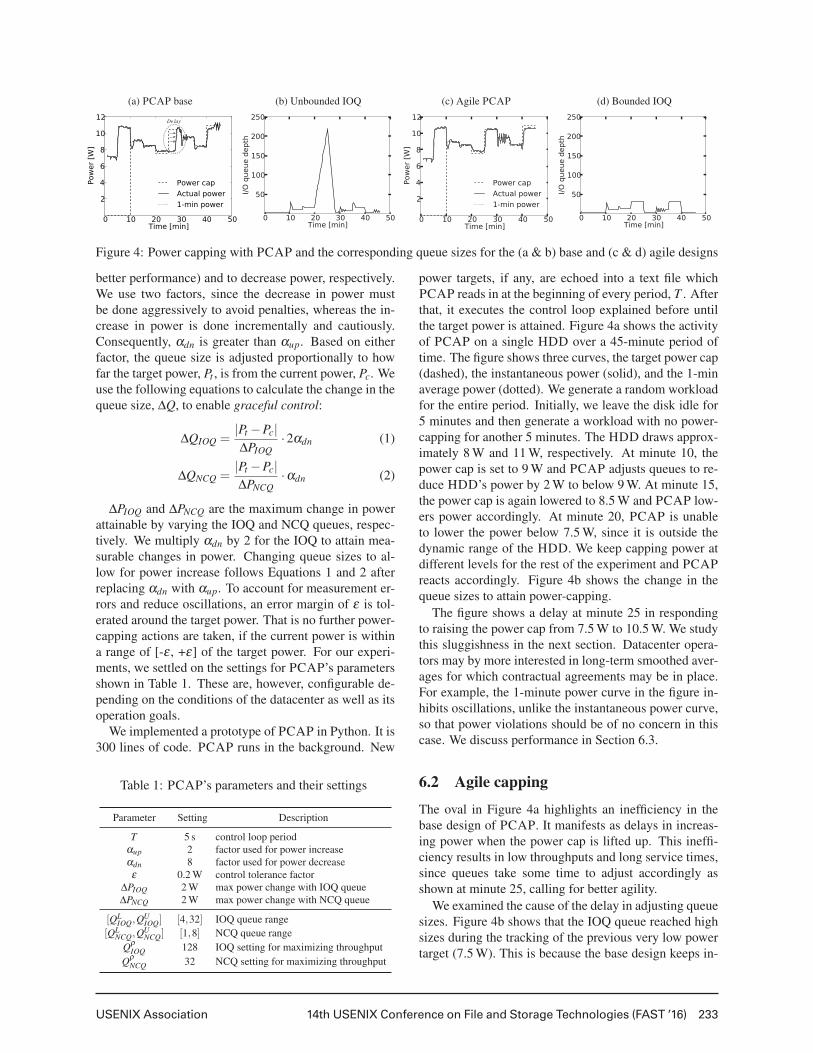
Figure 4: Power capping with PCAP and the corresponding queue sizes for the (a & b) base and (c & d) agile designs
better performance) and to decrease power, respectively.We use two factors, since the decrease in power mustbe done aggressively to avoid penalties, whereas the in-crease in power is done incrementally and cautiously.Consequently, αdn is greater than αup. Based on eitherfactor, the queue size is adjusted proportionally to howfar the target power, Pt , is from the current power, Pc. Weuse the following equations to calculate the change in thequeue size, ΔQ, to enable graceful control:
ΔQIOQ =|Pt −Pc|ΔPIOQ
·2αdn (1)
ΔQNCQ =|Pt −Pc|ΔPNCQ
·αdn (2)
ΔPIOQ and ΔPNCQ are the maximum change in powerattainable by varying the IOQ and NCQ queues, respec-tively. We multiply αdn by 2 for the IOQ to attain mea-surable changes in power. Changing queue sizes to al-low for power increase follows Equations 1 and 2 afterreplacing αdn with αup. To account for measurement er-rors and reduce oscillations, an error margin of ε is tol-erated around the target power. That is no further power-capping actions are taken, if the current power is withina range of [-ε , +ε] of the target power. For our experi-ments, we settled on the settings for PCAP’s parametersshown in Table 1. These are, however, configurable de-pending on the conditions of the datacenter as well as itsoperation goals.
We implemented a prototype of PCAP in Python. It is300 lines of code. PCAP runs in the background. New
Table 1: PCAP’s parameters and their settings
Parameter Setting Description
T 5 s control loop periodαup 2 factor used for power increaseαdn 8 factor used for power decreaseε 0.2 W control tolerance factor
ΔPIOQ 2 W max power change with IOQ queueΔPNCQ 2 W max power change with NCQ queue
[QLIOQ,Q
UIOQ] [4,32] IOQ queue range
[QLNCQ,Q
UNCQ] [1,8] NCQ queue range
QρIOQ 128 IOQ setting for maximizing throughput
QρNCQ 32 NCQ setting for maximizing throughput
power targets, if any, are echoed into a text file whichPCAP reads in at the beginning of every period, T . Afterthat, it executes the control loop explained before untilthe target power is attained. Figure 4a shows the activityof PCAP on a single HDD over a 45-minute period oftime. The figure shows three curves, the target power cap(dashed), the instantaneous power (solid), and the 1-minaverage power (dotted). We generate a random workloadfor the entire period. Initially, we leave the disk idle for5 minutes and then generate a workload with no power-capping for another 5 minutes. The HDD draws approx-imately 8 W and 11 W, respectively. At minute 10, thepower cap is set to 9 W and PCAP adjusts queues to re-duce HDD’s power by 2 W to below 9 W. At minute 15,the power cap is again lowered to 8.5 W and PCAP low-ers power accordingly. At minute 20, PCAP is unableto lower the power below 7.5 W, since it is outside thedynamic range of the HDD. We keep capping power atdifferent levels for the rest of the experiment and PCAPreacts accordingly. Figure 4b shows the change in thequeue sizes to attain power-capping.
The figure shows a delay at minute 25 in respondingto raising the power cap from 7.5 W to 10.5 W. We studythis sluggishness in the next section. Datacenter opera-tors may by more interested in long-term smoothed aver-ages for which contractual agreements may be in place.For example, the 1-minute power curve in the figure in-hibits oscillations, unlike the instantaneous power curve,so that power violations should be of no concern in thiscase. We discuss performance in Section 6.3.
6.2 Agile capping
The oval in Figure 4a highlights an inefficiency in thebase design of PCAP. It manifests as delays in increas-ing power when the power cap is lifted up. This ineffi-ciency results in low throughputs and long service times,since queues take some time to adjust accordingly asshown at minute 25, calling for better agility.
We examined the cause of the delay in adjusting queuesizes. Figure 4b shows that the IOQ queue reached highsizes during the tracking of the previous very low powertarget (7.5 W). This is because the base design keeps in-
7
234 14th USENIX Conference on File and Storage Technologies (FAST ’16) USENIX Association
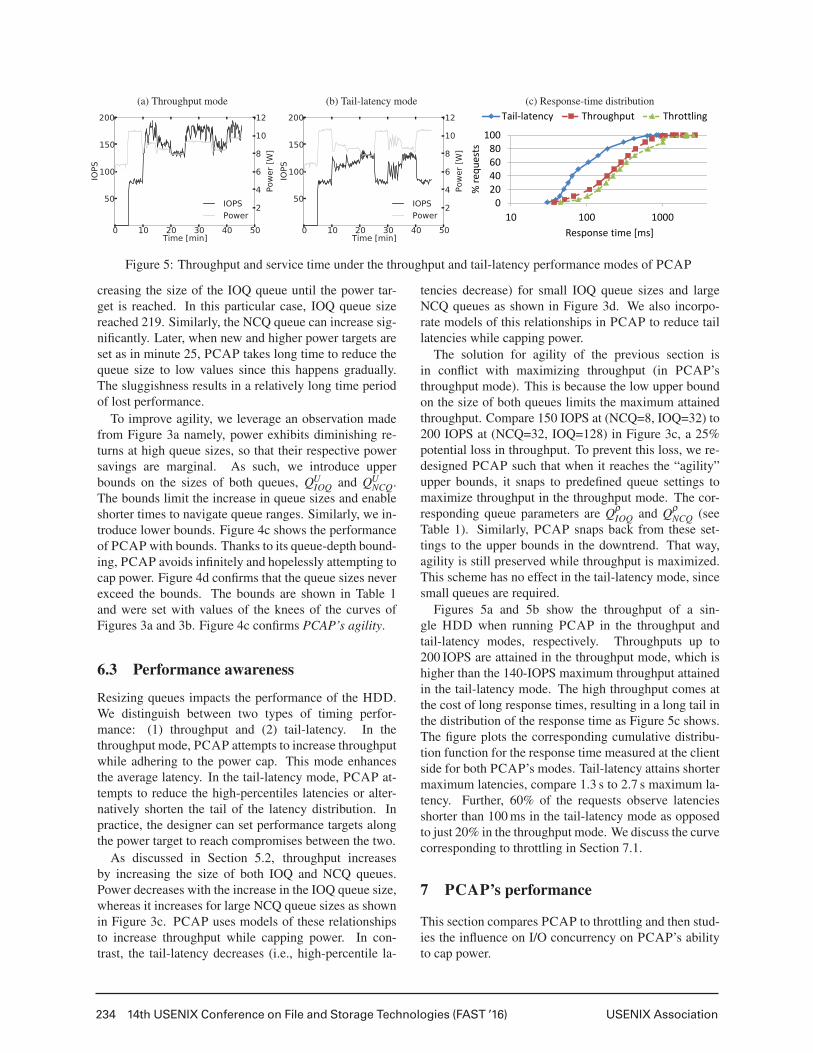
(a) Throughput mode (b) Tail-latency mode (c) Response-time distribution
Figure 5: Throughput and service time under the throughput and tail-latency performance modes of PCAP
creasing the size of the IOQ queue until the power tar-get is reached. In this particular case, IOQ queue sizereached 219. Similarly, the NCQ queue can increase sig-nificantly. Later, when new and higher power targets areset as in minute 25, PCAP takes long time to reduce thequeue size to low values since this happens gradually.The sluggishness results in a relatively long time periodof lost performance.
To improve agility, we leverage an observation madefrom Figure 3a namely, power exhibits diminishing re-turns at high queue sizes, so that their respective powersavings are marginal. As such, we introduce upperbounds on the sizes of both queues, QU
IOQ and QUNCQ.
The bounds limit the increase in queue sizes and enableshorter times to navigate queue ranges. Similarly, we in-troduce lower bounds. Figure 4c shows the performanceof PCAP with bounds. Thanks to its queue-depth bound-ing, PCAP avoids infinitely and hopelessly attempting tocap power. Figure 4d confirms that the queue sizes neverexceed the bounds. The bounds are shown in Table 1and were set with values of the knees of the curves ofFigures 3a and 3b. Figure 4c confirms PCAP’s agility.
6.3 Performance awareness
Resizing queues impacts the performance of the HDD.We distinguish between two types of timing perfor-mance: (1) throughput and (2) tail-latency. In thethroughput mode, PCAP attempts to increase throughputwhile adhering to the power cap. This mode enhancesthe average latency. In the tail-latency mode, PCAP at-tempts to reduce the high-percentiles latencies or alter-natively shorten the tail of the latency distribution. Inpractice, the designer can set performance targets alongthe power target to reach compromises between the two.
As discussed in Section 5.2, throughput increasesby increasing the size of both IOQ and NCQ queues.Power decreases with the increase in the IOQ queue size,whereas it increases for large NCQ queue sizes as shownin Figure 3c. PCAP uses models of these relationshipsto increase throughput while capping power. In con-trast, the tail-latency decreases (i.e., high-percentile la-
tencies decrease) for small IOQ queue sizes and largeNCQ queues as shown in Figure 3d. We also incorpo-rate models of this relationships in PCAP to reduce taillatencies while capping power.
The solution for agility of the previous section isin conflict with maximizing throughput (in PCAP’sthroughput mode). This is because the low upper boundon the size of both queues limits the maximum attainedthroughput. Compare 150 IOPS at (NCQ=8, IOQ=32) to200 IOPS at (NCQ=32, IOQ=128) in Figure 3c, a 25%potential loss in throughput. To prevent this loss, we re-designed PCAP such that when it reaches the “agility”upper bounds, it snaps to predefined queue settings tomaximize throughput in the throughput mode. The cor-responding queue parameters are Qρ
IOQ and QρNCQ (see
Table 1). Similarly, PCAP snaps back from these set-tings to the upper bounds in the downtrend. That way,agility is still preserved while throughput is maximized.This scheme has no effect in the tail-latency mode, sincesmall queues are required.
Figures 5a and 5b show the throughput of a sin-gle HDD when running PCAP in the throughput andtail-latency modes, respectively. Throughputs up to200 IOPS are attained in the throughput mode, which ishigher than the 140-IOPS maximum throughput attainedin the tail-latency mode. The high throughput comes atthe cost of long response times, resulting in a long tail inthe distribution of the response time as Figure 5c shows.The figure plots the corresponding cumulative distribu-tion function for the response time measured at the clientside for both PCAP’s modes. Tail-latency attains shortermaximum latencies, compare 1.3 s to 2.7 s maximum la-tency. Further, 60% of the requests observe latenciesshorter than 100 ms in the tail-latency mode as opposedto just 20% in the throughput mode. We discuss the curvecorresponding to throttling in Section 7.1.
7 PCAP’s performance
This section compares PCAP to throttling and then stud-ies the influence on I/O concurrency on PCAP’s abilityto cap power.
8
USENIX Association 14th USENIX Conference on File and Storage Technologies (FAST ’16) 235
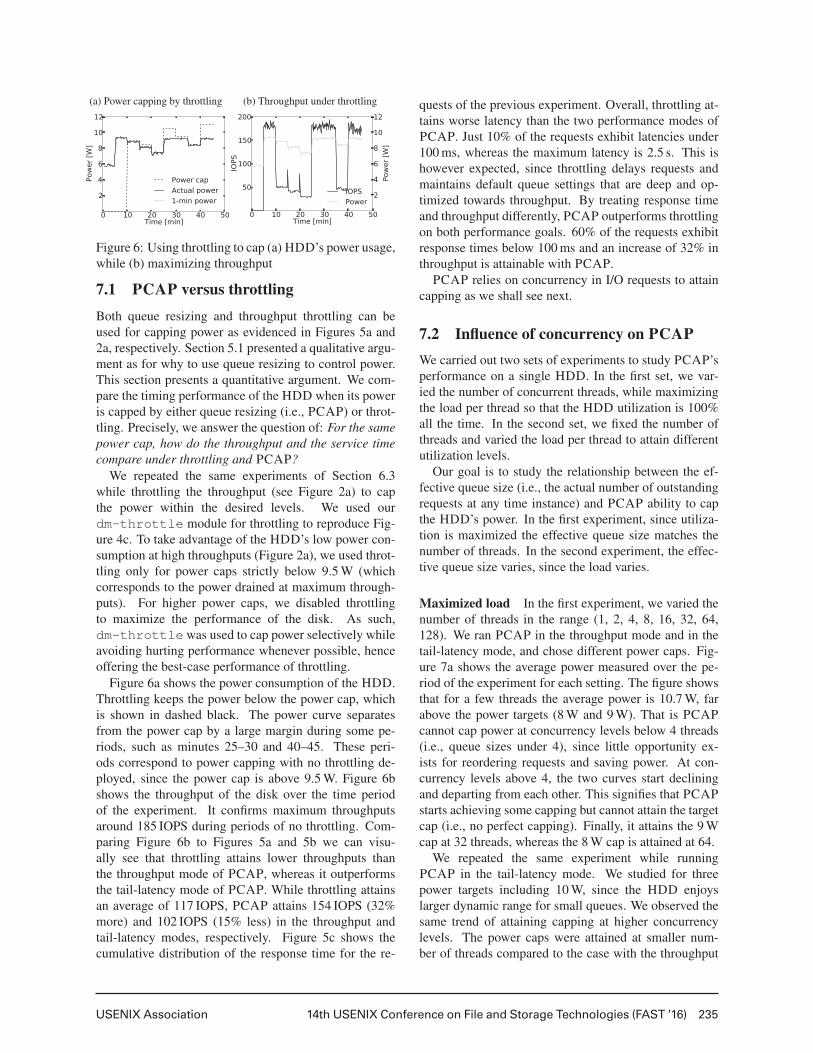
(a) Power capping by throttling (b) Throughput under throttling
Figure 6: Using throttling to cap (a) HDD’s power usage,while (b) maximizing throughput
7.1 PCAP versus throttling
Both queue resizing and throughput throttling can beused for capping power as evidenced in Figures 5a and2a, respectively. Section 5.1 presented a qualitative argu-ment as for why to use queue resizing to control power.This section presents a quantitative argument. We com-pare the timing performance of the HDD when its poweris capped by either queue resizing (i.e., PCAP) or throt-tling. Precisely, we answer the question of: For the samepower cap, how do the throughput and the service timecompare under throttling and PCAP?
We repeated the same experiments of Section 6.3while throttling the throughput (see Figure 2a) to capthe power within the desired levels. We used ourdm-throttle module for throttling to reproduce Fig-ure 4c. To take advantage of the HDD’s low power con-sumption at high throughputs (Figure 2a), we used throt-tling only for power caps strictly below 9.5 W (whichcorresponds to the power drained at maximum through-puts). For higher power caps, we disabled throttlingto maximize the performance of the disk. As such,dm-throttle was used to cap power selectively whileavoiding hurting performance whenever possible, henceoffering the best-case performance of throttling.
Figure 6a shows the power consumption of the HDD.Throttling keeps the power below the power cap, whichis shown in dashed black. The power curve separatesfrom the power cap by a large margin during some pe-riods, such as minutes 25–30 and 40–45. These peri-ods correspond to power capping with no throttling de-ployed, since the power cap is above 9.5 W. Figure 6bshows the throughput of the disk over the time periodof the experiment. It confirms maximum throughputsaround 185 IOPS during periods of no throttling. Com-paring Figure 6b to Figures 5a and 5b we can visu-ally see that throttling attains lower throughputs thanthe throughput mode of PCAP, whereas it outperformsthe tail-latency mode of PCAP. While throttling attainsan average of 117 IOPS, PCAP attains 154 IOPS (32%more) and 102 IOPS (15% less) in the throughput andtail-latency modes, respectively. Figure 5c shows thecumulative distribution of the response time for the re-
quests of the previous experiment. Overall, throttling at-tains worse latency than the two performance modes ofPCAP. Just 10% of the requests exhibit latencies under100 ms, whereas the maximum latency is 2.5 s. This ishowever expected, since throttling delays requests andmaintains default queue settings that are deep and op-timized towards throughput. By treating response timeand throughput differently, PCAP outperforms throttlingon both performance goals. 60% of the requests exhibitresponse times below 100 ms and an increase of 32% inthroughput is attainable with PCAP.
PCAP relies on concurrency in I/O requests to attaincapping as we shall see next.
7.2 Influence of concurrency on PCAPWe carried out two sets of experiments to study PCAP’sperformance on a single HDD. In the first set, we var-ied the number of concurrent threads, while maximizingthe load per thread so that the HDD utilization is 100%all the time. In the second set, we fixed the number ofthreads and varied the load per thread to attain differentutilization levels.
Our goal is to study the relationship between the ef-fective queue size (i.e., the actual number of outstandingrequests at any time instance) and PCAP ability to capthe HDD’s power. In the first experiment, since utiliza-tion is maximized the effective queue size matches thenumber of threads. In the second experiment, the effec-tive queue size varies, since the load varies.
Maximized load In the first experiment, we varied thenumber of threads in the range (1, 2, 4, 8, 16, 32, 64,128). We ran PCAP in the throughput mode and in thetail-latency mode, and chose different power caps. Fig-ure 7a shows the average power measured over the pe-riod of the experiment for each setting. The figure showsthat for a few threads the average power is 10.7 W, farabove the power targets (8 W and 9 W). That is PCAPcannot cap power at concurrency levels below 4 threads(i.e., queue sizes under 4), since little opportunity ex-ists for reordering requests and saving power. At con-currency levels above 4, the two curves start decliningand departing from each other. This signifies that PCAPstarts achieving some capping but cannot attain the targetcap (i.e., no perfect capping). Finally, it attains the 9 Wcap at 32 threads, whereas the 8 W cap is attained at 64.
We repeated the same experiment while runningPCAP in the tail-latency mode. We studied for threepower targets including 10 W, since the HDD enjoyslarger dynamic range for small queues. We observed thesame trend of attaining capping at higher concurrencylevels. The power caps were attained at smaller num-ber of threads compared to the case with the throughput
9
236 14th USENIX Conference on File and Storage Technologies (FAST ’16) USENIX Association
(a) Maximized load (b) Varied load
Figure 7: The influence of I/O concurrency on PCAP’sperformance in capping power for a single HDD
mode. For example, 9 W and 8 W were attained with aslittle as 16 (vs. 32) and 32 (vs. 64) threads, respectively.In addition, for the higher power target of 10 W, PCAPattains the cap starting from 2 threads.
Varied load In this experiment, we pushed load to theHDD progressively while fixing the number of threads.We used 32 threads to ensure power capping with PCAP.Without capping, the load varies between 32 IOPS to200 IOPS. Figure 7b plots the average measured powerversus the utilization level reported by iostat. Thefigure shows that the power is lower than both targets atlow utilization, since the HDD spends a sizable fractionof time idling, thanks to the low load. Observe in such ascenario, throttling is happening “naturally”. At higherutilizations, PCAP perfectly caps the power to below9 W, whereas the 8 W cap is violated for utilization levelsbetween 40–95%. To explain these results, we examinedthe effective queue size (from iostat) versus utiliza-tion. We found that the overshooting over 8 W is due toqueue sizes below 16, where PCAP cannot achieve per-fect capping (see Figure 7a). At higher utilization lev-els, large queues build up which allows PCAP to restorepower to below (or close to) the target as shown for 9 W.
Discussion In summary, PCAP attains perfect powercapping for high concurrency levels, whereas reductionsin power usage are possible for lower levels. The effec-tive concurrency for perfect capping tends to increase asthe desired power cap decreases. We find that PCAPbecomes effective starting from 32 threads. We alsofind that PCAP is ineffective below 4. We believe thisshould not be an immediate concern to the applicabilityof PCAP, since real systems are usually multi-threadedfor performance reasons. As such, chances that little con-currency appears in practice are little. That said, throt-tling can be used in such cases.
8 Putting it all together
This section evaluates PCAP’s performance under dif-ferent workloads. Then, we evaluate it when cappingpower at the system level for an array of HDDs.
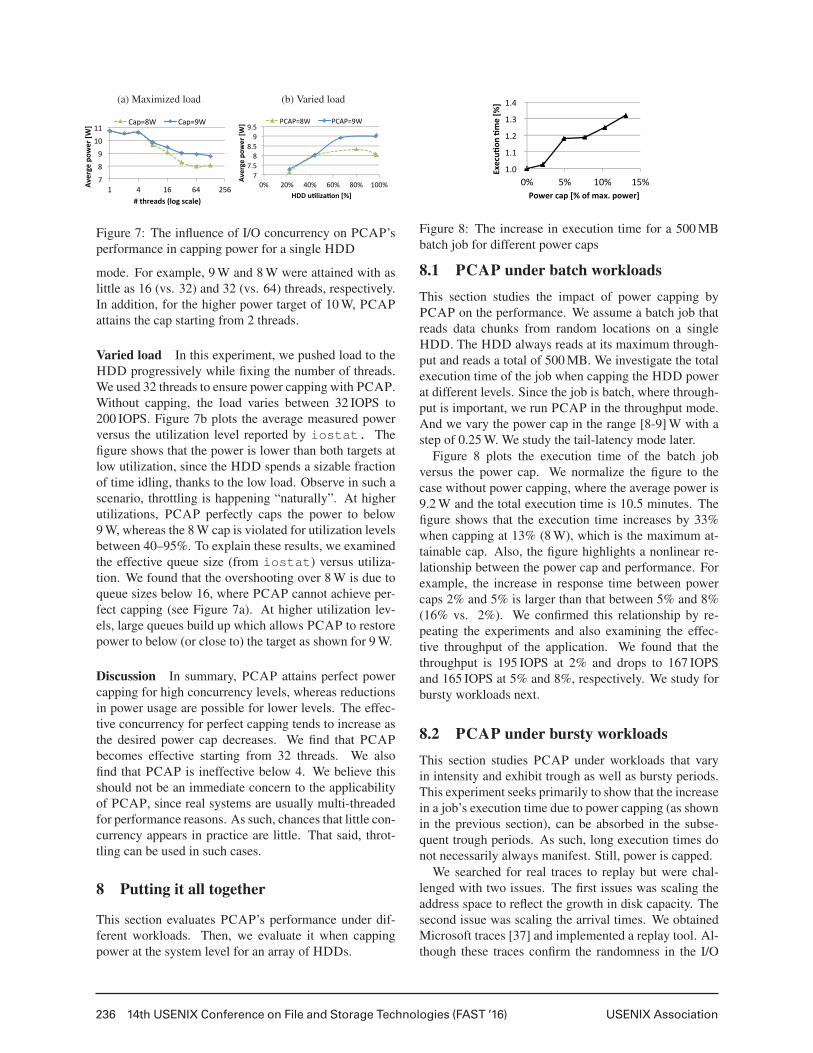
Figure 8: The increase in execution time for a 500 MBbatch job for different power caps
8.1 PCAP under batch workloadsThis section studies the impact of power capping byPCAP on the performance. We assume a batch job thatreads data chunks from random locations on a singleHDD. The HDD always reads at its maximum through-put and reads a total of 500 MB. We investigate the totalexecution time of the job when capping the HDD powerat different levels. Since the job is batch, where through-put is important, we run PCAP in the throughput mode.And we vary the power cap in the range [8-9] W with astep of 0.25 W. We study the tail-latency mode later.
Figure 8 plots the execution time of the batch jobversus the power cap. We normalize the figure to thecase without power capping, where the average power is9.2 W and the total execution time is 10.5 minutes. Thefigure shows that the execution time increases by 33%when capping at 13% (8 W), which is the maximum at-tainable cap. Also, the figure highlights a nonlinear re-lationship between the power cap and performance. Forexample, the increase in response time between powercaps 2% and 5% is larger than that between 5% and 8%(16% vs. 2%). We confirmed this relationship by re-peating the experiments and also examining the effec-tive throughput of the application. We found that thethroughput is 195 IOPS at 2% and drops to 167 IOPSand 165 IOPS at 5% and 8%, respectively. We study forbursty workloads next.
8.2 PCAP under bursty workloadsThis section studies PCAP under workloads that varyin intensity and exhibit trough as well as bursty periods.This experiment seeks primarily to show that the increasein a job’s execution time due to power capping (as shownin the previous section), can be absorbed in the subse-quent trough periods. As such, long execution times donot necessarily always manifest. Still, power is capped.
We searched for real traces to replay but were chal-lenged with two issues. The first issues was scaling theaddress space to reflect the growth in disk capacity. Thesecond issue was scaling the arrival times. We obtainedMicrosoft traces [37] and implemented a replay tool. Al-though these traces confirm the randomness in the I/O
10
USENIX Association 14th USENIX Conference on File and Storage Technologies (FAST ’16) 237
(a) Throughput vs. time (b) Throughput breakdown
Figure 9: (a) PCAP performance under bursty work-loads. The increase in execution time is absorbed, thanksto the trough periods. (b) Throughput is reduced due tocapping and workload components share the cut.
pattern, we found that the address space is in the rangeof 256 GB (vs. our 4 TB HDDs). More importantly, wefound that the traces were taken from a mostly-idle sys-tem, so that high power is not an issue but energy ef-ficiency (see Section 2.1) for which indeed some tech-niques were proposed such as write offloading [37]. Forexample, we needed to scale traces by a factor up to 100in order to see I/O activity, which in turn was not realisticbecause the inherent burstiness of the trace disappeared.We resorted to emulating a real workload.
Our workload is 55-minute long and consists of threeparts. The first part is a constant part which continuouslypushes load to the underlying HDD at a rate of 64 IOPS.The second and third parts are bursts which read 40 MBand 20 MB worth of random data, respectively. They arerepeated 3 times throughout the workload separated bytrough periods, each is 10-minute long. The third burstalways starts 5 minutes after the second one. We repeatedthe experiment 4 times for different power caps: no cap,9 W, 8.5 W, and 8 W. PCAP runs in the throughput mode.
Figure 9a shows the throughput in IOPS for the entireexperiment. We show for the two extreme power set-tings: no cap and 8.0 W to keep the figure readable. Twoobservations can be made. First, the throughput duringbursts decreases for power-capped scenarios, whereas itremains unaffected otherwise since the actual power isbelow the cap. The reduced throughput results in longertimes to finish the burst jobs, which are perfectly ab-sorbed in the subsequent trough periods. Secondly, bothcapping scenarios finish at the exact time of 55 minute.Note that in cases were no trough periods exist, longerexecution times cannot be hidden and the discussion re-duces to that of the previous section.
Figure 9b shows the split of the HDD’s throughputacross the three workload components. We show thesplit for the four power-capping settings. The throughputdrops from 190 IOPS to 170 IOPS. The two bursty partsshare the cut in throughput, 11% and 17%, respectively.
In summary, power capping impacts the performanceof the HDD. In real scenarios, where the total execution
time matters, a system like PCAP can incorporate per-formance as a target to optimize for while performingpower capping. The resultant increase in response timemanifests in high intensity workloads such as batch jobs,whereas it decreases in varying workloads.
8.3 PCAP/S: System-level power capping
This section demonstrates the application of power cap-ping on larger scales with multiple HDDs. We presentPCAP/S, PCAP for a system of HDDs.
PCAP/S builds on PCAP. It borrows the main controlloop of PCAP and works with multiple HDDs. PCAP/Selects HDDs for power capping in a performance-awareway. To mimic real systems, we assume that HDDs aresplit into tiers, which represent different service level ob-jectives (SLOs) as in service-oriented datacenters [35, 1]for instance. PCAP/S’ power capping policy splits intotwo parts: (1) JBOD-level and (2) HDD-level. We chosefor a priority-based strategy for the JBOD-level policy.It elects HDDs from the lower-priority tiers first whenpower must be reduced, whereas higher-priority tiers areelected first when more power is available. HDDs withinthe same tier are treated equally with regards to power in-crease or decrease. This policy strives to reduce perfor-mance penalty for higher-priority tiers. The HDD-levelpart, on the other hand, is exactly that of Section 6, whichresizes queues to attain power capping per HDD.
We studied power capping for the array of HDDs forour JBOD from Section 3.1. We split the 16 HDDs ineach JBOD into three different tiers. The first tier enjoysthe best performance. Both Tier 1 and Tier 2 contain5 HDDs each, whereas Tier 3 has 6. The JBOD itselfconsumes 80 W of power when unloaded (i.e., containsno HDDs). We set PCAP/S’ period, T = 10 s and errormargin, ε = 1 W.
We applied random workloads generated by FIO tothe three tiers over a 55-minute period of time. Differ-ent power caps were used: (200, 190, 185, 170, 195,150, 150, 180, 205 W.) PCAP/S was run in the latencymode. Figure 10a shows the total power differentiatedinto three tiers. Power capping starts at minute 10 witha power cap of 200 W (excl. the static power). PCAP/Sreduces the power below the cap by reducing the con-sumption of Tier 3, the lowest-priority tier. At minute 20,however, the power cap is set at 185 W, which is largerthan the maximum saving attainable by Tier 3. There-fore, Tier 2 takes a cut in power here too, but at a lesserdegree than Tier 3. At minute 25, the power cap is set at170 W, and Tiers 1–3 contribute to the reduction. Whenpower is raised later at minute 30, Tier 1 regains its max-imum power budget, whereas Tier 3 still observes a cutin power. At minute 35, a relatively very low power capof 150 W is set, which is beyond the capping capability
11
238 14th USENIX Conference on File and Storage Technologies (FAST ’16) USENIX Association
(a) PCAP for multiple HDDs (b) Response-time distribution
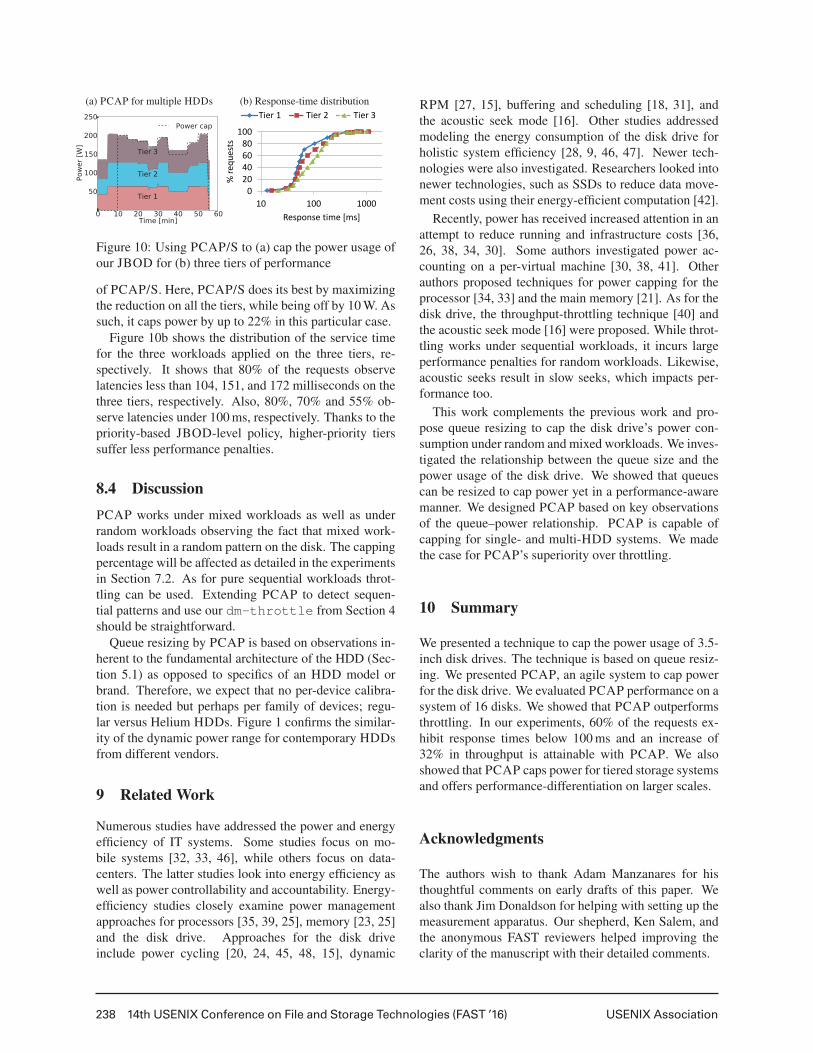
Figure 10: Using PCAP/S to (a) cap the power usage ofour JBOD for (b) three tiers of performance
of PCAP/S. Here, PCAP/S does its best by maximizingthe reduction on all the tiers, while being off by 10 W. Assuch, it caps power by up to 22% in this particular case.
Figure 10b shows the distribution of the service timefor the three workloads applied on the three tiers, re-spectively. It shows that 80% of the requests observelatencies less than 104, 151, and 172 milliseconds on thethree tiers, respectively. Also, 80%, 70% and 55% ob-serve latencies under 100 ms, respectively. Thanks to thepriority-based JBOD-level policy, higher-priority tierssuffer less performance penalties.
8.4 DiscussionPCAP works under mixed workloads as well as underrandom workloads observing the fact that mixed work-loads result in a random pattern on the disk. The cappingpercentage will be affected as detailed in the experimentsin Section 7.2. As for pure sequential workloads throt-tling can be used. Extending PCAP to detect sequen-tial patterns and use our dm-throttle from Section 4should be straightforward.
Queue resizing by PCAP is based on observations in-herent to the fundamental architecture of the HDD (Sec-tion 5.1) as opposed to specifics of an HDD model orbrand. Therefore, we expect that no per-device calibra-tion is needed but perhaps per family of devices; regu-lar versus Helium HDDs. Figure 1 confirms the similar-ity of the dynamic power range for contemporary HDDsfrom different vendors.
9 Related Work
Numerous studies have addressed the power and energyefficiency of IT systems. Some studies focus on mo-bile systems [32, 33, 46], while others focus on data-centers. The latter studies look into energy efficiency aswell as power controllability and accountability. Energy-efficiency studies closely examine power managementapproaches for processors [35, 39, 25], memory [23, 25]and the disk drive. Approaches for the disk driveinclude power cycling [20, 24, 45, 48, 15], dynamic
RPM [27, 15], buffering and scheduling [18, 31], andthe acoustic seek mode [16]. Other studies addressedmodeling the energy consumption of the disk drive forholistic system efficiency [28, 9, 46, 47]. Newer tech-nologies were also investigated. Researchers looked intonewer technologies, such as SSDs to reduce data move-ment costs using their energy-efficient computation [42].
Recently, power has received increased attention in anattempt to reduce running and infrastructure costs [36,26, 38, 34, 30]. Some authors investigated power ac-counting on a per-virtual machine [30, 38, 41]. Otherauthors proposed techniques for power capping for theprocessor [34, 33] and the main memory [21]. As for thedisk drive, the throughput-throttling technique [40] andthe acoustic seek mode [16] were proposed. While throt-tling works under sequential workloads, it incurs largeperformance penalties for random workloads. Likewise,acoustic seeks result in slow seeks, which impacts per-formance too.
This work complements the previous work and pro-pose queue resizing to cap the disk drive’s power con-sumption under random and mixed workloads. We inves-tigated the relationship between the queue size and thepower usage of the disk drive. We showed that queuescan be resized to cap power yet in a performance-awaremanner. We designed PCAP based on key observationsof the queue–power relationship. PCAP is capable ofcapping for single- and multi-HDD systems. We madethe case for PCAP’s superiority over throttling.
10 Summary
We presented a technique to cap the power usage of 3.5-inch disk drives. The technique is based on queue resiz-ing. We presented PCAP, an agile system to cap powerfor the disk drive. We evaluated PCAP performance on asystem of 16 disks. We showed that PCAP outperformsthrottling. In our experiments, 60% of the requests ex-hibit response times below 100 ms and an increase of32% in throughput is attainable with PCAP. We alsoshowed that PCAP caps power for tiered storage systemsand offers performance-differentiation on larger scales.
Acknowledgments
The authors wish to thank Adam Manzanares for histhoughtful comments on early drafts of this paper. Wealso thank Jim Donaldson for helping with setting up themeasurement apparatus. Our shepherd, Ken Salem, andthe anonymous FAST reviewers helped improving theclarity of the manuscript with their detailed comments.
12
USENIX Association 14th USENIX Conference on File and Storage Technologies (FAST ’16) 239
References[1] Amazon S3. http://aws.amazon.com/s3/.
[2] HGST 3.5-inch Enterprise Hard Drive. http://www.hgst.com/hard-drives/enterprise-hard-drives/enterprise-sata-drives/ultrastar-7k4000.
[3] Hgst active archive system. http://www.hgst.com/products/systems/hgst-active-archive-system.
[4] mongoDB. http://www.mongodb.org/.
[5] Native Command Queuing. https://www.sata-io.org/native-command-queuing.
[6] Seagate Enterprise Capacity 3.5 HDD. http://www.seagate.com/internal-hard-drives/enterprise-hard-drives/hdd/enterprise-capacity-3-5-hdd/.
[7] Wattsup .Net power meter. https://www.wattsupmeters.com/secure/products.php?pn=0&wai=0&more=2.
[8] WD Enterprise Re 3.5 HDD. http://www.wdc.com/en/products/products.aspx?id=580.
[9] ALLALOUF, M., ARBITMAN, Y., FACTOR, M., KAT, R. I.,METH, K., AND NAOR, D. Storage modeling for power estima-tion. In Proceedings of SYSTOR 2009: The Israeli ExperimentalSystems Conference (New York, NY, USA, 2009), SYSTOR’09,ACM, pp. 3:1–3:10.
[10] AXBOE, J. FIO benchmark. http://freecode.com/projects/fio.
[11] BARROSO, L. A. The price of performance. ACM Queue 3, 7(Sept. 2005), 48–53.
[12] BARROSO, L. A., CLIDARAS, J., AND HOLZLE, U. TheDatacenter as a Computer: An Introduction to the Design ofWarehouse-Scale Machines, Second edition, vol. 8. 2013.
[13] BARROSO, L. A., DEAN, J., AND HOLZLE, U. Web Search fora Planet: The Google Cluster Architecture. IEEE Micro 23, 2(Mar. 2003), 22–28.
[14] BOVET, D., AND CESATI, M. Understanding The Linux Kernel.Oreilly & Associates Inc, 2005.
[15] CARRERA, E. V., PINHEIRO, E., AND BIANCHINI, R. Con-serving disk energy in network servers. In Proceedings of the17th Annual International Conference on Supercomputing (NewYork, NY, USA, 2003), ICS’03, ACM, pp. 86–97.
[16] CHEN, D., GOLDBERG, G., KAHN, R., KAT, R. I., AND METH,K. Leveraging disk drive acoustic modes for power management.In Proceedings of the 2010 IEEE 26th Symposium on Mass Stor-age Systems and Technologies (Washington, DC, USA, 2010),MSST’10, IEEE Computer Society, pp. 1–9.
[17] CHEN, Y., ALSPAUGH, S., BORTHAKUR, D., AND KATZ, R.Energy efficiency for large-scale mapreduce workloads with sig-nificant interactive analysis. In Proceedings of the 7th ACM eu-ropean conference on Computer Systems (New York, NY, USA,2012), EuroSys ’12, ACM, pp. 43–56.
[18] CHOI, J., WON, Y., AND NAM, S. W. Power conscious diskscheduling for multimedia data retrieval. In Proceedings of the2nd International Conference on Advances in Information Sys-tems (2002), ADVIS’02, pp. 336–345.
[19] COOPER, B. F., SILBERSTEIN, A., TAM, E., RAMAKRISH-NAN, R., AND SEARS, R. Benchmarking Cloud Serving Sys-tems with YCSB. In Proceedings of the 1st ACM Symposium onCloud Computing (New York, NY, USA, 2010), SoCC’10, ACM,pp. 143–154.
[20] CRAVEN, M., AND AMER, A. Predictive Reduction of Powerand Latency (PuRPLe). In Proceedings of the 22nd IEEE / 13thNASA Goddard Conference on Mass Storage Systems and Tech-nologies (2005), MSST’05, pp. 237–244.
[21] DAVID, H., GORBATOV, E., HANEBUTTE, U. R., KHANNA,R., AND LE, C. RAPL: Memory power estimation and capping.In Proceedings of 2010 ACM/IEEE International Symposium onLow-Power Electronics and Design (Aug 2010), ISLPED’10,pp. 189–194.
[22] DEAN, J., AND BARROSO, L. A. The Tail at Scale. Communi-cations of the ACM 56 (2013), 74–80.
[23] DENG, Q., MEISNER, D., RAMOS, L., WENISCH, T. F., ANDBIANCHINI, R. Memscale: Active low-power modes for mainmemory. In Proceedings of the Sixteenth International Confer-ence on Architectural Support for Programming Languages andOperating Systems (New York, NY, USA, 2011), ASPLOS XVI,ACM, pp. 225–238.
[24] DOUGLIS, F., KRISHNAN, P., AND MARSH, B. Thwarting thepower-hungry disk. In Proceedings of the USENIX Winter 1994Technical Conference (Berkeley, CA, USA, 1994), WTEC’94,USENIX Association, pp. 293–306.
[25] FAN, X., ELLIS, C. S., AND LEBECK, A. R. The synergy be-tween power-aware memory systems and processor voltage scal-ing. In Proceedings of the Third International Conference onPower - Aware Computer Systems (Berlin, Heidelberg, 2004),PACS’03, Springer-Verlag, pp. 164–179.
[26] FAN, X., WEBER, W.-D., AND BARROSO, L. A. Power pro-visioning for a warehouse-sized computer. In Proceedings of the34th Annual International Symposium on Computer Architecture(New York, NY, USA, 2007), ISCA’07, ACM, pp. 13–23.
[27] GURUMURTHI, S., SIVASUBRAMANIAM, A., KANDEMIR, M.,AND FRANKE, H. DRPM: dynamic speed control for powermanagement in server class disks. In Proceedings of the 30th An-nual International Symposium on Computer Architecture (NewYork, NY, USA, 2003), ISCA’03, ACM, pp. 169–181.
[28] HYLICK, A., SOHAN, R., RICE, A., AND JONES, B. An analy-sis of hard drive energy consumption. In Proceedings of the 16thAnnual Meeting of the IEEE International Symposium on Mod-eling, Analysis, and Simulation of Computer and Telecommuni-cation Systems, MASCOTS’08 (2008), IEEE Computer Society,pp. 103–112.
[29] IV, W. T., SEADER, J., AND BRILL, K. Tier classifications de-fine site infrastructure performance. The Uptime Institute, WhitePaper (2006).
[30] KANSAL, A., ZHAO, F., LIU, J., KOTHARI, N., AND BHAT-TACHARYA, A. A. Virtual machine power metering and pro-visioning. In Proceedings of the 1st ACM Symposium onCloud Computing (New York, NY, USA, 2010), SoCC’10, ACM,pp. 39–50.
[31] KHATIB, M. G., VAN DER ZWAAG, B. J., HARTEL, P. H., ANDSMIT, G. J. M. Interposing Flash between Disk and DRAM toSave Energy for Streaming Workloads. In IEEE/ACM/IFIP Work-shop on Embedded Systems for Real-Time Multimedia, 2007. ES-TIMedia 2007 (Oct 2007), pp. 7–12.
[32] KIM, H., AGRAWAL, N., AND UNGUREANU, C. Revisitingstorage for smartphones. In Proceedings of the 10th USENIXConference on File and Storage Technologies (Berkeley, CA,USA, 2012), FAST’12, USENIX Association, pp. 209–222.
[33] LI, J., BADAM, A., CHANDRA, R., SWANSON, S., WOR-THINGTON, B., AND ZHANG, Q. On the Energy Overhead ofMobile Storage Systems. In Proceedings of the 12th USENIXConference on File and Storage Technologies (Santa Clara, CA,2014), FAST’14, USENIX Association, pp. 105–118.
13
240 14th USENIX Conference on File and Storage Technologies (FAST ’16) USENIX Association
[34] LIM, H., KANSAL, A., AND LIU, J. Power budgeting for vir-tualized data centers. In Proceedings of the 2011 USENIX Con-ference on Annual Technical Conference (Berkeley, CA, USA,2011), ATC’11, USENIX Association, pp. 59–72.
[35] LO, D., CHENG, L., GOVINDARAJU, R., BARROSO, L. A.,AND KOZYRAKIS, C. Towards Energy Proportionality for Large-scale Latency-critical Workloads. In Proceeding of the 41st An-nual International Symposium on Computer Architecuture (Pis-cataway, NJ, USA, 2014), ISCA’14, IEEE Press, pp. 301–312.
[36] MEISNER, D., SADLER, C. M., BARROSO, L. A., WEBER,W.-D., AND WENISCH, T. F. Power management of onlinedata-intensive services. In Proceedings of the 38th Annual Inter-national Symposium on Computer Architecture (New York, NY,USA, 2011), ISCA’11, ACM, pp. 319–330.
[37] NARAYANAN, D., DONNELLY, A., AND ROWSTRON, A. Writeoff-loading: Practical power management for enterprise storage.Trans. Storage 4, 3 (Nov. 2008), 10:1–10:23.
[38] RAGHAVENDRA, R., RANGANATHAN, P., TALWAR, V., WANG,Z., AND ZHU, X. No “power” struggles: Coordinated multi-levelpower management for the data center. In Proceedings of the 13thInternational Conference on Architectural Support for Program-ming Languages and Operating Systems (New York, NY, USA,2008), ASPLOS XIII, ACM, pp. 48–59.
[39] RAJAMANI, K., LEFURGY, C., GHIASI, S., RUBIO, J., HAN-SON, H., AND KELLER, T. Power management solutionsfor computer systems and datacenters. In Proceedings of theACM/IEEE International Symposium on Low Power Electronicsand Design (Aug 2008), ISLPED’08, pp. 135–136.
[40] STOESS, J., LANG, C., AND BELLOSA, F. Energy manage-ment for hypervisor-based virtual machines. In Proceedings ofthe USENIX Annual Technical Conference (Berkeley, CA, USA,2007), ATC’07, USENIX Association, pp. 1:1–1:14.
[41] THERESKA, E., DONNELLY, A., AND NARAYANAN, D. Sierra:practical power-proportionality for data center storage. In Pro-ceedings of the sixth conference on Computer systems (New York,NY, USA, 2011), EuroSys’11, ACM, pp. 169–182.
[42] TIWARI, D., VAZHKUDAI, S. S., KIM, Y., MA, X., BOBOILA,S., AND DESNOYERS, P. J. Reducing Data Movement Costs Us-ing Energy-Efficient, Active Computation on SSD. In Presentedas part of the 2012 Workshop on Power-Aware Computing andSystems (Berkeley, CA, 2012), USENIX.
[43] VERMA, A., KOLLER, R., USECHE, L., AND RANGASWAMI,R. SRCMap: energy proportional storage using dynamic consol-idation. In Proceedings of the 8th USENIX conference on Fileand storage technologies (Berkeley, CA, USA, 2010), FAST’10,USENIX Association, pp. 267–280.
[44] WEDDLE, C., OLDHAM, M., QIAN, J., WANG, A.-I. A., REI-HER, P., AND KUENNING, G. PARAID: A gear-shifting power-aware RAID. Trans. Storage 3, 3 (Oct 2007).
[45] XU, L., CIPAR, J., KREVAT, E., TUMANOV, A., GUPTA, N.,KOZUCH, M. A., AND GANGER, G. R. SpringFS: BridgingAgility and Performance in Elastic Distributed Storage. In Pro-ceedings of the 12th USENIX conference on File and storagetechnologies (Berkeley, CA, USA, 2014), FAST’14, USENIXAssociation, pp. 243–256.
[46] ZEDLEWSKI, J., SOBTI, S., GARG, N., ZHENG, F., KRISHNA-MURTHY, A., AND WANG, R. Modeling hard-disk power con-sumption. In Proceedings of the 2nd USENIX Conference on Fileand Storage Technologies (Berkeley, CA, USA, 2003), FAST’03,USENIX Association, pp. 217–230.
[47] ZHANG, Y., GURUMURTHI, S., AND STAN, M. R. SODA: Sen-sitivity Based Optimization of Disk Architecture. In Proceedingsof the 44th Annual Design Automation Conference (New York,NY, USA, 2007), DAC’07, ACM, pp. 865–870.
[48] ZHU, Q., CHEN, Z., TAN, L., ZHOU, Y., KEETON, K., ANDWILKES, J. Hibernator: helping disk arrays sleep through thewinter. In Proceedings of the twentieth ACM symposium on Oper-ating systems principles (New York, NY, USA, 2005), SOSP’05,ACM, pp. 177–190.
14


![PCAP: Performance-Aware Power Capping for … types of datacenters 3 Luiz A. Barrosoet al. [The Datacenter as a Computer, 2013] The average activity distribution of a sample of 2 Google](https://img.pdfslide.us/doc/110x75/5b83370b7f8b9a940b8c9fcb/pcap-performance-aware-power-capping-for-types-of-datacenters-3-luiz-a-barrosoet.jpg)