Embed Size (px)
Citation preview

E N V I R O N M E N T A L P R O D U C T D E C L A R A T I O N
PORTLAND CEMENT
(per ASTM C219 and specified in ASTM C150, ASTM C1157, AASHTO M 85, or CSA A3001)

ENVIRONMENTAL PRODUCT DECLARATION PORTLAND CEMENT
2
ASTM Certification page This document is a Type III industry-average Environmental Product Declaration (EPD) describing portland cements produced in the United States (US) by Portland Cement Association (PCA) members. The results of the underlying LCA are computed with the North American (N.A.) version of the Global Cement and Concrete Association (GCCA) Industry EPD tool for cement and concrete [4]. This tool and the underlying LCA model and database have been previously verified to conform to the prevailing sub-product category rule (PCR) [11], ISO 21930:2017 (the core PCR) [10] as well as ISO 14025:2006 [7] and ISO 14040/44:2006 Amd: 2020 LCA standards [8], [9]. This EPD is certified by ASTM to conform to the Sub-Product Category Rule (PCR) referenced below, as well as to the requirements of ISO 14025 and ISO 21930.
DECLARATION HOLDER
Portland Cement Association 5420 Old Orchard Road Skokie, IL, USA 60077-1083 www.cement.org
DECLARATION NUMBER EPD 195
PRODUCT GROUP AND NAME Cement, UN CPC 3744
DECLARED PRODUCT Portland cement(s) as a category product
REFERENCE PCR
NSF Product Category Rule for Preparing an Environmental Product Declaration for Portland, Blended Hydraulic, Masonry, Mortar, and Plastic (Stucco) Cements. V3.1, September 2020.
PROGRAM OPERATOR
ASTM International 100 Barr Harbor Drive West Conshohocken, PA, USA 19428-2959 www.astm.org
DATE OF ISSUE 03-12-2021 PERIOD OF VALIDITY 03-12-2021- 03-12-2026
NOTES The EPD results are computed using the N.A. version of GCCA Industry EPD tool for Cement and Concrete (https://concrete-epd-tool.org ).
ENVIRONMENTAL PRODUCT DECLARATION PORTLAND CEMENT
3
EPD VERIFICATION
This EPD has been certified by an independent, external verifier in accordance with ISO 14025.
Tim Brooke ASTM International
Date verified
Thomas P. Gloria, Ph. D. Industrial Ecology Consultants
Date verified
Product description and applicable standards The product under evaluation is portland cement as defined by ASTM C219 and specified in ASTM C150, ASTM C1157, AASHTO M 85 or CSA A3001. A hydraulic cement produced by pulverizing clinker, consisting essentially of crystalline hydraulic calcium silicates, and usually containing one or more of the following: water, calcium sulfate, up to 5% limestone, and processing additions. (ASTM C219) As a cement category portland cements have various properties, as follows: Type I – normal, no special properties required Type II – moderate sulfate resistant Type III – high early strength Type IV – low heat hydration Type V – high sulfate resistance Some cements are designated with a combined type classification, such as Type I/II, indicating that the cement meets the requirements of the indicated types and is being offered as suitable for use when either type is desired. All cement products are composed of specific combinations of calcium, silica, iron and alumina and small amounts of additives to achieve a desired profile of properties (e.g., strength, color). Clinker, the principle intermediate manufactured product within cement production, is typically produced from a combination of ingredients, including limestone (for calcium), coupled with smaller quantities of materials such as clay, iron ore, and sand (as sources of alumina, iron, and silica, respectively). So common are these building blocks that a wide variety of raw materials are suitable sources, and some sources, such clay and fly ash, may provide multiple chemical components. Cement plants are increasingly turning to industrial byproducts that otherwise would be discarded, once completing detailed analyses
ENVIRONMENTAL PRODUCT DECLARATION PORTLAND CEMENT
4
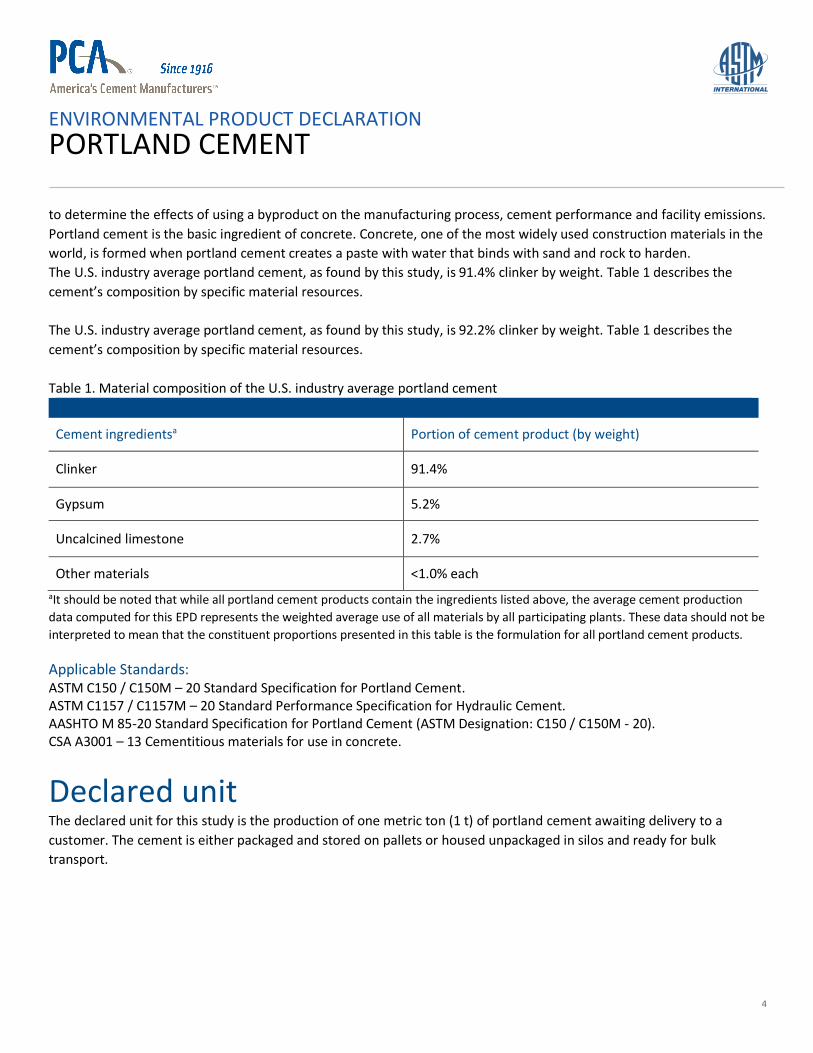
to determine the effects of using a byproduct on the manufacturing process, cement performance and facility emissions. Portland cement is the basic ingredient of concrete. Concrete, one of the most widely used construction materials in the world, is formed when portland cement creates a paste with water that binds with sand and rock to harden. The U.S. industry average portland cement, as found by this study, is 91.4% clinker by weight. Table 1 describes the cement’s composition by specific material resources. The U.S. industry average portland cement, as found by this study, is 92.2% clinker by weight. Table 1 describes the cement’s composition by specific material resources. Table 1. Material composition of the U.S. industry average portland cement
Cement ingredientsa Portion of cement product (by weight)
Clinker 91.4%
Gypsum 5.2%
Uncalcined limestone 2.7%
Other materials <1.0% each aIt should be noted that while all portland cement products contain the ingredients listed above, the average cement production data computed for this EPD represents the weighted average use of all materials by all participating plants. These data should not be interpreted to mean that the constituent proportions presented in this table is the formulation for all portland cement products. Applicable Standards: ASTM C150 / C150M – 20 Standard Specification for Portland Cement. ASTM C1157 / C1157M – 20 Standard Performance Specification for Hydraulic Cement. AASHTO M 85-20 Standard Specification for Portland Cement (ASTM Designation: C150 / C150M - 20). CSA A3001 – 13 Cementitious materials for use in concrete.
Declared unit The declared unit for this study is the production of one metric ton (1 t) of portland cement awaiting delivery to a customer. The cement is either packaged and stored on pallets or housed unpackaged in silos and ready for bulk transport.

ENVIRONMENTAL PRODUCT DECLARATION PORTLAND CEMENT
5
System boundary Life cycle stages This EPD describes portland cement production from cradle-to-gate, as depicted in Figure 1. This includes all modules (A1-A3) of the Production stage, as defined by the PCR. Specifically, Production stage modules capture the following aspects of the life cycle:
• Extraction and processing of raw materials and packaging used to produce cement (A1); • Transportation of raw materials and packaging from source to cement production site (A2); • Consumption of energy and water required to produce cement (A3); • Emissions and wastes generated from producing cement(A3); • Transportation of wastes from cement production to end-of-life (A3); and • End-of-life of wastes generated during cement production (A3).
The Construction, Use and End-of-life stages are excluded from the scope of the PCR and therefore from the impact results provided by this EPD.
Figure 1. Boundary of the industry-average cement production processes.

ENVIRONMENTAL PRODUCT DECLARATION PORTLAND CEMENT
6
Exclusions and cut-off criteria Several items are excluded from the foreground life cycle inventories (LCIs) used in the LCA. These relate specifically to operations at cement production plants:
Capital equipment and infrastructure. These are expected to contribute negligibly (<1%) to the total impact of cement production given the long lifetime of these items and high output of cement over this period. Personnel-related activities, such as travel, furniture and office supplies. (Energy and water use related to on-site office operations, such as company management and sales activities, are included.)
These two categories of items are included in upstream processes (e.g., electricity generation) where they are captured in the background data used in the LCA underlying GCCA Industry EPD tool.
Allocation approach Allocation of inventory flows and subsequently environmental impact is relevant when assets are shared between product systems. The allocation method prescribed by the PCR is applied in the underlying LCA. The sub-category PCR recognizes fly ash, furnace bottom ash, bypass dust, mill scale, polluted soils, spent catalyst, aluminum oxide waste, silica fume, granulated blast furnace slag, iron rich waste, cement kiln dust (CKD), flue gas desulfurization (FGD) gypsum, calcium fluoride rich waste and postconsumer gypsum as recovered materials and thus, the environmental impacts allocated to these materials are limited to the treatment and transportation required to use as a cement material input. Further, used tires, plastics, solvents, used oil and oily waste, coal/carbon waste, roofing asphalt, household refuse-derived waste, non-hazardous liquid waste, industrial sludge, and agricultural waste are considered non-renewable and/or renewable secondary fuels. Only the materials, water, energy, emissions, and other elemental flows associated with reprocessing, handling, sorting and transportation from the point of the generating industrial process to their use in the production process are considered. All emissions from combustion at the point of use are considered. For co-products, no credit is considered, and no allocation is applied. See the LCA model and LCA database reports of the N.A. version of GCCA’s Industry Tool for EPDs of cement and concrete for more information [4], [5].
Data Quality Requirements and Assessment Technology Coverage The life cycle impact assessment (LCIA) results presented in this EPD are calculated using an industry-average LCI of US PCA members producing portland cement. The LCI is assembled with data shared by PCA members through a survey process carried out in 2020 and represents 2019 operations. Primary (gate-to-gate activity) data were collected for limestone quarrying, clinker production and portland cement manufacture. Data collection and aggregation methods are described in the Portland Cement Association Life Cycle Inventory Summary Report, February 2021 [3].
ENVIRONMENTAL PRODUCT DECLARATION PORTLAND CEMENT
7
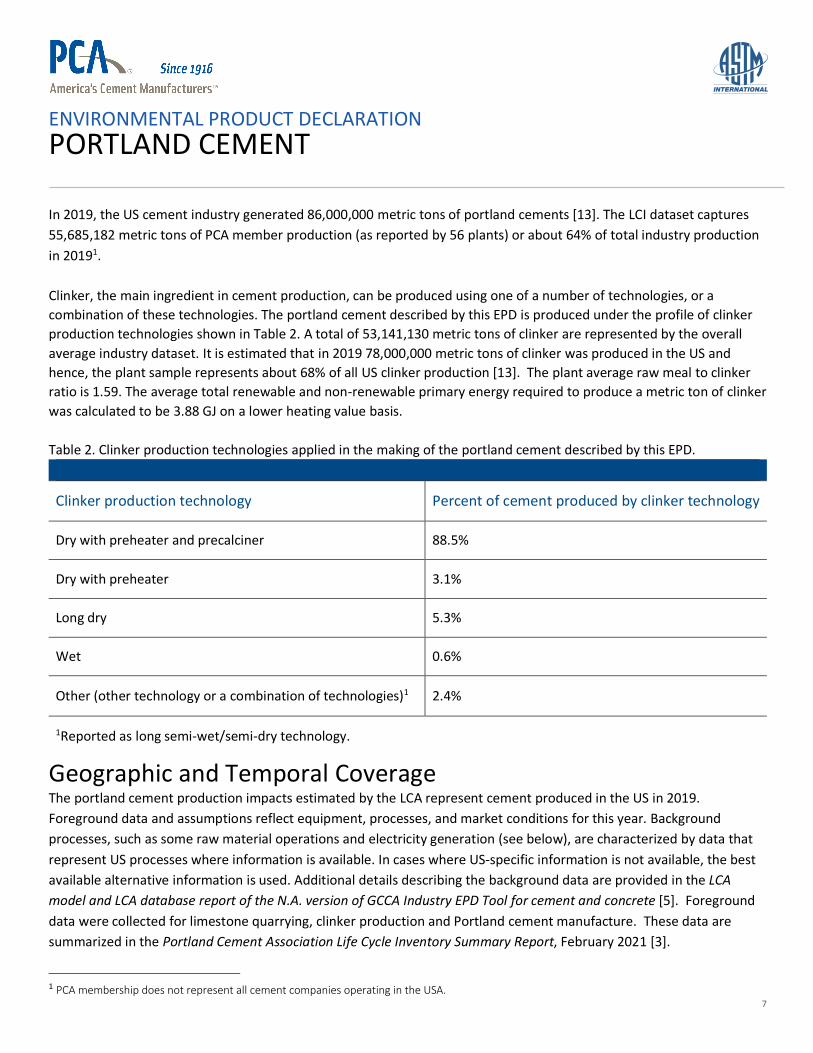
In 2019, the US cement industry generated 86,000,000 metric tons of portland cements [13]. The LCI dataset captures 55,685,182 metric tons of PCA member production (as reported by 56 plants) or about 64% of total industry production in 20191. Clinker, the main ingredient in cement production, can be produced using one of a number of technologies, or a combination of these technologies. The portland cement described by this EPD is produced under the profile of clinker production technologies shown in Table 2. A total of 53,141,130 metric tons of clinker are represented by the overall average industry dataset. It is estimated that in 2019 78,000,000 metric tons of clinker was produced in the US and hence, the plant sample represents about 68% of all US clinker production [13]. The plant average raw meal to clinker ratio is 1.59. The average total renewable and non-renewable primary energy required to produce a metric ton of clinker was calculated to be 3.88 GJ on a lower heating value basis. Table 2. Clinker production technologies applied in the making of the portland cement described by this EPD.
Clinker production technology Percent of cement produced by clinker technology
Dry with preheater and precalciner 88.5%
Dry with preheater 3.1%
Long dry 5.3%
Wet 0.6%
Other (other technology or a combination of technologies)1 2.4%
1Reported as long semi-wet/semi-dry technology.
Geographic and Temporal Coverage The portland cement production impacts estimated by the LCA represent cement produced in the US in 2019. Foreground data and assumptions reflect equipment, processes, and market conditions for this year. Background processes, such as some raw material operations and electricity generation (see below), are characterized by data that represent US processes where information is available. In cases where US-specific information is not available, the best available alternative information is used. Additional details describing the background data are provided in the LCA model and LCA database report of the N.A. version of GCCA Industry EPD Tool for cement and concrete [5]. Foreground data were collected for limestone quarrying, clinker production and Portland cement manufacture. These data are summarized in the Portland Cement Association Life Cycle Inventory Summary Report, February 2021 [3].
1 PCA membership does not represent all cement companies operating in the USA.

ENVIRONMENTAL PRODUCT DECLARATION PORTLAND CEMENT
8
Electricity grid mix For electricity use modeling, the PCR requires the use of subnational electricity consumption LCIs that consider power trading between regions. To do this, the US EPA’s eGrid 2018 data are used, which identify grid mixes for ten US regions (NERC regions) and considers regional trading [14]. A weighted average of the NERC regional mixes is applied in the LCA, where the weighting reflects the portion of portland cement produced in each region. The resulting grid mix used in the LCA is shown in Table 3.
Table 3. Grid mix for portland cement production described by this EPD.
Energy source Portion of representative grid mix
Gas 36.40%
Coal and peat 26.58%
Nuclear 18.04%
Hydro 7.81%
Wind 6.33%
Solar 1.92%
Biomass 1.55%
Oil 0.71%
Geothermal 0.53%
Waste 0.13%
TOTAL 100%
Data Completeness, Consistency, Reproducibility and Transparency All inputs (raw materials, ancillary and packaging materials, energy, and water) and outputs (emissions to air, water and soil, solid and liquid waste, products, co-products, and by-products) were collected, reviewed, benchmarked and modeled to complete LCI production profile for portland cements. The completeness of the cradle-to-gate process chain in terms of process steps is rigorously assessed for all cement facilities. A review of the source of individual input and output data (direct, indirect, estimate, other) shared by participating producers was conducted and summarized in Appendix A, Portland Cement Association Life Cycle Inventory Summary Report, February 2021 [3].
ENVIRONMENTAL PRODUCT DECLARATION PORTLAND CEMENT
9
To ensure consistency, cross checks of the energy demand and the calculated raw meal to clinker ratio against ranges reported in the WBCSD Cement Sustainability Initiative, Cement CO2 and Energy Protocol, v3.1 December, 2013 were conducted per each cement facility [15]. A full description of the foreground data quality assessment is provided in the Portland Cement Association Life Cycle Inventory Summary Report, February 2021 [3]. Activity LCI data are transparently disclosed in the LCI report, including all data sources, and this way external reproducibility of the EPD results with the GCCA Industry EPD Tool for cement and concrete is possible [3], [4]. The majority of data describing cement manufacture (including limestone quarrying and clinker production) is based on direct measurements and engineering calculations, as opposed to approximations. This is particularly true for flows that are the major contributors to impact for cement production, namely clinker production. It should be noted that the data quality assessment here in covers only limestone, clinker and cement production inventories (i.e., activity data). An evaluation of the quality of data used to model background processes (e.g., electricity generation) has also been carried out, and the results are presented in the LCA model and LCA database reports for the N.A. version of GCCA’s Industry EPD Tool for Cement and Concrete [4], [5].
Limitations This EPD represents average industry performance for PCA members producing portland cements. It considers only cement plants located in the US. Results may not adequately represent cement production systems that differ greatly from those captured by the data used in the underlying LCA. This EPD is a declaration of potential environmental impact and does not support or provide definitive comparisons of the environmental performance of specific products. Only EPDs prepared from cradle-to-grave life cycle results and based on the same function and reference service life and quantified by the same functional unit can be used to assist purchasers and users in making informed comparisons between products. The EPD provided here in and the underlying LCA conform to the NSF Product Category Rule for Preparing an Environmental Product Declaration for Portland, Blended Hydraulic, Masonry, Mortar, and Plastic (Stucco) Cements. EPDs of portland cement that follow a different PCR may not be comparable. LCIA results are relative expressions and do not predict impacts on category endpoints, the exceeding of thresholds, safety margins or risks. Further, LCA offers a wide array of environmental impact indicators, and this EPD reports a collection of those, as specified by the PCR. In addition to the impact results, this EPD provides several metrics related to resource consumption and waste generation. These data are informational as they do not provide a measure of impact on the environment. Further, a number of LCA impact categories and inventory items are still emerging or under development and can have high levels

ENVIRONMENTAL PRODUCT DECLARATION PORTLAND CEMENT
10
of uncertainty that preclude international acceptance pending further development. Use caution when interpreting results for these categories – identified with an “*”in Table 4.
Supplementary information regarding LCA methodology Additional information regarding databases and impact methodologies used for conducting the LCA for this EPD can be found in the LCA core model and LCA database reports of the N.A. version of GCCA’s Industry EPD Tool for Cement and Concrete [4], [5].
Life cycle assessment results The cradle-to-gate (A1 to A3) EPD results for producing one metric ton of portland cement are presented in Table 4. Table 4. Production stage EPD results for portland cements.
Impact category and inventory indicators Unit
Portland Cements
1 metric ton
Global warming potential, GWP 100, IPCC 2013 kg CO2 eq 922 Ozone depletion potential, ODP kg CFC-11 eq 2.10E-05 Acidification potential, AP kg SO2 eq 1.75 Eutrophication potential, EP kg N eq 1.02 Smog formation potential, SFP kg O3 eq 32.9 Abiotic depletion potential for non-fossil mineral resources, ADP elements* kg Sb eq 1.97E-04 Abiotic depletion potential for fossil resources, ADP fossil* MJ Surplus 363 Renewable primary resources used as an energy carrier (fuel), RPRE* MJ LHV 138.4 Renewable primary resources with energy content used as material, RPRM* MJ LHV 3.55 Non-renewable primary resources used as an energy carrier (fuel), NRPRE* MJ LHV 4080 Non-renewable primary resources with energy content used as material, NRPRM* MJ LHV 4.75 Secondary materials, SM* kg 95.8 Renewable secondary fuels, RSF* MJ LHV 54.3 Non-renewable secondary fuels, NRSF* MJ LHV 523 Net use of freshwater, NFW* m3 1.04 Hazardous waste disposed, HWD* kg 0.013 Non-hazardous waste disposed, NHWD* kg 309 High-level radioactive waste, conditioned, to final repository, HLRW* kg x1) Intermediate- and low-level radioactive waste, conditioned, to final repository, ILLRW* kg x1)
Components for re-use, CRU* kg 0 Materials for recycling, MFR* kg 0.52 Materials for energy recovery, MER* kg 0 Recovered energy exported from the product system, EE* MJ LHV 1.94 Additional Inventory Parameters for Transparency Global warming potential - biogenic, GWPbio* kg CO₂ eq 0.72
ENVIRONMENTAL PRODUCT DECLARATION PORTLAND CEMENT
11
Impact category and inventory indicators Unit
Portland Cements
1 metric ton
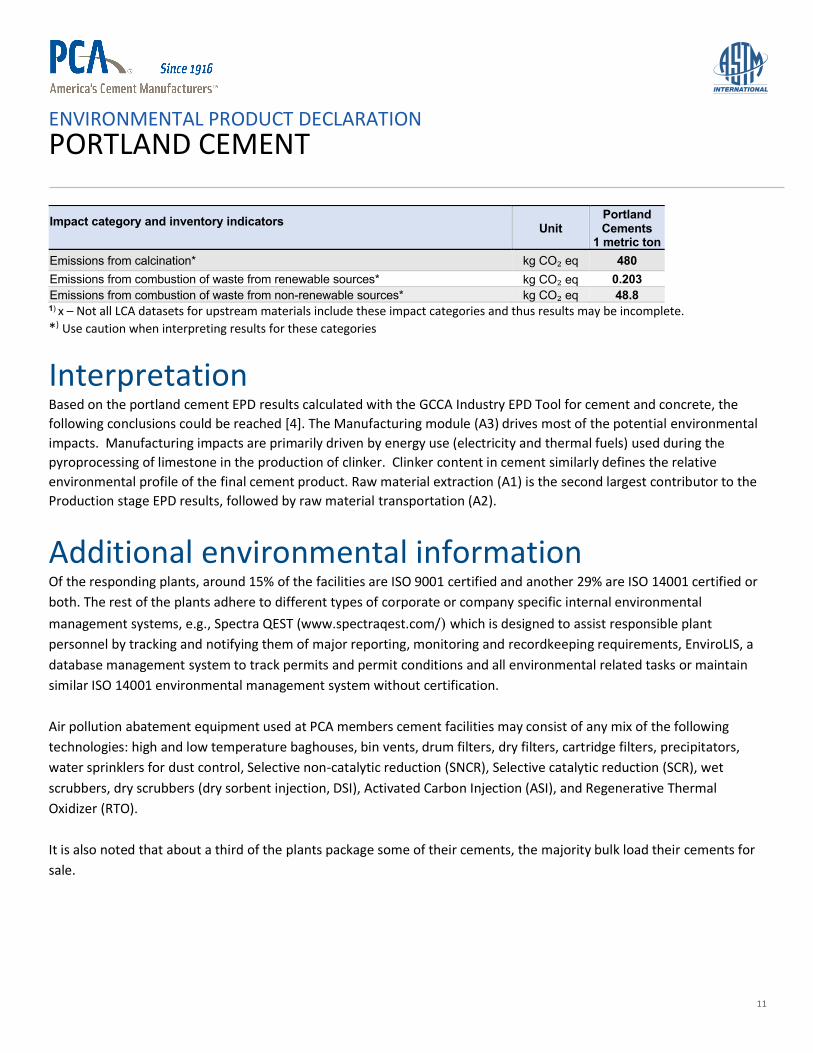
Emissions from calcination* kg CO₂ eq 480 Emissions from combustion of waste from renewable sources* kg CO₂ eq 0.203 Emissions from combustion of waste from non-renewable sources* kg CO₂ eq 48.8 1) x – Not all LCA datasets for upstream materials include these impact categories and thus results may be incomplete. *) Use caution when interpreting results for these categories
Interpretation Based on the portland cement EPD results calculated with the GCCA Industry EPD Tool for cement and concrete, the following conclusions could be reached [4]. The Manufacturing module (A3) drives most of the potential environmental impacts. Manufacturing impacts are primarily driven by energy use (electricity and thermal fuels) used during the pyroprocessing of limestone in the production of clinker. Clinker content in cement similarly defines the relative environmental profile of the final cement product. Raw material extraction (A1) is the second largest contributor to the Production stage EPD results, followed by raw material transportation (A2).
Additional environmental information Of the responding plants, around 15% of the facilities are ISO 9001 certified and another 29% are ISO 14001 certified or both. The rest of the plants adhere to different types of corporate or company specific internal environmental management systems, e.g., Spectra QEST (www.spectraqest.com/) which is designed to assist responsible plant personnel by tracking and notifying them of major reporting, monitoring and recordkeeping requirements, EnviroLIS, a database management system to track permits and permit conditions and all environmental related tasks or maintain similar ISO 14001 environmental management system without certification. Air pollution abatement equipment used at PCA members cement facilities may consist of any mix of the following technologies: high and low temperature baghouses, bin vents, drum filters, dry filters, cartridge filters, precipitators, water sprinklers for dust control, Selective non-catalytic reduction (SNCR), Selective catalytic reduction (SCR), wet scrubbers, dry scrubbers (dry sorbent injection, DSI), Activated Carbon Injection (ASI), and Regenerative Thermal Oxidizer (RTO). It is also noted that about a third of the plants package some of their cements, the majority bulk load their cements for sale.
ENVIRONMENTAL PRODUCT DECLARATION PORTLAND CEMENT
12
References 1. ASTM C150 / C150M – 20 Standard Specification for Portland Cement. 2. ASTM International, Program Operator Rules, version:8.0, 04/29/20. 3. Athena Sustainable Materials Institute 2021, Portland Cement Association (PCA) – Life Cycle Inventory Summary
Report. Prepared by: Mr. Jamie Meil, Mr. Grant Finlayson and Lindita Bushi, PhD, Prepared for: PCA, February 2021.
4. Global Cement and Concrete Association (GCCA) 2020. N.A. version of Industry EPD tool for Cement and Concrete. https://concrete-epd-tool.org/.
5. GCCA and PCA, GCCA Industry EPD Tool for Cement and Concrete (V3.0), LCA Model, North American version, Prepared by Quantis, November 2020.
6. ISO 14021:2016 Environmental labels and declarations - Self-declared environmental claims (Type II environmental labelling).
7. ISO 14025:2006 Environmental labeling and declarations - Type III environmental declarations - Principles and procedures.
8. ISO 14040:2006/Amd1:2020 Environmental management - Life cycle assessment - Principles and framework. 9. ISO 14044:2006/Amd1:2017/Amd2:2020 Environmental management - Life cycle assessment - Requirements and
guidelines. 10. ISO 21930:2017 Sustainability in buildings and civil engineering works - Core rules for environmental product
declarations of construction products and services. 11. NSF International, Product Category Rule Environmental Product Declarations, PCR for Portland, Blended, Masonry,
Mortar, and Plastic (Stucco) Cements, v3.1, Sept. 2020. 12. NSF International, Product Category Rule Environmental Product Declarations, PCR for Concrete, February 2020. 13. US EPA (2020) eGRID 2018. The Emissions and Generation Resource Integrated Database.
http://www.epa.gov/energy/egrid,. 14. US Geological Survey (USGS), National Minerals Information Center, Cement Statistics and Information, RY
2019. https://www.usgs.gov/centers/nmic/cement-statistics-and-information. 15. WBCSD CSI 2013: CO2 and Energy Protocol Version 3.1 of 9 December 2013. https://www.cement-co2-
protocol.org/en/.

ENVIRONMENTAL PRODUCT DECLARATION PORTLAND CEMENT
13
Participating PCA members
Member Corporate headquarters Website Argos USA Corp. Alpharetta, GA argos-us.com Ash Grove Cement Overland Park, KS ashgrove.com Buzzi Unicem USA, Inc. Bethlehem, PA buzziunicemusa.com CalPortland Company Glendora, CA calportland.com CEMEX USA Houston, TX cemexusa.com Continental Cement Chesterfield, MO continentalcement.com Drake Cement Scottsdale, AZ drakecement.com Federal White Cement Woodstock, ON federalwhitecement.com GCC of America Glendale, CO gccusa.com LafargeHolcim Rosemont, IL lafarge-na.com Lehigh Hanson Irving, TX lehighhanson.com Martin Marietta Materials, Inc. Dallas, TX martinmarietta.com Mitsubishi Cement Corporation Henderson, NV mitsubishicement.com Monarch Cement Company Humboldt, KS monarchcement.com National Cement Group Encino, CA nationalcement.com Salt River Materials Group Scottsdale, AZ srmaterials.com St. Marys Cement Toronto, ON stmaryscement.com Suwannee American Cement Branford, FL suwanneecement.com Titan America LLC Norfolk, VA titanamerica.com


![Environmental Product Declaration - St. Marys Cement EPD (Slag).pdf · This declaration has been prepared in accordance with ISO 14025 [3], ISO 21930 [2], ... EPD Project Report Information](https://img.pdfslide.us/doc/110x75/5ab20d287f8b9ac66c8d2fcf/environmental-product-declaration-st-marys-epd-slagpdfthis-declaration-has.jpg)
![ATHENA - Coordinate System Document...[RD02] ATHENA Mission Requirements Document (MRD), ATHENA-ESA-URD-0010 [RD03] ATHENA Product Tree, ATHENA-ESA-PT-0001 [RD04] Ariane 5 User’s](https://img.pdfslide.us/doc/110x75/5ff23cd84225de2c7f4f21b6/athena-coordinate-system-document-rd02-athena-mission-requirements-document.jpg)


![Athena Optics.ppt [Kompatibilitätsmodus] · ATHENA Optics First German ATHENA Science Workshop, January 13, 2012, Garching, Germany 1 ... (ESA led studies for XEUS/IXO/Athena) •](https://img.pdfslide.us/doc/110x75/5e7c8b679ccbb82b722f38d8/athena-kompatibilittsmodus-athena-optics-first-german-athena-science-workshop.jpg)