Embed Size (px)
Citation preview
UTILITY REGULATOR WATER
Version 02.00 (15th March 2019) 1
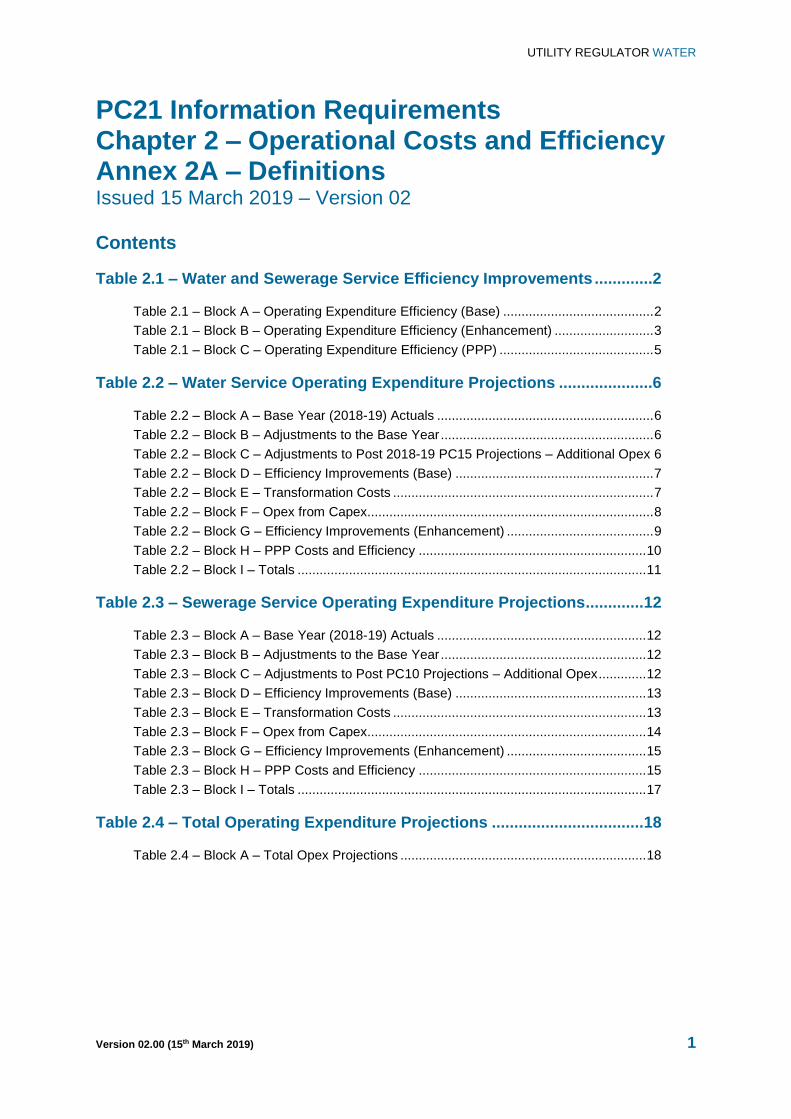
PC21 Information Requirements Chapter 2 – Operational Costs and Efficiency Annex 2A – Definitions Issued 15 March 2019 – Version 02 Contents
Table 2.1 – Water and Sewerage Service Efficiency Improvements .............2
Table 2.1 – Block A – Operating Expenditure Efficiency (Base) ......................................... 2
Table 2.1 – Block B – Operating Expenditure Efficiency (Enhancement) ........................... 3
Table 2.1 – Block C – Operating Expenditure Efficiency (PPP) .......................................... 5
Table 2.2 – Water Service Operating Expenditure Projections .....................6
Table 2.2 – Block A – Base Year (2018-19) Actuals ........................................................... 6
Table 2.2 – Block B – Adjustments to the Base Year .......................................................... 6
Table 2.2 – Block C – Adjustments to Post 2018-19 PC15 Projections – Additional Opex 6
Table 2.2 – Block D – Efficiency Improvements (Base) ...................................................... 7
Table 2.2 – Block E – Transformation Costs ....................................................................... 7
Table 2.2 – Block F – Opex from Capex.............................................................................. 8
Table 2.2 – Block G – Efficiency Improvements (Enhancement) ........................................ 9
Table 2.2 – Block H – PPP Costs and Efficiency .............................................................. 10
Table 2.2 – Block I – Totals ............................................................................................... 11
Table 2.3 – Sewerage Service Operating Expenditure Projections............. 12
Table 2.3 – Block A – Base Year (2018-19) Actuals ......................................................... 12
Table 2.3 – Block B – Adjustments to the Base Year ........................................................ 12
Table 2.3 – Block C – Adjustments to Post PC10 Projections – Additional Opex ............. 12
Table 2.3 – Block D – Efficiency Improvements (Base) .................................................... 13
Table 2.3 – Block E – Transformation Costs ..................................................................... 13
Table 2.3 – Block F – Opex from Capex............................................................................ 14
Table 2.3 – Block G – Efficiency Improvements (Enhancement) ...................................... 15
Table 2.3 – Block H – PPP Costs and Efficiency .............................................................. 15
Table 2.3 – Block I – Totals ............................................................................................... 17
Table 2.4 – Total Operating Expenditure Projections .................................. 18
Table 2.4 – Block A – Total Opex Projections ................................................................... 18
UTILITY REGULATOR WATER
Version 02.00 (15th March 2019) 2
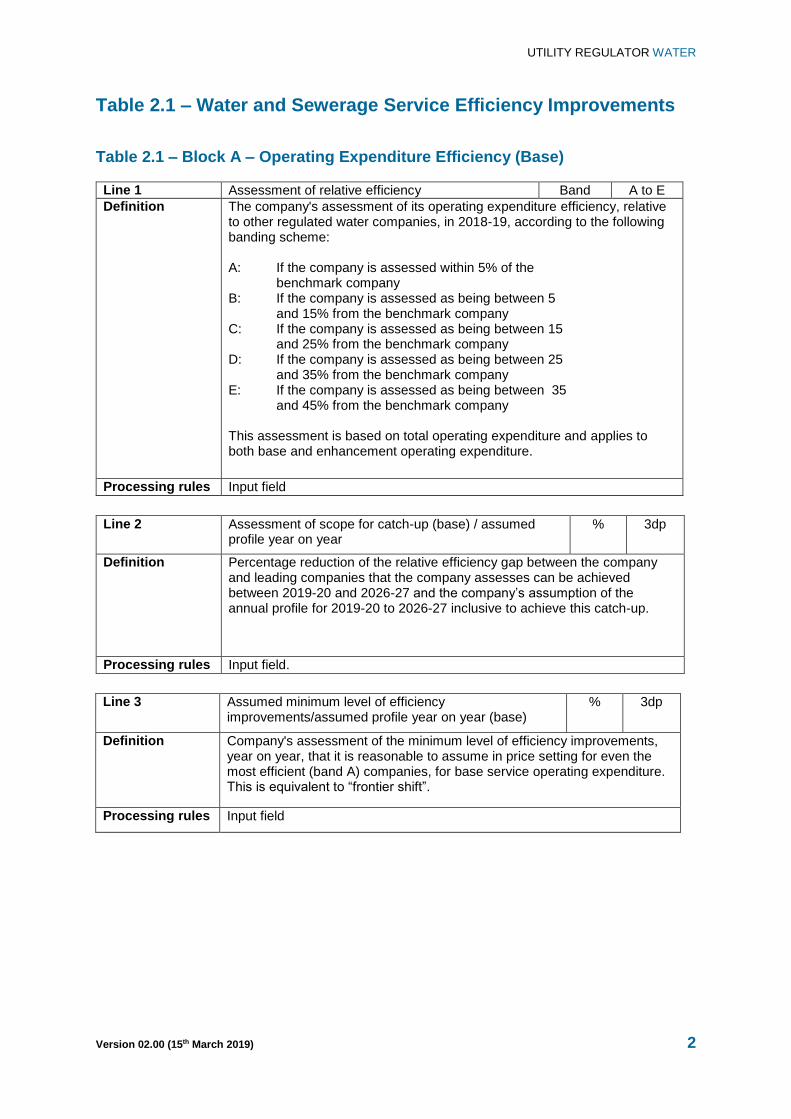
Table 2.1 – Water and Sewerage Service Efficiency Improvements
Table 2.1 – Block A – Operating Expenditure Efficiency (Base)
Line 1 Assessment of relative efficiency Band A to E
Definition The company's assessment of its operating expenditure efficiency, relative to other regulated water companies, in 2018-19, according to the following banding scheme: A: If the company is assessed within 5% of the benchmark company B: If the company is assessed as being between 5 and 15% from the benchmark company C: If the company is assessed as being between 15 and 25% from the benchmark company D: If the company is assessed as being between 25 and 35% from the benchmark company E: If the company is assessed as being between 35 and 45% from the benchmark company This assessment is based on total operating expenditure and applies to both base and enhancement operating expenditure.
Processing rules Input field
Line 2 Assessment of scope for catch-up (base) / assumed
profile year on year % 3dp
Definition Percentage reduction of the relative efficiency gap between the company and leading companies that the company assesses can be achieved between 2019-20 and 2026-27 and the company’s assumption of the annual profile for 2019-20 to 2026-27 inclusive to achieve this catch-up.
Processing rules Input field.
Line 3 Assumed minimum level of efficiency
improvements/assumed profile year on year (base) % 3dp
Definition Company's assessment of the minimum level of efficiency improvements, year on year, that it is reasonable to assume in price setting for even the most efficient (band A) companies, for base service operating expenditure. This is equivalent to “frontier shift”.
Processing rules Input field
UTILITY REGULATOR WATER
Version 02.00 (15th March 2019) 3
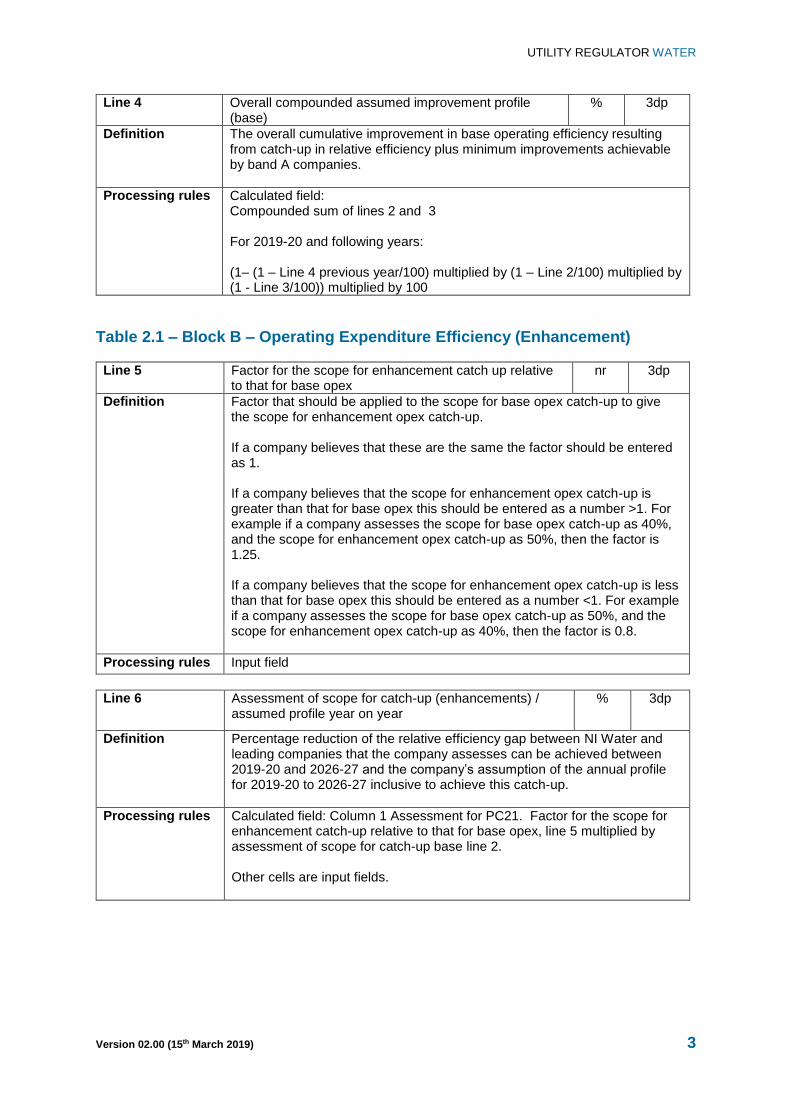
Line 4 Overall compounded assumed improvement profile (base)
% 3dp
Definition The overall cumulative improvement in base operating efficiency resulting from catch-up in relative efficiency plus minimum improvements achievable by band A companies.
Processing rules Calculated field: Compounded sum of lines 2 and 3 For 2019-20 and following years: (1– (1 – Line 4 previous year/100) multiplied by (1 – Line 2/100) multiplied by (1 - Line 3/100)) multiplied by 100
Table 2.1 – Block B – Operating Expenditure Efficiency (Enhancement)
Line 5 Factor for the scope for enhancement catch up relative to that for base opex
nr 3dp
Definition Factor that should be applied to the scope for base opex catch-up to give the scope for enhancement opex catch-up. If a company believes that these are the same the factor should be entered as 1. If a company believes that the scope for enhancement opex catch-up is greater than that for base opex this should be entered as a number >1. For example if a company assesses the scope for base opex catch-up as 40%, and the scope for enhancement opex catch-up as 50%, then the factor is 1.25. If a company believes that the scope for enhancement opex catch-up is less than that for base opex this should be entered as a number <1. For example if a company assesses the scope for base opex catch-up as 50%, and the scope for enhancement opex catch-up as 40%, then the factor is 0.8.
Processing rules Input field
Line 6 Assessment of scope for catch-up (enhancements) / assumed profile year on year
% 3dp
Definition Percentage reduction of the relative efficiency gap between NI Water and leading companies that the company assesses can be achieved between 2019-20 and 2026-27 and the company’s assumption of the annual profile for 2019-20 to 2026-27 inclusive to achieve this catch-up.
Processing rules Calculated field: Column 1 Assessment for PC21. Factor for the scope for enhancement catch-up relative to that for base opex, line 5 multiplied by assessment of scope for catch-up base line 2. Other cells are input fields.
UTILITY REGULATOR WATER
Version 02.00 (15th March 2019) 4
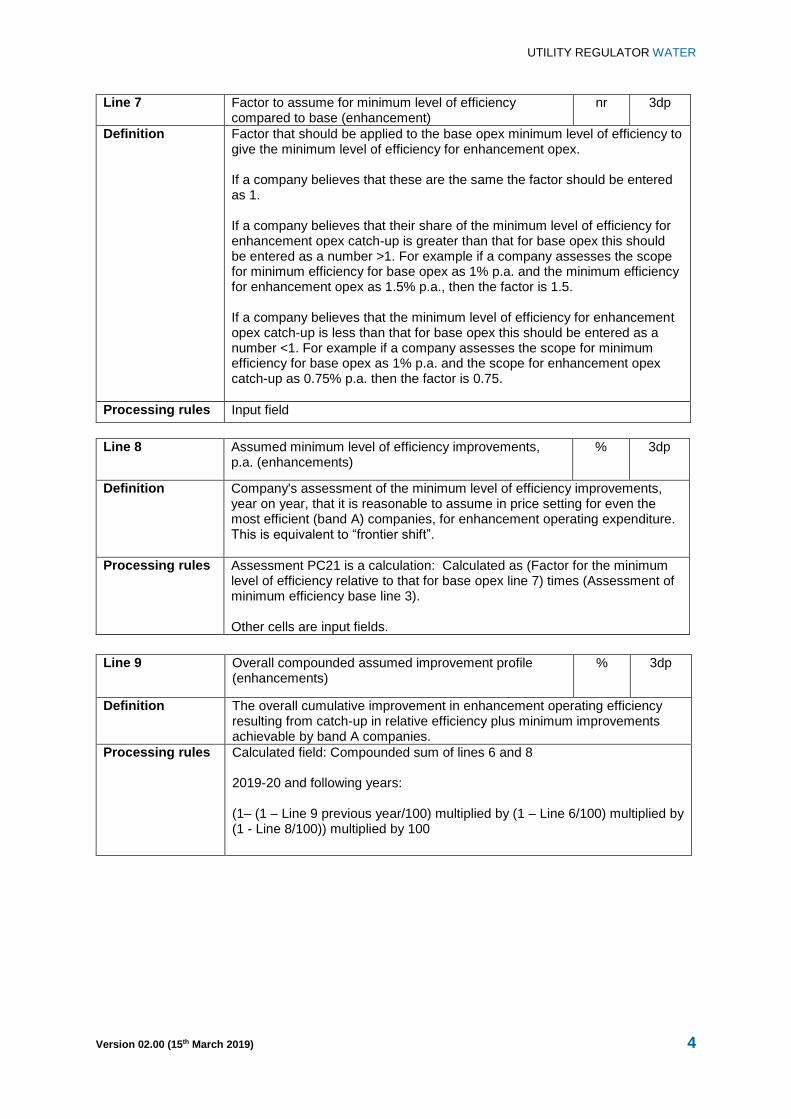
Line 7 Factor to assume for minimum level of efficiency compared to base (enhancement)
nr 3dp
Definition Factor that should be applied to the base opex minimum level of efficiency to give the minimum level of efficiency for enhancement opex. If a company believes that these are the same the factor should be entered as 1. If a company believes that their share of the minimum level of efficiency for enhancement opex catch-up is greater than that for base opex this should be entered as a number >1. For example if a company assesses the scope for minimum efficiency for base opex as 1% p.a. and the minimum efficiency for enhancement opex as 1.5% p.a., then the factor is 1.5. If a company believes that the minimum level of efficiency for enhancement opex catch-up is less than that for base opex this should be entered as a number <1. For example if a company assesses the scope for minimum efficiency for base opex as 1% p.a. and the scope for enhancement opex catch-up as 0.75% p.a. then the factor is 0.75.
Processing rules Input field
Line 8 Assumed minimum level of efficiency improvements, p.a. (enhancements)
% 3dp
Definition Company's assessment of the minimum level of efficiency improvements, year on year, that it is reasonable to assume in price setting for even the most efficient (band A) companies, for enhancement operating expenditure. This is equivalent to “frontier shift”.
Processing rules Assessment PC21 is a calculation: Calculated as (Factor for the minimum level of efficiency relative to that for base opex line 7) times (Assessment of minimum efficiency base line 3). Other cells are input fields.
Line 9 Overall compounded assumed improvement profile
(enhancements) % 3dp
Definition The overall cumulative improvement in enhancement operating efficiency resulting from catch-up in relative efficiency plus minimum improvements achievable by band A companies.
Processing rules Calculated field: Compounded sum of lines 6 and 8 2019-20 and following years: (1– (1 – Line 9 previous year/100) multiplied by (1 – Line 6/100) multiplied by (1 - Line 8/100)) multiplied by 100
UTILITY REGULATOR WATER
Version 02.00 (15th March 2019) 5
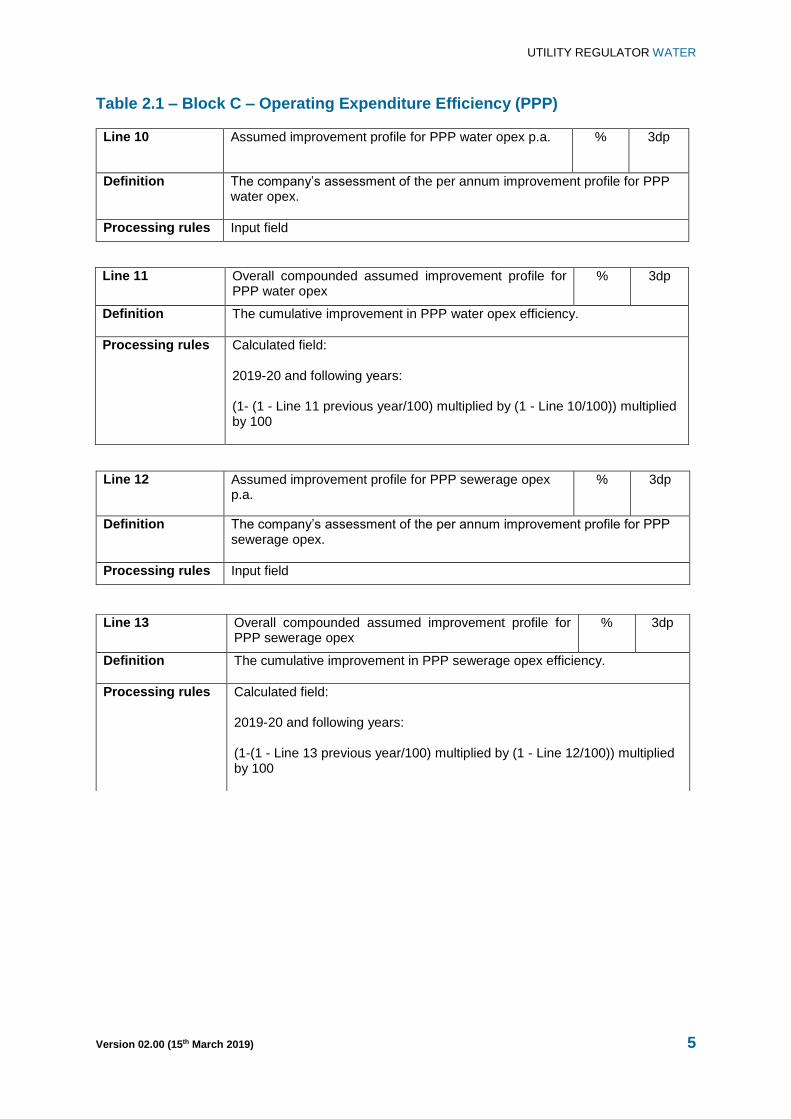
Table 2.1 – Block C – Operating Expenditure Efficiency (PPP)
Line 10 Assumed improvement profile for PPP water opex p.a. % 3dp
Definition The company’s assessment of the per annum improvement profile for PPP water opex.
Processing rules Input field
Line 11 Overall compounded assumed improvement profile for PPP water opex
% 3dp
Definition The cumulative improvement in PPP water opex efficiency.
Processing rules Calculated field: 2019-20 and following years: (1- (1 - Line 11 previous year/100) multiplied by (1 - Line 10/100)) multiplied by 100
Line 12 Assumed improvement profile for PPP sewerage opex p.a.
% 3dp
Definition The company’s assessment of the per annum improvement profile for PPP sewerage opex.
Processing rules Input field
Line 13 Overall compounded assumed improvement profile for PPP sewerage opex
% 3dp
Definition The cumulative improvement in PPP sewerage opex efficiency.
Processing rules Calculated field: 2019-20 and following years: (1-(1 - Line 13 previous year/100) multiplied by (1 - Line 12/100)) multiplied by 100
UTILITY REGULATOR WATER
Version 02.00 (15th March 2019) 6
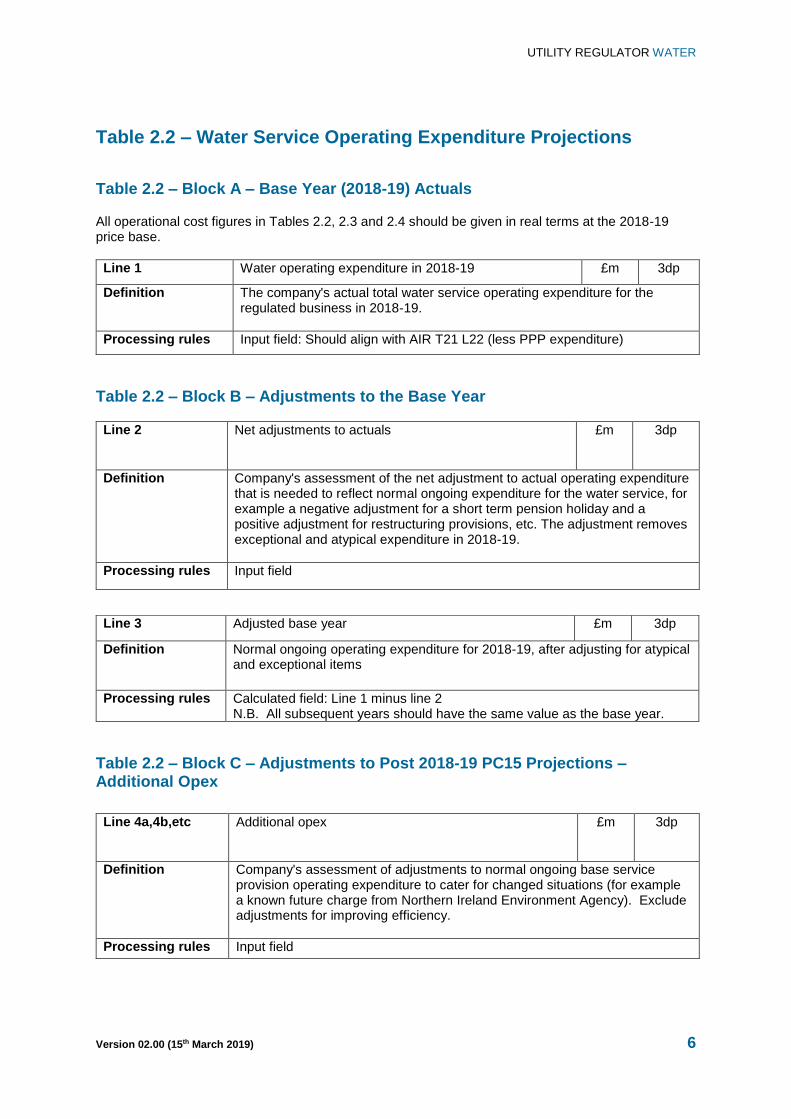
Table 2.2 – Water Service Operating Expenditure Projections
Table 2.2 – Block A – Base Year (2018-19) Actuals
All operational cost figures in Tables 2.2, 2.3 and 2.4 should be given in real terms at the 2018-19 price base.
Line 1 Water operating expenditure in 2018-19 £m 3dp
Definition The company's actual total water service operating expenditure for the regulated business in 2018-19.
Processing rules Input field: Should align with AIR T21 L22 (less PPP expenditure)
Table 2.2 – Block B – Adjustments to the Base Year
Line 2 Net adjustments to actuals £m 3dp
Definition Company's assessment of the net adjustment to actual operating expenditure that is needed to reflect normal ongoing expenditure for the water service, for example a negative adjustment for a short term pension holiday and a positive adjustment for restructuring provisions, etc. The adjustment removes exceptional and atypical expenditure in 2018-19.
Processing rules Input field
Table 2.2 – Block C – Adjustments to Post 2018-19 PC15 Projections – Additional Opex
Line 3 Adjusted base year £m 3dp
Definition Normal ongoing operating expenditure for 2018-19, after adjusting for atypical and exceptional items
Processing rules Calculated field: Line 1 minus line 2 N.B. All subsequent years should have the same value as the base year.
Line 4a,4b,etc Additional opex £m 3dp
Definition Company's assessment of adjustments to normal ongoing base service provision operating expenditure to cater for changed situations (for example a known future charge from Northern Ireland Environment Agency). Exclude adjustments for improving efficiency.
Processing rules Input field
UTILITY REGULATOR WATER
Version 02.00 (15th March 2019) 7
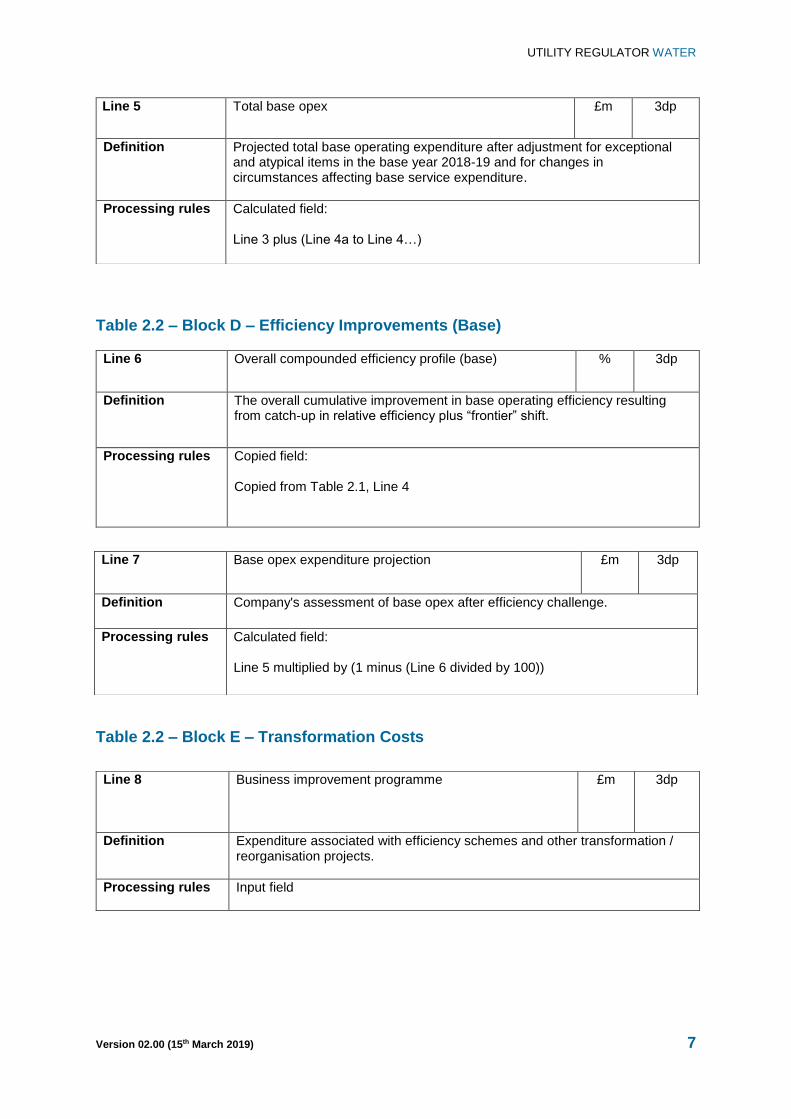
Table 2.2 – Block D – Efficiency Improvements (Base)
Line 6 Overall compounded efficiency profile (base) % 3dp
Definition The overall cumulative improvement in base operating efficiency resulting from catch-up in relative efficiency plus “frontier” shift.
Processing rules Copied field: Copied from Table 2.1, Line 4
Table 2.2 – Block E – Transformation Costs
Line 5 Total base opex £m 3dp
Definition Projected total base operating expenditure after adjustment for exceptional and atypical items in the base year 2018-19 and for changes in circumstances affecting base service expenditure.
Processing rules Calculated field: Line 3 plus (Line 4a to Line 4…)
Line 7 Base opex expenditure projection £m 3dp
Definition Company's assessment of base opex after efficiency challenge.
Processing rules Calculated field: Line 5 multiplied by (1 minus (Line 6 divided by 100))
Line 8 Business improvement programme £m 3dp
Definition Expenditure associated with efficiency schemes and other transformation / reorganisation projects.
Processing rules Input field
UTILITY REGULATOR WATER
Version 02.00 (15th March 2019) 8
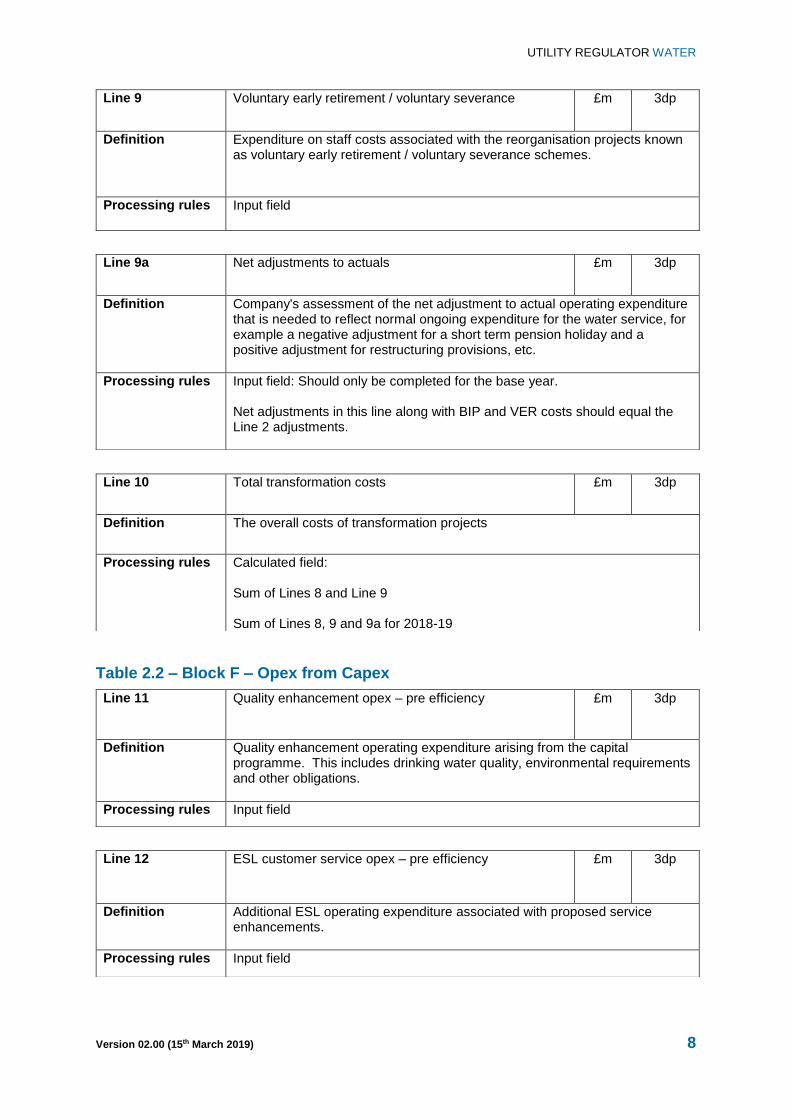
Table 2.2 – Block F – Opex from Capex
Line 9 Voluntary early retirement / voluntary severance £m 3dp
Definition Expenditure on staff costs associated with the reorganisation projects known as voluntary early retirement / voluntary severance schemes.
Processing rules Input field
Line 9a Net adjustments to actuals £m 3dp
Definition Company's assessment of the net adjustment to actual operating expenditure that is needed to reflect normal ongoing expenditure for the water service, for example a negative adjustment for a short term pension holiday and a positive adjustment for restructuring provisions, etc.
Processing rules Input field: Should only be completed for the base year. Net adjustments in this line along with BIP and VER costs should equal the Line 2 adjustments.
Line 10 Total transformation costs £m 3dp
Definition The overall costs of transformation projects
Processing rules Calculated field: Sum of Lines 8 and Line 9 Sum of Lines 8, 9 and 9a for 2018-19
Line 11 Quality enhancement opex – pre efficiency £m 3dp
Definition Quality enhancement operating expenditure arising from the capital programme. This includes drinking water quality, environmental requirements and other obligations.
Processing rules Input field
Line 12 ESL customer service opex – pre efficiency £m 3dp
Definition Additional ESL operating expenditure associated with proposed service enhancements.
Processing rules Input field
UTILITY REGULATOR WATER
Version 02.00 (15th March 2019) 9
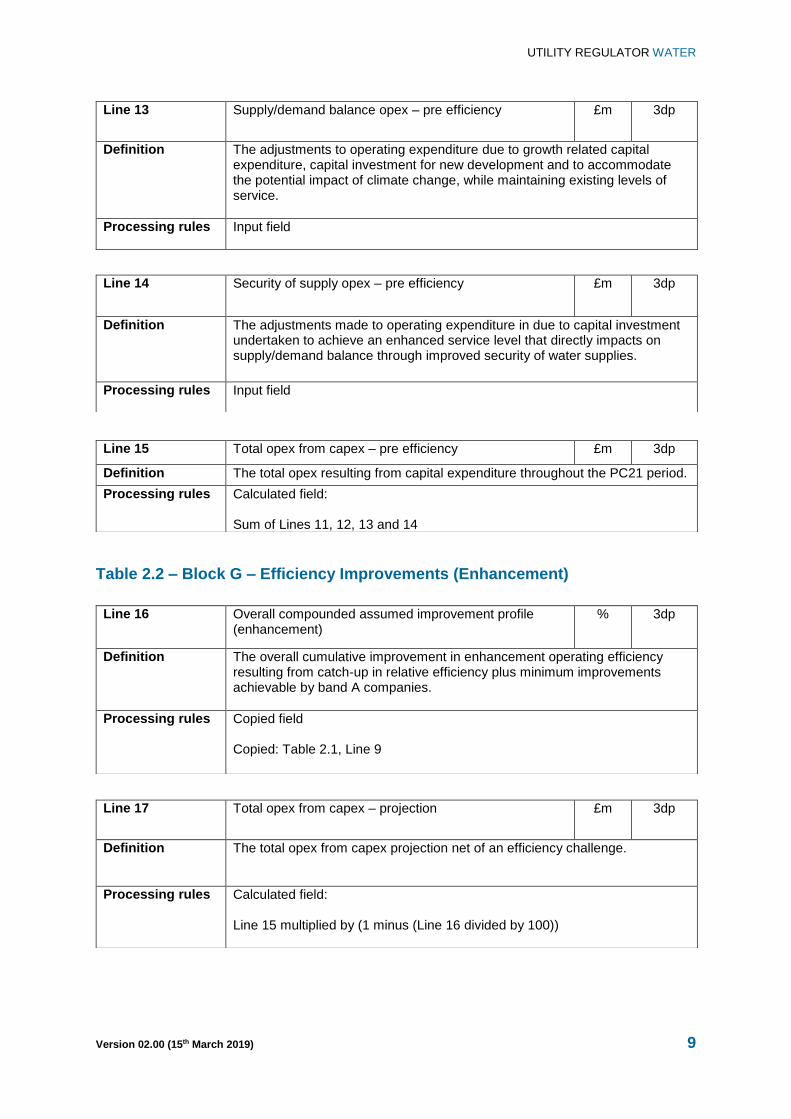
Table 2.2 – Block G – Efficiency Improvements (Enhancement)
Line 13 Supply/demand balance opex – pre efficiency £m 3dp
Definition The adjustments to operating expenditure due to growth related capital expenditure, capital investment for new development and to accommodate the potential impact of climate change, while maintaining existing levels of service.
Processing rules Input field
Line 14 Security of supply opex – pre efficiency £m 3dp
Definition The adjustments made to operating expenditure in due to capital investment undertaken to achieve an enhanced service level that directly impacts on supply/demand balance through improved security of water supplies.
Processing rules Input field
Line 15 Total opex from capex – pre efficiency £m 3dp
Definition The total opex resulting from capital expenditure throughout the PC21 period.
Processing rules Calculated field: Sum of Lines 11, 12, 13 and 14
Line 16 Overall compounded assumed improvement profile (enhancement)
% 3dp
Definition The overall cumulative improvement in enhancement operating efficiency resulting from catch-up in relative efficiency plus minimum improvements achievable by band A companies.
Processing rules Copied field Copied: Table 2.1, Line 9
Line 17 Total opex from capex – projection £m 3dp
Definition The total opex from capex projection net of an efficiency challenge.
Processing rules Calculated field: Line 15 multiplied by (1 minus (Line 16 divided by 100))
UTILITY REGULATOR WATER
Version 02.00 (15th March 2019) 10
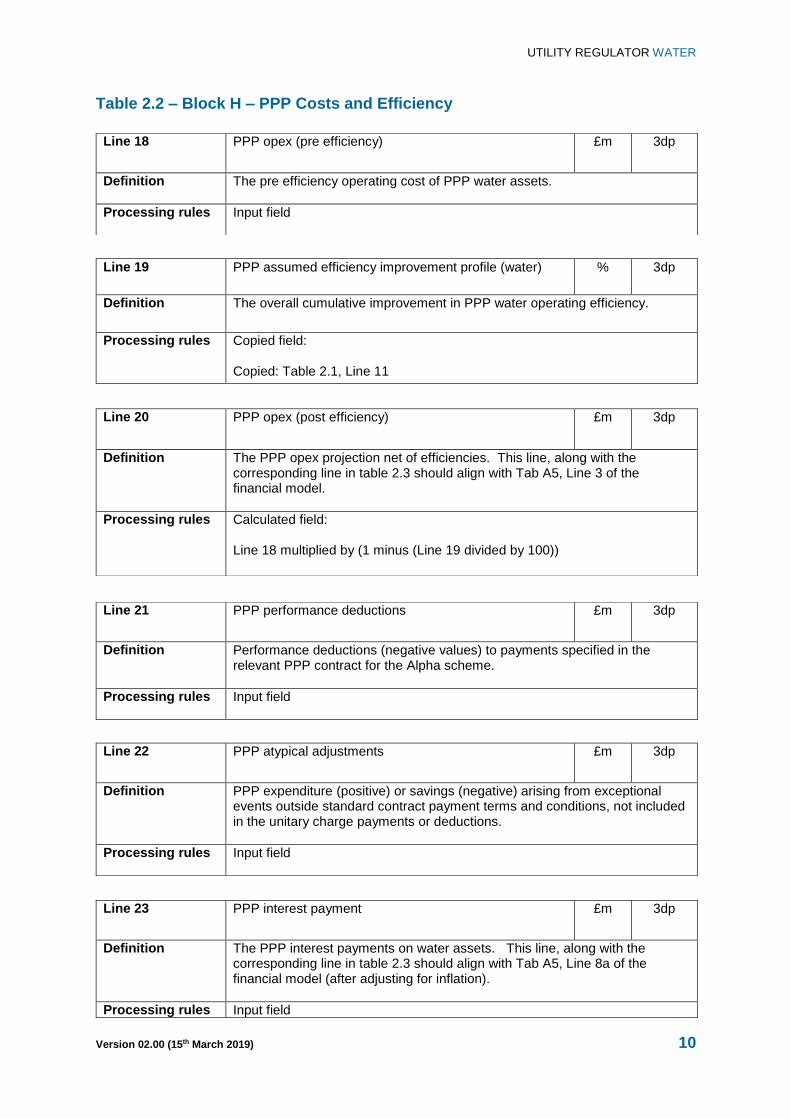
Table 2.2 – Block H – PPP Costs and Efficiency
Line 18 PPP opex (pre efficiency) £m 3dp
Definition The pre efficiency operating cost of PPP water assets.
Processing rules Input field
Line 19 PPP assumed efficiency improvement profile (water) % 3dp
Definition The overall cumulative improvement in PPP water operating efficiency.
Processing rules Copied field: Copied: Table 2.1, Line 11
Line 20 PPP opex (post efficiency) £m 3dp
Definition The PPP opex projection net of efficiencies. This line, along with the corresponding line in table 2.3 should align with Tab A5, Line 3 of the financial model.
Processing rules Calculated field: Line 18 multiplied by (1 minus (Line 19 divided by 100))
Line 21 PPP performance deductions £m 3dp
Definition Performance deductions (negative values) to payments specified in the relevant PPP contract for the Alpha scheme.
Processing rules Input field
Line 22 PPP atypical adjustments £m 3dp
Definition PPP expenditure (positive) or savings (negative) arising from exceptional events outside standard contract payment terms and conditions, not included in the unitary charge payments or deductions.
Processing rules Input field
Line 23 PPP interest payment £m 3dp
Definition The PPP interest payments on water assets. This line, along with the corresponding line in table 2.3 should align with Tab A5, Line 8a of the financial model (after adjusting for inflation).
Processing rules Input field
UTILITY REGULATOR WATER
Version 02.00 (15th March 2019) 11
Table 2.2 – Block I – Totals
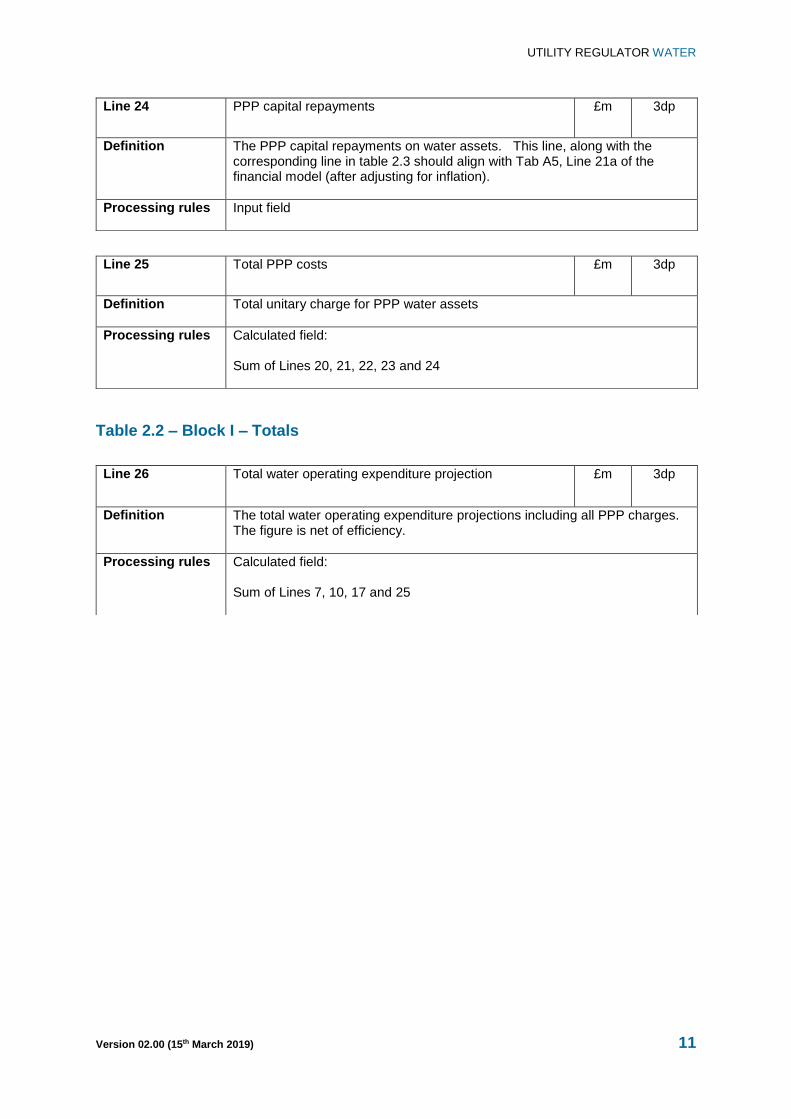
Line 24 PPP capital repayments £m 3dp
Definition The PPP capital repayments on water assets. This line, along with the corresponding line in table 2.3 should align with Tab A5, Line 21a of the financial model (after adjusting for inflation).
Processing rules Input field
Line 25 Total PPP costs £m 3dp
Definition Total unitary charge for PPP water assets
Processing rules Calculated field: Sum of Lines 20, 21, 22, 23 and 24
Line 26 Total water operating expenditure projection £m 3dp
Definition The total water operating expenditure projections including all PPP charges. The figure is net of efficiency.
Processing rules Calculated field: Sum of Lines 7, 10, 17 and 25
UTILITY REGULATOR WATER
Version 02.00 (15th March 2019) 12
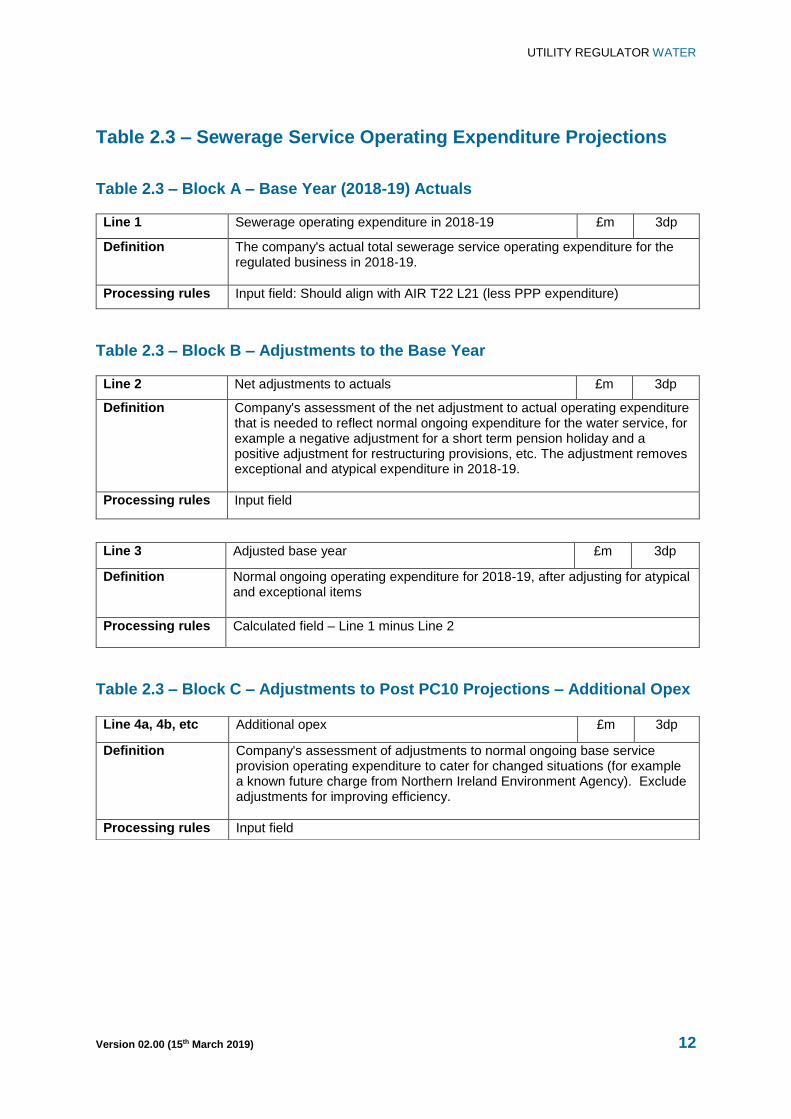
Table 2.3 – Sewerage Service Operating Expenditure Projections
Table 2.3 – Block A – Base Year (2018-19) Actuals
Line 1 Sewerage operating expenditure in 2018-19 £m 3dp
Definition The company's actual total sewerage service operating expenditure for the regulated business in 2018-19.
Processing rules Input field: Should align with AIR T22 L21 (less PPP expenditure)
Table 2.3 – Block B – Adjustments to the Base Year
Line 2 Net adjustments to actuals £m 3dp
Definition Company's assessment of the net adjustment to actual operating expenditure that is needed to reflect normal ongoing expenditure for the water service, for example a negative adjustment for a short term pension holiday and a positive adjustment for restructuring provisions, etc. The adjustment removes exceptional and atypical expenditure in 2018-19.
Processing rules Input field
Table 2.3 – Block C – Adjustments to Post PC10 Projections – Additional Opex
Line 3 Adjusted base year £m 3dp
Definition Normal ongoing operating expenditure for 2018-19, after adjusting for atypical and exceptional items
Processing rules Calculated field – Line 1 minus Line 2
Line 4a, 4b, etc Additional opex £m 3dp
Definition Company's assessment of adjustments to normal ongoing base service provision operating expenditure to cater for changed situations (for example a known future charge from Northern Ireland Environment Agency). Exclude adjustments for improving efficiency.
Processing rules Input field
UTILITY REGULATOR WATER
Version 02.00 (15th March 2019) 13
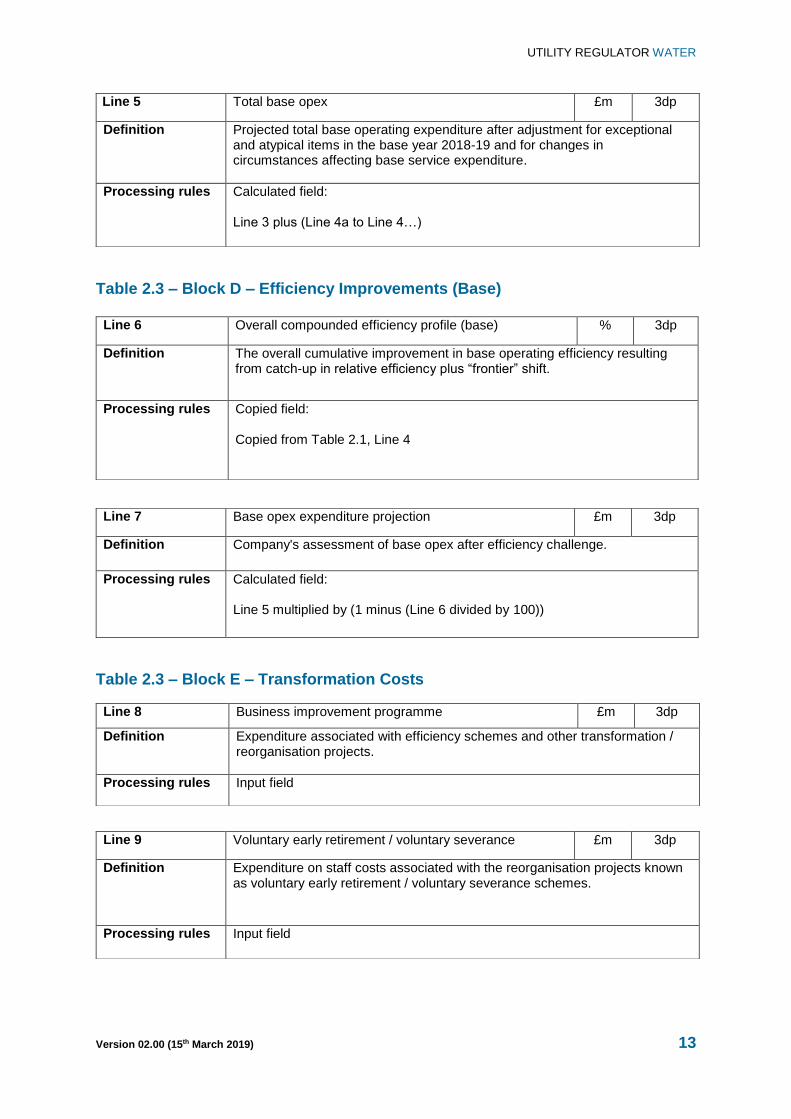
Table 2.3 – Block D – Efficiency Improvements (Base)
Table 2.3 – Block E – Transformation Costs
Line 5 Total base opex £m 3dp
Definition Projected total base operating expenditure after adjustment for exceptional and atypical items in the base year 2018-19 and for changes in circumstances affecting base service expenditure.
Processing rules Calculated field: Line 3 plus (Line 4a to Line 4…)
Line 6 Overall compounded efficiency profile (base) % 3dp
Definition The overall cumulative improvement in base operating efficiency resulting from catch-up in relative efficiency plus “frontier” shift.
Processing rules Copied field: Copied from Table 2.1, Line 4
Line 7 Base opex expenditure projection £m 3dp
Definition Company's assessment of base opex after efficiency challenge.
Processing rules Calculated field: Line 5 multiplied by (1 minus (Line 6 divided by 100))
Line 8 Business improvement programme £m 3dp
Definition Expenditure associated with efficiency schemes and other transformation / reorganisation projects.
Processing rules Input field
Line 9 Voluntary early retirement / voluntary severance £m 3dp
Definition Expenditure on staff costs associated with the reorganisation projects known as voluntary early retirement / voluntary severance schemes.
Processing rules Input field
UTILITY REGULATOR WATER
Version 02.00 (15th March 2019) 14
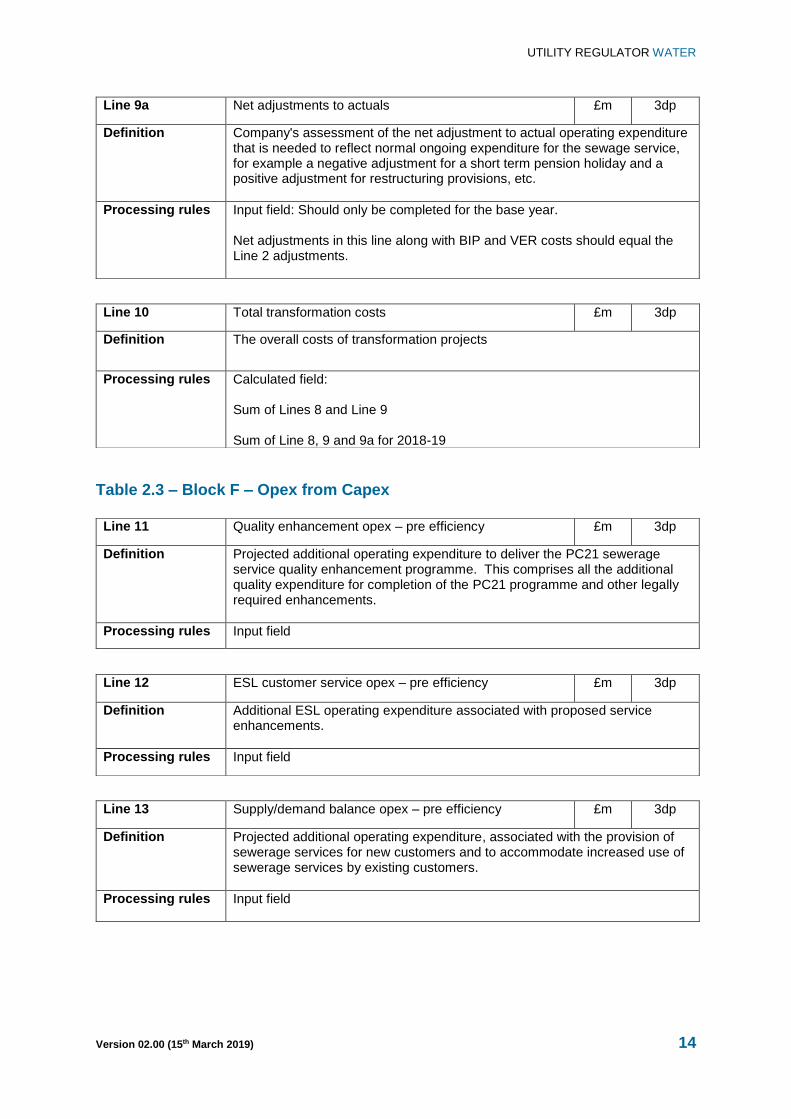
Table 2.3 – Block F – Opex from Capex
Line 9a Net adjustments to actuals £m 3dp
Definition Company's assessment of the net adjustment to actual operating expenditure that is needed to reflect normal ongoing expenditure for the sewage service, for example a negative adjustment for a short term pension holiday and a positive adjustment for restructuring provisions, etc.
Processing rules Input field: Should only be completed for the base year. Net adjustments in this line along with BIP and VER costs should equal the Line 2 adjustments.
Line 10 Total transformation costs £m 3dp
Definition The overall costs of transformation projects
Processing rules Calculated field: Sum of Lines 8 and Line 9 Sum of Line 8, 9 and 9a for 2018-19
Line 11 Quality enhancement opex – pre efficiency £m 3dp
Definition Projected additional operating expenditure to deliver the PC21 sewerage service quality enhancement programme. This comprises all the additional quality expenditure for completion of the PC21 programme and other legally required enhancements.
Processing rules Input field
Line 12 ESL customer service opex – pre efficiency £m 3dp
Definition Additional ESL operating expenditure associated with proposed service enhancements.
Processing rules Input field
Line 13 Supply/demand balance opex – pre efficiency £m 3dp
Definition Projected additional operating expenditure, associated with the provision of sewerage services for new customers and to accommodate increased use of sewerage services by existing customers.
Processing rules Input field
UTILITY REGULATOR WATER
Version 02.00 (15th March 2019) 15
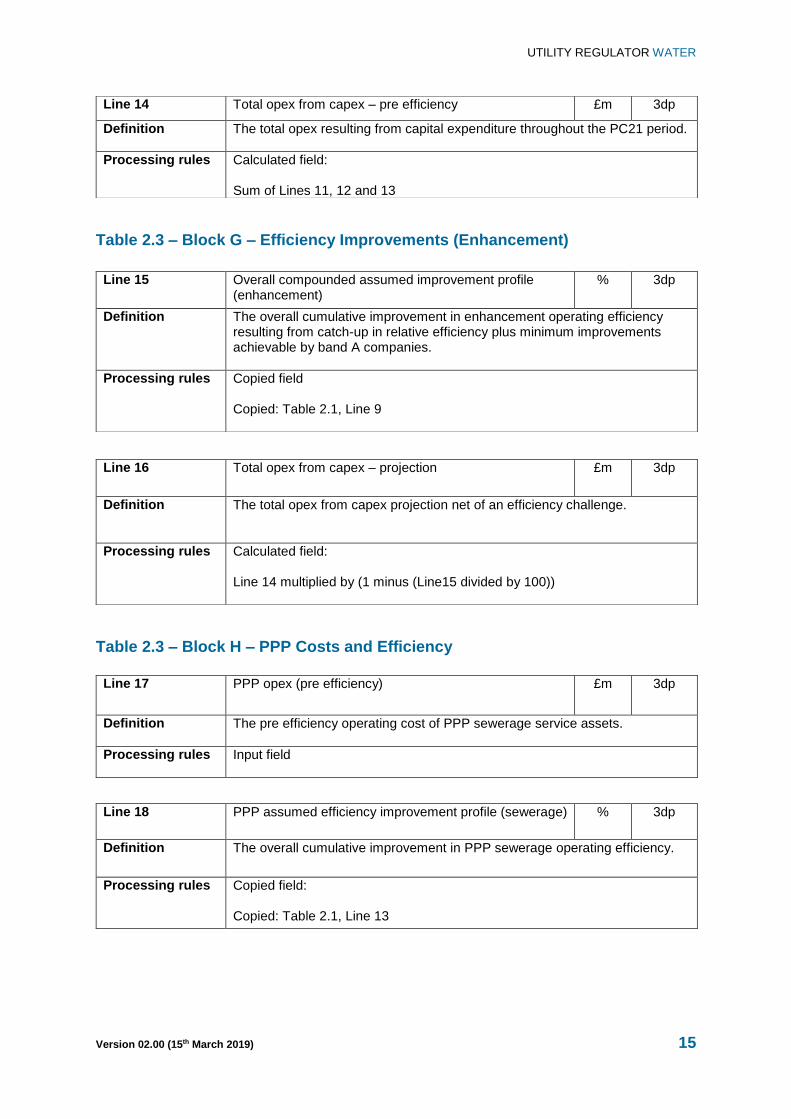
Table 2.3 – Block G – Efficiency Improvements (Enhancement)
Table 2.3 – Block H – PPP Costs and Efficiency
Line 14 Total opex from capex – pre efficiency £m 3dp
Definition The total opex resulting from capital expenditure throughout the PC21 period.
Processing rules Calculated field: Sum of Lines 11, 12 and 13
Line 15 Overall compounded assumed improvement profile (enhancement)
% 3dp
Definition The overall cumulative improvement in enhancement operating efficiency resulting from catch-up in relative efficiency plus minimum improvements achievable by band A companies.
Processing rules Copied field Copied: Table 2.1, Line 9
Line 16 Total opex from capex – projection £m 3dp
Definition The total opex from capex projection net of an efficiency challenge.
Processing rules Calculated field: Line 14 multiplied by (1 minus (Line15 divided by 100))
Line 17 PPP opex (pre efficiency) £m 3dp
Definition The pre efficiency operating cost of PPP sewerage service assets.
Processing rules Input field
Line 18 PPP assumed efficiency improvement profile (sewerage) % 3dp
Definition The overall cumulative improvement in PPP sewerage operating efficiency.
Processing rules Copied field: Copied: Table 2.1, Line 13
UTILITY REGULATOR WATER
Version 02.00 (15th March 2019) 16
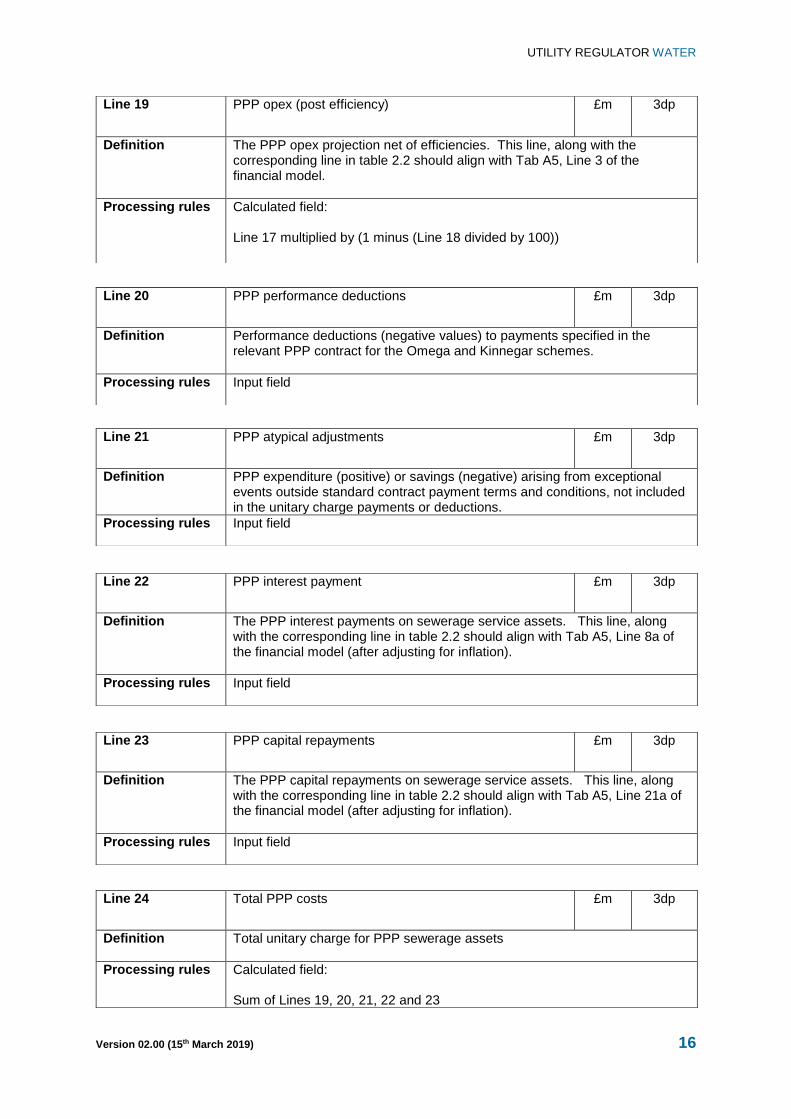
Line 19 PPP opex (post efficiency) £m 3dp
Definition The PPP opex projection net of efficiencies. This line, along with the corresponding line in table 2.2 should align with Tab A5, Line 3 of the financial model.
Processing rules Calculated field: Line 17 multiplied by (1 minus (Line 18 divided by 100))
Line 20 PPP performance deductions £m 3dp
Definition Performance deductions (negative values) to payments specified in the relevant PPP contract for the Omega and Kinnegar schemes.
Processing rules Input field
Line 21 PPP atypical adjustments £m 3dp
Definition PPP expenditure (positive) or savings (negative) arising from exceptional events outside standard contract payment terms and conditions, not included in the unitary charge payments or deductions.
Processing rules Input field
Line 22 PPP interest payment £m 3dp
Definition The PPP interest payments on sewerage service assets. This line, along with the corresponding line in table 2.2 should align with Tab A5, Line 8a of the financial model (after adjusting for inflation).
Processing rules Input field
Line 23 PPP capital repayments £m 3dp
Definition The PPP capital repayments on sewerage service assets. This line, along with the corresponding line in table 2.2 should align with Tab A5, Line 21a of the financial model (after adjusting for inflation).
Processing rules Input field
Line 24 Total PPP costs £m 3dp
Definition Total unitary charge for PPP sewerage assets
Processing rules Calculated field: Sum of Lines 19, 20, 21, 22 and 23
UTILITY REGULATOR WATER
Version 02.00 (15th March 2019) 17
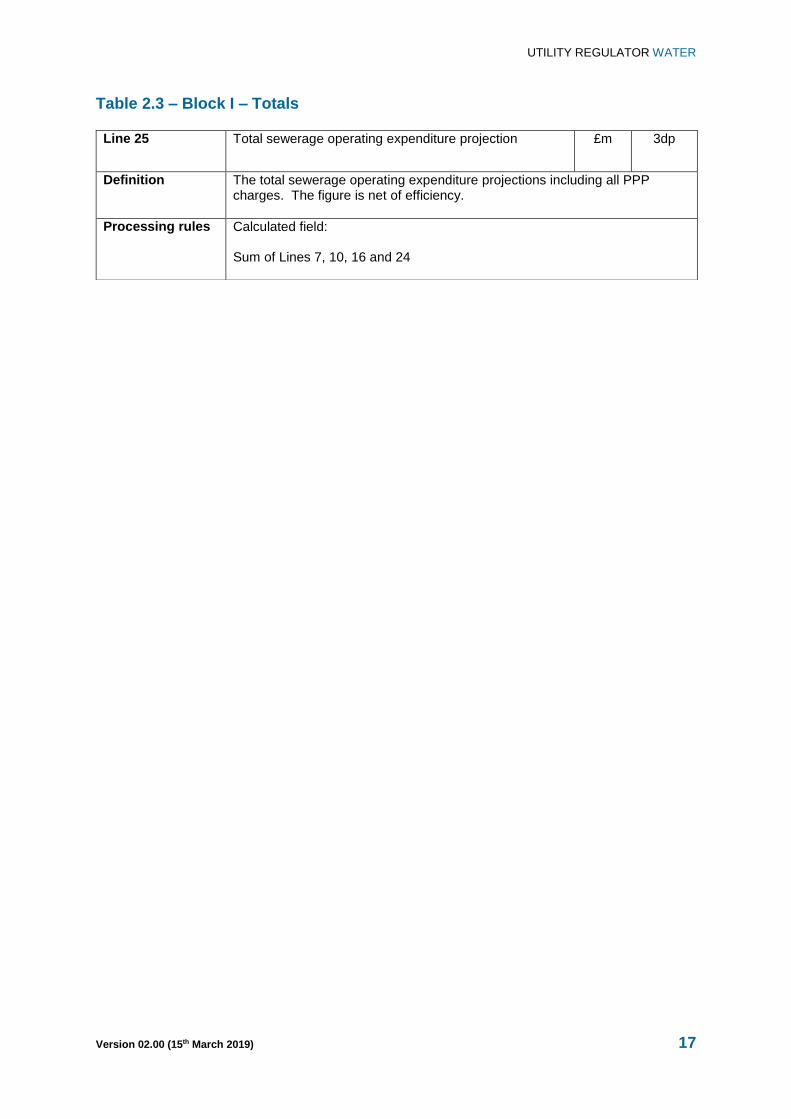
Table 2.3 – Block I – Totals
Line 25 Total sewerage operating expenditure projection £m 3dp
Definition The total sewerage operating expenditure projections including all PPP charges. The figure is net of efficiency.
Processing rules Calculated field: Sum of Lines 7, 10, 16 and 24
UTILITY REGULATOR WATER
Version 02.00 (15th March 2019) 18
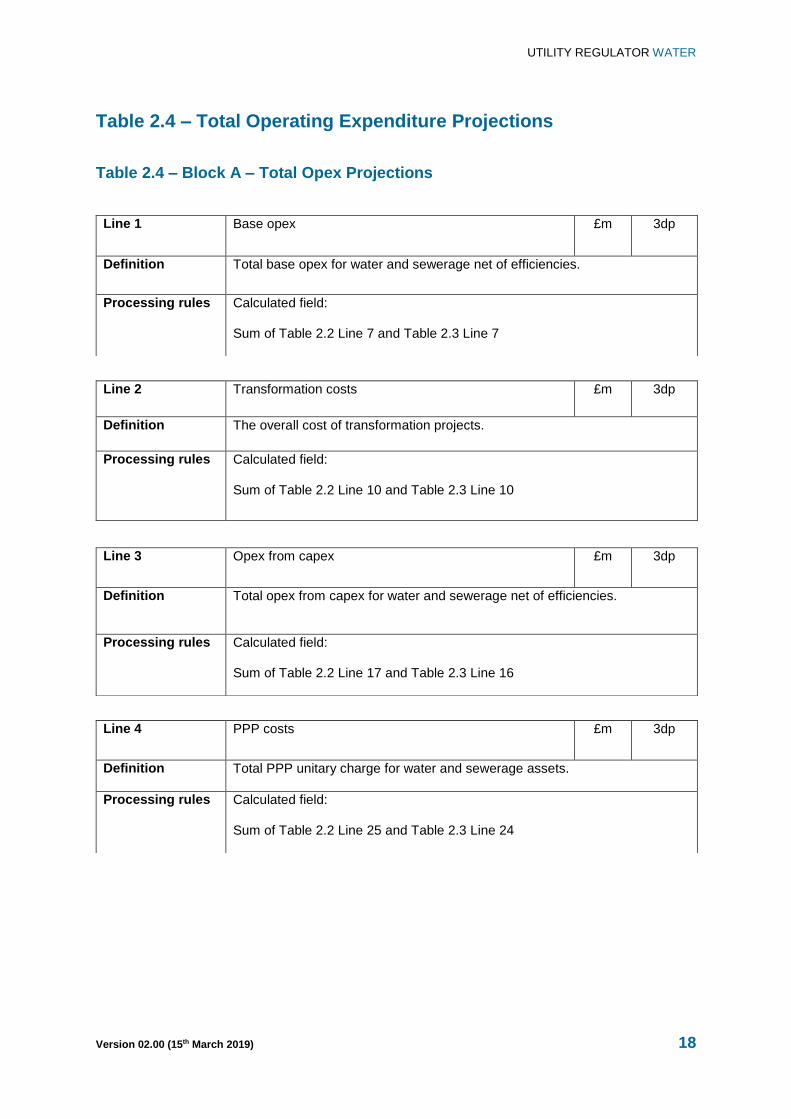
Table 2.4 – Total Operating Expenditure Projections
Table 2.4 – Block A – Total Opex Projections
Line 1 Base opex £m 3dp
Definition Total base opex for water and sewerage net of efficiencies.
Processing rules Calculated field: Sum of Table 2.2 Line 7 and Table 2.3 Line 7
Line 2 Transformation costs £m 3dp
Definition The overall cost of transformation projects.
Processing rules Calculated field: Sum of Table 2.2 Line 10 and Table 2.3 Line 10
Line 3 Opex from capex £m 3dp
Definition Total opex from capex for water and sewerage net of efficiencies.
Processing rules Calculated field: Sum of Table 2.2 Line 17 and Table 2.3 Line 16
Line 4 PPP costs £m 3dp
Definition Total PPP unitary charge for water and sewerage assets.
Processing rules Calculated field: Sum of Table 2.2 Line 25 and Table 2.3 Line 24
UTILITY REGULATOR WATER
Version 02.00 (15th March 2019) 19
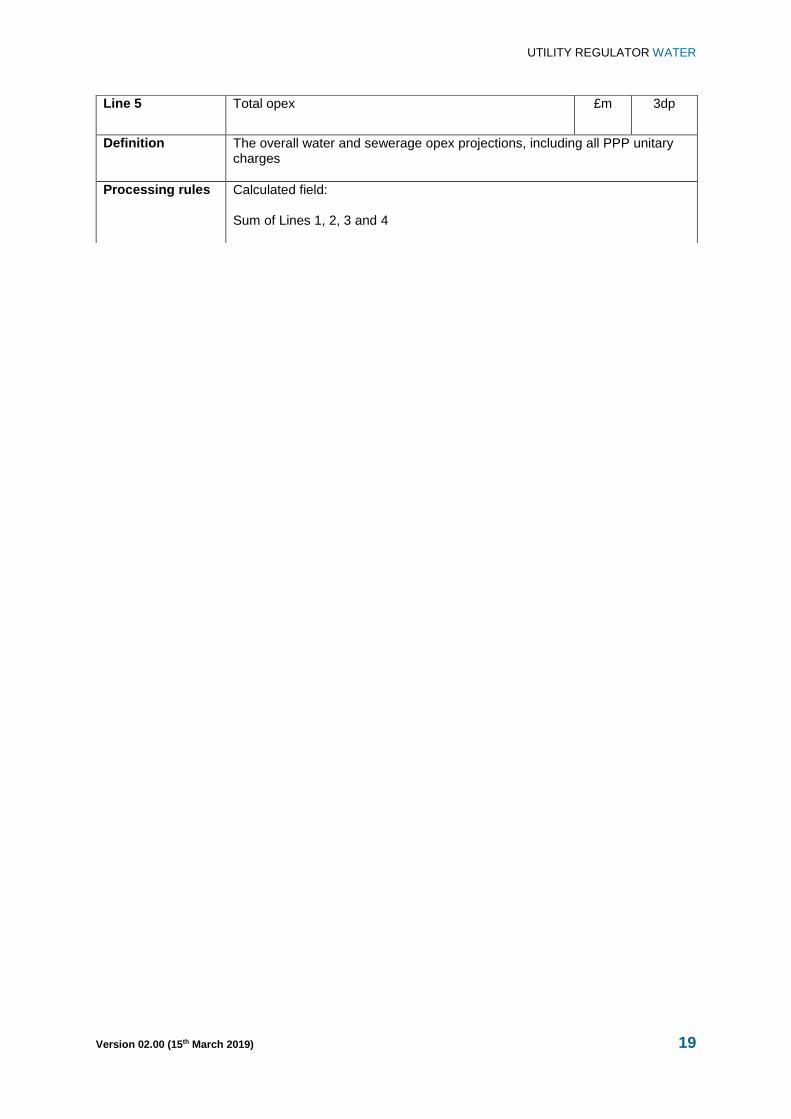
Line 5 Total opex £m 3dp
Definition The overall water and sewerage opex projections, including all PPP unitary charges
Processing rules Calculated field: Sum of Lines 1, 2, 3 and 4