Embed Size (px)
Citation preview

PC Makers
Presenters:Oana ConstantinKevin RidingerAdam Svoboda
Cindy Xia

Agenda
• Industry Analysis
• Company Analysis• Dell, Inc.
• Hewlett-Packard Development Company, L.P.
• Gateway, Inc.

Industry Definition
• The personal computer industry consists mostly of assembling and selling:
• Desktops & Notebooks• Servers & Mainframes• Workstations & Thin Clients• Supercomputers• Mass Storage Devices• Network Equipment• Peripherals• Handheld Devices

Nature of Industry
Motherboard
& CPUPower
Source & Cables
Floppy, CD/DVD Drive
Case
Extra Peripherals
Hard-drive
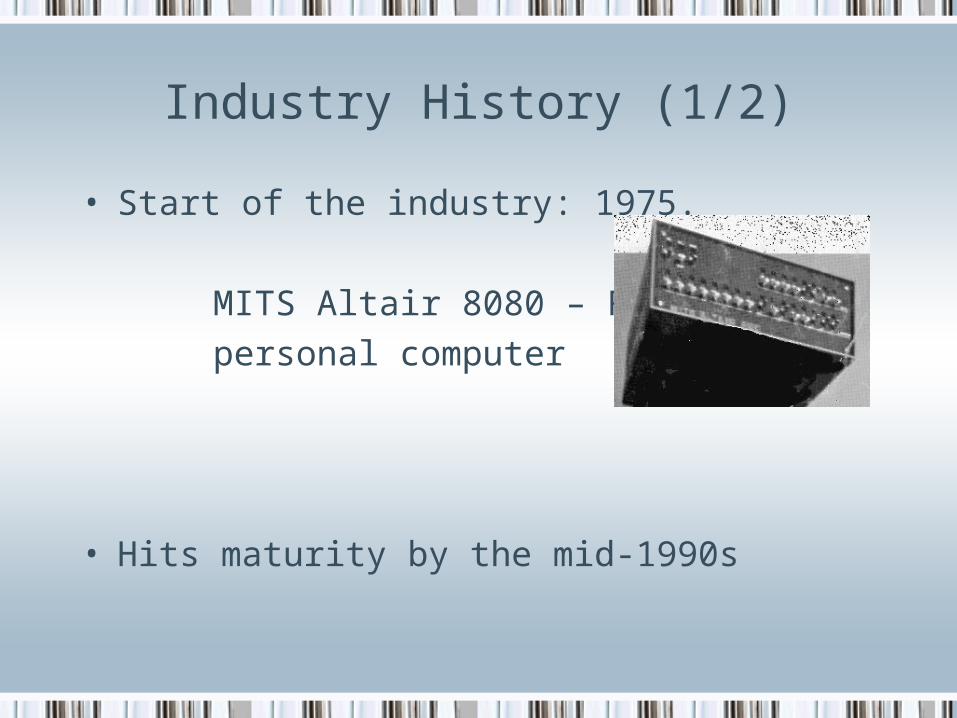
Industry History (1/2)
• Start of the industry: 1975.
MITS Altair 8080 – First
personal computer
• Hits maturity by the mid-1990s
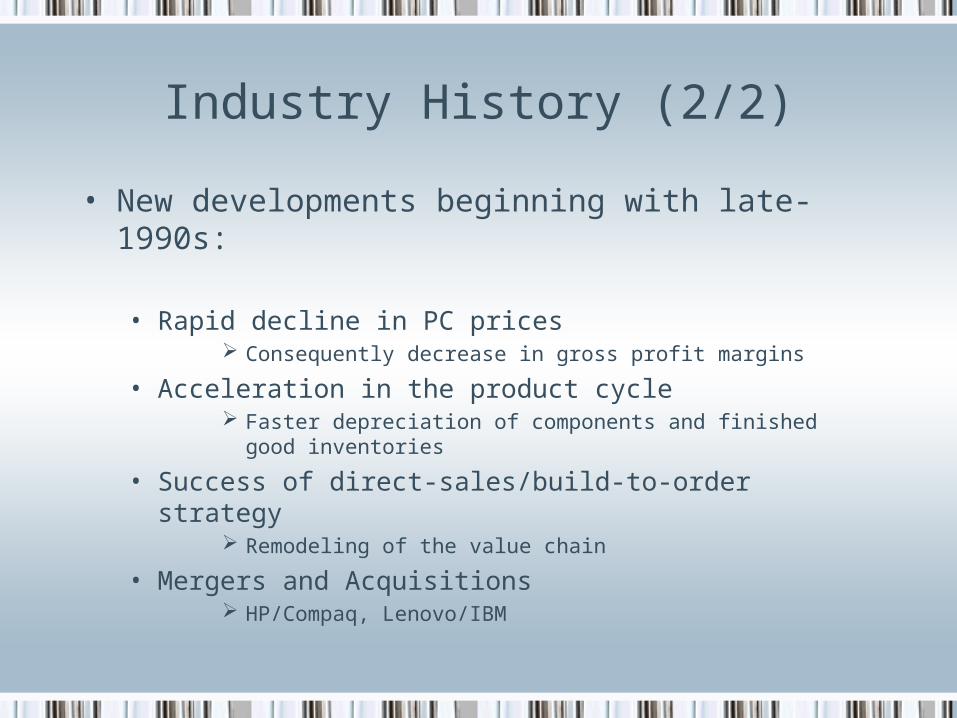
Industry History (2/2)
• New developments beginning with late-1990s:
• Rapid decline in PC prices Consequently decrease in gross profit margins
• Acceleration in the product cycle Faster depreciation of components and finished good inventories
• Success of direct-sales/build-to-order strategy Remodeling of the value chain
• Mergers and Acquisitions HP/Compaq, Lenovo/IBM

1995 Worldwide Market Share
10%8%
3%4%
8%
4%
7%3%3% 3%
47%
CompaqIBMDellHPAppleNECPackard-BellFujitsu/ICLAcerToshibaOther

2004 Worldwide Market Share
16%
6%
18%
1%4%
55%
HP/CompaqIBMDellFujitsu/SiemensAcerOther

PC Market Growth
US and Worldwide PC Market Growth
1985 1990 1995 2000 2003 2005 2010
U.S. PC Unit Sales (#M) 6.6 9.5 21.4 46.0 48.3 56.6 66.7
U.S. PC Dollar Dales ($B) 17.2 24.5 56.8 86.9 78.1 84.5 86.1
Worldwide PC Unit Sales (#M) 11 24.2 70.1 130 149 181 249
Worldwide PC Dollar Sales ($B) 29.5 71.3 155 247 243 270 302

PC Unit Sales by Region (millions)

PC Market Segments (Million Units)
020406080
100120140160
1990 1995 2000 2003 2005 2010
Servers (U.S.) Servers (Worldwide)Desktops (U.S.) Desktops (Worldwide)Mobile PCs (U.S.) Mobile PCs (Worldwide)

PC Market Segment Growth
Worldwide PC Market Segment Growth for Desktops, Mobile PCs, and Servers
1990 1995 2000 2003 2005 2010
Desktops 89.9% 81% 74% 68% 63% 55%
Mobile PCs 9.9% 17% 22% 27% 32% 39%
Servers 0.02% 2% 4% 5% 5% 6%
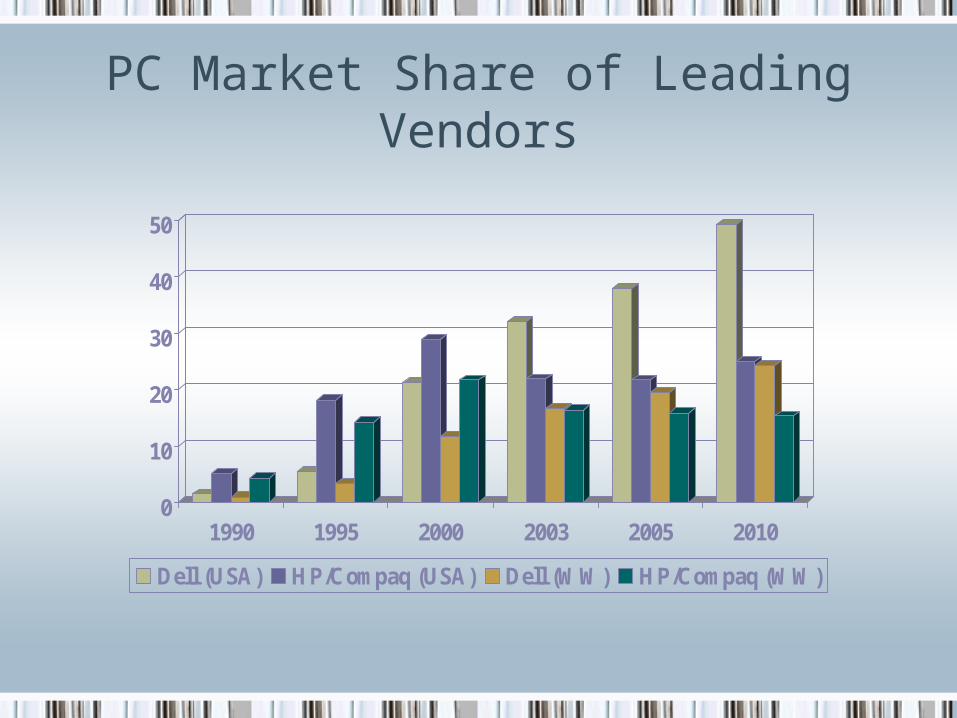
PC Market Share of Leading Vendors
0
10
20
30
40
50
1990 1995 2000 2003 2005 2010
Dell (USA) HP/Compaq (USA) Dell (WW) HP/Compaq (WW)
Business Models
• Big Box
• Direct
• White Box

Big Box Model
• Traditional approach, through “brick and mortar” retailers and own stores
• Distributors purchase assembled, ready-to-use computers
• Allows consumers to touch and feel the product
• Higher cost due to high inventories, longer distribution channel
• Profit margin eroded

Direct Model
• Take customized orders directly from end consumers
• Assemble systems as orders come in
• Ship the product direct to customers
• More efficient, JIT inventory system
• Lower costs due both to inventory savings and distribution by-passing
• Savings are passed to customers
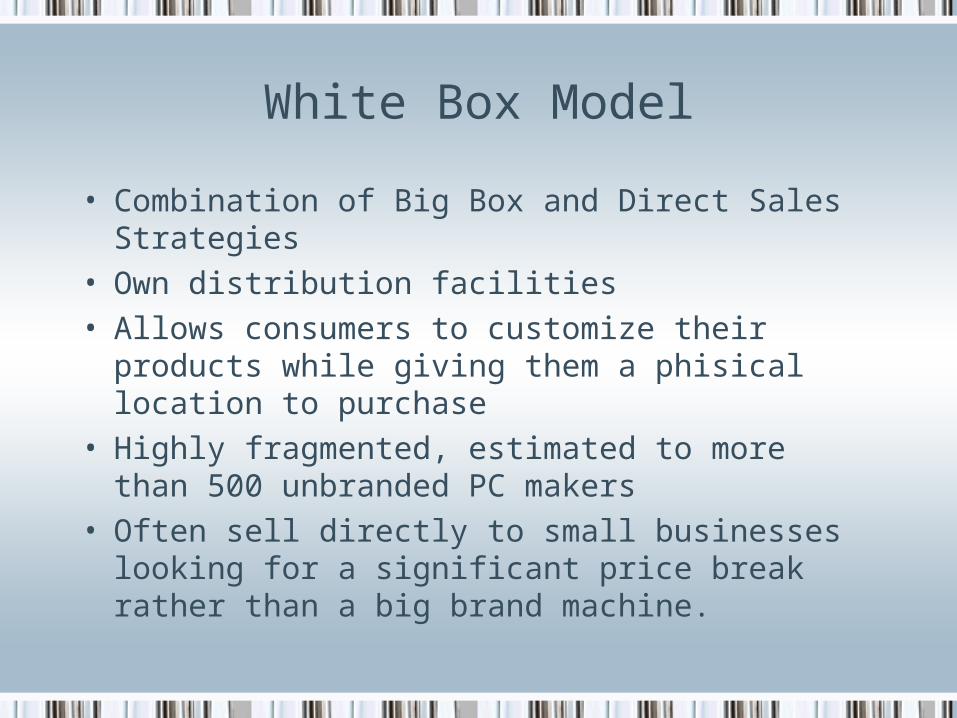
White Box Model
• Combination of Big Box and Direct Sales Strategies
• Own distribution facilities
• Allows consumers to customize their products while giving them a phisical location to purchase
• Highly fragmented, estimated to more than 500 unbranded PC makers
• Often sell directly to small businesses looking for a significant price break rather than a big brand machine.

PC Industry Value Chain, 2004
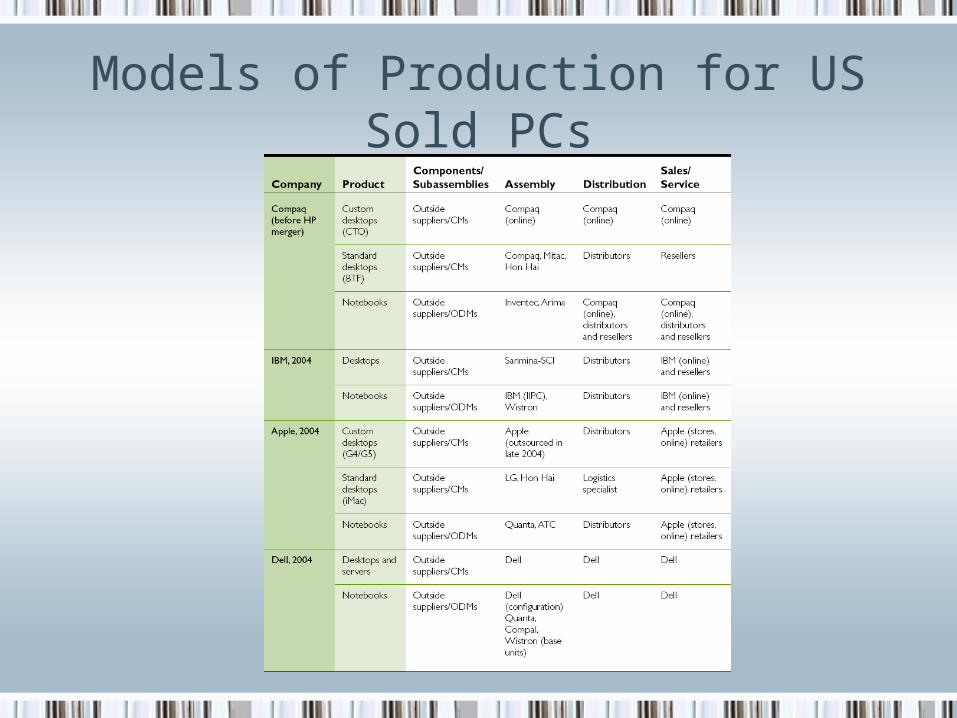
Models of Production for US Sold PCs

Industry Performance
• NASDAQ Computer Index (IXCO)
Includes 603 securities from categories:
Computer HardwareComputer SoftwareSemiconductorsComputer Services
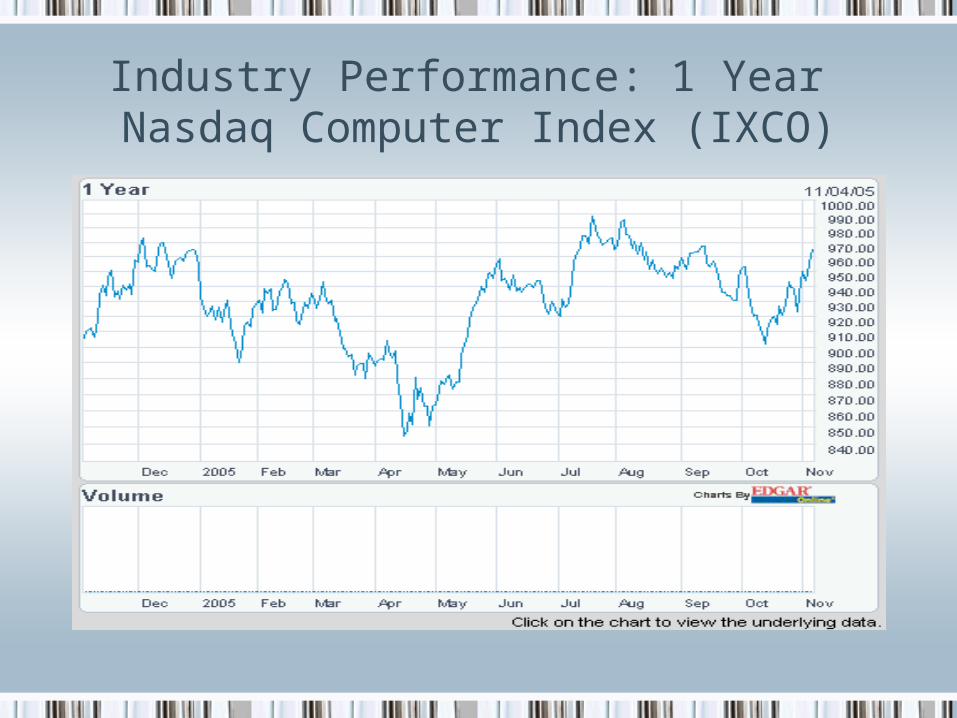
Industry Performance: 1 Year Nasdaq Computer Index (IXCO)

Industry Performance: 10 Year Nasdaq Computer Index (IXCO)

Industry Key Measures
• Profit Margin
• Sales Growth
• Market Share Growth
• Valuation Ratios
• Business Capital Spending

Industry Statistics
Valuation Ratios Financial Strength
P/E 22.96 Quick Ratio 1.34
P/Sales 1.85 Current Ratio 1.61
P/Book 6.83 LT Debt/Equity 0.31
Total Debt/Equity 0.38
Profitability Management Effectiveness
Gross Margin 31.33% ROI 19.28%
Operating Margin 9.22% ROA 9.94%
Net Profit Margin 10.68% ROE 31.35%
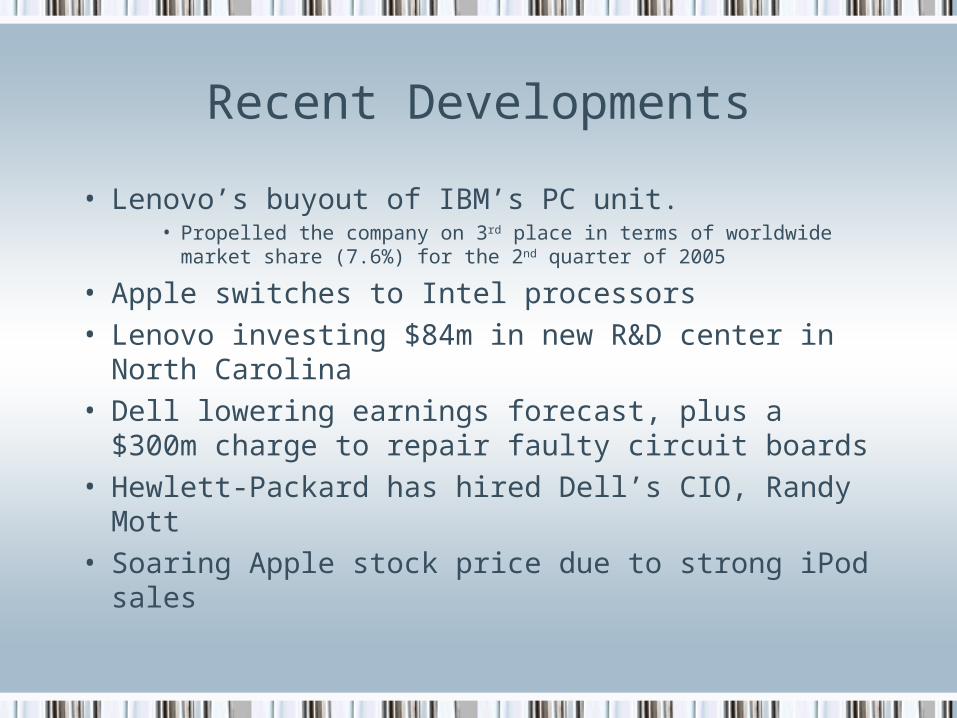
Recent Developments
• Lenovo’s buyout of IBM’s PC unit.• Propelled the company on 3rd place in terms of worldwide market
share (7.6%) for the 2nd quarter of 2005
• Apple switches to Intel processors
• Lenovo investing $84m in new R&D center in North Carolina
• Dell lowering earnings forecast, plus a $300m charge to repair faulty circuit boards
• Hewlett-Packard has hired Dell’s CIO, Randy Mott
• Soaring Apple stock price due to strong iPod sales
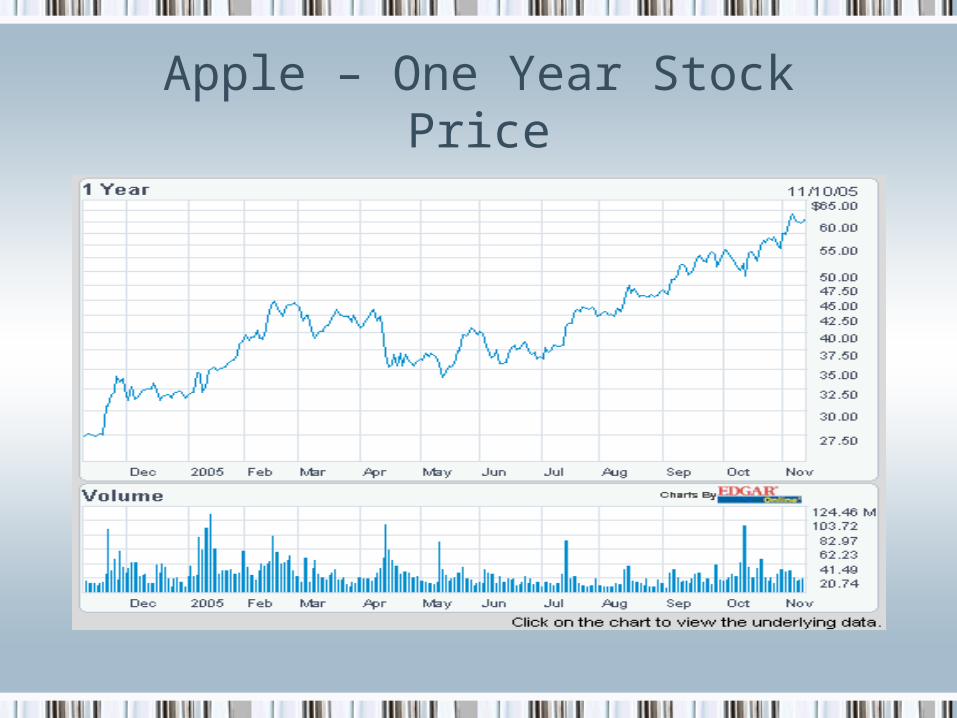
Apple – One Year Stock Price
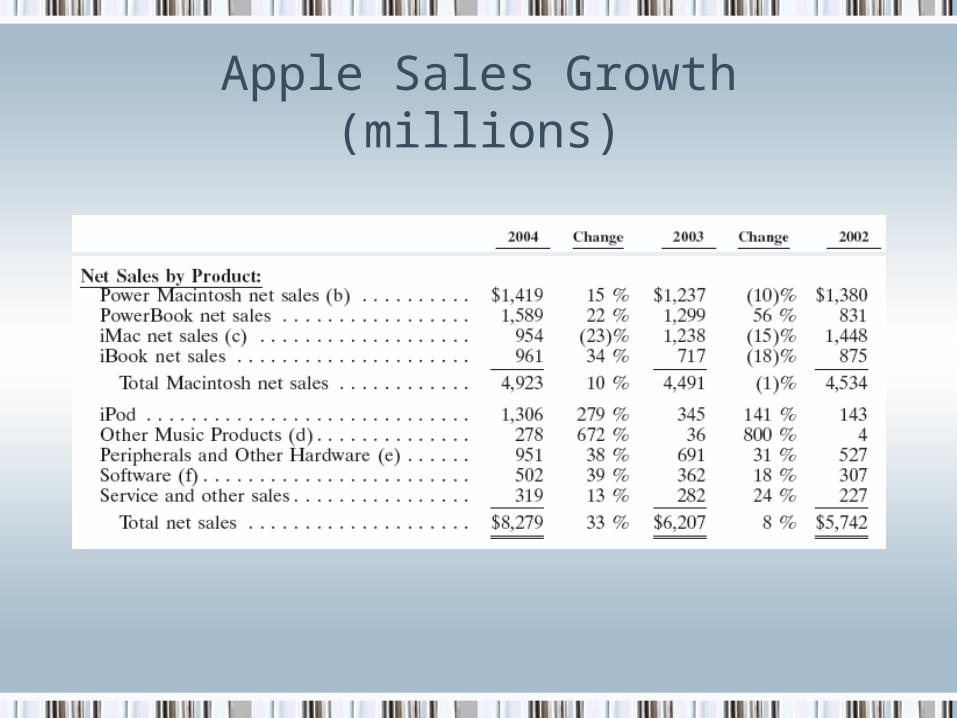
Apple Sales Growth (millions)

Future Trends – Industry
• Pricing competition will become more aggressive Exit by some smaller players Further consolidation through mergers and acquisitions
• PC shipments expected to grow at 6% per year, but revenues will remain almost flat Forces players to further innovate and expand product offering
such as media center computers and tablet PCs
• Faster growth in Europe and Asia segments Build strong marketing strategy targeting these segments to
capture market share

Future Trends – Technology
• Continued shift from desktops to notebooks
• Shift towards wireless devices
• Adaptive hardware technology to support PC virtualization
• Continuous movement toward miniaturization and digital enhancement of portable music players and phones

Dell Inc.
Presented by: Kevin Ridinger

Fast Facts about Dell Inc. Trades on NASDAQ, symbol: DELL One share bought for $8.50 at IPO in 1988 would be worth
$3,800 today. Employs over 61,400 people Revenues totaled over $52.8 billion for the last four quarters Market Position: #1 in U.S., #3 in Japan, #2 in Europe 7 Manufacturing centres spanning the globe, located in United
States(3), Brazil, Europe (Ireland), Malaysia, and China. Nearly one out of every five standards-based computer system
sold in the world today is a Dell.

Dell Timeline
1984: Michael Dell founds Dell Computer Corporation
1987: International expansion begins with opening of subsidiary in United Kingdom
1988: Dell conducts initial public offering of company stock (3.5 million shares at $8.5 each)
1993: Enters into Asia-Pacific region with subsidiaries in Australia and Japan
1996: Company begins major push into the server market
2000: Company sales via Internet reach $50 million per day
2001: For the first time, Dell ranks No. 1 in global market share
2004: Kevin Rollins becomes Dell's next chief executive officer. Michael Dell moves to Chairman of the Board

Management Michael Dell – Chairman of the Board (founded company
in 1984) Kevin B Rollins – President and CEO since July 2004
(prior he was president and COO of Dell Americas – joined in 1994)
William J. Amelio – Sr. VP Asia-Pacific/Japan (since 2001)
Paul D. Bell – Sr. VP Europe, Middle East & Africa (since 1996)
Joseph A. Marengi, Sr. VP, Americas (since 1996, came from Novell)
Many of Dell’s current management came to the company around 1996-97. Based on biographical evidence, many were lured from other high-tech companies, including Novell, HP, Apple, Sun and Texas Instruments.
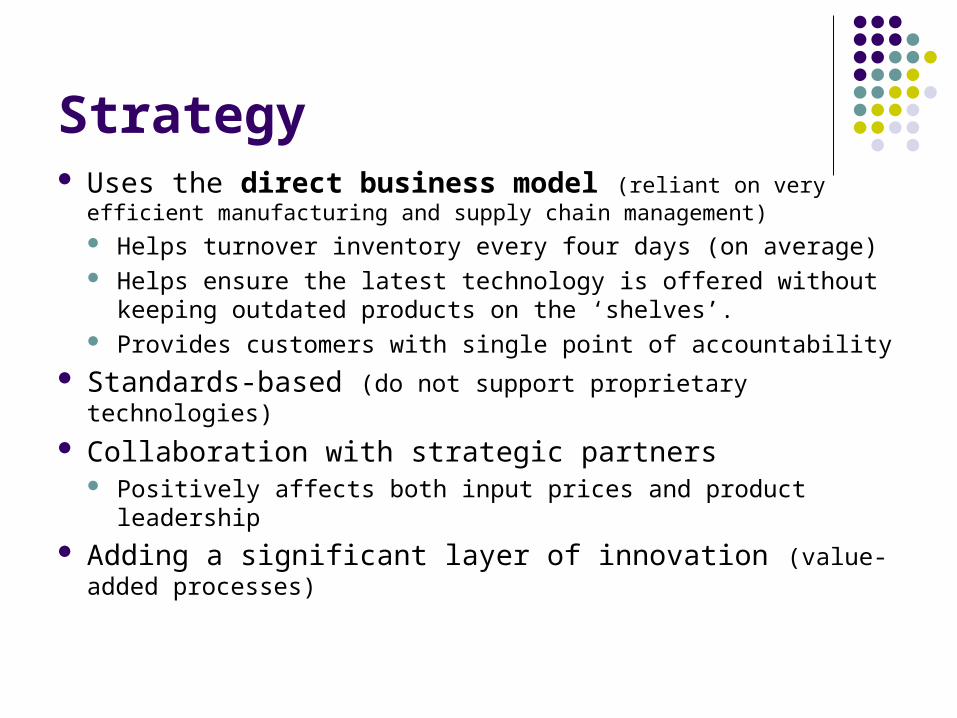
Strategy Uses the direct business model (reliant on very efficient
manufacturing and supply chain management) Helps turnover inventory every four days (on average) Helps ensure the latest technology is offered without
keeping outdated products on the ‘shelves’. Provides customers with single point of accountability
Standards-based (do not support proprietary technologies)
Collaboration with strategic partners Positively affects both input prices and product leadership
Adding a significant layer of innovation (value-added processes)
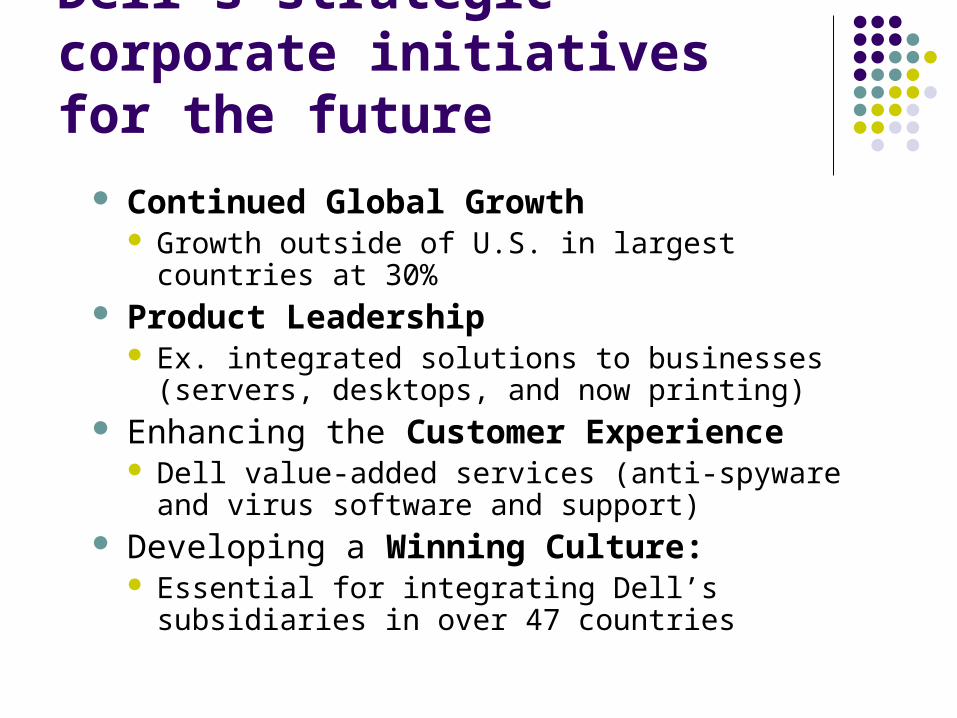
Dell’s strategic corporate initiatives for the future
Continued Global Growth Growth outside of U.S. in largest countries at 30%
Product Leadership Ex. integrated solutions to businesses (servers,
desktops, and now printing) Enhancing the Customer Experience
Dell value-added services (anti-spyware and virus software and support)
Developing a Winning Culture: Essential for integrating Dell’s subsidiaries in over 47
countries

Company Structure

Sources of Revenue Dell designs, develops, manufactures, markets,
sells, and supports the follow products:
•Notebook Computers•Desktop Computers•Printing and Imaging•Software and Peripherals
•Servers•Storage•Workstations•Networking
•Dell also offers a variety of services from development and support to professional and fully managed solutions.
Dell also has a financial services division which is a joint venture between Dell and CIT group. It organizes financing alternatives for clients

Sales Mix (by Region & Product line)
Product-specific

Revenue Growth
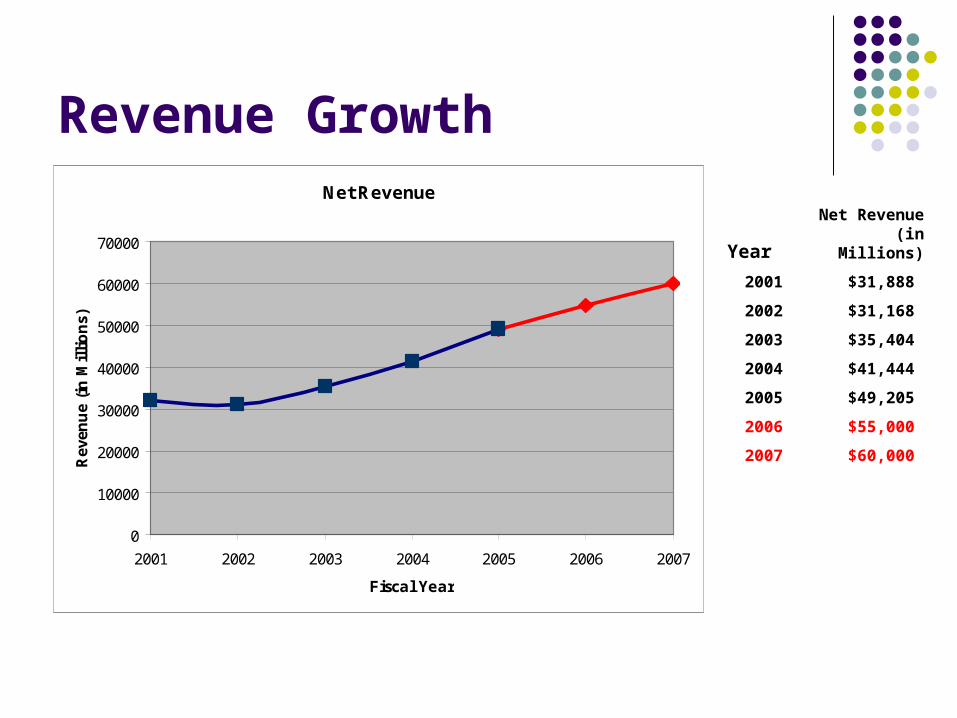
Revenue Growth
Year Net Revenue (in
Millions)
2001 $31,888
2002 $31,168
2003 $35,404
2004 $41,444
2005 $49,205
2006 $55,000
2007 $60,000
Net Revenue
0
10000
20000
30000
40000
50000
60000
70000
2001 2002 2003 2004 2005 2006 2007
Fiscal Year
Rev
enu
e (i
n M
illi
on
s)
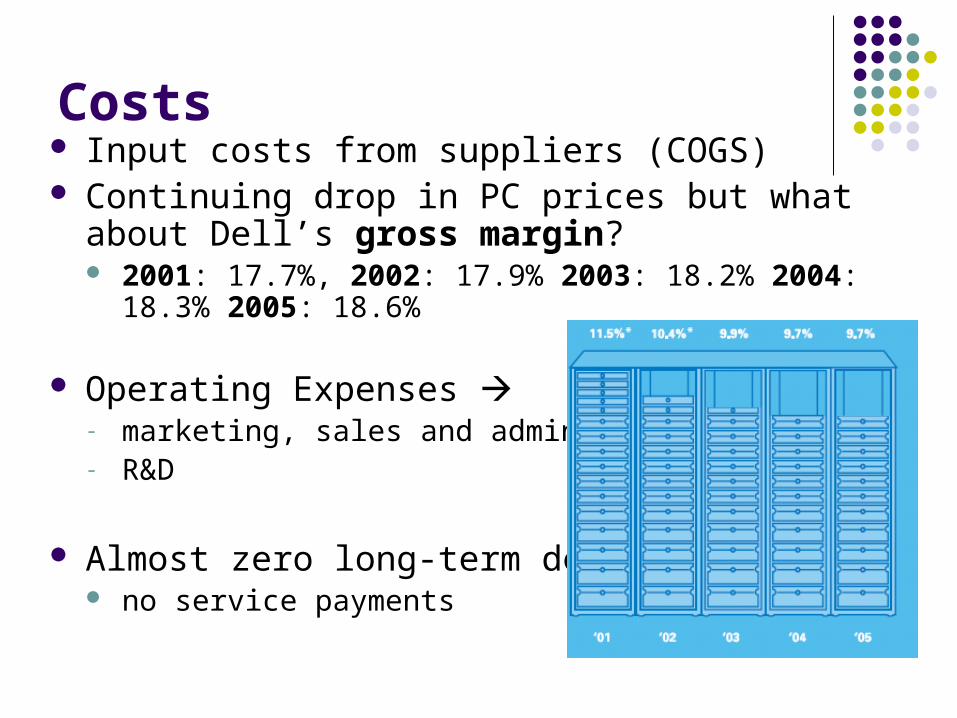
Costs Input costs from suppliers (COGS) Continuing drop in PC prices but what about Dell’s
gross margin? 2001: 17.7%, 2002: 17.9% 2003: 18.2% 2004: 18.3%
2005: 18.6%
Operating Expenses - marketing, sales and admin.- R&D
Almost zero long-term debt no service payments
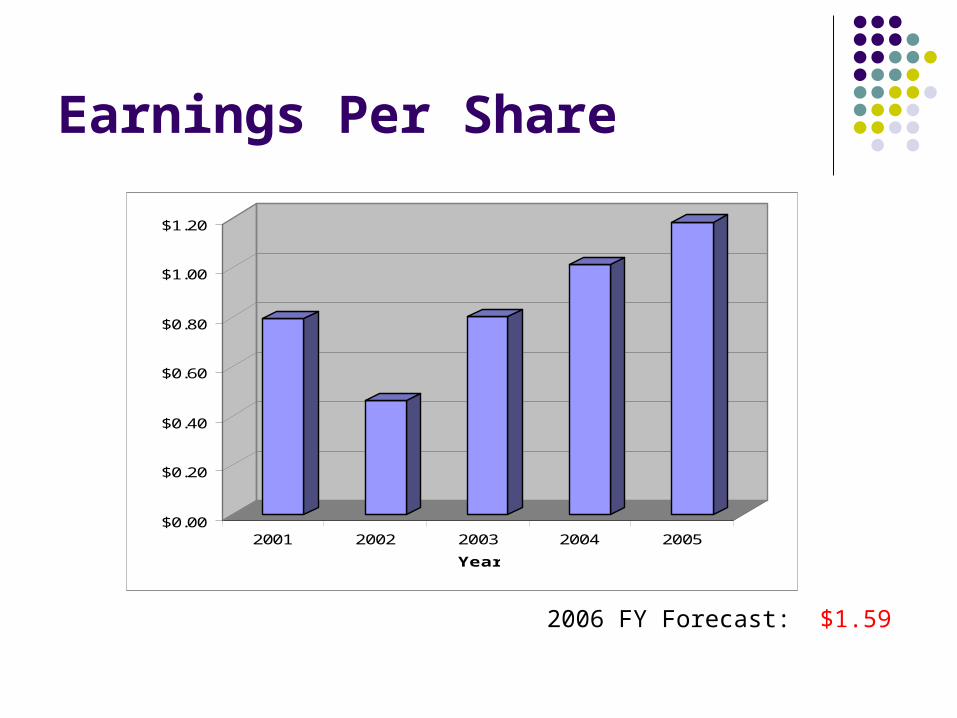
Earnings Per Share
$0.00
$0.20
$0.40
$0.60
$0.80
$1.00
$1.20
2001 2002 2003 2004 2005
Year
2006 FY Forecast: $1.59
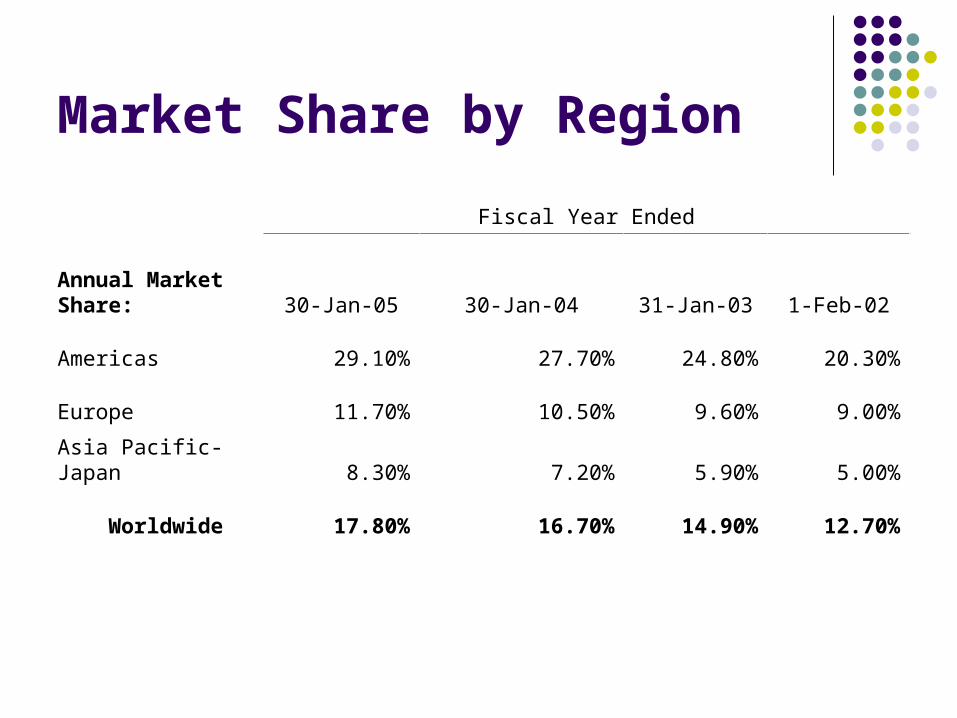
Market Share by Region
Fiscal Year Ended
Annual Market Share: 30-Jan-05 30-Jan-04 31-Jan-03 1-Feb-02
Americas 29.10% 27.70% 24.80% 20.30%
Europe 11.70% 10.50% 9.60% 9.00%
Asia Pacific-Japan 8.30% 7.20% 5.90% 5.00%
Worldwide 17.80% 16.70% 14.90% 12.70%
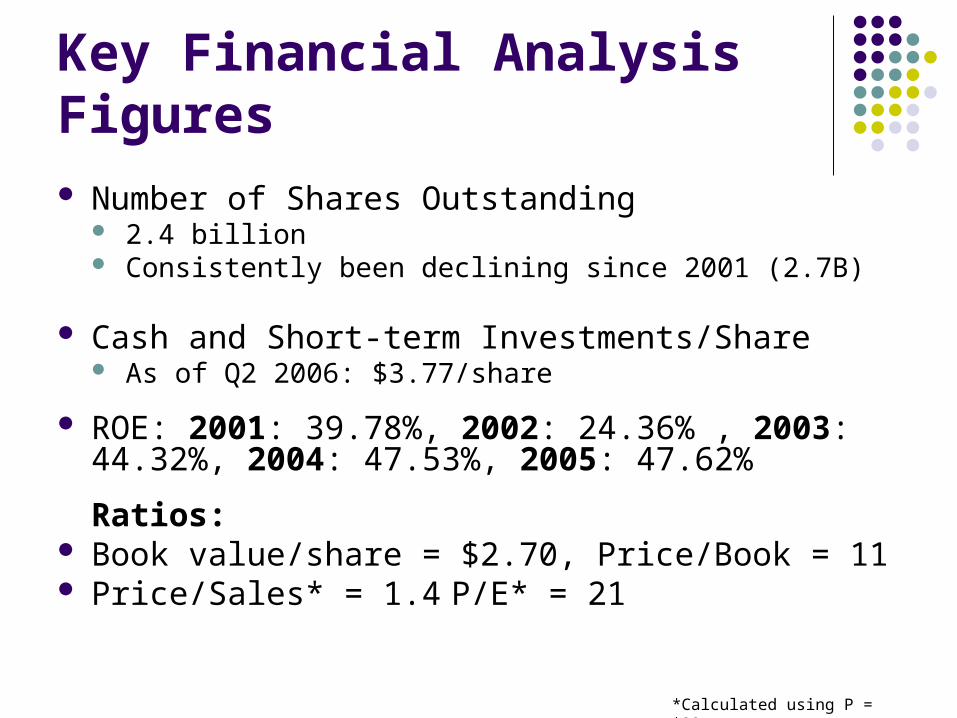
Key Financial Analysis Figures Number of Shares Outstanding
2.4 billion Consistently been declining since 2001 (2.7B)
Cash and Short-term Investments/Share As of Q2 2006: $3.77/share
ROE: 2001: 39.78%, 2002: 24.36% , 2003: 44.32%, 2004: 47.53%, 2005: 47.62%
Ratios: Book value/share = $2.70, Price/Book = 11 Price/Sales* = 1.4 P/E* = 21
*Calculated using P = $29

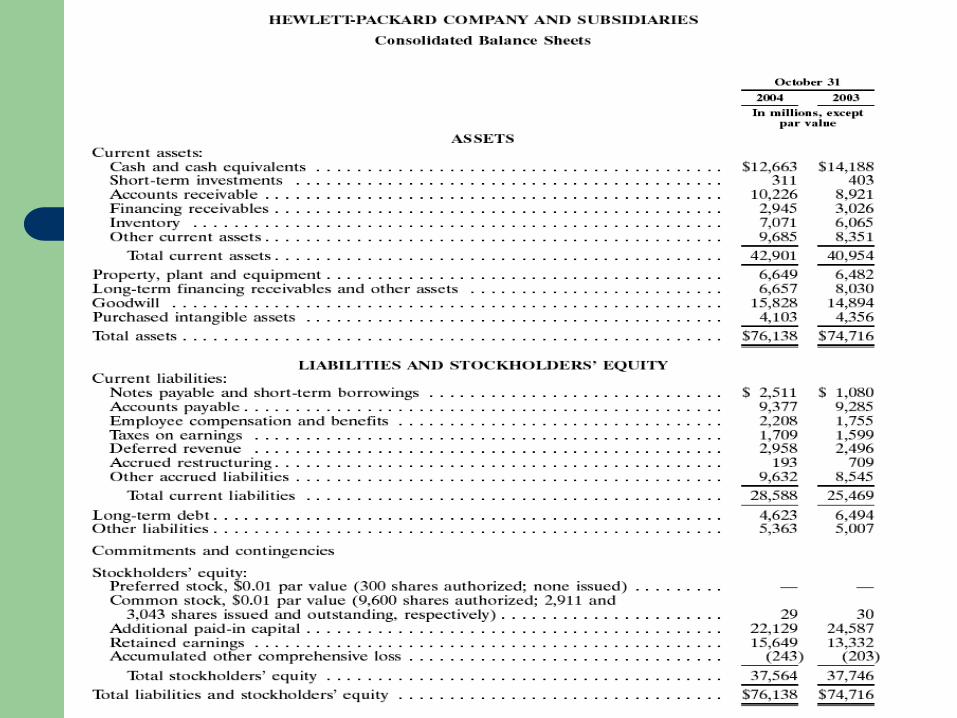
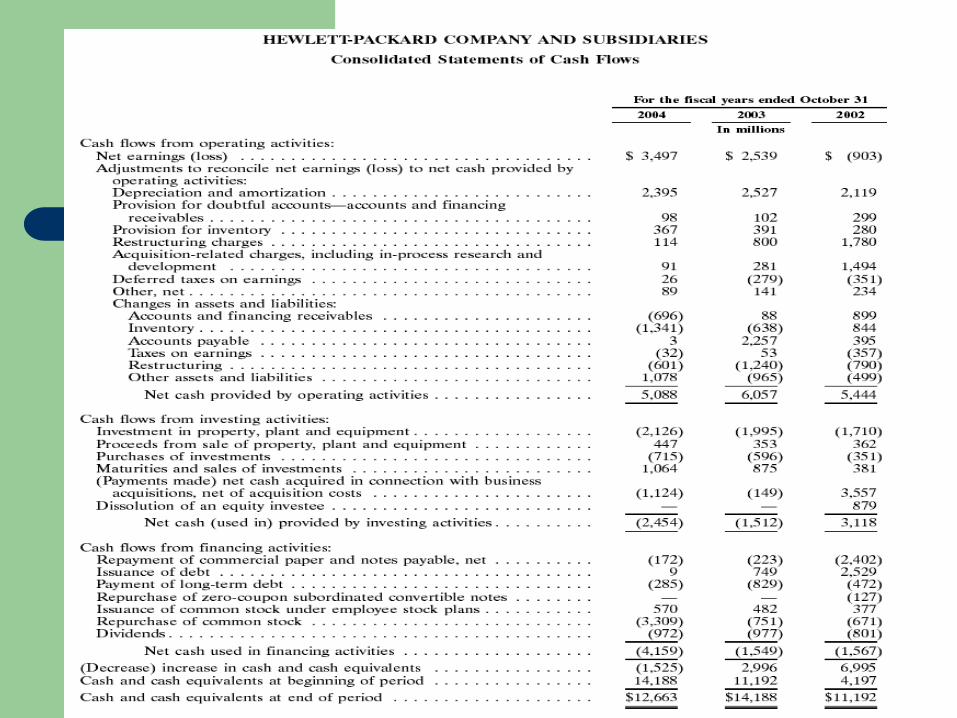
Financial Statements
Balance Sheet Income Statement Cash flow Statement

Stock Options
Average exercise price has steadily been increasing ($28.99 in 2005, compared to $8.78 in 2001)
As of Jan 28, 2005
As of Jan 31, 2003
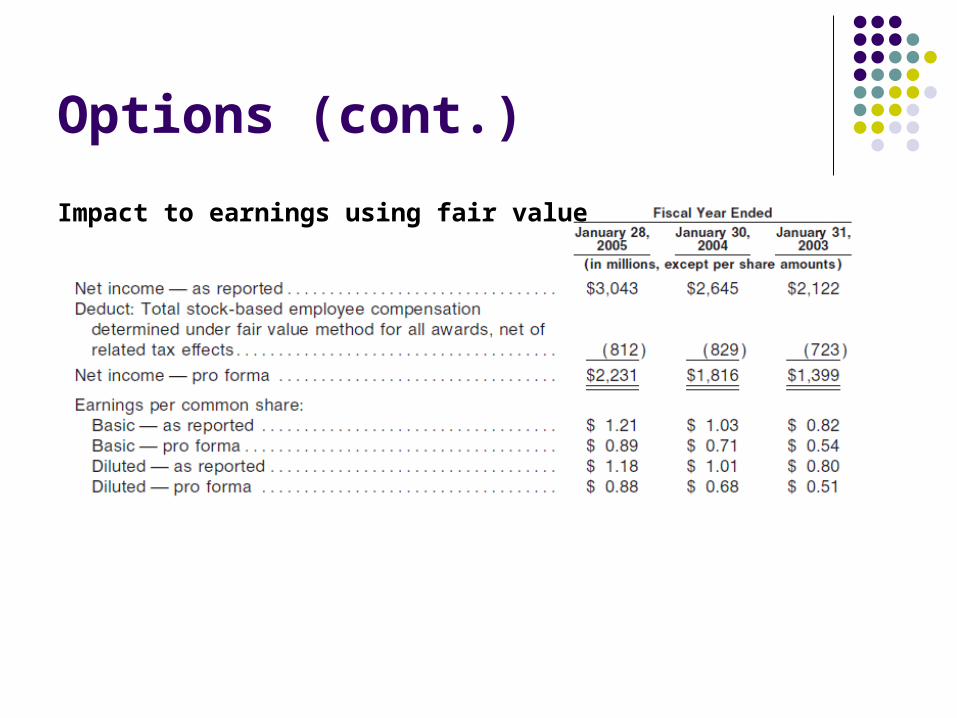
Options (cont.)
Impact to earnings using fair value

One Year Stock Price

10 Year Trading History
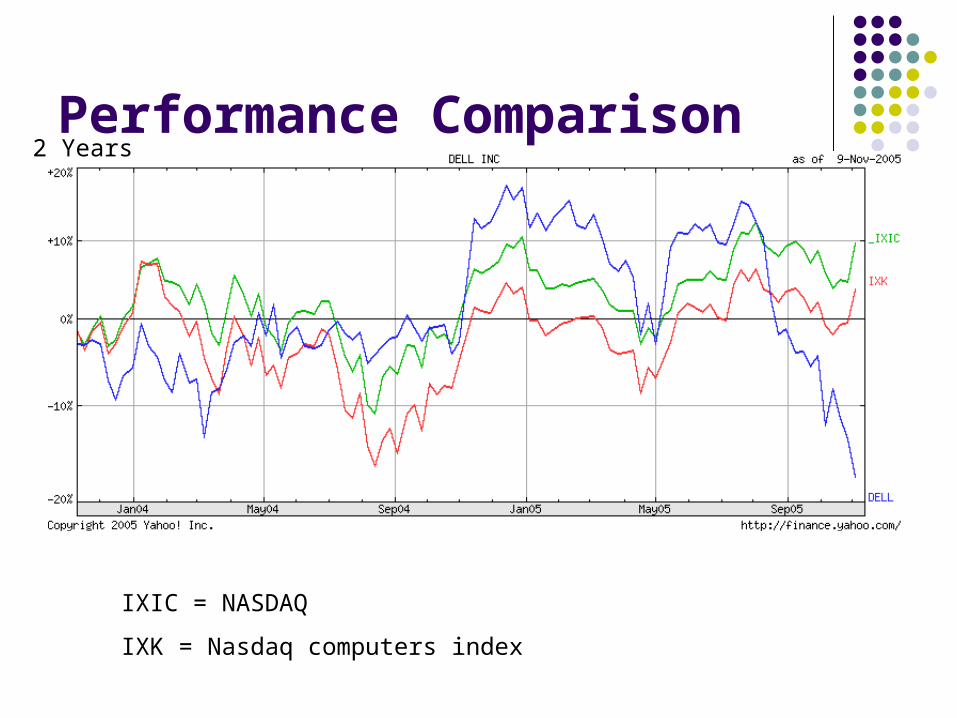
Performance Comparison
IXIC = NASDAQ
IXK = Nasdaq computers index
2 Years

Model Valuation
With the residual income model: Dell’s price should be between $15 and $25
depending on the assumptions used.
Since Dell does not pay a dividend we cannot use dividend models to calculate a price.
The FCFE model also does not work very well with the stocks that are in Dell’s industry Produces a price of $6 if the same k from the RI
model is used.
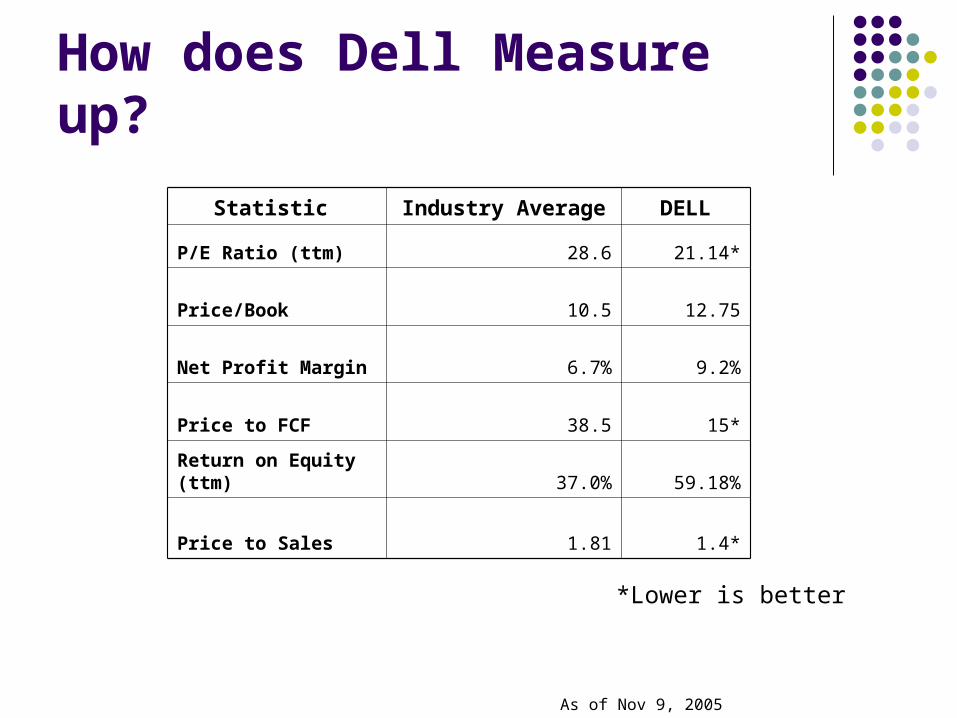
How does Dell Measure up?
Statistic Industry Average DELL
P/E Ratio (ttm) 28.6 21.14*
Price/Book 10.5 12.75
Net Profit Margin 6.7% 9.2%
Price to FCF 38.5 15*
Return on Equity (ttm) 37.0% 59.18%
Price to Sales 1.81 1.4*
As of Nov 9, 2005
*Lower is better

Value Drivers (cont.) Profits
Company has turned a profit year after year. Continued expense reduction and increasing
margins will help contribute to higher profits. Especially as international centres recently expanded
into mature. Share buy back and continued reduction in
gratuitous option issuance to execs Has a growing and already significant international
presence through diversifying it spreads risk of national economic/demand slowdowns
Value Drivers (Cont.) Growth
Market share available abroad in Asia-Pacific and Europe E-commerce forecasted to increase especially in Asia
Outside of the US, growth was over 30%. Has been strong for many years
Product/service expansion Printing and Imaging revenues rose from 0 to 1.2B in 2005 in just
under 2 years! Positioning themselves strategically within the emerging digital TV
segment, making partnerships with Microsoft and Intel Technology Changes/PC Replacement
Release of Windows Longhorn – may spur people to buy new computers with 64-bit capabilities
More than 35% of users plan to replace their computers in coming years (long-term avg. 20%)
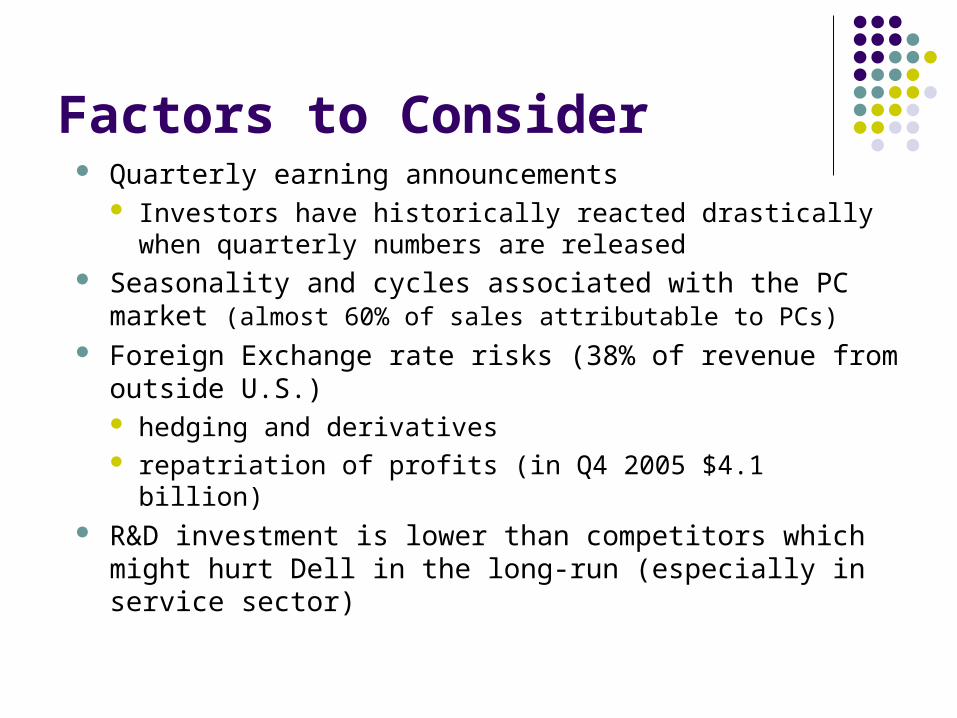
Factors to Consider Quarterly earning announcements
Investors have historically reacted drastically when quarterly numbers are released
Seasonality and cycles associated with the PC market (almost 60% of sales attributable to PCs)
Foreign Exchange rate risks (38% of revenue from outside U.S.) hedging and derivatives repatriation of profits (in Q4 2005 $4.1 billion)
R&D investment is lower than competitors which might hurt Dell in the long-run (especially in service sector)
1.951.65High Estimate
1.801.55Low Estimate
3233No. of Analysts
1.871.59Avg. Estimate
Next Year Jan-07
Current Year Jan-06
Earnings Est
Recommendation
Analysts:
Current Month Last Month Two Months AgoThree Months
Ago
Strong Buy 8 9 9 8
Buy 11 13 12 15
Hold 12 9 9 7
Sell 1 0 0 0
Strong Sell 0 0 0 0
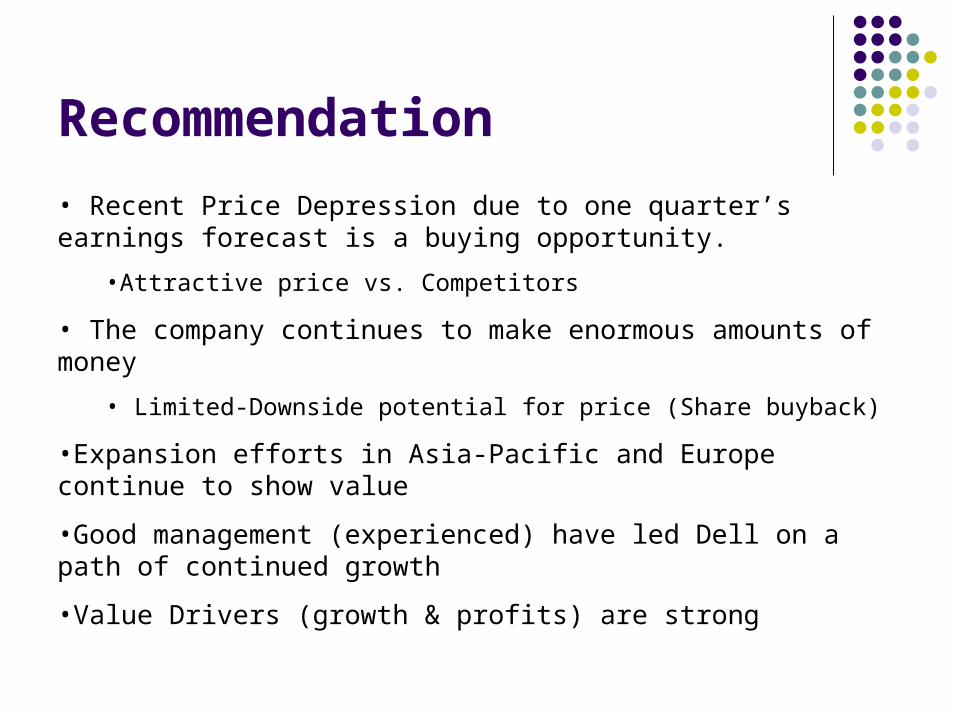
• Recent Price Depression due to one quarter’s earnings forecast is a buying opportunity.
•Attractive price vs. Competitors
• The company continues to make enormous amounts of money
• Limited-Downside potential for price (Share buyback)
•Expansion efforts in Asia-Pacific and Europe continue to show value
•Good management (experienced) have led Dell on a path of continued growth
•Value Drivers (growth & profits) are strong

Adam J Svoboda
Background
Founded in 1939 by Bill Hewlett and Dave Packard
First Product: Audio Oscillator
First Customer: Walt Disney
Went Public on: Nov 6, 1957

Management/Executives Mark Hurd - 2005 - Chief Executive Officer and
President. President and CEO of NCR since 2003 (25 years of experience)
Gilles Bouchard - Exec Vice President PSG (in Hp since 1989)
Vyomesh Joshi - Exec Vice President IPG since 1980
Randall D. Mott - Exec Vice President since 2005, with dell for 3 years
IN GENERAL: MOSTLY NEW BUT EXPERIENCED
Board of Directors
Lawrence T. Babbio, Jr. – 2002 Patricia C. Dunn - 1998 Richard A. Hackborn - 1992 Mark V. Hurd - 2005 Dr. George A. Keyworth II - 1986 Tom Perkins - 2005 Robert L. Ryan - 2004 Lucille S. Salhany - 2002 Robert P. Wayman - 2005
Current Events
HP takeover of Compaq - $25bn
New CEO – Mark Hurd
2005 – Profits fall
Compaq acquisition complete
Several other acquisitions have taken place
Snapshot – Compaq Merger May 7, 2002, largest merger computer industry
merger in history
$25 billion 1 Compaq share = 0.63 HP share Attempt to eliminate costs by reducing overlap
in sectors Was opposed by both Compaq and HP (family)
Corporate Objectives
Customer loyalty Profit Market leadership Growth Employees Leaders Global citizenship
Products and Services
Desktops and Workstations Notebooks and Tablet PCs Printers and multifunctional machines Handhelds and calculators Monitors and projectors Fax, Copiers and Scanners Digital Photography Storage Servers Networking Software
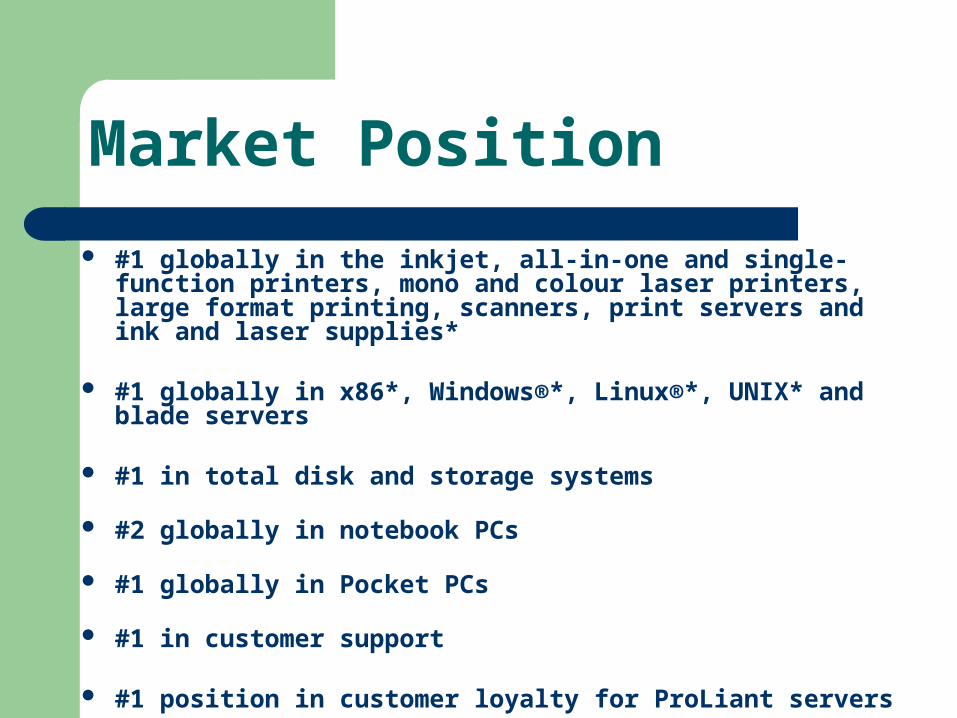
Market Position
#1 globally in the inkjet, all-in-one and single-function printers, mono and colour laser printers, large format printing, scanners, print servers and ink and laser supplies*
#1 globally in x86*, Windows®*, Linux®*, UNIX* and blade servers
#1 in total disk and storage systems
#2 globally in notebook PCs
#1 globally in Pocket PCs
#1 in customer support
#1 position in customer loyalty for ProLiant servers

HP Business Sectors
(PSG) Personal Systems Group (IPG) Imaging and Printing Group (ESS) Enterprise Storage and Servers (HPFS) HP Financial Services (HPS) HP Services Software Corporate Investments
(PSG) Personal Systems Group Commercial and consumer PC’s
Workstations, handheld computer devices and digital entertainment systems
Calculators
Software services for commercial and consumer markets

(IPG) Imaging and Printing Group
Printing, imaging and publishing devices
Both for home users and businesses
(ESS) Enterprise Storage and Servers
Storage and server products
Low and high end scalable servers e.g. Superdome
Enterprise arrays, storage area networks
(HPFS) HP Financial Services Leasing, financing, utility and asset recovery
services
Specialized financial services for small/medium businesses and educational and governmental entities.
(HPS) HP Services
Technology and consulting
Integration services
Managed services

Software
Software solutions including support
Infrastructure, operations and applications management
Corporate Investments
Labs and ‘business incubation’ projects.
Revenue is from selling network infrastructure products: enhancing computer and enterprise solutions.
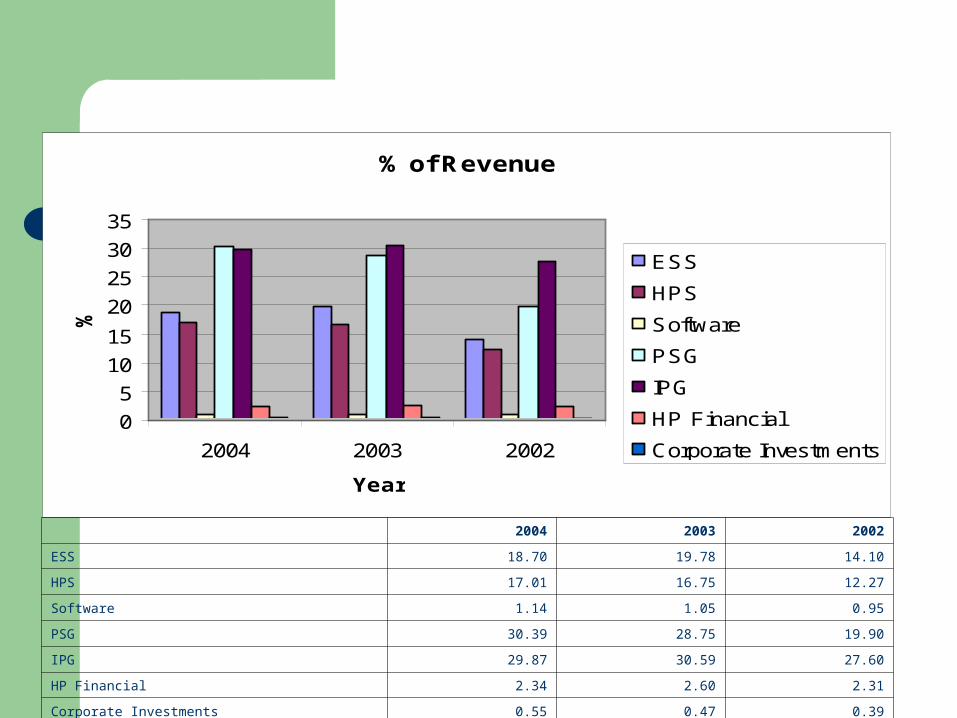
% Revenue by Sector% of Revenue
0
5
10
15
20
25
30
35
2004 2003 2002
Year
%
ESS
HPS
Software
PSG
IPG
HP Financial
Corporate Investments
2004 2003 2002
ESS 18.70 19.78 14.10
HPS 17.01 16.75 12.27
Software 1.14 1.05 0.95
PSG 30.39 28.75 19.90
IPG 29.87 30.59 27.60
HP Financial 2.34 2.60 2.31
Corporate Investments 0.55 0.47 0.39
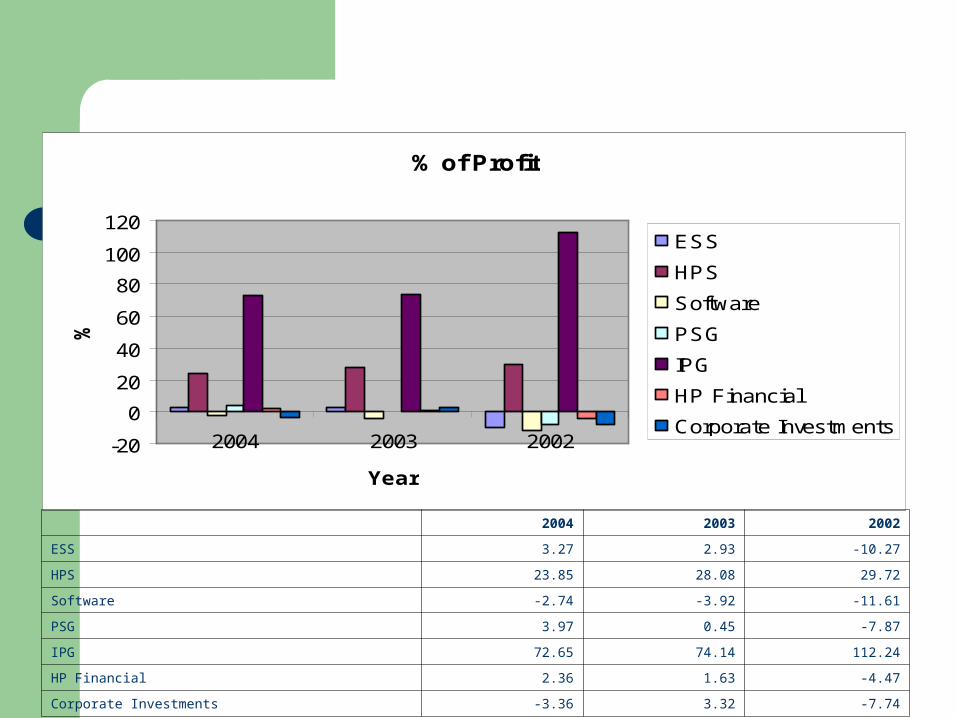
% Profit by Sector% of Profit
-20
0
20
40
60
80
100
120
2004 2003 2002
Year
%
ESS
HPS
Software
PSG
IPG
HP Financial
Corporate Investments
2004 2003 2002
ESS 3.27 2.93 -10.27
HPS 23.85 28.08 29.72
Software -2.74 -3.92 -11.61
PSG 3.97 0.45 -7.87
IPG 72.65 74.14 112.24
HP Financial 2.36 1.63 -4.47
Corporate Investments -3.36 3.32 -7.74

Earnings by Region
Revenue overview by region (in billions, for fiscal year 2003)
Americas (excluding
U.S.)6%
Japan4%
Asia Pacific11%
United States40%
Europe, Middle East,
Africa39%
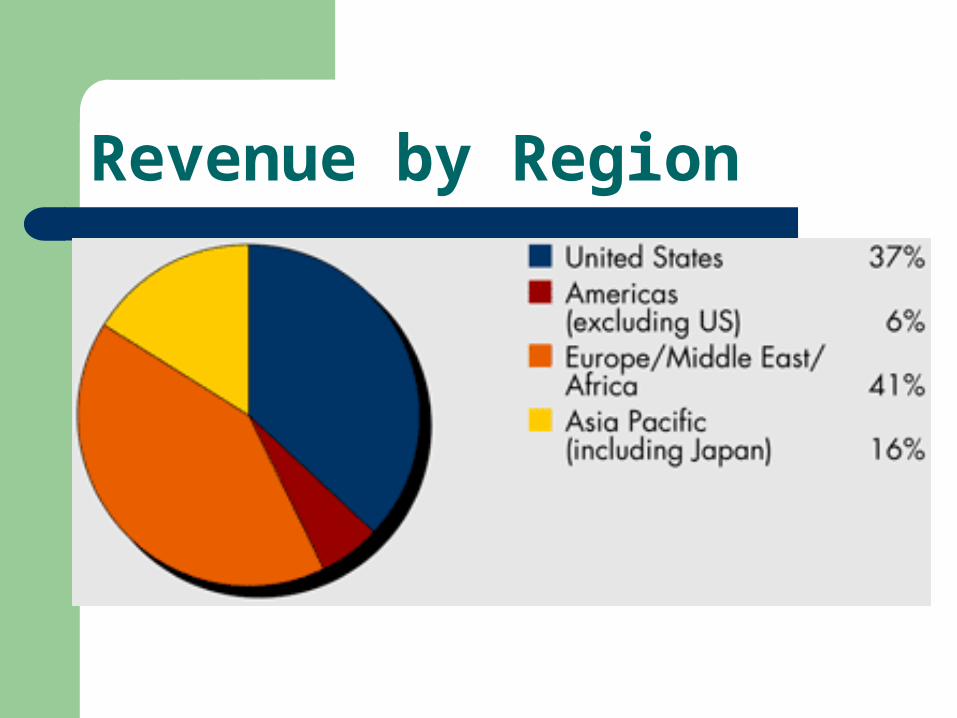
Revenue by Region

Analysis
% increase/decrease in 2003-2004 2002-2003
Revenue 9.37 29.11
Costs 7.86 21.81
Earnings on Operations 45.96 386.17
Net Earnings 37.73 381.17
% increase/decrease in 9 months of 2004 - 2005
Net Revenue 9.000957003
Net Expenses 8.931591637
Earnings from Operations 10.31313819
Net Earnings -17.62261014

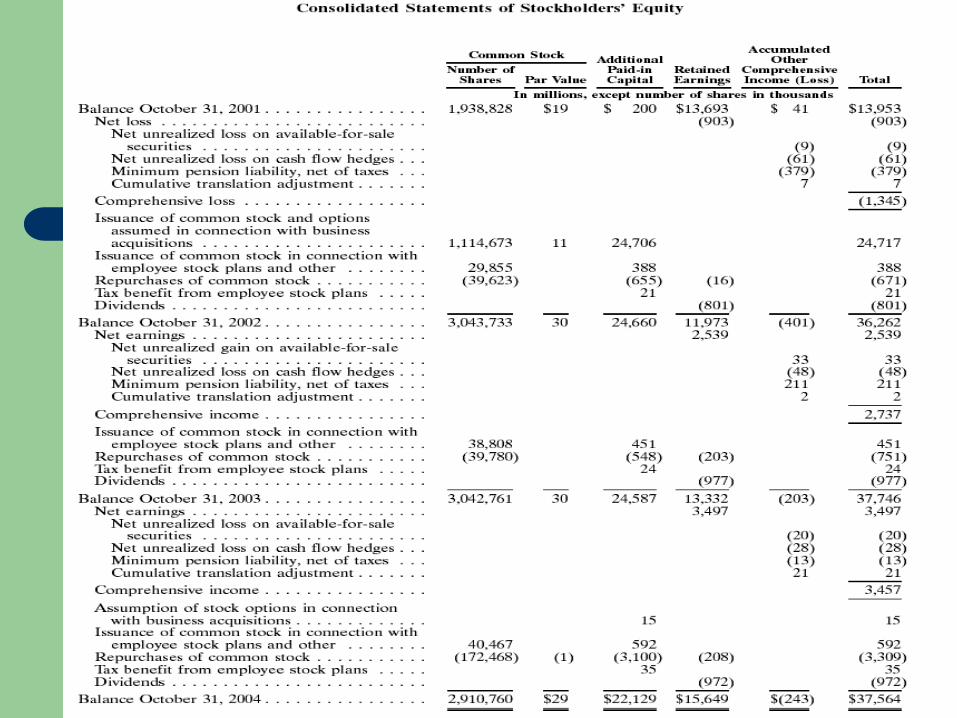
Shares
000’ 2004 2003 2002 2001
Balance 2,910,760 3,042,761 3,043,733 1,938,828
Issuance 111463
Repurchases 172468 39780 39623
Current – 2,907,000,000
Further $4bn buyback approved

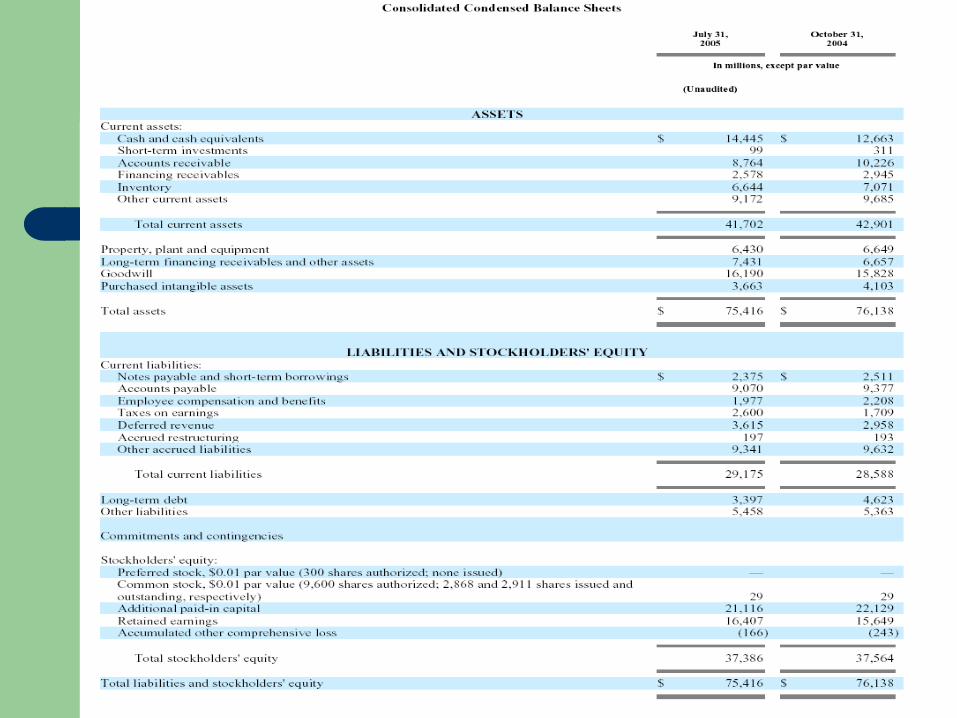
Financials
Dividend - $0.08 per quarter No stock splits since Dec 2000 (2 for 1) Year Est. EPS (10/05) 1.56 Price/Earnings (Trailing)18.695 Earnings Growth Rate17.200 Relative P/E1.053 Estimated P/E18.300

The stock as of 10 Nov 2005
Last 28.23 USD
Change -0.31
% Change (1) -1.09%
High 28.63
Open 28.4
Low 28.21
Net Volume 7,242,200
52 Wk High 29.51
Date 20/09/2005
52 Wk Low 18.85
Date 11/11/2004
Dividend 0.08
Div Date 12/09/2005
Market Cap 80,879 M
P/E Ratio 26.89
EPS 1.05

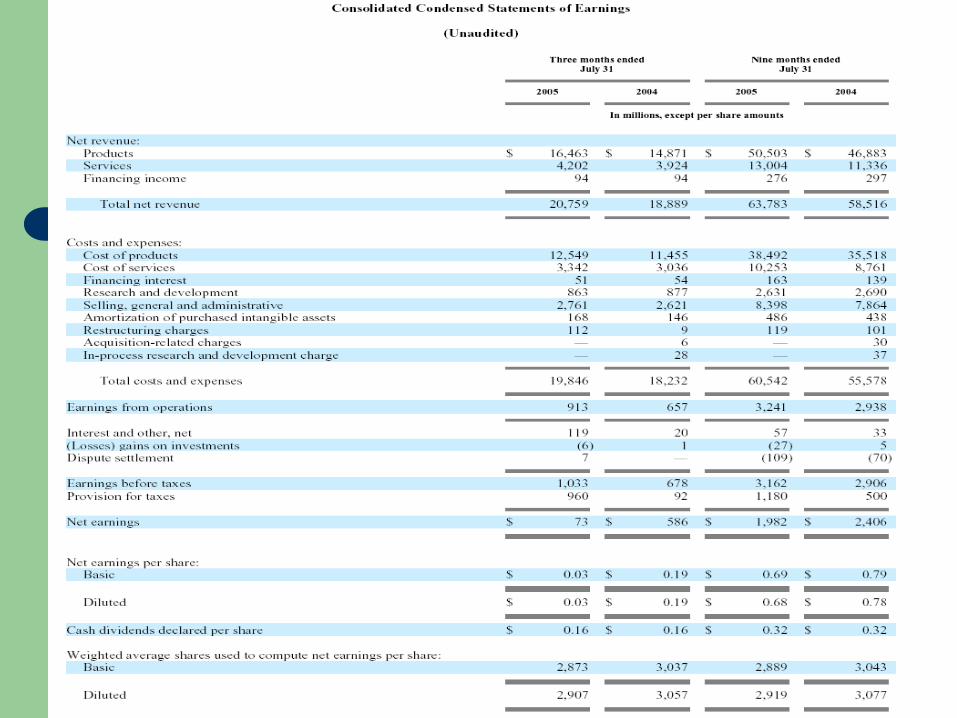

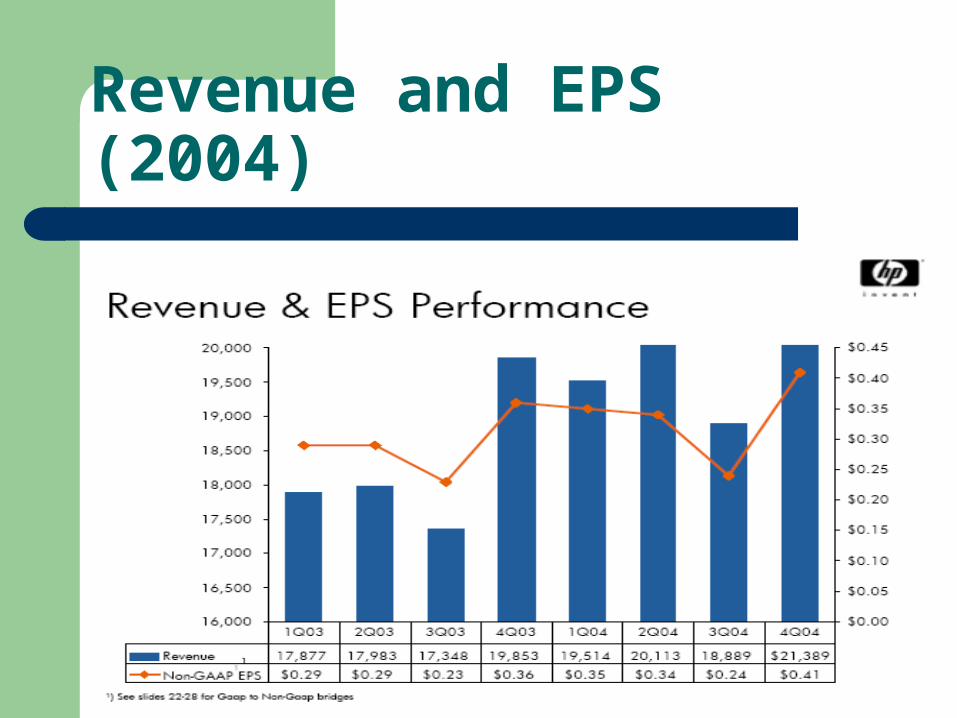
Revenue and EPS (2004)
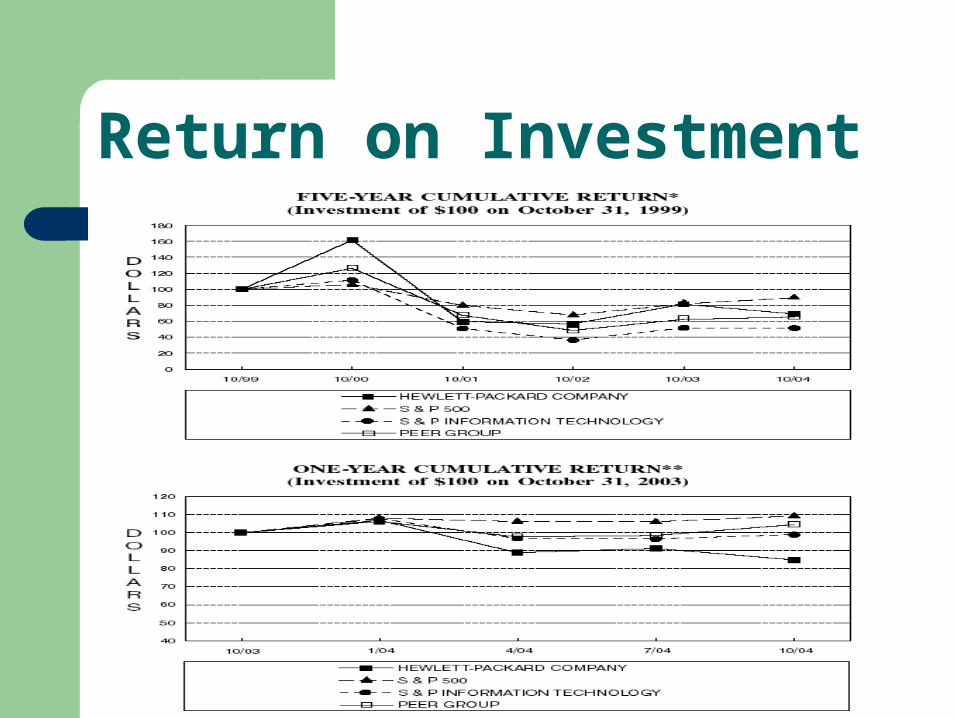
Return on Investment

Stock Performance

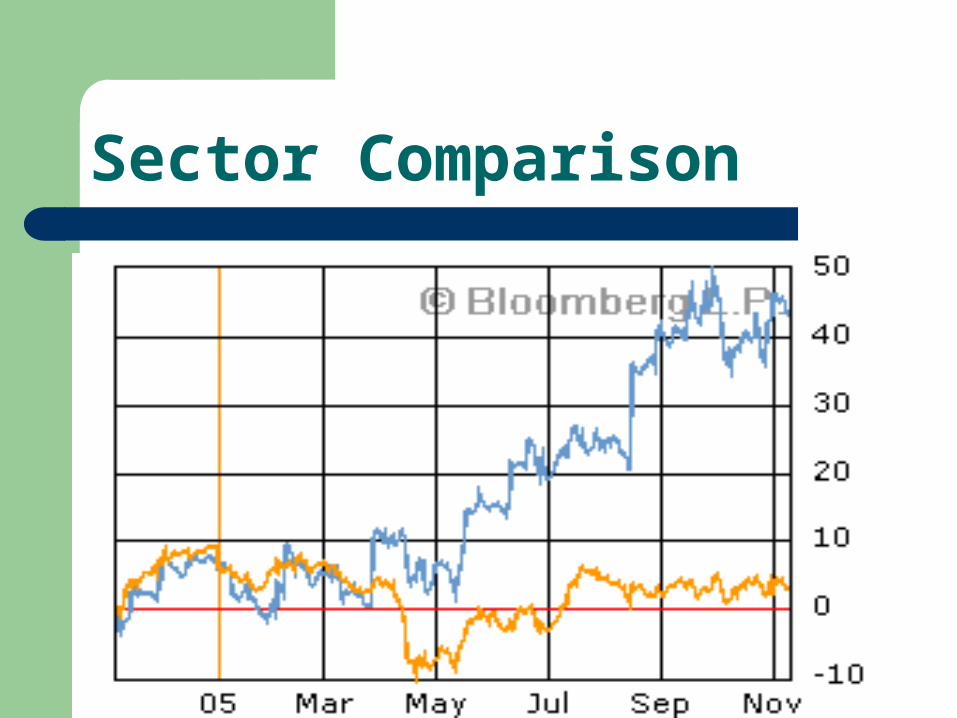
Sector Comparison
Factors affecting future performance Competition Inventory management ‘Staying on top of technological development’ Intellectual property rights Economic uncertainty Terrorism Political changes ‘business disruptions’

Inventory and Distribution
Big Box
BTO and CTO combined
High end and low end sales
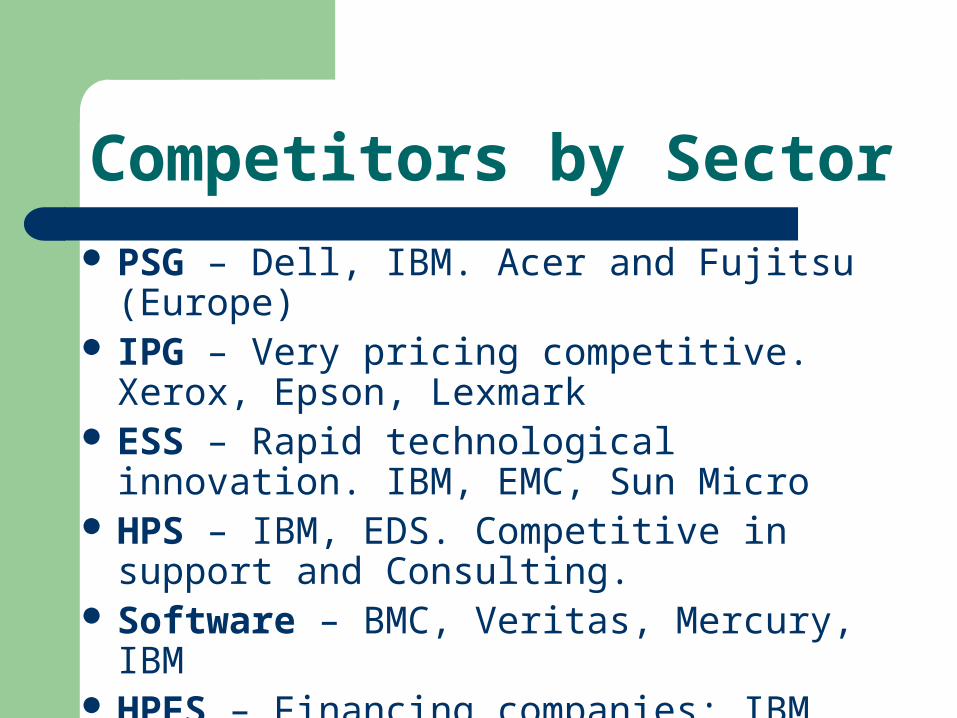
Competitors by Sector PSG – Dell, IBM. Acer and Fujitsu (Europe) IPG – Very pricing competitive. Xerox, Epson,
Lexmark ESS – Rapid technological innovation. IBM,
EMC, Sun Micro HPS – IBM, EDS. Competitive in support and
Consulting. Software – BMC, Veritas, Mercury, IBM HPFS – Financing companies: IBM Global
Financing, Banks and Financial Institutions

Moving Forward?
R&D – Constant at $3,500million Revenue increasing BUT so are costs Profits are sensitive to US$ exchange rate Several Business acquisitions $5billion authorized for share repurchases ($3b
remaining) Innovative and popular products Predicted fourth Q $22.2-$22.4bn Revenue – Up
10%

Acquisitions
Snapfish – Online photo service Scitex Vision – Super-wide digital printing RLX Technologies – Software provider Peregrine Systems – Management software Compaq – PC supplier ApplQ – open storage area network management
Market Leaders
The largest consumer IT company
The world's largest SMB IT company
A leading enterprise IT company
Also has a significant presence in the public sector as well as health and education

Philip Fisher
Production, Marketing, Research and Financial skills
Good The People Factor
New and old leaders - experienced Investment characteristics
Very diversified and continually evolving Price of the investment
Medium

Conclusion and Recommendation 2005 is a disappointing year New acquisitions bring a positive light Share buy-back
WEAK BUY (wait till
final results and evaluate!)

Gateway Inc.Technology You Trust

Values
Caring, honesty, teamwork, respect,aggressiveness, efficiency, fun and commonsense.
--- Offering products directly to customers, providing them with the best value for their money and unparalleled service and support

Company Background
Founded in 1985 in a farmhouse by Ted Waitt Went public in 1993 traded on NASDAQ Started trading on NY Stock Ex in 1997 3rd largest PC maker in U.S. In March 2004, acquired eMachines ($235 million) Currently 1,900 employees 6% of US market share in consumer segment

Distribution Channels
Direct distribution: web, phone, retail stores Indirect distribution: retailers like Costco Limited resellers in Canada and Mexico

Products
Computersdesktops, notebooks, all-in-ones, professional PCSystems (networking, servers and storage)
Computer accessoriesMouse, storage, memories, monitors, modems Consumer electronicsdigital TVs, digital camera, MP3 players, DVD
players
Software

Competitive Strategies in the 90’s
Gateway’ big box strategy and JIT
Direct +retail
Competitors:
Dell’s build-to-order, direct only, JIT
Compaq’s Build-to-forecast, retail only

Acquired Advanced Logic Research (ALR) in
1997 and announced its entry into corporate
network server market
Channeled through own retailing stores
Acquired ALR

Strategies in the 21st Century
• Encountered big loss from 2001failure of cost leadership strategyhigher cost and lower marginslow inventory turnover
• “Branded integrator”offered the fullest range of product and service
• B2B 2003
Acquiring eMachines
Acquired eMachines in March 2004
50 million new Gateway shares and $30 million cash
eMachines
Philosophy Build affordable computers for everyone – no
compromise PCs that deliver incredible value and performance.
Market budget-conscious consumers
Products PCs and peripheral displays
Distribution Channels 3rd party retailers: BestBuy, Office Depot
eMachines
2cnd largest vendor of desktop through US retailers
low-cost, full-featured computer systems $1.1 billions of sales in 2003 International market in Japan and UK Wayne Inouye, who joined eMachines in
2001 and quickly turned it into money-making business
What does eMashine bring to GTW
Low cost distribution model and retail relationaship
Highly efficient and profitable operation model
Market shares in consumer desktop sector International growth opportunities Management team

After Acquisition
eMachines CEO Wayne Inouye was named CEO of Gateway, succeeding Ted Waitt, who remains chairman and the company's largest stockholder 28.3% shares and plays an active role in long-term strategic direction, product development and marketing plans.
Combined management team from both Gateway and eMachine
A few new members joined management team

Management
Wayne R. Inouye (eMachine) CEO and President
Former president & CEO of eMachine since 2001
Senior vice president of PC merchandising for BestBuy
Scott Bauhofer, Senior vice president
Former senior vice president of BestBuy
bachelor's in history from San Francisco State University
Management
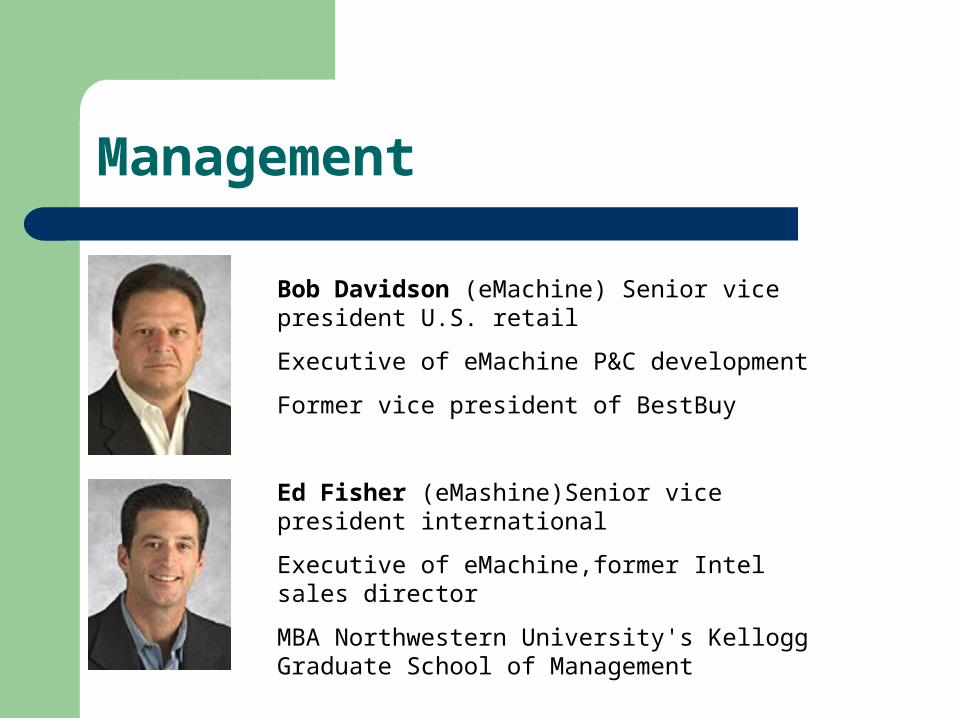
Bob Davidson (eMachine) Senior vice president U.S. retail
Executive of eMachine P&C development
Former vice president of BestBuy
Ed Fisher (eMashine)Senior vice president international
Executive of eMachine,former Intel sales director
MBA Northwestern University's Kellogg Graduate School of Management
Management
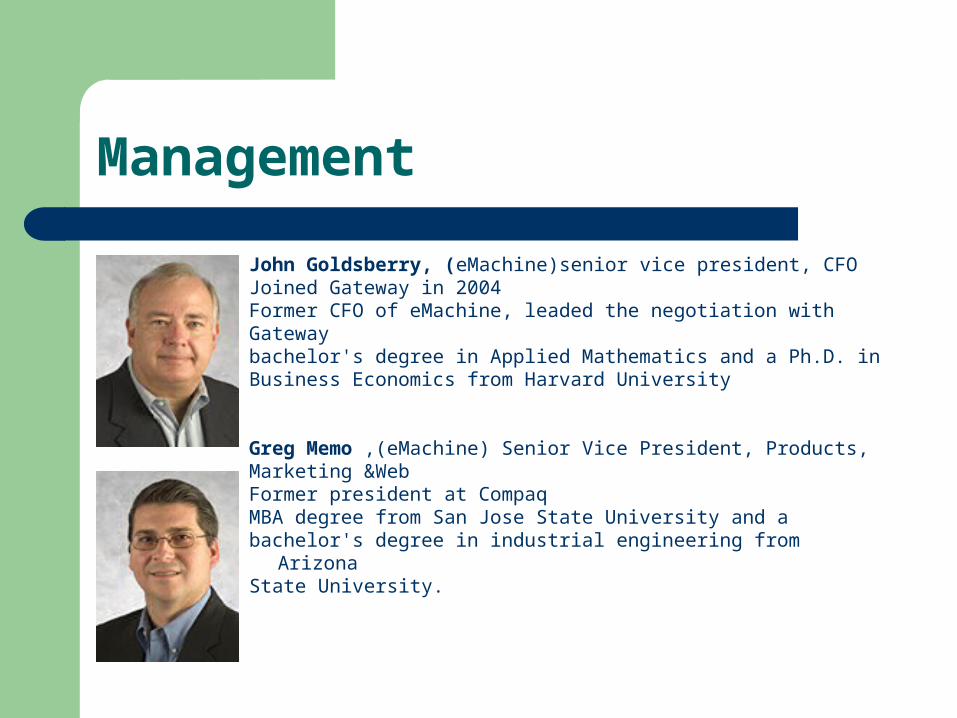
John Goldsberry, (eMachine)senior vice president, CFOJoined Gateway in 2004Former CFO of eMachine, leaded the negotiation withGatewaybachelor's degree in Applied Mathematics and a Ph.D. inBusiness Economics from Harvard University
Greg Memo ,(eMachine) Senior Vice President, Products,Marketing &WebFormer president at CompaqMBA degree from San Jose State University and abachelor's degree in industrial engineering from Arizona State University.

Management
Bruce K. Riggs, Senior Vice President, Operations and Customer careFormer senior vice president of Quanta Computer Inc and Dellbachelor's degree in Economics and Spanish at Lawrence University MBA from from Indiana University
Bruce W. Smith, senior vice president, professional lineFormer senior vice president of Equant, a global telecommunications-servicesmaster's degree in history from the University of Virginia bachelor's degree in history from The Johns Hopkins University

Management
Dan Stevenson, Vice President, DirectJoined Gateway in 2004Former senior director at Apple ComputerMBA from Harvard University and a bachelor's in accounting from Purdue University
Mike Zimmerman,(eMachine) Senior Vice President, Customer Care Services & Quality AssuranceFormer vice president and corporate planning at BestBuyBachelor's degree in business administration and marketing from Northwood University.

Corporate Goals
Profitably grow PC business Diversify revenue Increase gross margin with consumer
electronics products Reduce cost structure

Modified Strategies
Multi-branding Keep eMachine’s original marketing strategy Closed 188 Gateway owned retail stores Channel through big retailers New manufacturing model International markets (Japan, Mexico) Consolidated supply base Decrease employees from 7400-1900

Go-to-market strategy
Distribution Channels
eMachines brand sold worldwide by retailers Gateway products directly sold online and by
phone Gateway products sold in Canada, U.S.,
Mexico, and Japan by retailers Professional line (PCs, servers, service) sold
directly to organizations by sales force
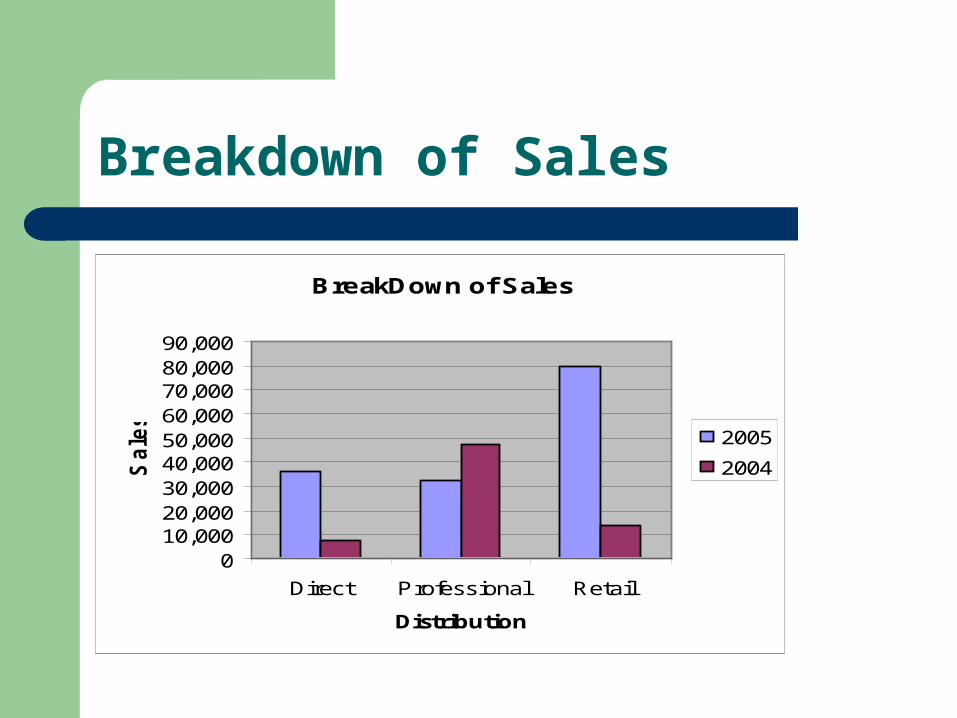
Breakdown of Sales
BreakDown of Sales
010,00020,00030,00040,00050,00060,00070,00080,00090,000
Direct Professional Retail
Distribution
Sale
s
2005
2004

Net Income
Net Income
-1200
-1000
-800
-600
-400-200
0
200
400
600
1997
1998
1999
2000
2001
2002
2003
2004
2005
Year
Net
Inco
me
Series1

Earning Per Share
EPS
-4
-3
-2
-1
0
1
2
Year
EP
S
Series1
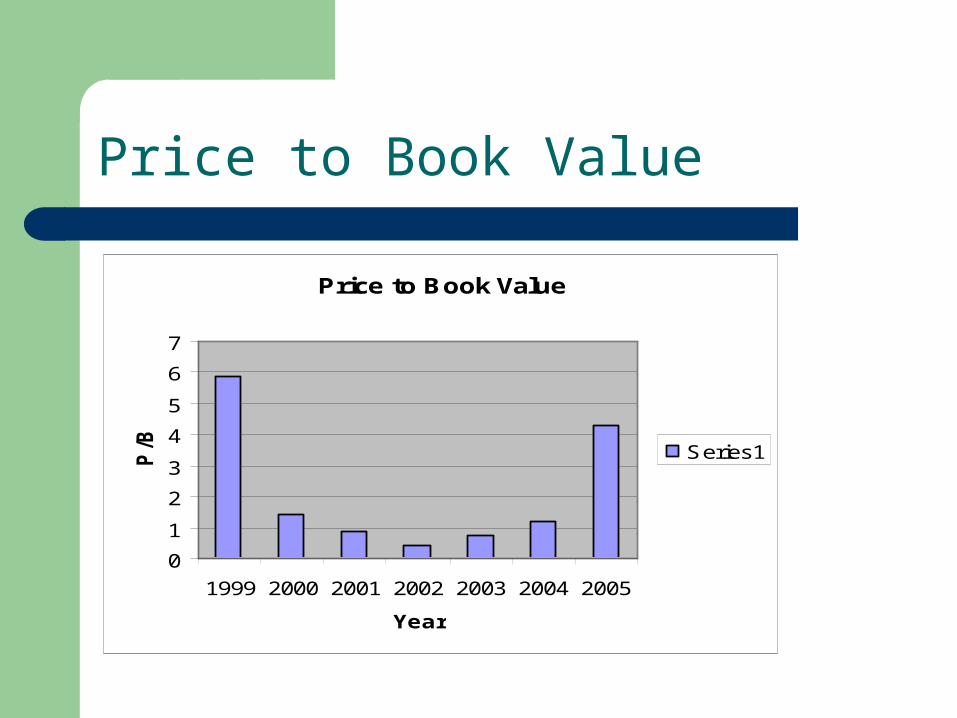
Price to Book Value
Price to Book Value
0
1
2
3
4
5
6
7
1999 2000 2001 2002 2003 2004 2005
Year
P/B Series1
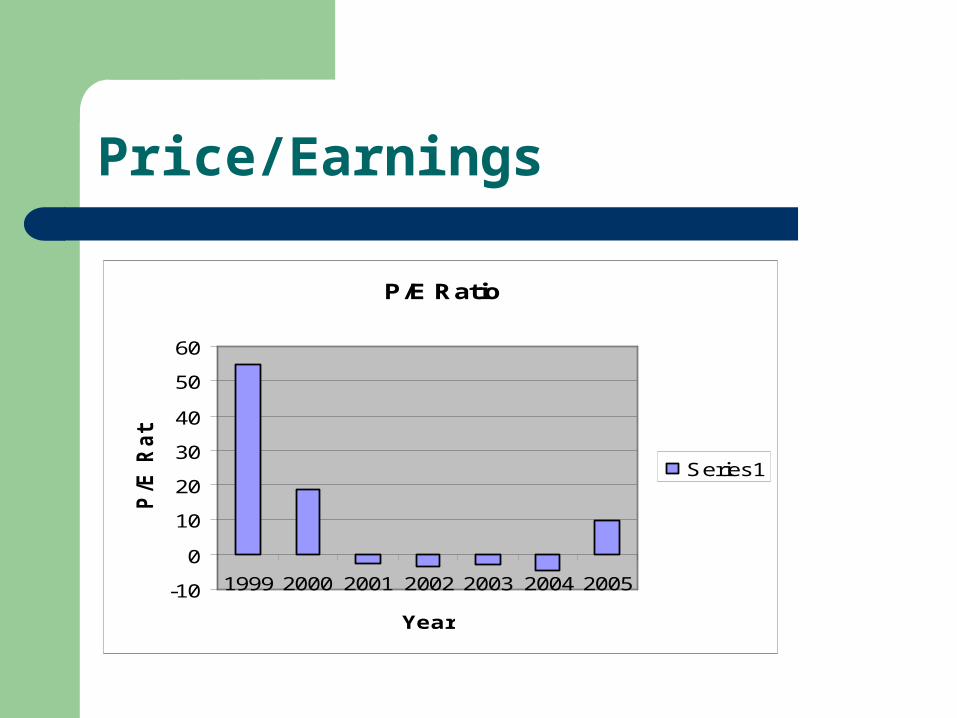
Price/Earnings
P/E Ratio
-10
0
10
20
30
40
50
60
1999 2000 2001 2002 2003 2004 2005
Year
P/E
Rati
o
Series1
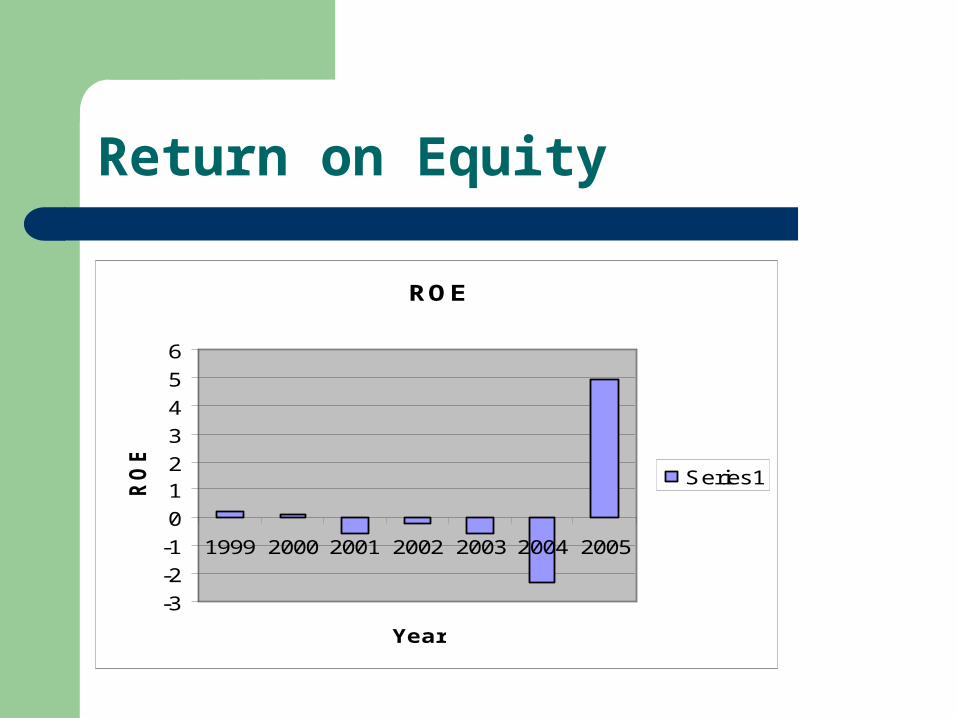
Return on Equity
ROE
-3
-2
-1
0
12
3
4
5
6
1999 2000 2001 2002 2003 2004 2005
Year
RO
E
Series1
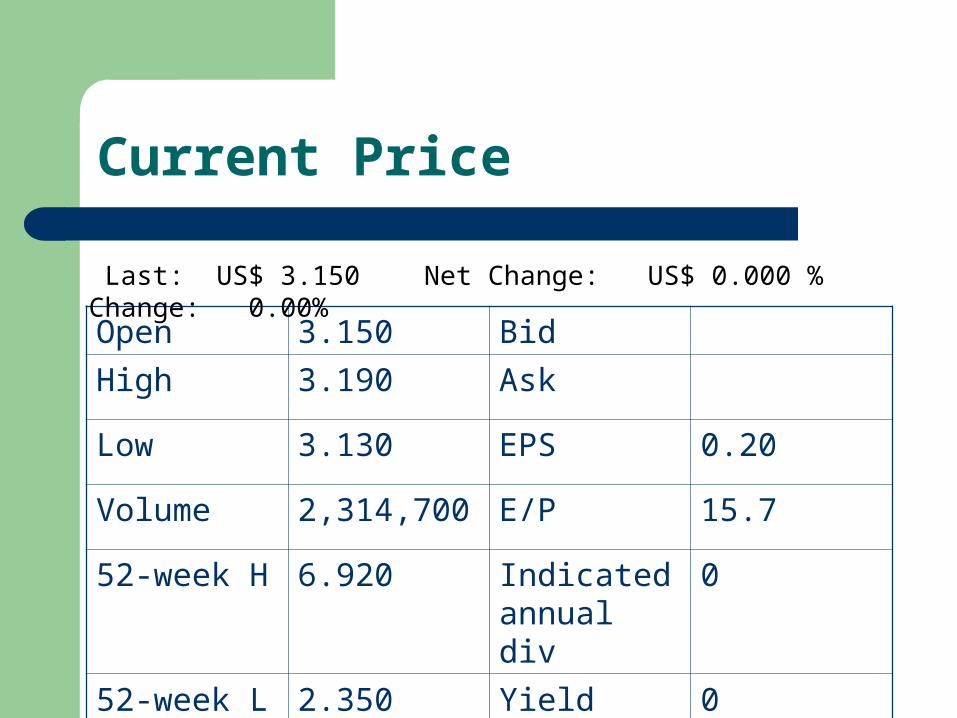
Current Price
Open 3.150 Bid
High 3.190 Ask
Low 3.130 EPS 0.20
Volume 2,314,700 E/P 15.7
52-week H 6.920 Indicated annual div
0
52-week L 2.350 Yield 0
Last: US$ 3.150 Net Change: US$ 0.000 % Change: 0.00%

Current Ratios
P/E Ratio9.26 Beta Coefficient1.87 Earnings per Share0.34 Market Cap (billion)1.17 B Shares Outstanding371,165,000
Ratios
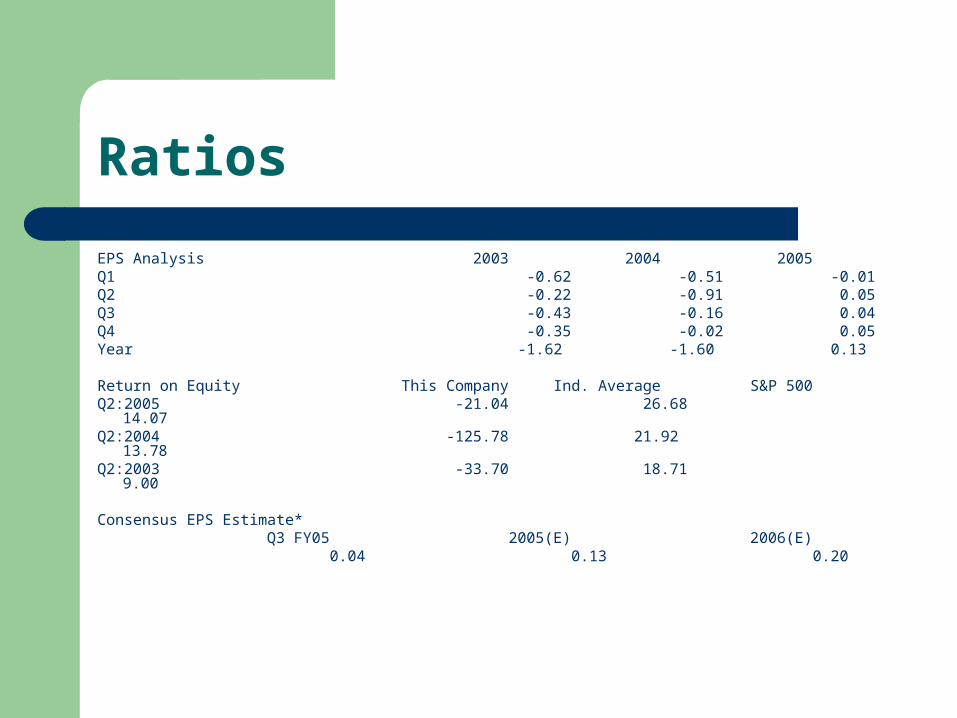
EPS Analysis 2003 2004 2005Q1 -0.62 -0.51 -0.01Q2 -0.22 -0.91 0.05Q3 -0.43 -0.16 0.04Q4 -0.35 -0.02 0.05Year -1.62 -1.60 0.13
Return on Equity This Company Ind. Average S&P 500Q2:2005 -21.04 26.68 14.07Q2:2004 -125.78 21.92 13.78Q2:2003 -33.70 18.71 9.00
Consensus EPS Estimate* Q3 FY05 2005(E) 2006(E) 0.04 0.13 0.20

Financial Statement
Income statement Balance sheet Cash flow statement

One-Year Price Chart
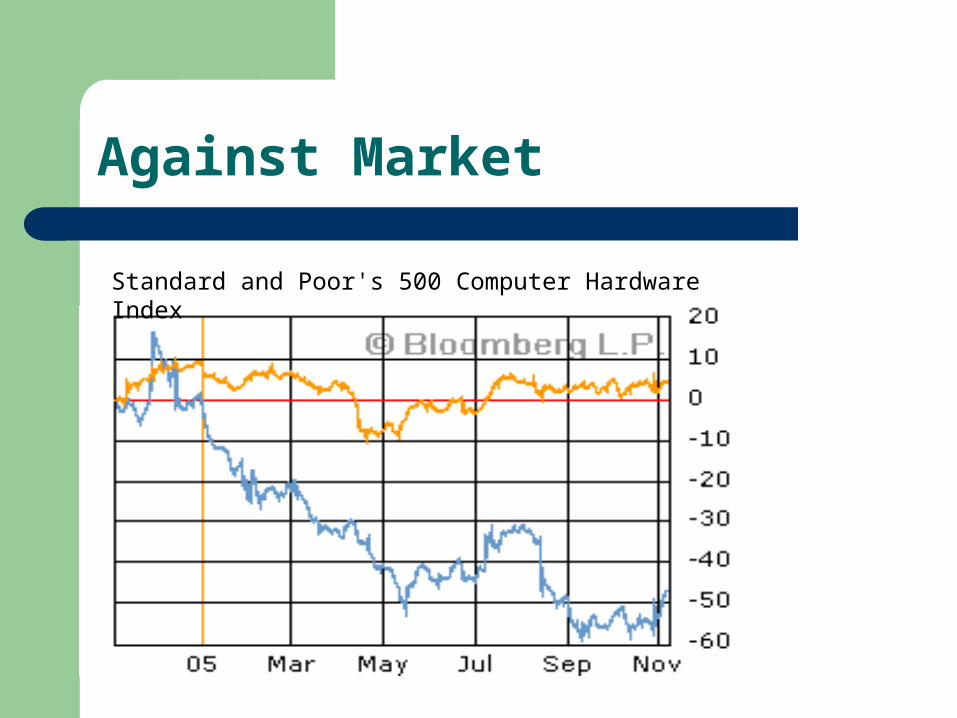
Against Market
Standard and Poor's 500 Computer Hardware Index
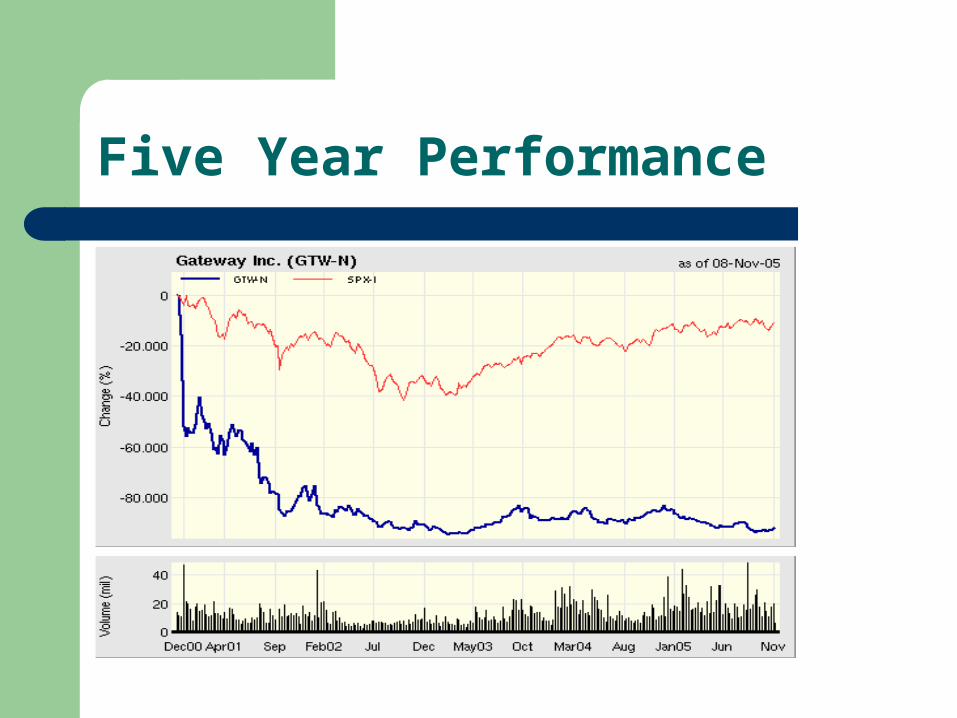
Five Year Performance

Share Repurchase
Repurchase of Preferred Stock and Convertible Note 2004 from America Online,
Series A and C Preferred Stock with a par value of $400 million plus 2.7 million common shares, for $315.6 million in cash and credits.
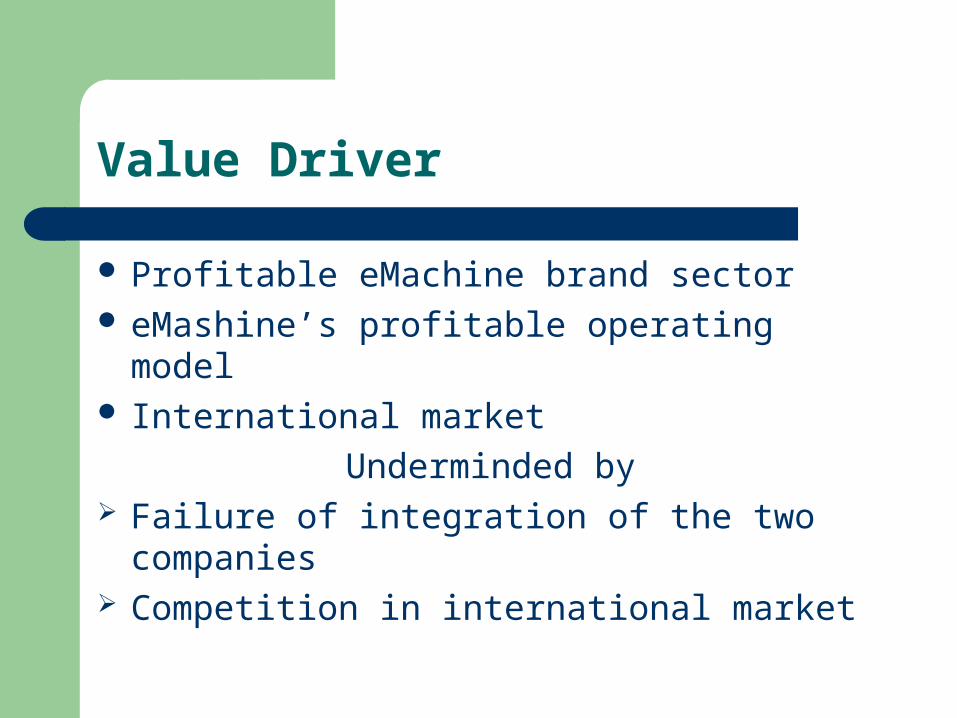
Value Driver
Profitable eMachine brand sector eMashine’s profitable operating model International market
Underminded by Failure of integration of the two companies Competition in international market

Forecasting
Opportunity to grow in international markets Maintain relationship with the big buyers Let us entertain you” is the new mantra of
computer industry. Previously, companies
focused solely on creating technology Competition:
Dell, Apple, HP

Competitive Landscape

Current Events
Closed three federal deals valued more than $20 million
$1.7 million deal with California Highway Patrol (CHP)
Hyper-threaded dual-core added Enters strategic alliance with LEAF Financial
and Merrill Lynch
Philip Fisher Approach
Production,Marketing, Research and Financial skills
Weak
The People Factor
Haven’t been with GTW for a long time Investment characteristics
Somewhat diversified Price of the investment
Low

Weak Hold
Conclusion