Embed Size (px)
Citation preview
Netherlands Environmental Assessment Agency, March 2010
Policy Studies
Emissions from the Netherlands: “How are we doing?”
The Netherlands Informative Inventory Report (IIR) contains
information on emission inventories in the Netherlands up to 2008,
describing methods, data sources, QA/QC activities carried out and
a trend analysis.
Its aim is to provide a better view on applicability (transparency
between countries, modeled air quality) and accountability
(transparency, completeness, consistency, strengths and weaknesses
in methods, uncertainties) of emission data.
So basically, it’s useful for inventory reviewers, modelers and
emission experts in general.
In the 1990–2008 period, emissions of all gases presented in this
report showed a downward trend. Major overall drivers for this trend
are emission reductions in industry, cleaner fuels and cleaner cars.
Netherlands Informative Inventory Report 2010

Netherlands Informative Inventory Report 2010
B.A. Jimmink, P.W.H.G. Coenen1, G.P. Geilenkirchen, A.J. Leekstra C.W.M. van der Maas, C.J. Peek, S.M. van der Sluis, D. Wever
1 Netherlands Organisation for Applied Scientific Research (TNO)
In cooperation with: National Institute for Public Health and the Environment
Netherlands Informative Inventory Report 2010© Netherlands Environmental Assessment Agency (PBL), March 2010PBL publication number 500080016
Corresponding Author: B.A. Jimmink; [email protected]
Parts of this publication may be reproduced, providing the source is stated, in the form: Netherlands Environmental Assessment Agency: Title of the report, year of publication.This publication can be downloaded from our website: www.pbl.nl/en. A hard copy may be ordered from: [email protected], citing the PBL publication number.
The Netherlands Environmental Assessment Agency (PBL) is the national institute for strategic policy analysis in the field of environment, nature and spatial planning. We contribute to improving the quality of political and administrative decision-making by conducting outlook studies, analyses and evaluations in which an integrated approach is considered paramount. Policy relevance is the prime concern in all our studies. We conduct solicited and unsolicited research that is both independent and always scientifically sound.
Office BilthovenPO Box 3033720 AH BilthovenThe NetherlandsTelephone: +31 (0) 30 274 274 5Fax: +31 (0) 30 274 44 79
Office The HaguePO Box 303142500 GH The HagueThe NetherlandsTelephone: +31 (0) 70 328 8700 Fax: +31 (0) 70 328 8799
E-mail: [email protected]: www.pbl.nl/en
Rapport in het kort 5
Emissies van luchtverontreinigende stoffen in Nederland 1990-2008 Dit rapport over de Nederlandse emissie-inventarisatie van grootschalige luchtverontreinigende stoffen licht de emissiecijfers toe die Nederland heeft geleverd aan het UNECE-secretariaat in het kader van de verplichtingen onder de Convention on Long-range Transboundary Air Pollution (CLRTAP), en aan de Europese Commissie in het kader van de verplichtingen onder de NEC1-richtlijn. De door Nederland gerapporteerde emissiecijfers zijn te vinden op de EMEP2-website: http://www.emep-emissions.at/ (EMEP data) en www.emissieregistratie.nl.
De IIR 2010 biedt een beter zicht op de toepasbaarheid (vergelijkbaarheid tussen landen, modelberekeningen voor luchtkwaliteit door EMEP) en afrekenbaarheid (transparantie, compleetheid, consistentie tussen jaren, sterkte en zwaktes in methoden, onzekerheden) van emissiecijfers. In de periode 1990–2008 vertonen de emissies van SO2, NOX, NMVOC, CO, NH3, zware metalen en persistente organische vervuilende stoffen (POP’s) een neerwaartse trend. De belangrijkste oorzaken van deze trend zijn emissiereductie maatregelen in industriële sectoren, schonere brandstoffen en schonere auto’s.
Het laatste hoofdstuk over projecties geeft methodes, gegevensbronnen en aannames weer, die gebruikt zijn bij het schatten van ramingen per sector.
Rapport in het kort
1 National Emissions Ceilings Directive.
2 Co-operative Programme for Monitoring and Evaluation of the Long-
range Transmission of Air Pollutants in Europe (EMEP).

Netherlands Informative Inventory Report 20106
Contents 7
Inhoud
�� Rapport in het kort 5
�� Acknowledgement 9
�� Summary 11
�� 1 Introduction 131.1 National inventory background 131.2 Institutional arrangements for inventory preparation 131.3 The process of inventory preparation 141.4 Methods and data sources 151.5 Key source analysis 161.6 Reporting, QA/QC and archiving 171.7 Uncertainties 181.8 Explanation on the use of notation keys 191.9 Missing sources 20
�� 2 Trends in emissions 212.1 Trends in national emissions 212.2 Trends in sulphur dioxide (SO2) 222.3 Trends in nitrogen oxides (NOx) 232.4 Trends in ammonia (NH3) 242.5 Trends in non-methane volatile organic compounds (NMVOC) 252.6 Trends in PM10 262.7 Trends in PM2.5 272.8 Trends in PAH 28
�� 3 Energy, stationary fuel combustion (1A) 293.1 Energy industries (1A1) 293.2 Manufacturing industries and construction (1A2) 303.3 Other sectors (1A4) 303.4 Other (1A5) 323.5 Mobile combustion (1A3) 323.6 Evaporation, tyre and brake wear, road abrasion (1A3b) 353.7 Energy, fugitive emissions from fuels (1B) 35
�� 4 Industry (2) 374.1 Overview of the sector 374.2 Mineral production (2A) 374.3 Chemical industry (2B) 384.4 Metal production (2C) 384.5 Pulp and paper (2D1) 394.6 Food and drink production (2D2) 394.7 Other production (2G) 39
Netherlands Informative Inventory Report 20108
�� 5 Solvents and product use (3) 415.1 Overview of the sector 415.2 Paint application (3A) 415.3 Degreasing and dry cleaning (3B) 415.4 Other, including products containing HMs and POPs (3D) 41
�� 6 Agriculture (4) 436.1 Dairy cattle (4B1A) 436.2 Non-dairy cattle (4B1b) 436.3 Swine (4B8) 446.4 Poultry (4B9) 446.5 Synthetic N-fertilisers (4D1a) 446.6 Farm-level agricultural operations including storage, handling
and transport of agricultural products (4D2a) 44
�� 7 Waste (6) 457.1 Waste incineration (6C) 457.2 Other waste (6D) 45
�� 8 Other (7) 47
�� 9 Recalculations and other changes 499.1 Recalculations of the 2010 submission 499.2 Improvements 49
�� 10 Projections 5110.1 Energy 5110.2 Industrial processes 5210.3 Agriculture 52
�� References 53
�� Colophon 55
Acknowledgement 9
Acknowledgement
The methods and results presented in this report are the product of close collaboration within the ER-team and invol-ving institutions and individuals throughout the Netherlands.
In particular, the ER-team acknowledges: � The Directorate for Climate Change and Air Quality of the
Dutch Ministry of Housing, Spatial Planning and the Envi-ronment, Mr. J. Wijmenga and Mr. J. Sliggers in particular, for their continued support,
� Annemieke Righart, editor at the Netherlands Environmen-tal Assessment Agency, for English-language editing of the chapters,
� The RIVM’s graphic department for the design and lay-out of this report, in particular Martin Middelburg.

Netherlands Informative Inventory Report 201010
Summary 11
Emissions of transboundary air pollutants in the Nederlands 1990-2008 This report, constituting the Netherlands Informative Inventory Report (IIR), contains information on emission inventories in the Netherlands, from 1990 up to 2008 (see www.prtr.nl and EMEP1 data on http://www.emep-emissions.at/). It includes descriptions of methods and data sources, QA/QC activities carried out and a trend analysis.
This IIR outlines such methods for estimating emissions as the extrapolation of emissions from individual companies to sectors. Estimations are given in more detail for sector and subsector for the key source categories (e.g. emission calculation from road transport in vehicle categories and road types).
In the 1990 – 2008 period emissions of SO2, NOX, NMVOC, CO, NH3, heavy metals and persistent organic pollutants (POPs) showed a downward trend. The major overall drivers for this trend are emission reductions in the industrial sectors, cleaner fuels and cleaner cars.
The final chapter on emission projections includes descriptions of methods, assumptions and data sources, used to estimate projected emissions per sector.
Summary
1 Co-operative Programme for Monitoring and Evaluation of the Long-
range Transmission of Air Pollutants in Europe (EMEP).

Netherlands Informative Inventory Report 201012
Introduction 13
Reporting emission data to the Executive Body of the Convention on Long-range Transboundary Air Pollution (CLRTAP) is required to fulfil obligations in compliance with the implementation of Protocols under the Convention. Parties are required to submit reports on annual national emissions of SO2, NOX, NMVOC, CO, NH3 and various heavy metals and POPs using the Guidelines for Estimating and Reporting Emission Data under the CLRTAP (UNECE, 2009).
The Netherlands Informative Inventory Report (IIR) 2010 contains information on the Netherlands’ inventories for the years 1990 to 2008, including descriptions of methods, data sources, QA/QC activities carried out and a trend analysis. The inventory covers all anthropogenic emissions to be reported in the Nomenclature for Reporting (NFR), including individual polycyclic aromatic hydrocarbons (PAHs), which are to be reported under persistent organic pollutants (POPs) in Annex IV.
1.1 National inventory background
Emissions in the Netherlands are registered in the Netherlands Pollutant Release and Transfer Register (PRTR). This PRTR database is the national database for target group monitoring, set up to monitor pollutants within the framework of National Emission Ceilings (EU), the Convention on Long-range Transboundary Air Pollution (CLRTAP), and to monitor the greenhouse gas emissions in conformance with United Nations Framework Convention on Climate Change (UNFCCC) requirements and the Kyoto Protocol (National System). PRTR encompasses the process of data collection, data processing, registration and reporting on emission data for some 350 compounds, and compound groups in air, water and soil. Emission data (for the most important pollutants) and documentation can be found at www.prtr.nl.
Emission estimates are based on official statistics of the Netherlands, e.g. energy and agricultural statistics as well as environmental reports of companies in the industrial sector and emission factors (both nationally developed and internationally recommended factors).
The Netherlands uses the ‘Guidelines for Estimating and Reporting Emission Data’ for reporting to the Economic Commission for Europe (UNECE) Convention on Long-range Transboundary Air Pollution (CLRTAP). However, instead of using the EMEP/CORINAIR Emission Inventory Guidebook
(EEA, 2005), the Netherlands often applies country-specific methods, including monitoring data and emission factors.
1.2 Institutional arrangements for inventory preparation
The Dutch Ministry of Housing, Spatial Planning and the Environment (VROM) has the overall responsibility for the emission inventory and submissions to CLRTAP. A Pollutant Release and Transfer Register (PRTR) system has been in operation in the Netherlands since 1974. From 2004 onwards, the Ministry of VROM has outsourced the full coordination of the PRTR to the Emission Registration team (ER-team) at the Netherlands Environmental Assessment Agency (PBL). The year 2010 marks the transition of responsibilities and staff of the ER-team from PBL to the National Institute for Public Health and the Environment (RIVM). This change in institutional arrangement will take effect in the IIR2011.
The main objective of the emission inventory is to produce an annual set of unequivocal emission data, which is up-to-date, complete, transparent, comparable, consistent and accurate. Emission data are produced in an annual (project) cycle (PBL, 2009) and various external agencies contribute to the PRTR by performing calculations or submitting activity data (see next section). Besides the PBL, the following institutes contribute to the PRTR:
� Statistics Netherlands (CBS); � Netherlands Organisation for Applied Scientific Research
(TNO); � RWS Centre for Water Management (RWS-WD) � Deltares � Alterra WUR � NL Agency (Waste management division); � Agricultural Economics Research Institute (LEI); � Facilitating Organisation for Industry (FO-I), which
coordinates annual environmental reporting (AER) by companies.
Each of the contributing institutes has its own responsibility and role in the data collection, emission calculations and quality control. These are laid down in general agreements with PBL and in the annual project plan (PBL, 2009).
Introduction 1
Netherlands Informative Inventory Report 201014
1.3 The process of inventory preparation
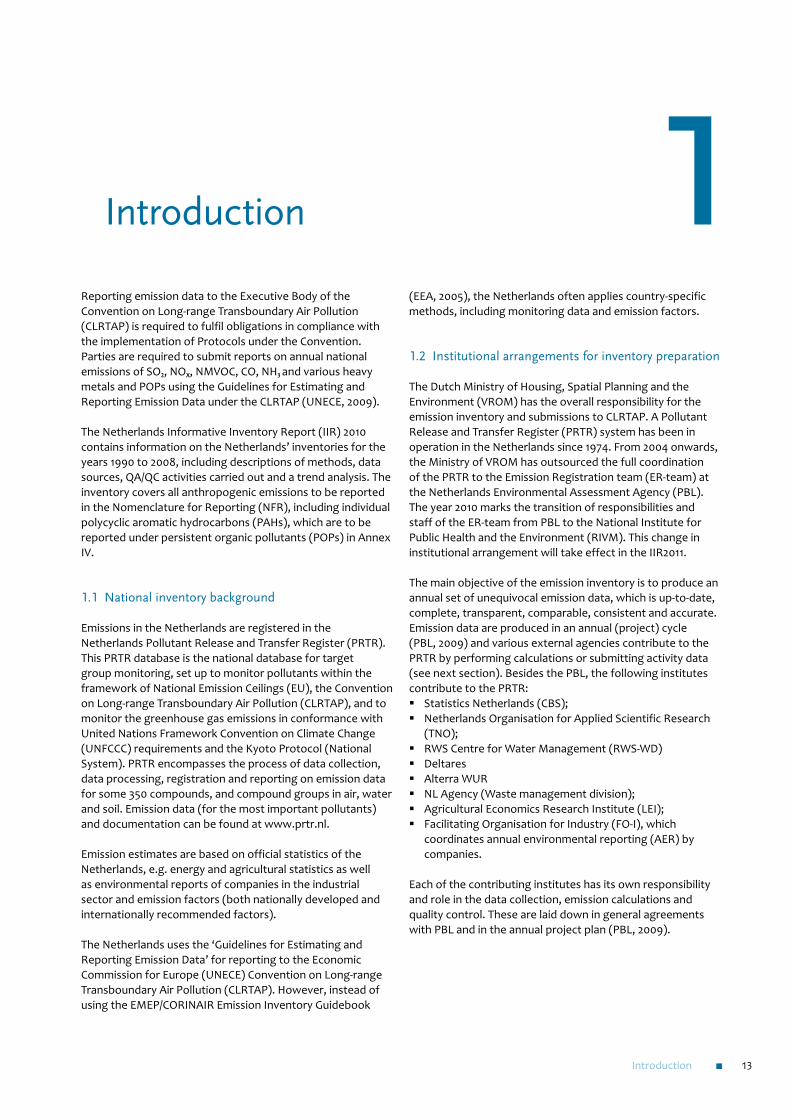
Data collection For the collection and processing of data (according to pre-determined methods), the PRTR is organised in task forces. The task forces are formed by sector experts of the participating institutes. Methods are compiled on the basis of the best available scientific views. Changes in scientific views lead to changes in methods, and to recalculation of the historical emissions. The following task forces are recognised (see Figure 1.1):
� task force on agriculture and land use; � task force on energy, industry and waste; � task force on traffic and transport;
� task force on water and, � task force on product use and service sector.
Every year, after collection of the emission data, several quality control checks are performed in the task forces during a yearly ‘trend analysis’ workshop. After approval by participating institutes, emission data are released for publication. Subsequently, emission data is des-aggregated to regional emission data for national use (e.g. 5x5 km grid data for provinces).
The organisational arrangement of the Netherlands Pollutant Release and Transfer Register (PRTR).
Figure 1.1PRTR Organisational arrangement
Ministry of VROM:dir. Climate and Air quality,
Ministry of LNV:dir. Agriculture Ministry of V&WDirectorate-General for Public Works and Water Management:• Centre for Transport and Navigation• Centre for Water Management
PRTR Steering body• Sponsors: – Ministry of VROM; – Ministery of V&W; – Ministry of LNV;• DCMR;• PBL;• RIVM.
Personel (expertise) through general agreements and contracts with:• CBS (Statistics Netherlands)• RWS Centre for Water Management• NL Agency• PBL• TNO• LEI• Alterra WUR• Deltares• FO-I
Project leader PRTRat PBL.
PRTR Executive body (WEM)• Project leader PRTR• Representatives of the contributing institutes• Taskforce chairmen
Task force on agricultureand land use (TGL)
Task force ENINA(Energy, Industry en Waste)
Task force on Trafficand Transport
Task force MEWAT(Emissions to water)
Task force WESP(Service sector and
product use)
Seminar on uniformingmanure numbers
(WUM)
Seminar on Land Use,Land Use Change and
Forrestry (LULUCF)Interaction
with Directorates
of the involved Ministries
Strategic decicion-making

Introduction 15
Data storageIn cooperation with the contributing research institutes, emission data are collected and stored in a database managed by PBL.
About 250 companies, representing several hundreds facilities, are legally obliged to submit an Annual Environmental Report (AER). As from 1 January 2002, they may submit their AERs electronically. Each of these companies has an emission monitoring and registration system in which the specifications are in agreement with the competent authority. Usually, the licensing authorities (Provinces, State, etc.) validate and verify the reported emissions. In addition, a number of companies are required to report information under the BEES/A legislation. Other companies (about 200) provide emission data voluntarily within the framework of environmental covenants. Information from the AERs is stored in a separate database at the PBL and formally owned by the companies involved.
Point-source emission data in the AER database are checked for consistency by the task forces. The result is a selection of validated point-source emissions and activity data, which are then stored in the individual PRTR database (ER-I). The ER-I data is combined with supplementary estimates for Small and Medium-sized Enterprises (SMEs). Several methods are applied for calculating these emissions. TNO has derived emission factors for NOx emissions from small installations, for instance (Van Soest-Vercammen et al., 2002), while, for other substances, the Implied Emission Factors (IEFs) derived from the AERs are applied to calculate sector emissions.
Emissions from the ER-I database and collectively estimated industrial as well as non-industrial sources are stored in
the PRTR database (see Figure 1.2). The PRTR database, consisting of a large number of geographically distributed emission sources (about 1000), contains a complete record of emissions in the Netherlands for a particular year. Each emission source includes information on the Standard Industrial Classification code (SBI-code) and industrial sub sector, separate information in process and combustion emissions, and the relevant environmental compartment and location. These emission sources can be selectively aggregated, by NFR category.
As of January 2009 the Dutch legislation on PRTR is changed. New threshold values replaced reporting and as of January 2010 companies are obliged to submit there AER electronically to the Dutch AER database. The environmental effects will be reported in detail in the IIR 2011.
1.4 Methods and data sources
Methods used in the Netherlands are documented in several reports, protocols and in meta-data files, available on www.prtr.nl. However, some reports are only available in Dutch. For greenhouse gases (www.greenhousegases.nl), particulate matter (PM) and all emissions related to mobile sources, the documentation has been translated in English.
In general, two emission models are used in the Netherlands: � A model for emissions of large point sources (e.g. large
industrial, power plants) that are registered individually and supplemented with emission estimates for the remainder of the companies in a subsector (based mainly on IEFs from the individually registered companies). This is the so-called ‘bottom up’ method.
The data flow in the Netherlands Pollutant Release and Transfer Register.
Figure 1.2Data flow in the Netherlands Pollutant Release and Transfer Register (PRTR)
(Electronic)Annual
EnvironmentalReports (AER)
(Individualfacilities)
AER database
ER-I database
Collectiveindustrialsources
Area/diffusesources
Activity data
Emission factors(Literature,
measurements)(Task forces PRTR)
Geographical distribution
data
PRTR-database
Statistics Netherlands etc.
(Task forcesPRTR)
(Task forces PRTR)
(Task forces PRTR)
Netherlands Informative Inventory Report 201016
� A model for emissions of diffuse sources (e.g. road transport, agriculture) that are calculated from activity data and emission factors from sectoral emission inventory studies in the Netherlands (e.g. SPIN documents produced by the ‘Cooperation project on industrial emissions’).
The following sections sketch these methods, which are discussed in more detail, by sector or subsector, for the top ten key sources mentioned in Chapter 3.
1.5 Key source analysis
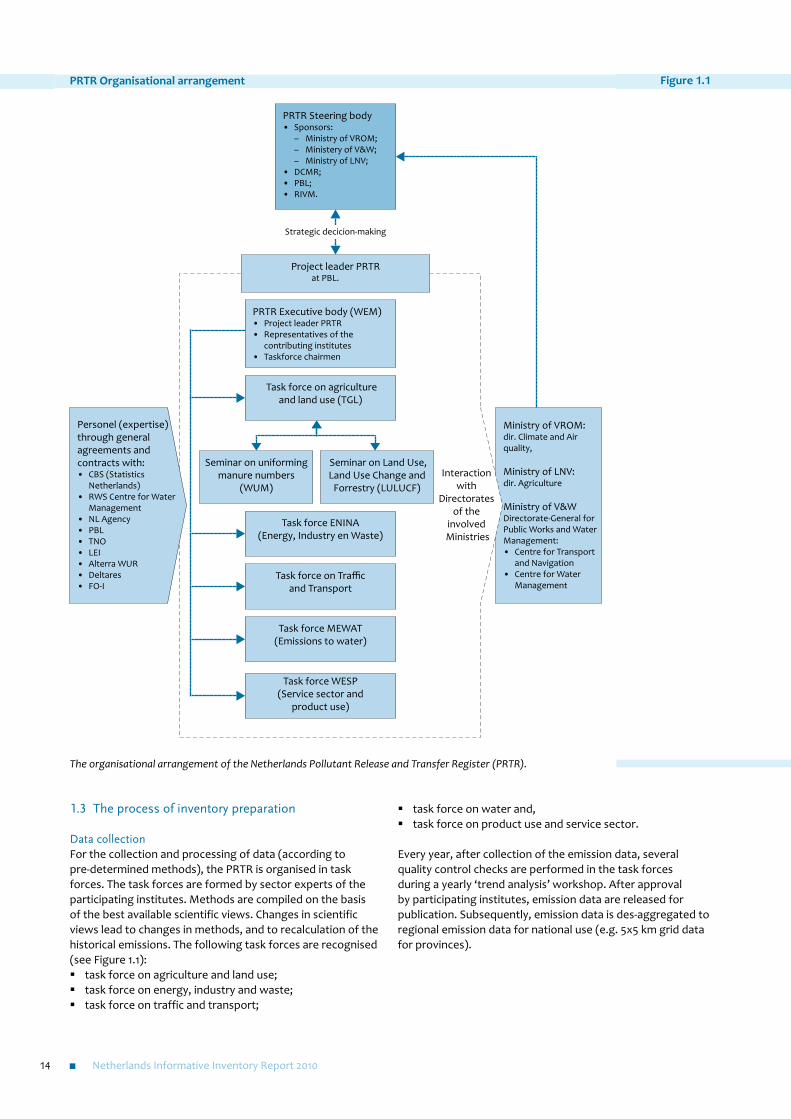
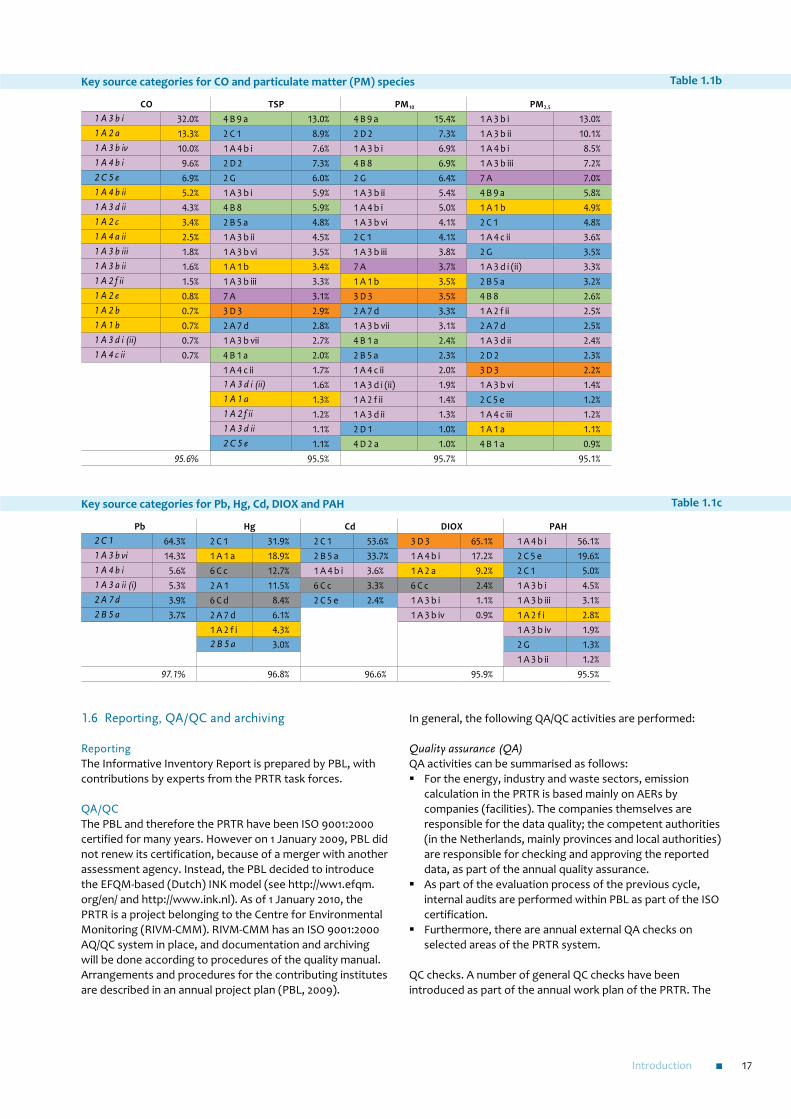
For all components, more than 95% of national total emissions should be covered by the key source categories. The REPDAB generated key source category list is insufficient for this purpose. Table 1.1 shows the key source categories which cover 95% of the national total for a component. See UNECE (2009) for an explication of the source category coding.
Key source categories for SOx, NOx, NH3 and NMVOC
Component SOx NOx NH3 NMVOCKey source categories (Sorted from high to low from top to bottom)
1 A 1 b 49.7% 1 A 3 b iii 20.7% 4 B 1 a 29.0% 3 D 2 11.9%1 A 1 a 11.7% 1 A 3 b i 11.8% 4 B 8 23.0% 3 A 2 11.4%1 A 2 b 7.0% 1 A 1 a 8.4% 4 B 1 b 14.4% 1 A 3 b i 10.2%1 A 2 a 6.8% 1 A 3 d i (ii) 5.8% 4 D 1 a 8.9% 2 G 7.7%1 A 2 c 6.4% 1 A 3 b ii 5.4% 4 B 9 a 7.5% 3 D 3 5.8%1 A 2 f i 5.0% 1 A 4 a i 4.6% 4 B 9 b 4.6% 1 A 3 b iv 5.7%1 A 3 d i (ii) 2.4% 1 A 4 c ii 4.5% 7 A 3.8% 1 A 4 b i 5.4%2 A 7 d 1.8% 1 A 4 b i 4.4% 4 B 6 3.4% 2 B 5 a 4.5%1 A 4 c ii 1.4% 1 A 2 c 4.3% 1 A 3 b i 1.8% 1 B 2 a i 4.0%1 A 3 d ii 1.2% 1 A 4 c i 4.3% 2 D 2 3.2%1 A 4 a i 1.1% 1 A 3 d ii 3.8% 1 A 1 b 3.2%1 A 2 f ii 1.0% 1 A 4 c iii 3.5% 3 D 1 3.0% 1 A 1 b 2.9% 1 A 3 b v 2.5%
1 A 2 f ii 2.9% 1 B 2 a iv 2.5%1 A 2 f i 2.6% 3 A 1 2.3%1 A 1 c 1.9% 1 A 3 d ii 2.3%1 A 2 a 1.8% 1 A 3 b iii 1.9%1 A 4 a ii 1.7% 3 B 1 1.4%
Energy 1 A 4 c i 1.1%Transport 1 A 4 b ii 1.0%Industry 1 B 2 b 1.0%Solvent and product use 1 A 4 c ii 0.9%Agriculture 1 A 3 b ii 0.9%Waste 1 A 2 f ii 0.7%Other 1 A 3 d i (ii) 0.5%Total (%) 95.6% 95.4% 96.4% 95.0%
Table 1.1a
Introduction 17
1.6 Reporting, QA/QC and archiving
ReportingThe Informative Inventory Report is prepared by PBL, with contributions by experts from the PRTR task forces.
QA/QCThe PBL and therefore the PRTR have been ISO 9001:2000 certified for many years. However on 1 January 2009, PBL did not renew its certification, because of a merger with another assessment agency. Instead, the PBL decided to introduce the EFQM-based (Dutch) INK model (see http://ww1.efqm.org/en/ and http://www.ink.nl). As of 1 January 2010, the PRTR is a project belonging to the Centre for Environmental Monitoring (RIVM-CMM). RIVM-CMM has an ISO 9001:2000 AQ/QC system in place, and documentation and archiving will be done according to procedures of the quality manual. Arrangements and procedures for the contributing institutes are described in an annual project plan (PBL, 2009).
In general, the following QA/QC activities are performed:
Quality assurance (QA) QA activities can be summarised as follows:
� For the energy, industry and waste sectors, emission calculation in the PRTR is based mainly on AERs by companies (facilities). The companies themselves are responsible for the data quality; the competent authorities (in the Netherlands, mainly provinces and local authorities) are responsible for checking and approving the reported data, as part of the annual quality assurance.
� As part of the evaluation process of the previous cycle, internal audits are performed within PBL as part of the ISO certification.
� Furthermore, there are annual external QA checks on selected areas of the PRTR system.
QC checks. A number of general QC checks have been introduced as part of the annual work plan of the PRTR. The
Key source categories for CO and particulate matter (PM) species
CO TSP PM10 PM2.5
1 A 3 b i 32.0% 4 B 9 a 13.0% 4 B 9 a 15.4% 1 A 3 b i 13.0%1 A 2 a 13.3% 2 C 1 8.9% 2 D 2 7.3% 1 A 3 b ii 10.1%1 A 3 b iv 10.0% 1 A 4 b i 7.6% 1 A 3 b i 6.9% 1 A 4 b i 8.5%1 A 4 b i 9.6% 2 D 2 7.3% 4 B 8 6.9% 1 A 3 b iii 7.2%2 C 5 e 6.9% 2 G 6.0% 2 G 6.4% 7 A 7.0%1 A 4 b ii 5.2% 1 A 3 b i 5.9% 1 A 3 b ii 5.4% 4 B 9 a 5.8%1 A 3 d ii 4.3% 4 B 8 5.9% 1 A 4 b i 5.0% 1 A 1 b 4.9%1 A 2 c 3.4% 2 B 5 a 4.8% 1 A 3 b vi 4.1% 2 C 1 4.8%1 A 4 a ii 2.5% 1 A 3 b ii 4.5% 2 C 1 4.1% 1 A 4 c ii 3.6%1 A 3 b iii 1.8% 1 A 3 b vi 3.5% 1 A 3 b iii 3.8% 2 G 3.5%1 A 3 b ii 1.6% 1 A 1 b 3.4% 7 A 3.7% 1 A 3 d i (ii) 3.3%1 A 2 f ii 1.5% 1 A 3 b iii 3.3% 1 A 1 b 3.5% 2 B 5 a 3.2%1 A 2 e 0.8% 7 A 3.1% 3 D 3 3.5% 4 B 8 2.6%1 A 2 b 0.7% 3 D 3 2.9% 2 A 7 d 3.3% 1 A 2 f ii 2.5%1 A 1 b 0.7% 2 A 7 d 2.8% 1 A 3 b vii 3.1% 2 A 7 d 2.5%1 A 3 d i (ii) 0.7% 1 A 3 b vii 2.7% 4 B 1 a 2.4% 1 A 3 d ii 2.4%1 A 4 c ii 0.7% 4 B 1 a 2.0% 2 B 5 a 2.3% 2 D 2 2.3% 1 A 4 c ii 1.7% 1 A 4 c ii 2.0% 3 D 3 2.2%
1 A 3 d i (ii) 1.6% 1 A 3 d i (ii) 1.9% 1 A 3 b vi 1.4%1 A 1 a 1.3% 1 A 2 f ii 1.4% 2 C 5 e 1.2%1 A 2 f ii 1.2% 1 A 3 d ii 1.3% 1 A 4 c iii 1.2%1 A 3 d ii 1.1% 2 D 1 1.0% 1 A 1 a 1.1%2 C 5 e 1.1% 4 D 2 a 1.0% 4 B 1 a 0.9%
95.6% 95.5% 95.7% 95.1%
Table 1.1b
Key source categories for Pb, Hg, Cd, DIOX and PAH
Pb Hg Cd DIOX PAH2 C 1 64.3% 2 C 1 31.9% 2 C 1 53.6% 3 D 3 65.1% 1 A 4 b i 56.1%1 A 3 b vi 14.3% 1 A 1 a 18.9% 2 B 5 a 33.7% 1 A 4 b i 17.2% 2 C 5 e 19.6%1 A 4 b i 5.6% 6 C c 12.7% 1 A 4 b i 3.6% 1 A 2 a 9.2% 2 C 1 5.0%1 A 3 a ii (i) 5.3% 2 A 1 11.5% 6 C c 3.3% 6 C c 2.4% 1 A 3 b i 4.5%2 A 7 d 3.9% 6 C d 8.4% 2 C 5 e 2.4% 1 A 3 b i 1.1% 1 A 3 b iii 3.1%2 B 5 a 3.7% 2 A 7 d 6.1% 1 A 3 b iv 0.9% 1 A 2 f i 2.8% 1 A 2 f i 4.3% 1 A 3 b iv 1.9%
2 B 5 a 3.0% 2 G 1.3% 1 A 3 b ii 1.2%
97.1% 96.8% 96.6% 95.9% 95.5%
Table 1.1c
Netherlands Informative Inventory Report 201018
QC checks built into the work plan aim at covering such issues as consistency, completeness and accuracy of the NFR data.
The general QC for the inventory is largely performed within the PRTR as an integrated part of the working processes. For the 2010 inventory the PRTR task forces filled in a standard-format database with emission data from 1990 to 2008. After a first check of the emission files, by the PBL for completeness, the data becomes available to the specific task force for checking consistency and trend (comparability, accuracy). The task forces access information on all emissions in the database, by means of a web-based emission reporter, and are facilitated by the ER-team with comparison information on trends and time series. Several weeks before the data set is fixed, a trend verification workshop will be organised by the PBL (see Text box 1.1).
Archiving and documentation Internal procedures are agreed on (for example, in the PRTR work plan) for general data collection and the storage of fixed data sets in the PRTR database at PBL, including the documentation/archiving of QC checks. Moreover, updating of monitoring protocols for substances under the Convention for Long Range Transboundary Air Pollution is one of the priorities within the PRTR system. Emphasis is put on documentation of methodologies for calculating SOx, NOx , NMVOC, NH3 and PM10 (PM2,5). Methodologies/ protocols, emission data (including the emissions of Large Point Sources on the basis of Annual Environmental Reports), as well as such emission reports as the National Inventory Report (UNFCCC) and the Informative Inventory Report (CLRTAP), are made available on the website of the PRTR: www.prtr.nl or www.emissieregistratie.nl (Dutch version). Each institution involved in the PRTR is responsible for QA/QC aspects related to reports based on the annually fixed database.
1.7 Uncertainties
Uncertainty assessments constitute a means to either provide the inventory users with a quantitative assessment of the
inventory quality or to direct the inventory preparation team to priority areas, where improvements are warranted and can be made cost-effective. For these purposes, quantitative uncertainty assessments have been carried out for these purposes since 1999. However, awareness of uncertainties in emission figures was expressed earlier in the PRTR in so-called quality indices and in several studies on industrial emissions and generic emission factors for industrial processes and diffuse sources. To date, the Dutch PRTR gives only one value for emissions (calculation result, rounded off to three significant digits).
The information on the quality of emission figures presented here is based on the TNO report ‘Uncertainty assessment of NOx, SO2 and NH3 emissions in the Netherlands’ (Van Gijlswijk et al., 2004), which presents the results of a Tier-2 ‘Monte Carlo’ uncertainty assessment.
1.7.1 Quantitative uncertaintyUncertainty estimates in national total emissions have been reported in the Environmental Balances since 2000 (PBL, 2009a). These estimates were based on uncertainties by source category using simple error propagation calculations (Tier 1). Most uncertainty estimates are based on the judgement of RIVM/PBL emission experts. A preliminary analysis on NMVOC emissions showed an uncertainty range of about 25%. In a recent study (Van Gijlswijk et al., 2004) the uncertainty in the contribution of the various emission sources to total acidification (in acidification equivalents) was assessed according to the Tier-2 methodology (estimation of uncertainties by source category using Monte Carlo analysis). See Table 1.2 for results. A comparison was also made between the Tier-1 and Tier-2 methodologies. This is not straightforward as the two studies use a different knowledge collection. The 2000 Tier-1 analysis used CLRTAP default uncertainties for several NOx processes, which explains the difference with the 1999 Tier-1 results. For NH3, the difference between the 2000 Tier-1 and Tier-2 can be explained by taking non-normal distributions and dependencies between individual emission sources for each animal type into account (both are violations of the Tier-1 assumptions: effects
Several weeks in advance of a trend analysis meeting, a snapshot from the database is made available by PBL in a web-based application (Emission Explorer, EmEx) for checks by the institutes involved and experts (PRTR task forces). In this way the task forces can check for level errors and consistency in the algorithm/method used for calculations throughout the time series. The task forces perform checks for relevant gases and sectors. The totals for the sectors are then compared with the previous year’s data set. Where significant differences are found, the task forces evaluate the emission data in more detail. The results of these checks form the subject of discussion at the trend analysis workshop and are subsequently documented.
Furthermore, the ER-team provides the task forces with time series of emissions per substance for the individual target sectors. The task forces examine these time series. During the
trend analysis for this inventory the emission data were checked in two ways: 1) emissions from 1990 to 2007 from the new time series were compared with the time series of last years inventory and 2) the data for 2008 were compared with the trend development per gas since 1990. The checks of outliers are performed on a more detailed level of the sub-sources in all sector background tables:
� annual changes in emissions; � annual changes in activity data; � annual changes in implied emission factors and � level values of implied emission factors.
Exceptional trend changes and observed outliers are noted and discussed at the trend analysis workshop, resulting in an action list. Items on this list have to be processed within 2 weeks or be dealt with in next year’s inventory.
Text box 1.1. Trend verification workshops
Introduction 19
encapsulated in the 1999 Tier-1 analysis). The differences for SO2 and total acidifying equivalents are small. The conclusion drawn from this comparison is that focusing on the order of magnitude of the individual uncertainty estimates, as in the RIVM (2001) study, provides a reasonable first assessment of the uncertainty of source categories.
The RIVM (2001) study draws on the results of an earlier study on the quality of nitrogen oxides (NOx) and sulphur dioxide (SO2) emissions, as reported by individual companies for point sources under their national reporting requirements. Besides providing quantitative uncertainty estimates, the study yielded important conclusions. One example was that a limited number of facilities showed high uncertainties (e.g. 50% or more for NOx), which could be reduced with little extra effort, and that companies generally have a lack of knowledge on the uncertainty about the emissions they report.
In the study by Van Gijlswijk (2004), emission experts were systematically interviewed on quantitative uncertainties, which provided simultaneous information on the reliability and quality of the underlying knowledge base. For processes not covered by interviews, standard default uncertainties, derived from the Good Practice Guidance for CLRTAP emission inventories, were used (Pulles and Van Aardenne, 2001). The qualitative knowledge (on data validation, methodological aspects, empirical basis and proximity of data used) has been combined into a score for data
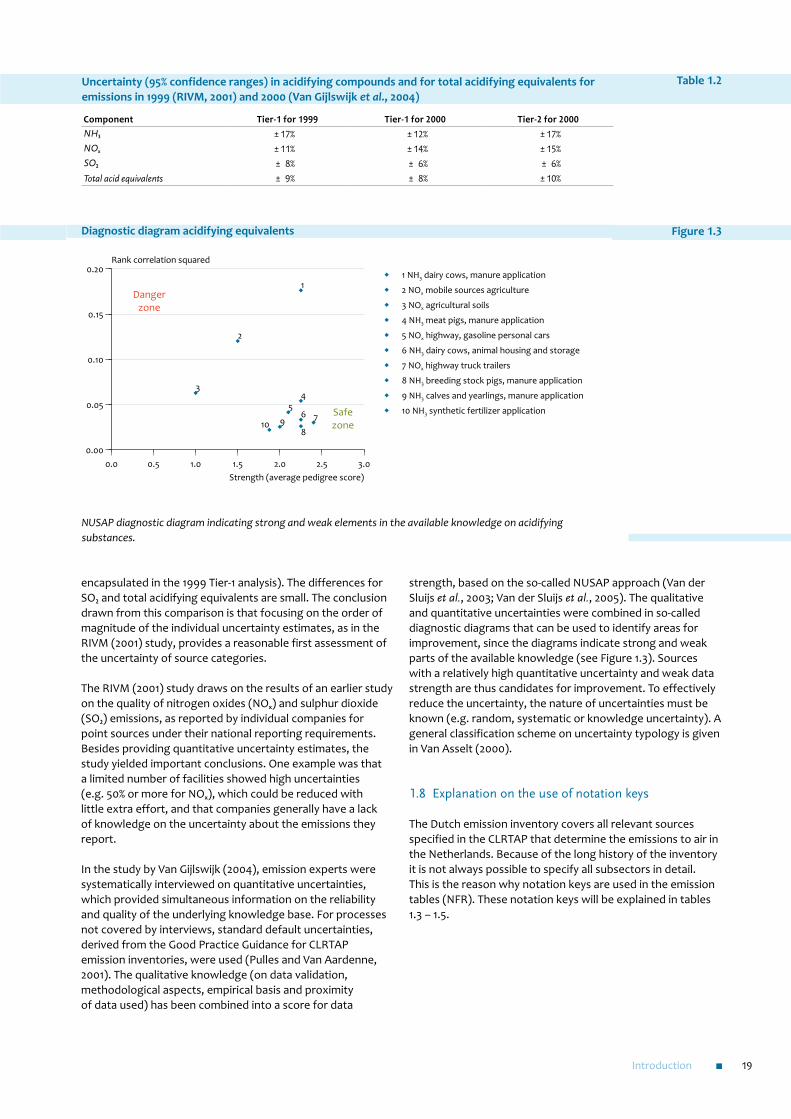
strength, based on the so-called NUSAP approach (Van der Sluijs et al., 2003; Van der Sluijs et al., 2005). The qualitative and quantitative uncertainties were combined in so-called diagnostic diagrams that can be used to identify areas for improvement, since the diagrams indicate strong and weak parts of the available knowledge (see Figure 1.3). Sources with a relatively high quantitative uncertainty and weak data strength are thus candidates for improvement. To effectively reduce the uncertainty, the nature of uncertainties must be known (e.g. random, systematic or knowledge uncertainty). A general classification scheme on uncertainty typology is given in Van Asselt (2000).
1.8 Explanation on the use of notation keys
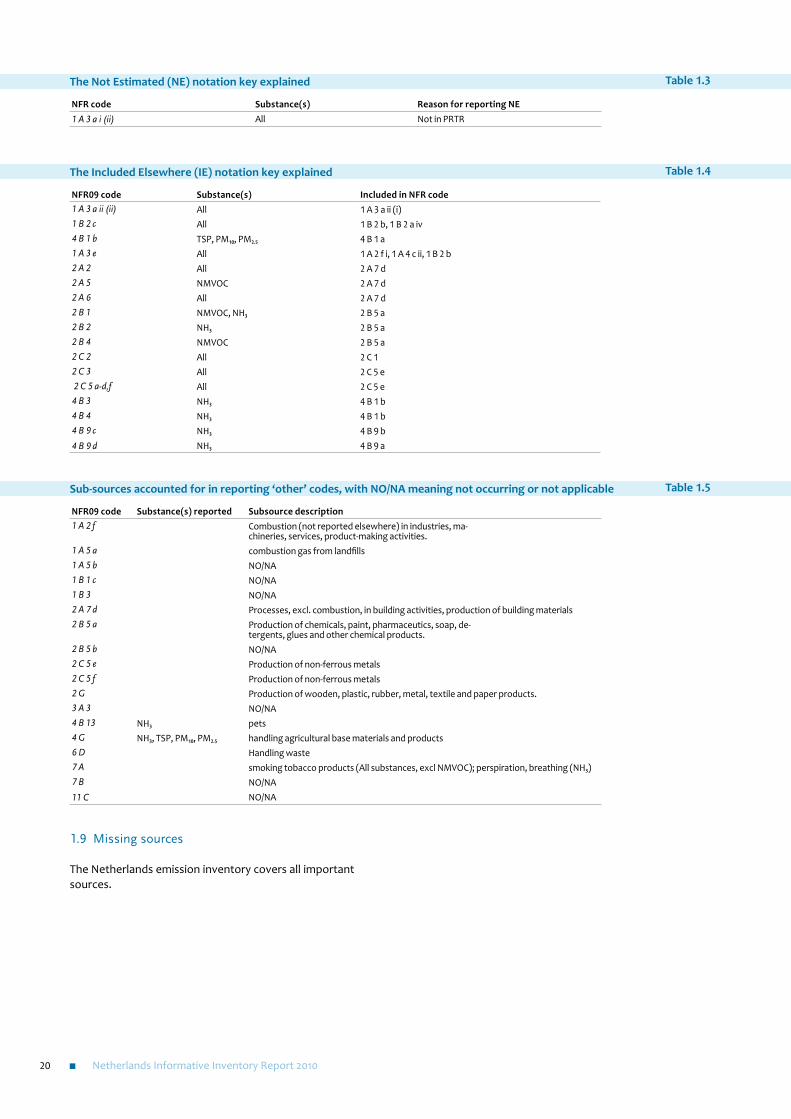
The Dutch emission inventory covers all relevant sources specified in the CLRTAP that determine the emissions to air in the Netherlands. Because of the long history of the inventory it is not always possible to specify all subsectors in detail. This is the reason why notation keys are used in the emission tables (NFR). These notation keys will be explained in tables 1.3 – 1.5.
Figure 1.3Uncertainty (95% confidence ranges) in acidifying compounds and for total acidifying equivalents for emissions in 1999 (RIVM, 2001) and 2000 (Van Gijlswijk et al., 2004)
Component Tier-1 for 1999 Tier-1 for 2000 Tier-2 for 2000NH3 ± 17% ± 12% ± 17%NOx ± 11% ± 14% ± 15%SO2 ± 8% ± 6% ± 6%Total acid equivalents ± 9% ± 8% ± 10%
Table 1.2
NUSAP diagnostic diagram indicating strong and weak elements in the available knowledge on acidifying substances.
Figure 1.3
0.0 0.5 1.0 1.5 2.0 2.5 3.0Strength (average pedigree score)
0.00
0.05
0.10
0.15
0.20Rank correlation squared
1 NH3 dairy cows, manure application
2 NOx mobile sources agriculture
3 NOx agricultural soils
4 NH3 meat pigs, manure application
5 NOx highway, gasoline personal cars
6 NH3 dairy cows, animal housing and storage
7 NOx highway truck trailers
8 NH3 breeding stock pigs, manure application
9 NH3 calves and yearlings, manure application
10 NH3 synthetic fertilizer application
Diagnostic diagram acidifying equivalents
1
2
34
56 7
8910
Safezone
Dangerzone
Netherlands Informative Inventory Report 201020
1.9 Missing sources
The Netherlands emission inventory covers all important sources.
Sub-sources accounted for in reporting ‘other’ codes, with NO/NA meaning not occurring or not applicable
NFR09 code Substance(s) reported Subsource description1 A 2 f Combustion (not reported elsewhere) in industries, ma-
chineries, services, product-making activities.1 A 5 a combustion gas from landfills1 A 5 b NO/NA1 B 1 c NO/NA1 B 3 NO/NA2 A 7 d Processes, excl. combustion, in building activities, production of building materials2 B 5 a Production of chemicals, paint, pharmaceutics, soap, de-
tergents, glues and other chemical products.2 B 5 b NO/NA2 C 5 e Production of non-ferrous metals2 C 5 f Production of non-ferrous metals2 G Production of wooden, plastic, rubber, metal, textile and paper products.3 A 3 NO/NA4 B 13 NH3 pets4 G NH3, TSP, PM10, PM2.5 handling agricultural base materials and products6 D Handling waste7 A smoking tobacco products (All substances, excl NMVOC); perspiration, breathing (NH3)7 B NO/NA11 C NO/NA
Table 1.5
The Not Estimated (NE) notation key explained
NFR code Substance(s) Reason for reporting NE1 A 3 a i (ii) All Not in PRTR
Table 1.3
The Included Elsewhere (IE) notation key explained
NFR09 code Substance(s) Included in NFR code1 A 3 a ii (ii) All 1 A 3 a ii (i)1 B 2 c All 1 B 2 b, 1 B 2 a iv4 B 1 b TSP, PM10, PM2.5 4 B 1 a1 A 3 e All 1 A 2 f i, 1 A 4 c ii, 1 B 2 b2 A 2 All 2 A 7 d2 A 5 NMVOC 2 A 7 d2 A 6 All 2 A 7 d2 B 1 NMVOC, NH3 2 B 5 a2 B 2 NH3 2 B 5 a2 B 4 NMVOC 2 B 5 a2 C 2 All 2 C 12 C 3 All 2 C 5 e 2 C 5 a-d,f All 2 C 5 e4 B 3 NH3 4 B 1 b4 B 4 NH3 4 B 1 b4 B 9 c NH3 4 B 9 b4 B 9 d NH3 4 B 9 a
Table 1.4
Trends in emissions 21
2.1 Trends in national emissions
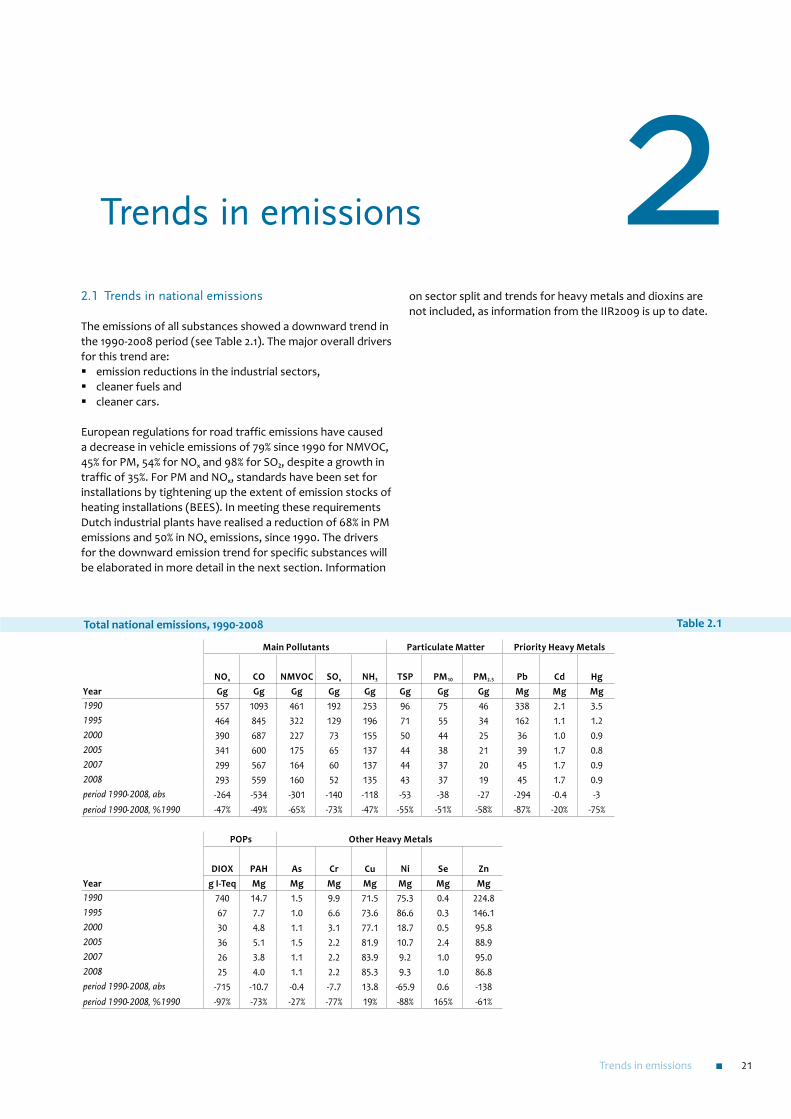
The emissions of all substances showed a downward trend in the 1990-2008 period (see Table 2.1). The major overall drivers for this trend are:
� emission reductions in the industrial sectors, � cleaner fuels and � cleaner cars.
European regulations for road traffic emissions have caused a decrease in vehicle emissions of 79% since 1990 for NMVOC, 45% for PM, 54% for NOx and 98% for SO2, despite a growth in traffic of 35%. For PM and NOx, standards have been set for installations by tightening up the extent of emission stocks of heating installations (BEES). In meeting these requirements Dutch industrial plants have realised a reduction of 68% in PM emissions and 50% in NOx emissions, since 1990. The drivers for the downward emission trend for specific substances will be elaborated in more detail in the next section. Information
on sector split and trends for heavy metals and dioxins are not included, as information from the IIR2009 is up to date.
Trends in emissions 2
Total national emissions, 1990-2008
Main Pollutants Particulate Matter Priority Heavy Metals
NOx CO NMVOC SOx NH3 TSP PM10 PM2.5 Pb Cd Hg Year Gg Gg Gg Gg Gg Gg Gg Gg Mg Mg Mg1990 557 1093 461 192 253 96 75 46 338 2.1 3.51995 464 845 322 129 196 71 55 34 162 1.1 1.22000 390 687 227 73 155 50 44 25 36 1.0 0.92005 341 600 175 65 137 44 38 21 39 1.7 0.82007 299 567 164 60 137 44 37 20 45 1.7 0.92008 293 559 160 52 135 43 37 19 45 1.7 0.9period 1990-2008, abs -264 -534 -301 -140 -118 -53 -38 -27 -294 -0.4 -3period 1990-2008, %1990 -47% -49% -65% -73% -47% -55% -51% -58% -87% -20% -75%
POPs Other Heavy Metals
DIOX PAH As Cr Cu Ni Se Zn Year g I-Teq Mg Mg Mg Mg Mg Mg Mg1990 740 14.7 1.5 9.9 71.5 75.3 0.4 224.81995 67 7.7 1.0 6.6 73.6 86.6 0.3 146.12000 30 4.8 1.1 3.1 77.1 18.7 0.5 95.82005 36 5.1 1.5 2.2 81.9 10.7 2.4 88.92007 26 3.8 1.1 2.2 83.9 9.2 1.0 95.02008 25 4.0 1.1 2.2 85.3 9.3 1.0 86.8period 1990-2008, abs -715 -10.7 -0.4 -7.7 13.8 -65.9 0.6 -138period 1990-2008, %1990 -97% -73% -27% -77% 19% -88% 165% -61%
Table 2.1

Netherlands Informative Inventory Report 201022
2.2 Trends in sulphur dioxide (SO2)
The Dutch SOx emissions (reported as SO2) decreased by 140 Gg, in the 1990-2008 period, corresponding to 73% of the national total in 1990 (Figure 2.1). Main contributions to this decrease came from the energy, industry and transport sectors. The use of coal declined and major coal-fired electricity producers installed flue-gas desulphurisation plants. The sulphur content in fuels for the (chemical) industry and traffic was also reduced. At present the industry, energy and refining sector (IER) is responsible for 88% of the national SO2 emissions.
SO2, emission trend 1990-2008 and share by sector in 1990 and 2008.
Figure 2.1
1990 1995 2000 2005 20100
50
100
150
200Gg
Other
2 Industrial processes
1A3 Transport
1A1a Power plants
1A2 Industry
1A1b Refining
Total
SO2 emissions
35 %
19 %
23 %
8 %
8 %
7 %
Share 1990
192 Gg
50 %
27 %
12 %
5 %
2 %5 %
Share 2008
52 Gg-150 -100 -50 0 50
Gg
Change 1990 – 2008
Trends in emissions 23
2.3 Trends in nitrogen oxides (NOx)
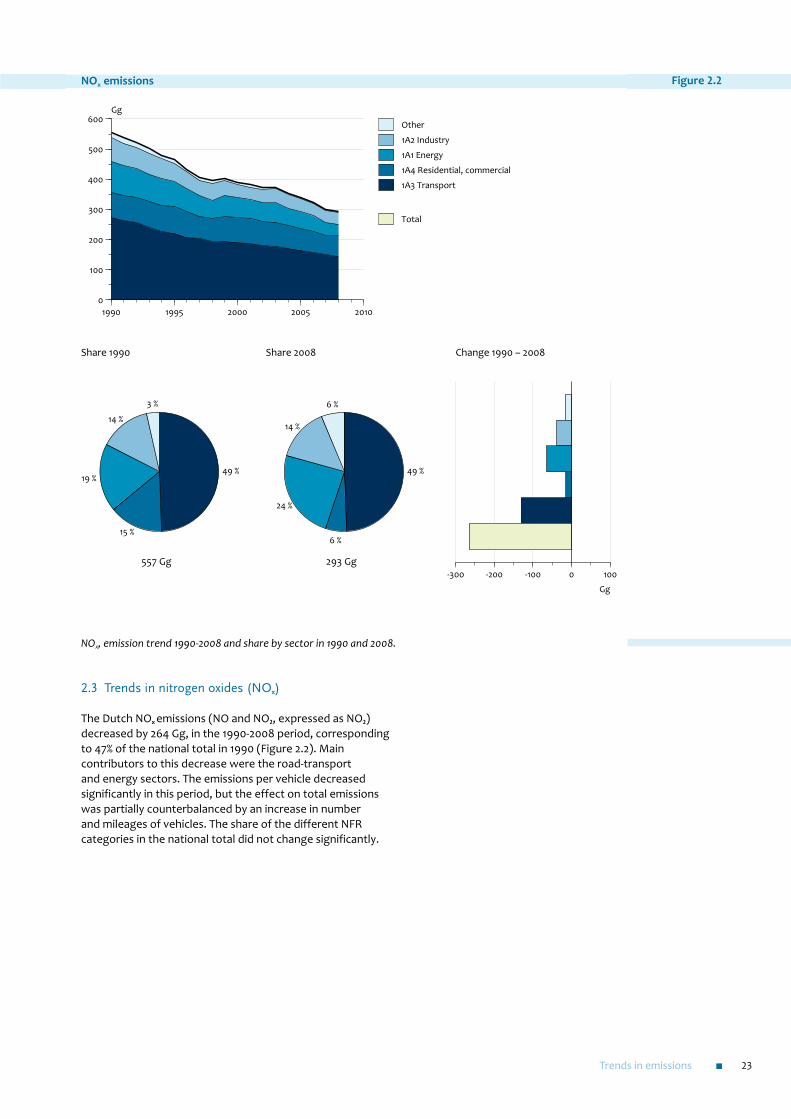
The Dutch NOx emissions (NO and NO2, expressed as NO2) decreased by 264 Gg, in the 1990-2008 period, corresponding to 47% of the national total in 1990 (Figure 2.2). Main contributors to this decrease were the road-transport and energy sectors. The emissions per vehicle decreased significantly in this period, but the effect on total emissions was partially counterbalanced by an increase in number and mileages of vehicles. The share of the different NFR categories in the national total did not change significantly.
NOx, emission trend 1990-2008 and share by sector in 1990 and 2008.
Figure 2.2
Share 1990 Share 2008 Change 1990 – 2008
49 %
15 %
19 %
14 %
3 %
557 Gg
49 %
6 %
24 %
14 %
6 %
293 Gg
1990 1995 2000 2005 20100
100
200
300
400
500
600Gg
Other
1A2 Industry
1A1 Energy
1A4 Residential, commercial
1A3 Transport
Total
NOx emissions
-300 -200 -100 0 100
Gg

Netherlands Informative Inventory Report 201024
2.4 Trends in ammonia (NH3)
The Dutch NH3 emissions decreased by 118 Gg, in the 1990-2008 period, corresponding to 47% of the national total in 1990 (Figure 2.3). This decrease was due to emission reductions from agricultural sources. The direct emissions from animal husbandry decreased slightly as a result of decreasing animal population and measures to reduce emissions from animal houses. Application emissions decreased because of measures taken to reduce the emissions from applying manure to soil and to reduce the total amount of N applied to soil. At present over 90% of Dutch NH3 emissions come from agricultural sources.
NH3, emission trend 1990-2008 and share by sector in 1990 and 2008.
Figure 2.3
Share 1990 Share 2008 Change 1990 – 2008
1990 1995 2000 2005 20100
50
100
150
200
250
300Gg
Other
2 Industrial Processes
1 Energy
4 Other agricultural activities
4B8 Swine
4B1 Cattle
Total
NH3 emissions
53 %
27 %
15 %
1 %
2 %2 %
253 Gg
43 %
23 %
25 %
2 %
1 %5 %
135 Gg-150 -100 -50 0 50
Gg
Trends in emissions 25
2.5 Trends in non-methane volatile organic compounds (NMVOC)
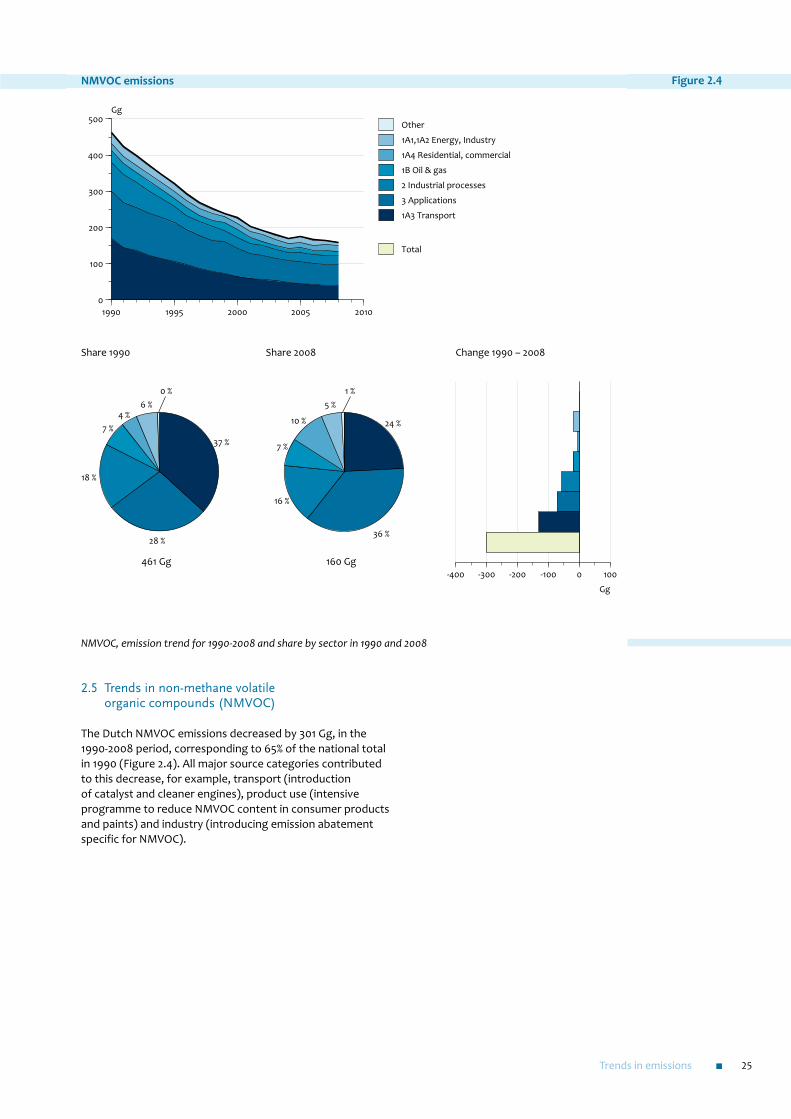
The Dutch NMVOC emissions decreased by 301 Gg, in the 1990-2008 period, corresponding to 65% of the national total in 1990 (Figure 2.4). All major source categories contributed to this decrease, for example, transport (introduction of catalyst and cleaner engines), product use (intensive programme to reduce NMVOC content in consumer products and paints) and industry (introducing emission abatement specific for NMVOC).
NMVOC, emission trend for 1990-2008 and share by sector in 1990 and 2008
Figure 2.4
Share 1990 Share 2008 Change 1990 – 2008
1990 1995 2000 2005 20100
100
200
300
400
500Gg
Other
1A1,1A2 Energy, Industry
1A4 Residential, commercial
1B Oil & gas
2 Industrial processes
3 Applications
1A3 Transport
Total
NMVOC emissions
37 %
28 %
18 %
7 %4 %
6 %0 %
461 Gg
24 %
36 %
16 %
7 %
10 %
5 %1 %
160 Gg-400 -300 -200 -100 0 100
Gg

Netherlands Informative Inventory Report 201026
2.6 Trends in PM10
Dutch PM10 emissions decreased by 38 Gg, in the 1990-2008 period, corresponding with 51% of the national total in 1990 (Figure 2.5). The major source categories contributing to this decrease are:
� industry (combustion and process emissions), due to cleaner fuels in refineries and the side-effect of emission abatement for SO2 and NOx , and
� traffic and transport
The emissions from animal husbandry in agriculture did not change significantly; neither did the emissions from consumers (1A4bi).
PM10, emission trend 1990-2008 and share by sector in 1990 and 2008.
Figure 2.5
Share 1990 Share 2008 Change 1990 – 2008
1990 1995 2000 2005 20100
20
40
60
80Gg
Other
3 Applications
1A4 Residential, commercial
1A1, 2 Energy, Industry
2 Industrial processes
4 Agriculture
1A3 Transport
Total
PM10 emissions
23 %
12 %
39 %
14 %
7 %1 %
3 %
75 Gg
27 %
26 %
25 %
6 %
8 %3 %
4 %
37 Gg-40 -30 -20 -10 0 10
Gg
Trends in emissions 27
2.7 Trends in PM2.5
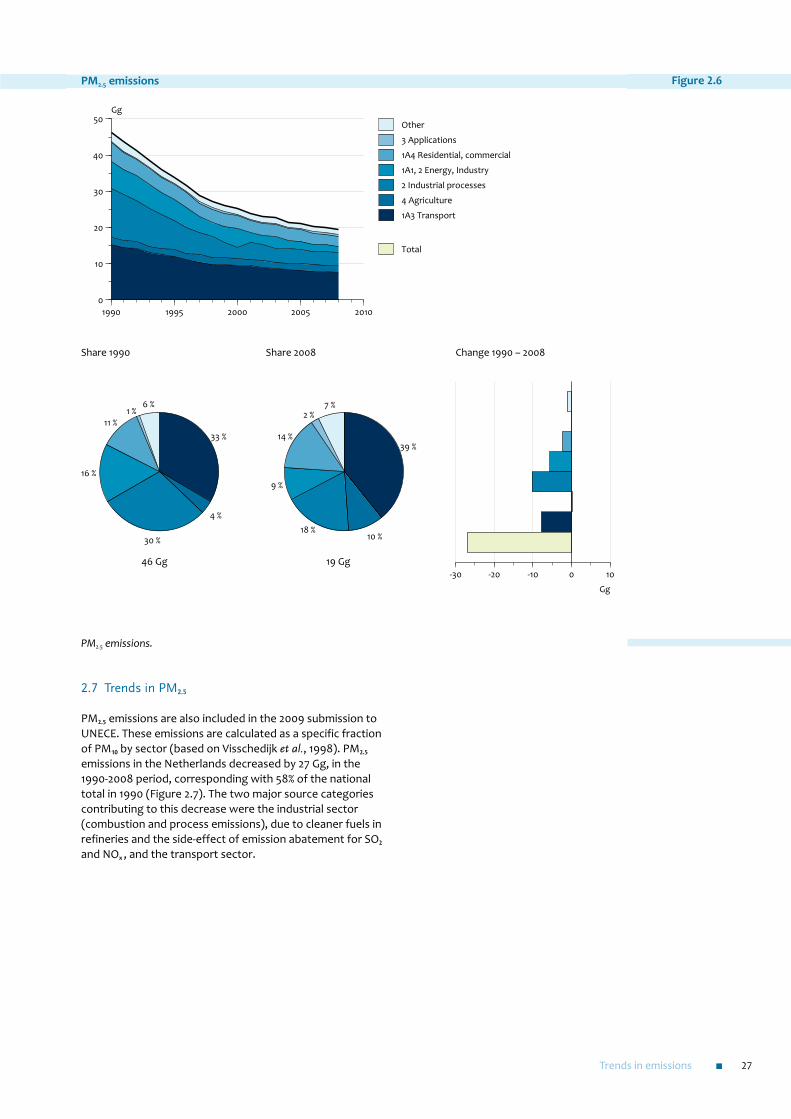
PM2.5 emissions are also included in the 2009 submission to UNECE. These emissions are calculated as a specific fraction of PM10 by sector (based on Visschedijk et al., 1998). PM2.5 emissions in the Netherlands decreased by 27 Gg, in the 1990-2008 period, corresponding with 58% of the national total in 1990 (Figure 2.7). The two major source categories contributing to this decrease were the industrial sector (combustion and process emissions), due to cleaner fuels in refineries and the side-effect of emission abatement for SO2 and NOx , and the transport sector.
PM2.5 emissions.
Figure 2.6
Share 1990 Share 2008 Change 1990 – 2008
1990 1995 2000 2005 20100
10
20
30
40
50Gg
Other
3 Applications
1A4 Residential, commercial
1A1, 2 Energy, Industry
2 Industrial processes
4 Agriculture
1A3 Transport
Total
PM2.5 emissions
33 %
4 %
30 %
16 %
11 %1 %
6 %
46 Gg
39 %
10 %18 %
9 %
14 %
2 %7 %
19 Gg-30 -20 -10 0 10
Gg
Netherlands Informative Inventory Report 201028
2.8 Trends in PAH
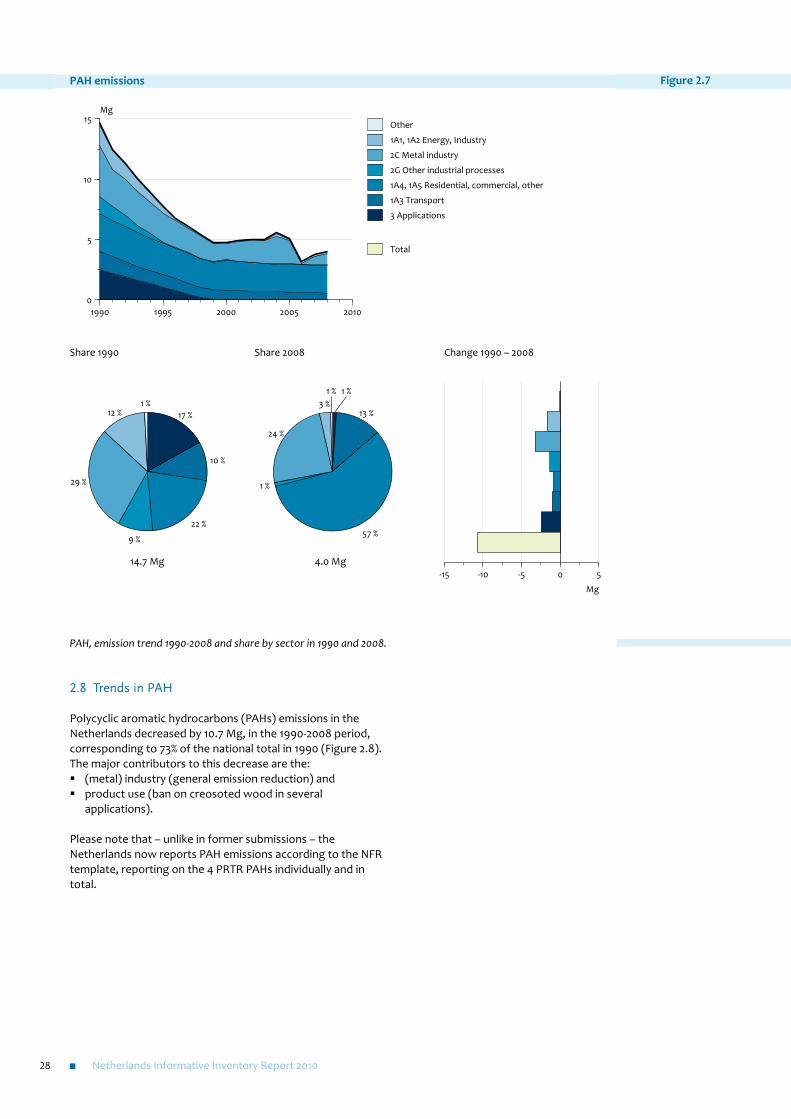
Polycyclic aromatic hydrocarbons (PAHs) emissions in the Netherlands decreased by 10.7 Mg, in the 1990-2008 period, corresponding to 73% of the national total in 1990 (Figure 2.8). The major contributors to this decrease are the:
� (metal) industry (general emission reduction) and � product use (ban on creosoted wood in several
applications).
Please note that – unlike in former submissions – the Netherlands now reports PAH emissions according to the NFR template, reporting on the 4 PRTR PAHs individually and in total.
PAH, emission trend 1990-2008 and share by sector in 1990 and 2008.
Figure 2.7
Share 1990 Share 2008 Change 1990 – 2008
1990 1995 2000 2005 20100
5
10
15Mg
Other
1A1, 1A2 Energy, Industry
2C Metal industry
2G Other industrial processes
1A4, 1A5 Residential, commercial, other
1A3 Transport
3 Applications
Total
PAH emissions
17 %
10 %
22 %
9 %
29 %
12 %1 %
14.7 Mg
1 %
13 %
57 %
1 %
24 %
3 %1 %
4.0 Mg-15 -10 -5 0 5
Mg
Energy, stationary fuel combustion (1A) 29
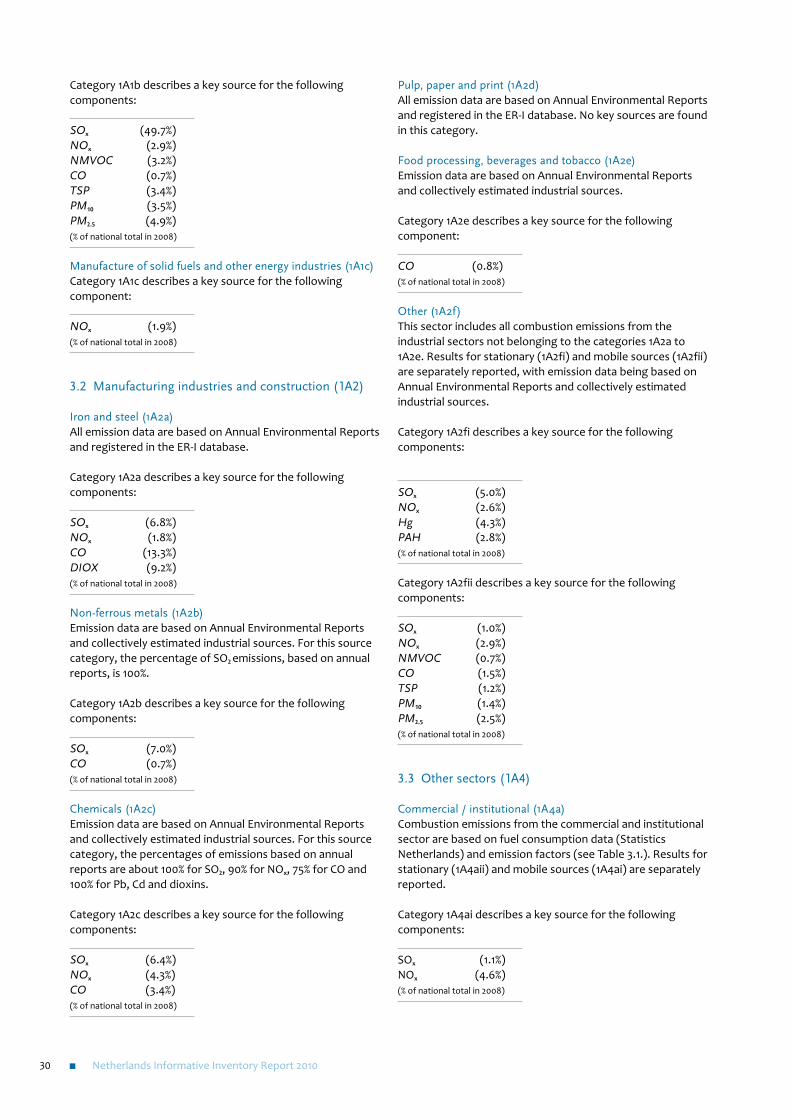
About 80-100% of the NOx, SO2, PM10 and NH3 emissions from stationary combustion (categories 1A1, 1A2, 1A4 and 1A5) are based on environmental reports of large industrial companies. The emission data in the Annual Environmental Reports (AERs) are based on direct emission measurements (see formula below) or calculations based on fuel input and emission factors. The emission factors used in the calculations are also based on measurements according to this formula.
��Emission = [Concentration]*Flow*Duration of emission
where:[Concentration] = Online (semi-)continuous measurement:
frequency - seconds to daily Discontinuous measurement: several
times a year, directly in air flow Off line: sampling and analysis in
laboratory
Flow = Flow-speed measurement in air flow; surface of flow channel; calculation based on fuel or raw materials/production quantities; for diffuse emissions: calculation of air flow over source
Duration = Calculation based on process-control data
The emissions and fuel consumption data in the AERs are systematically examined for inaccuracies by checking the resulting implied emission factors. If the environmental report provides data of high enough quality (see Section 1.3 on QA/QC), the information is used to calculate an ‘implied emission factor’ for a cluster of reporting companies (aggregated by SBI code) and the emission factor ER-I. These emission factors are fuel and sector dependent.
EF ER-I (SBI category, fuel type) = Emissions ER-I (SBI category, fuel type)
Energy use ER-I (SBI category, fuel type)
where:EF = emission factor
ER-I = Emission Registration database for individual companies
Next, the total combustion emissions in this SBI category are calculated from the energy use NEH, as provided in the Netherlands Energy Statistics (Statistics Netherlands), multiplied by the implied emission factor.
ER-I_SBI_emission (SBI category, fuel type) = EF ER-I (SBI category, fuel type) * Energy NEH (SBI category, fuel type)
For sectors without individual registration of emissions (e.g. residential and agricultural sectors), a set of specific emission factors is used (see Section 3.3).
3.1� �Energy�industries�(1A1)
�Public�electricity�and�heat�production�(1A1a)Emission data are based on Annual Environmental Reports and collectively estimated industrial sources. For this source category, the percentages of emissions based on annual reports are: 90% for NOx, 80% for SO2, 90% for CO and 100% for Hg, Cd and dioxins.
Category 1A1a describes a key source for the following components:
SOx (11.7%)NOx (8.4%)TSP (1.3%)PM2.5 (1.1%)Hg (18.9%)(% of national total in 2008)
Petroleum�refining�(1A1b)All emission data are based on Annual Environmental Reports and registered in the ER-I database.
Energy,�stationary�fuel�combustion�(1A)
3
Netherlands Informative Inventory Report 201030
Category 1A1b describes a key source for the following components:
SOx (49.7%)NOx (2.9%)NMVOC (3.2%)CO (0.7%)TSP (3.4%)PM10 (3.5%)PM2.5 (4.9%)(% of national total in 2008)
Manufacture of solid fuels and other energy industries (1A1c)Category 1A1c describes a key source for the following component:
NOx (1.9%)(% of national total in 2008)
3.2 Manufacturing industries and construction (1A2)
Iron and steel (1A2a)All emission data are based on Annual Environmental Reports and registered in the ER-I database.
Category 1A2a describes a key source for the following components:
SOx (6.8%)NOx (1.8%)CO (13.3%)DIOX (9.2%)(% of national total in 2008)
Non-ferrous metals (1A2b)Emission data are based on Annual Environmental Reports and collectively estimated industrial sources. For this source category, the percentage of SO2 emissions, based on annual reports, is 100%.
Category 1A2b describes a key source for the following components:
SOx (7.0%)CO (0.7%)(% of national total in 2008)
Chemicals (1A2c)Emission data are based on Annual Environmental Reports and collectively estimated industrial sources. For this source category, the percentages of emissions based on annual reports are about 100% for SO2, 90% for NOx, 75% for CO and 100% for Pb, Cd and dioxins.
Category 1A2c describes a key source for the following components:
SOx (6.4%)NOx (4.3%)CO (3.4%)(% of national total in 2008)
Pulp, paper and print (1A2d)All emission data are based on Annual Environmental Reports and registered in the ER-I database. No key sources are found in this category.
Food processing, beverages and tobacco (1A2e)Emission data are based on Annual Environmental Reports and collectively estimated industrial sources.
Category 1A2e describes a key source for the following component:
CO (0.8%)(% of national total in 2008)
Other (1A2f)This sector includes all combustion emissions from the industrial sectors not belonging to the categories 1A2a to 1A2e. Results for stationary (1A2fi) and mobile sources (1A2fii) are separately reported, with emission data being based on Annual Environmental Reports and collectively estimated industrial sources.
Category 1A2fi describes a key source for the following components:
SOx (5.0%)NOx (2.6%)Hg (4.3%)PAH (2.8%)(% of national total in 2008)
Category 1A2fii describes a key source for the following components:
SOx (1.0%)NOx (2.9%)NMVOC (0.7%)CO (1.5%)TSP (1.2%)PM10 (1.4%)PM2.5 (2.5%)(% of national total in 2008)
3.3 Other sectors (1A4)
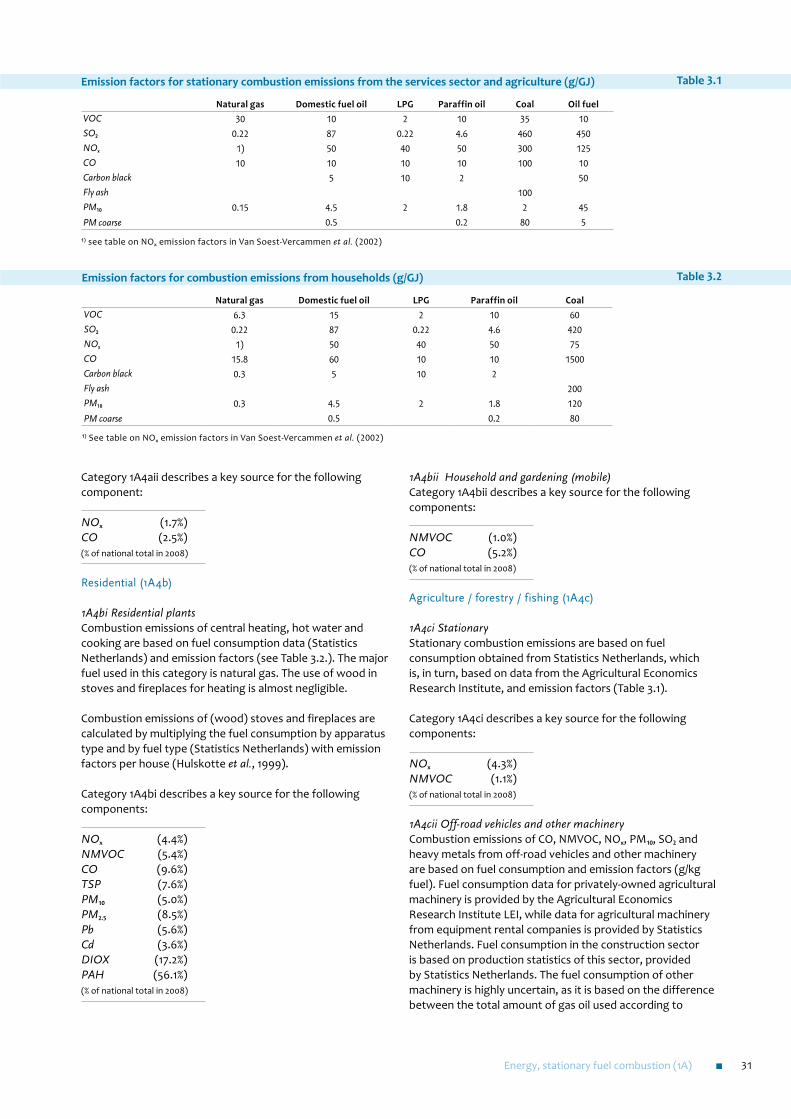
Commercial / institutional (1A4a)Combustion emissions from the commercial and institutional sector are based on fuel consumption data (Statistics Netherlands) and emission factors (see Table 3.1.). Results for stationary (1A4aii) and mobile sources (1A4ai) are separately reported.
Category 1A4ai describes a key source for the following components:
SOx (1.1%)NOx (4.6%)(% of national total in 2008)
Energy, stationary fuel combustion (1A) 31
Category 1A4aii describes a key source for the following component:
NOx (1.7%)CO (2.5%)(% of national total in 2008)
Residential (1A4b)
1A4bi Residential plantsCombustion emissions of central heating, hot water and cooking are based on fuel consumption data (Statistics Netherlands) and emission factors (see Table 3.2.). The major fuel used in this category is natural gas. The use of wood in stoves and fireplaces for heating is almost negligible.
Combustion emissions of (wood) stoves and fireplaces are calculated by multiplying the fuel consumption by apparatus type and by fuel type (Statistics Netherlands) with emission factors per house (Hulskotte et al., 1999).
Category 1A4bi describes a key source for the following components:
NOx (4.4%)NMVOC (5.4%)CO (9.6%)TSP (7.6%)PM10 (5.0%)PM2.5 (8.5%)Pb (5.6%)Cd (3.6%)DIOX (17.2%)PAH (56.1%)(% of national total in 2008)
1A4bii Household and gardening (mobile)Category 1A4bii describes a key source for the following components:
NMVOC (1.0%)CO (5.2%)(% of national total in 2008)
Agriculture / forestry / fishing (1A4c)
1A4ci StationaryStationary combustion emissions are based on fuel consumption obtained from Statistics Netherlands, which is, in turn, based on data from the Agricultural Economics Research Institute, and emission factors (Table 3.1).
Category 1A4ci describes a key source for the following components:
NOx (4.3%)NMVOC (1.1%)(% of national total in 2008)
1A4cii Off-road vehicles and other machineryCombustion emissions of CO, NMVOC, NOx, PM10, SO2 and heavy metals from off-road vehicles and other machinery are based on fuel consumption and emission factors (g/kg fuel). Fuel consumption data for privately-owned agricultural machinery is provided by the Agricultural Economics Research Institute LEI, while data for agricultural machinery from equipment rental companies is provided by Statistics Netherlands. Fuel consumption in the construction sector is based on production statistics of this sector, provided by Statistics Netherlands. The fuel consumption of other machinery is highly uncertain, as it is based on the difference between the total amount of gas oil used according to
Emission factors for stationary combustion emissions from the services sector and agriculture (g/GJ)
Natural gas Domestic fuel oil LPG Paraffin oil Coal Oil fuelVOC 30 10 2 10 35 10SO2 0.22 87 0.22 4.6 460 450NOx 1) 50 40 50 300 125CO 10 10 10 10 100 10Carbon black 5 10 2 50Fly ash 100 PM10 0.15 4.5 2 1.8 2 45PM coarse 0.5 0.2 80 5
1) see table on NOx emission factors in Van Soest-Vercammen et al. (2002)
Table 3.1
Emission factors for combustion emissions from households (g/GJ)
Natural gas Domestic fuel oil LPG Paraffin oil CoalVOC 6.3 15 2 10 60SO2 0.22 87 0.22 4.6 420NOx 1) 50 40 50 75CO 15.8 60 10 10 1500Carbon black 0.3 5 10 2Fly ash 200PM10 0.3 4.5 2 1.8 120PM coarse 0.5 0.2 80
1) See table on NOx emission factors in Van Soest-Vercammen et al. (2002)
Table 3.2

Netherlands Informative Inventory Report 201032
Netherlands energy statistics (NEH) minus the gas oil use in the agricultural and construction sectors. Combustion emissions of NH3 are based on emission factors (Ntziachristos and Samaras, 2000) and total fuel consumption by off-road vehicles and other machinery. NMVOC and PAH combustion emissions are calculated by using NMVOC profiles (VROM, 1993; Shareef et al., 1988).
Category 1A4cii describes a key source for the following components:
SOx (1.4%)NOx (4.5%)NMVOC (0.9%)CO (0.7%)TSP (1.7%)PM10 (2.0%)PM2.5 (3.6%)(% of national total in 2008)
1A4ciii National f ishingCombustion emissions are based on fuel sales to cutters operating within national waters, and on fuel-specific emission factors. Since fuel sales to cutters are not recorded separately by Netherlands energy statistics (these are included in the bunker fuel sales), an estimate of fuel use is made on the basis of vessel movements. Emission factors for CO, NOx, (NM)VOC, CH4, SO2, and PM10 are derived from national research (Hulskotte and Koch, 2000; Van der Tak, 2000). NH3 emission factors are derived from Ntziachristos and Samaras (2000). It is assumed that all four-stroke engines use diesel oil, while all two-stroke engines use heavy fuel oil. NMVOC and PAH combustion emissions are calculated by using NMVOC profiles (VROM, 1993; Shareef et al., 1988).
Category 1A4ciii describes a key source for the following components:
NOx (3.5%)PM2.5 (1.2%)(% of national total in 2008)
3.4 Other (1A5)
Other, stationary (including military) (1A5a)Emissions in this category are from the combustion of waste gas at dumping sites.
Other, mobile (including military) (1A5b)For military vessels and aircraft only emissions of CO2, N2O and CH4 are calculated. Other compounds relating to NEC ceilings can not be calculated, since it is unknown where fuel is used. The Ministry of Defence regards information on the location of military activity as classified.
No key sources are found in this category.
3.5 Mobile combustion (1A3)
Road transportation (1A3b)Exhaust emissions of CO, NMVOC, NOx, NH3 and PM in these source categories are dependent on vehicle type, fuel type, emission reduction technology, and driving behaviour. These emissions are calculated on the basis of vehicle kilometres and specific emission factors for a variation of different vehicle classes and for three different road types. The vehicle classes are defined by the vehicle category (such as passenger cars, vans, trucks), fuel type, weight class, emission legislation class and in some instances the engine type and/or the emission reduction technology. The emission factors for passenger cars are based on a yearly vehicle emission monitoring programme by TNO (Science and Industry). The VERSIT+ model (Smit et al., 2006) is used to calculate emission factors from the emission measurement database. The specific emission factors per vehicle class are aggregated to emission factors by year of construction (in grams per vehicle kilometre). The emission factors by year of construction are published in Statline, the central database of Statistics Netherlands. The method is described in detail in Klein et al. (2009).
Traffic volume data is based on the following data by Statistics Netherlands:
� The Dutch Mobility Behaviour Survey (CBS, 2009). Since 2004, this study has been conducted by the Transport Research Centre of the Directorate for Public Works and Water Management; the current Dutch name is MobiliteitsOnderzoek Nederland. (MON)
� Mileage data is compiled by the Stichting Nationale Autopas (NAP) (Dutch national vehicle information foundation). From its database the average annual mileage (Dutch vehicles) can be derived per vehicle, according to year of construction and fuel type. The data include kilometres driven abroad.
� The recent data on ownership and use of commercial vehicles have been based on the Statistiek Wegvervoer (Road Transport Survey) (CBS, 1994) combined with NAP-data. The data from 1990 to 1994 were derived from the BedrijfsVoertuigenEnquête (Commercial vehicle survey).
� A survey in 1993 on the use of motorcycles in the Netherlands (CBS, 1993). Currently, there are no plans for repeating this survey.
The characteristics of the Dutch vehicle fleet are based on CBS (1999), which in turn is based on data provided by the Dutch road traffic department (RDW). Passenger car movements by non-residents are based on the following data by Statistics Netherlands: ‘Statistics on registered overnight stays’, commuter traffic by foreign workers and number of day trips. Foreign freight transport kilometres are based on ‘Statistics on road freight transport’ and similar statistics from other EU countries provided by Eurostat.
Emissions of SO2 and heavy metals (and CO2) are dependent on fuel consumption and fuel type. These emissions are calculated by multiplying fuel use by emission factors (gram per litre fuel consumed). The emission factors are based on the sulphur, carbon and heavy metal contents of the fuels. It is assumed that 75% of the lead is emitted as particles and 95%
Energy, stationary fuel combustion (1A) 33
of the sulphur is transformed to sulphur dioxide. The data on fuel consumption by mobile sources is collected by Statistics Netherlands.
Emissions of NMVOC components (alkanes, alkenes, aromates, such as benzene and formaldehyde, polycyclic aromatic hydrocarbons PAHs and chlorinated hydrocarbons) are calculated by multiplying the total NMVOC emission by a NMVOC speciation profile.
1A3bi Road transport, passenger carsCategory 1A3bi describes a key source for the following components:
NOx (11.8%)NH3 (1.8%)NMVOC (10.2%)CO (32.0%)TSP (5.9%)PM10 (6.9%)PM2.5 (13.0%)DIOX (1.1%)PAH (4.5%)(% of national total in 2008)
1A3bii Road transport, light-duty vehiclesCategory 1A3bii describes a key source for the following components:
NOx (5.4%)NMVOC (0.9%)CO (1.6%)TSP (4.5%)PM10 (5.4%)PM2.5 (10.1%)PAH (1.2%)(% of national total in 2008)
1A3biii Road transport, heavy-duty vehiclesCategory 1A3biii describes a key source for the following components:
NOx (20.7%)NMVOC (1.9%)CO (1.8%)TSP (3.3%)PM10 (3.8%)PM2.5 (7.2%)PAH (3.1%)(% of national total in 2008)
1A3biv Road transport, mopeds and motorcyclesCategory 1A3biv describes a key source for the following components:
NMVOC (5.7%)CO (10.0%)DIOX (0.9%)PAH (1.9%)(% of national total in 2008)
1A3a Civil aviation
Combustion emissions – Amsterdam Airport Schiphol Combustion emissions of CO, NMVOC, NOx, PM10, SO2 and heavy metals from aviation are calculated with the EMASA model on a yearly basis (TNO Built Environment and Geosciences). This model is derived from the widely used method of the US Environmental Protection Agency for calculating aviation emissions.
The Landing and Take-off cycle (LTO) can be divided into four LTO cycle phases: idle, take-off, climb-out and approach from 3000 feet. The four modes in the LTO cycle correspond to different power settings of the engines: idle 7%, take-off 100%, climb-out 85% and approach 30%. The equation for calculating the emissions is presented next:
emission = SUMp,m,f (LTOp,m * Np * FUELm,f * TIMp,f * EFm,f )
where:emission = emission (kg/yr)
LTOp,m = number of LTO cycles per aircraft with jet engine type (m) per year
Np = number of engines per aircraft
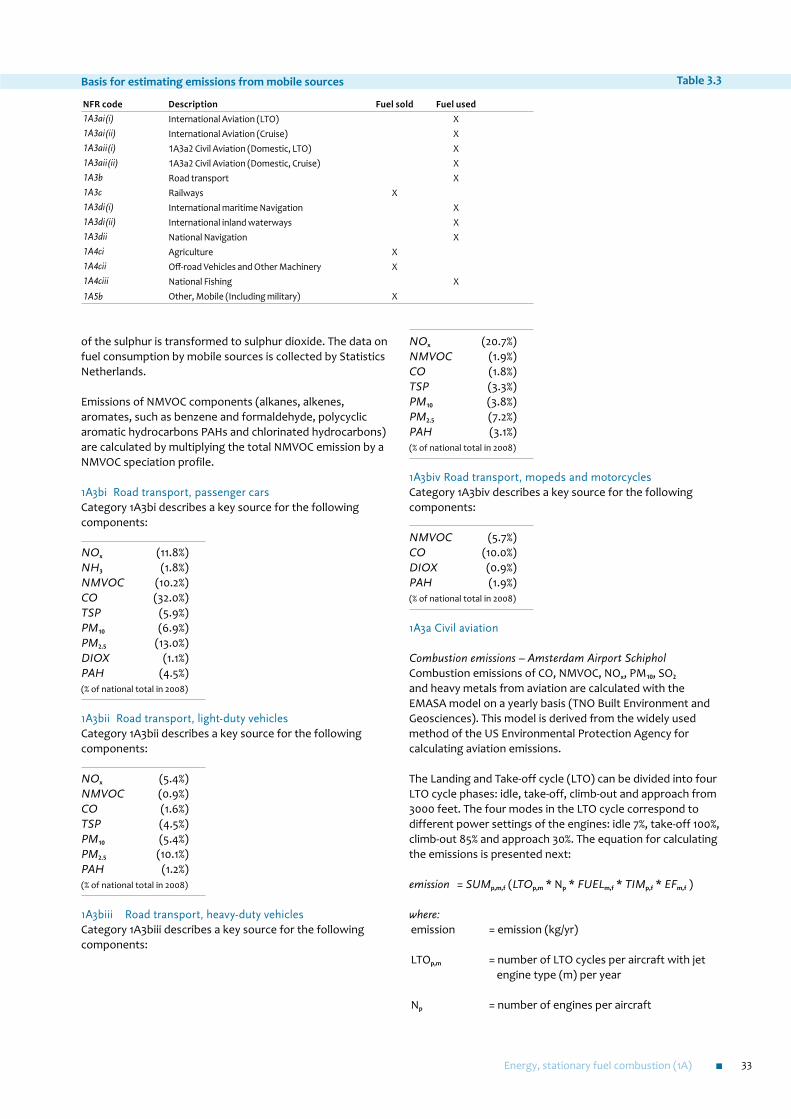
Basis for estimating emissions from mobile sources
NFR code Description Fuel sold Fuel used1A3ai(i) International Aviation (LTO) X1A3ai(ii) International Aviation (Cruise) X1A3aii(i) 1A3a2 Civil Aviation (Domestic, LTO) X1A3aii(ii) 1A3a2 Civil Aviation (Domestic, Cruise) X1A3b Road transport X1A3c Railways X 1A3di(i) International maritime Navigation X1A3di(ii) International inland waterways X1A3dii National Navigation X1A4ci Agriculture X 1A4cii Off-road Vehicles and Other Machinery X 1A4ciii National Fishing X1A5b Other, Mobile (Including military) X
Table 3.3
Netherlands Informative Inventory Report 201034
FUELm,f = fuel consumption of jet engine type (m) in LTO cycle phase (f)
TIMp,f = time in mode in LTO cycle (f) for aircraft (p)
EFm,f = emission factor of jet engine type (m) in LTO cycle (f) (kg/kg)
The EMASA model takes into account about 100 types of aircraft, as reported in the Statistical Annual Review of Amsterdam Airport Schiphol. The engine types of these aircrafts are based on the aircraft/engine combinations of the so-called home-carriers (e.g. KLM, Martinair and Transavia). The emission factors are derived from various sources, including the DERA database (DERA, 1999) and the Federal Aviation Agency Engine Emission Database of the EPA (FAA, 1996); for smaller engines emission factors are based on EPA publication AP42 (EPA, 1985). Emissions from military use of aviation fuel are reported under the source category Other mobile sources (NFR 1A5b).
Emissions from auxiliary power units and general power units for aircraft at Schiphol are based on an estimated fuel consumption of 500 gram per passenger multiplied with emission factors.
Combustion emissions other airportsEmissions by civil aviation from other airports are calculated similarly to the method described above, now taking into account the number of flights per regional airport. The aircraft types were derived from their ICAO codes and assigned to the most appropriate type present in the EMASA model. If no aircraft types are available for a certain year, the movements were indexed with the total number of flight movements as published by Statistics Netherlands. Furthermore, emissions in the 1995-1999 period are calculated by indexing the 1994 emissions with the flights per airport in this period.
NH3 emissions are based on emission factors from EEA (Ntziachristos and Samaras, 2000) and total fuel consumption during the LTO cycle at Dutch airports.
VOC and PAH combustion emissionsFirst, the NMVOC emissions are calculated as described above. Second, the NMVOC and PAH components are calculated using NMVOC profiles (VROM, 1993; Shareef et al., 1988).
1A3aii(i) Civil aviation (domestic, LTO)Category 1A3aii describes a key source for the following component:
Pb (5.3%)(% of national total in 2008)
1A3ai(i) International aviation (LTO)No key sources are found for category 1A3ai(ii).
Railways (1A3c)Combustion emissions of CO, NMVOC, NOx, PM10, SO2 and heavy metals from railways are based on diesel fuel
consumption and emission factors. Fuel consumption data is provided by NS Reizigers (Dutch rail passenger organisation). Emission factors for CO, NMVOC, NOx and PM10 were derived by PBL (The Netherlands Environmental Assessment Agency) in consultation with the NS (Railways Netherlands). Combustion emissions of NH3 are based on EEA emission factors (Ntziachristos and Samaras, 2000). NMVOC and PAH combustion emissions are calculated using NMVOC profiles (VROM, 1993; Shareef et al., 1988).
No key sources are found in this category.
International inland waterways (1A3di(ii))For inland waterways, emission factors are dependent on year of construction of the engine and on maximum RPM for recently built engines. Energy consumption data is calculated by using data on ship movements from Statistics Netherlands. This is calculated with the EMS model, which is managed by the Netherlands Organisation for Applied Scientific Research (TNO) (Hulskotte et al., 2003).
Category 1A3di(ii) describes a key source for the following components:
SOx (2.4%)NOx (5.8%)NMVOC (0.5%)CO (0.7%)TSP (1.6%)PM10 (1.9%)PM2.5 (3.3%)(% of national total in 2008)
National navigation (1A3dii)For inland navigation energy consumption for 28 different vessel classes is calculated for the various inland waterway types and rivers in the Netherlands, based on the load factor of the vessels and the speed of the vessels relative to the water. Emission factors dependent on energy consumption were derived by Oonk et al. (2003). Emission factors are dependent on year of construction of the engine and on maximum RPM for recently built engines. Energy consumption data is calculated using ship movements and divided into inland shipping and international shipping using the data of Statistics Netherlands. The above calculation is done with the EMS model, which is managed by TNO (Hulskotte et al., 2003).
Combustion emissions of leisure boats are based on fuel consumption data, which are estimated by multiplying boat numbers by specific yearly fuel consumption per boat type. Specific fuel consumption was determined by means of a questionnaire. The calculation procedure is described in a fact sheet (Hulskotte et al., 2005). Some of the emissions of some substances (e.g. PAH and NMVOC species) are specified as waterborne emissions.
Category 1A3dii describes a key source for the following components:
Energy, stationary fuel combustion (1A) 35
SOx (1.2%)NOx (3.8%)NMVOC (2.3%)CO (4.3%)TSP (1.1%)PM10 (1.3%)PM2.5 (2.4%)(% of national total in 2008)
Other (1A3e) No emissions are reported in this category and the subcategories 1A3e1 Pipeline compressors and 1A3e2 Other mobile sources and machinery.
3.6 Evaporation, tyre and brake wear, road abrasion (1A3b)
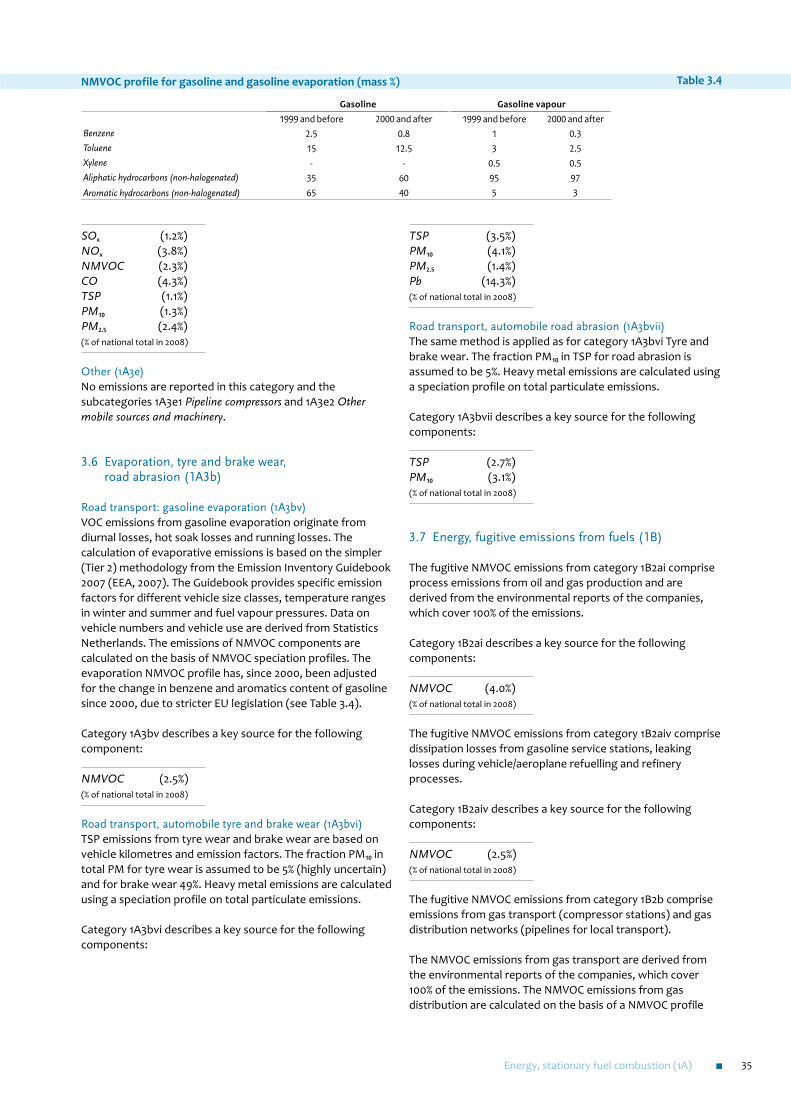
Road transport: gasoline evaporation (1A3bv)VOC emissions from gasoline evaporation originate from diurnal losses, hot soak losses and running losses. The calculation of evaporative emissions is based on the simpler (Tier 2) methodology from the Emission Inventory Guidebook 2007 (EEA, 2007). The Guidebook provides specific emission factors for different vehicle size classes, temperature ranges in winter and summer and fuel vapour pressures. Data on vehicle numbers and vehicle use are derived from Statistics Netherlands. The emissions of NMVOC components are calculated on the basis of NMVOC speciation profiles. The evaporation NMVOC profile has, since 2000, been adjusted for the change in benzene and aromatics content of gasoline since 2000, due to stricter EU legislation (see Table 3.4).
Category 1A3bv describes a key source for the following component:
NMVOC (2.5%)(% of national total in 2008)
Road transport, automobile tyre and brake wear (1A3bvi)TSP emissions from tyre wear and brake wear are based on vehicle kilometres and emission factors. The fraction PM10 in total PM for tyre wear is assumed to be 5% (highly uncertain) and for brake wear 49%. Heavy metal emissions are calculated using a speciation profile on total particulate emissions.
Category 1A3bvi describes a key source for the following components:
TSP (3.5%)PM10 (4.1%)PM2.5 (1.4%)Pb (14.3%)(% of national total in 2008)
Road transport, automobile road abrasion (1A3bvii)The same method is applied as for category 1A3bvi Tyre and brake wear. The fraction PM10 in TSP for road abrasion is assumed to be 5%. Heavy metal emissions are calculated using a speciation profile on total particulate emissions.
Category 1A3bvii describes a key source for the following components:
TSP (2.7%)PM10 (3.1%)(% of national total in 2008)
3.7 Energy, fugitive emissions from fuels (1B)
The fugitive NMVOC emissions from category 1B2ai comprise process emissions from oil and gas production and are derived from the environmental reports of the companies, which cover 100% of the emissions.
Category 1B2ai describes a key source for the following components:
NMVOC (4.0%)(% of national total in 2008)
The fugitive NMVOC emissions from category 1B2aiv comprise dissipation losses from gasoline service stations, leaking losses during vehicle/aeroplane refuelling and refinery processes.
Category 1B2aiv describes a key source for the following components:
NMVOC (2.5%)(% of national total in 2008)
The fugitive NMVOC emissions from category 1B2b comprise emissions from gas transport (compressor stations) and gas distribution networks (pipelines for local transport).
The NMVOC emissions from gas transport are derived from the environmental reports of the companies, which cover 100% of the emissions. The NMVOC emissions from gas distribution are calculated on the basis of a NMVOC profile
NMVOC profile for gasoline and gasoline evaporation (mass %)
Gasoline Gasoline vapour1999 and before 2000 and after 1999 and before 2000 and after
Benzene 2.5 0.8 1 0.3Toluene 15 12.5 3 2.5Xylene - - 0.5 0.5Aliphatic hydrocarbons (non-halogenated) 35 60 95 97Aromatic hydrocarbons (non-halogenated) 65 40 5 3
Table 3.4

Netherlands Informative Inventory Report 201036
with the CH4 emission from annual reports of the sector as input.
Category 1B2b describes a key source for the following component:
NMVOC (1.0%)(% of national total in 2008)
Industry (2) 37
4.1 Overview of the sector
Emissions in this sector include all non-energy-related emissions from industrial activities. Emissions from fuel combustion in industrial activities are included in data on the energy sector. Fugitive emissions in the energy sector (i.e. not relating to fuel combustion) are included in NFR sector 1B Fugitive emissions.
Industrial process emissions are based on environmental reports of large industries and extrapolations to total emissions per SBI category, using implied emission factors and production data (method 1), or they are based on sector reports on emissions (method 2) or they are based on specific emission factors and production statistics from CBS and branch organisations(method 3).
Method 1 Extrapolation from emission data of individual companies
Emission factor ER-I (SBI category) = Emissions ER-I (SBI category) / Production ER-I (SBI category)
whereER-I = Emission Registration database for
individual companies
Production ER-I = activity data or proxy for the production process
Next, the total process emissions in this SBI category are calculated from the production data, as provided in the Production Statistics (Statistics Netherlands), multiplied by the implied emission factor.
ERI_SBI_Emission (SBI category) = Emission factor ER-I (SBI category) * Production (SBI category)
Note: Companies do not provide specific information to the PRTR on their measurement systems or emission model or which emission factors are used in the calculation model. Therefore, in some cases the PRTR can not use the data from the environmental reports in the extrapolation to the total emissions of a sector.
Method 2 Sectoral emission reportsSome branch organisations provide emission reports as part of their agreements in covenants with the government; see
http://www.fo-industrie.nl (Dutch only). Total emissions for the sectors are obtained from these annual reports.
Method 3 Sources for which there is no individual or sectoral registrationA set of specific emission factors is used for the calculation of emissions such as PAHs from 2C1 and 2C5e. These emission factors are obtained from specific studies. The emission factors are combined with production statistics from CBS or activity data reported by specific branch organisations.
The main categories (2A–G) in the NFR sector 2 ‘Industrial processes’ are discussed in the following sections. Because the priority heavy metals (Pb, Hg and Cd) time series of most categories (2A1, 2B, 2C) are incomplete they will not be discussed in the following sections. In subsequent submissions, incomplete time series will be repaired, as far as possible.
4.2 Mineral production (2A)
This category comprises emissions related to the production and use of non-metallic minerals in:
� 2A1 Cement clinker production; � 2A3 Limestone and dolomite use; � 2A4 Soda ash production and use; � 2A7 Other (the production of glass and other mineral
production and use).
Emissions from 2A2 Lime production are included in 2D2; those from 2A5 Asphalt roofing and 2A6 Road paving with asphalt are not estimated since no methodology is available.
Due to allocation problems, total emissions from mineral products (2A) are reported in category 2A7. Only emissions in the category 2A1 Cement production could be reported separately, because emissions in this category are derived from the environmental reports of the corresponding companies.
Cement clinker production (2A1)Category 2A1 describes a key source for the following component:
Hg (11.5%)(% of national total in 2008)
Industry (2) 4
Netherlands Informative Inventory Report 201038
Other mineral products (2A7d)Category 2A7d describes a key source for the following components:
SOx (1.8%)TSP (2.8%)PM10 (3.3%)PM2.5 (2.5%)Pb (3.9%)(% of national total in 2008)
The SO2 emissions reported in this category originate in glass production and production of roof tiles. The SO2 and lead emissions from glass production are calculated with the extrapolation method (1), see Section 4.1, based on m2 glass produced by individual companies and total glass production, as reported by the CBS. The SO2 emission from the production of roof tiles is based on production statistics and a specific emission factor (method 3). Because of a lower sulphur content in fuels, SO2 emissions decreased from 10.1 in 1990 to 3.1 Gg in 2008. Pb emissions in this category are from glass production only.
4.3 Chemical industry (2B)
The PRTR comprises emissions related to three source categories belonging to this category:
� 2B1 Ammonia production (SBI 24.15 ‘Manufacture of artificial fertilisers’)
� 2B2 Nitric acid production (included in SBI 24.1 ‘Manufacture of basic organic chemicals’)
� 2B5a Emissions from ‘Other chemical product manufacture’:
� Manufacture of chemicals for agricultural use; � Manufacture of other chemical products (glue, photo
chemicals, pharmaceuticals, fibres, paint and ink, soap and detergents).
Adapic acid (2B3) and calcium carbide (included in 2B4) are not produced in the Netherlands. Emissions are not reported under 2B1 and 2B2 (only the greenhouse gases CO2 and N2O are reported here). Due to allocation problems, all emissions from the chemical industry (2B) are reported in category 2B5a.
Other chemical industry (2B5a)Category 2B5a describes a key source for the following components:
NMVOC (4.5%)TSP (4.8%)PM10 (2.3%)PM2.5 (3.2%)Pb (3.7%)Hg (3.0%)Cd (33.7%)(% of national total in 2008)
All emissions are calculated by extrapolation of activity data and emissions of the individual companies to totals in the
subsectors, using production volume or production value as a proxy.
From 1990 to 2008, NMVOC emissions decreased from 33.82 to 7.56 Gg and PM10 emissions from 4.42 to 0.84 Gg. These reductions were mainly caused by the implementation of technical measures.
4.4 Metal production (2C)
The national inventory of the Netherlands comprises emissions from iron and steel production (2C1) and other metal production (2C5). As announced in the 2009 submission, the current submission also includes emissions of the four individual PAHs (Benzo(a)pyrene, Benzo(b)fluoranthene, Benzo(k)fluoranthene, Indeno(1,2,3-cd)pyrene) as well as the total for those four substances.
2C1 Iron and steel productionCategory 2C1 describes a key source for the following components:
TSP (8.9%)PM10 (4.1%)PM2.5 (4.8%)Pb (64.3%)Hg (31.9%)Cd (53.6%)PAH (5.0%)(% of national total in 2008)
The Netherlands has one integrated iron and steel plant (Corus, formerly known as Hoogovens). Integrated steelworks convert iron ores into steel by means of sintering, producing pig iron in blast furnaces and converting pig iron to steel in basic oxygen furnaces. For the purpose of the inventory, emissions from integrated steelworks are estimated for these three processes, as well as for some other minor processes. Emissions from sintering are included in 1A. A portion of the coke oven gas and blast/oxygen furnace gas produced during these processes is sold to a nearby power plant to be used as fuel. These emissions are reported by Corus in AERs and are included in category 1B. The emissions are calculated by using the extrapolation method. Extrapolations to total emissions from this sector are very small.
The PM10 emissions decreased from 10.27 Gg in 1990 to 1.86 Gg in 2008 and the PAH emissions from 1.641 Mg in 1990 to 0.199 Mg in 2008. These reductions were mainly caused by the implementation of technical measures.
2C5e Other metal productionCategory 2C5e describes a key source for the following components:
Industry (2) 39
CO (6.9%)TSP (1.1%)PM2.5 (1.2%)Cd (2.4%)PAH (19.6%)(% of national total in 2008)
The other metal production (2C5) category covers the production of aluminium, copper, lead, nickel and zinc. Aluminium production is the most important sector in this category. Aluminium is produced at two primary aluminium smelters and they report their emissions in AERs. The emissions are calculated by using the extrapolation method.
Between 1990 and 2008 the CO emissions remained rather constant. PM10 emissions decreased from 1.046 Gg in 1990 to 0.357 Gg in 2008 and PAH emissions from 2.567 Mg in 1990 to 0.779 Mg in 2008. These reductions were mainly caused by the implementation of technical measures.
4.5 Pulp and paper (2D1)
Category 2D1 describes a key source for the following component:
PM10 (1.0%)(% of national total in 2008)
PM emissions in this category are derived from the environmental reports of the companies and completed with calculations using implied emission factors and production data (method 1). The PM10 emissions from this sector remained rather constant between 1990 and 2008.
4.6 Food and drink production (2D2)
Category 2D2 describes a key source for the following components:
NMVOC (3.2%)TSP (7.3%)PM10 (7.3%)PM2.5 (2.3%)(% of national total in 2008)
NMVOC and PM emissions in this category are derived from the environmental reports of the companies and completed with calculations using implied emission factors and production data (method 1). From 1990 to 2008, the NMVOC emissions decreased from 7.56 to 5.67 Gg and the PM10 emissions from 7.17 to 2.77 Gg. These reductions were mainly caused by the implementation of technical measures.
4.7 Other production (2G)
Category 2G describes a key source for the following components:
NMVOC (7.7%)TSP (6.0%)PM10 (6.4%)PM2.5 (3.5%)PAH (1.3%)(% of national total in 2008)
Most of PAH emissions are emitted in the electrical engineering sector. The emission figures are derived from the environmental reports of the companies and completed with calculations using implied emission factors and production data (method 1). NMVOC emissions decreased from 37.9 Gg in 1990 to 12.35 Gg in 2008 and PM10 emissions from 4.91 Gg in 1990 to 2.34 Gg in 2008. These reductions were mainly caused by the implementation of technical measures.
PAH emissions remained rather constant between 1990 and 2008.

Netherlands Informative Inventory Report 201040
Solvents and product use (3) 41
5.1 Overview of the sector
Emissions in this sector include emissions from the use of paints (3A), degreasing and dry-cleaning(3B), the printing industry (3D1), domestic solvent use (3D2) and other product use (3D3). Most emissions are based on activity data from (statistical) annual reports from branch organisations and NMVOC contents and emission factors from studies. Emissions from chemical products, manufacturing and processing (3C) are included in 2B (chemical industry).
NMVOC emissions from solvent use have decreased since 1990 because of a reduction in the solvent content in consumer products and paints. The PRTR works in good cooperation with industrial branch organisations.
In the paint application sector, annual statistics on sales are provided by the Dutch branch organisation for paint producers (VVVF). Also for products containing solvent (in the domestic sector and other product use), sales data are obtained from the branch organisations. The fraction NMVOC emitted to the atmosphere is available from other studies. The printing industry has an agreement with the government from which data become available for the PRTR.
The main categories (3A, 3B and 3D) in the NFR sector 3 ‘Solvent and product use’ are discussed in the following sections.
5.2 Paint application (3A)
This is the most important category in this sector.
3A1 Decorative coating applicationCategory 3A1 ‘Decorative coating application’ describes a key source for the following component:
NMVOC (2.3%)(% of national total in 2008)
3A2 Industrial coating applicationCategory 3A2 ‘Industrial coating application’ describes a key source for the following component:
NMVOC (11.4%)(% of national total in 2008)
VOC emissions from paint use are calculated from annual national paint sales statistics (containing data on paint that is both produced and sold in the Netherlands), provided by the Dutch branch organisation for paint producers (VVVF), including data on paint imports, estimated by the VVVF (2004). The VVVF (through its members) directly monitors VOC in paint, while an assumption by the VVVF is used for the VOC in imported paints. Estimates have also been made for paint-related thinner use and the (reduction) effect of afterburners. For more information, see the protocol ‘Calculation of VOC emissions from paint in the Netherlands’ (Peek, 2010).
NMVOC emissions from paint use decreased from 80.74 Gg in 1990 to 21.8 Gg in 2008, mainly due to the lower average NMVOC content.
5.3 Degreasing and dry cleaning (3B)
3B1 DegreasingCategory 3B1 ‘Degreasing’ describes a key source for the following component:
NMVOC (1.4%)(% of national total in 2008)
Up-to-date information on activity data is not available and emissions (2.9 Gg) have been assumed constant for the 2000-2008 period. For the next submission the PRTR will investigate this problem.
3B2 Dry-cleaningNo key sources in the category 3B2 ‘Dry-cleaning’.
5.4 Other, including products containing HMs and POPs (3D)
3D1 PrintingCategory 3D1 ‘Printing’ describes a key source for the following component:
Solvents and product use (3)
5
Netherlands Informative Inventory Report 201042
NMVOC (3.0%)(% of national total in 2008)
Some branch organisations provide emission reports as part of their agreements in covenants with the government. Emissions from total category are subtracted from these annual evaluation reports.
NMVOC emissions decreased from 14.36 Gg in 1990 to 4.79 Gg in 2008. These reductions were mainly caused by the implementation of technical measures (afterburners).
3D2 Domestic solvent use including fungicidesCategory 3D2 ‘Domestic solvent use including fungicides’ describes a key source for the following component:
NMVOC (11.9%)(% of national total in 2008)
The most important sources are cosmetics (and personal care), cleaning agents and car products.
Total NMVOC-emissions per product are calculated by multiplying them by the number of products sold. NMVOC emissions per product are calculated by multiplying the fraction of the NMVOC content that is emitted to the atmosphere by the content of the product.
Sales data are obtained from annual reports of branch organisations. The NMVOC content of the products and the fraction of the NMVOC content that is emitted to the atmosphere are obtained from studies.
The NMVOC emissions increased from 11.3 Gg in 1990 to 19.1 Gg in 2008. These extra emissions were caused by the increased consumption of cosmetics, cleaning agents and car products during the 1990-2008 period.
3D3 Other product useCategory 3D3 describes a key source for the following components:
NMVOC (5.8%)TSP (2.9%)PM10 (3.5%)PM25 (2.2%)DIOX (65.1%)(% of national total in 2008)
Category 3D3 also includes the emissions from the use of creosoted wood products (PAH) and dioxin emissions from PCP treated wood. The emission is estimated by using a specific Dutch method.
Dioxin emissions from timber frames used in housing are determined for 1990 based on Bremmer et al (1993). As PCP has been banned since 1989, a linear reduction in dioxin emissions has been assumed around 25 g I-TEQ in 1990 to around 16 g I-TEQ in 2000.
Emissions of the other components remained rather constant between 1990 and 2008.
Agriculture (4) 43
The sector Agriculture is a major source category for ammonia and particulate matter (PM) emissions. See section 5.2.3 on emission trends. For ammonia emission from agriculture two different sources are distinguished: animal manure and synthetic fertiliser. The main source of agricultural PM emissions is formed by animal housing systems. A description of the calculation method is provided in Van der Hoek (2002).
Ammonia emissions from animal manure Ammonia emissions from animal manure are calculated using the Manure and Ammonia model developed by the Dutch Agricultural Economics Research Institute (LEI). Input data for this model are divided into general and specific. General input data are animal numbers taken from the annual agricultural census. Specific input data concern the nitrogen and phosphate excretion by different animal categories and the ammonia volatilisation rates from animal housing systems and soil application systems for animal manure. The average nitrogen excretion per animal category is calculated annually as the difference between absorbed nitrogen from feeding and the capture in animal products. This so-called ‘balance’ method takes into account annual changes in food consumption, food nitrogen content, etc. The excreted nitrogen partly volatilises as ammonia in animal houses, in pasture, during storage and during application to the soil. The share of housing and manure application systems with low ammonia volatilisation rates is taken into account. The rate of volatilisation of ammonia from animal manure depends on such aspects as the nitrogen content of the manure, the chemical balance between ammonia and ammonium in the manure and, finally, the contact surface manure – air and the exposure time.
Ammonia emissions from synthetic fertiliser Ammonia emissions from synthetic fertiliser are calculated using data on the amounts of applied nitrogen fertiliser. These data are recorded by LEI and reported in Landbouwcijfers (Agricultural Data); these are also available via www.lei.wur.nl. Several types of nitrogen – each with their own specific ammonia emission factor fertiliser – are distinguished.
PM emissions from Agriculture The main source for PM emissions from agriculture are animal housing systems. Some other smaller sources include application of synthetic fertiliser, application of pesticides, supply of concentrates, hay making and harvesting of arable crops. The general input data for calculating the emissions
from animal housing systems are animal numbers taken from the annual agricultural census. The share of poultry in free range housing systems with relative high emission factors is taken into account in these calculations. For several sources country-specific emission factors are available (Chardon and Van der Hoek, 2002).
6.1 Dairy cattle (4B1A)
Ammonia emission from dairy cattle (adult female cows) is calculated by multiplying the activity number with the emission factor. For dairy cattle the activity number is based on the animal number count from the annual agricultural census. Emission factors are calculated from the excretion and volatilisation rates for dairy cows.
Excretion rateThe excretion rate depends on feed intake and milk yield. Distinction is made between type of feed in two regions in the Netherlands and for two periods (summer and winter period).
Volatilisation rateThere are four different sources for ammonia emissions from animal manure: animal housing (manure production and storage), outside storage facilities (manure storage), meadow (manure production) and soils (manure application). For this reason also four different volatilisation rates are distinguished. Approximately 40% of dairy cattle ammonia emissions are derived from application of manure to the soil. Another 50% derives from animal houses and the rest is from animals grazing and from storage of manure.
Category 4B1a describes a key source for the following components:
NH3 (29.0%)TSP (2.0%)PM10 (2.4%)PM2.5 (0.9%)(% of national total in 2008)
6.2 Non-dairy cattle (4B1b)
Emission data for non-dairy cattle is based on the non-dairy cattle number count from the agricultural census and on emission factors calculated from excretion and volatilisation
Agriculture (4) 6
Netherlands Informative Inventory Report 201044
rates for these specific cows. There is, however, no distinction made between young and full-grown animals. Young dairy cattle are also included in this category.
Category 4B1b describes a key source for the following component:
NH3 (14.4%)(% of national total in 2008)
6.3 Swine (4B8)
Emission data is based on agricultural data from the agricultural census and on emission factors calculated from excretion and volatilisation rates for two specific types of pigs. Distinction is made between animals for meat production (fattening pigs) and animals used for breeding (breeding sows). Three types of volatilisation rates are distinguished for the two swine categories: the animal house, manure storage and soil application. Housing systems with high and low ammonia emission are also distinguished.
Emission of particulates comes mainly from skin, manure, feed and mulch particles ventilated from animal housing and have been calculated using an average emission factor per pig, deducted from the PM5 (respirable fraction of PM) emission factor.
Category 4B8 describes a key source for the following components:
NH3 (23.0%)TSP (5.9%)PM10 (6.9%)PM2.5 (2.6%)(% of national total in 2008)
6.4 Poultry (4B9)
Ammonia emission data is based on agricultural data from the agricultural census and on emission factors calculated from excretion and volatilisation rates for two specific types of poultry. Distinction is made between animals for meat production (broilers) and animals for egg production (laying hens). For both poultry categories, three types of volatilisation rates are distinguished: for the animal house, manure storage and soil application. Five different housing systems are distinguished for laying hens.
Emission of particulates comes mainly from skin, manure, feed and mulch particles ventilated from animal housing; these have been calculated using an average emission factor per chick, deducted from the PM5 (respirable fraction of PM) emission factor. A distinction is made between free-range housing systems (with high PM emission factors) and housing systems based on cages (with a low PM emission factor).
Category 4B9 describes a key source for the following components:
TSP (13.0%)PM10 (15.4%)PM2.5 (5.8%)(% of national total in 2008)
Laying hensCategory 4B9a describes a key source for the following component:
NH3 (7.5%)(% of national total in 2008)
4B9b Other poultry Category 4B9b describes a key source for the following component:
NH3 (4.6%)(% of national total in 2008)
6.5 Synthetic N-fertilisers (4D1a)
Emission data is based on amounts of different types of synthetic fertiliser and specific emission factors.
Category 4D1a describes a key source for the following component:
NH3 (8.9%)(% of national total in 2008)
6.6 Farm-level agricultural operations including storage, handling and transport of agricultural products (4D2a)
Emission data are based on amounts of agricultural product stored, handled, transported and used, and on specific emission factors (Chardon and Van der Hoek, 2002).
Category 4D2a describes a key source for the following component:
PM10 (1.0%)(% of national total in 2008)
Waste (6) 45
7.1 Waste incineration (6C)
The combustion emissions from waste incineration are included in the category 1A1a because nearly all the energy from waste incineration is converted into electricity. The emissions from crematoria are reported in this category. Mercury (Hg) emissions are estimated on the basis of the number of corpses cremated and an average amalgam content.
6Cc Municipal waste incinerationCategory 6Cc describes a key source for the following components :
Hg (12.7%)Cd (3.3%)DIOX (2.4%)(% of national total in 2008)
6Cd CremationCategory 6Cd describes a key source for the following components :
Hg (8.4%)(% of national total in 2008)
7.2 Other waste (6D)
The emissions from the waste sector are reported in this category and coded as process emissions in the database. For historical reasons this category used to contain some of the emissions from waste incineration. This has been corrected in the latest submission, and emissions have been transferred to the 1A1a category.
No key sources in this category.
Waste (6) 7

Netherlands Informative Inventory Report 201046
Other (7) 47
The emissions from burning candles, smoking of cigarettes and lighting of fireworks are reported in this category. This also includes the emissions of NH3 from human perspiration. Please note that the Netherlands include this NH3 sources in the national total, whereas other parties do not. There is no clear guidance yet whether or not these emissions should be included in the national total for NH3.
Category 7A describes a key source for the following components:
NH3 (3.8%)TSP (3.1%)PM10 (3.7%)PM2.5 (7.0%)(% of national total in 2008)
Other (7) 8

Netherlands Informative Inventory Report 201048
Recalculations and other changes 49
9.1 Recalculations of the 2010 submission
Compared to the 2009 submission (Jimmink et al, 2009), only one methodological change was implemented in the PRTR system. A new method for calculating the emission from off-road vehicles was implemented which is described on the website of Statistics Netherlands, see http://www.cbs.nl/en-GB/menu/themas/natuur-milieu/methoden/dataverzameling/overige-dataverzameling/2006-11-methoden-rapport-verkeer-eng1.htm. This new method is based on sales data and average annual use, energy consumption and average life span of different types of mobile machinery (Hulskotte et al., 2009). Total energy consumption by non-road mobile machinery as applied in this method, was obtained from Statistics Netherlands. The new method has led to a decrease in the calculated PM10 emissions of 0.7 to 0.9 Gg (25-30%) for the 2000-2006 period. The drop in NOx
emissions was small (1-2%).
9.2 Improvements
Improvements included in the 2010 submission and the IIR 2010:New information on total kilometres driven by heavy-duty vehicles (excluding buses) became available from Statistics Netherlands, based on the Statistiek Wegvervoer (Road Transport Survey) combined with data from the NAP (Dutch national vehicle information foundation). The NAP registers odometer data from all vehicles that enter a garage for maintenance or repair. This data has been used by Statistics Netherlands to calculate the average annual mileage for different vehicle types. Combined with data on the number of vehicles in the Dutch car fleet and kilometres driven by foreign vehicles, this has led to new data on total annual mileage of different types of heavy-duty vehicles on the Dutch road network for the 2001-2007 period. Applying this new data has led to lower annual NOx emissions from heavy-duty vehicles by approximately 1to 6 Gg in the 2000-2006 period.
NAP-data has also been used by Statistics Netherlands for recalculating the total annual number of kilometres driven by light commercial vehicles (N1 vehicles) within the Netherlands in the 2001-2007 period. This resulted in a downward adjustment of approximately 10 to 20%, subsequently
resulting in a downward adjustment of total emissions from LCVs.
Furthermore, the Netherlands now also report on the individual PAHs, instead of formerly only reporting on the sum parameter for total PAHs. This methodological change explains the drastic reduction in reported PAHs emissions.
The Dutch inventory now also holds data on estimates of ammonia emissions from horses. The emissions of ammonia have now increased with 3 to 4 Gg compared to the last submission.
Because of recoding of emission sources in the PRTR system some emission figures were reallocated, compared to the 2009 submission (Table 9.1).
As before, for the Netherlands, emissions from road transportation were calculated on the basis of ‘fuel consumed’. More accurate activity data have become available on the amount of kilometres driven within the Netherlands, including a subdivision which distinguishes kilometres driven on motorways, regional and local roads.
For the subsector ‘Commercial’, ‘Riding Horses’ are recognised as a new emission source. A calculation for the complete reporting period has been added to the inventory.
For agricultural sources PM10 and PM2.5 emission series have been recalculated.
Planned improvements:The share of kilometres driven annually, on urban roads, rural roads and motorways by different vehicle types will be re-evaluated.
The NMVOC and PAH profiles used for calculating emissions of different NMVOC and PAH components from light and heavy-duty vehicles (excluding motorcycles and mopeds) will be re-evaluated.
The emission model VERSIT+, used for calculating emission factors for different types of road vehicles, will be re-estimated by using new measurement data on new light
Recalculations and other changes
9
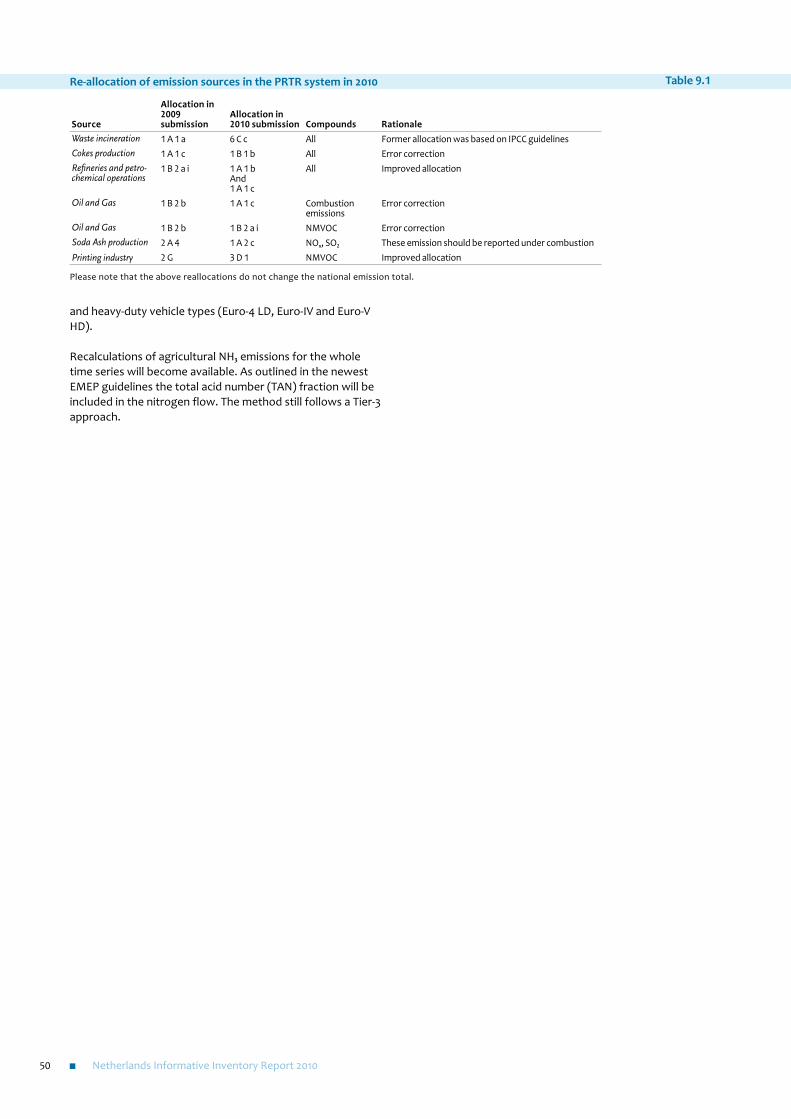
Netherlands Informative Inventory Report 201050
and heavy-duty vehicle types (Euro-4 LD, Euro-IV and Euro-V HD).
Recalculations of agricultural NH3 emissions for the whole time series will become available. As outlined in the newest EMEP guidelines the total acid number (TAN) fraction will be included in the nitrogen flow. The method still follows a Tier-3 approach.
Re-allocation of emission sources in the PRTR system in 2010
Source
Allocation in 2009 submission
Allocation in 2010 submission Compounds Rationale
Waste incineration 1 A 1 a 6 C c All Former allocation was based on IPCC guidelinesCokes production 1 A 1 c 1 B 1 b All Error correctionRefineries and petro-chemical operations
1 B 2 a i 1 A 1 bAnd1 A 1 c
All Improved allocation
Oil and Gas 1 B 2 b 1 A 1 c Combustion emissions
Error correction
Oil and Gas 1 B 2 b 1 B 2 a i NMVOC Error correctionSoda Ash production 2 A 4 1 A 2 c NOx, SO2 These emission should be reported under combustionPrinting industry 2 G 3 D 1 NMVOC Improved allocation
Please note that the above reallocations do not change the national emission total.
Table 9.1
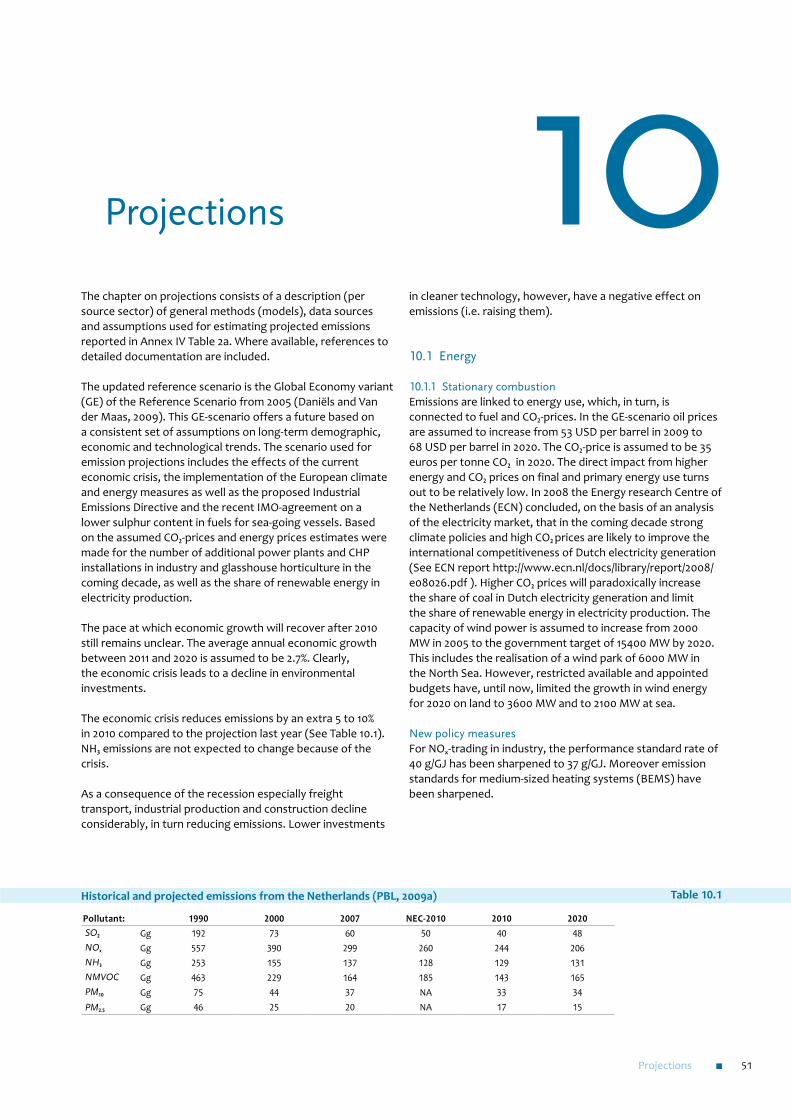
Projections 51
The chapter on projections consists of a description (per source sector) of general methods (models), data sources and assumptions used for estimating projected emissions reported in Annex IV Table 2a. Where available, references to detailed documentation are included.
The updated reference scenario is the Global Economy variant (GE) of the Reference Scenario from 2005 (Daniëls and Van der Maas, 2009). This GE-scenario offers a future based on a consistent set of assumptions on long-term demographic, economic and technological trends. The scenario used for emission projections includes the effects of the current economic crisis, the implementation of the European climate and energy measures as well as the proposed Industrial Emissions Directive and the recent IMO-agreement on a lower sulphur content in fuels for sea-going vessels. Based on the assumed CO2-prices and energy prices estimates were made for the number of additional power plants and CHP installations in industry and glasshouse horticulture in the coming decade, as well as the share of renewable energy in electricity production.
The pace at which economic growth will recover after 2010 still remains unclear. The average annual economic growth between 2011 and 2020 is assumed to be 2.7%. Clearly, the economic crisis leads to a decline in environmental investments.
The economic crisis reduces emissions by an extra 5 to 10% in 2010 compared to the projection last year (See Table 10.1). NH3 emissions are not expected to change because of the crisis.
As a consequence of the recession especially freight transport, industrial production and construction decline considerably, in turn reducing emissions. Lower investments
in cleaner technology, however, have a negative effect on emissions (i.e. raising them).
10.1 Energy
10.1.1 Stationary combustionEmissions are linked to energy use, which, in turn, is connected to fuel and CO2-prices. In the GE-scenario oil prices are assumed to increase from 53 USD per barrel in 2009 to 68 USD per barrel in 2020. The CO2-price is assumed to be 35 euros per tonne CO2 in 2020. The direct impact from higher energy and CO2 prices on final and primary energy use turns out to be relatively low. In 2008 the Energy research Centre of the Netherlands (ECN) concluded, on the basis of an analysis of the electricity market, that in the coming decade strong climate policies and high CO2 prices are likely to improve the international competitiveness of Dutch electricity generation (See ECN report http://www.ecn.nl/docs/library/report/2008/e08026.pdf ). Higher CO2 prices will paradoxically increase the share of coal in Dutch electricity generation and limit the share of renewable energy in electricity production. The capacity of wind power is assumed to increase from 2000 MW in 2005 to the government target of 15400 MW by 2020. This includes the realisation of a wind park of 6000 MW in the North Sea. However, restricted available and appointed budgets have, until now, limited the growth in wind energy for 2020 on land to 3600 MW and to 2100 MW at sea.
New policy measuresFor NOx-trading in industry, the performance standard rate of 40 g/GJ has been sharpened to 37 g/GJ. Moreover emission standards for medium-sized heating systems (BEMS) have been sharpened.
Projections 10
Historical and projected emissions from the Netherlands (PBL, 2009a)
Pollutant: 1990 2000 2007 NEC-2010 2010 2020 SO2 Gg 192 73 60 50 40 48 NOx Gg 557 390 299 260 244 206 NH3 Gg 253 155 137 128 129 131 NMVOC Gg 463 229 164 185 143 165 PM10 Gg 75 44 37 NA 33 34 PM2.5 Gg 46 25 20 NA 17 15
Table 10.1
Netherlands Informative Inventory Report 201052
10.1.2 Mobile combustionThe transport sector’s projections were updated with available new insights into transport volumes and emission factors. The assumed growth of diesel use by passenger cars has been adjusted downwards, based on recent developments in car sales in the Netherlands combined with new policy measures relating to the registration tax for passenger cars. In the new projections, the share of diesel in total fuel used is assumed to increase from approximately 23% in 2000 to 36% in 2020.
Policy measuresNOx emissions by road traffic are reduced by renewal of the fleet of vehicles, combined with the stricter Euro-standards for light and heavy-duty vehicles (e.g. the Euro-6 standards). These Euro standards also lead to a reduction in PM and NMVOC emissions from road traffic. There has been agreement within the EU on stricter NOx and PM10 standards for heavy-duty vehicles (Euro-VI). The Euro-VI standard applies to new vehicle types from 1-1-2013 and to all new sales from 1-1-2014. These standards are incorporated in the new NOx emission projections and lead to a decrease in NOx emission of approximately 13 kton in 2020. Emission standards for non-road transport (i.e. non-road mobile machinery, diesel trains and inland shipping) also contribute to the projected decrease in NOx emissions from the transport sector.
Since 2007 the North Sea is a Sulphur Emission Control Area (SECA), meaning sea-going vessels have to use fuel oil with a maximum sulphur content of 1.5%. The International Maritime Organisation (IMO) has sharpened this standard to 1% from 2010, and 0.1% from 2015 onwards.
At the end of 2008, the EU agreed on the revision of the fuel quality directive, which constrains the sulphur content for inland shipping, rail transport and mobile machinery to a maximum of 10 ppm. As a consequence of the sharpening of the standard, the entire transport sector (except for sea shipping) will use virtually sulphur-free fuels from 2011 onwards. Combined, these two measures lead to a sharp decrease in the projected SO2-emissions by the transport sector.
Additional policies that have not been decided upon and which, therefore, are not incorporated in the projections, are the introduction of road pricing and a limitation put on the growth of Schiphol Amsterdam Airport of 255000 landing and take-off (LTO) cycles (in 2000 the number of cycles was 215000). The Dutch Government plans to introduce a so-called ‘kilometre price’ for passenger vehicles, vans and heavy-duty vehicles, from 2011 onwards. The price per kilometre will depend on vehicle type, fuel type, fuel efficiency and emission performance. The average price per kilometre for passenger vehicles would be € 0.07. It is expected that the introduction of road pricing would lead to a decrease in vehicle kilometres travelled, resulting in lower emissions. The faster renewal rate of the national fleet of vehicles would also lead to a decrease in emissions.
10.2 Industrial processes
In the GE-scenario, industrial revenues grow by 2.4% per annum. The growth is relatively high in chemical industry (4.1%) and food and beverages industry (3.6%). Iron and steel production has a smaller growth with (0.9%).
Policy measuresThe refinery sector has agreed to an emission cap of 16 Gg for SO2. Additional policy envisages a sharpening of this cap to 14.5 Gg.
10.3 Agriculture
NH3 emissions from agriculture are not expected to change because of the economic crisis. Prices of agricultural products are expected to drop, in the short term, but this will not affect agricultural production levels.
Animal numbers have been derived from the GE-scenario in the long-term scenario study ‘Welfare, Prosperity and Quality of the Living Environment’ by CPB, MNP and RPB (CPB et al., 2006) and adjusted according to recent data from the Statistics Netherlands (CBS). Cattle stocks are assumed to decrease from 3.7 million cows in 2008 to 3.5 million in 2020. The number of pigs is assumed to decrease from 12 million in 2008 to 11 million in 2020 and for poultry an increase is expected from 99 million in 2008 to 109 million in 2020. The use of N fertilizer is expected to decrease from an annual 258 Gg in 2008 to 236 Gg per year in 2020.
Policy measuresAs an additional measure, the introduction of air scrubbers has been assumed for NH3 and PM2.5 emissions from very large animal houses.
References 53
Asselt, M.B.A. van (2000). Perspectives on uncertainty and risk-the PRIMA approach to decision-support, PhD thesis, Universiteit Maastricht.
Bremmer, H.J., L.M. Troost, G. Kuipers, J. de Koning, A.A. Sein (1993). Emissies van dioxinen in Nederland, RIVM rapportnummer 770501003, National Institute for Public Health and the Environment RIVM, Bilthoven (in Dutch).
CBS (1993). Motorrijden in Nederland, Cijfers over bezit en gebruik, Voorburg/Heerlen (in Dutch).
CBS (1994). Het bezit en gebruik van bedrijfsvoertuigen, CBS, Statline, Voorburg/Heerlen (in Dutch).
CBS (1999). Het bezit en gebruik van personenauto’s, CBS, Statline, Voorburg/Heerlen (in Dutch).
CBS (2009) De mobiliteit van de Nederlandse Bevolking, CBS, StatLine, Voorburg/Heerlen (in Dutch).
Chardon, W.J. and K.W. van der Hoek (2002). Berekeningsmethode voor de emissie van fijn stof vanuit de landbouw, RIVM rapportnummer 773004014, National Institute for Public Health and the Environment RIVM, Bilthoven (in Dutch).
CPB, MNP and RPB (2006). Welvaart en Leefomgeving. Een scenariostudie voor Nederland in 2040. Centraal Planbureau, Milieu- en Natuurplanbureau en Ruimtelijk Planbureau, Den Haag.
Daniëls, B.W. and C.W.M. van der Maas (2009). Actualisatie referentieramingen, Energie en emissies 2008-2020, ECN-E—09-010, Petten (in Dutch).
DERA (1999). Second revised edition of the ICAO Aircraft Engine Exhaust Emissions Data Bank, DERA.
EEA (2005). EMEP/CORINAIR Emission Inventory Guidebook – 2005. Technical report No 30. 2005/12/31. European Environment Agency. http://reports.eea.eu.int/EMEPCORINAIR4/en
EEA (2007) EMEP/CORINAIR Emissions Inventory Guidebook 2007. European Environment Agency, Copenhagen, Denmark.
EPA (1985) Environmental Protection Agency, Compilation of air pollution emission factors, vol. 2, Mobile sources, 4th edition.
FAA (1996). Federal Aviation Administration, Federal Aviation Air Emissions Databank version 2.1., http://www.faa.gov/
Gijlswijk, R. van, P.W.H.G. Coenen, T. Pulles, and J.P. van der Sluijs, (2004). Uncertainty assessment of NOx, SO2 and NH3 emissions in the Netherlands, TNO report R2004/100, TNO, Apeldoorn, Available: http://www.rivm.nl/bibliotheek/digitaaldepot/TNOreportRa2004.pdf.
Hoek, K.W. van der, (2002). Uitgangspunten voor de mest- en ammoniakberekeningen 1999 tot en met 2001 zoals gebruikt in de Milieubalans 2001 en 2002, inclusief dataset landbouwemissies 1980 – 2001, RIVM rapportnummer 773004013, Bilthoven (in Dutch).
Hulskotte J.H.J., W.F. Sulilatue, and A.J. Willemsen (1999). Monitoringsystematiek openhaarden en houtkachels, TNO-MEP-R99/170, Apeldoorn (in Dutch).
Hulskotte, J.H.J. and W.W.R. Koch, (2000). Emissiefactoren zeeschepen, TNO-MEP-R2000/221, Apeldoorn (in Dutch).
Hulskotte, J.H.J., E. Bolt and D. Broekhuizen (2003). EMS-protocol emissies door binnenvaart: verbrandingsmotoren, RWS-AVV Ministry of Traffic, Public Works and Water Management, ’s-Gravenhage (in Dutch).
Hulskotte, J.H.J., J. Oonk and J.C. Roovaart (2005). Emissieschattingen diffuse bronnen, Waterverontreininging door motoremissies uit de recreatievaart, TNO-MEP, Apeldoorn (in Dutch).
Hulskotte, J.H.J. and R.P. Verbeek (2009). Emissiemodel Mobiele Machines gebaseerd op machineverkopen in combinatie met brandstof Afzet (EMMA) (in Dutch), TNO-report TNO-034-UT-2009-01782_RPT-ML, TNO, Utrecht.
Jimmink, B.A., P.W.H.G. Coenen, G.P Geilenkirchen, C.W.M van der Maas, C.J. Peek, S.M. van der Sluis and D. Wever (2009). The Netherlands Informative Inventory Report 2009, PBL report nr. 500080015, Netherlands Environmental Assessment Agency. Bilthoven.
Klein, J., Geilenkirchen, G., Hoen, A., Hulskotte, J., Duynhoven, N. van, de Lange, R., Hensema, A., Broekhuizen, D. and H. Molnár-in ‘t Veld (2009). Methods for calculating the emissions of transport in the Netherlands .Task Force Traffic and Transport of the National Emission Inventory.
Ntziachristos, L. and Z. Samaras (2000). COPERT III; Computer Programme to calculate emissions from road transport, methodology and emission factors (version 2.1), European Energy Agency (EEA), Copenhagen.
Oonk H., J. Hulskotte, R. Koch, G. Kuipers and J. van Ling (2003). Emissiefactoren voor de binnenscheepvaart, TNO-rapport R2003/437 versie 2, Apeldoorn (in Dutch).
PBL (2009). Annual project plan for the Emission Inventory, Netherlands Environmental Assessment Agency. Bilthoven (in Dutch).
PBL (2009a). Environmental balance 2009, Netherlands Environmental Assessment Agency. Bilthoven (in Dutch).
Peek, C.J. (2010). Protocol NMVOS emissies uit verfgebruik in Nederland, PBL, Netherlands Environmental Assessment Agency, Bilthoven (in Dutch).
Pulles, T., and J. van Aardenne, (2001). Good Practice Guidance for CLRTAP Emission Inventories, Draft chapter for the UNECE CORINAIR Guidebook on Emission Inventories, Available: http://reports.eea.eu.int/EMEPCORINAIR4/en/BGPG.pdf
RIVM (2001). Environmental Balance 2000, RIVM report 251701051, National Institute for Public Health and the Environment RIVM, Bilthoven (in Dutch).
Shareef, G.S., W.A. Butler, L.A. Bravo and M.B. Stockton (1988). Air emissions species manual, Vol. I: Volatile organic compound (VOC) species profiles. Radian Corp., EPA report 450/2-88-003a.
Sluijs, J.P. van der, P. Kloprogge, J. Risbey and J. Ravetz (2003). Towards a synthesis of qualitative and quantitative uncertainty assessment: applications of the numeral, unit, spread, assessment, pedigree (NUSAP) system, Paper for the International Workshop on Uncertainty, Sensitivity, and Parameter Estimation for Multimedia Environmental Modeling, August 19-21, 2003, Rockville, Maryland, USA, Available: http://www.nusap.net.
Sluijs, J.P. van der, M. Craye, S. Funtowicz, P. Kloprogge, J. Ravetz, and J. Risbey (2005). Combining Quantitative and Qualitative Measures of Uncertainty in Model based Environmental Assessment: the NUSAP System, Risk Analysis, 25 (2). p. 481-492
Smit, R., R. Smokers, E. Schoen and A. Hensema (2006). A new modelling approach for road traffic emissions: VERSIT+ LD – Background and methodology. TNO report 06.OR.PT.016.1/RS, TNO Science and Industry, Powertrains, Delft.
Soest-Vercammen, E.L.J. van, J.H.J. Hulskotte and D.C. Heslinga (2002). Monitoringsprotocol Bijschatting Stationaire NOx-bronnen kleiner dan 20 MWth, TNO report R2002/042, TNO Milieu, Energie en Procesinnovatie, Apeldoorn (in Dutch).
Tak, C. van der (2000). Actualisatie T0-emissies, report number 16196.620/2, MARIN, Wageningen (in Dutch).
Visschedijk, A., W, Appelman, J. Hulskotte and P. Coenen. (2007). Onderhoud van methodieken Emissieregistratie 2006-2007, TNO report nr. A-R0865/B
UNECE (2009). Guidelines for Estimating and Reporting Emission Data under the Convention on Long-range Transboundary Air Pollution. http://www.ceip.at/fileadmin/inhalte/emep/reporting_2009/Rep_Guidelines_ECE_EB_AIR_97_e.pdf.
VROM (1993). Publikatiereeks Emissieregistratie. Emissiefactoren Vluchtige organische stoffen uit verbrandingsmotoren. no. 10, ’s-Gravenhage (in Dutch).
VVVF (2004). Jaarrapportage Verf en drukinktgebruik in Nederland. Vereniging van verf- en drukinktfabrikanten, ’s-Gravenhage (in Dutch).
References

Netherlands Informative Inventory Report 201054
Colophon 55
Colophon
ResponsibilityNetherlands environmental Assessment Agency
Project teamB.A. Jimmink, P.W.H.G. Coenen, G.P. Geilenkirchen, A.J. Leekstra, C.W.M. van der Maas, C.J. Peek, S.M. van der Sluis, D. Wever
GraficsM.J.L.C. Abels-van Overveld, B.A. Jimmink, C.J. Peek
Lay outStudio RIVM
ContactB.A. (Benno) Jimmink; [email protected]
This investigation has been performed by order and for the account of the Directorate-General for Environmental Protection, Climate and Air Division, of the Netherlands Ministry of Housing, Spatial Planning and the Environment, within the framework of project Emission Registration M/500080/IIR, ‘Netherlands Pollutant Emission Register’.
Report prepared for submission in accordance with The UN Framework Convention on Long Range Transboundary Air Pollution including electronic Excel spreadsheet files containing Nomenclature for Reporting (NFR) data for 1990 to 2008.
Netherlands Environmental Assessment Agency, March 2010
Policy Studies
Emissions from the Netherlands: “How are we doing?”
The Netherlands Informative Inventory Report (IIR) contains
information on emission inventories in the Netherlands up to 2008,
describing methods, data sources, QA/QC activities carried out and
a trend analysis.
Its aim is to provide a better view on applicability (transparency
between countries, modeled air quality) and accountability
(transparency, completeness, consistency, strengths and weaknesses
in methods, uncertainties) of emission data.
So basically, it’s useful for inventory reviewers, modelers and
emission experts in general.
In the 1990–2008 period, emissions of all gases presented in this
report showed a downward trend. Major overall drivers for this trend
are emission reductions in industry, cleaner fuels and cleaner cars.
Netherlands Informative Inventory Report 2010